a practical method to calculate and model the petrophysical
TRANSCRIPT
Wali and Baqer Iraqi Journal of Science, 2020, Vol. 61, No. 10, pp: 2640-2650 DOI: 10.24996/ijs.2020.61.10.20
__________________________ *Email: [email protected]
2640
A Practical Method to Calculate and Model the Petrophysical Properties of
Reservoir Rock Using Petrel Software: A case Study from Iraq
Sarah Taboor Wali
*, Hussain Ali Baqer
Petroleum Department, College of Engineering, University of Baghdad, Baghdad, Iraq
Received: 21/2/2020 Accepted: 2/5/2020
Abstract
Nasiriyah oilfield is located in the southern part of Iraq. It represents one of the
promising oilfields. Mishrif Formation is considered as the main oil-bearing
carbonate reservoir in Nasiriyah oilfield, containing heavy oil (API 25o(. The study
aimed to calculate and model the petrophysical properties and build a three
dimensional geological model for Mishrif Formation, thus estimating the oil reserve
accurately and detecting the optimum locations for hydrocarbon production.
Fourteen vertical oil wells were adopted for constructing the structural and
petrophysical models. The available well logs data, including density, neutron,
sonic, gamma ray, self-potential, caliper and resistivity logs were used to calculate
the petrophysical properties. The interpretations and environmental corrections of
these logs were performed by applying Techlog 2015 software. According to the
petrophysical properties analysis, Mishrif Formation was divided into five units
(Mishrif Top, MA, shale bed, MB1 and MB2). A three-dimensional geological
model, which represents an entrance for the simulation process to predict reservoir
behavior under different hydrocarbon recovery scenarios, was carried out by
employing Petrel 2016 software. Models for reservoir characteristics (porosity,
permeability, net to gross NTG and water saturation) were created using the
algorithm of Sequential Gaussian Simulation (SGS), while the variogram analysis
was utilized as an aid to distribute petrophysical properties among the wells.
The process showed that the main reservoir unit of Mishrif Formation is MB1
with a high average porosity of 20.88% and a low average water saturation of
16.9%. MB2 unit has good reservoir properties characterized by a high average
water saturation of 96.25%, while MA was interpreted as a water-bearing unit. The
impermeable shale bed unit is intercalated between MA and MB1 units with a
thickness of 5-18 m, whereas Mishrif top was interpreted as a cap unit. The study
outcomes demonstrated that the distribution accuracy of the petrophysical properties
has a significant impact on the constructed geological model which provided a better
understanding of the study area’s geological construction. Thus, the estimated
reserve h was calculated to be about 7945 MSTB. This can support future reservoir
development plans and performance predictions.
Keywords: Petro physical Properties; Reservoir modelling; Nasiriya Oilfield.
البترلصخور المكمن بأستخدام برنامج البتر وفيزيائيةالخصائص ونموذجةطريقة عملية لحداب .دراسة حالة من العراق
حدين علي باقر ،* سارة طابور والي
جامعة بغداد , بغداد, العراققدم ىشدسة الشفط, كمية اليشدسة,
ISSN: 0067-2904
Wali and Baqer Iraqi Journal of Science, 2020, Vol. 61, No. 10, pp: 2640-2650
2641
: الخالصةيقع حقل الشاصرية في الجزء الجشهبي من العراق وىه يسثل احد حقهل الشفط الهاعدة. يعتبر تكهين السذرف
تيدف الدراسة الى 25O . APIالسكسن الكاربهناتي الرئيدي الخازن لمشفط والذي يحتهي عمى نفط ثقيلوبشاء مهديل جيهلهجي ثالثي األبعاد لتكهين السذرف وبالتالي تقدير البتروفيزيائيوحداب ونسذجة الخرائص
األحتياطي الشفظي بدقة وتحديد أفزل السهاقع ألنتاج اليايدروكاربهن.تم أستخدام بيانات الجس الستهفرة بئر نفظي عسهدي لبشاء الشساذج الييكمية والبتروفيزيائية. 41تم أعتساد .
density, neutron, sonic, gamma ray, self-potential, caliper and resistivity والتي تزسشتلحداب الخرائص البتروفيزيائية .تم تشفيذ التفديرات والترحيحات البيئية ليذه السجدات من خالل أستخدام
خسس .وفقا لتحميل الخرائص البتروفيزيائية تم تقديم تكهين السذرف الى Techclog 2015برنامج تم بشاء مهديل جيهلهجي ثالثي األبعاد . Mishrif Top, MA, Shale bed, MB1,MB2)وحدات)
لتكهين السذرف في حقل الشاصرية الشفظي والذي يسثل مدخال لعسمية السحاكاة لمتشبهء بتررف السكسن في عل . Petrel 2016سيشاريهىات مختمفة ألستخالص اليايدروكاربهن بأستخدام برنامج
porosity, permeability, net to gross NTG, waterمهديالت الخرائص البتروفيزيائية )(saturation تم انذاؤىا بأستخدام خهارزميةSequential Gaussian Simulation SGS واألستفادة من
تحميل الستغيرات كعامل مداعد في نذر الخرائص البتروفيزيائية بين اآلبار.بسعدل مدامية عالي MB1سذجة بأن الهحدة السكسشية الرئيدية لتكهين السذرف ىي بيشت عسمية الش
جيدة وتسيزت بسعدل MB2%, الخرائص السكسشية لمهحدة 1..4% ومعدل تذبع مائي مشخفض 88.22 shale bedنفاذة الغير الهحدة .تم تفديرىا كهحدة خازنو لمساء MA% ,بيشسا 89..1تذبع مائي عالي
تم تفديرىا كهحدة غظاء Mishrif Top , في حينm 18-5بدسك MB1و MAين مقحسة بأعيرت نتائج الدراسة أن دقة تهزيع الخرائص البتروفيزيائية ليا تأثير كبير عمى السهديل الجيهلهجي السبشي
7119والذي وفر فيسا أفزل لسشظقة ألدراسة, وبالتالي األحتياطي ألشفظي الذي تم حدابة ليكهن حهالي MSTB أن يدعم خظط التظهير والتشبؤات السدتقبمية لمسكسن. شأنو. ىذا من
1- Introduction
Nasiriyah structure was discovered in 1975 and appeared as a longitudinal anticline with the
northwest-southeast axial direction. The structure length is 30 Km and its width is 10 Km, with an
enclosure of 65-70 m [1]. Mishrif Formation represents the main oil-bearing reservoir in Nasiriyah oil
field. It is one of the important carbonate reservoirs in the southern and central Iraqi oilfields which
include Zubair, Amara, Majnoon, Halfaya, West Qurna, Buzergan and Rumaila [2].
The accurate estimation of petrophysical properties is the most challenging part of building a
geological model. It has a great influence on fluid contact identification and, thus, reserve estimation.
According to that, the reservoir must be divided into layers based on the dominated rock type to
specify the trends and the average values of petrophysical parameters in reservoir rocks [3]. In
petroleum industry, geological modelling is considered a discipline of engineering science that
represent Earth's crust parts, especially hydrocarbon reservoirs [4] . The geological model is an
essential concept in the simulation process to predict the reservoir performance under different
hydrocarbon recovery scenarios and optimize the future reservoir development schemes. Modelling of
quantitative geological processes is vital in reservoir assessment to understand the subsurface
structures’ spatial distribution, which represents the base of numerical simulation for hydrocarbon
exploration and production. Subsurface modelling in three dimensions represents a mean to improve
the interpretation of data by visualizing and confronting these data simultaneously with the created
model [5].
The available well logs data, involving density, neutron, sonic, Gamma ray, resistivity, caliper and
self-potential were evaluated and corrected using Techlog 2015 software for providing values
concerning reservoir properties, including porosity and water saturation. The study aims to construct a
three dimensional (3D) geological model by applying Petrel 2016 for Mishrif Formation in Nasiriyah
oil field. The created geological model included reservoir structural design as well as a 3D modelling
of stratigraphic and reservoir petrophysical properties. Geostatistics can be defined as a numerical
collection technique that deals with the characterization of spatial attributes, applying foremost
Wali and Baqer Iraqi Journal of Science, 2020, Vol. 61, No. 10, pp: 2640-2650
2642
random models in a way similar to the manner where the analysis of time series identifies temporal
data. Geostatistical modelling is preferred to be used in describing the spatial distribution and variation
of reservoir properties, involving porosity and water saturation [6]. The classical geostatistical
approach used to model the reservoir properties in this study was the Sequential Gaussian Simulation
(SGS).
2- Study Area
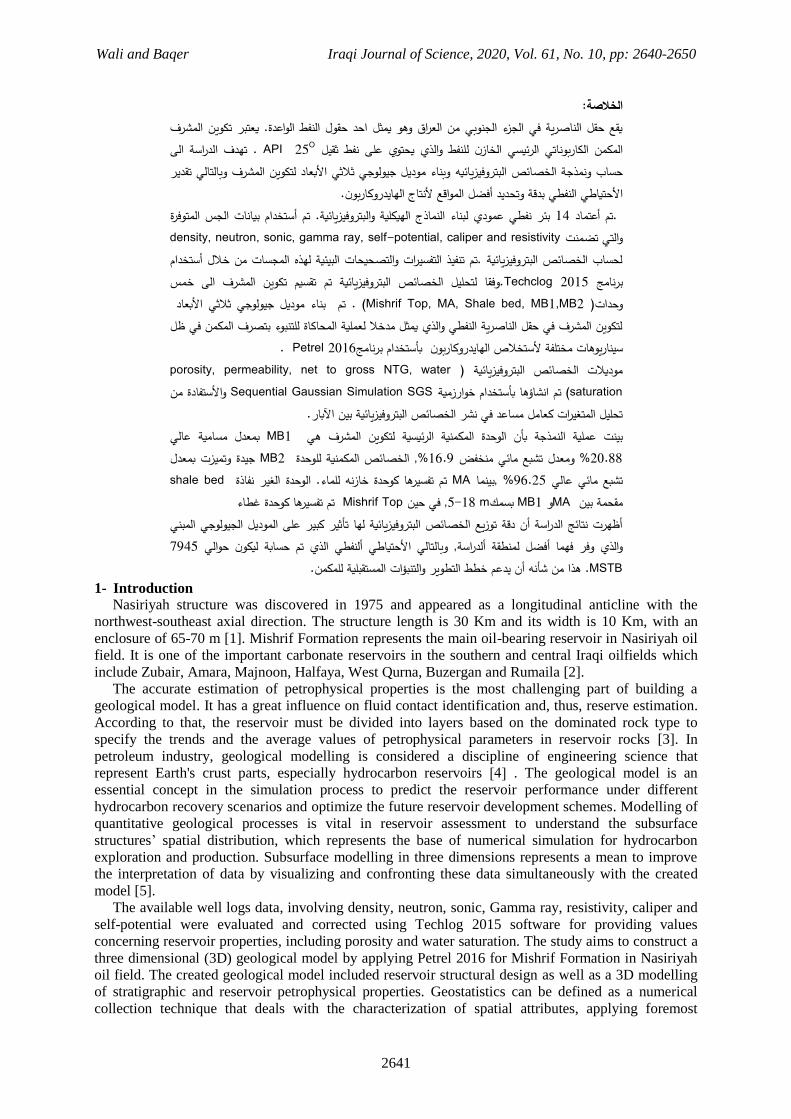
Nasiriyah field is located in the NW-SE oriented Mesopotamian Zone extending across the alluvial
plains of the Euphrates-Tigris valleys, about 38 km northwest of Thi Qar city (Figure-1). Mishrif
Formation is the main reservoir in Nasiriyah oil field, characterized by fine to coarse bioclastic
limestone deposited in a shallow depositional domain with an average thickness of 180 m. Forty-five
vertical oil wells were drilled in Nasiriyah oil field. This study relies on fourteen wells that all
penetrate Mishrif Formation (Figure-2).
Figure 1-Geographic map and coordinates of the study area [2].
Figure 2-Wells’ locations of Nasiriyah Oilfield.
Wali and Baqer Iraqi Journal of Science, 2020, Vol. 61, No. 10, pp: 2640-2650
2643
3- Methodology
This study was conducted starting with preparing the essential data, which are contour maps for
Mishrif Formation units, wellheads that included the wells measured depth and coordinates in three
dimensions, and well tops, along with well log data including density, neutron, sonic, gamma ray, self-
potential, caliper and resistivity. These data were interpreted and environmentally corrected by
Techlog 2015 software and calibrated using special core analysis data. Petrel 2016 software developed
by Schlumberger was employed to perform the study tasks, where the first phase was building the
reservoir structural model representing the boundaries of the geological units. The second phase
involved dividing Mishrif units into many layers for characterizing the vertical variance within each
geological unit. The third phase included the scale-up of reservoir properties. The fourth phase
included a property modelling procedure involving porosity and water saturation, where the variogram
analysis was utilized as an aid to distribute the petrophysical properties among wells. The final step
was oil reserve calculation.
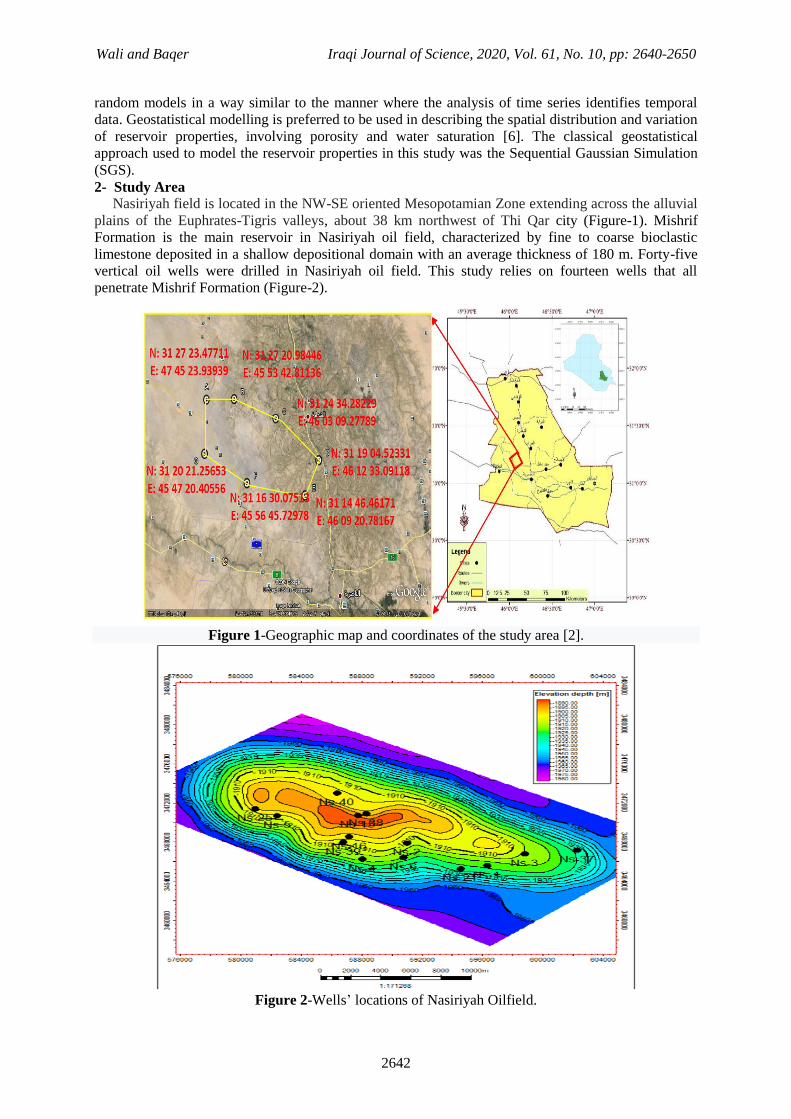
4- Structural Modelling
Structural modelling for Mishrif Formation was built depending on wellheads, well tops and
structural contour maps from 2-D seismic data for each unit (Mishrif top, MA, shale bed, MB1, MB2).
The established structural model illustrated a full three-dimensional form of Mishrif Formation in
Nasiriyah oil field (Figure-3) and provided essential geometric constraints for the geological model,
which in turn showed that the Formation is a quite gentle NW-SE oriented anticline.
5- 3D Grid construction
The construction of a 3D grid is the essential step of building a 3D model. It represents a network
of vertical and horizontal lines employed to characterize the 3D geological model. This step divided
the model into boxes called grid cells where each grid cell had one value of porosity, water saturation,
permeability and single rock type. These grid cells are referred to as cell properties [7] and this
simplification is a true representation of the reality to be used in the calculations. The grid dimensions
for Mishrif Formation in Nasiriyah oilfield were 200 m along the x-axis and 200 m along the y-axis.
Figure 3-Structural Maps for Mishrif Formation Units.
6- Layering Layering process reflects the geological deposition of a specific zone, where the modern geology
requires that the layered volumes have to be accurately represented [7]. Layering procedure is
Wali and Baqer Iraqi Journal of Science, 2020, Vol. 61, No. 10, pp: 2640-2650
2644
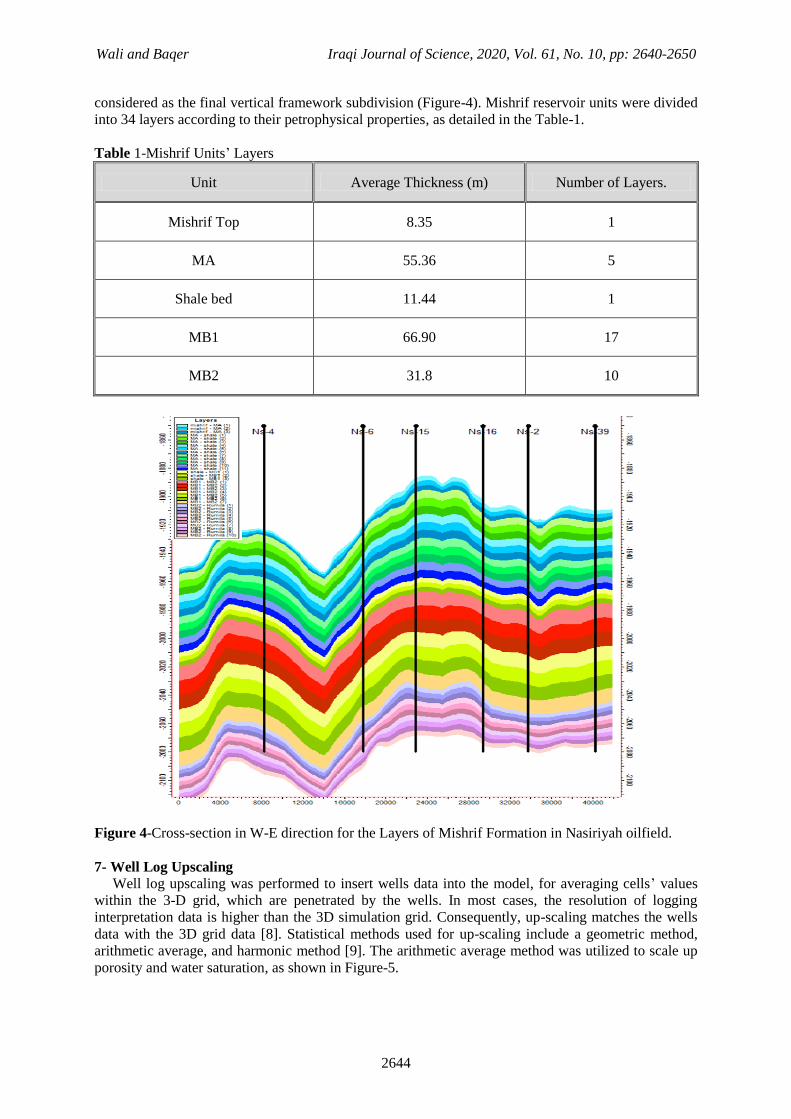
considered as the final vertical framework subdivision (Figure-4). Mishrif reservoir units were divided
into 34 layers according to their petrophysical properties, as detailed in the Table-1.
Table 1-Mishrif Units’ Layers
Unit Average Thickness (m) Number of Layers.
Mishrif Top 8.35 1
MA 55.36 5
Shale bed 11.44 1
MB1 66.90 17
MB2 31.8 10
Figure 4-Cross-section in W-E direction for the Layers of Mishrif Formation in Nasiriyah oilfield.
7- Well Log Upscaling
Well log upscaling was performed to insert wells data into the model, for averaging cells’ values
within the 3-D grid, which are penetrated by the wells. In most cases, the resolution of logging
interpretation data is higher than the 3D simulation grid. Consequently, up-scaling matches the wells
data with the 3D grid data [8]. Statistical methods used for up-scaling include a geometric method,
arithmetic average, and harmonic method [9]. The arithmetic average method was utilized to scale up
porosity and water saturation, as shown in Figure-5.

Wali and Baqer Iraqi Journal of Science, 2020, Vol. 61, No. 10, pp: 2640-2650
2645
Figure 5-Scale-up of porosity and water saturation for wells Ns-5, Ns-15, Ns-16
8- Oil Water Contact (OWC)
Oil-water contact has a large influence on geomodelling and volumetric calculations [8]. The
calculated initial oil-in-place range varies widely depending on the OWC location. In Nasiriyah field
Mishrif Formation, each reservoir unit possibly has a different OWC. Free water level (FWL) could
not be defined since wireline Formation pressure data was not available and each unit is thin, hence
only (oil down to) method can be recognized to locate the OWC. All wells have a different OWC and
their depths tend to become deeper from west to east. OWC was defined for each unit at the depth
where the calculated water saturation from logs interpretation process becomes downward to 100%.
9- Property Modelling
Property modelling is used to characterize the spatial distribution and variation of reservoir
physical parameters between wells [10]. These properties are the main indicator for reservoir
quantitative evaluation [11]. The database of property modelling were the logging interpreted curves
of each well. Stochastic modelling method was selected to build reservoir property models.
The classical geostatistical approach used to model the reservoir properties was the sequential
simulation approach. Sequential Gaussian Simulation (SGS) was utilized to model petrophysical
properties. Each cell of the 3D grid had values for petrophysical properties. The geostatistical
calculation of rock properties involved variogram analysis and petrophysical properties estimation
utilizing SGS as an interpolation method.
9-1 Variogram Model Variogram-based geostatistical-modelling methods are employed in most reservoir characterization
studies to accurately and efficiently describe reservoir heterogeneities. The 3D reservoir models are
constrained by the variogram-based techniques on local data which represent the geologic knowledge
and assist to create suitable flow behaviors through dynamic simulation. The variogram is used to
identify and model the spatial structure of the petrophysical properties [12]. The experimental
variogram is estimated by equation 1 below [13].
( ) ∑ ( ) ( )
( )
( ) 1
Wali and Baqer Iraqi Journal of Science, 2020, Vol. 61, No. 10, pp: 2640-2650
2646
The variogram is denoted by ( ) , where represents a lag vector, ( ) is pairs number, xui+L, xui,
are variables x at positions L and ui+L. At L =0, the variogram starts from zero reaching a constant
value (Sill: C) at a specific distance indicated as correlation length or range (a). The range refers to the
data correlation over different orientations. Any data beyond the range are distinct of each other with
no spatial structure. Hypothetically, the variogram has to be decreased to zero at L= 0, which is named
nugget effect (C0). Since experimental variogram is unable to provide these terms, it is not sufficient
for variogram analysis. Hence, experimental variogram has to be fitted with suitable theoretical
models. The most prevalent theoretical models used to fit the experimental variogram are the
spherical, exponential and gaussian, that are contained in Petrel 2016 software. The spherical model is
the most commonly applied to elucidate variogram. Spherical variogram equation can be represented
by equations 2a and 2b [13]
( ) ( )
(
)-
(
) 2a
If L a
and ( ) = C0 2b
if L a, where Msa(L)= a spherical model with a range a.
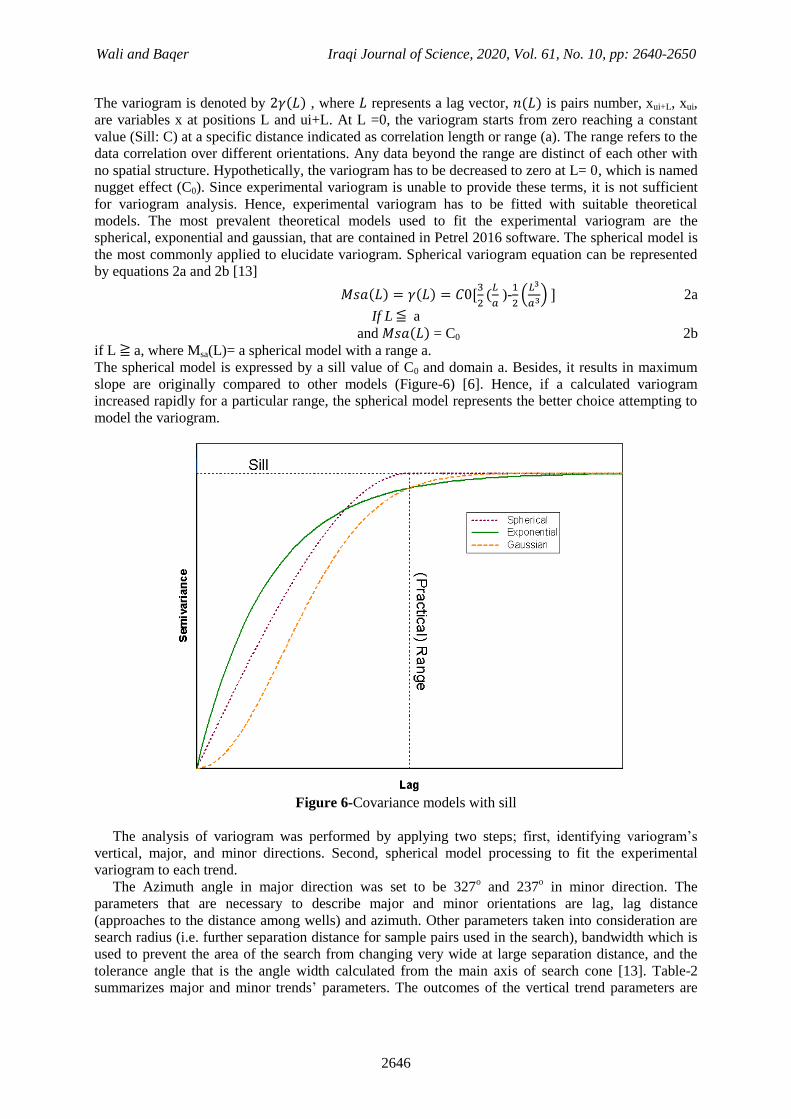
The spherical model is expressed by a sill value of C0 and domain a. Besides, it results in maximum
slope are originally compared to other models (Figure-6) [6]. Hence, if a calculated variogram
increased rapidly for a particular range, the spherical model represents the better choice attempting to
model the variogram.
Figure 6-Covariance models with sill
The analysis of variogram was performed by applying two steps; first, identifying variogram’s
vertical, major, and minor directions. Second, spherical model processing to fit the experimental
variogram to each trend.
The Azimuth angle in major direction was set to be 327o and 237
o in minor direction. The
parameters that are necessary to describe major and minor orientations are lag, lag distance
(approaches to the distance among wells) and azimuth. Other parameters taken into consideration are
search radius (i.e. further separation distance for sample pairs used in the search), bandwidth which is
used to prevent the area of the search from changing very wide at large separation distance, and the
tolerance angle that is the angle width calculated from the main axis of search cone [13]. Table-2
summarizes major and minor trends’ parameters. The outcomes of the vertical trend parameters are

Wali and Baqer Iraqi Journal of Science, 2020, Vol. 61, No. 10, pp: 2640-2650
2647
varied for each unit. The resulted nugget values of a spherical model for porosity and water saturation
for all Mishrif Formation units were equal to (0). The values of other parameters are listed in Table-3.
Table 2-Search Cone Parameters
Direction Azimuth Dip lag
Major 327 0 14
Minor 237 0 14
Direction Lag Distance. Radius Bandwidth
Major 1271.7 25434 12134.7
Minor 1015.6 20312 11778.8
Table 3-Parameters of variograms are delineated for porosity and saturation data from sphereical
model.
Unit Sill Major Minor Vertical
direction Property
Mishrif Top-MA 1.0073 5387.567 4708.327 5.052 Porosity
MA-Shale 0.9982 6019.898 5229.026 35.628 Porosity
Shale-MB1 0.9168 6035.027 5334.421 7.869 Porosity
MB1-MB2 0.9958 3464.164 3536.798 28.386 Porosity
MB2-Rumaila 0.9864 3867.363 5475.089 8.27 Porosity
Mishrif Top-MA 0.9309 5257.639 5011.941 9.88 Water saturation
MA-Shale 0.9936 5195.531 5905.759 32.409 Water saturation
Shale-MB1 0.9948 7112.716 5877.302 7.868 Water saturation
MB1-MB2 0.993 5011.838 3590.313 30.8 Water saturation
MB2-Rumaila 0.9896 4126.576 5238.217 13.499 Water saturation
9-2 Porosity Modelling
The key phase of this study was the distribution of the petrophysical properties. The distribution of
porosity across the field was carried out utilizing geostatistic interpolation. The well logging
interpreted and corrected porosity within Techlog 2015 software was taken as the control point after
applying a cutoff to the porosity curve (porosity≥5) as resulting from the log interpreted porosity vs
special core analysis of porosity relationship. Furthermore, well porosity distribution characteristics of
each well, and each geological layer and variogram ranges (Tables- 2 and 3), were used as constraint
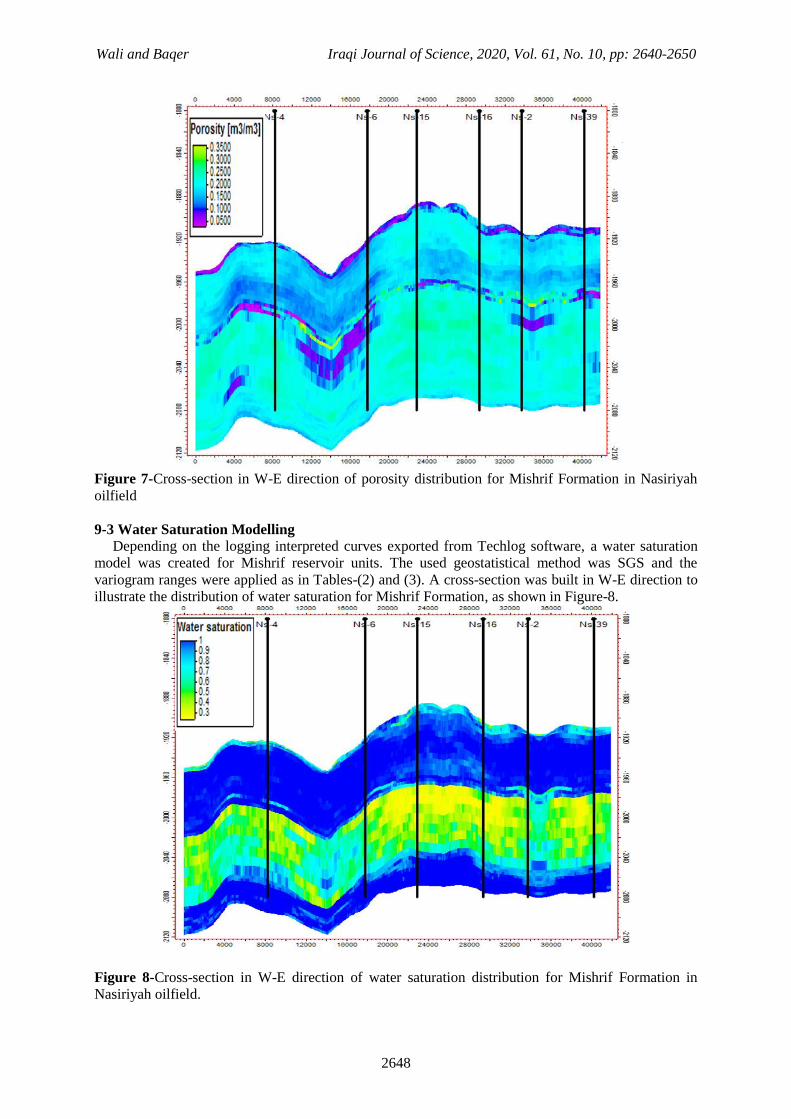
conditions. SGS method was applied to build effective porosity model. Figure-7 shows a cross-section
in the W-E direction of porosity distribution for Mishrif Formation which resulted from porosity
modelling process.
Wali and Baqer Iraqi Journal of Science, 2020, Vol. 61, No. 10, pp: 2640-2650
2648
Figure 7-Cross-section in W-E direction of porosity distribution for Mishrif Formation in Nasiriyah
oilfield
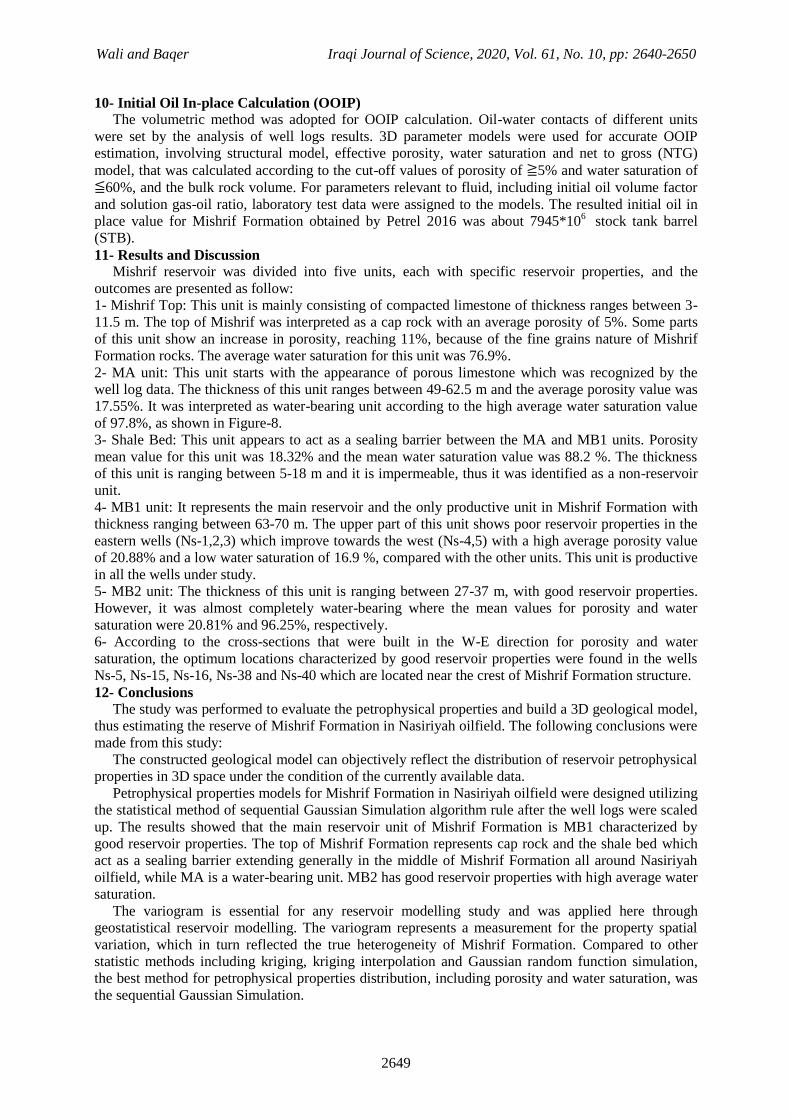
9-3 Water Saturation Modelling
Depending on the logging interpreted curves exported from Techlog software, a water saturation
model was created for Mishrif reservoir units. The used geostatistical method was SGS and the
variogram ranges were applied as in Tables-(2) and (3). A cross-section was built in W-E direction to
illustrate the distribution of water saturation for Mishrif Formation, as shown in Figure-8.
Figure 8-Cross-section in W-E direction of water saturation distribution for Mishrif Formation in
Nasiriyah oilfield.
Wali and Baqer Iraqi Journal of Science, 2020, Vol. 61, No. 10, pp: 2640-2650
2649
10- Initial Oil In-place Calculation (OOIP)
The volumetric method was adopted for OOIP calculation. Oil-water contacts of different units
were set by the analysis of well logs results. 3D parameter models were used for accurate OOIP
estimation, involving structural model, effective porosity, water saturation and net to gross (NTG)
model, that was calculated according to the cut-off values of porosity of 5% and water saturation of
60%, and the bulk rock volume. For parameters relevant to fluid, including initial oil volume factor
and solution gas-oil ratio, laboratory test data were assigned to the models. The resulted initial oil in
place value for Mishrif Formation obtained by Petrel 2016 was about 7945*106
stock tank barrel
(STB).
11- Results and Discussion
Mishrif reservoir was divided into five units, each with specific reservoir properties, and the
outcomes are presented as follow:
1- Mishrif Top: This unit is mainly consisting of compacted limestone of thickness ranges between 3-
11.5 m. The top of Mishrif was interpreted as a cap rock with an average porosity of 5%. Some parts
of this unit show an increase in porosity, reaching 11%, because of the fine grains nature of Mishrif
Formation rocks. The average water saturation for this unit was 76.9%.
2- MA unit: This unit starts with the appearance of porous limestone which was recognized by the
well log data. The thickness of this unit ranges between 49-62.5 m and the average porosity value was
17.55%. It was interpreted as water-bearing unit according to the high average water saturation value
of 97.8%, as shown in Figure-8.
3- Shale Bed: This unit appears to act as a sealing barrier between the MA and MB1 units. Porosity
mean value for this unit was 18.32% and the mean water saturation value was 88.2 %. The thickness
of this unit is ranging between 5-18 m and it is impermeable, thus it was identified as a non-reservoir
unit.
4- MB1 unit: It represents the main reservoir and the only productive unit in Mishrif Formation with
thickness ranging between 63-70 m. The upper part of this unit shows poor reservoir properties in the
eastern wells (Ns-1,2,3) which improve towards the west (Ns-4,5) with a high average porosity value
of 20.88% and a low water saturation of 16.9 %, compared with the other units. This unit is productive
in all the wells under study.
5- MB2 unit: The thickness of this unit is ranging between 27-37 m, with good reservoir properties.
However, it was almost completely water-bearing where the mean values for porosity and water
saturation were 20.81% and 96.25%, respectively.
6- According to the cross-sections that were built in the W-E direction for porosity and water
saturation, the optimum locations characterized by good reservoir properties were found in the wells
Ns-5, Ns-15, Ns-16, Ns-38 and Ns-40 which are located near the crest of Mishrif Formation structure.
12- Conclusions The study was performed to evaluate the petrophysical properties and build a 3D geological model,
thus estimating the reserve of Mishrif Formation in Nasiriyah oilfield. The following conclusions were
made from this study:
The constructed geological model can objectively reflect the distribution of reservoir petrophysical
properties in 3D space under the condition of the currently available data.
Petrophysical properties models for Mishrif Formation in Nasiriyah oilfield were designed utilizing
the statistical method of sequential Gaussian Simulation algorithm rule after the well logs were scaled
up. The results showed that the main reservoir unit of Mishrif Formation is MB1 characterized by
good reservoir properties. The top of Mishrif Formation represents cap rock and the shale bed which
act as a sealing barrier extending generally in the middle of Mishrif Formation all around Nasiriyah
oilfield, while MA is a water-bearing unit. MB2 has good reservoir properties with high average water
saturation.
The variogram is essential for any reservoir modelling study and was applied here through
geostatistical reservoir modelling. The variogram represents a measurement for the property spatial
variation, which in turn reflected the true heterogeneity of Mishrif Formation. Compared to other
statistic methods including kriging, kriging interpolation and Gaussian random function simulation,
the best method for petrophysical properties distribution, including porosity and water saturation, was
the sequential Gaussian Simulation.
Wali and Baqer Iraqi Journal of Science, 2020, Vol. 61, No. 10, pp: 2640-2650
2650
The accuracy of petrophysical properties modelling has a large influence on constructing a good
geological model, that represents the reservoir model structure, and effects the value of pore volume,
thus changing the value of oil in-place where the estimated value of initial oil in-place for Mishrif
Formation / Nasiriyah oilfield calculated by Petrel 2016 was about 7945*106 stock tank barrel (STB).
13- Acknowledgments
The authors would like to show their gratitude to Thi –Qar Oil Company for providing the required
data to achieve this study
References:
1. S.O.C., South Oil Company, S.O.C. 1990. “Geological study of Mishrif formation in Nasiriyah
oilfield".
2. Hlelai, M.A. and S. Z. Khorshid, S.Z. 2015. “3-D lithofacies Model of Mishrif Formation in
Nasiriyah oil field Southwestern Iraq,” Hlelai Khorshid Iraqi J. Sci., 56(4C): 3452–3462.
3. Kadhim, F.S., Samsuri, A. and Alwan, H. 2015. “Determination of Lithology , Porosity and Water
Saturation for Mishrif Carbonate Formation,” Int. J. Environ. Chem. Ecol. Geol. Geophys. Eng.,
9(8): 987–993.
4. Al-Baldawi, B.A. 2015. “Building A 3D Geological model Using Petrel Software for Asmari
Reservoir, South Eastern Iraq,” Iraqi J. Sci., 56(2C): 1750–1762.
5. Abdullah, M.D., Nasser, M.E. and Al-Yasseri, A.A. 2019. “Building a 3D petrophysical model for
Mishrif formation in Nasiriyah oil field, southern Iraq,” Iraqi J. Sci., 60(1): 115–126.
6. Perez, K. 2002. “Applied_Geostatistics_for_Reservoir_Char.pdf.”.
7. ali Faeq, S. 2013. “Permeability Prediction and 3D Petrophysical Model for Khasib Formation /
Ahdeb Field,”.
8. Schlumberger, 2008. Petrel introduction course, Schlumberger, 50-334p, 2008.
9. Lie, K.A. 2019. “Upscaling Petrophysical Properties,” An Introd. to Reserv. Simul. Using
MATLAB/GNU Octave, pp. 558–596.
10. Kamali, M.R., Omidvar, A. and Kazemzadeh, E. 2013. “3D Geostatistical Modeling and
Uncertainty Analysis in a Carbonate Reservoir, SW Iran,” J. Geol. Res., 2013, pp. 1–7, 2013.
11. Al-Musawi, F.A., Idan, R.M. and Salih, A.L.M. 2019. “Reservoir Properties and Facies
Distribution of Mishrif Formation in Ratawi Oilfield, Southern Iraq,” in The Structural Geology
Contribution to the Africa-Eurasia Geology: Basement and Reservoir Structure, Ore
Mineralisation and Tectonic Modelling, Springer, pp. 121–126.
12. Adeoti, L.,Onyekachi, N., Olatinsu, O., Fatoba, J. and Bello, M. 2014. “Static Reservoir Modeling
Using Well Log and 3-D Seismic Data in a KN Field, Offshore Niger Delta, Nigeria,” Int. J.
Geosci., 05(01): 93–106.
13. Nixon, J.V. 2001. “Introduction to Geostatic and Variogram Analysis,” Relig. Arts, 5(1–2): 2–12.
.