practical engineering geology
TRANSCRIPT


Practical Engineering Geology
This book presents a broad and fresh view on the importance ofengineering geology to civil engineering projects.
Practical Engineering Geology provides an introduction into the waythat projects are managed, designed and constructed and the ways thatthe engineering geologist can contribute to cost-effective and safeproject achievement. The need for a holistic view of geological materi-als, from soil to rock, and of geological history is emphasised. Chaptersaddress key aspects of
• geology for engineering and ground modelling• site investigation and testing of geological materials• geotechnical parameters• design of slopes, tunnels, foundations and other engineering structures• identifying hazards• avoiding unexpected ground conditions.
The book is illustrated throughout with case examples and shouldprove useful to practising engineering geologists and geotechnicalengineers and to MSc level students of engineering geology and othergeotechnical subjects.
Steve Hencher is a Director of consulting engineers Halcrow andResearch Professor of Engineering Geology at the University of Leeds.
Cover image Am Buachaille (The Herdsman), off Staffa in Scotland, isstunningly beautiful. It is also a succinct example of an engineeringgeological enigma so sits well on the front cover of this book. Howwere those curved columns formed and when in geological history? Ifwe were to drill through (heaven forbid) would we find the samefractures that we can see at the surface? If we were to found a bridgeon the island (again heaven forbid), how would we measure andcharacterise the rock? Could we simply use some rock mechanicsclassification to do the trick? Floating around the island, occasionallyfocusing on the distant horizon, one can ponder on such puzzles.

Applied Geotechnics
Titles currently in this series:
David Muir Wood Geotechnical ModellingHardback ISBN 978-0-415-34304-6Paperback ISBN 978-0-419-23730-3
Alun Thomas Sprayed Concrete Lined TunnelsHardback ISBN 978-0-415-36864-3
David Chapman et al. Introduction to Tunnel ConstructionHardback ISBN 978-0-415-46841-1Paperback ISBN 978-0-415-46842-8
Catherine O’Sullivan Particulate Discrete Element ModellingHardback ISBN 978-0-415-49036-8
Steve Hencher Practical Engineering GeologyHardback ISBN 978-0-415-46908-1Paperback ISBN 978-0-415-46909-8
Forthcoming:
Geoff Card Landfill EngineeringHardback ISBN 978-0-415-37006-6
Martin Preene et al. Groundwater Lowering in ConstructionHardback ISBN 978-0-415-66837-8

Practical Engineering Geology
Steve Hencher

First published 2012by Spon Press2 Park Square, Milton Park, Abingdon, Oxon OX14 4RN
Simultaneously published in the USA and Canadaby Spon Press711 Third Avenue, New York, NY 10017
Spon Press is an imprint of the Taylor & Francis Group, an informa business
© 2012 Steve Hencher
The right of Steve Hencher to be identified as author of this work has beenasserted by him in accordance with sections 77 and 78 of the Copyright,Designs and Patents Act 1988.
All rights reserved. No part of this book may be reprinted or reproduced orutilised in any form or by any electronic, mechanical, or other means,now known or hereafter invented, including photocopying and recording, or inany information storage or retrieval system, without permission in writingfrom the publishers.
This publication presents material of a broad scope and applicability. Despitestringent efforts by all concerned in the publishing process, some typographical oreditorial errorsmay occur, and readers are encouraged to bring these to our attentionwhere they represent errors of substance. The publisher and author disclaim anyliability, in whole or in part, arising from information contained in this publication.The reader is urged to consult with an appropriate licensed professional prior totaking any action or making any interpretation that is within the realm of a licensedprofessional practice.
Every effort has been made to contact and acknowledge copyright owners. If anymaterial has been included without permission, the publishers offer their apologies.The publishers would be pleased to have any errors or omissions brought to theirattention so that corrections may be published at later printing.
Trademark notice: Product or corporate names may be trademarks or registeredtrademarks, and are used only for identification and explanation without intent toinfringe.
British Library Cataloguing in Publication DataA catalogue record for this book is available from the British Library
Library of Congress Cataloging-in-Publication DataHencher, Steve (Stephen)Practical engineering geology / Steve Hencher.p. cm. - - (Applied geotechnics)1. Engineering geology. I. Title.TA705.H44 2012624.1′51- -dc232011021261
ISBN: 978-0-415-46908-1 (hbk)ISBN: 978-0-415-46909-8 (pbk)ISBN: 978-0-203-89482-8 (ebk)
Typeset in Sabonby Integra Software Services Pvt. Ltd, Pondicherry, India

Contents
Preface xivAcknowledgements xvAbout the author xvi
1 Engineering geology 11.1 Introduction 11.2 What do engineering geologists do? 11.3 What an engineering geologist needs to know 21.4 The role of an engineering geologist in a project 5
1.4.1 General 51.4.2 Communication within the geotechnical team 5
1.5 Rock and soil as engineering materials 91.6 Qualifications and training 11
2 Introduction to civil engineering projects 142.1 Management: parties and responsibilities 14
2.1.1 The owner/client/employer 142.1.2 The architect and engineer 142.1.3 The project design 162.1.4 The contractor 172.1.5 Independent checking engineer 18
2.2 Management: contracts 182.2.1 Risk allocation for geotechnical conditions 192.2.2 Reference ground conditions 212.2.3 Claims procedures 232.2.4 Dispute resolution 242.2.5 Legal process and role of expert witness 252.2.6 Final word on contracts: attitudes of parties 26
2.3 Design of structures: an introduction 272.3.1 Foundations 27
2.3.1.1 Loading from a building 272.3.1.2 Options for founding structures 29
2.3.2 Tunnels 312.4 Design: design codes 332.5 Design: application of engineering geological principles 36

3 Geology and ground models 383.1 Concept of modelling 38
3.1.1 Introduction 383.2 Relevance of geology to engineering 403.3 Geological reference models 41
3.3.1 A holistic approach 413.3.2 The need for simplification and classification 423.3.3 Igneous rocks and their associations 433.3.4 Sediments and associations – soils and rocks 46
3.3.4.1 General nature and classification 463.3.4.2 Sedimentary environments 52
3.3.5 Metamorphic rocks and their associations 603.4 Geological structures 63
3.4.1 Introduction 633.4.2 Types of discontinuity 643.4.3 Geological interfaces 643.4.4 Faults 643.4.5 Periglacial shears 673.4.6 Joints 673.4.7 Differentiation into sets 733.4.8 Orthogonal systematic 743.4.9 Non-orthogonal, systematic 763.4.10 Shear joints 783.4.11 Complex geometries 783.4.12 Sheeting joints 803.4.13 Morphology of discontinuity surfaces 84
3.4.13.1 Sedimentary rocks 853.4.13.2 Tension fractures 86
3.5 Weathering 873.5.1 Weathering processes 873.5.2 Weathering profiles 88
3.6 Water 913.6.1 Introduction 913.6.2 Groundwater response to rainfall 923.6.3 Preferential flow paths through soil 943.6.4 Preferential flow paths through rock 95
3.7 Geological hazards 963.7.1 Introduction 963.7.2 Landslides in natural terrain 97
3.7.2.1 Modes of failure 973.7.2.2 Slope deterioration and progressive
failure 983.7.3 Earthquakes and volcanoes 100
3.8 Ground models for engineering projects 1003.8.1 Introduction 1003.8.2 General procedures for creating a model 102
vi Contents

3.8.3 Fracture networks 1033.8.4 Examples of models 103
4 Site investigation 1154.1 Nature of site investigation 1154.2 Scope and extent of ground investigation 116
4.2.1 Scope and programme of investigation 1164.2.2 Extent of ground investigation 119
4.3 Procedures for site investigation 1244.3.1 General 1244.3.2 Desk study 124
4.3.2.1 Sources of information 1244.3.2.2 Air photograph interpretation 125
4.3.3 Planning a ground investigation 1284.3.3.1 Equation 1: geological factors 1294.3.3.2 Equation 2: environmental factors 1354.3.3.3 Equation 3: construction-related factors 1364.3.3.4 Discussion 137
4.4 Field reconnaissance and mapping 1394.4.1 General 1394.4.2 Describing field exposures 143
4.5 Geophysics 1514.5.1 Seismic methods 1524.5.2 Resistivity 1534.5.3 Other techniques 1534.5.4 Down-hole geophysics 154
4.6 Sub-surface investigation 1544.6.1 Sampling strategy 1544.6.2 Boreholes in soil 1554.6.3 Rotary drilling 158
4.7 In situ testing 1614.8 Logging borehole samples 1684.9 Down-hole logging 1724.10 Instrumentation 1744.11 Environmental hazards 179
4.11.1 General 1794.11.2 Natural terrain landslides 1804.11.3 Coastal recession 1814.11.4 Subsidence and settlement 1824.11.5 Contaminated land 1824.11.6 Seismicity 183
4.11.6.1 Principles 1834.11.6.2 Design codes 1834.11.6.3 Collecting data 183
4.12 Laboratory testing 1844.13 Reporting 184
Contents vii

5 Geotechnical parameters 1855.1 Physical properties of rocks and soils 1855.2 Material vs. mass 1855.3 Origins of properties 185
5.3.1 Fundamentals 1855.3.2 Friction between minerals 1875.3.3 Friction of natural soil and rock 1875.3.4 True cohesion 1895.3.5 Geological factors 189
5.3.5.1 Weathering 1905.3.5.2 Diagenesis and lithification
(formation of rock from soil) 1915.3.5.3 Fractures 1935.3.5.4 Soil and rock mixtures 193
5.4 Measurement methods 1955.4.1 Compressive strength 1965.4.2 Tensile strength 2015.4.3 Shear strength 201
5.4.3.1 True cohesion 2035.4.3.2 Residual strength 203
5.4.4 Deformability 2045.4.5 Permeability 204
5.5 Soil properties 2055.5.1 Clay soils 2055.5.2 Granular soil 2075.5.3 Soil mass properties 207
5.6 Rock properties 2075.6.1 Intact rock 207
5.6.1.1 Fresh to moderately weathered rock 2075.6.1.2 Weathered rock 208
5.6.2 Rock mass strength 2095.6.3 Rock mass deformability 211
5.7 Rock discontinuity properties 2135.7.1 General 2135.7.2 Parameters 2145.7.3 Shear strength of rock joints 215
5.7.3.1 Basic friction, φb 2155.7.3.2 Roughness 221
5.7.4 Infilled joints 2225.7.5 Estimating shear strength using empirical
methods 2235.7.6 Dynamic shear strength of rock joints 225
5.8 Rock-soil mixes 2265.8.1 Theoretical effect on shear strength of
included boulders 2275.8.2 Bearing capacity of mixed soil and rock 228
viii Contents

5.9 Rock used in construction 2285.9.1 Concrete aggregate 2285.9.2 Armourstone 2295.9.3 Road stone 2295.9.4 Dimension stone 229
6 Analysis, design and construction 2316.1 Introduction 2316.2 Loads 231
6.2.1 Natural stress conditions 2316.2.2 Loadings from a building 236
6.3 Temporary and permanent works 2376.4 Foundations 238
6.4.1 Shallow foundations 2386.4.2 Buoyant foundations 2416.4.3 Deep foundations 242
6.4.3.1 Piled foundations 2426.4.3.2 Design 2456.4.3.3 Proof testing 2516.4.3.4 Barrettes 2516.4.3.5 Caissons 252
6.5 Tunnels and caverns 2536.5.1 General considerations for tunnelling 2536.5.2 Options for construction 2546.5.3 Soft ground tunnelling 2556.5.4 Hard rock tunnelling 258
6.5.4.1 Drill and blast/roadheaders 2586.5.4.2 TBM tunnels in rock 260
6.5.5 Tunnel support 2606.5.5.1 Temporary works 2606.5.5.2 Permanent design 261
6.5.6 Cavern design 2656.5.7 Underground mining 2666.5.8 Risk assessments for tunnelling and
underground works 2666.5.8.1 Assessment at the design stage 2676.5.8.2 Risk registers during construction 267
6.6 Slopes 2686.6.1 Rock slopes 268
6.6.1.1 Shallow failures 2696.6.1.2 Structural 2726.6.1.3 Deep-seated failure 274
6.6.2 Soil slopes 2746.6.3 Risk assessment 2796.6.4 General considerations 2796.6.5 Engineering options 281
Contents ix

6.6.5.1 Surface treatment 2816.6.5.2 Rock and boulder falls 2826.6.5.3 Mesh 2836.6.5.4 Drainage 2836.6.5.5 Reinforcement 2856.6.5.6 Retaining walls and barriers 2866.6.5.7 Maintenance 287
6.7 Site formation, excavation and dredging 2886.7.1 Excavatability 2886.7.2 Dredging 288
6.8 Ground improvement 2886.8.1 Introduction 2886.8.2 Dynamic compaction 2896.8.3 Static preloading 2896.8.4 Stone columns 2906.8.5 Soil mixing and jet-grouted columns 2906.8.6 Drainage 2906.8.7 Geotextiles 291
6.8.7.1 Strengthening the ground 2916.8.7.2 Drainage and barriers 291
6.8.8 Grouting 2926.8.9 Cavities 292
6.9 Surface mining and quarrying 2936.10 Earthquakes 294
6.10.1 Ground motion 2946.10.2 Liquefaction 2966.10.3 Design of buildings 2976.10.4 Tunnels 2996.10.5 Landslides triggered by earthquakes 300
6.10.5.1 Landslide mechanisms 3006.10.5.2 Empirical relationships 302
6.10.6 Slope design to resist earthquakes 3036.10.6.1 Pseudo-static load analysis 3046.10.6.2 Displacement analysis 304
6.11 Construction vibrations 3046.11.1 Blasting 3046.11.2 Piling vibrations 305
6.12 Numerical modelling for analysis anddesign 3056.12.1 General purpose 3056.12.2 Problem-specific software 306
6.13 Role of engineering geologist during construction 3076.13.1 Keeping records 3076.13.2 Checking ground model and design
assumptions 3076.13.3 Fraud 309
x Contents

7 Unexpected ground conditions and how to avoid them:case examples 3107.1 Introduction 3107.2 Ground risks 3107.3 Geology: material-scale factors 311
7.3.1 Chemical reactions: Carsington Dam, UK 3117.3.2 Strength and abrasivity of flint and chert:
gas storage caverns Killingholme,Humberside, UK 312
7.3.3 Abrasivity: TBM Singapore 3127.3.4 Concrete aggregate reaction: Pracana Dam,
Portugal 3147.4 Geology: mass-scale factors 315
7.4.1 Pre-existing shear surfaces: Carsington Damfailure 315
7.4.2 Faults in foundations: Kornhill development,Hong Kong 316
7.4.3 Faults: TBM collapse, Halifax, UK 3167.4.4 Geological structure: Ping Lin Tunnel,
Taiwan 3187.4.5 Deep weathering and cavern infill: Tung Chung,
Hong Kong 3187.4.6 Predisposed rock structure: Pos Selim
landslide, Malaysia 3207.5 General geological considerations 322
7.5.1 Tunnel liner failure at Kingston on Hull, UK 3227.5.2 Major temporary works failure: Nicoll
Highway collapse, Singapore 3237.5.3 General failings in ground models 324
7.6 Environmental factors 3247.6.1 Incorrect hydrogeological ground model
and inattention to detail: landfill site in the UK 3247.6.2 Corrosive groundwater conditions and failure
of ground anchors: Hong Kong and UK 3277.6.3 Explosive gases: Abbeystead, UK 3287.6.4 Resonant damage from earthquakes at
great distance: Mexico and Turkey 3287.7 Construction factors 330
7.7.1 Soil grading and its consequence: piling atDrax Power Station, UK 330
7.7.2 Construction of piles in karstic limestone,Wales, UK 332
7.8 Systematic failing 3337.8.1 Heathrow Express Tunnel collapse 3337.8.2 Planning for a major tunnelling system under
the sea: SSDS Hong Kong 336
Contents xi

7.8.3 Inadequate investigations and mismanagement:the application for a rock research laboratory,Sellafield, UK 339
7.8.4 Landslide near Busan, Korea 3417.8.5 A series of delayed landslides on Ching
Cheung Road, Hong Kong 342
Appendix A: Training, institutions and societies 344A.1 Training 344
A.1.1 United Kingdom 344A.1.2 Mainland Europe 345A.1.3 United States of America 346A.1.4 Canada 347A.1.5 China 348A.1.6 Hong Kong 349
A.2 Institutions 349A.2.1 Introduction 349A.2.2 The Institution of Geologists (IG) 350A.2.3 The Institution of Civil Engineers (ICE) 351
A.2.3.1 Member 351A.2.3.2 Fellow 351
A.2.4 Institution of Materials, Minerals andMining (IOM3) 352
A.2.5 Other countries 352A.3 Learned societies 352
A.3.1 Introduction 352A.3.2 Geological Society of London 352A.3.3 International Association for Engineering Geology
and the Environment 353A.3.4 British Geotechnical Association (BGA) 353A.3.5 Association of Geotechnical and
Geoenvironmental Specialists 353A.3.6 International Society for Rock Mechanics 354A.3.7 International Society for Soil Mechanics and
Geotechnical Engineering 354Appendix B: Conversion factors (to 2 decimal places) and
some definitions 356Appendix C: Soil and rock terminology for description
and classification for engineering purposes 359C.1 Warning 359C.2 Introduction and history 359C.3 Systematic description 360
C.3.1 Order of description 360C.3.1.1 Soil 361C.3.1.2 Rock 361
xii Contents

C.4 Soil description 362C.5 Rock description and classification 362
C.5.1 Strength 362C.5.2 Joints and discontinuities 365C.5.3 Discussion 368C.5.4 Weathering 368
C.5.4.1 Material weathering classifications 369C.5.4.2 Mass weathering classifications 371
C.6 Rock mass classifications 374C.6.1 RQD 374C.6.2 More sophisticated rock mass classification
schemes 375C.6.2.1 RMR 375C.6.2.2 Q SYSTEM 376C.6.2.3 GSI 376
C.6.3 Slope classifications 378
Appendix D: Examples of borehole and trial pit logs 379D.1 Contractor’s borehole logs 379
D.1.1 UK example 379D.1.2 Hong Kong example 384
D.2 Consultant’s borehole log, Australia 384D.3 Contractor’s trial pit logs 393
Appendix E: Tunnelling risk 394Appendix E-1 Example of tunnelling risk assessment at
project option stage for Young DongMountain Loop Tunnel, South Korea 394
Appendix E-2 Example of hazard and risk prediction table 401Appendix E-3 Example risk register 415
References 417Index 443
Contents xiii

Preface
The genesis of this book lies in a wet, miserable tomato field in Algeria.I was sitting on a wooden orange box, next to a large green Russianwell-boring rig with a blunt bit. I was three weeks out of University.The Algerian driller hit the core barrel with a sledgehammer and a hotsteaming black sausage of wet soil and rock wrapped itself around myhands. A Belgian contractor walked up and said to me (in French),‘What do you think? Four, six?’ I looked at the steamingmass thought-fully and said, ‘Maybe about five.’He nodded approvingly. To this dayI don’t know what he was talking about or in what units.I went to see the ‘chef de zone’ for this new steelworks, Roger Payne,
who seemed totally in control and mature but was probably abouttwenty-eight, and suggested that we should write a book on engineer-ing and geology. He, as a civil engineer, should write the geology bitsand I should write the civil engineering bits as a geologist. That way wewould see what we both considered important. We would edit eachother’s work. Well, we didn’t do it but this book follows the blueprint.It includes aspects of geology that I consider most relevant to civilengineering, including many things that most earth science studentswill not have been taught in their undergraduate courses. It alsoprovides an introduction into the parlance of civil engineering, whichshould help engineering geologists starting out. It is an attempt to setout the things that I wish I had known when I started my career.

Acknowledgements
Many have helped with this book mainly by reviewing parts, providinginformation and agreeing use of their data, figures and photos.These include: Des Andrews, Ian Askew, John Burland, JonathanChoo, Chris Clayton, Gerry Daughton, Bill Dershowitz, Steve Doran,Francois Dudouit, Ilidio Ferreira, Chris Fletcher, John Gallerani,Graham Garrard, Robert Hack, Trevor Hardie, Roger Hart, EvertHoek, Jean Hutchinson, Justyn Jagger, Jason Lau, Qui-Hong Liao,David Liu, Karim Khalaf, Mike King, Andy Malone, Dick Martin,Dennis McNicholl, David Norbury, Don Pan, Chris Parks, AndyPickles, Malcolm Reeves, David Starr, Doug Stead, Nick Shirlaw,Kevin Styles, Nick Swannell, Leonard Tang, Len Threadgold, RogerThompson and Derek Williams. I would also like to acknowledge theguidance of friends andmentors including BobCourtier,Mike deFreitas,Richard Hart, Su Gon Lee, Keith Lovatt, Alastair Lumsden and LaurieRichards plusmy research studentswhosework I have relied on through-out. Ada Li has drawn some of the figures and Jenny Fok has done someof the tricky bits of typing. Thanks to all.Finally thanks to my long-suffering wife Marji – it has been a hard
slog, glued to the computer and surrounded by piles of paper whilst thegarden reverts to something resembling the Carboniferous rain forests.Sam Hencher has drawn some excellent cartoons and Kate and Jesshave helped in their own sweet ways.

About the author
Steve Hencher is a Director of Halcrow China Ltd. (www.halcrow.com). He is also Research Professor of Engineering Geology at LeedsUniversity, UK, and Honorary Professor in the Department of EarthSciences at Hong Kong University.He is a geologist by first degree and gained his PhD from Imperial
College, London, on the shear strength of rock joints under dynamicloading. He then joined SirWS Atkins & Partners where he was one ofonly nine geotechnical employees servicing what, even then, were thelargest consultants in Europe. Atkins gave him wide experience in avery short term. This included the opportunity to investigate theground for and supervise the construction and installation of piles atDrax Power Station, which provided a sharp insight into how largecivil engineering projects work. Since then he has worked with theHong Kong Government for five years, where he investigated majorlandslides, worked on shear strength of rock and first became involvedin mapping and describing thick weathered profiles. Other majorexperience includes being part of the Bechtel design team for theHigh Speed Rail in Korea, working specifically on the design of verylarge span tunnels and underground stations. He taught the MSc inEngineering Geology at Leeds University full-time from 1984 to 1996and supervised a large number of research students. Since 1997, hehas headed geotechnics in the Hong Kong Office of Halcrow and wasRegional Director of the KoreanOffice for seven years. He has workedand continues to work on various national and international commit-tees in geotechnical engineering, in particular on weathered rocks,piling, landslides, rock slopes and rock mass characterisation. He hasacted as an expert advisor and witness in several legal cases, includingaspects of foundation design and construction, tunnelling, landslidesand site formation.

1 Engineering geology
1.1 Introduction
Geology can be defined as the scientific study of the Earth and espe-cially the rocks and soils that make up the Earth: their origins, natureand distribution, and the processes involved in their formation.Engineering geology then may be defined as the scientific study ofgeology as it relates to civil engineering projects such as the design ofa bridge, construction of a dam or preventing a landslide. Engineeringgeologists need to identify the local rock and soil conditions at a siteand anticipate natural hazards such as earthquakes so that structurescan be designed, constructed and operated safely and economically.He (or she, throughout) needs to work with civil engineers and under-stand what they are trying to do and the constraints under whichthey work. His remit and responsibilities can be extensive, coveringall of the Earth Sciences, including geophysics, geochemistry andgeomorphology.
1.2 What do engineering geologists do?
Engineering geologists make up a high proportion of professionalgeologists throughout the world. Most of these work in civil engineer-ing: in consulting (designing) or contracting (construction) companieswith a team of engineers, some of whom will be specialised in the fieldof geotechnical engineering, which concerns the interface of structureswith the ground.One of the important tasks of an engineering geologist is to investi-
gate the geological conditions at a site and to present these in asimplified ground model or series of models. Models should containand characterise all the important elements of a site. Primary geologi-cal soil and rock units are usually further subdivided on the basis offactors such as degree of consolidation and strength, fracture spacingand style, hydrogeological conditions or some combination. Modelsmust identify and account for all the natural hazards that might impactthe site, as illustrated schematically in Figure 1.1 for a new high-rise

structure to be sited in a valley threatened by a nearby natural hillside.The ground model, integrated with the civil engineering structure, canbe analysed numerically to ensure that the tolerance criteria for aproject are achieved. For most structures, the design criteria will bethat the structure does not fail and that any settlement or deformationwill be tolerable; for a dam, the design criteriamight include acceptableleakage from the impounded reservoir; for a nuclear waste reposi-tory, it would be to prevent the escape of contaminated fluids to thebiosphere for many thousands of years.
1.3 What an engineering geologist needs to know
Many authors have attempted to define engineering geology as a subjectseparate to geology and to civil engineering (e.g. Morgenstern,2000; Knill, 2002; Bock, 2006), but it is easier to define what apractising engineering geologist needs to know and this is set out inTable 1.1. Firstly, an engineering geologist needs to be fully familiarwith geology to the level of a traditional earth sciences degree. Heshould be able to identify soil and rocks by visual examination and tointerpret the geological history and structure of a site. He also needs tohave knowledge of geomorphological processes, and be able to inter-pret terrain features and hydrogeological conditions. He must befamiliar with ground investigation techniques so that a site can be
Figure 1.1 Sitemodel for a newbuilding,illustrating some ofthe factors andhazards that needto be addressed bythe engineeringgeologist.
2 Practical Engineering Geology
naturallandslide risk
rainfall
flooding
foundationoptions?
previous land use?
superficial geologycan it carry loadpotential settlementliquefaction potential
earthquake hazard?
depth to bed rockand bed rockquality?active fault?in situ stress?
mining?
contamination?

Table 1.1 Basic skills and knowledge for engineering geologists.
It is difficult to define engineering geology as a separate discipline but easier to define the subject areas withwhich an engineering geologist needs to be familiar. These include:
1. GEOLOGYAn in-depth knowledge of geology: the nature, formation and structure of soils and rocks. The ability tointerpret the geological history of a site.
2. ENGINEERING GEOLOGY AND HYDROGEOLOGYAspects of geology and geological processes that are not normally covered well in an undergraduate geologicaldegree syllabus need to be learned through advanced study (MSc and continuing education) or duringemployment. These include:
– Methods and techniques for sub-surface investigation.– Properties of soil and rock, such as strength, permeability and deformability – how to measure these in the
laboratory (material scale) and in the field and how to apply these at the large scale (mass scale) to geologicalmodels.
– Methods for soil and rock description and classification for engineering purposes.– Weathering processes and the nature of weathered rocks.– Quaternary history, deposits and sea level changes.– Nature, origins and physical properties of discontinuities.– Hydrogeology: infiltration of water, hydraulic conductivity and controlling factors. Water pressure in the
ground, drainage techniques.– Key factors that will affect engineering projects, such as forces and stresses, earthquakes, blast vibrations,
chemical reactions and deterioration.– Numerical characterisation, modelling and analysis.
These are dealt with primarily in Chapters 3, 4, 5 & 6.
3. GEOMORPHOLOGY
Most engineering projects are constructed close to the land surface and therefore geomorphology is very important.An engineermight consider a site in an analytical way, for example, using predicted 100-year rainfall and catchmentanalysis to predict flood levels and carrying out stability analysis to determine the hazard from natural slopelandslides. This process can be partially shortcut and certainly enhanced through a proper interpretation of therelatively recent history of a site, as expressed by its current topography and the distribution of surfacematerials. Forexample, study of river terraces can help determine likelymaximum flood levels and can also give some indication ofearthquake history in active regions such as New Zealand. The recognition of past landslides through air photointerpretation is a fundamental part of desk study for many hilly sites. This is dealt with in Chapters 3 and 4.
4. CIVIL ENGINEERING DESIGN AND PRACTICEAn engineering geologist must be familiar with the principles of the design of structures and the options, say forfounding a building or for constructing a tunnel. He/she must be able to work in a team of civil and structuralengineers, providing adequate ground models that can be analysed to predict project performance, and thisrequires some considerable knowledge of engineering practice and terminology. The geological ground condi-tions need to be modelled mechanically and the engineering geologist needs to be aware of how this is done and,better still, able to do so himself. This is covered mainly in Chapters 2 and 6.
5. SOIL AND ROCK MECHANICS
Engineering geology requires quantification of geological models. Hoek (1999) described the process as ‘puttingnumbers to geology’. That is not to say that pure geologists do not take a quantitative approach – they do, forexample, in analysing sedimentary processes, in structural geology and in geochronology. However, a geologistis usually concerned with relatively slow processes and very high stress levels at great depths. The behaviour ofsoil and rock in the shorter term (days and months) and at relatively low stresses are the province of soilmechanics and rock mechanics. Knowledge of the principles and practice of soil and rock mechanics isimportant for the engineering geologist. This includes strength, compressibility and permeability at material andmass scales, the principle of effective stresses, strain-induced changes, critical states and dilation in rock masses.
characterised cost-effectively and thoroughly. Furthermore, he needsto understand the way that soils and rocks behave mechanically underload and in response to fluid pressures, how they behave chemically,and how to investigate their properties. To carry out his job properly,an engineering geologist also needs to know the fundamentals of howstructures are designed, analysed and constructed, as introduced inChapter 2 and presented in more detail in Chapter 6. Much of this willnot be taught in an undergraduate degree and needs to be learntthrough MSc studies or through Continuing ProfessionalDevelopment (CPD) including self study and from experience gainedon the job.The better trained and experienced the engineering geologist, the
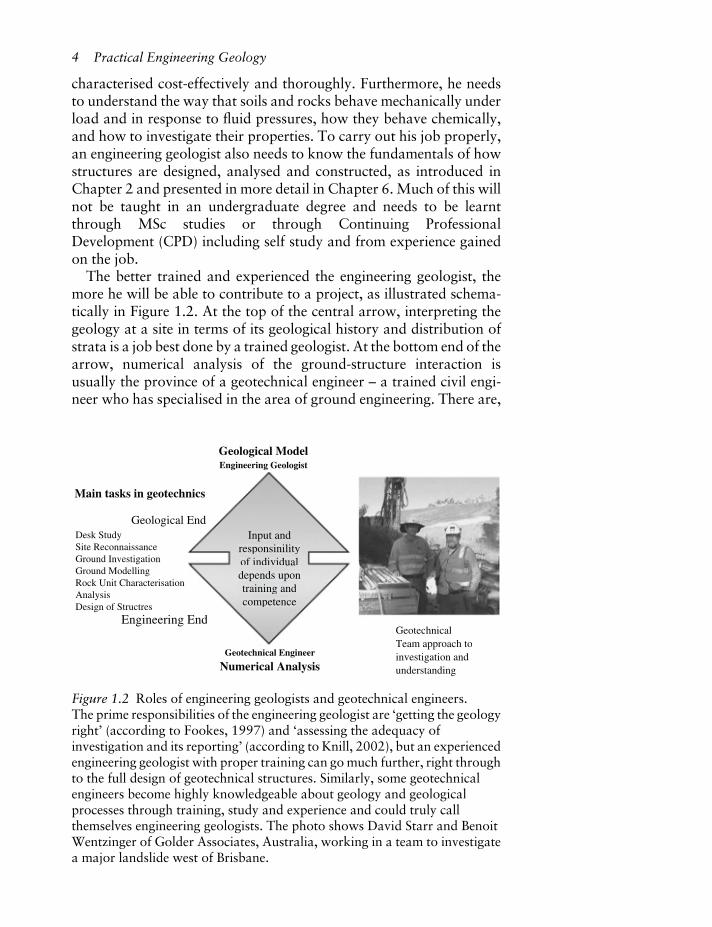
more he will be able to contribute to a project, as illustrated schema-tically in Figure 1.2. At the top of the central arrow, interpreting thegeology at a site in terms of its geological history and distribution ofstrata is a job best done by a trained geologist. At the bottom end of thearrow, numerical analysis of the ground-structure interaction isusually the province of a geotechnical engineer – a trained civil engi-neer who has specialised in the area of ground engineering. There are,
Figure 1.2 Roles of engineering geologists and geotechnical engineers.The prime responsibilities of the engineering geologist are ‘getting the geologyright’ (according to Fookes, 1997) and ‘assessing the adequacy ofinvestigation and its reporting’ (according to Knill, 2002), but an experiencedengineering geologist with proper training can gomuch further, right throughto the full design of geotechnical structures. Similarly, some geotechnicalengineers become highly knowledgeable about geology and geologicalprocesses through training, study and experience and could truly callthemselves engineering geologists. The photo shows David Starr and BenoitWentzinger of Golder Associates, Australia, working in a team to investigatea major landslide west of Brisbane.
4 Practical Engineering Geology
Geological ModelEngineering Geologist
Main tasks in geotechnics
Geotechnical Engineer
Numerical Analysis
Engineering End
Geological EndDesk StudySite ReconnaissanceGround InvestigationGround ModellingRock Unit CharacterisationAnalysisDesign of Structres
GeotechnicalTeam approach toinvestigation andunderstanding
Input andresponsinilityof individualdepends upontraining andcompetence
nics
End
End
GeotechnicalTeam approach to
Input andresponsinilityof individualdepends upontraining andcompetence

however, many other tasks, such as design of ground investigationsand numerical modelling, that could be done by either an experiencedengineering geologist or a geotechnical engineer. Many professionalengineering geologists contribute in a major way to the detailed designand construction of prestigious projects such as dams, bridges andtunnels and have risen to positions of high responsibility within privatecompanies and government agencies.
1.4 The role of an engineering geologist in a project
1.4.1 General
As discussed and illustrated later, some sites pose major challengesbecause of adverse and difficult geological conditions, but the majoritydo not. This leads to a quandary. If a ‘one-size-fits-all’ standardisedapproach is taken to site characterisation and more particularly toground investigation (Chapter 4), then much time and money will bewasted on sites that do not need it but, where there are real hazards,then the same routine approach might not allow the problems to beidentified and dealt with. This is when things can go seriously wrong.Civil engineering projects sometimes fail physically (such as the col-lapse of a dam, a landslide or unacceptable settlement of a building) orcost far more than they should because of time over-runs or litigation.Often, in hindsight, the root of the problem turns out to be essentiallygeological. It is also commonly found that whilst the difficult condi-tions were not particularly obvious, they were not unforeseeable orreally unpredictable. It was the approach and management that waswrong (Baynes, 2007).Engineering geologists can often make important contributions at
the beginning of a project in outline planning and design of investiga-tion for a site and in ensuring that contracts deal with the risksproperly, as outlined in Chapter 2.A skilful and experienced engineering geologist should be able to
judge from early on what the crucial unknowns for a project are andhow they should be investigated. Typical examples of the contributionsthat he might make are set out in Table 1.2.
1.4.2 Communication within the geotechnical team
The engineering geologist will almost always work in a team and needsto take responsibility for his role within that team. If there are geolo-gical unknowns and significant hazards, he needs to make himselfheard using terminology that is understood by his engineering collea-gues; the danger of not doing so is illustrated by the case example of aslope failure in Box 1-1.
Engineering geology 5

Table 1.2 Particular contributions that an engineering geologist might bring to a project (notcomprehensive).
1. Unravelling the geological history at a site. This will come initially from regional and local knowledge,examination of existing documents, including maps and aerial photographs, and the interpretation of exposedrock and geomorphologic expression. Geology should be the starting point of an adequate ground model fordesign.
2. Prediction of the changes and impacts that could occur in the engineering lifetime of a structure (perhaps50–100 years). At some sites, severe deterioration can be anticipated due to exposure to the elements, withswelling, shrinkage and ravelling of materials. Sites may be subject to environmental hazards, includingexceptional rainfall, earthquake, tsunami, subsidence, settlement, flooding, surface and sub-surface erosionand landsliding.
3. Recognising the influence of Quaternary geology, including recent glaciations and rises and falls in sea level;the potential for encountering buried channels beneath rivers and estuaries.
4. Identifying past weathering patterns and the likely locality and extent of weathered zones.5. Ensuring appropriate and cost-effective investigation and testing that focuses on the important features that
are specific to the site and project.6. Preparation of adequate ground models, including groundwater conditions, to allow appropriate analysis
and prediction of project performance.7. An ability to recognise potential hazards and residual risks, even following high-quality ground
investigation.8. Identification of aggregates and other construction materials; safe disposal of wastes.9. Regarding project management, he should be able to foresee the difficulties with inadequate contracts that
do not allow flexibility to deal with poor ground conditions, if they are encountered.
Box 1-1 Case example of poor communication with engineers
The investigations into a rock slope failure are reported byHencher (1983a), Hencher et al. (1985) and byClover (1986). During site formation works of a large rock slope, behind someplanned high-rise apartmentblocks, almost 4,000m3 of rock slid during heavy rainfall on awell-defined and very persistent discontinuitydipping out of the slope at about 28 degrees. The failure scar is seen in Figure B1-2.1. The lateralcontinuity of the wavy feature is evident to the left of the photograph, beneath the shotcrete cover, markedby a slight depression and a line of seepage points. If the failure had occurred after construction, the debriswould have hit the apartment blocks. A series of boreholes had been put down prior to excavation and theorientation of discontinuities had been measured using impression packers (Chapter 4). Statistical analysisof potential failure mechanisms involving the most frequent joint sets led to a design against shallow rockfailures by installation of rock bolts and some drains. The proposed design was for a steep cutting, withthe apartment blocks to be sited even closer to the slope face than would normally be allowed.Unfortunately, the standard method of discontinuity analysis had eliminated an infrequent series ofdiscontinuities daylighting out of the slope and on one of which the failure eventually occurred. Pitfalls ofstereographic analysis in rock slope design are addressed byHencher (1985), a paper written following thisnear-disaster.
Examination of the failure surface showed it to be a major, persistent fault infilled with clay-boundedrock breccia about 700mm thick and dipping out of the slope (Figures B1-2.2 and B1-2.3). In the pre-failure borehole logs, the fault could be identified as zones of particularly poor core recovery; the rockin these zones was described as tectonically influenced at several locations. In hindsight, the faulthad been overlooked for the design and this can be attributed to poor quality of ground investigation and
6 Practical Engineering Geology

statistical elimination of rare but important discontinuities from analysis, as discussed earlier, butexacerbated by poor communication. The design engineers and checkers might not have been alertedby the unfamiliar terminology (tectonically influenced) used by the logging geologist; they should havebeen more concerned if they had been warned directly that there was an adversely oriented fault dippingout of the slope.The feature was identified during construction, but failure occurred before remedial
Figure B1-2.1 View of large rock slope failure in 1982, South Bay Close, Hong Kong.
Figure B1-2.2 Exposure of brecciated and clay-infilled feature through mostly moderately and slightlyweathered volcanic rock and with very different orientation to most other rock joints.
Engineering geology 7
Dominant joint set
Fault zone

measures could be designed (Clover, 1986). It was fortunate that the failure occurred before constructionof the apartment blocks at the toe. The site as in 2010 is shown in Figure B1-2.4. The slope requiredextensive stabilisation with cutting back and installation of many ground anchors through concretebeams across the upper part of the slope and through the fault zones. These anchors will need to bemonitored and maintained continuously for the lifetime of the apartments.
Figure B1-2.4 Slope in 2010 showing anchored concrete beams installed to prevent further failure in thetrimmed-back slope above the apartment blocks.
Figure B1-2.3 Cross section through slope showing original and cut slope profile at the time of failure.Geology is interpreted frommapping of the failure scar, but the main fault could be identified in boreholesput down before the failure occurred.
8 Practical Engineering Geology
Volcanicrock
Originalgroundlevel
Cut slopeat time offailure
Failuresurface
mPD60
70
80
90
100
Volcanicrock
Colluvium
Failed mass
Seepageabovefault afterfailure
700 mm thick andlaterally veryextensive zone ofcaly-bound breccia

Inadequate site investigation that fails to identify the true nature of asite and its hazards can result in huge losses and failure of projects.Similarly, poorly directed or unfocused site investigation can be a totalwaste of time and money whilst allowing an unfounded complacencythat a proper site investigation has been achieved (box ticked).The engineering geologist needs to work to avoid these occurrences.He needs to be able to communicate with the engineers and to do thathe needs to understand the engineering priorities and risks associatedwith a project. Those risks include cost and time for completion. Thisbook should help.
1.5 Rock and soil as engineering materials
In geology all naturally occurring assemblage of minerals are calledrocks, whatever their state of consolidation, origins or degree ofweathering (Whitten & Brooks, 1972). For civil engineering pur-poses it is very different. Geological materials are split into soil androck, essentially on differences in strength and deformability. Tomake it more difficult, the definitions of what is soil and what isrock may vary according to the nature of the project. For manypurposes, soil is defined as material that falls apart (disaggregates)in water or can be broken down by hand but, for a large earth-movingcontract, materials may be split into soil and rock for paymentpurposes according to how easy or otherwise the material is toexcavate; rock might be defined as material that needs to be blastedor that cannot be ripped using a heavy excavating machine. Forengineering design, the distinctions are often pragmatic and theremay be fundamental differences in approach for investigationand analysis. This is illustrated for slope stability assessment inFigure 1.3. In the left-hand diagram, the soil, which might be stiffclay or completely weathered rock, is taken as having isotropicstrength (no preferential weakness directions), albeit that geologicalunits are rarely so simple. To assess stability, the slope is searchednumerically to find the critical potential slip surface, as explained inChapter 6. In contrast the rock slope to the right is, by definition,made up of material that is too strong to fail through the intactmaterial, given the geometry of the slope and stress levels. In thiscase, site investigation would be targeted at establishing the geometryand strength characteristics of any weak discontinuities (such asfaults and joints) along which sliding might occur. If an adversestructure is identified then the failure mechanism is analysed directly.This conceptual split is fundamental to all branches of geotechnicalengineering, including foundations, tunnels and slopes, and it isimportant that the engineering geologist is able to adapt quickly toseeing and describing rocks and soils in this way.
Engineering geology 9

The compartmentalisation of soil and rock mechanics is quitedistinct in geotechnics, with separate international societies, whichhave their own memberships, their own publications and organisetheir own conferences. Details and links are given in AppendixA. Textbooks deal with soil mechanics or rock mechanics but notthe two together. In reality, this is a false distinction and anunsatisfactory situation. Engineering geologists and geotechnicalengineers need to appreciate that in nature there is a continuumfrom soil to rock and from rock to soil. Soil deposited as softsediment in an estuary or offshore in a subsiding basin is gradu-ally buried and becomes stronger as it is compressed by the weightof the overlying sediment, and strong bonds are formed by cemen-tation, as illustrated in Figure 1.4. Conversely, igneous rock suchas granite is strong in its fresh state but can be severely weakenedby weathering to a soil-like condition, as illustrated in Figure 1.5,so that it might disintegrate on soaking and even flow into exca-vations below the water table.An engineering geologist must be familiar with the full range
of geological materials and understand the principles and methods of
Figure 1.3 Distinction between soil and rock at a pragmatic level for slope stability analysis. Soilfailure is near Erzincan, Turkey. Analysis involves searching for the slip plane that gives the lowestFoS for the given strength profile. The rock slope is in a limestone quarry, UK, and failure is totallycontrolled by pre-existing geological structure (bedding planes and joints).
10 Practical Engineering Geology
SOILROCKFailure through
Failure followspre-existingjoints
Too strong forintact failure(by definition)‘intact’
material
Potential slip surface withlowest, calculated ‘Factor ofSafety’ against failure
‘Soil’ vs. ‘Rock’ slop assessment: different requirements forinvestigation, testing and analysis
SOILROCKFailure through
Failure fopre-existinjoints
Too strongintact failu(by defini‘intact’
material
Potential slip surface withlowest, calculated ‘Factor ofSafety’ against failure

both soil and rock mechanics, which are tools to be adopted, asappropriate, within the engineering geological model.
1.6 Qualifications and training
Engineering geologists generally begin their careers as earth sciencegraduates, later becoming engineering geologists through postgradu-ate training and experience. Within civil engineering, in many coun-tries including the UK, Hong Kong and the USA, there is a careerpathway that is measured through achievement of chartered status orregistration as a professional, as summarised in Table 1.3. The aim isthat engineering works should only be designed and supervised bycompetent persons who have received adequate training and experi-ence. Chartered or registered status generally requires a recogniseduniversity degree followed by a period of training under the super-vision of a senior person within a company. The practice of engineer-ing is often legally defined and protected by government regulations.In some countries, only registered or chartered engineers or engineer-ing geologists are permitted to use the title and to sign engineering
Figure 1.4 The cycle of rock to soil and soil to rock. Diagenetic and lithification processes cause softsediment to transform into strong cemented rock during burial. Exposed rock breaks down to soil byweathering.
Engineering geology 11
Rock to Soil and Soil to Rock
Sedimenttransport
Erosion
Rock
Rock
Soil
Intermediate
deposition
sea
Selfweightcompaction
1,000
0 50
Porosity(%)
Dep
th o
f bu
rial
(m
)
100
2,000
3,000
4,000
Subsiding
Bonding betweenmineral grains
Shea
r st
reng
th, τ
Tensilestrength, σt
Normal stress, σ
cohesion, c
Self weightconsolidation
for mud /mudstone
leads to muchcloser packing
Grain bonding andcementation leads tothe development oftensile strength andtrue cohesion inaddition to frictionalstrength
φ
Weak sandstone
Clay-rich layer
Cementation from porefluids and plasticmigration from highlystressed grain contacts
Mostly vertical, orthogonalfractures from due to over-pressure of fluids oncesediment gains some tensilestrength (brittle fracture)
basin
Weatheringof rock to
soil
Rock to Soil and Soil to Rock
Sedimenttransport
Erosion
Rock
Rock
Soil
Intermediate
deposition
sea
Selfweightcompaction
1,000
0 50
Porosity(%)
Dep
th o
f bu
rial
(m
)
10
2,000
3,000
4,000
Subsiding
Bonding betweenmineral grains
Shea
r st
reng
th,τ
Tensilestrength, σt
Normal stress, σ
cohesion, c
Self weightconsolidatio
for mud /mudstone
leads to muccloser packin
Gracemthe tenstrueaddstre
φ
Weaak sk andstone
ClaCl y-rich layer
Cementation from porefluids and plasticmigration from highlystressed grain contacts
Mostly vertical, orthogonalfractures from due to over-pressure of fluids oncesediment gains some tensilestrength (brittle fracture)
basin
Weatheringof rock to
soil

documents (reports, drawings and calculations), thus taking legalresponsibility. Details for career routes for various countries are setout in Appendix A, together with links to a number of learned societiesand details of professional institutions that an engineering geologistmight aspire to join.
Figure 1.5 Typical stages of chemical weathering for an igneous rock.
12 Practical Engineering Geology
Slightly weathered grainte as recovered from a borehole andin thin section under microscope
‘out of the oven’ – notseen at Earth’s surface Typical dry
densityMg/m3
2.7
Weatheringand leaching
Clayremains inplace
Openporoustexture
Collapse andreworking
1.71.2
2.0
Fineswashedout ofrelicfabric
UCS up to about 250MPa
Looks fresh in handsample but joints may bestained
Several hammer blows tobreak sample
Discoloured, weakenedand jointed but still‘rock’
Needs hammer to break
Becoming soil like butdoesn’t disintegrate ifplaced in water
Many micro-cracks
Broken by hand
Feldspars soft – groovedwith pin and sampledisintegrates in water
Micro-cracks may besealed with clay
Original texture lost
Much of quartz has beendissolved.
Typically red, clay rich
Fresh
SlightlyWeathered
ModeratelyWeathered
HighlyWeathered
CompletelyWeathered
ResidualSoil
completely weathered granite with texture retained (feldsparsdecomposed to white kaolin). After adding water it completelydisaggregates (slakes)
Slightly weathered grainte as recovered from a borehole andin thin section under microscope
yp ydensityMg/m3
Weaee thehh ringandndnd leeaching
Clayremains inplace
pennnrousus
xtureee
ollapse andddki
1.72
2 0
nesashedt oflicbric
completely weathered granite with texture retained (feldsparsdecomposed to white kaolin). After adding water it completeldisaggregates (slakes)

Table 1.3 Typical routes for a career in geotechnical engineering (UK).
Engineering geologist Geotechnical engineer
� First degree geology or other earth sciences(BSc or MSc)
� First degree civil engineering (BEng orMEng)
� MSc in engineering geology� 5+ years experience and training� Chartered Geologist (straight-forward
route) – Geological Society of London� Chartered Engineer (more difficult route) –
Institution of Civil Engineers or Institutionof Mining, Metallurgy and Materials
� MSc in geotechnical subject (e.g. soilmechanics or foundation engineering)
� 5+ years experience and training� Chartered Engineer (Institution of
Civil Engineers)
Distinctive skills at early stage in career development
� Knowledge of the fabric and texture ofgeological materials and geological structuresand how these will influence mechanicalproperties (more so for rock than soil)
� Observation and mapping of geological data� Interpreting 3-D ground models from limited
information following geological principles� Identifying critical geological features for a
ground model
� Numerate, with sound basis for analysis andthe design of engineering structures
� Good understanding of mechanics(more so for soil than rock)
� Understanding of project management andbusiness principles

2 Introduction to civil engineeringprojects
2.1 Management: parties and responsibilities
2.1.1 The owner/client/employer
All civil engineering projects have owners – otherwise known as theclient or the employer, because the owner ultimately pays for all theworks and employs the various parties involved in design and con-struction. The owner normally engages architectural and engineeringcompanies to advise him and to manage, design and construct theproject in a cost-effective manner. Most projects are designed by aconsulting engineer and built by a contractor. Under such ‘engineer’sdesigns’ the design responsibility rests with the project designer. Otherprojects are described as ‘turnkey’ or ‘design and build’, where acontractor is commissioned to deliver the whole project or part of aproject as a complete package. Such arrangements – ‘contractor’sdesign’ – often apply to specialist parts of projects such as a boredtunnel or piled foundations for a building. The typical relationshipsand tasks for a project designed by a consulting engineer are illustratedin Figure 2.1.Sometimes the owner may have in-house technical expertise suffi-
cient to overview the project (as in a government department or largeenergy company) but rarely will he have the staff or experience todesign, construct and/or supervise all aspects of a large civil engineer-ing project, which might require a huge range of skills – from siteformation through numerical analysis to mechanical and electricalfitting out.
2.1.2 The architect and engineer
Engagement of an architect and engineer may be through competitivetender whereby several capable consulting companies are invited tomake proposals for design and possibly supervision and for the costcontrol of construction and to give a price for carrying out this work.The owner will select and contract with one party or with a consortiumof consultants known as a joint venture (JV), which might be a

2
3
The Client employs an engineer to
prepare a detailed design
The Engineer
The Engineer specifies the ground investigation (GI) – where and how
3+
4+GI results go back
to the Engineer
4
The Client employs a GI contractor on the
advice of the Engineer
6
The Engineer interprets the ground conditions
The Client employs a civil engineering
contractor to build the bridge
5
The Engineer prepares drawings and specifications
for construction
In the event of ‘Unexpected
Ground Conditions’, the Contractor
asks for more money from the Client
The claim is channelledthrough the Engineer who assesses validity
If there is no agreement then it may go to litigation
The Engineer calls for bids from qualified
contractors on behalf of the Client
He may also supervise works to ensure quality
The Client wants a bridge
He employs an architect to come up with a basic design
1
7 Help!
All parties have contracts with the
Client for their part of the works
Figure 2.1 The client wants a bridge. This figure illustrates various contractual arrangements andrelationships between the main parties in an engineered design – one where the project is designed bya specialist design engineer and built by a specialist contractor.

grouping of specialist architectural, structural, mechanical and civil/geotechnical companies, which have joined together specifically to winand work on the project. The JV will need well-organised internalmanagement to ensure that roles, responsibilities and payments areall clear and adhered to. The price paid by the owner may be a fixedlump sum on a time charge basis (usually with different rates quotedfor engineers of different seniority and expertise within the consultantorganisation) or on a time charge with an agreed ceiling estimate. Theroles of architect and engineer are legal entities with responsibilitiesoften defined by building regulations within the country where theproject is to be constructed. An individual within the company respon-sible for design may be named as an approved person, architector structural engineer and may be required to sign drawings andformal submissions to government or other checking organisations.
2.1.3 The project design
The engineer (and architect) plans the works, specifies investigationsand designs the structure. The design is usually presented as a series ofdrawings, including plans and cross sections (elevations) to scale, withdetails of what the contractor is to construct and where. This willnormally include an overall site plan showing, for example, the loca-tion of all foundation works – piles, pads or other features. Drawingsare accompanied by specifications for how the construction is to becarried out – for example, the strength of concrete to be used and anyrestrictions such as prohibition on blasting because of proximity tobuildings. This will later be supplemented by method statements(which set out how the contractor will carry out parts of the work)and programmes (dates for completion of the various activities makingup the works) submitted by the contractor commissioned to constructthe works (see below) to the designer for his approval.Within the consulting engineers a project director and project man-
ager will usually be appointed to see the project through to successfulcompletion. The measures of success are not only delivery of the projectto the satisfaction of the owner but also to make a profit for the designcompany and to meet internal requirements of the company, whichinclude staff development and training. The price quoted to the ownerwhen bidding to do theworks is usually based on the estimated staff costto produce the design and then adding a margin, which might be 100 to200%. This margin would cover overheads such as office support andinfrastructure, general company costs plus actual profit for the share-holders in the company. Whereas the mark-up on staff costs mightseem high, actual profit margins for most UK design consultants, onceall costs are taken into account, are often less than 10%.The engineer is in a very responsible position, as he will plan any site
investigation, seek tenders from contractors to carry out all tasks and
16 Practical Engineering Geology

works, and make recommendations to the owner regarding whichcontractors he should employ. He will take the site investigationdata, design the works and probably supervise the works, althoughsometimes this is let as a separate contract or conducted in-house forconsistency between separate sections of an ongoing project, as is thepractice of the Mass Transit Railway Authority in Hong Kong, forexample. During construction, the engineer will usually employ ornominate a resident engineer (RE) and other resident site staff whowill deal with the construction on site, on a day-to-day basis. The sitestaff will refer any needs for design changes as the works progress backto the design office for resolution.
2.1.4 The contractor
Various contractors may be employed for the works. Contractors areusually invited to bid to carry out works, as set out in drawings,specifications and a bill of quantities (BOQ), which lists the works tobe done and estimated amounts (e.g. volume of material to excavate).The contractor puts a price against each item in the BOQ and the sumof all the itemised costs will constitute his offer to the owner forcompleting the works. Generally, a specialist ground investigationcontractor will be employed to carry out sub-surface investigation ofthe site following a specification for those works by the engineer. Thatspecification will include locations and depths of sampling, types oftesting and the equipment to be used (Chapters 3 and 4). Other con-tractors will be used to conduct and construct the various facets of aproject.Contractors, like engineers, need to ensure that they allow for some
degree of profit. When the engineer assesses the various tenders, onbehalf of the owner, he needs to be cautious that any particularly lowbid is not unrealistic (which he would normally do by comparing withhis own broad estimate of what the cost might be). A particularly lowbid might mean that the contractor has misunderstood the scope of theworks and whilst the low price might be attractive to the owner, quiteoften such situations end up in conflict or dispute, with the contractordesperately trying to compensate for his underestimation of the costsinvolved. Alternatively, the contractor might be trying to win or main-tain market share at a time of high competition, so his bid has adeliberately low profit margin. A third possibility is that the contractoralready has in mind ways to make claims for additional payment,especially if the contracts are not well drafted, as discussed later. Theengineer may recommend that the owner does not accept the lowesttendered offer because of these various concerns, and some countriesand governments have rules and methods in place for trying to elim-inate unrealistic bids and ensuring that the most suitable contractor isemployed.
Introduction to civil engineering projects 17

Sometimes the contractor might identify some better or more cost-effective way of carrying out part or all of the works and can offer thisas an alternative design to that presented in the tender documents (theconforming design); the owner might accept this proposal because ofprice, programme or quality reasons. The contractor (and his designer)might then take over responsibility for future design works and theowner may employ another engineer to check these designs.The contractor may sub-contract parts of theworks – for example, by
employing a specialist piling sub-contractor to construct that element ofthe foundations. Whilst for a normal engineer-design project, theconsulting engineer is responsible for overall design, the contractormay need to design temporary works necessary as intermediate mea-sures in achieving the final design intent. For example, to construct adeep basement, the contractormay have to design some shoring systemto support the excavation until the final walls and bracing slabs of thefinal structure have been completed. Temporary works should nor-mally be designed to the approval of the engineer. In some instances,some of the permanent works are designed by the contractor or thetemporary works somehow incorporated within the permanent worksbecause to remove them might be too difficult or it is otherwisebeneficial to do so.Contractor’s designs are sometimes adopted for parts of a project
because of his local and specialist technical experience together withhis knowledge of the costs of material, plant and labour. Anotheradvantage is that there may be less ambiguity in terms of who isresponsible for the performance of the works and in particular dealingwith problems posed by difficult ground conditions. When it comes tofoundations or tunnels, the contractor should be in a position to acceptthe risk of any unforeseeable ground conditions – providing he isallowed to design and conduct an adequate ground investigation tohis own specification.
2.1.5 Independent checking engineer
For many large projects, an independent checker is employed by theowner to give added confidence that the design of permanent andtemporary works is correct. The checker is usually a similar type ofcompany to the design company, i.e. an engineering consultant. Thecheck could be confined to a simple review of design assumptionsand calculations but, in some instances, might involve a comprehensiveand separate analysis of all aspects of a project.
2.2 Management: contracts
Civil engineering is a commercial business and the engineering geolo-gist needs to understand how it works. The relations between all
18 Practical Engineering Geology

parties are governed by contracts. A contract is a legal documentbetween the owner and each of the other parties involved with a projectand defines the scope and specification of works, including paymentschedules and responsibilities. Contracts also need to be made betweenconsultants and specialist sub-consultants or JV partners, and betweena contractor and specialist sub-contractors. It is very wise to use lawyersat this stage to ensure that contracts are well written tominimise the riskof later dispute, although standard forms of contract are often used andlarge companies tend to have internal documents. The experiencedengineering geologist can help ensure that contracts are reasonable,realistic and fair with respect to their treatment of ground conditions,which is where many problems arise during construction. These pro-blems need to be resolved in a pragmatic manner and quickly duringconstruction, but there is often some dispute at a later stage over whichparty should pay for changes, additional costs and delays.
2.2.1 Risk allocation for geotechnical conditions
As discussed later, sites vary geotechnically from those that are extre-mely difficult to understand and characterise, to those that are simpleand straightforward. In a similar fashion, site investigations vary inquality from focused, excellent and insightful, to downright useless,depending on the experience, capability and insight of the engineerand his team in planning and interpreting the investigation and theskill and quality of equipment of the ground investigation contractor.As a result, there are always risks involved in projects, especiallywhere these involve substantial ground works, for example, in tunnel-ling or deep foundations. The risks need to be assigned under acontract and there are few mandatory rules. Each contract shouldstate how variations are to be dealt with in the event of unforeseenground conditions such as stronger or weaker rock (requiring differ-ent excavation techniques) or more water inflow to a tunnel (requir-ing additional ground treatment works) than had been anticipated.This is a large and important subject and guidance on how to identifycritical ground conditions through a systematic approach for addres-sing hazards and risks, using focused site investigation, is presented inChapters 4 and 6 and Appendix E. Chapter 7 takes this further andprovides case examples of projects where things went wrong for somereason or other.Some of the background and options for preparing a contract with
respect to ground hazards are illustrated in Figure 2.2.Mostly, projectsuse standard contract forms such as the New Engineering Contract(NEC) (ICE, 2005) or Fédération Internationale Des Ingénieurs-Conseils (FIDIC) (discussed by Tottergill, 2006). Some contractualforms are suitable to engineer-design contracts and others to designand build situations.
Introduction to civil engineering projects 19

In some forms of contract, the owner accepts all the ground risks andthat makes some sense in that it is his site, with all its inherent geologicaland environmental conditions. This kind of contract works quite wellfor simple sites and structures, for example, the cutting of a slope withthe installation of soil nails, where the work done by the contractor israther routine and can be simply re-measured against the provisionalBOQ priced by the contractor when he tendered to do the work. If heexcavates 2,300 m3 of soil and 52,050 m3 of rock during the contract,then that is what hewill be paid for, at the prices he originally quoted foreach type of excavation, although there might be some disagreementover the definition of soil and rock by the parties. Specialist engineerscalled quantity surveyors (QS) assess and recommend approval of suchpayments to the engineer and then on to the owner.In an attempt to make it clear-cut where the responsibilities lie, some
owners try to use contracts that place all the risks for ground condi-tions solely on the contractor, but this is inflexible and offers no wayout when things go wrong. In practice, depending on commercialpressures, the contractor may take a serious gamble (sometimes with-out fully weighing up the risks) and it is then, when things startbecoming difficult, such as when the ground conditions are worsethan expected, that claims begin to be made and disputes can follow.Even where all the risk has been accepted by the contractor, whenthings become very difficult, he and his lawyers may try to use clausesin the contract, such as claiming that the works were physically orcommercially impossible, or just give up on the project. The argumentscan be long and extremely costly for all parties. Such contractualarrangements are rarely used these days for major projects.For more complex projects and especially for constructions under-
ground, usually some of the ground risks are accepted by the
Figure 2.2 Themain options forforming a contractto deal with the riskof unexpectedlydifficult groundconditions.
20 Practical Engineering Geology
Contractor is paid thecost of completing worksin full. Disadvantage isthat there is no incentivefor the contractor toresolve problems cost-effectively when theyarise
Some compromisealternatives:
clause allowing additionalpayment
partnering (open book)allowing both gain or loss toboth parties if conditions arebetter or worse thananticipated
Contractor takes all risks
Client takes all risks
RISK OFUNEXPECTED
GROUNDCONDITIONS
agreed reference groundconditions at start
A disadvantage is thatthe contractor isunable (or unwilling)to price the risks withany certainty. Can gobadly wrong (seeChapter7)

contractor. As Walton (2007) observes, the contractor, unlike theowner, is in the construction business, is a specialist in the particulartype of works he is to undertake, and may be able to spread the riskover a number of contracts, to some degree. In order to get thecontractor to accept some of the risk of encountering difficult condi-tions, however, the owner must expect to pay some additional sum tocover that insurance element through a higher contract price; if therisks do not materialise, he will have wasted money, but that is thenature of insurance.In shared risk contracts, the contractor is expected to accept and
cope with generally variable but predictable conditions, but is allowedto claim for additional money where something unpredictable andhighly adverse is encountered. Despite the pressure release valve ofold ICE Conditions of Contract Clause 12 (payment for unexpectedground conditions) and similar clauses in other standard forms ofcontract, it is in all parties’ interests that all hazards and risks areforeseen and priced for by the contractor in terms of the extra workand delay which will occur if the risk materialises. This is definitely theprovince where the engineering geologist can play a major role and inparticular by engineering geologists working within the engineer’sconsulting team, which is responsible for investigating the site anddesigning and specifying the works. There is a similarly important rolefor engineering geologists within the tendering contracting company,who must anticipate hazards and price the job sensibly.Unfortunately, contractors sometimes fail to take account of all the
perceived risks (even where aware) partly because they know that theowner (advised by the engineer) will be tempted to employ the con-tractor offering the lowest price. There areMachiavellian aspects to allthis in that each party is trying to minimise its costs and risks whilstmaximising profit. Contract writing and interpretation are key parts ofthis. For example, a contractor will try to predict where extra quan-tities might be required during construction, compared to the estimatesby the engineer that will form part of the contract in the BOQ(for example, in the proportion or rock vs. soil to be excavated) andquote unit prices appropriately to maximise his profits. He mightinclude high mobilisation charges, whilst trimming prices of otheritems on the bill to improve the payment schedule and his cash flowwithout jeopardising his chance of winning the contract in competitionwith other invited tendering contractors. This is all fair and aboveboard but it does mean that the conduct of a civil engineering contractcan be rather fraught at times.
2.2.2 Reference ground conditions
It is now common, for tunnelling works especially, to try to set outsome reference ground conditions (presented in geotechnical baseline
Introduction to civil engineering projects 21

reports) that all parties buy into for contractual purposes before theworks actually begin. For larger tunnelling contracts in the UK, andincreasingly elsewhere, it is now mandatory that the hazards and risksare assessed and managed in a consistent manner (British TunnellingSociety, 2003). This is also the general case for some standard contracts(FIDIC). This was introduced largely because insurance companieswerereceiving an increasing number of claims due to tunnelling projectsgoing seriously wrong and were threatening simply to withhold insur-ance on ‘such risky, poorly investigated, poorly thought-through andmismanaged projects’ (Muir Wood, 2000).Unfortunately, in practice it is often not that simple to define engi-
neering geological conditions in a distinct and unambiguous manner.If one tries to be very specific (say on the rock type to be encountered)then it would be relatively easy for the contractor to employ a specialistat a later stage to dispute the rock description in detail and then toallege that the slight difference in rock type caused all the difficultiesthat followed (excess wear, higher clay content etc., etc., plus delays andgeneral loss of productivity). Drafters of reference conditions some-times resort instead to broad characterisation, perhaps using rock massclassifications such asQ or RockMass Rating (RMR), as introduced inChapters 4 and 5 and Appendix C. The problem there is that suchclassifications are made up of a range of parameters such as strengthand fracture spacing, each of which can be disputed because geology isnever that simple (or uniform). Furthermore, experienced personscan often draw very different conclusions from the same data set.Fookes (1997) reports an exercise where he asked two engineeringgeologists familiar with rock mass classifications to interpret the samesets of boreholes and exposures for a particular tunnel in terms ofRMR and Q value. One came up with an RMR = 11 (extremelypoor rock and danger of immediate collapse); the other RMR = 62(fair rock and that no support is required). The Q value interpretationswere similarly quite different (extremely poor vs. fair rock). In thisparticular case, the rock contained incipient cleavage (slate) and thedifferent opinions on classifications mostly hinged upon whether thatcleavage was considered a joint set or not – the standards and guidancedocuments do not help very much in this regard, as discussed inChapters 3 and 4. The main point is that despite reference conditionsbeing set out with good intentions of helping the contractor to price thejob and avoiding dispute, there is no guarantee that this will beachieved.It is the normal case that the extent of geological/geotechnical units
and position and nature of faults, for example, are uncertain. Thegeotechnical baseline report should present the best interpretation ofthe ground conditions by the designers and state any limitations andreservations. In doing so, the rationale should not be, somehow, tooutwit the contractor contractually, but to allow the contractor to
22 Practical Engineering Geology

select the right methods for construction, and to price and to pro-gramme his works adequately. Contractually, the reference conditionsshould be just that – something to refer to when considering whethersome adverse ground was anticipated or anticipatable by an experi-enced contractor, given the available information. The contractor willhave been expected to consider the site in a professional manner, whichwould include examining any relevant rock exposures, say in quarriesadjacent to the route. Many contracts require the contractor to satisfyhimself of the ground conditions at a site or along the route, but it israrely practical for him to carry out his own ground investigation attender stage (with no guarantee of winning the work) and often thatconstraint is accepted by an arbitrator in any subsequent dispute.One point that follows is that it is very important for engineering
geologists to keep good records throughout construction. Theseshould be factual, with measurements, sketches and photographs,using standard terminology for description and classification, as intro-duced in Chapter 3. Quite often, especially for tunnels, the engineeringgeologist representing the contractor will prepare sketches of groundconditions encountered, together with engineering works installed(such as locations of rock bolts and instruments) and seek to get thisagreed by the supervising team on a daily basis. This means that thebasis for payment is clarified and, in the event of some contractualdispute later, there are clear records for all parties to review.
2.2.3 Claims procedures
Interestingly, when things become difficult during the works becauseof poor ground conditions, the contractor has to apply through theengineer for extramoney (ultimately to be paid for by the owner). Nowit is the engineer’s responsibility to act impartially, within the terms ofthe contract, having regard to all the circumstances. In like manner, theengineer’s representative on site and any person exercising delegatedduties and authorities should also act impartially (ICE Conditions ofContract). In other standard contracts, in recognition that the engineeris employed by the owner, the engineer is expected to act reasonablyrather than impartially, but nevertheless he is clearly expected to treatthe contractor’s claims in a proper manner with due regard to thecontract and the actual situation. The engineer can, however, findhimself in a position of conflicting interest, where the ground condi-tions that are causing the difficulty to the contractor might, andperhaps should, have been recognised and dealt with by the engineer’sinvestigation, design and specification for the works (Dering, 2003).He might have to approve a claim by the contractor, in the knowledgethat he himself is culpable because of poor ground investigation,modelling or design. Conversely, he might resist a claim that laterproves valid following dispute resolution.
Introduction to civil engineering projects 23

2.2.4 Dispute resolution
If a claim cannot be resolved between the contractor and the ownerthen the claim might be passed to a third party. The two parties canjointly appoint a technical expert to help resolve the issues through aprocess of adjudication. It is a far less formal process than going tocourt. The appointment of an adjudicator might be written into theoriginal contract (as specified in the New Engineering Contract of ICE)and his decisions should be complied with. For larger projects, theparties might appoint an agreed panel of experts at the outset. Thepanel can be asked to adjudicate on the validity of any claim –whetherconditions were different to those anticipated and whether they hadthe adverse consequences claimed by the contractor. This leaves thedecisions in the hands of experienced professionals rather than lawyerswhose knowledge of ground conditions and ground behaviour mightbe rather limited.Mediation is an option where the parties to a dispute will plead
their cases to an independent mediator (who might be a lawyer ratherthan a technical expert). He will try to get the parties to reach anagreement and will also provide an opinion as to the likely outcome ifthe matter is taken to the next, more expensive level. If a party (eitherthe owner or contractor) is told by an independent mediator that theirposition over a claim is weak, then they may be more willing to reachan agreement with the other side. Arbitration is a higher-level processand is generally written into contracts as a way of having disputesresolved. Both parties agree at the outset that this should be so, andthe location where any arbitration should be conducted. Arbitrationtakes place in a court and there may be up to three arbitrators –
perhaps one agreed between both parties and the second and thirdchosen by each party independently. The cost, with lawyers (probablyseveral on both sides), barristers, independent experts (see nextsection) and the court expenses, can be very high. In a recent case thatthe author was involved with, the final award to the winning partywas essentially the same as had been previously offered in settlement,prior to arbitration, and was far exceeded by the cost of the legalproceedings.Arbitration decisions are generally taken as final – however dis-
gruntled one party might feel at the result. Arbitration reports andoutcomes are generally kept confidential to the parties. Unfortunately,this means that the profession does not learn lessons, which is a greatpity. The only cases that make their way into the literature as well-documented examples are those that are actually taken to court (publicdomain) or where there is some kind of forensic study in the case of amajor collapse such as the collapse of the Heathrow Express tunnelsand the failure of the Nicoll Highway excavations in Singapore. Theseand other case examples are presented in Chapter 7.
24 Practical Engineering Geology

2.2.5 Legal process and role of expert witness
When disputes reach the stage of either arbitration or civil court, whereone party sues another, it is usual for the parties to employ experts toadvise them on the validity or otherwise of their case and, if they agreewith their client’s position, to make a report stating the reasons why.Because many ground condition claims are fundamentally linked to apoor appreciation of geology, engineering geologists often becomeinvolved in disputes as experts. Initially, the expert will be advisinghis client on the strength of the claim, outside any legal proceedings. Ifthe expert disagrees with his client’s position, he must tell him as soonas he recognises that situation. It will then be up to the client and hislegal advisors to decide how to proceed.If the expert thinks his client’s case is valid and hewrites a report that
may be used in evidence, it is important that he recognises that hisoverriding duty is to the court rather than to the party that is paying forhis services. The expert needs to understand that in complex, technicalcases his evidence can often be pivotal. Questions put to an expert andhis replies to them are treated as part of his evidence. Experts arerequired to make some statement of truth, that he believes that thefacts stated in his report are true and that the opinions are correct andhis own. He will also need to make an oath in court. The court willoften request that the experts employed by the two sides hold meetingsand prepare joint statements, identifying where matters are agreed andwhere matters are in disagreement. In principle, this sounds straight-forward but sometimes instructing lawyers will prevent or limit theagreement of experts, partly because, whilst experts may agree broadlyor compromise over some technical issue (as they would if they wereworking together on an engineering project), there may be subtleties inthe legal considerations and case law that might hold sway. That said,technical experts must beware being led by lawyers in preparing theirreports and must not attempt to argue points that they are not happywith or that fall outside their knowledge and expertise. In court,barristers, judges and arbitrators will question experts very thoroughlyand a tenuous and weakly held position will usually be exposed forwhat it is.Geotechnical experts need to recognise that they are not legal
experts. The author was involved in a case where the contractor hadaccepted all ground risks. The situation appeared clear-cut and hope-less for the contractor to a layman, but a barrister educatedme that theowner and his design engineers had made ‘representations’ whichwould affect things legally. Quite often a party is clearly at fault insome way but there may be some question over their legal responsi-bility. To resist a charge of negligence the engineer need not have doneeverything right – just to the same quality as his peers on average.I have heard an expert say in court, ‘I have seenworse’, as an excuse for
Introduction to civil engineering projects 25

poor practice. It is then up to the arbitrator or judge to decide whetherthat excuse is persuasive.
2.2.6 Final word on contracts: attitudes of parties
In practice, much depends upon the attitudes of the various parties.Even a poorly drafted contract can be made to work so that the ownergets his project constructedwithin his budget and the contractormakesa profit, but this requires co-operative and non-adversarial attitudes.To foster this attitude, formal partnering sessions are commonly usedwhere everyone is asked to agree some set of rules of behaviour andprofessional dealings.Whether or not this works is often down to individuals – especially
the RE and the contractor’s site agent. The author has experience of alarge project involving several different contracts, where the RE had ahigh regard for one contractor but mistrusted another because ofprevious encounters on other projects. He was of the opinion thatthe second contractor had won the contract for an unrealistically lowprice and therefore would be out tomake its profit through claims. Thefirst contract went very well despite many technical problems, whichwere overcome in a pragmatic manner, working as a team. Reasonableclaims were dealt with expediently and everything was completed ontime, to the required technical standards and with the contractorleaving the site a happy man. The second contract was a direct con-trast. All site supervisory staff were instructed by the RE not to givehim any advice, help or site instructions, to avoid chinks in the con-tractual armour that the RE thought the contractor might exploitthrough spurious claims. The contract went badly wrong; there weretechnical difficulties, delays to all later works, financial losses and badfeelings all around.The Mass Transit Railway Corporation (MTRC) in Hong Kong
have run several very challenging projects with the construction ofunderground stations and tunnels in heavily congested urban areaswith all sorts of problems to be overcome. As an MTRC spokesmanput it verbally: ‘conditions are tough enough anyway without contrac-tual difficulties on top’. They therefore try to agree target-cost contractson a ‘cost-plus’ basis for complex projects. The contractor does whathe needs to do to construct the works and gets paid accordingly. Ifthe contract is brought to completion below target price then thecontractor receives a bonus, if not he ‘shares the pain’ with theMTRC. During one particularly challenging contract at Tsim ShaTsui, more than 600 ideas for better working practices were presentedduring the works, together with 371 value-engineering proposals(ways to do things more cost-effectively). As a consequence, the pro-grammewas reduced by five months with significant savings in costs toeveryone’s benefit.
26 Practical Engineering Geology

2.3 Design of structures: an introduction
The following section provides a brief illustration into how engineer-ing projects are designed and constructed, so that the following chap-ters dealing with ground investigation and preparation of groundmodels can be better understood. The project types used for thisintroduction are a) foundations for a building and b) tunnels. Civilengineering design and construction is addressed in more detail inChapter 6.
2.3.1 Foundations
2.3.1.1 Loading from a building
A building imposes a load on the ground. This will include the verticaldead weight of the building – its walls and fixed fittings and a live loadincluding transient loads such as from snow, wind or earthquakeloading, as discussed in detail in Chapter 6. The stress from a building,if placed directly on to flat, essentially isotropic ground, will decreasewith depth and can be expressed as a bulb of pressure, as illustrated inFigure 2.3. At a depth of perhaps 1.5 to 2.0 times the diameter of abuilding, the stress level can be anticipated to reduce to 10% of thestress immediately beneath the foundation (Tomlinson, 2001). This isan important rule-of-thumb for the engineering geologist to keep inmind because it gives an indication of the minimum depth of ground tobe investigated, as discussed in Chapter 4. The depth of significantstress change also depends upon the nature of the foundationsrequired, as illustrated in Figure 2.3.
Figure 2.3 Theconcept of a stressbulb beneath astructure. This isbased on elasticanalysis of uniformmaterials, but isindicative andhelpful. The widerthe structure, thegreater the volumeof ground that willbe stressedsignificantly andthat must beinvestigated. Moredetail is given inChapter 6.
Introduction to civil engineering projects 27
Shallow foundationon soil
Stressedzone
soil
Small house on stripfootings beneath load
bearing walls onlystresses ground locally to
shallow depths
Large building foundedon a raft to spread the
load, (with reduced stress)but stresses are carried by
a much larger volumebeneath the building

For a small house, the overall load is not very great (imagine thestructure collapsed as a pile of bricks and concrete which mightonly be a metre or two in height), so the weight of the house canusually be carried safely by narrow strip footings running beneath theload-bearing walls. For a footing of about 0.5m width, the typicalload from a two-storey house might be about 50kN (5 tonnes) permetre length of wall, so the bearing pressure on the foundation wouldonly be about 100kN/m2 (= 10kPa), which would be safely carriedby a stiff clay or dense sand (Chapter 6). For such a narrow stripfooting, the appropriate depth of ground investigation for assessingpotential settlement might be 1 to 2m. Such an investigation wouldnot, however, provide adequate warning of the many other poten-tial hazards that might affect a low-rise building, as listed inTable 2.1.
Table 2.1 Examples of hazards that might need to be considered, even for low-rise buildings.
Building on unstable ground Investigating the adequacy of the material immediately beneath a buildingto carry the bearing pressure would not deal adequately with sites that aregenerally unstable. Such hazards can be identified by experienced people,often by air photograph interpretation. Another obvious example of sitesto avoid are coastal areas where cliffs are retreating.
Old mine workings Old mine workings can collapse causing a subsidence trough thattravels gradually across the countryside and damages structures. Oldshafts can open up in gardens and directly beneath buildings andother structures. Must be researched and possibly investigated bysub-surface ground investigation – possibly geophysics and drilling inareas with a mining history.
Trees taking moisture outfrom foundations
Trees such as willows that are too close to houses can extract water,especially in times of drought, causing clay to dry out and shrink withconsequent movement in overlying foundations. This is a very commoncause of damage to houses on clay-rich soils.
Services too close Where there are back-filled trenches above services – such as pipesand cables – this can allow lateral movement of a house towards thetrench.
Adverse materials Growth of gypsum from soil containing sulphates can cause heave offoundations (e.g. Nixon, 1978; Hawkins & Pinches, 1987).
Seismicity In seismic zones, special care is required in the design of foundations(more details in Chapter 6). In particular, saturated silt and sandunderlying a structure can turn to a liquid during an earthquake(liquefaction).
Others Other hazards to consider include flooding, impact by boulders and treesfrom adjacent ground, frost heave and thaw in permafrost areas andenvironmental hazards such as hazardous gases, especially from previousland use.
28 Practical Engineering Geology

2.3.1.2 Options for founding structures
As discussed in detail in Chapter 6, there are two key considerationsfor foundation design. Firstly, there should be a check against bearingcapacity failure or ultimate limit state of the underlying soil or rock.This involves analysis of the various loads and calculating the strengthof the supporting ground. Generally, in traditional design methods aFactor of Safety (FoS) of between 2.5 and 3 is adopted against ultimatebearing capacity failure, i.e. the allowable bearing stress should be at least2 or 3 times lower than the load that the ground could theoreticallysupport without failing catastrophically.The second check is for settlement (otherwise known as a service-
ability state). Settlement is inevitable as a building is constructed and theground loaded, but there are certain tolerances that the designer needs tobe aware of. Many structures can cope with perhaps 25mm of vertical(total) settlement and some, such as an earth embankment dam (con-structed from soil and rock fill), may settle by metres without distress;the key question is usually the tolerance of a structure to differentialsettlement, whereby some parts of the structure settle more than others,causing shear stress between different parts. This may happen where theground is not uniform – perhaps one corner of the building footprint isless weathered and therefore stronger and less compressible than therest. If the design of the foundations and/or load distribution of thebuilding does not properly account for this variability, the building willsettle more towards one end. Generally, the limiting rotation for aframed structure is taken as about 1 in 500 to 1 in 300, to avoid crackingin walls and partitions (Skempton &Macdonald, 1956); for a high-risebuilding the tolerance may be lower. Some structures may be even moresensitive and have special requirements for restricting settlement.Generally, the structural designers will need to tell the geotechnicalengineer and engineering geologist what is the tolerance for the projectso that foundations can be designed accordingly.Generally, it is cost-effective to design shallow foundations for
structures. For framed structures comprising columns and beams ofconcrete or steel, the load is carried on the columns, which are thenfounded on pads of reinforced concrete. The size of padwill control thebearing pressure on the underlying soil or rock. If the ground cannotcarry the applied stress from the building without unacceptable settle-ment, then the pad size may be increased, as illustrated in Figure 2.4.For a concrete frame structure, steel reinforcement would be placed inthe columns and towards the base of the foundation where the con-crete may be subject to tensile stress by bending; concrete (and rock) isrelatively weak in tension – typically about one tenth of its strength incompression. Examples of design calculations are given in Tomlinson(2001). In Figure 2.4, because of the variable ground conditions belowthe pad, great care would be needed not to overstress any weaker zones
Introduction to civil engineering projects 29

and it might be necessary to carry out local dentition to excavatepockets of soil or weak rock and replace with structural concrete.Excavations should be examined by a competent engineering geologistor geotechnical engineer, to check that the conditions are as good asassumed for the design. Such checks and approvals should be welldocumented. If the required pad sizes between individual columns arelarge, it may make sense to combine the foundations in a single raftover the full building footprint. It must be remembered, however, thatthe wider the foundation, the greater the volume of ground stressed, asillustrated in Figure 2.3, and the ground investigation must establishthe nature of ground over that full depth. There are many caseswhere weak compressible material at depth has caused problems forfoundations (e.g. Poulos, 2005).Instead of using a raft it is often cost-effective to take the foundations
deeper using piles, which might be timber, steel or concrete. The entirebuilding load might be transferred to some stronger stratum at depthand this is called end-bearing on rockhead, a term that is discussed inChapter 3 (Box 3-1).Other piles rely on support from skin friction on the side of the piles,
for example, by driving a pile into sand until it can be driven nofurther. Many piles are designed to be part end-bearing and partlyrelying on skin friction (Figure 2.5). The design of foundations and themany different options are discussed in more detail in Chapter 6.
Figure 2.4 Demonstration of how the bearing pressure on the ground can be reduced by increasingthe dimensions of the footing whilst carrying the same building load. The weaker the ground, thelarger the foundation will need to be or some other solution might be necessary, such as piling tostronger material at depth. As the size of the foundation increases, so will the cantilever effect withbending, as illustrated in the second diagram. Steel reinforcement will be necessary to resist tensilestresses throughout the structure and also to resist buckling in the column.
30 Practical Engineering Geology
500 tonnes load
Steel reinforcement bars
Load
Compression
BendingTension
500 tonnes = 5000kN
a b
m
Bearing pressure
kN / m2
1.0
2.0
3.0
1.0 5000
1250
556
2.0
3.0
ba

2.3.2 Tunnels
Engineering geologists are often closely involved in the investigationof tunnel routes, preparation of reference ground conditions for con-tracts, tunnel design and during construction. Tunnelling has been car-ried out since ancient times, originally probablymaking use of techniquesdeveloped in mining, which date back many thousands of years.Aqueduct tunnels for water supply were constructed in ancient Rome,Greece and the Middle East. Modern tunnelling really started with thedevelopment of extensive canal systems in the UK and mainland Europein the C16 and C17 where the alternatives to tunnelling were either deepcuttings or long detours around hills. Originally, tunnels were hand-dug,using gunpowder where necessary. Many modern tunnels are con-structed in a similar fashion; improvements include computer-controlleddrilling for blast holes, rapid and sophisticated support methods andmuch better ventilation and safety systems. Generally, drill and blasttunnels involve a cycle of drilling, blasting, mucking-out and support,generally advancing a few metres per pull. Hand-excavation is alsosometimes used, employing essentially mining techniques, perhapsusing powerful road headers moved across the face to dislodge soil androck but not taking out the full tunnel profile at one time. It is often theengineering geologist who, during this type of tunnelling, will examinethe exposed ground and make decisions on the degree of temporarysupport that is required, together with any special requirements forfurther investigation or ground treatment before the tunnel is advanced.One advantage of drill and blast is that methods can be modified quicklyto suit changing and difficult ground conditions. Another advantage isthatmobilisation is fast – tunnelling can be begun quickly and carried outin remote areas of the world. The disadvantage is that it is often muchslower than by using a tunnel boring machine (TBM).TBMs were gradually introduced for excavation, in particular for the
underground railway tunnels in London. In an early attempt at tunnel-ling beneath the Channel, a 2.13m diameter boring machine tunnelled
Figure 2.5 Simplefoundation options.More detail is givenin Chapter 6.
Introduction to civil engineering projects 31
Shallow foundationon rock
Piles end bearingon rock
Building on skinfriction piles

1,893m in 1881 from the UK side and a similar machine advanced1,669m from its portal in France. Today there is a huge range of TBMsavailable, ranging from ones specifically designed for hard rock,through to ones that tunnel through soft waterlogged sediments usingpressurised slurry in front of the machine to support the soil. Asexplained in Chapter 6, precast segmental tunnel liners can be erecteddirectly following the cutting part of the machine and bolted togetherwith gaskets to form a watertight tube. TBMs can be highly successfulwith hundreds of metres advance in a single month, compared perhapsto a hundred metres using drill and blast methods; so, for long tunnels,the cost and possible delays in manufacturing a TBM for the job may bejustified. Quite often, however, TBMs run into difficulties from groundconditions that can slow them down or even stop them completely,despite huge sophistication in their design. The author has experienceof tunnelling through weathered rock in Singapore using a specificallydesigned slurry machine, where in one section of the tunnel the TBMwas stopped because of the high strength of the rock and lack of naturaldiscontinuities. Elsewhere on the same drive, the rock was weathered toa residual soil that was so clay-rich that the slurry treatment plant couldnot cope, again causing delays and necessitating redesign of the treat-ment plant. For the same machine, the machine operators had difficultyin selecting the pressure to adopt in the slurry. If the pressure was toolow, the ground collapsed, if too high, slurry was ejected into the streetabove. Shirlaw et al. (2000) give examples of problems in tunnellingthrough weathered rock terrain, and other examples, especially insqueezing ground and zones of high stress, are given by Barla &Pelizza (2000). Further case examples are given in Chapter 7.It is very important in tunnelling to consider all the potential
hazards that might be encountered and to make sure that the TBMcan cope, as addressed in Chapters 4, 6 and Appendix E. This is evenmore important for TBMs than drill and blast tunnels because it maybe very difficult to modify the method of working and ground support.Whereas in a drill and blast tunnel the engineering geologist canexamine the face and tunnel walls before and after a blast, in atunnel excavated by TBM, all that can often be seen is the spoil beingexcavated (often contaminated with drilling mud), so it is rather diffi-cult to confirm that the ground conditions are as anticipated.Engineering geologists are therefore relatively little used during TBMconstruction, until something goes wrong and needs investigation.In tunnels, key aspects to consider are safety for the workers and
public above the tunnel, the feasibility of different excavation techni-ques, limiting water ingress, stability of the face and side walls duringconstruction and, in the longer term, the effects on surrounding struc-tures (mainly settlement, undermining, vibration and noise) and cost.Shallow tunnels and other excavations, such as underground railway
stations, may be constructed as concrete boxes in open excavations
32 Practical Engineering Geology

from the ground surface (maybe 50mdeep). Immersed tube tunnels areformed from boxes of concrete constructed on land and then floated bybarge to position where they are sunk to the prepared river or seabedand bolted together.In bored tunnels in soil at relatively shallow depth, the main concerns
will usually be stability of the soil in the face, inflow of water andsettlement of adjacent structures. If necessary, the ground can be pre-treated with cement grout, and frozen or compressed air can be used torestrict water inflowand stabilise the ground.When using compressed airthere are considerable health considerations and regulations and there isdanger of a blowout occurring, particularly where running close to somepre-existing structure such as a well or borehole (Muir Wood, 2000).In relatively shallow depths in tunnels in rock, the prime considera-
tions will be blocks of rock falling into the opening, or encounteringfaults which may be full of water. Small failures are generally to beexpected in drill and blast tunnels or are protected by the shield in TBMoperations. Generally, in fractured rock, shotcrete is applied quickly,together with steel mesh and rock bolts as necessary to stabilise zones ofpotentially unstable rock. Similar temporary support systems are some-times used in tunnels through soil, although the principles are different,as discussed in Chapter 6, and there have been many failures in soiltunnels when trying to adopt an observational approach to temporarysupport (essentially the New Austrian Tunnelling Method).Tunnelling inevitably disturbs the in situ stress condition. Existing
stresses in the ground have to flowaround the created void. As discussedin Chapter 6, depending on the ratio of σ1 (maximumprincipal stress) toσ3 (minimum principal stress), tensile zones will develop. Generally,these will not cause any great problem other than some minor crackingand possibly some water ingress at shallow depths. In deep tunnels,however, the concentration of compressive stress in sidewalls to a levelof the intact rock strength, combined with lack of confining stress, canlead to spalling off and rock bursts (Carter et al., 2008). Such phenom-ena are not really a problem for most tunnels but can be significant forthose constructed deep through a mountain chain, or for deep mining.Hoek (2000) reports particular problems for tunnel stability where thein situ stress approaches five times the rock mass strength.
2.4 Design: design codes
Building works throughout the world are generally covered by localregulations, which are mandatory, together with codes of practice andstandards. Such documents cover most aspects of works, includingground engineering, and sometimes aspects of engineering geologicalpractice. Some of the key documents that the engineering geologist inthe UK needs to be aware of are listed in Table 2.2. Similar codes andstandards exist for many other countries.
Introduction to civil engineering projects 33

Table 2.2 Selected codes and standards that are useful or essential references for the engineeringgeologist. The bias here is towards UK practice.
1 CODES FOR SITE INVESTIGATION AND TESTING
1.1 INVESTIGATION
1.1.1 UK: BS 5930:1999 Code of practice for site investigations
BS 5930 (BSI, 1999) deals with the investigation of sites for civil engineering and building works inthe UK; parts have been superseded by documents linked to Eurocode 7 (BSI, 2002, 2003, 2004,2007). It encourages good practice and gives sources of information and references to original literature.In-depth guidance is given on a wide range of techniques in ground investigation, including drilling,boring, in situ testing and geophysical works. The code is almost a textbook in its own right andprovides excellent advice on designing and managing site investigations. The engineering geologist in theUK needs to be very familiar with this code of practice. There is no equivalent advisory-style Europeandocument.
The term site investigation is used in the code in its broad sense, including desk study; the narrower subject ofsub-surface exploration is termed ground investigation. Whilst common practice in the UK is covered in detail,some techniques that are used in ground investigation in other countries are dealt with only briefly or notmentioned.
BS 5930 gives guidance on standard rock and soil description for civil engineering purposes, and theterminology in the BS is used routinely in the ground investigation industry in the UK. As discussed in Chapters 3and 4, different schemes are used in other countries, and important subjects such as rock mass classification arenot covered. Amendment 1 to BS 5930 has been revised to comply with BS EN ISO 14688-1 (BSI, 2002), BS ENISO 14688-2 (BSI, 2004) and BS EN ISO 14689-1 (BSI, 2003), which apply in Europe generally. Changes interminology are not universally accepted as improvements (see discussions in Hencher (2008), Chapter 4 andAppendix C).
1.1.2 Other codes and standards for site investigationThere are several other codes and standards used internationally, and this applies particularly to soil androck description, as discussed in Chapter 4 and Appendix C. Often the differences are just a matter ofdefinition and terminology but there may also be local emphasis – for example, because of the localprevalence of weathered rock or swelling soils. It is very important that the applicable codes are used inwhichever country the engineering geologist is working.
1.2 TESTING
Standard UK methods for some laboratory and in situ soil and rock testing are given in BS 1377 (BSI, 1990),which has been partly superseded by Eurocode 7 Part 2 (Ground Investigation and Testing) (BSI, 2007).Internationally, reference is often made to American Standards (ASTM) or to methods recommended byInternational Society for Rock Mechanics (ISRM) (Ulusay & Hudson, 2006) and others. The recommendedmethods sometimes differ in detail (such as dimensions of samples) and care must be taken to ensure thatappropriate guidelines are being adopted according to the nature of the project and location. Modern,sophisticated and relatively uncommon testing practice is generally not dealt with in country standards andcodes of practice, and reference must be made to the scientific literature (see also Chapter 5).
2 CODES FOR GEOTECHNICAL DESIGN
The British codes of practice discussed below are now generally withdrawn and replaced by Eurocode 7(BSI, 2004, 2007) for geotechnical design purposes. Nevertheless, they provide general advice andguidance and therefore remain useful references on good practice based on ‘well-winnowed experience’(Burland, 2007).

Table 2.2 (continued) Selected codes and standards that are useful or essential references for theengineering geologist. The bias here is towards UK practice.
2.1 FOUNDATIONS
2.1.1 BS 8004:1986 Code of practice for foundations
As with BS5930, this code of practice (BSI, 1986) gives general guidance and background information that isvery useful in guiding the geotechnical engineer and engineering geologist. The code provides recommendationsfor the design and construction of foundations for buildings and engineering structures. It introduces generalprinciples of design, as well as detailed consideration of the design and installation of the foundations. The codealso discusses site operations and construction processes in foundation engineering, and the durability of thevarious materials used in foundation structures. Section 11 deals with safety issues.
In the UK, BS 8004 is superseded by BSI (2004), which adopts a limit state approach to design rather than alumped safety factor approach, as discussed later.
2.1.2 Other codes and standards
Whereas BS 8004 has been superseded in the UK, similar codes are still used internationally. For example, CP4:2003, the Code of Practice for Foundations in Singapore (Singapore Standards, 2003), provides generalguidance on foundation design, specific to local ground conditions. In Hong Kong, comprehensive guidance isgiven in GEO Publication No. 1/2006 (Foundation Design and Construction).
2.2 EARTHWORKS AND RETAINING STRUCTURES
2.2.1 BS 6031:1981 Code of practice for earthworks
BSI (1981a) gives advice on formation of earthworks for civil engineering projects such as highways, railwaysand airfields, and on bulk excavations for foundations, pipelines and drainage works. It gives some UK-focusedadvice on design and construction of cuttings and embankments. Advice is also given on methods of excavatingtrenches, pits and temporary support to the sides, including timbering, sheet piling, diaphragm walls andcontiguous bored piled walls.
2.2.2 BS 8002:1994 Code of practice for earth retaining structures
BSI (1994) is aimed at UK practitioners and provides guidance on the design and construction of retainingstructures up to about 15m high.
More detailed guidance on retaining wall design, especially where dealingwithweathered rocks, is given inGEO(1993) Geoguide 1: Guide for Retaining Wall Design, which, like many other Hong Kong guides andpublications, is downloadable from the Hong Kong Government Civil Engineering Design and Developmentwebsite (www.cedd.gov.hk).
2.3 EUROCODE 7: GEOTECHNICAL DESIGN
The Eurocodes comprise a suite of ten standards, now adopted as British Standards, which havereplaced the majority of older national codes of practice as the basis for designing buildings and civil engineeringstructures in the UK and in most member states of the European Community. As commented above, thesuperseded codes of practice still contain very useful guidance on good practice, albeit that there has been afundamental shift in design concept from a lumped Factor of Safety (FoS) to a partial factors approach.
Fundamentally, the concepts used in the earlier codes of practice and the Eurocodes are the same: under extremeloading conditions, structures must not fail catastrophically and in day-to-day service, structures should notsuffer deformations that would a) render the structure incapable of achieving the use for which it was designedor b) suffer deformations that take the structure beyond its aesthetic appearance requirements; these aredifferent examples of limit states.
Ultimate limit state failure might include the collapse of a slope, bearing capacity failure of a building, or blocksof rock falling out of the roof of a tunnel, or might be identified as piping failure through the foundations of adam. Serviceability limit state failure could be defined as excessive settlement, the classic example being theLeaning Tower of Pisa, which has settled dramatically but not collapsed.

Sometimes locally mandatory codes or guidelines conflict withothers prepared in other countries or by international learned societies,not least in terminology for soil and rock description and classification,with the same words used in different codes to mean different things.The engineering geologist who wishes to work in different countriesneeds to be aware that the standards and terms that he will need to usemay change from country to country. He also needs to be aware thatthe advice given in codes and working party reports regarding geolo-gical matters is often generalised and sometimes difficult to adopt; forexample, guidance prepared for temperate zones may not be appliedreadily in tropical areas and vice versa. This is addressed in more detailin Chapter 4 and Appendix C when discussing soil and rock descrip-tion for engineering purposes.
2.5 Design: application of engineering geological principles
Despite codes of practice and standards, ground conditions con-tinue to be the major source of failure in civil engineeringprojects – through catastrophic failure or unacceptable performanceand even more commonly due to claims, delay and litigation. Inhindsight, the problems can often be attributed to inadequate siteinvestigation, incorrect interpretation of the geological conditions or
Table 2.2 (continued) Selected codes and standards that are useful or essential references for theengineering geologist. The bias here is towards UK practice.
In traditional design, uncertainties are dealt with by adopting a FoS. This gives a broad protection againstthe inherent uncertainty in models, calculations, loads, strengths, workmanship and so on. If the site conditions,such as geological model and geotechnical parameters, are understood well or if potential consequences areminor, then a low FoS might be adopted. Where less certain or the risk is greater, then a higher FoS is adopted.
In the Eurocode approach, rather than assuming a global FoS, it has been taken as fundamental that differentparts of the calculation are known with different certainties; this is certainly true in many situations and is arefinement to design philosophy. Partial factors are then applied to material properties, resistances and/oractions (loads), according to the level of uncertainty. The Eurocode clauses are written as Principles andApplication Rules. Principles use the word ‘shall’ and are mandatory, whereas Application Rules use thewords ‘may’, ‘should’ and ‘can’ and allow more judgement. Although this use of language suggests a moreprescriptive approach than in earlier codes, in practice, the Eurocodes provide a similar level of latitude for thedesigner. For example, in assessing geotechnical risk, Eurocode 7 contains Application Rules that define threegeotechnical categories, and alternative methods are allowed for assessing geotechnical risk. For routinedesign cases, the geotechnical designmay be assessed by reference to past experience or qualitative assessment. Forcomplex or high-risk situations, e.g. weak/complex ground conditions or very sensitive structures, Eurocode 7allows the use of alternative provisions and rules to those within the Eurocode. In such situations, rational designbased on site-specific testing and numerical modelling might be more appropriate. Detailed guidance is given inBond & Harris (2008).
Limit state design approaches are used elsewhere, similar to current European practice. For example, Canadianpractice has moved in that direction and AASHTO (2007) is used in the USA and internationally for the designof major projects such as the 2nd Incheon Bridge in Korea, completed in 2009 (Cho et al., 2009a).
36 Practical Engineering Geology

inadequate design. Poor management and contractual arrangementsoften contribute to the problems. Ways of avoiding unexpectedground conditions are presented in Chapter 4 and case examples,mostly of projects where failures occurred, are presented inChapter 7.
Introduction to civil engineering projects 37

3 Geology and ground models
3.1 Concept of modelling
3.1.1 Introduction
The geology at a site can range from apparently simple to apparentlycomplex scales of metres, tens or hundreds of metres (Figures 3.1 and3.2). Geological complexity does not, however, always equate withdifficulty in engineering terms. Conversely, even where the soil orrockmass is apparently relatively uniform there may be a single featureor property that will cause problems (Figure 3.3). It is the task ofthe engineering geologist to interpret the geology at a site and toidentify those characteristics and properties that might be importantto the engineering project. Much of the detail will be insignificant;the skill is in recognising what is and what is not. At some stage duringthe design process the geology will need to be differentiated insome way into units that can be characterised with essentially uniformmechanical properties or where the properties change in somedefinable way, perhaps with depth. Sometimes the way to do this isobvious – for example, a layer of fill (man-made ground) overlyingalluvium, which in turn overlies bedrock, which will define the wayfoundations are designed – but at other locations identification of thekey attributes is more difficult. Thin layers that might be overlooked inlogging a borehole could turn out to be the most important features ata site.For civil engineering, ground models need to be prepared that are
simplified representations of a site and that should incorporate allthe important elements relevant to design and construction. Themodels are generally developed from a preliminary 3D interpretationof the geology based on desk study and surface mapping and thenrefined by further study of environmental factors such as earthquakehazard and hydrogeology. Models will be improved by groundinvestigation and testing and finally presented as a design model

specifically tuned to the project. The process is illustrated simply inFigure 3.4 and expanded upon later in this chapter. One of the keyfeatures of many ground models is differentiating between upper,soil-like materials, and underlying rock, with the separating bound-ary being called rockhead or, sometimes, ‘engineering rockhead’.Care must be taken in using this term because it has various defini-tions and connotations and is sometimes used in an over-simplisticway for what is a complex situation. The consequences of wrongperception can be severe if, for example, soil is encountered at depthand below the water table, unexpectedly in a hard rock tunnel.Definitions of rockhead are set out in Box 3-1.
Figure 3.1 Massivehorizontallybedded Eoceneconglomerate andsandstone,unconformablyoverlying TriassicLowerMuschelkalk,Sierra de Montsant,north of Falset,Spain.
Figure 3.2 Foldedand faultedextremely strongDevonianradiolarian chertinterbedded withthin bands ofextremely weakorganic shale, nearCabacés, Spain.
Geology and ground models 39

Box 3-1 Definition of rockhead
Care must be taken in using the term rockhead because it can be defined in various ways and the wrongimpressionmay be conveyedwithin a geotechnical design team that things are clear-cut when they are not.
Geological definition
Rockhead is defined in BS 3618 (BSI, 1964) as ‘the boundary between superficial deposits (or drift) andthe underlying solid rock’ and this definition is also adopted by the US Department of the Interior(Thrush et al., 1968). The term solid rock is defined, in turn, in Thrush et al., following Challinor (1964)as ‘rock which is both consolidated and in-situ’. Solid is also generally used in a geological sense todescribe formations that predate superficial deposits (Whitten & Brooks, 1972) as in solid vs. driftmaps. Rockhead used in this way, essentially defines a geological boundary usually marking anunconformity. The solid rock shown on a geological map says nothing about its strength or weatheringstate, so rockhead does not necessarily mark a boundary between soil and rock in strength terms.
Geotechnical definition
The term rockhead or engineering rockhead is often used in geotechnical design to define a boundarybetween soil-like material and rock that is stronger and more resistant, whatever the geological condi-tions. It is also sometimes used more generally ‘as the level at which the engineering parameters of theground satisfy the design parameters for a specific project’ (GEO, 2007).
Sometimes the geological profile is simple (recent soil over rock) and rockhead is readily defined, butoften the situation is more complex and care must be taken not to represent a difficult and variablegeological condition in over-simplified diagrams that might be misunderstood by designers. Weakermaterial or voids below the first occurrence of rock in a borehole might have a controlling influence onmass strength, compressibility and permeability and have severe effects on constructability, for example,collapse of pile borings or sudden inflow of soil into a tunnel.
It is particularly difficult to define a simple level for rockhead in regions of weathered rock. In theopinion of Knill (1978), in the case of karstic limestone, rockhead is the geological contact betweenin situ limestone and overlying superficial deposits (despite often great complexity due to dissolutionfeatures). Similarly, Statham & Baker (1986) define rockhead as the top of in situ limestone (despite thepresence of sediment–infilled voids ‘below rockhead’). Goodman (1993) comments that ‘The unevennessof the top-of rock surface (or rock head in British usage) on karstic limestone presents obstacles for thedesigner.’ He notes the many potential difficulties for design and construction and notes that ‘Unlikemost other rocks, the existence of a solid-appearing outcrop right at the location of a footing or pier doesnot guarantee that good rock will occur below the outcrop.’ The same is true for other rock types withlarge corestones sitting on the ground surface, underlain by severely weathered rock, as discussed byRuxton & Berry (1957). An example of a landslide that occurred where rockhead was misinterpreted bythe slope designers on the basis of boreholes that terminated 5m in rock, is described in Hencher &McNicholl (1995).
3.2 Relevance of geology to engineering
Attempting to form a ground model of a site based solely on descrip-tions from boreholes and test results, without recourse to an informedgeological interpretation of the data, would be like trying to puttogether a complex jigsaw without having the picture on the box lid.Geologists are trained to examine rocks and soils at scales of a handspecimen or a quarry and to draw conclusions on the likely origins and
40 Practical Engineering Geology

history of the sample or exposure. Then, by examining other samplesand exposures in and around a site, they can start to develop a pictureof how the various different components relate to one another.The conceptual model for the geology at a site can be used to extra-polate and interpolate observations to make further predictions on thebasis of geological knowledge. Ground investigation can then bedesigned and used to target residual unknowns.
Figure 3.4 Basicprocess of creatinga ground model fora site.
Figure 3.3Pre-existing fault(tight and planar)allowingaccommodatedmovement as acounter scarp, PosSelim landslide,Malaysia.
Geology and ground models 41
Ground InvestigationEnvironmental Factorsand Site Hazards
Ground Model for Design andConstruction with Geotechnical
Parameters
Preliminary Geological Model from SiteReconnaissance and Desk Study

3.3 Geological reference models
3.3.1 A holistic approach
Fookes et al. (2000) encourage a ‘total geological approach’ wherebyany site is assessed with regard to its full geological history. Thathistory includes original formation of the soils or rock underlying thesite, tectonic events, weathering, erosion, deposition of any overlyingsuperficial deposits, geomorphological development and anthropo-genic influences. The changes that have taken place at the Earth’ssurface to form the landscape and the extensive time involved arealmost inconceivable but must be considered when interpreting thegeology at any site.Total geological analysis should allow the distribution and nature of
the various strata at the site and other features, such as hydrogeologi-cal conditions, to be explained. The assessment should be based on theextensive literature on geological and geomorphological processes,which comprises the toolbox for interpreting the conditions that areencountered at any site. Useful sources of information on geologyfocused on civil engineering application are Blyth & de Freitas(1984) and Goodman (1993) but often, to understand what is happen-ing at a site, one has to refer to more fundamental geological literature.This chapter introduces aspects of geology that are relevant to engi-neering design and performance. It commences by considering thethree basic rock types – igneous, sedimentary and metamorphic –
focusing on their typical characteristics and associations that may beof particular importance to engineering. The next section introducesrock structures, particularly the origins and characteristics of disconti-nuities that tend to control rock mass properties. Towards the end ofthe chapter, guidance is given on developing ground models for a site.
3.3.2 The need for simplification and classification
As discussed in Chapter 4, simplified approaches are generally adoptedfor the description and classification of soils and rocks for engineeringpurposes, largely because geological detail is often irrelevant. This espe-cially applies to logging soil and rock encountered in boreholes.Nevertheless, the engineering geologist needs to be alert to situationsand cases where geological detail might be important to explainthe geological situation or because particular characteristics have somespecial significance. In the author’s experience, whilst many sites aredescribed and characterised quite adequately using shorthand terms andclassifications, occasionally one meets situations where to understandwhat is happening, to an adequate level for an engineering project,intensive study is necessary into geological minutiae, including chemicalanalysis, thin section examination and even radiometric dating.
42 Practical Engineering Geology

3.3.3 Igneous rocks and their associations
Igneous rocks were once molten. As magma cools, minerals growwith an interlocking texture. As a result, most igneous rocks arestrong and sometimes extremely strong in their fresh state – severaltimes the strength of concrete. They are primarily split into intrusiverocks that solidify below the Earth’s surface and extrusive rocks thatform on the Earth’s surface. They are then differentiated according tochemistry. Rocks with high silica content, either directly as quartz(SiO2) or tied up in the structure of other silicate minerals, are termedacidic. Basic rocks have low silica content and ultrabasic rocks evenlower. A simplified classification of igneous rocks is presented inTable 3.1.Intrusive rocks, solidified at depth, include extensive igneous
bodies now exposed at the Earth’s surface, such as granite thatmakes up Dartmoor in the UK. This rock solidified very slowly
Table 3.1 Classification of igneous rocks.
IGNEOUS ROCKS: generally have massive structure and crystalline texture. Typically high strength in freshstate.
Volcanic rocks deposited as sediments are dealt with in Table 3.2: Sedimentary rocks. More details are givenin Streckeisen (1974, 1980) and Thorpe & Brown (1985).
Grain size
ACIDMuch quartz
INTERMEDIATELittle quartz
BASIC1
Little or no quartz
Pale colour Dark
Relatively light in weight Heavy
Coarse>2mm
GRANITE2
GRANODIORITEDIORITE
SYENITEGABBRO
Medium0.06–2mm
MICRO-GRANITE3
MICRO-GRANODIORITEMICRO-DIORITE
MICRO-SYENITEDOLERITE4
Fine<0.06 mm
RHYOLITE5
DACITEANDESITE
TRACHYTEBASALT
Glassy OBSIDIAN VOLCANIC GLASS
1Rocks with even less silica and higher content of Fe and Mg are termed ultrabasic. Identify using standardgeological terminology. Examples are peridotite, pyroxenite and norite, and these can have distinctiveengineering characteristics (e.g. Dobie, 1987).
2 Rock types are often grouped together for engineering purposes, e.g. all coarse rock with free quartz is calledgranite. This can be an oversimplification as distinctions can be significant. Engineering geologists should usefull geological classifications, where possible.
3Micro-granite is sometimes termed fine-grained granite (see GeoGuide 3: GEO, 1988).4Diabase in US practice.5Where porphyritic, then often called quartz porphyry or feldspar porphyry, etc.
Geology and ground models 43

from temperatures in excess of 1,000 degrees Centigrade at depthsof several kilometres in the Earth’s crust and the slowness of thecooling allowed large mineral grains to grow very gradually. Sinceformation they have been uplifted and the overlying rocks erodedaway, with huge consequential changes in stress and temperatureconditions.Granitic rocks are light-coloured and relatively light in weight
(unit weight 27 kN/m3, which is 2.7 times that of water). In termsof mineralogy, granite has a high proportion of quartz and feldspar.Quartz (SiO2) is hard, has no cleavage weaknesses and is much moreresistant to chemical weathering than feldspar. Feldspar (orthoclaseand plagioclase) is a much more complex silicate mineral withcations of potassium, aluminium, sodium and calcium and relativelyweak cleavage directions that make it prone to chemical attack.The feldspars therefore break down, primarily to form clays,which are a series of minerals of essentially the same chemicalmakeup as the feldspars but which are more stable at the Earth’ssurface temperature and chemistry. Minor minerals in many igneousrocks include biotite, hornblende and magnetite, which contain iron,which is released and then oxidised on decomposition, hence givingthe rust-red of weathered rock profiles in many sub-tropical andtropical parts of the world. Iron oxide and carbonate productsplay an important role in cementing recently deposited sediments,as discussed later. Granitic rocks are found in continental regionsand probably largely represent melted and reconstituted crust asplates are subducted beneath mountain chains or in extensionzones (Davis & Reynolds, 1996).Oceanic regions are made up of basic igneous rocks – mainly
basalt – which is the fine-grained chemical equivalent of gabbro.Basalt erupts along extensional plate boundaries such as that runningdown the centre of the Atlantic Ocean as the European and Africanplates move away from the American plates at a rate of about 20mmeach year. Basic igneous rocks are darker-coloured and heavier thangranite, largely because they are rich in iron and magnesium. Gabbrohas a unit weight of about 30 kN/m3. Basic rocks are sometimesextruded in continental regions where faults allow basaltic magma torise as molten rock from great depth to the Earth’s surface. Basaltrock that originated as lava fields makes up the Giant’s Causeway inIreland and much of the other Tertiary volcanics of northern Britain.The basaltic Deccan Traps in India cover an area of more than50,000 km2.Lavas such as basalt are finer-grained than granite or gabbro
because they cool relatively quickly; where cooled extremelyquickly, say by extruding into water, they may form naturalvolcanic glass. Basaltic lava has relatively low viscosity and flowsa long way, unlike the more viscous pale-coloured acidic lavas
44 Practical Engineering Geology

such as rhyolite (the fine-grained equivalent of granite). Acidicvolcanoes erupt in a much more violent way than basaltic volca-noes. Other rocks associated with volcanoes are formed fromthe huge amounts of dust and other airborne debris in volcaniceruptions. Volcaniclastic sediments (Table 3.2) are called tuffsand often exhibit many sedimentary features, especially wheredeposited in water. Hot clouds of debris deposited on landbecome welded tuffs or ignimbrites. A welded tuff with pumiceinclusions (fiamme) that were hot and plastic when deposited andthen flattened by the weight of overlying material, is illustrated inFigure 3.5.Dykes are intruded in extensional (tensile) regions and cut across
other geological structures (Figure 3.6); sills follow existing geologicalstructures such as bedding and are more concordant. Dykes can bequite local or very extensive. The Great Dyke in Zimbabwe can betraced across country for more than 450 km. Tertiary dyke swarmsand associated intrusion complexes in Scotland, Ireland and northernEngland are shown in Figure 3.7.
Table 3.2 Simplified classification of sediments and sedimentary rock (see Tucker, 1982 for moredetail).
mm CLASTICSOIL 1,2
CLASTIC ROCK VOLCANICLASTIC orPYROCLASTIC ROCK
CHEMICAL &BIOCHEMICALROCK
>200
60
2
0.06
<0.002
BOULDERS
CONGLOMERATE(rounded clasts)
BRECCIA (angular)
PYROCLASTICBRECCIA or
AGGLOMERATE
LIMESTONE(examples):
Chalk
Calcarenite (sand and
gravel size)
Calcilutite (mud size
matrix)
Oolite
DOLOMITE
(Mg rich)
EVAPORITE (salts)
COAL
FLINT & CHERT
(Cryptocrystalline
silica)
COBBLES
GRAVEL LAPILLI TUFF
SAND SANDSTONEGreywacke (generally
poorly sorted)Arkose (feldspathic
sandstone)
COARSE ASH
TUFF
SILT SILTSTONEMUDSTONEas general
termSHALE iffissile
FINE ASH TUFF
CLAY CLAYSTONE
1Clastic means derived from fragments of other rocks. The term detrital is sometimes used, essentiallysynonymously. Some clay is neither of these, but newly formed, sometimes from solution.
2Classification and description of soil, including mixed soils, is dealt with in Chapter 4 and Appendix C.
Geology and ground models 45

Some of the characteristics of an area intruded by igneous rocks areillustrated schematically in Figure 3.8. Hot igneous rocks affect thecountry rock that they intrude, giving rise to thermal metamorph-ism, as discussed in Section 3.3.5. Some metamorphosed zones maybe much weaker than the associated igneous body, with obviouspotential consequences if encountered in an engineering project.Figure 3.9 shows a zone of weak, hydrothermally altered rockencountered at a depth of about 200m in a tunnel, well belowthe level of anticipated weathering and therefore rather unexpected.It resulted in a minor collapse that delayed tunnelling. The extentof the zone was investigated with horizontal drillholes. Followingforward probing, ground treatment and support, tunnelling wasable to proceed.
3.3.4 Sediments and associations – soils and rocks
3.3.4.1 General nature and classification
Sediments and sedimentary rocks are derived from the breakdown ofolder rocks. Detritus is transported by gravity, water, wind and
Figure 3.5 Weldedtuff with flattenedfiamme that wereplastic whendeposited sub-aerially, Ap LiChau, Hong Kong.
46 Practical Engineering Geology

glaciers, before it is deposited and gradually buried and transformedinto rock by diagenetic or lithification processes, as introduced inChapter 1 and discussed further in Chapter 5. Some weathering pro-ducts are carried in solution to be deposited directly on the Earth’ssurface, transformed into animal shells or carried by fluids to bedeposited as cements in the sediment pile as it is self-compacted.During transport, detritus is sorted by size and density, largely inresponse to the velocity of water flow or wind. Sediment depositedclose to its erosion source may have a wide range of grain sizes, asillustrated in Figure 3.10; sediments transported by water or wind tendto be winnowed to a limited range of grain sizes and are then termedwell-sorted (Figure 3.11); the same material would be called poorly-graded by an earthworks engineer – he looks for soils in embankmentsto have a wide range of sizes so that a dense degree of compaction canbe achieved. Grains are also abraded and rounded as they are blown bythe wind especially and this is an important engineering characteristic.Angular sand has an internal friction angle that may be 10 degreeshigher than rounded sand.
Figure 3.6 Basaltdyke cuttinggranite, HongKong.
Geology and ground models 47

Figure 3.7 Simplified map showing Tertiary dyke swarms and igneous intrusion complexesacross northern Britain. Lava flows, from the volcanoes above the igneous complexes that arenow exposed (e.g. Figure 3.26) included the extensive flood basalt sheets of which the Giant’sCauseway and the Isle of Staffa are part (see Figures 3.36 to 3.38). Data are from Holmes(1965) and Richey (1948).
Figure 3.8 Schematic representation of igneous rock associations.
SCOTLAND
ENGLANDIntrusive complexes
Dykes & dyke swarms
Ardnamurchan
Mull
SkyeRum
Staffa
Giant’s CausewayArran
Mourne
Carlingford
IRELAND
Slieve Gullion
remnant boulders and tors
later dyke cutting graniteand country rock
metamorphic aureole due toheat from granite
weathered zone withcorestones
granite batholith
limestone changed tomarble due tocontactmetamorphism
hydrothermal alteration ofgranite from late stage fluidsalong fault
ore body from minerals concentrated inlate stage cooling fluids from granite,travelled along fault and replacinglimestone
joint frequency decreasingwith depth

Figure 3.9Hydrothermal zone(darker, lower partof tunnel face),Black HillsTunnels, HongKong.
Figure 3.10 Poorlysorted cobbles andboulders, depositedclose to source withlittle transport,Cachopo Road,Portugal.
Figure 3.11Uniform, well-sorted cobbles andgravel, CanterburyPlain, NewZealand.

Sediments and detrital/clastic sedimentary rocks are classified pri-marily on dominant grain size, as in Table 3.2. In terms of soilmechanics and geotechnical behaviour, granular soils are generallydistinguished from clays in that they are non-cohesive and are com-paratively inert chemically, although some authors would dispute theterm cohesive being applied to clay, as discussed in Chapter 5.Granular soils include everything down to silt size and even someclay-sized soil where this is derived from mechanical breakdown(rock flour is clay-size material, generally quartz, produced by glacialabrasion). Gravel and larger grain sizes are usually made up of rock(lithic) fragments rather than mineral grains. In continental regionswhere granitic rocks dominate, sand and silt are often made up pre-dominantly from quartz, the most resistant mineral from granite. Inareas where chemical decomposition is inactive, feldspar might alsosurvive (arkosic).Many clays are distinct from granular soils, not only because of
their grain size and shear behaviour, but because they comprise anew series of minerals with their own structure and chemistry;they are derived from other rocks but not only as detrital mineralgrains but as precipitants from solution (Eberl, 1984). Other claysare primary, associated with igneous or hydrothermal activity orare formed by transformation of other minerals. Clays comprisethree groups: phyllosilicates, weakly crystalline aluminosilicatesand hydrous oxides of iron, aluminium and manganese. Selby(1993) provides a very useful review of clay mineralogy, as wellas their engineering properties.The most common clay minerals are the phyllosilicates, which, like
mica, comprise sheets or layers of silica and sheets of alumina. Thevarious clay mineral species owe their differences to the ways thatsheets are arranged; substitutions of other cations are made into thestructure, which produces distortion of the crystal lattice and thebonding between sheets. The type of clay that will be formed at anylocation depends primarily upon the source rock and climatic effects.Kaolinite and illite are relatively inactive clays and commonly pro-duced by the weathering of granitic rocks. Montmorillonite (majormember of the smectite class) is much more active and absorbs waterreadily, thereby swelling dramatically. When it dries it shrinks, andthese characteristics have important consequences for engineering.Smectites also tend to have low shear strengths when wet(Chapter 5). They are commonly the result of weathering in basalt intropical areas and form difficult but productive soils inmany countries,including Australia, Africa, India and the USA. Soil types includevertisols and black cotton soils.Aluminosilicate clays such as allophone develop from volcanic
ash with silica content below a critical level and are importantsoils in New Zealand, Japan and Indonesia (Selby, 1993). Like
50 Practical Engineering Geology

montmorillonite, they are very responsive to changes in watercontent, prone to flow and liquefy when wet and to shrink andcrack when dry.Atterberg limits are measured routinely in laboratories to define the
nature of soils and to interpret the likely clay mineralogy by indextesting. If water is added to a clay or clay-silt mix, one can get it toflow like a liquid. The moisture content at which it changes from aplastic state to a liquid state is known as the liquid limit (LL) and canbe determined using standard tests where a groove cut in the surfacecloses as the sample is tapped in a standard way or a cone is droppedonto the sample and penetration measured. If the sample is thendried out, the sample gets stronger and the water content at which asausage of 3mm diameter can be rolled without breaking is calledthe plastic limit (PL). The difference in moisture content betweenthe liquid state (LL) and plastic semi-solid condition (PL) is theplasticity index (PI). The PI is found to be a good indicator of thetype of material, species of clay and, hence, engineering behaviour(Figures 3.12a and b).Clay particles are carried by rivers to estuaries where a change in
salinity causes clay platelets to flocculate. Because of their shape and
Figure 3.12 (a)Chart of plasticityindex vs. liquidlimit used foridentifying thenature of fine-grained soil usingsimple, standardtests (Atterberglimits). (b) Use ofplasticity index toindicate claymineral in soilsample (afterSkempton, 1953). (b)
(a)
Pla
stic
ity in
dex
(%)
0
20
40
20 35 50
Non
pla
stic
Low Medium High
‘A-line’
CLAY
SILT
ORGANIC SOILS
Plasticity
Liquid limit (%)
100
80
60
40
20
0 20 40 60 80 100
Percentage of clay
Calciu
m m
ontm
orillo
nite
Illite
KaolinitePla
stic
ity in
dex
(%)
Geology and ground models 51

the distribution of excess electrical charges, they tend to link end-to-face and form open structures with very low density and high watercontent. This open structure is broken down, partly by bioturbationbut also by the weight of overlying sediment. The clays develop alaminar structure and water is squeezed out. Eventually, once theclay is buried by about 2 km, theoretically there may be dry contactbetween clay crystals with the development of strong, covalent bonds(shared ions) (Osipov, 1975). There would also be transformation ofclay, say from smectite to illite. During burial and self-weight compac-tion and consolidation, water may be expelled dramatically, with theformation of mud volcanoes on the sea floor. Mud volcanoes alsooccur on land, with the mud apparently sourced by erosion of mud-stones at great depth, although the mechanism is uncertain. The LUSImud volcano in East Java has had eruption rates of up to 180,000m3
per day, continuing over several years (Davies et al., 2011).
3.3.4.2 Sedimentary environments
The sketch in Figure 3.13 illustrates a number of sedimentary environ-ments. The source rock, nature of weathering and erosion and especiallythe method by which the sediment is transported and finally depositedresult in thewide range of sediments and sedimentary rocks encountered.
3.3.4.2.1 ONSHORE
Sediments deposited on land generally include colluvium (landslidedeposits and slope wash) and glacial deposits, which are often poorly
Figure 3.13 Examples of sedimentary environments.
52 Practical Engineering Geology
glacial moraine
desert sandsalluvial sands and gravel
sea
welded tuff
offshore sand and muds,fossiliferous, sometimescalcareous
salt cemented,sabkha
beachdepositsat coast
salt deposits ininland lake (hotclimates)
deep ocean muds
submarine landslide/turbiditycurrent − massive greywackes
deltaic sands in subsidingbasin
poorly sorted wadi deposits inephemeral stream
rock falldeposits

sorted. Alluvium is deposited in rivers and if transported for anydistance will become sorted and coarse clasts will be rounded. Otherimportant soils on land include organic soils such as peat, whichbecomes coal when lithified.Desert sands are distinguishable from river-transported sediments by
their rounded, almost single-sized grains, which may become cemented,especially by iron oxides, giving typical red beds such as the Permiansandstone in the UK (Figures 3.14 and 3.15). They also lack mica, whichis either abraded todust or blownaway. Finerwind-transported silt formsthick deposits called loess. Where cemented, loess has been exploited toconstruct settlements, especially in China. This can be risky as loess isprone to collapsewhenwetted or disturbed by earthquakes, and there arenumerous instances of loss of life as a result (Derbyshire, 2001).Glaciers have covered much of northern Europe, Canada and the
northern USA several times in the last three million years. In Britain,everywhere north of a line from London to the Bristol Channel wascovered in ice sheets. The rest would have been areas of permafrost
Figure 3.14Triassic dune-bedded aeoliansandstone(Buntsandstein),Ermita de Mare deDéu de la Roca,near Mointroig,Spain.
Figure 3.15Uniform Mioceneweak sandstonewith roundedgrains, weaklycemented with ironoxide cementproviding somecohesion, Algarve,Portugal.
Geology and ground models 53

(periglacial conditions).Manhas inhabited Britain on andoff for at least700,000 years but has had to abandon the country because of advancesin ice several times, most recently about 13,000 years ago. Only for thelast 11,500 years has Britain been occupied continuously (Stringer,2006). As a consequence, much of northern Britain shows signs ofglacial erosion and also materials deposited in association with theglaciers. Much of this is poorly sorted boulder clay or till but there arealso great thicknesses of sorted and layered outwash sediments laiddown on land or in lakes as the glaciers retreated. These materials canbe very variable vertically and laterally (Fookes, 1997), so great care isneeded in interpreting ground investigations. This is illustrated by onecase history (piling for Drax Power Station) presented in Chapter 7.Associated with these periods of glaciations, the sea level across theworld has fluctuated widely. About 20,000 years ago the sea level wasalmost 150m lower than it is today (Pirazzoli, 1996). As a consequence,ancient river channels that ran across the land surface have been sub-merged to become infilled with marine sediments, which can provehazardous for engineering projects such as tunnelling or foundationsfor bridges across estuaries. For example, during design of the recentlyconstructed 3.24 km immersed tube tunnel as part of the Busan–Geojefixed link crossing in South Korea, a depression was found in the seafloor, unexpectedly underlain by thick marine sediments, and thisrequired extensive engineering works to support the tunnel, involvingthe use of soil-cement mixed piles. Buried channels are also found onland, often with no obvious surface expression. Krynine & Judd (1957)report several case examples, including a dam at Sitka, Alaska, whereriver fill was fortuitously found by drilling, extending more than 25mbelow the dam foundations. If it had beenmissed then there would havebeen considerable water leakage beneath the dam, requiring remedialworks. In Switzerland, during the construction of the Lötschberg railtunnel, 25 miners were killed by inrush of glacial sediments when theyblasted out of rock unexpectedly into an over-deepened glaciallyscoured valley about 180m below the valley floor (Waltham, 2008). Acase from Hong Kong is presented in Fletcher et al. (2000) and sum-marised in Chapter 7, where the planned construction of a tower blockhad to be abandoned because of the potentially huge cost of deep boredpiles. A large cavernous xenolith of marble had been found unexpect-edly within granite beneath the site; the caves were partially infilled withsoft sediments to depths of 150m. The formation of the cave andsediment infill certainly occurred when sea levels were much lower.Other poorly sorted, mixed soils include landslide colluvium. One
such deposit is called the Fort Canning Boulder Bed, which underliesmuch of the Central Business District in Singapore and has causednumerous difficulties for construction, not least because it has some-times been misinterpreted during ground investigation as weatheredrock, as discussed in Box 3-2.
54 Practical Engineering Geology

Box 3-2 The Fort Canning Boulder Bed, Singapore
The Fort Canning Boulder Bed (FCBB) underlies much of the Central Business District of Singaporeand is an example of a complex mixed rock and soil deposit, the geological nature and interpretationof which has had, and continues to have, great consequences for civil engineering construction. Whenthe Fullerton Building was constructed in the 1920s, it was found that ‘the foundations whichconsisted of clay and boulders, were of a dangerous character, and this great structure had to beplaced on a concrete cellular raft, which is so designed as to give each superficial foot of soil notmore than one ton to carry’ (Straits Times, 27 June 1928). Since then, in several reported cases,engineers have struggled with construction on and through this material. Ground conditions havesometimes been misinterpreted following inadequate ground investigation. In 1952, the originalground investigation for the Asia Insurance Building incorrectly interpreted the site as underlain byin situ rock rather than FCBB. The mistake was only discovered during construction and necessitatedtotal redesign of the foundations (Nowson, 1954). Shirlaw et al. (2003) provide several otherexamples.
The FCBB is almost 100m thick in places, is not exposed at the ground surface, but is commonlyencountered in foundation construction and tunnels (Shirlaw et al., 2003). The deposit typicallycomprises a poorly sorted mixture of clay, silt and sand, with boulder content between 5% and35% (Singapore Standards, 2003). The mostly angular boulder content is probably derived fromthe adjacent Jurong Formation of Triassic/Jurassic age, with strong sandstone predominating.Figure B3-2.1 shows boulders recovered and partially drilled in large diameter bored piles fromone site near Mount Sophia. In between the boulders, the matrix sometimes comprises hard redclay with undrained shear strength up to 2 MPa (weak rock) but sometimes sandier and silty andof much lower strength. Broms & Lai (1995) also report encountering a highly permeable gravellayer within the FCBB at depth.
Shirlaw et al. (2003) suggest that the FCBB is a colluvial deposit originating from FortCanning Hill (Figure B3-2.2) but the low height of the hill relative to the thickness of thedeposit makes this somewhat doubtful and the red clay is often much stronger than wouldbe expected, even for clay that has undergone quite deep burial. Furthermore, the clay is clearly
Figure B3-2.1 Angular boulders up to about 3m diameter, plus cores extracted during rock coring forlarge diameter piles, from a site close to Mount Sophia, Singapore.
Geology and ground models 55

not a weathered product of the sandstone and, anyway, the contained boulders in the FCBBgenerally show little weathering. The red clay sometimes appears as an infill to apparent relicjoint structure in sandstone blocks (Figure B3-2.3).
Figure B3-2.3 Section of core (about 60mm diameter) showing slightly stained sandstone with apparentsoil infill.
Figure B3-2.2 View towards Fort Canning Hill from the Central Business District, and a few locationswhere FCBB have been encountered (according to Shirlaw et al., 2003).
56 Practical Engineering Geology
Pencil for scale
Hard clay and rock fragmentswith faint fabric roughlyparallel to staineddiscontinuity
Stained sandstone alongdiscontinuity (possibly orthogonalto bedding). Evidently open toelements for longer time thandiscontinuity below.
Hard red clay and rock fragment infill–probably due to opening rather thantransport of the whole mass as in alandslide
Strong, medium grainedsandstone (probablyJurong). Note lack ofweathering along angulardiscontinuity (possiblybedding-parallel).

Broms & Lai (1995) present two sketches of caisson excavations for the Republic Plaza, one of whichappears to have a vertical fabric. If this was a transported colluvial deposit, boulders would be expected tobe essentially random or preferentially flat lying. The same sketch shows vertical zones containing fewboulders, with a form similar to gulls found in areas of cambering (Parks, 1991).
An alternative model for the origin of the FCBB, therefore, is rock cliff deterioration, regressionand local collapse as sea levels rose from -150m at the end of the Holocene glacial periods. The redclay is probably partly washed-in infill to the open fractures within the deteriorating rock mass, ina terrestrial environment, as illustrated schematically in Figure B3-2.4. If the model is correct, thecollapsed colluvial facies of the FCBB would grade laterally into essentially in situ deterioratedJurong Formation rocks.
Whatever the truth regarding origin, the FCBB is a most difficult founding stratum and one thatmight be called unforgiving in the context proposed in Chapter 4, but situated in an area of one ofthe most valuable real estates in the world. Clearly, if dealing with a site which comprised weatheredbut essentially undisturbed Jurong, one might use rather higher design parameters than for acolluvial soil that might contain weaker horizons. Similarly, tunnelling through the weatheredJurong, the potential hazards might be different from tunnelling through a colluvial and possiblyinterbedded section of the FCBB with weaker horizons that could flow or ravel. The literature hasmany examples of problems that arise through getting the ground model wrong and as Shirlaw et al.(2003) note, identification of the FCBB can be difficult if adopting a routine approach to groundinvestigation.
3.3.4.2.2 OFFSHORE
Sediments are deposited offshore in tectonically controlled, continuallysubsiding basins and can be thousands of metres thick (Leeder, 1999).Skempton (1970) compiled data on rates of deposition for argillaceous
Figure B3-2.4 Schematic geological model that can explain the features of the Fort CanningBoulder Bed. The hard red clay is probably infill, washed in to open joints and fissures in deterioratingrock cliffs, and probably derived from weathered mudstone units in the Jurong. The clay becamehardened and cemented in a terrestrial environment in the same way as terra rossa in weatheredlimestone environments. The colluvial facies of the FCBB was probably deposited as rock and soilavalanches, at the coast. It remains unsorted, although may be intercalated with alluvial or beachdeposits. The FCBB was later buried locally by Kallang marine clay and fluvial horizons and byreclamation.
Geology and ground models 57
distrubed but essentially in situJourong Formation with washed-inred clay infill (probably terrestrial)
Current Sea Level
JurongFormation
Kallang Formation (mostlymarine clays)
Zone of Jurong rock avalanchedeposits (sea cliff collapse?) with
variable matrix and possibleinterbedded sediments

sediments (clay rich) and reported these as ranging from 0.03m/1,000years for deep sea conditions, about 1–2.5m/1,000 years for estuariesand shallowmarine conditions and up to 120m/1,000 years for deltaicsituations. Sand deposited close to the shoreline tends to be quite wellsorted, bedded and often fossiliferous (Figure 3.16). Offshore, belowthe continental shelf, thick, often relatively poorly sorted sandstonesare sometimes deposited very rapidly from dense turbidity currentsarising from submarine landslides. Rocks formed in this way (oncelithified) include greywacke. They are often bedded and cyclic withpredominantly finer-grained horizons followed by predominantlycoarser beds (Figure 3.17). Submarine landslides are a major hazardto offshore engineering works, including pipelines, cables and oil rigs,and are often triggered by earthquakes, although they may simplyoccur as the sediment accumulation on the continental shelf reachesa critically unstable geometry.
Figure 3.16Bedded Miocenesandstone, Capelada Sra da Rocha,Nr Porches,Algarve, Portugal.
Figure 3.17Carboniferousschistose turbidites,Cachopo Road,Portugal.
58 Practical Engineering Geology

Other sediments are deposited as a result of chemical processes.Many limestones, including chalk, are essentially biochemical, invol-ving microplankton and algae in their formation. Other types includebioclastic and reef limestone. Limestone can be fine-grained rock,uniform and extremely strong, as per the Carboniferous Great ScarLimestone of northern England. Other limestones such as oolite canbe weak and porous. Limestone is readily dissolved by acidic water,leading to karstic conditions (irregular rockhead and cavernous con-ditions) with obvious implications for site formation and design.Rocks susceptible to dissolution, including limestone, dolomite andsalts (discussed below), can constitute natural hazards due to suddencollapse of sinkholes and general subsidence. Relatively minor geo-logical differences can give rise to very different engineering proper-ties. Within the chalk of southern Britain there is a gradationalchange from the characteristic White Chalk, which is relativelystrong and brittle, down into grey, clay-rich rocks. The latter,Chalk Marl, intermediate between the overlying fractured, brittleWhite Chalk and underlying Gault Clay, was recognised as theideal tunnelling medium for constructing the Channel Tunnel(Varley & Warren, 1996). The presence of hard flint and chertbands in chalk can give rise to considerable difficulties duringconstruction, because of abrasion and wear on cutting tools, asillustrated by a case example in Chapter 7.Limestone can become dolomitised, which involves partial replace-
ment of calcium carbonate by magnesium carbonate and leads togreater porosity. Dolomitisation often occurs in the presence of eva-porates (salt deposits) and dissolution of underlying salts such asgypsum can lead to the development of sinkholes and brecciation ofthe overlying rock, followed by re-cementation. This process isdescribed for the Magnesian Limestone in the UK by Dearman &Coffey (1981). Similarly, the Miocene limestone and dolomitesequences in Qatar and Saudi Arabia are complex and extremelyvariable due to their post-formation dolomitisation, collapse andre-cementation (Sadiq & Nasir, 2002). The rock is sometimes strong,elsewhere very weak, and can be cavernous. This is important forfounding engineering structures and for other activities, includingdredging (Vervoort & De Wit, 1997). Limestone is an importantrock economically, particularly as a source of cement aggregate and,where massive and strong, is commonly used as armourstone forbreakwaters.Deposits of salt are formed by evaporation of lakes and even seas
(the Mediterranean completely dried up about five million yearsago), and are also very important economically as source rocks forchemical industries such as fertilisers. They are significant for the oiland gas industry because they have low density and low permeabil-ity and gradually rise through the overlying denser country rock as
Geology and ground models 59

diapiric structures. Traps for oil and gas at the boundaries of thesediapiric structures are searched for using geophysical methods andthen targeted by drilling. Salt deposits are also considered to havegreat potential as nuclear waste repositories because of their lowpermeability, although there are also reservations because of poten-tial dissolution, mobility and influence of heat (e.g. Krauskopf,1988). Salt also provides a cementing medium for sediments insome environments (sabkha) and can be very important for foundingstructures, as in the Gatch underlying Kuwait (Al-Sanad et al.,1990).Engineering properties of sediments and sedimentary rocks and their
investigation are addressed in Chapters 4 and 5.
3.3.5 Metamorphic rocks and their associations
Metamorphic rocks are rocks that have been changed by heat, pres-sure or both. By definition, they do not include low-temperature andlow-pressure diagenetic processes affecting soils, as discussed inChapter 5.A general classification of metamorphic rocks is presented in
Table 3.3. Contact metamorphism occurs at the host boundaries ofigneous bodies, as illustrated in Figure 3.8. The metamorphic aureolesurrounding amajor granite or gabbro pluton can extend for hundredsof metres. The greatest effect is on sedimentary rocks; recrystallised,generally very strong rock found close to large plutonic igneous rockbodies is called hornfels. At greater distances the effect of the intrusionis less – often the only indication of change being the growth of newminerals such as kyanite or cordierite in the otherwise largely unaltered
Table 3.3 Simplified classification of metamorphic rocks. Refer to Fry (1984) for more detail.
FOLIATED NON-FOLIATED
Coarse to medium
GNEISSOften widely spaced and irregular foliation
MIGMATITEMixed schist and gneiss
SCHISTStrong foliation
MARBLEDerived from limestone/dolomite
QUARTZITERecrystallised sandstone
HORNFELSGenerally recrystallised contact rock
SERPENTINITEMetamorphosed peridotite/norite
Fine<0.06mm
PHYLLITEUndulose foliation. Often micaceous, shiny
SLATEPlanar cleavage
MYLONITEFault gouge
60 Practical Engineering Geology

country rock. A good field example is the SkiddawGranite in the LakeDistrict, UK, where the crystalline hornfels zone extends more than 3 kmfrom the exposed granite outcrop (the granite shallowly underlies theground surface). The limit of metamorphism can be traced up to about5 km away from the exposed granite; the metamorphic aureole, mea-sured at right angles to the granite, is about 1 km thick (Institute ofGeological Sciences, 1971).Marble forms from the metamorphism of limestone through heat
and pressure, often during mountain-building processes. Metamorph-ism of sandstone can form quartzite, in which the sand grains arewelded together. This rock is often extremely strong and abrasive todrills and tunnel boring machines.Minor intrusive rocks such as dykes and sills, though very hot when
emplaced, often cause little metamorphism, because of their relativelysmall volumes, as illustrated in Figure 3.18 for a basalt dyke cuttinglimestone.Regional pressure during mountain building can impose a marked
cleavage or schistosity perpendicular to the maximum compre-ssive stress. Rock types formed in this way range from relatively
Figure 3.18Tertiary dykethrough Jurassiclimestone, Island ofMuck, Scotland.
Geology and ground models 61

low-temperature slate, through phyllite, to high-temperature schist. Inall cases, the rocks are recrystallised and the new fabric and structuredominates their mechanical properties, although original bedding maybe evident. Phyllite is intermediate between slate and schist and gen-erally has shiny, low-friction foliation because of the presence ofminerals such as mica and chlorite. In schist, the original beddingmay still be broadly recognised by chemical layering throughout therock mass – some zones could be richer in silica (originally sandstone),others might be graphitic (the original rock perhaps having beenorganic mudstone with coal). Sometimes there have been severalphases of metamorphism with several different cleavage or schistosityfoliations imposed on the same rock mass, leading to blocky rock,which may cause difficulties for underground excavations, as occurredfor the power house at Kariba Dam, Zambia (Blyth & de Freitas,1984).Mineralogical, grain size and shear strength variability along schis-
tose foliation can result in joint styles changing very rapidly fromlayer to layer, as illustrated in Figure 3.19, which causes obviousdifficulties for characterisation of the fracture network. Schist issometimes associated with thin (say 100mm) shear zones of low-frictional strength (15–25 degrees) often running roughly parallel tofoliation and sometimes extending laterally for more than one kilo-metre (Deere, 1971). Not surprisingly, these often cause problems forengineering structures, including tunnels and slopes. Deere givesseveral examples, particularly of tunnels running parallel to thestrike of steeply dipping schistosity. There are various possible ori-gins for these shear zones but many are probably the result ofslippage along foliation during folding – similar in origin to intra-formational shear zones in folded sedimentary rock sequences, asdiscussed below.
Figure 3.19 Jointsystem geometryvarying with eachstratum. About halfway along Sector9A of the ViaAlgarviana – SãoBartolomeu deMessines toBarragem doFuncho, Algarve,Portugal.
62 Practical Engineering Geology

3.4 Geological structures
3.4.1 Introduction
Where plates collide, large compressional stresses are generated, asalong the western coast of North and South America. The con-sequence is uplift of the Rocky and Andes mountains and earth-quakes on active faults such as the San Andreas in California andon the subducting plate beneath Chile and Peru. The rocks aresqueezed and are either deformed plastically (see Figure 3.2),where temperatures and confining pressures are high, or fracturedor both (Figure 3.20). Folding may control the disposition of thevarious rocks at a site and a specific geotechnical hazard involvedwith folding is intra-formational slip. As the rocks are folded,different layers slip relative to one another, possibly resulting inhighly polished planes of low shear strength (Salehy et al., 1977;Kovacevic et al., 2007). Such highly polished intra-formationalshear surfaces are common in the Coal Measures in the UK andhave been responsible for large landslides.For geotechnical engineering, the geological structures that are
of prime importance are called discontinuities. These are funda-mentally important to the mechanical properties of rock and somesoil masses and how they perform in engineering projects.
Figure 3.20Severely folded andthrusted sandstoneof the TableMountain Group,Cogmanskloof,South Africa.
Geology and ground models 63

3.4.2 Types of discontinuity
For geotechnical purposes, a discontinuity may be defined as a bound-ary or break within the soil or rock mass which marks a change inengineering characteristics or which itself results in amarked change inthe mass properties. At a macroscopic scale, the most importantdiscontinuities that engineering geologists need to consider are:
1. Geological interfaces such as bedding, pluton boundaries, dykesand sills, and unconformities
2. Faults3. Joints and other fractures
3.4.3 Geological interfaces
Geological interfaces are the main boundaries mapped by geologistsand therefore fundamental to unravelling the geological history at asite, interpolation between boreholes or field observations and extra-polation to some other location. The boundaries such as unconformi-ties and dyke boundaries often represent a major gap in time,sometimes of many millions of years. There may be sudden contrastsin rock and soil type and in degree of fracturing across the boundary(Figure 3.21). Such contrast is often mapped in the field by lines ofseepage and marked changes in slope. Often, however, rock strataboundaries, especially where unweathered, are of little engineeringconsequence, as illustrated in Figure 3.22.
3.4.4 Faults
Faults are geological fractures on which there has been demonstrableshear displacement. They range from minor breaks, with only a few
Figure 3.21 SignalHill, Cape Town,South Africa. Jointsorthogonal tohorizontal beddingin Table MountainSandstone,unconformablyoverlying CapeGranite.
64 Practical Engineering Geology

mm movements, to breaks in the Earth’s crust extending manykilometres laterally and vertically and with cumulative displacementsover many years, also of many kilometres. Faults can form in com-pressive regions (reverse faults) and in extensional zones (normalfaults). The term ‘normal’ originates from coal mining in the UK,because most fault blocks dropped away, down the dip of the fault,and the miners knew in which direction the productive coal seam waslikely to be found. Faults in the upper 10 km or so of the Earth’s crustbreak in a brittle manner, producing fractured, brecciated rock. Atgreater depth, where the temperature and stress is much higher, faultsoccur more plastically. Typical features of brittle and plastic faultzones, now exposed at the Earth’s surface, are illustratedin Figure 3.23. Fault zones can be very extensive, with metres ofbroken rock and gouge between the walls of the fault (Figure 3.24)but can otherwise be represented by a single surface with very littlegouge (Figure 3.25). One example presented in Chapter 7 (TBM tunnelcollapse) serves as an illustration of how important it is to know thenature of any fault zone. Sometimes the fault movement results in a
Figure 3.22 Fusedboundary, betweenvolcanic rock andgranitic intrusion,Anderson RoadQuarry, HongKong.
Figure 3.23Schematicrepresentation ofductile and brittlefault zones nowexposed at theEarth’s surface(after Fletcher,2004).
Geology and ground models 65
mylonite
granite
fault breccia
fault gouge
s-c fabrics
quartz veins
quartz veins
foldedmetasediments

Figure 3.24 Thickfault zone, about3m across – notediscontinuous palestrata, Pos Selimlandslide,Malaysia.
Figure 3.25 Thinfault zone with claygouge, hammer forscale, Pos Selimlandslide,Malaysia.

highly fractured shear zone, rather than a discrete plane with gouge,and such zones are often highly permeable.Faults are a particular concern in geotechnical engineering in that
they can be associated in sudden and often rather unexpected changesin rock quality. They may act as barriers to flow (termed fault seals inoil reservoirs) or, conversely, they can be highly permeable zones, fullof water, and lead to a sudden inrush of water into tunnels. Faults arealso, of course, the main source of earthquakes. By definition, faultsdisrupt the rock mass and may throw rocks of very different engineer-ing characteristics together. As a result, a tunnel may pass from hardand good rock to extremely poor rock conditions over a very shortdistance and without warning. Such situations can be very difficult todeal with, necessitating a change in excavation methods, supportrequirements and sometimes a complete rethink of a project(e.g. Ping Lin Tunnel – a case study in Chapter 7). For foundations,there may be a sudden change over a few metres from simple padfoundations resting on rock to the need for deep piles to carry the loadof a structure.Not all faults cause problems for projects, so there is a danger of
being over-cautious, leading to over-expensive investigation and unne-cessary allowance in design for potential poor ground. Furthermore,faults shown on geological maps are sometimes conjectural, inferredby the mapping geologist on some topographic feature such as a valleyor other lineament. However, lineaments and river systems can reflectgeological features other than faults and the drainage system may oweits geometry to ancient geological history.
3.4.5 Periglacial shears
Another type of fault that can cause considerable problems because oflow shear strength is that formed close to the Earth’s surface due toperiglacial processes. Such shear surfaces can be formed by a number ofdifferent mechanisms and can be extensive laterally (Spink, 1991).Numerous failures of slopes and embankments have been attributed totheir presence (Early & Skempton, 1972), including Carsington Dam,during construction as described in Chapter 7. Skempton et al. (1991)note that solifluction surfaces are oftendifficult tofind, evenwhenyouarefairly certain that they are there. Patient and detailed logging willbe required, possibly with trial pits left open for several weeks to allowthe shear surfaces to become apparent as the ground dries out and stressrelief occurs.
3.4.6 Joints
Joints are fractures in rock that, by definition, show no discernibledisplacement relating to their time of origin, which distinguishes them
Geology and ground models 67

from faults. All fractures are the consequence of overstressing the rockor soil material. The nature of joints – their orientations, roughnessand persistence – is controlled by the local stress conditions that causedthem to develop, together with the strength of the rock, other condi-tions, including temperature and water pressure, and subsequent his-tory. Many joints occur as sets of fractures, pervasive through largevolumes of rock, and owe their origins to processes such as cooling,burial or orogenic events (e.g. Hancock, 1985; Mandl, 2005). A setcomprises a roughly parallel series of joints. Sets that are apparentlyrelated in terms of origin are called systematic. Joints can also be non-systematic or random. Joints can be regarded as essentially:
– primary – associated with the geological formation of rock– secondary – caused by tectonic and gravitational stress including
the result of uplift and bending or– tertiary – due to local geomorphological or weathering influences.
Many of these begin as proto-joints that developwith time – they beginas general planes of weakness, which only become visible traces and,later, mechanical discontinuities, on uplift and exposure. Rock massesthat have few or no joints (as visible traces or mechanical fractures)include deep-seated, unweathered igneous plutons (Martin, 1994), asillustrated in Figure 3.26. The water-lain sandstone in Figure 3.27 alsohas very few visible joints – presumably the rock was not sufficientlyover-stressed during burial for the formation of hydraulic joints, asdiscussed later. Furthermore, the later uplift that must have occurreddid not involve tension, bending or relaxation to cause differentialstresses sufficient to induce fracturing.Much effort is made to try to characterise joint networks in rock
masses in geotechnical engineering – orientation, spacing, persistenceand aperture, especially. Guidance is given in BS5930 (BSI, 1999),
Figure 3.26Massive layeredgabbro with novisible joints, LochScavaig, Isle ofSkye, Scotland.
68 Practical Engineering Geology

ISRM (1978) and by Priest (1993). The standard guidelines for practi-tioners, however, treat joints largely as statistical entities rather thangeological features, and this is an area where geology has the potentialto offer great insight and time-saving in geotechnical engineering; anopportunity that has been rather disregarded to date. This is partlybecause joint origin is still a difficult, rather poorly understood andhighly debated subject (Pollard & Aydin, 1988).The following discussion refers to the stress conditions that initiate
fracturing, relative to the strength of the soil or rock at the time of jointformation. This is explained, through reference to Mohr’s stress cir-cles, in some detail in Chapter 5 in introducing triaxial testing, and thereader is recommended to go through that section in order to under-stand the following discussion. Mohr’s circles are also well explainedin most soil mechanics textbooks (Craig, 1992), rock mechanics text-books (Hudson & Harrison, 1997) and structural geology textbooks(Davis & Reynolds, 1996), which demonstrates the importance ofthese concepts to different scientific disciplines.Most joints are thought to develop as extensional fractures (in ten-
sion), parallel to a compressive major principle stress, σ1. In a coolingigneous body, the extensional stresses might be due to contraction.Alternatively, the tensile stress σ3 might be tectonic due to pulling apartof plates, as at the Mid-Atlantic Ridge or along the East African RiftValley, or the result of bending and relaxation during uplift or exhu-mation (Price, 1959; Price&Cosgrove, 1990; Rives et al., 1994). It can
Figure 3.27Miocene sandstonewith very fewvisible joint traces,Capela da Sra daRocha, Nr Porches,Algarve, Portugal.
Geology and ground models 69

also be due to excess pore water pressures in thick sediment piles(Engelder & Peacock, 2001). The condition for formation of exten-sional joints is illustrated by the left-most Mohr’s circle in the lowerFigure 3.28, where the minimum principle stress is tensile and equal tothe tensile strength of the soil or rock mass and the maximum principlecompressive stress (assumed vertical) is less than three times the tensilestrength of the intact rock. Under those stress conditions, joints wouldform in the plane of σ1 and σ3 with the dihedral angle, 2θ, equal to 0(Joint E in the upper diagram). At higher levels of differential stress,shear fractures (S in the upper diagram) would form as illustrated bythe right-most Mohr’s circle in Figure 3.28. The stress circle is tangen-tial to the rock failure envelope with a dihedral angle at 60 degrees(assuming a friction angle of 30 degrees). In between these extremes
Maximumprincipal stress
Minimumprincipal stressIntermediate
principal stress
4T
3T
2Textension
She
ar s
tres
s (τ
)
T
hybrid
shear
-2T -T T 2Tcompressivetensile
Normal stress (σ)
3T 4T 5T 6T 7T 8T
2θ
2θ = 0° 2θ = 45°
E
Failure envelope for rock
σ1
σ2
σ3
σ3
σ2
σ1
SS
2θ = 60°
Figure 3.28 Stress conditions expressed as Mohr’s circles for the formation of extensional (tension),hybrid and shear joints. The tangential line to the various circles is the overall failure envelope for therock under different stress conditions (after Hancock, 1985).
70 Practical Engineering Geology

there is a possibility for hybrid fractures to form with dihedral anglesbetween 0 and 60 degrees (sub vertical), and a potential joint spectrum,as illustrated in Figure 3.29. Details are given in Hancock (1985), whonotes that the regular arrangement of structures such as joints withinlarge areas (>1,000 km2) of weakly deformed rocks, gives confidencethat they are indeed linked to tectonic processes, as per theory.Engelder (1999), however, questions the predictive validity of theMohr-Coulomb approach in detail.The concept of fracture formation in a large mass of rock governed
by a Mohr-Coulomb strength law and under uniform stress condi-tions, is helpful in explaining joint formation at a site but generallygeological history and local stress conditions and constraints meansthat the situation is more complex. The soil or rock mass is unlikely tobe uniform and will include intrinsic flaws, pre-existing discontinuities
Figure 3.29 Stress conditions for the formation of hybrid joints and how these would appear on astereographic representation. The centre crosses represent a horizontal set of discontinuities (saybedding in a sediment or flow banding in an igneous rock). The hybrid system plots from thecircumference (vertical, extensional) inwards, up to dips of about 60 degrees to horizontal. Thelower right figure shows how this pattern might appear if the whole rock mass was tilted through αdegrees (after Hancock, 1991).
Geology and ground models 71
Joint spectrum ofhybrid joints
Bedding tilted through αºtowards the southeast
North North
σ3
α
σ2
σ1
σ1
σ3
σ3 (extensional)

and variable hydraulic conductivity (controlling effective stress).Pre-existing bedding, schistosity and faults, will have a controllinginfluence on the way joints develop (e.g. Rawnsley et al., 1992).Where the rock mass has a long and complex geological history,there may be several generations of fracturing, each influenced by theformer condition (see Rawnsley et al., 1990). Deciphering that historyis made more difficult once it is appreciated that all fractures that wenow see as obvious visible mechanical discontinuities at the Earth’ssurface, may have only been incipient or integral proto-joints at thetime of later joint formation and therefore might have had little influ-ence on the formation of the later joints (Hencher & Knipe, 2007).The proto-joint network provides relatively easy directions for
breaking otherwise massive rock, such as the rift and grain directionsin granite quarrying (Fujii et al., 2007) or as preferential directions forbreakage in laboratory testing (Douglas &Voight, 1969). Proto-jointsdevelop as persistent mechanical fractures later, following the pre-imposed geological blueprint (location, orientation and spacing),through weathering processes and/or stress changes. The developmentof each joint is progressive as microfractures merge and extend overgeological time (Hencher, 1987; Selby, 1993; Rogers & Engelder,2004; Hencher, 2006; Hencher & Knipe, 2007). At any particularmoment, a joint may be made up of open sections, sections where atrace is visible but where there is still considerable tensile strength andsections where the rock is apparently intact (rock bridges). Onlymicrofracturesmark the line of the future development of amechanicalfracture. That this is so, is evident from the obvious tensile strength ofmany rock joints, even though they are clearly visible as traces(Figures 3.30 and 3.31).
Figure 3.30 Partlydeveloped jointsthrough granite,north of Seoul,South Korea.
72 Practical Engineering Geology

3.4.7 Differentiation into sets
Joint sets are generally differentiated for rockmechanics analysis accord-ing to their geometries. The basics of stereographic projection represen-tation of rock joints is dealt with in Chapter 4 and explained in detail inWyllie & Mah (2004). If the poles representing discontinuities plotclosely on a stereographic projection, then they are considered to com-prise the same set. For example, when one defines a set in the rock massmodelling programme, UDEC (Chapter 6), this is done by inputting amean dip and dip direction (perhaps plus or minus 5 degrees). Programssuch as Dips from Rocscience (Chapter 6) can be used to identify setsstatistically, according to various methods such as the Fisher distribu-tion. This is a useful tool but a number of things must be borne in mind:
1. The original data might be biased or partial. Some joint sets maynot be fully developed at the point of observation or might bemisrepresented in terms of population, because of the geometryof the exposure.
2. Joints of similar geometry might include different sets geologically(in terms of time of formation) which have characteristics that arequite different despite their parallel orientation.
3. Important but rare geological features, such as a fault, might beovershadowed by the rest of the data and even removed fromconsideration by statistical manipulation, as discussed byHencher (1985).
4. A better approach is first to try to interpret the distribution andnature of joints in terms of a model for the geological history atthe site (Rawnsley et al., 1990; Hencher & Knipe, 2007). Data suchas surface textures and mineral coating can also be very helpfulfor differentiating between joint sets, especially for high-levelinterpretations such as for nuclearwaste studies (e.g. Bridges, 1990).
Figure 3.31Columnar jointsthrough rhyolite,High IslandReservoir, HongKong. Evidently,the traces are notfully developed aspersistentmechanicalfractures, otherwisethe undercutcolumns would notremain in place(gravity being whatit is).
Geology and ground models 73

Some aids for understanding joint origin on the basis of their geome-trical expression, as seen in stereographic projections, are set outbelow. These are often very helpful for interpreting geological history,but as Price & Cosgrove (1990) put it: ‘be warned – many fracturesresist all attempts at interpretation’.
3.4.8 Orthogonal systematic
Many joint sets are orthogonal; two sets occur perpendicular to oneanother and perpendicular to some planar fabric such as bedding,schistosity, or flow banding in an igneous pluton. Examples of suchjoint sets in sandstone and granite are presented in Figures 3.32 and3.33. The formation history can be quite complex, with one set beingformed initially, the second following stress relief due to the develop-ment of the first set or perhaps a general stress reversal, as discussed byRives et al. (1994). Interpretation may need detailed study of cross-cutting relationships. For the practising engineering geologist, theimportant thing is that this joint arrangement is very common in avariety of rock types and this can aid in interpretation of sets from field
Figure 3.32Orthogonalfractures insandstone, TableMountain, CapeTown, SouthAfrica.
74 Practical Engineering Geology

data. Figure 3.34 shows the typical distribution of poles that might beseen in a stereographic projection of horizontally bedded strata withtwo orthogonal joint sets and the geometrical expression if the stratahave been tilted. The interpreter should always be looking for angular
Figure 3.33Orthogonaljointing in granite,Mount ButlerQuarry, HongKong.
Figure 3.34Schematicrepresentation oforthogonalfractures and theirrepresentation on astereographicprojectionassuming one set(e.g. bedding orcooling surface) ishorizontal. Lowerright diagramshows typicalpattern of poles toorthogonal fracturesets if the modelwere tilted throughα degrees byfolding.
North
Horizontal discontinuities(e.g. bedding, schistosity)
Pattern of bedding andjointing following tilting oflayers through α degrees
North
α
90-α
σ3
σ2
σ1 (σ vertical)
xxx
x xxxxxx x x
xxxx x x
Geology and ground models 75

relationships between sets and linking these back to possible modes oforigin. Orthogonal sets may be essentially primary, formed orthogonalto the intermediate and minor principal stress directions, during burialand diagenesis of sedimentary rock (hydraulic joints of Engelder,1985) or during cooling in igneous rock. It has also been demonstratedexperimentally that orthogonal sets can be formed as a secondaryphenomenon by flexing layers (Rives et al., 1994), and this is probablya common origin during erosion, uplift and general doming (Price &Cosgrove, 1990).
3.4.9 Non-orthogonal, systematic
These joints are formed where the stresses perpendicular to the max-imum principal stress, σ1, are uniform. Themost common joints in thiscategory are those that develop in extensive sheet lavas, as illustrated inFigures 3.35–3.37. They form as tensile, planar zones of microfrac-tures arranged around centres of cooling, as primary structures, andmay develop incrementally during cooling (DeGraff & Aydin, 1987).Figure 3.38 shows deformed columnar jointed basalt lava, and oneexplanation is that a vertical columnar framework was established atan early stage of cooling but then part of the lava sheet collapsedwhilstthe rock was still plastic and the full joints developed as fractureslater. Figure 3.39 shows how columnar joints in a general lavaflow would appear on a stereographic projection originally andwhen tilted.Non-orthogonal, systematic columnar fractures can occur in
rocks other than lavas. Young (2008) describes their occurrence insandstone. In Chapter 7, the case example is presented of the PosSelim landslide in Malaysia. The pervasive jointing, which played a
Figure 3.35Vertical jointingthrough andesitelava, Hallasan,Cheju Island, SouthKorea.
76 Practical Engineering Geology

Figure 3.36Columnar joints inbasalt lava flow,Isle of Staffa,Scotland.
Figure 3.37Columnar joints, asseen at right anglesto cooling surface(looking down,vertically). There isno directionalcontrol on jointformation in thehorizontal plane(σ2 = σ3). Isle ofStaffa, Scotland.

major role in allowing the failure to develop, had no preferred orien-tation, other than it was at right angles to the planar shistocity(Figure 3.40). These are secondary joints, probably formed duringa relatively late stage of the regional tectonics responsible for theschistosity.
3.4.10 Shear joints
Pollard & Aydin (1988) dismiss the concept of shear joints as ‘sheernonsense’ but this seems to be a bit tongue-in-cheek (the paradox beingthat once shear takes place a joint becomes a fault by definition).Fractures certainly do develop in shear directions as they do in triaxialtesting (Chapter 5). In the example shown in Figure 3.41, some sec-tions of the shear joints show no visible displacement but over otherlengths of the same discontinuity, there is displacement. The argumentabout shear joints is largely academic in that whereas the joints pro-pagate in the shearing direction predicted from Mohr’s circle repre-sentation, in detail, the joint is probably made up of coalesced sections,which are strictly tensile, originating from minor flaws in the rock(Kulander & Dean, 1995). Engelder (1999) extends the discussion tohybrid joints. The appearance of shear joints on a stereonet, before andafter tilting, is shown in Figure 3.42.
3.4.11 Complex geometries
As discussed above, many joints follow some systematic geometricalpattern relating to the principal stress directions and magnitudes at thetime of their formation. In some field exposures, however, the fracturenetwork can be very complex and difficult to unravel, especially whena rockmass has been through several structural events, with each event
Figure 3.38Collapsedcolumnar joints.This has apparentlyhappened after thepattern of columnshad been defined inthe cooling lavasheet but whilst thelava was stillplastic. AmBuachaille (theHerdsman), Isle ofStaffa, Scotland.
78 Practical Engineering Geology

resulting in a new episode of fracturing, which will be influenced byany pre-existing fractures (Rawnsley et al., 1990). Examples of majorstructures influencing the geometrical development of joints are givenby Rawnsley et al. (1992) and one of these is illustrated in Figure 3.43.The joint geometries clearly follow stress trajectories that werestrongly influenced by the pre-existing major fault.
Columnar, verticaldiscontinuities plotaroundcircumference ofstereonet with nopreferential azimuth
North North
Appears asgirdle ofpoles
Horizontal discontinuities Following tilting through α°
α
90-α
σ1 (σ vertical)
σh σh (σ2 = σ3 = σh)
x xx
x xx xx
xxxx
xxxx
xx
Figure 3.39 Schematic representation of columnar fractures and their representation on astereographic projection, assuming one set (e.g. schistosity or cooling surface) is horizontal andformed in an isotropic stress field in the horizontal direction. Second diagram shows typical patternof poles if the model were tilted, say through folding. The original pattern of vertical fractures,plotting around the circumference, are expressed as a girdle of poles following a great circle, centredon the originally horizontal set.
Geology and ground models 79

3.4.12 Sheeting joints
Sheeting joints, which are sometimes also referred to as exfoliationfractures, are unlike other joints in that their geometry is not pre-defined by ancient geological history but instead they develop inresponse to near-surface stress conditions reflecting locally prevailingtopography (Hencher et al., 2011). These are tertiary joints, as definedearlier. Sheeting joints are a striking feature of many landscapes andthey have been studied for more than two centuries (Twidale, 1973).They run roughly parallel to the ground surface in flat-lying and
Figure 3.41 Jointswith conjugateshear arrangement.At some locationsthere aremeasurabledisplacements sothe shear jointsgrade into smalldisplacement faults.Near Austin, Texas,USA.
Figure 3.40 Jointpattern in schist. Alljoints areapproximately atright angles to theschistosity butotherwise randomin orientation. PosSelim landslide,Malaysia. SeeChapter 7 for moredetails of this casehistory.
80 Practical Engineering Geology
No visibledisplacement
Local normalfaulting

Figure 3.42Schematicrepresentation ofshear joints andtheir representationon a stereographicprojection,assuming one set(e.g. bedding orcooling surface) ishorizontal. Seconddiagram showstypical pattern ofpoles if the modelwere tilted, saythrough folding.
Horizontalbedding
North
xxxxx
xxxxxxxx
x
xx x xx
North
SoutheastBedding tilted by α°towards the southeast
β
β σ3
σ1
σ2
α
β
Figure 3.43Systematic joints,whose geometriesof formation wereclearly influencedby a pre-existingmechanicaldiscontinuity (thePeak Fault).Ravenscar, nearRobin Hood’s Bay,North Yorkshire,England.

steeply inclined terrain and generally occur close to the surface, typi-cally at less than 30m depth. They can often be traced laterally forhundreds of metres. Most sheeting joints are young, geologically, andsome have been observed to develop explosively and rapidly as tensilefractures in response to unloading (Nichols, 1980). Others are propa-gated to assist in quarrying, using heat or hydraulic pressure(Holzhausen, 1989). Their recent origins and long persistence withoutrock bridges differentiates them from most other joints and from mostbedding, cleavage or schistosity-parallel discontinuities.Sheeting joints are common in granite and other massive igneous
rocks but also develop more rarely in other rock types, includingsandstone and conglomerate (Figures 3.44 and 3.45). Some sheetingjoints develop at shallow dip angles, for instance, during quarrying,where high horizontal compressive stresses are locked in at shallowdepths. In Southern Ontario, Canada, for example, high horizontalstresses locked in following glacial unloading, often give rise to quarryfloor heave and pop-up structures accompanied by opening up of pre-existing incipient discontinuities such as bedding planes and schistosecleavage (Roorda et al., 1982). Where there are no pre-existing weak-ness directions, new sub-horizontal fractures may develop in otherwise
Figure 3.44Sheeting jointthrough arkosicsandstone, Uluru(Ayers Rock),Northern Territory,Australia.
82 Practical Engineering Geology

unfractured rock. Holzhausen (1989) describes propagation of newsheeting joints under a horizontal stress of about 17MPa at a depth ofonly 4m, where the vertical confining stress due to self-weight of therock is only about 100kPa. The mechanism is similar to a uniaxialcompressive strength test where tensile fracture propagates parallel tothe maximum principal stress (σ1). Such exfoliation and tensile devel-opment of sheeting joints is analogous to the sometimes explosivespalling and slabbing often seen in deep mines (Hoek, 1968;Diederichs, 2003).From a worldwide perspective, however, the joints most commonly
recognised as sheeting structures are observed in steep natural slopes.These joints are also thought to develop as tensile fractures where themaximum compressive stress due to gravity is reoriented to run paral-lel to the slope, as demonstrated by numerical models (Yu & Coates,1970; Selby, 1993) and discussed in detail by Bahat et al. (1999).Sheeting joints also develop parallel to the stress trajectories thatcurve under valleys where there has been rapid glacial unloading orvalley downcutting. Failure and erosion is a continuing process, withthe formation of new sheeting joints following the failure of sheet-bounded slabs.Wakasa et al. (2006) calculated an average erosion rateof 56m in one million years from measurements of exposed sheetingjoints in granite in Korea (Figure 3.46), which is significantly higherthan erosion rates on other slopes without sheeting joints.Whilst manyexposed sheeting joints are evidently very recent, others are mucholder. Jahns (1943) and Martel (2006) note the apparent dissectionof landscapes post-dating sheet joint formation. Antiquity is alsosometimes indicated by degree of weathering. Additional evidencefor the great age of some sheeting joints is the fact that they cansometimes be observed cutting through otherwise highly fracturedrock. Most sheeting joints occur in massive strong rock and it isargued that if the rock mass had been already highly fractured orweathered then the topographic stresses would be accommodated by
Figure 3.45Sheeting jointsthroughconglomerate. KataTjuta (the Olgas),Northern Territory,Australia.
Geology and ground models 83

movements within the weak mass rather than by initiating a newtensile fracture (Vidal Romani & Twidale, 1999). Therefore, wheresheeting joints are found in highly fractured rock masses, it is likelythat they predate the gradual development of the other joints, asmechanical fractures during unloading and weathering (Hencher,2006; Hencher & Knipe, 2007). Figure 3.47 shows the stereographicrepresentation of sheeting joints at a site in Hong Kong, together withcross joints, perpendicular to the sheeting joints and at right angles tothe azimuth of dip, which indicates their likely tensile origin.
3.4.13 Morphology of discontinuity surfaces
The shape of discontinuity surfaces is important to rock engineering,not least because of its influence on shear strength, and this is dealt
Figure 3.46Sheeting joints ingranite, MountBukansan, nearSeoul, South Korea.Climbers show thescale.
Figure 3.47Stereonet showingsheeting joints andcross joints at 90degrees. Tuen MunHighway, HongKong (afterHencher et al.,2011).
84 Practical Engineering Geology
North
EastWest
Sheetingjoints
Cross joints
Sheeting joints
South
Direction of dip ofsheeting joints
Note lack ofany setorthogonal tocross joints

with in Chapters 5 and 6. As for overall joint set orientation andspacing, discontinuity morphology is related to geological historyand mode of propagation, and surface features should be observedand described. The description, analysis and interpretation of discon-tinuity surface morphologies and the ways these can be linked tointerpretation of causative stresses, mechanisms and subsequentevolution, is a relatively undeveloped area of scientific study calledfractography (Ameen, 1995). It is difficult to be specific, that one typeof joint can be expected to have certain morphological characteristicscompared to others, but it is generally recognised that tensile fracturesare particularly rough and variable. Generally, roughness is charac-terised by measurement. Waviness is the deviation from mean direc-tion at the scale of metres. Smaller scale roughness (sometimes termedsecond-order) is either measured objectively or estimated with refer-ence to a scale called Joint Roughness Coefficient (JRC). Details aregiven in ISRM (1978) and Barton (1973, 1990). Roughness isdescribed in the field using terms such as stepped or slickensided(British Standards Institution (1999)). At the smallest scale, surfacetexture, together with mineralogy, will control basic friction.
3.4.13.1 Sedimentary rocks
Sedimentary bedding planes may show a variety of distinct mor-phologies, as illustrated by Stow (2005). Many are flat and planarbut others are rough. Ripple marks, as seen on beaches, are com-monly preserved in sandstone; in turbidite surfaces, scour markscan make them very rough, interlocking with the overlying layer(e.g. Figure 3.48). Bedding surfaces can also be roughened by bio-logical activity such as burrowing. Sometimes, bedding surfacesare exposed, weathered and eroded before the overlying rocks are
Figure 3.48Complex load/scour markings atbase of sandstonelayer, Texas, USA.
Geology and ground models 85

emplaced and, again, such features need to be interpreted correctly,both in terms of understanding the geological situation and becausethey will affect geotechnical properties.
3.4.13.2 Tension fractures
The first major work on fracture morphology was by Woodworth(1896). He observed and illustrated what are now considered classicexpressions of fractures propagating from a flaw, with typical featuresincluding feather markings and arrest or hackle marks (Figure 3.49).Most researchers consider that most such markings involve extension(tension), although other features probably involve some shear. Theyare recognised in all rocks and even drying sediments. They are alsocommonly observed in drill core, and distinguishing natural frominduced fractures is an important task for those logging the recoveredrock (Kulander et al., 1990). Such features are significant in their ownright geotechnically but are also important for the interpretation of thegeological history of a site.
Figure 3.49Shallow beddingplane with ripplemarks. Near-vertical surfacewith typical arrestand hackle marksassociated withtensile fracturepropagation. Tsau-Ling landslide,Taiwan.
86 Practical Engineering Geology

3.5 Weathering
3.5.1 Weathering processes
Weathering is the process by which rock deteriorates until it eventuallybreaks down to a soil. It occurs close to the Earth’s surface and dependsvery much on climatic influences: rainfall and temperature. Ollier(1975) and Selby (1993) provide good overviews.In hot, humid climates the following are themost important processes
� Decomposition: the result of chemical changes on exposure to theatmosphere (H2O, CO2 and O2). The original rock minerals, stableat the temperatures and pressures operative at the time of formation,break down at the Earth’s surface to sand, clay and silt.
� Disintegration: inter- and intra-grain crack growth and coalescenceof cracks to form fissures and propagation of large-scale joints.
� Eluviation: the soft, disintegrated (or dissolved) material is washedout from the parent rock fabric through open joints or from theporous skeletal structure and deposited elsewhere (illuviation).
Weathering affects not only strong rocks but weak masses, includingmaterials that might be regarded as engineering soils, even in theirfresh state. Processes include softening and chemical change(e.g. Moore & Brunsden, 1996; Picarelli & Di Maio, 2010).The rock mass in tropical areas is commonly severely weathered to
depths of tens of metres and occasionally over 100m. Weathering ismanifested by changes from the original rock state (fresh), includingmineralogy, colour, degree of fracturing, porosity and, thereby,density, strength, compressibility and permeability.In colder climates, chemical decomposition is less active and rocks
tend to deteriorate due to frost and ice action (Figure 3.50).Mechanical deterioration is also the dominant process in desert
Figure 3.50Disintegratedgranite withcorestones, aboveLake Tahoe,Nevada, USA.
Geology and ground models 87

environments, sometimes associated with expansive formation of saltin pores. The depth of weathering in cold climates is far less than intropical environments.In temperate climates such as the UK, weathering is rarely very
significant and certainly far less so than in countries such as Brazil,Malaysia and Singapore, where weathering has extremely importantconsequences for investigation, design and construction (e.g. Shirlawet al., 2000). In the UK and much of northern Europe, most weatheredrocks were stripped from the landscape by recent glaciations.
3.5.2 Weathering profiles
Weathering reduces the strength of rock material, as illustrated inFigure 1.5 and discussed in Chapter 5 in terms of geotechnical para-meters. Weathering processes generally operate at upper levels in thesaturated zone and in the vadose zone above the water table, althoughit should be noted that water tables change periodically and have doneso over the millions of years that it will have taken for the developmentof some thick weathered profiles. Therefore, current water levels maynot be related to depth of weathering at a site.As a general rule, weathering works in from free surfaces where
chemicals in water (including the water itself) can attack the parentrock (Figure 3.51). Eventually, it may leave a framework of corestonesof less weathered rock separated by severely weathered zones markingout the loci of the original joints (Figure 3.52). The process is illu-strated in Figure 3.53. The wide varieties of conditions that can beencountered in weathered terrain are discussed by Ruxton & Berry(1957), and Figure 3.54 is based on their interpretation of one type ofweathered profile from Hong Kong. Despite the conceptual usefulnessof Ruxton & Berry’s profiles, exposures are often encountered that donot conform and such exposures provide challenges to mass weath-ering classifications such as the current European standard, as dis-cussed in Chapter 4 and Appendix C. Furthermore, other rock typesoften weather without the development of corestone-type profiles.Mudstone sequences tend to develop a gradational weathering profile,as characterised for the KeuperMarl by Chandler (1969). Limestone isoften karstic, with large caves and open joints, as illustrated inFigure 3.55 and classified by Fookes & Hawkins (1988).At any particular location, the weathering profile is a function of
parent geology, groundwater conditions and the geological and geo-morphologic history of the site. The profiles may be ancient and bearlittle relationship to current geomorphologic setting. Given these andother factors, weathering profiles can be rather unpredictable fromexamination of the current topography. Valleys might be associatedwith deep weathering along faults (e.g. Shaw & Owen 2000), but notalways.
88 Practical Engineering Geology

Figure 3.52Corestonedevelopment ingranite, StubbsRoad, Hong Kong.
Figure 3.51Stained joints,volcanics, HongKong.

Chemical weathering rarely occurs to depths of more than 100m,even in tropical and sub-tropical areas, but this should only be used asa general guide to current situations; sometimes weathered profiles areencountered at much greater depths, having their origins in some pastlandscape and time. For example, Younger & Manning (2010)describe tests on a highly permeable zone in granite at a depth of410m and attribute the high permeability to weathering during theDevonian when the granite was exposed at the surface. Ollier (2010)provides other examples of ancient weathering profiles buried by latersediments.
1
2
3
4
5
Figure 3.54Schematicweathering profilewith corestonedevelopment, afterRuxton & Berry(1957), modified byHencher et al.(2011).
Figure 3.53 Corestone development. Note that boulders can be left behind at the surface as theweathering front penetrates in to the rock mass.
90 Practical Engineering Geology
Stage 1Staining along joints
Stage 2Weathering in from joints
Stage 3All corestones weatheredSharp weathering front
Relict joints in saprolite
Boulder left behind byweathering front
Exfoliation ofcorestones
Joints at depth incipient only Note that spacing of main joints remains constant

3.6 Water
3.6.1 Introduction
Water is critically important to many geotechnical projects. Surfacewater causes erosion and flooding; groundwater controls effectivestress and, therefore, frictional strength, and can be a major problemfor tunnelling. Water problems for most civil engineering design andconstruction is dealt with by measurement and monitoring using piezo-meters, backed up by numerical modelling and analysis (Chapters 4and 6). Groundwater levels do not generally fluctuate too much inresponse to individual rainstorms, other than close to the surface,which is significant for shallow landslides, as discussed below, but notfor most other engineering works. More significant are groundwaterchanges brought about by engineering works, either deliberately(e.g. dewatering to carry out excavations in the dry) or as an unintendedconsequence, for example, where tunnelling below a site. Lowering ofthe water table inevitably causes water migration and potentially inter-nal erosion, a loss of buoyancy, increase in effective stress and self-weight compaction of soil and rock. This may result in settlement and
Figure 3.55Limestonepavement withprotojoints etchedout by dissolutionweathering. AboveMalham, WestYorkshire.
Geology and ground models 91

damage to adjacent structures; piles can become overloaded by negativeskin friction (Chapter 6). Similarly, rising water levels can cause diffi-culties due to buoyancy, which could require holding down anchors orpiles. Rising water might also weaken the ground supporting astructure, sometimes due to dissolution of cementing agents.For tunnels and other underground structures, inflows can be very
difficult to predict accurately because it depends so much on thegeological situation, which is rarely well understood before theworks commence. Given knowledge of water pressure and hydraulicconductivity, then inflows can be predicted following standard equa-tions or by numerical simulation, but the controlling parameters aredifficult to measure or estimate and predictions can be wildly out, asfound for trials for nuclear waste investigations (e.g. Olsson & Gale,1995). This is especially so for tunnels passing through variable geol-ogy, as discussed byMasset & Loew (2010). The pragmatic solution isto probe ahead of the tunnel face periodically, and if inflows from theprobe holes are high, then to improve the ground in front of the tunnel,usually by injecting cement or silica grout to reduce the hydraulicconductivity. Alternatives are dewatering the ground or freezing theground temporarily. If predictions of groundwater conditions arebadly incorrect, this can have major consequences for the suitabilityof tunnelling method or machinery (e.g. the degree of waterproofing ofequipment). Where there is a risk of high water inflow, it is normalpractice to drive the tunnel uphill to reduce the risk of inundation,danger to workers and damage to machines. Where tunnelling underthe sea, lakes or rivers, there may be a risk of disastrous inflows, asoccurred during the construction of the Seikan Tunnel in Japan(Matsuo, 1986; Tsuji et al., 1996). Other examples where the severityof groundwater conditions was underestimated with severe conse-quences include the SSDS tunnels in Hong Kong and Ping Lin Tunnelin Taiwan, which are discussed in Chapter 7.
3.6.2 Groundwater response to rainfall
Most landslides are caused by rainfall and in Hong Kong, for example,rises in water level during a storm ofmore than 10m have been recorded(Sweeney&Robertson, 1979). Therefore, there is great interest in tryingto predict changes that might occur, as these will greatly affect anynumerical calculations of slope stability, as well as other engineeringprojects. Geological profiles are generally depicted for groundwatermodelling, as made up of discrete, homogeneous and often isotropicunits of given hydraulic conductivity (Todd, 1980), andmost commer-cially available, hydrogeological software only deal with homoge-neous units. To be more realistic, models may need to incorporatelocal barriers such as fault seals, fracture flowormore variable geologicalconditions such as local lithofacies (e.g. Fogg et al., 1998).
92 Practical Engineering Geology

Thewetting band theory, first proposed by Lumb (1962), is still usedfor estimating the likely depth of ground that might be affected by arainstorm. Given a rainstorm of a certain duration, and knowledge ofthe original saturation of the ground and porosity, the thickness of thesurface zone of saturation can be estimated. It is assumed that thesaturated layer will then descend until it meets the groundwater table,resulting in a rise in groundwater table, equal to the thickness of thewetting band. This provides a tool for assessing the design ground-water condition, albeit rather crude. Some of the geological conditionsthat will conspire to make such simple approaches unrealistic areillustrated in Figure 3.56.More sophisticated attempts have been made to model infiltration
and pressure diffusion processes in pressure head response and thetriggering of landslides, mathematically (see Iverson, 2000). Suchmethods are useful in visualising mechanisms but again rely on
Figure 3.56 Schematic model of water runoff, inflow and throughflow inweathered profile. Note theimportance of minor geological features such as dykes, clay-infilled joints or simple permeabilitycontrasts in the profile and the development of natural pipes. In rock, water flowwill be controlled byjoints and specific channels along those joints. There is often a zone ofmore highly fractured rock justbelow rockhead with preferential flow and sometimes upward flow into overlying soil profile(Hencher, 2010).
Geology and ground models 93
water ingress intofractures, root holes
etc.
shallow saturationand erosion: small
failures duringrainstorm
localperching
cut
lowering of water table bycutting induces highhydraulic gradient
= water table (variable)
= spring or seepage point = flow path
seepage pressuresinduce piping−flow
through system (hours/ days)
dyke
Flowoverland
100%runoff
recharge down faultzone (days / weeks)
rockexposure
fault
Upward flow frombedrock
weathered dykeacting as aquiclude
clay-infilled discontinuity

generalised parameters such as hydraulic diffusivity, which are oftendifficult to define and only apply to simple geological conditions.Morerecent modelling methods are described by Blake et al. (2003).It is often argued that it is more realistic to instrument a site and then
to extrapolate rainfall response to a design rainstorm (GCO, 1984a).However, instrumenting slopes tomeasure critical water pressures is noteasy because instruments must be installed (and monitored remotely) atthe precise locations where water pressures will develop. Quite oftenrock and soil profiles are compartmentalised and water flow carried innarrow channels, pipes or through particularly permeable zones, asdiscussed below, so the success of any instrumentation programmewill depend very much on the geological and hydrogeological insightsand skills of the investigating team, as well as a degree of good fortune.
3.6.3 Preferential flow paths through soil
Soil formed by sedimentation might be expected to suit isotropic mod-elling but intrinsic and systematic variability is to be anticipated.Sediment piles of even relatively uniform sand can be expected to con-tain intercalations of finermaterial that will result in heterogeneous flowcharacteristics. Conductivity will generally be higher in the horizontaldirection than vertical. For soils derived from theweathering of rock, themass can be incredibly complex and likewise the hydraulic conductivity.Degree of weathering varies from place to place and the soil mass willcontain remnant fabric and relict joints from the parent rock that willprobably control water throughflow. In practice and empirically, themass might be represented by a simple set of parameters characterisedfor a representative elemental volume (REV), but those parametersprobably do not actually represent the physical and mechanicalprocesses taking place in anything other than very simple situations.Richards &Reddy (2007) provide a comprehensive review of piping,
particularly as related to earth dam construction, which is where pipingwas first recognised as an important phenomenon. They define severaltypes of piping, which are also relevant to natural ground, namely:
1. Suffosion (or eluviation): the washing out or dissolution of mate-rial en-masse, leaving a loose framework of granular material,which is prone to collapse.
2. Dispersion of clay soils by rainwater in the vadose zone.3. Backwards erosion from a spring. The pipe forms (for some
reason) and then material is gradually lost from that opening.4. Erosion along some pre-existing opening such as a master joint.
The majority of pipes investigated by geomorphologists are confinedto the upper few metres in the ground profile (e.g. Jones, 1971; Uchidaet al., 2001). They are particularly common in forested areas withinshallow soil profiles and are associated with shallow landslides
94 Practical Engineering Geology

(Pierson, 1983). Anderson et al. (2008) used dyes (as have others) totrace pipe networks exposed by excavation. Not surprisingly, the sizeand connectivity of these shallow features was related to surfacecatchments. The same is probably not true of deeper features.Channelised fracture networks from the parent rock often persist
through the various stages of weathering. This type of preferential flowneeds to be considered in investigation, hydrogeological modelling anddesign. Such natural pipes probably follow original structural paths(especially master joint or fault intersections), but may also be formedby seepage pressure in weak saprolite or in superficial soils such ascolluvium. They also develop at permeability contrasts (e.g. colluviumoverlying saprolite). More details are given in Hencher (2010).Pipes are commonly seen associatedwithmany deep-seated failures in
weathered terrain (Hencher, 2006). It is implied that the development ofpipes at depth may be linked to early stages of progressive failure, as therock mass dilates and ground water exploits the dilating and deteriorat-ing rockmass. Such deep pipes are probably distinct in origin frompipesfound in upper soil horizons. Fletcher (2004) reports that infilled pipesare sometimes encountered up to depths of 80m below present sea level,and these must be associated with ancient lowstand levels.
3.6.4 Preferential flow paths through rock
Fracture flow in rock is poorly understood and difficult to investigate,characterise or model in any real sense (Black, 2010). Interpretation ofeven sophisticated test data is not straightforward, depending uponwhether one assumes that measured flow volume into or away from atest location is three-dimensional, planar (along a planar feature suchas might be assumed for a fault or major joint) or essentially linearalong a preferential channel. In simple terms, transmissivity dependsupon the aperture (degree of closure of rock walls) and roughness ofthe discontinuity walls and lengths of fractures, together with theirintersections. The flow paths are tortuous and extremely difficult toidentify. Dershowitz & LaPointe (1994) report how new oil wellscaused large drops in production to existing wells at distances ofseveral kilometres, within two days, whist other wells between themwere unaffected. Such behaviour could not be predicted without extre-mely good knowledge of the fracture network and understanding ofpotential connectivity, which is unlikely ever to be the case. To do sowith any hope of reasonable success would require a good under-standing of the fracture origins and this is quite unlikely given thecurrent state of geological knowledge. Most attempts are simplistic,extrapolating from superficial, statistical and poorly constrainedobservations in exposures or boreholes, to draw implications for therock mass at some distance. Thomas & La Pointe (1995) attempted todiscriminate between dry and flowing fractures in the drift at Kiamichi
Geology and ground models 95

Mine in Japan, on the basis of descriptive parameters such as rough-ness, aperture and orientation, as observed in the drift (at the exposedtraces of discontinuities in the mine). They used a neural networkapproach to train the analysis, but with limited success. Indeed, itseems clear that connectivity is the most important factor that controlsflow through rock, rather than locally measurable characteristics suchas fracture intensity, aperture or spacing. The fact that the mosttransmissive and well-connected features might not be adequatelysampled during investigation, is a major problem for all geotechnicalprojects, not least for potential nuclear waste repositories, where it isrecognised that large-scale conductive features need to be identifiedand dealt with in a deterministic manner (Black et al., 2007; Nirex,2007).In weathered rock profiles, water flow is sometimes concentrated in
fractured rock, underlying weathered saprolite or colluvium, and thiscan result in transmission of water (and highwater pressures) from onepart of a hillside to another, or even between catchments, where thewater then feeds into the overlying weathered mantle and may triggerlandslides. During the Mid Levels study in Hong Kong, it was recog-nised that confined conditions could occur where material of lowerconductivity overlies rock of higher conductivity. Strong upwardhydraulic gradients from bedrock to the decomposed rock aquiferwere identified in some areas (GCO, 1984b), and these observationswere used in setting up a numerical model of the hydrogeology (Leach& Herbert, 1982). Jiao &Malone (2000) and Jiao et al. (2005, 2006)have extended this concept of a highly transmissive zone at depth toexplain several deep-seated landslides and evidence of artesian pres-sure in Hong Kong. Montgomery et al. (2002) report an intenselyinstrumented site (more than 100 shallow piezometers) in Oregon,USA, and similarly noted artesian flow from the underlying bedrock,which they found surprising for such a steep hillside. They also com-mented that, whilst the seepage from bedrock might effectively deter-mine the specific locations where debris flows might initiate, thedistribution and connectivity of the near-surface bedrock fracturesystem are almost impossible to predict. Similar upward flows frombedrock into the overlying soil mantle are reported for steep graniticterrain by Katsura et al. (2008).
3.7 Geological hazards
3.7.1 Introduction
Numerous hazards can be regarded as essentially geological, includingthe potential for subsidence, swelling, clay shrinkage, natural noxiousgases and mining, as generally addressed in Chapter 4, when consider-ing elements to be targeted during site investigation. The most
96 Practical Engineering Geology

important natural hazards in terms of loss of life, however, are land-slides, earthquakes and volcanoes.
3.7.2 Landslides in natural terrain
There are more than 300 fatal landslides each year on average (Petley,2011). Some of these are in man-made slopes and therefore a matterfor engineering design (Chapter 6). Many, however, are in naturalslopes and single incidents can cause many deaths. The debris flowthat struck Gansu, China, in August 2010, killed more than 1,200people and destroyed at least 300 buildings. A total of 45,000 peoplehad to be evacuated. The risk to sites from natural terrain landslides istherefore an important consideration at many sites.
3.7.2.1 Modes of failure
Natural terrain landslides can be split into those where the detacheddebris directly impacts a site through gravity and those where thedebris becomes channelised and flows down a valley (Figure 3.57).Channelised landslides are relatively easy to deal with conceptually, inthat the pathway for the debris, which often becomes saturated andflows, is easily predicted, even if the size of the event is not. The bestthing to do is to avoid the outlet of any valley, but if this is not possible,
Figure 3.57 Run-out models for shallow landslides. Most landslides are onlyhazardous where they directly threaten a facility. Remote landslides can,however, feed into a stream channel where they can be channelised and flowgreat distances. Things may bemade worse where the initial failure produces alandslide dam, behind which a lake forms. When the temporary dam isbreached, a sudden discharge of fluidised debris is released.
Geology and ground models 97
• debris reacjes valley
Open hillside failure (OHF) within 100 mof river
Runout from O
HF < 100 m
historic
ally • temporary dam forms then isbreached
A
B
D+C
D
Rock fall debris from cutslope or threatening cliff
Channelised debrisflow
OHF within 100 m offacility at risk
Shallow crest failurein cut slope
• debris reacjes valley
Runout from O
HF < 1
historic
ally • temporary dam forms then isbreached
A
B
D+C
D
F within 100 m offacility at risk
crest failureut slope

for example, where building a road or railway, then the size of the designevent may be predicted by historical studies or from first principles.Hungr et al. (2005a) present a useful review of landslide characteristicsthat might be considered for design. In assessing existing facilities andstructures, sometimes these can be protected by barriers and otherengineering devices, but occasionally the risks are so high and cost ofmitigation too expensive, so that relocation is the only real solution.Open hillside landslides and rockfalls have a much more limited
distance of travel. For most landslides in Hong Kong, debris traveldistance is less than 100m, so the area of concern is quite obvious, bothin terms of source of landslides and structures at risk. It does not makethem less dangerous, just that the nature of the hazard and focus foranalysis is clear. Hazard assessment can follow standard methods ofinvestigation, analysis and design, as outlined in Chapter 6. Riskreview can be used to justify cost of mitigation works or taking noaction – despite there being a clear and obvious danger as, for example,along many roads through mountainous areas. The practical applica-tion of risk concepts are reviewed by many authors in Hungr et al.(2005b). Fell et al., (2005) and Wong (2005) are particularly useful.
3.7.2.2 Slope deterioration and progressive failure
The concept of ripening of slopes prior to failure has been a useful ideafor many years, but recently evidence for progressive deterioration ofslopes prior to detachment has become better documented. Thisapplies to both natural slopes and cut slopes (Malone, 1998;Hencher, 2000; Parry et al., 2000). Factors involved in slope deteriora-tion are illustrated schematically in Figure 3.58, and some of thefactors triggering natural terrain failures are illustrated in Figure 3.59.The gradual deterioration can be represented by a curve in which the
Factor of Safety reduces over a period of time, which may be hundredsof years (Figure 3.60). The vertical lines represent temporary reduc-tions in Factor of Safety caused by relatively short-term, transientevents (days). In the course of time, the slope will deteriorate to thepoint where it is vulnerable to a transient event – causing a reduction inthe Factor of Safety below 1.0. Whether that event results in cata-strophic failure, or only minor movement and internal deformation,depends on many factors, including the severity of the triggering eventand how long it lasts. The concept of ripening and progressive failureis discussed in more detail in Hencher (2006). Similar concepts arediscussed for claystone slopes by Picarelli & Di Maio (2010).Signs of gradual deterioration or, more likely, the cumulative effect
of intermittent triggering events, can be seen in many exposures andthese can be used during ground investigation to help judge whether afailure is imminent, although this may still not be straightforward, asdiscussed in Chapter 6, Box 6-4.
98 Practical Engineering Geology

Figure 3.58Deteriorationfactors in slopes.
Figure 3.59 Watertriggeringmechanisms ofshallow landslides.
Sheeting joint andassociated fracture
development
Extension andpropagation ofjoints duringweathering
Rapid deterioration offresh exposure (e.g.
Mudstone)
Stop-start intermittentmovements with dilation
and infilling
Vegetation jacking
Washout due tosurface flow
Destabilisation ofboulder
Sub-surfacepiping and
erosion
Saturation andloss of suction
Rising waterpressure
Cleft waterpressure in
discontinuities

3.7.3 Earthquakes and volcanoes
Volcanic risk is a clear problem, but sources of the hazards are gen-erally well known, although surprises do occur, as in the case of themud volcano that erupted disastrously in 2006 (Davies et al., 2011).Clearly, if a volcano is active then construction should avoid thepotential zone of travel and deposition of very hazardous materialssuch as lava and ignimbrite. Landslides associated with volcanoes arecalled lahars, which can travel great distances and be hugely damaging.Noxious gases are produced by volcanic activity. A tragic case at LakeNyos in Cameroon, Africa, in 1986, involved the eruption of a bubbleof carbon dioxide that suffocated more than 1,700 people and 3,500livestock in nearby villages. Avoidance is again the only real option.Earthquakes are rather more of a general hazard in that they can
occur anywhere in the world, though seismic activity is concentratedalong active plate boundaries. The process of assessing earthquakehazard for a site and then design to withstand the potential shakingare dealt with in Chapters 4 and 6.
3.8 Ground models for engineering projects
3.8.1 Introduction
Ground modelling is an essential part of engineering design. Theground model for a project will mainly comprise a simplified repre-sentation of the site geology that should include all aspects that arelikely to affect the project or to be affected by the project. A useful
Figure 3.60 The concept of gradual ripening of slopes prior to the development of a full landslide. Atsome stage, the slope will reach the point where it may be moved a little by some transient processsuch as intense rainfall or an earthquake. Deterioration will then continue and probably accelerateuntil eventually full detachment occurs. As Hencher (2006) notes, hillsides can be regarded as havingan inventory of different parcels of ground, all at different stages of deterioration and, therefore,susceptibility to a particular triggering event. Depending on the severity of the event, one, two ormany landslides will occur.
100 Practical Engineering Geology
STABLETemporaryreduction ofF of S in severestorm
Gradual deterioration of slope over time (say 1,000 years)
F of S
1.0
Dry condition line
Slope stableeven undersevere storm
Possible partialmovement duringstorm Slope fails even
under dryconditions
UNSTABLE

review is given inGEO (2007) and some principles are set out in Box 3-3.Ground models in this context are essentially 3D models of the geolo-gical conditions at a site, together with environmental influences andhazards. Numerical and physical models can be designed based on theconceptual ground model and might be used in the development ofground models, for example, in simulating the development of in situstresses.
Box 3-3 Principles of ground modelling
1. Ground models for a site should be based on adequate interpretations of geology andhydrogeological conditions; adequate with respect to the engineering circumstances andproject requirements.
2. Models should be extensive enough to include all the ground that will be affected by the works.For example, a building will stress the ground significantly to a depth of up to twice the breadthof the foundation footprint. A new dam and reservoir may influence the terrain and environmentfor a large area, many kilometres from the actual dam, through changes in ground water levelsand perhaps induced seismicity.
3. Engineering geological models should make sense in terms of the geological history at a site. This testis sometimes failed in ground models produced by non-geologists.
4. Make sure that the models incorporate all the features of the ground important to physicalperformance as conditions change (e.g. increased or decreased loading by the engineering works orthe application of fluid pressures).
5. The creation and testing of several simple models exploring the sensitivity of the site to variousassumptions will often be more revealing than a single complex model. This is certainly true when itcomes to using numerical and physical models.
6. Geotechnical engineers and engineering geologists should act as detectives in characterising a site,studying the evidence, hypothesising and testing hypotheses through the collection of additionaldata, including the output from numerical analyses. Several iterations may be necessary before themodels are adequate (Starfield & Cundall, 1988).
A preliminary geological model based on desk study, togetherwith geomorphological interpretation, should be used for planningground investigation, which will allow the model to be checked andrefined. Fookes (1997) suggests that a model can simply be awritten description or presented as cross sections or block diagramsand plans. It might be focused on some aspect such as ground-water, geomorphology or rock structure but should be targeted atthe engineering needs of the project. At a later stage, the geologicalmodel may be split into units which can be characterised in termsof engineering properties and anticipated performance. In somelocations and for particular projects, rocks that are quite differentin origin and age might be lumped together because they can beexpected to behave in a similar manner. Complex geology does not
Geology and ground models 101

always equate with difficult geotechnical behaviour. Conversely, anapparently simple geological profile may have subtle variationsthat affect the success, or otherwise, of a project.Once the model includes the range of engineering parameters and
ground conditions that need to be considered, it becomes a designmodel (Knill, 2002). It might then be used, for example, to decidewhat foundation system might be required to carry the load from abuilding. It is used for making decisions on how to deal with theground conditions. The full model will include not only geologicalfeatures but also other site factors, including environmental conditionsand influences such as groundwater, rainfall, wind and earthquakeloading, as well as anthropogenic influences such as blasting and trafficvibration.
3.8.2 General procedures for creating a model
The starting point of a model should usually be a three-dimensionalrepresentation of the geology of the area and to the depth that willbe affected by the project or which the project may affect. The firstattempt at a geological model for a site will usually be an interpreta-tion of published maps and the interpretation of aerial photographsand satellite imagery, depending upon the location of the project.Unfortunately, for some projects, that is as far as the geologicalinterpretation goes, sometimes with disastrous results because themaps are either incorrect or at such small scale that they cannotrepresent the site-scale features that will affect the project. Thoseworking in civil engineering need to appreciate that all publishedgeological maps are professional interpretations of relatively smallpieces of reliable data that are then interpolated and extrapolated.Faults may have been interpreted from lineaments and might notexist in reality. Conversely, published maps will certainly not showall the major geological discontinuities that may be significant for anengineering project. Most features on geological maps are generallymarked as uncertain or inferred but that does not stop the unwaryassuming that they are accurate. In all cases, maps and plans that arenot site- or project-specific, should be taken as indicative only and astarting point for detailed investigation, as discussed in more detailin Chapter 4. Despite the inevitable limitations of published infor-mation, a broad understanding of the geological and geomorpholo-gical setting can be used to make predictions of what might beencountered at the site through experience and training. For exam-ple, if the site includes a granitic intrusion, then one might expectcertain joint styles in the granite, a metamorphic aureole around theintrusion where the granite has cooked the country rock, and asso-ciated minor dykes and hydrothermal alteration, as illustrated inearlier sections of this chapter. In limestone country, one should
102 Practical Engineering Geology

expect caves and open fissures, perhaps infilled with secondary sedi-ments, even where they have not actually been sampled at the site.The use of earth science skills to interpret the available data as a sitehistory is clearly important, yet sometimes lacking in civil engineer-ing practice (Brunsden, 2002). The best source of information onwhat might be anticipated is the geological literature – textbooks onphysical and structural geology and sedimentology in particular, asbackground, together with local geological reports and memoirs,and there are no real short cuts.
3.8.3 Fracture networks
A particular problem with modelling rock masses is defining thefracture network. As addressed earlier in this chapter, considera-tion of geological origin and an appreciation of the history ofdevelopment of fractures can be important for creating a realisticmodel. In reality, most fracture models, be they for assessing rockstrength or permeability, are generated statistically based on orien-tation data. Persistence is extremely difficult to judge and mostsuch models start off essentially as geological guesswork that can beadjusted and modified as field test data are collected, say in the petro-leum industry or from large-scale pump tests associated with watersupply or nuclear waste investigations. Particular techniques are usedfor discrete fracture network (DFN) modelling as in software packagessuch as FracMan.
3.8.4 Examples of models
A simple model for a cut slope alongside a road is shown inFigure 3.61. The mass of rock and soil has been split into five units,largely on the basis of strength factors, as discussed in later chapters,but discrete and possibly important elements, such as major adversediscontinuities along which a landslide could occur, are identified forspecial consideration. A simple model of ground conditions for thedesign of foundations of a building is illustrated in Figure 3.62.The various units will each give some support to the building andthe ground-structure interactions need to be assessed if the founda-tions are to be designed cost-effectively. Models should not be overlycomplex but must account for all the important features at the site,including apparently ‘minor geological details’ that have ‘majorgeotechnical importance’, such as individual weak discontinuitiesalong which slippage could occur (Terzhagi, 1929; Baecher &Christian, 2003). Many such features can be searched for specificallyduring investigation, provided there is a proper appreciation of thegeological and anthropogenic history of the site, as discussed inChapter 4.
Geology and ground models 103

The model with assigned geotechnical parameters becomes a designmodel, which is then used to predict the interaction between thestructure and the ground, for example, from a building load, toensure that failure will not occur (ultimate limit state) and that defor-mation will be within the tolerance of the structure (serviceability limitstate). It must allow failure and deformation mechanisms to be
Figure 3.61 A schematic ground model for a weathered rock slope with units defined by degree ofweathering, percentage of corestones and degree of fracturing. Particular features, such as dykes,faults and adverse master joints, need to be included as individual entities.
Figure 3.62Preliminary groundmodel forfoundation design,with key geologicalelements identifiedfor geotechnicalcharacterisation rephysical parametersand behaviour.
104 Practical Engineering Geology
saprolite
corestones
adverse joints
dyke
Unit 1 goodquality rock Unit 2 weathering
on joints
Unit 3 More than50 % rock
Unit 4 significant proportionof corestones
Unit 5 mostlysaprolite
5
4
3
2
1
saprolite
orestones
joints
e
Unit 1 goodquality rock U it 2 th i
Unit 350 % r
Uniof c
Unit 5sapro
5
4
3
2
1
Unit 2Dense sand
Unit 3Weathered
rock
Unit 1Compressibleclay
Unit 4Strong rock

correctly identified – a mechanism model – whereby performance ispredicted in response to changes brought about by the engineeringworks or in the long term from environmental impacts, includingrainfall, rises in groundwater pressures and vibration shocks. Theremay be a long sequence of events contributing to the outcome, andthe geotechnical team need to predict this sequence or to recognise thesequence when carrying out forensic studies of failures. The need for adynamic approach rather than just static is illustrated by the concept ofbore pile design. A pile can be designed to carry load through skinfriction, as well as through end bearing, but the designer needs to takeaccount of how the load is taken up sequentially. In reality, dependingon the geological conditions and geometry of piles, the skin friction inthe upper part of a long pile will come into play in carrying the loadfrom the structure, long before any load will reach the toe of the pile;appreciation of this process will help the designer produce a cost-effective solution.The designmodel might be used as the basis for predictive numerical
modelling, but quite often a conceptual model can be used in its ownright to identify the hazards and the best way to proceed at a site.Whenfailures occur, it is often the conceptual engineering geological modelthat helps to explain what has happened. The parameters are verymuch secondary – it is rare to be able to be very certain regardingparameters such as strength and water pressures and often a range ofpossible solutions will fit the facts equally well (Lerouiel & Tavernas,1981). An example of an engineering geological model used to explaina major landslide is given in Chapter 7 (the Pos Selim landslide,Malaysia) and discussed in Malone et al. (2008). Experience tells uswhen a model makes sense in terms of likely strengths and mechan-isms. A complex 3D modelling exercise would often only serve toconfirm what we can already tell by judgement. Examples of concep-tual models used to explain the observed facts from two landslides aregiven in Boxes 3-4 and 3-5.
Box 3-4 Mechanism model for a landslide on Tsing Yi Island, Hong Kong
Facts to be taken into account
– The failure occurred in August 1982, several days after heavy rain (Choot, 1983). It constitutedgeneral distress in an elliptically shaped area in the centre of a cut slope, with kicking out at the toe byabout 750mm (Figures B3-4.1 and B3-4.2).
– Nomovement had been detected previously, despite evenmore severe rainfall inMay 1982.However,one piezometer in the centre of the distressed area had begun to show positive pore pressures since theMay rainstorm.
– The failure was in severely weathered granite with daylighting (partly clay-infilleddiscontinuities).
Geology and ground models 105

– The rear scarp was defined by a near vertical set of joints with thick slickensidedinfill of kaolin and manganese dioxide, indicative of intermittent opening up and movement(Figure B3-4.3).
– Water was observed issuing from the toe of the distressed area soon after the movement but this driedup after several days.
– The permanent water table was several metres below the level of distress, as indicated by constantseepage from the lower part of the cut slope.
Figure B3-4.1 View of distressed area with dammed river valley in background (as discussedbelow).
Figure B3-4.2 View of landslide from below. The toe has kicked out about 750 mm and water was seenissuing from this surface for several days.
106 Practical Engineering Geology
Dammed, boulder filled rivervalley, issuing water
Area of distress

– To the left of the rear scarp, facing the slope, soil was exposed containing 70% angular boulders andcobbles.
– The boulder-rich area extended to the left of the distressed area, though this was mostly covered withconcrete. The boulder zone was discrete, V-shaped and wet, with vegetation growing from cracks(Figure B3-4.4).
Figure B3-4.3 Relict joints in the rear of the landslide with thick, slickensided kaolin and manganesedioxide infill.
Figure B3-4.4 View of dammed river valley to left of failure.
Geology and ground models 107
Boulder filled river valley dammed with conerete
Flowing water
Granite
Distressedarea of slope

Developing a mechanism model
So the explanation is probably as illustrated in Figure B3-4.5.
Predisposing factors
1. Weathered granite with adverse daylighting joints, some clay-infilled (possibly associated with long-term deterioration).
2. River valley with large catchment, adjacent to slope.
What is the slipsurface?
Apparently sliding on relict joints.
What triggered themovement?
Timing suggests it was associated with heavy rainfall, but delayed, and thisneeds to be explained. Also, there is suspicion that some opening up mighthave been caused by the more intense May storm, because of the watermeasured in the failure zone, although site staff had not reported any signsof distress.
If it was triggered bygroundwater, then whydid movement stop?
Probably because the rock mass dilated, reducing water pressure, together witha reduction in water supply to the distressed area. This is supported by theobserved cessation of water flow from the toe of the distressed area, some daysafter the movement.
So where was the waterfrom?
The permanent water table is below the level of failure so the most likely sourceis throughflow from the boulder-filled feature to the left of failure.
So what is that feature? Aerial photo interpretation indicates that the boulder zone is the cross section ofan old river valley adjacent to the landslide.
Figure B3-4.5 Proposed model for the failure.
108 Practical Engineering Geology
Waterforces
Old river channel
Dilation reduceswater pressure,slope stabilises
Water fromchanneldammed byconcretesurface cover
Water ta
ble
(permanent)
Lateral flowto relict joints

Likely mechanism
1. After cutting of slope for road construction, the slope was coated with concrete. The concretedammed the truncated river valley seen in Figure B3-4.4.
2. Probably minor movements had been occurring intermittently for many years, as evidenced byinfilled and slickensided joints.
3. The May 1982 rainstorm probably resulted in high dammed water levels in the old rivervalley, feeding water laterally into the eventual failure area. This led to dilation of the rockmass and increased permeability, so that a piezometer that had been dry became responsiveafter May 1982.
4. The August 1982 storm led to a rise in water in the dammed river valley. It took several days for thecritical pressures to develop.
5. Water moved laterally into the adjacent rock mass. Water pressures reduced effective stress andinitiated failure.
6. The slope reached a metastable condition as the rock mass dilated and water pressures weredissipated.
Coda
The distressed area was cleaned off and the slope further investigated. Despite a lack of any ‘usefulpiezometer information’, the engineers responsible for the slope decided to install more than 100deep and expensive caissons and interconnecting drains in three lines, right across the slope, ratherthan concentrating on the most likely sources of shallow infiltration and throughflow, such as theold river valley. In August 1984, during re-profiling, major wedge failures occurred by sliding onclay-filled joints (Figure B3-4.6). The remedial measure adopted (apart from the deep drainage systemalready instigated) was to cut back the slope as far as feasible and to install more than 100 permanentground anchors, each stressed to more than 1,000kN through a grillage of ground beams (Buttling,1986).
Figure B3-4.6 View of slope during remedial works and new, joint-controlled failures.
Geology and ground models 109
Slopes re-graded after 1982 failure
Wedge failure August 1984
River valley colluvium nicely exposed

Box 3-5 Mechanism model for a landslide on Tuen Mun Highway, Hong Kong
Facts to be taken into account
– The failure occurred in May 1982, following about 400mm of rain in a few hours.– Three failures occurred in the upper level of a cut slope (Figure B3-5.1).– A piezometer had been installed through the site of the main failure prior to construction of the road.
Measurements indicated that the main water table was below the failure levels and this was confirmedby seepage points in the lower slopes.
– The failures were in predominantly highly and completely decomposed granite (mostly sand-sized).Two dolerite dykes in the vicinity of the failure were decomposed to fairly uniform silt-sized material(Figures B3-5.2 and 5.3).
Figure B3-5.1 View of section of Tuen Mun Highway at Ch. 6750 with two major and one minorlandslide.
Figure B3-5.2 View ofmain landslide with dolerite dyke shallowly dipping out of slope throughweatheredgranite.
110 Practical Engineering Geology
Piezometerstand pipe
Dykes

– A series of triaxial and direct shear tests were carried out. Back-analysis demonstrated that the strength ofintact material was too high to have permitted failure in the absence of adverse groundwater pressures.
– Adverse discontinuities were recorded in the second largest failure but were not persistent.
Develop the mechanism model
So the explanation is probably the following.
Predisposing factors
Weathered granite with cross-cutting dolerite dykes. There would be a permeability contrast, the dykesacting as aquitards.
Mechanism
1. The geological model of the main failure is shown in Figure B3-5.4.2. Themain landslidewas probably caused by direct infiltration, during or shortly after the intense rainfall.
Trial pitAccess ladders
Dyke 1
Figure B3-5.3 Close up of left flank of landslide with two dykes, themain one dipping out of the slope and asecond dipping back into the slope. Piezometer tube was installed at time of road construction (about 1976).
Mechanism? Apparently through the intact weathered rock for the mainfailure; relict discontinuities may have reduced the massstrength for the second failure.
What triggered the movement? The failures were associated with intense rainfall, althoughtiming was not known precisely. Vegetation above the slope wasflattened towards the slope, suggesting considerable surface flow.
But measured and observed water tablewas below failure surface?
Nevertheless, back analysis suggests that failure was impossi-ble without adverse positive water pressure.
Geology and ground models 111

3. Water infiltrated as a wetting band, until it reached the shallow dipping dyke underlying the mainlandslide scar, leading to increased water pressure.
4. Figure B3-5.5 shows a cross section through the failure with three postulated piezometricsurfaces, and Figure B3-5.6 shows the results from numerical analysis; the main curves showsolutions for Factor of Safety = 1.0 for different strength conditions and for each trial piezometricsurface individually. Although a range of strengths were measured for the decomposed granite, themost likely strength was φ′ = 36 degrees, c′ = 5 kPa. If that was correct, then the failure would havebeen triggered by a piezometric pressure somewhere between surfaces 2 and 3.
Figure B3-5.4 Geological model of landslide with normal and temporary perched water tables invokedto explain failure.
Figure B3-5.5 Cross section through failure with various levels of water used in back analysis to try toexplain the likely conditions when the landslide occurred.
112 Practical Engineering Geology
‘Permanent’ watertable above rock
head
Shallow dippingdyke underlying
failure
Temporaryperched water
above dykenecessary to
explain failure
Seepage
VI
IVV
IV/VGranite
Decomposed dolerite dykes
Grade IV & V granite
85
90
1
2
3Grade III
rock
95
100
Met
res
(mPD
)
105
Cut slo
pe
Natural slope

An example of a simple ground model prepared for the design of a realproject is given in Figure 3.63. When designing a tunnel one needs topredict the ground conditions along the route so that one can decidewhat tunnelling method needs to be adopted, as discussed in detail in
10
3
Most likely strengthφ′ = 36°, c′ = 5 kPa
x2
1Dry
Piezometric surface
Coh
esio
n, k
Pa
7.5
5
2.5
30 35 40Friction angle
Figure B3-5.6 Results from numerical analysis. Each point along the lines for the various trial piezometricsurfaces gives a FoS of 1.0. From testing and empirical data, the most likely field strength is φ = 36 degreesand c´= 5 kPa, which would indicate that the likely perched water pressure was somewhere between levels 2and 3 at the time of failure (Hencher (1983b), Hencher & Martin (1985)).
Urban areaRisk of dewatering, settlement ofbuildings and direct damage tofoundations
Tunnel under hillPotential high in situ stressesand squeezing groundMay be high water pressure ifconnected along faults
Urban areaRisk of damage tomajor slope
Weatheredrock
Generally good quality rock
extrapolated possible faults
Ventilationshaft
240.00220.00200.00180.00160.00140.00120.00100.0080.0060.00
20.000.00
-20.00-40.00
200.
000
300.
000
400.
000
500.
000
600.
000
700.
000
800.
000
900.
000
1,00
0.00
0
1,10
0.00
0
1,20
0.00
0
1,30
0.00
0
1,40
0.00
0
1,50
0.00
0
1,60
0.00
0
1,70
0.00
0
1,80
0.00
0
1,90
0.00
0
2,00
0.00
0
CHAINAGE(m)
GOODFAIR
POOR
Rock Quality
ELE
VA
TIO
N (
mP
D)
40.00
Figure 3.63 Ground model for tunnel. Predicted rock mass characteristics can be used to estimatethe amounts of reinforcement, such as rock bolts and shotcrete, that will be required. It will also beused during construction, as part of the risk control, probing ahead, as necessary, to establish zonesof hazardous ground. As illustrated in Chapter 7, tunnelling remains a risky endeavour because veryrarely are ground investigations adequate for characterising the ground along their length.
Geology and ground models 113

Chapter 6. Another requirement of the model is to allow the supportrequirements to be predicted along the tunnel. For example, in a longdrill and blast/hand-excavated tunnel, some sections of the ground, ingood rock, may need little support, others will need local reinforce-ment to prevent rock blocks falling. In other sections, through weakground or where there are high water pressures, the tunnel might needa thick reinforced concrete liner. A groundmodel needs to be preparedthat includes predictions of rock quality along the route. These predic-tions are needed so that the team constructing the tunnel knowwhat toexpect and where to take special precautions. The predictions are alsonecessary so that the contractor can prepare a realistic tender price forthe construction and as a reference so that all parties can judgewhetherconditions were more difficult than might have been anticipated, sothat additional payment can be made to the contractor, if appropriate,as discussed in Chapter 2. The model also needs to allow the influenceof the works on other structures to be assessed. In Figure 3.63, eachend of the tunnel terminates in urban areas. The problems of noise,vibrations, dewatering and physical interaction with existing founda-tions and slopes need to be considered and these are all aspects where acomprehensive ground model is essential. Where the tunnel passesunderneath the hill, there may be unusually high lateral stresses caus-ing squeezing on the tunnel. The possible faults identified along theroute may be associated with particularly poor ground and possiblyhigh inflow of groundwater.
114 Practical Engineering Geology

4 Site investigation
‘… if you do not know what you should be looking for in a site investiga-tion you are not likely to find much of value.’
(Glossop, 1968)
This much-quoted quote is worth repeating because it sums up thephilosophy of site investigation very well. Critical features need to beanticipated and looked for. Without care, the important details mightbe hidden within a pile of essentially irrelevant information. Thedifficulty and skill, of course, is in recognising what is critical.
4.1 Nature of site investigation
At any site, the ground conditions need to be assessed to enable safeand cost-effective design, construction and operation of civil engineer-ing projects. This will generally include sub-surface ground investiga-tion (GI), which needs to be focused on the particular project needs andunknowns. The requirements for GI will be very different for a tunnelcompared to the design of foundations for a high-rise building or forstability assessment of a cut slope. There needs to be a preliminaryreview of the nature of the project, the constraints for construction andthe uncertainties about the engineering geological conditions at thesite. The British Code of Practice for Site Investigation, BS 5930 (BSI,1999), sets out the objectives broadly as follows:
1. Suitability: to assess the general suitability of a site and its environsfor the proposed works.
2. Design: to enable an adequate and economic design, including fortemporary works.
3. Construction: To plan the best method of construction and, forsome projects, to identify sources of suitable materials such asconcrete aggregate and fill and to locate sites for disposal of waste.
4. Effect of changes: to consider ground and environmental changeson the works (e.g. intense rainfall and earthquakes) and to assess theimpact of the works on adjacent properties and on the environment.
5. Choice of site: where appropriate, to identify alternative sites or toallow optimal planning of the works.

4.2 Scope and extent of ground investigation
4.2.1 Scope and programme of investigation
The scope of site investigation is set out in Box 4-1. This should includeeverything relevant to use of the site, including site history and long-termenvironmental hazards and not just geology. All authorities (e.g. AGS,2006) agree that site investigation should, ideally, be carried out instages, each building on the information gained at the previous stage,as outlined in Box 4-2. A preliminary engineering geological modelshould be developed for the site fromdesk study andfield reconnaissance,as outlined in Chapter 3. That model should then be used to considerthe project constraints and optimisation (e.g. the likely need for deepfoundations or the best location for a dam) and for designing the firstphase of GI. For a large project, this first phase is usually carriedout during the conceptual phase. Further GI campaigns might be carriedout for basic design, for detailed design and often additional worksduring construction. Engineering geologists should readily appreciatethat all sites do not require the same level of ground investigation. Somehave simple ground conditions, others more complex. At some locations,existing exposures will allow the broad geology to be assessed and reducethe need for GI. Projects may be situated in areas where the geology andground conditions are alreadywell understood. For example, if designingpiles in London Clay, because of the wealth of published data andindustry experience, GI requirements should be fairly routine1 – littleshould be needed in thewayof testing to determine parameters for design.Taking this further, experience shows that themajority of sites world-
wide do not have any particularly inherently hazardous conditions andmight be categorised as forgiving. Even with no, or no competentinvestigation, the project is often completed without geotechnical diffi-culty. Such sites need little investigation – enough to establish that thereare no particularly adverse hazards. In a review of the scope of groundinvestigations for foundation projects in the UK, Egan (2008) foundthat GI was either not conducted or was lacking borehole plans for30% out of 221 projects, but he reported no adverse consequences. Inother words, the engineers took a risk, perhaps on the basis of previousexperience in an area, and apparently got away with it, although, asEgan points out, a ground investigation might have allowed morecost-effective solutions. Unfortunately, the world also has relativelyrare unforgiving sites with inherently difficult geotechnical conditionsthat need careful and insightful investigation if problems are to be
1 It does not follow that London Clay is without hazards for construction projects, forexample, the Heathrow Express Tunnel collapsed during construction, as discussed inChapter 7. De Freitas (2009) also provides a warning over geological variationthrough the London Clay stratum and argues that data banks of geotechnical propertiesneed to be used with care from one area to another.
116 Practical Engineering Geology

avoided. The big problem is identifying whether any particular siteis unforgiving and in what way. It is the task of the engineering geologist,through his knowledge of geological processes, to anticipate hazardousgeological conditions and to make sure that a GI is properly focused. Achecklist approach to hazard prediction is advocated below.
Box 4-1 Overall scope of site investigation
1. Hazards and constraints duringconstruction and in the longer term
– Previous site use – obstructions, contamination– Any history of mining or other underlying or adjacent
projects (e.g. tunnels or pipelines)– Sensitive receivers – such as neighbours that might be
affected by noise, dust, vibration and changes inwater levels– Regulatory restrictions– Natural hazards, including flooding, wind, earthquakes,
subsidence and landslides
2. Assess and record sitecharacteristics
– Access constraints for investigation andconstruction
– Need for traffic control, access for plant and wastedisposal
– Access to services– Site condition survey (partly as a record for any future
dispute)
3. Geological profile at site – Distribution and nature of soil and rock underlyingthe site, to an adequate degree, to allow safe andcost-effective design
– Usually this will require a sub-surface groundinvestigation
4. Physical properties of soiland rock units and designparameters
Key parameters:
– mass strength (to avoid failure)– deformability (to ensure movements are tolerable)– permeability (flow to and from site, response to rainfall and
loading/unloading)
Other factors:
– chemical stability (e.g. reactivity in concrete, potentialfor dissolution)
– potential for piping and collapse– abrasivity (sometimes a major consideration for
construction)
5. Changes with time – install instruments to check physical nature of the site – e.g.groundwater response to rainfall
– install instruments to monitor settlement and effect onadjacent structures during construction
– consider the potential for deterioration and need formaintenance
Site investigation 117

Box 4-2 Stages in a site investigation
Stage 1: Desk study at project conception stage
– Identification of key geological and environmental hazards at optional sites based on broad desk studyand possibly site visits.
– Consider site constraints, engineering considerations and economic factors.
Stage 2: Detailed desk study and reconnaissance survey
– Collect and review all documents relevant to the preferred site, including topographic andgeological maps, aerial and terrestrial photographs and any previous investigation reports.Review site history including previous building works and mining. Look for hazards such aslandslides.
– Site mapping, possibly with advance contract allowing safe access, vegetation clearance and trial pitsor trenches.
The Preliminary Ground Model
Develop a preliminary geological and geotechnical working ground model that can be used as areference for the rest of the ground investigation.
This preliminary model should be used as a reference by all the team, including those loggingboreholes and trial pits. The loggers need to knowwhat to expect and to be able to identify anythingthat necessitates revisions to the ground model.
Site-specific ground investigation should be aimed at verifying the model, answering anyunknowns and allowing design parameters to be derived.
Stage 3: Preliminary ground investigation linked to basic engineering design
– Consider use of geophysical techniques to investigate large areas and volumes.– Preliminary boreholes designed to prove geological model (rather than design parameters).– Instrumentation as appropriate (e.g. to establish groundwater conditions and seismicity).
Stage 4: Detailed ground investigation
– Further investigation to prepare detailed ground model and allow detailed design.– In situ and laboratory testing to establish parameters.– Detailed instrumentation and monitoring.
Stage 5: Construction
– Review of ground models during construction (including logging of excavations).– Testing to confirm design parameters.– Instrumentation to monitor behaviour and check performance against predictions.– Revision to design as necessary.
Stage 6: Maintenance
– Ongoing review – e.g. of settlement, slope distortion, groundwater changes and other environmentalimpacts, possibly linked to a risk management system.
118 Practical Engineering Geology

Typically, the cost of a site investigation is only a small part of theoverall project cost (less than a few percent), yet clients often requiresome persuasion that the money will be well spent and mightbe especially reluctant to allow a staged approach because of theimpact on programme. He might be reluctant to allow thinking andplanning time as the GI data are received and especially unwilling topay for a revised design as the ground models are developed andrefined. Sometimes the engineer might adopt a fast-track approachwhereby GI, design and construction are carried out concurrently,although this approach carries the risk that information gained latermight impact on earlier parts of the design and even on constructedparts of the works. The programming can sometimes go awry, as ona site in Algeria where the author was trying to set out locations fordrilling rigs in the same area as a contractor was preparing to constructfoundations which obviously did not make sense. It turned outthat design engineers had made assumptions about the ground condi-tions without waiting for GI, thinking that surface footings wouldbe adequate. This proved incorrect and the design needed completerevision. In a similar manner to fast tracking, an observationalapproach is sometimes adopted, especially for tunnelling, wherebyground conditions are predicted, often on rather sparse data, andprovisions made for change if and when ground conditions turnout to be different from those anticipated (Powderham, 1994).The observational method often relies on instrumentation of groundmovements, measured loads in structural members, or water levels,whereby performance is checked against predictions. This can goseriously wrong where the ground behaves outside predictions –
perhaps because the geological model is fundamentally incorrect orbecause instrument systems fail or are not reacted to quickly enough.Examples where instruments were not reacted to early enough includethe Heathrow Express Tunnel (Muir Wood, 2000) and the NichollHighway collapse in Singapore (Hight, 2009); these are described insome detail in Chapter 7. An observational approach should alsogenerally be adopted for rock slope construction, although it isseldom referred to as such. Basically, it is very difficult to characterisethe complete rock fracture network from a few boreholes and thereforeit is very important to check any design assumptions during construc-tion and to be prepared to come up with different solutions for stabi-lisation as the rock is exposed and structures identified and mapped(see Box 1-1).
4.2.2 Extent of ground investigation
A large part of any site investigation budget will generally be taken upin sub-surface investigation and characterisation of the ground
Site investigation 119

conditions (Items 3 and 4 in Box 4-1). Important questions are, howmuch ground investigation is required and how should it be done?There are no hard and fast rules, even though some authors try toprovide guidance on the basis of site area or volume for particulartypes of operation (e.g. Figure 4.1 for dredging) or on hypotheticalconsiderations (e.g. Jaksa et al., 2005). In reality, it depends upon thecomplexity of the geology at the site, how much is already knownabout the area, the nature of the project and cost. For sites with simplegeology, the plan might be for boreholes at 10m to 30m spacing, fordiscrete structures like a building (BS 5939: 1999). For a linearstructure like a road or railway project, the spacing might be anywherebetween 30 and 300m spacing, depending on perceived variability(Clayton et al., 1995). West et al. (1981) consider the particulardifficulties in planning investigations for tunnels. So muchdepends upon the depth of tunnel, the topography and variability ofgeology. Often, considerable reliance is made on aerial photographyinterpretation, geological mapping, a few widely spaced preliminaryboreholes and other boreholes targeted at particular perceived hazardssuch as faults that might be associated with poor quality rock andhigh water inflows. For example, Figure 4.2 shows the route of aplanned tunnel in Hong Kong, with potential hazards identified,together with a rationale for their mitigation and additionalGI. Where steeply dipping geological structures such as faults areanticipated, inclined boreholes may be required. Figure 4.3 shows an
Area to be dredged(million square metres)
2.0
1.5
1.0
0.5
Nub
er o
f bo
reho
les
to in
vest
igat
e gi
ven
area
60
50
40
30
20
100 2 4 6 8 10
Thickness of layer to be dredged, metres
Figure 4.1 Numberof boreholes fordredging area (inmillions of squaremetres) vs. averagethickness ofmaterial to beremoved, based onequation of Bates(1981), aspresented in PIANC(2000). Otherfactors that shouldbe taken intoaccount arevariability ofground conditionsand existingknowledge aboutthe area.
120 Practical Engineering Geology

assessment of possible conditions under the Eastern Tower ofStonecutters Bridge in Hong Kong at tender stage, based on deskstudy together with a proposed borehole investigation targeted atlikely faults and zones of deep weathering. Some broad details ofwhat was actually found are given in Fletcher (2004) and consequencesby Tapley et al. (2006).Requirements and practice for GI vary around the world. In
Hong Kong, for example, it is normal practice to put down a boreholeat the location of every bored pile (called a pre-drill). Elsewhere, apattern of perhaps three, four or five boreholes might be adoptedbelow each pile cap for a major structure. For example, for the2nd Incheon Bridge in South Korea, opened in 2009, for each of themain cable stay bridge towers there were four boreholes per pile cap,each of which was about 70 by 25m in plan and supported by 24large-diameter bored piles. For the Busan-Geoje fixed link crossing,completed in 2010, also in South Korea, there were two cable-staybridge sections, onewith two towers andmain span of 475m, the otherwith three towers. The towers were founded on gravity caissons sitting
Figure 4.2 Preliminary assessment of ground investigation requirements for a new tunnel,Hong Kong.
Site investigation 121
Complex geology: basaltintrusions and quartz
monzonite: deep weathering;extensive natural pipe system;fault encountered in nearby
tunnel
Passing underneathsubway tunnels;
possible fault
Tunnel in Grade IV/V rockbelow newly reclaimed areas
with high water pressure
Valleys with shallow rockcover and comparatively thick
soil mantle
Area ofreclamation
Complex geology: 3 inferredfaults, rock joints locally infilled
with kaolin and calcite andchlorite coated• Delay, water inflow and
settlement; difficult formation of shaft and launching TBM
• Instability, water inflow, delay and may affect existing subway tunnels• Further GI required• Ground pre-treatment• Instrumentation and close monitoring
• Instability, water inflow & delay; difficult formation of shaft and retrieving TBM
• Further GI required• Pretreatment and local pressure relief• Slurry mode excavation
Fault andbrecciated graniteidentified at tunneldepth in borehole;rock joints mainly
chlorite coated andcalcite infilled
Approximate line ofsea-bed depressionshown in Admiralty
chart of 1893 – maybeline of fault
fault encountered in nearbytunnel
sing underneathbway tunnels;ossible fault
Area ofreclamation
rock joints mainlychlorite coated and
calcite infilled
shown in Admiraltychart of 1893 – maybe
line of fault

on excavated rock (Chapter 6) and with plan dimensions of up to 40×20m. For each of these foundations, there were usually about sixboreholes, typically one put down at the conceptual stage, three forthe basic design and two for detailed design. For most of the otherviaduct piers with plan caisson dimensions of 17 × 17m, there werefrom one to five boreholes – less where the geology was better known,close to shore.Obviously, where the site reconnaissance, together with desk study
or findings from preliminary boreholes, indicate potentially complexand hazardous conditions, it may prove necessary to put down farmore boreholes. For the design of the new South West TransportCorridor near Brisbane, Australia, the preliminary investigation overa critical section of more than 500 m comprised five boreholes and afew trial pits, mostly along the centre line of the road. As the earthworks were approaching completion, minor landslides occurredat road level, together with some indications of deeper-seatedmovements. Over the next few months, an additional 70+ deepboreholes were put down, 56 trial pits and 54 inclinometers installed,despite almost 100% rock exposure in the cuttings (which was care-fully examined and mapped). This intensive investigation allowed thelandslide mechanisms to be identified in this very complex site and
Figure 4.3 Preliminary assessment of ground conditions by Halcrow for East Tower ofStonecutters Bridge, Hong Kong, and need for inclined boreholes to investigate major faultstructures.
122 Practical Engineering Geology
STONECUTTERSSIDE (East Tower)
LIKELY GROUNDINVESTIGATIONMETHODS
Rockhead profile• seismic traverses
sea level
Planneddrillholes
Tower forbridge
PiersExisting drillholes
Superficial deposits(fill, alluvium)and weak saprolite
Possiblerockheadprofile
• resisitivity• magnetic surveys• vertical drilling
• inclined, intersecting drilling• downhole geophysics• seismic tomography between boreholes
Suspected fault zone(from geomagneticsurvey)
Deep weathering?
Mapped fault zone
Low angle clay-filled thrusts?
Fault zones anddykes

remedial works to be implemented, which permitted the project to becompleted on time (Starr et al., 2010). In hindsight, the preliminaryboreholes, which would have been more than adequate for anormal stretch of road, gave no indication of the degree of difficultyand complexity at this unforgiving site, which only became clearfollowing intensive work involving a wide range of experts. In asimilar manner, the landslide at Pos Selim, Malaysia, described inChapter 7, could not have been anticipated from a few boreholes.The mechanism was at a very large scale and involved too manycomponents to have been understood before the major displacementsoccurred.As a general rule, at any site, at least one borehole should be put
down to prove ground conditions to a depth far greater than the depthof ground to be stressed significantly by the works. Generally, forfoundations, at least one borehole should be taken to at least 1.5times the breadth (B) of the foundation (Figure 4.4). For pile groups,it is generally assumed that there is an equivalent raft at a depth of 2/3Dwhere D is the length of piles and the ground should be proved to atleast 1.5B below that level. This is only a general guideline – if there isany reason to suspect more variable conditions and, where the geologyis non-uniform, one borehole will probably not be enough (Figure 4.5).Poulos (2005) discusses the consequences of ‘geological imperfections’on pile design and performance. Boreholes are often terminated oncerock has been proved to at least 5m, but this may be inadequate toprove bedrock in weathered terrain (Hencher & McNicholl, 1995).Whether or not one has reached in situ bedrock might be establishedby geological interpretation of consistent rock fabric or structureacross a site, but elsewhere it may be more difficult, in which case it
Figure 4.4 Criteria usually adopted for investigating the ground for foundations. Where geologyis or may be complex, ground conditions might need to be proved to greater depth and severalboreholes might be required. Similarly, these criteria do not apply or limit the need to considerparticular site hazards, such as slope stability above or below the site.
Site investigation 123
Widely spaced pads or strips Raft foundation Pile group
BBB
D
> 1.5B
> 1.5B
> 1.5B 2/3D
BBB
D
> 1.5B
> 1.5B
> 1.5B 2/3D

is best to take one or more boreholes even deeper if important to thedesign.
4.3 Procedures for site investigation
4.3.1 General
Guidance on procedures and methodologies for site investigation isgiven for the UK by Clayton et al. (1995) and for the USA andmore broadly by Hunt (2005). The British Code of Practice for SiteInvestigations, BS 5930 (BSI, 1999), provides comprehensive advice onprocedures and techniques and for soil and rock description forthe UK. Other codes exist for different countries (e.g. Australia,China and New Zealand). Generally, there is consistent advice overthe overall approach to site investigation, although terminology andrecommended techniques differ. All agree, however, that the first stepshould be a comprehensive review of all availablemaps and documentspertaining to a site – this is called a desk study.
4.3.2 Desk study
4.3.2.1 Sources of information
For any site, it is important to conduct a thorough document search.This should include topographic and geological maps. Hazard mapsare sometimes available. These include broad seismic zoning maps for
Figure 4.5Example ofsituations where asingle borehole (orfew boreholes)might missimportantinformation thatwill affect theintegrity of thestructure.
124 Practical Engineering Geology
B
Borehole meets usual criteria in terms of depth
Soft stratummissed byborehole(perhaps aslost core)
B

countries linked to seismic design codes. In some countries, there arealso local seismic micro-zoningmaps showing locations of active faultsand hazards such as liquefaction susceptibility. Sources of informationfor the UK are given in BS 5930 (BSI, 1999) and Clayton et al., 1995.The Association of Geotechnical and Geoenvironmental Specialists(AGS), whose contact details are given in Appendix A, also giveuseful advice and sources of reference. Records of historical miningactivity and previous land use are especially important. In the UK, theBritish Geological Survey (BGS) has made available a digital atlas ofhazards, including mining (but not coal), collapsible materials, swel-ling and compressible soils, landslides and noxious gas. Landslidehazard maps are published in the USA for southwest California andin Hong Kong, as discussed below.
4.3.2.2 Air photograph interpretation
Air photographs can be extremely useful for examining sites. Pairs ofoverlapping photographs can be examined in 3D using stereographicviewers, and skilled operators canprovidemany insights into the geologyand geomorphological conditions (Allum, 1966; Dumbleton & West,1970). Historical sets of photographs help to reveal the site develop-ment and to assess the risk from natural hazards such as landslides. InHong Kong, it is normal practice to set out the site history for any newproject through air photo interpretation (API) of sets of photos datingback to the 1920s. The role of API in helping to assess the groundconditions at a site is illustrated in Box 4-3.
Box 4-3 Role of air photo interpretation (API)
Overlapping air photos allows a skilled earth scientist to examine the site topography in three dimensions.According to Styles (personal communication), in order to do it well you must put yourself on the groundmentally and walk across the terrain looking around in oblique perspective. Topographic expression andother features such as the presence of boulders, hummocky ground, arcuate steps and vegetation, can beinterpreted in terms of terrain components and geomorphological development: landslide morphology,degree of weathering, and distribution of superficial deposits such as colluvium and alluvium. Broadgeological structure such as major joint systems, faults and folds, may be observed, interpreted andmeasured in a way that would be more difficult working only by mapping exposures on the ground(Figure B4-3.2).
Where landslides are identified on photographs, debris run-out can be measured, which may help inassessing the degree of risk for existing and future developments. River channels can be traced andcatchments measured. Where a series of historical photographs is available, an inventory of landslideevents can be compiled and related to historical rainfall records. Anthropogenic development and use ofsites can be documented.
It is important that API is checked by examination in the field and this is known as ground truthing,which is an integral part of site reconnaissance and field mapping. Similarly, interpreted site historyshould be checked and correlated against other documentary evidence such as oldmaps and photographs.The preliminary ground model developed from API and field studies can then be investigated further by
Site investigation 125

trial pits and boreholes, as necessary. Conversely, a ground investigation in an area of variable topo-graphy, without prior API, reconnaissance and desk study, may be ineffective and poorly focused. Anintroduction to the use of air photographs, with particular consideration of landslide investigations, isgiven by Ho et al. (2006).
Figure B4-3.1 Process of API. Pairs of overlapping photographs can be examined stereographically to givea 3D image. Major terrain features can be identified and if historical series of photographs are available,then land development and site history can be ascertained, in this example, in terms of landslide history. Inthe second image above, interpreted landslides have been mapped (with date of the photo in which thelandslide is first seen). These interpretations can then be checked in the field (Devonald et al., 2009).In addition, terrain can be split into units on the basis of surface expression, underlying geology, activity andvegetation, as described by Burnett et al. (1985). Third photo and overlay provided by K. Styles.
Figure B4-3.2 Major structural lineations visible in aerial photograph and controlling river developmentof Zambezi River above Victoria Falls between Zimbabwe and Zambia.
126 Practical Engineering Geology
Geomorophological interpretationof terrain units with associationconstraints and need for GI
Air photos used to interpret thenature of terrain, landslides andsite history
Victoria Falls

Even with little training, the importance of air photographs canbe immediately clear, as in Figure 4.6, which is an air photographfrom 1949 on to which has been marked the route of the ChingCheung Road in Hong Kong, constructed in 1963. Various groundhazards are evident in the photo (landslides and deep gulleying) andit is no surprise that these led to later problems with the road,as addressed in Chapter 7 and discussed by Hudson & Hencher(1984).Systematic interpretation of air photographs for determining
geotechnical hazards has been carried out in several countries.For example, the whole of Hong Kong was mapped, in terms ofperceived geotechnical hazard, from air photographs in the 1980sat a 1:20,000 scale and locally at 1:2,500 and, whilst neverintended for site-specific interpretation, these were very useful forurban planning (Burnett et al., 1985; Styles & Hansen, 1989). Airphotos can be used for detailed measurement by those trained to doso. Figure 4.7 shows displacement vectors for the slow-moving rocklandslide at Pos Selim, Malaysia. The 3D image was prepared fromas-built drawings and oblique air photographs taken from a heli-copter and linked to surveyed control points. The vectors produced(up to 15m drop in the rear scarp) are considered accurate to about0.2m. Topographic surveys can also be carried out using terrestrialor airborne LIDAR surveys and these can be repeated to monitorongoing movements in landslides or in volcanic eruptions(e.g. Jones, 2006). In some situations, especially for remote siteslacking good air photo coverage, satellite images may be helpful,although often the scale is not large enough to provide the detailedinterpretation required and stereo imagery is impossible – unlike forpurpose-flown aerial photograph sequences. Use of false spectral
Figure 4.6 Routeof Ching CheungRoad, Hong Kong,superimposed on1949 aerialphotograph (afterHencher, 1983c;Hudson &Hencher, 1984).
Site investigation 127

images such as infra-red can help interpretation, for example, ofvegetation and seepage.
4.3.3 Planning a ground investigation
BS 5930 and most textbooks on site investigation provide goodinformation on techniques and procedures but little advice on how toplan a ground investigation or on how to separate and characterisegeotechnical units within a geological model. They also say littleabout how to anticipate hazards, which is a key task for the engineer-ing geologist. It is important to take a holistic view of the geologicaland hydrogeological setting – the ‘total geological model’ approachof Fookes et al. (2000), as discussed in Chapter 3 – but thegeological data need to be prioritised to identify what is really impor-tant to the project and to obtain the relevant parameters for safedesign.The problem is that there are so many things that might potentially
gowrong at sites andwith alternatives for cost-effective design that it issometimes difficult to know where to start in collecting information.One might hope that simply by following a code of practice, thatwould be enough, but, in practice, the critical detail may be over-shadowed by relatively irrelevant information collected followingroutine drilling and logging methodology.One approach that can be useful for planning and reviewing data
from a ground investigation, and focusing on critical information, is to
Figure 4.7Visualisation of PosSelim landslide,Malaysia, showingdisplacementvectors over atwo-year period(after Malone et al.,2008).
128 Practical Engineering Geology

consider the different aspects of the site and how they might affect theproject in a checklist manner (Knill, 1976, 2002; Hencher & Daughton,2000; Hencher, 2007). The various components and aspects of theproject and how different site conditions might affect its successare considered one by one and in an integrated way. This is similarto the rock engineering systems methodology of Hudson (1992), inwhich the various parameters of a project are set out and their influ-ence judged and measured in a relative way (Hudson & Harrison,1992). This is also akin to the concept of a risk register for a civilengineering project at the design and construction stages, wherebyeach potential hazard and its consequence is identified and plansmade for how those risks might be mitigated and managed. This isaddressed in Chapter 6.The three verbal equations of Knill (1976) are set out in
Table 4.1. The first part is to consider geological factors: materialand mass strengths and other properties. The second is to assessthe influence of environmental factors such as in situ stress, waterand earthquakes. The final consideration is how these factorsaffect, and are affected by the construction works. A very similarprocess has been proposed for addressing risk by Pöschl &Kleberger (2004), particularly for tunnels.
4.3.3.1 Equation 1: geological factors
The first equation encourages the investigator to consider the groundprofile (geology) and its properties at both the material and mass scales.
Table 4.1 Engineering geology expressed as three verbal equations (after Knill, 1976).
Equation 1 GEOLOGY
MATERIAL PROPERTIES + MASS FABRIC ⇒ MASS PROPERTIES
The first equation includes the geology of the site and concerns the physical, chemical and engineeringproperties of the ground at small and large scales. It essentially constitutes the soil and rock groundconditions.
Equation 2 + ENVIRONMENT
MASS PROPERTIES + ENVIRONMENT ⇒ ENGINEERING GEOLOGICAL SITUATION
The second equation relates to the geological setting within the environment. Environmental factors includeclimatic influences, groundwater, stress, time and natural hazards.
Equation 3 + CONSTRUCTION
ENGINEERING GEOLOGICAL SITUATION + INFLUENCE OF ENGINEERING WORKS ⇒ENGINEERING BEHAVIOUR OF GROUND.
The third equation relates to changes caused by the engineering works such as loading, unloading andchanges to the groundwater levels. It is the job of the engineer to ensure that the changes are withinacceptable limits.
Site investigation 129

MATERIAL SCALE
The material scale is that of the intact soil and rock making up the site.It is also the scale of laboratory testing, which is usually the source ofengineering parameters for design. Typical factors to review are givenin Table 4.2. They include the chemistry, density and strength of thevarious geological materials and contained fluids making up the geo-logical profile. Hazards might include adverse chemical attack onfoundations or ground anchors, liquefaction during an earthquake,swelling or low shear strength due to the presence of smectite clays,abrasivity or potential for piping failure. Inherent site hazards asso-ciated with geology include harmful minerals such as asbestos anderionite. Granitic areas, phosphates, shale and old mine tailings aresometimes linked to relatively high levels of radon gas, which is esti-mated to cause between 1,000 and 2,000 deaths each year in the UK(Health Protection Agency). Talbot et al. (1997) describe investiga-tions for radon during tunnelling. Gas hazards are especially impor-tant considerations for tunnelling and mining but are also an issue forcompleted structures, as illustrated by the Abbeystead disaster of 1984when methane that migrated from coal-bearing strata accumulated ina valve house and exploded killing 16 people (Health and SafetyExecutive, 1985). These are all material-scale factors linked to thegeological nature of the rocks at a site.Locating sources for aggregate, armourstone and other building
materials is often a task for an engineering geologist. Other than theobvious considerations of ensuring adequate reserves and cost, onemust consider durability and reactivity, and this will involve geologicalcharacterisation and probably testing. Two examples in Chapter 7relate how adverse material properties of sourced fill and aggregatematerial led to severe consequences. At Carsington Dam, UK, a
Table 4.2 Examples of material-scale factors that should be considered for a projectFACTOR CONSIDERATIONS EXAMPLES OF ROCK TYPES/SITUATIONS
mineralhardness
mineralchemistry
abrasivity, damage todrilling equipment
reaction in concrete
oxidation – acids
swelling, squeezingdissolution
low friction
silica-rich rocks and soils (e.g. quartzite, flint, chert)
olivine, high temperature quartz, etc.
pyrites
mudrocks, salts, limestone
clay-infilled discontinuities, chlorite coating
loose, opentexture
collapse on disturbance oroverloading,liquefaction, piping, lowshear strength
poorly cemented sandstone, completely weatheredrocks (V); loess; quick clays
130 Practical Engineering Geology

chemical reaction was set up between the various rocks used to con-struct the dam, which resulted in acid pollution of river courses and theproduction of hazardous gas, with the death of two workers; atPracana Dam, Portugal, the use of reactive aggregate led to rapiddeterioration of the concrete. The latter phenomenon has beenreported from many locations around the world and is associatedwith a variety of minerals, including cryptocrystalline silica (sometypes of flint), high-temperature quartz, opal and rock types rangingfrom greywacke to andesite. Details of how to investigate whetheraggregate may be reactive and actions to take are given in RILEM(2003).
MASS SCALE
Mass-scale factors include the distribution of different materials in dif-ferent weathering zones or structural regimes, as successive strata or asintrusions. It includes structural geological features such as folds,faults, unconformities and joints (Table 4.3). Discontinuities verycommonly control the mechanical behaviour of rock masses andsome soils. They strongly influence strength, deformability and hydraulicconductivity.
Table 4.3 Examples of mass-scale factors that should be considered for a project
FACTOR CONSIDERATIONS EXAMPLES OF ROCK TYPESSITUATIONS
lithologicalheterogeneity
difficulty in establishing engineeringproperties, construction problems (plantand methodology)
colluvium, un-engineered fill,interbedded strong and weak strata, softground with hard corestones
joints/naturalfractures
sliding or toppling of blocks, deformation,water inflows, leakage/migration ofradioactive fluids
slopes, foundations, tunnels andreservoirs, nuclear repository
faults as joints, sudden changes in conditions,displacement, dynamic loads
tunnels, foundations, seismically activeareas
structuralboundaries,folds,intrusions
heterogeneity, local stress concentrations,changes in permeability – water inflows
all rocks/soils
weathering(mass scale)
mass weakening; heterogeneity (hard insoft matrix), local water inflow, unloadingfractures
all rocks and soils close to Earth’ssurface, especially in tropical zones;ravelling in disintegrated rockmasses
hydrothermalalteration
as weathering, low strength and prone tocollapse especially below water table
generally for igneous rocks especiallynear contacts
Site investigation 131

One of the main geological hazards to engineering projects at themass scale is faults. Faults can be associated with zones of frac-tured and weathered material, high permeability and earthquakes.Alternatively, faults can be tight, cemented and actually act asbarriers to flow, as natural dams rather than zones of high perme-ability. Faults should always be looked for and their influenceconsidered. There are many cases of unwary constructers buildingon or across faults, with severe consequences, sometimes leading todelays to projects or a need for redesign. Consequence is some-times difficult to predict but should be considered and investigated.Other examples of mass factors that would significantly affectprojects include boulders in otherwise weak soil, which mightpreclude the use of driven piles or would comprise a hazard on asteep slope.An example of where a formal review of the potential for large-
scale structural control might have helped is provided by the inves-tigation for a potential nuclear waste repository at Sellafield in theUK, as explained in Box 4-4. It appears that early boreholes and testsdid not sample relatively widely spacedmaster joints within the stratumand, therefore, an incomplete picture was formed of the factors con-trolling mass permeability. In hindsight, the true nature of the rockmight have been anticipated by desk study and field reconnaissance ofexposures.
Box 4-4 Anticipating mass characteristics: the Brockram and the SellafieldInvestigations
The UK Government specification for acceptable risk from any nuclear waste repository was set to beextremely onerous and necessitated intensive investigation combined with intensive modelling.Ground investigation has been conducted at Sellafield, Cumbria, since 1989, aimed at determiningwhether or not the site is suitable as a repository for radioactive waste. The target host rock is theBorrowdale Volcanics at a depth of more than 500m. Part of the modelling has involved trying topredict groundwater flow and the movement of radio-nucleides. For this, a good ground model wasnecessary with estimates of permeability for the full rock sequence. Several high-quality boreholeshave been put down at the site and logged very carefully. A general model has been developed, asillustrated in Figure B4-4.1 (ENE is to the right). The geological model has the Borrowdale Volcanics,which contain saline water, separated from the overlying sandstones, containing fresh water, by a bedcalled the Brockram, which is typically 25–100m in thickness and cut by faults. The Brockram andassociated evaporites and shale further west evidently play a very important potential role as a barrierto flow of groundwater (flow into the repository) and, hence, radio-nucleides migrating away from therepository.
Early modelling
For most early numerical simulations, the Brockram was modelled with very low conductivity(2 × 10⁻¹⁰ to 1 × 10⁻⁹ m/s), based largely on borehole tests and ‘expert elucidation’ (Heathcote et al.,
132 Practical Engineering Geology

1996). These values are similar to those measured for the Borrowdale Volcanics – 50% measuredover 50m lengths, with conductivity < 1 × 10⁻¹⁰ m/s, according to Chaplow (1996).
Later tests
At a later stage, field tests were carried out that yielded ‘significant flows’ in the Brockram, and the earliermodelling had to be revised. Michie (1996) reports hydraulic conductivity measurements within theBrockramwith amaximumof 1 × 10⁻⁵m/s, i.e. four orders ofmagnitude higher than adopted for the earlymodels.
A surprise?
The changed perception for this important stratum might be considered just part of what is to beexpected in any progressive ground investigation. However, the potential for locally high perme-ability associated with extremely widely spaced and persistent joints, at spacing such that they willbe rarely sampled in boreholes, could have been anticipated, partly because such joints can beobserved directly at exposures in the Lake District. At Hoff’s Quarry to the east of the LakeDistrict, the rock can be examined, and at a material scale a low permeability would be anticipated(Figure B4-4.2).
However, at a larger scale, the rock at Hoff can be seen cut by near-vertical master joints whichwould affect the mass permeability in a dramatic way (as evidenced from the Sellafield test).Therewere also indications from the literature that the Brockram might be permeable at a scale ofhundreds of metres. For example Trotter et al. (1937) commented on the possibility of pathwaysthrough the Brockram, with reference to the distribution of haematite mines within theCarboniferous Limestone underlying the Brockram.
Lessons: it is very important not simply to rely on site-specific data when elucidating parametersfor design. There is a need to consider the geological setting, origins and history – with all thatentails – as per the ‘total geological approach’ advocated by Fookes et al. (2000). Furthermore,when looking at data from boreholes, especially ones with a strong directional bias, one shouldconsider all the field evidence that might offer some clues as to the validity of the expert elucidationprocess.
Figure B4-4.1 Cross section across the potential repository zone, showing basic geology and directions offlow (modified from Chaplow, 1996).
Site investigation 133
Potential Repository Zone
Borrowdale Volcanics
Brockram
-1, 500 m
-1,000 m
-500 m
O.DCalder and St Bees Sandstones Fresh Water
Saline Water

Figure B4-4.2 Close up of Brockram rock, at Hoff’s Quarry, Vale of Eden, UK. The rock isa cross-bedded, limestone-rich, well-cemented breccia. It contains fossiliferous blocks ofCarboniferous Limestone as well as more rare rocks such as Whin Sill dolerite. It has theappearance of a wadi-type deposit – poorly sorted, probably rapidly deposited by flashfloods. From field assessment, it has a low permeability at the material scale. Lens cap (58mm)for scale.
Figure B4-4.3 More distant view of Brockram at Hoff’s Quarry. Note the fully persistent, near-verticalmaster joints about 40m apart, which will control mass permeability. Evidently joints from this set wouldonly be intersected using inclined rather than vertical boreholes.
134 Practical Engineering Geology

4.3.3.2 Equation 2: environmental factors
Environmental factors, some of which are listed in Table 4.4, includinghydrogeological conditions, should be considered part of the groundmodel for a site, but are best reviewed separately from the basicgeology, although the two are closely interrelated. The environmentalfactors to be accounted for depend largely on the nature, sensitivityand design life of structures and the consequence of failure. It is usualpractice to design structures to some return period criterion such as a 1in 100 year storm or 1 in 1,000 year earthquake, the parameters forwhich are determined statistically through historical review. In somecases, engineers will also want to know the largest magnitude eventthat might occur, given the location of the site and the geologicalsituation. Then some thought can be given as to whether or not it ispossible to make some provision for that maximum credible event. Forearthquakes, for example, a structure might be designed to behave
Table 4.4 Examples of environmental factors that should be considered for a project
FACTOR CONSIDERATIONS EXAMPLES OF ROCK TYPESSITUATIONS
in situstresses
high stress:squeezing,overstressing,rockbursts
low stress:open fractures,high inflows,roof collapse in tunnels
mountain slopes and at depth, shield areas,seismically active areas
extensional tectonic zones, unloaded zones,hillside ridges
natural gases methane, radon coal measures, granite, black shales
seismicity design loading, liquefaction, landslides seismically active zones, high consequencesituation in low seismic zones
influenced byman
unexpectedly weak rocks, collapsestructures
gases and leachate
undermined areas
landfills, industrial areas
groundwaterchemistry
chemical attack on anchors/nailsfoundations/materials
acidic groundwater, salt water
groundwaterpressure
effective stress, head driving inflow,settlement if drawn down
all soils and rocks
ice ground heave, special problems inpermafrost/tundra areas, freeze-thawjacking and disintegration
anywhere out of tropics
biogenicfactors
physical weathering by vegetation,rotted roots leading to piping,insect attack
near-surface slopesweathered rockscausing tree collapse
Site investigation 135

elastically (without permanent damage) for a 1 in 1,000 year event butfor a, very unlikely, maximum credible event, some degree of damagewould be accepted.The factors to review at this stage include natural hazards such as
earthquake loading, strong winds, heavy rain and high groundwaterpressures or flooding. Anthropogenic factors to consider includeindustrial contamination and proximity of other structures and anyconstraints that they may impose.
4.3.3.3 Equation 3: construction-related factors
The third verbal equation of Knill & Price (Knill, 2002) addresses theinteraction between the geological and environmental conditions at asite and the construction and operation constraints (Hencher &Daughton, 2000). Excavation will always give rise to changes in stresses,and the ground may need to be supported. Excavations may also resultin changes in groundwater, and the consequences need to be addressedand mitigated if potentially harmful. Similarly, loading from struc-tures has to be thought through, not only because of deformations butalso because of potentially raising water pressures, albeit temporarily.There will also be hazards associated specifically with the way the
project is to be carried out. For example, a drill and blast tunnel is verydifferent to one excavated by a tunnel boring machine and will havespecific ground hazards associated with its construction (Chapter 6).Similarly, the construction constraints are very different for boredpiling compared to driven piles (Table 4.5). The systematic reviewand investigation of site geology and environmental factors, discussedearlier, needs to be conducted with specific reference to the project athand. This will hopefully allow the key hazards to be identified anddesign to be robust yet cost-effective. Nevertheless, models are alwayssimplifications, and the engineer must adopt a cautious and robustapproach when designing, especially where the geological conditionsare potentially variable and where that variability might cause diffi-culties, as illustrated by the case of a tunnel failure reported inChapter 7 (Grose & Benton, 2005).
Table 4.5 Examples of the influence of engineering works
FACTOR CONSIDERATIONS
loading/unloading –
static/dynamicsettlement, failure, opening of joints, increased permeability in cut slopes,blast vibrations
change in water table increased or decreased pressure head, change in effective stress, drawdownleading to settlement, induced seismicity from reservoir loading
denudation or landclearance
increased infiltration, erosion, landsliding
136 Practical Engineering Geology

4.3.3.4 Discussion
It is evident that site investigation cannot provide a fully detailedpicture of the ground conditions to be faced. This is particularly truefor tunnelling, because of the length of ground to be traversed, thevolume of rock to be excavated and often the nature of the terrain,which prevents boreholes being put down to tunnel level or makestheir cost unjustifiable. Instead, reliance must be placed on engineeringgeological interpretation of available information, prediction on thebasis of known geological relationships and careful interpolation andextrapolation of data by experienced practitioners. Factors crucial tothe success of the operation, need to be judged and consideration givento the question: what if? It is generally too late to introduce majorchanges to the methods of working, support measures, etc. at theconstruction stage, without serious cost implications.Site investigation must be targeted at establishing those factors that
are important to the project and not to waste money and time inves-tigating and testing aspects that can be readily estimated to an accep-table level or aspects that are simply irrelevant. This requires a carefulreview of geotechnical hazards, as advocated above. Even then, onemust remain wary of the unknowns and consider ways in whichresidual risks can be investigated further and mitigated, perhapsduring construction, as addressed in Chapter 6.There is a somewhat unhealthy belief that standardisation (for
example, using British Standards, Eurocodes, Geoguides and ISRMStandard Methods) will provide protection against ground conditionhazards. Whilst most standards certainly encompass and encouragegood practice, they often do so in a generic way that may not always beappropriate to the project at hand and they may not provide specificadvice for coping with a particular situation. Ground investigations areoften designed on the basis of some kind of norm – a one-size-fits-allapproach to ground investigation. It is imagined that a certain numberof boreholes and tests will suffice for a particular project, essentiallyirrespective of the actual ground conditions at the site. This ignores thefact that ground investigations of average scope are probably unneces-sary for many sites but will fail to identify the actual ground conditionhazards at rare, but less forgiving sites. Similarly, an averaging-typeapproach will mean that many irrelevant and unnecessary samples aretaken and tested whilst themost important aspects of a site are perhapsmissed or poorly appreciated. This is, unfortunately, commonplace.If the hazards are considered in a systematic way, as discussed
earlier, then the risks can be thought through fully and this willhelp the ground investigation to be better focused. The process isillustrated in Box 4-5 for a hydroelectric scheme involving theconstruction of a dam, reservoir, power station and associatedinfrastructure.
Site investigation 137

Box 4-5 Planning a site investigation for a newhydroelectric scheme
Project concept: high arch dam with high-pressure penstock tunnels (120m hydraulic head)leading to underground power house, tailrace tunnels and surge chamber. Structures to beconsidered include reservoir, ancillary buildings, roads, power lines and diversion tunnel.Sources of concrete aggregate need to be identified, as well as locations for disposing constructionwaste.
General setting: valley with narrowing point suitable for arch dam (high stresses). Topography andhydrology adequate for reservoir capacity. Steep slopes above reservoir.
Geology from preliminary desk study: major fault along valley, maybe more. Right abutment(looking downstream) in granitic rock, sometimes deeply weathered. Left side, ancient schist,greywacke, mudstone and some limestone. Folded and faulted with many joints. Alluvial sedimentsalong valley.
Key issues for investigation:
Dam: stability of foundations and abutments, settlement, leakage, overtopping from landslide intoreservoir, silting up.
Tunnels and powerhouse: rock quality, in situ stress state, construction method, stability, lining andsupport requirements.
Reservoir: leakage, siltation, water quality.
Construction: source of aggregate, waste disposal, access, river diversion.
Figure B4-5.1 Schematic model of site for new hydroelectric scheme with some of the most importanthazards that need to be quantified during the site investigation.
138 Practical Engineering Geology
EnvironmentalIssues
earthquakes
high pressuretunnelsconstructionstabilitylining
timex.. storms
abutmentfailure
hazards oflandslide intoreservoir
quality of watersedimentation
water leakage from reservoir
dam construction-aggregate source?-waste disposal
stressed zone
piping failure
waterpressure
faultactive?
σ1
σ3σ2
sliding failureleakage
load from dam
in situ stressstate−important forhigh pressuretunnels andundergroundchambers

4.4 Field reconnaissance and mapping
4.4.1 General
At many sites, geologists can get a great deal from examining thelandscape, mapping and interpolating information from exposures,and this is one of the most important aspects of geological educationand training. This, together with desk study information, should allowpreliminary ground models to be developed, which can then be used to
Main geotechnical considerations when conducting site investigation
Issues Equation 1 Equation 2 Equation 3
Geology Environment Construction
Material Mass
Arch damstability andconstruction
Strength, deformability anddurability of foundation materials,including highly stressed abutments
Geological profile, depth to bedrockPresence of discontinuities, allowingfailure in abutments or slidingfailure below damFault reactivation
SeismicityWater pressurein foundationsand abutmentsCheck historyof mining
Adequatesource of non-reactiveaggregateWaste disposallocations (fillembankments)
Leakagebelow damand fromreservoir
Permeability (need for grouting/cutoffs)Potential for piping
Leakage on main fault and otherfaults/weathered zonesLimestone might be karstic
Groundwaterprofile insurroundingterrainExistingthroughflowpaths
Options forgrouting and/orcut-offstructures
Landslidesinto reservoir
Material strength Adverse discontinuities, aquitardscausing perched water pressure todevelopLandslide history
Response ofgroundwaterto storms andto lowering ofwater inreservoirSeismicloading
Need forstabilisationsuch asdrainage oroption toremovehazardousground
Powerhouseand high-pressuretunnels
Rock strength Abrasivity for tunnelequipment
Fracturing (rock mass classificationallows judgement of stabilisationrequired) Weathered zones
In situ stressstate (potentialsqueezing orleakage andneed for steelliners)Groundwaterpressure andpermeability(inflows orwater loss foroperatingtunnels)
Method ofexcavationGroundmovement dueto excavationBlastingvibrationGroundwaterchanges
Site investigation 139

form the basis for planning any necessary ground investigation. Thepreliminary model should allow an initial layout of the components ofthe project and, for buildings, some insight into the types of foundationthat might be required. For tunnels, decisions can be made on locationsfor portals and access shafts. The degree to which walk-over studies andfield mapping can be cost-effective is often overlooked, as illustrated bya case example in Box 4-6.
Box 4-6 Case example: cost-effectiveness of sitereconnaissance – bridge abutment, Lake District, UK
The first ground investigation that the author was involved with was for a bridge abutment in the LakeDistrict, UK. Figure B4-6.1 is a view of the rock cliff that was to form the abutment, and halfway down thecliff is a platform. Figure B4-6.2 is a side view of the platform. The man in the middle of the photograph islogging a borehole, using a periscope that has been inserted into a hole, inclined at about 45 degrees,drilled into the rock from the same platform. In the foreground, rock can be seen with a fabric dippingroughly parallel to the cliff. For reasons that are unimportant now, a question arose regarding thegeological structure being logged by the periscope.
The site engineer was asked for his geological map of the rock along the river (including the 100%exposed cliff). He replied, ‘what map?’
Figure B4-6.1 Drilling platform on cliff.
140 Practical Engineering Geology

There we were, perched on a precarious and extremely expensive platform. A drilling rig had beenbrought in and lowered down the cliff to drill an inclined borehole of perhaps 73mm diameter, at greatcost, and we had been brought to the site from London to log the hole using a periscope. Meanwhile,the full rock exposure was available to be mapped and interpreted at very little cost, which would haveallowed a much better and more reliable interpretation of the geological structure than was possiblefrom a single borehole.
Lesson: Use the freely available information first (desk study and walk-over/mapping) before decidingon what ground investigation is necessary at a site.
Mapping can be done in the traditional geological manner, usingbase maps and plans, or on air photographs, which may need to berectified for scale. Observations such as spring lines (Figure 4.8) are notonly important in delineating probable geological boundaries but alsoin their own right for hydrogeological modelling. Observation pointscan bemarked in the field, to be picked up accurately later by surveyors.Alternatively, locations can be recorded by GPS and input directly intoa computer, as illustrated in Figure 4.9. The success of preliminarymapping can be enhanced by letting an early contract to clear vegeta-tion, allow safe access and to put down trial pits and trenches on theinstruction of the mapping geologist (Figure 4.10).Soils and rock can be examined, described and characterised in
natural exposures and in trial pits and trenches, and full descriptionsshould be provided, as discussed later. Samples can be cut by hand fortransfer to the laboratory, with relatively slight disturbance(Figures 4.11 and 4.12).Access can be facilitated by using hydraulic platforms or by tempor-
ary scaffolding (Figure 4.13). Trial pits and trenches should not beentered unless properly supported, and caremust be taken in examiningany steep exposure; as a general rule, for safety reasons, field workshould be conducted by teams of at least two people.
Figure B4-6.2 Borehole periscope in use.
Site investigation 141

Apart from the general benefits to be gained from mapping freelyavailable or cheaply created surface exposures to determine localgeology, they are particularly important for characterising aspects ofrock structure such as roughness and persistence of discontinuities,which cannot be determined in boreholes. As for all measurements,however, extrapolation should only be made with caution and withawareness that structure and rock quality may change rapidly fromlocation to location (Piteau, 1973). Exposed soil may be desiccated andstronger than soil at depth; exposed rock will often be more weatheredwith closer and more persistent fractures than rock only a few metresin from the exposed surface.
Figure 4.8 Springline revealedfollowing heavyrain at base ofCarboniferousLimestone, north ofKilnsey Crag, WestYorkshire, UK.
Figure 4.9 Hand-held computer withortho-corrected airphotographs andterrain maps, usedto locate and mapnatural terrainlandslide. GPS usedto get accuratelocations ofidentified features.
142 Practical Engineering Geology

Information gained from desk study and site reconnaissance can beanalysed and draped over 3D digital models using GIS, as illustrated inFigure 4.14, which greatly assists visualisation, interpretation andplanning of GI, including access.
4.4.2 Describing field exposures
The task of describing a large field exposure, say in a cut slope, can bedaunting, and the following procedure is recommended. The exposure(natural or man-made) should be split initially into zones, layers orunits, by eye. The primary division will often be geological, i.e. rockand soil units of different age, but then differentiated by rock or soilmass quality such as degree of weathering or closeness of fracturing.Differentiation on strength can be made quickly by simple index testssuch as hitting or pushing in a hammer. The split might be on structuralregime, i.e. style and orientation of discontinuities. The process is
Figure 4.10 Locallabourers employedto dig some trialpits duringpreliminary fieldmapping. TlemcenUniversity andHospital site,Algeria.
Site investigation 143

Figure 4.11 Handtrimming a sampleto size in the field,for transportationto laboratory andtriaxial testing.
(a) (b)
Figure 4.12 (a) Block sample cut into grade IV weathered sedimentary rock and transported to thelaboratory. (b) The sample trimmed by hand to fit into a Leeds direct shear box.

illustrated in Figure 4.15. Once the broad units or zone boundarieshave been identified, then each needs to be characterised by systematicdescription and measurement, as shown schematically in Figure 4.16.Evidence of seepage should be noted; lush vegetation can be indicativeof groundwater. The distinction between engineering geological map-ping and normal geological practice is the emphasis on characterisingunits in terms of strength, deformability and permeability, rather thanjust age (Dearman & Fookes, 1974).Some of the equipment that might be used in field characterisation of
exposures includes safety harness, tapemeasures, hammer, knife, handpenetrometer, Schmidt hammers (type N and L), compass/clinometer
Figure 4.13 Cherrypicker platformused to examinerecently failed rockslope to allowremedial action tobe determined,Hong Kong.
Figure 4.14Surface geologydraped ontotopographicrepresentation, forassessment of newroad.
500
0
816000
815500
815000
814500
814000
813500
813000
8125
00
8120
00
8115
00
8110
00
8105
00 8110
0081
1500
8120
0081
2500
8130
0081
3500
8140
00
Site investigation 145

Figure 4.15Approach tocharacterise rockmass. First stage isto split into units byeye. Units/zoneswill be used in lateranalysis and design.
Figure 4.16 Oncethe broad units/layers have beenidentified, eachneeds to becharacterised.
How to start to describe?
?1
2
3
4
5
Stand back, split into zones or units by eye, thencharacterise each one separately.During characterisation, on close examinationyou might well need to refine or change youroriginal differentiation. Might split on:
- geology (dykes/sills separately)- colour- degree of weathering- percentage of included boulders-jointing style-perceived hazards
How to start to describe?
?1
2
3
4
5
Stand back, split into zones or units by eye, thencharacterise each one separately.During characterisation, on close examinationyou might well need to refine or change youroriginal differentiation Might split on:
1. FIRST SPLIT EXPOSURE INTO UNITS
3. DESCRIBE EACH MATERIAL IN EACH UNIT (as appropriate)
2. WITHIN EACH MAPPABLE UNIT
ColourColour codes asappropriate
Textures/fabricParticle size distribution
Slake test
Infiltration test
Degree ofmicrofracturing
ScratcheabilityDecomposition grade
• Geological origin
• Geology
• Weathering grades• Other characteristics such as seepage, vegetation, hazards
• Percentage corestones/ boulders• Jointing style and intensity; structure including faults, folds
• Shape, size and distribution of coarse fraction• Jointing pattern, structures (characterise these)
• Where heterogeneous, the proportion of fine fraction to coarse fraction
Field tests (hammer,knife)Schmidt hammerPenetrometer; vane
Grain size
Strength
Cohesion
Permeability
ChemicalDecomposition
MechanicalDecomposition

and hand lens. Water and a container are useful for conducting indextests such as slake tests and for making estimates of soil plasticity andgrading. Where appropriate, strength can be measured using suchtools as a hand vane, and point load testing, which can be carriedout on irregular lumps of rock. Whatever measurements are taken atexposures, the end user needs to be aware that it may be inappropriateto extrapolate properties because of the effects of drying out orsoftening from seepage and possibly the effects of weathering.Guidance on geological mapping and description is given in a five-
volume, well-illustrated handbook series by the Geological Society ofLondon, which deals with Basic Mapping, the Field Description ofIgneous, Sedimentary and Metamorphic Rocks (referenced inChapter 3) and Mapping of Geological Structure, each with morethan 100 pages (www.geolsoc.org.uk). Much of the detail that couldbe recorded by a geologist, however, might prove irrelevant to anengineering project, but what is or is not important might not beimmediately obvious. It is worth bearing in mind the observation ofBurland (2007):
‘It is vital to understand the geological processes and man-made activ-ities that formed the ground profile; i.e. its genesis. I am convinced thatnine times out of ten, the major design decisions can be made on thebasis of a good ground profile. Similarly, nine failures out of ten resultfrom a lack of knowledge about the ground profile.’
Despite this observation, current standards codes and textbooks deal-ing with ground investigation tend to take a very simplified, prescrip-tive, formulaic approach in their recommendations for the descriptionof geological materials and structure. The reason dates back to the1960s when Deere (1968) noted that:
‘Workers in rock mechanics have often found such a classificationsystem [geological] to be inadequate or at least disappointing, in thatrocks of the same lithology may exhibit an extremely large range inmechanical properties. The suggestion has even been made that suchgeologic names be abandoned and that a new classification system beadopted in which only mechanical properties are used.’
Deere went on to introduce classifications based on compressivestrength and elastic modulus and the Rock Quality Designation(RQD),andtheseorsimilarclassificationsarenowusedalmostexclusivelyfor logging rock core, with geological detail rarely recorded.Deere at the same time noted, however, ‘the importance to consider
the distribution of the different geologic elements which occur at thesite’. This sentiment would have been supported by Terzhagi (1929),some of whose insightful observations on the importance of geologicaldetail are revisited by Goodman (2002, 2003). Restricting geological
Site investigation 147

description to a few coded classifications, as in industry standards, isover-simplistic but it is a fine balance between providing too muchgeological information and too little.Generally, GI loggers tend to provide minimal summary descrip-
tions, as per the examples given in BS5930 and other standards, andavoid commenting on unusual features, although it varies from com-pany to company and, of course, the knowledge and insight of thelogger. Some guidance on standard logging is given in Appendix C andexamples of borehole logs are provided in Appendix D and discussedlater. Fletcher (2004) providesmany examples of the kind of geologicalinformation that can be obtained from logging of cores for engineeringprojects, most of which would be missed if following standard guide-lines for engineering description and classification.There is much to be said for the engineer informing theGI contractor
of his preliminary ideas regarding the ground model, based on deskstudy and reconnaissance, so that the contractor knows what to lookfor and can update the model as information is gained.Rock exposures are particularly important for characterising fracture
networks. Orientations are usually measured using a compass clin-ometer, as illustrated in Figure 4.17, with different diameter platesused to help characterise the variable roughness at different scales(Fecker & Rengers, 1971). Electronic compass/clinometers are under
Figure 4.17 Jointsurvey underwayusing Clar compassclinometer attachedto aluminiumplates.Investigation forGlensanda SuperQuarry, Scotland.
148 Practical Engineering Geology

development, which will avoid the need to level the instrument, whichcan be difficult, especially in the underground mapping of tunnels.Data are usually collected by systematic scan-line or window sur-
veys but these are tedious to carry out, seem to be routine to theunknowledgeable, and therefore sometimes delegated to junior staffwho may be unable or reticent to exercise independent judgement onwhat is or is not significant. Such surveys can give a false impression ofrigorous characterisation, whilst the important element of geologicalinterpretation, best done in the field, is lacking. Experienced engineer-ing geologists with training in structural geology should be able toassess the rock conditions by eye, both with respect to the geologicalconditions and potential for instability in a slope, and therefore cancarry out a subjective survey (Figure 4.18). The recommendedapproach for collection and interpretation of discontinuity data fromrock exposures is set out in Box 4-7.
Figure 4.18Distinctionbetween objectivesurveys (line/window) andsubjective surveys(from Hencher,1987).
a
db
SYSTEMATIC
Window survey
g
fc
e
Line survey
ab
SUBJECTIVE
Data collected systematically for all discontinuities intersected along line of survey or within window
d g
ec f
Potential for wedge and planar failures identified in field and data collected specifically for those adverse joints
Site investigation 149

Box 4-7 Collection of discontinuity data in exposures (modified fromHencher &Knipe, 2007)
1. First take an overview of the exposure. Examine it from different directions.2. Develop a preliminary geological model and split it into structural andweathering zones units. Sketch
the model.3. Broadly identify those joint sets that are present, where they occur, how they relate to geological
variation and what their main characteristics are, including spacing, openness as mechanicalfractures (or otherwise), roughness, infill and cross cutting or terminations in intact rock or againstother discontinuities. Surface roughness characteristics such as hackle marks should be noted as theseare indicative of origin and help differentiate between sets.
4. Measure sufficient data to characterise each set geologically and geotechnically. Record locations onplans and on photographs. This might be done using line and window surveys but quite often these aretime consuming and not very productive. It is generally best to decide what tomeasure and thenmeasureit, rather than hope that the answer will be revealed from a statistical sample.
5. Plot data and look at geometrical relationships. Consider how the various sets relate to one anotherand to geological history as evidenced from faults, folds and intrusions (Chapter 3).
6. Search for missing sets that might have been expected given the geological setting.7. Analyse and reassess whether additional data are required to characterise those joints that are most
significant to the engineering problem.
Where the data collection point is distant from the project location, consider whether the collected datamight be unrepresentative.
Remote measurement of fracture networks is becoming more reliableusing photogrammetry (Haneberg, 2008) or ground-based radar(Figure 4.19) and research is progressing into the automatic interpretationof laser-scanned data into rock sets (orientation and spacing) (Slob, 2010).Currently, this approach, however, lacks any link to an interpretation oforigin of the discontinuities and their geological inter-relationships(Chapter 3), which would make it much more valuable. In the author’sopinion, probably the best use for laser scanning at themoment is as an aidto the field team, in particular for measuring data in areas of an exposurewith difficult access, but they cannot replace mapping and characterisa-tion by experienced persons at the current stage of development.Rock joint data are generally represented on stereographic projections,
as illustrated in Figure 4.20. The technique allows sophisticated analysis ofgeological discontinuity data (Phillips, 1973), but its most common use inengineering geology is for determining the potential for specific rockdiscontinuities to cause a failure in a cut slope or in an undergroundopening (Hoek & Bray, 1974 and Chapter 6). Plotting of data, statis-tical grouping and comparison to slope geometry is now easily doneusing software such as Dips (Rocscience), but care should be taken ininterpretation and especially against masking important but relativelyrare data (Hencher, 1985). Bridges (1990) demonstrates the importanceof differentiating sets on the basis of geological characteristics ratherthan just geometry.
150 Practical Engineering Geology

4.5 Geophysics
Geophysical techniques are used to identify the disposition of soiland rock units, based on differences in physical properties suchas strength, density, deformability, electrical resistance andmagnetism. They can sometimes be used successfully to identifycavities such as mine workings or solution hollows and foridentifying saturated ground. Geophysics really comes into itsown for offshore investigations where drilling is very expensive.Geophysics can provide considerable information on geologicalstructure and rock and soil mass quality, which is relevant toengineering design, although such techniques are rarely used bythemselves but as part of a wider investigation involving bore-holes. Many engineering geologists and geotechnical engineershave both good and bad experience of engineering geophysics.Darracott & McCann (1986) argue that poor results can often beattributed to poor planning and the use of an inappropriatetechnique for the geological situation. More specifically, keyconstraints are:
� penetration achievable� resolution� signal-to-noise ratio, and� lack of contrast in physical properties.
Figure 4.19 Ground-based radar being used to generate a digital image of cut slopes near Seoul,Korea. Point clouds can be used to measure discontinuity geometry remotely.
Site investigation 151

When geophysics works well, the results can be extremely useful andthe method cost-effective. The main options and constraints are set outin BS 5930: 1999 and Clayton (1995).
4.5.1 Seismic methods
Seismic refraction techniques, using an energy source ranging from asledgehammer to explosives, can be useful on land and in shallowwater for finding depth to bedrock, for example, to identify buriedchannels that could otherwise only be proved by numerous boreholesor probes. Large areas can be investigated quite cheaply and quickly.The method works best where there is a strong contrast in seismic
discontinuity dipping 54 degrees in a 240 direction
N(a)
Oblique view across hemisphere with intersecting planar feature
reference sphere(lower hemisphere)
E
S
W
direction of dip (240)
trace of intersection where plane cuts hemisphere
dipping plane
projection of pole into horizontal plane
projection of trace into horizontal plane
direction of dip
(b)
Side view along strike of plane
pole normal to planetrace of plane
N Horizontal plan view
(c)
⋅ pole to plane
90° measured on reference net
projection of complete trace as a ‘great circle’
angle of dipmeasured on reference net
direction of dip
Npole to great circle 1pole to great circle 2
⋅⋅28°
Sliding directionfor a wedge formed by two planes(d)
Angle of inclination for line of intersection between planes great circle
for plane 150/238
great circle for plane 230/290
Figure 4.20 Representing discontinuity data as great circles or as poles (after Hencher, 1987).
152 Practical Engineering Geology

velocity between the overlying and underlying strata and some knowl-edge of the geological profile, preferably from boreholes. Otherwise,results will be ambiguous. Where weak (low velocity) strata underliestronger materials, these may not be identified by seismic survey.Wavevelocity (compressive and shear) can be interpreted directly in terms ofrock mass quality, deformation modulus and ease of excavation, asreviewed comprehensively by Simons et al. (2001). Seismic reflection isa key technique in offshore investigations.
4.5.2 Resistivity
Resistivity is another cheap and rapid method that can prove veryeffective, particularly in identifying groundwater (low resistance) andvoids (high resistance). The technique has been used successfully in theinvestigation of landslide profiles, in particular for identifying water-bearing strata at depth. Figure 4.21 shows the results of a resistivitysurvey in Hong Kong to identify underground stream channels aszones of high resistance (voids), which it did extremely well (Hencheret al., 2008).
4.5.3 Other techniques
There are a host of other techniques reported in the literature, withvarious success rates. Ground-based radar can be useful for findingshallow hidden pipes, etc. Other techniques such as magnetic andmicro-gravity rely on particular physical properties of the rock orfeature being searched for. Both have been used for locating old mine
Figure 4.21 Digital image interpretation of resistivity surveys across hillside above Yee King Road,Hong Kong. Tubular features of low resistivity are interpreted as underground streams (Hencheret al., 2008).
Site investigation 153
Borehole locations
Road
Underground streams

shafts – because the brick lining might have a magnetic signature andthe void is low gravity. Generally, such techniques are used as a firstpass across a site to identify any anomalies, which are then investigatedmore fully using trial pits, trenches and boreholes. For such investiga-tions, percussive holes, as used for forming holes for quarry blasting(no coring), can be very quick and relatively cheap – the presence ofvoids is indicated by lack of resistance to drilling and loss of flushingmedium. The voids can later be examined using TV cameras, peri-scopes or sonic devices to try to quantify size and shape. For manyreasons, such surveys are not always successful and therefore are not tobe relied upon to give a definitive answer (Clayton et al., 1995). Sewellet al. (2000) demonstrate the usefulness of marine magnetic andgravity surveys for identifying geological structures.
4.5.4 Down-hole geophysics
As with seismic reflection, down-hole geophysics is used routinely inoil and gas exploration, in mining and in sophisticated GI linked tonuclear waste disposal studies. Tools can be used to determine minorstratigraphic contrasts and rock properties. These tools are less usedfor engineering, with the exception of rock joint orientation (usingcameras and geophysical tools) and sometimes for identifying clay-richlayers. These tools are discussed below, together with logging anddescription.
4.6 Sub-surface investigation
Methods and techniques for sub-surface investigation are dealt with inmany publications, including BS 5930 (BSI, 1999), Clayton et al.(1995), GCO (1987), Hunt (2005) and Mayne et al. (2001).
4.6.1 Sampling strategy
There are usually four main objectives in sub-surface investigation:
1. to establish the geological profile2. to determine engineering properties for the various units within the
eventual ground model3. to establish hydrogeological conditions, and4. to monitor future changes in ground conditions through
instrumentation.
At many sites, it is best to use preliminary boreholes in an attempt toestablish the geological profile accurately. This will require samplingover the full depth and with sufficient boreholes to establish lateral andvertical variability. If recovery is low, then boreholes may need to be
154 Practical Engineering Geology

repeated; it is often the pieces of core that are not recovered that are themost important, because they are also the weakest. It is wise to includea clause in specifications for the GI contractor, setting out a minimumacceptable recovery, to encourage diligent work. A good driller cangenerally achieve good recovery in almost any ground, providing hehas the right equipment and adjusts his method of working to suit theground conditions. If he does not have suitable equipment (or flushingmedium), then that might be the fault of the engineer who specified theinvestigation, rather than the contractor, and this may need rectificationby issuing a variation order to the contract.Once the preliminary geological model has been established ade-
quately at a site, then additional boreholes can be put down as neces-sary to take samples for testing or to carry out in situ testing and toinstall instruments for monitoring changes such as response of watertable to rainfall. The same approach (sample first to prove the geolo-gical model and to identify any geological hazards, followed by asecond phase for testing and instrumentation) should be used for anyinvestigation where geological features may be important. This canonly be judged by a competent engineering geologist aware of both thelocal geological conditions and the factors that will control the successor otherwise of the particular civil engineering project.In practice, boreholes are often put down using a strategy of inter-
mittent sampling and in situ testing within a single borehole, whichmeans that the full ground profile is not seen. This can be cost-effectivefor design when the site is underlain by relatively uniform deposits andwhere the ground profile is already well-established from previousinvestigations. The danger is that site-specific geological featuresmight be missed yet prove important for the project.
4.6.2 Boreholes in soil
There are many different tools that can be used to investigate soils andmany of these are described by Clayton et al. (1995). In the UK, themost commonly used machine for investigating soils is the shell andauger, otherwise known as the cable-percussive rig, as illustrated inFigure 4.22. Such rigs are very manoeuvrable and can be towed behinda field vehicle or winched to the point where the hole is to be put down.They can cope with a wide range of soils, which makes for theirpopularity in the UK, where mixed glacial soils are common. Thehole is advanced by dropping a heavy shell (Figure 4.23). Materialbetween sampling points is usually discarded, although it should beexamined and recorded by the drilling contractor and disturbed bulksamples are taken in bags, if specified for the contract. All samples, ofcourse, should be sealed and labelled. If boulders are encountered inthe soil profile, these are broken up with a heavy chisel dropped downthe hole. Engineers usually specify alternate undisturbed samples for
Site investigation 155

laboratory testing and in situ strength tests at perhaps 1.5m intervalsor changes in strata. The standard penetration test (SPT) is commonlyused to measure strength, as discussed below under in situ testing.Vane tests might be carried out rather than SPTs, especially in claysoils. USA practice for investigating and sampling soils is described byHunt (2005). One cheap and quick way of sampling/testing is to usewash boring, whereby the hole is advanced by water jetting as rods arerotated. SPT tests, and possibly other samples, are taken at intervals.None of these methods gives continuous sampling, so geological detailmay be missed.
Figure 4.22 Shell and auger rig in action, Leicester, UK. Casing, used to support the hole, is standingout of ground and a shell is being dropped down hole to excavate further. In the foreground is aU100 sampling tube attached to a down-hole hammer, ready for placing down hole and taking asample once the hole has been advanced to the required depth. Leaning against the wheel is one of thedrillers and also a trip hammer for SPT testing – also awaiting use at appropriate depths and changesin strata.
156 Practical Engineering Geology

Undisturbed samples are usually taken using a relatively thin walledsampler of diameter 100mm (U100), and much of the publishedempirical relationships that are relied upon by designers are based ontests on samples achieved in this way. This sampling method does not,however, meet the more stringent requirements of Eurocode 7 for class1 sampling and testing, because of fears over disturbance. This is rathernaïve in that it implies that thinner sampling tubes can take an undis-turbed sample, which is not the case. Any sample taken from depth,squeezed into a tube and then extruded at the laboratory, will inevi-tably be disturbed to some degree. Further disturbance occurs duringpreparation of samples for laboratory testing and initial loading andsaturation, as expressed schematically in Figure 4.24 and investigatedby Davis & Poulos (1967). The engineering geologist and geotechnicalengineer need to be aware of the likely disturbance to any testedsamples and take due care in interpretation. Furthermore, the scalingup of results from laboratory to project scale requires careful consid-eration because it must include the effect of mass fabric and structure,including fractures and discontinuities. This is discussed further inChapter 5.
Figure 4.23 (a) Methodology for shell and auger advancement of boreholes. (b) Samplingstrategy.
Site investigation 157
‘Undisturbed’ sample takenat predefined depth orchanged in stratum bydriving or pushing tube
‘Undisturbed’ sample depth
Hole advanced by clay cutter(no sample)
casing
(a) (b)
Hole advanced by clay cutter(no sample)
Soil dumped –occasionallydisturbed samplesare taken
3
2
1
Steel casing installed ifnecessary to support hole
– Heavy cylinder (clay cutter) dropped to advance hole.– Bailer used in sand/gravel.– Chisel used to break boulders
– Undisturbed samples or SPT or vane tests every 1.5 metres
– May carry out strength test directly below undisturbed sample
Strength test and sample– either SPT or vane

4.6.3 Rotary drilling
Rotary drilling is used in all rocks but can also be used to obtain goodsamples in weaker materials, including colluvium (mixed rock andsoil), weathered rock and soil. In weaker ground, a similar investiga-tion strategy is often adopted as for soils, whereby sections are coredfollowed by SPT tests, although as for soils there is the risk thatimportant geological features may be missed.A drilling rig rotates a string of drilling rods whilst hydraulic cylin-
ders apply a downward force. At the lower end of the drilling stringthere is a hollow annulus bit, usually coated with diamonds or tung-sten carbide. As the bit is rotated, a stick of core enters into a corebarrel at the bottom of the drilling string. The retained core is pre-vented from falling out as the barrel is brought back to the surface, bysome form of core-catching device. Air, water, mud or foam is used tocool the bit and carry rock cuttings back to the surface (Figure 4.25).Where cored samples are not required over a particular length of hole,it can be advanced more quickly using rock roller bits, down-the-holehammers and water jets, as used in much oil and gas drilling.At the most basic level, a single-barrel well-boring rig can be used to
take core samples but these are often highly disturbed (Figure 4.26).Most drilling is carried out using double-barrel systems in which theouter barrel rotates around an inner barrel that takes in the core. A
Figure 4.24Potential sources ofsamplingdisturbance leadingto much lowerstrengths beingmeasured in thelaboratorycompared to thosein situ.
158 Practical Engineering Geology
Strength in undistrubed ground (may varynaturally with moisture content)
Actual strength of soil or rock in situ
Least sensitivse(rock)
Loss of strengthdue to disturbancein preparingsample for testing
Lower bound,remoulded strength
remouldedstrengthenvelope
truecohesion
τ
σ
φr
in-situstrength
disturban
ce
Most sensitive(weakly structuredsoil)
Range ofmeasuredstrengths
Measured strength
Reduction in strength dueto disturbance duringsampling (whatever methodis used)

problem with the double-tube system is that the flushing medium flowsbetween the core and the core barrel and can wash away some of thecored material, but it is still used internationally because it is relativelyinexpensive and can be mass produced. The problems can be reduced byusing a triple-tube system. In this system, the core enters a split inner
Figure 4.25 Rotarydrilling above fatallandslide at Fei ShuiRoad, Hong Kong.Polymer foam(white) is beingused as the drillingflush to try toimprove recovery.
Figure 4.26 Sample obtained from single-barrel Russian well drilling rig, El Hadjar steelworks,Annaba, Algeria (see preface). Previous logging of similar samples had interpreted the layering assome kind of varved sequence of silt and sand. Actually, the horizon in situ is fairly uniformweathered (grade IV) gneiss (the pale material). The dark-brown silt horizons represent occasionswhen the Algerian driller, bored with the slow drilling progress from his worn-out bits, raised thedrilling string and then dropped it again with some force down the hole, letting in a layer of the siltydrilling mud, which then became baked by the heat from the drilling process… The thickness of thepale layers are an indication of the driller’s boredom threshold – generally pretty consistent.
Site investigation 159

tube, which does not rotate; the flushingmedium flows between the innertube and an outer tube without touching the core. Such equipment haslow manufacturing tolerances so must be bought off the shelf, and thebits are very expensive and only last perhaps 8 to 12m of coring beforethey need to be replaced, which precludes its use on many projects.Usually, the larger the diameter of the core barrel, the better the
recovery and quality of sample, and it is prudent to start using alarge diameter and reduce diameter as necessary with depth. The widerange of casing, core barrel and drill rod sizes are listed in ASTM(1999),which also discusses good practice. When there is good-quality rockoverlying soil material, retrieving the softer material can be a problem.As for soil boring, the hole may need to be cased temporarily duringdrilling to prevent it collapsing. Drillers generally try to recover about1.5m of core per run before pulling all the drill string back to the groundsurface and dismantling it all. If recovery is low, then the drillermight tryto reduce the core run to 1m or even less, but this does not alwaysproduce better results. Other parameters such as thrust, torque andflushing medium may have more influence on recovery, and muchdepends on the experience, knowledge and attitude of the drilling crew.Wire line drilling employs large-diameter rods, which effectively
support the hole as it advances. After each core run, the core barrel ispulled up the centre of the drill rods, the core extracted, then droppedback down the hole to lock into the bottom of the hole, ready to startdrilling again. The cutting bit stays at the bottom of the drill rods and isnot extracted with the core barrel. To change the cutting bit, however,the whole drill string has to be removed.A system that is very commonly used in Hong Kong and elsewhere for
samplingweathered rock andmixed rock and soil is aMazier core barrel.This has a soil cutting shoe which is spring loaded and extrudes inadvance of an outer rock cutting bit when cutting through relativelyweak soil-like material (Figures 4.27 and 4.28). As conditions getharder, the soil cutter is pushed back and the outer coring bit takesover. This system, especially where combined with polymer foam flush,has been shown to produce good recovery of material in weathered andmixed materials (Phillipson & Chipp, 1982). The sample is taken in aplastic tube, which is later cut open so that the sample can be examined,described and tested (Figure 4.29). Drilling contractors will not opentubed samples without instruction to do so, and, in practice, geotechnicalengineers sometimes order Mazier samples (from the office) but thennever get round to opening and examining the samples, which is poorpractice. The author was recently involved in an arbitration where 20boreholes had been put down with alternate Mazier sampling in softclays and then SPTs. The project was then designed on the basis of theSPT data alone and went badly wrong, ending in arbitration. The sam-ples had not been opened up for examination or testing. A similar systemto the Mazier, used in the USA, is the Dennison sampler (Hunt, 2005).
160 Practical Engineering Geology

4.7 In situ testing
Many parameters are obtained for design by laboratory testing, asdiscussed in Chapter 5, but the potential for disturbance is obvious,as discussed earlier, especially for granular soil that disaggregateswhen not confined. There are therefore many reasons for attemptingto test soil and to a lesser extent rock in situ. Most tests are conductedin boreholes, but some are conducted by pushing the tools from theground surface or from the base of a borehole to zones where the soil isrelatively undisturbed. A self-boring pressuremeter, suitable for clayand sand, drills itself into the ground with minimal disturbance beforecarrying out a compression test at the required level.The SPT is probably the most commonly used in situ test, whereby
the number of blows to hammer a sample tube into the ground is
Figure 4.27Principles ofMaziersampling.
Spring-loaded(retractable)cutting shoe
Plastic liner
Rotary drive
Cutting bit
FlushFlush(water or
foam)Sample
Schematic, not scale
In rock, soil cutterretracts and rotary
bit takes over
In weakground
cutting shoepushed into
‘soil’
Site investigation 161

recorded. Soft soils are penetrated easily, hard soils and weak rockswith more difficulty. The SPT data can be interpreted in terms of shearstrength and deformability (Chapter 5) and for making predictions ofsettlement directly (Chapter 6). The split spoon sampler used for theSPT is a steel tube with a tapered cutting shoe. It is lowered down theborehole, attached to connecting rods, and then driven into the groundby a standard weight, which drops a standard height, as illustrated inFigure 4.30 and shown in action from a rotary drilling rig inFigure 4.31. The number of blows for each penetration of 75mm isrecorded; blows for the first 150mm are recorded but essentiallyignored (considered disturbed); the blows for the final 300mm are
Figure 4.29 Maziersample plastic tubebeing cut forexamination.
Figure 4.28 Mazier sampler with nicely recovered weathered granite – the right side third is stainedwith iron oxides. Spring-loaded cutting shoe is seen extending from the rock cutting bit outside.When the material strength becomes too high for the cutting shoe (exceeds spring stiffness), the outerbit takes over the cutting.
162 Practical Engineering Geology

added together as the N-value. Care must be taken in soil that theexternal water table is balanced, otherwise water may flow in fromthe bottom of the hole, causing softening and too low an N value.There are various corrections suggested for tests conducted in siltysand and for depth of overburden. Details are given in Clayton (1995).
6 marks each
WStandard weight falling standard height
⋅⋅ ⋅ ⋅⋅⋅ ⋅ ⋅ ⋅⋅⋅ ⋅ ⋅ ⋅
⋅
⋅ ⋅ ⋅
⋅⋅
⋅ ⋅ ⋅⋅ ⋅ ⋅⋅⋅
⋅ ⋅ ⋅ ⋅
⋅ ⋅
⋅
data recorded– number of blows of hammer per 75 mm penetration
23343
‘N’ value =15
‘seating blows’– disregarded
75 mm apart
Reference beam
⋅⋅ ⋅ ⋅⋅⋅ ⋅ ⋅ ⋅⋅⋅
⋅ ⋅ ⋅ ⋅ ⋅⋅
⋅ ⋅ ⋅
⋅⋅
⋅ ⋅ ⋅⋅ ⋅ ⋅⋅⋅
⋅ ⋅ ⋅ ⋅⋅
⋅ ⋅
⋅⋅ ⋅⋅ ⋅
⋅⋅ ⋅⋅
⋅ ⋅⋅⋅
⋅⋅
⋅
⋅⋅⋅⋅
⋅ ⋅⋅⋅⋅ ⋅
⋅ ⋅⋅
⋅ ⋅⋅ ⋅ ⋅⋅
⋅ ⋅ ⋅⋅⋅⋅ ⋅
⋅
⋅⋅⋅
⋅
⋅ ⋅⋅⋅ ⋅
⋅
⋅
⋅⋅⋅
⋅
⋅⋅
⋅ ⋅
35Connecting
rods
Hole allows expulsion ofwater and air
⋅ ⋅⋅ ⋅ ⋅⋅
⋅ ⋅ ⋅⋅⋅⋅ ⋅
⋅
⋅⋅⋅⋅
⋅
⋅⋅⋅⋅
⋅ ⋅⋅⋅⋅ ⋅
⋅
⋅
⋅⋅
⋅ ⋅⋅ ⋅ ⋅⋅
⋅ ⋅ ⋅⋅⋅⋅ ⋅
⋅
⋅⋅⋅
⋅
⋅ ⋅⋅⋅ ⋅
⋅
⋅
⋅⋅⋅
⋅
⋅⋅
⋅
⋅ ⋅ ⋅⋅
⋅⋅ ⋅
⋅⋅ ⋅
⋅
⋅ ⋅ ⋅⋅
⋅⋅ ⋅ ⋅ ⋅
⋅ ⋅⋅
⋅ ⋅⋅
⋅
⋅
⋅⋅ ⋅⋅⋅
⋅
⋅ ⋅ ⋅⋅ ⋅
⋅⋅
⋅
⋅ ⋅⋅
⋅⋅ ⋅⋅ ⋅⋅ ⋅
⋅
⋅
⋅
⋅⋅⋅⋅⋅⋅⋅
⋅ Sample that can be described and tested
Not to scale
⋅⋅ ⋅
⋅⋅ ⋅
⋅⋅
⋅ ⋅⋅
⋅ ⋅⋅
⋅⋅ ⋅⋅⋅⋅ ⋅ ⋅ ⋅⋅
⋅ ⋅⋅
⋅ ⋅⋅
⋅ ⋅⋅⋅ ⋅
⋅⋅⋅
⋅ ⋅ ⋅⋅ ⋅⋅
⋅⋅
⋅⋅
⋅⋅⋅
⋅ ⋅⋅
⋅⋅
⋅ ⋅
⋅
Borehole
Casing
Water table
Factors that will influence results and may require corrections to be made
⋅ ⋅⋅⋅⋅ ⋅⋅
⋅⋅ ⋅⋅ ⋅
⋅⋅ ⋅⋅⋅
⋅⋅⋅
xx
x x
Excess water pressure may develop in silty fine sand leading to low SPT values
W
– efficiency of impact
Length of rods (their weight and adsorption of energy by bending)
Water flow into the borehole may loosen ground
1
⋅⋅ ⋅⋅ ⋅ ⋅⋅
⋅⋅ ⋅⋅
⋅ ⋅⋅⋅ ⋅
⋅ ⋅ ⋅⋅ ⋅⋅⋅
Clean, dense sand may dilate causing suction and high temporary resistance
Nature of soil(also in situ stresses)
2 Efficiency of test3
⋅⋅⋅ ⋅
⋅⋅⋅⋅⋅ ⋅
⋅⋅⋅ ⋅ ⋅⋅
⋅⋅ ⋅
⋅⋅
⋅ ⋅⋅ ⋅⋅ ⋅⋅ ⋅ ⋅⋅
⋅⋅ ⋅⋅
⋅ ⋅⋅⋅ ⋅
⋅ ⋅ ⋅⋅ ⋅⋅⋅ ⋅⋅ ⋅⋅ ⋅ ⋅
⋅⋅⋅ ⋅⋅
⋅ ⋅⋅⋅ ⋅
⋅ ⋅ ⋅⋅ ⋅⋅⋅⋅⋅ ⋅⋅ ⋅ ⋅
⋅⋅⋅ ⋅⋅
⋅ ⋅⋅⋅ ⋅
⋅ ⋅ ⋅⋅ ⋅⋅⋅
Figure 4.30 Principles and details of the SPT test.
Site investigation 163

The SPT test is much maligned for associated errors but nevertheless isstill the most common basis for design in many foundation projects,mainly because no-one has come up with anything better. It is alsoactually quite a useful sampling tool, as illustrated in Figure 4.32. In
Figure 4.31 SPTtest underway inHong Kong(1980s).Nowadays, ahelmet would beworn.
Figure 4.32 Splitspoon sample ofcompletelyweathered granite.Note presence ofrelict joints and lackof visibledisturbance.
164 Practical Engineering Geology

the UK, it is normal to stop a test when 50 blows fail to advance thesplit spoon the full 300mm and instead to record the penetrationachieved for the 50 blows. Depending on the ground conditions andsample retrieved, it might be valid to extrapolate the blow count to anequivalent N-value pro rata. Overseas, it is common practice to con-tinue the test for 200 blows or more in weathered rock, and designs areoften based almost solely on such data, which is rather questionablepractice in a profile that might comprise a heterogeneousmix of harderand softer materials. Tests carried out in this way may damage equip-ment and are tedious for the drilling contractor, who might well betempted to cut corners if no-one is supervising. The interpretationof SPT testing in weak and weathered rock is discussed in moredetail in Chapter 5.The vane test involves rotation of a cruciform steel tool at a slow rate
within the soil (Figure 4.33). The test is especially suitable for soft claywhere SPTs are inappropriate because of the indeterminate nature ofpore pressure changes brought about by rapid loading. The vane test isassumed to give a direct measure of undrained shear strength for theshape sheared by the rotating tool but interpretation can be difficult,especially in bedded soils.The static cone penetrometer is a conical tool (like an SPT) that is
pushed rather than driven into the ground, usually from a heavy lorry(Figures 4.34 and 4.35). The end force on the cone tip, and drag on thesides of the tool, are measured independently and can be interpreted interms of strength and deformability. Clay, being cohesive, grips theside proportionally more than sand or gravel, so the ratio between endresistance and the side friction can be used to interpret the type of soil
Figure 4.33 Field vane used for measuring strength of clay down borehole or sometimes pushedfrom the ground surface. Once at test location, the vane is rotated to measure shear strength of thecylinder of soil defined by the vane geometry. To the left is a sleeve used to protect the vane duringinstallation.
Site investigation 165

as well as strength. A further refinement (piezocone) allows waterpressures to be monitored as the cone is pushed in, which again canhelp in interpreting the soil profile.Large-scale direct shear tests are sometimes carried out in the field
(Figure 4.36), in the hope that scale and disturbance effects might bereduced. In reality, lack of control in the testing process, as well asquestions over representation of samples, however large, often out-weighs any advantages. The derived data are generally less reliablethan those from a series of laboratory tests, which themselves wouldneed very careful interpretation before use at the mass scale, asdiscussed in Chapter 5.
Figure 4.34 Electric static cone penetrometer with piezometric ring. Forces on the cone tip aremeasured independently from the force on the shaft section above. A combination of all threemeasurements (including water pressure) gives a good indication of soil type as well as strengthcharacteristics.
Figure 4.35 Heavylorry being used toconduct static conepenetrometer tests.
166 Practical Engineering Geology

Small-scale deformability tests down boreholes include the use ofinflated rubber packers in soil (pressuremeter) or the Goodman jack inrockwhere two sides of the borehole are jacked apart. All such tests arevery small relative to the mass under consideration and need to beinterpreted with due care as to their representativeness. Deformationat project scale is better predicted from loading tests involving largevolumes. The inclusion of very high capacityOsterberg jacking cells setwithin large diameter, well-instrumented bored piles, as discussed inChapter 6, gives the prospect of deriving much more representativeparameters (e.g. Seol & Jeong, 2009). In practice, most rock massparameters tend to be estimated from empirical relationships derivedfrom years of project experience together with numerical modelling,rather than small-scale tests, as discussed in Chapter 5.Field tests are really the only option for measuring hydraulic con-
ductivity (also for oil and gas). Simple tests include falling or risinghead tests in individual boreholes, whereby water is either added to orpumped out of a hole and then the time taken for water to come backto equilibrium measured. For realistic indications of behaviour at fieldscale, however, larger-scale pumping tests are required. Even then,water flow is often localised and channelled so tests may not alwaysbe readily interpreted.
Figure 4.36 In situdirect shear test intrial trench, HongKong.
Site investigation 167

4.8 Logging borehole samples
Data from ground investigations are generally presented in areport comprising factual data as well as an interpretation ofconditions (if the GI contractor is requested to do so). One ofthe important jobs for an engineering geologist is to examine andrecord the nature of samples retrieved from boreholes. The datafrom individual boreholes is usually presented in a borehole log,which provides a record not only of the ground profile but manydetails of how the borehole was carried out. In the oil industry,where the hole is advanced by a rock-roller bit or similar destruc-tive method, logging is done by examining small chips of rockcarried in the flushing mud (well logging); in civil engineering, wegenerally have rather better samples to examine.Logging is generally conducted using a checklist approach and
employing standard terminology to allow good communication, forexample, on the apparent strength of a sample. Such standardisationcan, however, result in over-simplification and lack of attention togeological detail. The task might be delegated to junior staff whomight not have the experience and training to fully understand whatthey are examining. In addition, GI contractors will not routinelydescribe all features of samples recovered, partly because they wantto avoid disturbing the samples before the client/design engineer hasmade a decision on which samples he wishes to select for laboratorytesting. Several examples of borehole and trial pit logs are providedin Appendix D. The examples prepared by GI contractors in the UKand Hong Kong demonstrate good practice, whereby the wholeprocess of drilling a hole, testing down the hole and sampling arerecorded. The materials encountered are described following stan-dard codes and normal practice. Given the limitations discussedabove, designers and investigators may need to examine samplesand core boxes themselves and not rely on those produced by thecontractor. In Appendix D, examples are given of logs prepared byengineering geologists who have the responsibility for the overallsite investigation. These are supplementary to the logs produced bythe GI contractors. The Australian example is from an intensiveinvestigation of a failing slope that was threatening a road. Thereis considerable attention to detail, especially regarding the nature ofdiscontinuities and far more so than in the contractor’s logs. Inpractice, even this level of logging may be inadequate to interpretthe correct ground model, and selected samples and sections of corewill need to be described in even more detail by specialists, perhapsemploying techniques such as thin-section microscopy, radiometricdating and chemical analysis. In all cases and at all levels, logsshould be accompanied by high-quality photographs with scalesincluded.
168 Practical Engineering Geology

As discussed in Appendix C, guidance on standardised terminologyis given in BS5930: 1999, in the GEO guide on rock and soil descrip-tion (GCO, 1988) and the ISRM guidance on rock mass description(ISRM, 1981). There are many different standards and codes of prac-tice in use worldwide – USA practice is far removed from that in theUK, as is that for Australia, China, New Zealand, Japan and Korea,which leads to confusion, particularly as similar terminology is oftenused to mean different things. A consequence of this fuzzy standardisa-tion is that when projects go wrong geotechnically, as they sometimesdo, then legal arguments often hinge on incorrect or misinterpretationof terminology. The engineering geologist needs to do his homeworkbefore practising in any region.Another criticism made earlier regarding field mapping, but equally
applicable to logging, is that standard guides and codes to rock and soildescription tend to comprise a series of limited classifications that onehas sometimes to force on an unwilling rock mass. For example,rock masses, as exposed in quarries, can seldom be simply describedas widely or closely jointed, but loggers are required to apply suchclassifications to core samples. In the author’s opinion, it is far betterto concentrate on recording factual data, which can then be interpretedas the overall ground model becomes clearer. An example of over-simplified rock classification terminology is given in Box 4-8 withreference to the term aperture. The problem is that by usingsuch terms it is implied that the feature has properly been characterised,which is not the case. De Freitas (2009) discusses the same point andalso notes that many terms and indeedmeasured values such as porosityare lumped parameters and therefore rather insensitive anduninformative.
Box 4-8 Defining aperture: an example of poor practice by geotechnical codingcommittees
This example is used to illustrate the inadequacy of current geotechnical standards for soil and rockdescription to convey an accurate or realistic representation of the true nature of the geological situation.
Mechanical aperture is the gap between two rock discontinuity walls (three-dimensional) and a veryimportant characteristic with respect to fluid flow and grouting. It is expressed in most codes andstandards as a one-dimensional scale of measurement, in the same way as joint spacing. The variousattempts at revising description of aperture over 25 years (leading to the current BS/Eurocode 7 require-ments discussed later) have simply reinvented the measurement scales and terminology but have failed toaddress or inform users about the fundamental difficulties in measuring and characterising this property.
What is aperture?
It is the mechanical gap between two walls of a rock discontinuity such as a joint or a fault. An example ofa small section of joint with a gaping aperture (because the block has moved down slope and dilated overroughness features) is shown in Figure B4-8.1, which is a photograph of a section of sheeting joint ingranite from Hong Kong.
Site investigation 169

In the second example, of a fault exposed at a beach, also in Hong Kong (Figure B4-8.2), it is not quite soeasy; there is a groove along the feature but the astute geologist might interpret this as preferential erosion.Some authors advise measuring aperture using feeler gauges. Others have attempted to characteriseaperture volumetrically by injecting resin or liquid metals.
Does it matter?
It is an extremely important property of the rock mass, controlling fluid flow and also related to shearstrength. The problem is it is a very complex and unpredictable characteristic, as is the associated fluid flow.A single joint can be locally tight and impermeable, whilst elsewhere can be open allowing huge volumes ofwater to flow, as discussed by Kikuchi & Mito (1993). Investigation and characterisation can be a
Figure B4-8.2 Minor fault exposed on beach, Peng Chau Island, Hong Kong.
Figure B4-8.1 Part of sheeting joint with gaping aperture where seen. Evidently, away from the exposurethe aperture is tight and the rock walls are in contact. Example is near Sau Mau Ping, Hong Kong.
170 Practical Engineering Geology
aperture
aperture?

nightmare – if a borehole hits a conductive section, then high permeabilities will be measured and aninstalled instrument will be responsive to changes in water pressure, but this is literally a hit or missbusiness, as evidenced by many examples in investigations associated with nuclear waste (e.g. Thomas &La Pointe, 1995). The author has the experience of working in a deep tunnel 150m below the sea, whereover one section, the rock was highly jointed but dry, but elsewhere, at the same level, there was a steadyinflow through what was apparently intact rock. Clearly, it is not just local aperture that matters, but thecharacteristics of the full fracture network and its connectivity leading to the point of observation. It is animportant area for research and for observation linked to geochemical and structural studies together withan appreciation of coupled mechanisms (e.g. Olsson & Barton, 2001; Sausse & Genter, 2005). Withoutgetting to grips with the concept of channelised flow on rock joints and through joint networks, it may beimpossible to ever make a safety case for nuclear waste disposal, with all the corollaries, i.e. no nuclearpower, global warming and the end of civilisation. Well, perhaps slightly overstated, but not that much.
Apart from the natural variability of fracture networks, are there any other considerations?
Yes. Most rock joints are sampled in boreholes where aperture simply cannot be measured. Furthermore,it is very unlikely that any borehole sample would be representative of the discontinuity at any greatdistance. Down-hole examination with cameras and periscopes can be used to examine borehole walls,but again there is a problem with sampling and representativeness. In exposures such as quarries ortunnels, exposure is better but there is a question of disturbance – blasting, stress relief and blockmovement and whether observations at one location are relevant to the rock mass as a whole.
So what advice is given in recommended methods and standards?
1978 ISRM. The discussion on aperture is very useful. Its importance is recognised and many of thedifficulties in measurement and interpretation are highlighted.
For description purpose and where appropriate, apertures are split into closed, gapped and openfeatures, each subdivided into three. It is advised that:
a. modal (most common) apertures should be recorded for each discontinuity setb. individual discontinuities having apertures noticeably wider or larger than the modal value should be
carefully described, together with location and orientation data, andc. photographs of extremely wide (10–100cm) or cavernous (>1m) apertures should be appended.
1999UKBS5930 (BSI, 1999). Says little about aperture other than noting that it cannot be described incore. Five classes are introduced, which use some of the same terms as ISRMbut with different definitions.
2003 INTERNATIONAL STANDARD ISO 14689–1 (BSI, 2003) (for Eurocode 7 users). Provides anew mandatory terminology for one-dimensional measurement that differs from that of BS5930: 1999and ISRM (1978), as illustrated in Table 4 B8.1 (see below).
Table 4 B8.1 Terms for the description of aperture.
Aperture size term ISRM 19781 BS5930 1999 ISO 14689–1: 2003
<0.1mm Very tight Very tight Very tight0.1–0.25mm Tight Tight Tight0.25–0.5mm Partly open Partly open0.5–2.5mm Open Moderately open Open2.5–10mm Moderately wide Open Moderately wide10–100mm Very wide Very open Wide100–1,000mm Extremely wide Very wide>1,000mm Cavernous Extremely wide
1 In detail, there is further confusion in that ISRM also defines a termwide for gapped features >10mm; theother terms above, also for apertures >10mm are for open features but the difference is not fully obvious.
Site investigation 171

Hydraulic aperture vs. mechanical aperture
For completeness, it is worth emphasising here that even if we could measure mechanical aperturemeaningfully, the actual associated flow characteristics of the rock mass (hydraulic aperture) wouldbe very difficult to estimate or predict. It clearly makes sense to observe and characterise rockmasses as best we can, with respect to openness of the fracture network, but hydraulic conductivitycan only be measured realistically using field tests, as discussed elsewhere, and even these are oftenopen to different interpretations (e.g. Black, 2010).
Conclusions
After 25 years to digest the ISRM discussion and intensive international experience on research inmeasuring gaps in discontinuities and associated fluid flow, especially with respect to nuclear wastedisposal investigations, the requirement for site investigation in Europe is a new set of linearmeasurements that are inconsistent with previous ones. No mention is made of the difficulty ofcharacterising aperture in this way. Meanwhile, the New Zealand Geotechnical Society (2005) hasproduced yet another classification for aperture, which uses a selection of the same terms as in theabove table but defined differently (e.g. wide = 60mm to 200mm) and introduces a new set ofclasses for the middle range: very narrow, narrow, moderately narrow.
Apologies
Apologies for being so critical, but it seems to this author that many codes and classifications over-simplify geological description and constrain/stifle good practice. This is especially so where it is man-dated that some particular but fundamentally inadequate terminology shall be used. Unfortunately,inexperienced geotechnical engineers and engineering geologists are led to believe that such codificationadequately deals with description and characterisation of the feature, which is not the case.
4.9 Down-hole logging
Down-hole logging technology has largely come from the oil industryand partly frommining. At the simplest level, a TV camera or boreholeperiscope is lowered down an uncased borehole and used to identifydefects or to examine discontinuities. A borehole can be pumped dry ofwater and observations made of locations of water inflow, althoughthis might need to be inferred from temperature or chemical measure-ments (Chaplow, 1996). Borehole impression packers were introducedin the 1970s and can be used to measure the orientation of disconti-nuities. Using an inflatable rubber packer, paraffin wax paper ispressed against the walls of the borehole and when retrieved, thetraces of indented joints are clearly visible (Figure 4.37). Dip of thejoints is easily determined from the geometry of the borehole butmeasuring direction relies upon whatever device is used to orientatethe packer and, from experience, this can be a major source of error. Itis good practice when using the impression packer to specify over-lapping sections of measurement down the hole (by perhaps 0.5m) sothat consistency can be checked. In one borehole we found a 70 degreedifference between consecutive sections, resulting from the packerbeing deflated before the compass had set in position – the contractorwas asked to redo the work. Amore modern tool is the Borehole Image
172 Practical Engineering Geology

Processing System (BIPS), which gives a continual visual record ofthe borehole wall (Kamewada et al., 1990). The tool is lowereddown the borehole and a video camera takes a 360 degree imagemillimetre by millimetre down the hole through a conical mirror(Figure 4.38). Despite modern instrumentation for this tool, wherebyazimuth can bemeasured bymagnetic flux gates or gyroscopes, studieshave revealed errors of up to 20 degrees in this measurement (Döseet al., 2008). Care must also be taken in interpretation of discontinu-ities logged in boreholes, especially if boreholes are all vertical. Therewill be obvious bias to the measurements – steep joints will be under-sampled in vertical boreholes. As an example, during the ChingCheung Road landslide investigation (Halcrow Asia Partnership1998a), BIPS measurements were taken in vertical boreholes and
Figure 4.37 Impression packer. Paraffin wax paper has been pushed against the walls of theborehole by a rubber inflatable packer. A series of pale-grey traces can be seen, which represent a setof fairly planar joints dipping at about 70 degrees. Direction is obtained from a compass set in glue atthe base of the packer. Other options for orienting devices now include flux gate magnetometers andgyroscopes.
Site investigation 173

indicated a completely different style of jointing to those measuredin exposed faces (essentially along horizontal scan lines). The data arepresented in Figure 4.39 and it can be seen that the borehole dataessentially defined a girdle of joints at 90 degrees to the main poleconcentration that was measured from the horizontal scan line data.Both sets of data were required to provide the correct geologicalpicture.Other down-hole tools include resistivity and gamma ray inten-
sity (even in cased holes) which, whilst often useful for oilexploration and coal mining, generally have rather limited appli-cation to civil engineering, other than possibly for locating clay-richhorizons.
4.10 Instrumentation
Instrumentation is used to establish baseline ground conditions ata site, most commonly in terms of natural groundwater fluctua-tions. It is also used to monitor changes at a site brought about byconstruction activities such as excavation or blasting. Instrumentsystems need to be designed carefully so that they are reliable;there needs to be built-in redundancy for instruments that may failor become damaged by site works or by vandalism. Incoming datamust be readily interpretable if some action is to be taken as aconsequence. Instruments are often used during the works tocheck performance against predictions. Displacements and waterlevels can be monitored and compared to those anticipated. First(ALERT) and second (ALARM) level trigger conditions can bedefined with prescribed action plans. Data can be sent remotelyto mobile phones or by email to engineers who have the respon-sibility for safety and the power to take action such as closing aroad or evacuating a site. Other instruments that might be
Figure 4.38Output from BIPSdown-holediscontinuityorientation device,being used duringlogging of rockcore, TaejonStation, SouthKorea.
174 Practical Engineering Geology

employed during a large construction project include sound andvibration meters, especially where blasting is to be carried out.Piezometers are commonly installed as part of ground investiga-
tions to measure water pressures. Detailed information on theseand other instruments are given by Dunnicliff (2003). The simplestdevice is an open-tube standpipe with a porous tip, installed in a
Figure 4.39Comparisonbetweendiscontinuity datarecorded by BIPS(vertical drillhole)and from surfacemapping(horizontal scanlines). AfterHalcrow AsiaPartnership(1998a).
Discontinuities measured in borehole (vertical)
Discontinuities measured in scanlines
Site investigation 175

sand pocket within the borehole, as shown in Figure 4.40. Thereare also push-in versions available. The water level in the stand-pipe is dipped, perhaps on a weekly or monthly basis, using amechanical or an electronic device lowered down the hole; for anelectric dipmeter, the water closes a circuit to activate a buzzer. Tomeasure high rises in water level between visits by monitoringpersonnel, Halcrow plastic buckets can be installed on fishingline with a weight at the bottom of the string, at perhaps 0.5mintervals down standpipes. The buckets are pulled out of the holewhen the site is visited – the highest one that is filled with waterindicates the maximum level of water (Figure 4.41). At a moresophisticated level, standpipes can be set up so that readings aretaken automatically at regular intervals using pressure transducers(divers) or through an air bubbler system (Pope et al., 1982). Datacan be recorded on data loggers that can be set up to transmit
Figure 4.40 Standpipe piezometer tip about to be placed in borehole. Another has already beeninstalled at a deeper level. It is not very good practice to install more than one piezometer in aborehole, because of potential leakage between the different horizons being monitored, but canwork providing great care is taken in installation. Portsmouth dry dock, UK.
176 Practical Engineering Geology

information by telemetric systems. Other instruments includepneumatic or vibrating wire piezometers that respond very quicklyto changes in pressure (Figure 4.42). Because they require almostno water flow to record change of pressure (unlike a standpipe),they can be grouted in place in the borehole and several instru-ments can be installed in the same hole, which can save cost(Vaughan, 1969; Mikkelsen & Green, 2003).Instruments that are used to measure displacement include
strain gauges, tilt meters, inclinometers and extensometers.They can be mechanical or electrical, for example, using vibratingwire technology. Figure 4.43 shows the end of an extensometeranchored deep behind the working face of a large copper mine inSpain and fitted with lights and a claxon horn to give warning if
Figure 4.41 Halcrow buckets retrieved at Yee King Road landslide investigation (Hencheret al., 2008). These are unusual in that they contain sediments (from turbulent flows down theborehole). Normally, they would just contain water (or not), indicating the highest level thatthe water has risen in the borehole between inspections. Left side bucket is attached by fishingline to lead weights used to lower the buckets down the borehole.
Site investigation 177

Figure 4.42 Pneumatic piezometer being used to take measurements of rapidly changing waterpressures during pile driving. Only small volume changes are necessary to measure pressure changes,so readings could be taken every ten seconds or so.Water pressures measured went off scale at aboutthree times overburden pressure (Hencher & Mallard, 1989), Drax Power Station, Yorkshire, UK.
Figure 4.43Extensometer withclaxon and flashinglights used to warnworkers atAznalcollar mine,Spain, of dangerfrom moving slope.

the anchored point moves towards the mining area. Other instru-ments used to monitor performance at that site included deepinclinometers and a Leica total station, whereby numerous targetson the slope surfaces were surveyed remotely and automatically onan hourly basis, with the data sent to the site office (Hencheret al., 1996). An inclinometer is a tubular torpedo (with wheels),which is lowered down a grooved tube set into a borehole orbuilt into embankment fill. Figure 4.44 shows a section of inclin-ometer casing with the two sets of orthogonal grooves for thewheels. The torpedo (Figure 4.45) is first lowered down aligned bythe first set of grooves, then removed and lowered down thesecond set of grooves. The section on the figure also has magneticspiders with magnets, through which the tube can slide and cantherefore be used to monitor vertical settlement where the tube isinstalled in fill. Strain gauges within the torpedo measure tilt,which is recorded against depth. The orthogonal measurementscan be resolved to give the true direction and amount ofdisplacement.
4.11 Environmental hazards
4.11.1 General
Site investigation needs to include a review of the potential envir-onmental hazards as well as the immediate ground conditions.There may be risk from natural landslides and rockfall threateningthe project, potential for natural subsidence or collapse (say in
Figure 4.44 Exhumed inclinometer tubing. Four grooves inside (ridges outside) are guides forthe wheels on the inclinometer instrument. The device with arms is a spider, which becomesfixed in position against the walls of a borehole whilst the tube can pass up or down inside. Itis magnetic and a probe down hole can locate it and measurements can be made of settlement(as well as inclination).
Site investigation 179

areas underlain by salt deposits, old mine workings or karst),coastal erosion, wind, rain or earthquakes (Bell, 1999). As notedearlier, for some locations there are published hazard maps, butsuch maps cannot usually be relied upon on a site-specific scale. Itis up to the site investigation team to identify the potential hazardsfor the project throughout its life (maybe 50 to 100 years) and toquantify these. In some cases, such an assessment might lead to adecision not to proceed with a project. Elsewhere, the hazard canbe dealt with by careful design, and the main example of so doingis the hazard of earthquakes.
4.11.2 Natural terrain landslides
Landslides from natural terrain (rather than man-made slopes) are ahazard in most mountainous regions and can range from minor rockand boulder falls tomassive landslides which involve >20millionm3 ofrock and occur on average every three or four years worldwide (Evans,reported by Eberhardt et al., 2004). Landslides like the one thatdestroyed Yungay, Peru, in May 1970, and killed about 20,000people, are very difficult to predict and impossible to engineer. All
Figure 4.45Inclinometertorpedo about to belowered downgrooved tube. TuenMun Highway,Hong Kong.
180 Practical Engineering Geology

one can do is identify the landform, the degree of risk and perhapsmonitor displacements or micro-seismicity, with a plan to evacuatepeople and close roads if necessary.Smaller and more common natural terrain landslides can be
predicted and mitigated to some degree by engineering works.The starting point is generally historical records of previous land-slides, such as incidents on active roads through mountainousregions. These may allow areas of greatest hazard to be identifiedand some prioritisation of works. It should be noted, however,that small rockfalls at one location can be indicative of muchlarger and deep-seated landslides, and minor incidents should bereviewed in this light. Where there is good historical air photo-graph coverage, sources of landslides can be identified and thesecorrelated to susceptibility maps prepared using geographicalinformation systems (e.g. Devonald et al., 2009). Typical factorsthat might be linked to probability of landslide occurrence includegeology, thickness of soil, vegetation cover, slope angle, proximityto drainage line and catchment area. Once a best fit has beenmade linking landslide occurrence to contributing factors, mapscan be used in a quantitative, predictive way. Consequence of alandslide depends on location relative to the facility at risk(e.g. road, building), volume, debris run-out, possibility of dam-ming a watercourse and eventually impact velocity. From studiesin Hong Kong (Moore et al., 2001; Wong, 2005), it is apparentthat the greatest risk is generally from channelised debris flows(outlets of streams and rivers) and to facilities within about 100mof hazardous slopes (the typical limit of debris run-out in HongKong). A broader discussion is given by Fell et al. (2005). Adecision can be made on the resources that are justified to mitigatethe hazard, once one has determined the level of risk (which canbe quantified in terms of risk to life). There are many options,including barriers and debris brakes in stream courses and catchnets, especially for rockfall and boulder hazards. In some cases, adecision might be made to stabilise the threatening natural terrainusing drainage, surface protection, netting and anchors, as forman-made slopes, dealt with in Chapter 6.
4.11.3 Coastal recession
Coastal recession is a common problem and rates can be very rapid.For example, parts of the Yorkshire coast are retreating at up to 2mper year (Quinn et al., 2009). Many studies have been carried out onmechanisms, but the harsh fact is that many properties and land nearthe coast are at risk and many houses have to be abandoned. Coastalprotection measures can be designed successfully but these sometimesfail in a relatively short time and, constructing works at one location,
Site investigation 181

can have consequences for others along the coast, as suspected for thedamage to the village of Hallsands in Devon, which had to be largelyabandoned (Tanner & Walsh, 1984).
4.11.4 Subsidence and settlement
An excellent review on ground subsidence – natural and due tomining,is given by Waltham (2002). Ground subsidence occurs naturally dueto lowering of the water table from water extraction, oil and gasextraction, shrinkage of clay, and dissolution of salt deposits, lime-stone and other soluble rocks (e.g. Cooper & Waltham, 1999). Sub-surface piping can occur associated with landslides in any rocks,including granite (Hencher et al., 2008). The results can be dramatic,with sudden collapses of roads or even loss of buildings. Care musttherefore be taken to consider these possible hazards during siteinvestigation.Underground mining dates back thousands of years in some areas
(e.g. flints from chalk) and on a major scale for hundreds of years.Consequently, there are very incomplete records. In desk study, thefirst approach will always be to consult existing records and docu-ments, but wherever there is some resource, such as coal, that mighthave been mined, the engineering geologist needs to consider thatpossibility. Investigations can be put down on a pattern, specificallytargeted at the suspected way that mining might have been carried out(pillar and stall or bell pit, for example). Air photograph interpretationwill often be useful and geochemical analysis of soil can give someindication of past mining activities.
4.11.5 Contaminated land
Many sites around the world are severely contaminated, oftenbecause of man’s activities. This means that if the site is to beused for some new purpose, it may need to be cleaned up to bemade habitable. Similarly, when constructing near or throughpossibly contaminated land, this needs to be investigated and thecontamination mitigated, possibly by removing the contaminatedsoil to a treatment area. Barla & Jarre (1993) describe precautionsfor tunnelling beneath a landfill site. Guidance on investigation isgiven in BSI (2001), CIRIA (1995) and many other sources ofinformation are given by the AGS (Appendix A). Sometimes thecontamination is dealt with at site. Desk study can often identifyprojects where there are severe risks because of previous or cur-rent land use. Industrial sites such as old gas works, tanneries,chemical works and many mines are particularly problematical.Severe precautions need to be taken when dealing with such sitesand works will probably be controlled by legislation.
182 Practical Engineering Geology

4.11.6 Seismicity
4.11.6.1 Principles
Design against earthquake loading is an issue that needs to beconsidered in many parts of the world, depending upon the impor-tance of the project and risks from any potential damage. In somelocations, because of inherently low historical seismicity (UK) orseverity of other design issues (e.g. typhoon wind loading in HongKong), seismicity might be largely ignored for design other than forhigh-risk structures like nuclear power plants. Elsewhere, seismicityneeds to be formally assessed for all structures and taken intoaccount for design.
4.11.6.2 Design codes
Many countries have design codes for aseismic design and these aregenerally mandatory. Nevertheless, it is often prudent to carry out anindependent check and in particular to consider any particular aspectsof the site that could affect the impact of an earthquake. For example,the local soil conditions might have the potential to liquefy. Theseissues are considered in more detail in Chapter 6.Design codes, where well written and implemented, reduce the
earthquake risks considerably. The USA, for example, has a highseismic hazard in some areas but fatalities are few and this can beattributed to good design practice and building control. Chinaalso has a high seismic hazard in some areas, but earthquakescommonly result in comparably large loss of life, which might beattributed to poor design and quality of building. Structures canbe designed to withstand earthquake shaking, and even minorimprovements in construction methods and standards of buildingcontrol (quality of concrete, walls tied together, steel reinforce-ment, etc.) can prevent collapse and considerably reduce the likelyloss of life (Coburn & Spence, 1992).
4.11.6.3 Collecting data
The first stage is to consider historical data on earthquakes, which areavailable from many sources, including the InternationalSeismological Centre, Berkshire, and the US Geological Survey.These historical data can be processed statistically using appropriateempirical relationships to give probabilistic site data – for example, ofpeak ground acceleration over a 100 or 1,000-year period. This can bedone by considering distance from site of each of the historical earth-quake data or linked to some source structure (such as possible activefaults). Dowrick (1988) addresses the process well, and some guidanceis presented in Chapter 6. In some cases, estimates are made of the
Site investigation 183

largest earthquake that might occur within the regional tectonic regimeand similar regimes around the world, to derive a maximum credibleevent. This postulated worst case could be used by responsible autho-rities for emergency planning and is also used for some structures – asafe-shutdown event for a nuclear power station design.
4.12 Laboratory testing
Generally, a series of laboratory tests are specified for samples recov-ered from boreholes, trial pits and exposures, often employing thesame GI contractor who carried out the boring/drilling. Geotechnicalparameters and how to measure or estimate them are addressed inChapters 5 and 6.
4.13 Reporting
The results of site investigation are usually presented as factual docu-ments by the GI contractor – one for borehole logs, a second for theresults of any laboratory testing. In addition, specialist reports mightbe provided on geophysics and other particular investigations. Thesereports may include some interpretation, perhaps with some crosssections if the contractor has been asked to do so, but such interpreta-tion may be rather general and unreliable, not least because the GIcontractor will not be aware of the full details of the planned project.Generally, it is up to the design engineer to produce a full interpreta-
tion of the ground model in the light of his desk study, including airphoto interpretations and the factual GI (that he has specified). Thismight be done supported by hand-drawn cross sections and blockdiagrams – which should ensure that the data are considered carefullyand should enable any anomalies and errors to be spotted. There is atendency now to rely upon computer-generated images, with proper-ties defined statistically to define units (e.g. Culshaw, 2005; Turner,2006), which might reduce the chance that key features of the modelare properly recognised by a professional.
184 Practical Engineering Geology

5 Geotechnical parameters
‘Putting numbers to geology’Hoek (1999)
5.1 Physical properties of rocks and soils
For civil engineering design, it is necessary to assign physical propertiesto each unit of soil or rock within a ground model. These includereadily measurable or estimated attributes such as unit weight, densityand porosity. Other parameters that are often needed are strength,deformability and permeability. In the case of aggregates (rock used inconstruction for making concrete) and for armourstone, importantattributes are durability and chemical stability.
5.2 Material vs. mass
Most tests and measurements are made on small-scale samples in thefield or the laboratory and need to be scaled up according to theoreticalor empirical rules, to include for geological variability, fabric andstructure. For example, a soil mass might be made up of a mixture ofstrong boulders in amatrix of weak, soil-likematerial, and this mix hasto be accounted for in assigning parameters for engineering design.Mass strength, deformability and permeability of rock masses arecontrolled largely by the fracture network, rather than intact rockproperties; the permeability of intact rock might be 10−11 m/sec,which could be thousands of times lower than for the fracturedrock mass.
5.3 Origins of properties
5.3.1 Fundamentals
The strength of soil and rock (geomaterials) is derived from frictionbetween individual grains, from cohesion derived from cementation

filling pore spaces and from inter-granular bonds such as thoseformed by pressure solution (Tada & Siever, 1989). The strengthand deformability of soil is also a function of the closeness ofpacking of the mineral grains. Densely packed soil will be forcedto dilate (open up) during shear at relatively low confining stresses asthe grains override one another and deform, and the work doneagainst dilation provides additional strength. The same principlesapply to rough rock joints or fractured rock masses. Different miner-als may also have fundamentally different properties – some aremore chemically reactive and may form strong chemical bonds inthe short term, some are readily crushed or scratched, whilst othersare highly resistant to damage or chemical attack. Some, such as talcand chlorite, are decidedly slippery and if present on rock joints canresult in instability.The huge range of properties in soil and rock and how these
evolve with time is illustrated by a single sample in Figure 5.1. Theleft-hand picture shows a graded series of sediments. The sandhorizons become finer upwards, as is typical of sediments depositedfrom a river into a lake. At the top of the sample, there is a secondsand horizon that has been deposited onto the underlying sediment.This has deformed the underlying sediments, producing a loadingstructure, which shows that the soil was in a very soft state at thetime of formation. Contrast this with the rear of the same sampleshowing conchoidal fractures in what is actually extremely strongrock. The conversion from soft mud to rock has occurred over along time but has occurred naturally and, in practical geotechnicalengineering, we encounter and need to deal with the full range ofmaterials, transitional between these end members.
Figure 5.1(a) Graded,probably seasonalbedding with clearevidence of softsedimentdeformation. (b)Rear of the samesample withconchoidalfractures indicatingthe strength of thisrock (probably ofthe order of300 MPa).
186 Practical Engineering Geology
a) b)

5.3.2 Friction between minerals
Strength at actual contact points between grains of soil or rock islargely derived from electrochemical bonds over the true area of con-tact, which is only a very small proportion of the apparent cross-sectional area of a sample. At each contact between grains, elasticdeformation, plastic flow and dissolution may take place, spreadingthe contact point so that the actual contact area is directly proportionalto normal load. The attractive force over the true area of contact givesrise to frictional behaviour (Hardy & Hardy, 1919; Terzhagi, 1925;Bowden & Tabor, 1950, 1964). Bowden & Tabor, in particular,established that the area of asperity contact changed linearly withnormal load for metals by measuring electrical resistance across thejunctions. Power (1998) carried out similar tests using a graphite-based, rock-like model material (Power & Hencher, 1996).The lower-bound friction angles for dry samples of quartz and calcite is
reportedly about 6 degrees but higher when wet (Horn & Deere, 1962).The opposite behaviour was reported for mica and other sheet minerals.Perhaps linked to Horn & Deere’s observations, mineral species thatreportedly give higher friction valueswhenwet are the sameminerals thatcommonly form strong bonds during burial diagenesis through dissolu-tion and authigenic cementation (Trurnit, 1968). It is possible that thepresence ofwater allows asperity contacts to grow in theseminerals, evenin laboratory tests. Converselymica, chlorite and clayminerals are rarelyassociated with pressure solution bonding and inhibit pressure solutionand cementation of quartz (Heald & Larese, 1974). Some authors havequestioned whether Horn & Deere’s data are valid because of possiblecontamination and natural soil does not exhibit the same phenomena(Lambe&Whitman, 1979), but there is other evidence that basic frictionof rock-forming minerals can be so low. Hencher (1976, 1977) usedrepeated tilt tests on steel-weighted, saw-cut samples of sandstone andslate to reduce the sliding angle from about 32 degrees to almost12 degrees, which is approaching the low values of Horn and Deere.The reduction in strength was attributed to polishing (Figure 5.2).
5.3.3 Friction of natural soil and rock
Whilst basic friction the lower bound of minerals, originating fromadhesion at asperities, might be of the order of 10 degrees or evenlower, friction angles even for planar rock joints and non-dilational soilare often greater than 30 degrees yet the additional resistance (abovebasic) is still directly proportional to normal load. This additional fric-tional component varies with surface finish of planar rock joints and canbe reduced by polishing (Coulson, 1971) or by reducing the angularity ofsand (e.g. Santamarina&Cho, 2004). Figure 5.3 shows results from twoseries of direct shear tests on saw-cut and ground surfaces of granite. As
Geotechnical parameters 187

shown in Figure 5.2, at a microscopic scale such ground and apparentlyflat surfaces are still rough. Each data point in Figure 5.3 is taken from aseparate test with the sample reground beforehand. The upper line(inclined at 38 degrees) is the friction angle measured for moderatelyweathered (grade III) rock; the lower line inclined at 32.5 degrees is forslightly weathered (grade II) rock. The reason for the higher strength forthe more weathered surface is because the surface finish is slightlyrougher, the weathered feldspars being preferentially plucked from thesurface during grinding. The key observation, however, is the precisionof the frictional relationships – an increase in strength that is directlyproportional to the level of normal load. Scholtz (1990) reviews theorigin of rock friction and concludes that the additional strength isderived from deformation and damage to small-scale textural roughness.It is quite remarkable that this interlocking, non-dilational componentstill obeys Amonton’s laws of friction.The third contact phenomenon is dilation. Additional work is done
against the confining normal load during shear as soil moves from a
Saw-cut, ground surface (220 grade diamond wheel)
Surface after more than 3 m sliding in tilt test| 0.0025 mm
0.025 mm
Figure 5.2 Groundand polished saw-cut surface ofDelabole Slate athigh magnification(top) and followingrepeated slidingtests (bottom).
y = 0.64x
y = 0.77x
0
500
1000
0 500 1000 1500
She
ar s
tres
s, k
Pa
Normal stress, kPa
Saw-cut granite #60 carborundum
grade II dry
grade II wet
grade III wet
Figure 5.3 Perfect linear, frictional relationships between shear strength and normal stress for saw-cut and ground surfaces of rock. The upper line (stronger) is for moderately weathered granite, thelower for stronger, slightly decomposed rock. This paradox is explained by the fact that in the gradeII rock the various mineral grains are of similar scratch resistance and therefore the surface takes abetter polish during grinding than the more heterogeneous grade III rock.
188 Practical Engineering Geology

dense to a less dense state or as a rock joint lifts over a roughnessfeature. If the raw strength data from a test are plotted against normalstress, then the peak strength envelope may show an intercept on theshear strength axis (apparent cohesion), albeit that the peak strengthenvelope may be very irregular, depending upon the variability of thesamples tested. If corrections are made for the dilational work duringthe test, in many cases the strength envelope will be frictional: thestrength envelope passes through the origin. At very high stresses, alldilation will be constrained and the soil or rock asperities will be shearedthrough without volume change. These concepts are illustrated sche-matically in Figure 5.4.
5.3.4 True cohesion
Rocks and natural soil may also exhibit true cohesion, due to cementa-tion and chemical bonding of grains. For a rock joint, it is derived fromintact rock bridges that need to be sheared through. This additionalstrength, evident as resistance to tension, is essentially independent ofnormal stress and proportional to sample size. This is discussed furtherbelow.
5.3.5 Geological factors
In Chapter 1 (Figure 1.5), the concept of a rock cycle was introducedwhereby fresh rock deteriorates to soil through weathering and thensedimented soil is transformed again into rock through burial,compaction and cementation. Clearly, at each stage in this cycle thegeomaterials will have distinct properties and modes of behaviour.
Figure 5.4Measured strengthenvelope withapparent cohesionand friction, whichcan be corrected toa basic friction line(non-dilational).
She
ar s
tren
gth
Measured peak strength (φ + i)
Dilational work
Frictional resistance
Normal stress
area of interlock‘apparent’cohesion
Lower boundmineral friction
Texturalinterlocking:deformation anddamage
i
true area of contact
φ
Geotechnical parameters 189

5.3.5.1 Weathering
In fresh igneous and metamorphic rocks, the interlocking mineralgrains are linked by strong chemical bonds. As illustrated inFigure 5.5, there is almost no void space, although there may besome tiny fluid inclusions trapped within mineral grains. As weath-ering takes place close to the Earth’s surface and fluids pass through therock, it develops more voids as minerals decompose chemically andweathering products such as clay are washed out. The bonds betweenand within individual grains are weakened. Figure 5.6 illustrates howrock that starts off with a dry density of about 2.7Mg/m3 (typical ofgranite) becomes more and more porous so that by the completely
Figure 5.5 Thinsection throughgranite, illustratingtightly interlockingfabric. Width ofview approximately20mm.
grade VIResidual soil(collapsed)
gradeIV
Freshgrade I
grade VCompletely decomposedbut with original rock fabric
Degree of weathering
2.7
2.0
1.2
Dry
den
sity
, Mg/
m3
soil-like
rock
II
III
Figure 5.6 Change of dry density in weathered granite. The lowest value is for grade V, completelydecomposed material, at which stage the density can be as low as 1.2 despite still having theappearance of granite (fresh state 2.7). At that stage, the material is prone to collapse to a denser,reworked, grade VI state. Based on Lumb (1962).
190 Practical Engineering Geology

decomposed stage, the dry density may be reduced by more than50% if weathering products have been washed out. The final stage iscollapse to residual soil and an increase in density. Weathering isdiscussed in detail in Chapter 3.Geotechnical properties at the material scale are linked quite closely
to density empirically and, therefore, degree of deterioration from therock’s fresh state. Fresh granite might have a uniaxial compressivestrength of perhaps 200 MPa but by the time the rock is highlydecomposed the strength is reduced to 10–15 MPa and when comple-tely decomposed perhaps 10–15 kPa. Where the rock is relativelystrong, then properties and behaviour will be dominated by containedfractures; for most projects, the point at whichmaterial strength beginsto dominate design decisions is where the rock can be broken by hand.At the mass scale in weathered profiles, strength and deformation
might be affected by the presence of strong corestones of less weath-ered rock in a weakened matrix, and the problem of characterisation issimilar to that of mixed soils and rock such as boulder clay or boulderlandslide colluvium, as discussed later.Permeability in fractured rock or in weathered profiles can be extre-
mely variable and difficult to predict, with localised channel flowproviding high permeability. Elsewhere, accumulations of clay or gen-eral heterogeneity in the profile can prevent and divert water flow. Thecomplexities of flow through weathered rock profiles and difficulties inmeasuring permeability are discussed in Chapters 3 and 4.
5.3.5.2 Diagenesis and lithification (formation of rock from soil)
As discussed in Chapter 3, soil is transported by water, wind or gravityfrom the parent rock.During the process of transportation, the sedimentis sorted in size. Some soils such as glacial moraine and colluviumremain relatively unsorted. Sediments tend to be continually depositedover a very long period of time, for example, in river estuaries, and eachlayer of sediment overlies and buries the earlier sediment. The under-lying sediment is compacted and water squeezed out. This is termedburial consolidation and is a very important process governing thestrength and deformability of sediments. Grains become better packed,deformed and may form strong chemical bonds with interpenetrationand sutured margins. Voids may be infilled with cement precipitatedfrom soluble grains in the sediment (authigenic cement) or from solu-tions passing through the sediment pile, as illustrated in Figures 5.7and 5.8. Many clay oozes initially have a very high percentage of voids,with the mineral grains arranged like a house of cards. With time,overburden stress and chemical changes cause the flaky minerals toalign and the porosity (or void ratio) to decreasemarkedly, as illustratedin Figure 5.9. Burland (1990) has expressed the rate at which void ratiois reducedwith burial depth as a normalised equation although there are
Geotechnical parameters 191

often departures from this behaviour in natural sediment piles, duelargely to cementation (Skempton, 1970; Hoshino, 1993). The changesin property (especially strength and deformability) that ensue fromburial, compaction and consolidation are discussed in Section 5.5. Atsome locations, the upper part of the sediment pile is considerablystronger than might be anticipated from its shallow burial level becauseit has become desiccated on temporary exposure above water level.Where soils are uplifted and upper levels eroded, or otherwise loaded,and then that load removed (e.g. by the melting of a glacier), then thestrength and stiffness will be relatively high and the soil is termed
Figure 5.7Compaction andcementation ofgranular soils withburial leading toincreased strength,reduceddeformability andlower permeability.
Figure 5.8 Thin section of aeolian sandstonewith rounded grains of quartz, interpenetration of grainsand flattened surfaces where in contact, with some pressure solution, plus authigenic cementation ofgrains by silica and iron oxides. As a result of these diagenetic processes, the material has been turnedfrom loose sand into a strong rock. Triassic Sandstone, UK. Large grains about 5mm in diameter.
192 Practical Engineering Geology
0% 35%Decreasing porosity
Sutured contacts, strongpressure solution bondsand secondary cement
Compacted, long contacts,some interpenetration andauthigenic cement
Loose sand withtangential contacts
Burialdepth
Lithifi
catio
n

overconsolidated. In the case of sand, the history of burial compactioncan result in an extremely dense arrangement of the sand particles thatcannot be replicated in the laboratory. Such locked sands, with grainsexhibiting some interpenetration and authigenic overgrowths, not sur-prisingly, have high frictional resistance and dilate strongly under shear(Dusseault & Morgenstern, 1979).
5.3.5.3 Fractures
Natural fractures occur in most rocks close to the Earth’s surface and inmany soils once they begin to go through the processes of burial andlithification. Figure 5.10 shows a quarry face where discontinuities dom-inatemass geotechnical parameters such as deformability and permeabil-ity. Vertical joints in relatively young glacial till are shown in Figure 5.11.Fractureswill often dominate fluid flow through themass, aswell asmassdeformability and strength. They need special consideration and char-acterisation, as addressed in Chapters 3 and 4 and discussed later.
5.3.5.4 Soil and rock mixtures
Many soils such as glacial boulder clay and colluvium comprise amixture of finer soil and large clasts of rock, and these need special
Figure 5.9 Compression curves for naturally consolidated and partially cemented clay (modifiedfrom Skempton, 1970).
Geotechnical parameters 193
Depth
Approx 100 mmbelow sea bed
Voi
d R
aito
3 10 30 100 300 1,000
20
0
1
2
3
4
5
40
50
60
Poro
sity
70
75
BakuPo Valley
Detroit
Oceancores
St Andrew BayOslofjord
A-33A-31B-87
C-18
Drammen
DarammenAvonmouthPisaGosportG. of Mexico
TilburyÄlvängen
Grangemouth
KambaraMilazzoS. Joaquin
80
3,000 m
%

Figure 5.10Predominantlyvertical jointing(probablycombined coolingand tectonic duringemplacement) ingranite. MountButler Quarry,Hong Kong.
Figure 5.11Vertical jointsdeveloped inboulder clay. RobinHood’s Bay, NorthYorkshire, UK.
Zone of sparse jointing
Zone of intense jointing

consideration in terms of their properties.Weathered rocks can similarlycomprise mixes of weak and hard materials but there is also the addedcomplication of relict rock fabric and structure. The overall nature of themass will strongly affect the options for engineering assessment, asillustrated for slopes in Figure 5.12. Geotechnical parameter determina-tion for such mixed deposits is considered in Section 5.8.
5.4 Measurement methods
Methods of testing soil and rock are specified in standards such as BS1377 for soil in the UK (BSI, 1990), BS 5930 for several field tests (BSI,1999) and ASTM, more generally in the USA. The International
Figure 5.12Options for slopestability analysis.After Hencher &McNicholl, 1995.
Geotechnical parameters 195
4. Treat as discontinuous due to structural control
3. Treat as heterogeneous (continuum)
1. Treat as uniform (continuum)
• parameters from laboratory or in situ tests taken to be representative of zone
• allowance made for influence (but not control) of discontinuities on mass properties (e.g. Hoek-Brown)
• consideration given to influence of strong inclusions with deviated failure paths
• discontinuity controlled
Option Schematic diagramApproach for
defining parametersand analysis
2. Treat as uniform but weakened by discontinuities (continuum)

Society for Rock Mechanics provides guidance on many field andlaboratory tests (Ulusay & Hudson, 2006). Recommendations forthe same test sometimes differ, for example regarding sample dimen-sions and testing rate, so care has to be taken that an appropriatemethod is being adopted and referenced. Furthermore several differenttechniques or different equipment can sometimes be used ostensibly tomeasure the same parameters but inevitably with different results.For example, small strain dynamic tests may give very differentvalues for soil stiffness compared with large-scale loading tests buteach might be appropriate to some aspect of numerical analysis anddesign within a single project (Clayton, 2011). It should also beremembered that, however much they are standardised, all tests onsoil and rock are experiments. There will be many variables, not leastthe geological nature and moisture content of the sample to be tested,so interpretation is always necessary. Further judgement is requiredbefore attempting to apply small-scale results at the larger scale(e.g. Cunha, 1990).
5.4.1 Compressive strength
Intact rock, clay and concrete are generally classified in shorthand bytheir unconfined (or uniaxial) compressive strength (UCS) as discussedin Chapter 4. Compressive strength is not a relevant concept for purelyfrictional materials such as sand, which must be confined to developshear resistance. Indicative UCS values for various materials are pre-sented in Table 5.1; fresh rock is often considerably stronger than thehighest strength concrete. For concrete, UCS is used as a qualityassurance test on construction sites.In a UCS test the axial stress is σ1 and the confining stresses (σ2 and
σ3) are zero. Despite the apparent loading condition, the sample doesnot actually fail in compression but either in tension or in shear or insome hybrid mode. If the sample contains adverse weak fabric such asincipient joints or cleavage, then the sample will fail at lower strengththan it would without the flaws. UCS is really essentially an index testused especially in rock mass classification. In practice strength canoften be estimated quite adequately using index tests such as hittingwith a geological hammer (see Box 5-1). UCS can also be measuredusing point load testing, which is quick and easy, but correlation withUCS from laboratory testing may be imprecise. The Schmidt hammeris sometimes used to estimate strength using standard impact energy tomeasure rebound from a rock or concrete surface. It is sensitive tosurface finish and any fractures behind the impact location will causelow readings. It is also insensitive to strength over about 100 MPa. It isgenerally unsuitable for testing rock core – its main use in engineeringgeology is as an index test to help differentiate between differentdegrees of weathering as discussed in Chapter 4.
196 Practical Engineering Geology

Table 5.1 Indicative unconfined compressive strengths for some rock, soil and concrete.
Material Uniaxial Compressive Strength, UCS MPa
Natural rock and soil
Fine-grained, fresh igneous rock such as dolerite,basalt or welded tuff, crystalline limestone
>300 Rings when hit with geologicalhammer
Grade I to II, fresh to slightly weathered granite 100–200 Difficult to break with hammer
Cemented sandstone (such as Millstone Grit) 40–70Broken with hammer
Grade III, moderately weathered granite 20–40
Chalk
Grade IV highly weathered granite
5–30 Readily broken with geologicalhammerWeaker material broken by hand
Overconsolidated clay 0.6–1.0 Difficult to excavate with handpick
Very stiff clay-rich soil 0.3–0.6 Indented with finger nail
Concrete
High-strength concrete (e.g. Channel Tunnelliner)
50–100
Typical structural concrete 30–50
Shotcrete in tunnel 20–40
Box 5-1 To test or not to test?
Many ground investigations are wasteful in that they do not target or identify critical geologicalfeatures, and laboratory tests are commissioned without real consideration of whether or not theywill be useful.
Example 1Figure B5-1.1 shows the formation level (foundations) for the Queen’s Valley Dam, Jersey, which wascompleted in 1991. The damwas to be an earth dam, which exerts relatively low stresses on its foundations,compared to a concrete dam such as an archor gravity dam.With amaximumheight of 24mandan assumedunit weight of 20 kN/m3, the bearing pressure might be of the order of 500 kPa. The author, who wasmapping the foundations, was asked to select samples of core to be sent to the laboratory for uniaxialcompressive strength testing.Rock over much of the foundation was rhyolite that was extremely difficult to break by geological
hammer and had an estimated compressive strength of more than 300 MPa. The rhyolite, however,contained numerous incipient fractures (Figure B5-1.2), which would mean that the mass strengthwas somewhat lower and, more significantly, would cause samples to fail prematurely in thelaboratory. The author argued that if the samples were sent to the laboratory, the reported resultwould simply be scattered with a range from 0 to 300 MPa and what would that tell us that wedidn’t already know? The allowable bearing pressure for rock of this quality (Chapters 6) would beat least five times the bearing pressure exerted by the dam. In the event, the samples were still sent offto the laboratory for testing (because they had already been scheduled by the design engineers) andthe money was duly wasted.
Geotechnical parameters 197

Example 2The Simsima Limestone is the main founding stratum in Doha, Qatar, and is found extensively across theMiddle East. It is a highly heterogeneous stratum including calcarenite, dolomite and breccia. The rock isoften vuggy and re-cemented with calcite. RQD can be very high, with sticks of core a metre or more inlength without a fracture; elsewhere the RQD is zero. An example is shown in Figure B5-1.3.The properties of the stratum are clearly important for design of foundations and for other projects
such as dredging, as discussed in Chapter 3. UCS test data tend to be very scattered, in part because theintegral flaws inmany samples lead to early failure. If a strongly indurated sample with few flaws is tested,
Figure B5-1.2 Extremely strong rhyolite. Hammer and clipboard for scale.
Figure B5-1.1 View of left abutment of Queen’s Valley Dam, Jersey, UK, under construction.
198 Practical Engineering Geology

then it can give UCS strength of 60 or 70 MPa (higher than structural concrete). Samples ofinherently weaker material (as could be estimated from scratchtesting) or containing vugs or otherflaws, will fail at much lower strengths. A typical range of data is given in Figure B5-1.4. If smallerintact pieces of dolomitised limestone are point load tested selectively, they will, of course, errtowards the higher strength of the rock mass. As a consequence, conversion factors from point loadtest to UCS for this rock are usually taken empirically as 8 to 9 (Khalaf, personal communication).Data converted in this way are included in Figure B5-1.4. For more uniform rocks elsewhere in theworld, conversion factors of about 22 are more commonly applied (Brook, 1993). If such a factorwere to be used for the Simsima Limestone, then it would imply strength for the intact limestone,without flaws, up to about 200 MPa.
Given this very wide range of possible strengths, it would seem unwise simply to rely on astatistical testing campaign for characterising the rock mass. Far better to try first to characterisethe rock geologically into units based on the strength of rock materials and then mass char-acteristics including flaws, degree of cementation and degree of fracturing. In this case, indextests (hammer, knife), combined with visual logging and selective testing of typical facies, arelikely to give a far better indication of mass properties than UCS testing alone. To obtainparameters for the large scale (say foundations) then in situ tests such as plate loading andperhaps seismic tests would help, as would full-scale instrumented pile testing. Where rock massstrength is very important, as for the selection of dredging equipment, then it would be veryunwise to take UCS data at face value (as a statistical distribution). As for many tests, there arenumerous reasons why values measured in the laboratory might be unrepresentative of condi-tions in situ, often too low, and considerable judgement is required if the parameters arecritically important.Lesson: compressive strength ofmost rocks can often be estimated adequately by hittingwith a hammer
and the use of other index tests; if a hard blow by a hammer cannot break the material, then its strengthprobably exceeds that of any concrete structure to be built upon it. Where strength is critical, as in theselection of a tunnelling machine or choice of dredging equipment, then any test data must be examined
Figure B5-1.3 Example of core through Simsima Limestone (courtesy of Karim Khalaf, Fugro, MiddleEast).
Geotechnical parameters 199

critically. If laboratory test samples contain flaws such as discontinuities, then measured intact strengthmay be too low. Of course, at the mass scale, the flaws and joints will be extremely important but theircontribution cannot be properly assessed by their random occurrence and influence on laboratory testresults.
UCS
Ele
vati
on
(m
QN
HD
)
–25
–24
–23
–22
–21
–20
–19
–18
–17
–16
–15
–14
–13
–12
–11
–10
–9
–8
–7
–6
–50.1
Unconfined compressive strength (MPa)1 10 100
IS(50)-->UCS
Very Weak Weak Mod Weak Mod Strong Strong
Figure B5-1.4 Typical UCS data from Simsima Limestone (courtesy of KarimKhalaf, Fugro, Middle East).
200 Practical Engineering Geology

5.4.2 Tensile strength
Although rocks actually usually fail in tension rather than compres-sion, tensile strength is rarely measured directly or used in analysis ordesign, compressive strength being the preferred parameter for rockmass classifications and empirical strength criteria (see later). Tensilestrength of rock and concrete is relatively low, typically about 1/10th ofUCS. It is because of the weakness of concrete in tension that reinfor-cing steel needs to be used wherever tensile stresses are anticipatedwithin an engineering structure.
5.4.3 Shear strength
Shear strength is a very important consideration for many geotechnicalproblems, most obviously in landslides where a volume of soil or rockshears on a slip surface out of a hillside. It is also important for thedesign of foundations and in tunnelling (Chapter 6). There are twomain types of test used to measure shear strength in the laboratory –
direct shear and triaxial testing. There are also many other in situ testsused to measure shear strength parameters, either directly (e.g. vanetest) or indirectly (e.g. SPT and static cone penetrometer tests), andthese have been introduced in Chapter 4.For persistent (continuous) rock discontinuities, direct shear
testing is the most appropriate way of measuring shear strength.Details of testing and interpretation are given in Hencher & Richards(1989) and Hencher (1995). Because of the inherently variableroughness of different natural samples, dilation needs to be measuredand results normalised, as discussed later. If this is not done then, inthe author’s opinion, the tests are usually a total waste of time.The details of a shear box capable of testing rock discontinuities andweak rocks with controlled pore pressures is described by Barla et al.(2007).Direct shear tests are also carried out on soil and are much easier to
prepare and conduct than tests on rock discontinuities, although thestress conditions are not fully defined in the test, which can cause somedifficulties in interpretation (Atkinson, 2007). This is one reason whytriaxial testing is preferred for most testing of soils. Other advantagesare that factors like drainage and pore pressure measurement can becarefully controlled. A disadvantage is that the soil may well becomedisturbed during trimming and preparation for the test as well asduring back saturation and loading/unloading, but that is a problemfor all testing. In a triaxial test, the cylindrical sample is placed inside acell and then an all-around fluid pressure applied (σ3). This remainsthe constant minimum principal stress throughout the test. Some testsare carried out drained, in that water is allowed to seep out of thesample as it is compressed; in others drainage is prevented, the water
Geotechnical parameters 201

pressure changes as the sample is loaded and can be measured. In sometests the sample is initially loaded and consolidated to a requiredeffective stress in an attempt to simulate the field condition. Once thesample is in equilibrium, it is gradually compressed axially whilst theconfining stress remains constant. The process is illustrated graphicallyusing Mohr stress circles in Figure 5.13. Note that within the sample,the angle between σ1 and σ3 is 90 degrees, but in the Mohr circlepresentation, this stress field is expressed as a hemisphere(180 degrees). The hemisphere represents the stress state on anyplane drawn through the sample. The test proceeds from the statewhere σ1 = σ3, then σ1 is increased (hemispheres grow towardsthe right) until the sample eventually fails. Normal stress on anyplane through the sample is measured on the horizontal axis, shearstress on the vertical axis. The stress normal to a vertical plane throughthe sample is σ3 and the shear stress is zero; the normal stress on ahorizontal plane through the sample is σ1, the shear stress zero. Theseplanes are known as principal planes. For a plane inclined at 10degrees (shown as 20 degrees graphically within the Mohr circle) thenormal stress on that plane is σ10 and at 45 degrees it is σ45, with thecorresponding shear stress (τ), as indicated. At failure, the shear planethrough the sample will be developed at some angle (θ/2 degrees) to thehorizontal, expressed as θ in the Mohr circle graph. The Mohr stresscircle representing the stress state at that stage is shown in Figure 5.14for a single test. Further tests would be carried out on other similarsamples at different confining stresses and used to define a strengthenvelope (a line joining the stress states at which all samples failed).Usually the envelope for a set of samples can be defined in terms offriction (gradient of line) and apparent cohesion, c, which is the inter-cept on the shear stress axis at zero normal stress (Figure 5.4).
σ3
σ1
σ45
τ4545°
σ3
σ1
σ10
σ45σ3
τ10
τ45
σ, Normal stress
τ, S
hear
str
ess
σ1σ1σ10
τ1010°
20°
Figure 5.13Generalrepresentation ofstress conditions inan individualsample.
202 Practical Engineering Geology

5.4.3.1 True cohesion
The nature, origin and even existence of cohesion – strength at zeronormal load – causes considerable debate and confusion. This is partlybecause it can be either apparent (the result of dilation during a test andvarying with confining stress) or a real physical entity and due tocementation, grain bonding or impersistence of discontinuities in therock mass. Quite often both factors contribute to the measured strengthin the same test, for example, if shearing intact rock. In artificiallyprepared samples of remoulded soil there is no true cohesion andapparent cohesion is a function of the density of packing of the soilgrains relative to the confining stress. A theory of critical state soilmechanics has been developed for such soil that links shear strength todeformation characteristics (Roscoe et al., 1958; Schofield, 2006).Burland (2008) however notes the importance of geological history tonatural soils, with the development of bonding and fabric leading to truecohesional, non-dilational and stress-independent strength. WhileBurland was really discussing relatively young soils, it has been demon-strated earlier (Figure 5.1) how, with time, true cohesion can becomevery high and far outweigh the contribution of friction to shear strength.Conversely, as rock is gradually weathered it is primarily the cohesionalstrength that is lost – friction remains essentially constant.
5.4.3.2 Residual strength
Afterhighsheardisplacement, cohesion is lost, andshearingcontinuesataresidual friction level. This is non-dilational friction but in nature can belower than the critical state – also non-dilational – because of change instructurewith, for example, flattening and alignment of particles in a clayorthedevelopmentofhighlypolishedshearsurfaces.Suchstrengthscanbevery low (sometimes of the order of 7 degrees for montmorillonite clay-rich rocks) and very significant, especially for landslides (see discussion ofCarsingtonDam failure inChapter 7). To test residual strength, torsional
Figure 5.14Mohr circle at shearfailure.
σ3
σ1
σfφ°
τfθ/2°
Test 1
σ, Normal stress
τ, S
hear
str
ess
θ°σ3 σ1
c
Test 2
Geotechnical parameters 203

ring shear boxes are used, inwhich anannulus-shaped sample is preparedand then rotated until a constant low strength is obtained.
5.4.4 Deformability
Young’s Modulus (E) is expressed as stress/strain (with units of stress)and is a key parameter for predicting settlement of a structure ordeformation in a tunnel and needs to be defined at a mass scale. Forsoil, samples are consolidated in oedometers andmeasurements taken ofdeformation against time. Themain derived parameters are mv, which isan inversion of E, i.e. strain/stress, and Cc, which is a measure of rate ofconsolidation. For normally consolidated clay that has been simplyburied by overlying sediment, there will be a gradual improvement instrength and stiffness with depth, as illustrated for natural soils inFigure 5.9. Soil that has been overconsolidated because of its geologicalhistory will exhibit relatively high stiffness up to the loading levelcorresponding to its earlier pre-consolidation stress state. Once thatpressure is exceeded, the stiffness will revert to the natural consolidationcurve. At very small strains, overconsolidated clay can be much stifferthan at higher strain levels, and this can be important for realisticmodelling of excavations (Jardine et al., 1984; Clayton, 2011).Geophysical testing can be used to interpret stiffness parameters fromvelocities of wave propagation through soil, and values are again on thehigh side compared to static tests at relatively high strains (Mathewset al., 2000). The same is true of rock masses – interpretation ofcompressional or shear velocities tend to give higher stiffness valuesthan do static loading tests, and this probably reflects the low strainnature of loading from transient dynamic waves (Ambraseys &Hendron, 1968). Because of the difficulties in determining E at therock mass scale from first principles or testing, it is common to rely onempirical published data as discussed at 5.6.3.
5.4.5 Permeability
Permeability is an intrinsic parameter of soil and rock, relating to ratesof fluid flow through the material and strictly varies according to thefluid concerned – e.g. oil, water or gas. It has dimensions of area (L2).In hydrogeology and geotechnical engineering, the term permeability isgenerally used interchangeably with hydraulic conductivity and is thevolume of water (m3) passing through a unit area (m2) under unithydraulic gradient (1m head over 1m length) in a unit of time (persecond). This reduces to m/s. For low permeability rock suitable for anuclear waste repository, the permeability, k, might be 10-11 m/s. Foran aquifer of sandstone suitable for water extraction, it might be 10-6
m/s and for clean gravel 10-1 m/s. Typical values for other soils aregiven in BS 8004 (BSI, 1986).
204 Practical Engineering Geology

In some soil such as alluvial sand, the material permeability could besimilar to that of the mass, so laboratory testing might be relevant, butfor many ground profiles water flow will be localised and involvenatural pipes, fissures and open joints or faults. Field tests are thengenerally necessary to measure mass-scale permeability, as outlined inChapter 4. Large-scale pumping tests from wells with observationalboreholes at various distances can give reliable parameters for aquiferbehaviour but localised testing in boreholes, as specified in BS 5930(BSI, 1999), can be unreliable (Black, 2010). As discussed inChapters 3 and 6 and illustrated in examples in Chapter 7, localisedgeological features often control fluid flow through the soil or rockmass, so testing must be linked to relevant geological and hydrogeo-logical models.
5.5 Soil properties
5.5.1 Clay soils
As Skempton (1970) showed (Figure 5.9), for clay soil deposited off-shore at rates of perhaps 2m per thousand years, consolidation beha-viour due to self-weight is fairly well defined. As the porosity diminishesand water is squeezed out, so strength increases and deformabilityreduces, even in the absence of other diagenetic processes. Hawkinset al. (1989), for example, show a consistent linear increase in shearstrength with depth over 20m at a test site in Bothkennar, Scotland,based on vane tests. Cone test data from the same site are very similar toother sites in the UK, confirming the trend. Similar results have beenachieved from other sites worldwide, with a typical relationship:
su ¼ 10þ 2:0d
Where su=undrained shear strength, kPa andd=depthbelowground,m.Elsewhere, values can be somewhat lower; for the Busan Clay in
Korea, the gradient is closer to 1.0 times depth (Chung et al., 2007).Nevertheless the trend is similar so for design in soft to firm clay it isusual practice to carry out a series of vane tests down boreholes or conepenetrometer soundings, and then try to define a relationship of increas-ing strength with depth that can easily be input to numerical simula-tions. Relationships are published both for shear strength and modulusof clay interpreted from SPT tests, and these are reviewed in Clayton(1995) although the SPT is less appropriate for clay than for granularsoils. Most of the values obtained from field tests are necessarilyundrained and expressed as a value of apparent cohesion with nofrictional component. Undrained shear strength of clay can also beobtained from undrained tests in the laboratory and is estimatedduringfield description using index tests like resistance to finger pressure
Geotechnical parameters 205

or in a rather more controlled way using a hand penetrometer, asdiscussed in Chapter 4. Undrained strength is useful for assessing thefundamental behaviour of clay empirically, for example, in designingfoundations (Table 6.1). It is also used for numerical analysis in soils oflow permeability immediately after or during construction. Converselydrained conditions apply where excess pore pressures have dissipatedfollowing construction or where they dissipate relatively rapidly duringconstruction. For design of structures in clay under drained conditions,effective stress parameters are required – friction and possibly somecohesion where there has been some geological bonding. These para-meters are generally obtained from triaxial testing, in which pore pres-sures are monitored and corrected for throughout the test (e.g. Craig,1992). Effective stress parameters can also be interpreted from in situpiezocone penetrometer soundings (Chapter 4).Laboratory tests are relied upon for characterising natural clay far
more than for any other soils, because reasonably undisturbed samplescan be taken and the small grain size relative to testing apparatus meansthat scale effects are not evident. An exception is in settlement analysis,where it is found that standard oedometer tests give lower stiffness thanlarger-scale plate load tests or are evident from back analysis of theconstruction of a structure. Specialised testing is necessary to simulatelow strain deformation (e.g. Atkinson, 2000).As noted earlier, for some active and ancient landslides, the strength
along the slip plane through clay/mudstone is reduced below thecritical state friction angle to a residual friction angle well below20 degrees, even for clay of relatively low plasticity such as kaoliniteor illite (Skempton et al., 1989). Such low values can be measured inthe laboratory using ring shear boxes and back-analysed from land-slide case histories.Clays include some groups of very problematical soils. Quick clays
are clay and silt size but mostly detrital materials (rock flour producedby glacial scour), weakly cemented by salt, which can become dis-turbed and then flow, sometimes to disastrous effect. The Rissa,Norway, landslide in 1978 was filmed, flowing rapidly across flatground, indicating the sensitivity of such materials. Other clays suchas black cotton soils swell and shrink dramatically with changes inmoisture, which causes damage to roads and other structures. The claymineral group smectite (montmorillonite/bentonite) is most commonlyassociated with volume change and is typically identified by X-raytesting. Its presence is also indicated from high liquid limits and highplasticity indices in Atterberg limit tests (Chapter 3). These clay miner-als can have very low shear strengths. Starr et al. (2010) describe acreeping major rock slope failure where the rock is smectite-rich andfor which the operating residual friction angle was only about 7degrees as established by numerical back-analysis and confirmedfrom laboratory tests.
206 Practical Engineering Geology

5.5.2 Granular soil
The behaviour of granular soil such as silt, sand and gravel can beexamined in the laboratory but for design, geotechnical parameters aregenerally determined by in situ testing, because of the difficulties of a)obtaining and transporting undisturbed samples and b) the problemsof scale effects in testing samples of large grain size.The most common test for characterising silt, sand and gravel is the
SPT, as discussed in Chapter 4. Measured resistance needs to becorrected for various influences, including overburden pressure andthe silt content of sand. Resistance may be affected by water softeningin the base of a borehole. Details are given in Clayton (1995). SPT N-values are used to infer a range of properties, including density (unitweight), friction angle and deformability which are then used for thedesign of many types of structure, including foundations, retainingwalls and slopes. CPT tests can also be used in this way and areparticularly useful for the design of offshore structures.
5.5.3 Soil mass properties
Usually, properties of intact soils of sedimentary origin are assumed tobe representative of the larger soil mass layer or unit. This can be anover-simplification in that even quite recent soils can contain fracturesand systematic joints andmany are layeredwith different layers havingdifferent properties. In the latter case, permeability parallel to beddingmight be orders of magnitude higher than at right angles to bedding,and there are many geotechnical situations where such a conditionwould be important. McGown et al. (1980) discusses origins of frac-tures in soil and how they might be dealt with when assessing geotech-nical properties. London Clay, for example, contains many fissuresthat can be interpreted using structural geological techniques (Fookes& Parrish, 1969). Chandler (2000) describes the significance of bed-ding parallel flexural-slip surfaces extending at least 300m in LondonClay. Similar features are discussed by Hutchinson (2001).
5.6 Rock properties
5.6.1 Intact rock
5.6.1.1 Fresh to moderately weathered rock
Fresh to moderately weathered rock, by the definitions adopted here(Chapter 3 and Appendix C), cannot be broken by hand at the intactsample scale, as in a piece of core. That being so, it has an unconfinedcompressive strength of at least 12.5 MPa and is definitely rock-like inthat it could carry most structures without failing (presumed bearingcapacity of at least 1 MPa according to Table 6.1) and will not fail in a
Geotechnical parameters 207

man-made slope, in the absence of discontinuities, almost irrespectiveof height and steepness.The strength of fresh rock is a function of its mineralogy, internal
structure of those minerals (cleavage), grain size, shape and degree ofinterlocking, strength of mineral bonds, degree of cementation andporosity. Some rocks have intact strength approaching 400 MPa –
thesemight include quartzite, welded tuffs and fine- andmedium-grainedigneous rocks such as basalt and dolerite. Corresponding intact modulican be as high as 1 x 10⁶ MPa (1 x 10³ GPa) (Deere, 1968).Compressive strength is measured most accurately using very stiff
servo-controlled loading frames, whereby, as the rock begins to fail, sothe loading is paused to limit the chance of explosive brittle failure.Such test set-ups allow the full failure path to be explored, which canbe important in underground mine pillars where, despite initial failurein one pillar, there may be sufficient remnant strength after load istransferred to adjacent pillars, so that overall failure of the mine leveldoes not occur. For most civil engineering works, UCS values mea-sured by less sophisticated set-ups are adequate. Nevertheless, thespecification for UCS testing is onerous, particularly regarding testdimensions and flatness of the ends of samples. If these requirementsare not followed, local stress concentrations can cause early failure. Ifsamples are too short, then shear failuremight be inhibited. As noted inBox 5-1, there are alternative ways of estimating UCS that might beadequate for the task at hand.UCS is the starting point for many different empirical assessments of
rock masses, including excavatability by machinery such as tunnelboring machines. Other parameters that might need to be quantifiedinclude abrasivity and durability. Appropriate tests are specified in theISRM series of recommended methods (Ulusay & Hudson, 2006).Intact rock modulus is rarely measured for projects and is not
usually an important parameter for design. An exception is in numer-ical modelling of fractured rock mass, e.g. using UDEC (Itasca), wherethis parameter is required, but for this purpose, values are typicallyestimated from published charts or even selected to allow the model tocome to a solution within a reasonable time. Models tend to beinsensitive to the chosen parameter.
5.6.1.2 Weathered rock
Intact weathered rock has true cohesion from relict mineral bonding.In some cases there may be secondary cementation, especially fromiron oxides and the redistribution of weathering products within therock framework. At the strong end of grade IV where it can just bebroken by hand UCS might be about 12.5 MPa and cohesion of about3 MPa might then be anticipated (Hencher, 2006). In practice, suchhigh values have never been reported. Ebuk, who tested a range of
208 Practical Engineering Geology

weathered rocks in direct shear, measured amaximum cohesion of 300kPa for grade IV samples (Figure 5.15) but may have only been testingthe weaker range of grade IV.For design, parameters for weathered rock are often estimated from
SPTN-value data. Tests are often continued to 100 or even 200 blows,which is questionable practice for many reasons, not least damage toequipment. In terms of rock mass modulus, E, a typical relationshipadopted for design is:
E ¼ 1:0 to 1:2N MPa ðHencher & McNicholl; 1995Þ
For foundation design, parameters such as side friction and end bear-ing are also often estimated from empirical relationships linked to SPTdata. Full discussion of practice in Hong Kong is given in GEO (2006).
5.6.2 Rock mass strength
The presence of discontinuities in many rocks means that intact rockparameters from the laboratory are inappropriate at the field scale.
Figure 5.15Peak strengthenvelopes forgrades IV, V and VIgranite (based onEbuk, 1991). It ishighly likely thatEbuk (and others)have not carried outor reported tests onstronger grade IVmaterials (or if so,the author has notseen them).
0 100 200 300 400 500 600 700 800 900 1,000
1,000
900
800
700
600
500
400
300
200
100
0
Tests at natural moisture content
She
ar s
tres
s k
Pa
Normal stress, kPa
grade V
grade IV-Vtransition
grade IV
Upper limit forstrength of samplestested by Ebuk, 1991theoretical
cohesion atgradeIII/IVboundary
(3.5 MPa forσC = 12.5MPa)
Geotechnical parameters 209

Therefore, many attempts have been made to represent the overallstrength of the rock mass using simple Mohr-Coulomb parameters, fric-tionandcohesion,basedonoverall rockquality,usingclassifications suchas those presented in Appendix C. For example, using the Rock MassRating (RMR) of Bienawski (1989), ‘poor rock’would be assigned cohe-sion 1–200kPawith friction angle 15–25 degrees, and ‘good rock’wouldbe assigned cohesion 3–400 kPawith friction angle 35–45 degrees.A rather more flexible and geologically realistic approach is to use
the Hoek-Brown criteria (Hoek& Brown, 1997; Brown, 2008), whichis linked to a Geological Strength Index (GSI) for rating overall rockmass conditions such as ‘blockiness’ and the roughness or otherwise ofdiscontinuities. The GSI chart is presented and discussed in AppendixC. Given a GSI estimate, the uniaxial compressive strength for the rockblocks and a constant, mi, which differs for different rock types andhas been derived empirically from review of numerous test data (Hoek&Brown, 1980), one can calculate a full strength envelope for the rockmass. A program, RocLab, is downloadable from https://www.rocscience.com and allows values for cohesion and friction to becalculated but it needs to be checked that these relate to the appropriatestress level for the problem at hand. For example, Figure 5.16 shows asteep cut slope in weathered tuff. The question is whether it needs to becut back or otherwise reinforced or supported. The rockmass is severely
Figure 5.16 Cutslope throughweatheredvolcanic tuff.
210 Practical Engineering Geology

weathered. There are corestones of very strong tuff but these are sepa-rated and surrounded by highly and completely weathered materialsthat are much weaker. There are many joints and some of these havekaolin infill. In this case, there are no structural mechanisms for transla-tional failure along daylighting joints, and it is a clear candidate forwhere a Hoek-Brown/GSI approach might help the assessment. Fromthe GSI chart, one might best characterise the mass as ‘very blocky’with‘poor’ joint surfaces. The rock type is tuff, so the mi value is 15 (forgranite it would be 33). The difficult parameter is intact strength. In thiscase, the corestones have UCS values in excess of 100MPa, but for thisassessment I have taken into account the strength of the weakest mate-rial making up this slope and, on balance, an average of 5 MPa isconsidered conservative. Using a spreadsheet from Hoek et al. (1995)modified for low stress conditions, the curve shown in Figure 5.17 isobtained. On that basis, for a potential slip surface at a depth of about10m (vertical stress say 0.27 MPa), appropriate strength parametersmight be c = 80 kPa and phi = 46 degrees, as shown. Carvalho et al.(2007) discuss the assessment of rock mass strength where the intactrock has relatively low uniaxial compressive strength in more detail.
5.6.3 Rock mass deformability
Rock mass modulus is very difficult to predict with any accuracy, andmeasurements in boreholes or even by large in situ tests need to beconsidered critically and certainly should not be used directly in designwithout due consideration of the rock qualities of the zone tested(including relaxation) vs. the larger mass volume. Back calculations
0.80.70.60.50.4Normal stress, MPa
She
ar s
tres
s, M
Pa
Rock is very blocky, with poor quality jointsurfaces (GSI = 35)uniaxial compressive strength variable buttake as 5 MPami taken as 15
c = 80 kPaφ = 46°
0.30.20.100
0.1
0.2
0.3
0.4
0.5
Figure 5.17 Strength envelope for slope in Figure 5.16, based on Hoek-Brown criteria (see text).
Geotechnical parameters 211

have been made from large projects, including dams and tunnels, andthese data provide the main database for prediction (e.g. Gioda &Sakurai, 2005). Generally, poor quality, highly fractured rock (up toRMR = 50) will have a rock mass modulus increasing from soil-typevalues of perhaps 500 MPa to about 20GPa with decreasing fracturespacing and increasing intact compressive strength. As the rock massquality improves, so the modulus increases markedly, up to values of60 GPa or so for good-quality rock with RMR = 80. Many authorshave attempted correlations between a variety of rock mass classifica-tions (RMR and Q especially) and rock mass modulus, but withconsiderable scatter. This is perhaps not surprising given the inherentdifficulties of 1) trying to represent an often complex, heterogeneousgeological situation as a single quality number and 2) the non-uniformloading conditions of any project vs. the measurement system(deficiencies of data).Hoek & Diederichs (2006) carried out a detailed review and pro-
posed optimised equations linked to the GSI classification. The best-fitequation obtained was:
EmassðMPaÞ ¼ 105ð1−D=2Þ=�1þ eðð75þ25D−GSIÞ=11Þ
�
where GSI is as taken from the chart in Appendix C (Table C11). ThefactorD = 0 for undisturbedmasses, 0.5 for partially disturbed and 1.0if fully disturbed. Hoek&Diederichs present a more refined version ofthis equation using site-specific data for intact strength and modulus,but in many situations the rock mass will not be uniform, so consider-able judgement is necessary anyway. Richards & Read (2007) triedapplying the Hoek-Diederichs equations to the Waitacki Dam in NewZealand, which was founded on greywacke, and found that the massmodulus was considerably underestimated for a judged GSI of 20, butexamination of their data shows how sensitive any prediction is on theGSI adopted. As discussed elsewhere, features like joint spacing andcontinuity are extremely difficult to measure and characterise and veryrisky to extrapolate from field exposures because of variations withweathering and the structural regime. This all reinforces the needfor considerable judgement and engineering geological expertise inestablishing ground models, and caution when applying any empiricalrelationships.Large-scale pile loading tests can provide data on rockmass deforma-
tion (Hill & Wallace, 2001). They found that published correlationsbased on RMR andQ classifications overestimated the in situmodulusfor deep foundation design by up to one order of magnitude, but thiswas only a significant consideration where the Rock Mass Rating wasbelow 40 (poor and very poor rock masses), and in such cases site-specific testing might be required. As discussed in Chapter 6, the
212 Practical Engineering Geology

increasing use of Osterberg-type jacks embedded in large-diameterbored piles will no doubt provide very useful data in the future forassessing deformability of rockmasses and this, combinedwith sophis-ticated numerical modelling, is allowing refinements to the empiricalapproaches currently in use.
5.7 Rock discontinuity properties
5.7.1 General
The majority of rocks, and some soil masses near the Earth’s surface,contain many discontinuities and these dominate mass properties,including strength, deformability and permeability. Discontinuitiesinclude bedding planes, cleavage, lithological boundaries, faults andjoints. The origins, nature and development of discontinuities arediscussed in detail in Chapter 3. For the rest of this discussion, I willdiscuss joints but this is generally relevant to other discontinuities.Many joints are initiated geologically as incipient weakness directionsand only with time do they develop as full mechanical discontinuities,as illustrated in Figure 5.18 and discussed byHencher&Knipe (2007).In this figure, the incipient cleavage in the slate below the unconformitywith the Carboniferous Limestone generally has cohesion almost ashigh as the rock orthogonal to that cleavage direction. Nearby, how-ever, cleavage and bedding has opened up due to exposure and
Figure 5.18Variabledevelopment ofcleavage andbedding features asmechanicaldiscontinuities.Horton inRibblesdale, WestYorkshire, UK.
Incipientdiscontinuities(cleavage)
Mechanical, ‘infilled’discontinuity
Mechanicaldiscontinuity
(facing arrow)
Geotechnical parameters 213

weathering to form persistent joints with zero cohesion. Also shown isa bedding-parallel surface that is infilled with soil – actually a sedimen-tary feature. At intermediate stages, before rock joints become fullmechanical fractures, sections of incipient fractures are cohesive andwill contribute strongly to shear strength and shear stiffness along thediscontinuity plane. This is illustrated in Figure 5.19. The persistenceand shape of rock joints are very challenging parameters to measure oreven estimate. Rawnsley (1990) tried to relate joint properties such asstyle and persistence to geological origin. He concluded, after studyingnumerous rock outcrops of wide geological age, that whilst persistencecan be typified at the scale of joint sets, it is far less predictable atsmaller scales (Rawnsley et al., 1990). Zhang&Einstein (2010) reviewthe situation and make some suggestions based on measurement,modelling and theory (see also discussion of DFN modelling inChapter 3).
5.7.2 Parameters
The main properties of rock joints that need to be measured or esti-mated are shear strength, normal and shear stiffness and permeability/hydraulic conductivity. These properties depend on the geometry ofthe joints, including roughness, the nature, strength and frictionalproperties of the wall rock and any infill between the walls, and theirtightness or openness.
Figure 5.19 Well-defined daylightingdiscontinuities,clearly only stabledue toimpersistence(cohesion), Taiwan.
214 Practical Engineering Geology

Shear and normal stiffness of rock joints are not parameters that arenormally required for civil engineering design but are needed as inputswhen carrying out numerical simulations of jointed rock masses whereeach joint is modelled discretely using software such as UDEC.Guidanceis given in the UDEC manuals (Itasca, 2004). Permeability of jointsdepends on their openness, tortuosity and connectivity. It is a verydifficult but important subject area, especially for nuclear waste disposalconsiderations and tunnel inflow assessments (Black et al., 2007).
5.7.3 Shear strength of rock joints
When dealing with rock slopes, often any discontinuity that appearsthat could be persistent, is treated as so (ignoring potential cohesionfrom rock bridges). This is a conservative thing to do (see discussion inChapter 6) but there is little alternative. It is generally agreed that theshear strength of persistent joints is derived from some basic frictionalresistance offered by an effectively planar natural joint, plus the workdone in overriding the roughness features on that joint. This isexpressed by the following equation (after Patton, 1966):
τ ¼ σ tanðϕ�b þ i�Þ
where τ is shear strength, σ is normal stress, ϕb° is a basic friction anglefor a planar joint and i° is a dilation angle that the centre of gravity of thesliding slab follows during shear, i.e. the deviation from the direction thatthe shearing would have followed if the plane had been flat and slidinghad occurred along the mean dip direction of the joint. Despite theapparent simplicity of the Patton equation, derivation of the parameterscan be difficult, especially for judging the effective roughness angle. Theavailable international standards and codes deal with this inadequately.
5.7.3.1 Basic friction, ϕb
Basic friction of natural joints can be measured by direct shear testingon rock joint samples, but samples taken from different sections of thesame joint and joint set can be highly variable, particularly in terms ofroughness. Furthermore, it is found that any rough rock joint samplewill give different values for peak strength, depending on the directionof shear under the same normal load. Tests need very careful set up,instrumentation, analysis and interpretation, if they are to make sense.A series of tests on different samples of a joint will often yield very widescatter, which is meaningless without correcting for sample-specificdilation, as described by Hencher & Richards (1989) and Hencher(1995). Dilation reflects work being done in overriding asperities. Thedilation anglemeasured during a shear test will vary, especially accord-ing to the original roughness of the sample and the stress level. It is test-specific, will vary throughout a test and with direction of testing. It is
Geotechnical parameters 215

not the same as the dilation angle, i°, which needs to be assessed at fieldscale, although the mechanics are the same. To avoid confusion, thelaboratory-scale dilation angle measured during a test is heredesignated ψ°, whereas the field-scale dilation angle to be judged andallowed for in design is i°, as defined by Patton (1966).Typically, because of the complex nature of shearing, with damage
being caused to some roughness asperities whist others are overridden,the dilation angle, ψ°, is difficult to predict for an irregularly roughsample, although numerous efforts have beenmade to do so with somelimited success (e.g. Kulatilake et al., 1995; Archambault et al., 1999).In practice, rather than trying to predict dilation, which will be uniqueto each sample, stress level and testing direction, it is a parameter thatneeds to be measured carefully during direct shear tests so that correc-tions can be made to derive a normalised basic friction angle for use indesign. Figure 5.20 shows the result from the well-instrumented firststage of a direct shear test on a rough interlocking joint through lime-stone. The measured strength throughout the test includes the effect ofthe upper block having to override the roughness as the joint dilatesand work is done against the confining pressure. The dilation curve inFigure 5.20 superficially appears fairly consistent, but if one calculatesthe dilation angle over short horizontal increments, from the same dataset, it is seen to be much more variable and strongly reflects thepeaks and troughs of the measured shear strength throughout thetest (compare Figure 5.21 with Figure 5.20).These instantaneous dilation angles can be used to correct (normalise)
the shear strength incrementally throughout the test, using the followingequations:
τψ ¼ ðτ cosψ − σ sinψÞcosψ
σψ ¼ ðσ cosψ þ τ sin ψÞcosψ
where τψ and σψ are the shear and normal stresses corrected for positivedilation caused by sample roughness. The signs are reversed wherecompression takes place. Bymaking such corrections, the basic frictionangle can be determined for the natural joint surface. In practice,experience shows that for a system measuring to an accuracy ofabout ±0.005mm, analysis over horizontal displacement incrementsof about 0.2mm generally gives accurate dilation angles, even for arough tensile fracture (Hencher, 1995). By comparison, if one were touse the average dilation angle throughout the test, as implied in theISRM Suggested Method (ISRM, 1974), this would not allow thevariable shear strength to be understood and might lead to seriouserrors in determining basic friction values.Tests can be run multi-stage, in which the same sample is used for
tests at different confining stresses, which is very cost-effective, given
216 Practical Engineering Geology

the difficulties of obtaining and setting up samples. At each stage, thenormal load is generally increased (or decreased for experimentalreasons) and then the sample sheared until peak strength plus a fewmm. Tests must be properly documented, however, with photographs,sketches and profiles, so that any variable data can be explainedrationally (Hencher & Richards, 1989). Generally, it is found that
30
20
10
00 1 2 3
Horizontal displacement, mm
Dila
tion
angl
e, d
egre
es
4 5 6 7
Figure 5.21 Detailed analysis of dilation curve from Figure 5.20 calculated over 0.2mm horizontalincrements. The revealed underlying spikiness in the dilation curve matches that of the shear strengthcurve in 5.20 and is clearly the cause of variable strength. Details of how the dilation can be correctedfor to reveal the underlying basic friction are given in the text.
Horizontal displacement, mm
Ver
tical
dis
plac
emen
t, m
m
She
ar s
tres
s, k
Pa
Limestone joint – first stage
00
1
2
3
1 2 3 4 5 6 70
10Vert. displ.τ
20
30
40
50
60
70
80
90
Figure 5.20 Results from single stage of direct shear test on rough induced tensile fracture throughlimestone. Upper curve shows very spiky shear stress against displacement. The lower line showsvertical vs. horizontal displacement (dilation) throughout this stage of the test. The line has a fairlyconsistent gradient.
Geotechnical parameters 217

tests on a series of samples from the same joint set (with similar surfacemineralogy and textures) provide a reasonably well-defined dilation-corrected strength envelope, as illustrated in Figure 5.22. That strengthis frictional (obeys Amonton’s laws) and comprises an adhesionalcomponent plus a non-dilational damage component that varies withtexture and roughness.Barton (1990) suggested that the dilation-corrected basic friction
angle might be partly scale-dependent, as assumed for the asperitydamage component in the Barton-Bandis model (Bandis et al.,1981), but further research using the same testing equipment asBandis but with better instrumentation, indicates that this is unli-kely (Hencher et al., 1993; Papaliangas et al., 1994). Dilation-corrected basic friction is independent of the length of the sample.Scale effects do need to be taken into account in design but as ageometrical consideration when deciding on an appropriate fieldscale i° value.Many silicate rocks are found to have a basic friction ϕb ≈ 40 degrees
(Papaliangas et al., 1995), and Byerlee (1978) found the same strengthenvelope (τ = 0.85σ) for a large number of direct shear tests on variousrock types where dilation was constrained by using high confiningstresses. Empirically, it seems to be about the highest value for basicfriction achievable for natural joints in many silicate rocks and applic-able specifically to joints that are forced to dilate during shear or wheredilation is suppressed because of the high normal load. Conversely,much lower friction angles can be measured for natural joints
Figure 5.22Methodology forselecting a series ofsamples of rockjoint, testing andcorrecting to yield abasic friction anglefor the naturallytextured rock joint(after Hencheret al., 2011).
218 Practical Engineering Geology
natural joint with threesampling points
SampleA is roughest and thereforedilates the most and has the highestmeasured strength
disiplacement
Graphs for same normalstress, σ in each test)
normal stress, σ
= strength correctedfor dilation
strength envelope fornon-dilating joint
direct shearsamples
peak strengths
A2
A1
B1
C1
B2
C2
basic frictionangle,φ
b
Stage 1 Stage 2
C
C
shea
r st
ress
, τ
shea
r st
ress
, τB
B
A
A
Tests on 3 differentsamples

where they are planar and where the surface texture is very fine,polished or coated with low-friction minerals, as illustrated by a caseexample in Box 5-2. The author has measured values of only 10 to 15degrees for naturally polished joint surfaces through Coal Measuresmudstones of South Wales, UK, and such low values are lower thanmeasured for saw-cut surfaces through the parent rock. The range ofvariation for basic friction, measured for natural joints with differentsurface textures and for artificially prepared (saw-cut and lapped)joints, is indicated in Figure 5.23.
‘basic’, ‘residual’ or ‘smooth’ friction
τ = tan (φb + i ) σ40
30
20F
rict
ion
an
gle
10
0
Naturallypolished
mudstones
Natural joints(non-dilational)
Chloritecoated rock
joints
Roughness of flat surface
Rough, interlockingcoarse silicate rocks–corrected for dilation
Artificialsurfaces
Typical values forsaw cut/sand blasted/
tilted core
Repeatedsliding tests
Probableminimum
Range
Textural component–ploughing/deformation(non-dilational)
Adhesional friction component
Limit is about tan φ = 0.85(40°) for coarse silicaterocks
Figure 5.23 Concept of basic friction for a rock joint (after Hencher et al., 2011).
Box 5-2 Yip Kan Street landslide – an example of use of direct shear testing.
The Yip Kan Street landslide occurred in July 1981 on a dry Sunday night. It mainly involved largeblocks of rock of up to 10m3, which slid on persistent joint planes dipping at only 22 degrees out of theslope (Hencher, 1981b). The total failure volume was estimated to be 1,235m3. The 8m high, near-vertical slope was cut in very strong, slightly decomposed, coarse-grained igneous rock (quartz-syenite). The upper part of the slope was in saprolite. The failure occurred next to a constructionsite where blasting had been carried out recently, before the failure but not over the weekend. Therehad been intense rainfall a week before the failure. The slope had been deteriorating in the dayspreceding the failure, with cracks in chunam cover in the weathered part having been repaired five daysbefore failure.
Geotechnical parameters 219

Because of the low angle of sliding, it was decided to investigate in some detail. Blocks were collected –
both matching discontinuities and mismatched. It was noted that some blocks were coated with red ironoxides and others with green chlorite (a hard, thin coating). Each sample was carefully described and thentested multi-stage in a Golder Associates direct shear box. At each stage, the test proceeded until peakstrength was reached and then for another mm or two, following which the normal stress was increased,
Figure B5-2.1 Failure plane with debris cleared off.
0 100
100
200
300
400
0
100
100 200
Dila
tion-
corr
ecte
d sh
ear
stre
ss, τ
i kP
a
500
500
700
800
200 300
Dilation – corrected normal stress, σi kPa
τ i = σ i t
an 38°
τ = σ tan 28°τ i = 0.2 σ i
1.17
Low stress data
Iron ox
ide
Chlorite
Saw-cut (#60)
400 500 600 700 800 900
Saw-cut
YKS 2,3,8,9
YKS 1,4,6,7,11,12
Iron oxide-coated jointsCorrected data
Chlorite-coated jointsCorrected data
1,000 1,100
Figure B5-2.2 Shear strength data, Yip Kan Street rock slope failure.
220 Practical Engineering Geology

without resetting the sample in some cases. For some tests, complete runs of about 15mm shear displace-ment were conducted and in one test the sample was tested at the highest stress level first, which was thenreduced in stages incrementally. Samples were photographed, roughness measured and damage describedcarefully. For reference, a series of tests were conducted on saw-cut samples, ground with grade 60carborundum powder.Results from the tests are presented in Figure B5-2.2. Tests on natural joint surfaces were corrected for
dilation incrementally. It can be seen that the saw-cut surfaces gave a friction angle of about 28 degrees,which is about what might be expected.The tests from natural joints fall into distinct groups. The data from joints coated with iron
oxides define a friction angle of 38 degrees, which is the same as one finds for many weatheredrocks (Hencher et al., 2011). The data for the chlorite-coated joints were much lower, however, andunexpectedly so. At low stress levels especially, values were very low, below that of the saw-cutjoints, as can be seen from the inset figure and about the same as the angle of dip of the planesalong which the failure took place (ϕ ≅ 20 degrees at the lowest stress levels). Field-scale roughnesswas measured at 5 degrees using a 420 mm diameter plate and 9 degrees using a base plate of 80mm. It was concluded that the failure was progressive, probably having been exacerbated byblasting and previous rainfall and that the initial movements overcame the field-scale roughness.The eventual failure was explained by the presence of persistent chlorite-coated joints with inher-ently low frictional resistance (Brand et al., 1983).
5.7.3.2 Roughness
Roughness at the field scale will often be the controlling factor for thestability of rough or wavy persistent joints and for engineering designmust be added to the basic friction, ϕb, of the effectively planar rockjoint, as determined from corrected shear tests. Roughness is expressedas an anticipated dilation angle, i°, which accounts for the likelygeometrical path for the sliding slab during failure (deviation frommean dip). There are two main tasks for the geotechnical engineer inanalysing the roughness component: firstly, to determine the actualgeometry of the surface along the direction of likely sliding at all scales(Figure 5.24) and secondly to judge which of those roughnessfeatures along the failure path will survive during shear and force thejoint or joints to deviate from the mean dip angle. This is the mostdifficult part of the shear strength assessment, not least because it isimpossible to establish the detailed roughness of surfaces that arehidden in the rock mass. Considerable judgement is required and hasto be balanced against the risk involved. Hack (1998) gives a goodreview of the options, and the difficulties in exercising engineeringjudgement are discussed in an insightful way by Baecher & Christian(2003).In practice, the best way of characterising roughness is by measure-
ment on a grid pattern in the way originally described by Fecker &Rengers (1971), adopted in the ISRM Suggested Methods (1978)and described in Richards & Cowland (1982), although spatialvariability may be an important issue; the important first-orderroughness represented by major wave features may vary considerably
Geotechnical parameters 221

from one area to another, as of course also might the mean dip ofthe plane. At one location, a blockmight be prevented from sliding by awave in the joint surface causing a reduction in the effective down-dipangle along the sliding direction; elsewhere, a slab of perhaps severalmetres length may have a dip angle steeper than the mean angle forthe joint as a whole because it sits on the down-slope section of one ofthe major waves. Defining the scale at which roughness will forcedilation during sliding, rather than being sheared through, requiresconsiderable judgement. Some assistance is provided by Schneider(1976) and by Goodman (1980) who indicate that for typical roughjoint surfaces, where slabs are free to rotate during shear, as thelength of the slab increases (at field scale), the dilation angle controllinglifting of the centre of gravity of the upper block will reduce. Theproblem cannot be finessed by improved analytical methodology.There is no substitution to careful engineering geological inspection,investigation, characterisation of the ground model and judgementbased on experience of similar joints and geological settings, and anappreciation of the fundamental mechanics controlling the potentialfailure.
5.7.4 Infilled joints
The two walls of a joint might be separated by a layer or pocketsof weaker material which may reduce shear strength. A similarsituation arises from preferential weathering along a persistent
Figure 5.24Characterisingdiscontinuityroughness usingplates of differentdiameter. SkiptonQuarry, WestYorkshire, UK.
222 Practical Engineering Geology

joint. The effect of the infill is a function of the relative height ofroughness asperities in the wall rock vs. the thickness of weakermaterial (Papaliangas et al., 1990). If persistent and the infill is oflow strength, the consequences can be serious. Cut slopes on theA55 at Rhuallt, North Wales (Figure 5.25), failed by sliding onbedding-parallel thin clay infilled discontinuities with faults acting asrelease surfaces (Gordon et al., 1996). The mechanism had not beenanticipated from ground investigation prior to the failure, whichinvolved more than 185,000m3 of rock.In some slopes, incremental movement may take place over
many years before final detachment of a landslide and, followingeach movement, sediment may be washed in to accumulate indilated hollows on the joint (Figure 5.26). The presence of suchinfill might cause alarm during ground investigation but in manycases is confined to local down-warps and probably plays littlepart in decreasing shear strength, other than in restricting drai-nage (Halcrow Asia Partnership, 1998b). It may, however, betaken as a warning that the slope is deteriorating and approachingfailure.
5.7.5 Estimating shear strength using empiricalmethods
Various empirical criteria have been proposed for estimating shearstrength of rock joints, based on index tests and idealised jointshapes. The most widely used is that proposed by Barton (1973).Frictional resistance for saw-cut or other artificially prepared planarsurfaces is taken as a lower bound. The limiting value is typically 28.5to 31.5 degrees according to Barton & Bandis (1990). An additional
Figure 5.25 Cutslope at Rhuallt,North Wales,UK. Traversing theslope is a verypersistent narrowstratum of weakclay which,combined withcross-cutting faults,provided themechanism formajor rock failurein this otherwiseexcellent-qualityrock mass.
Road cutting, North Wales
Clay-infilled bedding-parallel surface
Note off-set by fault
Clay-infilled bedding-parallel surface
Note off-set by fault
Geotechnical parameters 223

component is then added to account for roughness using a JointRoughness Coefficient (JRC) usually judged from standard profilesand ranging from 0 to 20. This can be difficult in practice (Beer et al.,2002). JRC is then adjusted for the strength of the rock asperities vs.stress conditions and for scale. Details are given in Brady & Brown(2004) and Wyllie & Mah (2004).The criterion can be incorporatedwithin numerical software for modelling rockmass behaviour such asUDEC (Itasca, 2004). The contribution to shear strength from small-scale roughness is measured or estimated from standard shape pro-files (Joint Roughness Coefficient), although this can be difficult inpractice (Beer et al., 2002). Larger-scale roughness (waviness) thenmust be accounted for, over and above JRC, and scale correctionsapplied.An important point that needs to be emphasised is that dilation-
corrected basic friction parameters from direct shear tests on natural
General directionof downslopemovement
Approximately 5 mmsub-horizontaldisplacement of sheetingjoint. (Note trailingcorner has fractured)
20 mm thickclay infill – soft to firm light brownclay with occasional sand grains
Minor seepage noted onsheeting joint on 24.10.2000, four days after a heavyrainstorm
Approximately 25 mmsub-verticaldisplacement of joint
0 0.1 0.2 m
Approximate Scale
Clay infillRock on rock
Clay infillRock onrock
Figure 5.26Patchily infilledsheeting jointsfollowingintermittentdisplacement priorto failure. Detailsare given inHencher (2006).
224 Practical Engineering Geology

joints should not be used interchangeably in empirical equations as thiscould lead to an overestimation of field scale strength by perhaps10 degrees in many cases.
5.7.6 Dynamic shear strength of rock joints
There is some evidence that frictional resistance for rock joints isdependent on loading rate, and this may be significant for aseismicdesign and for understanding response to blasting. For a block of rocksitting on an inclined plane, given a value for static friction, one cancalculate the horizontal acceleration necessary to initiate movementand when the block should stop, given a particular acceleration timehistory, as illustrated in Figure 5.27. This type of calculation is thebasis of the Newmark (1965) method of dynamic slope stability ana-lysis, which is used to calculate the distance travelled, as discussed inmore detail in Chapter 6. Hencher (1977) carried out a series ofexperiments and found that initiation of movement was generallylater than anticipated (or did not occur), implying greater peak fric-tional resistance than predicted from static tests. The effective frictionfor initiation increased with the rate of loading (Figure 5.28). Theimplication is that if the loading is very rapid and reversed quickly(as in blast vibrations), shear displacement might not occur, despite thesupposed critical acceleration being exceeded. However, once move-ment was initiated, Hencher found that the distance travelled washigher than anticipated from static strength measurements and inter-preted this as reflecting rolling friction and the inability of strongfrictional contacts to form during rapid sliding. Hencher (1981a)suggested that for Newmark-type analysis, residual strength should
Figure 5.27Transient loadingof block on a plane.
Criticalacceleration
x..x
..
x..
x..
High
Low
t0
t1
k
Time
t0 – Predicted initiation of slidingt1 – Block comes to halt
“φb”
k
Geotechnical parameters 225

be used for calculating displacements. Recent work confirms low slid-ing friction angles post-failure (Lee et al., 2010).
5.8 Rock-soil mixes
It has long been recognised that mixes of soil and rock, such asillustrated in Figure 5.29, can often stand safely at steeper anglesthan if the slope were comprised only of the soil fraction. Fromtesting on soils together with theoretical studies, the point at whichthe hard inclusions start to have a strengthening effect is about 30%byvolume.
2.030°
40°
3.0‘Loading rate’
Higher stress change,higher rate of loading
φp
Figure 5.28Relationshipbetween phi(dynamic) and rateof loading. Thehigher the rate ofapplication of load(frequency), thegreater the initialstrength. Data fromHencher (1977,1981a).
Figure 5.29Cutting throughboulder colluvium.East of Cape Town,South Africa.
226 Practical Engineering Geology

5.8.1 Theoretical effect on shear strength ofincluded boulders
Hencher (1983d) and Hencher et al. (1985) report on the back-analysis of a landslide involving colluvium containing a high percen-tage of boulders, in which an attempt was made to estimate dilationangles on the basis of the coarse fraction percentage estimated in thefield and measurements taken from idealised drawings. These esti-mated field dilation angles were added to the strength for the matrix,determined from laboratory testing. West et al. (1992) took thisfurther and identified several ways that included boulders might influ-ence shear strength, based on physical modelling and back analysis ofslopes (these are illustrated in Figure 5.30). Factors envisaged included:boulders preventing failure along an otherwise preferred failure path,failure surface forced to deviate around a boulder, and a failure zoneincorporating the boulder. Triaxial tests reported by Lindquist &Goodman (1994) similarly concluded that boulders increase the massstrength. Additional review is provided by Irfan & Tang (1993).Practical methods for addressing the strength of mixed soils and
rocks remain difficult. One of the main problems is that such massescan be highly heterogeneous and difficult to characterise realistically.The other is that whilst trends of increasing mass strength with percen-tage of rock clasts and boulders are clear, general rules have not yetbeen formulated. Further advances will probably be by numerical
Figure 5.30Mechanisms offailure through amixed rock and soilslope. After Westet al. (1992).
(a)
(b)
(c)
Geotechnical parameters 227

modelling and could be done using PFC3D (Itasca). Whilst the largelyintractable geological characterisation nature of the problem wouldremain, the problem could probably be resolved parametrically in asimilar way and with a similar level of success for prediction as theHoek-Brown model for fractured rock masses.
5.8.2 Bearing capacity of mixed soil and rock
Mixed soil and rock deposits include sedimentary deposits like collu-vium and glacial boulder clay, but also some weathered rocks. As forassessing shear strength, there are considerable difficulties for sam-pling and testing and there can also be significant problems for con-struction (e.g.Weltman&Healy, 1978). The conservative position fordesign is to take the strength and deformability of the matrix asrepresentative of the mass, but allowance might be made for theincluded stiffer and stronger clasts by rational analysis, perhapsbacked up by numerical modelling.
5.9 Rock used in construction
Crushed rock and quarried or dredged sand and gravel are importantmaterials used in making concrete and construction generally, perhapsas fill. Rock is also used as armourstone, for example, in protectingearth dams fromwave action or for forming harbours. It is also cut andpolished as dimension stone to be used as kitchen work surfaces or ascladding on the outside of prestigious buildings. Engineering geologistsare often required to identify sources of aggregate, either from existingquarries but sometimes from new borrow areas in the case of sand forreclamation or new quarries for a remote project such as a road. Someof the properties that are important for their use are the same as inmuch of geotechnical design: strength, unit weight and porosity, butthere are other properties that need to be tested specifically.
5.9.1 Concrete aggregate
For concrete, the aggregate must be sound, durable and chemicallystable. Materials to be avoided include sulphates (e.g. gypsum andpyrites), clay and some silicate minerals such as opal and volcanicglass, which can cause a severe reaction and deterioration of theconcrete if present in the wrong proportions (see case example ofPracana Dam in Chapter 7). Tests are available and should be usedto ensure that the aggregate being sourced is suitable. These includemortar bar tests whereby a test mix of concrete is formed and observedto see if it expands with time. Other factors might include the need forlight- or heavy-weight concrete, fire resistance and overall strength.Concrete mix design for a large project may require a research
228 Practical Engineering Geology

programme to optimise the aggregate specification and type of cementto use. For smaller projects or where the demands are less onerous,then cost may be the controlling factor; aggregates and quarries haveplace-value, which is a matter of the quality of aggregate at a particularquarry together with the costs of transport to the project site. A usefulreview of the factors to be considered in specifying concrete aggregateis given by Smith & Collis (2001).
5.9.2 Armourstone
Armourstone is used to protect structures primarily from wave actionand is often made up of blocks of rock of several tonnes. Generally, therock must be durable and massive. If it softens or discontinuities openup with time, then the function is lost. Massive crystalline limestoneoften works well, as do many igneous and metamorphic rocks.Usually, durability (and availability and cost) is all-important but seethe case history of Carsington Dam in Chapter 7 where the choice oflimestone as riprap contributed to adverse chemical reactions andenvironmental damage. Weak or fractured rocks are obviously notappropriate. For many coastal defence works in the east of England,large rock blocks are brought by barge from Scandinavia because of alack of suitable local rock. CIRIA (2005) provides useful guidance.Where suitable rock is not available then concrete tetrapod structuresknown as dolosse are used in the sameway, piled on top of one anotherand interlocked, to protect coasts and structures by dissipating waveenergy.
5.9.3 Road stone
Aggregate is used in road construction in many different ways – asgeneral fill or in the sub-base, as drainage material and in the wearingcourse. There are many different standard tests to be applied in roadconstruction, and these are described in Smith & Collis (2001). Themost demanding specification is for wearing coursematerial. Rockmustbe strong and durable but also must resist polishing as it is worn bytraffic. This requires the rock used to comprise a range of differentminerals that are strongly bonded but wear irregularly. Rocks likelimestone are generally unsuitable (the polished stone value, PSV, istoo low). Rocks like Ingleton granite, which is really an arkose, haveexcellent properties and therefore very high place values – worthquarrying and transporting large distances – even from aNational Park.
5.9.4 Dimension stone
Dimension stone is quarried to be used directly in building, construc-tion or even sculptures. Typical rocks quarried in this way include
Geotechnical parameters 229

marble, granite and slate for roofs. Rocks are generally chosen for theircolour and appearance – the quarry at St Bees headland, Cumbria, UK(a fairly ordinary sandstone), was re-opened temporarily in the 1990sto provide rock for shipping to New York to repair buildings facedwith sandstone carried by ships as ballast in the 19th Century – becauseof its appearance. Dimension stonemust also be resistant to wear, frostand chemical attack. This can be difficult to determine from directtesting, so experience of the long-term performance of a particularrock from a particular quarry may be the best clue.
230 Practical Engineering Geology

6 Analysis, design and construction
6.1 Introduction
In Chapter 2, a brief introduction was given to civil engineeringpractice and types of structure. This chapter provides more detail sothat the engineering geologist can better understand the requirementsof projects, in terms of site investigation, design and constructionissues.
6.2 Loads
Most civil engineering projects involve either loading the ground,say from the weight of a new building, or unloading because ofexcavation of a slope or in a tunnel. Load changes can be permanentor temporary, static (due to weight) or dynamic (due to blasting,for example). A further important consideration for most geo-technical problems is the self weight of the ground and other in situstresses.
6.2.1 Natural stress conditions
At any point in the Earth’s crust, the stresses can be resolved into threeorthogonal directions. These are termed the maximum, intermediateand minimum principal stresses and depicted σ1, σ2 and σ3, respec-tively. By definition, the planes to which the principal stresses arenormal are called principal planes and the shear stresses on theseplanes are zero. An important point regarding rock engineering isthat all unsupported excavation surfaces are principal stress planesbecause there are no shear stresses acting on them (Hudson, 1989).One of the principal stresses will always be perpendicular to theEarth’s surface (Anderson, 1951) and is generally vertical.For projects close to the Earth’s surface, such as cut slopes or founda-
tions, natural stresses include self weight, weight of included water andbuoyancy effects below the water table, which reduces the total stress toan effective stress (weight of soil minus water pressure), as illustrated in

Box 6-1. As the rock or soil is compressed under self weight, it tries toexpand laterally and a horizontal stress is exerted. This is termed thePoisson effect. Typically, in a soil profile at shallow depths (tens ofmetres), the in situ horizontal stress (σh) due to self weight will bebetween about 0.3 (in loose sand) and 0.6 times (in dense sand) thevertical gravitational stress. The value 0.3 to 0.6 is called the coefficientof earth pressure at rest. In normally consolidated clay, the value isabout the same as for dense sand: 0.6. For most rocks, the Poisson’sratio is slightly less than 0.3. Most continental rocks weigh about27 kN/m3, so at a depth of 500m the total vertical stress canbe anticipated to be about 13.5 MPa, and horizontal stresses (σh)about 4 MPa.
Box B6-1 Example stress calculations
Generally, stresses are estimated by calculating the total weight of a vertical column of soil based on unitweight measurements. Effective stress is estimated by subtracting measured or estimated water pressurefrom the total stress due to the bulk weight of the soil or rock (including contained water).
In Figure B6-1.1, a ground profile is shown with sand overlying clay. The water table (upper surface ofsaturated ground) is 4m below ground level (mbGL).
The unit weight (γ) of the damp sand above the water table is 16 kN/m3; the unitweight below thewatertable, sand plus pores full of water (γsat), is 19 kN/m3. The underlying saturated clay has unit weight γsat =21 kN/m3. The unit weight of fresh water, γw, is about 9.81 kN/m3 (10 is generally a near-enoughapproximation given other assumptions).
Wewish to estimate the vertical stress at the crown of a tunnel to be constructed at a depth of 10mbGL.As shown in Figure B6-1.2.
4 mbGL
8 mbGL
10 mbGL
Water table
Sand abovewater table γ = 16 kN/m3
γ = 19 kN/m3
γ = 21 kN/m3
γ = 10 kN/m3
Sand belowwater table
Clay
Assume unitweight of water
Clay
Sand
Figure B6-1.1 Soil profile with tunnel to be constructed with crown at 10mbGL
232 Practical Engineering Geology

1 Note: the actual stress conditions near a tunnel would be more complex than thiscalculation. The tunnel would distort the stress field – refer to Muir Wood (2000) orHoek et al. (1995).
Therefore, before tunnel construction, the estimated vertical effective stress at the tunnel crown is 122kN/m2. During construction, due to seepage into the tunnel the water table would be lowered or thismight be done deliberately to excavate ‘in the dry’ to avoid flowing or ravelling of the soil into thetunnel. If the water pressure dropped, so the effective stress would increase. If the water table waslowered so that water pressure was zero at tunnel crown level, then the effective stress would equal thetotal stress (= 182 kN/m2).1
At some locations, however, tectonic or topographic stressescan be dominant even very close to the Earth’s surface, withhorizontal stresses sometimes locked in from a previous geologi-cal event and far in excess of that due to gravity and the Poisson
4 mbGL
8 mbGL
10 mbGL
Water table
60
Waterpressure
50 100 150 200 250
182
140
64Total vertical stress(bulk weight ofsoil)
effective stressσ′ = 182−60, i.e.
122 kN/m2
Figure B6-1.2 Total and effective stresses(vertical)
At depth Total vertical stress(σv)kN/m2
Water pressure (u)kN/m2
Effective vertical stress(σ′)kN/m2
4m 4×16 = 64 0 648m 64 + (4×19) = 140 4×10 = 40 140 – 40 = 10010m, at tunnel crown 140 + (2×21) = 182 6×10 = 60 182 – 60 = 122
Analysis, design and construction 233

effect. As illustrated in Box 6-2, in overconsolidated clays such asLondon Clay, where the rock has been buried to considerabledepth before uplift, erosion and unloading, then the earth pres-sure at rest can be up to three times the vertical stress. Intectonically active regions, stresses can be higher or lower thanlithostatic. Horizontal: vertical stress ratios as high as 15 havebeen measured in areas where tectonic or thermal stress has beenlocked in as the overburden has been eroded (Hoek & Brown,1980). These stresses can adversely affect engineering projects,resulting in deformation in tunnels, rock bursts and propagationof fractures (e.g. Karrow & White, 2002). In mountainous ter-rain, principal stress trajectories will follow the topography sothat the maximum principal stress runs parallel to steep naturalslopes, and this leads to spalling off of the rock parallel to thenatural slope (Chapter 3) and valley bulging at the toe of theslope.
Box B6-2 Variations from lithostatic stress conditions
Whereas in many areas of the Earth’s crust, stress conditions can be estimated reasonably well bycalculating the weight of the soil/rock overburden to give vertical stress and taking account of Poisson’seffect for horizontal stress, considerable variation is found (Hoek & Brown, 1980). In particular, hor-izontal stresses can be higher or lower than anticipated.
Example 1 Overconsolidated clay
Soils and weak rocks that have gone through a cycle of burial, partial lithification and then upliftand erosion are termed overconsolidated. They typically have lower void ratios (percentage ofpores) and are stiffer than would be expected for normally consolidated soils at similar depths ofoccurrence. They are also sometimes partially cemented, as described in Chapters 1, 3 and 5.Under compression, they demonstrate high moduli up until the original maximum burial stress,at which point they revert to the normal consolidation stress curve, as described in soilmechanics textbooks (e.g. Craig, 1992). Because the stress level has been much higher ingeological history, the horizontal stress may have become locked-in as a residual stress andmay be much higher than the vertical principal stress, as illustrated in Figure B6-2.1. Craigquotes earth pressure at rest K0 values up to 2.8 for heavily overconsolidated London Clay.Further discussion of earth pressures and how they relate to geological history is given bySchmidt (1966).
Example 2 Active and ancient tectonic regions
Deviations from lithostatic stress conditions can be anticipated at destructive plate margins, as along thewestern margins of North and South America where high horizontal stresses are to be expected.Conversely, in extensional tectonic zones the horizontal stresses can be anticipated to be tensile.Variations can also be expected in ancient mountain chains or areas of igneous intrusion where relicthorizontal stresses can be very high, resulting in rock bursts and large deformation of structures(e.g. Holzhausen, 1989).
234 Practical Engineering Geology

Example 3 Topographic stresses
Stress conditions may be strongly affected by local topography exacerbated by geological conditions. Atan extreme scale, large-scale mountain structures are ascribed to gravity gliding (e.g. Graham, 1981) andcertainly large landslides have ample evidence of compression and tensile zones. Other key examples ofthe effect of localised topographic stress are sheeting joints (Hencher et al., 2011) and valley bulging(Parks, 1991).
Stress conditions have been measured across the world from ins-truments, by interpretations of breakouts in deep drillholes for oiland gas exploration, or analysis of earthquakes, and manysuch data are compiled centrally and are freely available at http://www.world-stress-map. In situ stresses are sometimes investigatedspecifically for projects (Chapter 4) but this is expensive and canbe inconclusive because of the small scale and localised nature oftests.Where stress assumptions prove wrong, the consequences can be
severe, as at Pergau Dam, Malaysia, where it had been anticipatedthat stresses would be lithostatic (i.e. caused by self weight). Duringconstruction, open joints and voids were encountered in tunnelstogether with high inflow of water (Murray & Gray, 1997). It wasestablished that horizontal stresses were much lower than had beenexpected and this necessitated a complete redesign of shafts and high-pressure tunnels and their linings, at considerable cost. Low horizontalstresses can occur in the proximity of valley sides. Further examples aregiven later in this chapter.
Clay deposited insubsiding basin
millions of years
Uplift and erosion (the clay isnow ‘over consolidated’)
depth,z1
K0 might be about 0.6 for normally consolidatedclay (Craig, 1992)
K0 for over consolidated clay (LondonClay) might be up to about 3 (Craig, 1992)so, σh is now σ1 and up to 3 times σv
so, σv is also σ1 and σh is σ2 & 3 and = 0.6 σv
σv = γ . z1
σv = γ . z2
σh = γ . z1. K0
σh = γ . z2. K0
depth,z2
Figure B6-2.1 Stress conditions in overconsolidated soil. Uplift and erosion will result in a reduction in thevertical stress on the soil element but some residual horizontal stress may be retained from its burial history.
Analysis, design and construction 235

6.2.2 Loadings from a building
A structure will change the stresses in the ground and, in turn, be actedupon by stresses from the ground due to gravity and tectonic forces,wind, snow, earthquakes and perhaps from anthropogenic sources,including blasting and traffic. The loading condition for a high-risebuilding constructed on piles is illustrated in Figure 6.1. It is the task ofthe geotechnical team, given the loading conditions from other mem-bers of the design team, to ensure that there is an adequate Factorof Safety for the foundations against failure and that settlement iswithin the tolerance of the structure. The traditional permissiblestress approach, involving a lumped Factor of Safety to cover alluncertainties, has been replaced in Europe and some other countriesand design codes by a limit state approach, which encouragesmore rigorous consideration of different modes of failure and uncer-tainties in each parameter and in the calculation processes itself(Table 2.2).
Figure 6.1 Typical loading conditions for a high-rise building to be founded on piles.
236 Practical Engineering Geology
Total vertical load above pile = Σ [Dead load (including concrete self-weight& imposed dead loads) + Live load + vertical component of Wind load due
to structural response from lateral wind force on each floor.].
windload(plus earthquakeloading in seismicareas)
lateral component ofwind and seismic load(shear force) − needs tobe accounted for in pilecap and pile design
total vertical load +pile cap self-weightwill need to becarried by piles
ground level
skinfriction
soil
rock
design loading on each pile = total vertical load above each pile + pile cap self-weight
end bearingstress
rock socketfriction
piles
pile cap
resultant load onpiles includesvertical andhorizontalcomponents
dead loadplus live loadtaken on pilecap
buildinglive load such as snow
live load on each floor−furniture/people etc.
dead + live load due toloading from floor above

6.3 Temporary and permanent works
The engineer’s design generally concerns the permanent works – thelong-term stability and performance of the finished project. Performanceis measured by criteria specific to a project, such as settlement, leakage,durability and long-term maintenance requirements. During construc-tion, there will usually be other design considerations including stabilityof temporary excavations, disturbance to the groundwater conditionsand water inflow to the works. Temporary work design is generally theresponsibility of the contractor and his design engineers, perhapschecked by an independent checking engineer. The design of deeptemporary excavations can be just as demanding as for permanentworks, as illustrated in Figure 6.2. Catastrophic failure of such worksis unfortunately common – in recent years affecting such high-profileprojects as the International Finance Centre in Seoul, Korea, and theNicoll Highway subway works in Singapore (Chapter 7). In both cases,the strutted excavations collapsed. Guidance on the design of suchstructures is given in Puller (2003) and GCO (1990).In tunnels, during construction there may be a need to stabilise the
walls and possibly the working face using rapidly applied techniques,including shotcrete with mesh or steel fibres, steel arches or latticegirders and rock bolts (Hoek et al., 1995). Such measures are generallyspecified and installed by the contractor, typically agreed with a super-vising engineer who may well be an engineering geologist. The engi-neering geologist will probably be involved in identifying the rock
Figure 6.2 Temporary works for an underground station construction in Singapore. Piles to theleft were excavated by a large-diameter drilling rig and then concreted. As excavation has proceeded,the piles have been anchored back into the ground and strutted using systems of waling beams(horizontal, along the face of the piles) and struts, supported where necessary by additionalking posts.
Analysis, design and construction 237

mass conditions and identifying any geological structures that mightneed specific attention, as discussed later. The decisions taken willoften have cost as well as safety implications. Usually, measuresinstalled to allow safe working will be ignored when designingand constructing permanent liner support, but in some tunnels thereis no permanent lining so the temporary measures also become perma-nent works. In the latter case, the materials and workmanship will bespecified accordingly and as appropriate to the design life of theproject. Close supervision will be required on site to ensure that thespecified requirements are met and the quality of the works is notcompromised.
6.4 Foundations
Foundations are the interface between a building and the groundand transfer loads from the building to the underlying soil androck. Detailed and practical guidance on foundation design andconstruction issues is given by Tomlinson (2001). Wyllie (1999)deals specifically with foundations on rock. If ground conditionsare suitable, then shallow foundations are used because of costconsiderations. These include strip footings beneath the walls of ahouse (Figure 6.3), pads beneath columns for a steel or concrete-framed structure, or a raft supporting several loading columns andwalls.
6.4.1 Shallow foundations
For traditional design involving a single Factor of Safety, which isprobably the easiest to understand and still employed as the
Figure 6.3Concrete stripfoundations onweatheredlimestone for ahouse, Portugal.
238 Practical Engineering Geology

standard approach to design in many parts of the world, thefollowing definitions are used:
In Europe, since 2010, Eurocodes have replaced national standards andshould be used for design (BSI, 2004). The ultimate limit state (ULS) isessentially the same as ultimate bearing capacity but with possible fail-ure modes spelt out, including sliding resistance and structural capacity,heave, piping, and so on, which were implicit in the BS 8004 approachas factors that a responsible geotechnical engineer should consider. Theserviceability limit state (SLS) of Eurocode 7 is defined as: ‘states thatcorrespond to conditions beyond which specified service requirementsfor a structure or structural member are no longer met’, and this equateseffectively to the idea of allowable bearing pressure, as far as settlementis concerned, but includes other considerations such as vibration annoy-ance to neighbours, and so on – again, factors that would usually beconsidered automatically by experienced and responsible geotechnicalengineers when adopting a traditional approach to design.From Table 6.1 it can be seen that, for rock, the two governing
parameters are generally taken to be uniaxial compressive strength(UCS = �c) and degree of fracturing. This is expressed in charts presented
Bearing pressure The net loading pressure: load from structure, divided by thearea of the foundation, minus the weight of material removedfrom the excavation.
Ultimate bearingcapacity
The loading pressure at which the ground fails. This is the same asthe ultimate limit state in the limit state approach (Eurocode 7).
Allowable bearingpressure
The maximum loading pressure that meets two criteria:1. An adequate Factor of Safety against failure.2. Settlement within tolerance of the structure (specific to the
particular structure).
Presumed bearingpressure
A net loading pressure considered appropriate for a given groundcondition, based usually on local experience and incorporated inbuilding regulations or codes of practice such as BS 8004 (UK)(BSI, 1986) and CP4 (Singapore Standard, 2003).
Typical values are presented in Table 6.1 and can be used forpreliminary design purposes. They allow the practicability offoundation options to be assessed and to select appropriate groundinvestigation, testing and design methods. Presumed values areonly appropriate if the site is approximately level (not, for example,at the top of a steep slope) and where the geology is relativelyuniform and isotropic with no lenses or layers of significantlyweaker or compressible material within the zone of ground thatwill be stressed. Such tables are generally very conservative andeconomies can be made by conducting more detailed characteri-sation with testing and analysis, although sometimes regulatingbodies (building authorities) may be loathe to allow higher valuesto be used without considerable justification.
Analysis, design and construction 239

in BS 8004 and similar standards worldwide. For rock such as sandstoneor granitewith an intact compressive strength of 12.5MPa (just break byhand), the allowable bearing pressure would also be 12.5MPa, provideddiscontinuities are widely spaced apart, reducing to about 10 MPa asdiscontinuity spacing is about 0.5m and reducing to 2.5 MPa whendiscontinuity spacing is 150mm. If the fracturing is particularly adverseor includes discontinuities with low shear strength that could combine toform a failing wedge, then this needs specific consideration and analysis,as dealt with by Goodman (1980) and Wyllie (1999).Variability across the foundation footprint may also be an issue. If
there are soft or weathered pockets, these may need to be excavated
Table 6.1 Examples of presumed bearing pressures. These values, which can be used for optionassessment, are a selection of more extensive recommendations given in Tomlinson(2001) and BS 8004 (BSI, 1986).
Examples of rock type(indicative only)
Presumed bearing value(MPa)
ROCK
Bearing on surface of rock Strip footings < 3m wide.Length not more than tentimes width
Strong. Discontinuity spacing more than 200mmStrong. Discontinuity spacing 60–200mmModerately strong. Discontinuity spacing 60–200mm
10–12.55–101–5
Notes:Figures given are for igneous rocks, well-cemented sandstone, mudstone and schist/slate withflat-lying cleavage/foliation. For other rock types see references quoted. Strength definitions arefrom BS 5930:1999.Strong rock (σc = 50–100 MPa) requires more than one hammer blow to break.Moderately strong rock (σc = 12.5–50 MPa) – intact core cannot be broken by hand.
Examples of soil type(indicative only)
Presumed bearing value(MPa)
SOIL
Sand and gravel: foundations at least0.75m below ground level
SPT N-valueFoundation width
<1m <2m
Very denseDenseMedium denseLoose
> 5030–5010–305–10
0.80.5–0.80.15–0.50.05–0.15
0.60.4–0.60.1–0.40.05–0.1
Clay: foundations at least 1m belowground level
Undrained shearstrength (MPa)
Foundation width
<1m <2m
HardVery stiffStiffFirmSoft
> 0.300.15–0.300.075–0.150.04–0.0750.02–0.04
0.80.4–0.80.2–0.40.1–0.20.05–0.1
0.60.3–0.50.15–0.250.075–0.10.025–0.05
240 Practical Engineering Geology

and replaced with concrete or other suitable material. Karstic condi-tions with voids at depth that may be particularly difficult to investi-gate comprehensively can pose particular difficulties for foundationdesign and construction, as illustrated by a case example in Chapter 7and discussed by Houghten & Wong (1990). Conversely, if there areparticularly strong areas – for example, an igneous dyke throughotherwise weak rock in a pad foundation, then this must be accountedfor, otherwise the foundation may fail structurally. In all cases, it isessential to check any assumptions from preliminary design as thefoundation excavation is exposed. If the ground is worse than antici-pated then redesign may be required. In severe cases where, for exam-ple, a major fault is exposed unexpectedly, the required change indesign may be drastic, but that is the price paid for an inadequate siteinvestigation. Time must be allowed for checking during constructionand taking any actions that prove necessary.For soils, compressibility and settlement is often the main concern
and much more so than for rock. The presumed values given inTable 6.1 should restrict settlement to less than 50mm in the long-term, but estimates may be widely in error and even supposedlysophisticated methods of prediction are often inaccurate. For founda-tions on granular soils, empirical methods relying on SPT or CPT datatend to be used for predicting settlement. Burland & Burbridge (1985)compiled data for sand and gravel and showed that predictions ofsettlement are often in error by factors of two or more. Das &Sivakugan (2007) provide an updated review.For cohesive soil, where relatively undisturbed samples can be taken to
the laboratory, oedometer tests are used to determine settlement potentialand to predict rate of consolidation. Estimates of settlement can bemade,given the thicknesses of the various strata in the ground profile, theircompressibility and the stress changes. Details are given in many refer-ences, including Tomlinson (2001) and Bowles (1996). For major struc-tures, engineers will often carry out numerical modelling using softwaresuch as Plaxis or FLAC, which can be used for sensitivity studies. Suchsoftware is also used to predict deformations during different stages ofexcavation and construction and to determine support requirements.
6.4.2 Buoyant foundations
If the weight of the soil removed from an excavation is the same as thebuilding constructed within the excavation, then no settlement shouldoccur, as illustrated schematically in Figure 6.4. This design concepthas been used for many major structures incorporating deep base-ments which can be utilised for parking spaces. There may be a needto include holding-down piles or anchors in the design to combat anyuplift forces. Construction of deep foundation boxes often involves theconstruction of diaphragm walls using the same techniques as for
Analysis, design and construction 241

barrettes, as discussed below. Once the walls are in place, excavation isconducted inside the walls, with either bracing and/or anchorages usedto stabilise the works.
6.4.3 Deep foundations
6.4.3.1 Piled foundations
Piles are used to transfer building loads, via pile caps, to deeper levels inthe ground profile. There are two main types: driven and bored. Drivenpiles are hammered into the ground and are also termed displacementpiles. Hammering is sometimes done by dropping a large weight on thetop of the pile from a crane or using a diesel or hydraulic machine(Figure 6.5). Bored piles are generally constructed using bucket augers,soil grabs and rock roller bits, with heavy-duty rock cutting tools used togrind their way into the underlying rock and to form rock sockets asnecessary. Even using themost powerful equipment, formation of socketscan take a very long time, advancing perhaps only 100mm per hour instrong rock, and therefore canbe relatively expensive, so designers shouldbewary of being ultra-conservative in their specification of socket length.
6.4.3.1.1 DRIVEN PILES
Driven piles are generally made of timber, steel or concrete. Figure 6.6shows concrete piles being manufactured on site in a factory-typeoperation to allow 20,000 piles to be driven in just 18 months forDrax Power Station completion (Hencher & Mallard, 1989). Thepurpose-made pile beds were heated to allow rapid curing of concrete,
Figure 6.4 Conceptof buoyantfoundation design.The weight of thebuilding balancesthe excavated soilso that the netincrease or decreasein pressure isminimised.
242 Practical Engineering Geology
load from building,Wb, balanced by
weight of excavatedsoil, Ws
Holding downanchors or piles
to counteractbuoyant forces
Ws
Wb

and the piles were pre-stressed to improve their resistance to tensilestresses and to allow the piles to be lifted from their forms quickly. Formost sites, piles will be manufactured off site, sometimes as differentlengths that are joined together on site to suit requirements. One of theadvantages of using driven piles is that an estimate can be made of thedriving resistance, given the known energy being used to drive the pileand the penetration into the ground per blow of the hammer. Piles aretherefore driven to a set, which is a predefined advance rate (such as 25mm for 10 blows by the hammer). However, resistance during drivingmay not always give a very good indication of how the pile will behaveunder working conditions, because of false sets, generally due to waterpressure effects, as described for the Drax operation in Chapter 7.
Figure 6.6 Pilesbeing cast informers, DraxPower Station,UK. Note liftingeyes cast into theconcrete piles, steelplates at end of piles(trapezoidal) andpre-stressing cables,which are to be cutbefore lifting pilesfrom the castingbeds.
Figure 6.5 Dieselhammer (centre ofphoto) being usedto drive pre-stressedconcrete piles, DraxPower Station,UK. Elsewhere,piles are beingpitched into holesformed by auger. Inthe background,the kentledge canbe seen for a prooftest on a workingpile.
Analysis, design and construction 243

Driving resistance and set are, however, part of the process of qualitycontrol during construction. Pile driving analysers (PDAs) using accel-erometers and other instruments attached to the pile can be used toestimate driving resistance in a more sophisticated way than the tradi-tional method of measuring the quake with a pencil, although the samelimitations apply regarding whether or not dynamic behaviour is areliable indicator of future performance. PDAs are sometimes usedafter the pile has been installed (both driven and bored piles) to testits capacity, but this can be somewhat of a black art with manyassumptions being made and the method is certainly not foolproof oras reliable as full static load tests, as discussed below.
6.4.3.1.2 BORED PILES
Bored piles are excavated as described earlier. Temporary or perma-nent steel tubes (casing) may be used to prevent collapse of the holeand, if the hole is formed below the water table, often bentonite orsome other mud or polymer is used to support the sides of the hole.Once the hole has been completed and cleaned out, then a steelreinforcing cage is introduced and, finally, concreting carried out.Concrete needs to be tremied by a pipe from the surface to thebottom of the hole. This avoids the concrete disaggregating, and theconcrete will hopefully displace soft sediment that might have accu-mulated at the bottom of the bored hole after the final clean out. It willalso displace the bentonite slurry or water from the bored pile excava-tion, so this can be a very messy operation. Despite best efforts, softtoes of sediment will still sometimes occur (perhaps associated with theremoval of temporary casing) and sometimes ground movementsoccur causing necking of piles. Clearly, there is a need for high-qualitywork and for close supervision. Currently, in Hong Kong, all boredpiles are installed with steel tubes attached to the reinforcing cage(Figure 6.7). After concreting, rotary drilling is carried out down oneof the tubes, through the concrete and into the underlying naturalground, to prove that the pile is founded as designed and that thereare no soft sediments. If there are, then remedial measures such aspressure grouting might be needed. Other tubes installed through theconcrete are used to carry out geophysical cross-hole tests (seismic) tocheck for necking and other construction defects. In severe cases, pilesmay prove inadequate to carry the loads and remedial works arerequired. This might not be discovered until the superstructure isconstructed. In one extreme case in Hong Kong, two 44-storey towerblocks had to be demolished. Such problems may be put down toworkmanship, the inherent difficulties of the operation, poor investigationand design and sometimes fraud (Hencher et al., 2005).Once the piling is completed, a pile cap is constructed as a reinforced
box of concrete that bridges between several piles to support majorcolumns in the superstructure.
244 Practical Engineering Geology

6.4.3.2 Design
Piles are designed to suit the ground profile. If rockhead is at relativelyshallow depth and the overlying soil does not contain boulders thatcould cause difficulties, then driven piles might be adopted, end bear-ing onto the rock (Figure 6.8a). At Drax, the piles were driven to foundseveral metres into dense sand overlying sandstone, thereby picking upsome skin friction as well as end bearing (Figure 6.8b). If there is norock, then the piles will need to gain their resistance mostly from skinfriction in the soil. For example, the Sutong Bridge across the YangtzeRiver, China, which is (in 2011) the longest cable-stayed bridge in theworld, with a main span of 1,088m, is founded on bored piles taken to117m and relying upon skin friction from alluvial sediments(Figure 6.8c).Ways to estimate skin friction parameters and end-bearing resis-
tance are given in textbooks such as Tomlinson (2001) and might begoverned by standards such as AASHTO (2007), used as the basis fordesign of the 2nd Incheon crossing completed in 2009. The principlesare quite simple: skin friction is calculated as soil shear strength timessome adhesion factor multiplied by the surface area of the pile shaft.End bearing is often calculated as an empirical value for the soil or rockquality multiplied by the basal area of the pile. At some sites, thebottom end of the pile is enlarged by under-reaming to increase theend-bearing contribution, although sometimes the difficulty of thisoperation is hardly justified by the increase in pile capacity thatmight ensue.A worked example of pile design to Eurocode 7, using partial
factors specified uniquely for the UK (to correlate with traditionaldesign experience), is presented in Box 6-3, based on one
Figure 6.7Reinforcing cagefor bored pile withincluded tubes toallow proof drillingthrough the toes ofthe completed pileand cross-holegeophysical testingto prove integrity,Hong Kong.
Analysis, design and construction 245

presented by Bond & Simpson (2010). Other countries might usedifferent partial factors and other approaches, as allowed in theEurocode. In the example presented, the main unknowns – vari-able live load, shaft resistance and base resistance – are factoredup and down as appropriate towards a safe solution. The results
a)
b)
c)
Figure 6.8 Designconcepts for piles.a) End bearing,b) end bearing plusskin friction andc) skin frictiondominating.
246 Practical Engineering Geology

Box
6-3
Piledesign
(based
onBon
d&
Simpson
,201
0)
Shaftresistance,Rs¼
87:97�
ðα�1
58Þ=γ1
where
αisan
adhesion
factor
(tak
eas
0.5)
andγisamod
elfactor
=1.4
SoRs¼
4,96
4kN
Baseresistance,R
b¼
0:78
5�ð
Nc�25
6Þ=γ
where
Ncisabearingcapa
city
factor
(tak
eas
9)an
dγisthesamemod
elfactor
=1.4
SoRb¼
1,29
2kN
Totaldesign
compressive
resistance,Rc¼
4,96
4=1:6þ1,29
2=2:0¼
3,74
9kN
Withpa
rtialfactors1.6on
shaftan
d2.0on
endbearing,
which
are
design
ated
intheUK
Nationa
lAnn
exto
BSEN
1997
–1forabo
red
pileno
tsub
jectto
test.Iftested,
factorswou
ldbe
1.4an
d1.7respectively
(see
Bon
d&
Simpson
,201
0fordiscussion
).The
factored
design
resistan
ce,3.74
9M
N,is
less
than
thefac-
toredco
mpressive
load
,4.3M
N,so
longerpileswou
ldbe
requ
ired
.The
trad
ition
al,u
nfactoredglob
alFo
Swou
ldbe
(4,964
+1,29
2)×1.4/
4,00
0,i.e.2.19
,which
islower
than
wou
ldno
rmally
berequ
ired
follo
wingtrad
ition
aldesign
rules(typ
ically
2.5to
3.0)
intheab
senceof
extensiveprelim
inaryan
dworking
piletests.
Ass
ume
‘und
rain
ed’
shea
r st
reng
th p
rofil
ec u
= 6
0 +
7z k
Pa
28 m
c u =
256
kP
a (6
0 +
7 ×
28)
c u =
60
kPa
at g
roun
d su
rfac
e
1 m
Are
a of
sha
ft, A
s=
87.
97 m
2
Are
a of
bas
e, A
b=
0.7
85 m
2 (ci
rcul
ar p
ile)
Depth, z
Ave
rage
cu
alon
g pi
le le
ngth
= 1
58 k
Pa
( 60
+ 7
× 14
)
Per
man
ent l
oad
(dea
d) =
3 M
NV
aria
ble
load
(liv
e) =
1 M
N. T
his
has
to b
e fa
ctor
ed h
ighe
r by
1.3
so
tota
l loa
d is
4.3
MN
1Notethatthesymbo
lγhasbeen
used
inEurocod
estorepresent‘partialfactors’.Thiscanlead
toconfusioninthatthesymbo
lγismoregenerally
used
torepresentunit
weigh
tasin
γ Rfortheun
itweigh
tofrock.
Analysis, design and construction 247

are compared to the FoS, as determined using a traditional approach –
best estimate of strength divided by best estimate of loading. It is to benoted from this example that whichever approach, there is considerablejudgement and approximation involved. Shear strength is taken asundrained, which is conceptually questionable for the long-term; adhe-sion factor estimates range from 0.3 to 0.9 for different soils. If aneffective stress approach was adopted – as would generally be done forsand and weathered rock – then estimates would be needed of stressconditions and shaft resistance coefficients, which also requires estima-tion and judgement. Workmanship may also play a key role in whetheror not shaft frictionwill bemobilised andwhether the base of a bored pileexcavation is properly cleaned out prior to concreting. The use of apartial factors approach does concentrate on where the key unknownsare (rather thangeometry andfixed loads) but doesn’t take away the needfor proper ground characterisation, analysis and design judgement. Thefixed nature of the partial factors might seem rather prescriptive to coverall soil, rock and founding situations. Selection of parameters, adhesionand shaft resistance factors are reviewedwell inGEO (2006), and the useof Eurocode 7 for design is summarised by Bond & Simpson (2010).A site-specific way to obtain design parameters, especially for large
projects, is to install test piles and measure their performance at perhaps2.5 times the design load of the working piles. Test piles are ofteninstrumented along their length using strain gauges so that the actualresistance being provided by the ground can be measured throughoutthe full profile, and these parameters can be used in the design of otherpiles. Traditionally, piles are loaded from the top using kentledge ofconcrete blocks or steel (Figure 6.9). Jacks are used to push the pile intothe ground whilst the kentledge provides the reaction. One of thedifficulties of this is that much of the support comes from the uppersoil at early stages of the test, and there is little idea of how the toe is
Figure 6.9 Pile testset up withkentledge. DonghaiBridge, China.Figure courtesy ofLeonard Tang,Halcrow.
248 Practical Engineering Geology

performing until a test approaches failure (Figure 6.10). Recently, asystem has been introduced where Osterberg cells are incorporatedinto the pile construction at depth and then expanded against the testpile, both upwards and downwards (Figure 6.11). The end-bearingresistance below the cell is balanced by the skin friction from the soilabove the cell. This systemwas used for the IncheonBridge design, using
Reaction deadweight(kentledge)
Spreader beam
Jack and loadmeasurement
Displacementmeasurement
Support forreferencebeam awayfrom test
Load
Residualsettlement on
removal ofload
‘Elastic’settlement of pile
and ground
settlement attop of pile
1 2 3
Load carriedby skinfriction athigher level
Most ofload inskinfriction
Skin frictionreduced to‘residual’
Referencebeam Displacement
End bearingfailure
1 2 3
Figure 6.10 Typical set-up for pile load test. At early stages (1), most of the ground resistance willcome from skin friction at shallow depths. End bearing is not mobilised until later stages (2) and (3)of the test (depending on the configuration of the pile and ground profile). The rate of settlementincreases as the ground resistance becomes fully mobilised and there will be some permanentdisplacement (residual settlement) once the pile is unloaded.
Analysis, design and construction 249

up to 5 cells in a single 3m diameter pile to generate forces of over30,000 tonnes (Cho et al., 2009b). The obvious advantages include thefact that no reaction is required at the ground surface, but a limitation isthat the forces upwards must be balanced by those downwards, whichwould be difficult to achieve where the pile is mostly end bearing.
Figure 6.12 Theconcept of negativeskin friction. Wherethe ground arounda pile or group ofpiles settlessignificantly (cm),then the groundwill cause a dragdown force on thepile. At the sametime, the upperparts of the pilecannot providepositive skinresistance.
Figure 6.11 Piletest using anintegral jack or setof jacks. This set-upallows the endbearing part of thepile to be jackedagainst the upperparts (skin friction).If strain gauges arebuilt into the pile,then a goodinterpretation canbe made of groundparameters.
250 Practical Engineering Geology
Strain gauges and loadcells included in pile tellwhere the load is beingcarried (a check on soil androck parameters)
Included jack expands,forcing upper part of pileagainst lower part
Rocksocket
Building load
Soft clay
Soft clay
Rock
Sand
Drag downforce onpile
Sand, sandwichedbetween consolidatingclay layers also dragsdown on pile
Clay consolidates (settles)under own weight, due tofill or because of loweringof water table
Claysticks to
pile

An additional aspect to be considered in pile design is possible futuresettlement of the ground around the pile due to self weight, earthquakeliquefaction or perhaps groundwater extraction, which can result in adrag-down force on the pile, known as negative skin friction. This isillustrated in Figure 6.12. The potential for negative skin friction isgenerally a matter of engineering judgement based on the groundprofile and perceived future usage of the site and applied as a nominaladditional load to be carried by the piles.
6.4.3.3 Proof testing
Proof tests are typically carried out on one in a hundred piles or so. Thetest pile should be selected by the supervising engineer, after construc-tion and with no pre-warning to the contractor so that he does notexercise special care in its construction. Full loading tests are carriedout with kentledge or some other reaction system such as groundanchors and should be taken up to loads of perhaps 1.5 times theworking load for the pile. The displacement during the test (partlyelastic deformation of the pile) and residual settlement after the test iscompleted are used as criteria of whether the tested pile and its neigh-bours are acceptable (Figure 6.10). If not, then additional piles mayneed to be installed and the existing piles down-rated. There maybe time or space restrictions (such tests are very expensive and timeconsuming) and the contractor might urge the use of dynamic pileanalysers as an alternative way of proving acceptability. As notedearlier, such tests are often unreliable and may give no measure ofend-bearing resistance. Specialist tests are used to determine pile integ-rity, for example, by using a vibrator to take the pile through a series offrequencies so that its response can be measured. Resonance willindicate the length of the responding section, which will help indeciding whether or not the pile is broken.
6.4.3.4 Barrettes
Barrettes, like piles, are deep foundations but constructed in excavatedtrenches using special tools called hydrofraises, often under bentoniteto support the sides of the trench. Otherwise, construction is similar toa bored pile, with a steel cage inserted in to the trench prior toconcreting. Barrette shapes can follow the geometry of load-bearingwalls in the finished structure.An example of the use of barrettes rather than bored piles is for the
International Commerce Centre (ICC) in Hong Kong. The 118-storeybuilding is the tallest in Hong Kong and fourth tallest in the world (in2011). Granite bedrock is reportedly 60–130m deep below the build-ing, and the designers decided to use 241 post-grouted rectangularbarrettes rather than more traditional end-bearing bored piles (Tam,
Analysis, design and construction 251

2010). The barrettes were cracked by high-pressure water injectiondown pre-installed pipes whilst the concrete was still at lowstrength. Once the concrete had reached its 21-day strength, high-pressure grouting was carried out through the cracked path aroundthe barrettes, metre bymetre from the base to improve the skin frictionalresistance.
6.4.3.5 Caissons
Caissons are large box structures formed of steel or concrete and areused as a common solution for bridge foundations offshore. The box istypically constructed onshore then floated and towed to its locationwhere it is sunk. Sometimes caissons are sunk into the ground bydriving and digging, elsewhere they just sit on a prepared surface onthe sea floor. Different types are illustrated schematically inFigure 6.13. Once the caisson is in place/sunk to the required depth,then it is backfilled with rock and concrete. Caissons are also oftenused to form sea walls for reclamation schemes, the boxes are formedon land then floated and towed to position where they are sunk ontoprepared foundations and then backfilled.
Figure 6.13 Different types of caisson commonly used for large bridge foundations, with examples.
252 Practical Engineering Geology
Open(Top & bottom)
Humber Bridge, UK
Soil excavated bygrab buckets
Pneumatic(Closed at top)
Sink underown weight
as soil isexcavated
Box or Floating(Open at top)
Constructed on land,sunk onto prepared
foundationMuck(soil) out
Soil
Floatedto
position
Prepared baseRip rap topreventscour
1993 Rainbow Bridge, Tokyo − used robot excavators
Akaishi Kaikyo, JapanRion-Antirion, GreeceBusan-Geoje
− Mostly concrete or steel− Good for mixed soil that might hinder driven piles− Resistant to scour and impact (boat / ice)− Resist lateral forces (earthquakes)− Filled with soil / rock fill / concrete− May be any shape to suit structure
1874 Eads Steel Arch Bridge, Misssissippi (15 died, 79 severely afflicted by ‘caission disease’)
May needinternalstruttingduringtowing
Workingchamber
May construct withindewatered coffer dam or onartifical, temporary sandisland
2007 Second TacomaSuspension Bridge (span925 m Tower Caissons 40m × 25 m × 70 m deep)
Air &access
Maximum depth water 40m for manned excavation

6.5 Tunnels and caverns
6.5.1 General considerations for tunnelling
Tunnels will be constructed as part of an overall project, for example,water supply, drainage, rail, road, or in connection with power gen-eration. As a result, there may be little flexibility over route and,therefore, geological and hydrogeological conditions and size andshape of tunnel. It is up to the engineering team to come up with acost-effective solution.One factor that will influence the chosenmethod of construction and
lining (or not) are the final finish requirements for road and rail tunnelsand whether or not it might carry water under pressure in hydraulictunnels, as addressed at 6.6.5 below. Themain issues for the engineeringgeologist and design team are likely to be:
– The geology along the route; how this will affect the selectedmethod of tunnelling and any particular hazards such as naturalcaverns, mining or major faults.
– Stress levels and ratio of vertical to horizontal stress. High stress atdepth and the concentrations in stress resulting from perturbation ofthe stress field by the construction can result in failure of the rock,which might result in spalling in brittle rocks or squeezing in gen-erally weaker rocks (Hoek & Brown, 1980; Hoek et al., 1995).
– Hydrogeological conditions and the risk of unacceptable waterinflows and possible flooding; this is always a major issue forundersea tunnels, but can also be a concern under land.
– Existing structures that might be adversely affected by the tunnelduring construction, for example, by blast vibrations or undermin-ing as the tunnel passes by. In the longer-term, lowering of ground-water may cause settlement and/or affect water supply boreholes.
As for all geotechnical work, one needs a ground model for design.Because tunnels are often long and may be at great depth, it may beimpractical to do more than a rather superficial investigation, relyinglargely on geological mapping and extrapolation of data, although ifa serious obstacle is anticipated, such as a major fault zone, then bore-holes might be targeted at that feature using inclined boreholes or evendrilled along the line of the tunnel. Alternatively, a small-diameter pilottunnel might be constructed before the main tunnel – possibly for lateruse as a drainage or service tunnel – because small diameter tunnels tendto have fewer difficulties (Hoek, 2000). The pilot tunnel essentiallyworks as a large-diameter exploratory borehole.The ground model needs to include estimates of rock or soil quality
along the tunnel drive. For rock, this is often done using rock massclassifications (RMCs) such as Q, RMR or GSI, described in Chapter 4and Stille & Palmström (2003). This will allow some estimation of
Analysis, design and construction 253

support requirements and allow a contractor to choose his method ofworking and type of machine if a tunnel boring machine (TBM) optionis selected (Barton, 2003). The ground model will also be used forhazard and risk analysis, as discussed later, and may sometimes beused as the basis for Reference Ground Conditions in GeotechnicalBaseline Reports (Chapters 2 & 4), against which any claims forunexpected or differing ground conditions can be judged. As notedin Chapter 2, however, RMCs may be too coarse to representgeological conditions realistically. They may also be open to differentinterpretations, so that disputes are difficult to resolve.
6.5.2 Options for construction
Up to about a century ago, all tunnels in soil or rock were excavated byhand, using explosives where necessary to break up the rock in advanceof mucking out. Nowadays, many are excavated using powerfulmachines. The main options generally adopted in modern tunnellingand typical support measures are set out in Table 6.2. The method oftunnelling will often be decided on factors including length of tunnel,availability of TBM, local experience and expertise. In South Korea, forexample, most rock tunnels, including very long ones, have been con-structed in preference by drill and blast rather than TBM. There is awide variety of tunnel boring machines designed for all kinds of condi-tions from rock to soft soil. The engineering geologist needs to be able topredict the ground conditions so that the tunnel designers and tenderingcontractors can select the correct machine. It usually takes a long time tomanufacture and launch a TBM with a whole series of ancillary equip-ment in the following train, and if the machine proves unsuitable, forany reason, it can be a costly mistake. Somemachines are designed to beable to cope with mixed ground conditions but can still run intodifficulties. Nevertheless, many TBM tunnels proceed well and atmuch faster rates than hand dug/drill and blast tunnels. The adoptionof hazard and risk analysis (BTS, 2003), as discussed at 6.5.8, will helpreduce incidents but will not necessarily eliminate hazards entirely.
Table 6.2 Options for tunnelling (after Muir Wood, 2000).
Ground type Excavation Support
Strong rock Drill and blast or TBM Nil or rockbolts
Weak rock TBM or roadheader Rockbolts, shotcrete, etc.
Squeezing rock Roadheader Variety depending on conditions
Overconsolidated clay Open-face shielded TBM or roadheader Segmental lining or shotcrete etc.
Weak clay, silty clay EPB closed-face machine Segmental lining
Sands, gravel Closed-face slurry machine Segmental lining
254 Practical Engineering Geology

6.5.3 Soft ground tunnelling
Soft ground, including severely weathered rock, may be excavated byhand or by tunnel boring machine. For open-face excavation, beha-viour can be predicted using classification such as the Tunnelman’sClassification of Heuer (1974), which allows prediction of whether thesoil will stand firmly whilst the liner is put in place or is likely to ravel,run, flow, squeeze or swell. Behaviour depends on the nature of soil,water conditions and stress levels. For example, un-cemented sandmight be expected to flow below the water table, especially at depth.Such empirical predictions are also useful for weathered rocks wherethe application of conventional soil mechanics principles is question-able (Shirlaw et al., 2000). When tunnelling in soil or in mixed-faceconditions, it is the behaviour of the weakest or most mobile materialthat generally governs the need for, and magnitude of, the supportpressure that is needed at the tunnel face.If the soil is stiff and cohesive, then NATM methods can work
successfully, as has been achieved, for example, in the London Clay(van der Berg et al., 2003) and in the Fort Canning Boulder Bed and theOld Alluvium in Singapore (Shirlaw et al., 2000). Where soils areunstable, then various options include grouting, dewatering, freezingor the use of compressed air. All of these are costly, may have severehealth and safety implications and restrictions, and take time to install.Nevertheless, suchmethods are often necessary to recover and restart atunnel that has encountered a major problem and perhaps collapsed.Tunnel boring machines used in soft ground are of the closed-face
type, as illustrated in Figure 6.14 a and b. Guidance onmachine selectionand use is given by the British Tunnelling Society (BTS, 2005).Earthpressure balance (EPBM)and slurrymachines use pressurised soil
at the cutting face to hold up the ground as the tunnel advances. In anEPBM machine, the broken down soil remains in the plenum chamberbehind the cutting head, balanced by pressure in the Archimedes screw,which removes the spoil under the control of the operators. In a slurrymachine, which tends to be used in higher permeability soils, bentoniteslurry is introduced to the plenum chamber, mixes with excavated soil,which is then removed for separation, disposal and re-use (bentonite) bypipes rather than on a muck conveyor. Permanent concrete lining isformed from precast segments, directly behind the machine, and thisliner is used as a reaction to push the TBM forward. TBMs often workwell for the specific conditions for which they are designed but alsocommonly run into problems with the machine getting stuck or runninginto rock that is either too hard or too soft or too wet for the type ofmachine (see Table 6.3). Shirlaw et al. (2003) report cases of settlementand collapse in Singapore, even using sophisticated EPBMs. Similarly, anEPBMmachinewas recently stoppedby silt breaching the tunnel liner onacontract in the UK. A further example is discussed inChapter 7. Recovery
Analysis, design and construction 255

options include freezing the groundand grouting the ground to stabilise itto allow the TBM to be withdrawn (NCE, 19 January 2011).Where the materials to be excavated include strong and weaker
material, this is known as mixed-face conditions. For stability, themajor issue concerns relative mobility of the materials rather thanjust strength. A mixed face of strong boulders and hard claypresents problems in terms of rate of excavation, but generallynot in terms of heading stability. However, a combination ofstrong, stable rock with a more mobile material, such as flowing,rapidly squeezing or fast ravelling material, provides conditionswhere the overall stability of the heading can be very difficult tocontrol as well as difficult to excavate. Shirlaw et al. (2003)provide examples of major inflows resulting from the use of con-ventional rock tunnelling methods too close to the transition fromrock-like to soil-like conditions. Ironically, this particular type ofmixed-face condition has become even more problematic with theintroduction of modern tunnelling technology.
Figure 6.14 Schematic diagrams of shielded TBMs. a) Slurry machine; bentonite slurry is pumped toplenum chamber and mixes with spoil cut at the face. Mixture is removed for separation andtreatment before recycling. b) Principles of EPBM. Cut soil (with additives as necessary) is removedby a screw device with the pressures monitored andmaintained. c) Single-shield rock TBM. Rock cutfrom the face is mucked out and TBM pushes forward against the liner erected to the rear of theshield. Other rock TBMs use grippers pushed against the walls of the tunnel and use this as thereaction force for advancing the TBM.
256 Practical Engineering Geology
Liner segments erected within rear of shieldand usesd to jack forward TBM
Excavated soil and slurry out
Bentonite slurry in
shield
additives as ncessary
conveyor
conveyor
spoil
Archimedes screw usedto balance pressure
Cut
ters
in r
otat
ing
head
a) SLURRY
b) EARTH PRESSURE BALANCE
c) SHIELDED ROCK

Tab
le6.3
Typ
ical
prob
lemswithTBM
tunn
elsan
dpo
ssiblemitigationmeasures.
Prob
lem
Mitigation
Groun
dtoostrong
(intactstreng
than
d/or
lack
ofdiscon
tinu
ities)
May
need
topu
llTBM
back
andad
vancewithdrill
andblast
Groun
dtooweakan
dcolla
psing(sho
uldha
vebeen
anearth
balanceor
slurry
machine
perhap
s)Groun
dim
prov
ementmight
benecessaryin
adva
nceof
tunn
eldrive–grou
ting
orfreezing
Major
faults
Collapseof
grou
ndan
dTBM
getsstuck.
May
need
tosink
ashaftin
fron
tof
machine
andconstructa
tunn
elba
ckto
andarou
ndtheTBM
tofree
itup
.Groun
dtreatm
enta
ndpo
ssibleha
ndconstruction
throug
hfaultzone
may
berequ
ired
togettheTBM
going
again
Weakgrou
ndan
dhigh
insitu
stresses
lead
ingto
squeezing
action
onTBM
Can
causehu
gedelays.G
roun
dim
prov
ementto
streng
then
thegrou
ndan
dresistthe
squeezingpressures
Too
muchclay
forslurry
treatm
ent
Can
causedelayan
dnecessitateinstallation
ofad
dition
altreatm
entplan
t–extra
hydrocyclones,etc
Groun
dab
rasive
becauseof
high
silicacontentcausingtoo
muchwearon
teeth,
lead
ingto
costan
ddelay
Costmay
beproh
ibitive,necessitatingachan
geof
excava
tion
metho
d
Too
muchwater
andTBM
electricsno
tprotected
Drilling
andgrou
ting
inad
vanceof
machine
orpo
ssibly
grou
ndfreezing
orcompressed
airworking
.Possiblechan
geof
metho
dto
drill
andblastor
employ
differentmachine
withsuitab
lespec
Excesstunn
elslurry
pressure
causes
blow
outat
grou
ndsurface
Low
erpressure
Pressure
toolow
causes
face
colla
pse
Reverse
oftheab
ove

6.5.4 Hard rock tunnelling
The main options are drill and blast, a roadheader excavating machineor to use a TBM that may be either open (without a protective shield) orshielded.
6.5.4.1 Drill and blast/roadheaders
Generally, drill and blast tunnels are more flexible than TBMs and allowdifficult ground conditions to be understood andovercome, but theymaybe much more time consuming unless a number of access points can befound to allow operations to proceed from several faces at the same time.Holes are drilled in the face, and explosives placed in the holes. Issues
of tunnel blast design are addressed by Zare & Bruland (2006). Theholes are detonated sequentially to break to a free face over microseconds. The aim is to break the rock to manageable size so it can beexcavated (mucked out) readily with machines, without further blastingor hammering. Other aims may be to keep blast vibrations to a mini-mum and not cause damage or offence to nearby residents, and usuallyto keep as closely as possible to the excavation shape prescribed by thedesigners, i.e. minimising overbreak. Typical advances per round are 3to 3.5m, sometimes up to 5m in very good rock conditions. Dependingon the size of tunnel and ground conditions, the full face may be blastedin one round ormay be taken out as a series of smaller headings – top, orside, thatmay be supported by sprayed concrete with steel mesh or steel/carbon fibres, rock bolts, and/or steel arches or lattice girders, before thetunnel is advanced. Figure 6.15 shows a tunnel portal following the firstblast, with steel arches being erected to protect the tunnel access.
Figure 6.15 Afterfirst blast andmucking out,construction oftemporary steelarches to protecttunnel portal,Queens ValleyReservoir, Jersey,UK.
258 Practical Engineering Geology

After blasting, and dust and gases have dissipated and safety checksmade (e.g. formethane or radon), the broken rock ismucked out and it isthe engineering geologist’s task to examine and map the geologicalconditions exposed. The freshly blasted rock may well be unstable, andthe geologist should not approach the face until the contractor hascarried out all necessary scaling and/or rock support work to make thetunnel safe. The contractor has overall responsibility for site safety andhis instructions should be followed at all times in this respect. A decisionwill then be taken on whether the ground is as expected, if the groundis changing (and probing ahead is required), and the supportrequirements. Any potential for deteriorating conditions or, for example,a major potential wedge failure, need to be identified quickly so thatsupport measures can be taken. As illustrated in Figure 6.16, often therock mass is self-supporting. As the tunnel is excavated, the tunnel wallsmove inwards, the rockmass dilates and generally locks up. If there is aninherentweakness, such as a freewedge of rock or a fault zone, then localcollapse can be followed by ravelling failure, which could chimney to theground surface. In two of the examples discussed in Chapter 7, thesituation deteriorated quickly. If conditions are poor and getting worse,then the ground might be supported in advance of the tunnel by anumbrella of spiles or canopy tubes, and/or by pressure grouting.In suitable rock, other mining approaches may be used, including the
use of large roadheaders that cut their way into the rock but do notexcavate the full face profile in one operation, unlike a TBM. In a tunnelformed by drill and blast or roadheader, it is possible to examine andrecord the ground conditions throughout construction and make deci-sions as to the support required. In a TBM tunnel, little can be told about
Figure 6.16 (a)Convergence inrock tunnel tostable condition.(b) Local failureand ravelling toground surface.
Analysis, design and construction 259
Self stablisation of interlockingrock mass with no specificfailure mechanism
a) b)
If no self stablisation then mayneed to reinforce with bolts,shotcrete, steel arches or latticegirders
Local support to preventfailure – bolts and anchors
Rock massdilates –strengthening
Specific failure mechansim.In worse case rock mass may‘unravel’ back to the surface –called ‘chimneying’

the ground ahead of themachinewithout stopping anddrilling in front ofthe face, which disrupts operations and is therefore to be avoided.
6.5.4.2 TBM tunnels in rock
The design and use of modern hard rock TBMs is covered comprehen-sivelybyMaidl et al. (2008). IngoodrockwithhighRQD,openTBMsaresometimes used, but generally only for relatively small diameter tunnels.The tunnel advances by jacking forward against grippers that areextended laterally against the tunnel walls. Clearly, if the rock becomespoor quality then there may be problems with the grippers. There is alsono way of preventing groundwater ingress other than by grouting, pre-ferably in advance of themachine. InChapter 7, a case (SSDS) is presentedwhere open-rock TBMs were selected, anticipating good rock conditionswith low water inflows, and the operations were halted when inflowsbecame too great and grouting in advance was extremely difficult.In poorer-quality rock, generally, shielded TBMs are used. A single-
shield machine pushes against the liner, as for soil TBMs (Figure 6.14c).In other set-ups there are two shields; the rear shield has grippers andprovides the reaction against which the front shield can push forward.The cutter head has discs that rotate as the cutter head itself rotates. Thethrust of the machine causes the rock to fail, mainly in tension. A majorconsideration is the lifetime of the cutting discs before they need to bereplaced, as addressed by Maidl et al. (2008). A case example inChapter 7 describes considerable wear in an EPBM used to tunnelthrough abrasive sandstone.
6.5.5 Tunnel support
6.5.5.1 Temporary works
Rock tunnelling, in general, relies largely on the rock mass locking up asjoints and interlocking blocks of rock interact and dilate during theprocess of convergence towards the excavation. Good-quality rockoften forms a natural arch and no or little support is needed. However,in weaker ground, such as in fault zones, the rock mass cannot supportitself, even with reinforcement, and requires artificial support in the formof steel arch ribs, typically encased in shotcrete. Optimising supportrequirements in weaker ground requires prediction of likely convergencerates,makingobservations as excavation is undertaken, i.e. observationalmethods, and then applying support such as rock bolts and/or shotcreteand/or steel arch ribs to control the movement and prevent excessiveloosening (Powderham, 1994). In stronger, blocky rock masses, rockmovement will be much less, and the purpose of the support is then toprevent loss of loose blocks andwedges, whichwould destabilise the archand maybe lead to ravelling failure.
260 Practical Engineering Geology

Rockmass classification systems introduced in Chapter 4 are linked tocharts allowing decisions to be taken as to the immediate (temporary)support measures required. These are reviewed by Hoek et al. (1995). Inpractice, decisions may often be biased by other considerations such asthe materials and equipment at hand and the workers’ perceptions of thedegree of risk and how well previous support measures have worked.This may of course have cost implications and may also later become amatter of dispute as to what was really necessary, as discussed andanalysed by Tarkoy (1991). The importance of good engineering geolo-gical records during construction is emphasised. In severe situations suchas high stress or intense water inflow, steel lining may be used but eventhen this sometimes proves inadequate as happened during the construc-tion of the Tai Po to Butterfly Valley water supply tunnel in Hong Kong,where unexpectedly highwater pressures buckled the liners (Robertshaw& Tam, 1999; Buckingham, 2003).
6.5.5.2 Permanent design
There are twomain areas for consideration: firstly, the area around theportal, especially for tunnels that are part of a road or rail system, and,secondly, need for a permanent liner.
6.5.5.2.1 PORTAL DESIGN
The area above the entrance to a tunnel often requires careful engineeringto make it safe, both during construction and during operation. Theproblems are essentially the same as for general slope stability design,as discussed later in this chapter, but the need for long-term inspectionandmaintenance, whilst maintaining tunnel usage, sets portal design in arather special category.Acanopy is often constructed toprotect theportalarea from falling rock and other debris, as illustrated in Figure 6.17.Catch nets, barriers (such as gabion walls) and in situ stabilisation can
Figure 6.17Canopy extendingout from tunnelliner (beingwaterproofed), toprotect portal area.A55, North Wales.
Analysis, design and construction 261

beused to prevent debris impacting theportal area.Rock and soilmassesimmediately above the portal area are often coveredwith steel mesh andshotcrete or similar hard covering and dowelled, nailed or anchoredbackusing post-tensioned bolts and cable anchors. The requirements fordesigning, protecting and maintaining ground anchorages are set out innational standards and codes of practice such as BS 8081 (BSI, 1989)and BS EN 1537 (BSI, 2000). Despite such standards, things occasion-ally go wrong, either because of ground conditions or flaws inthe anchorage itself, and designers must appreciate the practical difficul-ties that might be associated with maintenance programmes whilstensuring safety for the road user. If a major problem is found, then thetunnelmight need to be closedor restricted in usewhilst the problems arerectified. Several cases of the failure of rock anchorages, even in projectspost-dating BS 8081, are discussed in Chapter 7.
6.5.5.2.2 PERMANENT LINERS
The options for permanent tunnel liner design include:
– Unlined (ignoring temporary support measures)– Unreinforced concrete– Reinforced concrete– Steel.
Lined tunnels can be designed to be undrained, in which case thepermanent lining must withstand the full groundwater pressure aswell as rock loads. Other tunnels are designed to be drained, wherebythe outer surface (or extrados) of the arch of the liner is lined with awaterproofing membrane laid onto geotextile sheets, which carrywater down to drains and sumps below the tunnel invert. The sumpsmay need continual pumping, and the whole drainage system needsmaintenance over the life of the project. Figure 6.18 shows details of adesign, as used in some recent rail tunnels in Hong Kong. Aftershotcreting the tunnel walls, layers of geotextile (outer) and water-proof membrane (inner) are placed, followed by an inner concreteliner (250 mm thick). Groundwater is thereby channelled via thegeotextile to an egg box drainage system in the invert. For anydrained lining design, care must be taken that any permanent draw-down in the water table has no adverse affects on structures abovethe tunnel or on water supply from groundwater sources.Precast concrete segments are commonly erected as part of a TBM
excavation and support process, mainly in soft ground tunnels, but alsoin somehardrockapplications.The segmentsaremanufacturedexternallyand thenerectedwithin the shield surrounding theadvancingmachineandboltedtogether. Ifrequired,segmentscanbefittedwithgasketstoformfullywaterproofconcrete liners (Figure6.19).Asnotedearlier, the installed linercan be designed to provide a reaction to push the TBM forward.
262 Practical Engineering Geology

Figure 6.19 Interlocking tunnel segments, prefabricated and erected to the rear of a TBM shield(figure courtesy of Mike King, Halcrow).
Figure 6.18 Egg box drainage system for a drained tunnel (courtesy of MTRC, Hong Kong).
finished tunnel
shotcrete
inner,concretelining
geotextile layer andwaterproofingmembrane
‘egg box’ drainagesystem being placed ongeotextile, linked todrainage around innerconcrete liner

One of the most severe design situations is in high-pressure watersupply tunnels associated with hydropower constructions where forsome operational periods the tunnel carries water under high pressure,but at other times the same tunnels are empty and have to withstandsignificant external water and rock pressures.The main concerns with pressure tunnels are:
– Potential damagebyhydraulic fracturing (formationofnewfractures)or jacking (opening of existing fractures) within the rock mass, and
– Stability, durability and low maintenance.
To avoid hydraulic fracturing, an empirical rule is sometimes used:
DγRHγW
> 1:25 ðHaimson; 1992Þ
Where γR is unit weight of rock and γW is unit weight of water, D isrock overburden at tunnel location and H is the water head. However,it is important to recognise that this formula only considers verticalin situ stress. Horizontal stress can be very low in some situations, forexample, close to valley sides, and this will control the risk of hydraulicfracture or jacking if water from the tunnel can reach the excavatedrock surface at sufficiently high pressure.Where the confining rock stress, vertical and/or horizontal, is too low,
fullywelded continuous steel liners are generally used to prevent the high-pressure water from reaching the rockmass. Concrete liners may be usedin competent rock but might crack under high internal water pressure ifthe confining stresses are too low. In such cases, there is a risk of leakageto surrounding ground (with a risk of causing landslides in some situa-tions) and/or water flow into other underground openings. Haimson(1992) presents examples of schemes where the importance of stressconditions and the correct choice of lining only became evident late inthe design process, with ‘unpleasant consequences’. An important task ofthe engineering geologist is to ensure that the in situ stress conditionsalong the route of a pressure tunnel are evaluated fully and reported tothe design team, preferably at an early stage in project planning.In certain situations, typically in low pressure headrace tunnels, a
concrete liner can be designed with drainage holes to relieve waterpressure on the tunnel lining. Consolidation grouting is usually carriedout around the tunnel to reduce leakage out of or into the tunnel(depending on the relative internal and external water pressures).Unlined tunnels can be used in good rock conditions and with favour-able in situ stresses, but there may be higher maintenance requirementsand the need to construct rock traps to catch any fallen debris. Theproper design of hydraulic pressure tunnels is particularly important asthe consequences of failure are usually very severe and costly to repair.A comprehensive summary of the principal design and constructionconsiderations is presented by Benson (1989).
264 Practical Engineering Geology

6.5.6 Cavern design
Caverns are large-span underground openings and these are used formany purposes, including sports halls, power stations and oil and gasstorage (Sterling, 1993). Hydroelectric power caverns and large three-lane road tunnels are typically 20 to 25m span, but caverns have beenconstructed successfully in good-quality rockwith spans in excess of 60m(Broch et al., 1996), and natural caves are found with much larger spans.There is considerable guidance in the literature on approaches to
their design and construction (e.g. Hoek&Brown, 1980; GEO, 1992).Many design issues are similar to tunnels but because they are at fixedlocations, ground investigation decisions are more straightforward.The other major difference is scale. Whereas many tunnel walls lockup as the rock dilates, and need little support to ensure stability, in acavern there is more potential for large-scale strain and failuremechan-isms to develop. For example, large caverns were required for a pro-posed high-speed rail station at Taegu, Korea, in strong mudstone.Preliminary numerical analyses were carried out to design permanentconcrete liners and bolting support, assuming essentially isotropic rockmass parameters. The design had to be revised when it was realisedthat the rock structure was strongly anisotropic with bedding mostlyhorizontal and many near-vertical tensile joints infilled with calcite(Figure 6.20). These joints could allow discrete failure into the crownof the openings, as illustrated by Maury (1993) for mine workings.
Figure 6.20 Rock core from vertical borehole in strong mudstone, Taegu,South Korea. Note near-vertical persistent joint infilled with calcite. Thisnetwork of joints (two sets orthogonal to bedding) were encounteredfrequently in preliminary boreholes, and appreciation of their significance ledto a) reconsideration of the potential rock loads on the permanent liners andb) additional ground investigation using inclined rather than vertical holes tocharacterise the rock mass better.
Analysis, design and construction 265

Hoek & Moy (1993) and Cheng & Liu (1993) describe differentaspects of the design and construction of the Mingtan pumped storageproject in Taiwan and illustrate the need for an integrated approach ofgeological investigation, modelling, design, observation, constructionand instrumentation. An exploration/drainage gallery and two othergalleries were used to install long corrosion-protected permanent cableanchors to reinforce the roof arch of the main cavern 10m below, priorto its excavation. Small loads were applied to the cable anchors, whichonly took on their full loads as the cavern was excavated.
6.5.7 Underground mining
Underground mining is quite different from the formation of cavernsand tunnels for civil engineering, although many of the skills requiredare the same. In mining, the objective is to extract the ore whilstminimising waste rock production. Safety is a prime concern, as it isfor civil operations, but mining involves the formation of non-permanent voids, many of which will be allowed to collapse orpacked loosely with waste rock, so the fundamental operational con-cepts are obviously quite different. Rock mechanics of undergroundmining operations are discussed by Brady & Brown (2004). In terms ofgeological hazards, of particular concern are flammable and/or noxiousgases, including radon, and the control of dust and ventilation is veryimportant. Such matters are generally mandated by national standardson health and safety but still accidents occur regularly worldwide.A general concern for construction in mining areas is continuing
ground settlement or sudden collapse of old workings. These arematters to be considered at the desk study stage of site investigation,as addressed in Chapter 4.
6.5.8 Risk assessments for tunnelling andunderground works
In Chapter 4, a system was introduced whereby site investigation isconducted or reviewed following a checklist approach whereby firstlygeological hazards are considered, then environmental factors andfinally hazards associated with the specific type of project or construc-tion method. Tunnels are often particularly risky undertakings becausethey are so dependent upon geotechnical conditions, which may varyconsiderably along their length, and it is seldom feasible to carry out ascomprehensive a ground investigation as it is for other types of project.Good reviews of tunnel collapse mechanisms and case histories aregiven by Maury (1993) and GEO (2009) respectively. Consequently,industry has developed several approaches whereby hazards are con-sidered in detail, so that strategies can be prepared to reduce or mitigatethe risks. This can be done at the option assessment and design stagesand then later as part of the management of construction.
266 Practical Engineering Geology

The British Tunnelling Society Joint Code of Practice for RiskManagement of Tunnel Works in the UK (BTS, 2003) was preparedjointly by the Association of British Insurers and the BTS and sets outrequirements regarding risk assessment and management for any tunnelwith a contract price of more than £1 million. In effect, it is mandatoryin the sense that without its adoption, no insurancewill be forthcomingfor an underground project. The Code of Practice sets out how andwhen risk is to be assessed andmanaged, and by whom. Risks are to beassessed at the project development stage (design), by the contractor attender stage and during construction through a risk register.The Code also requires the ground reference conditions or geotech-
nical baseline conditions to form part of the contract, but as noted inChapters 2 and 4, definition of such conditions is not always straight-forward. Whilst the intention to avoid dispute is laudable, there maybe considerable difficulty in summarising geological and geotechnicalconditions succinctly and unambiguously.
6.5.8.1 Assessment at the design stage
The ways that risk can be assessed at investigation and design stagesare illustrated by the example of the 16.2 km Young Dong rock tunnelin Korea, as presented in Appendix E-1 and E-2. Given an appreciationof the ground conditions along the route, based on a well-conductedsite investigation, the hazards associated with the various options forconstruction can be considered. Once these have been identified, theirlikelihood and seriousness can be rated in terms of potential conse-quence (e.g. programme, cost, health and safety) and methodologiesdevised for mitigation prior or during construction. Decisions can thenbe made on how to proceed.
6.5.8.2 Risk registers during construction
During construction, hazards that were anticipated at the design stagemay prove real or illusory. New ones will be identified and need to bedealt with. The current way of so-doing is to employ a risk register inwhich hazards are identified and assigned to individuals in the projectteam to derive strategies for their avoidance or mitigation. In the BTSCode of Practice (2003), this is identified as a task for the contractorbut the register will include risks brought forward from the projectdevelopment stage. In practice, it may well be the project engineerrather than the contractor who manages the construction risk register,perhaps at monthly meetings held to monitor progress on mitigatingeach of the identified risks, remove from the register those that havebeen dealt with, and recognise and assign to individuals any new risksidentified during the course of the work. Brown (1999) outlines therisk management procedures adopted for the successfully completedChannel Tunnel Rail Link Project in the United Kingdom, and a list of
Analysis, design and construction 267

typical tunnelling hazards to be considered during construction ispresented in a table in Appendix E-3.
6.6 Slopes
Landslides cause major economic damage and kill many people eachyear. Slopes can be split into natural andman-made. The hazards fromnatural terrain landslides in mountainous regions and at the coast areconsidered in Chapter 4.Man-made slopes include cut slopes (cut into the natural hillside)
and fill slopes. Fill slopes might simply comprise the excess debris froman adjacent cutting, dumped or compacted onto the adjacent hillside toform an extra carriageway, but can also include sophisticated, highand steep slopes incorporating geotextiles or other materials tostrengthen the soil (Figure 6.21). Stability needs to be assessed byengineers and if considered unstable, measures must be taken toimprove the stability to an acceptable level.
6.6.1 Rock slopes
Rock slope stability is generally controlled by the geometry of pre-existing, adversely oriented discontinuities, including bedding planes,faults and master joints including sheeting joints. Failure types can begrouped as illustrated in Figure 6.22 and as follows:Shallow: superficial failures, generally low to medium volume.Structurally controlled: slidingmay occur on one ormore intersecting
discontinuities that are adversely oriented relative to the slope geome-try. Toppling can result because of the presence of unstable columns
Figure 6.21Construction ofreinforced earthembankment forCastle Peak Roadwidening, HongKong.
268 Practical Engineering Geology

of rock, perhaps dipping steeply back into the slope. Large complexfailures can involve a number of adverse sets of discontinuities togetherwith some breaking through intact, perhaps weathered rock, allowingthe full mechanism to develop.Deep seated, non-structurally controlled: the rock can be considered
an interlocking mass of rock blocks without adverse fabric such asbedding, schistosity or systematic joints.
6.6.1.1 Shallow failures
Steep rock slopes are sources of rockfalls, which can be a major risk,especially where adjacent to a busy road or railway. All rock slopesurfaces deteriorate with time (Nicholson et al., 2000). Rock materialweathers, vegetation grows and opens up joints and blocks get under-mined by erosion (Figure 3.58). Even small blocks can cause accidents.On large lengths of highway through a mountainous region, there willbe a need to identify where the risk is greatest so that the risks can bemitigated cost-effectively (Box 6-4). This can be done by using someRock Mass Rating appraisal system together with software capable ofpredictingwhere falling rockmight end up, but it is often just amatter ofengineering judgement taking account of the history of rockfalls. In suchan assessment, it should be remembered that relatively minor rockfalls
Figure 6.22 Modes of failure in rock slopes.
Analysis, design and construction 269
rock fallravelling
wedge
topple
– Rock Mass Rating RMR– GSI (Hoek-Brown)– Hack SSPC (Hack, 1998)
Options for assessing rock mass strengthinclude:Rock mass is weakened by discontinuities
even though they do not fully define thefailure geometry
Failure geometry followspattern of geologicaldiscontinuities
May be controlled bydiscontinuity pattern ormaterial deterioration. Oftentriggered by rainfall,vegetation jacking orvibration
complex
DEEP-SEATEDNON-STRUCTURAL
STRUCTURAL
SHALLOW
planar

may be precursors to major rock collapses. Methods of mitigatingrockfalls and other potential landslides are discussed below.
Box 6-4 Judging the severity of rockfall hazards and the associated risks
‘People – even experts – rarely assess their uncertainty to be as large as it usually turns outto be.’
Baecher & Christian (2003).
The assessment of hazard of rock slope failure is always rather subjective, as illustrated by a visit to thepetroglyphs at Anhwa-ri, Goryeong, Korea, in February 2008. The rock exposure shown in FigureB6-4.1, above the rock carvings, appears to be on the brink of failure and one would be tempted to
fence off the area, immediately followed by removal of any blocks that cannot be stabilised bydowelling and dentition works. However, the fact that the precarious open-jointed rock is directlyabove the ancient rock carvings, is evidence that this rock face has not retreated very far over aperiod of more than 2,000 years. The process of deterioration and collapse is actually quite slow andjudgment of the risk as immediate and obvious, requiring urgent action, would therefore err on theconservative side.
Conversely, the slope shown in Figure B6-4.2 is in the Cow and Calf Quarry at Ilkley, Yorkshire, in theUK, and was used to teach MSc engineering geology students to map rock discontinuities for severalyears. The collapse to the left of the photograph occurred unexpectedly between mapping exercises,despite its repeated examination and systematic logging on scan lines, without the failure mechanismhaving been identified.
Figure B6-4.1 Petroglyphs at Anhwa-ri, Goryeong, Korea. Rock slope above petroglyphs (with smallprotective fence) shows signs of vegetation wedging, with loose blocks resting against trees.
270 Practical Engineering Geology

These examples illustrate our uncertainty and the difficulties in judging the degree of hazard byexamination alone. It is highly likely that even after ground investigation, our ability to judge theseverity of the situation is often rather poor. The conclusion must be that consequence should bethe priority when assessing the risk of slope failure. If there is a major risk to life, then worksshould be done. This is the underlying philosophy behind the Landslide Preventive Works (LPM)strategy in Hong Kong where the catalogue of tens of thousands of slopes, prepared in the 70s and80s, has been compiled and ordered in terms of perceived risk (a function of height, angleand proximity to vulnerable facilities). Each slope is being checked and upgraded in order. Mostof these are dealt with using essentially prescriptive engineering works, including soil nails andinclined drains installed to a pattern.
If there is clear danger from the hazard, then it should be dealt with. In the Korean case discussedabove, despite the apparently slow retreat of the rock exposure above the petroglyphs, visitors to the siteshould be protected against the evident rockfall hazards.
Quantitative risk assessment of rockfall to roads
At the site shown in Figure B6-4.3, while it might be intuitively obvious that there is some risk to life fromrockfall along the road and some history of such rockfalls, the cost of preventive works may be veryexpensive. One way to deal with this quandary is to try to quantify the risk and compare this to the cost ofreducing the risk.
To do this requires the following data to be measured or estimated:
– Frequency and size of rockfall incidents (per day).– Number of vehicles per day, average length and velocity.– Vulnerability of persons in vehicles to rockfall (depends on size of falls).
Figure B6-4.2 Unexpected rock failure in Cow and Calf Quarry, Ilkley, West Yorkshire, UK.
Analysis, design and construction 271

The annual probability of risk of death can then be calculated and compared to published guide-lines on acceptable risk (e.g. Fell et al., 2005). Different sections of road will be shown to havedifferent risk levels, which will allow decisions to be made on where to carry out mitigation works.Quite often such a calculation will show that risks are acceptable even if, judgmentally, the hazardis still intolerable (the situation looks very worrying). It may well be found that relatively simplemeasures, such as scaling off the most obvious loose rock and providing netting or cheap barrierssuch as gabions locally, will reduce risk considerably whilst also making the situation feel safer.Further guidance on judging rockfall hazards and the use of rockfall rating systems is given byBunce et al. (1997) and Li et al. (2009).
6.6.1.2 Structural
The distinction of failure mechanisms into planar, wedge and top-pling, and the discontinuity geometries and conditions responsiblefor each style of failure, are set out clearly by Hoek & Bray (1974),and this has been updated by Wyllie & Mah (2004). The mostcommon type of failure is sliding on a single discontinuity, and thisis simple to analyse. The main difficulties are in assessing shearstrength of the rock discontinuities, as set out in Chapter 5, andhow to deal with groundwater pressures. Generally, a simple analysisis done in which it is supposed that water pressure at the slope face iszero, increasing back within the slope, to some height below groundsurface at the rear of the slope (Figure 6.23). This is often a conser-vative assumption, in that water pressure will be localised, not actingthroughout the whole slope at the same time. Richards & Cowland(1986) discuss a well-investigated site where it would have beenunrealistic to design the slope to withstand the maximum water
Figure B6-4.3 Road cut through limestone with very little engineering support or protective measures,Tailuko Gorge, Taiwan.
272 Practical Engineering Geology

pressures at each location, all acting at the same time, because instru-ments clearly showed pulses of water pressure travelling through theslope, following a rain storm.Even small intact rock bridges can provide sufficient true cohe-
sion to stop seemingly hazardous slopes from failing (Figure 5.19).This can be a major dilemma because the rock bridges cannot beseen or identified by any realistic investigation method. Carefulgeological study has failed to identify a useable link between per-sistence and any other measurable joint characteristic (Rawnsley,1990) and, it must be remembered, traces exposed at the Earth’ssurface may be poor representations of characteristics inside theunexposed mass, because of stress relief and weathering. Because ofthis uncertainty, designs will typically require the risk of failure tobe minimised by incorporating toe buttresses, reinforcement withanchorages of some kind, or some other protection, possibly usingan avalanche shelter.From experience, wedge failures are relatively rare so that even
where these are identified as a problem from stereographic analysis,this might not develop in practice. Similarly, most slopes thatappear to have a toppling problem do not do so in reality, generallybecause of impersistence. Care must be taken, therefore, to berealistic in appraising the results of any geometrical analysis thatsuggests there to be a problem. One factor that must be consideredis risk, which is the product of hazard (likelihood of a failure) andconsequence (likelihood of injury or damage). One other aspect isthat where major failures do occur, it is often found by laterinspection that the rock mass was in serious distress long beforefailing and this might have been discovered by carefully targetedinvestigation. Key factors to look for are open and infilled jointsand distorted trees, though again the situation might be less riskythan it immediately appears (Box 6-4). There is no easy answer tothis – it is a matter requiring observation, measurement, analysis,experience and judgement, and consideration of consequence.
Figure 6.23Typical model foranalysing influenceof water pressureon stability of asliding rock slab.
Analysis, design and construction 273
Water pressure here,P = zw × 9.8 kN/m2
Water force exerted on vertical joint,V = 0.5 × zw × P kN
Water uplift force on potential sliding surfaceU = 0.5 × l × P kN
zw
V
U

Monitoring can be conducted in the real time, for example, usingtotal systems that record movements at short intervals automaticallyor vibrating wire strain gauges with data transferred to the respon-sible person, as discussed in Chapter 4. Alternatively, periodicexaminations using inclinometers, radar or photogrammetry canall be effective.
6.6.1.3 Deep-seated failure
Very large rock slope failures often involve some zones wheresliding on discontinuities is happening whilst elsewhere the rockmass may be acting as an isotropic fractured mass in a Hoek-Brown way and in other areas intact rock may be failing.Explaining such complex failures is a much easier task than pre-diction. Many large failures have been studied in detail, and thesecases are probably the best place to look for ideas and inspirationwhen dealing with large slopes (e.g. Bisci et al., 1996; Eberhardtet al., 2004).
6.6.2 Soil slopes
For soil slopes, where the ground mass can be regarded as essen-tially isotropic within each unit or layer (stratum), analysisinvolves searching through the slope geometry, looking for thepotential slip planes with the lowest FoS. This can be doneeasily using available software such as SLOPE-W and Slide. Inweathered rock and indeed many soils, stability might well becontrolled by adverse relict joints and other weak discontinuitiesso that a variety of possible failure modes need to be addressed.An example of hazard models requiring particular analysis withincut slopes in Eocene mudstone at Po Chang in Korea is given inBox 6-5.
Box 6-5 Hazard models for a slope, Po Chang, Korea
The slope shown in Figure B6-5.1 is within a development site near Po Chang, South Korea. The rockcomprises weak to strong bedded mudstone containing strong rounded concretions. The slope wasexcavated several years prior to the photograph and in some areas is deteriorating very rapidly, withlarge screes of disintegrated mudstone debris.
Apart from bedding, the main discontinuities are orthogonal vertical sets of joints, probablyformed during burial. There are also conjugate shear fractures, inclined at steep angles. As FigureB6-5.2 shows, the same rock is exposed in unprotected slopes adjacent to main roads on theoutskirts of Po Chang. There are evident recent failure scars in some of the slopes.
This case provides an example of how a single slope or series of slopes may contribute severaldifferent hazards, each of which needs to be considered in a different way, as illustrated in FigureB6-5.3.
274 Practical Engineering Geology

Shallow hazards include boulder fall from the concretions, undermined from the continuing ravellingdeterioration of the mudstone. Trees may collapse in a similar way.
There is a risk of structurally controlled failure on the steeply inclined conjugate shear set of joints,with vertical joints providing the release surfaces. There was evidence of such failures in some expo-sures. Finally, there is a risk of large-scale landslide in these steep slopes, involving a generalised slipsurface through the closely fractured rock. The question is how to determine an appropriate setof strength parameters for analysis. It might be reasonable to use the GSI approach (Marinos &
Figure B6-5.2 Road side cutting though same sequence of Eocene mudstone on outskirts of Po Chang.
Figure B6-5.1 View of large cut slope in Eocene mudstone near Po Chang Korea.
Analysis, design and construction 275

Hoek,2000), but the first step would be to collect more empirical data on the way that the Po Changmudstone behaves regionally and to identify whether there are any large-scale failures that might beback-analysed.
The simplest type of analysis is undrained in which it is assumed thatthe soil has a uniform strength, independent of stress level, expressed ascohesion along the potential slip plane. The logic is that any change innormal stress is matched by a change in water pressure so that changein effective stress and frictional resistance is zero. This type of analysis isonly appropriate for earthworks in clay, immediately after cutting, andis not considered further here (see also Box 6-3 re pile design).More generally an effective stress analysis is used where the strength
of the soil (or closely fractured rock) is considered to be derived fromtwo components – friction and cohesion, as per the Mohr-Coulombexpression:
τ ¼ ðσ − uÞtan ϕþ c
Ravelling failureRapid weathering(opening of bedding)Undermining of boulders/concretionsNot appropriate toanalyse numerically –observation of rate
Boulder fall
Geologicalconcept forjoint styles inslope
σ1
σ1
σ1
σ1
σ3
σ2σ3
σ2
σ2
σ2
σ3
σ3
Diageneticburialjoints
Q? how todefine massstrength?
seepage
Slab failure toppling(contribution from rootjacking?)
Tree fall4
3
2
1
4
3
5
1
6
2
7 5
6
7
Translational planarwedge failure
not observed at this sitebut evident at coastalexposure of same rock
Large scale failure mass −most joints & bedding notadverse
Seepage backsapping
Figure B6-5.3 Ground model for slope. Main discontinuities include bedding which is almost horizontal,orthogonal near-vertical joints and steeply inclined shear joints. Potential failure mechanisms (1 to 7) areidentified, each of which need to be considered and assessed individually, both through observation in thefield and by numerical analysis where possible.
276 Practical Engineering Geology

where τ is shear strength; σ is total stress (generally due to weight)normal to the failure plane; u is water pressure reducing σ to aneffective stress, σ′; ϕ is angle of friction; and c is cohesion.Frictional resistance changes with stress conditions, which vary
throughout the slope, and to deal with this, a method of slices is usedtypically to calculate stability. Figure 6.24 shows a slope with the poten-tial failing mass split into four vertical slices. In this diagram, the weightsof slices 1 and 3 have been resolved into destabilising shear force,S, parallel to the tangent to the section of slip surface below each sliceand a normal force acting normal to the shear surface (N). It is evidentthat the ratio of S to N varies considerably from one slice to the next.Slices 1 and 2 are being prevented from failing by Slices 3 and 4. The FoSfor the slope as a whole is the ratio of the summation of shear resistancesbeneath each slice to the summation of the shear components. There aremany different versions of the method of slices. For some, circular slipplanes are assumed, in others, irregular slip surfaces can be analysed(e.g. Morgernstern & Price, 1965). Slice boundaries are generally takento be vertical and assumptions need to bemade regarding the forces at thevertical interfaces between each slice. The method of Sarma (1975)allows non-vertical slices, which gives some flexibility in dealing withmore complex geology. Software packages (limit equilibrium) give arange of options regarding themethodof analysis and give almost instantanswers so the results from the various analytical models can be com-pared. Sometimes this is done in a probabilistic manner, varying thevarious strength parameters through their anticipated ranges and distri-butions (Priest&Brown, 1983). Generally, these analyses are carried outto try to establish that the FoS exceeds some chosen value – typicallybetween 1.2 for a slope with low consequence of failure and 1.4 for ahigher risk slope and, empirically, most slopes analysed with such FoS
Figure 6.24 Themethod of slices forslope stabilityanalysis.
Analysis, design and construction 277
Normal component(N) of weight ofslice (W)
Shearcomponentof weight ofslice (S)
Shear strength for each slice= N tanφ + CWhere C = ‘cohesion’ alongslice base length
W1
W3
2
3
4
N
1

will stand safely provided that the ground model is correct – probably inpart because of inherent conservatism in most assessments of massstrength parameters (see discussion on disturbance in Chapter 4). Moresophisticated analyses can be carried out using generalised representa-tions of soils and their properties in both two and three-dimensions(e.g. FLAC SLOPE and FLAC3D – Itasca), and these software packagesallow the engineer to see how the failure develops in a time-steppingmanner, which is very helpful. The best use of stability analyses is to testthe significance of the various assumptions to the outcome. Lumb (1976)addressed some of the problems of the Factor of Safety approach andadvocated that engineers think instead in terms of probability: ‘forcingthe designer to consider the reliability of all his data and to face up to theconsequences of his beingwrong’. If, for example, water level is shown ascritical to stability, then that should lead to a careful assessment of theneed to prevent infiltration and to install drainage systems.In the partial factor approach of Eurocode 7, each part of the
analysis – forces and strength parameters – are factored in a prescrip-tive manner. Commonly used software packages can cope with this.This approach might be regarded as rather limiting and perhaps givingan incorrect impression that everything is understood and thatall factors are always the same. For example, the Eurocode partialfactor for cohesion is the same as for friction (1.25), whereas it iscommon experience that friction can generally be measured or esti-mated with far more confidence than cohesion and changingassumptions on cohesion can have a disproportionate influence oncalculated FoS.All analyses are of course only as valid as the input parameters and
especially the geological and hydrogeological models; if the model iswrong, so will be the analysis. In a study of the failures of severalengineer-designed slopes, Hencher (1983e) concluded:
‘Six of the eight cut slopes that failed had been investigated by drillingin recent years. In five of these cases, important aspects that controlledthe failure were missed. In only one case were the true geologicalconditions recognised, but even then the groundwater levels wereunderestimated considerably. In all cases, where piezometric datawere available and the groundwater level was known by other means,albeit approximately (e.g. observed seepage), the piezometric data didnot reflect peak water pressure at the failure surface. This was princi-pally due to failure to observe rapid transient rises and falls in waterlevels. A further problem was that many of the piezometers wereinstalled at levels where they could not detect the critical perchedwater tables which developed.’
More recently, Lee & Hencher (2009) document a case study wherea slope was subject to numerous ground investigations and analy ses(often in response to some relatively minor failure) over many years,
278 Practical Engineering Geology

before the slope finally collapsed in a disastrous manner. There werefundamental misconceptions about the geological conditions by all ofthe investigators. The potential for self-delusion that such methods ofanalysis truly represent actual stability conditions is expressed a littlecynically in the song ‘Slopey, Slopey, Slopey’ in Box 6-6. Lerouiel &Tavernas (1981) used various classic examples of slope failures andtheir analysis to demonstrate how different assumptions can lead todifferent results and explanations.
6.6.3 Risk assessment
A decision needs to be made on whether the risk from slopefailure is acceptable or not and whether the cost of engineeringworks can be justified. A modern approach to assessing the needfor preventive measures is to use quantified risk assessment, asdescribed by Pine & Roberds (2005). The project describedinvolved remediation and stabilisation of several sections of highcut and natural slopes dominated by potential sheeting joint fail-ures and by the potential for failure of rock blocks and bouldersbouncing down exposed sheeting joints to impact the road below.Design of slope cut-backs and stabilisation measures was based ona combination of reliability criteria and conventional FoS designtargets aimed at achieving an ALARP (as low as reasonably prac-ticable) risk target, which, in actuarial terms, translated to lessthan 0.01 fatalities per year per 500m section of the slopes underremediation. Further examples of quantitative risk calculation aregiven by Fell et al. (2005).
6.6.4 General considerations
Remediation of stability hazards on slopes is often not trivial,especially where the works are to be conducted close to existing infra-structure and implementation of the works can itself increase the risklevels, albeit temporarily. Factors that will influence the decision onwhich measures to implement include the specific nature of thehazards, topographic and access constraints, locations of the facilitiesat risk, cost and timing. The risks associated with carrying out worksnext to active roads, both to road users and to construction workersthemselves, need to be addressed (GEO, 2000a). Pre-contract stabili-sation works might be needed to allow site access and preparation.Preventivemeasures such as rock boltingmay be carried out at an earlystage to assist in the safe working of the site and designed to formpart of the permanent works. Options for the use of temporaryprotective barriers and catch nets to minimise disruption to trafficduring the works also need to be addressed, as do contractual controlsand alternatives for supervision of the works. Traffic controls may be
Analysis, design and construction 279

Box 6-6 Slopey, Slopey, Slopey (1982)
– sung (and danced if you wish) to the tune of the Hokey-Cokey.
You put your phi value inYou take your c' value outYou add a bit of suctionAnd you shake it all aboutYou do the old Janbu2 and you turn aroundThat’s what it’s all about.
Chorus:Oh slopey, slopey, slopeyOh slopey, slopey, slopeyOh slopey, slopey, slopeyIt’s so easyOne – point – four3!
Written and sung by the GCO Cabaret Stars, 1982
2 Janbu is the author of a commonly used limit equilibriummethod of slices for calculating Factors of Safetyof slopes and can be applied to non-circular surfaces. There are two forms: a routine method and a rigorousmethod (Janbu, 1973). Lumsdaine&Tang (1982) carried out an exercise comparing results of calculationsby six Government Offices and 36 others and found a very high proportion of analytical errors and lack ofdocumentation, which of course is over and above any uncertainty in groundmodel, parameters adopted andassumed groundwater conditions – either positive pore pressure or suction.3 A Factor of Safety of 1.4 is generally regarded as an acceptable number to guard against failure in a high-risk slope in Hong Kong (GCO, 1979; 1984).
Figure B6-6.1 Chung Hom Kok, Hong Kong.
280 Practical Engineering Geology

needed, and in some circumstances it will be necessary to closeroads or evacuate areas temporarily, especially where blasting is tobe used. The use of a risk register, as piloted for tunnels (Brown,1999), with clear identification of particular risks and responsibleparties, helps to ensure that all hazards and consequences areadequately dealt with during construction. Decision analysisis now widely applied at an early stage to assess whether tomitigate slope hazards (e.g. by rockfall catch nets) or to remedi-ate/resolve the problem by excavation and/or support approaches.If construction of intrusive engineering measures to stabilisehazards might be unduly risky, then passive protection can beadopted instead. A hybrid solution is often the most pragmaticapproach for extensive, difficult slopes where some sections mightbe stabilised by anchors and buttresses, with other sectionsprotected by nets and barriers (Carter et al., 2002; Pine &Roberds, 2005).
6.6.5 Engineering options
Some of the options for improving the stability of slopes are illustratedin Figure 6.25 and listed more comprehensively in Hencher et al.(2011). These can be split into passive options that either deal withthe possible failure by controlling surface deterioration at source, orinstalling preventative reinforcement to increase local factors of safety,or adding walls or buttresses to restrain detached debris before itcauses injury or damage, and active measures that enhance overallFactors of Safety of larger sections of slope by major engineeringworks, including cut backs or buttresses or heavy tie-back cableanchors.
6.6.5.1 Surface treatment
Many risks can be mitigated cost-effectively through surface treatmentto stabilise or remove relatively small blocks of rock. Surface drainageis important, using adequately sized concrete channels with a fallacross the slope and channels down the face that may be stepped toreduce velocity of flow. Further guidance is given in GCO (1984a) andin Ho et al. (2003).There is a temptation to use hard slope treatments such as shotcrete
to constrain loose blocks at the slope surface but such measures, if notproperly designed, can restrict drainage from the slope, hide the geo-logical situation from future investigators and can themselves cause ahazard as the shotcrete deteriorates, allowing large slabs of shotcrete todetach. Furthermore, shotcrete is increasingly an unacceptable solu-tion for aesthetic reasons and there is a push towards landscaping highvisual slopes where safety is not compromised (GEO, 2000b).
Analysis, design and construction 281

Bioengineering is used to generally improve the stability and reduceerosion from natural slopes. Roots bind the soil and vegetation canincrease surface runoff. Most bioengineering solutions cannot, how-ever, be relied upon to improve the long-term stability in risky slopes,because vegetation can rot and die or be destroyed by fire.Furthermore, root growth can lead to rock blocks becoming loosenedand detached.
6.6.5.2 Rock and boulder falls
Where individual rockfall sources are identified, these can be scaledoff, reinforced by dowels, bolts, cables or dentition buttresses and/ornetted where the rock is in a closely jointed state. Removing largeblocks can be difficult because of the inherent risks associated withbreakage techniques, including blasting and chemical splitting, whichcan dislodge blocks unexpectedly. Care must be taken to protect thepublic and workers during such operations. The most difficult zones todeal with are those with poor access. Implementing passive or activeprotection needs to start from safe ground andmove progressively intothe areas of more hazardous stability.Rockfall trajectory analysis, using widely available software, allows
prediction of energy requirements and likely bounce heights and run-out damage zone extent. Where energy considerations allow, toe zoneprotection measures, catch benches, catch ditches and toe fences
Figure 6.25Schematicrepresentation ofvarious measuresfor stabilising rockslopes or protectingpublic.
282 Practical Engineering Geology
Surface channels to preventwater ingress/surfaceerosion
Scaling orbuttressing/restrainingof loose blocks
Patterndowelingespecially ofkey blocks
Anchoring ofslabs shown tohave low F of S
Drains
Catchnets tostop rockfallsreachingfacility

provide the earliest viable mitigation approach, without requiringaccess to the slope.Catch nets or fences can be positioned on-slope or in the toe zone of
the slope, depending on energy requirements and site restrictions. Anexample is shown in Figure 6.26. Where energies computed fromrockfall analyses are too high for toe zone protection alone to maintainrisk levels below prescribed criteria for highway or rail users, on-slopeenergy protection fences become a necessity to reduce total energyimpact at road level. Where the road (or railway) passes under areasprone to continuous rockfall, an avalanche shelter is commonly used(Figure 6.27).
6.6.5.3 Mesh
Wire mesh is commonly used to restrict ravelling-type rock failure andcan be fixed at many anchorage points or can simply hang down theface, fixed with anchors at the top and weighted with scaffold barsor similar at the toe. Mesh (varying from chain-link, triple twist,hex-mesh to ring-net, in increasing order of energy capacity) can beplaced by a variety of techniques, ranging from climber-controlledunrolling of the mesh to the use of helicopters.
6.6.5.4 Drainage
Deep drainage can be very effective in preventing the development ofadverse water pressures, and this is often a combination of surfaceprotection and channelling of water away from the slope and inclineddrains drilled into the slope. Regular patterns of long horizontal drain
Figure 6.26Retainingstructures and catchnets to stop naturalterrain landslidesimpacting newroad, LantauIsland, Hong Kong.
Analysis, design and construction 283

holes can be very effective, but all drains will seldom yield water flows,and the effectiveness of individual drains will probably change withtime as sub-surface flow paths migrate. Typically, drains compriseplastic tubes with slotted crests and solid inverts, inserted into pre-drilled holes of tens or even hundreds of metres. Inner geotextile linersmight be used that can be withdrawn and replaced if they get cloggedup. Drains might need to be flushed out periodically. Attention shouldbe made to detailing the drain outlets properly otherwise the slope facemay backsap. If not maintained, vegetation can block outlets reducingtheir effectiveness.In rock slopes, there is a need to target sub-surface flow channels,
many of which will be shallow and ephemeral. The paths may betortuous and hard to identify and drainage measures can therefore berather hit or miss. If the exposed joint is badly weathered, the weakmaterial may backsap and possibly pipe, leading to destabilisation,partially caused by lack of free drainage, and careful detailing will berequired to prevent deterioration. No-fines concrete, whilst appearingto be suitable to protect weathered zones, often ends up with lowerpermeability than designed and should not be relied upon withoutsome additional drainage measures.
Figure 6.27 Rock-fall nets andavalanche shelter,near Cape Town,South Africa.
284 Practical Engineering Geology

As an alternative to deep drains drilled into the slope from thesurface, drainage adits and tunnels are sometimes used to lowerthe water table, generally with drainage holes drilled radially intothe rock mass from the tunnel walls. Other solutions include deepcaissons constructed at the rear of the slope to intercept through-flow, with inclined drains leading away from the slope at theirbase (McNicholl et al., 1986). Pumped wells are also occasionallyused, pumps being activated when water levels reach criticalheights within the slope.
6.6.5.5 Reinforcement
Stability can be improved by a variety of reinforcement options. Forrough matching joints, provided there has not been previous move-ment, the interlocking nature provides considerable shear strength. Ifthe joint can be prevented from movement by reinforcing at strategiclocations, then full advantage can be taken of the natural shearstrength. Depending on configuration, rock may be stabilised by pas-sive dowels, tensioned bolts or cable anchors. Passive dowels allowboth mobilisation of a normal force (due to the resistance provided bythe fully grouted dowel) plus active shear restraint provided by thesteel of the dowels resisting block slide mobilisation (Spang & Egger,1990).The Geotechnical Engineering Office in Hong Kong has pub-
lished some guidelines on prescriptive measures for rock slopesand in particular gives guidance on rock dowelling for rock blockswith volume less than 5m3 (Yu et al., 2005). In essence, it isadvised to use pattern dowels with one dowel per m3 of rock tobe supported, with minimum and maximum lengths of 3 and 6mrespectively, and where the potential sliding plane dips at less than60 degrees. The dowels are to be installed at right angles to thepotential sliding plane, with the key intention to allow the dowelsto act in shear, whilst also enhancing the normal restraint due toasperity ride during sliding. In practice, dowels frequently need tobe used in more variable orientations. Designs must be checked inthe field during installation, to check that the perceived groundmodel is correct. If not, then the design must be revised.Sub-horizontal cable anchors can be used if capacities larger than
about 20 tonnes per reinforcement member are required. Great careneeds to be taken to ensure that such tensioned anchors are adequatelyprotected against corrosion, and regular checking and maintenancewill be required. Several cases of anchors that have failed due tocorrosion are discussed in Chapter 7. For weaker rock and soil, patternsoil nailing is now commonly used. The nails, which typically comprise50mm or so diameter steel bars connected, as necessary, by couplersevery 6m, are usually installed in pre-drilled holes, held centrally by
Analysis, design and construction 285

lantern spacers and then pressure grouted over their full length usingtubes installed with the nail. Soil nails are usually installed as a passivereinforcement that would only take on load if the slope began todeform prior to failure.
6.6.5.6 Retaining walls and barriers
Retaining walls are commonly used to support steep slopes, especiallywhere the slope comprises weak and broken rock and where space isconstrained. There are many different types, as illustrated in Figure 6.28.
Figure 6.28Different types ofretaining wall.
286 Practical Engineering Geology
Wall may be sheetpiles, secant pilesor diaphragm wall
Wall might be tiedback by groundanchors or to ananchor block setback from the wall
Gravity wall
Gravity,reinforcedconcrete wall
Sliding resistance
Shoring
Cantileveredlength
Potentiallyfailing wedge
Struts
Passiveresistance in soil
Gabion wall setagainst cut back slope
If a fill slope, gabionbaskets can beconnected tohorizontal reinforcingsheets built into the fill
Must havesufficient weightand strength toresist shearing,overturning andsliding

For temporary works, corrugated steel sheets are generally driven,vibrated or pushed into soil prior to deep excavation, with each sheetlinking to its neighbour. As the excavation proceeds, sheets are usuallybraced by a system of struts and waling beams, although they may alsorely on depth of embedment. Diaphragm walls formed by concretingdeep trenches excavated under bentonite mud are also used as part oftemporary works and then may be incorporated in the permanentstructure. Permanent retaining structures are often created using piles.Alternatively, where the ground can be anticipated to stand steeply,temporarily during construction, the full slope is cut back and then awall of concrete constructed at some short distance in front. The spacebetween thewall and the natural ground is backfilledwith granular free-drainingmaterial, often with geotextile material at the interface, feedingwater down to a drain (Figure 6.29). Drainage is very important if theretaining wall is not going to act as a dam. Gabionstructures are madefrom galvanised steel or, rarely, plastic baskets, backfilled with rock.The main advantages are that they are free-draining, can be landscaped,and they can be made cheaply on site using locally derived rock to filllocally woven baskets. They are therefore very suitable for formingretaining structures or barriers in remote locations (Fookes et al.,1985). Deflection structures and barriers are commonly used to divertor retain channelised debris flows away from buildings or roads.
6.6.5.7 Maintenance
Whatever the engineering solutions adopted, slopes should beexamined periodically for signs of distress and for maintenancesuch as cleaning out of drainage channels. The requirement forinspection, testing and possible remediation works, should be builtinto the design of any new slope, with careful consideration forhow this is to be achieved. In Hong Kong, the current practice is
Figure 6.29Concrete retainingwall underconstruction, HongKong.
Analysis, design and construction 287

to prepare maintenance manuals for slopes and to carry outroutine engineer inspections at regular intervals. New and newlyupgraded slopes are generally constructed with access laddersand often with hand rails provided along berms to allow safeinspection.
6.7 Site formation, excavation and dredging
6.7.1 Excavatability
Site excavation is usually carried out by heavy machinery, and themain questions for the engineering geologist are what machinerywould be suitable and whether the rock would need to be blastedfirst.Where blasting is restricted, then the contractor might need to
use some kind of chemical or hydraulic rock splitter, but the noiselevels of drilling and rock breaking might still be a problem.Generally, the factors that will control whether or not blasting isneeded are intact rock strength and the spacing between joints(MacGregor et al., 1994; Pettifer & Fookes, 1994). As emphasisedelsewhere, care must be taken to differentiate between mechanicalfractures with low tensile strength and incipient fractures withhigh strength as this will strongly affect the ability of machinesto rip the rock.
6.7.2 Dredging
Dredging (underwater excavation) is commonly carried out for portworks, to improve navigation on rivers and as part of other landreclamation projects in providing fill material (Bray et al., 1997).There are several types of dredger and these vary in their capacity todeal with soil and weak rock. Where there are few natural fractures inthe weak rock, excavations can be difficult, even for the strongestsuction-cutter dredgers and then some pre-treatment, normally blasting,will be required. Reviews on dredging practice in various countries,including the USA, UK, Hong Kong and Singapore, are given in Eisma(2006).
6.8 Ground improvement
6.8.1 Introduction
At many sites, the ground conditions are too weak or wet to allowconstruction by the preferred method or even to allow access by heavy
288 Practical Engineering Geology

construction equipment. Ground improvement might therefore becarried out, often as an alternative to some engineering solution suchas piling, and the engineering geologist should be aware of the techni-ques that might be employed to deal with a particular site condition(Charles, 2002). Ground improvement might be used in temporaryworks, such as freezing the ground to allow tunnelling through satu-rated and potentially flowing materials, or the construction of barriersto water flow, or to restrict vibrations during construction. In othersituations, ground improvement might provide a permanent solutionsuch as densification or using chemical additives to provide additionalstrength.
6.8.2 Dynamic compaction
One of the simplest methods is dynamic compaction, which involvesdropping a large weight, up to about 30 tonnes, from a crane, over aregular pattern and then backfilling the depressions with granularmaterial. Further drops are carried out at closer spacing. The depthof improvement depends upon the weight dropped, size of pounderand the height. Typically, a weight of about 15 tonnes dropped 20mmight be expected to improve ground to about 10m deep (e.g. Bo et al.,2009). The method is most suitable for improving fills and granularsoils generally, but sites underlain by clay have also been improved,although consideration must be given to the pore pressures that mightbe generated and how these dissipate. Generally, the improvement ismeasured by tests before and after improvement, using techniques suchas the SPT, CPT or the Menard pressuremeter that was developedspecifically for this purpose (Menard & Broise, 1975). The techniquehas been applied successfully for quite prestigious projects involvinglarge-scale reclamation, such as Nice Airport. In Hong Kong, it hasbeen used to densify the upper fewmetres in old fill slopes in an attemptto improve their stability.
6.8.3 Static preloading
If time allows, then an effective way to improve the consolidationcharacteristics at a site is to preload it, often by placing an embank-ment of fill material that can be removed again later or re-graded atsite, compacted properly in thin layers. The process of consolidation isgenerally accelerated by introducing a series of vertical drains toincrease the mass permeability and allow excess pore pressures todissipate, monitored using piezometers. The drains can be sandwicks, which are sausages of geotextiles, filled with sand and installedin pre-drilled holes. Other systems include wick drains that aregeotextile-covered plastic elements pushed into the ground using a
Analysis, design and construction 289

purpose-built machine. At some sites consolidation and strengtheningis achieved by a technique termed vacuum preloading; references aregiven in Charles (2002).
6.8.4 Stone columns
Stone columns can be used to enhance drainage and are installed todepths of 10m and sometimes more. These are formed by using avibrating poker, pushed into the soil to form a void and then fillingthe void with gravel and sand, which is compacted in stages using thesame vibrating tool (McCabe et al., 2009). Stone columns have beenused to increase mass permeability and prevent liquefaction of loosesilty sand during an earthquake, although in such a usage settlementwill still occur but in a relatively uniform and non-catastrophicmanner. Stone columns are also used generally to improve the bearingconditions at a site, the improvement depending upon the ratio ofcross-sectional area of stone columns to untreated ground. Groupsand lines of stone columns can be used asweak piles to provide supportto structures such as oil tanks.
6.8.5 Soil mixing and jet-grouted columns
Clay soils especially, can be improved by mixing with lime slag andcement, either at the ground surface (to prevent erosion in slopes, forexample) or in columns or trenches, using hollow-stem augers andsimilar equipment. The works will improve the bearing capacity of theground, although the improvement might be difficult to quantify.Stronger columns can be formed by using jet-grouted columnsformed using high-pressure grout jets as a drilling string is rotatedand lifted from depth. The resulting column of mixed soil and groutcan be used to carry structures or to form cut-off barriers to restrictwater flow, for example, beneath dams. Jet grouting is sometimes usedto form structural members during temporary works construction ofdeep excavations (Puller, 2003; also see case study of Nicoll Highwaycollapse in Chapter 7).
6.8.6 Drainage
For deep excavations and tunnelling, it is commonly necessary tolower the groundwater during construction, although there aremany factors that must be considered, not least associated settle-ment of the ground due to increased effective stress and self-weight compaction and consolidation and drying up of land inadjacent properties (Preene & Brassington, 2003). New and steepflow paths through the soil can lead to seepage piping and lique-faction in the floor of excavations. The cheapest and simplest way
290 Practical Engineering Geology

to lower water is just to let it happen naturally as the excavationproceeds, to channel water inflow to collection sumps and to thenpump this water away, although disposal may be an issue onenvironmental grounds, and pumping from great depth willrequire a series of pumps at different levels. Active dewatering isgenerally conducted using well-point systems or submersiblepumps in wells. Details are given by Puller (2003). As notedelsewhere, dewatering is often important to the stability of slopesand semi-permanent solutions include drains, drainage caissonsand adits. Emergency pumping systems are sometimes set up tobe triggered if piezometric levels become dangerously high.
6.8.7 Geotextiles
Geotextiles are fabric or plastic sheets that have many different uses inground engineering. A few of these are discussed below.
6.8.7.1 Strengthening the ground
To improve site access, sheets of plastic mesh may be laid on theground and then a layer of gravel placed and compacted on top. Thepurpose of the geotextile is to prevent the gravel being pushed into andmixing with the underlying soil that may be wet and soft. In this way,temporary road access can be provided. In other circumstances, morecomplex solutions might be designed involving elements such as stonecolumns or piles, together with a geotextile grid draped across andlinking the structural elements.Geotextile mats and strips are also used in the design of reinforced
earth structures (as are metal grids and strips), as illustrated inFigure 6.21. Basically, the frictional resistance between the soil andgrid or mats, placed horizontally and regularly within a fill structure,enhances the overall strength of the soil mass and prevents it failing.Where facing walls are used or the geotextile is wrapped around at theface to prevent soil erosion, the finished structure can be very steep oreven vertical.Plastic grid boxes, infilled with rock cobbles, have been used to form
gabion walls as barriers. Care must be taken that the situation is notone where the finished structure can be destroyed by fire and that thedeterioration rate is acceptable given the proposed lifetime of thestructure.
6.8.7.2 Drainage and barriers
Geotextile sheets are available that are highly permeable but alsodesigned with a mesh size that restricts soil erosion, in the same wayas traditional soil filter systems. Geotextiles are therefore used, for
Analysis, design and construction 291

example, as part of the drainage system behind concrete retainingwalls. Plastic sheets (geomembranes) are used as barriers to waterflow, especially for landfill sites. Great care must be taken to ensurethat sheets are welded one to the other and that those welds are tested.Membranes must be resistant to and protected from puncturing. Anyleakage may be extremely difficult and expensive to rectify at a laterstage. In Chapter 7, an example is given where a combination ofpermeable geotextiles and impermeable geomembranes were used toreduce leachate loss from a quarry used for landfill.
6.8.8 Grouting
Grouting is generally used to increase strength of a rock or soil massand to reduce permeability (Warner, 2004). It is routinely used belowdams to provide a cut-off curtain to restrict seepage through thefoundations. A main consideration is the type of grout – usuallycement, but sometimes chemical grouts or resin must be used topenetrate low-permeability ground. The pattern of holes to be used,phases of grouting necessary, and pressures to be adopted are alsomatters for specialist design. Grouting might jack open existing jointsin rock or form new fractures in soil and weak rock (claquage).Grouting is sometimes used to correct settlement or other deforma-tions caused by engineering works such as tunnelling (e.g. Harris et al.,1994), but care must be taken that the grouting does not make mattersworse, as per the Heathrow Express Tunnel collapse described inChapter 7.
6.8.9 Cavities
Cavities that engineering geologists and geotechnical engineersneed to contend with include natural cavities such as thoseoften found in limestone areas, more rarely in other rock types,including unlikely candidates such as weathered granite (Hencheret al., 2008). The other main problem is mining. Ground inves-tigation for such voids is a matter of careful desk study (includ-ing the mining method that might have been used if that is thehazard of concern), focused investigation, possibly using geophy-sics such as micro-gravity and resistivity and probing, perhapsusing percussive drilling to keep the costs down. If and whenvoids are found, these can be explored and characterised usingcameras, echo sounders and radar. In the case of old mine work-ings, inspection may be required by suitably equipped and experi-enced persons following proper safety procedures. Depending ontheir extent, voids may be backfilled, grouted or structurallyreinforced, as appropriate. When extensive mine workings wereencountered unexpectedly during tunnelling for the high-speed
292 Practical Engineering Geology

railway from Seoul to Taejon in South Korea, one proposedsolution was to construct a concrete structure through the workings,but this was considered politically unacceptable because the publicwas already aware of the situation. Instead, the route for the rail-way had to be moved several kilometres at considerable cost and thecompleted works were abandoned.
6.9 Surface mining and quarrying
Surface mining and quarrying are industries that have strongdemands for geotechnical expertise, including engineering geol-ogy. Slope design is often very important and the design prac-tices discussed earlier, used in civil engineering, also apply toquarries and open pits and opencast mines. The main differenceis that in such enterprises many of the slopes are always chan-ging in geometry as the works progress. One key to success isestablishing a safe layout for operations such as crushing andprocessing plants and for haul roads, whilst avoiding sterilisingvaluable resources because of the siting of infrastructure such assite offices and treatment plants. Major haul roads also need tobe established in a safe manner to avoid disruption to operationsif instability occurs. Other faces may well be temporary and aretherefore formed at angles that would be unacceptable as per-manent slopes in civil engineering. For large open-pit mineoperations, the scale of overall slope formation can be huge,extending hundreds of metres, and predicting stability oftenrequires numerical modelling, tied in to monitoring systems.Excavation of rock usually involves blasting and this is a specia-list operation as it is for tunnelling. A good review is given inWyllie & Mah (2004). Key considerations for all blasting opera-tions are fragmentation, to avoid producing large blocks thatcannot be handled easily and need secondary breaking opera-tions, avoiding damage to the remaining rock, avoiding over-break beyond the design profile, safety and risk from flyrock,gases and vibrations.Waste frommining needs to be disposed of. In open-pit coal mining,
the waste rock is backfilled into the void as part of the ongoingoperations and nowadays in the UK at least, the final reinstatementof the area is strictly controlled, with every attempt made to simulatethe natural countryside as it was pre-operations. Other wastes areoften wet and contaminated and held behind tailings dams thatshould be designed and analysed with just as much care as a civilengineering structure. Unfortunately, this is often not the case, andthere have been many major failures worldwide over the last fifty yearswhich have resulted in severe contamination and many deaths (Ricoet al., 2008).
Analysis, design and construction 293

6.10 Earthquakes
There are four major considerations for design:
1. Local ground failure, e.g. because of liquefaction in loose saturatedcohesionless sand and silt.
2. Rupture because of fault movement, which can be significantespecially for tunnel design.
3. Ground shaking causing inertial forces. Buildings and slopes areespecially at risk from horizontal shaking.
4. Remote hazards. These will include landslides from adjacent landwhere debris run-out could impact the site, and tsunamis.
6.10.1 Ground motion
Most structures need to be designed to withstand dynamic loading.This includes wind loading (to typhoon levels in countries such asJapan, Korea and Hong Kong), earthquakes and blasting/traffic. Themain one of these that requires input from the engineering geologist isearthquake loading. The level of hazard is assessed at the site investi-gation stage (Chapter 4), and there is often a mandatory design codefor a particular country. Alternatively, or as a check, the design teamwill identify some design earthquake or series of such design eventswith equal probability of occurrence within the lifetime of the struc-ture. For example, statistical analysis of historical earthquake activitymight indicate that there is an equal chance of a magnitude 8 (M8)earthquake at 200 km distance, as a magnitude 5.2 (M5.2) earthquakeat 10 km. These earthquakes would probably result in very differentground shaking at the project site. From study of recorded data using
0.35
0.3
0.25
0.2
0.15
0.1
0.05
Pea
k ho
rizon
tal g
roun
d ac
cele
ratio
n (g
)
05 50
Kilometres from epicentre500
MS = 5
MS = 4
MS = 6
MS = 7
Figure 6.30 Peakacceleration vs.distance fordifferent magnitudeearthquakes(European data).Equations given inAmbraseys et al.(1996).
294 Practical Engineering Geology

strong motion seismographs, attenuation laws have been derived fordifferent parts of the world. Forces are used for engineering design, soacceleration is an important parameter. The equation below has beenshown to fit the available European seismic data reasonably well andcan be used for prediction (Ambraseys et al., 1996). Data from NorthAmerica and elsewhere are not very different.
logðaÞ ¼ −1:48þ 0:266Ms − 0:922 logðrÞ
where a is peak horizontal ground acceleration expressed as a fractionof gravitational acceleration, g, (9.81m/s2). Ms is surface wave magni-tude and r is essentially the distance between the project site andthe earthquake epicentre. Figure 6.30 gives median data and can berefined for degree of confidence and for site characteristics (Ambraseyset al., 1996). Unexpectedly high accelerations do occur, and this isoften the result of local ground conditions or topography that amplifythe effect, as for the peak accelerations of 1.25g and 1.6g in theabutment of Pacoima Dam, USA, during two separate earthquakes(Bell & Davidson, 1996). The February 2011 earthquake that causedhuge damage in Christchurch, New Zealand, involved vertical groundaccelerations up to 2.2g and horizontal ground accelerations of up to1.2g, which are very high for a 6.3M event and can be largely attrib-uted to the very shallow nature of the earthquake (about 5 km,according to the New Zealand Society for Earthquake Engineering).Peak ground acceleration, although an important starting point, is
not enough to give an indication of structural performance. What alsomatters is the time that the strong shaking continues and the frequencyspectrum of the waves carrying the energy. The situation is
Figure 6.31Predominantperiods in rock fordifferentmagnitudes ofearthquake atdifferent distances(US data).
1.4
Pre
dom
inan
t per
iod
– se
cond
s
1.2
1.0
0.8
0.6
0.4
0.1
00
Near field, smallearthquakes with highfrequency dominanting
10 Hz (same frequency asone-storey building)
1 Hz (same frequency asten-storey building)
Longer periodsmight dominateon soil sites
M = 6
M = 7
M = 8
40 80 120 160 200 240 280 320 360 400
Distance from causative fault – km
Large earthquakes atgreat distance: longperiods, lowfrequencies dominate
Analysis, design and construction 295

complicated by the way that individual structures respond to repetitivedynamic loading, which is a matter of harmonic resonance. Thus,whilst for the M5.2 design earthquake at 10 km the peak accelerationcan be predicted from the equation presented earlier as 0.12g and forthe M8 design earthquake at 200 km as 0.04g, other characteristicswill be very different. Figure 6.31 shows the predominant period inground acceleration records for western USA (Seed et al., 1968), whichindicates that for a near-field M5.2 quake the predominant periodmight be less than 0.2 secs, whereas for the distant M8 quake thepredominant period could be more than 0.8 secs. Furthermore, theduration of shaking will be significantly longer for the large magnitudeearthquake (e.g. Bommer &Martinez-Pereira, 1999). The duration ofstrong shaking for aM5.2 earthquake might be a few seconds. For theChristchurch Feb 2011 M6.3 earthquake, the strong shaking lastedabout 12 seconds. For an earthquake of M8, the duration could beover a minute. With longer duration, the potential for amplificationwill be much greater and fatigue-type failure can occur.
6.10.2 Liquefaction
Liquefaction is a common failure mode in natural soils, fill and some-times in embankment dams during earthquakes. It occurs in loosesaturated cohesionless sand and silt, which, when disturbed, loses itsstructure and collapses. Because of its low permeability, water cannotescape so natural piping and even general liquefaction occurs as theeffective stress and thereby friction reduces to zero. There are manyclassic examples of whole apartment blocks tilting over and buildingssettling. Elsewhere, service pipes float to the surface and seawalls collapse as the retained fill flows into the sea. The potential forliquefaction is readily identified during site investigation. The generalrules are:
1. It occurs in un-cemented deposits – fill or geologically recent soil.2. The most susceptible soils are cohesionless (sands and silts) with a
liquid limit less than 35% andwater content greater than 0.9 timesthe liquid limit (Seed & Idriss, 1982).
3. It generally occurs at depths shallower than about 15m.4. Generally, SPT N value (corrected) less than 30 (Marcusson et al.,
1990) or CPT cone resistance less than 15 MPa (Shibata &Taparasaka, 1988).
Analysis of the hazard might be refined by considering the liquefactionpotential vs. the characteristics of a design earthquake, but generally ifthe area has high seismicity and the granular soil at a site is relativelyloose and groundwater table high, then it is probably wise to carry out
296 Practical Engineering Geology

preventive measures. These might include compaction, grouting or theinstallation of stone column drains that will help prevent excess porewater pressure development, although they would not prevent settle-ment. Alternatively, passive mitigation may be the best option – relo-cate the proposed structures away from the zone of liquefiable soil. Ifthe ground does liquefy, then apart from movement of structures in oron the ground, the settled soil might cause drag down (negative skinfriction) on any piles installed through that zone.
6.10.3 Design of buildings
For buildings such as one or two-storey houses, there are certain simplerules that, if adopted, can reduce the risk of failure and would limitinjuries, especially in developing nations. These include ensuring thatwalls are tied together, preferably by reinforced ground beams orbeams along the tops of walls (Coburn & Spence, 1992).For larger engineered structures, these need to be designed to with-
stand the repeated force waves. As outlined in 6.10.1, given a parti-cular design earthquake one can make estimates about the groundmotion characteristics that the structure will have to withstand. Theseinclude peak acceleration, predominant frequency and duration ofshaking for a given return period earthquake. Typically, the returnperiod used is 1 in 500 to 1,000 years but the choice is rather arbitraryand will depend on the nature and sensitivity of the project and theseismic history. These bedrock ground motions may be modified bythe local site geology or topography and estimates of the modifiedshaking characteristics can be made by dynamic analysis using
Figure 6.32Responses ofbuildings toearthquakeshaking.
Analysis, design and construction 297
− Displacement of building (or slope) depends on building form and ground motion
− If buildings RESONATE motion is amplified
− Buildings have natural periods− T = 0.1 N seconds
0.1
5
Mag
nifi
catio
n
1.0Ground Motion Period
Natural Period of Structure
10.0Ratio
0.2s 0.4s

software such as SHAKE or through reference to published groundmotion spectra for particular ground profiles. Generally, thick softsoil profiles may lead to relative amplification of longer period waves.The design ground motion then needs to be applied to the structure.Structures have their own dynamic characteristics and if the incomingfrequencies match the natural response frequencies of the structure,then movements may be magnified (Figure 6.32). Structural engineerswill take the incoming design earthquake characteristics and calculatethe response of the structure. For more frequent, smaller earthquakes,the structural engineer will design the structure as far as possible tobehave elastically (no permanent displacement). In the event of anextremely large and less probable event, a structure can be designed tobe fail-safe. Redundant elements such as additional steel beams can beincluded that yield under extreme loads but also change the funda-mental frequency of the building, damping the response to the shak-ing. Other options are to put a building on springs of some kind or toinclude hydraulic actuators or pendulums that again reduce the struc-tural shaking. An example of an innovative aseismic design is thefoundations for the Rion–Antirion Bridge constructed in Greece in2005. The cable-stayed bridge, with five main spans extending 2.25 kmacross a fault zone, was designed to withstand horizontal accelerationsof 0.5g at ground level and up to 2m offsets between adjacent towers.Underlying each tower is thick soil and the depth of sea is up to 65m.The towers were founded on 90m diameter cellular structures placedon a 3.6m layer of gravel placed on the natural soil, which wasreinforced by up to 200×2m diameter tubular piles to depths of 30m.The foundation structure is not attached to the piles; the gravel actsas a fuse, limiting the transfer of load to the superstructure. Thepiles in the underlying soil are there to prevent rotational bearingfailure. Details of the design of the foundations are given byCombault et al. (2000) and further references are given at the webpage for the bridge.Two recent earthquakes, however, show that even with good
design practice, earthquakes can cause damage to a level that is notanticipated. As a result of the February 2011, Christchurch, NZ,earthquake, many small one-and two-storey buildings were destroyedor badly damaged, as one might expect near the epicentre of anearthquake with magnitude exceeding 6.0, where the groundmotion might be expected to be dominated by high frequencies.Widespread liquefaction was also a major contributor to thedamage of these smaller buildings. However, for this earthquake,because of its shallow nature and possibly other factors that servedto concentrate and amplify the ground motion, unexpectedly largeaccelerations and forces were generated. In the case of the March2011 earthquake that struck NE Japan (east of Honshu), most engi-neered buildings on mainland Japan withstood the very strong
298 Practical Engineering Geology

shaking associated with this 8.9 or even 9.0M earthquake (10,000times as strong, in terms of overall energy release, as the Christchurchearthquake) and this is testament to the skill and knowledge of thecivil engineer designers. The huge damage and large number of deathscaused by the Japan earthquake resulted from a 10m high tsunamiwave that came ashore and destroyed whole villages. Regardingengineered structures, several nuclear power stations had been con-structed along the shoreline in the impacted region. The structuresapparently performed well in terms of withstanding seismic shakingbut severe damage did occur because of failure of cooling systems.The initial shaking caused safe shutdown of the reactors, as is therequired procedure for nuclear power stations impacted by a majorearthquake, but the loss of electrical power stopped the flow of cool-ing water required to prevent the fuel rods overheating. Backup dieselgenerators kicked in and provided the necessary power for an hour orso but then they failed because of the tsunami. In hindsight, no doubtthe secondary power sources could and should have been designed tosurvive inundation, as they are for more modern installations, and therisk properly identified using an event tree approach.
6.10.4 Tunnels
Tunnels and mines tend to be safer than surface structures duringearthquakes, and this safety increases with increased depth (Poweret al., 1998). Except where the tunnel passes through particularlypoor ground or intercepts active faults, earthquake resistant design isgenerally not a high priority. Of course, where the support in a tunnelis inadequate or marginal under static loading conditions, then earth-quake shaking might well trigger failure. This is especially true atportals of tunnels; landslides and especially rockfalls are very com-monly triggered by earthquakes, as discussed in the next section.Failures in some tunnels, and especially the failure of Daikai subwaystation during the Kobe earthquake in 1995, have caused a rethink onseismic stability of underground structures. Hashash et al. (2001)provide a very useful review and examples of aseismic design. Areinforced concrete lining should have significantly better seismicresistance characteristics than an unreinforced lining. If the tunnelintersects a fault that is suspected of being active, then special measureswill be required or, preferably, the fault avoided. Key considerationsare the estimated magnitude of the displacement and the width of thezone over which displacement is distributed. If large displacements areconcentrated in a narrow zone, then the design strategy may be toenlarge the tunnel across and beyond the displacement zone. Thetunnel is made wide enough such that the fault displacement will notclose the tunnel and traffic can be resumed after repairs have beenmade. In some cases, an enlarged tunnel is constructed outside the
Analysis, design and construction 299

main tunnel and the annulus backfilled with weak cellular concrete orsimilar. The backfill has low yield strength to minimise lateral loads onthe inner tunnel liner, but with adequate strength to resist normalground pressures and minor seismic loads. If fault movements arepredicted to be small and/or distributed over a relatively widezone, it is possible that fault displacement may be accommodated byproviding articulation of the tunnel liner using ductile joints. Thisdetail allows the tunnel to distort into an S–shape through the faultzone without rupture, and with repairable damage. This may not befeasible for fault displacements more than 75–100mm. An alternativeapproach is to accept that damage will occur and to make contingencyplans to control traffic and to carry out repairs as quickly as possible inthe event of a damaging earthquake.
6.10.5 Landslides triggered by earthquakes
Landslides are commonly triggered by earthquake shaking, especiallyin mountainous areas. The Wenchuan earthquake in SichuanProvince, China, of 12 May 2008, was very large (M8) and quiteshallow (14 km) and the active faults ran through populated valleyssurrounded by high slopes. Landslides, including rockfall, causedmore than 20,000 deaths, with one individual landslide killing morethan 1,600 people (Yin et al., 2008). One of the main consequenceswas the damming of streams, which necessitated emergency engineer-ing works to lower the water levels in the lakes that formed behind thelandslide debris before they were overtopped or burst uncontrollably.
6.10.5.1 Landslide mechanisms
Slopes affected by strong earthquake shaking can be categorised inthree classes, as set out in Table 6.4. These are:
1. Stable slopes: these are defined as situations where the shaking isnot strong enough to cause permanent displacement in a slope.This may be because the peak forces are insufficient to overcomethe strength of the ground or because different parts of the sameslope are out of phase so that whilst some parts are being driventowards failure, other parts are being accelerated in the opposingdirection.
2. Permanently displaced slopes: the key aspect of dynamic loading,whether it is from earthquakes or blasting, is its transient nature.The waves pass through the ground and induce inertial forces. Inthe same way as discussed in Chapter 5 regarding a laboratoryexperiment (Figure 5.27), at a critical acceleration (kc) a slope willstart to move. The continued positive acceleration above criticalwill cause the displacement to increase in velocity. However, after
300 Practical Engineering Geology

Table 6.4 Performance of slopes under dynamic loading
Class Condition Details and examples
1. Stable Acceleration less than thatnecessary to cause permanentdisplacement
2. Permanentdisplacementbut stable
FoS post-quake > 1.0
Damage may allow deteriorationand later collapse
Tension cracks resulting from Erzincan earth-quake, Turkey, 1992
3. Failure Metastable condition so thatacceleration leads to cata-strophic failure directly
Reducing shear strength so thatFoS is less than 1.0 after earth-quake shaking has finished.
Deteriorating condition follow-ing earthquake
Rise in water pressure due tocollapse of soil structure orregional changes in hydrogeolo-gical conditions
e.g. Tsao ling reactivated landslide, Chi Chi earth-quake, Taiwan, 1999
Rockfalls and other landslides may continue fordays after an earthquake

a short time (typically a fraction of a second), the exciting accel-eration will decrease and then change direction so that the inertialforce is back into the slope. This will stop themovement unless theslope is metastable, as discussed later. Sliding friction can belower than residual (Hencher, 1977, 1981a; Crawford &Curran, 1982; Tika et al., 1990), and by employing pessimisti-cally low shear strength, total displacement can be calculated fora series of acceleration pulses and this used as part of a designdecision. Generally, even for a very large earthquake, the perma-nent displacement in a slope directly attributable to inertial load-ing will be small, of the order of millimetres or centimetres(Newmark, 1965; Ambraseys & Srbulov, 1995). Nevertheless,small permanent displacements will make the slope prone toaccelerated weathering and deterioration if not protected orrepaired.
3. Failed slopes: catastrophic landslides during earthquakes can bethe result of four different conditions, viz:
– Low residual strength. The inertial displacement during theearthquake reduces shear strength to a residual value so thateven after the earthquake shaking, the slope continues tomove. Examples of large-scale failures involving sliding onbedding planes with reducing strength are described for theChi-Chi earthquake (1999) by Chen et al. (2003) and Chigiraet al. (2003), and for the Niigata earthquake (2004) byChigira et al. (2006).
– Deteriorated state. The structure of rock or soil mass isdisturbed so that it collapses and a flow can develop.
– Geometrically unstable equilibrium. The initial displacementcaused by the earthquake shaking results in unstable equili-brium. A typical example is rockfall from exposed rock cliffs.Once displaced, the rock will fall, sometimes as a progressivefailure several days after the earthquake. Rockfalls maybecome entrained and develop into debris avalanches.
– Water-induced failure. Firstly, loose saturated soil can col-lapse and liquefy down to depths of about 15m on slopesinclined at only a few degrees. The collapsed material canspread and flow. As a secondmechanism, the general ground-water flow paths can be affected by earthquake loading andthis can trigger slope failures.
6.10.5.2 Empirical relationships
Keefer (1984, 2002) identifies 14 individual types of earthquake-induced landslide. The three main categories are:
302 Practical Engineering Geology

1. Disrupted slides and falls: these include highly disrupted landslidesthat move down slope by falling, bouncing or rolling, or by transla-tional sliding, or by complexmechanisms involving both sliding andfluid-like flow. They typically originate on steep slopes, travel fastand can transport material far beyond the slope in which theyoriginate. Other than large rock avalanches, failures in thiscategory are thin with initial failure depths less than 3m.
2. Coherent landslides: these include translational slides and rotationalslides. Such failures are typically relatively deep seated (greater than3m), slow moving and displace material less than 100m.
3. Lateral spreads and flows: fluid flow is the dominant mechanismand this mode of failure is typical of liquefied soils.
Themost common failures, according toKeefer, are rockfalls, rockslidesand disrupted soil slides. This follows from the analysis of Table 6.4where it can be seen that significant landslides will only occur wherethere are predisposing factors such as a topographic setting that is inunstable equilibrium or strain softening (due to collapsing structure orlow residual strength, for example, through the loss of rock bridge-cohesion during the earthquake shaking). Keefer compiled data frommany earthquakes and plotted the area affected by earthquakes vs.magnitude of the earthquake. The upper bound is rather well defined.For a magnitude M5, the affected area might be about 100 km2, 1,000km2 for M6, and 10,000 km2 for M7. Keefer also presents data on themaximum distance of landslides triggered by earthquakes of givenmagnitude. He provides separate upper bound curves for disrupted,coherent and flow-type failures. Disrupted landslides such as rockfalls,which are themost common type of earthquake-triggered landslides, arealso shown as themost likely to occur at far distances from the epicentre.Rodriguez (2001) has carried out a further review of data, includingmore recent data from Japan, and his data demonstrate the considerablescatter that can be expected and therefore the difficulties in prediction ona site-specific basis. For example, some M7 earthquakes only causelandslides within an epicentral distance of 10 km whereas others ofthe same magnitude cause landslides 200 km away. This might beattributed in part to resonance effects associated with ground frequencyspectra and duration, as for buildings (Hencher & Acar, 1995).
6.10.6 Slope design to resist earthquakes
Traditionally, and in most software packages, there are two mainapproaches to slope design to withstand dynamic loads (mostly earth-quakes). The options for landslide prevention are essentially the sameas for the static condition (change geometry, reinforce, reduce waterpressure, protect the site below or move the facility at risk).
Analysis, design and construction 303

6.10.6.1 Pseudo-static load analysis
One approach is simply to include a horizontal inertial load into theanalysis (some authors argue for an inclined force but it really makeslittle difference considering the inexact nature of the method) and todetermine whether or not the FoS reduces below 1.0. The problemwith this approach is that if one includes the peak predicted particleacceleration (say from equation 6.1) then very often the slope willbe shown to fail, whereas in reality the permanent displacementwould be negligible because of the extremely short time that accelerationwould be acting. As confirmation, many vertical slopes in quarries areacted on by accelerations approaching or exceeding 1g during produc-tion blasting, but landslides due to blasting are very rare. Engineerstherefore often choose to use some arbitrarily reduced acceleration,such as a nominal 0.1g, as a pseudo-static force in the stability analysisto check that the slope (or dam) has some degree of resistance tohorizontal loading, but this is clearly rather unsatisfactory.
6.10.6.2 Displacement analysis
As discussed earlier, given a predicted acceleration against time record, itis straightforward to calculate the likely displacement that might becaused in a slope during an earthquake, and there are options to do soin software such as SLOPE/W.Those displacementswill always be small,however, nomatter how large the earthquake, and what matters more isthe residual state of the slope after the earthquake – is there a situationwhere the ground is strain softening or is it in unstable equilibrium?These are considerations for the engineer, who must decide whetheradditional reinforcement might be necessary or other protective mea-sures such as nets and barriers. Other software such as FLAC andUDEC(Itasca) can be used to study the seismic susceptibility of slopes. Thesebeing time-stepping software, the mode of failure can be identified,expressed visually and perhaps as a movie. It might, for example, bepossible to test the potential failure mechanism of soil nails during anearthquake, eachnailmodelled specifically. That said, as ever, themodelscan only be as good as the input data and results will only be indicative.
6.11 Construction vibrations
6.11.1 Blasting
Blasting causes noise, ground vibrations, air overpressure and flyrock.All of these can be controlled – generally by using less or different typesof explosive and limiting the number of charged drillholes that aredetonated at the same time. In particular, using millisecond delaysbetween lines of drillholes will reduce the vibration level considerably.Details are given in Dowding (1985) and many other publications.
304 Practical Engineering Geology

Safety is a major issue and an engineering geologist working in asituation where blasting is being conducted may well be involved inblast monitoring, checking fragmentation and reviewing the overallsuitability of the blast design, given the changing geological situationas the rock is excavated.
6.11.2 Piling vibrations
The other major source of potentially damaging vibrations in civilengineering is from driven piles. Damaging levels are generallylimited to about 10m distance, although this depends on the sensi-tivity and state of repair of the structure. Predictions can be madeusing empirical formulae into which the main inputs are hammerenergy and distance (Head & Jardine, 1992), but these are rarelyvery accurate.
6.12 Numerical modelling for analysis and design
6.12.1 General purpose
There are two main groups of programs commonly used: finite element(FE) and finite difference (FD), time-stepping type software. PLAXIS is ageneral purpose FE package that allows geotechnical situations – foun-dations, slopes or tunnels – to be modelled. The model is set up and runto give a quick solution to complex equations – perhaps of deformationor calculation of Factor of Safety of a model that is split into elements –mostly triangular. It can also be used to model fluid flow. As with allsophisticated software, it should only be used by those knowledgeableof the underlying mechanics and the way these are dealt with within thecomputer program. Following the Nicoll Highway collapse discussed inChapter 7, it was established that there had been a mistake made in themanner in which the design of the diaphragm walls was carried outusing an inappropriate soil model. The same problemwould have arisenfor any finite element package used in this incorrect manner – it is notunique to PLAXIS. The mistake resulted in excessive deformation of thewalls and an under-design of their moment capacity, although these twoeffects did not have any influence on the final failure. Themistake was inadopting effective stress strength parameters in aMohr-Coulombmodelunder undrained conditions and expecting theMohr-Coulombmodel topredict an appropriate undrained strength. For clay, such as the KallangFormation at the Nicoll Highway site, undrained strength is a functionof stress history, in particular overconsolidation ratio, because thisdetermines whether a soil will attempt to contract or dilate as it issheared in an undrained manner and thus generate positive or negativepore pressures during shearing, which in turn decreases or increases thestrength. The Mohr-Coulomb model does not consider dilation or
Analysis, design and construction 305

contraction during undrained shearing and, as such, cannot model, forexample, soft clays (or dense sands) under undrained conditions. If youuse a Mohr-Coulomb model for undrained conditions, then you simplyuse the undrained strength to control failure conditions and not theeffective strength parameters. The Nicoll Highway Committee ofInquiry Report on the collapse includes a well-written section on theproblem with the Mohr-Coulomb model (Magnus et al., 2005).The finite difference program FLAC is probably the second most
generally used software for geotechnical design.Until recently, the programwas quite daunting, requiring individual
commands to be typed in, but recent versions have a graphic interface,which makes things easier. As for PLAXIS and other sophisticatedprograms, a great deal of knowledge and understanding is needed ifreasonable results are to be achieved. For example, themodelmust firstbe set up with proper boundary conditions and brought to equilibriumas natural ground before any engineering works such as excavation aresimulated. FLAC progressively calculates and checks solutions.Intermediate stages can be calculated, saved and expressed graphicallyas a movie which can illustrate how strains are developing with time.FLAC, like its sister programUDEC, can cope with large displacements,more so than typical FE analyses. FLAC is used mainly for soil and rockthat can be characterised as continua. UDEC is used for fractured rockand each fracture or set of fractures can be specified individually interms of geometry and engineering parameters. Both UDEC and FLACcan be used for foundation design, tunnels and slopes.Other commonly used software include the suite produced by
Rocscience, such as Phase2, and their use is discussed in detail inHoek et al. (1995) and at http://www.rocscience.com/education/hoeks_corner.Many authors, experienced in the development and use of soft-
ware, have recommended that sophisticated software should beused in an investigatory way, using many simple models tocheck sensitivity to assumptions rather than trying to prepare asingle complex model in an attempt to simulate all aspects of asituation at the same time (Starfield & Cundall, 1988). Swannell& Hencher (1999) discuss the use of software specifically forcavern design.
6.12.2 Problem-specific software
Many suites of software have been developed for particular purposes.SLOPE/W and SLIDE, for example, are commonly used for routinedesign of slopes. The software calculates stability employing themethod of slices, as discussed in section 6.6.2, and gives instant solu-tions for FoS for a wide range of potential slip surfaces, the broadgeometries of which are specified by the operator. Controlling factors
306 Practical Engineering Geology

such as slope geometry, strength parameters and groundwater condi-tions can be varied rapidly, allowing sensitivity analysis. Structuralelements such as soil nails and rock bolts can be included in themodels.There are many similar packages available, all of which are verifiedand validated against standard mathematical solutions. There is adanger that the ease of use of such software in sensitivity analysis,varying a range of likely parameters, can give a misplaced confidencethat all possible conditions have been dealt with. If the groundmodel isseriously wrong, the results will be meaningless.Other specialist software packages are used for particular design
tasks such as rockfall trajectory analysis, stresses around tunnels, piledesign and groundwater and contaminant migration modelling.Details of many of these are reviewed at the web page maintained byTim Spink: http://www.ggsd.com. Most engineering companies alsohave in-house spreadsheets (often based on EXCEL) used to solvecommon analytical problems.
6.13 Role of engineering geologist during construction
6.13.1 Keeping records
Engineering geologists on site should keep careful records as worksadvance, using daily notebooks. Excavations should be examined,described and photographed as necessary. It is often useful to takephotographs and use these as the base for overlays on which to recordfeatures such as geological boundaries, strength of materials, disconti-nuity orientations and style and locations of seepage. Such recordswill be very helpful in the case of any future disputes over payment or ifanything goes wrong. Pairs of photographs taken some distanceapart can be used to allow a 3D image to be viewed, and this isparticularly useful where access is difficult or hazardous. Wherediscontinuities are measured, it is important to record the location. Intunnels, description proformas are commonly used as a permanentrecord, agreed and signed by the contractor and supervisor, asillustrated in Figure 6.33.
6.13.2 Checking ground model and designassumptions
It is fundamentally important that design predictions are checkedduring construction. Design is usually based on widely spaced bore-holes and the interpretation is almost certainly going to be oversimpli-fied. Often this does not have any major consequence but sometimes itdoes so and the engineering geologist on site should be alert to anyindications that the ground model is incorrect or inadequate. Anychanged conditions should be flagged up quickly to the designers sothat necessary rectifications can be made.
Analysis, design and construction 307

Drive North
infill variable10 to 100 mmmostly granular/lithic fragments,some clay
60/188
II/III
IIIIII
III
III
III
III
III/II
III/II
45/040
boarded
1 metre
65/185
65/10735/028
40/0
33
50/0
18
55/0
96
30 mm
infill mostly
granular,m
ed. dense
approx.60/194
minor overbreak
will probably appear in roof in nextpull
TIE RODS
FACE FACEFACE
FOOTLEFTWALL
ROCK TYPE DETAILS ADDITIONAL NOTES
NAME GRANITE v. weak zone in lower part of leftwall and across face. soft clay inpart. Thick zones up to 0.5 m areat intersects of infilled joints. Onedipping south (194), up into facehas softened up invert 1.5 m backfrom face. Possibly will causeoverbreak on next pull.
Damp, no inflow
Pink, mostly discoloured brownCOLOUR
III occ. IIWEATHERINGmostly 300 mm, incipient closerGenerally tight
JOINT DETAILS
Several major infilled discontinuities/shearzones. also minor clay infilled
DIPS/AZIMUTHS
WATER INFLOWCHAINAGE
AGREED RECORD
WHSH
95.94
15.9.89ADD COMMENTS
FOOTRIGHTWALL
0
0.5
1.0
1.5
2.0
2.5 m
CL
v. weak,soft. clay in part
v. weak zone. probablydue to coalescing shearzones. soft sandy clay +gravel (rock fragments)
very
wee
k zo
ne –
som
e so
ft cl
ayas
soci
ated
with
infil
led
faul
t?60
/194
Maj
or in
fille
ddi
scon
tinui
ties–
faul
ts?
STRENGTH moderately strong. locally strong/ mod. weak
Figure 6.33 Example of agreed record of ground conditions in a tunnel. Queens Valley Reservoirdiversion tunnel, Jersey, UK.

In rock slope design and construction, the fundamentally importantfeatures of discontinuity orientation, lateral persistence, roughness andinfill, can only be surmised from typical ground investigation data.Ground models and assumptions need to be checked as the rock isexposed.There aremany cases of rock slope failurewhere slidingoccurredon features that were exposed during construction but were either notmapped by the site staff or the significance not recognised. This can be averydifficult situation in that evenwhere rock iswell exposed, thepresenceor otherwise of rock bridges or steps along adversely oriented disconti-nuities can only be guessed at. Care should be taken to note how easily therock is being excavated andhowstable or otherwise temporary slopes are,as such information will be helpful in judging the risk.
6.13.3 Fraud
As a final note, the engineering geologist should be aware that frauddoes occur in civil engineering, as in other walks of life. Whole bore-holes in ground investigations have been known to be fictitious,let alone individual test runs. Cases are known where core from onesite is placed into core boxes at another site. Tests are sometimes notcarried out as specified or results falsified. Data on foundations aresometimes made up – for example, depths, materials used and testresults (Hencher et al., 2005). Engineering geologists need to be awarethat such practice does occur, albeit rarely, and remain alert in theirsupervising duties.
Analysis, design and construction 309

7 Unexpected ground conditions andhow to avoid them: case examples
‘As failure is exactly what engineers do not want it is essential that we learnlessons when it does happen.’
(Blockley, 2011)
7.1 Introduction
When projects go wrong because of ground conditions, it is sometimesbecause those adverse ground conditions were truly onerous andunpredictable but other times because of poor ground characterisationand modelling. Furthermore, if and when things end up in litigation itis often clear that the problem has been exacerbated by the way theproject was set up, managed and contracted (Muir Wood, 2000;Baynes, 2007). Quite often, good practice, which is set out in standardsand the literature, is simply not followed because of lack of knowledge,experience or application in the engineering teams or for commercialreasons. Where unexpectedly difficult conditions are encounteredduring a project, for whatever reason, the consequences can be mini-mised provided the attitudes of the various parties are to work togetherto solve the issues. This is often a simple matter of good professionalpractice on both sides but can be actively encouraged in contracts, asdiscussed in Chapter 2.
7.2 Ground risks
First, it is worth considering where ground risks arise. Clayton (2001)divides them essentially into three: technical, contractual and manage-rial. Of the technical risks, these were split down byMcMahon (1985)and Trenter (2003) in to:
1. The risk of encountering unknown geological conditions and2. The risk of using incorrect design criteria.
If one examines failures inprojects, however, often the causes are farmorecomplexandit is the interactionof thevariouspredisposingconditionsata

site and other construction factors that caused the problems. Very oftenmismanagement is fundamental to why critical factors are missed, over-lookedor not dealtwith properly, as discussed for tunnels byMuirWood(2000).Forthefollowingdiscussion,caseexamplesaregroupedaccordingto the predominant cause following the geology plus environment plusconstruction approach introduced in Chapter 4 (Table 4.1). This is notalways easy to do because it is often a combination of factors that led tofailure or to the extent of the failure. A fourth category introduced here issystematic failure–where fundamentaldecisionsorconcepts seemtohaveplayed amajor role in what occurred.
7.3 Geology: material-scale factors
Geotechnical hazards occur at a full range of scales frommicro (miner-alogy, friction) to macro (plate tectonics, typhoons). Material factorsare at the scale of hand-held samples or pieces of core. It is the scale ofmost laboratory and in situ tests. Hazards at this scale are associatedwith the physical and chemical nature and properties of the variousgeological materials making up the site and used in construction,including their durability.
7.3.1 Chemical reactions: Carsington Dam, UK
Carsington Dam failed in July 1984, during construction, when it hadalmost reached full design height (see Section 7.4.1 for full discussion).One of the lesser-known problems with the Carsington Dam project,however, concerned chemistry of the materials making up the dam,which should have been anticipated. The damwas constructed of locallyderived rock fill with a clay core. The rock included black shale withpyrite (FeS) and the riprap was limestone (CaCO3) (Figure 7.1).
Figure 7.1Chemical reactionsbetween materialsmaking upCarsington Dam.
Unexpected ground conditions and how to avoid them 311
clay core
[killed workers]
[polluted streams]
H2O + Ca CO3 + FeS → CO2
H2SO4
limestone riprap
Coal Measures mudstone rock fill(with pyrites)
in situ mudstone
CARSINGTON DAM (1984)
‘yellowclay’
+

Sulphuric acid was generated as a result of the geological materialspresent and this acid polluted local stream courses. Carbon dioxide,because it is heavier than air, collected in underground inspectionchambers and four workers died as a consequence. The variouschemical reactions and processes are discussed in detail by Pye &Miller (1990). The lesson is that potential chemical reactionsshould be considered for any project. Other examples are given inChapter 4.
7.3.2 Strength and abrasivity of flint and chert: gasstorage caverns Killingholme, Humberside, UK
Another example of a material-scale factor that should have beenanticipated is shown in Figure 7.2, which shows a cavern in chalkunder construction for the storage of liquefied gas beneath SouthKillingholme, Yorkshire. The roadheader pictured had been specifiedfor the excavation of the caverns and had been dismantled and lowereddown a narrow shaft for this purpose. Excavation by the road headerproved impractical economically, because of wear caused by the pre-sence of bands of extremely strong and abrasive flints and chert in thechalk. Blasting had to be used instead to excavate the caverns (Anon,1985). Perhaps the presence of bands of flint might have been antici-pated in the chalk, even if it had not been logged during site-specificdrilling (probably due to inadequate sampling).
7.3.3 Abrasivity: TBM Singapore
Shirlaw et al. (2000) provide examples of the high abrasion that canresult from high quartz content in soils, weathered and fresh rockduring tunnelling. As part of the construction of the North East Lineof the Mass Rapid Transit in Singapore, two tunnels were driven from
Figure 7.2Killingholme LNGcaverns underconstruction. Theroadheader is beingused to trim blastedcaverns rather thanexcavate them ashad been theoriginal intention.
312 Practical Engineering Geology

the east bank of the Singapore River to Clarke Quay Station on thewest bank. The total length of each drive was only 70m. A single 6.53mdiameter machine (Figure 7.3) was used to construct the tunnels withthe TBM turned around after the first drive. The tunnelling passedfrom weathered sandstone to marine clay on the southbound tunneland the reverse on the northbound tunnel. To maintain the facepressure in the weathered sandstone, the EPB shield needed tobe operated at almost maximum torque, which resulted in extensivewear to the cutting tools and dangerously high temperatures inthe slurry and spoil. Almost all of the discs had to be replaced after70m before re-launching the shield for the northbound drive.Furthermore, the sandstone was broken down to abrasive slurry,which, in EPB mode, fills the chamber and the area between the cuttinghead and the excavated face causing further damage to the machine,including the screw conveyor. In a separate case, for an EPBM tunnel-ling mainly through Old Alluvium in Singapore, the pressure bulkhead(40mm thick steel), became so abraded that it failed, resulting in amajor loss of ground (Marshall & Flanagan, 2007). The incidentcaused about 280mm of settlement and closure of a lane of the centralexpressway for 12 hours (Shirlaw, personal communication).Similar problems have been reported and should be anticipated for
other soils and rock with high silica content, including granite and soilsderived from granite, and can be predicted using Cerchar AbrasivityIndex tests. The abrasion can be lessened by appropriate use of additives.In the example above, for the southbound and most of the northbounddrives, eitherwater or polyacrylamidewere used as a conditioning agent.For the last 10m of the northbound tunnel, the contractor switched tofoam. This had a dramatic effect in reducing the torque required torotate the cutting head, and the temperature of the spoil.
Figure 7.3 EPBMachine in crosssection. Thepressure at the faceis maintained by therate at whichbroken downmaterial is removedin the Archimedesscrew.
Unexpected ground conditions and how to avoid them 313
Man LockLining segments6 -Mixing
Blade
1-fixedBlade
Plenumchamber
24-shield Jacks
8100
Tail seals
3-slime InjectionPipes
Horizontal GateScrew Discharger
Erector Equipment
Exc
avat
ion
dia
653
0
Segm
ent
Out
er d
ia. 6
530

7.3.4 Concrete aggregate reaction: Pracana Dam,Portugal
Pracana Dam is a 60m high concrete gravity buttress dam builtbetween 1948 and 1951 and located in the centre of Portugal, onthe Ocreza River, a tributary of the Tagus River. In 1962, crackswere detected in some buttresses and, in 1964, seepage throughthe dam increased suddenly (Gomes et al., 2009). Cracking furtherdeveloped together with progressive upward movement of thecrest and downstream movement of the dam. Cores were drilledinto the dam and samples taken to analyse deposits in cracks andthe aggregate and to conduct expansion tests. It was establishedthat alkali-silica reactivity (ASR) of the locally derived aggregate,including quartzite, milky quartz, feldspar, granite and shale/grey-wacke, was probably the cause for the swelling phenomenon. Aphotograph of the crazing resulting from the ASR is given inFigure 7.4. Remedial works included sealing of individual cracks,resin grouting and placing a 2.5mm PVC geomembrane withgeotextile on the upstream side of the dam. As illustrated by thiscase, alkali-silica reactivity in concrete can cause severe deteriora-tion and necessitate expensive remediation and yet is readilyavoided if the mineralogy of the aggregate is considered properlyand appropriate reactivity and expansion tests conducted whenthe aggregate is selected for the project (Smith & Collis, 2001).
Figure 7.4 Cracks in face of the Pracana Dam, Portugal, due to alkali-silica reactivity from use ofreactive aggregates in concrete (reproduced with kind permission from Ilidio Ferreira, Head of DamSafety Department at EDP, Portugal).
314 Practical Engineering Geology

7.4 Geology: mass-scale factors
7.4.1 Pre-existing shear surfaces: Carsington Damfailure
Carsington Dam is infamous because it collapsed over a long lengthduring construction in June 1984 (Figure 7.5). The project was delayedby seven years as a result. A major factor was that the foundationmaterials were mistakenly considered to comprise undisturbed residualclay derived from in situ weathering of the underlying mudstone,whereas they were later identified as periglacial head deposits(Figure 7.6). The head deposits contained pre-existing slip planes alongwhich the shear strength was far lower than had been assumed for theoriginal design (Skempton & Vaughan, 1993). In hindsight, probablythe clayabovebedrock shouldhavebeen excavatedprior to constructionof the dam, aswasdone for the reconstructionof the dam (Banyard et al.,1992). As noted in Chapter 3, pre-existing shear surfaces are recognisedcommonly in quite young soils and particularly in the London Claywhere they have been associated with landslides.
Figure 7.5 Failureof Carsington Dam.Black area behindwater intakestructure is tensioncrack due to failureover 400 m lengthof the dam crest.White area in frontis limestone riprap.
Figure 7.6 Crosssection throughCarsington Dam,illustrating mode offailure.
Unexpected ground conditions and how to avoid them 315
Whitelimestoneriprap
Black area is rear scarp offailure along much of thelength of the dam
Coal Measures mudstonerock fill
slip surface
clay found to be transported‘head’ with pre-existing
shear surfaces (periglacial)φ not 20• but 12•
clay core
in situ mudstone
yellow claythought to beresidual bydesigners

7.4.2 Faults in foundations: Kornhill development,Hong Kong
Figure 7.7 shows foundations for high-rise structures under con-struction at Kornhill, Hong Kong. The presence of a major fault(weathered zone in line with the valley) meant that foundationshad to be taken locally tens of metres deeper than adjacent foun-dations. Clearly, the valley was indicative of the potential for poorground conditions. That said, all valleys are not associated withfaults and all major faults are not associated with valleys. AtKornhill, some faults that had been anticipated caused no difficul-ties whilst other unpredicted faults were discovered during con-struction (Muir et al., 1986).
7.4.3 Faults: TBM collapse, Halifax, UK
A tunnel was to be constructed in northern England throughCarboniferous mudstones, and a tunnel boring machine (TBM) wasselected for the construction. The disc cutters of themachine are seen inFigure 7.8. Normally, you should not be able to photograph this viewof the machine until the tunnel has been completed and the TBM hasentered a reception excavation. Unfortunately, in this case the tunnelhad collapsed during construction when the TBM encountered a fault(Figure 7.9). The TBM came to a halt as material collapsed around it.The only way of advancing the tunnel was to sink a shaft in advance ofthe TBM and excavate a larger tunnel by hand, back to the collapse,and freeing the machine (Figure 7.10). This of course was expensiveand led to some dispute. The contractor (constructing the tunnel andwhose TBM had got buried) claimed that he did not expect such poorground. An expert for the client said that he should have done so
Figure 7.7 Fault invalley at Kornhill,Hong Kong. Poor-quality rock in faultzone resulted infoundations beingtaken tens of metresdeeper than inbetter rock awayfrom the fault zone.
316 Practical Engineering Geology

because a fault was clearly indicated by the ground investigation. Thecontractor agreed that there was a fault shown from the boreholes butargued that the GI did not indicate the degree of disturbance that hadled to the collapse. Another expert was called to give evidence. He wasasked, ‘Was such poor ground an unusual occurrence with suchfaults?’ The expert answered, ‘yes, very unusual’ – [case going theway of the contractor]. He then went on to say, ‘It is so interestingthat I bring my students each year to examine it in the quarry near thesite where the collapse occurred.’ Case dismissed. [The New
Figure 7.9Collapse of faultzone aroundTBM – exacerbatedby attempt to moveTBM backwards,which necessitatedemergency backfilland grouting abovethe tunnel.
Figure 7.10Solution – sinkshaft in advance ofTBM and excavatetunnel by handback to TBM,allowing it to beprotected andfreed up.
Figure 7.8 TBMexposed in faultzone, northernEngland.
Unexpected ground conditions and how to avoid them 317
Tunnel BoringMachine fa
ult
Recovery tunnel
Recovery shaft
Tunnel BoringMachine

Engineering Contract (ICE, 2005) states that in judging the physicalconditions, the contractor is assumed to have taken into account:
– The site information– Publically available information referred to in the site information– Information available from a visual inspection of the site, and– Other information that an experienced contractor could reasonably
be expected to have or to obtain.]
7.4.4 Geological structure: Ping Lin Tunnel,Taiwan
The Ping Lin Tunnel in Taiwan (now called theHsuehshan Tunnel) waseventually completed after numerous delays, collapses and deaths. Theplan was to excavate a pilot tunnel using a 4.8m diameter rock TBMfollowed by two 11.74m diameter TBMs for the main tunnels, but theanticipated tunnelling rates of up to 360m/month/machine provedhopelessly optimistic because of adverse ground conditions. The geol-ogy included a syncline of sandstone with several faults. The pilottunnel TBM soon ran into trouble as slow seepage from a fault drain-ing the saturated aquifer above rapidly increased and flooded thetunnel (Figure 7.11). Attempts were made to construct bypass tunnelsand to advance each of the TBMs using pre-grouting to improve therock mass, but much of the tunnelling had to be done using drill andblast methods rather than using the purpose-built TBMs. Details ofthis project are described by Barla & Pelizza (2000).
7.4.5 Deep weathering and cavern infill: TungChung, Hong Kong
The new town at Tung Chung is situated close to Hong KongInternational Airport and for a large part was built on offshore
Figure 7.11 Riverof water out of pilottunnel TBM, PingLin, Taiwan.
318 Practical Engineering Geology

reclamation. Prior to the planning of TungChung and the formation ofthe reclamation, only very limited ground investigations and geophysicalsurveys were undertaken. As a consequence, the geology of the sub-strate below the seabed was essentially unknown, and extrapolation ofthe geology from the onshore rock outcrops proved to be misleading.Initial ground investigations on the newly formed reclamation indi-
cated that the sub-surface bedrock geology comprised rhyolite dykes,marble, metasedimentary rock and skarn. The thickness of weatheredbedrock varied greatly across the reclaimed area, from less than 50mto over 150m. At the site of a proposed 50-storey residential towerblock, a very steep gradient in the rockhead surface was identified. Inaddition, cavities up to 12m in thickness and of unknown lateralextent were recorded in the drill logs, deduced from zones of nosample recovery and sudden drops of the drill string. Using this infor-mation, a foundation design consisting of 2.5m diameter bored pilessocketed into rock at depths in excess of 120m was proposed. Groundconditions are illustrated in Figure 7.12. However, the costs and risksinvolved with this design were considered to be too high, and furtherground investigations were undertaken to investigate the geologymorefully and to determine whether the cavities were actually present orwere filled with soil. The new boreholes used polymer drilling fluidsand improved sampling techniques, followed by down-hole electricalcylinder resistivity, gamma density and sonar surveys. No open cav-ities were identified in the second phase of drilling and a new geologicalmodel was proposed. The foundation design was then reassessed, butconcern over the mention of open cavities in the original borehole logsstill remained and in the event the tower block was never built.The key points to be learnt from this project are:
– The town planning of Tung Chung should have taken into accountthe sub-surface geology, so that areas with problematic foundationconditions could have been avoided, if at all possible.
Figure 7.12 3Dgeological model,Tung Chung, HongKong (courtesy ofDr Chris Fletcher,Fletcher (2004)).
Unexpected ground conditions and how to avoid them 319
collapsed material
full platform
granite
cavity fill
sea sf
sf
c-mc-m
c-f
c-f
c-fc-f
m-s
m-s m-s
meta-sediments
superficial deposits
volcanic rock

– The use of geophysical techniques, such as microgravity surveys,prior to the formation of the reclamation, would have greatlyassisted the formulation of a realistic geological model, therebymaximising the potential of the site and reducing costs.
– Ground investigations in areas of complex ground, deep tropicalweathering and the presence of calcareous metasedimentary rocks,require advanced drilling techniques and high levels of soilrecovery.
7.4.6 Predisposed rock structure: Pos Selimlandslide, Malaysia
The Pos Selim landslide in Malaysia is described by Malone et al.(2008). The landslide occurred in one of the many large and steep cutslopes along the new 35km section of the Simpang Pulai–LojingHighway project, and it is pertinent to ask the question why did itoccur there rather than somewhere else?Failure occurred early on in a small cut slope and affected the natural
slope above the cutting. Progressively, the slope was then cut back inresponse to further failures until the works reached the ridgeline about250m above the road (Figure 7.13). The slope then continued to movewith huge tension cracks developing near the crest, with vertical dropat the main scarp of more than 20m in three years.Clearly, at the site there are some predisposing factors that are
causing instability, whereas many other equally steep slopes alongthe 35km of new highway show no similar deep-seated failures. Thegeneral geology of the site is schist but the main foliation actuallydips into the slope at about 10 degrees, so the commonmode of failureassociated with such metamorphic rocks, of planar sliding on day-lighting, adverse schistosity, or on shear zones parallel to the schistos-ity (Deere, 1971), is not an option to explain this landslide. Following
Figure 7.13 Viewof Pos Selimlandslide,Malaysia.
320 Practical Engineering Geology

detailed face mapping by geologists, review of displacement data andexamination of the various stages of failure, a model was derived thatcan be used to explain the nature of the failure, the vectors ofmovement and the fact that it has not yet failed catastrophically but isbulging at one section of the toe (Figures 7.14 & 7.15). Key aspects ofthe geology are frequent joints that are oriented roughly orthogonal tothe schistosity, three persistent faults cutting across the failure and
Figure 7.14 3Dmodel of postulatedfailure mechanism,Pos Selim.
Figure 7.15 (a) Digital model of Pos Selim landslide with movement vectors compiled by comparingan orthophoto with an as-built CAD drawing (courtesy of Dr Andy Hansen). (b) Stereo plot withconcentration of poles near centre representing the foliation dipping back into the slope at about14 degrees. Most joints form a girdle at about 90 degrees to the mean pole of the foliation. (c)Explanation for main body of landslide – exploiting jointing and kicking out at the toe and upwards,along foliation.
Unexpected ground conditions and how to avoid them 321
Counterscarp
Bulging
Faults
Foliationdipping intoslope
joint
foliation
joint girdlec)a)
b)
foliation
Foliation rockbridge

another major fault to the north of the landslide area. The derivedmodel is of a mechanism of sliding on the short, impersistent jointsthat combine with offset sections of schistose fabric to form a shearsurface. The shearing forces are largely balanced by sliding frictionon joints along the transverse faults and schistosity in one part of thetoe where the failure is kicking out. Resistance is also provided by thedilating mass towards the right side toe of the slope (facing). Onepossible option for remediation that can be derived from this model,therefore involves strengthening the toe area by anchoring or otherwisebuttressing.It is to be noted that this model is not numerical but could certainly
be used as the basis for a numerical model that would indeed work forsome realistic set of parameters. Without this understanding of geolo-gical mechanism, it would be impossible even to begin to designsuccessful remedial measures.There is some evidence that groundwater is playing a part in the
failure (some seepage) and therefore it was recommended that longtrial raking drains be installed at points of seepage, in such a way thatthey also allow water pressures to be monitored within the slope (acost-effective combination of ground investigation and remedialmeasure).
7.5 General geological considerations
One of Terzhagi’s principles, as reported by Goodman (2002), was to:‘assume the worst configuration of properties and boundary condi-tions consistent with the data from site investigations’, i.e. within theconfines of an appropriate groundmodel. The following two examplesillustrate the consequences of failing to do so.
7.5.1 Tunnel liner failure at Kingston on Hull, UK
The failure of a tunnel at Kingston on Hull is reported by Grose &Benton (2005). The tunnel was constructed with a TBM through asequence of saturated Quaternary sediments. During construction,water and then soil migrated through one of the already constructedsegmental liner joints and the tunnel had to be abandoned temporarilyas the situation deteriorated. A subsequent investigation failed to comeup with a definitive answer but it was clearly a matter of soil-structureinteraction and possibly construction defects. The discussions byHartwell (2006) and Shirlaw (2006) are instructive and they comeup with various ideas to do with problems with grouting of the linerto explain the failure, which seem feasible. The bottom line seems to bethat the tunnel design and construction methodology was not robustenough for the ground conditions. In this case, whatever the geologicalvariability that ultimately brought about the failure, variability was to
322 Practical Engineering Geology

be anticipated and the design and construction methodology shouldhave coped with this.
7.5.2 Major temporary works failure: NicollHighway collapse, Singapore
A major failure of temporary works occurred during the constructionof part of the Circle Line of the MRT, Singapore, on 20 April 2004.Four persons were killed. The post-failure investigations were pre-sented to a meeting of the British Geotechnical Association (Hight,2009).At the time of collapse, excavation was taking place of a 34m deep
excavation for a cut and cover tunnel between two diaphragm walls.As the excavation was lowered, the vertical walls were supported by asystem of steel struts, waler beams and kingposts. By the time of thefailure, there were nine levels of struts and some of these were instru-mented with load cells and strain gauges. About six hours before thefinal failure, some of the struts began to lose load rapidly, whilst otherstook on more load. This has been interpreted as brittle failure (rapidand unrecoverable loss of strength) of some of the strutting. A detail ofthe strut beams/waling collection was considered the major factor inthe collapse (Magnus et al., 2005).The excavation was in an area of reclaimed land, but most of the
excavation was through very soft and soft to firm predominantly claysof the Kallang Formation, which is an extensive and well-investigatedstratum in Singapore (Bird et al., 2003). It was concluded that therehad been relative vertical movement between the diaphragm walls andstrutting system as part of the failure mechanism. At the meetingreported, it was argued by Hight (2009) that the failure also relatedto the fact that the temporary works were designed to a FoS of 1.2 yetcontained brittle elements, including the steel strutting/waling connec-tion and a concrete strut formed at depth using jet piling. It wassuggested that the trigger for the failure was due to ground conditionsdeviating from the design assumptions, in that the undrained strengthprofile was lower than assumed and a complex geology, which involvedsignificant variations in stratigraphy between the diaphragm walls.The comment regarding undrained strengths actually does not relateto incorrectly measured or anticipated strengths but an error in theway that strength was dealt with in numerical modelling (Magnuset al., 2005). The comment on complex geology apparently relatesto a local deepening of the Kallang Clay but such occurrences arecommonplace in Singapore (Bird et al., 2003).In this case, the fundamental cause of the failure was the structural
connection between struts and waling beams that was under-designed.As reported from the BGAmeeting, ‘The waling detail that yielded andunderwent brittle failure had a direct load capacity that was only
Unexpected ground conditions and how to avoid them 323

marginally lower than the load thatwas predictedwould be applied to it.’Perhaps if a higher overall FoS (say 1.4) had been adopted for the designof the walls, it might have compensated for the error in structural designdetail, but if it had done so it would have been essentially by chance.Blockley (2011), in his paper on engineering safety, discusses a Swisscheese model (Reason, 1990) where the components controlling safetyare expressed as a series of layers such as management, design andground model, each with defects (holes) in them, including unsafe acts.These are dynamic – some of the holes move around during constructionor generally with time. Failure occurs where the holes line up. The NicollHighway collapse is an example where there were several such layerswith defects and it just happens that perhaps three out of five or solined up at this particular location and these were enough to initiatefailure. The fact that others lined up elsewhere on site (including diffe-ring ground conditions and incorrect analysis) contributed to the scale ofthe failure. The FoS or partial factor approaches of Eurocode 7 cannot beexpected routinely to cope with structural design faults nor errors inground models and analytical mistakes. At the BGA meeting, thesite was described as unforgiving, but this seems outside the sense ofthe term as used in Chapter 4 where it is taken to describe particularlyadverse geological conditions that would be very difficult toanticipate or to investigate using routine approaches which was not thecase here.
7.5.3 General failings in ground models
As a general point, when things do go wrong and a detailed examina-tion is made of the ground model assumptions vs. what caused thefailure, it is often found that the ground model was inadequate orincorrect. Sometimes this can be because the GI was poorly designed orconducted, but also because practice was poor. Some of the commonerrors and poor practices are set out in Table 7.1.
7.6 Environmental factors
Environmental factors include hydrogeological conditions, in situstresses and earthquake shaking. Such factors should be consideredin preparing the ground model for a site. The environmental factors tobe accounted for depend largely on the nature, sensitivity and designlife of structures and the consequence of failure.
7.6.1 Incorrect hydrogeological ground model andinattention to detail: landfill site in the UK
A quarry in Gloucestershire, UK, was used for disposing domesticrefuse. The quarry had been developed to extract moderately
324 Practical Engineering Geology

strong to strong Great Oolite limestone with well-defined beddingplanes dipping shallowly at about 4 degrees to the northeast. Therock also had many joints orthogonal to bedding, many of whichwere open, partly as a result of dissolution and partly due toblasting damage. The limestone overlies Fullers Earth, which is aclay-rich formation. The landfill operatives had been advised that
Table 7.1 Errors in practice that contribute to failure to foresee ground conditions.
Common failings Comments
General
Desk study inadequate
These are really tasks for atrained and experiencedengineering geologist.
No site reconnaissance and mapping ofexposures.
Failure to interpret the landscape – e.g.colour of soil, topography, vegetation, seepage.
Lack of anticipation of geologicalassociations, e.g.:
– Link between landscape and geologicalhistory.
– Significance of soil origin.– Metamorphic and igneous associations.– Origins of discontinuity networks.– Lateral and vertical variation,
especially in weathered terrain.
Site-specific
Inadequate or incompetent investigation. Investigations must be targeted atimportant unknowns.
Failure to examine samples (designer). May miss vital clues.
Misinterpretation of data. Over-reliance by designer oninterpretation by groundinvestigation contractor.
Ignoring significance of lost samples and poorrecovery.
Poor recovery often equates withpoor ground conditions.
Designer fails to recognise significance of groundinformation.
Most soil and rock mechanicstextbooks say little aboutgeology and training in civilengineering courses is oftensuperficial.
Contractor fails to examine samples or site. Tender restrictions mightconstrain accessibility but ifprevented from so doingcontractor should document this.
Instrumentation inadequate (type, location andmonitoring arrangements).
Installation must enhanceground models and allowprediction for projectconstruction and lifetime.
Unexpected ground conditions and how to avoid them 325

the risk of leachate (liquid rich in waste products) migration fromthe quarry was low, but it turned out that this was based on anincorrect interpretation of local geology. The landfill was thenoperated using internal clay bunds and a series of drains andlagoons but, crucially, these were constructed overlying a thinlayer of limestone that had been left in place in the floor of thequarry as an operating surface for vehicles, both during quarryingand landfill operations. When the quarry was about half full ofrefuse, leachate emerged at a spring in an adjacent valley about akilometre away. This polluted a stream, which then impacted afish hatchery downstream as well as water supply. Reappraisal ofthe geological model using available published maps indicated thatthe leachate was probably passing laterally through the lowerstratum of jointed limestone that had been left in the base of thequarry and then channelled down a fault to the spring. Tracertests were commissioned and these confirmed the link between thequarry source and the polluted spring (Smart, 1985). Variousoptions were considered to improve the situation, including grout-ing, but the preferred remedial measures involved the excavationof landfill along the downstream margin, cutting a trench throughthe lower limestone and into the underlying Fullers Earth clay andthen using geotextile membrane on the inside and an impermeablesheet on the outside wrapped around a drain falling to a sumpwhere leachate could be collected regularly for separate treatment.Upstream of the quarry, a similar membrane and drain system waskeyed into the Fullers Earth, collected groundwater throughflowand channelled it around and away from the quarry. As thelandfill was completed, it was to be capped to prevent directrainfall ingress. The works led to significant reductions in migra-tion of leachate and improvement in the quality of water emergingfrom the spring.It is to be noted that at the time the quarry was operated a dilute and
disperse approach was generally adopted to landfilling in the UK andworldwide, whereby it was assumed that the overall migration ofleachate would be insignificant as it mixed with a large volume ofgroundwater. This case illustrates that where the leachate is trans-ported by local channel flow, rather than volumetric dispersionthrough a porous mass, dilution cannot be relied upon. Nowadays,in most countries the base and sides of landfills will be sealed usinga 0.6 to 1.0m layer of low-permeability soil followed by flexiblegeomembranes, which again will be covered by a layer of soil toprevent puncturing by traffic or other means. Levels of leachate willalso be controlled by internal drainage. While these systems canseldom be completely leak proof, pollution levels should generallybe low.
326 Practical Engineering Geology

7.6.2 Corrosive groundwater conditions and failureof ground anchors: Hong Kong and UK
In the 1970s and 1980s, many ground anchors were installed tostabilise cut slopes in Hong Kong, but this practice largely came to ahalt following failure of a number of anchors in the slope shown inFigure 7.16. The problem was recognised following the explosive fail-ure of concrete anchor head covers as the bar anchors broke.Investigation showed that whilst the steel anchor bars were protectedfrom chemical attack alongmost of their lengths, either by grease or bycement grout, close to a steel coupler there was an air space andinadequate protection, which allowed rusting and failure. Similardeterioration has been observed in the UK on the A685, above theM6 near Tebay, where rock bolts were installed, some with built-indynamometers to allow loads to be checked periodically (Edwards,1971). The bolts, with lengths up to 9.15m, had fixed anchor lengthsvarying from 0.31 to 0.61m (epoxy resin). The rest of the length wasgrouted with either cement or bitumastic, following a nominal loadingof 50 kN. Several of the bolts have now lost their anchor plates andtherefore are unable to carry their design loads due to deterioration ofthe rock mass and general rusting of the assemblages (Figure 7.17).Designers and owners need to recognise long-termmaintenance require-ments, including regular inspection and testing and the likelihood thatanchors will need to be replaced periodically. Edwards (1971) identi-fied the need for corrosion protection and long-term maintenance butthis appears not to have been done. Even in more recent projects, anddespite stringent standards in force for design and construction,including corrosion protection, anchors fail. The design of rock cutslopes at Glyn Bends on the A5 in North Wales required 4,500m ofground anchors stressed to between 400 kN and 600 kN (Green &Hawkins, 2005). Within 10 years of construction, the new section ofroad had to be closed after two anchor heads fell off and other anchorsfailed on testing (NorthWales Geology Association, 2006). Anchorages
Figure 7.16Anchored slopebelow ClearwaterBay Road, HongKong.
Unexpected ground conditions and how to avoid them 327

also fail due to corrosion in other situations, including holding downanchors for concrete dams (Cederstrom et al., 2005). Similar problemscan arise with corrosion of steel piles or of steel reinforcement withinconcrete piles, especially in aggressive environments such as at the coast.These issues need to be addressed by the designer.
7.6.3 Explosive gases: Abbeystead, UK
In 1984, a methane gas explosion destroyed a valve house atAbbeystead waterworks in Lancashire. Eight people were killedinstantly by the explosion and others died subsequently. The inquiryinto the disaster concluded that the methane had seeped from coaldeposits 1,000m below ground and had built up in an empty pipeline.Following a trial and appeal, the designers were held negligent forfailing to exercise reasonable care in assessing the risk of methane inthe finished structure. A review of the various opinions as to whichparty (client, contractor and/or engineer) should have foreseen theaccumulation of methane is given by Abrahamson (1992). Otherdetails are given by Orr et al. (1991).
7.6.4 Resonant damage from earthquakes at greatdistance: Mexico and Turkey
One of the interesting aspects of earthquakes is the damage that iscaused at great distances through resonant affects. One of the classiccases is the earthquake that killed an estimated 10,000 people inMexico City in September 1985. The earthquake was large (8.1 mag-nitude) but the epicentre was more than 350km away from the city, so
Figure 7.17Deteriorated rockbolt with provingring. Jeffrey’sMount, above M6near Tebay, UK.
328 Practical Engineering Geology
Rusted dynamometerand face plate. Thisdetail was supposed tobe protected by apolythene cap.
Face placeassemblagemissing

the peak bedrock acceleration was not very high at about 0.04g (aswould be anticipated from attenuation equations discussed inChapter 6). Consequently, in areas of the city built on rock, the earth-quake was hardly felt. However, the dominant period of the incomingwaves matched the natural period of a basin of lakebed sediments onwhich part of Mexico City is constructed (about 2.5 seconds) and theground motion was amplified by the long duration ground motion.That ground motion in turn matched the natural resonant frequenciesof some buildings, and almost all damage was caused to structuresbetween 6 and 15 storeys in height.In a similar manner, whilst most damage from the M6.8 Erzincan
earthquake, 1992, occurred close to the epicentre and near to theNorth Anatolian Fault, anomalous damage occurred at great dis-tances, including complete failure of a six-storey reinforced concretestructure at about 40km, the very top level of a minaret at 80km(Figure 7.18) and large landslides at more than 100km distance. This
Figure 7.18Damage to top ofminaret at about80 km fromepicentre,Sularbasi.
Unexpected ground conditions and how to avoid them 329

damage almost certainly was caused by long-period wave resonanceeffects (Hencher & Acar, 1995).
7.7 Construction factors
The third verbal equation of Knill & Price (Knill, 2002) addresses theinteraction between the geological and environmental conditions at asite and the construction and operational constraints and interactions.The systematic review and investigation of site geology and environ-mental factors, discussed in Chapter 4, needs to be conducted withspecific reference to the project at hand – how construction is to beachieved and the long-term performance of the structure.
7.7.1 Soil grading and its consequence: piling atDrax Power Station, UK
It is often during construction that things go seriously wrong. Anexample is provided from the 20,000 piles driven to support thesecond phase of construction of Drax Power Station in Yorkshire,UK. The ground conditions appeared to be straightforward withabout 17m of firm, varved silt and clay overlying 2–3m of sand thatwas typically dense and in turn overlying Triassic sandstone. Thisprofile was proved to be consistent across the site by numerous shelland auger boreholes, with many SPT tests in the sand. Piles weretherefore expected to come to a halt during driving at depths ofabout 18–19m. In the event, the piles were driven to depths whichvaried unexpectedly and unpredictably by up to about 4m. Figure 7.19shows some of the piles; the holes in the front are where piles disap-peared below carpet level without reaching a satisfactory resistance(set) during driving. Where piles were driven to carpet level without
Figure 7.19 Drivenpiles at Drax PowerStation completion.Dark holes inforeground arewhere pile headshave been drivenbelow carpet levelwithout achievingan adequate set andneed re-driving.
330 Practical Engineering Geology

achieving the specified resistance, they had to be re-driven contrac-tually. Invariably, it was found that on re-driving, the piles could notbe advanced at all. This was not through design or choice and was acostly problem because piles had to be manufactured to cater forlonger lengths of penetration to avoid re-drives that were expensiveand caused delays to the programme. An investigation was carried outusing driven sample tubes into the sand, as well as additional conepenetrometer soundings in groups of piles where they came to an earlyset and where the depth of penetration was much greater, respectively.In addition, some pneumatic piezometers were installed within thesand horizon and readings of groundwater pressure taken during piledriving as the piling front approached the instrument positions. Dataare presented in Figure 7.20. It can be seen that for piles more than 4maway from the piezometers, there was no influence from the piledriving. However, as the piles approached the piezometer positions,water pressures increased markedly and for the closest piles were offscale at more than twice overburden pressure. Clearly, wewere dealingwith an effective stress problem. Examination of samples establishedthat an explanation for the different behaviour was in the soil grading.In areas where the piles were driven to refusal at unexpectedly highlevels, the sand was uniform and clean. Where they penetrated todeeper levels, the sand had higher contents of silt and clay and clearlyhad lower permeability. Evidently, the lower permeability allowedhigher water pressures to develop, which reduced effective stress andenabled greater penetration. If the driving was stopped, the waterpressure dissipated and the piles could not be advanced, however
Figure 7.20Piezometricpressure vs.horizontal distancebetween pile andinstrument.
550 Off Scale
Piezometer 1Piezometer 2
450
350
250
Por
e pr
essu
re, k
N/m
2
150
50
0 2 4 6 8Distance between pile being driven and piezometer, m
10 12 14 16 18
Unexpected ground conditions and how to avoid them 331

hard they were hit. This was proved by driving some piles to a targetdepth next to boreholes, 1.5m into the sand rather than to set orto carpet level. Piles that had not reached set on initial drive werethen re-driven (they did not advance) and some were tested withoutre-driving to 1.5 times working load, which was carried perfectlysatisfactorily. In hindsight, the original GI had been too simple; thestandard clack valve-type sampling of the sand horizon, typical ofUK practice, was not adequate for establishing the true nature of thesoil. The variability across the site was due to the outwash fan originof the sand with local pools of clay and silt-rich soils in the glaciallandscape. These difficulties added perhaps 10% to the cost of pileproduction (Hencher & Mallard, 1989). The problem had not beenanticipated and was related entirely to the method of construction. Ifbored piles had been used instead of driven piles for the Drax founda-tions, which would have been feasible, then the problem would nothave arisen. What was particularly galling was when a senior consul-tant, who had been involved in the construction of the first phase of thepower station, visited the site and said, when informed of what washappening, ‘Oh you have found that again, have you?’
7.7.2 Construction of piles in karstic limestone,Wales, UK
Fookes (1997) discusses a number of examples of unexpected groundconditions where he believes that the situation could have been antici-pated prior to tender, and includes several dealing with karstic lime-stone. One that is described is for a river crossing inWales, and Fookesargues that karstic conditions could readily have been identified fromlocal evidence and boreholes specific to the project. The case is rathermore complicated than that. The karst was indeed recognised prior totender by all parties and, as is good practice (Cole, 1988), a groundimprovement contract was let to wash out and grout voids in thelimestone around pile locations prior to the piling contract. Thatbeing so, the conditions anticipated by the piling contractor were asshown in Figure 7.21. In the event, for various reasons, the groutingwas not comprehensive, in particular because some arbitrary rockheadwas adopted at some depth below true rockhead (see Chapter 3),which rather negated the point of the grouting.During the piling contract, where the rock mass was of good quality
(either naturally or due to successful grouting), piles were installedwithout difficulty. Elsewhere, the contractor encountered soil over-lying a very irregular rock profile containing voids, some of whichwere open, others infilled with soil and some grouted. Cased holescollapsed and there was loss of concrete from the holes once formed,with a risk of pollution to the adjacent river. The karstic conditionswere not unforeseen, as suggested by Fookes, but the lack of ground
332 Practical Engineering Geology

improvements was. Of course, other foundation schemes might havebeen conceived that would have placed less reliance on the pre-pilinggrouting contract, but as things stood there was a valid claim.
7.8 Systematic failing
Sometimes things go wrong because of some fundamental misunder-standing of the proper approach to follow or due to some miscommu-nication or lack of management of the process. Muir Wood (2000)compares the design of a tunnel to the performance of a symphony.Whereas in the concert hall, all the players are using the same musicsheets and are watching a conductor, all too often in engineering pro-jects the control is inadequate and all the players have their own agenda.The result, as Muir Wood puts it, can end up cacophonic. Often whenthings go wrong it is argued that ground conditions were unexpected,but on analysis it is shown that ground characterisation of the site wasfatally incorrect or there were failings in management of the project.Regarding the Heathrow Express Tunnel collapse discussed below,
this was described by the Health and Safety Executive, UK (2000), asan organisational accident with a multiplicity of causes. Other casesbelow could be described in similar fashion.
7.8.1 Heathrow Express Tunnel collapse
One case from which many lessons can be learned is the well-documented collapse of a series of tunnels and chambers in LondonClay under construction for the Heathrow Airport Express (HEX) inOctober 1994. This case is described in detail, both technically andregarding management and contractual issues, by Muir Wood (2000),
Figure 7.21Anticipatedconditions forpiling in karsticlimestone,following groundimprovementcontract.
Unexpected ground conditions and how to avoid them 333
limestone
drift
rock socket
casing throughdrift
voids that were to be grouted

whowas appointed as part of the team investigating the collapse by theHealth and Safety Executive (HSE, 2000). The monetary cost ofthe failure was at least £400 million whereas the original contractvalue was £60 million. The reputation of civil engineering in the UKwas also badly tarnished overseas.The project was to be conducted by the New Austrian Tunnelling
Method (NATM), which was a novel approach for tunnelling inLondon Clay, although it had been used successfully for trial tunnelsat Terminal 4. As described in Chapter 6, the traditional concept ofNATM relies on the rock mass locking up as joints and interlockingblocks of rock interact and dilate during convergence towards theexcavation. The mass often forms a natural arch within the surroundingrock mass as it relaxes, and no or little support is needed. Optimisingsupport requirements requires prediction of likely convergence rates,making measurements as excavation proceeds and then applying anysupport necessary to prevent collapse. Generally, shotcrete is used toprevent loss of loose blocks and wedges, which would destabilise thearch and maybe lead to ravelling failure. Further active supportoptions include the use of bolts, lattice girders and steel arches, asappropriate. The principle is that the rock mass carries most of thestress and by waiting until the appropriate time, the engineered worksare kept to a minimum. After the rock mass has stabilised, an innerliner can be constructed, with or without waterproofing.There is some debate over whether the method adopted for HEX
really was or should be termed NATM. Muir Wood prefers the terminformal support to describe the use of a primary shotcrete liner for theHeathrow Express project; ICE (1996) uses the term sprayed concretelinings (SCL). The common feature between NATM in rock and SCLin weaker ground is the use of shotcrete as a preliminary support, butin weaker ground the shotcrete is used to minimise the deformationand settlement of the ground, which ‘effectively reverses the originalNATM principle of encouraging controlled ground deformation’(ICE, 1996). It is a subtle but important difference. Even before theHeathrow tunnel project, considerable questionmarks had been raisedover whether the LondonClay (an extremelyweak, fissured rockmass)would behave as a jointed rock mass, appropriate to the use of aNATM approach. In fact, the design concept was to use sprayedconcrete (with steel mesh and lattice girders) to form a load-bearingclosed ring (without any bolts or dowels as might be used for rock) tolimit settlement – a quite different concept to NATM in rock. One ofthe features of the failure at HEX was cracking and perhaps repairworks of that damage prior to a complete folding in of the shotcreteliner, and this has been blamed as a contributory factor although it wasargued, post collapse, by experts, that even with part of the invertcompletely removed, ‘the tunnel, as designed, should still have stoodup for up to 80 days’ (Wallis, 1999).
334 Practical Engineering Geology

Muir Wood summarises the factors he considers as contributing tothe collapse of the Heathrow tunnels. He notes that if any one of thesehad been addressed competently, in all probability the collapse wouldnot have occurred.
Management: an unfamiliar system of project management basedon the New Engineering Contract (NEC) (ICE, 2005) with self-certification by the contractor of a design by others. Muir Woodadvocates a more partnering approach.
Control of works: it was assumed that the specialist consultingengineers advising the contractor would bring particular knowl-edge and expertise to the project but commercial factors limitedhis presence on site and in reality he had limited power to exercisecontrol as should have been done for a design-led system ofconstruction.
Compensation grouting: due to higher than anticipated ground set-tlement, compensation grouting was carried out beneath one ofthe buildings adjacent to the works. Muir Wood describes this as,‘in reality grout-jacking, requiring pressures in excess of pre-existing vertical ground stress’. The grouting probably loadedthe tunnel and contributed to the collapse.
Lack of reaction to instrument data: there is no evidence that therewas any reaction by the contractor and his advisors to the dataindicating circumferential movement of the tunnel lining togetherwith depression of the crown. Muir Wood argues that there wasno acceptable explanation for this phenomenon other than aweakness of the invert. This should have been clear from distressthat had been seen in the invert. The advisors had not establishedany criteria for acceptable deflections or movement of the lining sothere was no quantitative trigger to warn that action needed to betaken. Data were presented in figures and diagrams without anycommentary or discussion. Nevertheless, according to Muir Wood,the data caused the client (British Airport Authorities) to questionthe integrity of the tunnelling, a suggestion that was dismissedby the contractor.
In addition, an important factor was probably the presence of severalparallel openings at the time of the failure, which would have allowedfailure mechanisms to develop more readily than in the trial tunnels atTerminal 4 (Karakuş & Fowell, 2004).Little is said in the various papers dealing with the Heathrow
collapse about the geology of the site. According to an expert for theprosecution by the HSE, ‘The London Clay is a well-documented,largely homogeneous, uniform and extensive body of over consoli-dated sedimentary clay with very few discontinuities and none identi-fied in the area of the collapse that could have caused a landslip …’
Unexpected ground conditions and how to avoid them 335

(Wallis, 1999). This description is somewhat at odds with the observa-tions of Skempton et al. (1969) and others of joints and fissures inLondon Clay, including numerous polished and slickensided ones. Thecontractor’s expert argued that: ‘Some unforeseeable and completelyunpredictable behaviour or geotechnical mechanism in the clay body isthe only explanation for the collapse …’ (Wallis, 1999) linked to theopinions of other experts that the excavated tunnels should have stoodup for up to 80 days. It is noted that in subsequent years several authorshave highlighted the importance of low shear strength flexural shears inthe London Clay (Chandler, 2000; Hutchinson, 2001), which have ledto landsliding, including near to Heathrow, but no such surfaces wereapparently observed in the post-collapse investigations at HEX(Norbury, personal communication; HSE, 2000).
7.8.2 Planning for a major tunnelling system underthe sea: SSDS Hong Kong
The Stategic Sewerage Disposal Scheme (SSDS) Stage 1 was an ambi-tious project to construct a series of shafts and deep tunnels at typicaldepths of 120–145m, leading from a number of catchments aroundVictoria Harbour in Hong Kong to a central treatment works con-structed at Stonecutters Island. The layout of the scheme is set out inFigure 7.22 and details are given by McLearie et al. (2001).
Figure 7.22 Layoutof SSDS Stage1 tunnels A toG, Hong Kongharbour. Darkershades are graniticrock: gt ¼ granite,gd ¼ granodiorite,m ¼ monzonite.Most of the otherrocks are mainly ofvolcanic origin.Base map is fromFletcher (2004).
336 Practical Engineering Geology
gt
gt
gt
Lantau Island
Tsing Yi Island
Stonecutters Island
Kai Tak Airport
Hong Kong Island
gdG
m
m
m
10 km50
EF
B
D
A

These tunnels were to be the first bored tunnels under the sea inHong Kong, and the general thinking amongst the design engineerswas that if the tunnels were deep enough, in rock that was grade III orbetter, then water inflowwould be low and ground conditions suitablefor excavatingwith open-face rock TBMs. In the event, most boreholesput down for the project and available at time of tender did not proveground conditions to the depths of the tunnel alignment that waseventually adopted. Buckingham (2003) summarises as follows:
‘When the SSDS project was conceived, site investigation was under-taken along the planned alignment to levels determined by this align-ment. This revealed ground conditions at the planned depth to be worsethan expected, the tunnels were lowered by several tens of metres belowthe depth of these boreholes with the idea that they would be below thepoor ground. The tender was based upon this assumption that thetunnels would be in better rock with minimal water ingress.’
There was a tender competition and the successful contractors electedto use mostly refurbished open-face rock tunnel boring machines withdiameters of between 3.2 and 4.3m. These TBMs had very limitedability to grout ahead of the tunnels and a low level of shielding forelectrical and mechanical devices, which reflected the general assump-tion by all parties – the HK Government, the design engineers and thebidding contractors – that water inflow would be low. The contractorwas required to accept all geotechnical risks such that there was nomechanism for additional payment in the event of unexpectedconditions.In the event, once tunnelling commenced, severe water inflow con-
ditions were encountered in Tunnels F and C especially. In Tunnel A/Bthere was almost zero water inflow, due to the massive nature of therock. Fairly onerous conditions had been set for the original contract,including a limit for groundwater inflow of 200 litres/minute/1,000mlength of tunnel. This compares to a final inflow rate of 5,300 l/minfor the completed Tunnel F, which equates to 1,400 l/min/1,000m(McLearie et al., 2001), despite extensive ground treatment andre-letting of the contract, as discussed below.The original contractor had great difficulty in grouting ahead of the
tunnels because the machines and ancillary drilling rigs were notdesigned for such poor conditions. The original specification was for120 degree drilling capability rather than 360 degrees, which is moreappropriate for stability improvement than preventing water ingress.In Tunnel F, measured water pressures – to be overcome by grouting –was up to 14 bars. Post-excavation grouting behind the TBM provedineffective in meeting the requirements of the contract. When waterwas stopped at one location, it reappeared somewhere else. Figure 7.23shows water conditions in Tunnel F at one stage.
Unexpected ground conditions and how to avoid them 337

The original contractor halted work in June 1996 and tookadvice on the likely time to complete the tunnels from specialist con-sultants brought in to assess the situation. Following negotiationsbetween the contractor and the government, the contractor wasremoved from the SSDS project in December 1996 and this wasfollowed by arbitration.In 1997, the project was re-let as three separate contracts, which
were completed byNovember 2000. The contractual arrangements areunknown in terms of acceptance of ground risks but what is known isthat considerable difficulties were encountered, including tunnellingthrough major fault zones (as had been predicted by the specialistsadvising the original contractor at the time that he stopped work). InTunnel F, the Tolo Channel Fault Zone comprised 268m of mostlypoor-quality rock, which required up to 20 grout holes of typically 54mlength around the full perimeter, with grout quantities averaging5,000kg/m of tunnel through most of the fault zone (McLearie,et al., 2001). Some details of the additional works and additionalcosts resulting are given in the Legislative Council Panel onEnvironmental Affairs report (2000).Other problems associated with the re-let tunnelling contracts
included settlement in an area of recent reclamation about 1kmaway from Tunnel C. Inflows into Tunnel C from a discretehighly fractured fault zone peaked at 10,400 l/min (compared to apermitted limit of about 1,000l/min for the full length of the 5.3kmTunnel C) and this led to considerable drawdown, settlement anddamage to several housing developments (Maunsell, 2000; Kwong,2005).The final breakthrough of the tunnels was four years late and US
$200 million over budget (Wallis, 2000).
Figure 7.23View alongTunnel F (1995).Note flow weir ininvert.
338 Practical Engineering Geology

Buckingham (2003) summarises the project:
‘Inadequate thought and planning during the site investigation stagelead to poor equipment and method selection. Also the fact that thecontractor was open to all ground condition risks, which eventually ledhim to pull of the job resulting in lengthy and expensive arbitration,created additional problems.’
It was argued at the time of the failed Stage 1 works, in defence of thegovernment’s case, that the investigation for the SSDS tunnels was themost extensive seen in Hong Kong (albeit that most boreholes did notreach eventual tunnel depth, failed to sample or intersect the majorfaults along the route and provided almost no data on permeabilityconditions). That argument resonates in some ways with a quoteregarding nuclear works (Nirex application, see below), highlightedby Green & Western (1994):
‘If a problem is too difficult to solve, one cannot claim that it is solved bypointing to all the efforts made to solve it.’
(Bulletin of Atomic Scientists, 1976)
7.8.3 Inadequate investigations andmismanagement: the application for a rock researchlaboratory, Sellafield, UK
An application by Nirex to construct an underground rock researchlaboratory at Sellafield to investigate the site’s suitability for disposalof nuclear waste was rejected following a public inquiry. This essen-tially brought a halt to investigations in a dramatic way. Consideringthe considerable cost of investigations up to that time and the con-sequences for the nuclear industry and Britain’s energy policies, thiscan be considered a major failed project. Moreover, the failure wasbasically a matter of ground modelling and interpretation.Nirex in the 1990s were given the task of developing a site for the
disposal of waste in the UK. The government set strict safety guidelinesthat would need to be met for a final application for a repository.Following a high-quality ground investigation that was ‘the mostexpensive “single” geological investigation carried out in Britainother than the North Sea oil projects’ (Oldroyd, 2002), Nirex decidedthat part of their studies should include an underground rock researchlaboratory. Other parties were not convinced that Nirex were readyfor this stage because of doubts regarding:
1. the general suitability of the site at Sellafield2. the capability of the Nirex team to control the necessary science
Unexpected ground conditions and how to avoid them 339

3. an opinion that the baseline hydrogeological conditions hadnot yet been established and that these would be disturbed irre-vocably by the construction of a laboratory. The baseline condi-tions would be a crucial part of establishing a safety case in thefuture.
It was argued that there was a major risk that construction of theunderground laboratory would itself damage the site irretrievably.A research laboratory should be constructed elsewhere to investigateand refine the science, even if the final disposal site was to be atSellafield. Furthermore, various parties were suspicious that the rockresearch laboratory would be a ‘Trojan Horse’. Once considerablemoney had been invested in a rock research laboratory, it would bevery difficult for the UK Government to argue that Sellafield wasfundamentally unsuitable as a repository site. Many of the argumentsput forward at the public inquiry as expert evidence are published byHaszeldine & Smythe (1996).Some authors have interpreted the failure at the public inquiry to
represent a fundamental ruling on the unsuitability of the Sellafieldsite. Others are less convinced that that point was established, simplythat Nirex were not ready at that time to make the case to proceed withan underground laboratory at the site where waste might be disposedof. Even at the time of the public inquiry, various people were of theopinion that the fundamental problemwas the government’s insistenceon disposal (such that the site would not need to be monitored or anyprovision made for retrieval), rather than stored underground whilst asafety case was established and tested, possibly over many years.Warehousing waste underground would reduce many of the risks ofstorage at the ground surface, although it would not be the finalsolution desired by the politicians. There are arguments for disposal,if it can be achieved, not least to remove a burden from futuregenerations, but perhaps that is simply unrealistic at the moment. Itseems highly likely that radioactive waste might be regarded as lessdangerous in the future due to advances in medical science, and theremay be ways of modifying or even using the waste in the future as anenergy source. There certainly will be improved methods for investi-gating and modelling the geology and hydrogeological conditions ata site.A year before the public inquiry – which brought the whole
process to a halt – Green & Western (1994) wrote on behalf ofFriends of the Earth that the government should ensure (amongstother things) that:
1. Radioactive wastes are held in interim, retrievable and monitor-able storage until scientific knowledge has advanced to enablepermanent solutions to be adopted.
340 Practical Engineering Geology

2. An ongoing and comprehensive research programme is initiatedfor all waste streams into waste conditioning, retrievability andlong-term management and the long-term behaviour of radioac-tive wastes in the environment.
These recommendations still seem eminently sensible, and if thatadvice had been accepted then the investigations at Sellafield wouldhave proceeded but with a different focus and programme. Oldroyd(2002) comments, ‘in retrospect, the whole Nirex enterprise appears tohave been in too much of a hurry’. As a result, rather than an ongoing,well-planned and managed approach to deal with the radioactivewaste disposal problem, the UK efforts seem to have come to a haltdue to fundamental mismanagement.
7.8.4 Landslide near Busan, Korea
The failure of slopes and the subsequent costs of remedial works areoften the result of insufficient geological investigation and inadequateinterpretation of ground conditions prior to design. This is compoundedby poor investigations into the causes of failures and systemic problemsassociated with poorly defined responsibilities for the stability of cutslopes. This was illustrated by the repeated failure of a large slope inKorea (Lee & Hencher, 2009). The original ground investigation anddesign were deficient, particularly considering the predictable com-plexity of the geological conditions. Subsequent investigations weresimilarly deficient. As a consequence, the slope failed six times despitenine reassessments by various professional engineers and the imple-mentation of several different remedial schemes over a period of sevenyears up to a disastrous failure in 2002. During the history of design,failure and reassessment, the height of the cut slope increased from45m to 155m and the cost increased from 3.3 million to 26 millionUS dollars.The investigation, design and management of excavation of this cut
slope can all be strongly criticised. There were many warnings that theslope was not safe and yet opportunities over a four-year period, toprevent the final failure, were not taken. Investigations, instrumenta-tion, monitoring and design fell far short of international good practiceand failed to meet the then current Korean (rather poorly specified)guidelines. It appears that all (or nearly all) engineers involved ininvestigations and review thought that failure would be restricted tosoil. That being so it was only considered necessary to drill and proverock for a metre beneath the soil to establish a ground model foranalysis. There was neither appreciation nor understanding by theengineers that they were dealing with a weathered rock slope withstructural control of mass shear strength and hydrogeology. The slopewas modelled and analysed as if it comprised layers of cheese, albeit
Unexpected ground conditions and how to avoid them 341

soil mechanics cheese, overlying stainless steel rock which could neverfail. This certainly indicates a lack of engineering geological thinkingand may reflect some fundamental problems with training and thesometimes-unhealthy compartmentalisation of geotechnics into rockmechanics and soil mechanics. This is not just a Korean problem. Asnoted in Chapter 4, in many situations sites are forgiving in that anincorrect model does not inevitably lead to disaster. The geotechnicalengineer proceeds in normal fashion, ignorant of the real geologicalconditions, but gets away with it. Unfortunately, this was one of thoseunforgiving sites in a seriously adverse geological situation and wherea superficial and rather poor approach to ground investigation andmodelling proved inadequate.
7.8.5 A series of delayed landslides on ChingCheung Road, Hong Kong
One section of Ching Cheung Road in Hong Kong has been the focusfor a series of large and unusual landslides since it was first built in1963 to 1967. Figure 4.6 shows the section of road and was usedearlier to illustrate the usefulness of aerial photographs at desk studystage.In 1972, two major landslides occurred on Ching Cheung Road.
The HK Government engaged consultants to study the two land-slides, partly because they were unusual in that both occurred on drydays. The smaller of the two landslides occurred four days after amajor rainstorm, the larger ten days after the rainstorm. The investiga-tion concentrated on a theoretical consideration of the infiltration andstorage characteristics of the ground, but no explanation could begiven for the delayed nature of the failures. The consultant designedthe slopes to be cut back, but during the remedial works it was notedthat one of the slopes was issuing water and that movements wereoccurring. A pragmatic solution was recommended to install a series ofraking drains, and this seems to have been effective in stopping themovements. The two slopes subsequently survived effectively for sev-eral years without any major event. In 1982, another major delayedfailure occurred on this section of the road, away from the area thathad been cut back with raking drains in the 1970s. As part of theinvestigation for that failure, the early photographs were found andinterpreted showing the pre-disposing poor condition of the hillside.The delayed nature of the failure was explained conceptually through adelayed rise in the main groundwater table (Hencher, 1983c; Hudson&Hencher, 1984).Following the 1983 failures, the section of Ching Cheung Road was
selected for investigation and upgrading, as necessary under theLandslide Preventive Measures (LPM) programme. Several boreholeswere put down, analysis conducted and a programme of cutting back
342 Practical Engineering Geology

and vegetating of the slopes instigated. In so doing, all the previouschannels leading from the series of raking drains, installed after the1972 failures, were stripped away as part of the change from hardcovering to a vegetated finish. In essence, the drains and their functionhad been forgotten about.In 1997, another large failure occurred essentially at the same loca-
tion as one shown in the 1940s photographs and one of the 1972failures. Photographs of the failure show raking drains hanging out ofthe slope (HAP, 1998). Post-failure investigations showed evidence ofextensive natural pipes that were almost certainly associated withprevious movements in the slope. Details are given in Hencher (2006).There are two systematic failings illustrated by this example. Firstly,
all of the subsequent failures might have been avoided by proper siteinvestigation prior to construction of the road. The photographsillustrating the predisposing factors were obviously available ingovernment but were not consulted, perhaps because API was notroutinely used for engineering projects in the 1960s. The second failingwas a management error in disregarding the previously successfulengineering works when designing the upgrading works, which prob-ablymade things worse rather than better andmay have contributed tothe 1997 landslide.
Unexpected ground conditions and how to avoid them 343

Appendix A: Training, institutions andsocieties
A.1 Training
Thanks are due to professional colleagues worldwide who kindlyfound the time to advise on current situations re training and profes-sional matters. Apologies for gaps in coverage – information on prac-tice elsewhere can probably be gained from contacting theinternational society secretariats (IAEG, ISRM, ISSMGE), details ofwhich are given later.
A.1.1 United Kingdom
Most engineering geologists from the UK begin their careers with anundergraduate degree in geology or some closely related subject, andthere is no real shortcut for gaining an adequate understanding ofgeological processes. Portsmouth University has for many yearsoffered a practical undergraduate course in engineering geology,which provides graduates with a suitable entry level of training forthe profession but inevitably some of the basic geology teaching has tobe omitted in such a course. Furthermore, as indicated in Table 1.1,there is considerably more fundamental geology to learn, even forgraduates whose undergraduate courses offer a much higher modularcontent in geology.Generally, the best way to gain the next level of knowledge is
through formal training via an MSc course but even after that it willtake some years of experience before the engineering geologistbecomes a person that can contribute fully to a geotechnical team.Geotechnical engineers would normally follow a similar career path,starting with a degree in civil engineering and then taking a specialistMSc course.ManyMSc engineering geology courses will fulfil the needfor specialist training for both geologists and civil engineers – but thecareer route for the MSc graduate will really follow from his initialtraining as a geologist or engineer. In the case of a geologist graduatingwith anMSc in engineering geology, he will still know that he is out ofhis depth if asked in his first year in employment to check the structural

design of a strutted excavation. Civil engineers who have proceeded totake an MSc in engineering geology are similarly unlikely to havegained enough knowledge of geological processes and relationshipsto identify realistic geological models, other than for simple situations.It is important that even an MSc-qualified individual follows a periodof training, and this is often arranged in a formal and structuredmanner by large consulting or contracting companies or by govern-ment departments. In the UK and several other countries such as HongKong, the aim of the individual is to become either a chartered geolo-gist (CGeol) through accreditation with the Geological Society ofLondon or to become a member of one of the institutions of engineer-ing and a chartered engineer (CEng). A chartered status indicates thatthe individual has gained adequate experience in various facets of theprofession. As stated earlier, many engineering geologists have careersin civil engineering and become skilled in geotechnical engineering(including design of structures) and should then aspire to becomingmembers of engineering institutions and to become chartered engi-neers. That can only be achieved through further study, possiblyformal exams in engineering subjects and/or extensive proven experi-ence. Further and continuing study (self taught, reading technical andscientific journals and attending lectures and seminars) is a formalrequirement of membership of most institutions. Some of the careerroutes are set out in Chapter 1, Table 1.3, and details of institutionsand learned societies, what they do and offer, and routes for member-ship are presented later.A UK Register of Ground Engineers (the term has been specifically
chosen in preference to geotechnical engineers) has recently beenestablished and includes engineering geologists. The scheme wasdrawn up by the ICE, the Geological Society (Engineering GeologyGroup) and IOM3 and administered by the ICE. The scheme is open tochartered members from the three professional bodies. Applicants arerequired to demonstrate their competence on six specific topics (inno-vation, technical solutions, integration, risk management, sustainabil-ity and management) and there are three levels of Registrant:Professional, Specialist, and Adviser. As at 2011, the scheme doesnot have any particular legal status. The emphasis is for applicants todemonstrate competence in the various areas.
A.1.2 Mainland Europe
In continental Europe, higher education is moving towards theUK model. Through the Bologna Declaration, most Europeancountries (including the UK) agreed that university systems anddegrees should have the same standards within the so-calledEuropean Higher Education Area. The background ofthe declaration is that it facilitates the employment and study of
Appendix A 345

European citizens in any European country, which is one of the maingoals of the European Union.Not every country has implemented the Declaration to the same
level, however. In the Netherlands, the first degree for an engineeringgeologist will now generally be a BSc in civil and geo-engineering,geology, geography or any other subject that has some relevanceto geotechnical engineering or engineering geology. Depending onany deficiencies in the first degree, additional subjects may be requiredto be studied before or during an MSc degree.The German university system has changed to a system comparable
to the Netherlands and UK with the introduction of a split system offirst and second degrees, so the situation for engineering geologyeducation is now broadly the same as in the UK and the Netherlands.Other EU countries are at various stages of implementing the BolognaDeclaration.The European Federation of Geologists has adopted a system of
multilateral recognition between affiliated national associations,which is incorporated in the professional title european geologist(EurGeol). As with CGeol status in the UK, the title EurGeol is opento all geologists, whether they work in government, academia orindustry, and therefore gives no indication of competence in engineeringgeology.
A.1.3 United States of America
As in the UK, engineering geologists from the United States generallystart off with an undergraduate degree in geology or geologicalengineering. Typically, most engineering geologists are initially trainedand educated in geology, primarily obtaining undergraduate degrees ingeology. A number of universities also offer Bachelor of Science (BS)degrees in geological engineering. These programme provide the stu-dent with a general background in fundamental geology and geophy-sics, and geological engineering design, including such subjects as soiland rock engineering, geological and geophysical exploration, geolo-gical hazard evaluation, groundwater hydrology, geographic informa-tion systems (GIS), hazardous waste management and environmentalscience. The undergraduate student choosing this field of study willlearn to apply geologic principles to engineering solutions related todesign of geotechnical/civil infrastructure such as tunnels, dams,bridges, excavations andwaste disposal sites but as with similar under-graduate degree courses in the UK, this is inevitably at some expenseregarding the depth of geology taught. The same applies to othersaspiring to become engineering geologists whose initial degree con-tains a relatively small amount of geological training (e.g. physicalgeographers and even many earth scientists whose geological modulesmay make up perhaps only 30% of the course). Such individuals
346 Appendix A

obviously have other skills and learning that will help them in theircareers but they will find that there is still a lot of geological topping-up to do as well as all the engineering during their early years inemployment (Box 1-1).In the USA, a minimum of aMaster of Science (MS) is now normally
required for persons seeking employment in geological or geotechnicalengineering fields. For most engineering geologists, the MS degreeprogramme includes studies in rock and soil mechanics, geotechnics,groundwater, hydrology, strengths and permeability of soil and rock,and civil engineering design. Once in employment, geological engi-neers are encouraged to obtain their professional engineering licence orregistration, particularly if working for a smaller consulting firm or areworking for a state agency. As at 2011, 31 states have GeologistLicensing Boards (California, Florida, Oregon and Washington toname a few). Typically, education requirements consist of graduationfrom an accredited college or university with a degree in geology,hydrogeology or engineering geology. To be licensed as a geologist,typically one must have at least five years (Oregon requires seven yearsunder direct supervision of a registered geologist) of documented andverifiable professional geological practice or, if applying for a specialtysuch as engineering geologist, three to five years of specialty practicethat is acceptable to the review board. In some states, an undergradu-ate degree and/or each year of graduate studymay count as one year ormore of experience. Geological research or teaching at college oruniversity level may be credited year for year if, in the opinion of theboard, it is comparable to experience from practice of geology or aspecialty. In most states, applicants must also pass a geologist and/orspecialty geologist examination.In the states of Oregon and California, the licensure title is Certified
Engineering Geologist, and in Washington State the title is LicensedEngineering Geologist. There are some states that have reciprocity(i.e. California Board for Geologists and Geophysicists and theWashington State Geologist Licensing Board agree to reciprocity).Applicants requesting license through reciprocity must, however,have certified proof from the state where they are licensed.
A.1.4 Canada
In Canada, engineering programmes must be accredited by theCanadianCouncil of Professional Engineers. Accreditation is normallyevaluated every six years by a visiting team, some of whom evaluatethe general programme and university environment. Students graduatewith the subject matter that is required for professional registration.Graduates may register as Engineers in Training, but require four yearsof experience, supervised by a Professional Engineer, before they canbecome Professional Engineers in their own right. They have to pass a
Appendix A 347

Professional Practice Exam, which covers engineering law and engi-neering ethics, before the P.Eng is conferred. The accreditation reviewis completed by a national organisation (the Canadian Council ofProfessional Engineers), but the Law and Ethics exams, as well as theevaluation of the applicant’s file are administered by the provincialorganisation (in Ontario, for example, the organisation is calledProfessional Engineers Ontario).Some Universities in Canada, which offer earth sciences, have put
together a package of courses that is expected to meet the courserequirements for registration as Professional Geologists. WhileGeoscientists Canada publishes national guidelines as to the coursesrequired, these are not binding, and programmes are not directlyaccredited. Rather, the experience and course review by each provin-cial organisation is completed for each individual applicant. Threeavailable electives are considered within the Professional Geologistdesignation: geology, geophysics and environmental geoscience. Eachapplicant must pass a Professional Practice and Ethics exam.In both cases (P.Eng and P.Geol), because registration is completed
on a provincial level, the geoscientist or geological engineer mustbecome registered in all of the provinces where they plan to work.Furthermore, in both cases, where an applicant is missing core courses,they must complete subject area exams to demonstrate their technicalproficiency in the subject.In summary, engineering geologists in Canada have a legal require-
ment to register as professional geoscientists in each province where-they wish to work but there is no specific professional qualificationfor engineering geologists. P.Eng applies specifically to engineers butengineering geologists with long experience in civil engineering canregister – i.e. hold both P.Geol and P.Eng qualifications.
A.1.5 China
China’s universities provide courses in both geology and engineeringgeology as first degrees. Some level of professional status as a geologistor engineering geologist is provided by membership of the GeologicalSociety of China (GSC). To become a member requires five yearsexperience after graduation or two years experience after completinga postgraduate MSc or MEng. Engineering geologists can becomemembers of the Engineering Geology Committee (EGC) (the ChinaNational Group of IAEG), which is a professional committee withinthe GSC. Engineering geologists’ status in the workplace is identifiedby positional title, a ranking system – junior to senior. This profes-sional ranking is reviewed and entitled by a committee called thepositional title audit panel, organised by local government, or withinsome big institutes/companies authorised by the government. Salariesand allowances are largely determined by this positional system.
348 Appendix A

Currently in China, there are professional qualifications of Regis-tered Civil Engineer, Registered Geotechnical Engineer, RegisteredStructural Engineer, Registered Mining Engineer, and so on, and it islikely that the role of Registered Geologist will be established andrecognised in China soon. Currently, some engineering geologists doachieve the status of Registered Geotechnical Engineer by takingprofessional examinations.
A.1.6 Hong Kong
Hong Kong, which is a Special Administrative Region (SAR) of China,has its own Institution of Engineers with an equivalent status to theInstitution of Civil Engineers in the UK. Engineering geologists, qua-lified as chartered engineers through one of the UK institutions canbecome members of HKIE through mutual recognition of societies, ormay become members through normal routes requiring graduationfrom a recognised course with adequate engineering input, or bytaking additional professional examinations. This initial step must befollowed by a period of additional training and professional experi-ence over a period of typically four or five years. After at least a year’srelevant professional practice in Hong Kong, members of HKIE canapply to becomeRegistered ProfessionalGeotechnical EngineersRPE(G).Many other geologists and engineering geologists in Hong Kongachieve chartered geologist (CGeol) status through the GeologicalSociety of London, and this requires the individual to follow a pre-scribed course of training and experience, as detailed below. As notedearlier, however, the qualification CGeol can be achieved by allgeologists who are members of the Geological Society of London anddoes not in itself indicate knowledge or experience of engineeringpractice.
A.2 Institutions
A.2.1 Introduction
There are a number of professional institutions in the UK that governprofessional practice, to some degree, by setting out training routesand requirements for their members, thereby setting standards.Membership is conferred and recognised by letters that can beappended to the member’s name, as in MICE (Member of theInstitution of Civil Engineers). Most institutions also act as learnedsocieties, publishing journals, books and offering their support toconferences and meetings. Similar bodies exist in different countriesaround the world and offer reciprocal recognition of qualifications,allowing a member from one country to practice professionally
Appendix A 349

in another. All the UK institutions are open to foreign members, andthere are well-established regional groups in different countries (andthroughout the UK).For geologists, in the UK, direct membership is possible to the
Institution of Geologists, which has its home within the GeologicalSociety of London. Through the Institution of Geologists, one canbecome a chartered geologist (CGeol). Other institutions that theengineering geologist might wish to join because of their impor-tance to the industry are the Institution of Civil Engineers and theInstitution of Mining, Metallurgy and Minerals (which isobviously more attuned to mining and the extractive industries).Through both of these institutions, a suitably trained and experi-enced engineering geologist can become a chartered engineer(CEng) – a title conferred by the Engineering Council and whichapplies to many types of engineers – e.g. mechanical, aeronauticalor structural.
A.2.2 The Institution of Geologists (IG)
The IG provides a process for the professional validation of geologists,mostly but not exclusively in the UK, a system of regional groups,external relations with government, industry and other professionalbodies. It is a founder member of the European Federation ofGeologists. It publishesTheGeologist’s Directory, which lists members.The title chartered geologist (CGeol) is awarded to suitable geolo-
gical graduates with a period of training and experience on a par withthat required of engineers to become chartered engineers (CEng). It isopen to all geologists.Candidates must, via a professional report, supporting documenta-
tion and through a professional interview, prove their competenceagainst each of the following criteria:
1. Understanding of the complexities of geology and of geologicalprocesses in space and time in relation to their speciality.
2. Critical evaluation of geoscience information to generate predictivemodels.
3. Effective communication in writing and orally.4. Competence in the management of Health and Safety and
Environmental issues, and in the observance of all other statutoryobligations applicable to their discipline or area of work.
5. Clear understanding of the meaning and needs of professionalismincluding a clear understanding of the Code of Conduct andcommitment to its implementation.
6. Commitment to continuing professional development throughouttheir professional career.
7. Competence in their area of expertise.
350 Appendix A

Usually, the training period prior to successful application is severalyears. Large companies and government organisations might well runin-house training schemes under a nominated supervisor, whichencourages the junior geologist to get the range of experience heneeds. Further details can be found from the Geological Society webpage http://www.geolsoc.org.uk.
A.2.3 The Institution of Civil Engineers (ICE)
The Institution of Civil Engineers is primarily the governing body forpractising graduate civil engineers in the UK but other disciplines,including engineering geologists, can join if they can demonstratesufficient engineering in their education, take additional professionalexams and/or have a proven track record of experience. The usualroute is first degree followed by a period of training to meet a range ofachievements, usually to by signed off by an engineering supervisorwithin the employing company. After the period of training, the can-didate will apply and need to demonstrate his competence in a profes-sional interview. There are two main grades that an engineeringgeologist might aim for:
A.2.3.1 Member
Membership of the Institution of Civil Engineers (MICE) can beawarded to a wide range of engineers practising in the broad area ofcivil engineering
A.2.3.2 Fellow
Fellow is the highest grade of membership of the Institution and maybe awarded to those engaged in a position of responsibility in thepromotion, planning, design, construction, maintenance ormanagementof important engineering work.Chartered engineer (CEng) status can be awarded by the ICE or
other engineering institutions. Applicants must be able to demonstratetheir professional engineering experience and managerial skills. Theymust have practical knowledge and understanding of the engineeringprinciples relevant to the disciplines of the Institute. They must alsodemonstrate the use of such knowledge to contribute to the design,manufacture, maintenance, testing and safety of components, devicesand structures, or the control of process plant. Details of theEngineering Council that administers the scheme can be found at:http://www.engc.org.uk/Full details of the ICE, benefits and membership requirements are
given at: http://www.ice.org.uk/Membership.
Appendix A 351

A.2.4 Institution of Materials, Minerals andMining(IOM3)
As for ICE, there are two main grades that would interest engineeringgeologists: Professional Member and Fellow. As for ICE, Membersand Fellows can become chartered engineers (CEng) if suitably quali-fied.Other grades are for those with appropriate technical qualificationsand experience.The IOM3 can be contacted at http://www.iom3.org.
A.2.5 Other countries
Many other countries have their own institutions that govern practice,maintain standards and act as learned societies in the same way as UKinstitutions; many, such as the American Society of Civil Engineers(ASCE) are open to foreign membership.
A.3 Learned societies
A.3.1 Introduction
Membership of professional institutions provides some certificationthat the member is competent to practice in a particular field and thathe follows some code of conduct in his professional activities.Engineering geologists might also find benefit from joining varioussocieties, most of which produce journals, newsletters and organisemeetings for their members. The societies sometimes take it uponthemselves to provide advice on practice, although generally this hasno legal status and, historically, different societies have offered differentadvice on the same subject, which can be somewhat confusing.The following is a list of those societies that might be of particular
interest to an engineering geologist. Several are really UK-focused butsimilar groups can be found worldwide and often are very active andgood fun, organising social events as well as dealing with local prac-tice. Over recent years, the IAEG, ISRM and ISSMGE, which areinternational in nature, have forged better links between themselveswith joint commissions looking at different aspects of good practiceand research, which may go some way to avoiding the overlaps (andblinkered approaches) between the concepts of engineering soil androck, as addressed in Chapter 1.
A.3.2 Geological Society of London
TheGeological Society of London (also known asTheGeological Societyor Geol. Soc.) is a learned society, based in the UK, with the declared aimof ‘investigating the mineral structure of the Earth’. It is the oldestnational geological society in the world and the largest in Europe, with
352 Appendix A

over 9,000 Fellows entitled to the title FGS (Fellow of the GeologicalSociety) – over 2,000 of whom are also chartered geologists (CGeol).Membership is open to any geology graduates (greater than 25% earthscience subjects) but also to other graduates who are particularly inter-ested in geology or where they work in a profession where geology is acore subject. FGS is therefore open to most geotechnical engineers whoare particularly interested in geology. The Geol. Soc. produces theQuarterly Journal of Engineering Geology and Hydrogeology.
A.3.3 International Association for EngineeringGeology and the Environment
The International Association for Engineering Geology and theEnvironment (IAEG) was founded in 1964.According to http://www.iaeg, the aims of the International
Association for Engineering Geology and the Environment are:
� to promote and encourage the advancement of engineeringgeology through technological activities and research
� to improve teaching and training in engineering geology, and� to collect, evaluate and disseminate the results of engineering
geological activities on a worldwide basis.
A journal, The Bulletin of Engineering Geology and the Environment,is produced, and the IAEG runs regular conferences and organisescommissions with the aim of improving practice.
A.3.4 British Geotechnical Association (BGA)
According to its website: http://bga.city.ac.uk the British GeotechnicalAssociation (BGA) is the principal association for geotechnical engi-neers in the United Kingdom. It performs the role of the ICE GroundBoard, as well as being the UKmember of the International Society forSoil Mechanics & Geotechnical Engineering (ISSMGE) and theInternational Society for Rock Mechanics (ISRM).The BGAorganises renowned events like the annual Rankine Lecture,
as well as supporting young engineers and professional and technicalinitiatives throughout the field of geotechnics. Membership includes acopyof themonthlymagazineGroundEngineering, which generally hasa practical bias with articles on topical subjects and case studies.
A.3.5 Association of Geotechnical andGeoenvironmental Specialists
The Association of Geotechnical and Geoenvironmental Specialists(AGS) is a non-profit-making trade association established to improve
Appendix A 353

the profile and quality of geotechnical and geoenvironmentalengineering. Information can be found at http://www.ags.org.uk.The membership comprises UK organisations and individuals havinga common interest in the business of site investigation, geotechnics,geoenvironmental engineering, engineering geology, geochemistry,hydrogeology and other related disciplines. The AGS is also active inHong Kong.The AGS produces guidelines on what it considers good prac-
tice and organises meetings. It has played a particularly impor-tant role in defining ways for transfer of geotechnical dataelectronically.
A.3.6 International Society for Rock Mechanics
As noted above, the ISRM and sister society ISSFGE in the UK aretaken under the wing of the British Geotechnical Association, which is,in turn, provided support by the ICE.The following is taken from the ISRM webpage: http://www.isrmThe International Society for Rock Mechanics (ISRM) is a non-
profit scientific association supported by the fees of the members andgrants that do not impair its free action. The Society has 5,000 mem-bers and 46 national groups. The field of rock mechanics is taken toinclude all studies relative to the physical and mechanical behaviour ofrocks and rock masses and the applications of this knowledge forthe better understanding of geological processes and in the fields ofengineering (ISRM Statutes).The main objectives and purposes of the Society are:
� to encourage international collaboration and exchange of ideasand information between rock mechanics practitioners;
� to encourage teaching, research and advancement of knowledge inrock mechanics;
� to promote high standards of professional practice among rockengineers so that civil, mining and petroleum engineering worksmight be safer, more economic and less disruptive to theenvironment.
The ISRM holds rock mechanics congresses every four years and alsosponsors and supports other conferences internationally.
A.3.7 International Society for Soil Mechanics andGeotechnical Engineering
The aim of the ISSMGE is the promotion of international co-operationamongst engineers and scientists for the advancement and
354 Appendix A

dissemination of knowledge in the field of geotechnics, and its engi-neering and environmental applications (which of course overlapswith other societies).Like the ISRM and IAEG, it produces a regular newsletter and
organises congresses and supports other conferences.Its webpage is at: http://www.issmge.org
Appendix A 355

Appendix B: Conversion factors (to 2decimal places) and some definitions
To convert from To Multiply by
LENGTH
inches millimetres 25.4
feet metres 0.30
metres feet 3.28
kilometres miles 0.62
miles kilometres 1.61
AREA
square metres square feet 10.76
square feet square metres 9.29 × 10⁻²
VOLUME
cubic metres cubic feet 35.31
cubic feet cubic metres 0.02
litres cubic metres 0.001m3
cubic metres litres 1,000
gallons (UK) litres 4.55
litres gallons (UK) 0.22
cubic metres gallons (US) 264.17
cubic metres gallons (UK) 219.97
Key volumetric parameters in soil mechanics are porosity, void ratio and specific volume.Thethreekeycomponents insoilofaparticularvolume(V)arethevolumeofsolids(Vs) (i.e.mineralgrains),
volume of voids between the solid particles (Vv) and the volume of water (Vw) within the voids.V =Vs +Vv.POROSITY (n %) = Vv/V, i.e. the volume of voids as a percentage of the total volume of soil.Someworkers prefer touse the closely relatedVOIDRATIO (e) =Vv/Vs. Conceptually, they are essentially
the same – as the soil is compressed the void volume decreases and the porosity and void ratio also decrease.Incriticalstatesoilmechanics,workerssometimesusethetermSPECIFICVOLUME,whichisdefinedas1+e.Degree of saturation is the ratio of water volume to total voids. So SATURATION (Sr) = Vw/Vv
expressed as a percentage. If all the voids are full of water, Sr is 100%.WATERCONTENT is ratio of mass of water to mass of solid particles (Mw/Ms) so will vary according
to the specific gravity of the mineral grains, all other things being the same. These and other basicdefinitions are clearly set out in most soil mechanics textbooks (e.g. Craig, 1992).

To convert from To Multiply by
FORCE
pounds kilograms 0.45
tons (metric) 4.53 × 10⁻⁴
newtons 4.44
tons (metric) kilograms 1,000
pounds 2204.62
kilonewtons 9.80
kilonewtons pounds 224.81
tons (metric) 0.10
kilograms 101.97
STRESS or PRESSURE
pounds/square foot kilonewtons/square metre 0.04
pounds/square inch kilonewtons/square metre 6.89
kilograms/square centimetre pounds/square inch 14.22
kilonewtons/square metre 98.06
tons (metric)/square metre kilograms/square centimetre 0.10
kilonewtons/square metre 9.80
kilonewtons/square metre pounds/square foot 20.88
kilograms/square centimetre 0.01
tons (metric)/square metre 0.10
1 bar = 100 kPa = 0.1 MPa
The fundamental unit of FORCE in the metric system is the newton (N), which is roughly the weight(mass × gravitational acceleration) of an apple. A kilogram would comprise about 10 apples and weigh10 N (actually 9.81 N but usually rounded to 10, which is within the accuracy of most geotechnicalanalyses). In the USA, Imperial units (feet, inches) are generally used for civil engineering works and theunit of weight is the pound.
STRESS: A 10m high column of granite of one square metre in plan would weigh 270kN and exert avertical pressure or TOTAL STRESS on its base of 270kN/m2. If the column of granite was submerged inwater, its weight would be buoyant (Archimedes principle) and the EFFECTIVE STRESS at the base of thecolumn of granite would be (270–100)kN/m2 (the stress at 10m depth of water), i.e. 170kN/m2. One kN/m2
is often referred to as 1 kilopascal (1kPa) and 1,000kN/m2 expressed as 1MN/m2 or 1 megapascal (MPa).Disregarding buoyancy, 1 MPa is the anticipated vertical stress at a depth of about 40m in rock.
In tunnelling, the term BAR is often used for water pressure or in compressed air environments (used tosupport the tunnel face and stop water inflow). One bar is 100kPa, i.e. the water pressure at a depth ofabout 10m.
Appendix B 357

To convert from To Multiply by
UNIT WEIGHTtons (metric)/cubic metre grams/cubic centimetre 1.00
megagrams/cubic metre 1.00pounds/cubic foot 62.42
pounds/cubic foot tons(metric)/cubic metre 0.01kilonewtons/cubic metre 1.57 × 10⁻¹
kilonewtons/cubic metre tons (metric)/cubic metre 0.10pounds/cubic foot 6.36
A cubic metre of water weighs about 10,000N = 10 kilonewtons = 10 kN. By comparison, a cubic metreof granite weighs about 27 kN because the SPECIFICGRAVITY of quartz, one of themain componentsof granite, is 2.69, i.e. it weighs 2.69 times the weight of the same volume of water. The UNITWEIGHTis WEIGHT/UNIT VOLUME. The UNIT WEIGHT, γR, of granite is 27 kN/m3 and for water γW = 10kN/m3. The unit weight of soil γS is lower than that of granite and typically between 12 and 18 kN/m3.This is because, whilst the minerals in soil usually have similar specific gravities to the minerals ingranite, soil has many voids filled either with air or water.
Instead of ‘weight’ we often use the term DENSITY, which is MASS/VOLUME and usually expressedin Mg/m3. DRY DENSITY – the mass of the dry sample divided by volume – is an easy index test tomeasure in the laboratory and often correlates quite well with degree of weathering or consolidation of arock or soil. BULK DENSITY is the mass of natural soil (with contained moisture) per unit volume.RELATIVE DENSITY is a term used to describe the relative compaction of soil compared to its densestcondition achievable naturally or by compaction. The terms used are:
For natural granular materials (mostly sands), the same terms are used, correlated to SPT ‘N’ values, asdescribed in Chapter 4.
Relative density (%) Term
0–15 Very loose15–35 Loose35–65 Medium65–85 Dense85–100 Very dense
358 Appendix B

Appendix C: Soil and rock terminology fordescription and classification forengineering purposes
C.1 Warning
It would be very nice to set out here a guide to soil and rock descriptionthat could be applied worldwide. Unfortunately, that is not possible –different countries and different international societies have their ownterminologies and things are getting worse – not better. In this appen-dix, I try to set out what is common practice or at least widely used.Where this is not possible, I set out some of the disagreements and insome instances argue the case.Engineering geologists and geotechnical engineers, working in any
country, need to comply with local regulations, and this will oftenapply to standards for soil and rock description. This can be difficultand many will feel uncomfortable at using strange and perhaps poorlydefined terms. One option, sometimes, is to avoid the use of classifica-tions and to give actual data instead.Wemight disagree internationallyover what ‘strong’ or ‘highly weathered’ rock means but UCS = 45MPais clear and ametre is a metre everywhere. That said, there are differenttesting methods and different capabilities re testing so even ‘absolute’numbers must be treated with some caution.
C.2 Introduction and history
Standardisation of soil and rock description has been an aspiration ofmany individuals and working groups over the last 50 years. A briefreview is given below.Much of the soil description and classification terminology has been
fairly standardised since the days of Terzhagi and Casagrande (1948).Deere (1968) made various proposals re rock strength classificationand discontinuity spacing and introduced the Rock QualityDesignation (RQD), and much of the terminology he recommendedcontinues to be used in some parts of the world, not least the USA(Hunt, 2005). One of the earliest attempts to provide fairly compre-hensive guidance for logging rotary core through rock was theGeological Society Engineering Group Working Party Report (Anon,1970). That report and another on maps and plans (Anon, 1972) setmany standards that were then followed, particularly in the

UK. Unfortunately, conflicting use of terms was already a feature,especially regarding rock strength, as illustrated later. Other bodies(ISRM and IAEG in particular) were meantime setting up their ownworking groups and coming up with sets of terms to describe rockfeatures that were in conflict with those suggested by others. The ISRMpublication on Suggested Methods for the Quantitative Description ofDiscontinuities (ISRM, 1978) is a particularly well-illustrated anduseful guide, but some of the terminology is its own.This was followed in the UK by the preparation of fuller guidance on
the description and classification of both soil and rock in the BS 5930:1981 Code of Practice for Site Investigations. Following its publica-tion, a conference was held to review the BS and papers and discussionwere published as Geological Society Engineering Geology SpecialPublication No. 2 (Hawkins, 1986). The Geotechnical ControlOffice (1988) published Geoguide 3 on Soil and Rock Descriptions,which largely followed British practice but with some distinct differ-ences, especially regarding the description and classification of weath-ered rock, which is of particular importance to Hong Kong.BS 5930 was revised and republished in 1999 and is a better docu-
ment. Most recently, amendments have been made as part of theintroduction of the Eurocode, and some of the changes are not neces-sarily improvements, as discussed by Hencher (2008). Meanwhile,other countries have adopted their own schemes (e.g. Australia, NewZealand and China) and whilst there are common aspects, often thesame terms (and certainly the same properties) are redefined in differ-ent ways, which is confusing to say the least. In China, there arecurrently separate standards for site investigation for different indus-tries: transportation, railway, houses and buildings, oil and gas,mining, hydro-electricity, geological survey and for exploration. USpractice is illustrated by Hunt (2005) and CALTRANS (2010).
C.3 Systematic description
Systematic description is generally applicable to ground investigation –logging boreholes and exposures. Descriptions should be thoroughand unambiguous so that the end user, perhaps in a design office,will know what has been observed on site. The scope and style ofroutine description of soil and rock for engineering purposes in loggingare well established. Examples are presented in Appendix D and serveto illustrate the differences in practice internationally.
C.3.1 Order of description
No preferred order is given in EN ISO 14688 (BSI, 2002) or 14689 (BSI,2003) so, for the UK, the BS 5939 recommendations should be adoptedin logging. This is largely to encourage the logger to consider all aspects.
360 Appendix C

C.3.1.1 Soil
BS 5930:1999 states that soils should be described in the followingorder:
A) Mass characteristics
1. density/compactness/field strength2. discontinuities3. bedding
B) Material characteristics
1. colour2. composite soil types: particle grading and composition; shape
and size3. principal soil type (name in capitals, e.g. SAND), based on
grading and plasticity4. shape
C) Stratum name: geological formation, age and type of deposit;classification (optional)
Examples presented in BS 5930 are:
Firm, closely-fissured, yellowish-brown CLAY (LONDON CLAYFORMATION).
Loose, brown, sub-angular, fine and medium flint GRAVEL(TERRACE GRAVELS).
It is advised that materials in interstratified beds may be described asfollows:
Thinly interbedded dense yellow fine SAND and soft grey CLAY(ALLUVIUM).
and that any additional information or minor details should be placedat the end of the main description after a full stop, in order to keep thestandard main description concise.
C.3.1.2 Rock
For rock, the BS recommended order is as follows
A) Material characteristics
1. strength2. structure3. colour4. texture
Appendix C 361

5. grain size6. rock name (in capitals, e.g. GRANITE)
B) General information
1. additional information and minor constituents2. geological formation
C) Mass characteristics
1. state of weathering2. discontinuities
BS 5930 (BSI, 1999) should be consulted for all terms and definitionsas used in British practice. A detailed commentary is given by Norbury(2010). Other countries have their own terms and practice guidance, sothe engineering geologist needs to be aware of local usage wherever heis working.
C.4 Soil description
Tables C1 and C2 set out common terminology to be adopted forsoil description and Table C3 presents common terminology fordescribing the strength and compactness of detrital sediments.Such terms and index tests may not be appropriate or adequatefor describing and classifying soil-like materials derived by in situweathering.
C.5 Rock description and classification
For rock, key issues are intact rock strength, nature of discontinuities,weathering and rock mass classification.
C.5.1 Strength
Intact strength of rock material is very different from massstrength, as addressed in Chapter 5, and usually to a greaterdegree than for soils, albeit that soil also contains joints, shearplanes and general fissures and fractures that influence massbehaviour.Strength can be estimated quite readily in absolute terms (MPa)
by simply hitting it with a hammer or trying to break it by handand quite often no further testing will be required (see Box 5-1).Despite this, the geotechnical community has been inconsistent in itsterminology for 50 years. Some of the definitions used worldwide
362 Appendix C

are presented in Tables C4 and C5 and the potential for confusion isobvious. The engineering geologist must be cautious, especially whereusing an empirical guideline, say for allowable bearing pressure orrippability of rock based on intact rock strength (e.g. Table 6.1). Referto the actual UCS in MPa and not the descriptive term that couldmean different things, depending on who has logged the sample andin which country.
Table C1 Basic soil types – based on GCO (1988) but generally compatible with much internationalpractice.
SOIL TYPE PARTICLE SIZE (mm) IDENTIFICATION
BOULDERS – >200 Only seen complete in pits or exposures.
COBBLES – 60–200 Often difficult to recover by drilling.
GRAVEL
Coarse 20–60
Visible to naked eye; little or no cohesion but wherecemented should state so; particle shape and gradingcan be described.Well-graded means wide range of grain sizes.Poorly graded is the opposite.Can use the terms uniform or gap-graded asappropriate.
Medium 6–20
Fine 2–6
SAND
Coarse 0.6–2
Medium 0.2–0.6
Fine 0.06–0.2
SILT
Coarse
Medium
Fine
0.02–0.06
0.006–0.2
0.002–0.006
Coarse silt is barely visible to naked eye – easilyseen with hand lens; exhibits little plasticity (can’troll into a cohesive sausage) and marked dilatancy(when wet and squeezed, it increases in volume sothat water will disappear); slightly granular or silkyto the touch. Disintegrates in water; lumps dryquickly; may possess cohesion but can be powderedbetween fingers. Silt is often detrital quartz (not clayminerals).
CLAY
– <0.002 Dry lumps can be broken by hand but notpowdered between the fingers. Disintegrates inwater more slowly than silt; smooth to the touch;exhibits plasticity but no dilatancy; sticks to thefingers and dries slowly; shrinks appreciably ondrying, usually showing cracks. These propertiesmore noticeable with increasing plasticity. Quartz ofclay size (often glacial rock flour) has very differentproperties than true clay minerals.
ORGANICCLAY, SILTOR SAND
– varies Contains much organic vegetable matter; often hasa noticeable smell and changes to different coloursbecause of oxidation (red/yellow) or reducingenvironment (green/blue/black).
PEAT – varies Predominantly plant remains; usually dark brown orblack in colour; often with distinctive smell; low bulkdensity.
Appendix C 363

Table C2 Dealing with composite soil types – based on GCO (1988) but generally compatible withmuch international practice.
PRINCIPAL SOIL TYPE TERMINOLOGYSEQUENCE
TERM FORSECONDARYCONSTITUENT
% OF SECONDARYCONSTITUENT
Verycoarse (BOULDERS& COBBLES)(>50% of soil >60mm)
Secondary constituents(finer material)after principal1
With a little <5
With some 5–20
With much 20–50
Coarse (GRAVEL &SAND) (>65 % gravel &sand sizes)
Secondary constituentsbefore principal(excluding cobbles &boulders)
Slightly (silty,clayey or silty/clayey)2
<5
Silty, clayey orsilty/clayey
5–15
Very (silty, clayeyor silty/clayey)
15–35
AND/OR
Slightly (gravellyor sandy)
<5
Gravelly or sandy 5–20
Very (gravellyor sandy)
20–50
Fine (SILTS & CLAYS)(>35% silt & clay sizes)
Secondary constituentsbefore principal(excluding cobbles &boulders)3
Slightly (gravellyor sandy or both)
<35
(gravelly orsandy)
35–65
Examples: slightly silty/clayey, sandy GRAVEL. Slightly gravelly, sandy SILT. Very gravellySAND. Sandy GRAVEL with occasional boulders. BOULDERS with much finer material (silty/clayey,very sandy gravel).
For fine soils, plasticity terms should also be described where possible, viz: ‘non-plastic’ (generally silts),‘intermediate plasticity’ (lean clays), ‘high plasticity’ (fat clays).
Notes:1 Full name of finer materials should be given (see examples).2 Secondary soil type as appropriate; use ‘silty/clayey’ when a distinction cannot be made betweenthe two.3 If cobbles or boulders are also present in a coarse or fine soil, this can be indicated by using one of thefollowing terms relating to the very coarse fraction after the principal: ‘with occasional’ (<5), ‘with some’(5–20), ‘with many’ (20–50), where figures in brackets are % very coarse material expressed as a fractionof the whole soil (see examples).

C.5.2 Joints and discontinuities
Joints, faults and fractures are ofmajor importance to rock engineeringand yet are rather poorly defined.Norbury (2010) states that:
Discontinuities are synonymous with fractures – mechanical breakswhich intersect the soil or rock.
Joints are breaks in the continuity of a body of rock along which therehas been no visible displacement.
Fissures are exactly the same as joints but the term is reserved for soil.
Incipient fractures are natural fractures which retain some tensilestrength and so may not be readily apparent on visual inspection.
This largely tallies with ISRM (1978).
Table C3 Guide to soil strength terminology – based on GCO (1988) but generally compatible withmuch international practice.
SOIL TYPE TERM IDENTIFICATION
Very Coarse(COBBLES &BOULDERS)
Loose
DenseBy inspection of voids and particles packing in the field
Coarse(SAND & GRAVEL)
Very loose SPT ‘N’ value 0–4.
Loose ‘N’ value 4–10; can be excavated with spade, 50mm peg easilydriven.
Mediumdense
SPT 10–30.
Dense ‘N’ value 30–50, requires pick for excavation; 50mm peghard to drive.
Very dense ‘N’ value >50.
Fine(CLAY & SILT)
Very soft Undrained shear strength (Su) <20 kPa; exudesbetween fingers when squeezed in hand.
Soft Su 20–40 kPa; moulded by light finger pressure.
Firm Su 40–75 kPa; can be moulded by strong finger pressure.
Stiff Su 75–150 kPa; cannot be moulded by fingers; can be indentedby thumb.
Very stiffor hard
Su >150 kPa; can be indented by thumbnail.
Organic(ORGANIC CLAY,SILT SAND & PEAT)
CompactSpongyPlastic
Fibres already compressed together.Very compressible and open structure.Can be moulded in hand and smears fingers.
Appendix C 365

Table C4 Intact rock strength.
The left-hand column classification is used in several textbooks and standards for foundation design(e.g., BS 8004, 1986; Tomlinson, 2001). The changes in the amended BS 5930 (right-hand column)are inconsistent; note in particular the very different definitions of the termweak. Caremust be takenwhen interpreting boreholes to check the governing standard at the time of the works. Other termsare used in different standards in different countries (Table C5).
BS 5930: 1999; GCO (1988) BS EN ISO 14689-1:2003; ISRM (1981);amended BS 5930: 1999 (2010)
Term &UCS(MPa)
Identification Identification Term &UCS(MPa)
Extremelyweak <0.5
Easily crumbled by hand; indenteddeeply by thumbnail.
Indented by thumbnail.Extremelyweak <1.0Very weak
0.5–1.25
Crumbled with difficulty;scratched easily by thumbnail;peeled easily by pocket knife.
Weak1.25–5
Broken into pieces by hand;scratched by thumbnail; peeled bypocket knife; deep indentations (to5mm) by point of geological pick;hand-held specimen easily brokenby single light hammer blow.
Crumbles under firm blows withpoint of geological hammer, canbe peeled with pocket knife.
Very weak1–5
Moderatelyweak5–12.5
Broken with difficulty in twohands; scratched with difficulty bythumbnail; difficult to peel buteasily scratched by pocket knife;shallow indentations easily madeby point of pick; hand-heldspecimen usually broken by singlelight hammer blow. Point loadstrength (PLS) 0.2–0.5 MPa.
Can be peeled by a pocket knifewith difficulty, shallowindentations made by a firmblow of geological hammer.
Weak5–25
Moderatelystrong12.5–50
Scratched by pocket knife;shallow indentations made byfirm blow with point of pick;hand-held specimen usuallybroken by single firmhammer blow. Point loadstrength (PLS) 0.5–2 MPa.
Cannot be scraped or peeled witha pocket knife, specimen can befractured with single firm blow ofgeological hammer.
Mediumstrong25–50
Strong50–100
Firmblowswith point of pick causeonly superficial surface damage;hand-held specimen requires morethan one firm hammer blow tobreak. PLS 2–4MPa.
Specimen requires more than oneblow of geological hammer tofracture it.
Strong50–100
Very strong100–200
Many hammer blows required tobreak specimen. PLS 4–8 MPa.
Specimen requires many blows ofgeological hammer to fracture it.
Verystrong100–250
Extremelystrong >200
Specimen only chipped byhammer blows. PLS > 8 MPa.
Specimen can only be chippedwith geological hammer.
Extremelystrong>250

BS EN ISO 14689-1:2003 does not say what a joint is but definesdiscontinuity:
Discontinuity: surface which breaks the rock material continuity withinthe rock mass and that is open or may become open under the stressapplied by the engineering work; the tensile or shear strength across oralong the surface is lower than that of the intact rock material.
Australian Standard AS1726
Strength Is (50) (MPa)
Extremely low Generally N/A
Very low <0.1
Low 0.1–0.3
Medium 0.3–1
High 1–3
Very high 3–10
Extremely high >10
China National Standard (2009)
Strength UCS (MPa)
Extremely soft <5
Soft 5–15
Moderately4 soft 15–30
Moderately hard 30–60
Hard >60
4 Term used in Chinese code (original translation) is ‘secondly’ rather than ‘moderately’.
Table C5 Examples of other standard terminology in use for intact rock strength.
New Zealand Geotechnical Society (2005)
Strength UCS MPa Is (50) (MPa)
Extremely weak <1.0
<1Very weak 1–5
Weak 5–20
Medium strong 20–50 1–2
Strong 50–100 2–5
Very strong 100–250 5–10
Extremely strong >250 >10
Appendix C 367

In other words, whereas a discontinuity, as defined by Norbury andlSRM, is a mechanical fracture, the European standard broadens thisto include incipient fabric (such as cleavage or bedding planes) thatmight open up under stress. The implication is that a feature might bedescribed as a discontinuity in some logs but not in others.
C.5.3 Discussion
The distinctions might appear trivial but where it matters is whencharacterising the rock mass. Rock mass classifications discussedlater mostly incorporate discontinuity or joint spacing as a fundamen-tal parameter. Rock Quality Designation (RQD) is a measure in bore-holes of the proportion of pieces of ‘sound’ core more than 100mm inlength between discontinuities in the sense of mechanical fractures(natural and not drill-induced). If one were to include incipient fabricsuch as intact bedding and schistosity, then the whole measure of RQDwould be changed and this has knock-on effects for rock mass classi-fications systems such as Q and RMR.It is best to follow the Norbury/ISRM definition that a discontinuity
is a mechanical break (and this should be used in RQD). Other fabricsthat retain tensile strength (including bedding and cleavage) should bedescribed as incipient and not counted in RQD. Incipient discontinu-ities should be logged and characterised as high tensile strength (closeto that of intact rock), intermediate or low (readily split). Geologically,however, incipient fabric such as cleavage, where it has little effect onintact strength, would be called faint, as in faintly defined cleavage.Geometrical description and measurement of discontinuities is cov-
ered in the ISRM guidelines.
C.5.4 Weathering
As discussed in Chapter 3, many rocks are weathered to great depths,especially in tropical and sub-tropical areas of the world. Weatheringeffects should be described and recorded and may be interpreteddirectly from changes in colour, discontinuity spacing, infill onjoints and intact strength. In some circumstances, weathering classifi-cations are useful to characterise rock at the scale of an intact, uni-form sample or at the mass scale. The classification provides ashorthand description, which is often treated synonymously withmass strength.Unfortunately, there are many different classifications, some of
which use the same terminology to describe different conditions andprofiles; others describe the same phenomena and profiles using dif-ferent terms, all of which is very confusing (Martin & Hencher, 1986;Hencher 2008).
368 Appendix C

C.5.4.1. Material weathering classifications
Having used weathering classifications a great deal in practice, theauthor is convinced that material classifications such as that used inHong Kong and presented in Table C6 are the most useful for dealingwith rock that weathers from a strong condition progressively to a soilso that thick profiles of saprolite are sometimes found. It has been usedfor logging many tropically weathered igneous and sedimentary rocks,even in temperate climates, and is essentially a strength rating.The Australian standard weathering scheme is presented in Table
C7 and is essentially the same as that in Table C6 except that differentterminology is used and distinctly weathered (DW) includes a verywide range of strengths (including grades III and IV from Table C6). In
Table C6 Material classification: Geoguide 3 (GCO, 1988).
This classification from GCO (1988) is applicable to uniform samples of weathered igneous andvolcanic rocks and other rocks of equivalent strength in fresh state. It is broadly compatible withrecommendations of Anon (1995), BS5930: 1999 and used in other standards such as CP4 (2003) inSingapore. It has stood the test of time (from Moye, 1955) as a useful tool in logging core anddescribing thick weathered profiles. The classification should be supplemented by other descriptiveterms, and it is often helpful to qualify with index tests such as Schmidt hammer readings onexposures (not applicable for core logging).
DECOMPOSITIONTERM GRADE SYMBOL TYPICAL CHARACTERISTICS
RESIDUAL SOIL VI Original rock texture completely destroyed; can becrumbled by hand and finger pressure into constituentgrains.
COMPLETELYDECOMPOSED
V Original rock texture preserved; can be crumbled byhand and finger pressure into constituent grains; easilyindented by point of geological pick; slakes1 in water;completely discoloured compared with fresh rock.
HIGHLYDECOMPOSED
IV Can be broken by hand into smaller pieces; makes adull soundwhen struck by hammer; not easily indentedby point of pick; does not slake in water; completelydiscoloured compared with fresh rock.
MODERATELYDECOMPOSED
III Cannot usually be broken by hand; easily broken byhammer; makes a dull or slight ringing sound whenstruck by hammer; completely stained throughout.
SLIGHTLYDECOMPOSED
II Not broken easily by hammer; makes a ringing soundwhen struck by hammer; fresh rock colours generallyretained but stained near joint surfaces.
FRESH ROCK I Not broken easily by hammer; makes a ringing soundwhen struck by hammer; no visible signs ofdecomposition (i.e. no discolouration).
Notes:1A sample placed in a container of water will lose strength and become a slurry. The rapidity and ease of slakingcan be used as a qualifying index test at site.
Appendix C 369

practice, the boundary between grades III and IV is often taken asdistinguishing between rock-like and soil-like behaviour for slopeanalysis, is readily identifiable, and is often used in specifyingtarget depths for piling, so the advantage of grouping themtogether is not obvious. The Australian and Hong Kong exampleborehole logs presented in Appendix D illustrate the use of mate-rial weathering grades in practice. Larger-scale mass exposures,such as those with corestone development, can be described withreference to the distribution of the various material classificationgrades as illustrated in Figure 3.61.
Table C7 From Australian Standard AS 1726 (1993).
In the Australian Standard, a material weathering classification is prescribed (but no massclassification). The various grades are essentially the same definition as in Table C4 (Geoguide 3) butusing some different terms. DW includes material ranging from the strength of fresh rock to materialthat falls apart in water.
TERM SYMBOL DESCRIPTION COMMENTS
RESIDUALSOIL
RS
Soil developed on extremelyweathered rock; the mass struc-ture and substance fabric are nolonger evident; there is a largechange in volume but the soil hasnot been significantlytransported.
Same as Geoguide 3.
EXTREMELYWEATHEREDROCK
XW
Rock is weathered to such anextent that it has soil properties,i.e. it either disintegrates or it canbe remoulded in water.However, it retains rockstructure.
Same definition as completelyweathered rock (Moye, 1955)and Geoguide 3.
DISTINCTLYWEATHEREDROCK
DW*
Rock strength usually changedby weathering. The rock maybe highly discoloured, usuallyby iron staining. Porosity maybe increased by leaching, ormay be decreased due todeposition of weatheringproducts in pores.
SLIGHTLYWEATHEREDROCK
SW
Rock is slightly discoloured butshows little or no change ofstrength from fresh rock.
FRESH ROCK FRRock shows no sign ofdecomposition or staining
*Covers highly weathered and moderately weathered classes commonly used internationally. HW and MWclasses may be used if noted in explanatory notes.
370 Appendix C

C.5.4.2. Mass weathering classifications
Formal mass schemes are commonly prescribed in different standardsbecause they are readily drawn on paper (percentages of soil and rock)but in practice are often difficult to apply, inflexible and not particu-larly useful. The scheme used in Hong Kong is presented in Table C8.This was prepared following the work of Martin & Hencher (1986)and was largely a response to the perceived failings of the scheme usedin the then BS 5930:1981 and similar schemes adopted by theISRM. The zones have some sense to them and it seems to workreasonably well in practice, although conditions are found where theapplication is simply impossible and/or unhelpful. Describing profilesaccording tomaterial grade distributions is the preferredmethod of theauthor. Elsewhere, the ISRM recommendation is still to use a massscheme by preference – the old scheme of BS 5930:1981 – despite itbeing impossible to use this in logging (though some people try). The
Table C8 Mass weathering zones (GCO, 1988).
Comment: largely similar to scheme recommended in Anon (1995) and BS5930: 1999. Thisclassification was developed for classifying thick, heterogeneous weathered profiles. The zoneboundaries make good sense in terms of engineering significance. Principles are often useful startingpoints for differentiating engineering units in a ground model.
TERMZONESYMBOL TYPICAL CHARACTERISTICS
RESIDUAL SOIL RSResidual soil derived from in situweathering; massstructure and material texture/fabric completelydestroyed: 100% soil.
PARTIALLYWEATHEREDROCK MASS (PW)
PW 0/30
Less than 30% rock.Soil retains original mass structure and materialtexture/fabric (i.e. saprolite).Rock content does not affect shear behaviour ofmass, but relict discontinuities in soil may do so.Rock content may be significant for investigationand construction.
PW 30/5030% to 50% rock.Both rock content and relict discontinuities mayaffect shear behaviour of mass.
PW 50/9050% to 90% rock.Interlocked structure.
PW 90/100Greater than 90% rock.Small amount of the material converted to soilalong discontinuities.
UNWEATHEREDROCK
UW
100% rock.May show slight discolouration alongdiscontinuities.
Appendix C 371

Table C9 International Society for Rock Mechanics (1978) vs. Eurocode 7 schemes. See Hencher(2008) for further discussion.
The Eurocode 7 scheme is the 1978 ISRM scheme but with different grade numbers. This type ofscheme can be applied as descriptive shorthand in areas where weathering is a relatively minorconsideration, as illustrated for the greywacke and schists of southern Portugal (Pinho et al., 2006)and can also be used for more deeply weathered heterogeneous zones. It is difficult, however, to logcore using this scheme and this causes difficulties for many workers. Deere & Deere (1988) redefine‘sound and hard’ rock for RQD as fresh or slightly weathered (ISRM); if the rock core is ‘moderatelyweathered’, they say that RQD should be annotated RQD*. This overlooks the dilemma for a loggerthat grade III (ISRM, 1978) can include up to 50% ‘soil’ by definition.
ISRM (1978) EUROCODE 7
TERM DESCRIPTION DESCRIPTION
FRESH(100% ROCK)
I No visible sign of rockmaterial weathering; perhapsslight discolouration on majordiscontinuity surfaces.
0 No visible sign of rockmaterial weathering; perhapsslight discolouration on majordiscontinuity surfaces.
SLIGHTLYWEATHERED(100% ROCK)
II Discolouration indicatesweathering of rock materialand discontinuity surfaces. Allthe rock material may be dis-coloured by weathering andmay be somewhat weaker thanits fresh condition.
1 Discolouration indicatesweathering of rock materialand discontinuity surfaces.
MODERATELYWEATHERED(>50%ROCK)
III Less than half of the rockmaterial is decomposed and/ordisintegrated to a soil. Fresh ordiscoloured rock is presenteither as a discontinuous fra-mework or as corestones.
2 Less than half of the rockmaterial is decomposed ordisintegrated. Fresh or disco-loured rock is present, either asa continuous framework or ascorestones.
HIGHLYWEATHERED(<50% ROCK)
IV More than a half of the rockmaterial is decomposed and/ordisintegrated to a soil. Fresh ordiscoloured rock is presenteither as a discontinuous fra-mework or as corestones.
3 More than half of the rockmaterial is decomposed ordisintegrated. Fresh ordiscoloured rock is present,either as a discontinuousframework or as corestones.
COMPLETELYWEATHERED(100%SOIL)
V All rock material is decom-posed and/or disintegrated tosoil. The original mass struc-ture is still largely intact.
4 All rockmaterial is decomposedand/or disintegrated to soil. Theoriginal mass structure is stilllargely intact.
RESIDUAL SOIL(100% SOIL)
VI All rock material is convertedto soil. The mass structure andmaterial fabric are destroyed.There is a large change involume, but the soil has notbeen significantly transported.
5 All rock material is convertedto soil. The mass structure andmaterial fabric are destroyed.There is a large change involume, but the soil has notbeen significantly transported.

latest move in this sad story is that Eurocode 7 has reverted to a massscheme for classification, which is essentially the same as the ISRM butwith different zone numbers and even poorer definitions (Table C9).For most countries, this is relatively unimportant, but where the engi-neering geologist finds himself dealing with severely weathered rock,he will probably find it useful to adopt the approaches used in HongKong and in Singapore (refer to GCO (1988), Anon (1995), BS5930:1999 and CP3 (2004)).Other schemes are used in different countries; many of these have
been prepared from agricultural or soil science perspectives and someare discussed by Selby (1993). In Japan and Korea, distinctionsare made between hard rock, soft rock and weathered rock. InChina, a pragmatic classification is used based on the ability to cutmaterial with a shovel (Table C10).As discussed at length in Anon (1995) and adopted by BS5930: 1999
and Eurocode 7, weathering in limestone needs special consideration,as do rocks that weather in a relatively uniformway, such as chalk andsome mudstones. Norbury (2010) discusses these schemescomprehensively.
Table C10 Chinese Standard GB50021-2001 (2009 Edition).
Classification is essentially a practical mass scheme, which does not deal with weathered rockmassesthat develop as corestone-rich profiles. Not applicable for core logging in boreholes.
TERM DESCRIPTION (SIMPLIFIEDFROM ORIGINAL)
COMMENT
RESIDUAL SOIL Structure fully destroyed. Easily dugwith shovel.
Actually, many residual soils are quitestrong, cemented with iron especially,so can be quite difficult to dig.
FULLYWEATHERED
Structure basically destroyed but stillrecognisable. Residual structuralstrength existing. May be dug withshovel.
HIGHLYWEATHERED
Majority of structural planesdestroyed. May be dug with shovel.
From experience inHongKong, highlydecomposed (weathered) rock oftenshows the highest degree of fracturing– they become healed by the comple-tely weathered and residual soil stages(Hencher & Martin, 1982).
MODERATELYWEATHERED
Structure partially destroyed; sec-ondary minerals along joints;weathered fissures developed. Hardto cut with shovel.
NON-WEATHERED Structure basically unchanged.
Appendix C 373

C.6 Rock mass classifications
This review is not comprehensive but considers the most commonlyused rock mass classification systems. A particularly useful review,mostly with respect to tunnelling and underground structures, isgiven by Professor Hoek at: http://www.rocscience.com/hoek/corner/3_Rock_mass_classification.pdf
C.6.1 RQD
Rock Quality Designation (RQD) was proposed by Deere (1968) asan index of rock quality by which a modified core recovery percentageis measured by counting only pieces of ‘sound and hard’ core 4 inches(100mm) or greater in length as a percentage of core run. Thismeasure is usually recorded on core logs and has stood the test oftime, partly because it is simple (like the SPT test for soils and weakrock). Many authors have pointed out inconsistencies and suggestedmodifications, for example, over core lengths to be considered andhave questioned the definition of sound and hard, but most of thesehave not been widely adopted. Basically, one adds the lengths of intactcore greater than 100mm in length along the centre line of core andexpresses this as a percentage of core run. If there is 100% recoveryand all sticks between natural discontinuities are >100mm in length,the rock has an RQD of 100%. If all sticks of core were 95mm, theRQD would be 0%. It is a crude measure but used in practice and is akey parameter in other rock mass classifications, RMR and Q, asdiscussed below. Details of measurement are given in BS 5930:1999and most other standards, including Geoguide 3 (GCO, 1988).Various authors have used RQD directly to correlate with rock massparameters such as Young’s modulus or to estimate bearing capacityfor foundations (Peck et al., 1974). It should be borne in mind thatrock with 100mm spacing of open joints (100% RQD) is in factseverely fractured rock that would be described as closely spaced (60mm to 200mm). According to BS 8004 (BSI, 1986), any rockwith jointspacing less than 100mmwould require ‘tests on rock’, as discussed inChapter 6, to assess allowable bearing pressure.Palmström (1982) suggests that RQD can be estimated from the
number of discontinuities per unit volume based on visible disconti-nuity traces surface exposures, using the following relationship:
RQD ¼ 115 − 3:3Jv
where Jv is the sum of the number of joints per unit length for alldiscontinuity sets and known as the volumetric joint count. There isa practical difficulty here in that traces of discontinuities do not
374 Appendix C

necessarily equate with natural breaks in core (the incipient jointproblem, as discussed in Chapter 3). The engineering geologist mustbeware of counting all visible traces in defining RQD, otherwise theground will be assigned a much lower quality rating than is reallyjustified. This can have major consequences in assessing the potentialof tunnel boring machines or roadheaders to make progress whencutting rock.
C.6.2 More sophisticated rock mass classificationschemes
Various rock mass classifications have been developed, largely asmethods of estimating support requirements for underground excava-tions linked to case histories, although GSI (covered below) is aimedinstead at predicting engineering parameters rather than engineeringperformance and support requirements. As discussed in Chapter 6,these classifications really come into their own whilst tunnelling andwhere a decision has to bemade quickly, onmucking out, as to the levelof support that is required to stabilise the rockmass. In a drill and blastoperation, there is no time for the engineering geologist to take sophis-ticated measurements and carefully weigh up the potential modes offailure and rock loads whilst the drilling crew (no doubt on a bonuslinked to advance rate) wait patiently…However, not all tunnel engineers are great fans of rock mass classi-
fications schemes. Sir Alan Muir Wood (2000) comments, ‘Currently,much time and effort tends to be wasted in assembling prescribed data,often painstakingly acquired at the tunnel face, to enable calculation ofa RMC algorithm which is then filed in a geological log book but notapplied to serve any further purpose.’ And, ‘For weak rocks, the con-tribution from RMC is more limited … based on material… as well asdiscontinuities. Attempts to base support needs for weak rocks onRMC have been notably unsuccessful.’He continues, ‘RMC are inade-quate to provide reliable information on failure modes’, and ‘the wayahead must be to identify important parameters for a particular situa-tion and to present these in a multidimensional way’.
C.6.2.1 RMR
The Rock Mass Rating (RMR) of Bienawski (1976, 1989) has alsostood the test of time as a useful classification system, despite manyquestion marks over definitions. The five parameters for the RMRsystem and their ranges of assigned points are as follows:
1. Uniaxial compressive strength of rock material (0–15)2. Rock Quality Designation (3–20)3. Spacing of discontinuities (5–20)
Appendix C 375

4. Condition of discontinuities (0–30)5. Groundwater conditions (0–15)
Points are assigned for each parameter and then summed to rate therock as very good to very poor. It is to be noted that the degree offracturing and condition of those fractures covers 70% of the RockMass Rating and that there is a high level of double counting betweenfactors 2 and 3. There is also somewhat of a conundrum in that rockwith RQD of 90–100% is allocated the full 20 points but rock withjoint spacing of 60–200mm is only allocated 8 out of 20 points.Orientation of discontinuities is used to adjust the summed rating
according to whether discontinuities are adverse relative to the engi-neering project.RMR is used (as is RQD by itself) to correlate with rock mass
parameters, including rock mass strength and deformability.
C.6.2.2 Q SYSTEM
The Q system of Barton et al. (1974) is commonly used to classify thequality of rock mass – as a predictive tool in estimating tunnel supportrequirements for a planned tunnel or cavern, for judging whetherground conditions during tunnelling were as expected or not (contrac-tual issues) and for making decisions on temporary and permanentsupport requirements during tunnelling (Chapter 6). Barton (2000,2005) also discusses ways of using the Q system in predicting TBMperformance. Q has a value range from 0.001 to 1,000.
QðqualityÞ ¼ RQDJn
� �JrJa
� �JwSRF
� �
where:RQD is Rock Quality Designation; Jn is joint set number; Jr is jointroughness number; Ja is joint alteration number; Jw is joint waterreduction factor; and SRF is a Stress Reduction Factor (relating toloosening of rock, rock stress in competent rock and squeezing condi-tions in incompetent rock).Ranges and descriptions for each parameter are given in the original
publications by Barton (2000, 2005) but also in Hoek & Brown(1980) and at Hoek’s corner, as referred to at C6.
C.6.2.3 GSI
The Geological Strength Index (GSI) of Hoek (1999) provides ameans of estimating rock mass strength and deformability throughbroad classification based on rock type and quality of rock mass,as illustrated in Table C11. Ways in which the GSI can be used toestimate rock mass parameters are dealt with in Chapter 5.
376 Appendix C

Table C11 GSI.

C.6.3 Slope classifications
Various authors have devised soil and rock mass classifications as ameans of judging slope stability (Romana, 1991; Selby, 1993; Hack,1998). In the experience of the author, these are less commonly appliedthan are rock mass classifications for tunnels, perhaps because there isnot usually the same degree of urgency to make decisions and need tolink observations to empirical experience. When assessing a slope, onecan usually take some time to examine and investigate the geologicalconditions in some detail and carry out rational analysis and design –
as of course should also be done wherever time allows for under-ground openings, as discussed in Chapter 6. Slope stability assessmentclassifications can be useful where, for example, carrying out a rapidcomparative hazard and risk survey along a highway.
378 Appendix C

Appendix D: Examples of borehole andtrial pit logs
In this appendix, examples are presented of borehole (or drillhole) andtrial pit logs from the UK, Hong Kong and Australia. Locations havebeen omitted in some examples. They contain a great deal of informa-tion, not only as records of the ground conditions encountered but alsoon the way in which the investigation was conducted, the machineryused, the tests conducted and their results and the groundwater con-ditions. These serve to illustrate the variety of use of descriptive termsand classifications in description as well as typical techniques used inground investigation.
D.1 Contractor’s borehole logs
Contractor’s logs are carried out following standards and codes in thecountry where the work is carried out. As discussed in Chapter 4, theytend to provide somewhat simplified descriptions of ground condi-tions. The engineer who, unlike the contractor, has designed the GIshould have carried out a thorough desk study and be aware of thefactors that will be crucial to the success of a project; he may need toexamine samples himself to ensure that key features at a site have beencorrectly identified, described and highlighted.
D.1.1 UK example
The borehole log D1 is courtesy of Geotechnics Ltd. and for a holetaken to 20m depth. Descriptions of soil and rock encountered are toBS 5930:1999.All of the following detail (andmuchmore) can be read directly from
the log without any report or further explanation.The first 1.2m was excavated as an inspection pit. This is usual
practice, just in case there might be services such as electric cables orpipes not identified on plans or using detecting equipment. Water wasencountered at 0.4m.A cable percussion rig was then used to advance a hole of 0.15m
diameter. The hole was advanced essentially following the strategy

Figure D1 UK drillhole.

Figure D1 (continued).

Figure D1 (continued).

outlined in Figure 4.23. Sample types are B (bulk or bag sample of thearisings), E (environmental for contamination testing), W (watersample) and D (small disturbed tub or jar sample, generally taken bya split tube sampler in an SPT test). SPT results (N-values) are given in aseparate column (S5 and so on) and more details of the SPT tests aregiven in a separate sheet. In this example no undisturbed samples weretaken. If they had been, they would have been reported as U (open102 mm tube) or UT (thin-walled open drive sample) together with arecord of the number of blows taken to drive the sample (for generalinformation only, as the driving force from the hammer is not usuallystandardised). The cable percussion driving was continued to a depthof 8.30m, by which time the investigation had encountered weatheredCoal Measures mudstone (described as very stiff slightly sandy CLAYwith lithorelicts of the parent rock). An SPT was attempted in theweathered rock but only penetrated 146mm (rather than 300mm)for 50 blows of the hammer when the test was terminated, which isstandard practice in the UK. In the cable percussion section of hole,water was encountered near the surface but then as casing wasinstalled the hole proceeded in the dry until the base of alluvium at4.20m depth. Water rose in the borehole to 3.90m.From 8.30m, the hole was advanced using rotary drilling using
water flush with a diameter of 0.12m. Advance rates are given at thebottom of page 1. The first drilling run was only 0.5m, but after that1.5m runs were adopted up to 18m when a 2m run was carried out.Total core recovery (TCR) was not bad, generally over 80%, but from10.50 to 12.00m 47% of core was lost (TCR = 53%). Solid CoreRecovery (SCR) is defined as percentage of core with full circumfer-ence. RQD is percentage of core (on a drilling run basis – NOT rocktype) in full sticks of sound rock >100mm in length. Fracture index(no. per metre) is also recorded. Note that core run lengths are notconsistent with geological changes – no reason why they should beunless the driller noted some sudden change in advance rate or loss offlushing fluid perhaps, which might cause him to stop and extract thedrill string to investigate the cause. In the contractor’s own style of log,he has chosen to split the description into general and detail columns,which is helpful. Water was encountered in the rock at a depth of11.10m and rose to 6.40m. When the hole was complete, a standpipepiezometer was installed – details of the installation are on the log.Also noted is chiselling time – this is useful information for the designer(perhaps if he is considering using driven piles) but is also a record forpayment purposes. As a comment, note that there is no attempt todescribe weathering state (the strength consequence is clearly recordedso there is no need) – this contrasts with the HK and Australianexamples presented later. Initials of the crew who carried out theboring, who logged the materials and prepared the log and whochecked the whole report are given.
Appendix D 383

D.1.2 Hong Kong example
The drillhole recordD2 is provided courtesy of GammonConstructionLtd, HK, for a hole taken to 14.78m depth. Descriptions of soil androck are to GCO (1988).As for the UK example, the hole commenced with an inspection pit
to 1.50m to check for services. After that, the hole was advanced byrotary drilling using water flush. PX casing with an outside diameter(OD) of 140mmwas installed to 3.50m and then HX (OD 114mm) to6.50m at the top of rockhead, fromwhich depth the hole was uncased.To a depth of 8.50m, an intermittent sampling strategy was adopted,withMazier samples and SPT tests. To 5.70m, the rock is all describedas grade V, completely decomposed granite. At 5.70m there is a 0.8mthick basalt stratum, completely decomposed to very stiff, slightlysandy SILT (also grade V). The basalt was sampled in an SPT test,which gave an N-value of 91 (in the UK the test would normally havebeen terminated at 50 blows).From 6.50m, the drilling was continued using a Craelius T2-101
double-tube core barrel with an outside diameter of 101mm and corediameter of about 84mm. The rock recovered is all described asmoderately strong or strong, moderately (grade III) or slightly decom-posed (grade II) granite. Recovery in the rock is generally good andRQD high. There is some information about discontinuities, theirnature, closeness and orientations, but no real detail. If this drillholewas for a slope stability assessment, then more information would berequired, especially regarding the dip direction of the joints. If it wasfor a foundation design, then such information would probably not benecessary. Water levels have been recorded each morning and eveningbut these would have been affected by the drilling process and waterflush so little can be interpreted from these data. A piezometer wasinstalled at a depth of 6.30m (at the basalt horizon). No details aregiven on this log but probably the piezometer would have beeninstalled in a sand/gravel pocket extending above the basalt into thesandy decomposed granite.
D.2 Consultant’s borehole log, Australia
The drillhole record D3 is provided courtesy of Golder Associates(GA)/Sinclair Knight Merz, Brisbane, and with acknowledgements tothe Department of Transport and Main Roads, Queensland, for per-mission. Only the first three of seven sheets are presented. Soil androcks are described according to Australian Standards (1993).Shorthand descriptors and other terms are given in sheet D3 (terms).GA are consulting engineers responsible for investigating the site
where this borehole has been put down. It is the site of a complexlandslide so cores have been logged not only by the GI contractor (not
384 Appendix D

Figure D2 HK drillhole.

Figure D2 (continued).

Figure D3 (1) BH380 Borehole report.

Figure D3 (continued).

Figure D3 (continued).

presented here) but also by GA. In the original report, the logs areaccompanied by high-quality photographs. The borehole diameter is96mm and core diameter 76mm. The log only provides informationon the rock recovered; for information on how the borehole was
Figure D3 (continued).
390 Appendix D

Figure D4 Trial pit UK.

Figu
reD5
HKtrialp
it.

conducted, how long it took, casing used, information on flush andgroundwater encountered, etc. one would need to examine the GIcontractor’s log for the same hole. The factor that distinguishes thislog from the HK and UK examples is the attention to detail in describ-ing each discontinuity, with information on roughness, infill andmineral coatings, as applicable. That said, this log is really only apreliminary step. After considering other details regarding the site,not least results from instruments monitoring ground movementsand water pressures, then sections of core where movement is sus-pected were examined and logged in even greater detail, with samplestaken for strength testing, microscopic examination and chemicalanalysis.
D.3 Contractor’s trial pit logs
Examples from the UK and from Hong Kong are presented in D4 andD5 respectively. Descriptions and classification used reflect local stan-dards and codes. The UK example is essentially the same as a boreholelog (one-dimensional). The HK example is more graphic and shows allfour sides of the pit. As is common practice in HK, large block sampleswere taken at depths of 1.5m and 3.0m. These are cut by hand,covered in foil, waxed and placed in a wooden box for transportationto the laboratory, where they are opened, described and prepared fortesting, as illustrated in Figure 4.12.
Appendix D 393

Appendix E: Tunnelling risk
Appendix E-1 Example of tunnelling risk assessment atproject option stage for Young Dong Mountain Loop Tunnel,South Korea
The YoungDong Railroad Relocation Project for the KoreanNationalRailways (KNR) included a single-track railway tunnel, in rock,approximately 16.3 km long with a span of approximately 8m. As at2011 it is the longest tunnel in Korea. The tunnel had to be constructedas a large radius loop to limit the gradient of the track, as illustrated inFigure AE-1.1. The maximum depth of the tunnel is approximately400m, with most of the alignment being at depths in excess of 100m.The route for the tunnel was identified as having intrinsic hazards
including:
– potentially high water pressures, up to 40 bars (4 MPa) pressure– fault zones, possibly associated with significant groundwater
inflows– highly sheared and closely jointed rocks– some rocks with high strength and abrasivity– possible cavernous limestone with groundwater– old mine workings (coal).
Halcrow, with Nick Swannell as Project Manager, was commissionedto advise a consortium of contractors tendering for the construction ofthe tunnel and as part of the brief carried out a thorough hazard andrisk assessment of the route for both TBM and drill and blast options.Several state-of-the art reports by Dr Graham Garrard of Halcrowwere based on existing ground investigations along the route, mappingand further GI together with an in-depth review of tunnel case historiesin similar terrain throughout the world by Dr. Laurie Richards.A risk assessment method was developed to make a quantitative and
objective assessment of the construction methods of the tunnel. Therisks associated with tunnel excavation are dependent on the hazardsencountered and were defined for this project with respect to

programme (rather than other issues such as safety or cost asmight have been done). The likelihood of a hazard occurringwas assigned one of three levels and consequence of each hazardassumed to be at one of five levels, as set out in Table AE-1.1below.The level of risk for each hazard can be determined by finding its
likelihood of occurrence and considering its consequence. The level ofrisk associated with the hazard is then established conventionally asfollows:
Level of Risk ¼ Likelihood� Consequence
Once the level of risk has been ascertained, it can be compared withTable AE-1.2 below to identify the action that should be taken tomitigate the risk.Having made an assessment of the risk associated with each hazard,
appropriate mitigation measures are considered. The residual riskremaining after mitigation is then assessed in the same way to determineacceptability or otherwise.
Figure AE-1.1 The Young Dong (now Solan) Mountain Loop Tunnel Project, South Korea, afterDaewoo Corporation. Figure modified from Kim et al. (2001).
Appendix E 395

Risk assessment
The assessment of risks associated with the use of a shieldedTBM was carried out separately from that for drill and blastexcavation.Table AE-1.3 provides a brief summary of the hazards identified for
a drill and blast option with level of probability of occurrence andlikely consequence and hence risk. Possible ways of mitigating the riskare identified and the residual likely risk identified. The original reportsgo into far more detail of the nature of hazards, ways to mitigatethem and the potential ways those mitigation measures might proveunsuccessful leaving residual risks. An example of a summary hazardand risk register for this project (TBM option) is given at Appendix E-2.
Conclusions
It was found that the number of hazards and residual risks associatedwith a shielded TBM construction would be greater than for the drilland blast method. The principal reasons were:
– the relative inflexibility of mechanised excavation and lining sys-tems to deal with conditions for which they may not have beenspecifically designed.
Table AE-1.1
LIKELIHOOD CONSEQUENCE
TITLE DESCRIPTION SCALE TITLE DESCRIPTION SCALE
Probable
Likely to occur duringthe construction of thetunnel, possibly onmore than oneoccasion
3
Catastrophic Total loss of a sectionof tunnel 5
Critical
Major damage ordelay to tunnel ormajorenvironmentalimpact affectingprogramme
4
Occasional
Likely to occur at leastonce duringconstructionof the tunnel
2
Serious
Some damage ordelay to tunnel orsomeenvironmentalimpact affectingprogramme
3
Marginal
A routinemaintenance repairto tunnel or minorhindrance
2
RemoteUnlikely to occurduring construction ofthe tunnel
1Negligible
Of little consequenceto programme 1
396 Appendix E

– the dependence of the tunnel progress entirely on the performanceand reliability of a single item of mechanical plant, which wouldrequire a high level of technological input for its successful opera-tion and maintenance.
Further details are given by Kim et al. (2001).
Table AE-1.2Consequence
Likelihood
Catastrophic Critical Serious Marginal Negligible
Probable 15 12 9 6 3
Occasional 10 8 6 4 2
Remote 5 4 3 2 1
Score
10–15Very high risk – not acceptable for tunnel construction – need to apply mitigationmeasures to eliminate or reduce risk
6–9
High risk – apply mitigation measures to eliminate or reduce risk. Residual risk at thislevel indicates need for active management control and response plans to be welldeveloped with well trained personnel, materials and plant readily available
1–5Low risk – may be accepted if mitigating measures are in place under activemanagement control
Appendix E 397

Table AE-1.3 Programme risk assessment for excavation by drill and blast.
(L = likelihood, C = consequence, R = L ×C = risk). Residual risk is likely outcome after application ofmitigation measures.
NO HAZARD RISK RISKLEVEL
MITIGATION MEASURES RESIDUALRISK LEVEL
L C R L C R
1 Highly jointedrock mass(possibly inassociation withhigh-pressurewater).See Hazard 3 forwater ingressspecifically.
Ravellingground, rooffalls andsidewalland/or faceinstabilitywith highamount ofprimarysupport.
3 4 12 1. Reduce length ofexcavation advance; facesupport and/or buttressingand/or partial faceadvance.
2. Reduce powder factor tolessen blast damage.
3. Increase rock support andinstall rock support in theform of rock bolts and steelfibre reinforced shotcretewithout delay.
4. Probing and pre-injection.
2 2 4
2 Fault zones Soft ground ormixed faceconditionswith potentialroof falls andsidewallsinstabilityrequiring ahigh degree ofprimarysupport.
3 4 12 1. Reduce length ofexcavation advance; facesupport and/or buttressingand/or partial faceadvance.
2. Reduce powder factor.3. Increase rock support and
install rock bolts, steelfibre reinforced shotcrete,lattice girders and spillingbars without delay.
4. Provision of probe drillingto identify these featuresahead of the excavationface.
5. Provision of TunnelSeismic Prediction (TSP) toidentify fault zones aheadof the excavation face.
6. Provision ofinstrumentation tomonitor movement tooptimise support.
3 2 6

Table AE-1.3 (continued) Programme risk assessment for excavation by drill and blast.
NO HAZARD RISK RISKLEVEL
MITIGATION MEASURES RESIDUALRISK LEVEL
L C R L C R
3 Water ingress,possibly underhigh pressure upto 40 bar (4 MPa)
Water incavities, jointsand fissures inthe rock massenteringexcavationand causinginstability ofground.
Difficultieswith shotcreteapplication.
3 4 12 1. Tunnel drive to beup-grade to allow water todrain. (Not possible withall drives.)
2. Provision of pumps tocope with high flows andbackup systems to dealwith pumps and powerfailures.
3. Provision of probe drillingto identify areas of highwater flows and to carryout pre-injection groutingto stem the flow.
4. Excavation equipmentsystems to be rated to IP68or equivalent.
5. Use drainage channels tocontrol inflows prior toshotcreting.
2 2 4
4 Cavities in therock mass(including mineworkings)possiblyassociated withwater inflow
Instability oftunnel face,roof fall andside wallinstability.
Flooding.
Need formajorstructuralwork orinfilling.
3 4 12 1. Provision of TSP toidentify cavities in advanceof excavation.
2. Provision of probe drillingto determine extent ofcavities and provide meansfor grouting or otheradvance stabilisationmeasures.
3. Reduce length ofexcavation advance.
2 3 6
continued overleaf

Table AE-1.3 (continued) Programme risk assessment for excavation by drill and blast.
NO HAZARD RISK RISKLEVEL
MITIGATION MEASURES RESIDUALRISK LEVEL
L C R L C R
5 Tunnelatmosphere andventilationincludingaccumulation ofexplosive andnoxious gases
Explosionrisk. Possibleaccumulationof explosiveand ornoxious gas.Methane,associatedwith coal orother sourcesis a flammablegas, lighterthan air andcan give riseto explosion.In largequantities itcan also causeasphyxiation.Other gasessuch as carbondioxide,carbonmonoxide,sulphurdioxide andhydrogenulphide arenoxious.
3 5 15 1. Provision of adequatefresh air from the portal tothe excavation face.
2. Provision of adequate andsuitable atmosphericmonitoring system.
3. Avoid the use of dryshotcrete mix.
4. Use explosive appropriateto tunnels prone to firerisk.
5. Standby generators topower fans.
1 4 4
6 Mechanicalbreakdown
Failure of keyitem of plant.
3 3 9 1. Planned maintenancestrategy.
2. Maintain spare plant items.3. Maintain stocks of spares.
3 1 3
7 Use of explosives Prematuredetonation oruncontrolledexplosion.
2 5 10 1. Employ qualified staff.2. Comply with safety
regulations.3. Use proper storage and
transport facilities.4. Use non-electric
detonators.
1 5 5

App
endixE-2
Exa
mpleof
hazard
andrisk
prediction
table
Exa
mpletableof
predictedha
zardsat
option
/designstag
eforTBM
withpo
tentialintersectionof
oldmineworking
s,ka
rst,colla
psed
andweakzones;thisis
partof
amoredetailedrepo
rtprepared
fora
specificprojecta
ndwas
supp
ortedby
simila
rtab
lesfor
drillan
dblasto
ptions,d
etailedtext,recom
mendedmetho
dsof
working
,interna
tion
alcase
stud
iesan
ddiscussion
.
Hazard
Consequenceofeventontunnel
Possiblemitigationmeasurespriorto
anddu
ring
construction
toredu
celik
elihoo
dor
consequenceof
hazard
Notes
*indicatestechniqu
emorelik
ely
than
others
tobe
useful
Impa
ctof
mitigation
measuresan
drisk
Summaryof
main
residu
alrisks
Number
Title
Exa
mpleof
circum
stan
ces
LikelihoodðLÞ
ConsequenceðCÞ
Risk(LxC)
1Inrush
ofwater
orun
consolidated
grou
nd
cavity,fau
lt,
area
ofcolla
psed
grou
nd,sha
ft,
adit
H1.
GI1
boreho
lesan
dpa
cker
tests
2.pre-construction
geolog
ical
desk
stud
yan
drisk
assessment*
3.surfacegrou
ting
aheadof
tunn
el4.
prob
edrillingah
eadof
andarou
ndtheface
throug
hTBM
2head
.Mon
itoring
ofwater
volumean
dpressure*
5.inspectio
nof
prob
edrillcuttings
for
weakor
unconsolidated
material,
mon
itoring
ofstrata
colour
and
odou
rforun
anticipated
chan
ges*
6.TSP
3to
detectlik
elygeolog
ical
structures*
7.mon
itoring
ofwater
mak
efrom
face
andsign
ificant
chan
gesin
volumeor
pressure*
8.grou
ndprob
ingrada
rto
detect
cavities,clay
orhigh
density
offractures
9.geolog
icalmap
ping
todetectchan
ges
instructure,strata
distress
LH
H1.
failu
reto
identify
inrush
cond
itions
2.blocka
geof
prob
eho
les
withdebris,o
run
consolidated
material
resultingin
underestim
ationof
water
pressure
andvo
lume
3.failu
reof
grou
ting
prog
ramme
4.failu
reof
EPB
M4
bulkhead
5.injury
toworkforce
6.pa
rtialo
rcompletelossof
tunn
eldrive
continuedov
erleaf
1.GI=Groun
dinvestigation
2.TBM
=Tun
nelb
oringmachine
3.TSP
=Tun
nelS
eism
icProfi
lingor
Prediction
4.EPB
M=Earth
pressure
balancetunn
ellin
gmachine

(con
tinu
ed)
Hazard
Consequenceofeventontunnel
Possiblemitigationmeasurespriorto
anddu
ring
construction
toredu
celik
elihoo
dor
consequenceof
hazard
Notes
*indicatestechniqu
emorelik
ely
than
others
tobe
useful
Impa
ctof
mitigation
measuresan
drisk
Summaryof
main
residu
alrisks
Number
Title
Exa
mpleof
circum
stan
ces
LikelihoodðLÞ
ConsequenceðCÞ
Risk(LxC)
10.grou
tingah
eadof
tunn
elface*
11.consideralso
likelihoo
dof
hazards:2,
3,5,
6,7,
8,9,
10,1
1,16
and17
2Inrush
offlam
mab
lega
sas
1ab
ove
M1.
GIbo
reho
les
2.pre-construction
geolog
ical
desk
stud
yan
drisk
assessment*
3.prob
edrillingah
eadof
andarou
ndtheface
throug
hTBM
head
.M
onitoringof
characterof
flush
return*
4.mon
itoring
oftunn
elatmosph
ere(gas
mon
itoring
attopof
face)todetect
sign
ificant
chan
gesincharactero
rcompo
sitio
n*
5.inspectio
nof
prob
edrillcuttings
toidentifyweakor
unconsolidated
material,mon
itoring
ofstratacolour
andod
ourfor
unan
ticipated
chan
ges*
6.TSP
todetectlik
elygeolog
ical
structures*
7.mon
itoring
oftunn
elatmosph
erefor
sign
ificant
chan
gesincharactero
rcompo
sitio
n*8.
GPR
todetectcavities,clay
orhigh
density
offractures
9.geolog
icalmap
ping
todetectchan
ges
instructure,stratadistress
LL
L1.
failu
reto
identify
presence
ofga
s2.
explosiondu
ring
prob
edrillingbecauseof
flush
failu
reat
thedrill
bit
3.escape
ofga
san
dexplosionin
thedriveage
4.injury
toworkforce
5.tempo
rary
evacua
tion
ofdrivedu
ring
remedial
works
or6.
tempo
rary
loss
ofdrive

(con
tinu
ed)
Hazard
Consequenceofeventontunnel
Possiblemitigationmeasurespriorto
anddu
ring
construction
toredu
celik
elihoo
dor
consequenceof
hazard
Notes
*indicatestechniqu
emorelik
ely
than
others
tobe
useful
Impa
ctof
mitigation
measuresan
drisk
Summaryof
main
residu
alrisks
Number
Title
Exa
mpleof
circum
stan
ces
LikelihoodðLÞ
ConsequenceðCÞ
Risk(LxC)
10.prov
isionof
adequa
teventila
tion
(and
ifnecessarymetha
nedraina
gesystem
)*11
.ad
optio
nof
flam
mab
legasworking
practic
es(nosm
okingpo
licy,
safety
light
policies,intrinsically
safe
plan
tan
dequipm
ent
12.consider
also
likelihoo
dof
hazards:
1,3,
4,5,
7,8,
9,10
,11,
12an
d17
3Nox
ious
gases(eg
CO2,
S02,
H2S
as1ab
ove
M1.
GIbo
reho
les
2.pre-construction
geolog
ical
desk
stud
yan
drisk
assessment*
3.geolog
ical
map
ping
offace
cuttings
todetect
chan
gesin
structurean
dstrata,p
resenceof
orga
nicmaterial,
sulphides,etc*
4.mon
itoringof
tunn
elatmosph
ere
(gas
mon
itoringat
topan
dba
seof
face)todetect
sign
ificant
chan
gesin
characteror
compo
sition
*5.
prob
edrillingah
eadof
andarou
ndtheface
throug
hTBM
head
.M
onitoringof
characterof
flush
return
6.prov
isionof
adequa
teventila
tion
*7.
consider
also
presence
ofha
zard
2
LL
L1.
failu
reto
identify
gases
2.injury
toworkforce
3.tempo
rary
evacua
tion
ofdrivedu
ring
remedial
works
continuedov
erleaf

(con
tinu
ed)
Hazard
Consequenceofeventontunnel
Possiblemitigationmeasurespriorto
anddu
ring
construction
toredu
celik
elihoo
dor
consequenceof
hazard
Notes
*indicatestechniqu
emorelik
ely
than
others
tobe
useful
Impa
ctof
mitigation
measuresan
drisk
Summaryof
main
residu
alrisks
Number
Title
Exa
mpleof
circum
stan
ces
LikelihoodðLÞ
ConsequenceðCÞ
Risk(LxC)
4Rad
onas
1ab
ove
L1.
pre-construction
geolog
ical
desk
stud
yan
drisk
assessment*
2.mon
itoringof
tunn
elatmosph
erefor
sign
ificant
chan
gesin
characteror
compo
sition
3.prov
isionof
adequa
teventila
tion
*4.
consider
also
hazard
3
LL
L1.
failu
reto
identify
rado
nat
elevated
levels
2.long
term
affectson
workforce
health
3.tempo
rary
evacua
tion
ofdrivedu
ring
remedial
works
5Excessive
volume
ofgrou
ndwater
as1ab
ove
plus
perm
eable
strata
andfractured
grou
ndassociated
with1ab
ove
H1.
hydrolog
icaltestingin
GIb
oreholes*
2.pre-construction
geolog
ical
desk
stud
yan
drisk
assessment,tunn
eldepth*
3.prob
edrillingah
eadof
face
throug
hcontrolv
alve
grou
tedinto
rock
aheadof
TBM
cuttersan
dmon
itoringof
water
volumean
dpressure*
4.pa
cker
testingto
measure
perm
eabilityah
eadof
face*
5.TSP
todetect
likelygeolog
ical
structures*
6.mon
itoring
ofwater
mak
efrom
face
andsign
ificant
chan
gesin
volumeor
pressure*
7.grou
ndprob
ingrada
rto
detect
cavities,clay
orhigh
density
offractures
MH
H1.
failu
reof
grou
ting
prog
rammegrou
ndfreezing
2.un
derestim
ationof
inflow
3.failu
reof
EPB
Mbu
lkhead
4.failu
reof
pumps
5.tempo
rary
evacua
tion
ofdriveor
6.tempo
rary
loss
ofdrive

(con
tinu
ed)
Hazard
Consequenceofeventontunnel
Possiblemitigationmeasurespriorto
anddu
ring
construction
toredu
celik
elihoo
dor
consequenceof
hazard
Notes
*indicatestechniqu
emorelik
ely
than
others
tobe
useful
Impa
ctof
mitigation
measuresan
drisk
Summaryof
main
residu
alrisks
Number
Title
Exa
mpleof
circum
stan
ces
LikelihoodðLÞ
ConsequenceðCÞ
Risk(LxC)
8.geolog
ical
map
ping
toan
ticipa
teperm
eableor
fracturedstructure,
strata
distress
etc
9.grou
ting
aheadof
face*
10.ad
vanced
dewateringah
eadof
tunn
elfrom
thesurface
11.grou
ndfreezing
aheadof
face
12.consider
also
hazard
1
6Excessive
grou
ndwater
pressure
as5ab
ove
M1.
hydrolog
ical
testingin
GIb
oreholes
2.pre-construction
geolog
ical
desk
stud
yan
drisk
assessment,tunn
eldepth*
3.prob
edrillingah
eadof
face
throug
hcontrolv
alve
grou
tedinto
rock
aheadof
TBM
cuttersan
dmon
itoringof
water
volumean
dpressure*
4.mon
itoringof
water
mak
efrom
face
andsign
ificant
chan
gesinvo
lumeor
pressure*
5.TSP
todetect
likelygeolog
ical
structures
6.grou
ndprob
ingrada
rto
detect
cavities,clayor
high
densityof
fractures
MH
H1.
failu
reof
grou
ting
prog
rammegrou
ndfreezing
2.un
derestim
ationof
grou
ndwater
pressure
3.failu
reof
EPB
Mbu
lkhead
4.failu
reof
pumps
5.tempo
rary
evacua
tion
ofdriveor
6.tempo
rary
orperm
anent
loss
ofdrive
continuedov
erleaf

(con
tinu
ed)
Hazard
Consequenceofeventontunnel
Possiblemitigationmeasurespriorto
anddu
ring
construction
toredu
celik
elihoo
dor
consequenceof
hazard
Notes
*indicatestechniqu
emorelik
ely
than
others
tobe
useful
Impa
ctof
mitigation
measuresan
drisk
Summaryof
main
residu
alrisks
Number
Title
Exa
mpleof
circum
stan
ces
LikelihoodðLÞ
ConsequenceðCÞ
Risk(LxC)
7.geolog
ical
map
ping
toan
ticipa
teperm
eableor
fracturedstructure,
strata
distress
8.grou
ting
aheadof
face*
9.grou
ndfreezing
aheadof
face
10.ad
vanced
dewateringah
eadof
tunn
elfrom
thesurface
11.useperm
eablelin
erto
redu
cepressure
onlin
er12
.consider
also
hazard
1an
d2
7Collapsed
grou
ndka
rstareas
(bou
lder
chok
es),
shafts,a
reas
of colla
psed
mine
working
s
M1.
GIbo
reho
les
2.pre-construction
geolog
ical
desk
stud
yan
drisk
assessment
3.prob
edrillingah
eadof
andarou
ndface
throug
hTBM
head
.M
onitoringof
ratesof
drillingan
dcharacterof
drill
cuttings
(presence
ofclay
,infi
llmaterialsetc)*
4.mon
itoringof
water
mak
efrom
face
5.TSP
todetect
chan
gein
reflection
characteristicof
strata
6.geolog
ical
map
ping
toidentify
disturbedor
fracturedstructurean
dstrata
distress
LM
M1.
failu
reof
grou
ting
prog
ramem
orstrata
controlfoa
ms
2.stab
ility
prob
lemsan
dda
mag
eto
cutter
head
3.high
erthan
anticipa
ted
load
ingon
tunn
ellin
ings
lead
ingto
prem
ature
failu
re4.
high
erpo
stconstruction
maintenan
ce5.
tempo
rary
orperm
anent
loss
ofdrive

(con
tinu
ed)
Hazard
Consequenceofeventontunnel
Possiblemitigationmeasurespriorto
anddu
ring
construction
toredu
celik
elihoo
dor
consequenceof
hazard
Notes
*indicatestechniqu
emorelik
ely
than
others
tobe
useful
Impa
ctof
mitigation
measuresan
drisk
Summaryof
main
residu
alrisks
Number
Title
Exa
mpleof
circum
stan
ces
LikelihoodðLÞ
ConsequenceðCÞ
Risk(LxC)
7.mon
itoringrelative
volumeof
spoil
prod
uced
anddriveage
distan
ceto
identify
caving
grou
nd8.
useof
strata
control(eg
benton
ite)
foam
sah
eadof
face
9.grou
ting
aheadof
face
10.grou
ting
behind
liner
tofillcavities
11.consider
also
hazard
1,2,
8,9,
10,
11,1
2,13
,14,
15,1
6,17
8Cav
ity<<
tunn
eldiam
eter
karst,old
mine
working
s,po
ssibly
faults
M1.
GIbo
reho
les
2.pre-construction
geolog
ical
desk
stud
yan
drisk
assessment
3.prob
edrillingah
eadof
andarou
ndface
throug
hTBM
head
.M
onitoringof
ratesof
drillingan
dcharacterof
drill
cuttings
(presence
ofclay
,infi
llmaterialsetc)*
4.TSP
todetect
airor
water
filled
cavity
(unlikelyto
detect
small
cavities)
5.geolog
ical
map
ping
toidentify
disturbedor
fracturedstructurean
dstrata
distress
6.consider
also
hazard
1,2,
9,10
,11,
12,1
3,14
,15,
16,1
7
LL
L1.
failu
reof
grou
ting
prog
meram
2.difficultyin
maintaining
tunn
elalignm
ent
3.high
errisk
ofwater
orga
sinrush
(see
abov
e)
continuedov
erleaf

(con
tinu
ed)
Hazard
Consequenceofeventontunnel
Possiblemitigationmeasurespriorto
anddu
ring
construction
toredu
celik
elihoo
dor
consequenceof
hazard
Notes
*indicatestechniqu
emorelik
ely
than
others
tobe
useful
Impa
ctof
mitigation
measuresan
drisk
Summaryof
main
residu
alrisks
Number
Title
Exa
mpleof
circum
stan
ces
LikelihoodðLÞ
ConsequenceðCÞ
Risk(LxC)
9Cav
ity~tunn
eldiam
eter
karst,old
partial
extraction
mine
working
s
M1.
GIbo
reho
les
2.pre-construction
geolog
ical
desk
stud
yan
drisk
assessment
3.prob
edrillingah
eadof
andarou
ndface
throug
hTBM
head
.Mon
itoring
ofratesof
drillingan
dcharacterof
drill
cuttings
(presenceof
clay
,infi
llmaterialsetc)*
4.TSP
todetect
cavity
5.geolog
ical
map
ping
toidentify
disturbedor
fracturedstructurean
dstrata
distress
6.grou
ting
aheadof
face
tofillcavities
tocreate
plug
toim
prov
edriving
cond
itions
andhelp
minim
iseTBM
deviation*
7.grou
ting
behind
liningto
fillcavities*
8.consider
also
hazard
1,2,
8,11
,12,
13,1
4,15
,16,
17
LL
L1.
failu
reto
detect
cavity
2.failu
reof
grou
ting
prog
ramme
3.difficultyin
maintaining
tunn
elalignm
ent
4.high
errisk
ofwater
orga
sinrush
(see
abov
e)

(con
tinu
ed)
Hazard
Consequenceofeventontunnel
Possiblemitigationmeasurespriorto
anddu
ring
construction
toredu
celik
elihoo
dor
consequenceof
hazard
Notes
*indicatestechniqu
emorelik
ely
than
others
tobe
useful
Impa
ctof
mitigation
measuresan
drisk
Summaryof
main
residu
alrisks
Number
Title
Exa
mpleof
circum
stan
ces
LikelihoodðLÞ
ConsequenceðCÞ
Risk(LxC)
10Cav
ity>>
tunn
eldiam
eter
karst,old
partial
extraction
mine
working
s
H1.
GIbo
reho
les
2.pre-construction
geolog
ical
desk
stud
yan
drisk
assessment
3.prob
edrillingah
eadof
andarou
ndthroug
hTBM
head
.Mon
itoringof
ratesof
drillingan
dcharacterof
drill
cuttings
(presenceof
clay
,infi
llmaterials,etc)*
4.TSP
todetect
cavity
5.geolog
ical
map
ping
toidentify
disturbed,
fracturedor
distressed
strata
6.grou
tcavities
aheadof
tunn
elface
(may
bevery
difficult)*
7.draincavity,tak
eTBM
offlin
ean
dconstructdu
mmytunn
elring
son
tunn
ellin
e,grou
tremaining
cavities
arou
ndlin
ingthen
adva
ncethroug
hdu
mmytunn
el.N
ote:thisop
tion
may
notbe
possibledu
eto
water
mak
e*8.
consider
also
hazard
2,3,
4,8,
9,10
,11
,12,
14,1
5,17
andpa
rticularly
hazards1
and16
during
construction
LH
H1.
failu
reto
detect
cavity
system
s2.
failu
reof
grou
ting
prog
ramme
3.un
ableto
draincavities
4.sign
ificant
delayto
prog
ramme
5.sign
ificantly
increased
risk
ifwater
andga
sinrush
andsettlement
(hazards
1,2,
3an
d16
)
continuedov
erleaf

(con
tinu
ed)
Hazard
Consequenceofeventontunnel
Possiblemitigationmeasurespriorto
anddu
ring
construction
toredu
celik
elihoo
dor
consequenceof
hazard
Notes
*indicatestechniqu
emorelik
ely
than
others
tobe
useful
Impa
ctof
mitigation
measuresan
drisk
Summaryof
main
residu
alrisks
Number
Title
Exa
mpleof
circum
stan
ces
LikelihoodðLÞ
ConsequenceðCÞ
Risk(LxC)
11Variableface
cond
itions
karstbo
ulder
beds
and
cave/m
ine
working
infill,
faultzones
and
high
lyfolded/
disturbed
areas
M1.
GIbo
reho
les
2.pre-construction
geolog
ical
desk
stud
yan
drisk
assessment
3.prob
edrillingah
eadof
face
throug
hTBM
head
andmon
itoringratesof
drillingan
dcharacterof
drill
cuttings*
4.geolog
icalmap
ping
todetectchan
ges
instructure*
5.TSP
todetect
likelygeolog
ical
structures
which
couldbe
associated
withva
riab
leface
cond
itions
6.grou
ndprob
ingrada
rto
detect
clay
orhigh
densitiesof
fractures
7.useTBM
face
withab
ility
todeal
withsm
alla
mou
ntsof
softmaterial
(tun
nela
lignm
entmay
becomprom
ised*)
8.consider
also
likelihoo
dof
hazards:
2,3,
5,6,
7,8,
9,10
,11,
16an
d17
ML
M1.
failu
reto
anticipa
tecond
itions
2.da
mag
eto
cutters
3.stab
ility
prob
lemsan
dda
mag
eto
cutter
head
4.delays
toprog
ramme
5.increasedrisk
ofwater
orga
sinrush

(con
tinu
ed)
Hazard
Consequenceofeventontunnel
Possiblemitigationmeasurespriorto
anddu
ring
construction
toredu
celik
elihoo
dor
consequenceof
hazard
Notes
*indicatestechniqu
emorelik
ely
than
others
tobe
useful
Impa
ctof
mitigation
measuresan
drisk
Summaryof
main
residu
alrisks
Number
Title
Exa
mpleof
circum
stan
ces
LikelihoodðLÞ
ConsequenceðCÞ
Risk(LxC)
12M
etal
obstructions
oldmine
working
s,surfaceGI
boreho
les
(lostdrill
string
s)an
dlostbitsfrom
adva
nce
drilling
H1.
pre-construction
geolog
ical
desk
stud
yan
drisk
assessment(presence
ofoldmineworking
s)2.
maintenan
ceof
good
GIdrilling
recordsan
drecordsof
adva
nced
drillingprog
ramme*
3.mon
itoringof
face
prod
uction
rates*
4.stop
machine
draw
back
anduse
cuttingor
explosives
toremov
eob
stacles*
5.Con
sideralso
likelihoo
dof
1,pa
rticularly
2,7,
8,9,
10,1
1,13
,14,
15,1
6,17
MH
H1.
failu
reto
identify
possibility
ofmetal
inface
2.stab
ility
prob
lemsan
dda
mag
eto
cutter
head
3.un
ableto
cutor
remov
emetal
from
aheadof
TBM
dueto
face
instab
ility
orwater
mak
e4.
delays
toprog
ramme
5.difficultyin
maintaining
tunn
elalignm
ent
13Su
bsidence
alon
gtunn
ellin
eka
rstan
doldmine
working
sbeneath
tunn
ellin
e
H1.
GIbo
reho
les,identification
ofka
rst
orminew
orking
s2.
pre-construction
geolog
ical
desk
stud
yan
drisk
assessment*
3.prob
edrillingah
eadof
face
and
beneathtunn
elto
detect
areasof
weakgrou
nd.M
onitoringratesof
drillingan
dcharacterof
drill
cuttings*
4.identification
ofka
rsticor
mining
features*
LH
H1.
failu
reto
identify
unconsolidated
grou
nd2.
failu
reof
grou
ting
prog
ramme
3.working
s/ka
rsttoodeep
toconsolidatefrom
tunn
el4.
settlementof
TBM
,delays
toprog
rammean
dloss
oflin
e5.
failu
reof
tunn
ellin
ing
postconstruction
continuedov
erleaf

(con
tinu
ed)
Hazard
Consequenceofeventontunnel
Possiblemitigationmeasurespriorto
anddu
ring
construction
toredu
celik
elihoo
dor
consequenceof
hazard
Notes
*indicatestechniqu
emorelik
ely
than
others
tobe
useful
Impa
ctof
mitigation
measuresan
drisk
Summaryof
main
residu
alrisks
Number
Title
Exa
mpleof
circum
stan
ces
LikelihoodðLÞ
ConsequenceðCÞ
Risk(LxC)
5.geolog
ical
map
ping
todetect
disturbedor
distressed
strata*
6.grou
ting
aheadan
dbelow
tunn
elto
consolidatestrata*
7.po
stconstruction
micrograv
ity
survey
(gradiom
etry)alon
glin
eof
tunn
elto
identify
cavities
andareas
ofun
treatedgrou
ndor
toconfi
rmconsolidationun
dertak
ensatisfactorily*
8.consider
also
likelihoo
dof
hazards:
1,2,
5,7,
8,9,
10,1
1an
d15
14Groun
dheav
eprox
imityto
faults,shear
zones,
oldmine
working
s,folded
grou
ndan
dplaces
where
stress
cond
itions
atyp
ical
M1.
GIbo
reho
lesstructural
interpretation
2.pre-construction
geolog
ical
desk
stud
yan
drisk
assessment
3.prob
edrillingah
eadof
face
and
beneathtunn
elto
detect
areasof
weakgrou
nd.M
onitoringratesof
drillingan
dcharacterof
drill
cuttings*
4.identification
ofminingfeatures
5.geolog
ical
map
ping
toidentify
weak
ordisturbedstrata*
6.usecopy
cuttersin
weakgrou
ndto
increase
tunn
eldiam
eter*
7.consideralso
likelihoo
dof
hazards:15
MM
M1.
failu
reto
identify
grou
ndcond
itions
2.difficultiesin
mov
ing
TBM
forw
ard
3.difficultiesin
placing
lining
4.delays
inprog
ramme
5.incorrectlin
ingselection
6.po
stconstruction
lining
failu
re7.
increasedmaintenan
cecosts

(con
tinu
ed)
Hazard
Consequenceofeventontunnel
Possiblemitigationmeasurespriorto
anddu
ring
construction
toredu
celik
elihoo
dor
consequenceof
hazard
Notes
*indicatestechniqu
emorelik
ely
than
others
tobe
useful
Impa
ctof
mitigation
measuresan
drisk
Summaryof
main
residu
alrisks
Number
Title
Exa
mpleof
circum
stan
ces
LikelihoodðLÞ
ConsequenceðCÞ
Risk(LxC)
15Sq
ueezinggrou
ndas
14ab
ove
M1.
GIbo
reho
lesstructural
interpretation
2.pre-construction
geolog
ical
desk
stud
yan
drisk
assessment
3.prob
edrillingah
eadof
face
and
beneathtunn
elto
detect
areasof
weakgrou
nd.M
onitoringratesof
drillingan
dcharacterof
drill
cuttings*
4.identification
ofminingfeatures
5.geolog
ical
map
ping
toidentify
weak
ordisturbedstrata*
6.useof
copy
cuttersin
weakgrou
ndto
increase
tunn
eldiam
eter*
7.consideralso
likelihoo
dof
hazards:14
MM
M1.
failu
reto
identify
grou
ndcond
itions
2.difficultiesin
mov
ing
TBM
forw
ard
3.difficultiesin
placing
lining
4.delays
inprog
ramme
5.incorrectlin
ingselection
6.po
stconstruction
failu
reof
tunn
ellin
ing
7.increasedmaintenan
cecosts
16Sh
ockload
ingof
tunn
ellin
ing
colla
pseof
karst,old
mine
working
sab
ove,
below
orad
jacent
totunn
ellin
ing.
Earthqu
ake,
faultrupture
H1.
GIbo
reho
lesprov
ingof
extensive
karstfeaturesor
open
mineworking
s2.
pre-construction
geolog
ical
desk
stud
yan
drisk
assessment*
3.seismicha
zard
assessment
4.detectionof
cavities
>>tunn
eldiam
eter
from
prob
edrillingah
ead
ofan
darou
ndtheface
throug
hTBM
head
*5.
TSP
todetect
cavities
invicinity
oftunn
elbo
re*
LH
H1.
failu
reto
detect
cavities
2.failu
reof
grou
ting
prog
ramme
3.inab
ility
togrou
tworking
sdu
eto
depth
topo
grap
hy4.
tunn
elcolla
psean
dtempo
rary
loss
ofdrive
5.selectionof
incorrect
tunn
ellin
ing
continuedov
erleaf

(con
tinu
ed)
Hazard
Consequenceofeventontunnel
Possiblemitigationmeasurespriorto
anddu
ring
construction
toredu
celik
elihoo
dor
consequenceof
hazard
Notes
*indicatestechniqu
emorelik
ely
than
others
tobe
useful
Impa
ctof
mitigation
measuresan
drisk
Summaryof
main
residu
alrisks
Number
Title
Exa
mpleof
circum
stan
ces
LikelihoodðLÞ
ConsequenceðCÞ
Risk(LxC)
6.useconcrete
rather
than
spheroidal
steellining
7.po
stconstruction
micrograv
ity
survey
(gradiom
etry)alon
glin
eof
tunn
elto
locatean
ddeterm
inesize
ofcavities
invicinity
(30m
radius)of
tunn
el8.
consider
also
likelihoo
dof
hazards:
1,2,
3,5,
6,7,
8,9,
10,1
1,16
and17
6.po
stconstruction
damag
eto
tunn
ellin
ing
7.high
errisk
ofwater
inrush
throug
hda
maged
lining
17Con
taminated
grou
ndindu
strial
and
domestic
effluents
disposed
ofdo
wnmine
shafts
L1.
GIbo
reho
lesprov
ingcontam
ination
2.GIinvestigationidentifyingpo
stmininguses
ofmineshaftsan
dad
its*
3.pre-construction
geolog
ical
desk
stud
yan
drisk
assessment*
4.mon
itoringof
spoilp
ropertiesdu
ring
tunn
ellin
g*5.
mon
itoringof
tunn
elatmosph
ere
6.consider
also
likelihoo
dof
hazards:
1,2,
3,7,
8,9,
10,1
1,12
,and
16
LL
L1.
failu
reto
identify
contam
inan
ts2.
high
errisk
ofha
zard
2from
petroleum
wastes
3.injury
(sho
rtan
dlong
-term
)to
workforce
4.selectionof
incorrect
tunn
ellin
ing
5.corrosionof
tunn
ellin
ing

Appendix E-3 Example risk register
Table of typical tunnelling hazards and possible mitigation measuresto be considered during design and construction (modified fromBrown, 1999 with reference to Channel Tunnel Rail Link).
Hazard(alphabetical)
Aspect Mitigations/actions
Access/egress To site and work areas Safe routes and methods
Biological healthhazards
Burial sites, etc.
Site investigationLiaison with authoritiesAvoid disturbance/minimiseAppropriate disposal
Confined spaces
Asphyxiation, explosion, flooding, heat,humidity:a) Existing confined spacesb) Confined spaces to be constructed/
maintained
Minimise need for working in confinedspaces in designReduce need to enter confined spacesSafe working practices
Contaminatedland
Contaminated groundGround gas
Site investigation to identifyAvoid disturbanceVentilation and monitoringAppropriate disposal
Demolition andsite clearance
To existing structures
Survey structures and conditionConsider stabilityPlan and phase work to minimisedisturbanceFencing and security
New structuresDesign to ensure practical and safesequenceCommunication
Earthworks Ground movements
Site investigationMinimise earthworksConsider effect on existing structuresAdequate information to Contractor
Excavation
Collapse, or falls associated with groundmovements
GI to identify design constraintsMinimise deep excavationConsider existing structuresAdequate information to Contractor
Areas prone to flooding (cavernouslimestone, old mine workings, etc.)
Site investigationLiaise with authorities re floodpotentialSafety plan
Contaminated ground, ground gas, oldmine workings
See contaminated land aboveProbing ahead/geophysics
Appendix E 415

(continued)
Hazard(alphabetical)
Aspect Mitigations/actions
Fire/explosionGeneral constructionConfined spaces and tunnels
Use non-flammable and benignmaterialsAppropriate plant and machineryEmergency systems including liaisonwith emergency services
Mechanical liftingoperations
Impacts and loads
Design works to minimise interactionwith existing structuresDesign detailing and documentation
Maintenance Access/egress to working environment
Incorporate into designHigh durability materials and detailsAllow for accessAddress residual risks
Manual handlingMinimiseDesign to ensure legislationcompliance
Noise andvibration
General construction
Specification of methods andtechniquesSet limits and ensure compliance withhealth and safety requirements
Public safety
Minimise disruption and interactionby phasing works and designSecurity fencing and controlMinimise influence of subsequentmaintenance works
Services Overhead and underground services
Agree with utility providersAvoid diversionsAvoid work near servicesProvide information on services andsignage
Site plant/traffic
Ensure adequate site sizeTraffic control measuresPhase worksMaximise separation between plantand personnel
Substanceshazardous tohealth
Identify hazardsEliminate or substituteReduce exposureProper handling
Temporarystability ofstructures
Existing structures affected by works
Consider existing structure stabilityProvide info to ContractorCondition surveys
Unexplodedordnance (bombs)
Site investigation including desk studySurvey and use specialistsEmergency plan

References
AASHTO 2007. LRFD Bridge Design Specification, 4th edition. AmericanAssociation of State Highway and Transportation Officials, Washington DC.
Abrahamson, M.W. 1992. Abbeystead – a legal view. Proceedings of the ICE, CivilEngineering, 92, 98–99.
Al-Harthi, A.A. & Hencher, S.R. 1993. Modelling stability of the Pen-Y-Clip tunnel,UK. Safety and Environmental Issues in Rock Engineering, Eurock ‘93, Lisbon:Balkema, 451–459.
Al-Sanad, H.A., Shaqour, F.M., Hencher, S.R. & Lumsden, A.C. 1990. The influenceof changing groundwater levels on the geotechnical behaviour of desert sands.Quarterly Journal of Engineering Geology, 23, 357–364.
Allum, J.A.E. 1966. Photogeology and Regional Mapping. Oxford: Pergamon Press,107p.
Ambraseys, N.N. & Hendron, A.J. Jr. 1968. Dynamic behaviour of rock masses.Chapter 7 in Rock Mechanics in Engineering Practice, Stagg, K.G. & Zienkiewicz,O.C. (eds.), New York: Wiley, 203–236.
Ambraseys, N.N., Simpson, K.A. & Bommer J.J. 1996. Prediction of horizontalresponse spectra in Europe. Earthquake Engineering & Structural Dynamics, 25,371–400.
Ambraseys, N.N. & Srbulov, M. 1995. Earthquake-induced displacements of slopes.Soil Dynamics & Earthquake Engineering, 14, 59–72.
Ameen,M.S. 1995. Fractography: fracture topography as a tool in fracture mechanicsand stress analysis. An introduction. In Fractography: Fracture Topography as aTool in Fracture Mechanics and Stress Analysis, Ameen, M.S. (ed.), London:Geological Society London Special Publication No. 92, 1–10.
American Society for Testing and Materials 1999. Standard Practice for RockCore Drilling and Sampling of Rock for Site Investigation, ASTM, D 2113–99,20p.
Anderson, A.E., Weiler, M., Alila, Y. & Hudson, R.O. 2008. Dye staining andexcavation of a lateral preferential flow network. Hydrology and Earth SystemSciences Discussions, 5, 1043–1065.
Anderson, E.M. 1951. The Dynamics of Faulting. Edinburgh: Oliver and Boyd, 206p.Anon 1970. The logging of rock cores for engineering purposes.Quarterly Journal ofEngineering Geology, 3, 1–14.
Anon 1972. The preparation of maps and plans in terms of engineering geology.Quarterly Journal of Engineering Geology, 5, 293–382.
Anon 1985. Liquefied petroleum gas caverns at South Killingholme. Photographicfeature. Quarterly Journal of Engineering Geology, 18, 1, ii–iv.
Anon 1995. The description and classification of weathered rocks for engineeringpurposes. Geological society engineering group working party report. QuarterlyJournal of Engineering Geology, 28, 207–242.

Archambault, G., Verreault, N., Riss, J. & Gentier, S. 1999. Revisiting Fecker-Rengers-Barton’s methods to characterize joint shear dilatancy. In RockMechanics for Industry, Amadei, Kranz, Scott & Smeallie (eds.), Rotterdam:Balkema, 423–430.
Association of Geotechnical & Geoenvironmental Specialists 2006. AGS Guidelinesfor Good Practice in Site Investigation, 2p.
Atkinson, J.H. 2000. Non-linear soil stiffness in routine design. Géotechnique, 50,487–508.
Atkinson, J.H. 2007. The Mechanics of Soils and Foundations, 2nd edition. London:Taylor & Francis, 442p.
Australian Standards 1993. Geotechnical site investigations. AS–1726.Baecher, G.B. & Christian, J.T. 2003. Reliability and Statistics in GeotechnicalEngineering. London and New York: Wiley, 605p.
Bahat, D., Grossenbacher, K. & Karasaki, K. 1999. Mechanism of exfoliation jointformation in granitic rocks, Yosemite National Park. Journal of Structural Geology,21, 85–96.
Bandis, S.C. 1990. Scale effects in the strength and deformability of rocks and rockjoints. In Scale Effects in Rock Masses, Pinto da Cunha (ed.), Rotterdam: Balkema,59–76.
Bandis, S.C., Lumsden, A.C. & Barton, N.R. 1981. Experimental studies of scaleeffects on the shear behaviour of rock joints. International Journal of RockMechanics and Mining Sciences and Geomechanics Abstracts, 18, 1–21.
Banyard, J.K, Coxon, R.E. & Johnston, T.A. 1992. Carsington Reservoir –
reconstruction of the dam. Proceedings of the ICE – Civil Engineering, 92,106–115.
Barla, G., Barla, M., Camusso, M. & Martinotti, M.E. 2007. Setting up a new directshear testing apparatus. Proceedings of the 11th Congress of the InternationalSociety for Rock Mechanics, 1, 415–418.
Barla, G. & Jarre, P. 1993. Tunnelling under an industrial waste landfill in Italy:Environmental controls and excavation procedures. Safety and EnvironmentalIssues in Rock Engineering, Eurock ‘93, Lisbon: Balkema, 259–266.
Barla, G. & Pelizza, S. 2000. TBM Tunnelling in difficult conditions. Proceedings ofGeoEng 2000, Melbourne, Australia, 329–354.
Barton, N.R. 1973. Review of a new shear-strength criterion for rock joints.Engineering Geology, 7, 287–332.
Barton, N.R. 1990. Scale effects or sampling bias? Proceedings of 1st InternationalWorkshop on Scale Effects in Rock Masses, Loen, Norway, 31–55.
Barton, N.R. 2000. TBM Tunnelling in Jointed and Faulted Rock. Rotterdam:Balkema, 173p.
Barton, N. 2002. Some new Q-value correlations to assist in site characterization andtunnel design. International Journal of Rock Mechanics and Mining Science, 39,185–216.
Barton, N.R. 2003. TBM or drill-and-blast. Tunnels & Tunnelling International,June, 20–22.
Barton, N.R. 2005. Comments on ‘A critique of QTBM’. Tunnels & TunnellingInternational, July, 16–19.
Barton, N.R. & Bandis, S.C. 1990. Review of predictive capabilities of JRC-JCSmodel in engineering practice. In Rock Joints, Proceedings InternationalSymposium on Rock Joints, Loen, Norway, Barton, N. & Stephansson, O. (eds.),Rotterdam: Balkema, 603–610.
Bates, A.D. 1981. Profit or loss pivot on pre-dredging surveys. Dredging + PortConstruction, April 1981, Intec Press, UK. [Referenced in PIANC (2000) Siteinvestigation requirements for dredging works, Report of Working Group No. 23,32p.]
418 References

Baynes, F.J. 2007. Sources of geotechnical risk. Engineering Geology in GeotechnicalRisk Management, Hong Kong Regional Group of the Geological Society ofLondon, 1–12.
Beer, A.J., Stead, D. & Coggan, J.S. 2002. Estimation of the Joint RoughnessCoefficient (JRC) by visual comparison. Rock Mechanics & Rock Engineering,35, 65–74.
Bell, D.K. & Davidson, B.J. 1996. Response identification of Pacoima Dam for the1994 Northridge Earthquake. Eleventh World Conference on EarthquakeEngineering, Oxford, Disc 2, Paper No. 774.
Bell, F.G. 1999. Geological Hazards. London and New York: Taylor & Francis.Benson, R. 1989. Design of unlined and lined pressure tunnels. Tunnelling andUnderground Space Technology, 4, 2, 155–170.
Bieniawski, Z.T. 1976. Rock mass classification in rock engineering. In Explorationfor Rock Engineering, Proceedings of Symposium, Bieniawski, Z.T. (ed.), 1,97–106.
Bienawski, Z.T. 1989. Engineering Rock Mass Classifications. New York: Wiley,251p.
Bird, M.I., Chang, C.H., Shirlaw, J.N., Tan, T.S. & Teh, T.S. 2003. The age andorigin of the quaternary sediments of Singapore with emphasis on the Marine Clay.Proceedings of Underground Singapore 2003, Singapore, 428–440.
Bisci, C., Dramis, F. & Sorriso-Valvo, M. 1996. Rock Flow (Sackung). Chapter 7.2 inLandslide Recognition, Dikau, R., Brunsden, D., Schrott, L. & Ibsen, M.L. (eds.),Chichester: Wiley, 150–160.
Black, J.H. 2010. The practical reasons why slug tests (including falling and risinghead tests) often yield the wrong value of hydraulic conductivity.Quarterly Journalof Engineering Geology, 43, 345–358.
Black, J.H., Barker, J.A. & Woodman, N.D. 2007. An Investigation of ‘SparseChannel Networks’. Report No. R-07–35. Svensk Kärnbränslehantering AB(SKB), 123p.
Blake, J.R., Renaud, J.-P. Anderson, M.G. & Hencher, S.R. 2003. Retaining wallimpact on slope hydrology using a high-resolution finite element model. Computersand Geotechnics, 30, 6, 431–442.
Blockley, D.I. 2011. Engineering safety. Proceedings of the Institution of CivilEngineers: Forensic Engineering, 164, Issue FE1, 7–13.
Blyth, F.G.H. & de Freitas, M.H. 1984. A Geology for Engineers, 7th edition.London: Edward Arnold, 325p.
Bo,M.W., Na, Y.M.&Arulrajah, A. 2009. Densification of granular soil by dynamiccompaction. Proceedings of the Institution of Civil Engineers: GroundImprovement, 162, 121–132.
Bock, H. 2006. Common ground in engineering geology, soil mechanics and rockmechanics: past, present and future. Bulletin Engineering Geology&Environment,65, 209–216.
Bommer, J.J. & Martinez-Pereira, A. 1999. The effective duration of earthquakestrong motion. Journal of Earthquake Engineering, 3, 127–172.
Bond, A.J. & Harris, A. 2008. Decoding Eurocode 7. London: Taylor and Francis,598p.
Bond, A.J. & Simpson, B. 2010. Pile design to Eurocode 7 and the UK NationalAnnex. Part 2: UK National Annex. Ground Engineering, January, 28–31.
Bowden, F.P. & Tabor, D. 1950. The Friction and Lubrication of Solids. Part I.Oxford: Clarendon Press.
Bowden, F.P. & Tabor, D. 1964. The Friction and Lubrication of Solids. Part II.Oxford: Clarendon Press.
Bowles, J.E. 1996. Foundation Analysis andDesign, 5th edition. NewYork:McGrawHill, 1175p.
References 419

Brady, B.H.G. & Brown, E.T. 2004. Rock Mechanics for Underground Mining, 3rdedition. Berlin and New York: Springer.
Brambati, A., Carbognin, L., Quaia, T., Teatini, P. & Tosi, L., 2003. The Lagoon ofVenice: geological setting, evolution and land subsidence. Episodes: Journal ofInternational Geoscience, 26, 3, 264–268.
Brand E.W., Hencher, S.R. & Youdan, J.D. 1983. Rock slope engineering in HongKong. Proceedings of the 5th International Rock Mechanics Congress, Melbourne,17–24.
Bray, R.N., Bates, A.D. & Land, J.M. 1997. Dredging. A Handbook for Engineers,2nd edition. Oxford: Butterworth-Heinemann, 434p.
Bridges, M.C. 1990. Identification and characterisation of sets of fractures and faultsin rock. Proceedings of the International Symposium on Rock Joints, Loen,Norway, 19–25.
British Standards Institution 1964. BS3618:1964, Sec. 5. Glossary of Mining Terms,Geology, 18p.
British Standards Institution 1981a. BS 6031:1981 Code of Practice for Earthworks.British Standards Institution 1981b. BS 5930:1981 Code of Practice for SiteInvestigations (Formerly CP 2001), 147p.
British Standards Institution 1986. BS 8004:1986 Code of Practice for Foundations.British Standards Institution 1989. BS 8081:1989 Code of Practice for GroundAnchorages.
British Standards Institution 1990. BS 1377:1990 Methods of Test for Soils for CivilEngineering Purposes (9 parts).
British Standards Institution 1994. BS 8002:1994 Code of Practice for EarthRetaining Structures.
British Standards Institution 1999. BS 5930:1999 Code of Practice for SiteInvestigation. 206p.
British Standards Institution 2000. BS EN 1537:2000 Execution of SpecialGeotechnical Work – Ground Anchors.
British Standards Institution 2001. BS 10175:2001 Code of Practice for Investigationof Potentially Contaminated Sites.
British Standards Institution 2002. EN ISO 14688–1.Geotechnical Investigation andTesting – Identification and Classification of Soil – Part 1: Identification andDescription.
British Standards Institution 2003. EN ISO 14689–1.Geotechnical Investigation andTesting – Identification and Classification of Rock – Part 1: Identification andDescription.
British Standards Institution 2004. EN 1997–1:2004. Eurocode 7: GeotechnicalDesign. Part 1: General Rules. Code of Practice.
British Standards Institution 2007. EN 1997–2:2007. Eurocode 7: GeotechnicalDesign. Part 2: Ground Investigation and testing. Code of Practice.
British Tunnelling Society 2003. The Joint Code of Practice for Risk Management ofTunnel Works in the UK, 18p.
British Tunnelling Society 2005. Closed-Face Tunnelling Machines and GroundStability. London: Thomas Telford.
Broch, E., Myrvang, A.M. &. Stjern, G. 1996. Support of large rock caverns inNorway. Tunnelling and Underground Space Technology, 11, 11–19.
Broms B.B. & Lai P.H. 1995. The Republic Plaza in Singapore – Foundation Design,Bengt B. Broms Symposium on Geotechnical Engineering, Singapore, 3–24.
Brook, N. 1993. The measurement and estimation of basic rock strength. InComprehensive Rock Engineering, Volume 3, Hudson, J. (ed.), Oxford: PergamonPress, 41–66.
Brown, E.T. 2008. Estimating the mechanical properties of rock masses. InProceedings, 1st Southern Hemisphere International Rock Mechanics
420 References

Symposium, Perth, 16–19 September, Potvin, Y., Carter, J., Dyskin, A.& Jeffrey, R.(eds.), 1, 3–22.
Brown, R.H.A. 1999. The management of risk in the design and construction oftunnels. Korean Geotechnical Society, Tunnel Committee Seminar, 21st Seminar,21 September, 22p.
Brunsden, D. 2002. Geomorphological roulette for engineers and planners: someinsights into an old game. Quarterly Journal of Engineering Geology &Hydrogeology, 35, 101–142.
Buckingham, R.J. 2003. Problems Associated with Water Ingress into HardRock Tunnels. MSc (Applied Geosciences) dissertation, Hong Kong University,unpublished, 39p.
Bulletin of Atomic Scientists 1976. Preface to the Royal Commission onEnvironmental Pollution. Sixth Report, Nuclear Power and the Environment.
Bunce, C.M., Cruden, D.M. & Morgenstern, N.R. 1997. Assessment ofthe hazard from rockfall on a highway. Canadian Geotechnical Journal, 34,344–356.
Burland, J. 2007. Terzhagi: back to the future. Bulletin Engineering Geology andEnvironment, 66, 29–33.
Burland, J.B. 1990. On the compressibility and shear strength of natural clays.Géotechnique, 40, 329–378.
Burland, J.B. 2008. Interlocking, and peak and design strengths. Discussion ofSchofield, A.N., 2006, Géotechnique, 58, 527.
Burland, J.B. & Burbidge, M.C. 1985, Settlement of foundations on sand and gravel.Proceedings of the Institution of Civil Engineers, 78, 1325–1381.
Burnett, A.D., Brand, E.W. & Styles, K.A. 1985. Terrain classification mapping for alandslide inventory in Hong Kong. Proceedings IVth International Conference andField Workshop on Landslides, Tokyo, 63–68.
Buttling, S. 1986. Remedial works to amajor rock slope inHongKong. Proceedings ofthe Conference on Rock Engineering and Excavation in an Urban Environment,Hong Kong, 41–48.
Byerlee, J.D. 1978. Friction of rocks. Pure Applied Geophysics, 116, 615–626.CALTRANS 2010. Soil and Rock Logging, Classification, and Presentation Manual,81p. http://www.dot.ca.gov/hq/esc/geotech/sr_logging_manual/page/logging_manual_2010.pdf
Carter, T.G., de Graaf, P., Booth, P., Barrett, S. & Pine, R. 2002. Integration ofdetailed field investigations and innovative design key factors to the successfulwidening of the Tuen Mun Highway. Proceedings of the 22nd Annual Seminar,organised by the Geotechnical Division of the Hong Kong Institution of Engineers,8 May 2002, 187–201.
Carter, T.G., Diederichs, M.S. & Carvalho, J.L. 2008. Application of modifiedHoek-Brown transition relationships for assessing strength and post-yieldbehaviour at both ends of the rock competence scale. Proc. SAIMM, 108,325–338.
Carvalho, J.L., Carter, T.G. & Diederichs, M.S. 2007. An approach for prediction ofstrength and post yield behaviour for rock masses of low intact strength.Proceedings 1st Canadian-US Rock Mechanics Symposium. Meeting Society’sChallenges and Demands, Vancouver, 249–257.
Casagrande, A. 1965. Classification and identification of soils.Transactions AmericanSociety Civil Engineers, 113, 901–992.
Cederstrom, M., Thorsall P.-E., Hildenwall, B. &Westberg, S.-B. 2005. Incident withloss of seven post-tensioned 72 ton anchors in a dam. Dam Safety 2005Proceedings, Association of State Dam Safety Officials.
Challinor, J.A. 1964. A Dictionary of Geology, 2nd edition. Cardiff: University ofWales Press, 289p.
References 421

Chandler, R.J. 1969. The effects of weathering on the shear strength properties ofKeuper Marl. Géotechnique, 19, 321–334.
Chandler, R.J. 2000. Clay sediments in depositional basins: the geotechnical cycle.Quarterly Journal Engineering Geology and Hydrogeology, 33, 7–39.
Chaplow, R. 1996. The geology and hydrogeology of Sellafield: an overview.Quarterly Journal of Engineering Geology, 29, S1–S12.
Charles, J.A. 2002. Ground improvement: the interaction of engineering science andexperience based technology. Géotechnique, 52, 527–532.
Chen, T.-C., Lin, M.-L. & Hung, J.-J. 2003. Pseudostatic analysis of Tsao-Ling rock-slide caused by Chi-Chi earthquake. Engineering Geology, 71, 31–47.
Cheng, Y. & Liu, S.C. 1993. Power caverns of Mingtan Pumper Storage Project,Taiwan. InComprehensive Rock Engineering, Volume 5, Surface andUndergroundProject Case Histories (Editor in Chief, J.A. Hudson; Volume Editor, E. Hoek),Oxford: Pergamon Press, 111–132.
Chigira, M., Wang, W-N, Furya, T. & Kamai, T. 2003. Geological causes andgeomorphological precursors of the Tsaoling landslide triggered by the 1999Chi-Chi earthquake, Taiwan. Engineering Geology, 68, 259–273.
Chigira, M. & Yahi, H. 2006. Geological and geomorphological characteristics oflandslides triggered by the 2004 Mid Niigata prefecture earthquake in Japan.Engineering Geology, 82, 202–221.
China Ministry of Construction 2009. Code of Investigation of GeotechnicalEngineering. National Standard of the People’s Republic of China, GB5OO21–2001 (2009 edition), 269p.
Cho, S-M., Ahn, S-S., Lee, Y-K. &Oh, S-T. 2009a. Incheon Bridge: facts and the stateof the art. Proceedings of the International Commemorative Symposium for theIncheon Bridge, 18–28.
Cho, S-M., Kim, J-H., Lee, H-G., Kim, Z-C., Shin, S-H., Song,M-J., Kim, D-J.& Park,Y-H. 2009b. Pile load tests on the Incheon Bridge Project. Proceedings of theInternational Commemorative Symposium for the Incheon Bridge, 488–499.
Choot, E.B. 1983. Landslide Studies 1982 Case Study No. 9 Tsing Yi (2). SpecialProject Report No. SPR 10/83, Geotechnical Control Office, Hong Kong, 44p.
Chung, S.G., Kim, G.J., Kim,M.S.&Ryu, C.K. 2007. Undrained shear strength fromfield vane test on Busan clay.MarineGeoresources&Geotechnology, 25, 167–179.
Cole, K.W. 1988. Foundations. ICE Works Construction Guides, London: ThomasTelford Ltd., 82p.
Combault, J., Morand, P. & Pecker, A. 2000. Structural response of the Rion AntirionBridge. Proceedings of the 12th World Conference on Earthquake Engineering,Auckland, Australia.
Construction Industry Research and Information Association (CIRIA) 1995. RemedialTreatment for Contaminated Land. Volume III: Site Investigation and Assessment.
Construction Industry Research and Information Association (CIRIA) 2005. TheRock Manual. The Use of Rock in Hydraulic Engineering, 2nd edition. C683,CIRIA, London.
Clayton, C.R.I. 1995.The Standard Penetration Test (SPT): Methods andUse. CIRIAReport 143, 144p.
Clayton, C.R.I. 2001. Managing Geotechnical Risk: Improving Productivity in UKBuilding and Construction. London: Thomas Telford, 80p.
Clayton, C.R.I. 2011. Stiffness at small strain: research and practice. Géotechnique,61, 5–37.
Clayton, C.R.I, Simons, N.E. & Mathews, M.C. 1995. Site Investigation. AHandbook for Engineers, 2nd edition. London: Granada, 424p.
Clover, A.W. 1986. Slope stability on a site in the volcanic rocks of Hong Kong.Proceedings of the Conference on Rock Engineering and Excavation in an UrbanEnvironment, Hong Kong, 121–134.
422 References

Coburn, A. & Spence, R. 1992. Earthquake Protection. Chichester: Wiley, 355p.Combault, J., Morand, P. & Pecker, A. 2000. Structural response of theRion-Antirion Bridge. 12th World Conference Earthquake Engineering, Paper1609, 7p.
Cooper, A.H. & Waltham, A.C. 1999. Photographic Feature: Subsidence caused bygypsum dissolution at Ripon, North Yorkshire. Quarterly Journal of EngineeringGeology, 32, 4, 305–310.
Coulson, J.H. 1971. Shear strength of flat surfaces of rock. Proceedings of the 13th USSymposium on Rock Mechanics, Urbana, Illinois, 77–105.
Craig, R.F. 1992. Soil Mechanics, 5th edition. Chapman & Hall, 427p.Crawford, A.M. & Curran, J.H. 1982. The influence of rate and displacementdependant, shear resistance on the response of rock slopes to seismic loads.International Journal of Rock Mechanics & Mining Sciences and GeomechanicsAbstracts, 19, 1–8.
Culshaw, M.G. 2005. From concept towards reality: developing the attributed 3Dgeological model of the shallow subsurface. Quarterly Journal of EngineeringGeology and Hydrogeology, 38, 231–284.
Cunha, A.P. 1990. Scale effects in rock mechanics. In Proceedings 1st InternationalWorkshoponScaleEffects inRockMasses, PintodaCunba (ed.), Loen,Norway, 3–27.
Darracott, B.W. & McCann, D.M. 1986. Planning engineering geophysical surveys.In S I Practice: Assessing BS5930, Geological Society, Engineering Geology SpecialPublication No. 2, A.B. Hawkins (ed.), 85–90.
Das, B.M. & Sivakugan, N. 2007. Settlements of shallow foundations on granularsoil – an overview. International Journal of Geotechnical Engineering, 1, 19–29.
Davies, R.J., Mathioas, S.A., Swarbrick, R.E. & Tingay, M.J. 2011. Probabilisticlongevity estimate for the LUSI mud volcano, East Java. Journal of the GeologicalSociety, London, 168, 517–523.
Davis, E.H.& Poulos, H.G. 1967. Laboratory investigations of the effects of sampling.Civil Engineering Transactions (Australia), CE9, 86–94.
Davis, G.H. & Reynolds, S.J. 1996. Structural Geology of Rocks and Regions, 2ndedition. John Wiley & Sons, 776p.
Dearman, W.R. & Coffey, J.R. 1981. Effects of evaporite removal on the massproperties of limestone. Bulletin of the International Association of EngineeringGeology, 24, 91–96.
Dearman, W.R. & Fookes, P.G. 1974. Engineering geological mapping for civilengineering practice in the United Kingdom. Quarterly Journal of EngineeringGeology and Hydrogeology, 7, 223–256.
Deere, D.U. 1968. Geological considerations. Chapter 1 in Rock Mechanics inEngineeringPractice, Stagg,K.G.&Zienkiewicz,O.C. (eds.),NewYork:Wiley, 1–20.
Deere, D.U. 1971. The foliation shear zone – an adverse engineering geologic featureof metamorphosed rocks. Journal of the Boston Society of Civil Engineers, 60, 4,1163–1176.
Deere, D.U. & Deere, D.W. 1988. The RQD index in practice. ProceedingsSymposium on Rock Classification for Engineering Purposes, ASTM SpecialTechnical Publications 984, Philadelphia, 91–101.
de Freitas, M.H. 2009. Geology; its principles, practice and potential for Geotechnics.Quarterly Journal of Engineering Geology and Hydrogeology, 42, 397–441.
DeGraff, J.M. & Aydin, A. 1987. Surface morphology of columnar joints and itssignificance to mechanics and direction of joint growth. Geological Society ofAmerica Bulletin, 99, 605–617.
Derbyshire, E. 2001. Geological hazards in loess terrain, with particular reference tothe loess regions of China. Earth-Science Reviews, 54, 231–260.
Dering, C. 2003. Discussion. Proceedings 14th SE Asian Geotechnical Conference,Hong Kong, 3, 41–43.
References 423

Dershowitz, W. & LaPointe, P. 1994. Discrete fracture approaches for oil and gasapplications. In Proceedings 1st North American Rock Mechanics Symposium,Rock Mechanics, Nelson & Laubach (eds.), Rotterdam: Balkema, 19–30.
Dershowitz, W., Lee, G., Geier, J., Foxford, T., LaPointe, P. & Thomas, A. 1996.FracMan Interactive Discrete Feature Data Analysis, Geometric Modeling, andExploration Simulation, User Documentation, Version 2.5. Redmond,Washington: Golder Associates.
Devonald, D.M., Thompson, J.A., Hencher, S.R. & Sun, H.W. 2009.Geomorphological landslide models for hazard assessment – a case study atCloudy Hill. Quarterly Journal Engineering Geology, 42, 473–486.
Diederichs, M.S. 2003. Rock fracture and collapse under low confinement conditions.Rock Mechanics and Rock Engineering, 36, 339–381.
Dobie, M.J.D. 1987. Slope instability in a profile of weathered norite. QuarterlyJournal of Engineering Geology and Hydrogeology, 20, 279–286.
Döse, C. Stråhle, A., Rauséus, G., Samuelsson, E. & Olsson, O. 2008. Revision ofBIPS-Orientations for Geological Objects in Boreholes from Forsmark andLaxemar. Svensk Kärnbränslehantering AB (SKB Report No. P-08–37), 97p.
Douglas, P.M. & Voight, B. 1969. Anisotropy of granites: a reflection of microscopicfabric, Géotechnique, 19, 376–398.
Dowding, C.H. 1985. Blast Vibration Monitoring and Control. Saddle River, NJ:Prentice-Hall Inc., 297p.
Dowrick, D.J. 1988. Earthquake Resistant Design for Engineers and Architects, 2ndedition. Chichester: John Wiley & Sons.
Dumbleton,M.J.&West, G. 1970Air Photograph Interpretation for Road Engineersin Britain. Ministry of Transport, RRL Report, LR369, Road Research Laboratory,Crowthorne.
Dunnicliff, J. 1993.Geotechnical Instrumentation for Monitoring Field Performance.New York: Wiley, 577p.
Dusseault, M.B. & Morgenstern, N.R. 1979. Locked sands. Quarterly Journal ofEngineering Geology, 12, 117–131.
Early, K.R. & Skempton, A.W. 1972. Investigations of the landslide at Walton’sWood, Staffordshire. Quarterly Journal of Engineering Geology, 5, 19–41.
Eberhardt, E., Stead, D. & Coggan, J.S. 2004. Numerical analysis of initiation andprogressive failure in natural rock slopes – the 1991 Randa rockslide. InternationalJournal of Rock Mechanics and Mining Sciences, 41, 69–87.
Eberl, D.D. 1984. Clay formation and transformation in rocks and soils.Philosophical Transactions, Royal Society, London, A311, 241–257.
Ebuk, E.J. 1991. The Influence of Fabric on the Shear Strength Characteristics ofWeathered Granites. Unpublished PhD thesis, the University of Leeds, 486p.
Ebuk, E.J., Hencher, S.R. & Lumsden, A.C. 1993. The influence of structure on theshearing mechanism of weakly bonded soils. Proceedings 26th Annual Conferenceof the Engineering Group of the Geological Society, The Engineering Geology ofWeak Rock, Leeds, 207–215.
Edwards, R.J.G. 1971. The practical application of rock bolting – Jeffrey’s Mountrock cut on the M6. Journal Institution Highway Engineers, 17, 12, 21–27.
Egan, D. 2008. The ground: clients remain exposed to unnecessary risk.Proceedings of the Institution of Civil Engineers, Geotechnical Engineering,161, 189–195.
Eisma, D. (ed.) 2006.Dredging in Coastal Waters. Balkema: Taylor & Francis, 244p.Engelder, T. 1985. Loading paths to joint propagation during a tectonic cycle: anexample from the Appalachian Plateau, USA. Journal of Structural Geology, 7,459–476.
Engelder, T. 1999. Transitional-tensile fracture propagation: a status report. Journalof Structural Geology, 21, 1049–1055.
424 References

Engelder, T. & Peacock, D. 2001. Joint development normal to regional compressionduring flexural-slow folding: the Listock buttress anticline, Somerset, England.Journal of Structural Geology, 23, 259–277.
Fecker, E. & Rengers, N. 1971. Measurement of large scale roughness of rock planesby means of profilograph and geological compass. Proceedings Symposium onRock Fracture, Nancy, France, Paper 1–18.
Fell, R., Ho, K.K.S., Lacasse, S. & Leroi, E. 2005. A framework for landslide riskassessment and management. Landslide Risk Management, Hung, Fell, Couture &Eberhardt (eds.), 3–25.
Fletcher, C.J.N. 2004. Geology of Site Investigation Boreholes from Hong Kong.Applied Geoscience Centre, Hong Kong Construction Association and AGS (HongKong), 132p.
Fletcher, C.J.N., Wightman, N.R. & Goodwin, C.R. 2000. Karst related depositsbeneath Tung Chung New Town: implications for deep foundations. ProceedingsConference on Engineering Geology HK 2000, Institution of Mining andMetallurgy, Hong Kong, 139–149.
Fogg, G.E., Noyes, C.D. & Carle, S.F. 1998. Geologically based model of hetero-geneous hydraulic conductivity in an alluvial setting. Hydrogeology Journal, 6, 1,131–143.
Fookes P.G. 1997. Geology for engineers: the geological model, prediction andperformance. Quarterly Journal of Engineering Geology, 30, 293–431.
Fookes, P.G., Baynes, F.J. & Hutchinson, J.M. 2000. Total geological history: amodel approach to the anticipation, observation and understanding of groundconditions. GeoEng 2000, Melbourne, 1, 370–460.
Fookes, P.G. & Hawkins, A.B. 1988. Limestone weathering: its engineering signifi-cance and a proposed classification scheme. Quarterly Journal of EngineeringGeology, 21, 7–31.
Fookes, P.G. & Parrish, D.G. 1969. Observations on small-scale structural disconti-nuities in the London Clay and their relationship to regional geology. QuarterlyJournal of Engineering Geology, 1, 217–240.
Fookes, P.G., Sweeney, M., Manby, C.N.D. & Martin, R.P. 1985. Geological andgeotechnical engineering aspects of low-cost roads in mountainous terrain.Engineering Geology, 21, 1–13, 17–53, 57–65, 69–85, 91–99, 102, 105–109,115 –131, 133, 135–152.
Fry, N. 1984. The Field Description of Metamorphic Rocks. Milton Keynes, UK: TheOpen University Press, 110p.
Fujii, Y., Takemura, T., Takahashi, M. & Lin, W. 2007. Surface features of uniaxialtensile fractures and their relation to rock anisotropy in Inada granite. InternationalJournal of Rock Mechanics and Mining Science, 44, 98–107.
Note – all the following GCO and GEO publications are available to download from:http://www.cedd.gov.hk/eng/publications/http://www.cedd.gov.hk/eng/publications/
Geotechnical Control Office 1979. Geotechnical Manual for Slopes, 1st edition.Geotechnical Control Office, Hong Kong, 242p.
Geotechnical Control Office 1984a. Geotechnical Manual for Slopes, 2nd edition.Geotechnical Control Office, Hong Kong, 295p.
Geotechnical Control Office 1984b. Mid-Levels Study: Report on Geology,Hydrology and Soil Properties. Geotechnical Control Office, Public WorksDepartment, Hong Kong.
Geotechnical Control Office 1987. Guide to Site Investigation (Geoguide 2). HongKong Government, 359p.
Geotechnical Control Office 1988.Guide to Rock and Soil Descriptions (Geoguide 3).Geotechnical Engineering Office, Hong Kong, 189p.
Geotechnical Control Office 1990. Review of Design Methods for Excavations. GCOPublication No. 1/90, 192p.
References 425

Geotechnical Engineering Office 1992. Guide to Cavern Engineering (Geoguide 4).Geotechnical Engineering Office, Hong Kong, 156p.
Geotechnical Engineering Office 1993.Guide to RetainingWall Design (Geoguide 1),2nd edition. Geotechnical Engineering Office, Hong Kong.
Geotechnical Engineering Office 2000a. Highway Slope Manual. GeotechnicalEngineering Office, Hong Kong, 114p.
Geotechnical Engineering Office 2000b. Technical Guidelines on LandscapeTreatment and Bio-engineering of Man-made Slopes and Retaining Walls. GEOPublication No. 1/2000, Geotechnical Engineering Office, Hong Kong, 146p.
Geotechnical Engineering Office 2006. Foundation Design and Construction.Geotechnical Engineering Office, Hong Kong, 348p.
Geotechnical Engineering Office 2007. Engineering Geological Practice in HongKong, GEO Publication No. 1/2007, 278p.
Geotechnical Engineering Office 2009. Catalogue of Notable Tunnel Failure CaseHistories (up to December 2008). Geotechnical Engineering Office, Hong Kong.
Gioda, G. & Sakurai, S. 2005. Back analysis procedures for the interpretation of fieldmeasurements in geomechanics. International Journal forNumerical andAnalyticalMethods in Geomechanics, 11, 555–583.
Glossop, R. 1968. The rise of geotechnology and its influence on engineering practice.Eighth Rankine Lecture. Géotechnique, 18, 107–150.
Gomes, J.P., Batista A.L. &Oliveira, S. 2009. Damage-Chemo-Viscoelastic Model onthe Analysis of Concrete Dams under Swelling Processes. Proceedings InternationalConference on Long Term Behaviour of Dams (LTBD09), Graz.
Goodman, R.E. 1980. Introduction to Rock Mechanics. New York: John Wiley &Sons.
Goodman, R.E. 1993. Engineering Geology. Rock in Engineering Construction.New York: Wiley, 412p.
Goodman, R.E. 2002. Karl Terzaghi’s legacy in geotechnical engineering.Geo-strata,ASCE, October.
Goodman, R.E. 2003. Karl Terzhagi and engineering geology. In GeotechnicalEngineering, Ho, K.K.S. & Li, K.S. (eds.), Rotterdam: Balkema, 115–122.
Gordon, T., Scott, M.J. & Statham, I. 1996. The identification of bedding shears andtheir implications for road cutting design and construction. Prediction andPerformance in Rock Mechanics and Rock Engineering, Eurock ’96, Torino,Italy, 597–603.
Graham, R.H. 1981. Gravity sliding in the Maritime Alps. Geological Society,London, Special Publications, 9, 335–352.
Green, P.&Western, R. 1994.Time to Face the Inevitable. A Submission from Friendsof the Earth Ltd. to the UKDepartment of the Environment’s Review of RadioactiveWaste Management Policy, 72p.
Green, R.G. &Hawkins, A.B. 2005. Rock cut on the A5 at Glyn Bends, NorthWales,UK. Bulletin Engineering Geology and Environment, 64, 95–109.
Grose, W.J. & Benton, L. (2005). Hull wastewater flow transfer tunnel: tunnelcollapse and causation investigation. Geotechnical Engineering, 158, 4,179–185.
Hack, R. 1998. Slope Stability Probability Classification, SSPC, 2nd edition.International Institute for Aerospace Survey and Earth Sciences (ITC), PublicationNo. 43, 258p.
Haimson, B.C. 1992. Designing pre-excavation stress measurements for meaningfulrock characterization. In Rock Characterization, Eurock’92, Hudson, J.A. (ed.),London: Thomas Telford, 221–226.
HalcrowAsia Partnership 1998a.Report on the Ching Cheung Road Landslide of 3rdAugust 1997. Geotechnical Engineering Office, Hong Kong, GEO Report No.78, 47 p.
426 References

Halcrow Asia Partnership Ltd. 1998b. Report on the Landslide at Ten ThousandBuddha’sMonastery of 2 July 1997. GEOReport No. 77, Geotechnical EngineeringOffice, Hong Kong, 96p. http://www.cedd.gov.hk/eng/publications/geo_reports/geo_rpt077.htm
Hancock, P.L. 1985. Brittle microtectonics: principles and practice. Journal ofStructural Geology, 7, 437–457.
Hancock, P.L. 1991. Determining contemporary stress directions from neotectonicjoint systems. Philosophical TransactionsOf the Royal Society LandA, 337, 29–40.
Haneberg, W.C. 2008. Using close range terrestrial digital photogrammetry for 3-Drock slope modelling and discontinuity mapping in the United States. Bulletin ofEngineering Geology and the Environment, 4, 457–469.
Hardy, W.B. & Hardy, J.K. 1919. Note on static friction and on the lubricatingproperties of certain chemical substances. The Philosophical Magazine, 38,32–48.
Harris, D.I., Mair, R.J., Love, J.P., Taylor, R.N. & Henderson, T.O. 1994.Observations of ground and structure movements for compensation groutingduring tunnel construction at Waterloo station. Géotechnique, 44, 691–713.
Hartwell, D.J. 2006. Discussion: Hull wastewater flow transfer tunnel: tunnel collapseand causation investigation. Geotechnical Engineering, 2, 125–126.
Hashash, Y.M.A., Hook, J.J., Schmidt, B. & Yao, J.I.-C. 2001. Seismic design andanalysis of underground structures. Tunnelling and Underground SpaceTechnology, 16, 247–293.
Haszeldine, R.S. & Smythe, D.K. (eds.) 1996. Radioactive Waste Disposal atSellafield, UK. Site Selection, Geological and Engineering Problems. University ofGlasgow, 520p.
Hawkins, A.B. (ed.) 1986. Site Investigation Practice: Assessing BS 5930. GeologicalSociety of London, Engineering Geology Special Publication No. 2, 423p.
Hawkins, A.B., Larnach, W.J., Lloyd, I.M. & Nash, D.F.T. 1989. Selecting thelocation, and the initial investigation of the SERC soft clay test bed site. QuarterlyJournal of Engineering Geology and Hydrogeology, 22, 281–316.
Hawkins, A.B. & Pinches, G.M. 1987. Cause and significance of heave at LlandoughHospital, Cardiff – a case history of ground floor heave due to gypsum growth.Quarterly Journal of Engineering Geology, 20, 41–47.
Head, J.M. & Jardine, F.M. 1992. Ground-borne vibrations arising from piling.Technical note 142, Construction Industry Research and Information Association(CIRIA), UK.
Heald, M.T. & Larese, R.E. 1974. Influence of coatings on quartz cementation.Journal Sedimentary Petrology, 44, 1269–1274.
Health and Safety Executive 1985. The Abbeystead Explosion. A report of theinvestigation by the Health and Safety Executive into the explosion on 23 May1984 at the valve house of the Lune/Wyre Water Transfer Scheme atAbbeystead.
Health and Safety Executive 2000. The collapse of NATM tunnels at HeathrowAirport. 110p.
Heathcote, J.A., Jones, M.A. &Herbert, A.W. 1996. Modelling groundwater flow inthe Sellafield area. Quarterly Journal of Engineering Geology, 29, S59–S81.
Hencher, S.R. 1976. Correspondence: A simple sliding apparatus for themeasurementof rock friction. Géotechnique, 26, 4, 641–644.
Hencher, S.R. 1977. The Effect of Vibration on the Friction between Planar RockSurfaces. Unpublished PhD thesis, Imperial College Science and Technology,London University.
Hencher, S.R. 1981a. Friction parameters for the design of rock slopes to withstandearthquake loading. Proceedings of Conference on Dams and Earthquake, ICE,London, 79–87.
References 427

Hencher, S.R. 1981b. Report on Slope Failure at Yip Kan Street (11SW-D/C86)Aberdeen on 12th July 1981. Geotechnical Control Office Report No. GCO 16/81,Geotechnical Control Office, Hong Kong, 26p.
Hencher, S.R. 1983a. Landslide Studies 1982 Case Study No. 4 South Bay Close.Special Project Report No. SPR 5/83, Geotechnical Control Office, Hong Kong, 38p.
Hencher, S.R. 1983b. Landslide Studies 1982 Case Study No. 5 Tuen MunHighway. Special Project Report No. SPR 6/83, Geotechnical Control Office,Hong Kong, 42p.
Hencher, S.R. 1983c. Landslide Studies 1982 Case Study No. 10 Ching CheungRoad. Special Project Report No. SPR 11/83, Geotechnical Control Office, HongKong, 38p.
Hencher, S.R. 1983d. Landslide Studies 1982 Case Study No. 1 Chai Wan Road.Special Project Report No. SPR 2/83, Geotechnical Control Office, HongKong, 34p.
Hencher, S.R. 1983e. Summary Report on Ten Major Landslides in 1982. SpecialProject Report No. SPR 1/83, Geotechnical Engineering Office, Hong Kong, 28p.
Hencher, S.R. 1983f. Landslide Studies 1982 Case Study No. 8 Tsing Yi (1). SpecialProject Report No. SPR 9/83, Geotechnical Control Office, Hong Kong, 36p.
Hencher, S.R. 1985. Limitations of stereographic projections for rock slope stabilityanalysis. Hong Kong Engineer, 13, 7, 37–41.
Hencher, S.R. 1987. The implications of joints and structures for slope stability. InSlope Stability – Geotechnical Engineering and Geomorphology, Anderson, M.G.& Richards, K.S. (eds.), UK: John Wiley & Sons Ltd, 145–186.
Hencher, S.R. 1995. Interpretationof direct shear tests on rock joints. InProceedings 35thUS Symposium on Rock Mechanics, Deaman & Schultz (eds.), Lake Tahoe, 99–106.
Hencher, S.R. 1996a. Fracture flow modelling: Proof of evidence. In RadioactiveWaste Disposal at Sellafield, UK: Site Selection, Geological and EngineeringProblems, Haszeldine, R.S. & Smythe, D.K. (eds.), published by Department ofGeology and Applied Geology, University of Glasgow, 349–358. http://www.foe.co.uk/archive/nirex/sfoe6.html
Hencher, S.R. 2000. Engineering geological aspects of landslides. Keynote paper.Proceedings Conference on Engineering Geology HK 2000, Institution of Miningand Metallurgy, Hong Kong, 93–116.
Hencher, S.R. 2006. Weathering and erosion processes in rock – implications forgeotechnical engineering. Proceedings Symposium on Hong Kong Soils and Rocks,March 2004, Institution of Mining, Metallurgy and Materials and GeologicalSociety of London, 29–79.
Hencher, S.R. 2007. Hazardous ground conditions – reducing the risks. KeynotePaper. Engineering Geology in Geotechnical Risk Management, Hong KongRegional Group of the Geological Society of London, 32–40.
Hencher, S.R. 2008. The ‘new’ British and European standard guidance on rockdescription. A critique by Steve Hencher. Ground Engineering, 41, 7, 17–21.
Hencher, S.R. 2010. Preferential flow paths through soil and rock and their associationwith landslides. Hydrological Processes, 24, 1610–1630.
Hencher, S.R. & Acar, I.A. 1995. The Erzincan Earthquake, Friday, 13 March 1992.Quarterly Journal of Engineering Geology, 28, 313–316.
Hencher, S.R., Anderson, M.G. & Martin R.P. 2006. Hydrogeology of landslides.Proceedings of International Conference on Slopes, Malaysia, 463–474.
Hencher, S.R. & Daughton, G. 2000. Anticipating geological problems. TheUrban Geology of Hong Kong, Geological Society of Hong Kong Bulletin, 6,43–62.
Hencher, S.R. & Knipe, R.J. 2007. Development of rock joints with time and con-sequences for engineering. Proceedings of the 11th Congress of the InternationalSociety for Rock Mechanics, 1, 223–226.
428 References

Hencher, S.R., Lee, S.G., Carter, T.G. & Richards, L.R. 2011. Sheeting joints –
Characterisation, Shear Strength and Engineering. Rock Mechanics and RockEngineering, 44, 1–22.
Hencher, S.R., Liao, Q.H.&Monighan, B. 1996.Modelling slope behaviour for openpits. Transactions of the Institution of Mining & Metallurgy, 105, A37–A47.
Hencher, S.R. & Mallard, D.J. 1989. On the effects of sand grading on driven pileperformance. Proceedings of the International Conference on Piling and DeepFoundations, London, 255–264.
Hencher, S.R. &Martin, R.P. 1984. The failure of a cut slope on the Tuen Mun roadin Hong Kong. Proceedings of the International Conference on Case Histories inGeotechnical Engineering, St Louis, Missouri, 2, 683–688.
Hencher, S.R., Massey, J.B. & Brand, E.W. 1985. Application of back analysis tosome Hong Kong landslides. Proceedings of the 4th International Symposium onLandslides, Toronto, 1, 631–638.
Hencher, S.R. & McNicholl, D.P. 1995. Engineering in weathered rock. QuarterlyJournal of Engineering Geology, 28, 253–266.
Hencher, S.R. & Richards, L.R. 1989. Laboratory direct shear testing of rockdiscontinuities. Ground Engineering, 22, 2, 24–31.
Hencher, S.R., Sun, H.W. & Ho, K.K.S. 2008. The investigation of undergroundstreams in a weathered granite terrain in Hong Kong. In Geotechnical andGeophysical Site Characterization, Huang & Mayne (eds.), London: Taylor &Francis, 601–607.
Hencher, S.R., Toy, J.P. & Lumsden, A.C. 1993. Scale dependent shear strength ofrock joints. In Scale Effects in Rock Masses 93, Pinto da Cunha (ed.), Rotterdam:Balkema, 233–240.
Hencher, S.R., Tyson, J.T. &Hutchinson, P. 2005. Investigating substandard piles inHong Kong. Proceedings 3rd International Conference on Forensic Engineering,Institution of Civil Engineers, London, 107–118.
Heuer, R.E. 1974. Important ground parameters in soft ground tunnelling.Proceedings of Speciality Conference on Subsurface Exploration for UndergroundExcavation and Heavy Construction, ASCE, 41–45.
Hight, D. 2009. Nicoll Highway, Singapore: the post collapse investigations. MeetingReport by Cabarkapa, Z. Ground Engineering, October, 9–13.
Hill, S.J. & Wallace, M.I. 2001. Mass modulus of rock for use in the design of deepfoundations. In Proceedings 14th Southeast Asian Geotechnical Conference, HongKong, Ho, K.K.S. & Li, K.S. (eds.), 1, 333–338.
Ho, H.Y., King, J.P. & Wallace, M.I. 2006. A Basic Guide to Air Photo Inter-pretation in Hong Kong. Applied Geoscience Centre, University of HongKong, 115p.
Ho, K.K.S., Sun H.W. & Hui, T.H.H. 2003. Enhancing the Reliability andRobustness of Engineered Slopes. Geotechnical Engineering Office, Hong Kong,GEO Report No. 139.
Hoek, E. 1968. Brittle failure of rock. In Rock Mechanics in Engineering Practice.Stagg & Zienkiewicz (eds.), London: Wiley and Sons, 99–124.
Hoek, E. 1999. Putting numbers to geology – an engineer’s viewpoint. The 2ndGlossop Lecture. Quarterly Journal of Engineering Geology, 32, 1–20.
Hoek, E. 2000. Big tunnels in bad rock. 2000 Terzhagi Lecture. ASCE Journal ofGeotechnical and Geoenvironmental Engineering, 127, 726–740.
Hoek, E. 2009. A slope stability problem in Hong Kong. Published online at http://www.rocscience.com/hoek/pdf/7_A_slope_stability_problem_in_Hong_Kong.pdf
Hoek, E. & Bray, J.W. 1974. Rock Slope Engineering. London: Institution of Miningand Metallurgy, 309p.
Hoek, E. & Brown, E.T. 1980. Underground Excavations in Rock. Institution ofMining and Metallurgy, London, 527p.
References 429

Hoek, E.&Brown, E.T. 1997. Practical estimates of rockmass strength. InternationalJournal of Rock Mechanics & Mining Sciences, 34, 1165–1186.
Hoek, E. & Diederichs, M.S. 2006. Empirical estimation of rock mass modulus.International Journal of Rock Mechanics & Mining Sciences, 43, 203–215.
Hoek, E., Kaiser, P.K. & Bawden, W.F. 1995. Support of Underground Excavationsin Rock. Rotterdam: A.A. Balkema, 215p.
Hoek E. & Marinos, P. 2000. Predicting Tunnel Squeezing. Tunnels and TunnellingInternational, Part 1, 32/11, 45–51, November 2000; Part 2, 32/12, 33–36,December 2000.
Hoek, E. & Moy, D. 1993. Design of large powerhouse caverns in weak rock. InComprehensive Rock Engineering, Volume 5, Surface and Underground ProjectCase Histories (Editor in Chief, J.A.Hudson; Volume Editor, E. Hoek), Oxford:Pergamon Press, 85–110.
Holmes, A. 1965. Principles of Physical Geology, 2nd edition. London: Nelson& Sons.Holzhausen, G.R. 1989. Origin of sheet structure, 1. Morphology and boundaryconditions. Engineering Geology, 27, 225–278.
Horn, H.M. & Deere, D.U. 1962. Frictional characteristics of minerals.Géotechnique, 12, 319–335.
Hoshino, K. 1993. Geological evolution from the soil to the rock: Mechanism oflithification and change of mechanical properties. In Geotechnical Engineering ofHard Soils – Soft Rocks, Anagnostopoulos et al. (eds.), Rotterdam: Balkema, 131–138.
Houghten, D.A. &Wong, C.M. 1990. Implications of the karst marble at Yuen Longfor foundation investigation and design. Hong Kong Engineer, June, 19–27.
Hudson, J.A. 1989.RockMechanics Principles in Engineering Practice. CIRIA GroundEngineering Report: Underground Construction, London: Butterworths, 72p.
Hudson, J.A. 1992. Rock Engineering Systems. New York: Ellis Horwood, 185p.Hudson, J.A. & Harrison, J.P. 1992. A new approach to studying complete rockengineering problems. Quarterly Journal of Engineering Geology andHydrogeology, 25, 93–105.
Hudson, J.A. & Harrison, J.P. 1997. Engineering Rock Mechanics. An Introductionto the Principles. Oxford: Pergamon Press, 444p.
Hudson, R.R. &Hencher, S.R. 1984. The delayed failure of a large cut slope in HongKong. Proceedings of the International Conference on Case Histories inGeotechnical Engineering, St Louis, Missouri, 679–682.
Hungr, O., Corominas, J. & Eberhardt, E. 2005a. Estimating landslide motionmechanism, travel distance and velocity. In Landslide Risk Management, Hungr,Fell, Couture & Eberhardt (eds.), London: Taylor & Francis Group, 99–128.
Hungr, O., Fell, R., Couture, R. & Eberhardt, E. (eds.) 2005b. Landslide RiskManagement. London: Taylor & Francis Group, 764p.
Hunt, R.E. 2005. Geotechnical Engineering Investigation Handbook, 2nd edition.Boca Raton, FL: Taylor & Francis, 1066p.
Hutchinson, J.N. 2001. Reading the ground: morphology and geology in site apprai-sal. Quarterly Journal of Engineering Geology and Hydrogeology, 334, 7–50.
Institution Civil Engineers 1996. Sprayed Concrete Linings (NATM) for Tunnels inSoft Ground. London: Thomas Telford, 88p.
Institution Civil Engineers 2005. NEC3 Engineering and Construction Contract.London: Thomas Telford.
Institute of Geological Sciences 1971. British Regional Geology: Northern England,4th edition. HMSO, 125p.
International Society for Rock Mechanics 1974. Suggested Methods for DeterminingShear Strength. Final Draft, February 1974.
International Society for Rock Mechanics 1978. Suggested methods for the quantita-tive description of discontinuities in rock masses. International Journal of RockMechanics and Mining Sciences & Geomechanics Abstracts, 15, 319–368.
430 References

International Society for Rock Mechanics. 1981. Basic geotechnical description ofrock masses. International Journal of Rock Mechanics Mining Sciences andGeomechanics Abstracts, 18, 85–110.
Irfan, T.Y. 1996. Mineralogy, fabric properties and classification of weatheredgranites in Hong Kong. Quarterly Journal of Engineering Geology, 29, 5–35.
Irfan, T.Y.&Tang, K.Y. 1993.Effect of the Coarse Fractions on the Shear Strength ofColluvium. Geotechnical Engineering Office, GEO Report No. 23, Hong Kong,232p.
Itasca 2004. UDEC Version 4.0 User’s Guide, 2nd edition.Iverson, R.M. 2000. Landslide triggering by rain infiltration. Water ResourcesResearch, 36, 1897–1910.
Jahns, R.H. 1943. Sheet structure in granites, its origin and use as a measure of glacialerosion in New England. Journal of Geology, 51, 71–98.
Jaksa, M.B., Goldsworthy, J.S., Fenton, G.A., Kaggwa, W.S., Griffiths, D.V., Kuo,Y.L. & Poulos, H.G. 2005. Towards reliable and effective site investigations.Géotechnique, 55, 2, 109–121.
Janbu, N. 1973. Slope stability computations. Embankment-Dam Engineering, NewYork: John Wiley & Sons, Inc., 47–86.
Jardine, R.J., Symes, M.J. & Burland, J.B. 1984. The measurement of soil stiffness inthe triaxial apparatus. Géotechnique, 34, 323–340.
Jiao, J.J., Ding, G.P. & Leung, C.M. 2006. Confined groundwater near the rockheadin igneous rocks in the Mid-Levels area, Hong Kong, China. Engineering Geology,84, 207–219.
Jiao, J.J. & Malone, A.W. 2000. An hypothesis concerning a confined groundwaterzone in slopes of weathered igneous rocks. Symposium on Slope Hazards and theirPrevention, Hong Kong, 165–170.
Jiao, J.J., Wang, X-S. & Nandy, S. 2005. Confined groundwater zone and slopeinstability in weathered igneous rocks in Hong Kong. Engineering Geology, 80,71–92.
Jones, A. 1971. Soil piping and stream channel initiation. Water Resources Research,7, 3, 602–609.
Jones, L.D. 2006.Monitoring landslides in hazardous terrain using terrestrial LIDAR:an example from Montserrat. Quarterly Journal of Engineering Geology andHydrogeology, 39, 371–373.
Kamewada, S., Gi, H.S., Taniguchi, S. & Yoneda, H. 1990 Application of boreholeimage processing system to survey of tunnel. In Proceedings of the InternationalSymposium on Rock Joints, Barton, N.R. & Stephansson, O., (eds.), Loen,Norway, Rotterdam: Balkema, 51–58.
Karakuş, M.M. & Fowell, R.J. 2004. An insight into the New Austrian TunnellingMethod (NATM). Rockmec′2004-VIIth Regional Rock Mechanics Symposium,Sivas, Turkey, 14p.
Karrow, P.F. & White, O.L. 2002. A history of neotectonic studies in Ontario.Tectonophysics, 353, 3–15.
Katsura, S., Kosugi, K., Mizutani, T., Okunaka, S. & Mizuyama, T. 2008. Effects ofbedrock groundwater on spatial and temporal variations in soil mantle ground-water in a steep granitic headwater catchment. Water Resources Research, 44,W09430.
Keefer, D.K. 1984. Landslides Caused by Earthquakes,Geological Society of AmericaBulletin, 95, 406–421.
Keefer, D.K. 2002. Investigating landslides caused by earthquakes – a historicalreview. Surveys in Geophysics, 23, 473–510.
Kikuchi, K. &Mito, Y. 1993. Characteristics of seepage flow through the actual rockjoints. Proceedings 2nd International Workshop on Scale Effects in Rock Masses,Lisbon, 305–312.
References 431

Kim Y.I., Hencher, S.R., Yoon, Y.H. & Cho, S.G. 2001. Determination of theconstruction method for the Young dong tunnel by risk assessment. Korea Societyof Civil Engineers, Seminar, Seoul, 200–206.
Knill, J.L. 1976. Cow Green revisited. Inaugural Lecture, Imperial College of Scienceand Technology, University of London.
Knill, J.L. 1978. Geology and Foundations. Chapter 2 in Foundation Engineering inDifficult Ground, Bell, F.G. (ed.), London: Newnes-Butterworths, 116–131.
Knill, J.L. 2002. Core values: the first Hans Cloos Lecture. Proceedings 9th AEGCongress, Durban, 1–45.
Kovacevic, N., Hight, D.W. & Potts, D.M. 2007. Predicting the stand-up time oftemporary London Clay slopes at Terminal 5, Heathrow Airport. Géotechnique,57, 63–74.
Krauskopf, K.B. 1988.Radioactive Waste Disposal and Geology. Topics in the EarthSciences, Volume 1, London: Chapman & Hall, 145p.
Krynine, D.P. & Judd, W.R. 1957. Principles of Engineering Geology andGeotechnics. New York: McGraw-Hill, 730p.
Kwong, A.K.L. 2005. Drawdown and settlement measured at 1.5 km away from SSDSStage 1 Tunnel C (a perspective from hydro-geological modelling). Proceedings ofK.W.Lo Symposium, London, Ontario, Canada, Session D, 1–24.
Kulander, B.R. & Dean, S.L. 1995. Observations on fractography with laboratoryexperiments for geologists. In Fractography: Fracture Topography as a Tool inFracture Mechanics and Stress Analysis, Ameen, M.S. (ed.), Geological SocietyLondon Special Publication, 92, 59–82.
Kulander, B.R., Dean, S.L. & Ward, B.J. 1990. Fractured Core Analysis.Interpretation, Logging and Use of Natural and Induced Fractures in Core.AAPG Methods in Exploration Series, No. 8, 88p.
Kulatilake, P.H.S.W., Shou, G., Huang, T.H. & Morgan, R.M. 1995. New peakshear strength criteria for anisotropic rock joints. International Journal of RockMechanics and Mining Science & Geomechanics Abstracts, 32, 673–669.
Kveldsvik, V., Nilsen, B., Einstein, H.H. & Nadim, F. 2008. Alternative approachesfor analyses of a 100,000m3 rock slide based on Barton-Bandis shear strengthcriterion. Landslides, 5, 161–176.
Lambe, T.W. & Whitman, R.V. 1979. Soil Mechanics. New York: Wiley, 553p.Leach, B. & Herbert, R. 1982. The genesis of a numerical model for the study of thehydrogeology of a steep hillside in Hong Kong. Quarterly Journal of EngineeringGeology, 15, 243–259.
Lee, K.C., Jeng, F.S., Huang, T.S., Hsieh, Y.M. & Orense, R.P. 2010. Can tilt testprovide insight regarding frictional behaviour of sandstone under seismic excita-tion? Proceedings New Zealand Society for Earthquake Engineering 2010Conference, Paper 19, 8p.
Lee, S.G. & Hencher, S.R. 2009. The repeated collapse of a slope despite continuousreassessment and remedial works. Engineering Geology, 107, 16–41.
Leeder, M. 1999. Sedimentology and Sedimentary Basins. Oxford: Blackwell Publishing,592p.
Legislative Council Panel on Environmental Affairs 2000. Paper for discussion on 25October 2000.
Lerouiel, S.& Tavernas, F. 1981. Pitfalls of back-analysis. Proceedings 10th ICSMFE,Stockholm, 1, 185–190.
Li, Z.H., Huang, H.W., Xue, Y.D. & Yin, J. 2009. Risk assessment of rockfallhazards on highways. Georisk: Assessment and Management of Risk forEngineered Systems and Geohazards, 3, 14–154.
Lindquist, E.S. & Goodman, R.E. 1994.Strength and deformation properties of aphysical model melange. Proceedings 1st North American Rock MechanicsSymposium, Austin, Texas, 843–858.
432 References

Lumb, P. 1962. Effect of rain storms on slope stability. Proceedings of the Symposiumon Hong Kong Soils, Hong Kong, 73–87.
Lumb, P. 1976. Discussion on the assessment of landslide potential with recommenda-tions for future research byA.A. Beattie&E.P.Y. Chau.HongKongEngineer, 4, 2, 55.
Lumsdaine, R.W. & Tang, K.Y. 1982. A comparison of slopes stability calculations.Proceedings of the Seventh Southeast Asian Geotechnical Conference, Hong Kong,31–38.
Maidl, B., Schmid, L., Ritz W. & Herrenknecht, M. 2008. Hardrock Tunnel BoringMachines. Berlin: Ernst and Young, 343p.
Malone, A.W. 1998. Slope movement and failure: evidence from field observations oflandslides associated with hillside cuttings in saprolites in Hong Kong. Proceedings13th Southeast Asian Geotechnical Conference, Taipei, 2, 81–90.
Magnus R., Teh C.I., Lau J.M. 2005. Report of the Committee of Inquiry into theIncident at the MRT Circle Line Worksite that Led to the Collapse of NicollHighway on 20 April 2005.
Malone, A.W., Hansen, A., Hencher, S.R. & Fletcher, C.J.N. 2008. Post-failuremovements of a large slow rock slide in schist near Pos Selim, Malaysia. The10th International Symposium on Landslides and Engineered Slopes, Xian,457–461.
Mandl, G. 2005. Rock Joints. The Mechanical Genesis. Berlin and New York:Springer, 221p.
Marcusson, W.F. III, Hynes, M.E. & Franklin, A.G. 1990. Evaluation and use ofresidual strength in seismic safety analysis of embankments. Earthquake Spectra, 6,529–572.
Marinos, P. &Hoek, E. 2000. GSI – a geologically friendly tool for rockmass strengthestimation. Proceedings of GeoEng 2000, Melbourne, Australia, 1422–1442.
Marshall, R.H. & Flanagan, R.F. 2007. Singapore’s Deep Tunnel Sewerage System –
Experiences and Challenges. RETC 2007, Toronto, 1308–1319.Martel, S.J. 2006. Effect of topographic curvature on near-surface stresses and appli-cation to sheeting joints. Geophysical Research Letters, 33, LO1308.
Martin, D.C. 1994. Quantifying drilling-induced damage in samples of Lac du Bonnetgranite. Proceedings 1st North American Rock Mechanics Symposium, Austin,Texas, 419–427.
Martin, R.P. & Hencher, S.R. 1986. Principles for description and classification ofweathered rocks for engineering purposes. In S I Practice: Assessing BS5930,Geological Society, Engineering Geology Special Publication No. 2, Hawkins,A. B. (ed.), 299–308.
Masset, O. & Loew, S. 2010. Hydraulic conductivity distribution in crystalline rocks,derived from inflows to tunnels and galleries in the Central Alps, Switzerland.Hydrogeology Journal, 18, 863–891.
Mathews, M.C., Clayton, C.R.I. & Owen, Y. 2000. The use of field geophysicaltechniques to determine ground stiffness profiles. Proceedings Institution CivilEngineers, Geotechnical Engineering, January, 31–42.
Matsuo, S. 1986. Tackling floods beneath the sea. Tunnels & Tunnelling, March,42–45.
Maunsell Consultants Asia Ltd. 2000. Investigation of unusual settlement in TsuenKwan O Town Centre. Final Report, November 2000, Territory DevelopmentDepartment, Hong Kong Government.
Maury, V. 1993. An overview of tunnel, underground excavation and boreholescollapse mechanisms. In Comprehensive Rock Engineering, Volume 4, Editor inChief (J. Hudson), Oxford: Pergamon Press, 369–412.
Mayne, P.W., Christopher, B.R. & deJong, J. 2001. Manual on SubsurfaceInvestigations. National Highway Institute, Publication No. FHWA NHI-01-031Federal Highway Administration, Washington, DC, 305p.
References 433

MacGregor, F., Fell, R., Mostyn, G.R., Hocking, G. &McNally, G. 1994. The estima-tion of rock rippability.Quarterly Journal of Engineering Geology, 27, 123–144.
McCabe, B.A., Nimmons G.J. & Egan, D. 2009. A review of field performance ofstone columns in soft soils. Proceedings of the Institution of Civil Engineers:Geotechnical Engineering, 162, 323–334.
McGown, A., Marsland, A., Radwan, A.M. & Gabr, A.W.A. 1980. Recording andinterpreting soil macrofabric data. Géotechnique, 30, 4, 417–447.
McLearie, D.D., Forekman, W., Hansmire, W.H.& Tong, E.K.H. 2001. Hong KongStrategic Sewage Disposal Scheme Stage 1 deep tunnels. 2001 RETC Proceedings,487–498.
McMahon, B.K. 1985. Geotechnical design in the face of uncertainty. Journal of theAustralian Geomechanics Society, 10, 7–19.
McNicholl, D.P., Pump, W.L. & Cho, G.W.F. 1986. Groundwater control in largescale slope excavations – five case histories from Hong Kong. In Groundwater inEngineering Geology, Cripps, J.C. et al. (eds.), Geological Society, EngineeringGeology Special Publication no. 3, 561–576.
Mead, L. & Austin, G.S. 2005. Dimension stone. Industrial Minerals and Rocks, 7thedition. Littleton CO: AIME-Society of Mining Engineers, 907–923.
Megaw, T.M. & Bartlett, J.V. 1981. Tunnels: Planning, Design, Construction,Volume 1. New York: Ellis Horwood Limited, 284p.
Menard, L. & Broise, Y. 1975. Theoretical and practical aspects of dynamicconsolidation. Géotechnique, 25, 3–18.
Michie, U. 1996. The geological framework of the Sellafield area and itsrelationship to hydrogeology. Quarterly Journal of Engineering Geology, 29,S13–S28.
Mikkelsen, P.E. & Green, G.E. 2003. Piezometers in fully grouted boreholes.Proceedings Symposium on Field Measurements in Geomechanics, Oslo, 1–10.
Montgomery, D.R., Dietrich, W.E. & Heffner, J.T. 2002. Piezometric response inshallow bedrock at CB1: Implications for runoff generation and landsliding.WaterResource Research, 38, 12, 1274, 10-1–10-18.
Moore, R. & Brunsden, D. 1996. A physico-chemical mechanism of seasonal mudslid-ing.Géotechnique, 46, 259–278.
Moore, R., Hencher, S.R. & Evans, N.C. 2001. An approach for area and site-specificnatural terrain hazard and risk assessment, Hong Kong. Proc. 14th SEA Geotech.Conference, Hong Kong, 155–60.
Morgenstern, N.R. 2000. Common ground. Proceedings of GeoEng 2000,Melbourne, Australia, 1, 1–30.
Morgenstern, N.R. & Price, V.E. 1965. The analysis of the stability of general slipsurfaces. Géotechnique, 15, 79–93.
Moye, D.G. 1955. Engineering Geology for the SnowyMountains scheme. Journal ofthe Institution of Engineers, Australia, 27, 287–298.
Muir, T.R.C., Smethurst, B.K. & Finn, R.P. 1986. Design and construction of highrock cuts for the Kornhill Development, Hong Kong. Proceedings of Conference onRock Engineering and Excavation in an Urban Environment, Hong Kong,Institution of Mining and Metallurgy, 309–329.
MuirWood,A. 2000.Tunnelling:Management byDesign. London: E&FNSpon, 320p.Murray, A.D. & Gray, A.M. 1997. The Pergau Hydroelectric Project Part 3: civilengineering design. Proceedings institution Civil Engineers Water, Maritime &Energy, 124, 173 –188.
Newmark, N.M. 1965. Effects of earthquakes on dams and embankments.Géotechnique, 2, 139–160.
New Zealand Geotechnical Society 2005. Field Description of Soil and Rock. 36p.Nichols, T.C. Jr. 1980. Rebound, its nature and effect on engineering works.Quarterly Journal of Engineering Geology, 13, 133–152.
434 References

Nicholson, D.T., Lumsden, A.C. & Hencher, S.R. (2000). Excavation-induced dete-rioration of rock slopes. Proceedings of Conference on Landslides in Research,Theory and Practice, Cardiff: Thomas Telford, Volume 3, 1105–1110.
Nirex 2007.Geosphere Characterisation Report: Status Report. October 2006, 198p.Nixon, P.J. 1978. Floor heave in buildings due to the use of pyritic shales as fillmaterial. Chemistry and Industry, 160–164.
Norbury, D. 2010. Soil and Rock Description in Engineering Practice. CRC Press,288p.
North Wales Geology Association 2006. Newsletter, 46, July, p. 1.Nowson, W.J.R. 1954. The history and construction of the foundations of the AsiaInsurance Building, Singapore. Proceedings Institution Civil Engineers, Pt 1, 3,407–443.
Oldroyd, D.R. 2002. Nirex and the great denouement. Chapter 20 in: Earth, Water,Ice and Fire: Two Hundred Years of Geological Research in the English LakeDistrict, Geological Society Memoir No. 25. xvi, London, Bath: GeologicalSociety of London, 328p.
Ollier, C.D. 1975.Weathering, 2nd impression. London: LongmanGroupLimited, 304p.Ollier, C.D. 2010. Very deep weathering and related landslides. In Weathering asa Predisposing Factor to Slope Movements, Calceterra, D. & Parise, M.(eds.), Geological Society, London: Engineering Geology Special Publications,23, 5–14.
Olsson, O. & Gale, J.E. 1995. Site assessment and characterization for high-levelnuclear waste disposal: results from the Stripa Project, Sweden.Quarterly Journal ofEngineering Geology and Hydrogeology, 28, Supplement 1, S17–S30.
Olsson, R. & Barton, N. 2001. An improved model for hydromechanical couplingduring shearing of rock joints. International Journal of Rock Mechanics & MiningSciences, 38, 317–329.
Orr, W.E., Muir-Wood, A., Beaver, J.L., Ireland, R.J. & Beagley, D. 1991.Abbeystead Outfall Works: background to repairs and modifications – and thelessons learned. Journal of the Institution of Water and EnvironmentalManagement, 5, 7–20.
Osipov, V.I. 1975. Structural bonds and the properties of clays. Bulletin of theInternational Association of Engineering Geology, 12, 13–20.
Palmström, A. 1982. The volumetric joint count – a useful and simple measure of thedegree of rock jointing. Proceedings 4th Congress International AssociationEngineering Geologists, Delhi, 221–228.
Papaliangas, T., Lumsden, A.C., Manolopoulou, S. & Hencher, S.R. 1990. Shearstrength of modelled filled rock joints. Proceedings of the International Symposiumon Rock Joints, Loen, Norway, 275–282.
Papaliangas, T.T., Hencher, S.R. & Lumsden, A.C. 1994. Scale independent shearstrength of rock joints. Proceedings IV CSMR/ Integral Approach to Applied RockMechanics, Santiago, Chile, 123–133.
Papaliangas, T.T., Hencher, S.R. & Lumsden, A.C. 1995. A comprehensive peakstrength criterion for rock joints. Proceedings 8th International Congress on RockMechanics, Tokyo, 1, 359–366.
Parks, C.D. 1991. A review of the mechanisms of cambering and valley bulging. InQuarternary EngineeringGeology, Forster, A., Culshaw,M.G., Cripps, J.C., Little,J.A.&Moon, C. (eds.), Geological Society EngineeringGeology Special PublicationNo.7, 381–388.
Parry, S., Campbell, S.D.G. & Fletcher, C.J.N. 2000. Kaolin in Hong Kongsaprolites – genesis and distribution. Proceedings Conference EngineeringGeology HK 2000, IMM HK Branch, 63–70.
Patton, F.D. 1966. Multiple modes of shear failure through rock. Proceedings 1stInternational Congress International Society RockMechanics, Lisbon, 1, 509–513.
References 435

Peck, R.B., Hanson, W.E. & Thornburn, T.H. 1994. Foundation Engineering, 2ndedition. New York: John Wiley and Sons, 514p.
Petley, D. 2011 (ongoing). Dave’s Landslide Blog. http://daveslandslideblog.blogspot.com/
Pettifer, G.S. & Fookes, P.G. 1994. A revision of the graphical method for assessingthe excavatability of rock.Quarterly Journal of EngineeringGeology, 27, 145–164.
Phillips, F.C. 1973. The Use of Stereographic Projection in Structural Geology, 3rdedition. London: Edward Arnold, 90p.
Phillipson, H.B. & Chipp, P.N. 1982. Air foam sampling of residual soils in HongKong. Proceedings of the ASCE Specialty Conference on Engineering andConstruction in Tropical and Residual Soils, Honolulu, 339–356.
PIANC 2000. Site Investigation Requirements for Dredging Works. Report ofWorking Group No. 23 of the Permanent Technical Committee II, InternationalNavigation Association, 32p.
Picarelli, L.&DiMaio, C. 2010. Deterioration processes of hard clays and clay shales.In Weathering as a Predisposing Factor to Slope Movements, Calceterra, D. &Parise, M. (eds.), Geological Society, London: Engineering Geology SpecialPublications, 23, 15–32.
Pierson, T.C. 1983. Soil pipes and slope stability. Quarterly Journal of EngineeringGeology, 16, 1–15.
Pine, R.J. & Roberds, W.J. 2005. A risk-based approach for the design of rock slopessubject to multiple failure modes – illustrated by a case study in Hong Kong.International Journal of Rock Mechanics & Mining Sciences, 42, 261–275.
Pinho, A., Rodrigues-Carvalho, J.A., Gomes, C.F. & Duarte, I.M. 2006. Overview ofthe evaluation of the state of rock weathering by visual inspection. 10th IAEGCongress, Engineering Geology for Tomorrow’s Cities, Nottingham, Paper 260.
Pirazzoli, P.A. 1996. Sea-Level Changes. The Last 20000 Years. Chichester: JohnWiley & Sons, 211p.
Piteau, D.R. 1973. Characterising and extrapolating rock joint properties in engineer-ing practice. Rock Mechanics, Supplement 2, 2–31.
Pollard, D.D. & Aydin, A. 1988. Progress in understanding jointing over the pastcentury. Geological Society America Bulletin, 100, 1181–1204.
Pope, R.G., Weeks, R.C. & Chipp, P.N. 1982. Automatic recording of standpipepiezometers. Proceedings of the 7th Southeast Asian Geotechnical Conference,Hong Kong, 1, 77–89.
Pöschl, I. & Kleberger, J. 2004 Geotechnical risk in rock mass characterisation – aconcept.Course onGeotechnical Risks in Rock Tunnelling, Aveiro, Portugal, April,11p.
Poulos, H.G. 2005. Pile behavior – consequences of geological and constructionimperfections. 40th Terzaghi Lecture, Journal Geotechnical & GeoenvironmentalEngineering, ASCE, 131, 538–563.
Powderham, A.J. 1994. An overview of the observational method: development in cutand cover and bored tunnelling projects. Géotechnique, 44, 619–636.
Power, C.M. 1998.Mechanics of Modelled Rock Joints under True Stress ConditionsDetermined by Electrical Measurements of Contact Area. Unpublished PhD thesis,University of Leeds, 293p.
Power, C.M.&Hencher, S.R. 1996. A new experimental method for the study of realarea of contact between joint walls during shear. RockMechanics, Proceedings 2ndNorth American Rock Mechanics Symposium, Montreal, 1217–1222.
Power, M.S., Rosidi, D., Kaneshiro, J.Y. 1998. Seismic vulnerability of tunnels andunderground structures revisited. InNorth American Tunneling, Ozdemir, L. (ed.),Rotterdam: Balkema, 243–250.
Preene, M. & Brassington, F.C. 2003. Potential groundwater impacts from civilengineering works. Water & Environment Journal, 17, 59–64.
436 References

Priest, S.D. 1993.Discontinuity Analysis for Rock Engineering. London: Chapman&Hall, 473p.
Priest S.D. & Brown E.T. 1983 Probabilistic stability analysis of variable rock slopes.Transactions Institution Mining & Metallurgy, 92, A1–12.
Price, N.J. 1959. Mechanics of jointing in rocks.Geological Magazine, 96, 149–167.Price, N.J. & Cosgrove, J. 1990. Analysis of Geological Structures. Cambridge:
Cambridge University Press.Puller, M. 2003. Deep Excavations: A Practical Manual, 2nd edition. London:Thomas Telford Ltd., 584p.
Pye, K. & Miller, J.A. (1990). Chemical and biochemical weathering of pyriticmudrocks in a shale embankment. Quarterly Journal of Engineering Geology, 23,365–382.
Quinn J.D., Philip L.K. & Murphy W. 2009. Understanding the recession of theHolderness Coast, East Yorkshire, UK: a new presentation of temporal and spatialpatterns. Quarterly Journal of Engineering Geology and Hydrogeology, 42,165–178.
Rawnsley, K.D. 1990. The Influence of Joint Origin on Engineering Properties.Unpublished PhD thesis, University of Leeds, 388p.
Rawnsley, K.D., Hencher, S.R. & Lumsden, A.C. 1990. Joint origin as a predictivetool for the estimation of geotechnical properties. Proceedings of the InternationalSymposium on Rock Joints, Loen, Norway, 91–96.
Rawnsley, K.D., Rives, T., Petit, J.-P., Hencher, S.R. & Lumsden, A.C. 1992. Jointdevelopment in perturbed stress fields near faults. Journal of Structural Geology, 14,939–951.
Reason, J. 1990. Human Error. New York: Cambridge University Press.Richards, K.S. & Reddy, K.R., 2007. Critical appraisal of piping phenomena in earthdams. Bulletin Engineering Geology Environment, 66, 381–402.
Richards, L.R.&Cowland, J.W. 1982. The effect of surface roughness on the field shearstrength of sheeting joints in Hong Kong granite.Hong Kong Engineer, 10, 39–43.
Richards, L.R.&Cowland, J.W. 1986. Stability evaluation of some urban rock slopesin a transient groundwater regime. Proceedings Conference on Rock Engineeringand Excavation in an Urban Environment, IMM, Hong Kong, 357–363,(Discussion 501–6).
Richards, L.R. & Read, S.A.L. 2007. New Zealand greywacke characteristics andinfluences on rock mass behaviour. Proceedings 11th Congress of the InternationalSociety of Rock Mechanics, Lisbon, 1, 359–364.
Richey, J.E. 1948. Scotland. The Tertiary Volcanic Districts, 2nd edition revised.British Regional Geology, Her Majesty’s Stationery Office, 105p.
Rico, M., Benito, G., Salgueiro, A.R., Díez-Herrero, A. & Pereira, H.G. 2008.Reported tailings dam failures. A review of the European incidents in the worldwidecontext. Journal of Hazardous Materials, 152, 846–852.
RILEM 2003. Recommended Test Method AAR-I, Detection of Potential Alkali-Reactivity of Aggregates – Petrographic Method, Materials & Structures, 36,480–496.
Rives, T., Rawnsley, K.D. & Petit, J.-P. 1994. Analogue simulation of natural orthogo-nal joint set formation in brittle varnish. Journal of Structural Geology, 16, 419–429.
Robertshaw, C. & Tam, T.K. 1999. Tai Po to Butterfly Valley Treated WaterTransfer. World Tunnelling, 12, 8, 383–385.
Rodriguez, C.E. 2001. Hazard Assessment of Earthquake-induced Landslides onNatural Slopes. Unpublished PhD thesis, Imperial College of Science andTechnology, University of London, 367p.
Rogers, C.M. & Engelder, T. 2004. The feedback between joint-zone developmentand downward erosion of regularly spaced canyons in the Navajo Sandstone, ZionNational Park, Utah. In The Initiation, Propagation and Arrest of Joints and Other
References 437

Fractures, Cosgrove, J.W. & Engelder, T. (eds.), Geological Society Publication,231, 49–71.
Roorda, J., Thompson, J.C. & White, O.L., 1982. The analysis and prediction oflateral instability in highly stressed, near-surface rock strata. CanadianGeotechnical Journal, 19, 4, 451–462.
Romana, M. 1991. SMR Classification. Proceedings 7th Congress Rock Mechanics,ISRM. Aachen, Germany, 2, 955–960.
Roscoe, K.H., Schofield, A.N. & Wroth, C.P. 1958. On the yielding of soils.Géotechnique, 8, 22–53.
Ruxton, B.P. & Berry, L. 1957 The weathering of granite and associated erosionalfeatures inHong Kong.Bulletin of theGeological Society of America, 68, 1263–1292.
Sadiq, A.M. & Nasir, S.J. 2002. Middle Pleistocene karst evolution in the State ofQatar, Arabian Gulf. Journal of Cave and Karst Studies, 64, 132–139.
Salehy, M.R., Money, M.S. & Dearman, W.R. 1977. The occurrence andengineering properties of intra-formational shears in Carboniferous rocks. InProceedings Conference on Rock Engineering, Newcastle, Attewell, P.B. (ed.),Newcastle: London, 311–328.
Santamarina, J.C. & Cho, G.C. (2004). Soil behaviour: The role of particle shape. InAdvances in Geotechnical Engineering: The Skempton Conference, Jardine, R.J.et al. (eds.), 29–31 March 2004, London: Thomas Telford 1, 604–617.
Sarma, S.K. 1975. Seismic stability of earth dams and embankments. Géotechnique,25, 743–761.
Sausse, J. & Genter, A. 2005. Types of permeable fractures in granite. GeologicalSociety, London, Special Publications 2005, 240, 1–14.
Schmidt, B. 1966. Discussion on earth pressures at rest related to stress history.Canadian Geotechnical Journal, 3, 239–242.
Schneider, H.J. 1976. The friction and deformation behaviour of rock joints. RockMechanics, 8, 169–184.
Schofield, A.N. 2006. Interlocking, and peak and design strengths.Géotechnique, 56,357–358.
Scholz, C.H. 1990. The Mechanics of Earthquakes and Faulting. Cambridge:Cambridge University Press, 439p.
Seed, H.B., Idriss, I.M. & Kiefer, F.W. 1968. Characteristics of Rock Motions duringEarthquakes, EERC 68–5, University of California, Berkeley, September.
Seed, H.B. & Idriss, I.M. 1982. Ground Motions and Soil Liquefaction duringEarthquakes, Monograph No. 5, Earthquake Engineering Research Institute,Berkeley, California, 134p.
Selby, M.J. 1993. Hillslope Materials and Processes, 2nd edition. Oxford: OxfordUniversity Press, 451p.
Seol, H. & Jeong, S. 2009. Load-settlement behavior of rock-socketed drilled shaftsusing Osterberg-Cell tests. Computers and Geotechnics, 36, 1134–1141.
Sewell, R.J., Campbell, S.D.G., Fletcher, C.J.N., Lai, K.W. & Kirk, P.A. 2000. ThePre-Quaternary Geology of Hong Kong. Geotechnical Engineering Office, CivilEngineering Department, Hong Kong SAR Government, 181p plus 4 maps.
Shaw, R. & Owen, R.B. 2000. Geomorphology and ground investigation planning.Proceedings Conference on Engineering Geology HK 2000, Institution of Miningand Metallurgy, Hong Kong, 151–163.
Shibata, T. & Taparaska, W. 1988. Evaluation of liquefaction potential of soil usingcone penetration tests. Soils and Foundations, 28, 49–60.
Shirlaw, J.N. 2006. Discussion: Hull wastewater flow transfer tunnel: tunnel collapseand causation investigation. Geotechnical Engineering, 2, 126–127.
Shirlaw, J.N., Broome, P.B., Chandrasegaran, S., Daley, J., Orihara, K., Raju, G.V.R.,Tang, S.K., Wong, K.S. & Yu, K. 2003. The Fort Canning Boulder Bed.Underground Singapore 2003. Engineering Geology Workshop, 388–407.
438 References

Shirlaw, J. N., Hencher S.R. & Zhao, J. 2000. Design and construction issuesfor excavation and tunnelling in some tropically weathered rocks and soils.Proceedings of GeoEng 2000, Melbourne, Australia, Volume 1: Invited Papers,1286–1329.
Shirlaw, N., Ong, J.C.W., Rosser, H.B., Tan, C.G., Osborne, N.H. & Heslop, P.E.2003. Local settlements and sinkholes due to EPB tunneling, Proceedings ICE,Geotech. Engineering, 156 (GE4), 193–211.
Simons, N., Menzies, B. &Mathews, M. 2001.A Short Course in Soil and Rock SlopeEngineering. London: Thomas Telford, 432p.
Singapore Standards 2003, Code of Practice for Foundations. CP4:2003, Spring,Singapore, 253p.
Skempton, A.W. 1953. The colloidal ‘activity’ of clays. Proceedings 3rd InternationalConference of Soil Mechanics and Foundation Engineering, 1, 57–61.
Skempton, A.W. 1970. The consolidation of clays by gravitational compaction.Quarterly Journal of Engineering Geology, 125, 373–411.
Skempton, A.W., Leadbetter, A.D. & Chandler, R.J. 1989. The Mam Tor landslide,North Derbyshire. Philosophical Transactions Royal Society London, A, 329,503–547.
Skempton, A.W. & Macdonald, D.H. 1956. The allowable settlement of buildings.Proceedings of the Institution of Civil Engineers, Part 3, 5, 727–784.
Skempton, A.W., Norbury, D., Petley, D.J.& Spink, T.W. 1991. Solifluction shears atCarsington, Derbyshire. Geological Society, London, Engineering Geology SpecialPublications, 7, 381–387.
Skempton, A.W., Schuster, R.L.& Petley, D.J. 1969. Joints and fissures in the LondonClay at Wraysbury and Edgeware. Géotechnique, 19, 205–217.
Skempton, A.W. & Vaughan, P.R. 1993. The failure of Carsington Dam.Géotechnique, 43, 1, 151–173.
Slob, S. 2010. Automated Rock Mass Characterisation Using 3-D Terrestrial LaserScanner. Unpublished PhD thesis, Technical University of Delft, 287p.
Smart, P.L. 1985. Applications of fluorescent dye tracers in the planning and hydro-logical appraisal of sanitary landfills. Quarterly Journal of Engineering Geology,18, 275–286.
Smith, M.R. & Collis, L. (eds.) 2001. Aggregates. Geological Society, London,Engineering Geology Special Publications No. 17, 339p.
Spang, K.&Egger, P. 1990. Action of fully-grouted bolts in jointed rock and factors ofinfluence, Rock Mechanics and Rock Engineering, 23, 201–229.
Spink, T. 1991. Periglacial discontinuities in Eocene clays near Denham,Buckinghamshire. InQuarternary Engineering Geology, Forster, A., Culshaw, M.G.,Cripps, J.C., Little, J.A.&Moon, C. (eds.), Geological Society EngineeringGeologySpecial Publication No. 7, 389–396.
Starfield, A.M. & Cundall, P.A. 1988. Towards a methodology for rock mechanicsmodelling. International Journal of Rock Mechanics and Mining Sciences &Geomechanics Abstracts, 25, 99–106.
Starr, D., Dissanayake, A., Marks, D., Clements, J. & Wijeyakulasuriya, V. 2010.South West Transport Corridor Landslide. Queensland Roads, 8, 57–73.
Statham, I. & Baker, M. 1986. Foundation problems on limestone: A case historyfrom the Carboniferous Limestone at Chepstow, Gwent. Quarterly Journal ofEngineering Geology, 19, 191–201.
Sterling, R.L. 1993. The expanding role of rock engineering in developing nationaland local infrastructures. In Comprehensive Rock Engineering, Volume 5. Surfaceand Underground Project Case Histories, (Editor in Chief, J.A. Hudson; VolumeEditor, E. Hoek), Oxford: Pergamon Press, 1–27.
Stille, H. & Palmström, A. 2003. Classification as a tool in rock engineering.Tunnelling and Underground Space Technology, 18, 4, 331–345.
References 439

Stow, D.A.V. 2005. Sedimentary Rocks in the Field. A Colour Guide. MansonPublishing Ltd., 320p.
Streckeisen, A. 1974. Classification and nomenclature of plutonic rocks: IUGSSubcommission on the Systematics of Igneous Rocks. Geologische Rundschau,63, 773–786.
Streckeisen, A. 1980. Classification and nomenclature of volcanic rocks, lampro-phyres, carbonatites and melilitic rocks: IUGS Subcommission on the Systematicsof Igneous Rocks. Geologische Rundschau, 69, 1, 194–207.
Stringer, C. 2006. Homo Britannicus. London: Allen Lane, 319p.Styles, K.A. & Hansen, A. 1989. Geotechnical Area Studies Programme: Territoryof Hong Kong (GASP Report No. XII). Geotechnical Control Office, HongKong, 356p.
Swannell, N.G. & Hencher, S.R. Cavern design using modern software. Proceedingsof 10th Australian Tunnelling Conference, Melbourne, March 1999.
Sweeney, D.J. & Robertson, P.K. 1979. A fundamental approach to slope stabilityproblems in Hong Kong. Hong Kong Engineer, 7, 10, 35–44.
Tada, R. & Siever, R. 1989. Pressure solution during diagenesis. Annual ReviewsEarth Planetary Sciences, 17, 89–118.
Talbot, D.K., Hodkin, D.L. & Ball, T.K. (1997) Radon investigations for tunnellingprojects: a case study from St. Helier, Jersey. Quarterly Journal of EngineeringGeology, 30, 2, 115–122.
Tam, A. 2010. Lofty aspirations at destination West Kowloon.Hong Kong Engineer,May, 8–11.
Tanner, K. &Walsh, P. 1984.Hallsands: A Pictorial History. Kingsbridge: Tanner &Walsh, 32p.
Tapley,M.J., West, B.W., Yamamoto, S. & Sham, R. 2006. Challenges in constructionof Stonecutters Bridge and progress update. International Conference on BridgeEngineering, Hong Kong.
Tarkoy, P.J. 1991. Appropriate support selection, Tunnels and Tunneling, 23(October), 42 –45.
Terzhagi, K. 1925. The physical causes of proportionality between pressure andfrictional resistance. From Erdmechanic, translated by A. Casagrande in FromTheory to Practice in Soil Mechanics, J. Wiley.
Terzhagi, K. 1929. The Effect of Minor Geological Details on the Stability of Dams.American Institute of Mining and Metallurgical Engineers, Technical Publication215, 31–44.
Thomas, A.L.& La Pointe, P.R. 1995. Conductive fracture identification using neuralnetworks. Proceedings 35th US Symposium on Rock Mechanics, Lake Tahoe,627–632.
Thorpe, R.S. & Brown, G.C. 1985. The Field Description of Igneous Rocks. MiltonKeynes, UK: The Open University Press, 154p.
Thrush, P.W. & the Staff of the US Bureau of Mines 1968. A Dictionary of Mining,Mineral and Related Terms. US Department of the Interior, 1269p.
Tika, Th., Sarma, S.K. & Ambraseys, N. 1990. Earthquake induced displacements onpre-existing shear surfaces in cohesive soils. Proc. 9th Eur. Conference onEarthquake Engineering, 4A, 16–25.
Todd, D.K. 1980. Groundwater Hydrology, 2nd edition. New York: Wiley, 535p.Tomlinson, M.J. 2001. Foundation Design and Construction, 7th edition. England:Prentice Hall, 569p.
Tottergill, B.W. 2006. FIDIC Users’Guide: A Practical Guide To The 1999 Red AndYellow Books: Incorporating Changes And Additions To The 2005 MDBHarmonised Edition. London: Thomas Telford.
Trenter, N. 2003. Understanding and containing geotechnical risk. Proceedings of theInstitution of Civil Engineers: Civil Engineering, 156, 42–48.
440 References

Trotter, F.M., Hollingworth, S.E., Eastwood, T. & Rose, W.C.C. 1937. GosforthDistrict (One-inch Geological Sheet 37 New Series). In Memoirs of the GeologicalSurvey of Great Britain, Department of Scientific and Industrial Research.
Trurnit, P. 1968. Pressure solution phenomena in detrital rocks. SedimentaryGeology, 2, 89–114.
Tsuji, H., Sawada, T. & Takizawa, M. 1996. Extraordinary inundation accidents inthe Seikan undersea tunnel. Proceedings Institution Civil Engineers, GeotechnicalEngineering, 119, 1–14.
Tucker, M.E. 1982. The Field Description of Sedimentary Rocks. Milton Keynes, UK:The Open University Press, 112p.
Turner, A.K. 2006. Challenges and trends for geological modelling and visualisation.Bulletin Engineering Geology and Environment, 65, 109–127.
Twidale, C.R. 1973. On the origin of sheet jointing. Rock Mechanics, 5, 163–187.Uchida, T., Kosugi, K. & Mizuyama, T. 2001. Effects of pipeflow on hydrologicalprocess and its relation to landslide: a review of pipeflow studies in forestedheadwater catchments. Hydrological Processes, 15, 2151–2174.
Ulusay, R., Hudson, J.A. (eds.) 2006. The Complete ISRM Suggested Methods forRock Characterisation, Testing and Monitoring.
van der Berg J.P., Clayton C.R.I., Powell D.B. 2003. Displacements ahead of anadvancing NATM tunnel in the London clay. Géotechnique, 53, 767–784.
Varley, P.M. & Warren, C.D. 1996. History of the geological investigations for theChannel Tunnel. Chapter 2 in Engineering Geology of the Channel Tunnel, Harris,C.S., Hart,M.B., Varley, P.M.&Warren, C. (eds.), London: Thomas Telford, 5–18.
Vaughan, P.R. 1969. A note on sealing piezometers in boreholes. Géotechnique, 19,405–413.
Vervoort, A. & De Wit, K. 1997. Correlation between dredgeability and mechanicalproperties of rock. Engineering Geology, 47, 259–267.
Vidal Romani, J.R. & Twidale, C.R. 1999. Sheet fractures, other stress forms andsome engineering implications. Geomorphology, 31, 13–27.
Wakasa, S., Matsuzaki, H., Tanaka, Y. &Matskura, Y. 2006. Estimation of episodicexfoliation rates of rock sheets on a granite dome in Korea from cosmogenic nuclideanalysis. Earth Surface Processes and Landforms, 31, 1246–1256.
Wallis, K. 2000. Breakthroughs Made on Hong Kong Sewer. T & T International,December, 2000.
Wallis, S. 1999. Heathrow failures highlight NATM (abuse?) misunderstandings.Tunnel, 3/99, 66–72.
Waltham, A.C. 2002. Foundations of Engineering Geology, 2nd edition. London:Spon Press, 92p.
Waltham, A.C. 2008. Lötschberg tunnel disaster, 100 years ago.Quarterly Journal ofEngineering Geology & Hydrogeology, 41,131–136.
Walton, J.G., 2007. Unforeseen Ground Conditions and Allocation of Risk: Beforethe Roof Caved in. Paper delivered at the first of two sessions organised by theSociety of Construction Law on 1 May 2007.
Warner, J. 2004. Practical Handbook of Grouting – Soil, Rock and Structures.New York: John Wiley & Sons.
Weltman, A.J. & Healy, P.R. 1978. Piling in ‘Boulder Clay’ and other Glacial Tills.DOE and CIRIA Piling Development Group, Report PG5, 78p.
West, G., Carter, P.G., Dumbleton, M.J. & Lake, L.M. 1981. Site investigation fortunnels, International Journal Rock Mechanics Mining Science, 18, 345–367.
West, L.J., Hencher, S.R. & Cousens, T.C. 1992. Assessing the stability of slopes inheterogeneously graded soils. Proceedings 6th International Symposium onLandslides, Christchurch, New Zealand, 1, 591–595.
Whitten, D.G.A. & Brooks, J.R.V. 1972. The Penguin Dictionary of Geology.Penguin Books, 495p plus appendices.
References 441

Wong, H.N. 2005. Landslide risk assessment for individual facilities. In LandslideRisk Management, Hungr, Fell, Couture & Eberhardt, (eds.), London: Taylor &Francis Group, 237–296.
Woodworth, J.B. 1896. On the fracture system of joints, with remarks on certain greatfractures. Proceedings of the Boston Society of Natural History, 27, 163–184.
Wyllie, D.C. 1999. Foundations on Rock: Engineering Practice, 2nd edition. London:E & FN Spon.
Wyllie, D.C. &Mah, C.W. 2004. Rock Slope Engineering, 4th edition. London: E &FN Spon, 431p.
Yin, Y., Wang, F. & Sun, P. 2008. Landslide hazards triggered by the 12 May 2008Wenchuan Earthquake, Sichuan, China, 2008, Proceedings First World LandslideForum, Tokyo, 1–17.
Young, G.M. 2008. Origin of enigmatic structures: field and geochemical investiga-tion of columnar joints in sandstones, Island of Bute, Scotland. The Journal ofGeology, 116, 527–536.
Younger, P.L. &Manning, D.A.C. 2010. Hyper-permeable granite: lessons from testpumping in the Eastgate Geothermal Borehole, Weardale, UK.Quarterly Journal ofEngineering Geology & Hydrogeology, 43, 5–10.
Yu, Y.F., Siu, C.K. & Pun, W.K. 2005. Guidelines on the Use of PrescriptiveMeasures for Rock Slopes. GEO Report 161, 34p.
Yu, Y.S. & Coates, D.F. 1970. Analysis of Rock Slopes Using the Finite ElementMethod. Department of Energy, Mines and Resources Mines Branch, MiningResearch Centre, Research Report, R229 (Ottawa).
Zare, S. & Bruland, A. 2006. Comparison of tunnel blast design models. Tunnellingand Underground Space Technology, 21, 533–541.
Zhang, L& Einstein, H.H. 2010. The planar shape of rock joints. RockMechanics &Rock Engineering, 43, 55–68.
442 References

Index
Bold numbers depict figures, tables or boxes.
Abbeystead disaster (United Kingdom), 130adjudication, in dispute resolution, 24aggregate, 228–9AGS, see Association of Geotechnical andGeoenvironmental Specialists (AGS)
air photo interpretation (API), 125–8; process of, 126aperture, 169–72API, see air photo interpretation (API)arbitration, in dispute resolution, 24architect, role of, 14–16armourstone, 229Association of Geotechnical and GeoenvironmentalSpecialists (AGS), 125, 353–4
Atterberg limits, 51Australia; Kata Tjuta (the Olgas), 83; South WestTransport Corridor, Queensland, 122; Uluru(Ayers Rock), 82
barrettes, 251–2basalt, 44–5, 47basement construction, 18bearing pressure, 28–30; definition, 239;allowable, 197, 239, 240, 363; presumed,239, 240; ultimate bearing capacity, 239;on rocks, 197, 240; on soils, 240
BGS, see British Geological Survey (BGS)bill of quantities (BOQ), 17, 20BIPS, see Borehole Image Processing System(BIPS)
black cotton soils, 50, 206blasting, 225, 258–9, 288, 293–4, 304, 312; see also
drill and blastBologna Declaration, 345–6BOQ, see bill of quantities (BOQ)Borehole Image Processing System (BIPS), 173,174–5; comparison with surface mapping, 175
boreholes, 155; examples of logs; Australian, 383–4;Hong Kong, 384; UK, 379–83; preliminary, 121–2;logging of samples, 168–72, 384–93; periscope,140–1, 154, 171, 172
Britain, see United Kingdom
British Code of Practice for Site Investigation(BS5930), 115, 124; objectives of, 115
British Geological Survey (BGS), 125British Geotechnical Association (BGA), 353Brockram (United Kingdom), 132–4Busan (South Korea), landslide in, 341–2Busan Clay (South Korea), 205
cable-percussive rigs, 155caissons, 252Canada, training for engineering geologist, 347–8Canadian Council of Professional Engineers, 347–8Carsington Dam (United Kingdom), failure of, 67,131, 311–12, 315
cementation, 10, 11, 59, 189, 192, 203, 208Cerchar abrasivity index tests, 313chalk, 59, 312Channel Tunnel, 31–2checking engineer, role of, 18cherry picker platform, 145China; codes, 124, 169, 360, 367, 378; Sutong Bridge,
245; training of engineering geologist, 348–9;Wenchuan earthquake, 300
Ching Cheung Road (Hong Kong), 127, 173, 342–3Christchurch earthquake (New Zealand), 296, 298claims procedures, 23clay soils, 50–2, 205–6; aluminosilicates, 50–1;
cohesiveness of, 50; and granular soils, 50;overconsolidated; stress in, 234–5;montmorillonite, 50–1, 203, 206; phyllosilicates,50; smectite, 50, 52, 130, 206; vane test on, 205; seealso London Clay
client, of engineering projects, 14coastal recession, 181codes; for design, see design, codes; for earthworks andretaining structures, 35, 359–78; for site investigationand testing, 34, 115, 124–5, 128–9, 359–78
Coefficient of earth pressure at rest, 232, 234cohesion, 50, 189, 203colluvium, 52, 54, 95, 158, 227–8compass-clinometer, 148

compressive strength, 196, 197; of rock, 196, 197–200,208, 239–40; of soil, 196, 197; tests, 197–200; seealso unconfined compressive strength (UCS)
concrete; compressive strength of, 196, 197–8; tensilestrength, 201
construction vibrations, 304; blasting, 304;piling, 305
contaminated land, 182Continuing Professional Development (CPD), 4contractors; as designers, 18; responsibilities of,17–18; sub-contractors, 18
contracts; arrangements, 15; attitudes of parties, 26;claims procedures, 23; definition of, 19; disputeresolution, 24; legal process, 25–6; referenceground conditions, 21–3; risks assigned under,19–21; to contractors, 20–1; to owners, 20;shared, 21
conversion factors, 356–8cost; of arbitration, 24; of construction, 16–18; in
failed projects; Heathrow Express Tunnel collapse,333; inadequate site investigation, 9; profit margin,16–17; of site investigation, 119; of sitereconnaissance, 140–1
critical potential slip surface, 9, 306
Daikai subway station (Japan), 299deformability, 204, 334, 377; of rocks, 211–13; of
soil, 185–6; tests, 167Dennison sampler, 160density, definition, 361design model, see model, designdesign; application of engineering geologicalprinciples, 36–7; codes, 34–6; criteria, 2; design andbuild, 14, 19; engineer’s design, 14, 237; forearthworks and retaining structures, 35; Eurocode7, 35–6; for foundations, 29–31, 35; for siteinvestigation, 34; of tunnels, 31–3
desk study, 124–5DFN, see discrete fracture network (DFN)diagenesis, 191–3diagenetic and lithification processes, 11, 47differentiation into sets, in rocks, 73–4dilation, 189; angle of, 215–19dimension stone, 229–30Dips from Rocscience, 73, 151direct shear tests, 201, 209; to measure basic frictionof natural joints, 215–21; in field, 166, 167; ongranite, 188; Leeds direct shear box, 144; on soil,201; Yip Kan Street landslide, 219–21
discontinuities in rocks, see rocks, types ofdiscontinuities in
discrete fracture network (DFN), 103dispute resolution, 24; see also expert witness, role ofdisturbance of samples, 157–8, 161, 166Drax Power Station (United Kingdom), 242–3, 330–2dredging, 288; see also site excavationdrill and blast, 31–3, 136, 254, 257–8, 375, 398–400;see also blasting
drilling, rotary, 158–61; wire-line, 160
dune bedding, 53dykes, 45, 48, 61
earth pressure balance machines (EPBM),255, 256, 313
earthquakes, 100; damage in Mexico and Turkey,328; design considerations, 297–307; design ofbuildings, 297–9; groundmotion, 294–6; landslidestriggered by, 300–3; empirical relationships, 302–3;landslide mechanisms, 300–3; liquefaction, 296;slope design, 303–4; displacement analysis, 304;pseudo-static load analysis, 304; tunnels, 299
effective stress, principle of, 91, 202, 206, 231, 232–3,276–7, 357
employers, re engineering projects, 14end bearing (piling), 30, 105, 211, 245–51engineers, 14–16; responsibilities of, 16–17engineering geologists; career routes, 12,344–55; institutions; Institution of Civil Engineers(ICE), 351; Institution of Geologists (IG), 350–1;Institution of Materials, Minerals and Mining(IOM3), 352; learned societies; Association ofGeotechnical and Geoenvironmental Specialists,353; British Geotechnical Association (BGA), 353;Geological Society of London, 352; InternationalAssociation for Engineering Geology and theEnvironment, 353; International Society for RockMechanics, 354; International Society for SoilMechanics and Geotechnical Engineering, 354;knowledge of, 2–5; role in project, 1–2, 5–9, 38;training; Canada, 347–8; China, 348–9; Europe,349–50; Hong Kong, 349; UK, 344–5, 353; UnitedStates of America, 346–7; see also geotechnicalengineer, career routes
engineering geologists, role during construction,307–9; alertness to fraud, 309; checking designassumptions, 307; record-keeping, 307, 308
engineering geology; definition, 1engineering judgement, see judgement, engineeringenvironmental factors, in site investigations, 135–6environmental hazards, 179–80; coastal recession,181; contaminated land, 182; natural terrainlandslides, 180–1; seismicity, 183–4; subsidenceand settlement, 182
EPBM, see earth pressure balance machines (EPBM)Eurocodes, 34–6, 239, 245–6, 372–3Europe, training for geologists, 345–6European Federation of Geologists, 346exfoliation fractures, see joints, in rocksexpert witness, role of, 25–6; see also dispute resolutionextensometer, 177, 178
Factor of Safety (FoS); foundations, 29, 236, 238;slopes, 98, 278; of temporary works in NicollHighway collapse, 323–4
failures in projects, examples; due to adverse groundconditions; Ping Lin Tunnel, Taiwan, 318; due tochemical reactions; Carsington Dam (UK), 311–12;gas storage caverns in Killingholme, 312; Pracana
444 Index

Dam (Portugal), 314; TBM Singapore, 312–14; dueto deep weathering and cavern infill; Tung Chung(Hong Kong), 318–20; due to damage fromearthquakes at great distance (Mexico and Turkey),328; due to explosive gases (UK), 328; due to failureof ground anchors (Hong Kong and UK), 327–8;due to faults (UK), 316–18; due to faults infoundations (Hong Kong), 316; due to incorrecthydrogeological groundmodel, (UK), 324–6; due tokarstic limestone (UK), 332; due to landslides(Ching Cheung Road and Korea), 342–3; due topre-disposed rock structure (Pos Selim landslide),320–2; due to pre-existing shear surfaces,(Carsington Dam), 315; due to soil grading (DraxPower Station) 330–2; due to systemic failure(Heathrow Express Tunnel collapse), 333–6; due totemporary works failure (Nicoll Highway collapse),323–4; due to tunnel liner failure (Kingston onHull) UK, 322–3; Strategic Sewerage DisposalScheme (SSDS) (Hong Kong), 336–9; undergroundrock research laboratory (Sellafield) 339–41
failure envelope, in rocks, 70fast track approach, 119faults, in rocks, 64–7, 131–2; brittle, 65; plastic, 65;reverse, 65; normal, 65; seals, 67
Fei Shui Road landslide (Hong Kong), 159feldspar, 44, 50FIDIC, 19field exposures, 143–51; instruments, 144–51; rock
exposures, 148–9field reconnaissance and mapping, 139–41; cost-
effectiveness of, 140–1; use of GPS, 141–2FLAC SLOPE, 278FLAC, 241, 304, 306FLAC3D, 278force, definition, 357Fort Canning Boulder Bed (Singapore), 54, 55–7FoS, see Factor of Safety (FoS)foundations, 19; buoyant, 241–2; deep, 30–1,242–52; barrettes, 251–2; bored piles, 244–5;caissons, 252; design of piles, 245–9; driven piles,242–4; example of pile design, 247; proof testing onpiles, 249;designof, 29–30;FactorofSafety (FoS), 29,236, 238; settlement, 29; loading from buildings,27–8; hazards, 28; pile, 30–1; raft, 30–1; scope of siteinvestigation, 122; shallow, 29, 31, 238–41;variability across footprint, 240–1; strip footings, 28,240
foundations, design of, 29–31FracMan, 103fractures, see faults, in rocks; joints, in rocksfriction, definition, 357; between minerals, 187;between rock joints, 215–21
gabbro, 44, 68gas storage caverns in Killingholme, 312gases, failure of project due to (Abbeystead,UK), 328
geological interfaces, in rocks, 64
Geological Society Engineering Group WorkingParty, 359
Geological Society of China (GSC), 348Geological Society of London, 345, 349Geological Strength Index (GSI), 210, 376–7geologists, definition, 1geology, definition, 1; reference to engineering,40–1
geomorphology, 3geophysics; constraints of, 151–2; down-hole, 154;resistivity, 153; seismic methods, 152–3
geotechnical engineer, career routes, 13; see alsoengineering geologists
Geotechnical Engineering Office, HongKong, 285
GI, see ground investigation (GI)GIS, 143, 145glaciation, 54GPS, 141, 142granite, 10, 44, 50granular soils, 207Greece; Rion–Antirion Bridge, 298ground anchors, failure of project due to (Hong Kongand UK), 327–8
ground investigation (GI), see site investigationground model for site, creation of, 41ground models, see models, groundground truthing, 125groundwater, 262, 290, 327–8; response to rainfall,92–4; see also water; water table
GSI, see Geological Strength Index (GSI)
Halcrow buckets, 176, 177hazard maps, 125hazards, 28; chemical, 130–1; earthquakes, 100; gas,130; landslides, 97–100; rock fall, 270–2; slope,274–9; volcanoes, 100
Heathrow Express Tunnel collapse (UnitedKingdom), 24, 116, 333–6; cost, 333
history of site, geological, 42Hoek-Brown criteria, 210; strength envelope forslope, 211
Hong Kong, 17, 26; Black Hills Tunnels, 49; ChingCheung Road, 127, 342–3; failure due to groundanchors, 327–8; Fei Shui Road landslide, 159;Geotechnical Engineering Office, 285; Kornhilldevelopment, 316; Mass Transit RailwayAuthority, 17, 26; site investigations in, 121; SouthBay Close slope failure, 6–9; Stonecutters Bridge,121, 122; Strategic Sewerage Disposal Scheme(SSDS), 336–9; Tai Po to Butterfly Valley watertunnel, 261; training for engineering geologist, 349;trial pit logs, 392–3; Tsing Yi Island landslide,105–10; Tuen Mun Highway landslide, 110–13;Yip Kan Street landslide, 219–21
hornfels, 60–1hydraulic conductivity tests, 167, 204–5; see alsopermeability
hydraulic fracturing, 264
Index 445

hydroelectric scheme, site investigation plan, 138–9hydrogeological ground model, failure due to landfill(UK), 324, 324–6
igneous rocks, 10, 43–6, 48; acidic, 43; associations,48; basic, 43, 44; chemical weathering in, 10, 12;classification of, 43; extrusive, 43; granite, 44;intrusive, 43, 44
impression packers, 172–3improvement, ground, 288–93; cavities, 292–3;
drainage, 290–1; dynamic compaction, 289;geotextiles, 291; as drainage and barrier, 291–2; asground strengthening, 291; grouting, 292; jetgrouting, 290; soil mixing, 290; static preloading,289–90; stone columns, 290
Incheon Bridge (South Korea), 121, 245, 249–50inclinometer, 177, 180India, basalt rocks in, 44Indonesia; LUSI mud volcano, 52in-situ, sub-surface, 154–67; boreholes in soil, 155;
deformability tests, 167; hydraulic conductivitytests, 167; objectives, 154–5; piezocone, 166; rotarydrilling, 158–61; shear tests, 166, 167; standardpenetration test (SPT), 161–5, 201; static conepenetrometer, 165, 166, 201; vane test, 165, 201
Institution of Civil Engineers (ICE), 349–51Institution of Geologists (IG), 350–1Institution of Materials, Minerals and Mining(IOM3), 352
instrumentation, 174–9; extensometer, 177, 178;inclinometer, 177, 179; piezometers, 176–7, 178
insurance, 22International Association for Engineering Geologyand the Environment, 353
International Commerce Centre, Hong Kong, 251International Finance Centre in Seoul, Korea, 237International Society for Rock Mechanics (ISRM),195–6, 354–5
International Society for Soil Mechanics andGeotechnical Engineering (ISSMGE), 354
intra-formational slip, 63
Japan; earthquakes in, 299; Daikai subway station,299; Kiamichi Mine, 95–6; Kobe earthquake, 299
Joint Roughness Coefficient (JRC), 85, 224joint venture (JV), 14–15, 16joints, in rocks, 67–73, 365–8; columnar, 73; hybrid,70, 71, 78; infilled, 7, 223; non-orthogonalsystematic, 76–8; orthogonal systematic, 74–6;primary, 68; secondary, 68; shear, 70, 78;sheeting, 80–4; systematic, 68, 74–8; tensile,76–8; tertiary, 68
JRC, see Joint Roughness Coefficient (JRC)judgement, engineering, 221, 248, 269JV, see joint venture (JV)
Kallang Clay, 323Kallang Formation, 305karstic limestone, failure due to (UK), 332
Kiamichi Mine (Japan), 95–6Kobe earthquake (Japan), 299Korea, Po Chang, 274–6
laboratory testing, 184lahars, 100Lake Nyos, 100Landslide PreventiveMeasures (LPM) programme, 342landslides, 92; modes of failure, 97–8; slopedeterioration and failure, 98–100; triggered byearthquakes, 300–3; empirical relationships,302–3; landslide mechanisms, 300–2; see also slopes
lawyers, 19limestone, 59, 103; cavities in, 292; construction ofpiles in, 332; dolomitisation of, 59; joints, 218;marble, 61; Simsima Limestone (Qatar), 198–200
liquefaction susceptibility, 125liquid limit (LL) of clay, 51lithification, 191–3LL, see liquid limit (LL) of clayloads, 231–6; from buildings, 236; natural stressconditions, 231–5; active tectonic regions, 234;overconsolidated clay, 234; Poisson effect, 232;topographic regions, 235; tunnels, 232–3
loess, 53logging of borehole samples, 168–72; examples,168–9; consultant’s report, 384–93; Hong Kong,384; UK, 379–83; over-simplification ofclassification terminology, 169–72; reporting,184; terminology, 169
logging, down-hole, 172–4London Clay, 116, 207, 234, 234–5, 333–6; see also
clay soilsLötschberg rail tunnel (Switzerland), 54LUSI mud volcano (Indonesia), 52
Malaysia; Pergau Dam, 235; Pos Selim Landslide,105, 123, 128, 320–2
maps; guidance for, 147; for geological modelling,102; hazard, 125
Mass Rapid Transit (MRT) (Singapore), 312, 323Mass Transit Railway Corporation (MTRC) HongKong, 26
Mazier core barrel, 160, 161–2mediation, 24metamorphic rocks; aureole, 60–1, 102; classification,60–2; regional, 61
method of slices, 280, 306method statements, 16mines; safety during earthquakes, 299; surface, 296–7model, design, 102, 104, 105models, ground, 38, 100–14; design of tunnel,113–14; development of, 41, 104; examples,103–7; fracture networks, 103; principles of, 101;procedures for creating, 102–3
models, site, 1–2Mohr’s stress circles, 69–71, 202Mohr-Coulomb model, 71, 210, 276, 305mud volcanoes, 52
446 Index

NEC, see New Engineering Contract (NEC)New Austrian Tunnelling Method (NATM), 33, 334New Engineering Contract (NEC), 19, 335New Zealand; Christchurch earthquake 296,298
Nicoll Highway collapse (Singapore), 24, 119, 237,305, 323–4
Nirex, 339–40nuclear waste disposal, 132–3numerical modelling; for analysis and design, 305–7;software, 306–7
observational approach, 33, 119oedometer tests, 204, 206, 241Osterberg cells, 249owner, of engineering projects, 14
Pacoima Dam (United States of America), 295Pergau Dam (Malaysia), 235periglacial shears, 67periscope, borehole, 140–1, 154, 171, 172permeability, 204–5; see alsohydraulic conductivity testsPI, see plasticity index (PI) of claypiezocone, 166piezometers, 91, 175–6, 178pile foundations, 30; barrettes, 251–2; bored piles,244–5; caissons, 252; design of piles, 245–9; drivenpiles, 242–4; example of pile design, 247; prooftesting on piles, 249
pile load test, 249piling, 305Ping Lin Tunnel (Taiwan), failure of, 67, 318piping, types of, 94PL, see plastic limit (PL) of clayplastic limit (PL) of clay, 51plasticity index (PI) of clay, 51plates, 44, 63PLAXIS, 241, 305Po Chang (South Korea) slope hazards, 274–6point load test, 147, 196, 199Poisson effect, 232polished stone value (PSV), 229porosity, definition, 356Portsmouth University, 344Portugal; Cachopo Road, 49, 58; Pracana Dam,failure of, 131, 314
Pos Selim Landslide (Malaysia), 105, 123, 320–1; airphotograph interpretation (API), 125–8
Pracana Dam (Portugal), failure of, 131, 314pre-drill, 121preliminary boreholes, scope of site investigation,122–3
pressuremeter, self-boring, 161principal stresses, 33, 70, 76, 78, 83, 231–5principal planes, 202, 231programmes, 16project design, 16–17project designers, 14; contractors as, 18project director, 16
project management, 14–18properties of soil and rock, 186
Qatar; Simsima Limestone, compressive strengthtests, 198–9
QS, see quantity surveyors (QS)quantity surveyors (QS), 20quarrying, 293–4quartz, 44, 50Queen’s Valley Dam (United Kingdom), compressivestrength tests, 197–8
Q value, 22, 212, 253, 368, 374
raft foundations, 30rainfall; flow paths through rock, 95–6; flow pathsthrough soil, 94–5; groundwater response to, 92–4
RE, see resident engineer (RE)reference ground conditions, 21–3representative elemental volume (REV), 94resident engineer (RE), 17REV, see representative elemental volume (REV)Rion–Antirion Bridge (Greece), 298risk allocation for geotechnical conditions, 19–21risk register, for soil slopes, 281RMR, see Rock Mass Rating (RMR)road stone, 229rock mass classification, 22, 146–7, 374–8; GSI,
210–12, 376–7; limitations of, 168; Q value, 22,210, 212; rock mass modulus, 211–12; Rock MassRating (RMR), 22, 210, 212, 375–6; Rock QualityDesignation (RQD), 147, 359, 374–5
Rock Mass Rating (RMR), 22, 210, 212, 375–6rock slopes; modes of failure, 6–9, 270–4; deep-
seated, 274; shallow, 269; structural, 272–4;undrained analysis, 276
rock to soil and soil to rock, cycle of, 11rocks; bearing pressures, 239–40; classification
terminology, 22, 23, 34, 210, 212, 359–60, 364–5;complex geometries in, 78–80; compressivestrength, 239–40; definition of, 9; description of,362–3, 364; differentiation into sets, 73–4; asengineering materials, 9–11; exposures, 147–8;failure envelope, in rocks, 70; fall hazards, 270–2;joint data, 150–1; solid, 40; strength envelope, 189,202, 209, 210, 211, 218
rockhead, 39; end-bearing on, 30; geologicaldefinition, 40; geotechnical definition, 40
rocks, in construction; aggregate, 228–9;armourstone, 229; dimension stone, 229–30; roadstone, 229
rocks, discontinuity properties, 213, 365–8; in-filledjoints, 223; parameters, 214–15; shear strength ofjoints, 215–22; basic friction, 215–21; dilationangle, 216–18; estimation using empirical methods,223–5; roughness, 221–2
rocks, physical properties of; cohesion, 189;compressive strength, 196, 197–200, 208;conversion from soil, 186, 191–3; deformability,204; fractures, 193; fresh to moderately weathered
Index 447

rock, 207; friction, 187–9; mass deformability,211–13; mass strength, 209–11; permeability,204–5; shear strength, 201; direct shear, 201;dynamic, 226–8; residual strength, 203–4; triaxialtesting, 201; true cohesion, 203; and soil mixtures,226–8; tensile strength, 201;weathering, 190–1, 208,368–73; chemical, 10, 12; see also sedimentary rocks
rocks, types of discontinuities in, 63–84, 130–1,367–8; complex geometries, 78–80; differentiationinto sets, 73–4; faults, 64–7, 131–2; brittle, 65;plastic, 65; reverse, 65; normal, 65; seals, 67; TBMtunnel collapse, 65; geological interfaces, 64; joints,67–73, 365–8; columnar, 73; primary, 68;secondary, 68; tertiary, 68; morphology of, 84–6;non-orthogonal systematic, 76–8; orthogonalsystematic, 74–6; periglacial shears, 67; CarsingtonDam, 67; sedimentary rocks, 85–6; shear joints, 78;sheeting joints, 80–4; tension fracture, 86
rock-soil mixes, 226–8; bearing capacity, 228; shearstrength, 227–8
RocLab, 210Rocscience, 306rotary drilling, 158–61roughness, 68, 85, 189, 214–15, 221–4, 376
salts, 59–60sands, 47, 53satellite imagery, for site investigation, 127saturation, definition, 356scan line survey, 149, 174–175Schmidt hammer, 196sedimentary rocks, 46–60; environments, 52;
offshore, 58–60; onshore, 52–7; grain size, 47, 50;morphology of discontinuities in, 84–5, 367–8; seealso rocks
sedimentation, rates of, 191–2self-boring pressuremeter (SPT), 161–4Sellafield Investigations (United Kingdom) 132–3,339–40
serviceability limit state (SLS), 29; definition, 239settlement, 29; differential, 29SHAKE, 298shallow foundations, 29shear strength, 201; direct shear, 201; residual strength,203–4; triaxial testing, 201; true cohesion, 203
shear strength, of rock-soil mixes, 225–6shear tests, 166, 167; direct shear tests, 201, 209; tomeasure basic friction of natural joints, 215–21; infield, 165, 166; on granite, 188; Leeds direct shearbox, 144; for persistent rock discontinuities, 201;on soil, 201; Yip Kan Street landslide, 219–21;triaxial shear tests, 67, 144, 227; on soils, 201
shell and auger rig, 156–8, 337Simsima Limestone (Qatar), compressive strengthtests, 198–200
Singapore; Fort Canning Boulder Bed, 54, 55–7;Jurong Formation, 55, 57; Nicoll Highwaycollapse, 24, 119, 237, 306, 323–4; TBM tunnelcollapse, 65, 314–13
site excavation, 19–21, 288; see also dredgingsite investigation; down-hole logging, 172–5;environmental hazards, 179–80; coastal recession,181; contaminated land, 182; natural terrainlandslides, 180–1; seismicity, 183–4; subsidenceand settlement, 181–3; field exposures, 143–51;instruments, 146–8, 150; rock exposures, 148–9;field reconnaissance and mapping, 139–41; cost-effectiveness of, 140–1; use of GPS, 141–2;geophysics; constraints of, 151–2; down-hole, 154;resistivity, 154; seismic methods, 152–3; in-situ,sub-surface, 154–67; boreholes in soil, 155;deformability tests, 167; hydraulic conductivitytests, 167; objectives, 154–5; piezocone, 166; rotarydrilling, 158–61; shear tests, 166, 167; standardpenetration test (SPT), 161–5, 202; static conepenetrometer, 165, 166, 202; vane test, 165, 202;instrumentation, 176–81; extensometer, 177, 179;inclinometer, 178, 180; piezometers, 176–7, 179;laboratory testing, 184; logging of boreholesamples, 168–73; examples, 168–9, 383–95;over-simplification of classification terminology,169–73; reporting, 184–5; terminology, 169
site investigation, procedures for; desk study, 124–8;air photograph interpretation, (API) 125–8; sourcesof information, 124–5; planning, 128–39; forhydroelectric scheme, 137–9; verbal equations,129–36
site investigation, scope of, 6, 115–24; StonecuttersBridge, 121, 122; extent of, 120; for foundations,123; for new tunnel, 121; preliminary boreholes,122–3; variations around the world, 121
site variations, 19–21skin friction (piling), 30, 105, 245–52, 301slake test, 147SLIDE, 306slope hazards, 274–6slope stability assessment, 9–10, 197, 225,268, 277
slopes, rock, see rock slopesslopes; classification, 378; deterioration and failure of,6–9, 98–100; instrumentation of, 94; modes offailure, 6–9, 97–8; see also landslides
SLOPE-W, 274, 278, 304, 306SLS, see serviceability limit state (SLS)slurry machines, 255soil slopes, 274; design considerations forearthquakes; displacement analysis, 305; pseudo-static load analysis, 304–5; example of hazardmodel, 274–6; options to improve stability of;drainage, 284–5; maintenance, 287–8; mesh, 283;reinforcement, 285–6; retaining walls, 286–7; rockand boulder falls, 282–3; surface treatment, 281–2;remediation, 279–81; risk assessment, 279; slipplanes, 277; stability analyses, 278; Factor of Safetyapproach, 278–9; partial factor approach, 278;undrained approach, 278
soil; bearing pressures, 240; classificationterminology, 359–60; compressibility and
448 Index

settlement, 241; definition of, 9–10; description of,362, 363–4
soil, physical properties of; clay soils, 205–6;cohesion, 189; compressive strength, 196, 197;conversion to rock, 186, 191–3; deformability of,185–6, 204; fractures, 193; friction betweenminerals, 187–9; granular soils, 207; massproperties, 207; permeability, 204–5; and rockmixtures, 193–5; shear strength, 201; direct shear,201; residual strength, 203–4; triaxial testing, 201;true cohesion, 203; strength of, 185–6
‘soil’ vs. ‘rock’ rock assessment, 9–10solid rock, definition, 40South Africa; avalanche shelter, 283; colluvium, 227;geological interfaces, 63, 64, 74
South Bay Close (Hong Kong), rock slope failure in,6–9
South Korea; Busan Clay, 205; Busan, landslide in,341–2; Incheon Bridge, 121, 249–50; Po Chang,274–6; Young Dong Mountain Loop Tunnelproject, 394–7
South West Transport Corridor (Queensland,Australia), 122
specific volume, definition, 356Spain; Cabacés, 39; Falset, 39SPT, see standard penetration test (SPT)Staffa, Isle of, see United Kingdomstandard penetration test (SPT), 156, 158, 160–5; ongranular soils, 241; in situ site investigation, 161–7
standards, 195static cone penetrometer, 165, 166Stonecutters Bridge (Hong Kong), site investigation,121, 122
Strategic Sewerage Disposal Scheme (SSDS) (HongKong), 336–9
strength envelope, for rock, 189, 202, 209, 210,211, 218
stress bulb, 27stress calculations, examples; active tectonic regions,235; over-consolidated clay, 234–5; topographicregions, 235; tunnels, 232–3
stress, definition, 367–8strip footings, 28, 240subsidence, 182–3surface mining, 293–4Sutong Bridge (China), 245Switzerland; Lötschberg rail tunnel, 54
Tai Po to Butterfly Valley (Hong Kong), 261Tailuko Gorge (Taiwan), 272Taiwan; Ping Lin Tunnel, 65, 318;Tailuko Gorge, 272
TBM tunnel collapse (Singapore), 65, 260temporary works, 237tensile fractures, 82–6, 217tensile strength, 29–30, 201; of concrete, 201, 244,tensile strength, 201, 365
‘total geological approach’ model, 42, 128,133–4
trial pit logs; of consultant, 384; of contractor, 394;Hong Kong, 384; UK, 391
triaxial shear tests, 67, 145, 224, 360; on soils, 201Tsing Yi Island Landslide (Hong Kong), 105–10Tuen Mun Highway Landslide (Hong Kong), 110–13tuff, 45, 46Tung Chung, Hong Kong, 318–19tunnel boring machines (TBM), 31–2, 65, 254–6,
312–13, 399–411Tunnelman’s classification, 255tunnels; cavern design, 265–6; design of, 31–3,
113–14; general considerations, 253–4; hard rocktunnelling, 258–60; drill and blast, 258–60;permanent design, 261–2; permanent liners, 262–4;portal design, 261–2; procedures for siteinvestigation, 124; risk assessment, 19, 266–8; atdesign stage, 267, 397–8; registers duringconstruction, 267–8, 415–16; road headers, 256–9;safety during earthquakes, 303; safety issues, 32–3;scope of site investigation, 117; shallow, 32–3; softrock tunnelling, 254–5; stress calculations, 232–3;techniques of construction, 31; temporary worksfor supports, 237–8, 260–1; tunnel boringmachines (TBMs), 31–2, 65, 254–5, 316–18,398–416; underground mining, 266
UCS, see unconfined compressive strength (UCS)UDEC, 73, 304, 306UK, see United KingdomUK Register for Ground Engineers, 345ULS, see ultimate limit state (ULS)ultimate limit state (ULS), 239unconfined compressive strength (UCS), 197, 200,
207; see also compressive strengthUnited Kingdom; Abbeystead disaster, 130, 328;bridge abutment, Lake District, 140–1; BrockramInvestigations, 132–4; Carsington Dam, failure of,67, 311–12, 315; chalk, 59; Drax Power Station,54, 330–1; failure of project due to ground anchors,327–32; failure of project due to karstic limestone,333; glaciers in, 53–4; Heathrow Express Tunnelcollapse, 24, 116, 333–6; igneous rocks, 44, 48;Kingston on Hull, 322–3; profit margins of designconsultants, 16; Queen’s Valley Dam, compressivestrength tests, 197–8; Sellafield Investigations(United Kingdom) 132–3, 339–41; SkiddawGranite, 61; Staffa, Isle of, 48, 77, 78; TBM collapsein Halifax, 316–18; training for engineeringgeologist, 344–5, 352; trial pit logs, 393
United States of America; Pacoima Dam, 295;training, 344–5
vane test, 165, 201; on clay soil, 205verbal equations, for planning of site investigations,129–43; construction-related factors, 136;environmental factors, 135–6; geologicalfactors, 129–30; mass scale, 131–3;material scale, 130–1
vibrations, construction, see construction vibrations
Index 449

void ratio, definition, 356volcanoes, 45, 48, 100; mud, 52
wash boring, 156water content, definition, 356water, 91–3; flow paths through rock, 95–6; flowpaths through soil, 94–5; ground water response torainfall, 92–4; inflows, 92; runoff, 93; see alsogroundwater; water table
water table; changes in, 88, 91–2, 155, 182, 262; stresscalculations, 232–3; Tsing Yi Islandlandslide (Hong Kong), 105–10; Tuen MunHighway landslide (Hong Kong), 110–13;wetting band theory, 93; see also groundwater;water
waviness, 85weathering, in rocks, 87–90, 190–1, 208–9, 368–9;
chemical, 10, 12, 88–90; corestones, 88, 89–90; in
cold climates, 87–8; definition, 87; failure inprojects due to, 320–4; processes, 87;decomposition, 87; disintegration, 87; eluviation,87; in temperate climates, 88; in tropical areas, 87
websites, 235, 307Wenchuan earthquake (China),300
wetting band theory, 93wire line drilling, 160
Yip Kan Street landslide (Hong Kong),219–21
Young Dong Mountain Loop Tunnel project (SouthKorea), 394–5
Young’s Modulus, 204
Zambezi River, 126
450 Index