petrophysical and geomechanical characterization of a
TRANSCRIPT
ZORASI, C.B. 2019. Petrophysical and geomechanical characterization of a marginal (Wabi) field reservoir in north-central Niger Delta. Robert Gordon University [online], MRes thesis. Available from: https://openair.rgu.ac.uk
Petrophysical and geomechanical characterization of a marginal (Wabi) field
reservoir in north-central Niger Delta.
ZORASI, C.B.
2019
This document was downloaded from https://openair.rgu.ac.uk
The author of this thesis retains the right to be identified as such on any occasion in which content from this thesis is referenced or re-used. The licence under which this thesis is distributed applies to the text and any original images only – re-use of any third-party content must still be cleared with the original copyright holder.
PETROPHYSICAL AND GEOMECHANICAL CHARACTERIZATION OF
A MARGINAL (WABI) FIELD RESERVOIR IN NORTH CENTRAL
NIGER DELTA
ZORASI, COLLINS BARIBOR BSc, MSc (Applied Geophysics)
1417713
MRes 2019
ii
PETROPHYSICAL AND GEOMECHANICAL CHARACTERIZATION OF A
MARGINAL (WABI) FIELD RESERVOIR IN NORTH CENTRAL NIGER
DELTA
ZORASI, COLLINS BARIBOR BSc, MSc (Applied Geophysics)
1417713
A thesis submitted in partial fulfillment of the
requirements of the
Robert Gordon University
for the degree of Master of Research
This research programme was carried out in
Collaboration with Schlumberger, Aberdeen.
September 2019

iii
Dedication
I hereby dedicate this thesis to Almighty God for his provisions of life, unmerited favour and wisdom to
accomplish this research work and; to my grandmother Mrs. Leyorma Tanen who had given me words of
encouragement and had been keen for my success in life. This thesis is also dedicated to my lovely wife
Mrs. Zorasi Happy Barineka.

iv
Acknowledgements
It is rare and almost impossible for a research work such as this to be carried out successfully without
meaningful contributions from others by way of moral, academic, financial as well as spiritual
encouragement and support. It is in this light that I wish to pay tribute to Almighty God for his gracious
gift of health, provision and wisdom for completing this thesis in his Glory.
I wish to express my sincere thanks and appreciation to my supervisory team Dr. Nadimul Faisal, Dr.
Sheikh Islam and Dr. Gbenga Oluyemi whose advice, constructive criticism, positive suggestions and
materials contributed so much to the success of this thesis. Thanks to my Lecturers/academic staff, Prof.
Bab, Oyeneyin, Dr. Colin Thompson, Dr Gelareh Holbrook, Dr. James Cunningham and Prof. Richard
Laing for their academic advice and support. I really appreciate Dr. Fabian Krzikalla Schlumberger
Aberdeen for his advice and materials support.
It is my pleasure to acknowledge. Mr. Huub Streng of Total Exploration and Production Nigeria Limited
for the provision of data used in this research and Mr. Adeyiga Adeyemi of the Department of Petroleum
Resources for his kind consideration towards the data collection. My heartfelt gratitude also goes to Dr.
Mammah Sylvester for his assistance through various means to ensure that I am successful in my endeavour
and the special joy he has added to my life.
It was an honour to be chosen as a recipient of the most prestigious Petroleum Technology Development
Fund (PTDF) scholarship award, without their financial support I would not be able to complete this study
on time. I really acknowledge your support.
I will remain grateful to my family members especially Mrs. Tanen Sila Rose, Uncle Zorasi John and all
well-wishers who contributed in one way or the other toward the success of this thesis I say thank you. I
also wish to acknowledge my colleague Mr. Abbey Dearson for the time spent to proofread this report.
ZORASI, Collins Baribor
v
ABSTRACT
The aim of this study is to evaluate marginal field petrophysical and geomechanical
parameters and to develop a model for analysis of geomechanical problems to mitigate stress
related issues in drilling, development and reservoir management for Wabi field, onshore Niger
Delta.
The increase in oil and gas demand globally has necessitated the re-evaluation of mature depleted
and marginal fields for enhancement of hydrocarbon recovery and development in the Niger delta province.
These oil and gas fields are situated in the young sedimentary rocks known as shaly-sand formation basin
called Tertiary Niger delta. Tertiary Niger Delta is an unconsolidated formation which depositional
environment had led to production and development difficulties due to related geomechanical issue
possibilities such as weak reservoir rocks, low pressure (depleted reservoir), stack or multiple reservoirs
with thick net pay and high porosity. The methodology leverage on integrated approach (seismic,
core, wireline logs and DST in-situ stress measurements), for continuous and static measurements
along the borehole record of mechanical properties of the rock penetrated for petrophysical and
geomechanical characterization of Wabi field.
To understand the current condition of this field of study, identification of stress state and
mechanical rock properties was investigated for reservoir development and management. Therefore, this
research focuses on geomechanical characterisation for development of geomechanical model for
predicting fault reactivation, fractures and sand production which leads to compaction and subsidence.
In summary, the followings conclusions are made: Wabi field has pockets of potential hydrocarbon
reserves at different intervals with good reservoir qualities to enhance its development for production. Also,
rock strength estimation in this field shows that the reservoir is stable; however, production of hydrocarbon
from these zones may lead to subsidence. To mitigate for this futuristic event reservoir pressure
maintenance should be plan for. If injection will be anticipated the appropriate pressure should be used not
to fracture or cause fault reactivation in the wells. The results of this study show the estimation of
hydrocarbon reserve and help to avoid and predict geomechanical related problems and devise a mitigating
strategy for sanding management. Finally, the results should be beneficial to marginal field’s operators who
may venture into acquisition of marginal fields with limited resources and needs to maximize profits.
vi
TABLE OF CONTENTS
Title Page i
Dedication iii
Acknowledgement iv
Abstract v
Table of Contents vi
List of Figures x
List of Tables xiii
Nomenclature xiii
CHAPTER 1: INTRODUCTION
1.1 Research context 1
1.2 Motivation of the study/statement of the problems 5
1.3 Research aims 5
1.4 Objectives 6
1.5 Contribution to knowledge/justification of the study 6
1.6 Thesis layout 7
CHAPTER 2: LITERATURE REVIEW
2.1. Rock and rock mechanics 8
2.2. Sand production management 10
2.2.1. Fault and fractures of rock 14
2.3. Review of the Niger Delta geology 16
2.3.1. Tectonic settings of the Niger Delta 16
2.3.2. Regional Geology of the Niger Delta 20
2.3.3 Stratigraphy of the Niger Delta 22
2.3.4 Location of the study area 25
vii
2.4. Conceptual framework 26
2.4.1. Stress field pattern of the Niger Delta 30
2.4.2. Petroleum basin geomechanical characterisation 34
2.5. Estimation of in situ stress 36
2.5.1. Description of principal stresses 38
2.6. Theoretical framework (Behavior of rock) 38
2.6.1. Linear elasticity 38
2.6.2. Poro-elasticity 40
2.6.3. Plasticity 40
2.6.4. Visco-elasticity 40
2.7. Rock strength and rock failure 41
2.7.1. Factors affecting rock strength 41
2.7.2. Rock failure and fracture mechanics 43
2.7.3. Basic rock model 44
2.8. Empirical review 45
2.8.1. Sand production 45
2.8.2. Geomechanical methodology 48
2.8.5. Previous work on Wabi field. 53
CHAPTER 3: MATERIALS AND METHODS
3.1 Materials and methods 55
3.1 Method of data collection and instrumentation 55
3.2 Research design (workflow) 55
3.2.1 Procedures to carry out this analysis 57
3.3. Geomechanical properties estimation 58
3.3.1. Elastic properties of rock 58
3.3.2. In situ stress measurement of mechanical properties 60
3.3.3. Geophysical tools (acoustic and density logs) 61
3.3.4. Determination of elastic constants 65
3.4. In situ stress estimation 68
viii
3.4.1. Vertical stress determination 68
3.4.2. Minimum horizontal stress determination 69
3.4.3. Maximum horizontal stress 70
3.4.4. Pore pressure estimation 71
3.4.5. Stress (pressure/depth) gradient determination 72
3.5 Rock strength determination 73
3.5.1 Unconfined compressive strength (UCS) 73
3.5.2 Cohesive strength ( ) 74
3.5.3 Tensile strength ( ) 74
3.6 Failure mechanisms 75
3.6.1 Shear failure mechanism 75
3.6.2 Tensile failure mechanism 76
3.7 Failure criteria 76
3.7.1. Mohr criterion 77
3.7.2. Mohr Coulomb failure criterion 77
3.9. Cost and Limitation of the study. 78
CHAPTER 4 : RESULT PRESENTATION AND DISCUSSION
4. Data analysis presentation and discussion 80
4.1. Data sources (inventory) 80
4.1.1. Regional correlation 81
4.1.2. Depositional environment 82
4.1.3. Reservoir delineation for sand production/failure 82
4.2. Petrophysical evaluation analysis 88
4.2.1. Reservoir delineation and petrophysical characterization. 89
4.2.2. Reservoir analysis for hydrocarbon types and fluid contacts 92
4.2.3. Quantitative analysis 94
4.3. Seismic interpretation of Wabi field 110
4.3.1. Time structural map 112
ix
4.3.2. Structural analysis 112
4.4. Stress distribution from geologic map of seismic section 115
4.4.1. Stress direction 115
4.4.2. Magnitude of principal stresses 116
4.4.3. Pore pressure and overburden gradient 120
4.5. Mechanical properties estimation 123
4.5.1. Young’s modulus of the field 123
4.5.2. Poisson’s ratio of the Wabi field 126
4.5.3. Unconfined compressive strength 127
4.5.4. Influence of rock strength 127
4.5.5. Fracture and Fault stability analysis 128
4.5.6. 3D Mohr diagram of the field. 129
CHAPTER 5: CONCLUSION AND RECOMMENDATIONS
5.1 Summary of research 132
5.2 Conclusion 133
5.3 Recommendations 137
References 138
Appendices 155
x
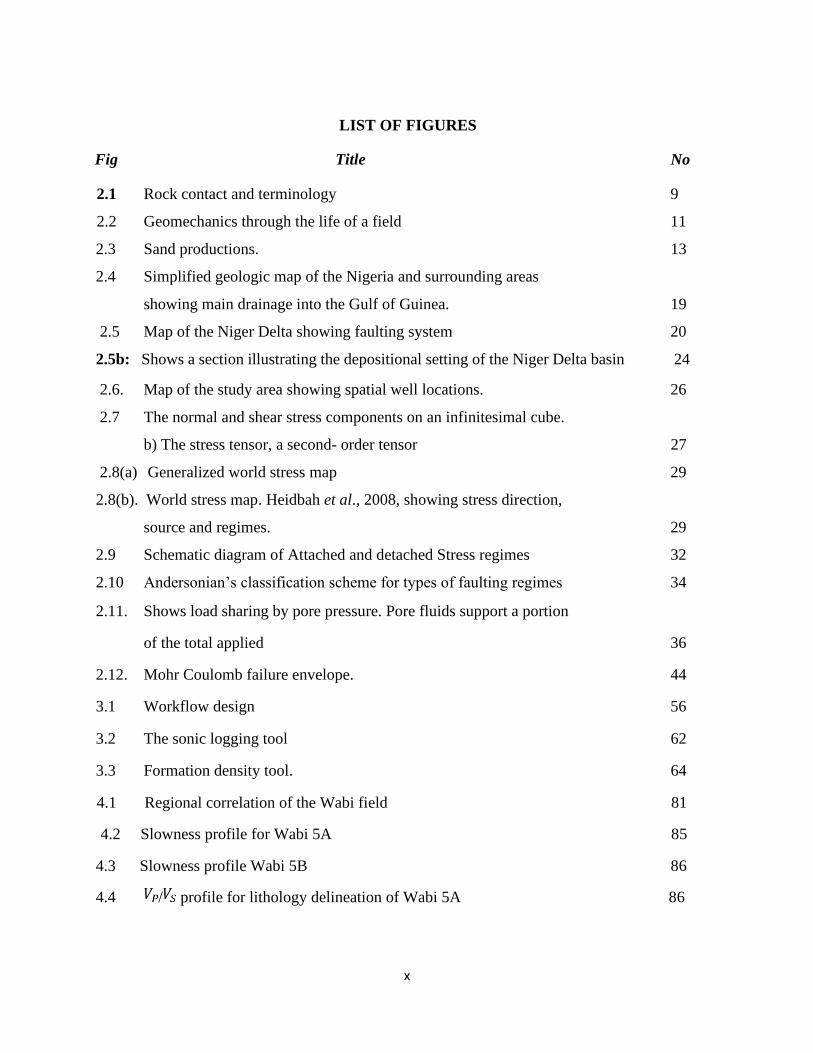
LIST OF FIGURES
Fig Title No
2.1 Rock contact and terminology 9
2.2 Geomechanics through the life of a field 11
2.3 Sand productions. 13
2.4 Simplified geologic map of the Nigeria and surrounding areas
showing main drainage into the Gulf of Guinea. 19
2.5 Map of the Niger Delta showing faulting system 20
2.5b: Shows a section illustrating the depositional setting of the Niger Delta basin 24
2.6. Map of the study area showing spatial well locations. 26
2.7 The normal and shear stress components on an infinitesimal cube.
b) The stress tensor, a second- order tensor 27
2.8(a) Generalized world stress map 29
2.8(b). World stress map. Heidbah et al., 2008, showing stress direction,
source and regimes. 29
2.9 Schematic diagram of Attached and detached Stress regimes 32
2.10 Andersonian’s classification scheme for types of faulting regimes 34
2.11. Shows load sharing by pore pressure. Pore fluids support a portion
of the total applied 36
2.12. Mohr Coulomb failure envelope. 44
3.1 Workflow design 56
3.2 The sonic logging tool 62
3.3 Formation density tool. 64
4.1 Regional correlation of the Wabi field 81
4.2 Slowness profile for Wabi 5A 85
4.3 Slowness profile Wabi 5B 86
4.4 / profile for lithology delineation of Wabi 5A 86
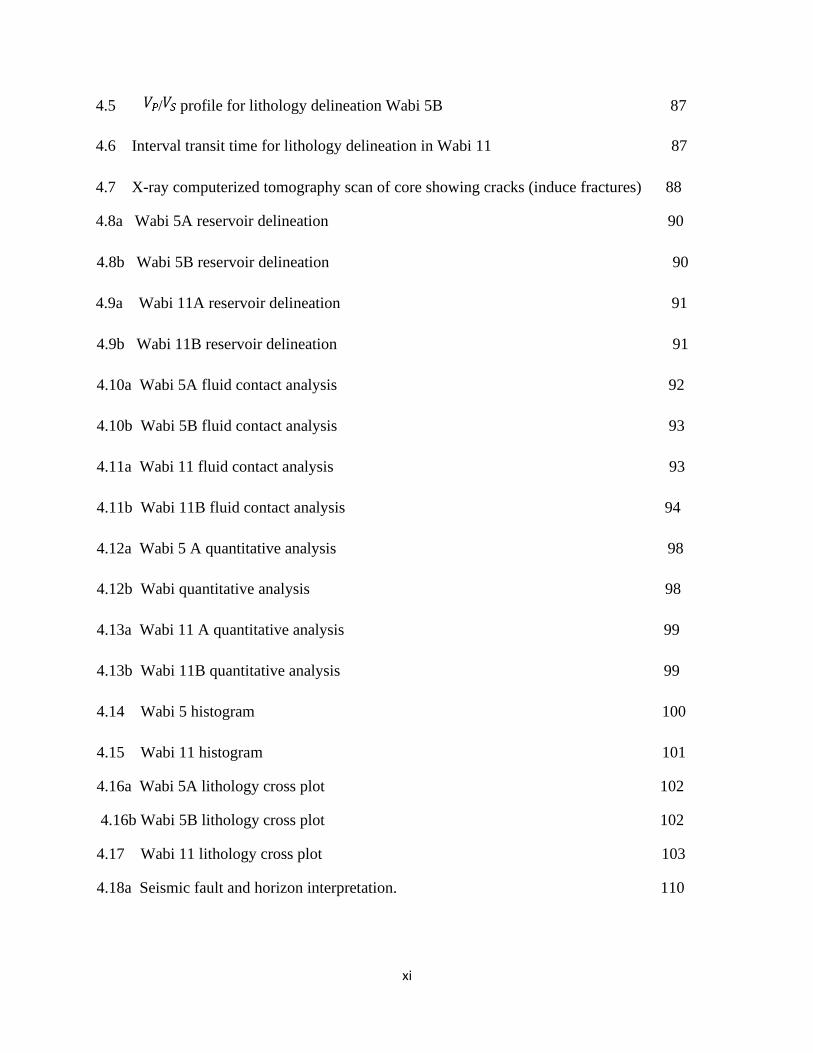
xi
4.5 / profile for lithology delineation Wabi 5B 87
4.6 Interval transit time for lithology delineation in Wabi 11 87
4.7 X-ray computerized tomography scan of core showing cracks (induce fractures) 88
4.8a Wabi 5A reservoir delineation 90
4.8b Wabi 5B reservoir delineation 90
4.9a Wabi 11A reservoir delineation 91
4.9b Wabi 11B reservoir delineation 91
4.10a Wabi 5A fluid contact analysis 92
4.10b Wabi 5B fluid contact analysis 93
4.11a Wabi 11 fluid contact analysis 93
4.11b Wabi 11B fluid contact analysis 94
4.12a Wabi 5 A quantitative analysis 98
4.12b Wabi quantitative analysis 98
4.13a Wabi 11 A quantitative analysis 99
4.13b Wabi 11B quantitative analysis 99
4.14 Wabi 5 histogram 100
4.15 Wabi 11 histogram 101
4.16a Wabi 5A lithology cross plot 102
4.16b Wabi 5B lithology cross plot 102
4.17 Wabi 11 lithology cross plot 103
4.18a Seismic fault and horizon interpretation. 110
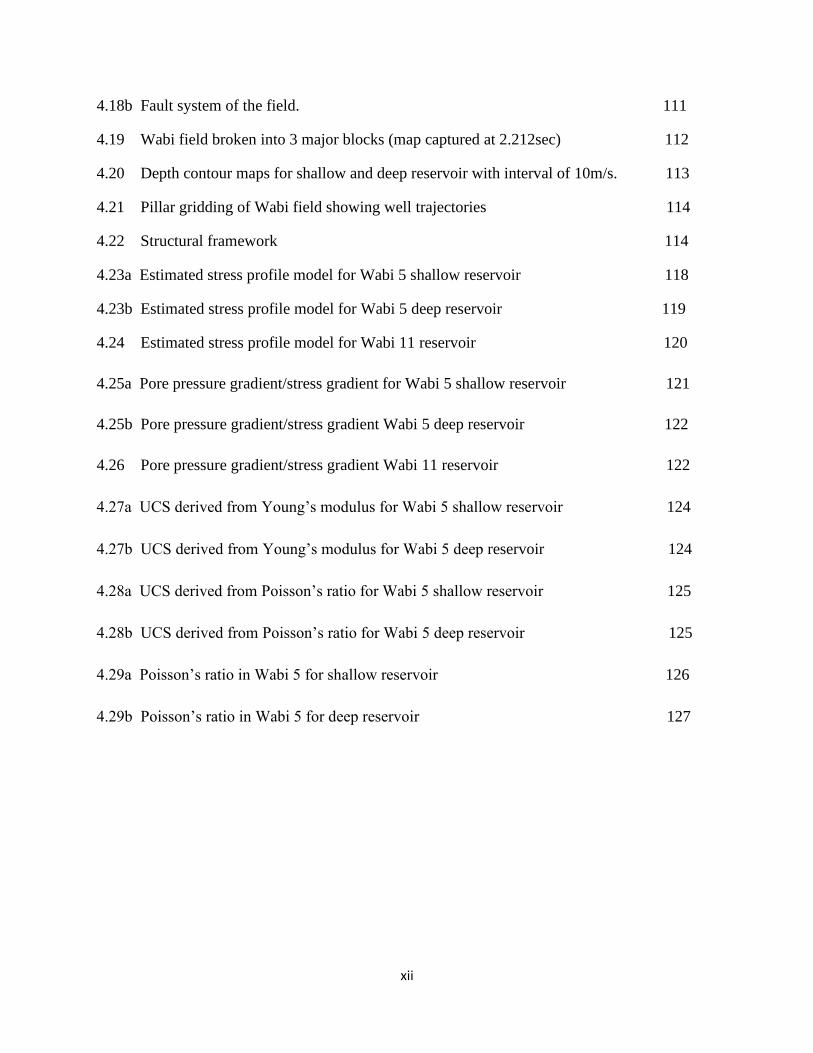
xii
4.18b Fault system of the field. 111
4.19 Wabi field broken into 3 major blocks (map captured at 2.212sec) 112
4.20 Depth contour maps for shallow and deep reservoir with interval of 10m/s. 113
4.21 Pillar gridding of Wabi field showing well trajectories 114
4.22 Structural framework 114
4.23a Estimated stress profile model for Wabi 5 shallow reservoir 118
4.23b Estimated stress profile model for Wabi 5 deep reservoir 119
4.24 Estimated stress profile model for Wabi 11 reservoir 120
4.25a Pore pressure gradient/stress gradient for Wabi 5 shallow reservoir 121
4.25b Pore pressure gradient/stress gradient Wabi 5 deep reservoir 122
4.26 Pore pressure gradient/stress gradient Wabi 11 reservoir 122
4.27a UCS derived from Young’s modulus for Wabi 5 shallow reservoir 124
4.27b UCS derived from Young’s modulus for Wabi 5 deep reservoir 124
4.28a UCS derived from Poisson’s ratio for Wabi 5 shallow reservoir 125
4.28b UCS derived from Poisson’s ratio for Wabi 5 deep reservoir 125
4.29a Poisson’s ratio in Wabi 5 for shallow reservoir 126
4.29b Poisson’s ratio in Wabi 5 for deep reservoir 127
xiii
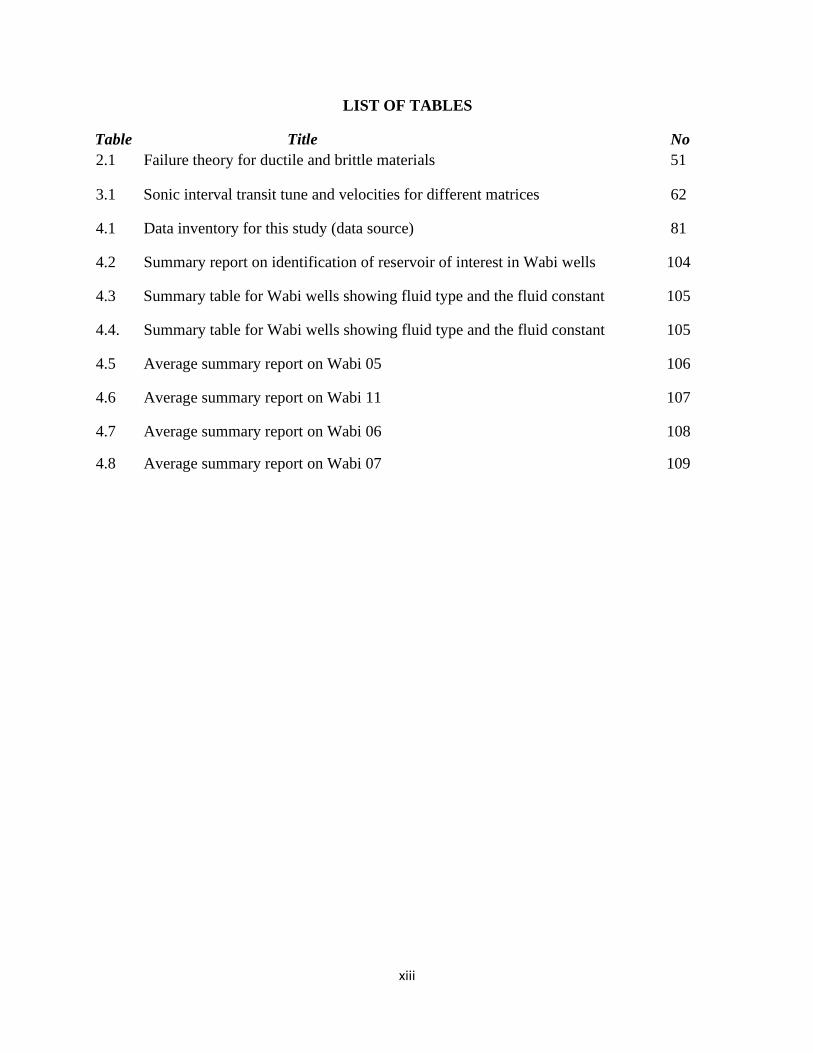
LIST OF TABLES
Table Title No
2.1 Failure theory for ductile and brittle materials 51
3.1 Sonic interval transit tune and velocities for different matrices 62
4.1 Data inventory for this study (data source) 81
4.2 Summary report on identification of reservoir of interest in Wabi wells 104
4.3 Summary table for Wabi wells showing fluid type and the fluid constant 105
4.4. Summary table for Wabi wells showing fluid type and the fluid constant 105
4.5 Average summary report on Wabi 05 106
4.6 Average summary report on Wabi 11 107
4.7 Average summary report on Wabi 06 108
4.8 Average summary report on Wabi 07 109
xiv
NOMENCLATURE
- Cohesion
UCS - Unconfined compression strength
- Compaction factor for sonic log
- Rock matrix compressibility
GR - Gamma ray
h - Reservoir thickness
K - Parameter related to cohesion
Kb - Bulk modulus
LOT - Leak off test
m,n - Hoek constant
NPHI - Neutron log
Pp - Pore pressure
- Drawdown pressure
RHOB - Density log
- Peak strength parameters related to cohesion
(t) - time
v - Change in volume
- Initial volume
- Pure volume
- Bulk rock constituents
- Rock bulk compressibility
- Bulk modulus of the material
- Tensile strength

-
xv
Resistivity of uninvaded zone
Volume of shale
a - Tortuosity factor
- Resistivity of formation water
- Water saturation
- Resistivity of adjacent shale
DRHO - Bulk density correction
- Compaction factor for sonic log
- Shear stress
- Overburden (vertical stress)
- Minimum horizontal stress
- Calibration factor or rock stiffness
- The overburden stresses
- The international horizontal stress
- The minimum horizontal stress
- Effective stress
- Total applied stress
- The rock density
h - The depth of burial
g - Acceleration due to gravity (gravitational) constant
- Shear velocity (S – wave)
- Compressional velocity (P – wave)
d - Magnitude constant
f - Shape constant
- Constant
xvi
Constant
Shmin Minimum horizontal stress
Shmax - Maximum horizontal stress
- Static elastic constant
Fg - Fracture gradient
F - Force
A - Area
D - Depth
E - Young modulus
G - Shear Modulus
- Original length
h – Depth
V - Original volume
- Change in diameter
- Change in length
PF – Pore pressure
– Coefficient of internal faction
– Tensile strength
- Maximum shear stress
- Angle of surface sliding
- Frictional angle
LAS file - Industry standard binary format for storing data.
SEG Y - Society of Exploration Geophysicists standard for
storing Geophysical data.
xvii
Greek symbol
- Biot constant
- High velocity coefficient
- Strain in x direction
Strain in y direction
Elastic strain
- Volumetric strain
- Angle of internal friction
- Poisson ratio
- Bulk density of that formation
- Density read off bulk density log
- Fluid density in a wellbore
- Density of the matrix material
- Density derived porosity
- Sonic derived porosity
- Interval transit time of formation
- Interval transit time of formation matrix
- Interval transit time of fluid in borehole
- Transit time of adjacent shale
C - Constant (1)
- Velocity matrix of material
- Effective minimum horizontal stress
- Maximum stress
- Intermediate stress
- Minimum stress
xviii
- Principal stresses
- - Maximum horizontal stress
- Minimum horizontal stress
- Normal stress at failure
- Normal stress
- Cohesive strength
- Shear stress at failure
- Porosity
- Slip tendency
- Dilation tendency

0

1
CHAPTER 1
INTRODUCTION
1.1 Research context
Interestingly, we are in a dispensation of hydrocarbon prospecting which marks the gradual end
of the era of readily available hydrocarbon discovery with decline in extractable oil from existing
reserves (Tunio et al., 2011). This coupled with the increase in energy demand worldwide,
prompted the government, multinational and indigenous oil industries to look inward for
hydrocarbon production from undeveloped discovery herein referred to as marginal or depleted
mature field, for the reassessment of upside potential of the field. Again, some hydrocarbon
discoveries that are unsuccessful to go with the preferred or conventional production pace may
underline set of reasons for reservoir issues (i.e. geomechanical problems) which need to be
carefully and critically examined (Hugo and Ian, 2014).
In Petroleum prospecting surveys, exploration geophysics is conducted in a sequential order of
relative cost, starting with magnetic, gravity and seismic to find commercial hydrocarbon
accumulation. Less expensive methods are utilized first to narrow down the prospect to be
explored by more expense methods. In geophysical prospecting the physical properties measured
are density, electrical conductivity, magnetism, radioactivity and elasticity. Interpretation involves
much inferential reasoning to provide information about the structure and distribution of rock
types (Martey, 2000).
Authors such as, Adetoba (2008) and Offia (2011) cited previous studies conducted in the prolific
Niger Delta region by the Department of Petroleum Resources (1999) which shows that there are
about 116 marginal fields identified to be lying redundant and unproductive, which transverse the
southern part of Nigeria called the Tertiary Niger delta basin. According to the research work by
Newcross Petroleum (2010), the vast hydrocarbon deposits in such fields account for about 1.3
Billion barrels, (Ajayi, 2017).
Marginal field identifies a prospect with questionable overall economic viability. These marginal
fields mean diverse things to different operating companies worldwide (e.g. what international Oil
Company sees as marginal would not be considered by indigenous companies as marginal). In
2
other words, multinational oil companies focus on the development of their large reserves against
smaller ones (Fee and O’Dea, 1986).
Furthermore, Kulasinga et al (2014) defined Marginal field as hydrocarbon discoveries that may
or may not possess the technical characteristics of a conventional oil field discovered by
multinational oil and gas companies and have not developed it for over a decade.
As the high energy demand grows worldwide, it is undeniably accompanied by the increasing rate
of oil production, prompting prospecting for oil and gas activities in frontier harsher environmental
degradation, where there are geomechanical stress related challenges facing reservoir during oil
and gas exploration and production.
Ajayi (2017) reported that to achieve the desired daily crude oil production rate to meet the world
energy demand and boast the country’s economy, farm out of undeveloped or marginal fields was
circulated for their allocation to home-grown oil companies in Nigeria. In addition, Adamu et al.
(2013) emphasized on the strategic importance of developing marginal fields in the prolific Niger
Delta by the Federal Government of Nigeria as may serve as a drive towards improving reserve
and production capacity enrichment.
According to Nouri et al. (2003), over 70% of developed hydrocarbon fields globally are found in
sediments that are unconsolidated (e.g. sandstone and carbonate formations). Therefore, they are
evidently very prone to unwanted sand production (Udebhulu and Ogbe, 2015). Regions of the
world with continual sand production problems have been recognized in young sediments such as
in: Nigeria, Venezuela, Canada-Tar sands, Indonesia, California and US Gulf coast. These
sediments serve as reservoirs for the world’s hydrocarbon reserves (Osisanya, 2010).
The Tertiary Niger Delta formation is an unconsolidated formation of which sand control is of
major geomechanical problem, especially in geologically complex or difficult areas where some
oil reservoirs and marginal fields are found (Schlumberger, 1985). In their submission, Oluyemi
(2007) and notably, Otti and Woods (2005) has it that the typical characteristics of these
formations/fields include strong degree of unconsolidation, high porous formation with thick net
pay, high rock instability and high depletion rate. Economides and Nolte (2000) opined that the
existence of any two of the characteristics mentioned above, may eventually subject the formation
3
to structural failure because reservoirs that are located underneath the earth crust suffer tectonic
stresses. Several geological activities may have been responsible from the inception of the original
deposition.
Besides, due to scarcity of reliable relevant data from operating oil and gas companies in the Niger
delta, stress pattern of the region is not well understood. However, Tingay et al (2005) illustrated
that the result of world stress map (WSM) conducted so far correlate with global and regional
stress patterns. This WSM is quite helpful when working in areas with none or trivial pre-existing
knowledge particularly, in attempting to comprehend the relative stress orientation and magnitude
from a known area to unknown area. Hence, information of present-day tectonic stress is necessary
for several applications in oil and gas industry (Tingay et al., 2005).
In rock formation, three basic internal stresses are identified Tiab and Donaldson (2012), these are
compressive, shear, and tensile. Reservoir formations are affected by the collective load of the
overlying strata which causes vertical compressive stress, together with lateral (horizontal)
stresses thereby creating imbalance upon the extraction of hydrocarbon (Rasouli et al., 2011).
Hence, anisotropy (variations of stress in materials) occurs as the in-situ principal stresses are
united vertically and horizontally (Zimmerman, 2006; Jamshidian et al., 2017). Principal stresses
are defined as those normal components of stress that act on planes that have shear stress
components with zero magnitude. Stress states in a formation are not always hydrostatic that is,
being equal in all directions, because of the balanced system of the stresses which could be
influence by either tension or compression stresses (Wilson and Cosgrove, 1982). Hence, these
in-situ stresses are aligned into three most important stresses. These three states of stresses exist
in subsurface formation and are described in descending order of magnitude as: vertical or
overburden, sigma 1 ( ), maximum or intermediate horizontal, sigma 2 ( ) and minimum or least
horizontal, sigma 3 ( ). The directions and magnitudes of these formation stresses are used to
characterize reservoir conditions for various geomechanical applications (Sinha et al., 2008). For
instant, the bearing and size of these stresses are requisite for forecasting geomechanical issues
such as borehole stability, hydraulic fracturing for enhanced production and for discerning
intervals of perforation for sand management (Sinha et al., 2008). Hence, they play important roles
in petroleum prospecting for oil and gas and reservoir development (Sinha et al., 2008).
4
Langhi (2014) succinctly affirmed that stresses and deformations have potential to adversely
impact on exploration activities, field development and production operations. Therefore,
evaluating these stresses is critical to comprehending the mechanical performance of a reservoir
rock to make optimal decision throughout the field’s lifespan. Archer and Rasouli (2012) assert
that precise estimation of the state of stresses will necessarily aid proper understanding of the
formation to avoid risk.
To achieve optimum development results and produce reasonable quantities of these hydrocarbons
from marginal or mature fields, these formations/fields will require detailed and comprehensive
assessment or reassessment of the reservoir petrophysical and geomechanical/mechanical
properties of the field such as; the rock strength, present day/in situ stress, and elastic moduli for
development of reservoir geomechanical model for predicting fault reactivation, wellbore
instability, compaction that leads to subsidence and sand production meant to be used for
development plan strategy. Geomechanical characterization of hydrocarbon reservoir rock gives
the description of mechanical parameters based on the physical and chemical composition
(Dusseault, 2011) of rock mass of the geologic formation.
This research will furnish and address geomechanical stress related problems and recommend
mitigating strategy for well completion design and infill drilling in Wabi, in the study area. It shall
employ both quantitative and qualitative approaches/methods that are in accordance with best
industry practices and adopt existing empirical correlations, using seismic and wire line logs
parameters as an input data depending on the initiate stage in the life cycle of the field with the
aim of developing a geomechanical model. Geomechanical model is meant for characterising stress
at depth as well as for solving wide range of geomechanical in-situ stress related to development
problems in the field of study such as fractures, fault reactivation, compaction, sand production
prediction and wellbore instability (Herwanger and Koutsabeloulis, 2011). It can also be used to
devise or design a mitigating strategy for longevity of the field. The integration of Petrophysics
and Geomechanics characterization is paramount for assessment of stresses in the reservoir,
prediction of sand failure, failure in seal, fault reactivation, recommendation for perforation
location and casing for reservoir management. The results obtained from detailed geomechanical
5
analysis shall enhance longevity of well management and ultimately add value to or increase the
daily hydrocarbon production.
1.2 Motivation of the study /Statement of problem
Many researchers have studied new discovery, brownfield (mature depleted reservoirs),
undeveloped discoveries and marginal fields in the Niger Delta based on their upside potentials,
economic viability, wax deposition, water coning, high gas/oil ratio with little or no emphasis on
rock geomechanics properties for well engineering; that is, the original in-situ stress state and the
alteration this stress state may have on the reservoir, whether it is close to failure envelope of the
reservoir rocks (Herwanger and Koutsabeloulis, 2011). The Tertiary Niger Delta is an
unconsolidated formation faced with naturally fractured petroleum reservoirs, this creates
geomechanics challenges which affected well development, drilling and completion, production
and enhancement of recovery.
The unconsolidated nature of the Niger Delta depositional environment has led to production and
development difficulties due to weak reservoir rocks, stack or multiple reservoirs with thick net
pay, highly porous and low pressure due to depleted reservoir (Schlumberger, 1985).
The occurrence of these phenomena at the same time compounds the overall stress-related
geomechanics problems which is damaging to production and development. Hence, identifying the
consequence of initial stress state and what its changes may impact on the reservoir strength during
development and production is vital for reservoir engineering management (Herwanger and
Koutsabeloulis, 2011). This research focuses on geomechanical and petrophysical characterization
of hydrocarbon reservoir rock for optimal development and production of oil and gas. This is vital
for forecasting sand production occurrence for well completion design.
1.3 Research Aim
The aim of this research is to characterize marginal field petrophysical and geomechanical
parameters and develop 3D Mohr Circle geomechanical model for analysis of geomechanical
problems in Wabi, onshore Niger Delta.
6
1.4 Objectives:
The objectives of this research are as follows:
1. To investigate and estimate the field’s mechanical behavior and mechanical properties of the
formation rocks.
2. To carry out Petrophysical interpretation to ascertain Wabi field reservoirs quality.
3. To investigate and model stress (pressure/depth) gradient in the field.
4. To estimate and model the elastic properties, rock strength, and in-situ stress field that exist in
Wabi field from geophysical logs
5. To develop 3D Mohr Circle Geomechanical model to predict rock strength, fault reactivation,
wellbore instability, sand production fractures, wellbore instability and sand failure during
production.
1.5. Contributions to knowledge and justification of the study
This research contributes to knowledge as follows: Geomechanics as at today had not been fully
implemented in most fields in the Niger Delta, especially, it is lacking in field development plan
(FDP) submission by operators to Government regulating agency. Sequel to the above, the author
has carried out petrophysical and geomechanical evaluation known as reservoir geomechanics and
wellbore stability investigations of Wabi field using an integrated approach with data sets
comprising of seismic data, petrophysical logs and core x-ray computerized tomography (CT scan)
to guide and assure stable wellbore, choice of completion intervals and prediction of onset sand
production. This research finding predicted in-situ rock stresses, Poisson’s ratio, modulus of
elasticity, porosity, pay zones (reservoirs with hydrocarbons), volume of shale, hydrocarbon
saturation and rock strength for proper characterization of Wabi reservoirs, these are the claimed
contributions by the author in Wabi field. The applications of the findings are relevant in well
intervention programs, infill drilling and injectivity for enhancement of hydrocarbon recovery to
profer better engineering design to reduce risks associated with oil and gas development for
production optimization. This is very helpful to marginal field’s operators who may venture into
7
acquisition of marginal fields for optimum profitability and high investment returns as financial
resources is a barrier to their operation.
1.6 Thesis layout
Chapter 1: This introductory chapter gives an insight into the background of this study and
explained the general overview of mechanical behavior of reservoir bearing formation and related
stress states that exist beneath the earth crust including their effects on oil and gas production. It
goes forward to highlight the reasons and significance of this study.
Chapter 2: This section is dedicated to related studies and introduces the concept of rock
mechanics, in situ stress state, geology of Niger delta, sand production, fault reactivation leading
to compaction and fracture of reservoirs. This review identifies the missing gap to be investigated
for mitigation strategy for optimization of hydrocarbon.
Chapter 3: This chapter highlights the theories of rock failure, field approach of evaluating
petrophysical and geomechanical parameters of the hydrocarbon reservoir of interest and presents
the data set and materials required for the actualization of the objectives of this research.
Chapter 4: Presents the results of this research findings and discussion of the hydrocarbon potential
including related geomechanical characteristics issues in the field.
Chapter 5: The conclusions of the research studies are presented in this chapter followed by the
remarks and recommendation for further studies.
8
CHAPTER 2
LITERATURE REVIEW
The aim of the present literature review is not to consolidate the entire research, but to pick a
handful of articles that are either closely related to the research or which, if studied might lead to
a conclusion that might help in further justifying the necessity and validity of the research. This
includes literatures concerning geomechanics and petrophysical characterization as appeared in
several publications. This is based on conceptual framework, theoretical framework and empirical
review to identify the gap to be addressed particularly in Wabi field, Niger Delta, Nigeria.
2.1 Rock and rock mechanics
Rock mechanics generally concentrate on the theoretical and applied mechanical behavior of rock;
where rocks responses due to stress field are studied within its surrounding environment for
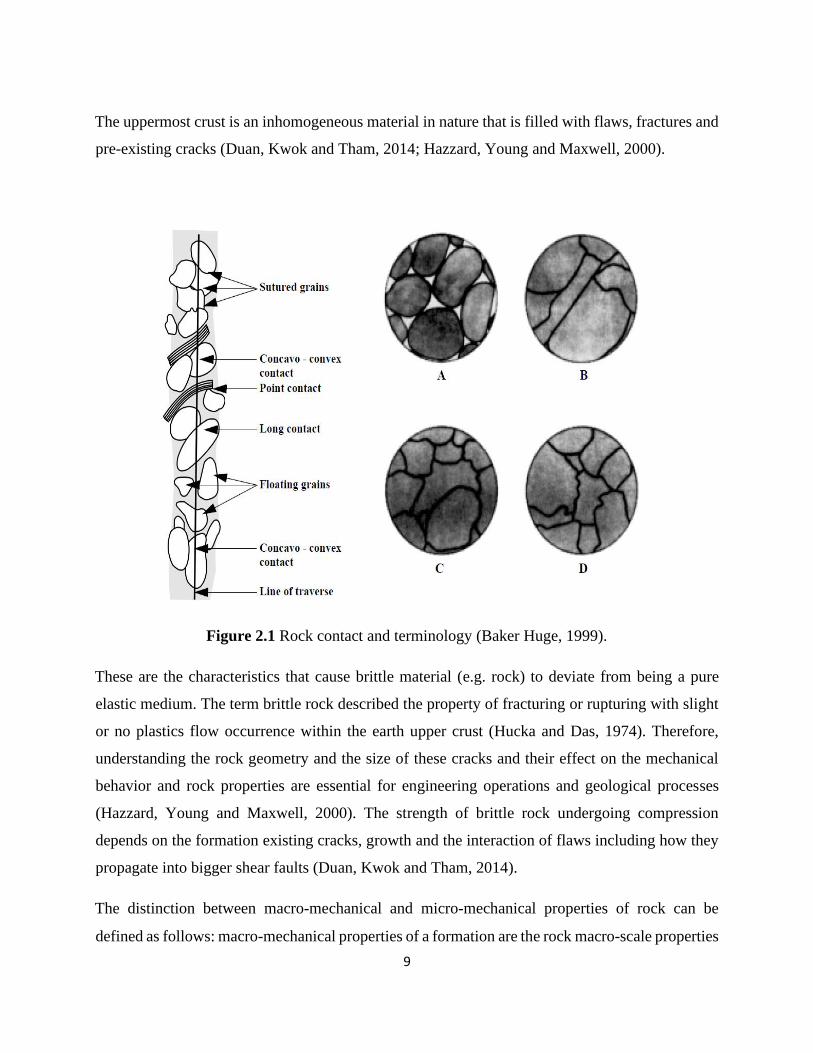
engineering and geological purposes (Sorough, 2013). Rock is a natural substance known not to
be a continuum rather a regulated discontinuum Figure 2.1. They are composed of discontinuity
(separation in the rock continues having effectively zero tensile strength) and intact matrix
(Norouzi, Baghbanan and Khani, 2013). Xie and Gao (2014) stated that the existence of various
defects (i.e. pores, crystal boundaries, fissures, dislocations secondary phases, twin crystallites,
inclusions and precipitate made rock to be complex. These defects caused the discontinuous,
inhomogeneous, nonlinear and anisotropic in mechanical behavior and properties of rocks due to
irregularity of scale and cracks distribution. Therefore, decrease in physical and mechanical
properties occurs (Xie and Gao, 2014). The priority of rock mechanics is to understand the
mechanical behavior and mechanical properties of a given rock about its deformation, strength and
failure when subjected to external force (Xie and Gao, 2014).
The structural and textural characteristics, minerals composition including fracturing, porosity,
mineral strength constituents and degree of cement bond are some of the factors upon which rock
strength determination are based (Sygala, Bukowski and Janoszek, 2014).
9
The uppermost crust is an inhomogeneous material in nature that is filled with flaws, fractures and
pre-existing cracks (Duan, Kwok and Tham, 2014; Hazzard, Young and Maxwell, 2000).
Figure 2.1 Rock contact and terminology (Baker Huge, 1999).
These are the characteristics that cause brittle material (e.g. rock) to deviate from being a pure
elastic medium. The term brittle rock described the property of fracturing or rupturing with slight
or no plastics flow occurrence within the earth upper crust (Hucka and Das, 1974). Therefore,
understanding the rock geometry and the size of these cracks and their effect on the mechanical
behavior and rock properties are essential for engineering operations and geological processes
(Hazzard, Young and Maxwell, 2000). The strength of brittle rock undergoing compression
depends on the formation existing cracks, growth and the interaction of flaws including how they
propagate into bigger shear faults (Duan, Kwok and Tham, 2014).
The distinction between macro-mechanical and micro-mechanical properties of rock can be
defined as follows: macro-mechanical properties of a formation are the rock macro-scale properties

10
such as Young modulus, Poisson’s ratio and peak strength whereas the micromechanical properties
are the rock micro-scale properties such as pores, cracks, fissures and flaws (Jumiski, 1983). The
knowledge of mechanisms of ruptures (fracture) and populates of deformation in micro and macro
mechanical properties of rocks have practical and theoretical significant (Xie and Gao, 1999).
Initiation and propagation of fracture/deformation are caused by micro cracks in the formation;
this can be illustrated by a sample that is loaded to a peak stress, cracks are visible as the sample
attained peak stress and at the edge of the sample a small process zone of crack is form. This is
followed by propagation of macro shear fault in the brecciate zone through the mechanisms of
kinking or buckling (Hazzard, Young and Maxwell, 2000). As rock density increases it cause
dislocations which depend on the increased in applied load resulting in to micro-cracks formation
(Hazzard, Young and Maxwell, 2000). Again, micro-cracks are form during the convergence of
two groups of dislocations, secondary phase particles or crystal boundary resulted to a local zone
that is concentrated with high stress (Xie and Gao, 1999). Pores in both high and weak stressed
region extent and converge respectively to form macro fracture (Xie and Gao, 1999). Cracks in
brittle rocks are known to be predominantly tensile and orientate sub parallel to compressive stress
direction (Duan, Kwok and Tham, 2014).
Initiation in rock failure and deformation was conducted by Nolen-Hoesema who reported that
rock process of propagation of cracks increases with applied force/load in a marble (Xie and Gao,
1999). Wu and Chudnovsky (1993) cited in Xie and Gao (1999) attributed the influence of micro-
cracks distribution on the macro cracks to stress factor in the rock formation.
Petroleum exploration is conducted within the upper crust (brittle material) which ranges from 10
5km, this depth is of a particular interest for petroleum prospecting and other activities such as
storage of waste or carbon sequestrations and earthquakes studies (Allmendinger, 2015). At this
depth, the application of Mohr Coulomb failure criteria can determine rock failure.
2.2 Sand Production Management
Herwanger and Koutsabeloulis (2011) explained that rock failure leads to sand production,
compaction and subsidence in a reservoir. Economides et al. (2013) defined sand production as
the production of solid particles especially, rock grains with oil, gas, and water from the reservoir.
11
The occurrence of this observable fact in an unconsolidated and sometimes from consolidated
formation is unwanted. Gholami et al. (2016) credited sand production failure to shear stress and
fluid flow forces. Over the years, several methods have been established to forecast sand
production and to avoid it by altering drilling or production strategies. This has been a setback
associated with petroleum industry worldwide. This problem is more severe in loose young
sedimentary formations for instant Tertiary Niger Delta.
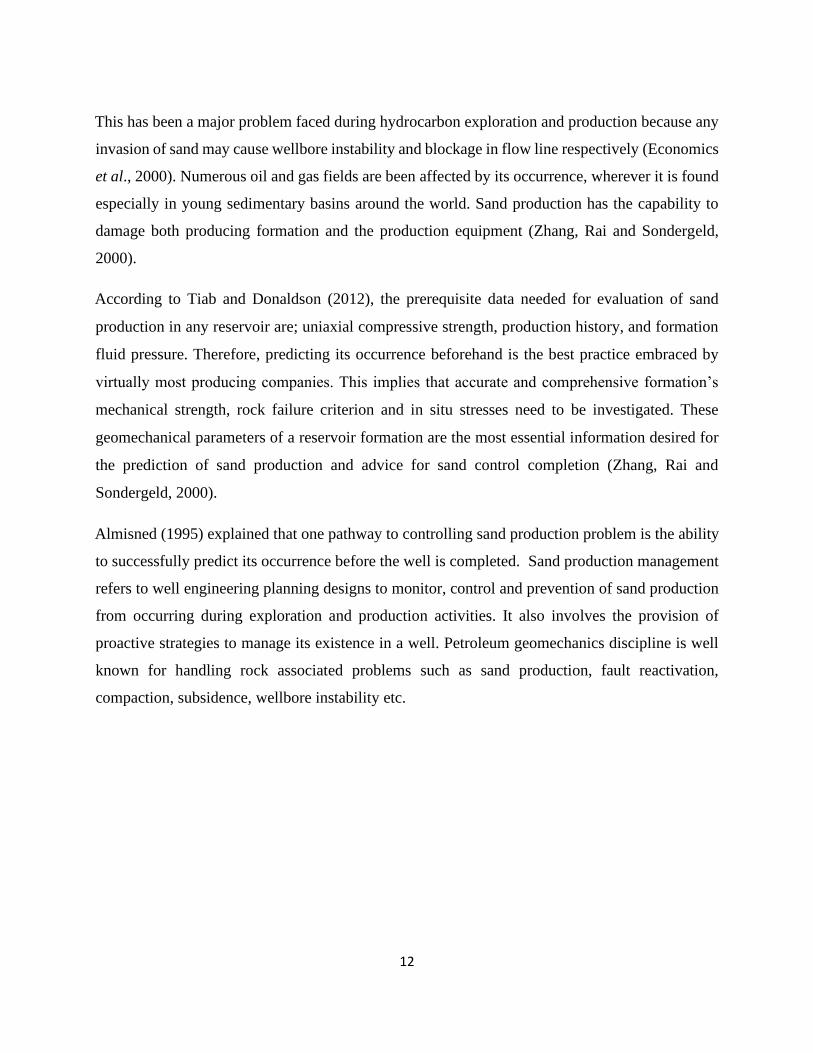
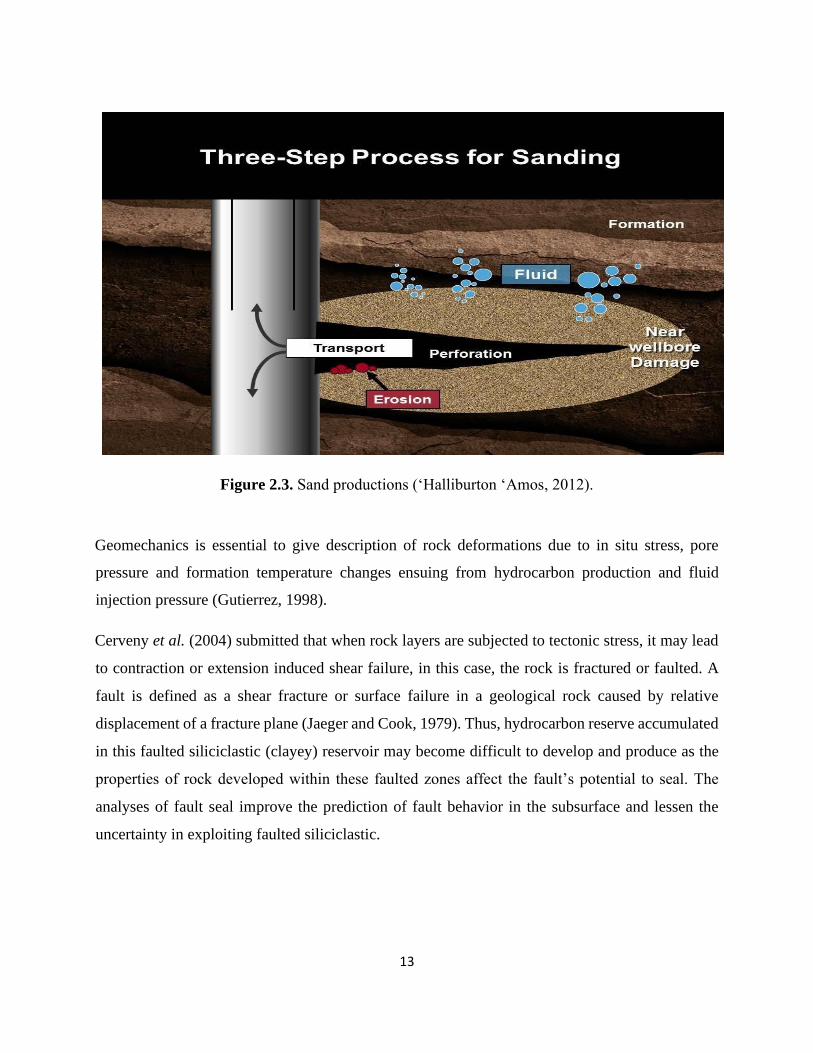
Isehunwa and Farotade (2010), described sand production as a progression that develops in three
scenarios, that is , in the formation, cavity and wellbore Figure 2.3. Balarabe and Isehunwa (2017)
identified the collapse of surrounding rock formations in perforated wells from which liberated
grains are generated due to changes in stress, sand grains dislodgment from failed rocks and fluid
flow transportation of these grains into the well bore and up to the surface facility, as notable causes
of sanding occurrence. Hence, sand production is the production of rock particles along with oil,
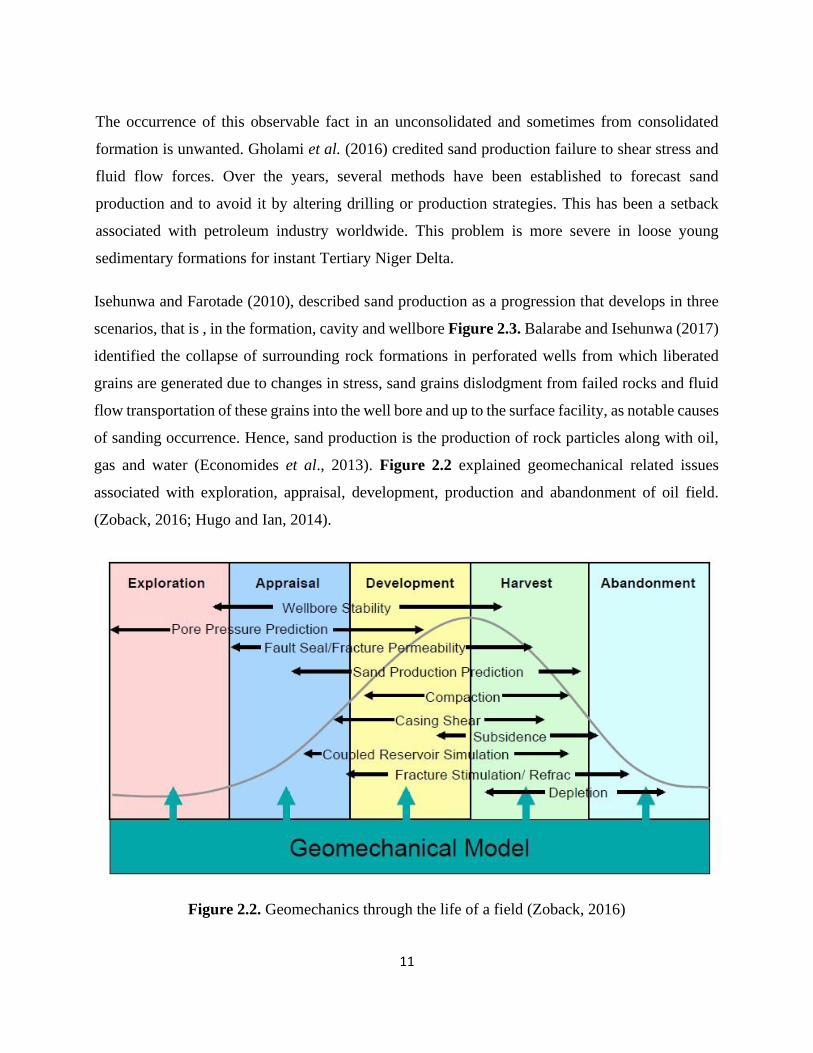
gas and water (Economides et al., 2013). Figure 2.2 explained geomechanical related issues
associated with exploration, appraisal, development, production and abandonment of oil field.
(Zoback, 2016; Hugo and Ian, 2014).
Figure 2.2. Geomechanics through the life of a field (Zoback, 2016)
12
This has been a major problem faced during hydrocarbon exploration and production because any
invasion of sand may cause wellbore instability and blockage in flow line respectively (Economics
et al., 2000). Numerous oil and gas fields are been affected by its occurrence, wherever it is found
especially in young sedimentary basins around the world. Sand production has the capability to
damage both producing formation and the production equipment (Zhang, Rai and Sondergeld,
2000).
According to Tiab and Donaldson (2012), the prerequisite data needed for evaluation of sand
production in any reservoir are; uniaxial compressive strength, production history, and formation
fluid pressure. Therefore, predicting its occurrence beforehand is the best practice embraced by
virtually most producing companies. This implies that accurate and comprehensive formation’s
mechanical strength, rock failure criterion and in situ stresses need to be investigated. These
geomechanical parameters of a reservoir formation are the most essential information desired for
the prediction of sand production and advice for sand control completion (Zhang, Rai and
Sondergeld, 2000).
Almisned (1995) explained that one pathway to controlling sand production problem is the ability
to successfully predict its occurrence before the well is completed. Sand production management
refers to well engineering planning designs to monitor, control and prevention of sand production
from occurring during exploration and production activities. It also involves the provision of
proactive strategies to manage its existence in a well. Petroleum geomechanics discipline is well
known for handling rock associated problems such as sand production, fault reactivation,
compaction, subsidence, wellbore instability etc.
13
Figure 2.3. Sand productions (‘Halliburton ‘Amos, 2012).
Geomechanics is essential to give description of rock deformations due to in situ stress, pore
pressure and formation temperature changes ensuing from hydrocarbon production and fluid
injection pressure (Gutierrez, 1998).
Cerveny et al. (2004) submitted that when rock layers are subjected to tectonic stress, it may lead
to contraction or extension induced shear failure, in this case, the rock is fractured or faulted. A
fault is defined as a shear fracture or surface failure in a geological rock caused by relative
displacement of a fracture plane (Jaeger and Cook, 1979). Thus, hydrocarbon reserve accumulated
in this faulted siliciclastic (clayey) reservoir may become difficult to develop and produce as the
properties of rock developed within these faulted zones affect the fault’s potential to seal. The
analyses of fault seal improve the prediction of fault behavior in the subsurface and lessen the
uncertainty in exploiting faulted siliciclastic.
14
2.2.1 Fault and fracture of rocks
In their well-articulated work, Sorkhabi and Tsuji (2005) posited that the current approaches used
for fault seal analysis mostly proffer solution to normal fault in classic reservoirs where the
integration of fault seal and in situ stress analyses had been proven as an innovative technology
breakthrough in the petroleum industry. Thus, fault investigation becomes necessary as petroleum
traps have developed along two separate and successive lines of deliberation such as fault rock seal
and fault closures. This approach is basically concerned with structural geology development
applications, utilizing quantitative fault analysis methods for kinematic and geometric
investigation of sedimentary basins, which concluded that plate tectonics presented an integrated
tool to show a relationship between faults and basins been dependent on the far field (i.e. plate
boundary produce stress) (Sorkhabi and Tsuji, 2005).
The importance of the geometric diagnoses is obvious from identification of various sealing
processes in fault zones, architectures and quantitative appraisal of petrophysical properties.
Generally, faulted rock has been being detrimental for exploration of fault traps because of their
high-capillarity and low permeability features in sedimentary basins. However, recent studies
conducted have changed the previous polarized observation of faults as either seals or leaks into
rationale of more complex fault fluid flow behavior (Sorkabi and Tsuji, 2005).
Ferrill et al. (1999) suggested an algorithm known as Slip tendency ( ) and dilation tendency ( )
to evaluate the relative strength or weakness of fault seal under in-situ stress conditions. They
described slip tendency as a shear failure, defined as the ratio of shear stress to normal stress. It is
expressed mathematically as:
(2.1)
Similarly, Dilation tendency (i.e. failure by extension fracturing) is given by:
(2.2)
where, is the slip tendency, is the dilation tendency, is shear stress, is normal stress,
and is the overburden or vertical stress, is the intermediate stress and is the minimum
15
horizontal stress acting on the fault surface. The values of and can be calculated from
equation as follows:
(2.3)
(2.4)
where, , is the vertical stress; is the horizontal stress and is the angle between and the
fault or fracture plane.
From stress regimes description of faults, in normal faults, vertical stress or the maximum
principal stress ( ) exerted overlying weight/ overburden thickness and the horizontal stress ( )
was considered as the minimum principal stress ( ) (Kachi et al., 2005) which could be calculated
as follows;
(2.5)
where is the coefficient of earth pressure at depth and it is a calibration factor
Sims et al. (2005) explained the extensional fault system development and reservoir connectivity
and concluded that it depends on whether fault transverse reservoir acts as conduits for flow in
fracture carbonate reservoirs or as barrier to flow (in highly porous sandstone reservoir). They
inferred from their study that fault system evolution or growth has effects on the extent to which
rock coupled between and around faults and fault network connectivity. As fault system advances,
rock mass connection decreases and network connectivity increase concurrently (Sims et al.,
2005).
Yamada et al. (2005) postulated that regional scale stress has a major impact on fault expansion
during the formation of geological structures. Also, faults created after stress conversion is affected
by pre-existing faults; therefore, the consequential geometry of the faults is determined by the
order of the stresses.
Normal faulting field analysis demonstrated that synthetic layer dip related to normal faults is a
familiar feature of extensional fault systems, developed where layers up thrown and down thrown
16
in the opposite direction (antithetic) or both sides of a normal fault dip toward the down thrown
side of the fault (Ferrill et al., 2005).
Aydin (1978) defined deformation bands in sedimentary rocks as thin (millimeter-wide) planar
structures in faulted sandstones from study conducted in Utah. Deformation band transpire as
single planar structures in host formation (e.g. sandstone) away from weak zones (Sorkhabi and
Haasegawa, 2005). In the perspective of Sorkhabi and Hasegawa (2005), deformation bands
increase noticeably in bulk and connectivity toward the fault plane, signifying that faulting
develops from entity bands to a high- deformational zone described as anastomosing cataclastic
slip bands (Fowles and Burley, 1994) and culminating/assembles in the slip fault plane. Thus,
reactivation of bedding perpendicular due to shear faults caused major normal faults development.
Davatzes and Aydin (2005) interned from their examination of the distribution of fault rock and
rupture structures in shaly-sand formation that rupture zones are found along strike and dip.
Consequently, these are caused by variations in the fault geometry, lithology, fault slip and fault
mechanism.
2.3 Review of the Niger Delta geology
2.3.1 Tectonic setting of the Niger Delta
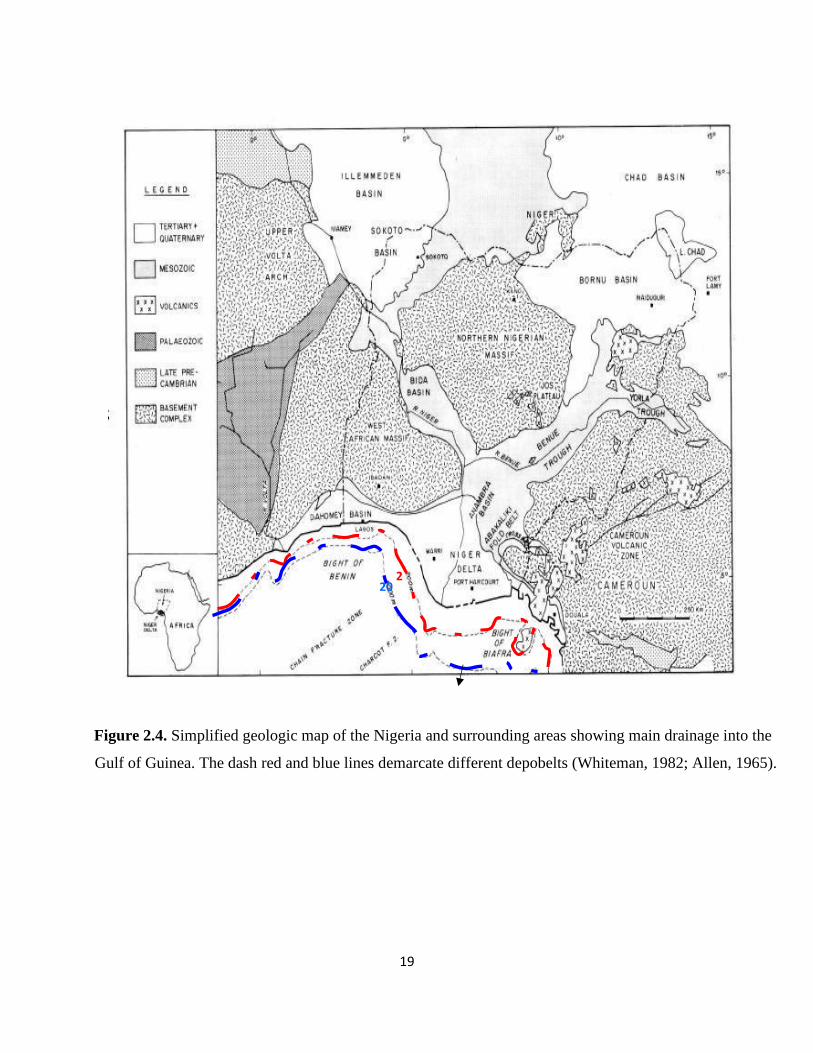
The drifting apart of the continental crust of Africa and South America plates during the late
Jurassic rift (Doust and Daukoru, 1990; Etu-Efeotor, 1997) marked the origin of tectonic setting
in the Niger Delta and the entire Gulf coast of Guinea Figure 2.4. According to Tuttle, Brownfield
and Charpentier (1999) the tectonic framework of the plate margin beside the coast of West Africa
shield was controlled by mid-oceanic ridges and Cretaceous fracture zones articulated as trenches
in the deep Atlantic, which subdivides the plate boundary into entity basins. These amount to the
formation of triple junction or the rift-ridge system (i.e. RRR) during the Cretaceous era which
arms are known as; the Atlantic arm, Gulf of Guinea transforms complex and the Abakaliki-Benue
trough (Tuttle, Brownfield and Charpentier, 1999; Schlumberger, 1985). Two arms of this triple
junction followed the Southeastern and southwestern coasts of Cameroun and Nigeria and
developed into collapsed continental margins (Doust and Omatsola, 1990), while the third arm,
failed and developed into the Abakaliki–Benue trough (Doust and Omatsola, 1990; Weber and
17
Daukoru, 1975) known to be the oldest sedimentary basin. Along the Nigerian coast, the Benue-
Abakaliki trough is seen up to West African shield (Tuttle, Brownfield and Charpentier, 1999).
These three arms (RRR) known as the triple junction rift-ridge system opened at different rates
and different times initiated the continental drift that separated Africa from South America (Weber
and Daukoru, 1975; Doust and Omatsola, 1990). This rifting ceased totally in the late Cretaceous
and gravity tectonism became the main deformation process in the Niger Delta complex (Tuttle,
Brownfield and Charpentier, 1999). After the separation between Africa and the South Atlantic,
the Gulf of Guinea was created now occupied by Niger delta basin.
In the mid Cretaceous (Albian) time, marine deposits or incursion took place in Anambra–Benue
trough known as the fail arm of the triple junction ( Doust and Omatsola, 1990; Short and Stauble,
1967) and this was recognized as the first sedimentary deposits in the Niger delta basin which end
in the Santonian time known as Akata Formation. Subsequently, paralic clastics deposits sequences
were deposited on top the older under compacted marine shale (clay) as the growth of the proto
Niger delta in the late Cretaceous which ended during the transgression of Paleocene marine known
as Agbada Formation. During the Eocene to recent the final phase of the depositional sequence
was deposited which ended the deposit and manifested the present-day Niger delta progradation
(Short and Stauble, 1967; Doust and Omatsola, 1990). The third phase was deposited, after the
occurrence of gravity tectonism has ceased. The successions of the marine and paralic clastics
thickness deposits were deposited in series of regressive and transgressive phases (Doust and
Omatsola, 1990).
The actual development of the present day Niger Delta commenced in late Paleocene/Eocene, as
sediments built out afar the Benue-Abakaliki trough southward against the crust of the Atlantic
Ocean, where it assume the current convex to sea morphology (Doust and Omatsola, 1990).This
growth has been dependent between the rate of sedimentation and subsidence balance, caused by
tectonics of the basement and structural configuration Figure 2.5. In general, the regressive classic
sequence has the maximum thickness of about 30,000 to 40,000ft or 9,000 to 12,000 m (Evamy et
al., 1978).
18
Weber and Daukoru (1989) asserted that the Niger Delta expansion is affected by basement
faulting which in turn influences the thickening of the sediment distribution. The majorities of
these faults affect different parts of the Agbada formation and flatten/even out into detachment
plane adjacent to overpressure Akata Formation (Doust and Omatsola, 1990; Weber and Daukoru,
1975). However, the associated faults in the basin act as stratigraphic traps to accumulate
hydrocarbons and serve as hydrocarbon migration paths from Akata over pressured formation to
Agbada sand (Weber and Daukoru, 1975). These associated growth faults are roll over anticline,
close space flank faults, collapse growth fault crest, shale diapirs, back to back features and diapirs
and abruptly (Evamy et al., 1978). Growth faults of the Niger delta signifies that their formation
is active and allows faster sedimentation in normal faulting that is, in down thrown relative to
reverse or upthrown (Weber and Daukoru, 1975, Weber, 1971).
19
Figure 2.4. Simplified geologic map of the Nigeria and surrounding areas showing main drainage into the
Gulf of Guinea. The dash red and blue lines demarcate different depobelts (Whiteman, 1982; Allen, 1965).
2 20
20
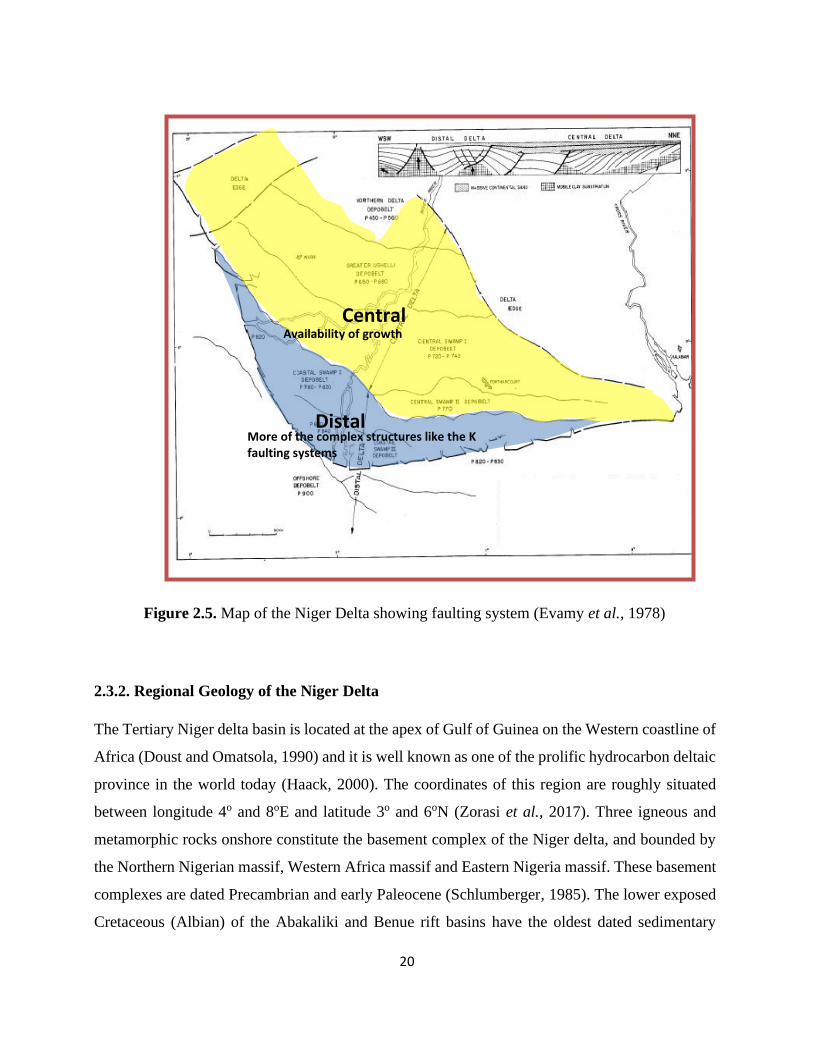
Figure 2.5. Map of the Niger Delta showing faulting system (Evamy et al., 1978)
2.3.2. Regional Geology of the Niger Delta
The Tertiary Niger delta basin is located at the apex of Gulf of Guinea on the Western coastline of
Africa (Doust and Omatsola, 1990) and it is well known as one of the prolific hydrocarbon deltaic
province in the world today (Haack, 2000). The coordinates of this region are roughly situated
between longitude 4o and 8oE and latitude 3o and 6oN (Zorasi et al., 2017). Three igneous and
metamorphic rocks onshore constitute the basement complex of the Niger delta, and bounded by
the Northern Nigerian massif, Western Africa massif and Eastern Nigeria massif. These basement
complexes are dated Precambrian and early Paleocene (Schlumberger, 1985). The lower exposed
Cretaceous (Albian) of the Abakaliki and Benue rift basins have the oldest dated sedimentary
Central
Distal
Availability of growth
More of the complex structures like the K faulting systems
21
rocks. Similarly, older sediments sequence may also exist in the offshore Miogeoclinal basins
underneath the Niger Delta complex formed on the sea floor during the first opening of the Gulf
of Guinea and resulted to the drifting apart of the continent (Schlumberger, 1985).
The Niger Delta complex today, covers an area of about 100,000 sq.km, of which less than 20%
is considered as prospective. 100% of the Nigerian hydrocarbon production is from this great
petroliferous Delta complex. Niger Delta basin is located in the southern part of the country and
the host of the vast known petroleum (hydrocarbon) potential of the country. These oil and gas
reserves are found precisely underneath the onshore (inland) and shallow to deep water of the
Niger Delta province especially, in the Agbada Formation (Short and Stauble, 1967; Weber and
Daukoru, 1990). Three Formations are known in the Niger Delta. These are Akata, Agbada and
Benin. Akata Formation is known as the source rock, Agbada Formation is a paralic clastics
sequence, which consists of sand, siltstone; interbedded high energy deltaic sandstones with
intercalation of shales generated in several offlap cycles (Short and Stauble, 1967). These features
made the Agbada formation the objective target of most exploration activities in the region due to
its reservoir quality with the beneath marine shales serving as the source rock /petroleum system
(Tuttle et al.,1999). The Benin Formation is known as sandy and potable water formation.
The vast quantities of sediments supplied to the Niger Delta complex were partly generated and
eroded from the hinterland and especially from the thermal uplift blocks in Cameroun Mountain
(Schlumberger, 1985) and by eustatic changes in sea level. Most of the Oil and Gas produced from
the Niger Delta are in the Agbada sand reservoirs where the hydrocarbons are trapped in mostly
rollover anticlines and other associated structures (Schlumberger, 1985). There are huge
undiscovering that may exist in both the onshore and offshore Niger Delta.
The commonly fault found in the Niger Delta is the synsedimentary fault or growth fault. They are
initiated around local depocentres at the time of formation and grow faster during sedimentation.
Growth fault offsets active surface of sedimentary deposition and flattening with depth are
common (Weber and Daukoru, 1985).
22
2.3.3. Stratigraphy of the Niger Delta
In the Niger delta three lithofacies have been identified by the oil and gas industry as Akata,
Agbada and Benin Formations. These three depositional sequence are laid down from the
subsurface basement complex to surface outcrop (Short and Stauble 1967; Avbovbo, 1978).The
order of their deposition in an upward direction signifies the age of each formation from oldest to
the youngest (i.e marine shale, transitional and continental environments).
1) Akata Formation
This formation age ranges from Eocene to recent. It is a basal unit of the Cenozoic Niger delta
basin, composed of mainly marine shales deposited in the advanced delta into deep water or
offshore (Weber and Daukoru, 1985).It is an under compacted clay with locally sandy, silty beds
with some plant remains at the top, deposited as turbidities and continental slope channel fills
(Schlumberger, 1985). Between the adjacent Agbada and top of Akata formations sandstone lenses
occur, this development makes prospecting for oil and gas at the top of Akata formation viable due
to the presence of planktonic foraminifera content that may account for over 50% of the rich micro
fauna and the benthonic assemblages indicating that its deposition is on the shallow marine shelf
environment and slope (Short and Stauble 1967; Avbovbo, 1978).Hence, it is referred to as the
main source rock for the Niger delta complex. This formation thickness depends on the shale
diapirism and or it subjection to permeability (flowage). Weber and Daukoru (1985) estimated its
thickness to range from 600 to over 6000m.
2) Agbada Formation
The overlying paralic sequence, on top of the under compacted clays constitute the Agbada
formation. It consists of alterations of sandstones, sands, shales and siltstones. The sandy upper
unit of this formation is the hydrocarbon reservoir, while at the base significant sandstones’ unit
is evidence which are very coarse to fine in grain size with intercalation of shales (Schlumberger,
1985; Weber and Daukoru, 1985; Short and Stauble, 1967). It is slightly consolidated and have
calcareous matrix (cementation), bulk of this formation is unconsolidated. This unconsolidated
nature of the Agbada formation is what affect and caused most of the completion and production
issues (geomechanical problems) seen in the Niger Delta till date (Schlumberger,1985). The
sandstone are poorly sorted with variation in grain sizes ranging from fine to coarse. Shale content
23
increases downward as the formation passes or grades into Akata Shales. Lignite streaks, limonite,
shell fragments and glauconites are present. The formation is built up of various offlap rhythms
that cut across the entire subsurface of the Niger delta basin (Doust and Omatsola, 1990). The age
is from Eocene to Oligocene. Weber and Daukoru (1985) estimated its thickness to range from
300 to about 4500m.
3) Benin Formation
Among the three sedimentary deposits, Benin formation is the youngest and the uppermost unit of
the Tertiary Niger delta basin. It is composed of gravels and nonmarine sand deposited in an
alluvial or fluviatile environment (Weber and Daukoru, 1985; Doust and Omatsola, 1990). The
formation is known for its high percentage of sand as it cut across the entire Niger delta. It has few
minor streaks and lacks the presence of marine fauna and blackish water (Schlumberger, 1985).
The sandstones and sands are coarse to fine, poorly sorted, sub-angular to well-rounded and has
granular texture. Lignite streaks occurs and feldspars and Hematite are common (Schlumberger,
1985). Its shale content consists of sandy to silty and has plant remains. Structural features
associated with this formation are; Oxbow fills, channel fills, point bars and natural leaves back
swamp. Its age is from Miocene to recent. According to Weber and Daukoru (1990), the thickness
of this formation especially within the central Niger delta is 2100m.Till date only little oil and gas
has been found in the Benin formation. Hence, it is known for its potable water bearing (Short and
Stauble, 1967).
24
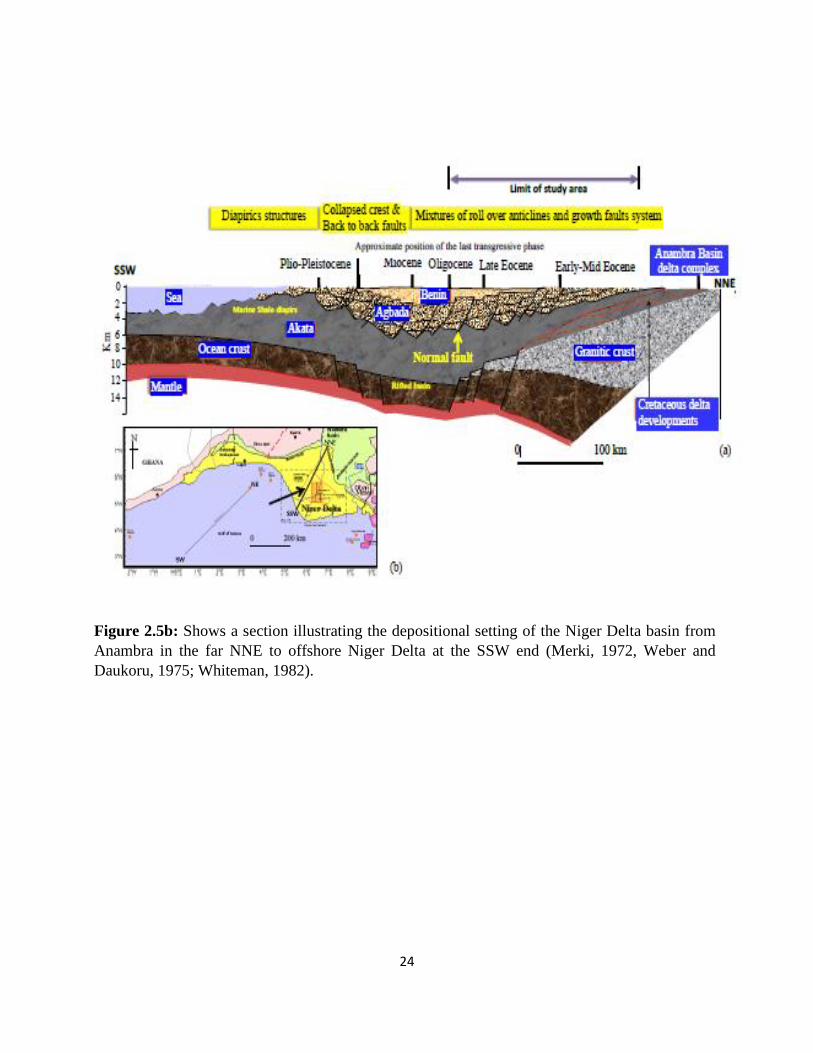
Figure 2.5b: Shows a section illustrating the depositional setting of the Niger Delta basin from
Anambra in the far NNE to offshore Niger Delta at the SSW end (Merki, 1972, Weber and
Daukoru, 1975; Whiteman, 1982).
25
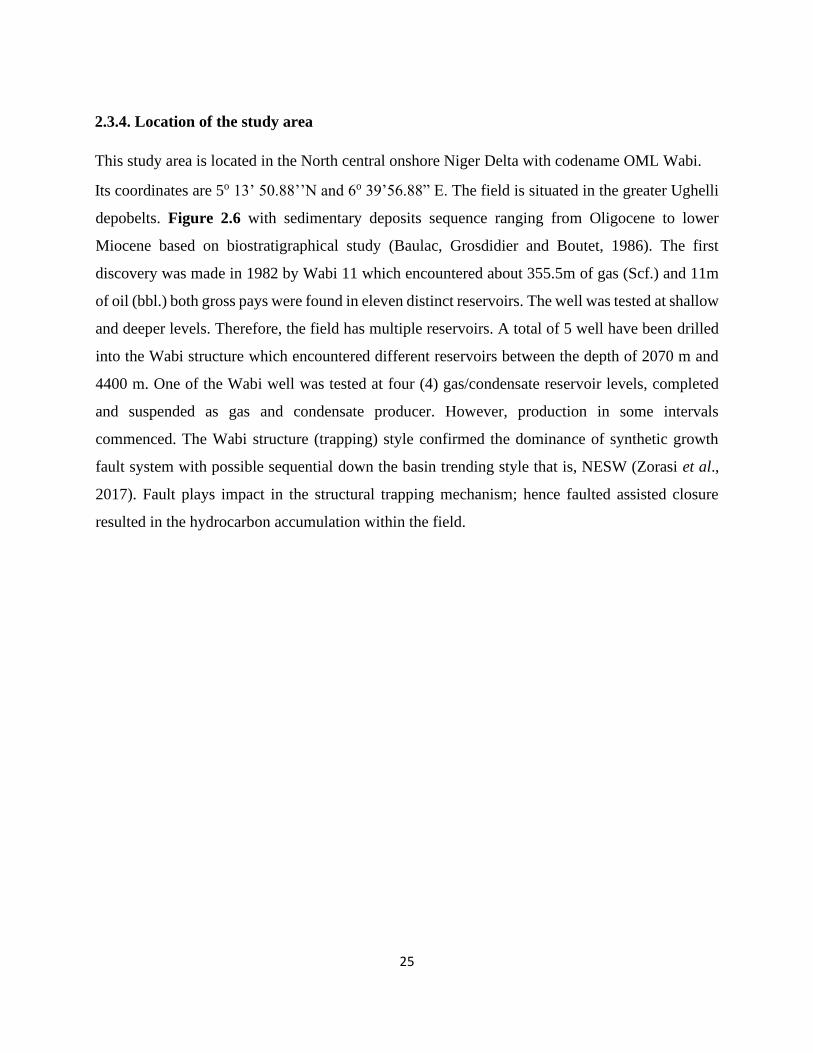
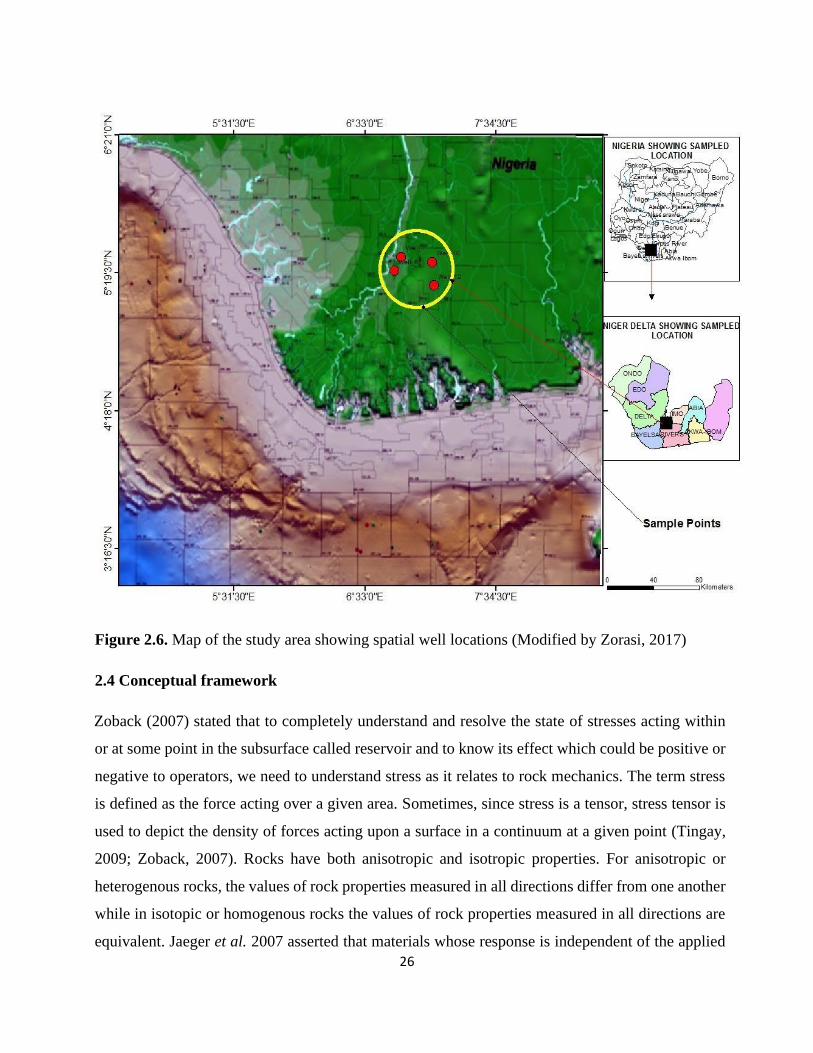
2.3.4. Location of the study area
This study area is located in the North central onshore Niger Delta with codename OML Wabi.
Its coordinates are 5o 13’ 50.88’’N and 6o 39’56.88” E. The field is situated in the greater Ughelli
depobelts. Figure 2.6 with sedimentary deposits sequence ranging from Oligocene to lower
Miocene based on biostratigraphical study (Baulac, Grosdidier and Boutet, 1986). The first
discovery was made in 1982 by Wabi 11 which encountered about 355.5m of gas (Scf.) and 11m
of oil (bbl.) both gross pays were found in eleven distinct reservoirs. The well was tested at shallow
and deeper levels. Therefore, the field has multiple reservoirs. A total of 5 well have been drilled
into the Wabi structure which encountered different reservoirs between the depth of 2070 m and
4400 m. One of the Wabi well was tested at four (4) gas/condensate reservoir levels, completed
and suspended as gas and condensate producer. However, production in some intervals
commenced. The Wabi structure (trapping) style confirmed the dominance of synthetic growth
fault system with possible sequential down the basin trending style that is, NESW (Zorasi et al.,
2017). Fault plays impact in the structural trapping mechanism; hence faulted assisted closure
resulted in the hydrocarbon accumulation within the field.
26
Figure 2.6. Map of the study area showing spatial well locations (Modified by Zorasi, 2017)
2.4 Conceptual framework
Zoback (2007) stated that to completely understand and resolve the state of stresses acting within
or at some point in the subsurface called reservoir and to know its effect which could be positive or
negative to operators, we need to understand stress as it relates to rock mechanics. The term stress
is defined as the force acting over a given area. Sometimes, since stress is a tensor, stress tensor is
used to depict the density of forces acting upon a surface in a continuum at a given point (Tingay,
2009; Zoback, 2007). Rocks have both anisotropic and isotropic properties. For anisotropic or
heterogenous rocks, the values of rock properties measured in all directions differ from one another
while in isotopic or homogenous rocks the values of rock properties measured in all directions are
equivalent. Jaeger et al. 2007 asserted that materials whose response is independent of the applied
27
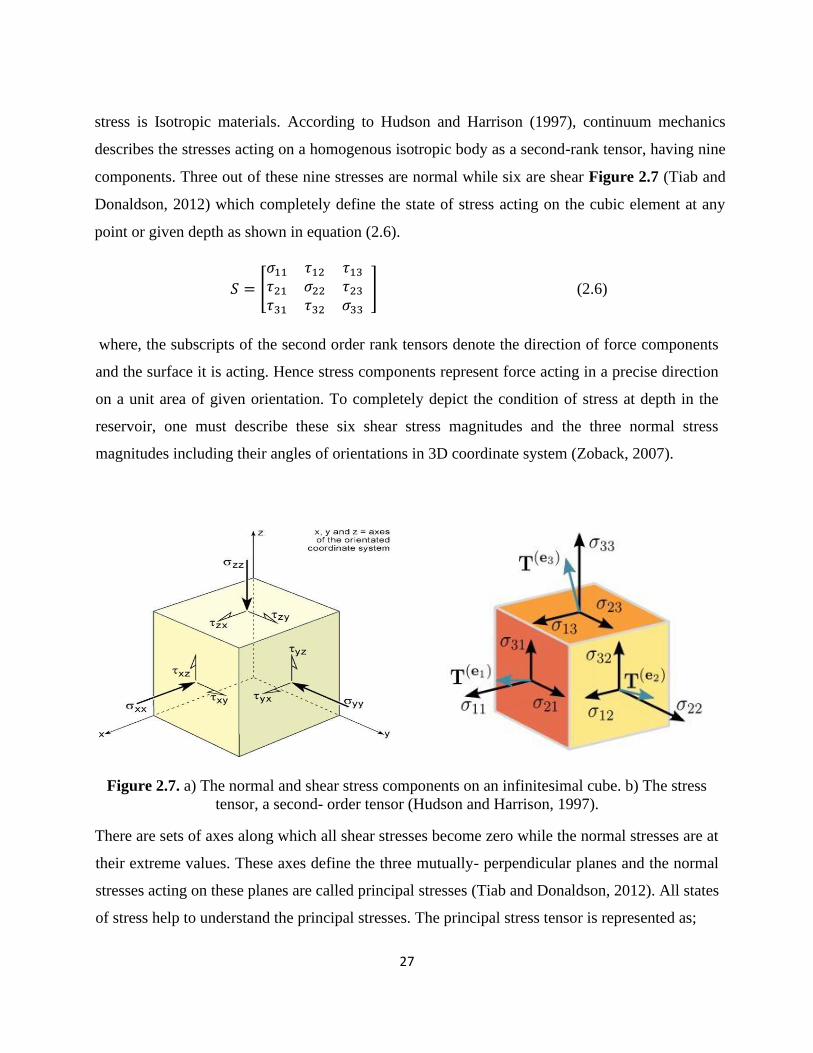
stress is Isotropic materials. According to Hudson and Harrison (1997), continuum mechanics
describes the stresses acting on a homogenous isotropic body as a second-rank tensor, having nine
components. Three out of these nine stresses are normal while six are shear Figure 2.7 (Tiab and
Donaldson, 2012) which completely define the state of stress acting on the cubic element at any
point or given depth as shown in equation (2.6).
𝑆 = [
𝜎11 𝜏12 𝜏13
𝜏21 𝜎22 𝜏23
𝜏31 𝜏32 𝜎33
] (2.6)
where, the subscripts of the second order rank tensors denote the direction of force components
and the surface it is acting. Hence stress components represent force acting in a precise direction
on a unit area of given orientation. To completely depict the condition of stress at depth in the
reservoir, one must describe these six shear stress magnitudes and the three normal stress
magnitudes including their angles of orientations in 3D coordinate system (Zoback, 2007).
Figure 2.7. a) The normal and shear stress components on an infinitesimal cube. b) The stress
tensor, a second- order tensor (Hudson and Harrison, 1997).
There are sets of axes along which all shear stresses become zero while the normal stresses are at
their extreme values. These axes define the three mutually- perpendicular planes and the normal
stresses acting on these planes are called principal stresses (Tiab and Donaldson, 2012). All states
of stress help to understand the principal stresses. The principal stress tensor is represented as;
28
𝑆 = [𝜎1 0 00 𝜎2 00 0 𝜎3
] (2.7)
where 𝜎1 is the overburden, 𝜎2 is the intermediate horizontal and 𝜎3 is the minimum horizontal
stress.
Sorough (2013) explicitly explained that geomechanics engineers utilize theoretical and applied
science for the evaluation of mechanical behavior of subsurface rocks within the force fields of
their physical environment. In other words, it is the application of engineering principles to
mechanics of rock design and construction of any kind either on or in the rock. The concept of
geomechanics was originally developed to enhance mining activities as well as to aid in civil
engineering design purposes. However, because of its efficacy it was implemented into the oil and
gas industry over three decades ago for improvement of drilling, fault reactivation, stress evolution
and hydraulic fracturing. Geomechanical characterization is executed both for well scale analysis
for wellbore stability, sand production, hydraulic and field scale such as fault reactivation,
subsidence or heave, cap rock integrity, and effect of reservoir flow or match (Schlumberger, 2017)
The main rationale behind the practice of geomechanical analysis is to calculate approximately the
rock properties and stresses acting on a wellbore.
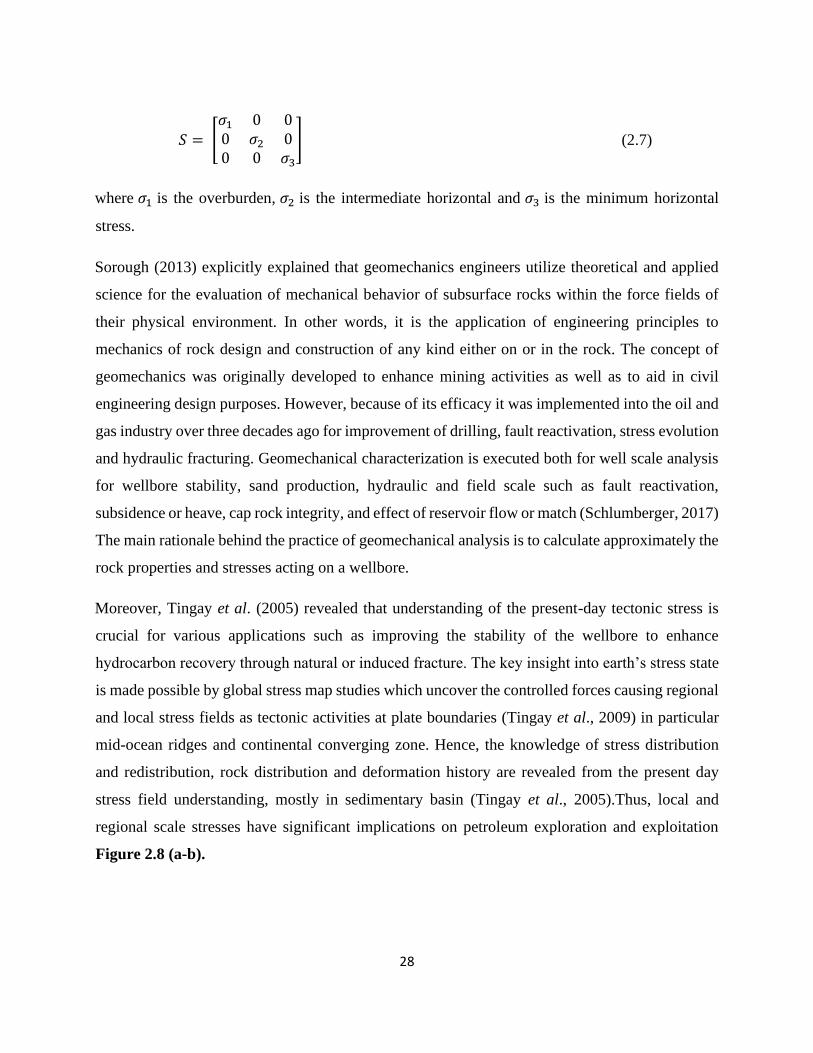
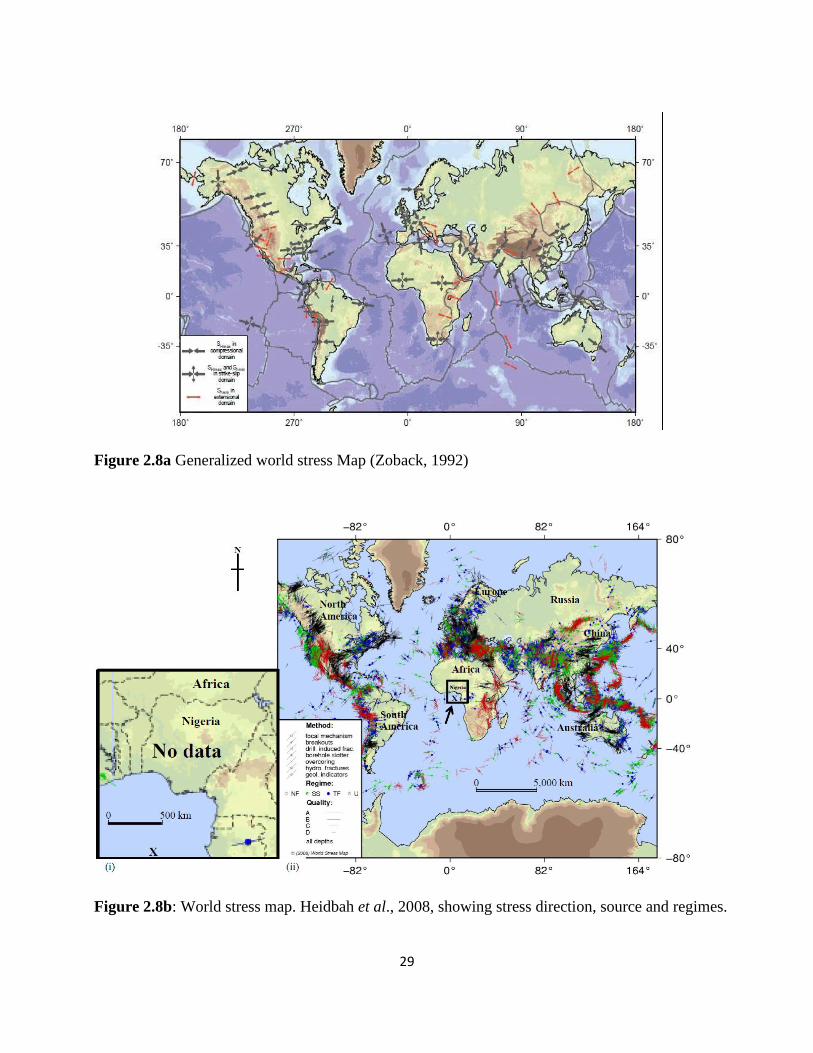
Moreover, Tingay et al. (2005) revealed that understanding of the present-day tectonic stress is
crucial for various applications such as improving the stability of the wellbore to enhance
hydrocarbon recovery through natural or induced fracture. The key insight into earth’s stress state
is made possible by global stress map studies which uncover the controlled forces causing regional
and local stress fields as tectonic activities at plate boundaries (Tingay et al., 2009) in particular
mid-ocean ridges and continental converging zone. Hence, the knowledge of stress distribution
and redistribution, rock distribution and deformation history are revealed from the present day
stress field understanding, mostly in sedimentary basin (Tingay et al., 2005).Thus, local and
regional scale stresses have significant implications on petroleum exploration and exploitation
Figure 2.8 (a-b).
29
Figure 2.8a Generalized world stress Map (Zoback, 1992)
Figure 2.8b: World stress map. Heidbah et al., 2008, showing stress direction, source and regimes.
30
2.4.1 Stress field pattern of the Niger Delta
The concept of subsurface stress in the lithosphere has been reviewed and documented by (Zoback,
1989; Tingay et al., 2005; Bell, 1996; Magnenet, Cornet and Fond, 2007). In the Niger delta, the
issue of in situ stress is considered mostly as overpressure development which is very common in
the west and central Niger delta fields due to numerous extensive growth faults and associated roll
over anticline that concentrate in the Agbada formation (Ojo et al., 2017) which varies with depths.
Far field stress or basement stress, regional and local stress are what contributes to stress pattern
of any region globally (Tingay, 2009; Zoback, 2007). In other words, the summation of these
stresses provides an insight into the Niger delta stress field pattern. The understanding of the state
of stress beneath the earth’s crust can be made available through the world stress map (WSM)
(Tingay, 2009) Figure 2.9. This is a map showing the relative magnitudes of horizontal principal
stress and their orientations (Zoback, 2002). Tingay (2009) inferred from this map that forces
exerted at mid-oceanic ridges, subduction zones and continental collision zones are the causes
responsible for plate-scale stress and the reason for the sub parallel motion in regional stress
orientation. Rifting and gravity tectonism played major roles for the formation of secondary
structures in the Niger delta, that is, structures that are related to the tectonic rock’s deposition and
regional stress field (Verner, 2007).
Knowledge of this present day (in-situ stress) state facilitates good understanding of deep-seated
geological processes that occur in the earth’s interior and it is vital for mining activities,
understanding basin evolution due to plate tectonic motion, investigation of rock distribution and
deformation history and petroleum exploration and exploitation (Tingay, 2009; Zoback, 2007;
Rajabi, Tingay and Heidbach, 2016).
i. Attached regimes
In sedimentary basins the first deposits of young sedimentary Cretaceous rocks that overlain the
basement complex mechanically and has low strength rocks intervals (e.g. evaporates, over
pressured shale or mechanically weak spot) that can interfere and disrupt the original laid down
sediment to cause mechanical detachment in the basin is referred to as Attached regimes (Bell,
1996; Tingay, 2009). This regime has primary structure associated with the origin of rocks
31
deposition. The stress field, magnitudes and orientations in this region are influence by far field
stresses (plate scale forces and intra-basins forces) acting from afar or within the basement complex
(Tingay, 2009). The stress pattern displays in this attached region depict the underlying rock
pattern and show regional consistency in their orientations (Bell, 1996; Tingay, 2009) which are
predictable in the whole basin.
Based on global comparison and correlation made, Bell (1996) and Zoback (2007) further state
and confirm that attached stress regimes demonstrates uniformity in directional homogeneity of
stress orientations with other similar studies conducted elsewhere in the world.
ii. Detached regimes
This is the mechanical separation of the basal unit from the overlying sedimentary sequence.
Overpressure shale of the Niger delta basin forms a detachment folds, detachment zone for normal
fault and thrust structures in a linked extensional contractional systems (Wiener et al., 2010). Doust
and Omatsola (1990) Asserted that basin deposited with intervals of low strength rocks such as
evaporites, over pressured, halite and ductile marine shales with slope instability are weak
geomechanical zones which would trigger development of growth faults structures known as
detached fault (Bell, 996; Tingay, 2009). Detachment fault is a low angle normal fault along which
a basal strata shears at an inclined surface (Howard and John, 1987).
By deep mechanical detachment, far field stresses (acting in the basement) are partially and/or
completely removed from the paralic clastic sequence overlying on the basal unit (Tingay, 2009).
The stress patterns of this region are complicated or random because of the dominance of local
(intra-basin) sources of stress mentioned above and exhibit vastly different and compound stress
orientations. In other words, stresses in detached regimes are basically controlled by small or local
sources of stress (Bell, 1996: Tingay, 2009). However, Bell and Babcock (1986) revealed that there
is less orientation consistency found in other part of the world sediments.
Consequently, there exist some variations in horizontal stresses which depend on the sedimentary
basin of interest. Similarly, Becker et al. (1987) maintained that stress orientations can differ
between thrust plates due to multi-level detachment, forming the surfaces of detachment. The most
spectacular of detachment case is the appealing to conclude that stress regime which reflect

32
basement stresses of Mesozoic and Cenozoic sequences is attached base on the coincident of
regional stress direction of the Scotian shelf and North American plate (Zoback and Zoback, 1991;
Yassir and Bell, 1994).
Stress orientation in attached regime
Stress orientation in detached regime
Figure 2.9. Schematic diagram of Attached and detached Stress regime (Bell, 1996; Tingay, 2009).
iii. Anderson classification scheme
Besides, Anderson (1951) and Cerveny et al. (2004) unanimously agreed that three stress regimes
are identifiable if rock fails in shear. These stress regimes are associated with the three
classifications of fault regimes by Anderson hypothesis of faulting is extensively used as a basis
to describe the basics of fault failure and orientation. Stress state is defined by three principal
stresses which are mutually perpendicular to each other (Twiss and Moores, 1992). Anderson did
this description using a hypothesis which assumes that one of the principal stresses is the greatest,
followed by intermediate and the least (i.e. 𝜎1 > 𝜎2>𝜎3 ) in descending order of magnitude. The
lithostatic load is constantly vertical and should be identified first since the other two are
orthogonal and horizontal Figure 2.10. This automatically defines the orientations of the two
horizontal stresses (Cerveny et al., 2004; Economides and Nolte, 2000). Anderson’s theory of
faulting predicts the type of developed fault at any given area to form in two conjugate planes
33
depending on any three of the principal stresses that becomes vertical with the other two being
orthogonal (Twiss and Moores, 1992; Jaeger and Cook, 1979; Zoback, 2007) as follows:
1) Faults are expected to form at +600 to the minimum horizontal stress direction.
2) Faults are expected to form at +300 to the vertical principal stress direction.
3) The line created by connection of conjugate fault planes will be parallel to .
Following the orientations of the stresses defined above, Anderson (1951) described the
classification of fault in an area as Normal fault; when dip is 60o, Thrust fault; when dip is 30o and
strike slip; when dip is an angle of 30o (Twiss and Moores, 1992). His theory assumes and
characterize maximum principal stress (overburden) to be vertical in normal faulting, the minimum
horizontal stress as vertical in the thrust faulting and intermediate horizontal stress as vertical in
the strike slip faulting (Zoback, 2007).
Moreover, the work of Bell (1996) reviewed the in situ stresses in sedimentary rocks for geological
and petroleum geomechanical engineering applications and elaborated on the generally used
measurements methods for determination of in situ stress in sedimentary rock especially in terms
of the three principal stresses; vertical, intermediate and minor horizontal stresses (Bell, 1996).
Consequently, he mentioned the sources where these three principal stresses, which are relative
can be obtained from, as density log for vertical stress determination, leak off test or hydraulic
fracture test for minor horizontal stress, core monitoring techniques for minor and intermediate
stresses including micro and mini fracture data.
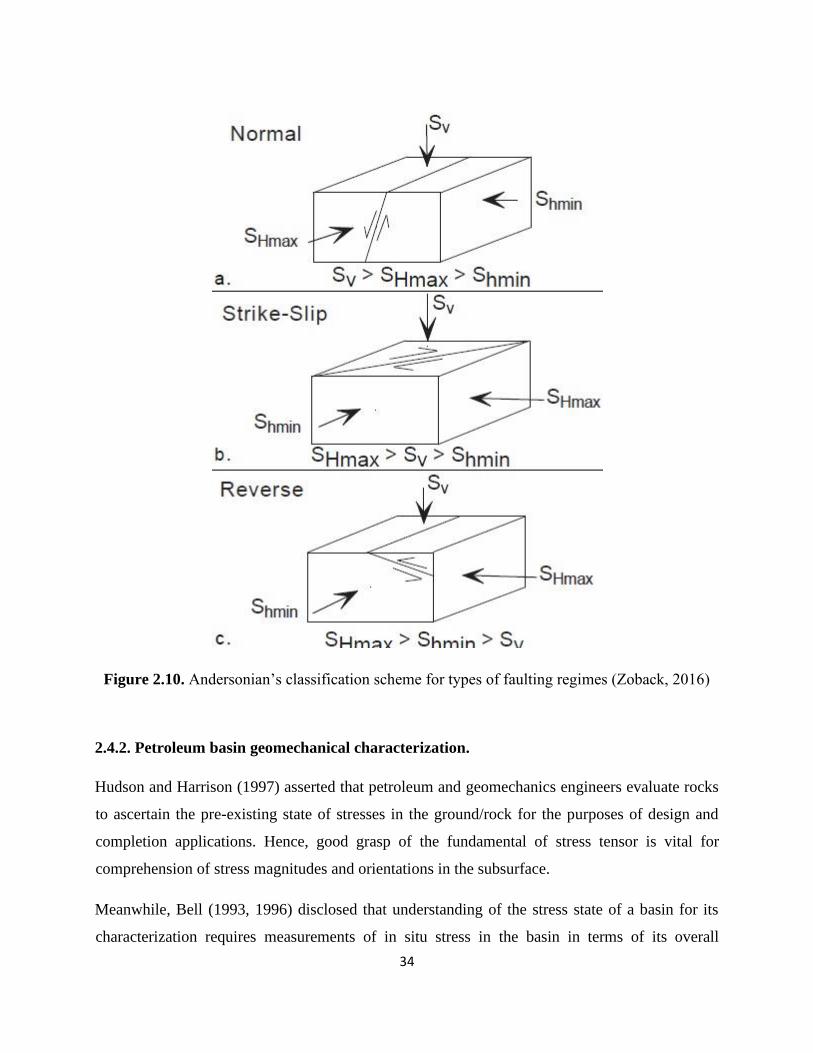
34
Figure 2.10. Andersonian’s classification scheme for types of faulting regimes (Zoback, 2016)
2.4.2. Petroleum basin geomechanical characterization.
Hudson and Harrison (1997) asserted that petroleum and geomechanics engineers evaluate rocks
to ascertain the pre-existing state of stresses in the ground/rock for the purposes of design and
completion applications. Hence, good grasp of the fundamental of stress tensor is vital for
comprehension of stress magnitudes and orientations in the subsurface.
Meanwhile, Bell (1993, 1996) disclosed that understanding of the stress state of a basin for its
characterization requires measurements of in situ stress in the basin in terms of its overall
35
geomechanics, which incidentally includes the relationship between the sediments and the
overlying rocks.
In addition, Zoback (2007) submitted that sedimentary basins are found in stress regimes with
normal strike-slip and reverse faulting environments. Thus, data gathered during drilling and
hydrocarbon production, provide necessary information on stress orientations and magnitudes
(Zoback, 2007). These data are required and acquired as a function of depth to address
geomechanical stress related issues if the reservoir has geomechanical challenge (Dusseault, 2011).
The understanding of stress magnitude and distribution in the earth interior can be combined with
mechanical, thermal and rheological constraints to examine a broad range of geologic processes
(Tingay et al., 2005).
Zoback (2007) and Bell (1996) asserted that in some regions, consistent stress field exists all over
the upper brittle crust as indicated by constant orientations observed in part of North Sea and
western Canada. However, change in in-situ stress as a result of production, injection and drilling
activities make it difficult for the existence of uniform present-day stress from the different
measurement techniques sampling very different rock volumes and depth ranges (Zoback, 2007).
In the account of Schneider (1985), Bell (1996) and Yale (2003) demonstrated that present day
stress orientations are strongly influence by mechanical properties contrasts of rock unit present in
the basin. In other words, geologic structures such as diapirs, folds and faults deflected the
horizontal principal stress in an order of few meters to kilometers (Tingay, 2009) and are known
to be the controlling factor in local stress field. Examples have been cited around the world where
these local stress variations have been observed (Tingay, 2009; Bell, 1996), a weak fault or fracture
zones cannot uphold shear stresses hence, act as a free surface. Hence, the stress field within this
faulted or fracture zones are re-oriented locally so that Shmax is deflected to be sub- parallel to the
faults or fracture, this suggests that the weak zones are soft relative to the surrounding rocks.
Similarly, in a stiff structure Shmax is deflected to be perpendicular to the fault trace or igneous
intrusive (Bell, 1996; Tingay, 2009). These anomalous local stress orientations are the
consequences of near geologic structures and/or mechanical properties contrasts of the rocks. How
much horizontal principal stresses are deflected depends on the scale (i.e greater, larger and small)
nature of the interface and the geomechanical property contrast (Zhang et al., 1994).
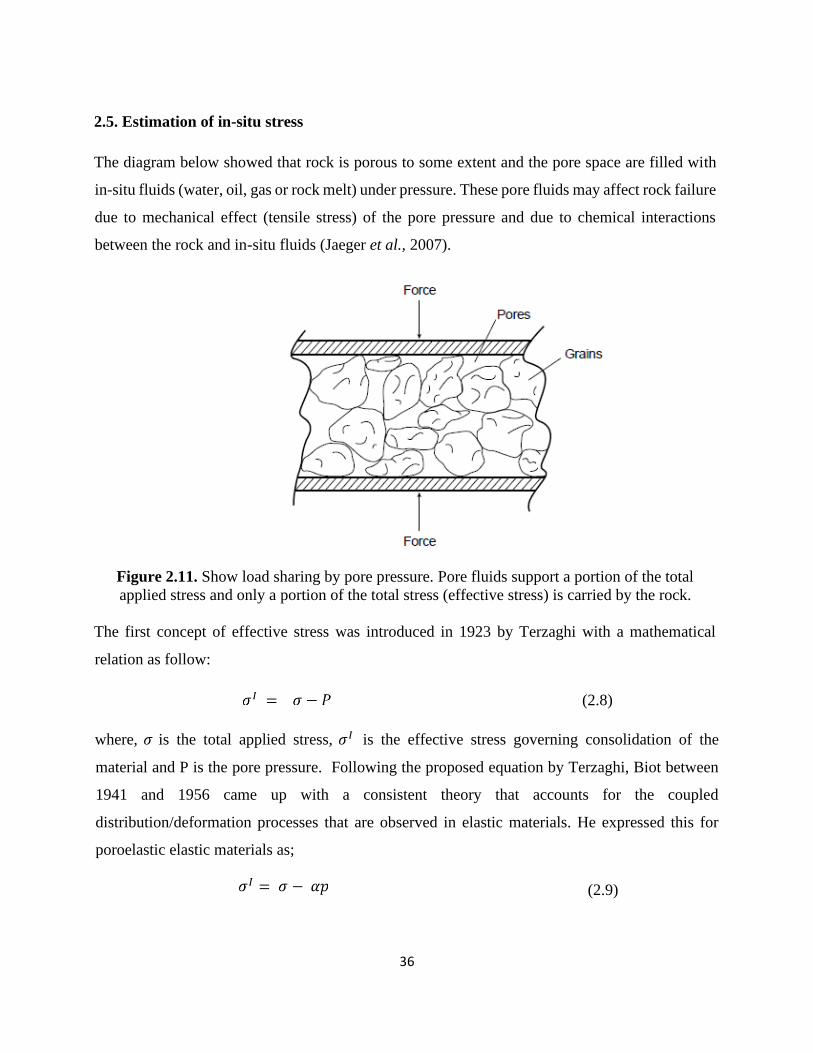
36
2.5. Estimation of in-situ stress
The diagram below showed that rock is porous to some extent and the pore space are filled with
in-situ fluids (water, oil, gas or rock melt) under pressure. These pore fluids may affect rock failure
due to mechanical effect (tensile stress) of the pore pressure and due to chemical interactions
between the rock and in-situ fluids (Jaeger et al., 2007).
Figure 2.11. Show load sharing by pore pressure. Pore fluids support a portion of the total
applied stress and only a portion of the total stress (effective stress) is carried by the rock.
The first concept of effective stress was introduced in 1923 by Terzaghi with a mathematical
relation as follow:
(2.8)
where, 𝜎 is the total applied stress, 𝜎𝐼 is the effective stress governing consolidation of the
material and P is the pore pressure. Following the proposed equation by Terzaghi, Biot between
1941 and 1956 came up with a consistent theory that accounts for the coupled
distribution/deformation processes that are observed in elastic materials. He expressed this for
poroelastic elastic materials as;
(2.9)
37
where, is the poroelastic (Biot) constant which varies between (0 and 1). Terzaghi (1923)
effective stress equation governs rock deformation.
Worldwide, oil and gas hydrocarbon reservoirs are found at various depths (shallow and deep
reservoirs) below the earth’s surface, that is, within few hundred to several thousand meters/feet
(Jones et al., 1992). As the depth to hydrocarbon discoveries increases, so the weight of the
overlying rock column increases and acts as overburden stress on the reservoir. To estimate stress
state generated, we assume that the rock is a semi – infinite isotropic medium subjected to
gravitational loading where there is no horizontal strain. Vertical stress is generated by the weight
of the overburden and it is referred to as maximum principal stress (Economides, 2000).
𝜎𝑣 = ∫ 𝜌(𝐻)𝑔 𝑑𝐻
𝐻
0
or 2.10
𝜎𝑣 = ∫ 𝜌𝑟𝑔 ℎ
ℎ
0
where, is the overburden stress, g is the gravitational constant, H is the depth of burial and is
the rock density. The integration of density log gives us the vertical stress. In young sediment
formation over burden gradient varies from about 0.8psi/ft to about 1.25psi/ft in high density
formations.
Sedimentary rocks are known for its porous nature which host fluid such as oil, water and gas in a
formation. Considering a cross section of the hydrocarbon reservoir; generally, the whole rock
columns on top of the hydrocarbon reservoir down to the reservoir ideally will also be saturated
with (oil, condensate, brine or water) and/or gases (natural gas or air). These liquids, thus, form a
continuous column from surface of the earth down to the reservoir interval and the load of this
column is accountable for another stress component acting in the hydrocarbon reservoir this is
known as the hydrostatic pressure or component of pore fluid pressure expressed by (Jones et al.,
1992) as:
38
𝑃𝑃 = ∫ 𝜌𝑓𝑔 ℎ
ℎ
0
(2.11)
Where, is the pore pressure and is the pore fluid pressure, g is the gravitational constant and
h is depth.
Tingay et al. (2005) explained that the present-day stress field is been controlled by the deflection
caused by geologic structures such as faults and diapirs. Thus, the present-day stress pattern,
geologic setting and type of rock in a basin also subject hydrocarbon reservoir to horizontal stresses
(Jones et al., 1992).
2.5.1 Description of principal stresses
Economides and Nolte (2000) asserted that a complete account of the state of stress is of
significance because hydraulic fractures promulgate perpendicular to the minimum principal
stress. This aids hydraulic fracturing design as follows: if 𝜎3 is horizontal, a vertical fracture will
be created (recommended for the reservoir). If 𝜎3 is vertical, a horizontal fracture will be created
(recommended for the reservoir) and if 𝜎3 is inclined, an incline fracture normal to it will be
created (recommended).
2.6 Theoretical framework (mechanical behavior of rock)
Rock deforms when subjected to load due to high stress level and more strain experience.
Jones et al. (1992) posited that sedimentary rocks consist of porous media, grains and minerals that
eventually cemented (bonded) these rock properties together. These sedimentary rocks are the hub
for hydrocarbon generation, storage and transmissivity by their intrinsic nature. The theories of
rock behavior that is, elastic, nonlinear or inelastic which determine the relationship between stress
and strain provide the basis for interpretation of geomechanical parameters for well construction
design. These theories are referred to as constitutive laws.
39
Rocks are not completely elastic they are brittle with negligible plasticity; the awareness of elastic
parameters is of enormous importance for engineering applications. At low effective stresses rock
samples subjected to load behave elastically while at high effective stresses rocks deform or rupture
(Cerveny et al., 2004; Jones et al., 1992). When a rock sample or an element of the earth is
submitted to load, it exhibits elastic behavior at low stresses but at high effective stresses, it
deforms, yield or give way in service. Thus, rock behavior depends on the existing stress
conditions. The description of the behavior of rock undergoing deforming force is governed by
constitutes laws which determines the relationship between stress and strain and describes the
deformation (Zoback, 2007). There are three types of these laws namely; Elasticity, plastic and
Viscous (Serra, 1984)
2.6.1 Linear elasticity
For an ideal rock, it is assumed that rock behaves as an elastic material this gives it significant
advantages (Serra, 1984). In elastic theory, it is assumed that there is a one-to-one association
between stress and strain when subjected to an applied force and upon the removal of the force the
rock behavior becomes reversible. This display linear elasticity behavior and Hooke’s law is
obeyed, that is, it assumed a linear and unique relationship between stress and strain. Once more,
taking into account the strength of the materials the deformation will be elastic until the point of
failure is reached. Beyond the elastic limit, any small degree of inelastic deformation leads to
failure of material (Tiab and Donaldson, 2012). This is valid for well cemented rocks but for weak
and poorly cemented rocks the applicability of the above strength of material approach is more
questionable (Zoback, 2007). This theory is applied to non-linear and anisotropy materials. As
mentioned above, the rock returning to initial shape is not necessarily immediate and may take
some time; this is known as Elastic-plastic (non-linear elastic). This defines rock behavior which
responds elastically to the stress level at which it yields and then deforms plastically; without limit
upon unloading of the applied force the rock would again behave elastically. In this case there is
nonlinear relationship between stress and strain, but it recovers strain attained upon unloading.
Anisotropic material has properties that differ in different directions and these properties can be
40
characterized by five young moduli, Poisson’s ratio, compressibility, bulk modulus and shear
modulus (Economides and Nolte, 2000).
2.6.2 Poroelasticity
Poroelastic theory explains the deformation in a porous rock saturated with fluid where, the
stiffness of a fluid saturated rock will depend on the rate (i.e. time dependent deformation) at which
external force is applied. Therefore, the deformation of a poroelastic material is time dependent. It
is a property shared with viscoelastic materials.
2.6.3 Plasticity
Soft rocks are usually weak and manifest larger deformation features (creep), creep is a time
dependent deformation that occur in materials under constant stress, its originates from visco-
elastic effect and occur in both saturated or dry rocks, that is, they flow. Plasticity theory deals
with the reaction of rock to load further than elastic limit. Rock deformation becomes permanent
above a certain threshold (Serra, 1984). It behaves elastically prior to the point of threshold
attainment and deformation occur because of inter-granular movements and recrystallization
processes. The theory of plasticity deals with the complex rock behavior particularly in
compression. Therefore, it is used for predicting stress concentration around a borehole and the
behavior of soft materials in a depleted reservoir (Economides and Nolte, 2000).
2.6.4 Visco-elasticity
Visco-elastic theory is one in which the deformation of rock is in response to an applied stress or
strain, it is time rate dependent. The deformational stress required to cause a certain amount of
strain in the rock depends on the perceptible viscosity ƞ of the rock (Serra, 1984). Viscosity is the
internal resistance offered against the free flow of fluid material. It is equal to the ratio of shear
stress τ, to the rate of shear strain, γ. Viscous material can deform, and the strain is unrecoverable
(Serra, 1984). A viscous material that exhibits permanent deformation after application of a load
describes visco-plastic. The above theories describe the constitute behavior of rock in elastic,
poroelastic, elastic-plastic and viscoelastic media (Zoback, 2007).
41
2.7. Rock strength
The strength of a reservoir rock is the stress at which the rock fails (i.e losses its integrity) either
in shear, compression and tension depending on load configuration, geometry and stress
distribution. The strength of rock can be obtained from various laboratory test methods. These test
methods are; triaxial compressive and extension, hydrostatic compressive, uniaxial compressive,
uniaxial tension, and polyaxial or true triaxial. The general strength of rocks is a connection
between the principal effectives stress mechanism as articulated by (Terzaghi, 1923; Economides
and Nolte, 2000). Rock strength are dependent on the following factors: rock type and composition,
rock weathering, rock density, rock grain size, rock porosity, confining stresses, rock anisotropy,
rate of loading, rock geometry, shape and size, time, temperature, pore fluid pressure and fluid
saturation (Amadei, 2007).
2.7.1 Factors affecting rock strength
The intrinsic properties of reservoir rocks (i.e. texture and mineralogy) coupled with the
geomechanical behavior of rocks are controlled by the following factors:
i. Influence of pore pressure
Pore fluids in a formation provide some support to portion of the total applied stress, besides, a
portion of the effective vertical stress is also supported by the rock matrix. The effective stress of
a formation varies across the life span of the reservoir (Economides and Nolte, 2000). Furthermore,
the fluid response is modified by the mechanical performance of the porous rock in two ways: an
increase of pore pressure which reduces normal reservoir stress and induces rock dilation and
compression of the rock which produces pore pressure increase causing a time dependent
characteristic to the mechanical properties of the rock (Detournay and Cheng, 1993).
ii. The effect of water
Han and Dusseault (2005) reported that the increase of water saturation during production leads to
sand failure. Formation water act in different ways to cause sand failure: by chemical deterioration
42
of cementing materials which weaken the strength of the crystal structure rock and; by pressure
solution caused by dissolves soluble minerals deposited locally in low stress environment which
are prone to complete flush out (Allmendinger, 2015). A sandstone will addition of water or fully
saturated may typically lose its strength by 15% (Goodman, 1989). On the other hand, the
consequence of fissure water and pore pressure influences the rock strength.
iii. The effect of size on strength
Rocks are composed of crystals and intact grain to grain, principally characterized by joints, cracks,
fissures, shistosity, cavities and other possible discontinuity (Jumikis, 1983). To understand the
components that influence rock strength, large samples are required for test, these samples suggest
pre-existing cracks, but when the test specimen sample is small in size such that relatively, few
cracks are present. This sample failure involves new crack growth. Therefore, rock strength is size
dependent (Goodman, 1989). Rock strength decreases with the size of the test specimen and a finer
size grain leads to high fracture (Amadei, 2007).
iv. Anisotropic rock
Rock anisotropy describes the continuous directional variations of principal stresses and
mechanical properties of compressive strength (Bidgoli and Jing, 2014; Goodman, 1989). It occurs
in so many formations with interlayer mixtures components such as sandstones/shale intercalation,
chert/shale alteration and banded gneisses. The characteristic of strong anisotropy is established in
rocks with parallel arrangement of flat minerals like chlorite, mica and long mineral like
hornblende or clay (Goodman, 1989). Deformation and rock strength anisotropy has significant
role for well engineering design and assessment in geomechanics as rock exhibiting anisotropy
may leads to strong strength anisotropy (Goodman, 1989).
v. Confining pressure
All rocks deform slightly by some few percentages prior to their rupture or fracture at low confining
pressure (Serra, 1986). This mean that at high confining pressure rock mechanical property
behavior variation is observed. Hence, at reservoir depth confining pressure increases the rock
strength (Amadei, 2007).

43
vi. Time
Rocks generally exhibit elastic behavior except in few cases where they have nonlinearity. When
the rocks are subjected to very short time or duration stresses they behave elastically and become
plastic when they are expose to stresses applied over long duration of time. Thus, time played a
significant role in the behavior of rocks (Tiab and Donaldson, 2012)
vii. Temperature
Elasticity limit of rock is observed to decrease as the formation temperature increases; therefore,
when temperature increases less stress is required to produce deformation or strain in a reservoir.
2.7.2 Rock failure and fracture mechanics
Rock failure means the gross loss of reliability in a rock sample specimen to carry out its proposed
function as regard to civil engineering context (Jumikis, 1983). A rock fails as soon as the state of
stress is such that the criterion is met along one plane, which is also the failure plane. For instance,
in the case of Mohr circle this means that the state of stress at failure is represented by a Mohr
circle that touches the failure envelop. To comprehend failure, certain compactable failure criterion
needs to be employed because sand fails in shear, while clay fails as plastic, these have been
documented as their respective failure mechanisms (Economides, Watters and Dun-Norman,
1998). Other failure mechanisms are; tensile, cohesive, creeping and pore collapse. These
criterions are used to generate envelopes which separate unstable from stable zones.
The empirical relations for rock failure criteria are terminology of physical hypotheses derived
from laboratory experiments, which indicate how temperature, time effects and in situ stress
including other factors affect rock strength (Goodman, 1989). There are numerous rock failure
criteria for different rock types.
Thus, they are used to evaluate if a rock will fail or not for engineering design. These relationships
are called the failure criterion, and its graphical representation is called the failure envelope. In this
study because of the well-established background and simplicity of Mohr Coulomb’s and Mohr’s
criteria, its use is therefore adopted Figure 2.12. The figure below explained Mohr diagram, shear

44
failure occurs if the stress state produces a shear stress that falls outside the stability envelop while
tensile failure occurs if the stress state falls to the left shear stress axis and exceeds the tensile
strength of the rock.
Figure 2.12. Mohr Coulomb failure envelope.
2.7.3 Basic rock failure model
Models developed to predict rock failure can be divided into four categories namely; Empirical
correlation model, analytical analysis model, numerical analysis model and probabilistic model.
i. Empirical correlation models are developed based on exact field data. They describe the
physical behavior of a reservoir rock failure based on field observations. They rely on
establishing an empirical correlation with relationships between onset sand product, well
data and field parameters which are responsible for causing sanding development in a
hydrocarbon reservoir (Gholami et al., 2016).
ii. Analytical models: are theoretical model applied for the prediction of rock failure which
focuses on stress state analysis in the formation, wellbore and/or perforation intervals for
45
which critical condition has reached for the initiation of rock failure. These simplify the
rock mechanic properties and geometry problem and are very realistic for screening
purposes and are deployed over a broad range of circumstances (Oyeneyin, 2015). As the
name implies analytical mathematical equations are used to estimate rock failure or
sanding potential (Oyeneyin, 2015; Gholami et al., 2016). Thus, they are widely used for
sand production evaluation in subsurface engineering, although suffer from assumptions
used (Gholami et al., 2016).
iii. Numerical analysis models: These are the best model to be employed in solving precise
geomechanical problems because they proffer great details of rock failure development as
a result of various combinations of input data used for their simulation analysis than their
counterparts. The acquisition of all these parameters as input for reservoir simulation
suffers some drawback because varied procedures are required, and their corrections must
be affected accordingly (Gholami et al., 2016).
iv. Probabilistic models: These statistical models developed which utilizes analytical models
in conjunction with numerical models to evaluate and predict statistical variation
underlying field parameters with reference to satisfactory range of uncertainty.
2.8 Empirical analysis review
Rock formation may become loose after shear volume or tensile failure. When rock fails by
shearing or in tensile it led to sand production.
2.8.1 Rock Failure and Sand production
Udebhulu and Ogbe (2015) asserted that the Niger Delta formation is a poorly consolidated and
friable region which makes it prone to sand production. This necessitated the need for proper
geomechanical analysis to be carried out to understand the in-situ stress, rock strength and elastic
properties for field development.
Osisanya (2010) confirmed that poor consolidation reservoirs have always proved difficult which
warrants sand production issues to be expected when completing wells in these formations. The
46
reduction of in situ stress due to poor completion practices also results in consolidation rock failure
in mature and brown fields globally. A lot of factors influence sand failure. They include fluid
production rate, formation strength and changing in in-situ stresses; just to mention but a few. Sand
production is one of foremost problems usually encountered by producing companies for several
decades now (Osisanya, 2010).
According to particles together Nouri et al. (2003), sand production is the phenomenon that is
associated with the production of solid with reservoir fluid. The volumetric failure model which
he puts forward argues that pore collapse is a significant source of sanding in a reservoir through
induced disintegrated material exposure to the cavity’s face.
Soroush (2013) and Majidi et al. (2015) confidently maintained that when the virgin state of stress
is disturbed by different oil and gas exploration activities, pore fluid pressure in the reservoir is
reduced. This reduction may eventually instigate a redistribution of stress in the reservoir and
surrounding rocks; thereby leading to a variety of potential issues such as compaction, subsidence,
fault reactivation and other forms of strain localization
Oyeneyin (2015) stated and explained that reservoir management for sand production needs an
accurate acquaintance of the likelihood of rock failure and the amount of sand it will produce.
Conducting a geomechanical analysis is a vital step to assess and prevent costly problems during
oil and gas exploration and production (Hoedeman and Hughes, 2015).
Moreover, Jones et al. (1992) reiterated that in order to comprehend the mechanical behavior of
hydrocarbon reservoir rocks, a sound knowledge of geomechanical properties is indispensable.
The understanding of a reservoir rock may influence the well design strategy. Three approaches
are used in geomechanics for its evaluation. They are theoretical, experimental and best industry
practices. They emphasized that the productive capacity of a field is affected by the in-situ stress
and deformation of rocks due to pressure drop in the reservoir.
The key objectives of geomechanical assessment of reservoir rocks are essentially for economic
development, better well engineering, evaluation of the probability of deformational problem
occurring in the subsurface, estimation of cost and impact on environmental safety, prediction of

47
drilling and wellbore stability problems, design of effective well completions and the prompt
provision of geomechanical data for mass balances of simulations (Jones et al., 1992).
Pak and Chan (2008) and Hibbeler and Rac (2005) explained that petroleum reservoir having low
permeability for the flow of fluid requires hydraulic fracturing to make it commercially feasible.
The study justified real time sanding model with minimal input parameters from geophysical logs.
Cartson et al. (1992) asserted that detailed understanding of reservoir formation, mechanical
strength, rock failure mechanism and present-day stress state is necessary for predicting sanding
potential for mitigation strategy.
Benetatos et al. (2015) succinctly submitted that the notable sources of stress in the subsurface
could be categorized as natural and anthropogenic processes. The former is, as a matter of fact,
occasioned by tectonic loading, sediment compaction, sediment loading and post-glacial rebound.
However, the latter process of stresses formation is basically triggered by man-made activities such
as drilling operations, fluid exploitation and local hydrocarbon production.
Abija and Tse (2016) explained the significance of in situ stress level and direction for oil and gas
field development planning for optional well placement, especially, in deviated wells for safe and
stable drilling to lessen nonproductive time.
In addition, Hubert and Willis (1957) clearly established that the direction of propagation of
hydraulic fracturing in a reservoir should be perpendicular to the minimum horizontal principal
stress orientation. This was further revealed analytically through the work done to open an amount
of a fracture when compared to the product of the stress acting vertically to the fracture plane
and/or times the fracture opening amount.
A well is said to be poorly planned or designed when there is inadequate geomechanical data or
information about it. The required information about such well may include the elastic properties
and the strength of the rock, in-situ stress and well bore stresses around the wellbore wall.
Sometimes, production activities may lead to geomechanical problems such as wellbore collapse,
kick, lost circulation, side tracking and even well abandonment particularly during an infill and
extended wells drilling (Abija and Tse, 2016). The review behind the development of a
48
geomechanical model of a field is to sustain the lifetime of the reservoir (Hegazy and
Lakshmikantha, 2014).
2.8.2 Geomechanical methodologies (theories and methods)
Considering the separate works of Chin and Ramos (2002) and; Udebhulu and Ogbe (2015) reveals
that there is a wide variety of empirical, numerical and analytical models for sand production
prediction because of the efforts that have been spent in developing these models for
geomechanical prediction of sand failure over the years, to assist in several ways of field
development and management.
Udebhulu and Ogbe (2015) developed a general mechanistic model that incorporates the theory of
dimensionless quantities related with sanding and concluded that nearly all reservoirs have
distinctive sand production rate (SPR) relationship index which represents its susceptibility to
produce sand or its sanding characteristics.
Abdideh and Ahmadifar (2013) designed methodological workflow for geomechanical model with
a primary aim to predict appropriate layers for hydraulic fracturing operation in hydrocarbon
reservoir rock using geomechanical model. Their geomechanical model followed an outline which
includes five main steps to estimate and calculate elastic properties of rock: in-situ stresses, design
for safe mud window, selection of hydraulic suitable layers for fracturing and failure prediction
from stress. They concluded that geomechanics provides the key understanding for the
investigations and interpretation of the earth response against stresses, which may be natural and
anthropogenic.
As a step towards addressing related geomechanical problems for well stability, Darvisa et al.
(2015) described hydraulic fracturing as a well stimulation treatment and/or enhancement of
hydrocarbon production that requires desirable technical deployment. Geomechanical model
established for a field enhances the detailed comprehension of the field development options to
improve well liberation through an optimized and incorporated method (Xiao et al., 2016).
Balarabe and Isehunwa (2017) developed a geomechanical model, whose purpose is to reliably
estimate critical pressure below which sand production can occur in a reservoir.
49
McDermott and Kolditz (2006) put forward a geomechanical model which characterizes fracture
closing as a function of effective stress and the variations in petrophysical reservoir parameters
which include aperture, permeability and porosity. The changes in normal effective stress cause
fracture closure and can be used to formulate an analytical elastic deformation solution to compute
the buckle reaction to changes in effective stress (McDermott and Kolditz, 2006). Their model
provides an imminent key process to determining the closing of a fracture and serve as a substance
input function for numerical models involving the effects of the stress field disparity.
Moreover, Zoback and Khaksar (2006) reiterated the existing empirical equations developed
worldwide to estimate rock strength from geophysical logs. These equations have been proven to
be very useful in the oil exploration and production industry for estimating and solving a wide
range of geomechanical problems; especially, when direct strength information from core is not
available. However, some of these equations work practically well for strength-porosity
relationships in sandstone and shale formations. The variation of rock strength in individual
physical property, shown that published or unpublished empirical correlations designed for
estimation of rock strength at a particular region could not adequately fit another region.
Meanwhile, Kang et al. (2009) brilliantly and reliably introduced a new approach based on
grainscale discrete element to mimic the realistic rock condition. Their well-articulated and
presented work revealed the limitations inherent in conventional models and the potential
usefulness of a new approach based on a discrete element method (DEM).
In his contribution Hoedeman (2015) compared the different geomechanical model such as 1D,
3D, 4D finite element models for state of stress and asserted the model that gives a more precise
and reliable present-day stress among its counterpart as 1D geomechanical models.
Besides, Archer and Rasouli (2012) applied log derived methodology to estimate rock strength
through the calculation of the elastic properties and in-situ stress magnitudes from vertical, major
and minor horizontal stresses.
Woehrl et al. (2010) presented meaningful comparison between the different methods used to
obtain rock mechanical properties from petrophysical logs using empirical relations and
algorithms. The petrophysical logs allow for computation of continuous presentation of
50
mechanical properties with depth. These log-derived petrophysical data were correlated with
laboratory-derived rock mechanical properties for validation of result.
In their work, Fidelis and Akaha (2016) further stated that geomechanical analysis and its modeling
is a tool employed to generate data for well planning and reservoir engineering. These properties
are the elastic constants such as bulk modulus, shear modulus, Young’s modulus and Poisson’s
ratio including the in-situ stress. These geomechanical properties account for hydrocarbon
reservoir stress profile which is critical to any reservoir development. Thus, they play a key role
in the assessment and development of a field by predicting and mitigating the effects of stress and
pressure changes for resultant strains on the reservoir, wellbore and completion design in the
formation.
In an anticipation to get a better reservoir performance Zhou et al. (2005) applied two methods
which are based on mapping and radial basis function to estimate rock strength from high-quality
nuclear spectrometric tools, comprises of prompt gamma Neutron activation, natural gamma and
conventional geophysical logs.
Hudson and Harrison (2000) stated two approaches as direct and indirect for the determination of
5hmin. The direct method as the name implies involves direct stress measurements using either of
the tests methods: micro-frac, mini-frac, leak-off test and step rate tests (Zoback, 2007; Fang and
Khaksar, 2011; Carnegie et al., 2002).
Jamshidian et al. (2017) submitted in their studies that, various models have been anticipated for
the indirect method of determining minimum horizontal stress (Shmin) parameter and listed these
models to include: Newberry, Huang, Terzaghi, Anderson and horizontal poroelastic strain models
(Jamshidian et al., 2017). Basically, this indirect method requires various data sets from wireline
logs data, core, pore pressure, static Young’s modulus, Poisson’s ratio and shear sonic transit time
(Jamshidian et al., 2017).
Bieniawski (1974) also proposed two comprehensible and easy-to-use methods primarily designed
for the prediction of the behavior of rock materials and the estimation of the strength of the rock
(i.e uniaxial and triaxial). He validated his methods with some 700 representative specimens from
five different rock types.
51
The deformations of porous rock have been reported by (Carbognin et al., 1978; Yin et al., 2006,
2007; Taheri, 2015) as major concern in some reservoir that affects not only the surface facilities
but also cause blockage in the tubing and reduced production rate.
In another contribution, Zoccarato et al. (2016) succinctly declared that the prediction of the
subsurface compaction of producing oil and gas fields is an imperative issue for accurate reservoir
management.
According to Darvish et al. (2015), in order to effectively address stress associated issues of
reservoir rocks, it is essential to carry out some vital rock mechanical test on different reservoir
rock (core) samples for physical and mechanical properties information of the reservoir rock.
Sengupta et al. (2011) highlighted on the importance of the extent to which seismic driven earth
model can be incorporated into the domain of geomechanics and drilling. The impact of formation
parameters from seismic data on well design was duly emphasized. Mention was also made on the
fact that seismic inversion parameters improve the resolution and quality of a 3D Mechanical earth
model (MEM).
To comprehend failure phenomenon, a specific and compatible criterion must be employed, while
some materials such as sand, fail in shear, others, such as clay, may fail due to plastic deformation.
Many empirical criteria have been developed to predict rock and formation failure (Aadnoy and
Looyeh, 2011). Most of them consider only minimum (𝜎3) and maximum (𝜎1) principal stresses.
(Konietzky et al., 2017). However, more advanced once include the intermediate principal stress
(𝜎2). Below are some failure theories and UCS model adopted in rock mechanics. Table 2.1 Failure
theories for ductile and brittle materials
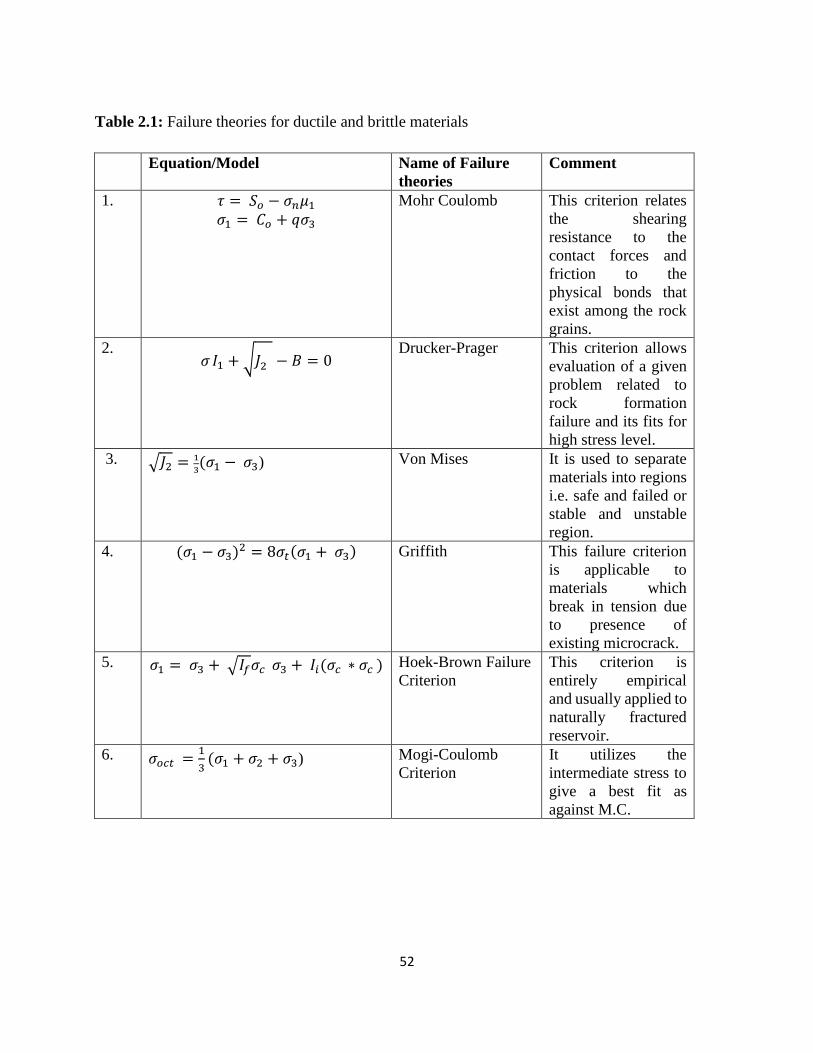
52
Table 2.1: Failure theories for ductile and brittle materials
Equation/Model Name of Failure
theories
Comment
1. 𝜏 = 𝑆𝑜 − 𝜎𝑛𝜇1
𝜎1 = 𝐶𝑜 + 𝑞𝜎3
Mohr Coulomb This criterion relates
the shearing
resistance to the
contact forces and
friction to the
physical bonds that
exist among the rock
grains.
2. 𝜎 𝐼1 + √𝐽2 − 𝐵 = 0
Drucker-Prager This criterion allows
evaluation of a given
problem related to
rock formation
failure and its fits for
high stress level.
3. √𝐽2 = 1
3(𝜎1 − 𝜎3) Von Mises It is used to separate
materials into regions
i.e. safe and failed or
stable and unstable
region.
4. (𝜎1 − 𝜎3)2 = 8𝜎𝑡(𝜎1 + 𝜎3) Griffith This failure criterion
is applicable to
materials which
break in tension due
to presence of
existing microcrack.
5. 𝜎1 = 𝜎3 + √𝐼𝑓𝜎𝑐 𝜎3 + 𝐼𝑖(𝜎𝑐 ∗ 𝜎𝑐 ) Hoek-Brown Failure
Criterion
This criterion is
entirely empirical
and usually applied to
naturally fractured
reservoir.
6. 𝜎𝑜𝑐𝑡 =1
3(𝜎1 + 𝜎2 + 𝜎3) Mogi-Coulomb
Criterion
It utilizes the
intermediate stress to
give a best fit as
against M.C.
53
2.8.5 Previous work on Wabi field
Adewole and Healy (2013) obtained the directions and magnitudes of two principal stresses namely
maximum and minimum horizontal stress components in the Niger Delta from petroleum
exploration data and recommended that the maximum horizontal stress is the intermediate
principal stress in the basin. Also using two approaches which depict function of vertical stress
and over pressure at depths they quantified the magnitude of horizontal. Hence, proposed the
existence of inhomogeneous stress in the Northern Niger Delta and suggested different sources of
stress field in the study basin base on analyses of 32 borehole breakouts recorded in six wells.
Abija et al. (2016) carried out investigation of in situ stress orientation and magnitude for
determination of stress pattern in Wabi field Niger delta for well engineering particularly, for
directional drilling trajectory optimization for actualization of safe drilling operation of infill wells
in the field.
Uzorchukwu (2016) conducted a critical evaluation of the different existing correlations employed
for estimation and analysis of geomechanical parameters of rocks adopting three approaches;
namely, ranking and cross plots to obtain the best correlation that fits the Niger Delta region and
recommends the best correlation that can be applied to evaluate rock strength in the Niger Delta
reservoir as the Sharma and Singh approach.
Abija and Tse (2016) examined the geomechanical properties of an onshore field in the north
central Niger Delta for geosteering, wellbore stability, hydraulic fracturing in directional wells for
implementation in infill well using data from Oil and gas producing company.
Salawu, Sanaee and Onabanjo (2017) determined the rock strength (unconfined compressive
strength) of core samples collected from across the Niger Delta basin at different depths to obtain
an empirical correlation equation for the region and compared the derived UCS correlation
equation with other best industry existing correlations to verify if any existing correlation correlate
well in the Niger Delta region and concluded that known of the obtainable correlations built for
other regions of the world fits the Niger Delta.

54
Besides, Zorasi et al (2017) also embarked on a detailed and comprehensive seismic, petrophysical,
sequence/stratigraphic and geochemical evaluation of a mature onshore field (Wabi) in the Niger
Delta for reservoir characterization and upside hydrocarbon potential determination using seismic,
wire line logs, Drill stem test (DST), core and geochemical data, and identified bypassed pay zone
deeper in the field for reservoir development.
55
CHAPTER 3
MATERIALS AND METHODS
This chapter presents the materials, data sets and practical methodologies that were used or
employed for the evaluation of Wabi field petrophysical and geomechanical parameters through
oil and gas company best practices and empirical relations to understand the mechanical behaviour
of rocks for mitigation strategy and development. The materials used in this study includes: (i)
petrophysical logs such as gamma ray, resistivity, density, neutron and sonic logs, and (ii)
processed seismic data acquired by serving company.
3.1 Method of data collection and instrumentation
Data sets from Brown Mature/Marginal field reservoirs were collected from an oil producing
company in the Niger Delta with the assistance of the Department of Petroleum Resources (DPR).
These data include:
1. Digitize 3D seismic data (in Seg-Y data format).
2. Digitize conventional logs: Gamma ray, sonic, density, neutron, resistivity in LAS format
3. Repeat formation tester/ Drill stem test data for Pore pressure measurement.
4. Core x-ray scan for Wabi 5.
5. Check shots.
The following software: Schlumberger Petrel, interactive petrophysics and MS Excel were
employed for the analyses and interpretation of these data.
3.2 Research design (workflow)
The workflow designed for this study help to optimize both Wabi reservoir petrophysical and
geomechanical characterisation Figure 3.1. The step by steps workflow includes: Seismic
interpretation which gives lateral resolution of the subsurface, petrophysical evaluation gives
vertical resolution of wellbores, sequence stratigraphy analysis depicts the depositional
environment and geomechanics gives estimation of mechanical rock properties and the formation
strength to support completion design.
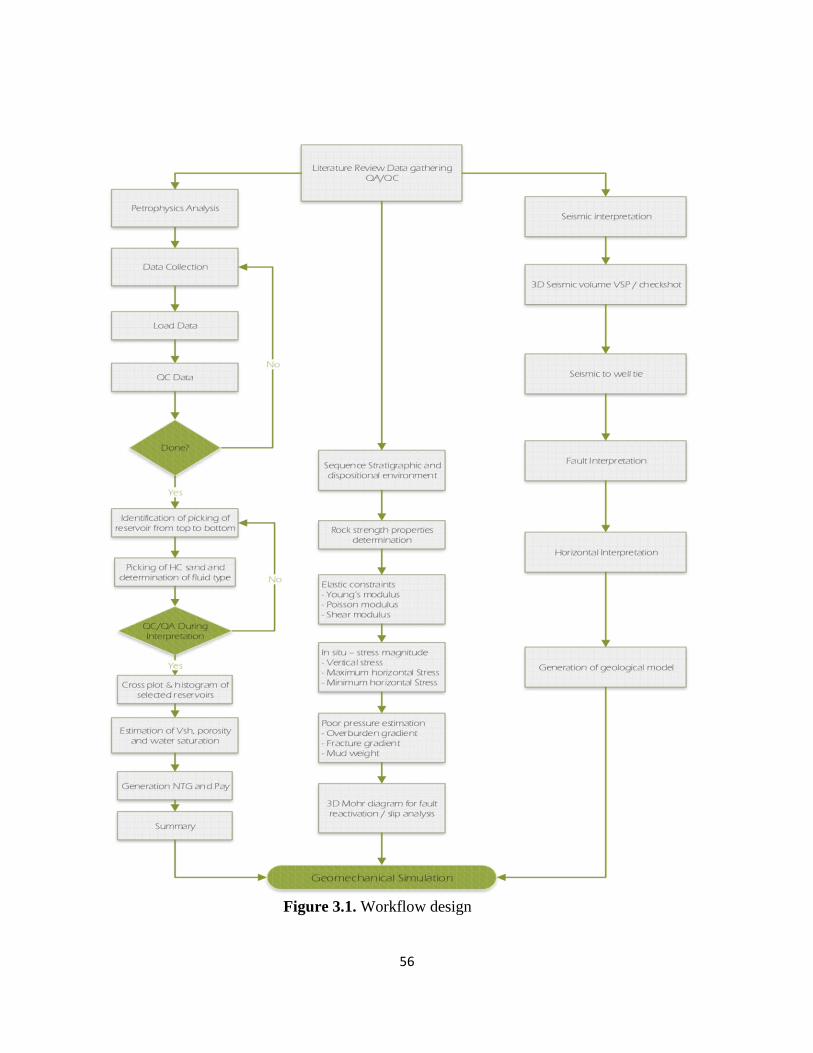
56
Figure 3.1. Workflow design
57
3.2.1 Procedures to carry out this analysis
a) Seismic interpretation analysis.
Detailed 3D seismic interpretation using the appropriate software (i.e. Schlumberger Petrel for
comprehensive seismic interpretation workflow, both structural & stratigraphic) was employed.
This includes: The loading of available data (seismic and logs) to the software, generation of
synthetic seismogram to determine the horizons or picks of interest to be interpreted on the seismic
profile, fault and horizon interpretation, calculation of heaves, creation of fault polygons and
zapping/interpolation/smoothing of horizons, generation of depth converted contour maps,
volumetric estimation and generation of geo-models, determination of fault trends, extent and
direction as well as delineation of stratigraphy of the area using seismic stratigraphic approach.
b) Petrophysical parameters valuation from well logs for reservoir characterization
Detailed petrophysical evaluations of sediments of the Basin will be carried out, such evaluations
included: Estimation of sand thicknesses with a view to producing an isopach map and determine
areas with good sand development, estimation of sand/shale percentages, estimation of total and
effective porosities, estimation of water and hydrocarbon saturation, delineation of possible
hydrocarbon-bearing sands and also water, oil and gas contacts, estimation and comparison of
porosity, permeability, water saturation, hydrocarbon saturation in and across the well(s) using the
available wireline logs, determination of the lithology and geometry of the sand units with a view
to correlating them, estimation of shale volume content, bulk volume water, hydrocarbon pore
volume/thicknesses, Net pay flag, cross plots of variable parameters, such as the different porosity
logs to determine mineral/ lithologic compositions of the sand units, estimation of Gas Production
Index (GPI) to determine intervals with good gas potential.
c) Lithology/Stratigraphic Evaluated from well logs for depositional environment.
Detailed sequence stratigraphic/ sedimentological analysis includes: The correlation of sequences,
systems tracts and parasequence from both seismic profiles and field studies, facies analysis and
identification/description of lithofacies units, depositional environments and stratigraphic
sequences, textural and compositional analyses of sandstone particles and microscopy to determine
mineralogical composition, porosity, maturity, provenance and effect of diagenesis on the
58
sandstone, interpretation of faunal abundance and/or diversity and trends of parasequence
thickening and thinning .
d) Geomechanical parameters evaluation from well logs using poroelastic theory
Detailed geomechanical evaluation of the reservoir parameters shall be carried out. This will
include: Estimation of the elastic properties such as shear/rigidity modulus, elastic modulus, bulk
and matrix moduli, bulk and grain compressibility, Poisson’s ratio and Biot’s coefficient from well
logs, inelastic properties determination: fracture gradient, rock strength, (uniaxial compressive
strengths) , tensile and cohesive strengths, and frictional angle, overburden (vertical stress)
calculation and the magnitudes of minimum and maximum horizontal stresses estimation using
poroelastic formulation, lithology delineation, pore pressure estimation, onset sand production
prediction estimation and construction of a 3D Mohr diagram.
3.3 Geomechanical properties estimation
The principle of elasticity examines the relationship existing between the forces applied to a rock
material and its responses to changes in shape and size (Timur, 1987). Upon the removal of the
forces acting on rock sample, it returns to its original shape and size, in elastic, Isotropic,
homogeneous solid. Therefore, the theory of elasticity assumes a linear relationship between stress
and resulting strain, provided the force or load is not large enough to cause permanent deformation
(Economides and Nolte, 2000). This implies that all strain recovers when the deforming force is
removed. The coefficient of proportionality is called Young’s modulus. Subjecting a rock sample
to a deforming force shortens or expands it (Timur, 1987).
3.3.1 Elastic property of rock and their definition
The property of a rock that describes or defines its ability to resist permanent deformation or
slightly deformed under the action of applied force is known as the elastic properties of that given
rock. These properties include shear modulus, bulk modulus, young’s modulus and Poisson’s ratio
(Serra, 1984). The reciprocal of bulk modulus is known as compressibility. Knowledge of these
elastic properties is very crucial for well engineering development because their determination
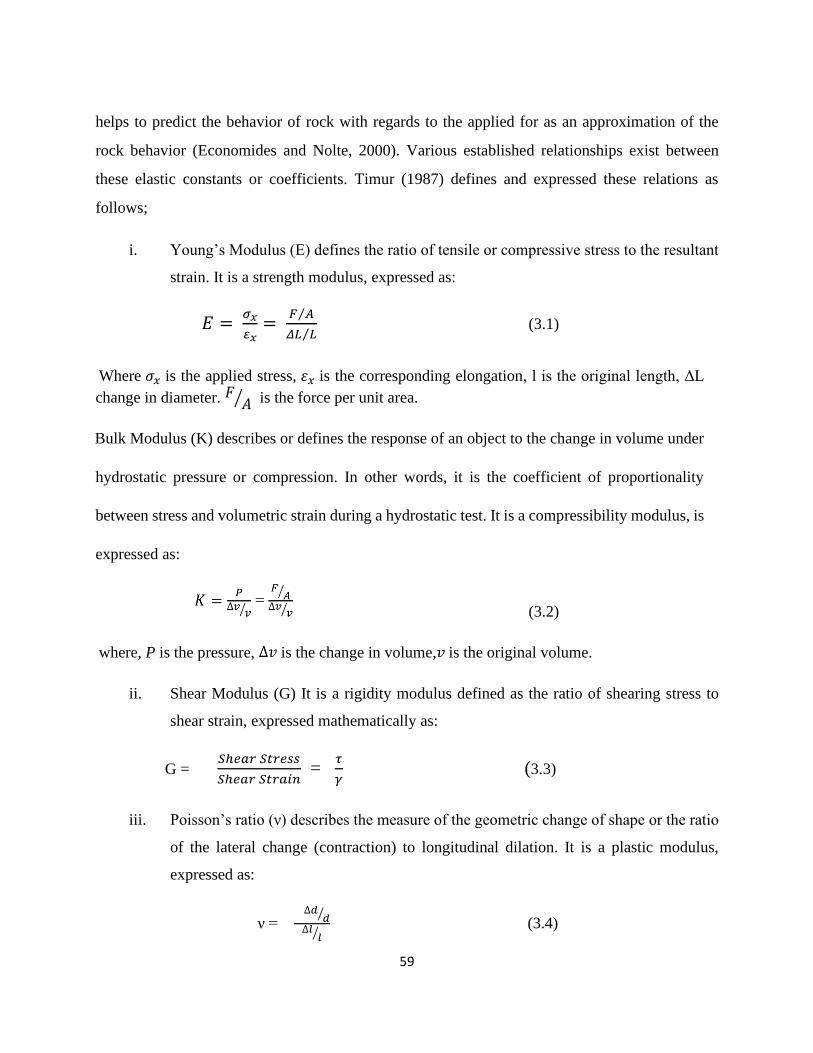
59
helps to predict the behavior of rock with regards to the applied for as an approximation of the
rock behavior (Economides and Nolte, 2000). Various established relationships exist between
these elastic constants or coefficients. Timur (1987) defines and expressed these relations as
follows;
i. Young’s Modulus (E) defines the ratio of tensile or compressive stress to the resultant
strain. It is a strength modulus, expressed as:
𝐸 = 𝜎𝑥
𝜀𝑥=
𝐹 𝐴⁄
𝛥𝐿 𝐿⁄ (3.1)
Where 𝜎𝑥 is the applied stress, 𝜀𝑥 is the corresponding elongation, l is the original length, ΔL
change in diameter. 𝐹 𝐴⁄ is the force per unit area.
Bulk Modulus (K) describes or defines the response of an object to the change in volume under
hydrostatic pressure or compression. In other words, it is the coefficient of proportionality
between stress and volumetric strain during a hydrostatic test. It is a compressibility modulus, is
expressed as:
(3.2)
where, P is the pressure, is the change in volume, is the original volume.
ii. Shear Modulus (G) It is a rigidity modulus defined as the ratio of shearing stress to
shear strain, expressed mathematically as:
G = 𝑆ℎ𝑒𝑎𝑟 𝑆𝑡𝑟𝑒𝑠𝑠
𝑆ℎ𝑒𝑎𝑟 𝑆𝑡𝑟𝑎𝑖𝑛 =
𝜏
𝛾 (3.3)
iii. Poisson’s ratio (ν) describes the measure of the geometric change of shape or the ratio
of the lateral change (contraction) to longitudinal dilation. It is a plastic modulus,
expressed as:
ν = ∆𝑑
𝑑⁄
∆𝑙𝑙⁄
(3.4)
60
where, is the change in diameter, is the original diameter of cylindrical core sample
For isotropic linear elastic medium, there are four established elastic parameters which are not
independent of one another, (Economides and Nolte, 2000; Timur, 1987) and anyone of these can
be articulated in terms of two others. i.e. the shear modulus G and bulk modulus K then an
expression can be written as a function of Young’s modulus, E and Poisson’s ratio, ν (Tiab and
Donaldson, 2012; Timur, 1987; Serra, 1984) and so on and so forth. See example below;
G = 𝐸
2(1+𝑉) (3.5)
K = (3.6)
3.3.2 In-situ stress measurement of mechanical properties
The frequently used indirect method for the determination of mechanical properties of rock is the
sonic (acoustic) and bulk density log measurements through wireline tools (Jones et al., 1992).
Acoustic waves propagate mechanical energy. This is the only petrophysical sonde (tool) that
responds to mechanical (elastic) properties of a formation. This is because its records parameters
linked with the transmission of sound waves in a given formation (Timur, 1987; Serra 1984). Two
types of waves are utilized, they are: compressive and shear waves for estimation of elastic
constants of a formation (Timur, 1987), thus measures the speed of propagation of compressive
and shear waves in a wellbore as well as their characteristics (Economides and Nolte, 2000).
Acoustic wave speed propagated in a formation can be estimated with the aid of the time it takes
to travel through a certain thickness of the formation (Timur, 1987).
Acoustic wave propagation in rocks depend on structural framework of grain, and pores, rock
matrix composition, temperature, porosity pore pressure and overburden (Timur, 1987). The
passage of compressive (P-wave) and shear (S-wave) characterized by particular kind of particle
movement through the earth stresses the rock and induces a strain which is proportional to the
applied stress. The P-wave caused the rock to change in volume while the S-wave caused the rock
to change in shape (Domenico and Danbom, 1986). Hence, the velocity of compressional and
shear wave depends on elastic constant of rock. Compressive wave ( ) has a particle motion that
is parallel to its direction of propagation sometimes called longitudinal wave. This wave travels
61
through liquid, gas and solid and has a constant velocity for a given material (Sheriff and Geldart,
1995). Shear wave (Vs) has particle motion, which is perpendicular to the propagation of the wave,
sometimes called transverse waves. It does not travel through fluid, i.e. gas and liquid but only
solid because it lacks attractive forces between molecules (Timur, 1987). Precise measurements of
compressional and shear wave velocities for mechanical properties description and analyses using
established models predict the capability of sand or rock strength to withstand impose forces due
to overburden weight or fast pressure depletion (Tixier, Loveless and Anderson, 1975).
3.3.3 Geophysical tools for the determination of mechanical properties
Acoustic log or sonic log is a continuous record versus depth of the specific time required for a
compressed wave to traverse a given distance of formation adjacent to the borehole. The acoustic
tool contains a transmitter and two receivers (Figure 3.2). When the transmitter is energized, at a
rate of 10 to 20 Hertz, the sound wave enters the formation from the mud column, travels through
the formation and backed to the receivers through the mud column. Formation velocity (travel
time, t) is determined using the differences in arrival times at the two receivers. The system has
circuits to compensate for hole size changes or any tilting of tool. The fundamental measurement
recorded on the sonic log is interval travels time; this is the reciprocal of interval velocity (Asquith
and Gibson, 1982). This parameter is recorded in microseconds per foot. Acoustic travel time can
be expressed as:
∆𝑡 = 106
𝑉 𝜇𝑠/𝑓𝑡 and
v = 1×0.348
∆𝑡×106 m/s (3.7)
where, v is velocity (m/s) and is the sonic interval transit time in .
Acoustic travel time normally fall between 40 and 200 , which corresponds to velocity
readings of 5,000 to 25.000 ft/s as shown in Table 3.1.
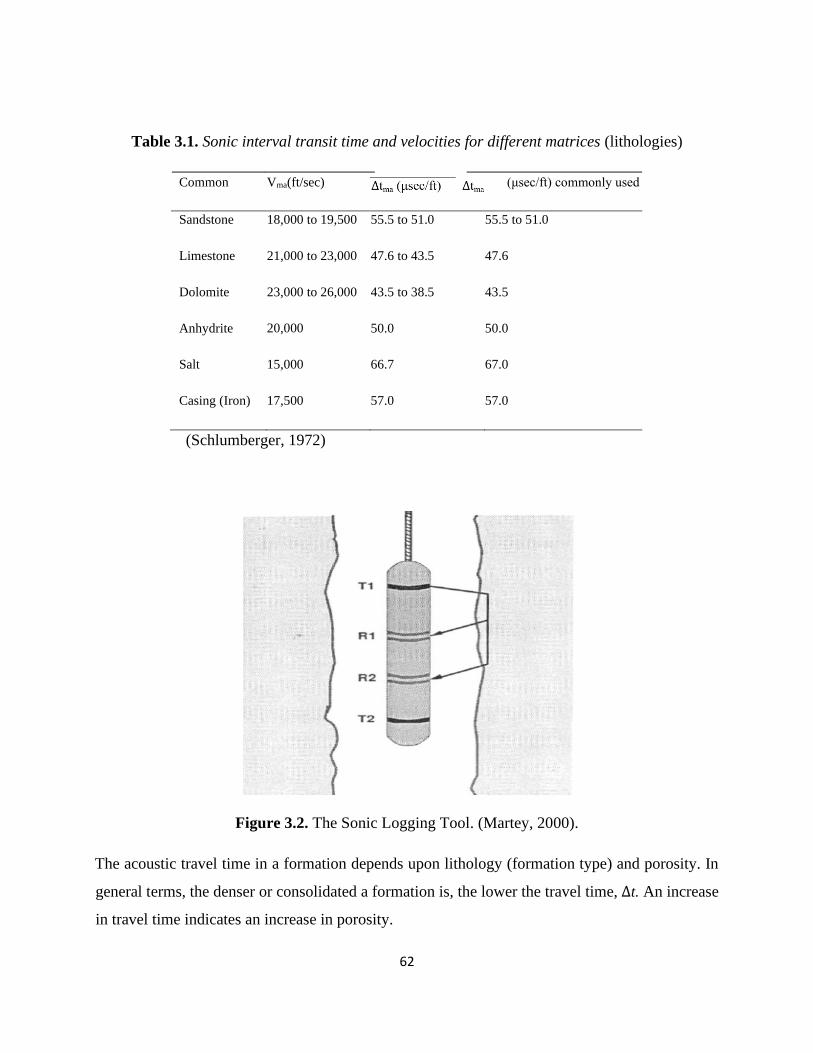
62
Table 3.1. Sonic interval transit time and velocities for different matrices (lithologies)
Common Vma(ft/sec) (μsec/ft) commonly used
Sandstone
Limestone
Dolomite
Anhydrite
Salt
Casing (Iron)
18,000 to 19,500
21,000 to 23,000
23,000 to 26,000
20,000
15,000
17,500
55.5 to 51.0
47.6 to 43.5
43.5 to 38.5
50.0
66.7
57.0
55.5 to 51.0
47.6
43.5
50.0
67.0
57.0
(Schlumberger, 1972)
Figure 3.2. The Sonic Logging Tool. (Martey, 2000).
The acoustic travel time in a formation depends upon lithology (formation type) and porosity. In
general terms, the denser or consolidated a formation is, the lower the travel time, ∆t. An increase
in travel time indicates an increase in porosity.
63
a. Wyllie average equation for uncompacted sands is given by (Asquith and Gibson, 1982)
as:
pmafl
ma
sonicC
IX
tt
tt
−
−=
log (3.8)
where 𝐶𝑝 = 𝛥𝑡𝑠ℎ ×𝐶
100
where: ∅sonic = sonic derived porosity, fraction, ∆tlog = sonic log reading of formation, μs/ft
= Interval transit time of formation/matrix material, ∆tfl = interval transit time of fluid
(189 corresponding to a fluid velocity of about 5300ft/s), CP = empirical correction factor/
compaction factor, ∆tsh = transit time of adjacent-shale C = a constant which is normally 1.0
(Asquith and Gibson, 1982).
Density log: The density tool measures the number of electrons that is related to the true bulk
density of the formation, using a pad mounted chemical source of gamma radiation which emits
medium energy gamma rays of about 66 MeV (Geoservices, 2004; Asquith and Gibson, 1982). At
each collision with formation electrons, some energy is lost. This is collision is (known as Compton
scattering), thereby affecting the amount of gamma rays being detected at the receivers. The
receivers are two shielded gamma ray detectors (known as Geiger counters which automatically
compensate for mud cake and small borehole irregularities). Density response is based on rock
matrix, porosity and pore fluids in their relative proportions (Figure 3.3).
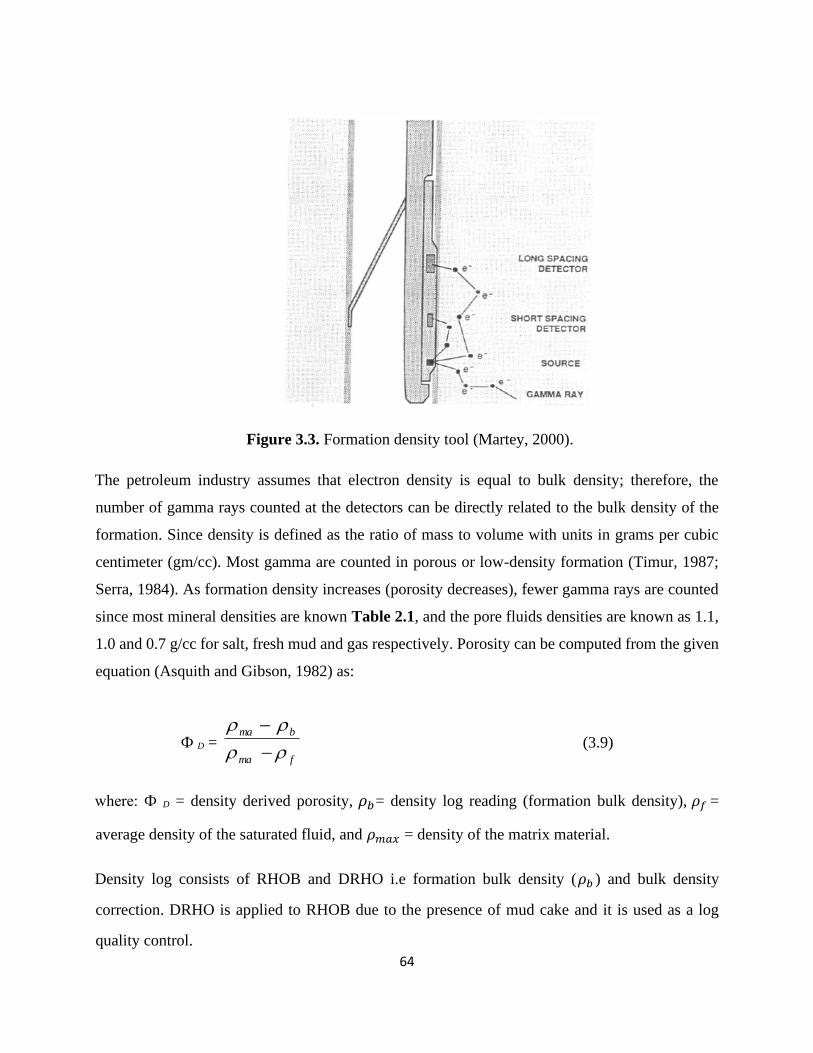
64
Figure 3.3. Formation density tool (Martey, 2000).
The petroleum industry assumes that electron density is equal to bulk density; therefore, the
number of gamma rays counted at the detectors can be directly related to the bulk density of the
formation. Since density is defined as the ratio of mass to volume with units in grams per cubic
centimeter (gm/cc). Most gamma are counted in porous or low-density formation (Timur, 1987;
Serra, 1984). As formation density increases (porosity decreases), fewer gamma rays are counted
since most mineral densities are known Table 2.1, and the pore fluids densities are known as 1.1,
1.0 and 0.7 g/cc for salt, fresh mud and gas respectively. Porosity can be computed from the given
equation (Asquith and Gibson, 1982) as:
Ф D = fma
bma
−
− (3.9)
where: Ф D = density derived porosity, 𝜌𝑏= density log reading (formation bulk density), 𝜌𝑓 =
average density of the saturated fluid, and 𝜌𝑚𝑎𝑥 = density of the matrix material.
Density log consists of RHOB and DRHO i.e formation bulk density (𝜌𝑏 ) and bulk density
correction. DRHO is applied to RHOB due to the presence of mud cake and it is used as a log
quality control.
65
3.3.4 Determination of elastic constants from Petrophysical logs
In the absence of core samples for laboratory testing to obtain geomechanical parameters for
solving related geomechanical problems associated with drilling, well design and production
management. There are numerous empirical relations established which relate rock strength to
measured parameters derived from petrophysical logs (Zoback, 2007). These relations are based
on the fact that, many factors affecting rock strength also affect elastic moduli and other
petrophysical parameters. Most established empirical relation for determination of rock strength
from geophysical logs utilize P-wave and S-wave velocity and Young modulus (E) derived from
𝑉𝑃and density data (Zoback, 2007).
The determinations of elastic properties are possible from mechanical properties log (sonic) which
in turn are used to estimate the formation strength for well engineering. The mechanical properties
logs give a quantitative means for the identification of sedimentary rocks that are strong enough to
produce hydrocarbon without producing sand (Tixier, Loveless and Anderson, 1975). The
correction of dynamic elastic modulus calculated from sonic and density logs, necessitated the
elastic properties of a formation to be categorized as static or dynamic modulus, depending on the
way they were determined in the laboratory or in the field. The elastic properties derived from
experiments conducted in the laboratory on core are called static constant; whereas, the elastic
properties determined or estimated using acoustic log and sometimes ultrasonic wave velocities on
core in the laboratory or indirect measurement through well logging techniques are called dynamic
constant (Oluyemi, 2007).
Well logging utilizes empirical relations for its derivative of elastic constants. Poor laboratory and
inadequate process coupled with the parameters used for the calculations of elastic properties are
the main reason for the difference observed between static and dynamic properties. Static and
dynamic constants’ values in an ideal elastic material are constants and linearity concept is obeyed.
However, in friable sand (unconsolidated sand), the reverse is the case, as the dynamic constant
values are constantly higher than static constant values at low confining stress. Rocks at low
confining stress have nonlinear stress-strain relationships (Serra, 1984) while at high confining
stresses rock behavior is more linear or elastic hence, both static and dynamic constants have
66
correlation (Jones et al., 1992). Tixier, Loveless and Anderson (1975) concluded that in practice,
dynamic constants from wire line logs when evaluating friable sand gives better results than static
because the measurement are made under in situ conditions and fairly represent the confining stress
in the formation of interest.
For the determination of Young modulus and Poisson’s ratio, a good reliable measurement for
density, compressional and shear wave velocity are desirable (Economides and Nolte, 2000). For
intervals where the shear velocity is not present or missing, a synthetic model travel times can be
used for the estimation of compressional and shear wave (Simm and Bacon, 2014). However, care
should be taken. Gartner’s relation is handy in the transformation of sonic or density logs for the
purposes of replacing missing sections. Because, in many rocks, compressional velocity and bulk
density have a positive relationship, so that as velocity increases so density increases. Gartner et
al. (1974) developed a copy (series of brine- saturated lithology dependent relation of the form;
(3.10)
where, ρ is the density, Vp is the P-wave velocity, d is a magnitude constant and f is the shape
constant.
Bai and Li (2012) demonstrated that because of the intense need for interpretation of mechanical
properties of rock formation, can also be derived from density using Gardner’s method as:
(3.11)
where 357.346 is Gardner coefficient.
In addition, Castagna et al. (1985) demonstrated that in the absence of shear log in old wells, shear
velocity needs to be predicted from log measurement since generally there is a strong lithology
dependent, and basically pressure independent; optimistic correlation between compressional and
shear velocity had been established from collection of data sets.
Therefore, Greenberg and Castagna (1992) defined four empirical equations which give good
trends for predicting Vs occurring in brine bearing lithologies as follows:
67
Sandstone : = 0.8042 - 0.8559 (3.12)
Limestone : + 1.016𝑉𝑃 – 1.0305 (3.13)
Dolomite : = 0.58321 – 0.07775 (3.14)
Shale : = 0.7697 – 0.86735 (3.15)
where, and 𝑉𝑝 are in km/s.
However, due to the significant variation that can occur using empirical relations for Vs prediction
in different sandstone lithologies Vs could be higher than that predicted by the sand line (Sim and
Bacon, 2004; Smith, 2011) including clean quartz and glauconitic sands. Therefore, Murphy et al.
(1993) developed an equation for clean sand prediction as = 0.802 – 0.75.
Young’s modulus
The strength modulus was estimated from acoustic log reading of the travel time of compressional
and shear waves using empirical relations for it computation expressed as;
Young’s modulus (E) = unit in MPa (3.16)
where , , and have their usual meaning (Omar 2015)
Shear modulus
The rigidity modulus was estimated from bulk density of the formation and acoustic shear
velocity Vs through the empirical relation given by (Omar, 2015) as:
Shear modulus (G) = unit in Pascal (3.17)
Bulk Modulus
Compressibility modulus can be calculated from the Young’s modulus and Poisson’s ratio
coefficient through the empirical relation given by (Economides and Nolte, 2000; Timur, 1987)
as:
68
K unit in Pascal or MPa (3.18)
Poisson’s ratios
The plastic modulus was computed from acoustic measurements of the compressional wave and
shear wave velocities using the empirical equation by (Omar, 2015) expressed as:
Poisson’s ratio (ν) dimensionless unit (3.19)
3.4 In-situ stress estimation
Understanding of the in-situ stress magnitudes and their directions existing at depth in the
subsurface have lot of applications in petroleum geomechanics. This comprehension assists in
predicting and solving geomechanical related issues such as sand production determination,
estimation of fracture gradient, casing design, compaction, subsidence, fault reactivation, and rock
failure investigations (Maleki et al. 2014; Addis and Yassir, 1996; Oyeneyin, 2015). This is
because reservoir rocks/formations are under constant forces either from tectonic forces,
gravitational, geological process resulting to fault or folds, diapirs and mechanical contracts
(Oluyemi, 2007; Oyeneyin, 2015).
Stress states are characterized by three principal in-situ stresses namely vertical or overburden
stress, principal maximum horizontal stress and minimum horizontal stress (Economides and
Nolte, 2000). The orientations of these stresses depend on the normal, thrust and strike-slip fault
regimes (stress regimes). These stresses are estimated from geophysical logs in this study. It is
beneficial to recognize these stresses to address geomechanical reservoir description for
development.
3.4.1 Vertical stress determination
The vertical or overburden stress is the stress acting on the reservoir formation due to the load of
the overlying beds in normal faulting regimes (Jones et al., 1992; Abdideh and Ahmadifar, 2013)
69
They act in downward direction. This stress is computed as an integral of the rock density to the
depth of interest from density log using equation (2.9) expressed as (Jones et al., 1992). Vertical
stress
𝜎𝑣 = ∫ 𝜌𝑔 ℎ
ℎ
0
For onshore, the vertical or overburden stress is calculated by the expression given by (Omar,
2015) as:
or MPa.
where is the vertical stress; ρ is the formation bulk density read off from density log, g is
acceleration due to gravity and h is the depth of interest.
3.4.2 Minimum horizontal stress determination (Shmin)
Successive field development requires an accurate petroleum geomechanics evaluation for the
understanding of the minimum horizontal stress which is essential for the assessment of sand
production, hydraulic fracturing, fault reactivation and wellbore stability (Jamshidian et al., 2017).
The minimum horizontal stress can be estimated or measured from two techniques namely, indirect
or direct methods from field data such as wireline logs through (viz) empirical correlations and
well tests; leak of test (LOT) conducted in prior wells and from core data respectively (Jamshidian
et al., 2017; Abdideh and Ahmadifar, 2013). It is very important to note that, tectonic stress and
pore pressure caused and controlled the variations in magnitudes and orientations of the minimum
horizontal stress Shmin in sedimentary basins (Adewole and Healy, 2013). The study area has been
reported to be over pressured, therefore, this inform the empirical relation to be applied. In this
study the minimum horizontal stress was evaluated using the proposed Ahmed et al. (1991)
equation given as:
unit in MPa (3.20)
70
where: is the overburden stress, ν is the Poisson’s ratio, is the pore pressure, α is the Biot’s
constant and Shmin is the minimum horizontal stress.
The Biot’s constant can be estimated from the (Schlumberger, 1985) expression given as:
α = (3.21)
where: is the bulk modulus of the material, 𝐾𝑟 is the bulk of the rock constituents, 𝐶𝑟 is the
matrix compressibility and is the rock bulk compressibility. The computation of
compressibility from , ∆𝑡𝑐 and ∆𝑡𝑠 of bulk rock and matrix.
The coefficient of earth pressure at rest Ko can be computed from the expression given by
(Economides and Nolte, 2000) as:
(3.22)
It can also be written in terms of effective stress when two principal stresses are equal in horizontal
plane as:
(3.23)
Where: is the vertical effective stress, is the minimum horizontal effective stress and is
the matrix or earth pressure coefficient at rest accounting for vertical stress at depth.
3.4.3 Maximum horizontal stress determination (Shmax)
Among the three in situ principal stresses used to define the full stress tensors existing at depth
explained in this study, the most difficult to estimate is the maximum horizontal stress (SHmax)
tensors (Adewole and Healy, 2013; Maleki et al., 2014). Its determination depends on the
comprehensive knowledge of the pore pressure, minimum horizontal stress, vertical stress, static
Young’s modulus and Poisson’s ratio (Maleki et al., 2014; Jamshidian et al., 2017). There are
numerous empirical relations that exist which can be used to estimate maximum and minimum
stress (Zoback, 2007) but in this study the following relations equations 3.20-3.24 were used.
71
The estimation of the magnitudes of the major and minor principal stresses (i.e maximum and
horizontal) were calculated from using (Ostadhassan et al., 2012; Holbrook et al., 1993)
Poroelastic model expressed as:
unit in MPa (3.24)
where: ν is Poisson’s ratio, is the vertical or overburden stress, pore pressure, α is Biot
constant, is the static Young’s moduli, are strain at maximum and minimum
horizontal stress directions (Maleki et al., 2014). The deformation (strain) in the maximum and
minimum horizontal directions is given by (Kidambi and Kumar, 2016) equation as:
(3.25)
(3.26)
To obtain the Young’s modulus static constant from the dynamic constant, the dynamic moduli
must be converted using the relation established by (Seyed and Aghighi, 2015) expressed as:
= 0.731 - 2.337 (3.27)
where 0.731 and 2.337 are Seyed and Aghighi constants obtained from laboratory experiment on core
and applied for static correction of elastic constant.
3.4.4 Pore pressure Estimation
According to Schlumberger glossary of terms (2018), the pressure exerted by a column of fluid or
water in the pore spaces from earth surface or sea level through the formation’s depth is called
pore pressure or formation pressure. When this pressure is at equilibrium that is it act equally in
all direction with respect to the principal stresses the formation is said to have hydrostatic pressure.
This is computed in this study using equation (2.8) expressed by Jones et al. (1992) and (Omar,
2015) relation as follows:
𝑃𝑃 = ∫ 𝜌𝑓𝑔 ℎ
ℎ
0
72
or
(3.28)
where, g is the acceleration due to gravity, is the pore pressure, h is the depth.
3.4.5 Stress (Pressure/depth) gradients
i. Overburden gradient estimation
Knowledge of overburden gradient is necessary in oil field operation and development. It is meant
for the evaluation of formation pressure and for calculation of fracture gradient (Geoservices,
2004; Addis and Yassir, 1996). In this study, the overburden gradient is computed by averaging
density derived from wireline density log over the intervals or depth of interest using the expression
of (Omar, 2015) relation as follows:
Overburden gradient (OVBG) = 𝜎𝑣
ℎ Psi/ft (3.29)
where, is the vertical stress, h is the depth.
ii Fracture gradient estimation (FG)
To avoid the unprecedented incident of formation fracturing and opening of pre-existed fault and
fissures which result to very expensive and catastrophic lost circulation issue in a wellbore,
accurate prediction of formation fracture gradient is required (Zhang and Yin, 2017; Tiab and
Donaldson, 2012). It is very important to note that rocks Poisson’s ratio, overburden stress gradient
and pore pressure are the main factors influencing fracture pressure gradient (Zhang and Yin, 2017;
Tiab and Donaldson, 2012). The choice of methods to be used for the calculation of this fracture
gradient differs in the oil and gas industry as there is no consensus method. Some pore pressure
specialists adopt the use of minimum stress gradient for fracture estimation while others employed
73
fracture initiation pressure gradient or maximum leak off tests (Zhang and Yin, 2017). This can be
estimated according to Tiab and Donaldson (2012) as:
(3.30)
where, FG is the fracture gradient, D is the depth, is the pore pressure, is the overburden
pressure, is the Poisson’s ratio and is the Biot constant.
iii Pore pressure gradient estimation (PG)
The pressure gradient is calculated by dividing the pore pressure at any given point in a formation
by the corresponding depth.
(3.31)
3.5 Rock strength determination
Rock strength defines the peak stress level at which rock sample fails. Rock strength depends on
the strength of intact rock and strength of rock discontinuities. Therefore, understanding the stress
distribution and redistribution is essential for well planning (Economides and Nolte, 2000; Jumikis,
1983).
3.5.1 Unconfined Compressive strength (USC)
Rock strength can be measured by unconfined compressive strength (UCS), that is, the peak value
of stress that can be withstood by rock before its failure (deformation) when subjected to
compressive force with no radial stress or lateral constraint (Goodman, 1989). There are several
types of tests conducted for UCS but the most widely used tests are uniaxial compressive and
triaxial compressive tests. Prior understanding of the characteristic of failure model as applicable
to rock strength requires certain and capable failure criterion to be applied. Knowledge of strength
of rock is essential for construction and design of drilling, production and secondary recovery
74
program for reservoir development (Sylvester and Lader, 2015). It aids proper simulation of the
reservoir based on the availability of geomechanical data.
Mechanical properties and behavior of rock strength depends on elastic moduli values at the
interval of interest. The UCS of the study field can be estimated from geophysical logs through the
empirical relations established for the Niger delta by Salawu, Sanaee and Onabanjo (2016). These
correlations are between UCS and formation slowness, Poisson’s ratio, and Young’s modulus for
upper Agbada formation. They are:
UCS = 1 ∆ (3.32)
UCS = 0.2017 (3.33)
UCS = 0.3966 E+1.1956 (3.34)
where E is the young modulus of Niger Delta, UCS is the unconfined compressive strength of
rock in the Niger Delta, 𝜐 is the Poisson’s ratio in the Niger Delta and ∆𝑡 is the formation slowness
or interval transit time in the Niger Delta.
3.5.2 Cohesive strength
Cohesion is not a measurable physical quantity although it expresses rock strength. Sometimes
unconfined compressive strength is referred to as cohesive strength since it describes the linear
model or failure envelope line demonstrated by Mohr criterion in terms of the intercept made with
the ordinate axis, when the minimum principal stress is zero, i.e. 0 related to shear stress in
soil mechanics (Jaeger, Cook and Zimmerman, 2007). As a result, the linearized failure line of
Mohr can be expressed as
(3.35)
where; is the shear stress, is cohesive strength of soil, is the coefficient of friction and
is the effective normal stress (Zoback, 2007).
75
3.5.3 Tensile strength ( )
Tensile strength reflects the punching or flexural failure of a thin bed of overlying weak material
that is, it depicts failure under tension (where a weak bed underlies a layer of stiffer rock) (Willie,
1999). Tensile testing is not usually conducted and rarely acceptable in the plan of structures
because tensile strength of fractured rock is efficiently zero. However, direct testing in clean
tension gives the most consistent results. The Brazilian test is also conducted for tensile strength
determination (Oluyemi, 2007).
Again, this not also used in geomechanics for failure analysis because of its magnitude being set
at one-tenth of the which is the average value. When comparing to unconfined compressive
strength its value is lower than to UCS (Serra, 1986). This makes its usefulness unimportant
coupled with the fact that stress at depth is not tensile except caused by induce hydraulic tensile
failure. Tensile failure occurs due to the application of biaxial stress (Tiab and Donaldson, 2012).
In situ rock strength is expressed by (Schlumberger, 1985) as:
and 12 (3.36)
where: is the cohesive strength = (Abijah and Tse, 2016) (3.37)
3.6 Failure Mechanisms
Knowledge of failure mechanism requires the application of well-matched failure criterion. Failure
is caused by the stresses identified as effective stresses experienced by the rock structure. Failure
mechanism describes the simplified models for which rock fails and depicts the real behavior of
rocks under applied forces. These criteria utilize mathematical relations for observed behavior of
rock deformation which is valid for Isotropic rock. Three main failure mechanisms mode have
been reported and observed in uniaxial and triaxial test (Zoback, 2007; Fjaer et al., 2008). They
are shear failure, tensile failure and pore collapse (Fjaer et al., 2008). Other mechanisms are creep,
plastic failure and cohesive failure. During drilling phase, shear and tensile failure mechanisms are
extensively used for wellbore stability analysis (Economides and Nolte, 2000).
76
3.6.1 Shear failure mechanism
The existence of excessive shear stress along some planes in a rock sample or reservoir causes
fracture and fault development (Fjaer et al., 2008) along the failure plane in which two sides of the
plane are in relative motion due to one another in a frictional procedure. Frictional force at play
depends on the attractive force acting to keep the bodies in motion together. Thus, failure occurs
due to the actualization of the critical shear stress called which depend on the normal stress
acting over the failure plane (Fjaer et al., 2008) it can be expressed as:
(3.38)
This equation in a plane describes stable region from unstable region (Fjaer et al., 2008).
The Tresca criterion for shear failure is expressed as:
(3.39)
The above equation (3.39) shows that rock yield when the critical shear stress is attained.
3.6.2 Tensile failure mechanism
This is caused by excessive tensile stress occurrence because of the effective tensile stress across
some plane in the rock exceeding the tensile strength of the formation. It is a characteristic property
of any given rock (Fjaer et al., 2008). Tensile strength of sedimentary formations is too low. It is
localized and inhomogeneous due to its failure pattern which splits along few fault/fracture planes.
Tensile failure criterion which specified conditions and identified failure surface in principal stress
( ) space is written as:
= - To (3.40)
But, for homogeneous rock, the conditions for tensile failure is fulfilled at the lowest principal
stress . The tensile failure criterion becomes
= -To (3.41)
77
3.7 Failure criteria
The empirical relation for rock failure criteria is the expressions of physical hypotheses. This
implies that they are obtained from experiments conducted. These criteria identify how in situ
stress, temperature, time and other factors influence strength of rock (Jumikis, 1983). We use
failure criteria to determine if a rock will yield, flow, buckle, crush, crack or else give way in
services (Goodman, 1989). All failure criteria are dependent on effective stresses.
3.7.1 Mohr Criterion
To appraise rock failure or fracture (i.e. when there is a complete loss of cohesion), the mechanical
conditions which ascertain its failure was first investigated by Coulomb and Navier (1960) whose
study considered the state of failure as shear failure (Jumikis, 1983). In 1900 Mohr reviewed the
work of Coulomb and Navier and incorporated the maximum shear theory as the basis of his failure
criterion (Yona and Warkentin, 1975). The Mohr theory considered shear failure across a plane
and provides a relationship between shear and normal stresses acting on the plane of failure
(Goodman, 1989; Zoback, 2007; Pollard and Fletcher, 2005) as:
where, τ is shearing stress along the plane of failure; and, σ is the normal stress transverse the
plane. The following are the assumptions of the above relation (Amadei 2007):
i. The tensile and compressive strengths of the rock are unequal.
ii. Failure occurs when there is equalization between maximum shear stress and shear
strength of a given rock. In order words, failure takes place when the Mohr envelope is
tangential to the Mohr circle and failure also depends on the major and minor applied
principal stresses (Amadei, 2007).
3.7.2 Mohr Coulomb Failure Criterion
According to Fjaer (2008) Mohr Coulomb criterion is an expansion of the Mohr criterion. Mohr
criterion assumes the reality of a shear curve envelope (Jumikis, 1983). The Mohr Coulomb
78
criterion is an empirical equation which relates the shear strength to normal stress. That is, the
resistance of a rock to fail in shear to the contact forces and friction, to the cohesion that exist
among grains (Jaeger and Cooke, 1979; Aadnoy and Looyeh, 2011). In other words, it states that
the maximum shear stress at which failure occur is equal to the sum of cohesion , normal
stress and coefficient of friction ɸ acting on the failure plane. This criterion characterizes rock
behavior in terms of or and internal friction.
Mohr Coulomb theory seeks to predict the plane on which failure or sliding occurs. Thus, the M-
C criterion is a linear shear of Mohr failure line (Zoback, 2007; Aadnoy and Looyeh, 2011;
Goodman, 1989) given as:
where, τ is the shear stress, is the effective normal stress acting on the grains, is the intrinsic
shear strength of the rock, μ is the coefficient of internal friction (tan ɸ); where ɸ is the angle of
surface sliding (Amadei, 2007; Aadnoy and Looyeh, 2011).
Mohr Coulomb failure criterion describes rock behavior in the middle range of compressive stress
where failure takes place along two conjugate planes at an angle theta with respect to
being parallel to , where is the angle between the normal to the failure plain or envelop and
the direction of .
Because of its well explained and established concepts in simple terms, using few parameters
which can be obtained from laboratory experiment necessitated it wide usage as failure criterion
within the industry (Oyeneyin, 2015; Oluyemi, 2007).
3.8 Cost and Limitation of the study
The technique used in this study can be deployed in the absence of core data to derive elastic
constants. Coring is known to be expensive and cannot be acquired in every well drilled.
Especially, in the Niger Delta only few wells had been cored. Hence, in the absence of core plugs,
the use of dynamic elastic constants was estimated from geophysical logs since acoustic and
density logs which are mechanical logs were run as part of the open-hole logging suite at a
79
reasonable cost (drilling cost). Therefore, wireline techniques could provide a practical, cost
effective method to estimate geomechanical and petrophysical properties. Provided the
calculations made from acoustic and density logs yield accurate estimate of in situ stress and
petrophysical properties where proper adjustment due to drilling fluid is accounted for. The
advantages of this method include; good representative of the confining stress in the reservoirs,
dynamic measurements obtained from wireline logs provide continuous curves that reveal changes
and trends throughout the well penetrated than cores retrieved from the reservoir provides discrete
point properties. Core provide the ground truth and more direct method of determining rock
strength than logging, but precautions are essential.
The followings challenges were found in this study. They are:
1) Fracture orientation data for Wabi field was not made available for construction of the
Mohr circle model.
2) Leak off test (LOT), a test conducted to know the formation integrity, mini and micro
fracture data were not provided for comparing stress information obtained from well logs.
3) The Niger delta basin lack necessary subsurface stress information.
4) Did not have access to Schlumberger wellbore software for prediction of fracture
properties (i.e. cohesion and fracture angle) in Wabi.
5) Above all, core samples data from Wabi field was not given for laboratory testing of elastic
constants and to validate information obtained from wireline logs. Hence, the results herein
are obtained from wireline logs only.
80
CHAPTER 4
Result presentation and discussion
This section deals with the report of this study’s findings and discussion of the analyses of Wabi
field data available from two wells named Wabi 5 and Wabi 11. These two wells were chosen
because of the availability of mechanical elastic logs (i.e. sonic and density) logs in them.
However, petrophysical analyses were made in all the wells in the study field. The assumption
made in this study was that the reservoir rock is isotropic that is, the material exhibits a perfectly
linear stress-strain relationship.
4.1. Data sources (inventory)
Wabi field data inventory was done to identify the availability of petrophysical tools recorded in
each of the four wells which penetrated the formation of interest in the study area. These data
availability check seeks to know the well with the complete sets of petrophysical tools run in them,
for reservoir characterization and geomechanical parameters estimation, Table 4.1. This table
shows data sources denoted as Y (Yes) and N (No) which signifies their availability or not. Logs
suites available in this study are resistivity, density, neutron, gamma ray and sonic logs. Sequel to
this inventory only Wabi 5 and Wabi 11 had the complete set of tools for geomechanical
characterization. However, all the tools available in other Wabi wells are still of importance in use
for petrophysical characterization. Among these data the most significant for this study are sonic
and density logs because their combination gives an insight into the in-situ stress state and
mechanical behavior of rocks especially rock strength (Tiab and Donaldson, 2012; Tixier, Lovely
and Anderson, 1987).
Apart from the tools listed above, other data such as DST/RFT, master logs, X-ray scan of core
and seismic data) were provided or made available for this study based on the original aim and
objectives conceived (i.e to characterize Wabi reservoirs for development). However, slight
changes were made which alter the available data to suit this present study. Therefore, most of the
analyses done in this study are based on empirical correlation through petrophysical techniques
and tools.
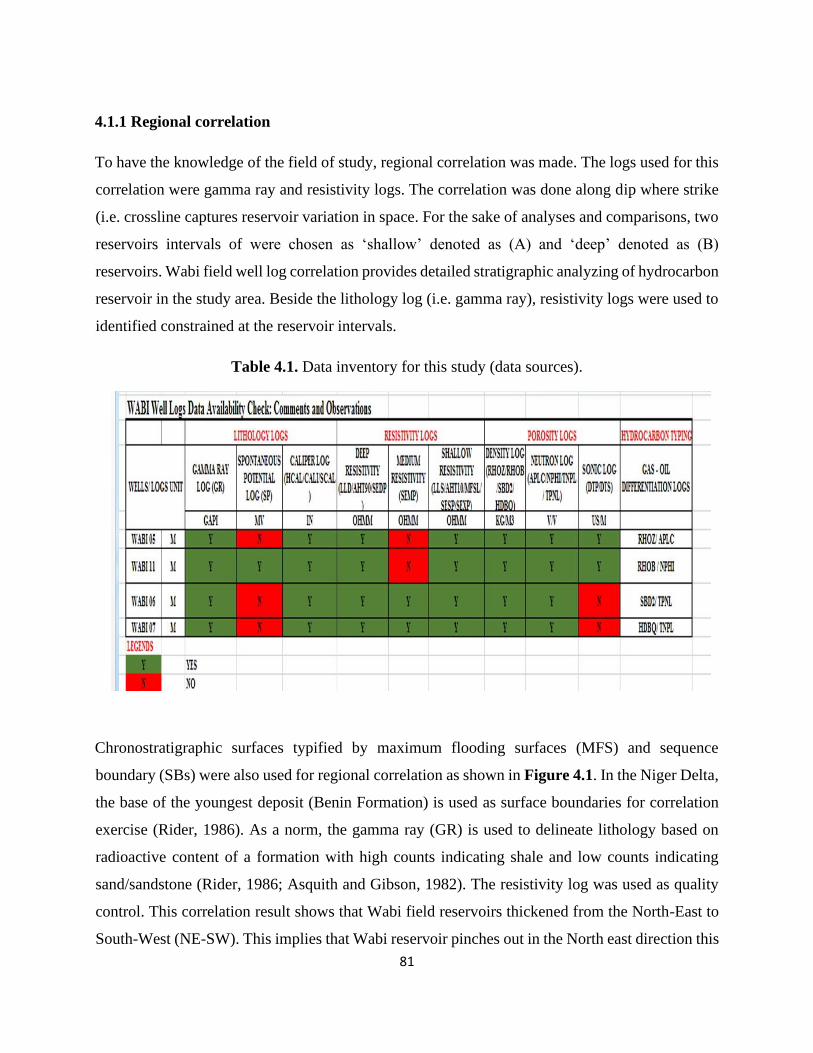
81
4.1.1 Regional correlation
To have the knowledge of the field of study, regional correlation was made. The logs used for this
correlation were gamma ray and resistivity logs. The correlation was done along dip where strike
(i.e. crossline captures reservoir variation in space. For the sake of analyses and comparisons, two
reservoirs intervals of were chosen as ‘shallow’ denoted as (A) and ‘deep’ denoted as (B)
reservoirs. Wabi field well log correlation provides detailed stratigraphic analyzing of hydrocarbon
reservoir in the study area. Beside the lithology log (i.e. gamma ray), resistivity logs were used to
identified constrained at the reservoir intervals.
Table 4.1. Data inventory for this study (data sources).
Chronostratigraphic surfaces typified by maximum flooding surfaces (MFS) and sequence
boundary (SBs) were also used for regional correlation as shown in Figure 4.1. In the Niger Delta,
the base of the youngest deposit (Benin Formation) is used as surface boundaries for correlation
exercise (Rider, 1986). As a norm, the gamma ray (GR) is used to delineate lithology based on
radioactive content of a formation with high counts indicating shale and low counts indicating
sand/sandstone (Rider, 1986; Asquith and Gibson, 1982). The resistivity log was used as quality
control. This correlation result shows that Wabi field reservoirs thickened from the North-East to
South-West (NE-SW). This implies that Wabi reservoir pinches out in the North east direction this

82
gives rise to water injection well placement for enhancement of hydrocarbon recovery in Wabi
field.
Figure 4.1. Regional correlation panel for Wabi field.
4.1.2 Depositional environment
From sequence stratigraphic analysis two depositional environments were identified in Wabi field
as Channel and Tidal flat setting to deltaic plain environment. This confirms with the dominant
depositional environments identified in the Niger Delta (Schlumberger, 1985).
4.1.3 Reservoir delineation for sand production/failure
The study field is a mature field in the onshore Niger Delta which needs to be upgraded for
commercial production of hydrocarbon therein. This onshore field was investigated for the
83
common unconsolidated problem known as sand production found in most tertiary young
formation (Otti and Woods, 2005). No drilling data report was provided to verify the likelihood of
sanding. This drilling report would have partially identified geomechanical problems before hand
to know the mechanical properties and strength of the formation penetrated. In this study, the
identification of weak formations liable to have geomechanical issues was investigated and
evaluated (Tixier, Lovely and Anderson, 1987). To evaluate the formation’s likelihood for
geomechanical problems, several established failure criteria were employed. In this study three (3)
failure criteria were used to recognize the existence of geomechanical related issues in Wabi field
as follows:
i) Rock harness is described by Brinell hardness number (BHN): This is the ratio of applied
force on an indenter to the depth of indentation (Tiab and Donaldson, 2012). The delineation of
the intervals of interest from Wabi 10 and 11 master log descriptions of lithology shows that the
formation is loosely consolidated. The Wabi formation geologic age ranges from Oligocene to
Miocene (Weber and Daukoru, 1985). Based on the BHN classification, this formation has some
cementing materials and moderately cemented which resulted in weak unconfined compressive
strength of the formation. When there is grain to grain stress increase coupled with erosion and
changes in fluid saturation, the cement bond is broken and permits geomechanical issue occurrence
(Oyeneyin, 2015), Appendix C and D.
ii) Depth criterion: This criterion has been documented in several literatures on sand
production prediction in the Niger delta region (Abiola et al., 2014) using depth range to define
the compaction and strength of a formation. The established depth range is 10,000 ftss and well
deeper than 10000ftss. The former indicated that wells drilled and completed within 10,000 ftss
are prone to sand production, whereas the latter demonstrates that wells drilled and completed
deeper than 10,000ftss have lesser sand production problem. Therefore, a trend can be shown for
both cases that compaction increases onshore-ward (i.e. upward) implying that unconsolidation
increases downward towards offshore where we have young depobelts (depocenters).
iii) Sonic log criterion: Acoustic or slowness ( 𝐷𝑇𝑃 and 𝐷𝑇𝑆) profiles were used to differentiate
consolidation from unconsolidated formation to identify formation that would produce sanding.
This criterion used an established threshold to distinguish unconsolidated from consolidated
84
formation (Chang Zoback and Khaksar, 2006; Tixier Loveless and Anderson, 1975). Sonic transit
time in sedimentary basin which measures the compressional wave greater than 110 s/ft and less
than 90 s/ft were used as strength indicator for the characterization of the formation as
unconsolidated and consolidated respectively Figures 4.2-4.6 as well as lithology identification
using ratio (Chang Zoback and Khaksar, 2006).
In addition, interpretation of caliper log showed that Wabi field has related geomechanical
problems to be addressed for safe hydrocarbon infill drilling and exploitation (Abdideh and
Ahmadifar, 2013; Maleki et al., 2014). The description of X-ray scanned of core from Wabi 05
confirmed that the reservoir has numerous fractures or induced fractures caused by moving core
barrels to laboratory, indicated orientation of strike and dip on cores, showed that core plugs have
been taken for further analysis such as special core analysis or routine core analysis Figure 4.7.
The lithology of Wabi is seen as alternation of sand, sandstone and shale popularly known as shaly
sand sequence. Its lithology description is as follows: White-rose, colorless, transparent –
translucent, sub-angular-sub-rounded, fine-coarse, glauconites, calcareous- dolomites cement in
sand and sandstone reservoirs while in shale it is grey-dark, indulated, silty, locally graded to
siltstone and fissile Appendix C.
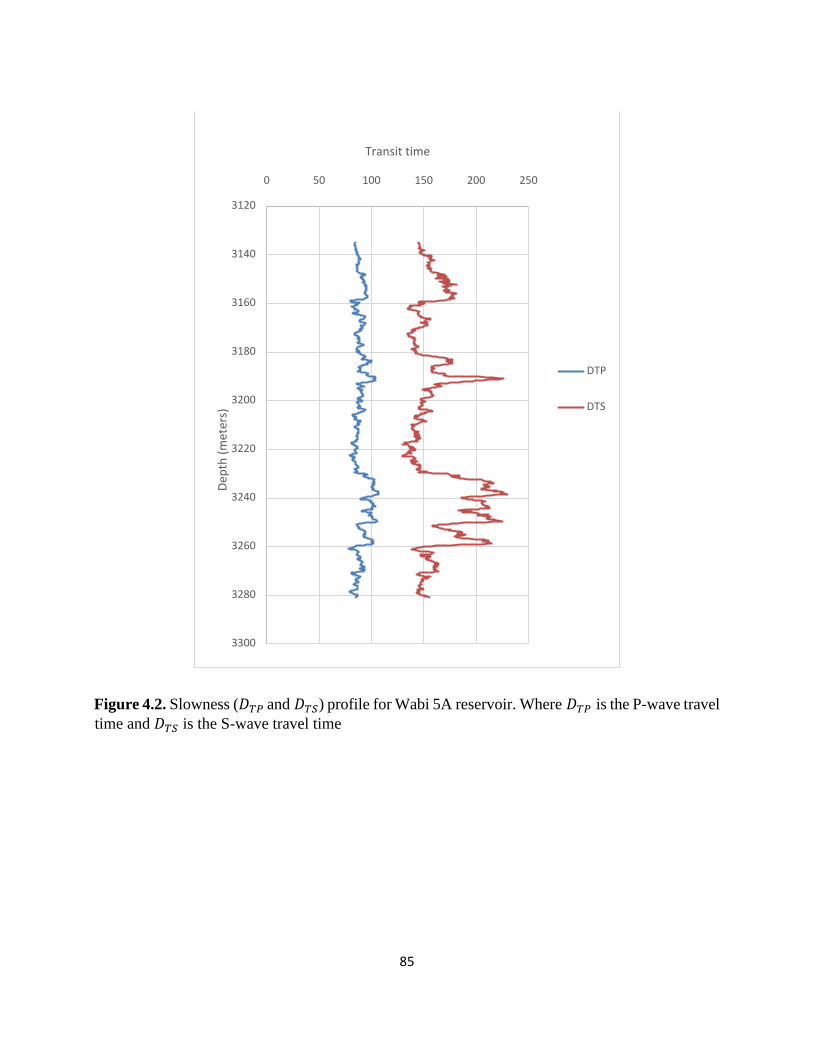
85
Figure 4.2. Slowness (𝐷𝑇𝑃 and 𝐷𝑇𝑆) profile for Wabi 5A reservoir. Where 𝐷𝑇𝑃 is the P-wave travel
time and 𝐷𝑇𝑆 is the S-wave travel time
3120
3140
3160
3180
3200
3220
3240
3260
3280
3300
0 50 100 150 200 250
Transit time
DTP
DTS
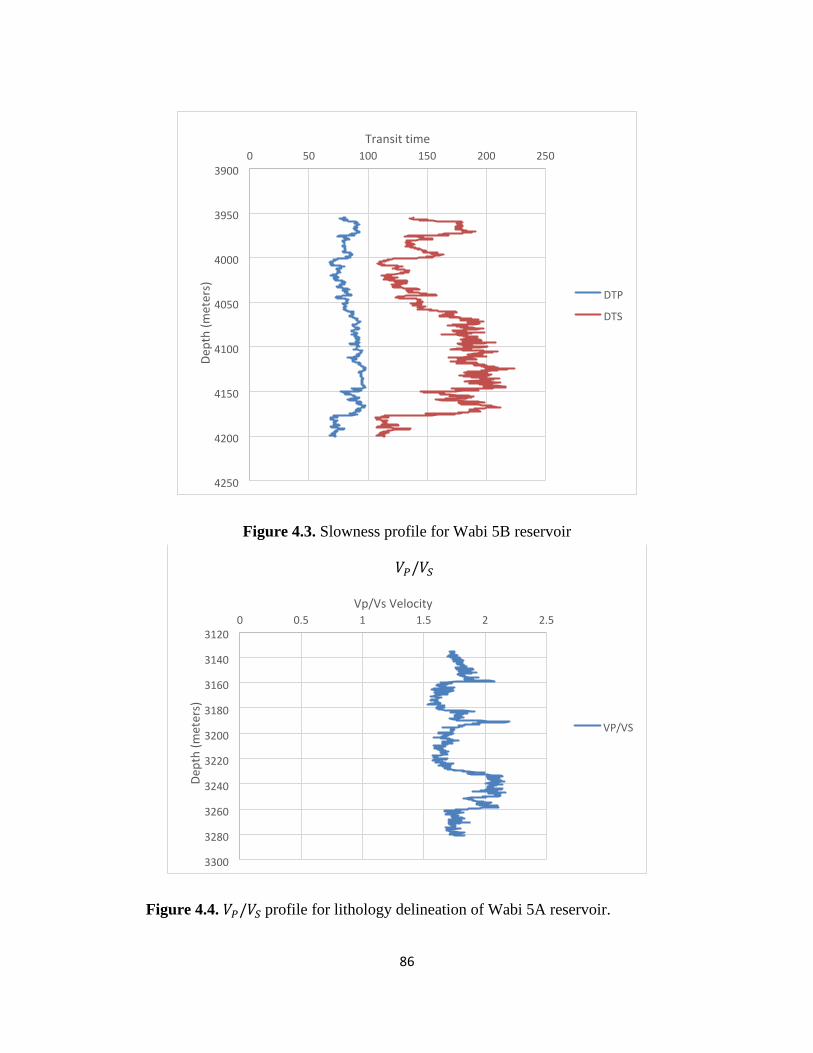
86
Figure 4.3. Slowness profile for Wabi 5B reservoir
Figure 4.4. 𝑉𝑃/𝑉𝑆 profile for lithology delineation of Wabi 5A reservoir.
3900
3950
4000
4050
4100
4150
4200
4250
0 50 100 150 200 250
Transit time
DTP DTS
3120
3140
3160
3180
3200
3220
3240
3260
3280
3300
0 0.5 1 1.5 2 2.5
Vp/Vs Velocity
𝑉𝑃/𝑉𝑆
VP/VS
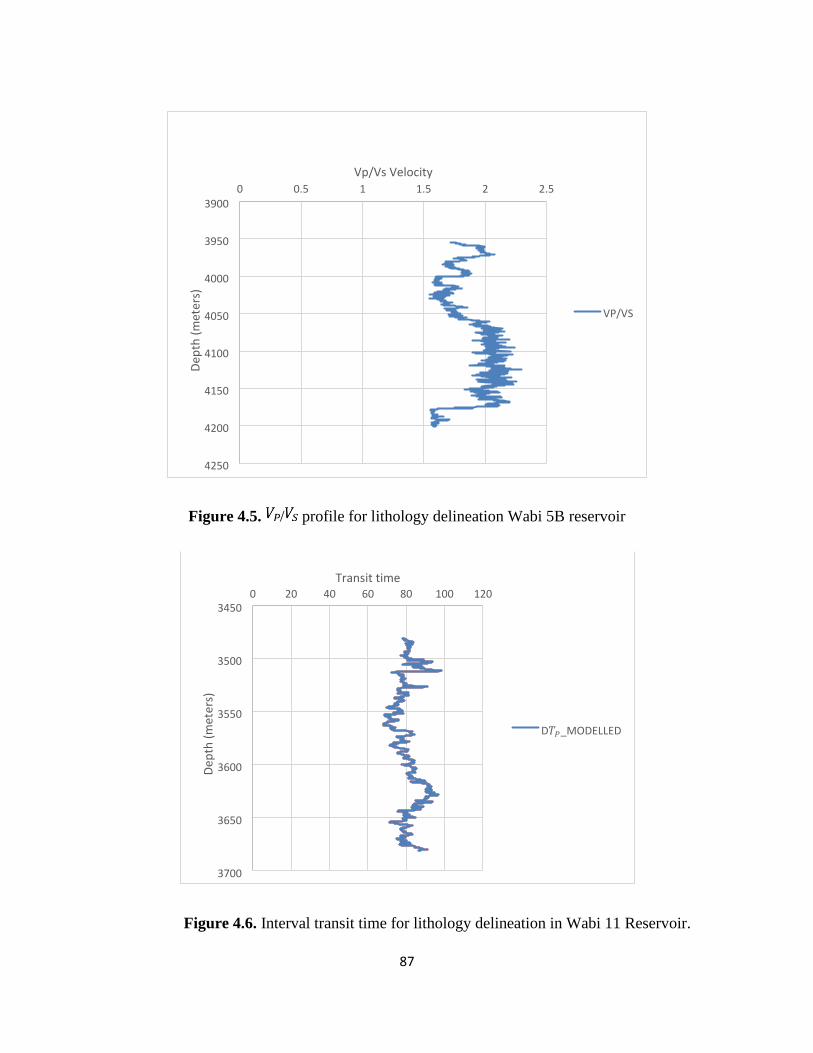
87
Figure 4.5. / profile for lithology delineation Wabi 5B reservoir
Figure 4.6. Interval transit time for lithology delineation in Wabi 11 Reservoir.
3900
3950
4000
4050
4100
4150
4200
4250
0 0.5 1 1.5 2 2.5
Vp/Vs Velocity
VP/VS
3450
3500
3550
3600
3650
3700
0 20 40 60 80 100 120
Transit time
D𝑇𝑃_MODELLED
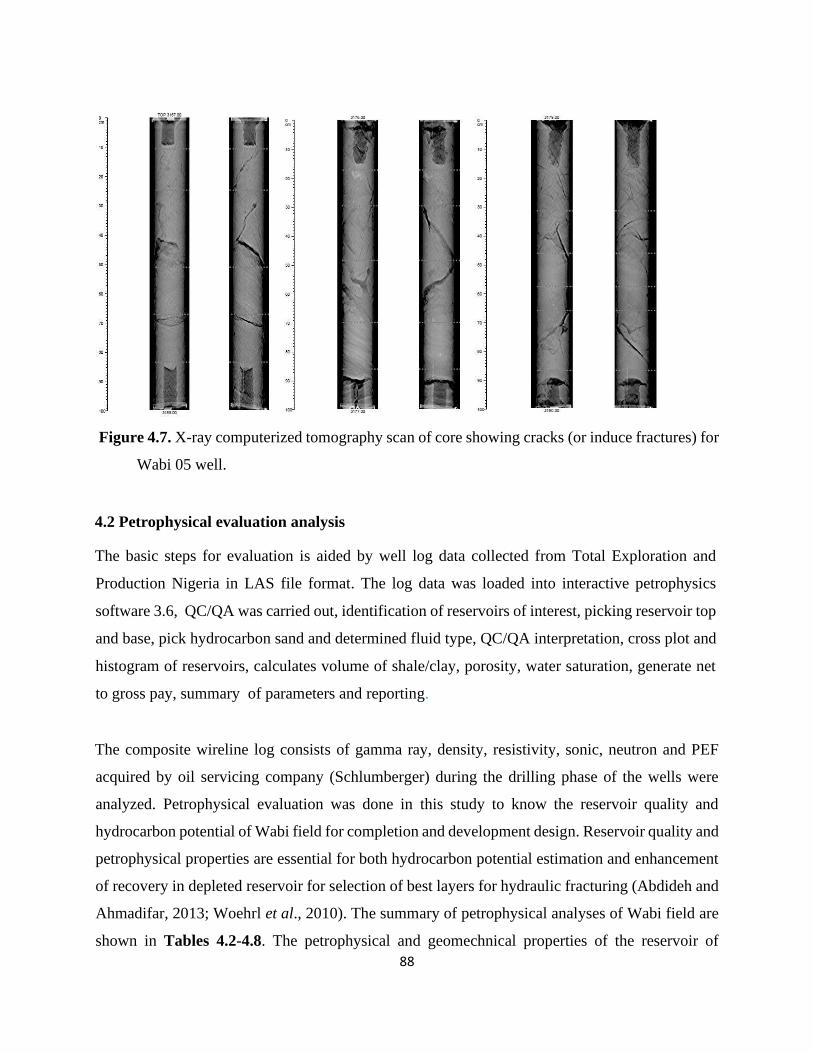
88
Figure 4.7. X-ray computerized tomography scan of core showing cracks (or induce fractures) for
Wabi 05 well.
4.2 Petrophysical evaluation analysis
The basic steps for evaluation is aided by well log data collected from Total Exploration and
Production Nigeria in LAS file format. The log data was loaded into interactive petrophysics
software 3.6, QC/QA was carried out, identification of reservoirs of interest, picking reservoir top
and base, pick hydrocarbon sand and determined fluid type, QC/QA interpretation, cross plot and
histogram of reservoirs, calculates volume of shale/clay, porosity, water saturation, generate net
to gross pay, summary of parameters and reporting.
The composite wireline log consists of gamma ray, density, resistivity, sonic, neutron and PEF
acquired by oil servicing company (Schlumberger) during the drilling phase of the wells were
analyzed. Petrophysical evaluation was done in this study to know the reservoir quality and
hydrocarbon potential of Wabi field for completion and development design. Reservoir quality and
petrophysical properties are essential for both hydrocarbon potential estimation and enhancement
of recovery in depleted reservoir for selection of best layers for hydraulic fracturing (Abdideh and
Ahmadifar, 2013; Woehrl et al., 2010). The summary of petrophysical analyses of Wabi field are
shown in Tables 4.2-4.8. The petrophysical and geomechnical properties of the reservoir of
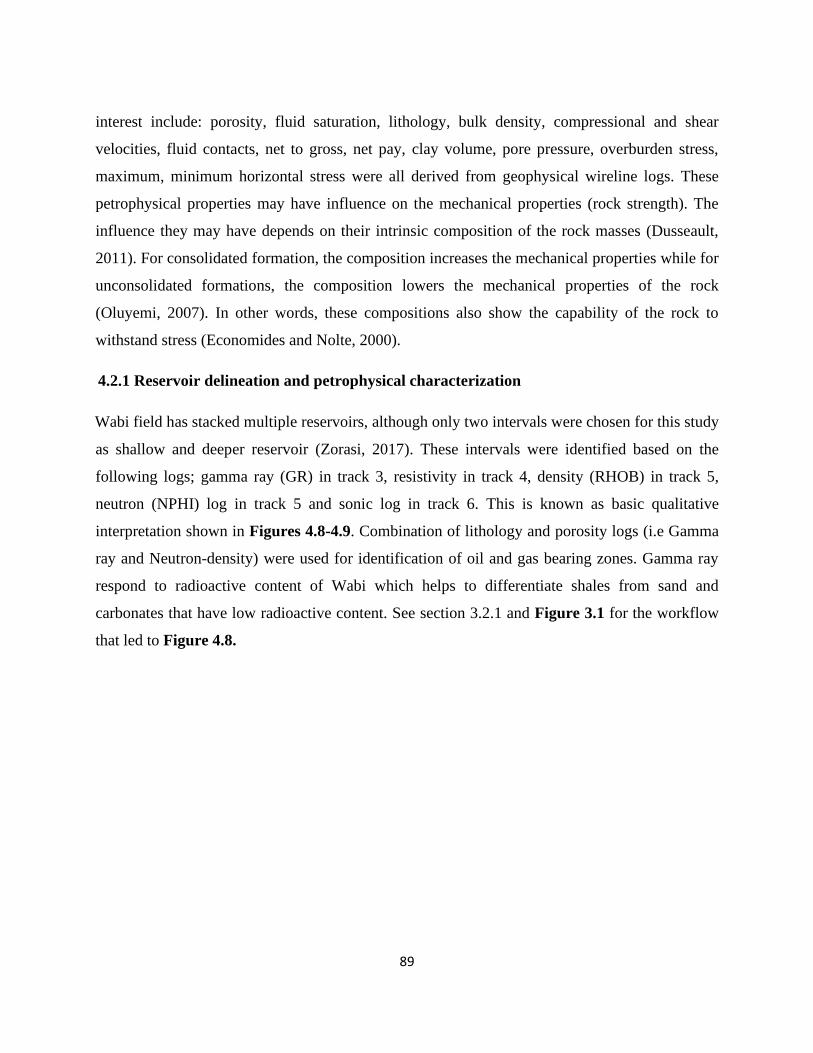
89
interest include: porosity, fluid saturation, lithology, bulk density, compressional and shear
velocities, fluid contacts, net to gross, net pay, clay volume, pore pressure, overburden stress,
maximum, minimum horizontal stress were all derived from geophysical wireline logs. These
petrophysical properties may have influence on the mechanical properties (rock strength). The
influence they may have depends on their intrinsic composition of the rock masses (Dusseault,
2011). For consolidated formation, the composition increases the mechanical properties while for
unconsolidated formations, the composition lowers the mechanical properties of the rock
(Oluyemi, 2007). In other words, these compositions also show the capability of the rock to
withstand stress (Economides and Nolte, 2000).
4.2.1 Reservoir delineation and petrophysical characterization
Wabi field has stacked multiple reservoirs, although only two intervals were chosen for this study
as shallow and deeper reservoir (Zorasi, 2017). These intervals were identified based on the
following logs; gamma ray (GR) in track 3, resistivity in track 4, density (RHOB) in track 5,
neutron (NPHI) log in track 5 and sonic log in track 6. This is known as basic qualitative
interpretation shown in Figures 4.8-4.9. Combination of lithology and porosity logs (i.e Gamma
ray and Neutron-density) were used for identification of oil and gas bearing zones. Gamma ray
respond to radioactive content of Wabi which helps to differentiate shales from sand and
carbonates that have low radioactive content. See section 3.2.1 and Figure 3.1 for the workflow
that led to Figure 4.8.
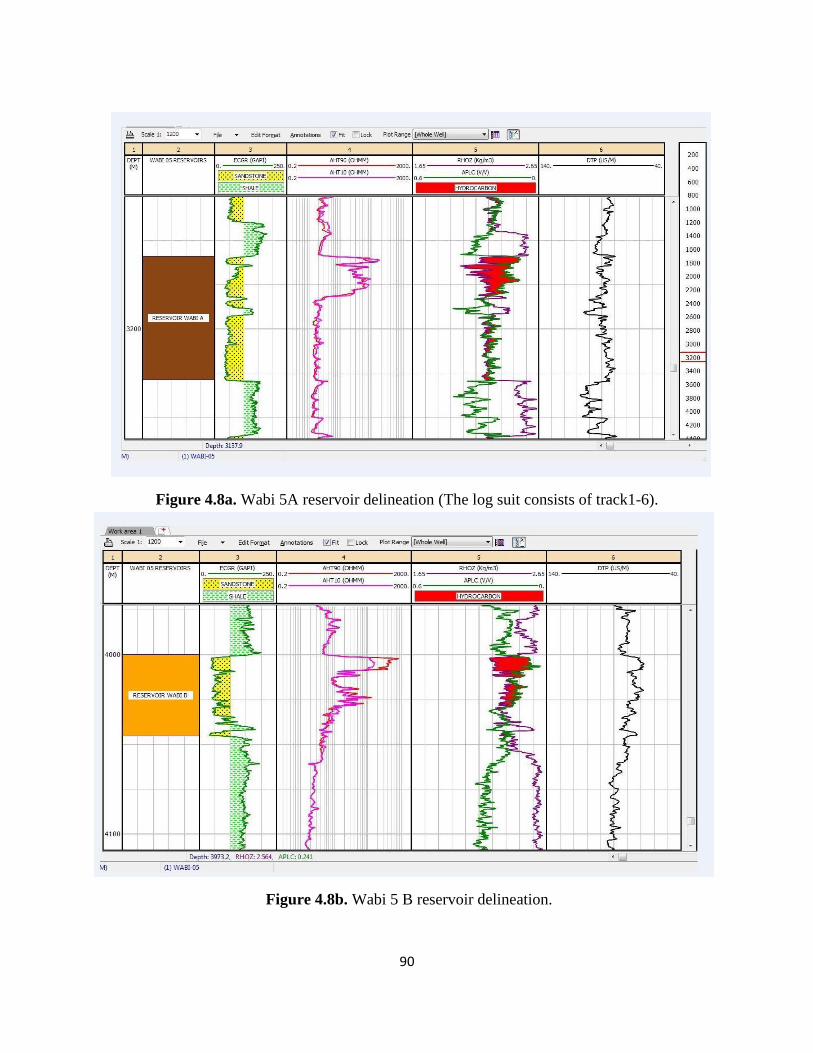
90
Figure 4.8a. Wabi 5A reservoir delineation (The log suit consists of track1-6).
Figure 4.8b. Wabi 5 B reservoir delineation.
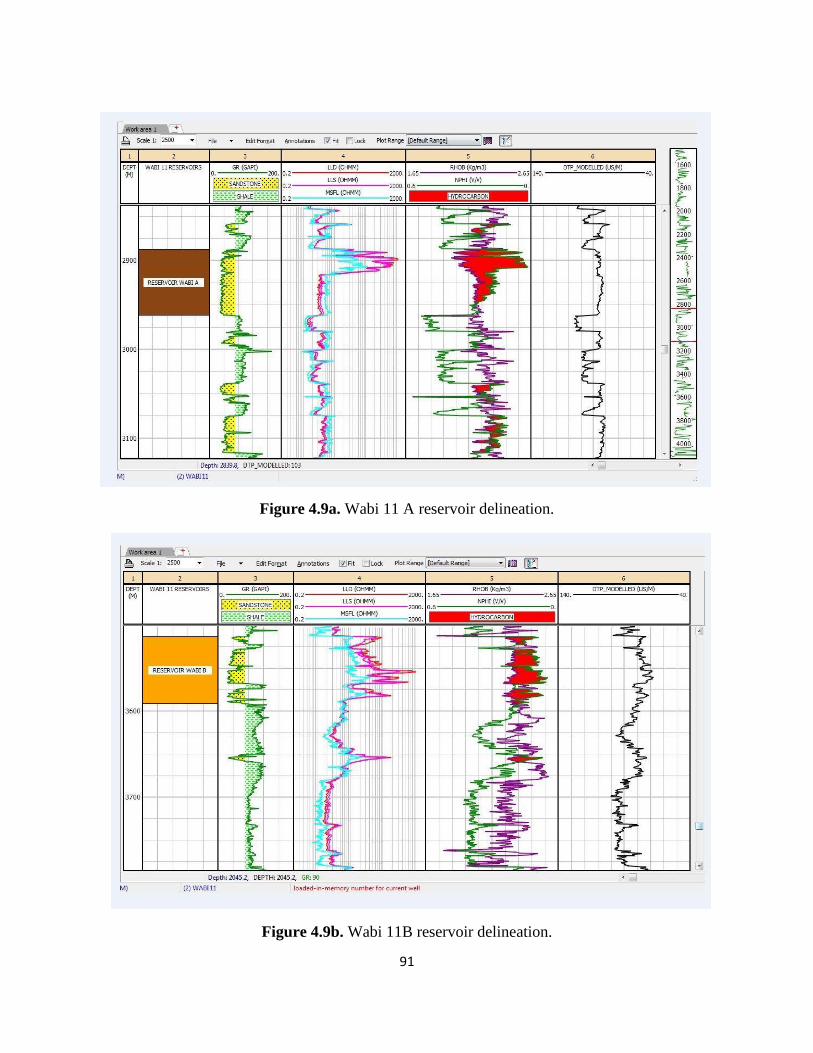
91
Figure 4.9a. Wabi 11 A reservoir delineation.
Figure 4.9b. Wabi 11B reservoir delineation.
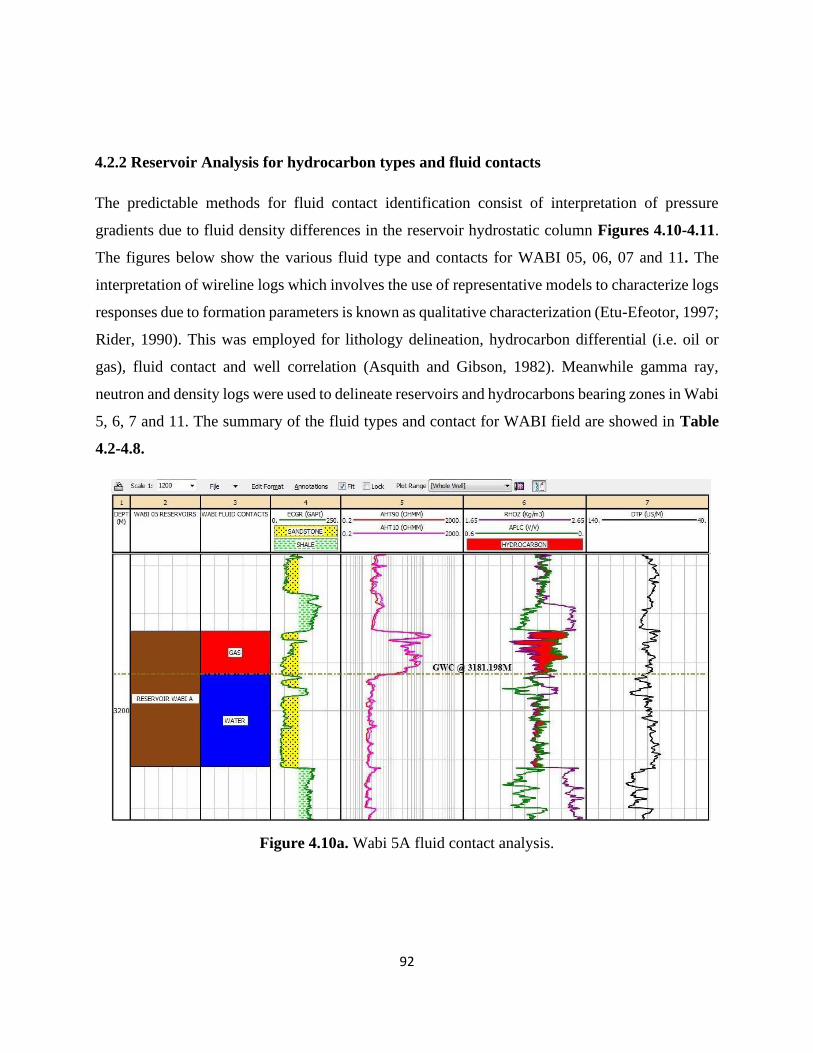
92
4.2.2 Reservoir Analysis for hydrocarbon types and fluid contacts
The predictable methods for fluid contact identification consist of interpretation of pressure
gradients due to fluid density differences in the reservoir hydrostatic column Figures 4.10-4.11.
The figures below show the various fluid type and contacts for WABI 05, 06, 07 and 11. The
interpretation of wireline logs which involves the use of representative models to characterize logs
responses due to formation parameters is known as qualitative characterization (Etu-Efeotor, 1997;
Rider, 1990). This was employed for lithology delineation, hydrocarbon differential (i.e. oil or
gas), fluid contact and well correlation (Asquith and Gibson, 1982). Meanwhile gamma ray,
neutron and density logs were used to delineate reservoirs and hydrocarbons bearing zones in Wabi
5, 6, 7 and 11. The summary of the fluid types and contact for WABI field are showed in Table
4.2-4.8.
Figure 4.10a. Wabi 5A fluid contact analysis.
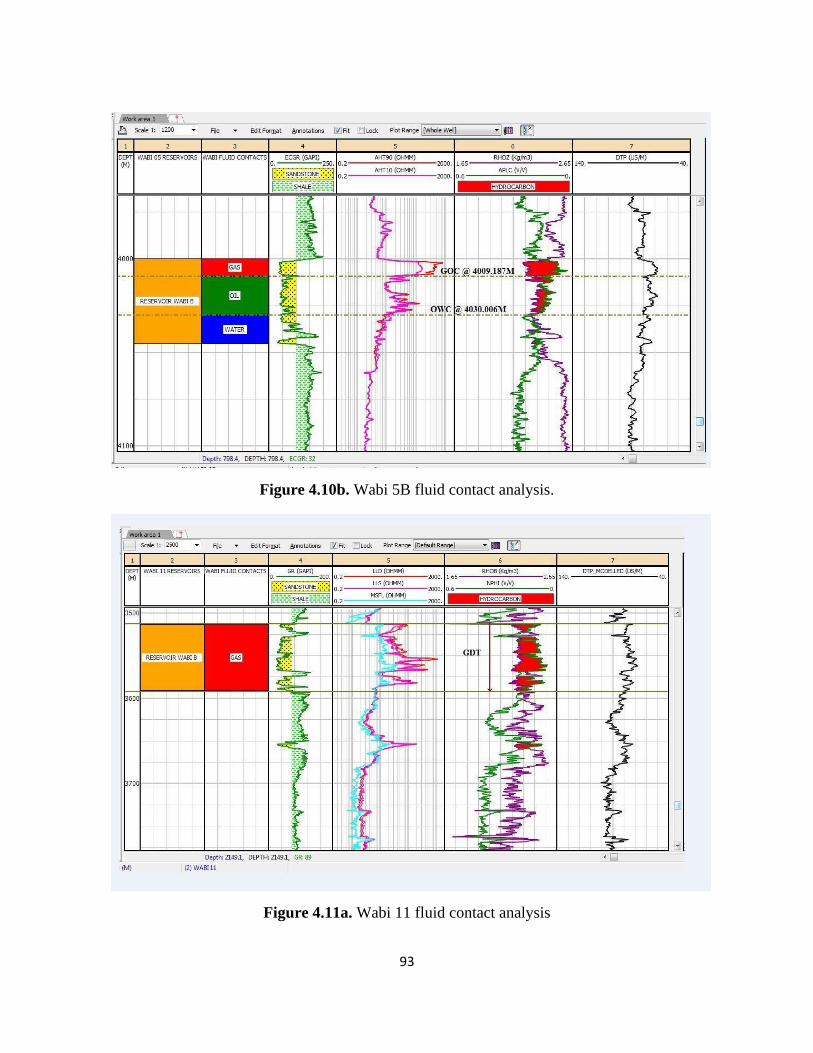
93
Figure 4.10b. Wabi 5B fluid contact analysis.
Figure 4.11a. Wabi 11 fluid contact analysis
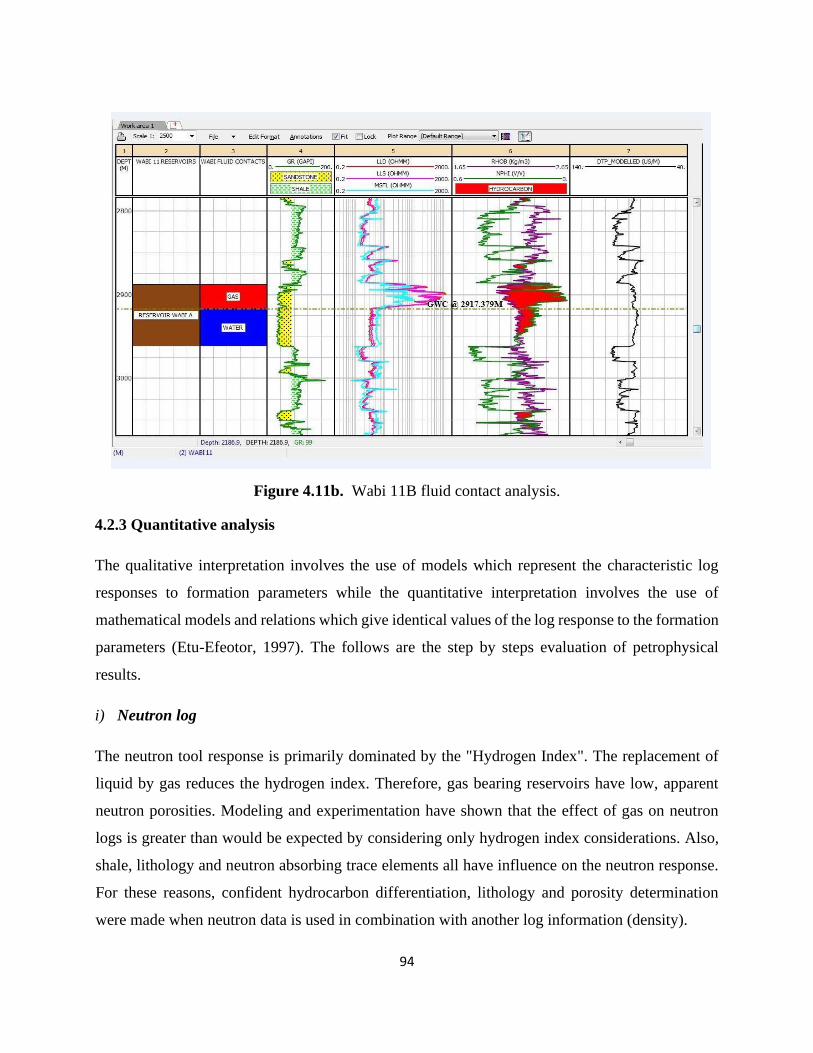
94
Figure 4.11b. Wabi 11B fluid contact analysis.
4.2.3 Quantitative analysis
The qualitative interpretation involves the use of models which represent the characteristic log
responses to formation parameters while the quantitative interpretation involves the use of
mathematical models and relations which give identical values of the log response to the formation
parameters (Etu-Efeotor, 1997). The follows are the step by steps evaluation of petrophysical
results.
i) Neutron log
The neutron tool response is primarily dominated by the "Hydrogen Index". The replacement of
liquid by gas reduces the hydrogen index. Therefore, gas bearing reservoirs have low, apparent
neutron porosities. Modeling and experimentation have shown that the effect of gas on neutron
logs is greater than would be expected by considering only hydrogen index considerations. Also,
shale, lithology and neutron absorbing trace elements all have influence on the neutron response.
For these reasons, confident hydrocarbon differentiation, lithology and porosity determination
were made when neutron data is used in combination with another log information (density).
95
ii) Density log
In porous formations, the difference between the bulk density as measured by the tool in a water
filled system compared to a water plus oil filled system is very small. However, if gas is present
in the pore space, the measured bulk density can be significantly less than in a liquid filled system.
This is the basis for hydrocarbon differentiation using the density tool and when used in
combination with a neutron log usually provides reliable results in Wabi field.
iii) Sonic log
The gas effect on the acoustic velocities is a complex process; and surprisingly the most significant
effect that occur in the low gas saturation range. In general, gas in the pore space results in a
decrease in compressional velocity i.e. longer transit time and attenuation of the compressional
wave. This commonly leads to cycle skipping in compressional velocity tools. The modern array
devices do not, in general, suffer from this problem as compressional velocities are derived from
the wave form correlations rather than arrival picks. Gas bearing zones can be identified by a
tendency for the sonic to shift to the left due to the slowing of the compressional wave. Thus, in
gas bearing intervals, the parting between the sonic and resistivity readings are greater than in oil
bearing intervals (Zaki, 1994).
iv) Porosity calculation
The available porosity logs for Wabi Wells are Neutron, Density and Sonic. The density log was
used to calculate porosities in the entire reservoirs. The matrix and fluid density used are
respectively 2.648 g/cm and 1.1 g/cm, respectively. The calculated porosities are effective and
total porosities of the reservoirs. Effective porosities are less than the total porosity in decimal. The
ratio of interconnected pore volume to the bulk volume of a material defines the effective porosity.
The interconnected pore volume or void space in a rock contributes to fluid flow or permeability
in a reservoir Figures 4.12-4.13.
v) Calculating net pay with cutoffs
The thickness of rock that contributes to economically feasible production with today's technology
describes the net pay. Net pay is obviously a moving target since technology, prices, and costs vary
96
almost daily (Zorasi, 2017). Hence, tight reservoirs or shaley zones that were bypassed in the past
are now prospective pay zones due to new technology and continued demand for hydrocarbons.
Net pay is determined by applying appropriate cutoffs values to reservoir properties so that
unproductive or uneconomic layers are not counted (Zorasi, 2017). Cumulative reservoir
properties, after appropriate cut off are applied to provide information about the pore volume (PV),
hydrocarbon pore volume (HPV) and flow capacity (KH) of a potential pay zone. These values are
used to calculate hydrocarbon in place recoverable reserves and productivity of wells (Asquith and
Gibson 1982). Cut – Off used for this interpretation are: Volume of shale (Vsh) = 0.4, Effective
porosity (PHIE) = 0.15, Water saturation (SW=0.5).
vi) Fluid saturation calculation
The fraction or percentage of pore space that is occupied by water called water saturation was
calculated for the reservoirs of the WABI wells using the formula for hydrocarbon saturation as
follows:
= 1 – (decimal) or = 100 – (%) (Asquith and Gibson, 1982).
Where, = Hydrocarbon Saturation; = Water Saturation, = or where is Oil
Saturation and is Gas Saturation.
The formula used in calculating this water saturation parameter was Juhasz (1981) and Waxman
Smith (1968):
n
w
w
m
e
cl
cl
t
SRaR
v
R
2
24.11
+=
where,
∅𝑒 - Effective porosity
𝑅𝑡 - Resistivity of uninvaded zone or true resistivity.

97
𝑉𝑆ℎ - Volume of shale
n - Saturation exponent
𝑅𝑊 - Resistivity of formation water
𝑆𝑊 - Water saturation
𝑅𝑆ℎ - Resistivity of adjacent shale
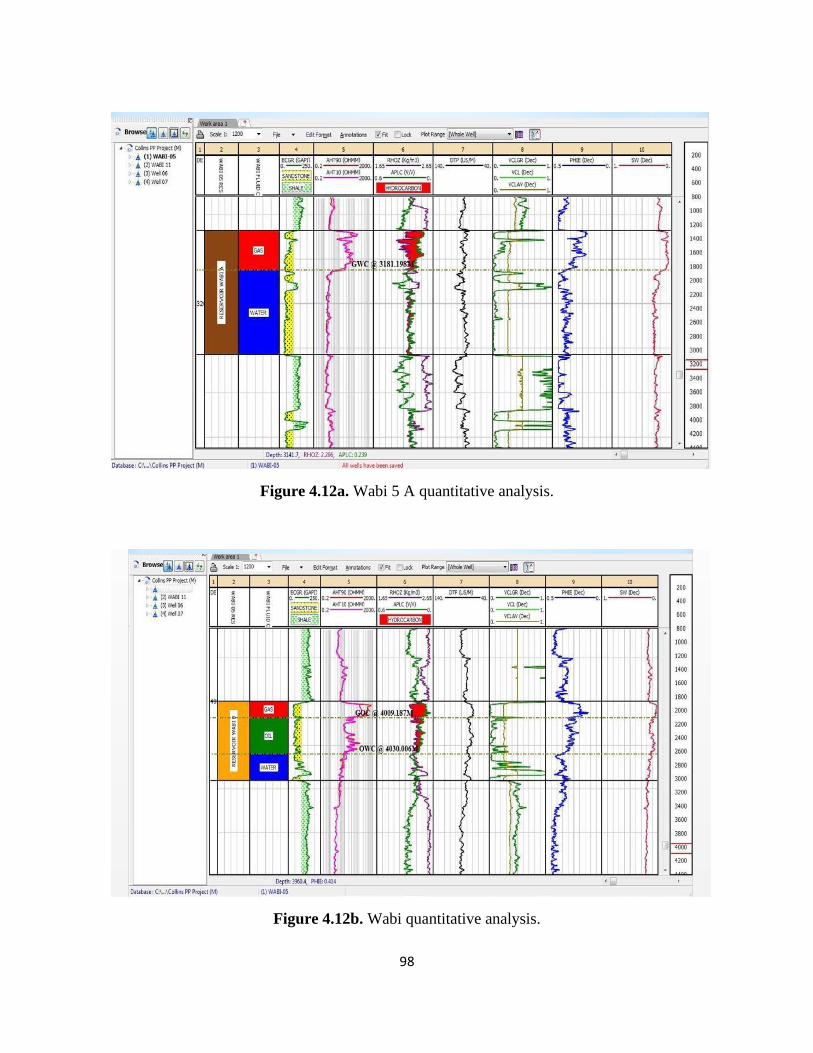
98
Figure 4.12a. Wabi 5 A quantitative analysis.
Figure 4.12b. Wabi quantitative analysis.
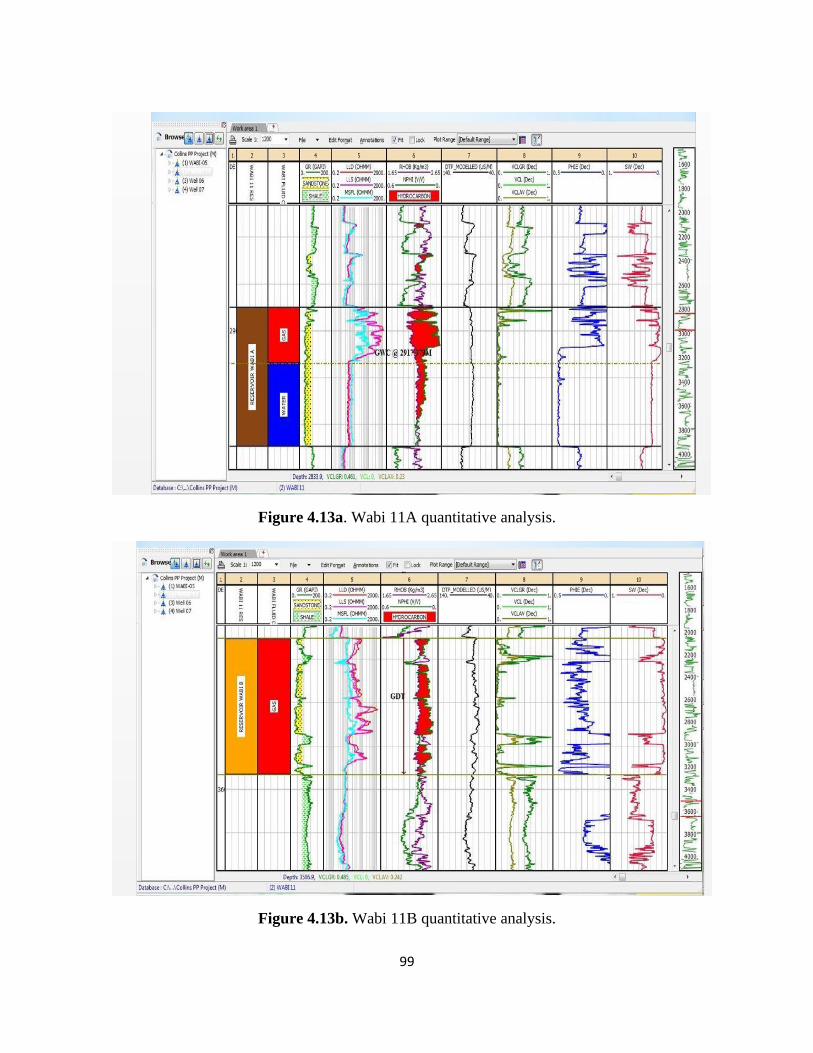
99
Figure 4.13a. Wabi 11A quantitative analysis.
Figure 4.13b. Wabi 11B quantitative analysis.
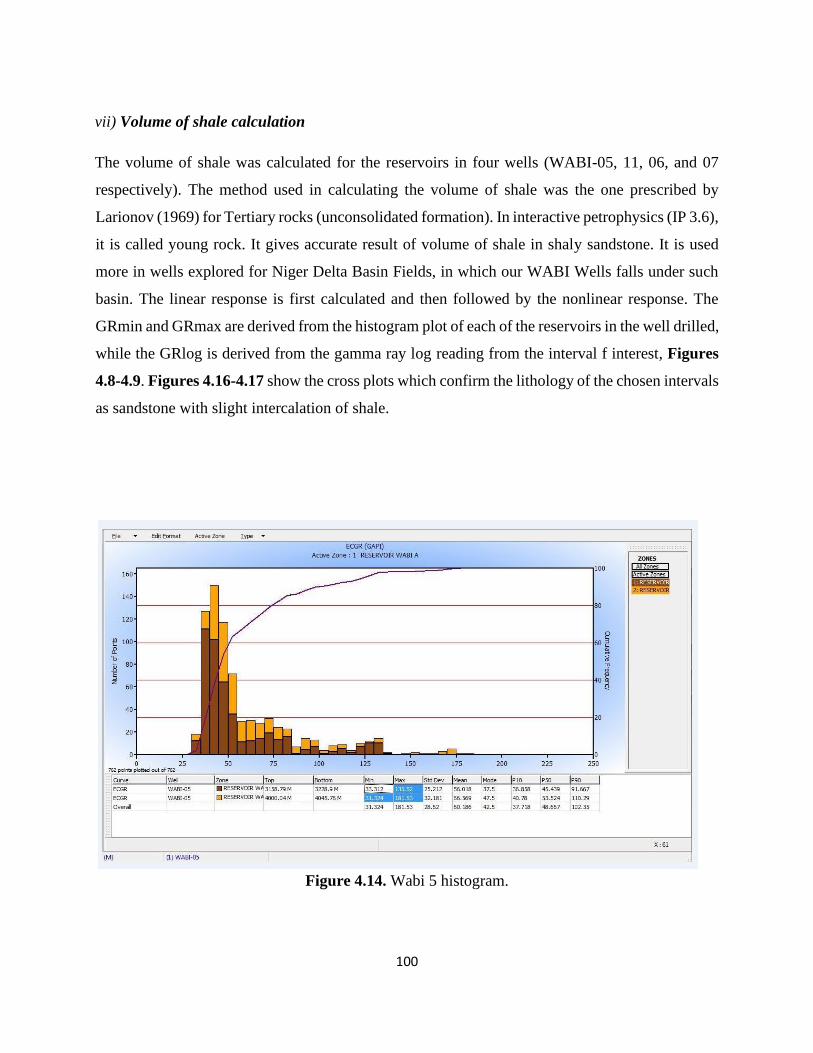
100
vii) Volume of shale calculation
The volume of shale was calculated for the reservoirs in four wells (WABI-05, 11, 06, and 07
respectively). The method used in calculating the volume of shale was the one prescribed by
Larionov (1969) for Tertiary rocks (unconsolidated formation). In interactive petrophysics (IP 3.6),
it is called young rock. It gives accurate result of volume of shale in shaly sandstone. It is used
more in wells explored for Niger Delta Basin Fields, in which our WABI Wells falls under such
basin. The linear response is first calculated and then followed by the nonlinear response. The
GRmin and GRmax are derived from the histogram plot of each of the reservoirs in the well drilled,
while the GRlog is derived from the gamma ray log reading from the interval f interest, Figures
4.8-4.9. Figures 4.16-4.17 show the cross plots which confirm the lithology of the chosen intervals
as sandstone with slight intercalation of shale.
Figure 4.14. Wabi 5 histogram.

101
Figure 4.15. Wabi 11 histogram.
Viii) Cluster Analysis
Cross plotting techniques are very robust for classification of lithology and fluid type using log
responses. Cross plotting of rock properties from petrophysical logs is one of the convenient and
proficient techniques to look at two rock properties and their attributes. Therefore, prove decisively
which rock properties and their attributes will be supportive to differentiate gas in a particular
reservoir. Crossplot analysis was carried out to establish Wabi rock properties / attributes that
described and differentiates the reservoir and hydrocarbon content. The cross plot of Neutron log
versus Density colour coded with gamma ray in Figure 4.16-4.17 discriminates the reservoirs into
shale, brine sands, oil sands and gas sands. This was realized when cursor is moved on reservoir
intervals on log section and the cross plot equally highlighted same for confirmation of similar
result. Hence, cross plots were used to visually recognize or detect anomalies that may result to
hydrocarbon presence or other fluids and lithologies.
The tables 4.2-4.8 showed the summary of Petrophysical analyses results of Wabi field.
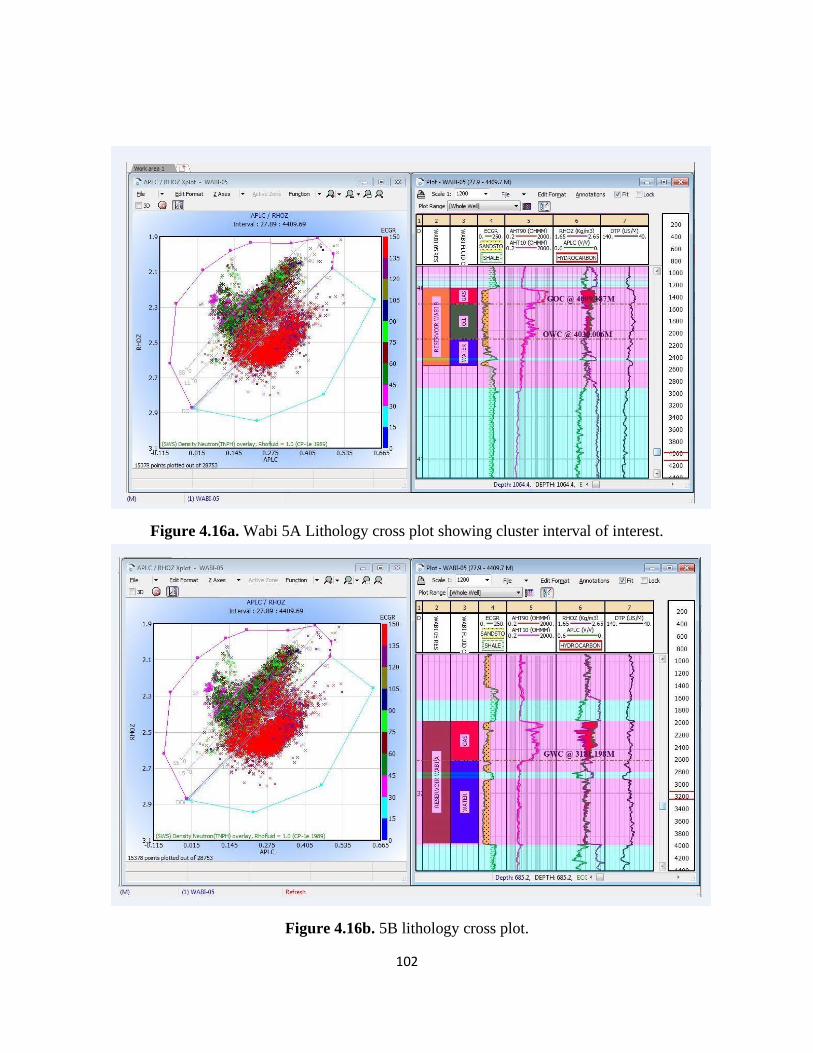
102
Figure 4.16a. Wabi 5A Lithology cross plot showing cluster interval of interest.
Figure 4.16b. 5B lithology cross plot.
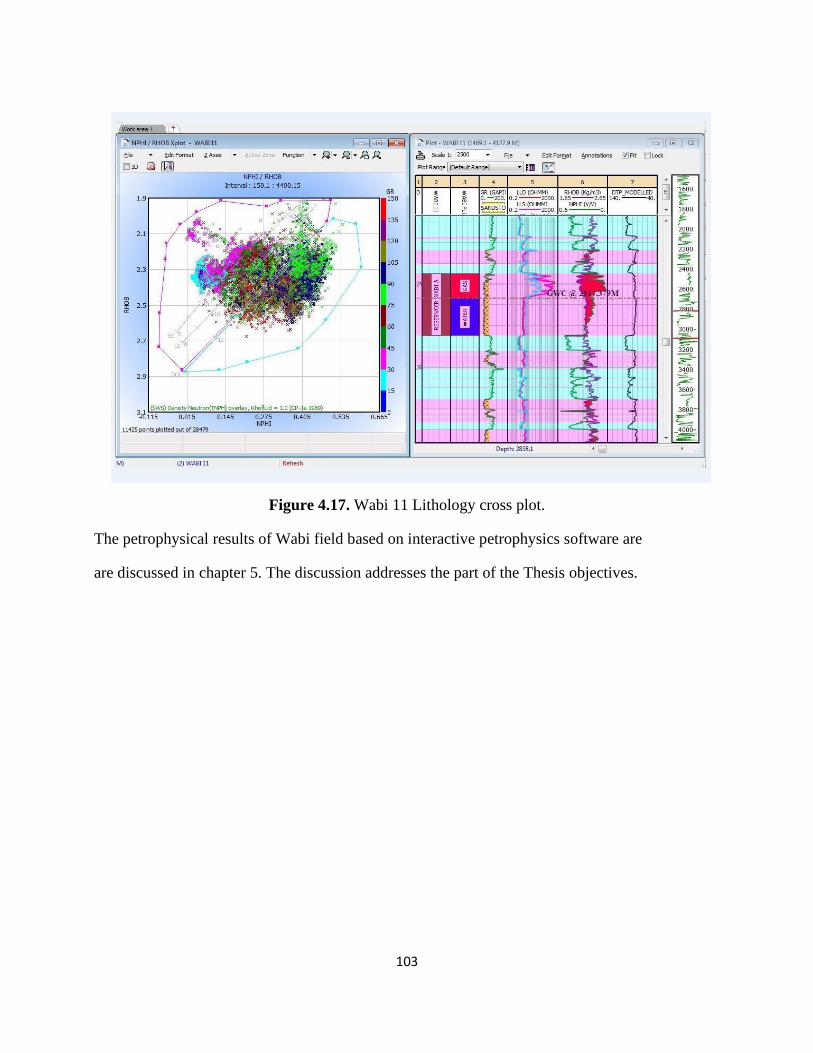
103
Figure 4.17. Wabi 11 Lithology cross plot.
The petrophysical results of Wabi field based on interactive petrophysics software are
are discussed in chapter 5. The discussion addresses the part of the Thesis objectives.

104
Table 4.2: Summary report on identification of reservoirs of interest in Wabi wells
WELL RESERVOIRS TOP MD (M) BOTTOM MD (M)
WABI 05 RESERVOIR WABI A 3158.795 3228.899
WABI 05 RESERVOIR WABI B 4000.043 4045.763
WABI 11 RESERVOIR WABI A 2887.661 2962.185
WABI 11 RESERVOIR WABI B 3513.263 3591.597
WABI 06 RESERVOIR WABI A 3887.862 3997.286
WABI 06 RESERVOIR WABI B 4053.216
4078.972

105
Table 4. 3: Summary table for Wabi wells showing fluid type and the fluid contacts.
WELL RESERVOIRS TOP MD
(M)
BOTTOM
MD (M)
HYDROCARBON
FLUID TYPE
FLUID
CONTACT
WABI 05 RESERVOIR
WABI A
3158.795
3181.198
3181.198
3228.899
GAS
WATER
GWC @
3181.198M
WABI 05 RESERVOIR
WABI B
4000.043
4009.492
4030.066
4009.492
4030.066
4045.763
GAS
OIL
WATER
GOC @
4009.492M
OWC @
4030.066M
WABI 11 RESERVOIR
WABI A
2887.661
2917.379
2917.379
2962.185
GAS
WATER
GWC @
2917.379M
WABI 11 RESERVOIR
WABI B
3513.263 3591.597 GAS GDT
OWC: Oil – Water Contact
GDT: Gas Down- To
GWC: Gas – Water Contact
GOC: Gas – Oil Contact.
Table 4.4: Summary table for Wabi wells showing fluid type and the fluid contacts.
WELL RESERVOIRS TOP MD
(M)
BOTTOM
MD (M)
HYDROCARBON
FLUID TYPE
FLUID
CONTACT
WABI 06 RESERVOIR
WABI A
3887.862 3997.286 GAS GDT
WABI 06 RESERVOIR
WABI B
4053.216 4078.972 GAS GDT
WABI 07 RESERVOIR
WABI A
2915.26
2931.9
2931.9
2984.144
GAS
WATER
GWC @
2931.9M
WABI 07 RESERVOIR
WABI B
3340.76
3365.1
3365.1
3429.61
GAS
WATER
GWC @
3364.078M
GWC: Gas – Water Contact, GDT: Gas Down- To
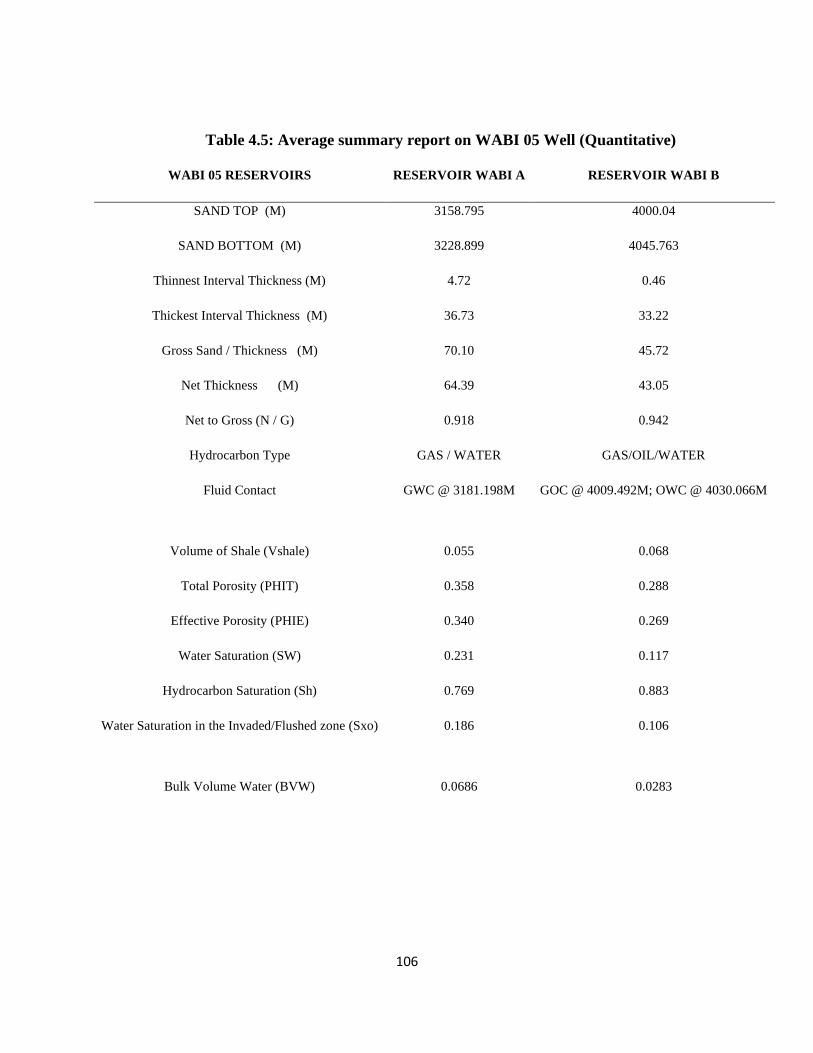
106
Table 4.5: Average summary report on WABI 05 Well (Quantitative)
WABI 05 RESERVOIRS RESERVOIR WABI A RESERVOIR WABI B
SAND TOP (M) 3158.795 4000.04
SAND BOTTOM (M) 3228.899 4045.763
Thinnest Interval Thickness (M) 4.72 0.46
Thickest Interval Thickness (M) 36.73 33.22
Gross Sand / Thickness (M) 70.10 45.72
Net Thickness (M) 64.39 43.05
Net to Gross (N / G) 0.918 0.942
Hydrocarbon Type GAS / WATER GAS/OIL/WATER
Fluid Contact GWC @ 3181.198M GOC @ 4009.492M; OWC @ 4030.066M
Volume of Shale (Vshale) 0.055 0.068
Total Porosity (PHIT) 0.358 0.288
Effective Porosity (PHIE) 0.340 0.269
Water Saturation (SW) 0.231 0.117
Hydrocarbon Saturation (Sh) 0.769 0.883
Water Saturation in the Invaded/Flushed zone (Sxo) 0.186 0.106
Bulk Volume Water (BVW) 0.0686 0.0283
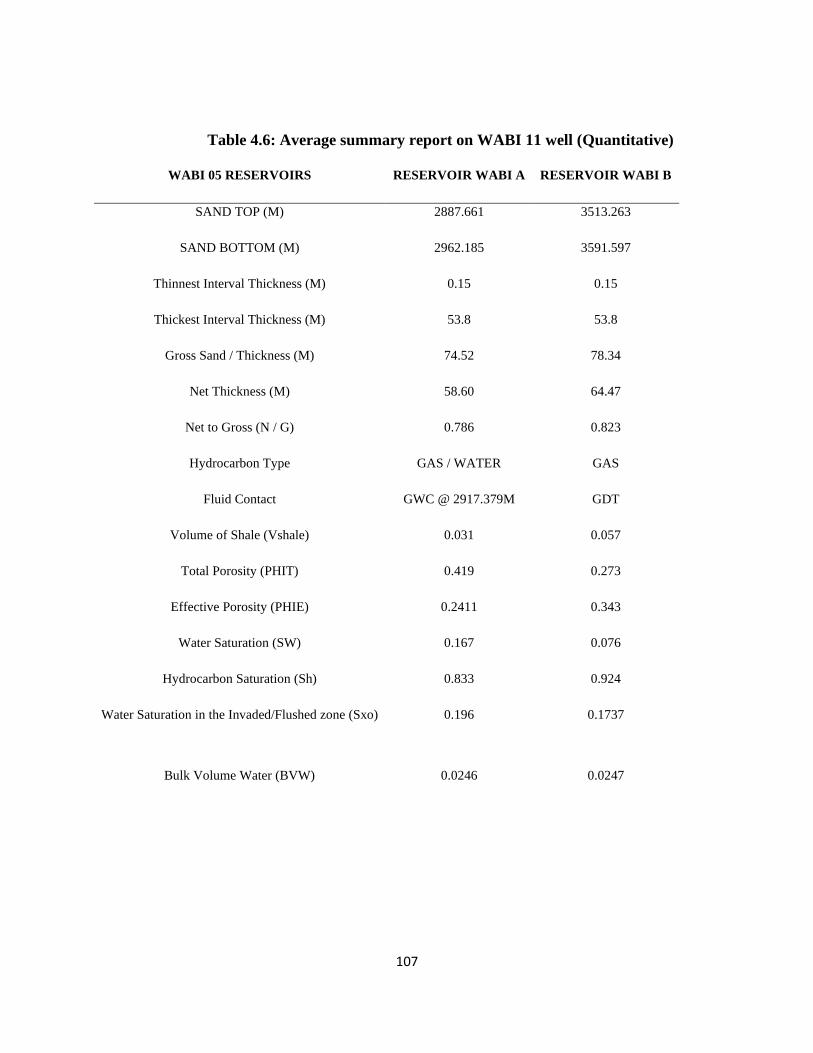
107
Table 4.6: Average summary report on WABI 11 well (Quantitative)
WABI 05 RESERVOIRS RESERVOIR WABI A RESERVOIR WABI B
SAND TOP (M) 2887.661 3513.263
SAND BOTTOM (M) 2962.185 3591.597
Thinnest Interval Thickness (M) 0.15 0.15
Thickest Interval Thickness (M) 53.8 53.8
Gross Sand / Thickness (M) 74.52 78.34
Net Thickness (M) 58.60 64.47
Net to Gross (N / G) 0.786 0.823
Hydrocarbon Type GAS / WATER GAS
Fluid Contact GWC @ 2917.379M GDT
Volume of Shale (Vshale) 0.031 0.057
Total Porosity (PHIT) 0.419 0.273
Effective Porosity (PHIE) 0.2411 0.343
Water Saturation (SW) 0.167 0.076
Hydrocarbon Saturation (Sh) 0.833 0.924
Water Saturation in the Invaded/Flushed zone (Sxo) 0.196 0.1737
Bulk Volume Water (BVW) 0.0246 0.0247
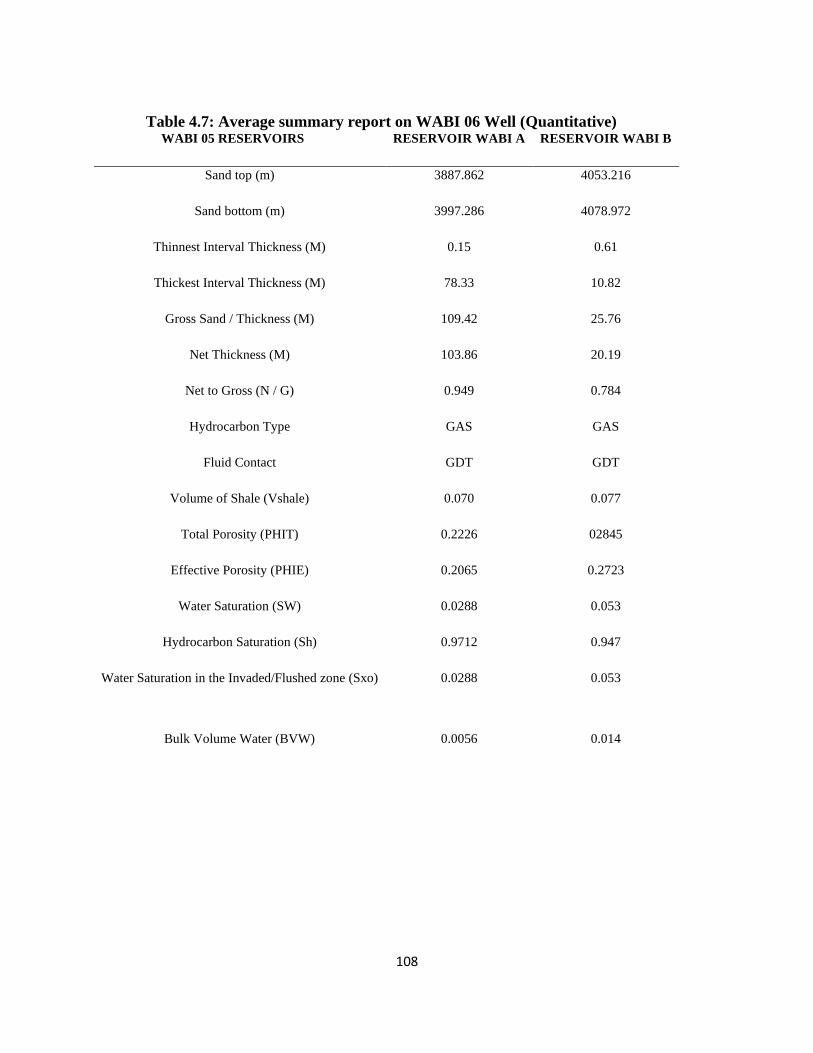
108
Table 4.7: Average summary report on WABI 06 Well (Quantitative) WABI 05 RESERVOIRS RESERVOIR WABI A RESERVOIR WABI B
Sand top (m) 3887.862 4053.216
Sand bottom (m) 3997.286 4078.972
Thinnest Interval Thickness (M) 0.15 0.61
Thickest Interval Thickness (M) 78.33 10.82
Gross Sand / Thickness (M) 109.42 25.76
Net Thickness (M) 103.86 20.19
Net to Gross (N / G) 0.949 0.784
Hydrocarbon Type GAS GAS
Fluid Contact GDT GDT
Volume of Shale (Vshale) 0.070 0.077
Total Porosity (PHIT) 0.2226 02845
Effective Porosity (PHIE) 0.2065 0.2723
Water Saturation (SW) 0.0288 0.053
Hydrocarbon Saturation (Sh) 0.9712 0.947
Water Saturation in the Invaded/Flushed zone (Sxo) 0.0288 0.053
Bulk Volume Water (BVW) 0.0056 0.014
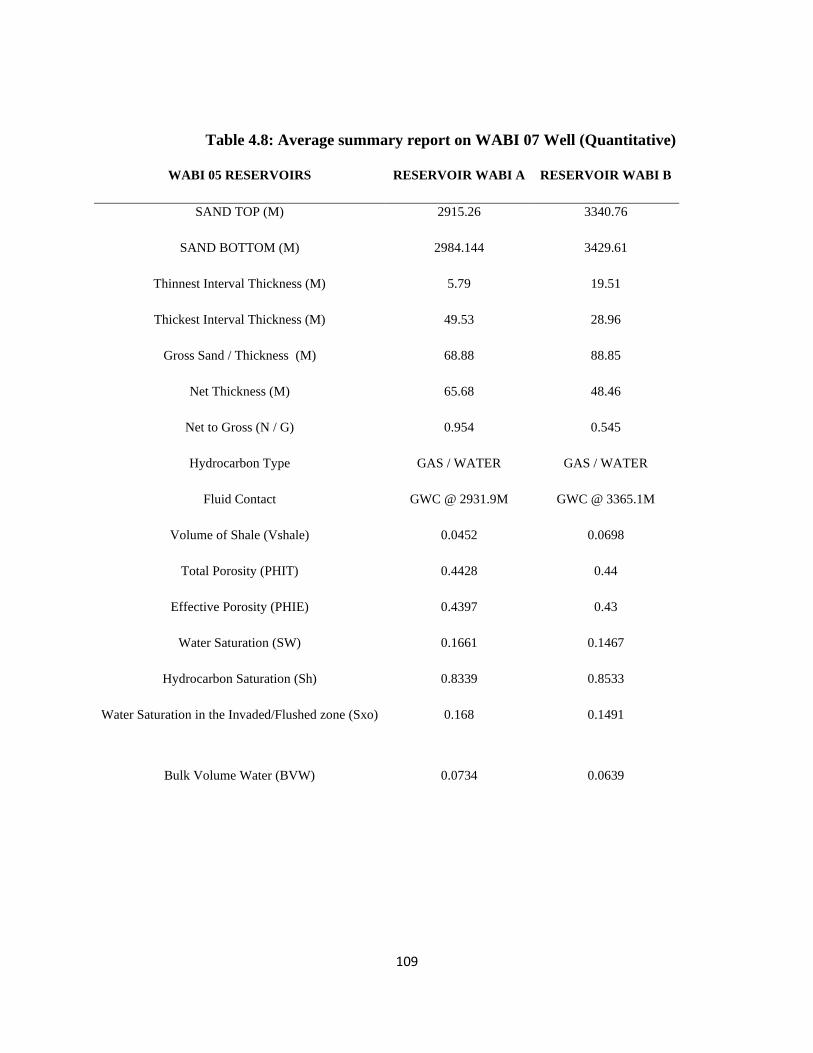
109
Table 4.8: Average summary report on WABI 07 Well (Quantitative)
WABI 05 RESERVOIRS RESERVOIR WABI A RESERVOIR WABI B
SAND TOP (M) 2915.26 3340.76
SAND BOTTOM (M) 2984.144 3429.61
Thinnest Interval Thickness (M) 5.79 19.51
Thickest Interval Thickness (M) 49.53 28.96
Gross Sand / Thickness (M) 68.88 88.85
Net Thickness (M) 65.68 48.46
Net to Gross (N / G) 0.954 0.545
Hydrocarbon Type GAS / WATER GAS / WATER
Fluid Contact GWC @ 2931.9M GWC @ 3365.1M
Volume of Shale (Vshale) 0.0452 0.0698
Total Porosity (PHIT) 0.4428 0.44
Effective Porosity (PHIE) 0.4397 0.43
Water Saturation (SW) 0.1661 0.1467
Hydrocarbon Saturation (Sh) 0.8339 0.8533
Water Saturation in the Invaded/Flushed zone (Sxo) 0.168 0.1491
Bulk Volume Water (BVW) 0.0734 0.0639
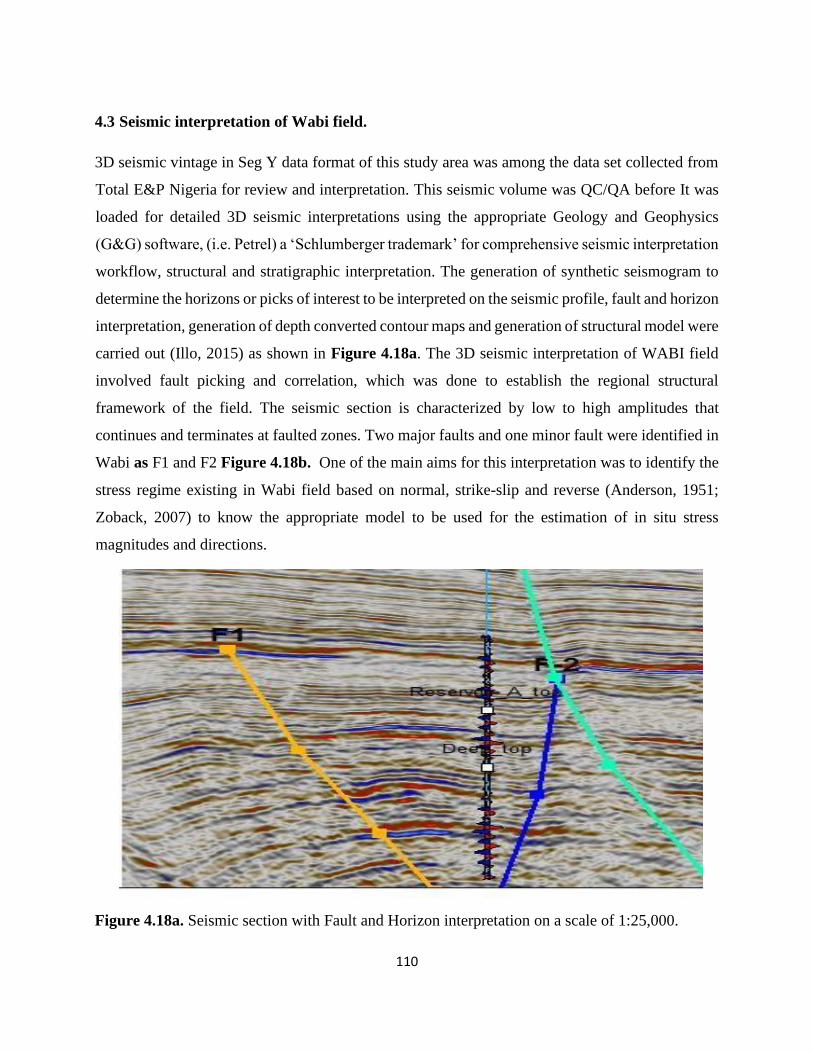
110
4.3 Seismic interpretation of Wabi field.
3D seismic vintage in Seg Y data format of this study area was among the data set collected from
Total E&P Nigeria for review and interpretation. This seismic volume was QC/QA before It was
loaded for detailed 3D seismic interpretations using the appropriate Geology and Geophysics
(G&G) software, (i.e. Petrel) a ‘Schlumberger trademark’ for comprehensive seismic interpretation
workflow, structural and stratigraphic interpretation. The generation of synthetic seismogram to
determine the horizons or picks of interest to be interpreted on the seismic profile, fault and horizon
interpretation, generation of depth converted contour maps and generation of structural model were
carried out (Illo, 2015) as shown in Figure 4.18a. The 3D seismic interpretation of WABI field
involved fault picking and correlation, which was done to establish the regional structural
framework of the field. The seismic section is characterized by low to high amplitudes that
continues and terminates at faulted zones. Two major faults and one minor fault were identified in
Wabi as F1 and F2 Figure 4.18b. One of the main aims for this interpretation was to identify the
stress regime existing in Wabi field based on normal, strike-slip and reverse (Anderson, 1951;
Zoback, 2007) to know the appropriate model to be used for the estimation of in situ stress
magnitudes and directions.
Figure 4.18a. Seismic section with Fault and Horizon interpretation on a scale of 1:25,000.

111
Figure 4.18b shows the structural fault system in the study area. These faults compartmentalized
the reservoir into three blocks as block A, block B and block C. This block compartmentalization
was also captured in time slice as shown in Figure 4.19. Block A does not have any well control
and block C was not considered in this study because it is plagued with poor data quality.
Therefore, the focus of this research is on block B which has four wells that has penetrated into it.
The dominant structural trap style in Wabi field is the synthetic growth fault system (F1, F3, F4)
with a subtle antithetic fault captured at down deep reservoir which localized within NE section of
block B.
Figure 4.18b. Fault system of the field.
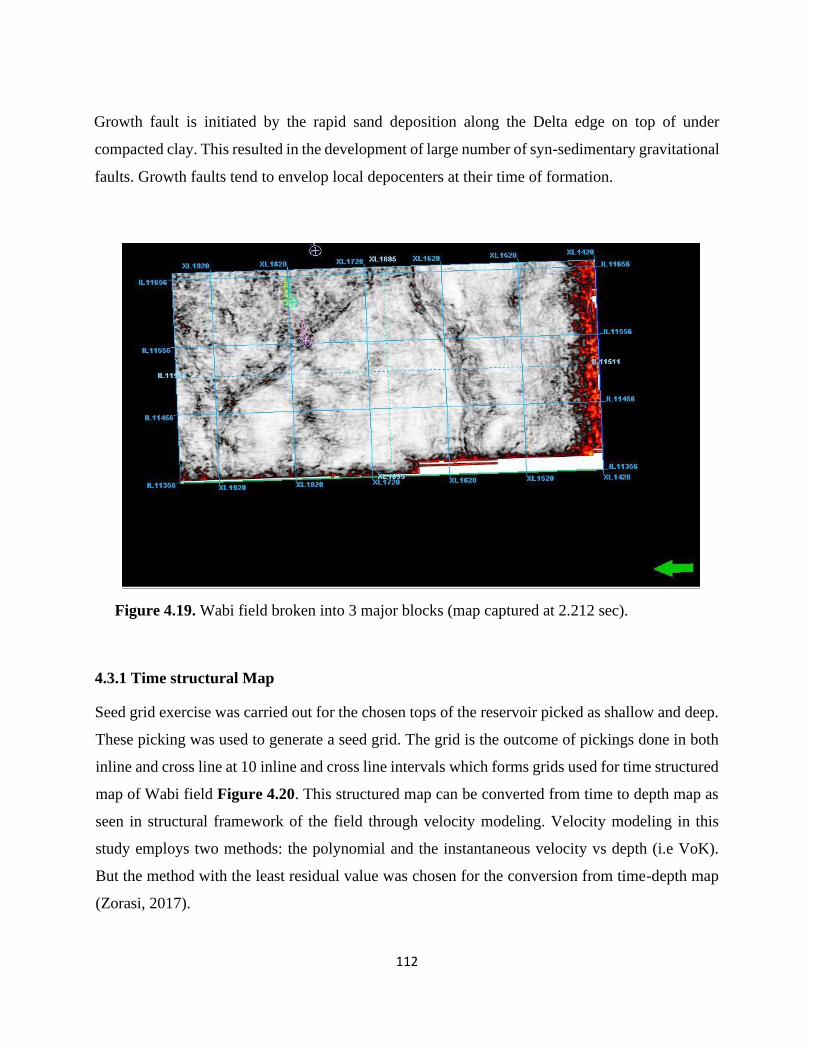
112
Growth fault is initiated by the rapid sand deposition along the Delta edge on top of under
compacted clay. This resulted in the development of large number of syn-sedimentary gravitational
faults. Growth faults tend to envelop local depocenters at their time of formation.
Figure 4.19. Wabi field broken into 3 major blocks (map captured at 2.212 sec).
4.3.1 Time structural Map
Seed grid exercise was carried out for the chosen tops of the reservoir picked as shallow and deep.
These picking was used to generate a seed grid. The grid is the outcome of pickings done in both
inline and cross line at 10 inline and cross line intervals which forms grids used for time structured
map of Wabi field Figure 4.20. This structured map can be converted from time to depth map as
seen in structural framework of the field through velocity modeling. Velocity modeling in this
study employs two methods: the polynomial and the instantaneous velocity vs depth (i.e VoK).
But the method with the least residual value was chosen for the conversion from time-depth map
(Zorasi, 2017).
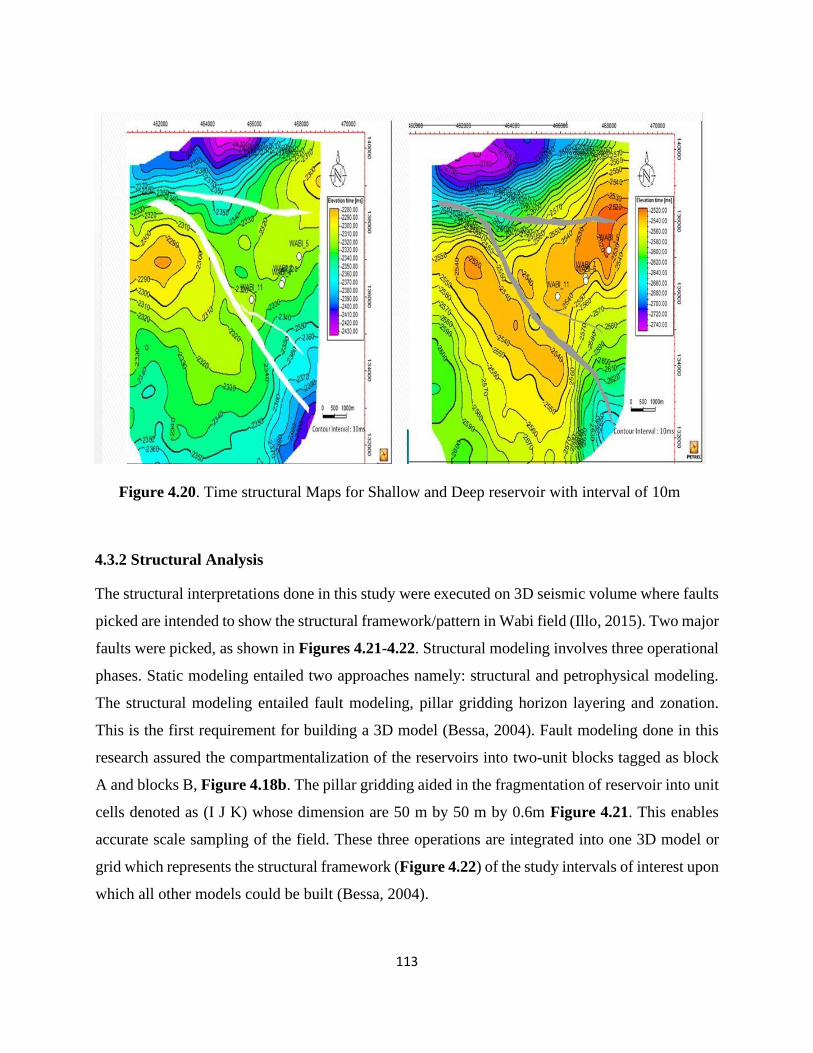
113
Figure 4.20. Time structural Maps for Shallow and Deep reservoir with interval of 10m
4.3.2 Structural Analysis
The structural interpretations done in this study were executed on 3D seismic volume where faults
picked are intended to show the structural framework/pattern in Wabi field (Illo, 2015). Two major
faults were picked, as shown in Figures 4.21-4.22. Structural modeling involves three operational
phases. Static modeling entailed two approaches namely: structural and petrophysical modeling.
The structural modeling entailed fault modeling, pillar gridding horizon layering and zonation.
This is the first requirement for building a 3D model (Bessa, 2004). Fault modeling done in this
research assured the compartmentalization of the reservoirs into two-unit blocks tagged as block
A and blocks B, Figure 4.18b. The pillar gridding aided in the fragmentation of reservoir into unit
cells denoted as (I J K) whose dimension are 50 m by 50 m by 0.6m Figure 4.21. This enables
accurate scale sampling of the field. These three operations are integrated into one 3D model or
grid which represents the structural framework (Figure 4.22) of the study intervals of interest upon
which all other models could be built (Bessa, 2004).
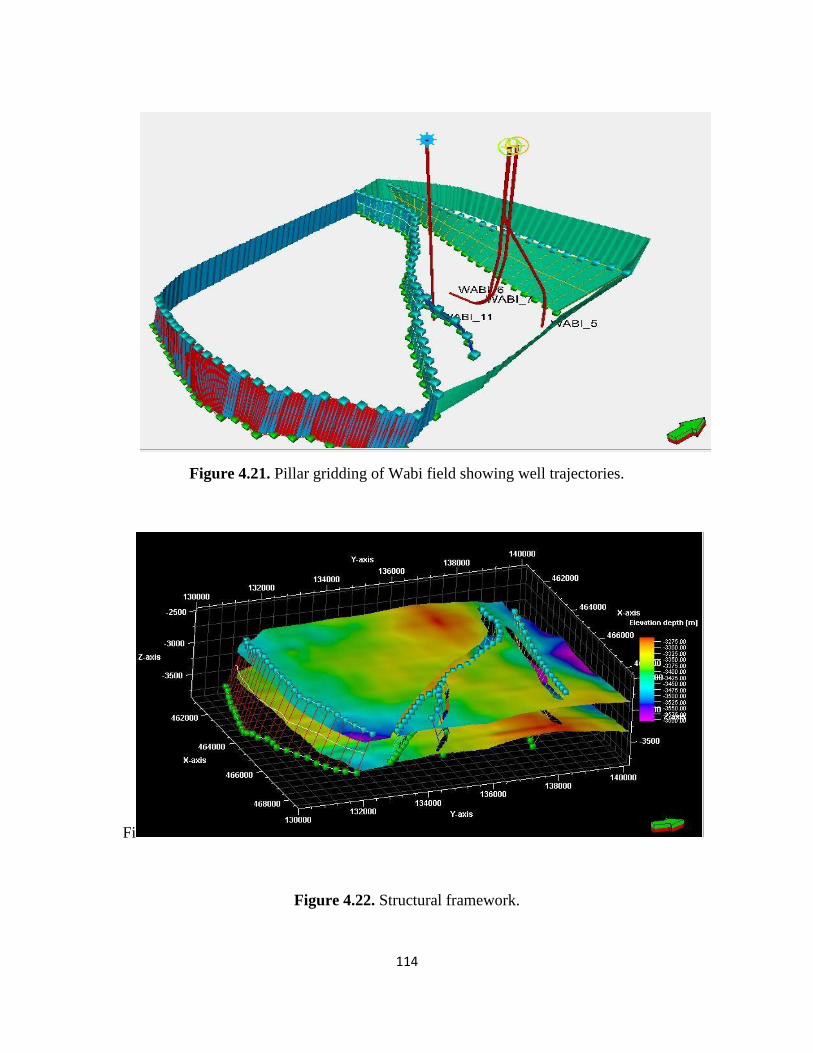
114
Figure 4.21. Pillar gridding of Wabi field showing well trajectories.
Fi
Figure 4.22. Structural framework.

115
4.4 Stress distribution from geologic map of seismic section
The seismic section showing fault interpretation and structural map were used for the identification
of stress regime in the Wabi field as normal faulting following the Andersonian classification of
faults regime (Zoback, 2007). Therefore, , this implies that the application of the
Uniaxial Elastic –Strain Model for the field is valid. The type of growth fault found in Wabi field
is known as antithetic growth which is associated with the detached stress regime (Bell, 1993).
More importantly, stress regime may vary from bed to beds as reported by Warpinski (1989)
whereas in some cases maximum and minimum horizontal stress measured in the same stress
regime have shown approximately equal values (Avasthi et al., 1991). Rosepiller (1979) studies
confirmed that maximum horizontal stress is closer to minimum horizontal stress than to
overburden stress due to ambiguity in unknown tensile strength in Cotton Valley East Texas. This
is the discrepancies that may result in estimating stress regimes in this study (Bell, 1996), Figure
4.23. Therefore, it is advisable to use the geologic map of the study field to identify the appropriate
regimes (Katahara, 1996). The tectonic setting, history and structural maps provided the insight of
order of principal stresses.
[
4.4.1 Stress directions
According to the work done by Abija and Tse (2016), using borehole breakout data and multiarm
(4 and 6 arms) caliper logs from Wabi 10 and 11, shows the maximum horizontal stress is in the
directions of ENE-WSW, NNW-SSW and NW-SE. These directions indicated the existence of
multiple sources of stress in Wabi field. Adewole and Healy (2013) pointed out that Northern Niger
delta is an inhomogeneous basin with different sources of stress. The direction of the maximum
stress, ENE-WSW is orientated parallel to the fracture zone. Fractures are caused by tectonic
stresses. The existing strike of the fractures normally coincides with the orientation of the faults in
a region (Schlumberger, 1989), while the NE –SW is orientated towards the basin fault, known as
the major lines of weak spot separating the North from South (Abija and Tse, 2016; Eze et al.,
2011). Hence, principal stress orientations are controlled by geological forces and anisotropy of
rocks.
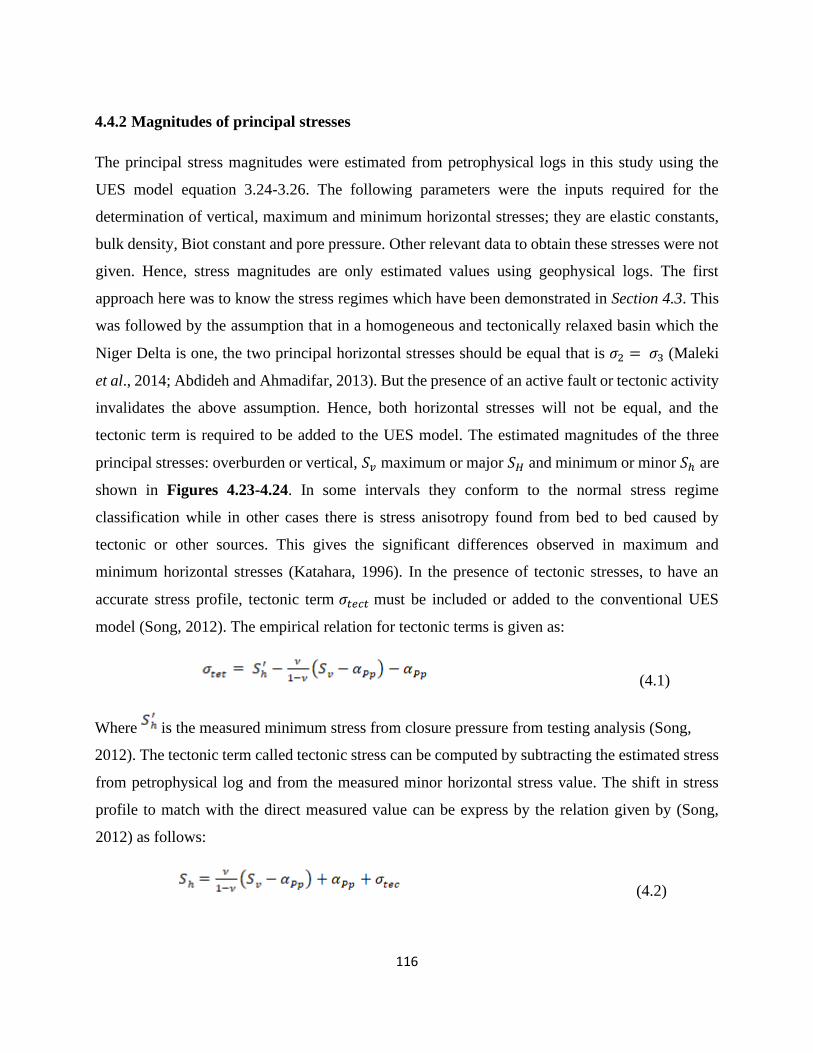
116
4.4.2 Magnitudes of principal stresses
The principal stress magnitudes were estimated from petrophysical logs in this study using the
UES model equation 3.24-3.26. The following parameters were the inputs required for the
determination of vertical, maximum and minimum horizontal stresses; they are elastic constants,
bulk density, Biot constant and pore pressure. Other relevant data to obtain these stresses were not
given. Hence, stress magnitudes are only estimated values using geophysical logs. The first
approach here was to know the stress regimes which have been demonstrated in Section 4.3. This
was followed by the assumption that in a homogeneous and tectonically relaxed basin which the
Niger Delta is one, the two principal horizontal stresses should be equal that is 𝜎2 = 𝜎3 (Maleki
et al., 2014; Abdideh and Ahmadifar, 2013). But the presence of an active fault or tectonic activity
invalidates the above assumption. Hence, both horizontal stresses will not be equal, and the
tectonic term is required to be added to the UES model. The estimated magnitudes of the three
principal stresses: overburden or vertical, 𝑆𝑣 maximum or major 𝑆𝐻 and minimum or minor 𝑆ℎ are
shown in Figures 4.23-4.24. In some intervals they conform to the normal stress regime
classification while in other cases there is stress anisotropy found from bed to bed caused by
tectonic or other sources. This gives the significant differences observed in maximum and
minimum horizontal stresses (Katahara, 1996). In the presence of tectonic stresses, to have an
accurate stress profile, tectonic term 𝜎𝑡𝑒𝑐𝑡 must be included or added to the conventional UES
model (Song, 2012). The empirical relation for tectonic terms is given as:
(4.1)
Where is the measured minimum stress from closure pressure from testing analysis (Song,
2012). The tectonic term called tectonic stress can be computed by subtracting the estimated stress
from petrophysical log and from the measured minor horizontal stress value. The shift in stress
profile to match with the direct measured value can be express by the relation given by (Song,
2012) as follows:
(4.2)
117
However, no Leak off test (LOT) or other means of direct measured minimum stress was given.
Therefore, tectonic term was not used in the estimation. In summary, in-situ stress state is a
paramount property of a rock for fracture design because it determines the mechanical failures of
a wellbore and its evaluation is essential for injection or infill well drilling design and planning.
The maximum and minimum horizontal stresses are the intermediate and least stresses acting on
the formation horizontally as confined stress/pressure. In other words, it defines the stiffness of the
rock (Goodman, 1989). As the rock stiffness increases, horizontal stress reduces. Thus, it is known
as a criterion of failure. In a normal faulting system, these stresses are orthogonal to each other
(Economides and Nolte, 2000). The knowledge of these stresses is vital as they influence rock
failure; especially, brittle materials fail due to the presence of stress.
The stress profile estimated and their model (Figures 4.23-4.24) shows that the stress at the
intervals of shallow reservoir depth (3140 m to 3280 m) signifies that the vertical stress is greater
than the maximum horizontal stress while the maximum horizontal stress in turn is greater than
the minimum horizontal stress ( ) (Zoback, 2007). This trend conforms with the
normal fault regime described by Anderson 1951 and the deduction made from seismic
interpretation also confirms the study area to be normal fault (Maleki et al., 2014). However, at
some intervals between 3230m to 3260m and 3605m to 3605m, the maximum horizontal and
vertical stresses are equal and maximum horizontal stress is greater than vertical stress
at down deep reservoir respectively due to mechanical anomalies in elastic properties of
rocks (Bell, 1996) obtained from analysis of principal stresses.
The existence of wide variations in the present-day stress magnitudes and orientations at some
intervals (beds) in Wabi field is as a result of the presence of anisotropy media (Kozloski et al.,
2011) caused by mechanical rock contrasts (Bell, 1996). Confining stresses (i.e. maximum and
minimum horizontal) cause compression in a reservoir. This rock failure in tension or shear
depends on the differential stress . Hence, low differential stress causes tensile
failure while high differential stress causes shear failure (Wilson and Cosgrove, 1982).
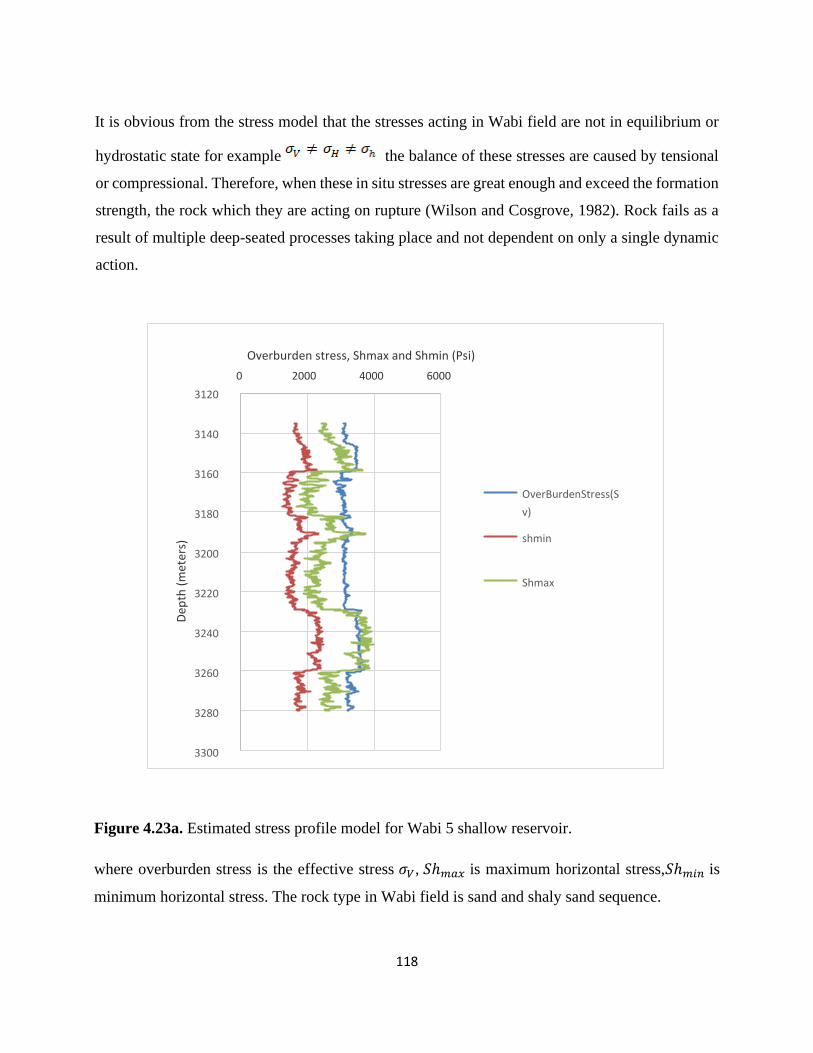
118
It is obvious from the stress model that the stresses acting in Wabi field are not in equilibrium or
hydrostatic state for example the balance of these stresses are caused by tensional
or compressional. Therefore, when these in situ stresses are great enough and exceed the formation
strength, the rock which they are acting on rupture (Wilson and Cosgrove, 1982). Rock fails as a
result of multiple deep-seated processes taking place and not dependent on only a single dynamic
action.
Figure 4.23a. Estimated stress profile model for Wabi 5 shallow reservoir.
where overburden stress is the effective stress 𝜎𝑉, 𝑆ℎ𝑚𝑎𝑥 is maximum horizontal stress,𝑆ℎ𝑚𝑖𝑛 is
minimum horizontal stress. The rock type in Wabi field is sand and shaly sand sequence.
3120
3140
3160
3180
3200
3220
3240
3260
3280
3300
0 2000 4000 6000
Overburden stress, Shmax and Shmin (Psi)
OverBurdenStress(S v)
shmin
Shmax
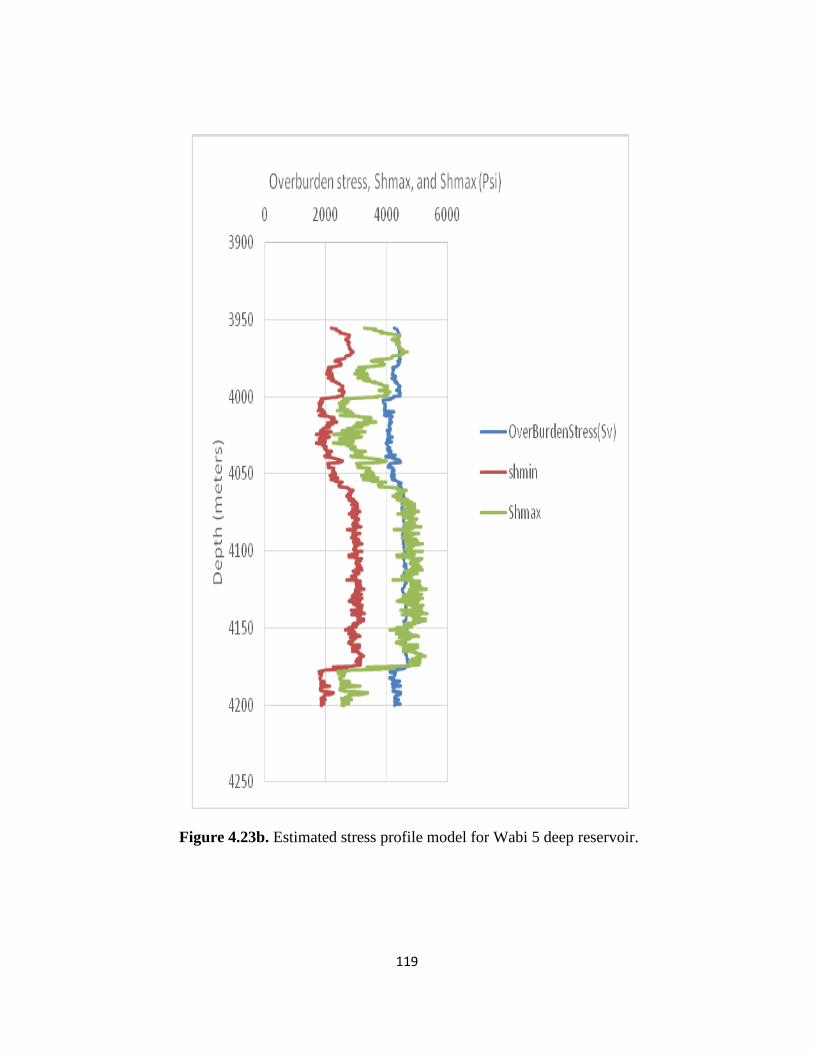
119
Figure 4.23b. Estimated stress profile model for Wabi 5 deep reservoir.
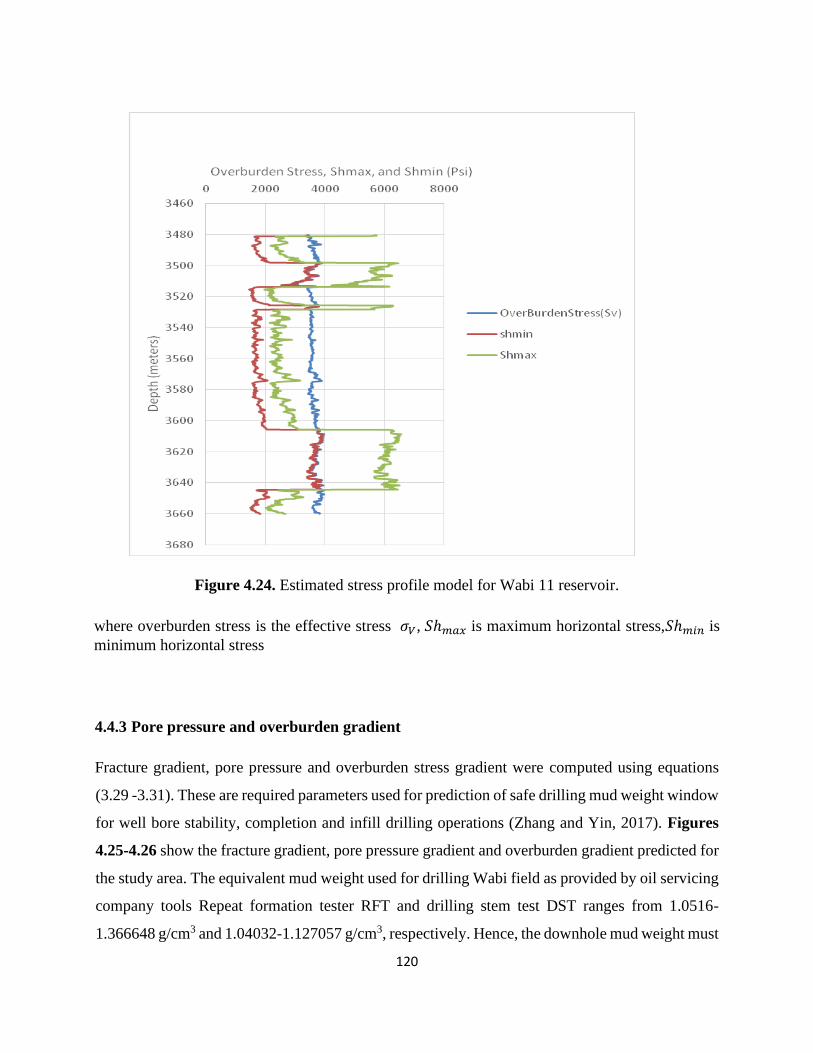
120
Figure 4.24. Estimated stress profile model for Wabi 11 reservoir.
where overburden stress is the effective stress 𝜎𝑉, 𝑆ℎ𝑚𝑎𝑥 is maximum horizontal stress,𝑆ℎ𝑚𝑖𝑛 is
minimum horizontal stress
4.4.3 Pore pressure and overburden gradient
Fracture gradient, pore pressure and overburden stress gradient were computed using equations
(3.29 -3.31). These are required parameters used for prediction of safe drilling mud weight window
for well bore stability, completion and infill drilling operations (Zhang and Yin, 2017). Figures
4.25-4.26 show the fracture gradient, pore pressure gradient and overburden gradient predicted for
the study area. The equivalent mud weight used for drilling Wabi field as provided by oil servicing
company tools Repeat formation tester RFT and drilling stem test DST ranges from 1.0516-
1.366648 g/cm3 and 1.04032-1.127057 g/cm3, respectively. Hence, the downhole mud weight must
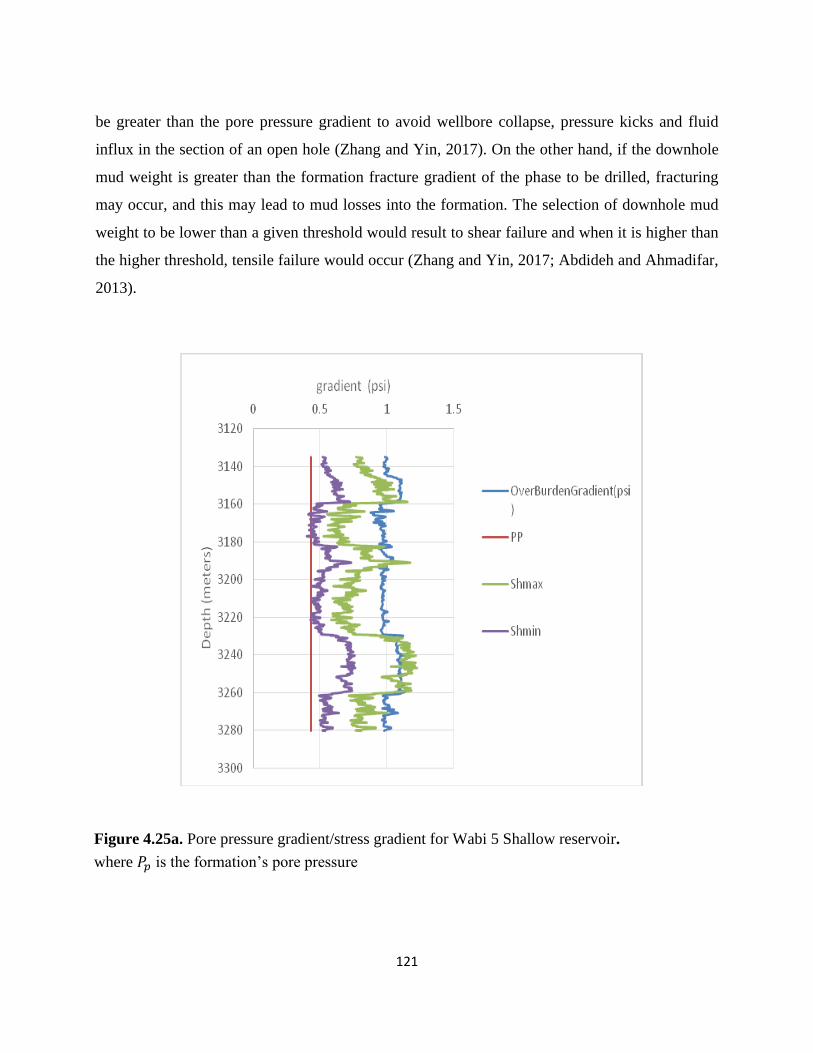
121
be greater than the pore pressure gradient to avoid wellbore collapse, pressure kicks and fluid
influx in the section of an open hole (Zhang and Yin, 2017). On the other hand, if the downhole
mud weight is greater than the formation fracture gradient of the phase to be drilled, fracturing
may occur, and this may lead to mud losses into the formation. The selection of downhole mud
weight to be lower than a given threshold would result to shear failure and when it is higher than
the higher threshold, tensile failure would occur (Zhang and Yin, 2017; Abdideh and Ahmadifar,
2013).
Figure 4.25a. Pore pressure gradient/stress gradient for Wabi 5 Shallow reservoir.
where 𝑃𝑝 is the formation’s pore pressure
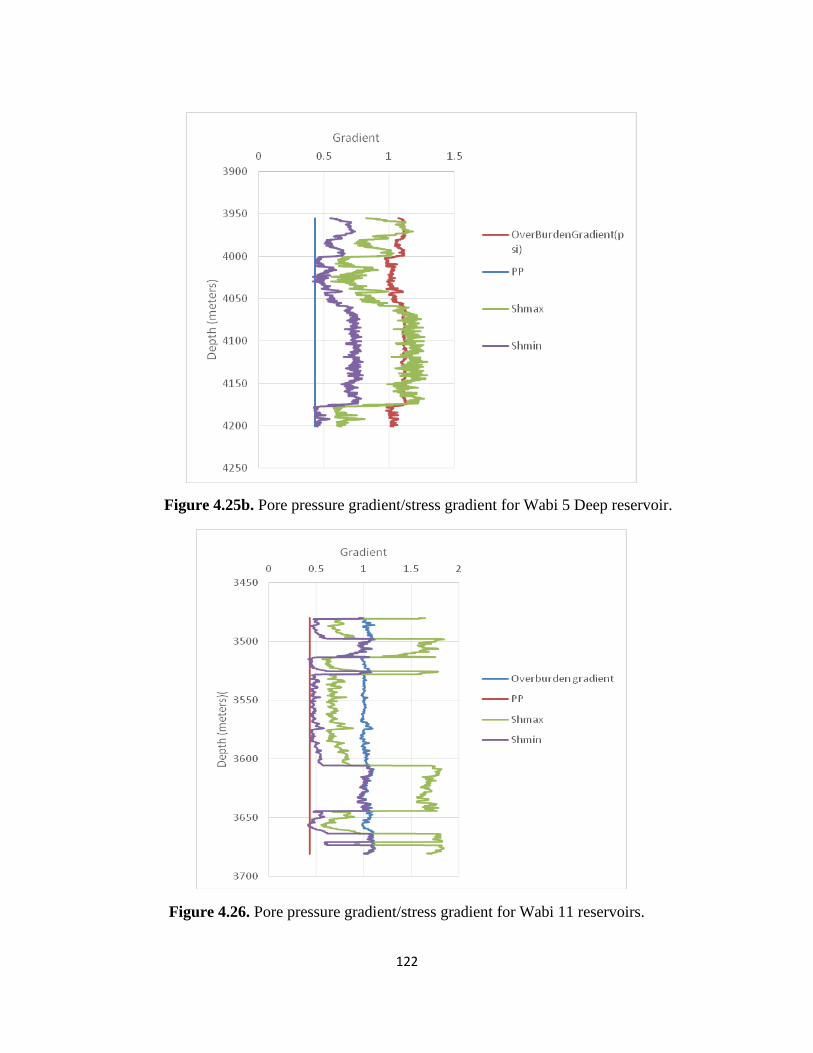
122
Figure 4.25b. Pore pressure gradient/stress gradient for Wabi 5 Deep reservoir.
Figure 4.26. Pore pressure gradient/stress gradient for Wabi 11 reservoirs.
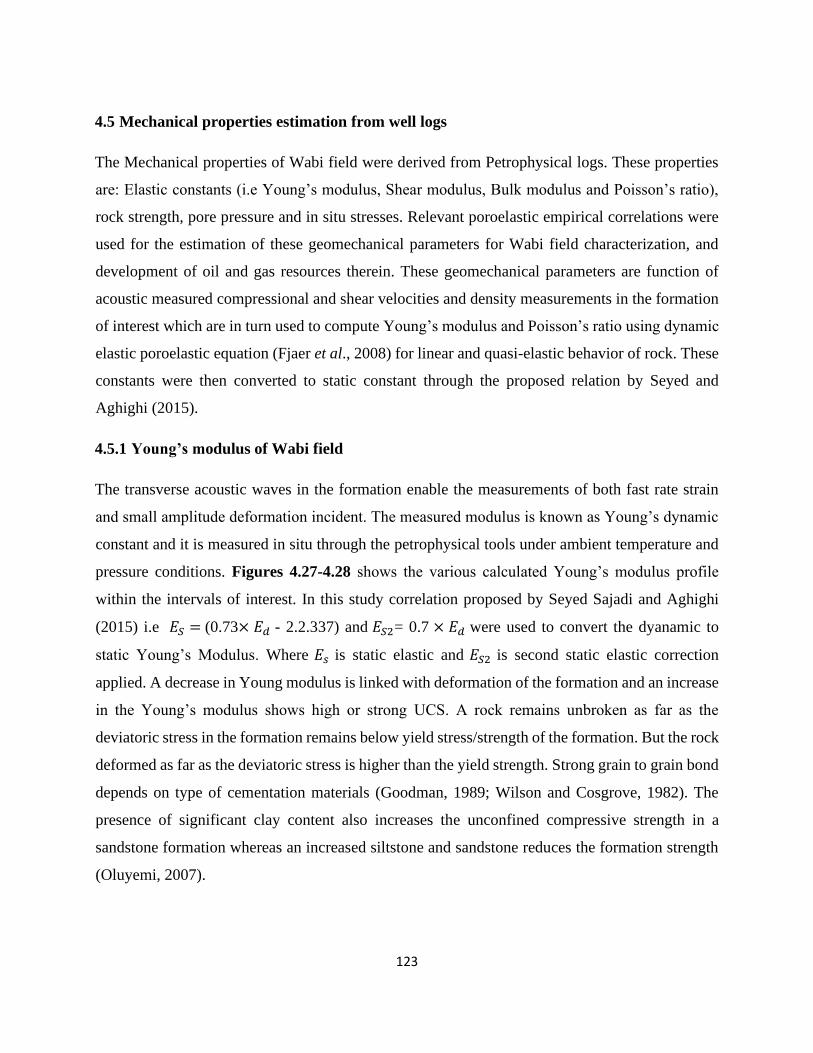
123
4.5 Mechanical properties estimation from well logs
The Mechanical properties of Wabi field were derived from Petrophysical logs. These properties
are: Elastic constants (i.e Young’s modulus, Shear modulus, Bulk modulus and Poisson’s ratio),
rock strength, pore pressure and in situ stresses. Relevant poroelastic empirical correlations were
used for the estimation of these geomechanical parameters for Wabi field characterization, and
development of oil and gas resources therein. These geomechanical parameters are function of
acoustic measured compressional and shear velocities and density measurements in the formation
of interest which are in turn used to compute Young’s modulus and Poisson’s ratio using dynamic
elastic poroelastic equation (Fjaer et al., 2008) for linear and quasi-elastic behavior of rock. These
constants were then converted to static constant through the proposed relation by Seyed and
Aghighi (2015).
4.5.1 Young’s modulus of Wabi field
The transverse acoustic waves in the formation enable the measurements of both fast rate strain
and small amplitude deformation incident. The measured modulus is known as Young’s dynamic
constant and it is measured in situ through the petrophysical tools under ambient temperature and
pressure conditions. Figures 4.27-4.28 shows the various calculated Young’s modulus profile
within the intervals of interest. In this study correlation proposed by Seyed Sajadi and Aghighi
(2015) i.e 𝐸𝑆 = (0.73× 𝐸𝑑 - 2.2.337) and 𝐸𝑆2= 0.7 × 𝐸𝑑 were used to convert the dyanamic to
static Young’s Modulus. Where 𝐸𝑠 is static elastic and 𝐸𝑆2 is second static elastic correction
applied. A decrease in Young modulus is linked with deformation of the formation and an increase
in the Young’s modulus shows high or strong UCS. A rock remains unbroken as far as the
deviatoric stress in the formation remains below yield stress/strength of the formation. But the rock
deformed as far as the deviatoric stress is higher than the yield strength. Strong grain to grain bond
depends on type of cementation materials (Goodman, 1989; Wilson and Cosgrove, 1982). The
presence of significant clay content also increases the unconfined compressive strength in a
sandstone formation whereas an increased siltstone and sandstone reduces the formation strength
(Oluyemi, 2007).
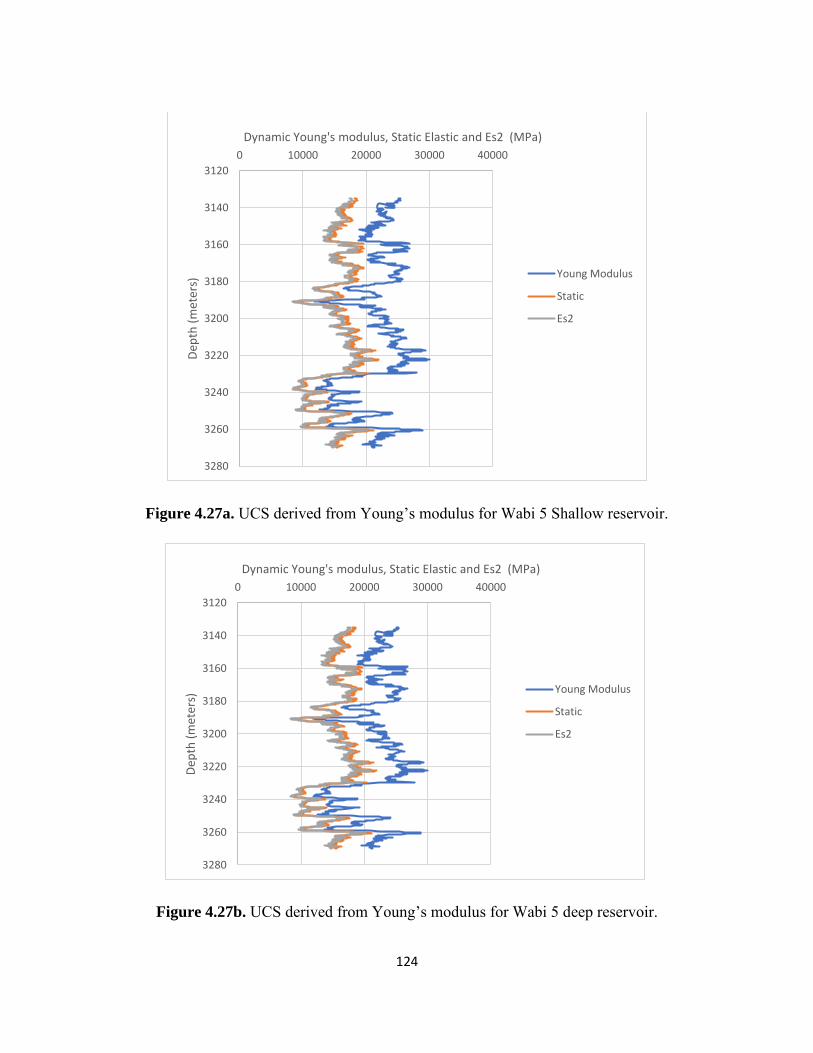
124
Figure 4.27a. UCS derived from Young’s modulus for Wabi 5 Shallow reservoir.
Figure 4.27b. UCS derived from Young’s modulus for Wabi 5 deep reservoir.
3120
3140
3160
3180
3200
3220
3240
3260
3280
0 10000 20000 30000 40000
Dep
th (
met
ers)
Dynamic Young's modulus, Static Elastic and Es2 (MPa)
Young Modulus
Static
Es2
3120
3140
3160
3180
3200
3220
3240
3260
3280
0 10000 20000 30000 40000
Dep
th (
met
ers)
Dynamic Young's modulus, Static Elastic and Es2 (MPa)
Young Modulus
Static
Es2
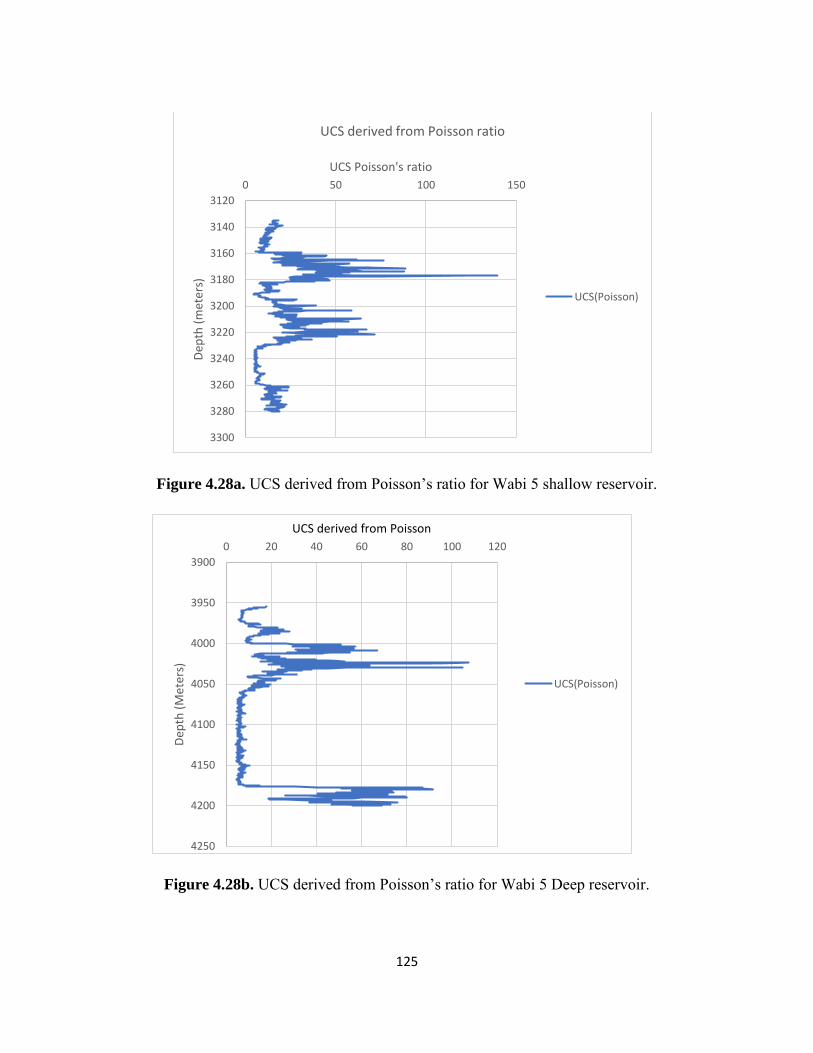
125
Figure 4.28a. UCS derived from Poisson’s ratio for Wabi 5 shallow reservoir.
Figure 4.28b. UCS derived from Poisson’s ratio for Wabi 5 Deep reservoir.
3120
3140
3160
3180
3200
3220
3240
3260
3280
3300
0 50 100 150D
epth
(m
eter
s)
UCS Poisson's ratio
UCS derived from Poisson ratio
UCS(Poisson)
3900
3950
4000
4050
4100
4150
4200
4250
0 20 40 60 80 100 120
Dep
th (
Met
ers)
UCS derived from Poisson
UCS(Poisson)
126
4.5.2 Poisson’s ratio of Wabi field
Acoustic logs are displayed as slowness (∆t) which is the reciprocal of velocity. Slowness of
compressional is denoted as ∆𝑡𝑐 and Slowness of shear wave denoted as ∆𝑡𝑠 . The ratio of
compressional and shear waves defines the Poisson’s ratio (ν) and this ratio provides additional
information about the formation’s lithology. Poisson’s ratio describes the ability of the formation’s
material to shorten parallel to overburden (vertical) stress with equivalent elongation in the
minimum principal stress direction Figures 4.29a-4.29b. Poisson (ν) have values between
0.00 and 0.5. This implies that (ν) value range of 0.05 signifies very hard and rigid rocks and 0.45
for soft poorly consolidated rocks. Thus, high Poisson’s ratio shows that the material is subject to
deformation which results into volume change. Consequent to the above analysis of Poisson’s
ratio, the more ductile a material becomes the more its Poisson ratio will increase because of lateral
expansion relative to longitudinal contractions and on the other hand, the more brittle a material
becomes the less the Poisson ratio.
Figure 4.29a. Poisson’s ratio in Wabi 5 for Shallow reservoir.
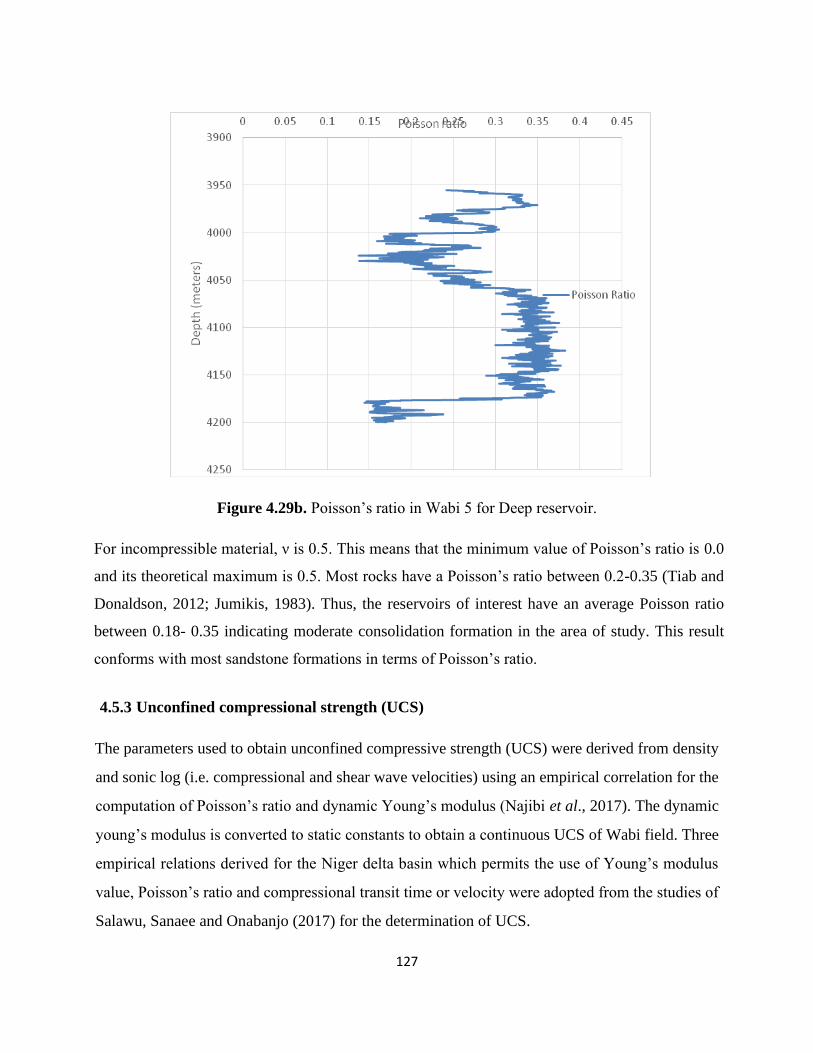
127
Figure 4.29b. Poisson’s ratio in Wabi 5 for Deep reservoir.
For incompressible material, ν is 0.5. This means that the minimum value of Poisson’s ratio is 0.0
and its theoretical maximum is 0.5. Most rocks have a Poisson’s ratio between 0.2-0.35 (Tiab and
Donaldson, 2012; Jumikis, 1983). Thus, the reservoirs of interest have an average Poisson ratio
between 0.18- 0.35 indicating moderate consolidation formation in the area of study. This result
conforms with most sandstone formations in terms of Poisson’s ratio.
4.5.3 Unconfined compressional strength (UCS)
The parameters used to obtain unconfined compressive strength (UCS) were derived from density
and sonic log (i.e. compressional and shear wave velocities) using an empirical correlation for the
computation of Poisson’s ratio and dynamic Young’s modulus (Najibi et al., 2017). The dynamic
young’s modulus is converted to static constants to obtain a continuous UCS of Wabi field. Three
empirical relations derived for the Niger delta basin which permits the use of Young’s modulus
value, Poisson’s ratio and compressional transit time or velocity were adopted from the studies of
Salawu, Sanaee and Onabanjo (2017) for the determination of UCS.
128
The application of the Young’s modulus values to estimate UCS gives a better estimate of the rock
strength, because its dynamic values were converted to static value, Figures 4.27-4.28. The
application of slowness (∆𝑡𝑐) with values greater than 100 𝜇s/ft or low velocities 𝑉𝑃 < 3000 𝑚/𝑠
for the estimation of unconfined compressive strength gives a lower result meaning that it under
predict the UCS. The above velocity is an indication of a poorly (weak) sedimentary rock (Chang,
Zoback and Khaksar, 2006). Although, the transit time derived equation for the Niger delta values
were not used in this study. Finally, the application of Poisson’s ratio for the estimation of UCS of
Wabi field gives a relatively good UCS, Figure 4.29.
4.5.4 Influence of rock strength
Wabi formation of interest with high 𝐾𝑜 value that is, the coefficient of earth pressure at rest which
varies with depth indicates stiff layers with concentration of stress and low value indicates soft
layers that have more strain (deformation).The use of 𝐾𝑜is applicable only when there is no lateral
compliance/compaction (Jones et al., 1992).
The porosity of Wabi field within the reservoir intervals are summarized in Tables 4.2-4.8. High
porous formation with porosity values of 45-35% reduces the young’s modulus (Herwanger and
Koutsabeloulis, 2011). Thus, intervals with high porosities are soft formation and are prone to
reservoir compaction during the productive stage of the field’s life. In these intervals the ratio
between dynamic to static elastic young’s modulus is high. Hence, sand control program should
be designed to mitigate this geomechanical problem from cutting down only production which
may eventually lead to loss of the wells (Herwanger and Koutsabeloulis, 2011). Pressure
maintenance should be anticipated to reinstate reservoir compaction caused by depletion or
pressure drawdown. For low porosity intervals, the observed difference between the dynamic to
static elastic is negligible.
4.5.5 Fracture and Fault stability Analysis
Most formations in the crustal region of the vertical composition of the earth contain several
structural imperfections and a number of planes of weaknesses known as rock defects (Jumikis,
1983). Rock formations are therefore prevented from exhibiting perfect elasticity due to the
129
presence of these rock defects. Therefore, rocks are often characterized to be inelastic. According
to the work of Morris, Ferrill and Henderson (2014) defined slip tendency as surface that may
fault, fracture or rupture in a stress field and relate it to the ratio of shear stress to the normal stress
including the orientation of the maximum determined shear stress. They summarized that slip
occurs on pre-existing fracture and fault plane when the determined shear stress equals or exceeds
the frictional resistance to sliding (i.e. shear strength).
[
4.5.6 3D Mohr Analytical diagram
Accurate assessment of the orientation of faults, fracture and failure envelope of Wabi field
depends on the magnitude of the in situ stress state for fault reactivation and possible breach of
cap rock integrity (Adewole, 2013).This analysis involves the computation of the shear and normal
stresses acting on an arbitrary oriented faults in 3D (Zoback, 2007).To address this geometrical
problem, it should be noted that the directions of the three principal stresses are not aligned
normally to our North-East down coordinate system (Schmitt, 2014; Allmendinger et al., 2012)
where these stress state can be resolved into a vector acting on the plane of weakness. One of the
simplest approaches to solving this problem is the utilization of 3D Mohr diagram, refer
Appendices (A-B). The 3D Mohr diagram is valuable for representing fault stability in the
subsurface formation (Zoback, 2007). In this study, the values of the average three principal
stresses in descending order of magnitude, , and were used to determine the 3D Mohr
circles (Zoback, 2007). Faults are represented by a point, situated in the space between 𝜎1 and 𝜎2
and 𝜎2 and 𝜎3 of the smaller Mohr circle defined as the differential stress or deviatoric stress ∆𝜎
Appendix (A and B), and the greater Mohr circle is defined by the difference between 𝜎1 and 𝜎3.
Also, from this 3D Mohr circle diagram, the shear stress can be determined.
According to Bell (1996) and Schmitt (2014), dry rock fails according to the proposed Mohr
Coulomb criterion equation. But in the subsurface our formation rock is porous in the reservoir
intervals and contains pore fluids. Therefore, the failure criterion in this case differs from that of
the dry rock. The Terzaghi equation for effective stress is very crucial in the explanation of pore
130
pressure and effective stress for the analysis of rock failure (Schmitt, 2014). The principal stresses
must be replaced by effective stress (Twiss and Moores, 1992; Schmitt, 2014; Bell, 1996) as:
where, the subscript i, is overburden stress, maximum horizontal (H) or Minimum horizontal stress
(h), 𝜎𝑒𝑓𝑓 is the effective stress and 𝑃𝑝 is the pore fluid pressure.
It is obvious that most formations in the crust are already wrecked and exhibit available plane of
weakness that support slip and ruptures if the appropriate conditions are in place. Appendices (A-
B) show shallow and deep reservoirs of Wabi 05. Appendices (a) and (b) represent the undisturbed
or virgin state of the effective stress before pore fluid pressure is agitated (Schmitt, 2014). The 3D
Mohr diagram and its failure envelope represent the potential plane of weakness in differing
orientations for the field of study. For convenience, we assume that cohesion C is approximately
zero because as sliding occurs, it vanishes (Timmerman, 1982; Schmitt, 2014). Exploitation of
hydrocarbon from Wabi field overtime would induce changes in the formation pore pressure which
resulted in depletion of the reservoir pressure. This decrease reduces the impact of slip in the
formation of interest. Thus, it caused the virgin stress state of the Mohr circle at hydrostatic state
to be shifted to the right (i.e. away from the failure envelope) leading to reservoir compaction due
to the consequences of large effective stress alternation (Schmitt, 2014; Nacht et al., 2010). It is
important to note that this does not affect cohesion rather it affects only the rock frictional strength
by reduction and subject the formation to be weaker (Zoback, 2007). The continuous modification
of the stress state by decrease in pore fluid pressure keeps Wabi field formation stronger (Schmitt,
2014).
On the other hand, when enhancement recovery injection of fluid is done, hence, increasing the
pore fluid pressure which decreases the effective normal stresses of the formation on the fault plane
and resulted or culminated in shifting of the virgin state of the Mohr circle to the left (Bell, 1996;
Schmitt, 2014). As the formation pore pressure keeps increasing due to injection of fluid and
necessitates further shifting of the Mohr circle to the left till it intercept the failure envelope of the
rock mass when slip or the rock fail under favorable conditions (i.e. fault reactivation on pre-
existing fault plane) (Schmitt, 2014; Nacht et al., 2010; Streit and Hillis, 2004; Bell, 1996). The
(
131
point at which the shifted Mohr circle touches the failure line, the shear strength and shear stress
of the formation are equal (minimum). This point is known as the plane of maximum obliquity
(Zoback, 2007). Thus, two zones are demarcated from the failure line as unstable and stable zone.
If the combination of the effective normal and shear stresses falls under the failure line, then the
formation is stable, and the shear strength of the formation is greater than the shear stress of the
formation (Jaeger, Cook and Zimmerman, 2007). But when the plot of effective normal stresses
and shear stresses exceeds the failure envelope, the shear strength of the rock is lesser than the
shear stress and the rock mass fail or slip. This analysis is known as the slip tendency analysis
(Morris, Ferill and Henderson, 2014; Streit and Hillis, 2004). The failure line properties (i.e
cohesion C and frictional angle ϕ) when varied update all available display interactively on the
Mohr circle (Twiss and Moores, 1992) and describe rock stability and instability.
132
CHAPTER 5
Summary, Conclusion and Recommendations
5.1 Summary of Research
This chapter summarizes and concludes the entire investigations carried out and recommends areas
for further studies to be executed to have good petrophysical and geomechanical representation of
Wabi field. Also, some mitigation strategies are mentioned to avoid severe damage that could be
caused by sand production in the future of the field.
The Niger Delta is an unconsolidated formation with naturally fractured reservoirs cause by lose
sands. These have posed major challenged for operators both multinational and indigenous
companies in developing their reserves. This unconsolidation also affects drilling, completion,
production and enhancement programmes. Therefore, the need to understand this naturally fracture
reservoir is one of the reasons that necessitated this research to look out the geomechanical
properties of Wabi field.
The field of study is a mature brown onshore field located at North-West of Port Harcourt, Rivers
State, Nigeria. The motivation for this study is sequel to the call by the Federal Government of
Nigeria for release and allocation of Marginal fields to indigenous oil and gas Companies. The
meanings of Marginal field and its characteristics have been detailed in previous chapter 1. The
operator of this field concluded to farm into this block for hydrocarbon potential evaluation and
to evaluate any possible geomechanical related issues the field may have for its upgrading and
development. This anticipation was made to boost the Nigerian economy and increasing energy
supply needed across the country.
This study adopted empirical correlations and best company practices for the investigation of the
study area. The following data set (i.e. Petrophysical wireline logs, Seismic data, DST/RFT, core
picture from Wabi) were collected for the Petrophysical and Geomechanical analyses for risk
assessment to enable mitigation strategy design for Wabi field. The elastic properties of reservoir
rocks derived from log data were bulk modulus (Kb), shear modulus (G) and Poisson’s ratio (v).
Young modulus (E) is subsequently, evaluated from shear modulus and Poisson’s ratio. The

133
strength of the reservoir rock was expressed in terms of Uniaxial compressive strength (UCS)
through a calibration with core laboratory.
Good knowledge of the mechanical properties of reservoir rocks is an important component of
pre-production investigations for both reservoirs. This would facilitate the design and
implementation of an economic development program for Wabi field. Consequently, this research
provides an understanding of Wabi reservoir description for optimal development plan and
management.
The mechanical properties log provides a quantitative means for identifying sands that are strong
enough to produce oil and gas without any form of sand control .The method is based on a
correction of in situ strength with the dynamic elastic moduli computed from sonic and density
logs. The assumption made in this study was that the reservoir rock is isotropic this implies that
the material exhibits a perfectly linear stress-strain relationship.
5.2 Conclusion
The ultimate objective of this research was to have detailed Petrophysical and Geomechanical
characterization of Wabi field in the Niger Delta province for hydrocarbon potential determination
and geomechanical related problems which include in-situ rock stress, modulus of elasticity,
formation porosity, leak off coefficient and Poisson’s ratio determination to ensure that proper
well planning/stable wellbore is achieved while we explore for more hydrocarbon reserves for
commercial exploitation. This study helps to mitigate against reservoir reactivation for injection
project and management of reservoir compaction and subsidence which could occur as we produce
from the reservoirs.
Table 4.2-4.8 shows the summary of Petrophysical analyses carried out in Wabi field. Table 4.2
showed the identification of reservoirs intervals from Top to bottom known as the reservoir
thickness. Tables 4.3-4.4 showed the type of hydrocarbon fluid identified and their contacts levels
between gas and water (GWC), gas and oil contact (GOC) and oil water contacts. Table 4.5 showed
various petrophysical properties these include reservoir thickness (net pay sand), net to gross,
134
hydrocarbon types, fluid contact, sand top and bottom, gross sand thickness, volume of shale,
porosity, effective porosity, water saturation, hydrocarbon, bulk volume water.
Wabi 5 well had average net sand thickness of 64.39m and 43.05m, effective porosity of 0.34 to
0.269, water saturation 0.231 and 0.117 and hydrocarbon saturation of 0.769 and 0.883 for shallow
and deeper reservoir. Low water saturation means that the reservoir has more hydrocarbon in place.
The hydrocarbon present in Wabi 5 is Gas. Wabi 11 had average net sand thickness of 58.60m and
64.47m for shallow and deeper reservoir, effective porosity of 0.2411 and 0.343, water saturation
of 0.167 and 0.076 hydrocarbon saturation 0.833 and 0.924. Hydrocarbon type is Gas. Wabi 6 had
average net thickness of 103.86m and 20.19m, effective porosity 0.2065 and 0.2723, water
saturation 0.0288 and 0.053 and hydrocarbon saturation 0.9712 and 0.947. Wabi 7 had net sand
thickness of 65.68m and 48.46m, effective porosity of 0.4397 and 0.43, water saturation of
saturation 0.1661 and 0.1467 and hydrocarbon saturation as 0.8339 and 0.8533. Hydrocarbon type
Gas.
Consequently, Wabi field has good reservoir quality for oil and gas production. The field is
identified as a gas field and production of gas from all wells could be harmonize to production
manifold for subsequent transportation to various customers such as Nigeria Liquified Natural Gas
(NLNG), Indorama, and Gas turbine stations) that need it for sale and power supply. In terms of
the first well to be produced, the asset manager would start with reservoirs with the highest reserves
and has huge thickness before producing from the reservoir with lower reserves (i.e Wabi 06,07,05
and 11) respectively is the order of producing if commingling is not allowed by DPR.
In order to address the aim and objectives of geomechanical characterization, two reservoir
intervals were picked at each well and from a total of four wells drilled in Wabi field. These wells
are: Wabi 5, Wabi 6, Wabi 7 and Wabi 11. The petrophysical analyses at the reservoir intervals
ranges from top to bottom as follows: 3158.795 m - 3228,899 m, 4000.04 m - 4045.763 m,
3887.862 m - 3997.286 m, 4053.216 m - 4078.972 m, 2915.26 m - 2984.144 m, 3340.76 m -
3429.61 m, 288.661 m 2962.185 m, 3513.263 m – 3591.597 m, respectively. The reservoir
qualities in terms of the total and effective porosity were as follows: 0.358-0.340 and 0.288- 0.269,
0.2226 – 0.2065 and 0.2723- 0.053, 0.4428 -0.4397 and 0.44-0.43, and 0.419-0.2411 and 0.273-
0.343, respectively. These porosities are good for storage and transmissivity of hydrocarbon. Also,
135
the hydrocarbon saturation for the respective intervals are 0.769 and 0.883, 0.9712 and 0.947,
0.8339 and 0.8533 and 0.833 and 0.924. These intervals are good for shallow reservoir
development because of the significant volume of hydrocarbon estimated therein.
Only two wells were used for the geomechanical properties investigation of Wabi field because of
the availability of sonic log in them, these were Wabi 5 and Wabi 11). However, the sonic 𝑉𝑃
modeled log for Wabi 11 showed errors within the intervals of interest, therefore only Wabi 5 and
few sections of Wabi 11 results are displayed in this study. The intervals considered for
Geomechanical rock properties of Wabi field ranges from 3160 m - 3230 m, 4000 m – 4050 m
and 3510 m – 3650 m for Wabi 5 and 11, respectively.
Young’s moduli (E) of the field are 23199.21 Psi, 33679.68 Psi, and 24.87 Psi while UCS ranging
between 23153.00 Psi, 33053.69 Psi. UCS derived from Poisson’s ratio is 29.90 Psi, 28.650 Psi
and 31.31.59 Psi. The UCS obtained with Young modulus parameter showed that the rock
formation has the capacity to withstand external forces and shown high strength against rock
failure. Poisson’s average ratio ranges between 0.2258, 0.21570 and 0.29935 meaning that, there
is small variation in volume of rock. Hence, this study shows Poisson’s ratio of 0.18- 0.35 which
indicates that the reservoir is stable.
The studied reservoirs show high porosity with poor cementation this signifies its vulnerability to
deformation. Although, it is in the consolidated region in the Niger Delta. Therefore, the ratio of
dynamic to elastic constant, that is, Young’s modulus constant is between 10 MPa to 20 MPa. It
is obvious that, rock strength decreases with increasing porosity with variation in Co between
porosity of 30-35%.
For pore pressure prognosis in case of drilling further wells in Wabi field, the mud window for the
field can be designed since the drilling equivalent mud weight ranges between 1.05163 g/cm3-
1.366642 g/cm3 and 1.010686 g/cm3-1.127057 g/cm3. Mud weight must be greater than the pore
pressure gradient and less than the fracture gradient for the avoidance of wellbore instability, fluid
influx and pressure kicks in an open hole drilled.
From this study, the average in situ stress principal stresses are: =3112.65 Psi, =2356.63 Psi,
= 1607.80 Psi in shallow reservoir and in deep reservoir; = 4409.29 Psi, = 4115.27 Psi,
136
=2639.04 for Wabi 5. While for Wabi 11 they are; =3617.90 Psi, =3709.42Psi, 2375.85
Psi. These in situ stress trends indicated normal faulting regime in Wabi field, however, rock
anisotropy exists in some parts of the reservoir thereby causes different stress regime existence.
Where any small difference between and will affect stress orientation and fracture
propagation design in Wabi field, if the need arises. The estimated hydrostatic pressure are;
1384.37 Psi, 1732.95 Psi and 1520.68 Psi.
The estimated principal stresses and pore pressures above were used to construct 3D Mohr diagram
for Wabi field. The Mohr diagram for the interval of interest at hydrostatic pressure indicated that
the reservoirs are stable as the combined normal effective and shear stresses are below the failure
envelope, but as exploitation activities progresses, it would reduce the effective stress and the
reservoir would be compacted leading to subsidence. On the other hand, increasing pore fluid
pressure by injection of fluid would cause fault reactivation and fracturing of the reservoirs at both
chosen depth as shown in 3D Mohr diagram for this study (Appendices A-B).
The estimation of the mechanical behavior of the rock mass was done to understand the
formation’s properties to mitigate what will cause risk to Wabi reservoir either during exploitation
or recovery phases. This is essential for stimulation and completion design to prevent fault
reactivation, fracturing of the reservoir and subsidence.
Addressing the technical challenges that would be faced for development of Marginal and
Brownfield in the Niger Delta and elsewhere requires a generic workflow and integrated solution
as demonstrated in this study. Therefore, geomechanical analysis play an important role in a field
life spanning from exploration, appraisal, and development to production of hydrocarbon to
prevent the risks and boost daily crude production required in our today’s energy demand.
In summary, the followings conclusions are made: Wabi field has pockets of potential hydrocarbon
reserves at different intervals with good reservoir qualities to enhance its development for
production. Also, rock strength estimation in this field shows that the reservoir is stable; however,
production of hydrocarbon from these zones may lead to subsidence in the future. To mitigate for
this futuristic event reservoir pressure maintenance should be planned for.
137
5.3 Recommendations
After a careful study and analysis of data collected, the following recommendations are made:
1. Active sand control methods such as screens, slotted liners and gravel pack completion
designed is recommended for the study area.
2. Proper pressure maintenance should be planned for the longevity of the reservoir.
3. Lack of appropriate data from Oil and Gas industry is highly needed to better understand
the phenomena that may trigger or induce Seismicity or subsidence in the study area.
4. Fracture data from Wabi field alongside rock mechanical properties from Laboratory
testing should be used for the construction of the 3D Mohr diagram and compare with the
model obtained in this study.
5. The results presented in this study were based on log derived, to serve as representative
values of the geomechanical properties of the field. Thus, further studies should be
conducted in the area using laboratory core testing for geomechanical properties to validate
results.
6. More information from exploration to development phases of the reservoirs are needed as
major input to understand the physics and geomechanics of the in-situ stresses for
reappraisal, well completion, and accurate predictive model and for development strategy.
7. Pressure information from leak of test (LOT), mini and micro fracture test from Wabi field
should be used to validate the result in this study.
8. Type of drilling fluid used for Wabi field drilling should be specified for its usage for
further analysis of stress effect.
9. This study focuses on macro-mechanical rock properties of Wabi field; therefore, further
studies should be conducted on micromechanical properties as this may focus more on the
initiation and propagation of failure or fracture in Wabi field.
10. Also, further studies should be carried out in respect to temperature conditions of the field
and its effect on the rock properties.
11. Finally, to predict real time sanding issue in the field, simulation study must be done. This
is what my PhD research will be focusing on.
138
REFERENCES
AADNOY, B.S. and LOOYEH, R., 2011. Petroleum rock mechanics. drilling operations
and well design. Elsevier, Amsterdam: Gulf Professional Publishing.
ABDIDEH, M. and AHMADITFAR, A., 2013. Predication of geomechanical modeling
and selection of suitable layer for hydraulic fracturing operation in oil reservoir (South
West of Iran). European Journal of Environmental and Civil Engineering.
ABDIDEH, M. and FATHABADI,M.R., 2013. Analysis of stress field and determination
of safe mud window in borehole drilling. Case study: South West Iran. Journal of
Petro. Production Tech. Springer, 3, pp.105-110.
ABIJA, F.A. and TSE, A, C., 2016. Geomechanical evaluation of an onshore oil field in
the Niger Delta, Nigeria. Journal of Applied Geology and Geophysics, 4(1). pp.99111.
ABIJA, F.A. and TSE, A. C., 2016. In-situ stress magnitude and orientation in an
onshore field Eastern Niger Delta: Implications for directional drilling. SPE-
184234MS.
ABIOLA, S.O., NWABUEZE, V.O., OKORO, F.O. and AJIENKA, J.A., 2014. Review of
sand production from oil well completions across depositional environments in the
Niger Delta. SPE- 172484-MS.
ADAMU, M.A., AJIENKA, J.A. and IKIENSIKIMA, S.S., 2013. Economics analysis on
the development of Nigeria offshore marginal fields using probabilistic approach.
Advances in Petro. Explo. and Dev., 6(1), pp. 11-21.
ADDIS, M.A. LAST, N. and YASSIR, N.A., 1996. Estimation of horizontal stresses at
depth in faulted Regions and their relationship to pore pressure variation. SPE.
ADDIS, M.A., LAST, N.C., and YASSIR, N.A., 1994. The estimation of horizontal stress
at depth in faulted regions and their relationship to pore pressure variations. Eurorock
’94, Balkema, Rotterdam. pp. 887 – 895.
ADDIS, M.A., LAST, N.C., and YASSIR, N.A., 1996. Estimation of Horizontal Stresses
at Depth in Faulted Regions and their Relationship to Pore Pressure Variations. SPE
Res. Eva. and Eng.,11(1), pp.11-18. SPE-28140-PA. available from:
http://dx.doi.org/10.2118/ 28140-PA.
ADETOBA, L.A., 2008. The Nigeria marginal field development initiative-issues and
challenges. Society of Petroleum Engineers, 119709 Abuja, Nigeria.
ADEWOLE, E.O. and HEALY, D., 2013. Quantifying in-situ horizontal stress in the
Niger Delta basin. Nigeria. Journal of Engineering Technology, 2(3), pp.88.
ADEWOLE, E.O., 2013. Overpressure in the Northern Niger Delta Basin, Nigeria
mechanical, probability and classification. Ph.D. thesis, University of Aberdeen.
139
AHMED, U., MARKLEY, M.E., CRARY, S.F., 1991. Enhanced in-situ stress profiling with
micro fracture, core and sonic logging data. SPE Form. Eval. 6(02). 243-251.
AJAYI, O., 2017. Marginal field bid rounds. IJALP oil and gas. Available from: https://www.olaniwunajayi.net/wp-content/uploads/2017/89/FG-TO-OPEN-BIDROUNDS-FOR-30-MARGINAL-OIL-FIELDS-pdf.
AL-AMJMI, A.M., SULTAN, Q.U. and ZIMMERMAN, R.W., 2006. Stability analysis of
deviated boreholes using the Mogi-Coulomb failure criterion, with application to some
oil and gas reservoir. International Association of Drilling Contractors/SPE.
ALLEN, J.R.L., 1965. Late quaternary Niger Delta and adjacent areas: Sedimentary
environments and Lithofacies. Bull. Ameri. Asso. Petro. Geolo.
ALLMENDINGER, R.W., 2015. Modern Structural Practice: A structural geology laboratory
manual for the 21st Century. Available from:
http//www.geo.cornell.edu/geology/faulty/RWA/structure-lab-manual.
ALLMENDINGER, R.W., CARDOZO and FISCHER, D. M., 2012. Structural geology
algorithms. London: Cambridge University Press.
ALMISNED, O.A. 1995. A model for predicting sand production from well logging data.
PhD thesis. University of Oklahoma, USA.
AMADEI, B. 2007. Suggested methods for rock characterization, testing and
monitoring. Springer. Amsterdam.
ANDERSON, E.M. (1951). The dynamic of faulting and dyke formation with application
of Britain. Edinburgh Oliver and Boyd.
ARCHER, S. and RASOULI, V., 2012. A log-based analysis to estimate mechanical
properties and In situ stresses in a shale gas well in North Perth Basin. Transaction
on Engineering Sciences. 81, pp. 163-173.
Asquith, G. and Gibson, C., 1982. Basic Well log analysis for geologists. The American
Association of Petroleum Geologists. Methods in Exploration Series Number 3.
AVASTHI, J.M., NOLEN–HOEKSEMA, R.C., and ELRAAA, A.W.M., 1991. In situ stress
evaluation in the McElroy Field, West Texas. SPE Formation Evaluation, pp. 301308.
AVBOVBO, 1978.Tertiary lithostratigraphy of Niger Delta. American association of
Petroleum Geologists Bulletin,62 (2),295-300.
AYDIN, A., 1978. Small faults formed and deformation bands in sandstone. Pure and
Applied Geophysics, 16, pp.913-930.
BAI, M. and LI, G., 2012. A comprehensive approach on determining correlation
between sonic and density log measurements from the Gulf of Guinea of Mexico and
North Sea fields for improved reservoir descriptions. SPE-152195.
140
BAKER HUGES INTEQ 1996.Geological Procedures Workbook. Training and
Development Houston U.S.A.
BALARABE, T. and ISEHUNWA, S., 2017. Evaluation of sand production potential
using well logs. SPE-189107.
BARTON, C.A. and ZOBACK, M.D., 1994. Stress perturbations associated with active
faults penetrated by boreholes: Possible evidence for near-complete stress drop and
a new technique for stress magnitude determination. Journal of Geophysics
Researchers, Vol. 99, pp. 9373-9390.
BAULAC, J., GROSDIDIER, E. and BOUTET, 1986.Biostratigraphical study of Wabi
10.Direction exploration division richer ches et application on geologie Laboratoire
establissement de Boussens.
BOSSIOUNI, ZAKI. 1994.Theory, Measurement and Interpretation of well logs.
Society of Petroleum Engineers Inc.
BECKER, A., BLUMLING, P. and MULLER, W.H., 1987. Recent stress field and
neotectonics in the Eastern Jura mountains, Switzerland. Tectonophysics, Vol. 135,
pp. 277-288.
BELL J.S., 1993. Attached and detached in situ stress regime in sedimentary basins:
European Association of Petroleum Geoscientist and Engineers. 5th Conference and
Technical Exhibition. Stavanger, Norway. 7 – 11. June 1993, Extended Abstracts of
papers F046.
BELL, 1996. “Applications of stress measurements”. Geoscience Canada, 23(3), pp.
135-153.
BELL, 1996. In situ stresses in Sedimentary rocks (Part 1): Measuring technique.
Geoscience Canada, 23(2), pp. 85-100.
BELL, J.S., and Babcock, E. A., 1986. The stress regime of the Western Canadian
basin and implication for hydrocarbon recovery. Canadian Petroleum Geology,
Bulletin, Vol. 34, pp. 364-378.
BENETITOS, C., RECCA, V., SACCHI, Q. and VERGA, F., 2015. How to approach
subsidence evaluation for marginal fields. A case history. The Open Petroleum
Engineering, Journal, 8, 214-234.
BESSA, F., 2004. Reservoir characterization and reservoir modeling in the
northwestern part of Hassi Messaoud field Algeria. PhD. Thesis. University of
Hamburg, Germany.
BIDOGOLI, M.N. and JING, L., 2014. Anisotropy of strength and deformation ability
of fractured rocks. Journal of Rock Mechanics and Geotechnical Engineering, 6,
156164.

141
BIENIAWSKI, Z.T., 1974. Estimating the strength of rock materials. Journal of South
African Institution of Mining and Metallurgy, 312-320.
BIOT, M.A., 1941. General theory of three-dimensional consolidation. Journal of
Applied Physics, 12, 155 – 164.
BIOT, M.A., 1956a. “General solutions of the equations of elasticity and consolidation
for a porous material”. Journal of Applied Mechanics. 23, 1, 91-96.
CARBOGNIN, L., GATTO, P., MOZZI, G. and GAMBOLATI, G., 1978. Land subsidence
of Ravenna and its similarities with the venice case, Proc. of engineering foundation.
Conf. on evaluation and prediction of subsidence, New York, 254-266.
CARNEGIE, A., THOMAS, M., EFNIK, M. S., HAMAWI, M., AKBAR, M. and BURTON,
M., 2002. An advanced method of determining in situ reservoir stresses: wireline
conveyed micro-fracturing. In Abu Dhabi International Petroleum Exhibition and
Conference. Society of Petroleum Engineers.
CASTAGNA, J.P., BATZLE, M.L. and EASTWOOD, R.L., 1985. Relationships between
compressional wave and shear wave velocities in clastic silicate rocks. Geophysics,
50, 571-581.
CERVENY, K., DAVIS, R., DUDLEY, R. F., KAUFMAN, P., KNIPE, R. and KRANTZ, B.,
2004. Reducing uncertainty with fault seal analysis. Available from:
www.slb.com/2/media/file/.../04-faultsealanalysispdf
CESARO, M., CHEUNG, P., ETCHECOPAR, A. and GONTALINI, M., “Shaping up to
stress in the Apennines, “Italy 2000: Value Added Reservoir Characterization (Well
evaluation conference, Italy) Schlumberger 1997.
CHANG, X., ZOBACK, M.D. and KHAKSA, A., 2006. Empirical relations between rock
strength and physical properties in Sedimentary rocks. Jour. of Sci. and Engineering,
5(1), pp. 223-237.
CHIN, L.Y., and RAMOS, G.G., 2002. Predicting volumetric sand production in weak
reservoirs. Society of Petroleum Engineering - 78169-MS.
DAFFAUT, K. and LANDRO, M., 2006. Vp/Vs ratio differential stress and rock
consolidation of comparison between rock models and time –lapse AVO data. Society
CREWES research report (9).
DARVISH, H., NOURI-TALEGHANI, M., SHOKROLLAHI, A. and Tatar, A., 2015. Geo-
mechanical modeling and selection of suitable layer for hydraulic fracturing operation
in an oil reservoir (South West of Iran). Journal of African Earth Sciences, III, 409-
420.
DASSAULT, 2015. Systemes Simulia: Reservoir Geomechanics. Available from:
file///E/Geomechanics/whitepaper-reservoir geomechanics.pdf.
142
DASSEAULT, M., 2011. Lecture slides: Petroleum in the value chain: Available from:
file:///e:/Geomechanics/a_intro_to_Geome.pdf.
DAVATZES, N. C., and A. AYDIN, 2005, Distribution and nature of fault architecture
in a layered sandstone and shale sequence: An example from the Moab fault, Utah,in
R.Sorkhabi and Y. Tsuji, eds., Faults, fluid flow, and petroleum traps: AAPG Memoir
85, p. 153–180
DEPARTMENT OF PETROLEUM RESOURCES (DPR), 1999. Available from: DPR
website.
DETOURNAY, E. and CHENG, A.H.D., 1993. Fundamentals of Poroelasticity in
comprehensive Rock Engineering, J. A Hudson, ed., Pergamon, Oxford 113 – 171.
DOUST. H. and OMATSOLA, E., 1990. Niger Delta, in Edwards, J. D. and Santogrossi,
P.A., eds., Divergent/passive Margin Basins, AAPG Memoir 48: Tulsa, American
Association of Petroleum Geologists, pp. 239‐248.
DUAN, K., KNOK, C.Y. and THAM, L.G., 2014. Micromechanical Analysis of the failure
Process of brittle rock. International Journal for Numerical and Analytical Methods in
Geomechanics, 39, pp. 618-634.
DUSSEAULT, M.B., 2011. Geomechanical challenges in petroleum reservoir
Exploration. KSCE. Journal of Civil Engineering, 15(4), pp. 669-678.
ECONOMIDES, M.J. and NOLTE, K., 2000. Reservoir Simulation. 3rd Edition.
Chichester: John Wiley and Sons Ltd.
ECONOMIDES, M. J., HILL, A.D., ECONOMIDES, C. and ZHU, D., 2013. Petroleum
Production Systems. Prentice Hall. Pearson Education. USA.
ECONOMIDES, M.J., WATTERS, L.T. and DUNN-NORMAN, S., 1998. Petroleum well
construction: John Wiley & Sons Ltd.
ETU-EFEOTOR, J.O., 1999. Fundamental of petroleum geology. Jeson services.
ETU-EFFEOTOR, J.O., 1997. Manual of Petroleum Geology. Manuscript edn. Nigeria:
Uniport.
EVAMY, B.D., HAREMBOURE, J., KAMERLING, P., KNAAP, W.A., MOLLOY, F.A. and
ROWLANDS, P.H., 1978. Hydrocarbon habitat of Tertiary Niger Delta. American
Association of Petroleum Geologists Bulletin, Vol. 62, pp. 277‐298.
EVANS, K.F., ENGELDER, T. and PLUMB, R.A., 1989. Appalachian stress study 1. A
detailed description of in situ stress variations in Devonian shales of the Appalachian
Plateau. Journal of Geophysical Research, 94, pp. 7129-7154.
143
EZE, G. L., SUNDAY, V. N., UGWU, S. A., UKO, E. D. and NGAH, S. A., 2011.
Mechanical model for Nigerian interpolate Earth tremors. Available from:
https//earthzine.org/2011/…./Mechanical-model-for- Nigeria.int….
FANG, Z. and KHAKSAR, A., 2011. Complexity of mini fracture tests and implecations
for in-situ horizontal stresses in coalbed methane reservoir. In International
Petroleum Technology Conference.
FEE, D.A. and O’DEA, J., 1986. Technology for developing marginal offshore oil fields.
London and New York: Elsevier Applied Science Publishers
FERRILL, D.A., WINTERLE,G., WITMEYER, D. ,SIMS, S., COLTON, A., ARMSTRONG
and A.P. MORRIS.,1999.Stress rock strains groundwater at Yacca Mountain, Nevada.
Geological society of America today, 9, 1-8.
FERRILL, D.A.A.P., MORRIS, D.W. SIMS, D.G. WAITING and S. HASEGAWA, 2005.
Development of synthetic layer dip adjacent to normal faults in R. Sorkhabi and Y.
Tsuji, eds., Fault, fluid flow and petroleum traps. AAPG Memoir 85, 125-138.
FOWLES, J., and BURLEY,S.D., 1994, Textural and permeability characteristics of
faulted, high porosity sandstones: Marine Petroleum and Geology, v. 11, p. 608– 623
FJAER, E., HOLT, R.M. HORSRUD, P., RAAEN, A.M. and RISNES, R., 2008. Petroleum
related rock mechanics (2nd edition). Amsterdain Elsevier.
GARDNER, G.H.F, GARDNER, L.W. and GREGORY, A.R., 1974. Formation velocity and
density: the diagnostic for stratigraphic traps. Geophysics, 39, 770–780.
GEOSERVICES, 2004. Lecture slide: Competence assurance system. Quantitative
pressure detection. Presented at Port Gentile Gabon.
GHOLAMI, R. AADNOY, B., RASOULI, V. and FAKHAN, N., 2016. An analytical model
to predict the volume of sand during drilling and production. Journal of Rock
Mechanics and Geotechnical Engineering 8, 4, pp. 521-532.
GODMUNDSSON, A., 2011. Rock fractures in geological process. Cambridge.
GOODMAN, R.E.,1989. Introduction to Rock mechanics second edition. New York:
John Wiley & Sons.
GREENBERG, M.L. and CASTAGNA, J.P., 1992. Shear wave velocity estimation in
porous rocks: Theoretical formulation, preliminary verification and applications.
Geophysical Prospecting, 40,195-209.
GUTIERREZ, M., 1996. The role of geomechanics in reservoir simulation. Society of
Petroleum Engineers.
HAACK, R. C., SUNDARARAMAN, P., DIEDJOMAHOR, J. O., XIAO, H., GANT, N. J.,
MAY, E. D. and KELSCH, K., 2000. Niger Delta Petroleum Systems, Nigeria, In M.R.
144
Mello and B. J. Katz, eds., Petroleum Systems of South Atlantic Margins, AAPG Memoir
73, pp. 213 – 231
HAMID, O., OMAIR, A. and GUIZADA, P., 2017. Reservoir geomechanics on
carbonates. SPE- 183704-MS.
HAN, G. and DUSSEAULT, M.B., 2005. Strength variation with deformation in
unconsolidated rock after water breakthrough. SCA2002- 22
HAZZARD, J. F. and YOUNG, R.P., 2000. Micromechanical modeling of cracking and
failure in brittle rocks. Journal of Geophysical Research, Vol. 105, B7, pp. 16, 683-
16, 697.
HEGAZY, M. and LAKMIKANTHA, M.R., 2014. Geomechanics: a new star in the horizon
to change the fortunes in E&P projects. SPE. Doi: 10: 2118/169914 – MS
HEIDBACH, O., TINGAY, M., BARTH, A., REINECKER, J., KURFEß, D. and MÜLLER, B.,
2008. The World Stress Map database release
2008.doi:10.1594/GFZ.WSM.Rel2008.
HERWANGER, J. and KOUTSABELOULIS, N., 2011. Seismic Geomechanics. “How to
build and calibrate Geomechanical models using 3D and 4D seismic data”.
Netherlands: EAGE publication.
HIBBELER, J. and RAC, P., 2005. Simplifying hydraulic fracturing theory and practice.
In SPE 97311, SPE Annual Technical conference and exhibition, Dalas, Texas, USA.
HILLIS, R.R., MILDREN, S.D., PIGRAM, C.J. and WILLOUGHBY, D.R., 1997.
Horizontal Stress Orientation in the Australian North West Continental Shelf: Stress
Rotation Associated With a Convergent Plate Boundary. Tectonics, 16(2), pp. 323335.
HOEDEMAN, G., 2015. Multi-scale Geomechanics. How much model complex is
enough? Society of Petroleum Engineering -177634-MS.
HOLBROOK, P.W., MAGGIORI D.A., 1993. Real time pore pressure and fracture
gradient evaluation in all sedimentary lithologies. In: Proceedings of Offshore
European Conference. Aberdeen, Scotland, SPE: 1993. Paper SPE 26791.
HOWARD, K.A. and JOHN, B.E., 1987. Crustal extension along a roof system of
imbricate low angle fault: Colorado River extensional corridor, California and Arizona.
HUBBERT, M.K and RUBEY, W.N., 1959. Role of fluid Pressure in Mechanics of
overthrust faulting. Bull. Geol. 502. Ame. 70, 115 – 205.
HUBBERT, M.K. and WILLIS, D.G., 1957. Mechanics of hydraulic fracturing. Petro.
Trans. AIME, 210, 153- 163.
HUCKA, V. and DAS, B., 1974. Brittleness determination of rocks by different
methods. International Journal of Rock Mechanics and Mining Science and
Geomechanics Abstracts.
145
HUDSON, J.A and HARRISON, J.P., 2000. Engineering rock mechanics: an
introduction to the principles. UK: Elsevier Science Ltd.
HUDSON, J.A.,and HARRISON, J.P. and 1997. Engineering rock mechanics. An
introduction to the principles.First edition. London: Elsevier.
HUGO, H.E. and IAN, R., 2014. NAPE Lecture slides: Addressing the challenges in
Nigerian development and brown-fields wireline logging advances. NAPE Port
Harcourt.
ILLO, C.A., 2015. Reservoir characterization in Fanito Oil field: An integration of
seismic and petrophysical log data in the onshore Niger Delta Nigeria. MSc Thesis.
University of Nsukka.
JAEGER, J.C. and COOK, N.G., 1979. Fundamental of Rock mechanics. 3rd ed.
London: Chapman and Hall.
JAEGER, J.C., COOK, N.G.W. and ZIMMERMAN, R.W., 2007. Fundamentals of rock
mechanics. Fourth edition. USA: Blackwell publishing.
JAMSHIDIAN, M., ZADEH, M.M., HADIAN, M., NEKOEIAN, S. and Zadeh, M.M., 2016.
Estimation of minimum horizontal stress, Geomechanical modeling and hybrid neural
Network based on Conventional well logging data: A case study. Geosystem
Engineering, 20(2), pp.88-103.
JONES M.E., LEDDRA, M.J., GOLDSMITH, A.S. and EDWARDS, D., 1992. The
Geomechanical Characteristics of Reservoirs and Reservoir Rocks, Health and Safety
Executive - Offshore Technology Report. London: HMSO Books.
JUMIKIS, A.R., 1983. Rock Mechanics.2nd edition. Germany: Trans Tech
Publications.
KACHI, T.H., YAMADA, K., YASUHARA, M., FUJIMOTO, S., HASEGAWA, S.I. and, R.
SORKHABI., 2005. Fault-seal analysis applied to the Erawan gas-condensate field in
the Gulf of Thailand, In F. Sorkhabi and Y. Tsuji, eds., Faults, fluid flow and petroleum
traps. AAPG memoir, 85, 59-78.
KANG, Y,YU. M. MISKA, S. and TAKACH, N., 2009. Wellbore stability: A critical review
and introduction to DEM. SPE 124669.
KATAHARA, K.W., 1996. Estimation of in situ stress profiles from well logs. SPNLA
37TH Annual logging symposium.
KIDAMBI, T., KUMAR, G.S., 2016. Mechanical earth modeling for a vertical well drilled
in a nationally fracture light carbonate gas reservoir in the Persian Gulf. Journal of
Petro. Sci. Eng., 141, 38-51.
146
KIM, A., 2012. Sand control mechanism and its impact on mature fields. Available
from. https://halliburtonblog.com/sand-control-mechnaism and its impact on mature
fields.
KONIETZKY, H.H., ISMAEL, M.A., and FREIBERG, B., 2017. Failure Criteria for rocks.
Geotechnical institute Available from:https://tufreiberg/…/gt/…
/23_Failure_Criteria_rocks.pdf.
KOZLOWSKI, K.A., FIDAN, M., DONALD, A., SHOTLON, P., NIELSEN, H., ANDERSON,
N. AND JOCKER, J., 2011. Overburden characterization for geomechanics and
geophysical applications in the Ekofisk Field. A North sea case study. SPNLA 52nd
Annual logging symposium.
KULASINGA, R., BEGGS, D. and COHEN, J., 2014. Marginal fields in Nigeria: recent
development. Available from: https:///www.denton.com….2014.
LANGHI, L., 2014. Lecture slide: Geomechanics for reservoir and beyond. Avaiable
from:https://www.sut.org/wp-content/uploads/2014/07/Langhi-reservoirGeomechanics-WEB-APPROVED,onsite.pdf.
LARIONOV, V.V., 1969. Radiometry of boreholes in (Moscow: Nedra).
LAWRENCE, S. R., Monday, S. and Bray, R., 2002. Regoinal Geology and Geophysics
of the Eastern Gulf of Guinea (Nider Delta to Riomuni): The Leading Edge, Vol. 21,
pp. 1112 – 1117.
MAGNENENT, V., Cornet, F.H. and Fond, C., 2007. A Nontectonic origin for the
present-day stress field in the Paris basin (France). Journal of Geophysical research.
Solid earth 122, pp. 9313-9327.
MAJIDI, R., EDWARDS, S., ZHANG, J., SANT, R. and LAST, N., 2015. Drilling depleted
sands. Geomechanics, challenges and mitigations. SPE- 174741-MS.
MALEKI, S., MORADZADEH, A., RIABI, R.G. and SADAGHZADEH, F., 2014.
Comparison of several different methods of in situ stress determination. International
Journal of Rocks Mechanics and Mining Science. 7, 395-404.
MARTEY, A.O., 2000. Lecture Note: Petrophysics for Shell intensive training
programme univation.
MCDERMOTT, C. and KOLDITZ, 2005. Geomechanical model for fracture deformation
under hydraulic, mechanical and thermal loads.Hydrogeology. Journal. 14, 485-498.
MERKI, P.J., 1972. Structural geology of the Cenozoic Niger delta, Proceedings of
African Geology Conference, Ibadan, Nigeria 1972, Ibadan University Press, pp. 635-
646.
MOCKORCIAKOVA, A. and PANDULA, B. (2003). Study of the relation between the
static and dynamic moduli of rocks. Metalurgija, 42 (1), 37-39.
147
MORRIS, A., FERRILL, D.A. and HENDERSON, D.B., 1996. Slip-tendency analysis and
fault reactivation. The Geological Society of America. Vol. 24-5, pp. 275-278.
MURPHY, W., REISCHER, A. and HSU, K., 1993. Modulus decomposition of
compressional and shear velocities in sand bodies. Geophysics, 58, 227–239.
NACHT, P.K., DE-OLIVERIA, M.F.F., ROEL, D.M. and COSTA, A.M., 2010. Investigation
of geological fault reactivation and opening. Associacion Argentina de Mecania
computacional, Vol. 29, pp. 8689-8697.
NAJIBI, A.R., GHATOORI, M., LASHKARIPOUR, G.R., and ASEF, M.R., 2017. Reservoir
Geomechanical modeling: In-situ stress, pre pressure, and mud design. Journal of
Petroleum Science and Engineering, 151, pp. 31- 39.
NEW CROSS PETROLEUM LIMITED, 2010: Fate of Nigeria’s marginal fields. Available
from: http://www.newcrosspet.com/fate-of-Nigeria-marginal-fields.
NOROUZI, S., BAGHBANAN, A. and KHANI, A., 2013. Investigation of grain size
effects on Micro/Macromechanical properties of intact rock using voronoi element –
discrete element method approach. Particulate Science and Technology, 31: 507-
514.
NORRIS, A., 1992. On the correspondence between Poroelasticity and
thermoelasticity, J. Appl. Phys., 71, 1138-1141.
NOURI, A., VAZIRI, H., BELHAY,H.,ISLAM,R., 2003.Effect of volumetric failure on
sand production in Oil-wellbore :SPE Asia Pacific Oil and Gas conference and
Exhibition. Jakarta, Indonesia. Society of Petroleum Engineering.
OFFIA, U.S., 2011. Development and management of Marginal field in the Niger Delta
basin: Opportunities and challenges. Petro.Tech. Dev. Jour., 1(1), pp.1-9.
OJO, A.O., ADEPELUMI, A.A. and OJO O.A., 2019. Abnormal pressure detection using
integrated Approach in Oluku Field, East Niger-Delta, Nigeria. Journal of Geography,
Environment and Earth Science International, 9(3), pp. 1-11.
OLUYEMI, G.F., 2007. Intelligent grain size profiling using neural network and
application to sand potential prediction in real time. PhD Thesis. Robert Gordon
University. Aberdeen.
OMAR, I., 2015. Reservoir geomechanics lecture slides. Stanford University. Available
from: https://lagunita.Stanford.edu./Course v1…about.
OSISANYA, S.O., 2010. Practical guidelines for predicting sand production’’. SPE
136980, paper presented at the 34th Annual SPE International Conference and
Exhibition held in Tinapa, Calabar, Nigeria.
OSTADHASSAN, M., ZONG, Z. and ZAMRIAN, S., 2012. Geomechanical modeling of
an anisotropic formation-Bakken: Case study. 46th US Rock
148
Mechanics/Geomechanics Symposium American Rock Mechanics Association.
OTTI, P.E. and WOOD, J.D., 2005. World Oil: Modern sandface completion practices
Handbook. Houston Texas: Gulf Publishing Company.
OYENEYIN, B., 2015.Integrated sand management for effective hydrocarbon flow
assurance. Amsterdam: Elsevier.
POLLARD, D.D. and FLETCHER, R.C., 2005. Fundamental of structural Geology.
Cambridge and New York: Cambridge University Press.
RAJABI, M., TINGAY, M. and HEIDBACH, O., 2016. The present-day state of tectonic
stress in the Darling Basin, Australia: Implications for exploration and production.
Marine and petroleum geology, 77, pp. 776-790
RASOULI, V., PALLIKATHEKATHIl, Z.J. and MAWULI, E., 2011. The influence of
perturbed stresses near faults on drilling strategy:A case study in Blacktip field, North
Australia. Journal of Petroleum Science and Engineering, 76, pp.37-50.
RATH, J.S., ARGUELLO, J.G., STONE, C.M. and SOBOLIKE, S.R., 2009. Evaluating the
present in-situ stress state for the Richton, MS Strategic Petroleum reserve site using
geomechanical analysis.Publication.
RIDER, M.H. 1986.The Geological interpretation of well log.John Wiley and Sons.New
York.
ROSEPILER, M.J., 1979. Determination of principal stress and confinement of
hydraulic fractures in cotton valle. In SPE- 8405-MS, SPE Annual Tech. Conf. and
Exh. Las Vegas, NV: SPE.
SALAWU, B.A., SANAEE, R. and ONABANJO, O., 2017. Rock compressive strength: a
correlation from formation Evaluation data for the Niger Delta. AAPG/SEG. Nairobi
Kenya.
SCHLUMBERGER, 1989. Log Interpretation Principles/applications. Houston Texas,
U.S.A: Schlumberger education services.
SCHLUMBERGER, 1972. Log interpretation: Principles. Schlumberger.
SCHLUMBERGER, 1985. Well Evaluation Conference. Nigeria.
SCHLUMBERGER, 2018. Oilfield Glossary [Homepage of Schlumberger Limited],
[Online]. Available: http://www.glossary.oilfield.slb.com [May/08, 2018].
SCHLUMBERGER, 2017. Geomechanics of reservoir management. Available.
http://www.slb.com/.../geomechanics/reservior-management.as
SCHMITT, D.R., 2014. Basic geomechanics for induced seismicity: A Tutorial focus
article coordinated by Mostafa Naghizadeh/ Fereidoon Vasheghani. CSEG Recorder,
pp. 24-28.
149
SCHNEIDER, T., 1985. Bohrlochrandausbreuche in norddeutschen bohrungen und
ihm bezichung zum regionalen spannungensfeld-beobachtung und theorie. Diploma
Thesis. University of Karisruhe, Germany.
SENGUPTA, et al., 2011. Building a seismic-driven 3D geomechanical model in a deep
carbonate reservoir. SEG Annual meeting.
SERRA, O., 1986. Fundamentals of well log interpretation volume 2. Interpretation of
logging data. Amsterdam: Elsevier science publishers.
SERRA, O., 1984. Fundamentals of well log interpretation, the acquisition of logging
data. Amsterdam Elsevier: Science Publishers.
SEYED SAJADI, S. and AGHIGHI, M.A.,2015. Building and analyzing geomechanical
model of Bangestan reservoir in Kopal oil field, Iranian. Journal of Mining Engineering,
10, 21-34.
SHERRIF, R. and GELDART, L. 1995.Exploration Seismology. Cambridge University
Press.
SHORT, K.C. and STAUBLE, A.J., 1967. Outline of geology of Niger Delta. American
Association of Petroleum Geologists Bulletin, 51, pp. 761-779.
SIMM, R. and BACON, M., 2014. Seismic Amplitude: An interpreter’s Handbook.
Cambridge University Press United Kingdom.
SIMS, D.W., MORRIS, A.P., FERRILL, D.A., and SORKHABI, R., 2005. Extensional fault
system evolution and reservoir connectivity. In R. Sorkhabi and Tsuji eds. Faults, flow
and petroleum traps: AAPG Memoir, 85, 79-93.
SINHA, B.K., WANG,J., KISRRA, S., LI, J., PISTRE, V, BRATTON, T. and SANDERS,
M., 2008. Estimation of Formation stress using borehole Sonic data. SPWLA Annual
Logging Symposium, Edinburgh, Scotland.
SMITH, T., 2011. Practical seismic petrophysics: The effective use of ‘log data for
seismic analysis. The leading Edge, 30-1128-1141.
SOCIETY OF PETROLEUM ENGINEERING, 2016. The role of geomechanics in
conventional and unconventional reservoir performance and management. Available
www.spe.org/events/16fsap/docs/16FSAR-Application-Brochure.pdf.
SONG, L., 2012. Minimum horizontal stress profile from logging data for Montney
Formation of North East Britain Columbia. SPE 162233
SORKHABI, B. and TSUJI,Y., 2015. Faults, fluid flow and petroleum traps. In Japan
oil, gas and metals national corporation. AAPG Memoir 85.
SORKHABI, R. and S. HASEGAWA, S., 2005. Fault zone architecture and permeability
distribution in the Neogane classics of northern Sarawak (Min Airport Road out crop),
150
Malaysia, In R. Sorkhabi and Y. Tsuji, eds. Faults, fluid flow and petroleum traps.
AAPG Memoir 85, 139-157.
SORKHABI, R. and TSUJI, Y., 2005. The place of faults in petroleum traps, in R.
Sorkhabi and Y. Tsuji, eds. Faults, fluid flow and petroleum traps. AAPG Memoir 85,
pp. 1-31.
SOROUGH, H., 2013. Discover a career in Geomechanics. Society of Petroleum
Engineers. SPE-0313-015-TWA.
STREIT, J.E. and HILLIS, R.R., 2004. Estimating fault stability and sustainable fluid
pressures for underground storage of Co2 in Porous rock. Journal of Energy, 29, pp,
1224-1450.
SYGALA, A., BUKOWSKA, M., and JANOSZEK, T., 2013. High temperature versus
geomechanical parameters of selected rocks. The present state of research. Journal
of Sustainable Mining, Vol. 12, 4, pp. 45- 51.
SYLVESTER, O. and JOHN-LANDER, I., 2015. Comparative study of rock strength and
petrophysical properties derived from core and log data. International Journal of
Current Engineering and Technology. Vol. 5, 2, pp. 900-906.
TAHERI, E., SADRNEJAD, S.A. and GHESEMZADEH, H., 2005. Multiscale
geomachanical model for a deformable oil reservoir with surrounding rock effects.
International Journal of Multi-scale Computional Engineering, 13 (6), 533-559.
TERZAGHI, 1923. K. VAN: “De Berechung der Durchlassig-Keitszitter des Tones aus
dem verlauf de Hydrodynamischen Spannungserscheinungen: Sitzungsber., Akad,
Wiss., Wien Math. Natuwiss: KL, 132, 105-124.
TIAB, D. and DONALDSON, E.C., 2012. Theory and practice of measuring reservoir
rock and fluid transport properties. 3rd edition. Amsterdam: Gulf Professional
Publishing.
TIMMERMAN, E.H., 1982. Practical reservoir Engineering: Methods for analyzing
output from equations and computers. Oklahama: Pennwell Publishing Company
Tulsa.
TIMUR, A., 1987. Acoustic logging chapter 51. In H.B., Bradley. Edition-in-chief
petroleum engineering Hand-Book. Society of Petroleum Engineers, 51-1-51-52.
TINGAY, M., 2009. States and origin of present day stress fields in sedimentary
basins. DOI: 10.1071/ASEG 2009ab 037.
TINGAY, M., MULLER,B., REINECKER, J., HEIDBACH, O., WENZEL, F. and
FLEKENSTEIN, P., 2006. Understanding tectonic stress in the oil patch: the world
stress map project. The Leading Edge, pp.1276-1282.
151
TINGAY, M.R.P., HILLIS, R.R., MORLEY, C.K., SWARBRICK, R.E. and OKPERE, E.C.,
2003a. Variation in vertical stress in the Baram Basin, Brunei: tectonic and
geomechanical implications. Marine and Petroleum Geology, 20(10), pp. 12011212.
TINGAY, M.R.P., MULLER, B., REIMAKER, J. and HEIDBACH, O., 2005. State and
original of the present day stress field in sedimentary basins. New results from the
world stress map project. American Rock Mechanics Association ARMA/USRMS,
061048.
TIXIER, M.P. LOVELESS, G.W. and ANDERSON, R.X., 1975 Estimation of the
formation strength from the mechanical properties log. Journal of Petroleum
Technology, 27, 283-293.
TUNIO, S.Q., TUNIO, A.H., GHIRANO, N.A and EL ALDAWY, Z.M., 2011.Comparison
of different enhanced oil recovery techniques for better oil productivity. Intern. Jour.
of Appl. Sci. and Tech., 1(5), pp. 143-153.
TUTTLE, M.L.W., BROWN Field M.E. and CHARPENTIER, R.R., 1999. The Niger Delta
petroleum system. Niger Delta province, Nigeria Cameroon and Equatorial Guinea
Africa,U.S. Geological survey open-filler Report-95-50H, 3.1P.Available
https://pubs.usgs.gov/of/1999/ofr-99=0050/.../chapter.A.html
TWISS, R. J. and MOORES, E. M. 1992. Structural Geology. New York: W. H. Freeman
and Company.
UDEBHULU, D.O. and OGBE, D.O., 2015. Mechanistic model for predicting sand
production: A case Study of Niger Delta Wells. Society of Petroleum Engineer178279-
MS.
UZORCHUKWU, M.I., 2016. Critical Evaluation of the correlations used for estimating
geomechanical properties for the Niger Delta. MSc Thesis, African University of
Science and Technology.
VERNER, K., 2007. The Mapping of geological structure.Czech geological survey in
Prgue.Available from:https:www.Krystof_Verner_Applied Structure_geology_and
tectonics_pdf.
WARPINSKI, et al., 1993, N.R., LORENZ, J.C. BRANAGAN, P.T. MYAL, F.K. and GALL,
B.L. “Examination of cored Hydraulic Fracture in a deep gas well”. Paper SPE. 22876,
SPE Formation Evaluation, 8, 3, 150-158.
WARPINSKI, N.R., 1989. Elastic and Viscoelastic calculation of stresses in
sedimentary basins. SPE- 522- 530.

152
WARPINSKI, N., and TEUFEL, L., 1989. Insitu stresses in low permeability, nonmarine
rocks. Journal of Petroleum Technology, 41, 405-414.
WEBER, K. J. and DAUKOU, E. M., 1975. Petroleum geology of the Niger Delta:
Proceedings of the Ninth World Petroleum Congress, Vol. 2, Geology: London, Applied
Science, pp. 210-221.
WEBER, K.J., 1987. Hydrocarbon distribution patterns in Nigerian growth fault
structures controlled by structural style and stratigraphy. Journal of Petroleum
Science and Engineering, 1, pp. 91-104.
WEBER, R.J., 1971. Sedimentological aspects of oil fields in the Niger Delta. Geology
magazine, 105. pp. 386-389.
WHITEMAN A., 1982. Nigeria: its petroleum ecology resources and potential. London,
Graham and trotman.
WILLIS, R. B. FONTAINE, J., PAUGH, L., GRIFFIN, L., 2005. Geology and geometry:
a review of factors affecting the effectiveness of hydraulic fracturing. In SPE Eastern
Regional meeting; Morgantown, W.V., SPE 97993.
WILSON, G. and COSGROVE, J.W., 1982. Introduction to small scale geological
structures. George Allen and Unwin Publishers Ltd.
WOEHRL, B., PEI, J. and REMER, J., 2010. Camparison of methods to derive rock
mechanical properties from formation evaluation logs. American Rock Mechanics
Association, ARMA, 10-167.
WYLLIE, D.C.K., 1999. Foundations on Rock 2nd edition. Chapman and Hall.
XIAO, X., JENAKUMA, T., ASH, C., BUL, H. and FAKUNLE, O., 2016. An integrated
workflow combining seismic inversion and geomechanics modeling-Bonga field,
offshore Nigeria. Offshore Tech. Conference. Houston Texas.
XIE, H., and GAO, F., 2000. The mechanics of cracks and a statistical strength theory
for rocks. International Journal of Rock Mechanics and Mining Sciences, 37, pp. 477
YALE, D.P., 2003. Fault and Stress magnitude controls on variations in the orientation
of in-situ stress. Fracture and in-situ stress characterization of hydrocarbon
reservoirs. M. Ameen. London. Geological Society, 209, 55-64.
YAMADA, Y.H., OKAMURA, Y. T. and TSUNEYAMA, F., 2005. Analog models of faults
associated with salt doming and wrenching: Application to offshore United Arab
Emirates, In R. Sorkhabi and Y. Tsuji, eds., Faults, fluid flow and petroleum traps:
AAPG Memoi,r 85, 95-106.
153
YAMADA, Y.H. and MATSUOKA, T., 2005. Digital sand box modeling using distinct
element method. Applications to fault tectonics, in R. Sorkhabi and Y. Tsuji, eds.
Faults, fluid, flow and petroleum traps: AAPG Memoir, 85, 107-123.
YANA, R.N. and NAERKENTIN, B.P., 1975. Developments in Geotechnical Engineering
soil properties and behavior. Amsterdam, Oxford New York: Elsevier Scientific
Publishing Company.
YASSIR, N.A. and BELL, J.S., 1994. Relationship between Pore Pressure Stresses, and
present day Geodynamics in Scotian Shelf, Offshore Eastern Canada: America
Association of Petroleum Geologists, Bulletin, Vol. 78, pp.1863 – 1880.
ZHANG, J.J., RAI, C.S. and SANDERGELDS, 2000. Mechanical strength of reservoir
materials. Key information for sand prediction. SPE Reservoir Eval. & Eng. 3(2), 127-
131.
ZHANG, J., and YIN, S., 2017. Fracture gradient Prediction: An overview and an
improved method. Petroleum Science, 14: pp. 720 – 730.
ZHOU, B., FRASER, S., BORSARU, M., AIZAWA, T., SLIWA, R. and HASHIMOTO, T.
,2005. New approaches for rock strength. Estimation from geophysics logs. Available
at http://www.suncohi.co.jp/tech_topics/technology /…../002_/pdf
ZIMMERMAN, R.W., KUMAR, S. and BODVARSSON, G.S., 1991. Lubrication theory
analysis of the permeability of Rough- walled fractures. Int. J. rock Mech., 28, 325 –
331.
ZOBACK, M.D. and ZOBACK M.L., 1991. Tectonic stress field of Norh America and
relative plate motions, In SLEMMONS, D. B., ENGDAHL, E. R., ZOBACK, M. D. and
BLACKWELL, D.D., eds., Neotectonic of North America, Decade map volume 1:
Geoogical Society of America, Boulder, Colorado, pp. 339-366.
ZOBACK, M.D. and ZOBACK, M.B., 2002. Stress in the Earth’s lithosphere.
Encyclopedia of Physics Science and Technology. Third edition, Vol. 16, pp. 143153.
ZOBACK, M.D., 2016. Reservoir Geomechanics: In situ stress and rock mechanics
applied to reservoir process. Course overview. Standford University (online-lecture1-
overview-2016%20Zoback. pdf.
ZOBACK, M.L., Zoback, M.D. et al, 1989. Global patterns of tectonic stress. Nature,
341, 291-298.
ZOBACK, M.D., 2007. Reservoirs Geomechanics. New York, U.S.A: Cambridge
University press.
ZOBACK, M.D., MOOS, D. AND MASTIN, L., 1985. “Well bore breakouts and in situ
stress, “Journal of Geophysics Research, 90, No. B7, 5523-5530.
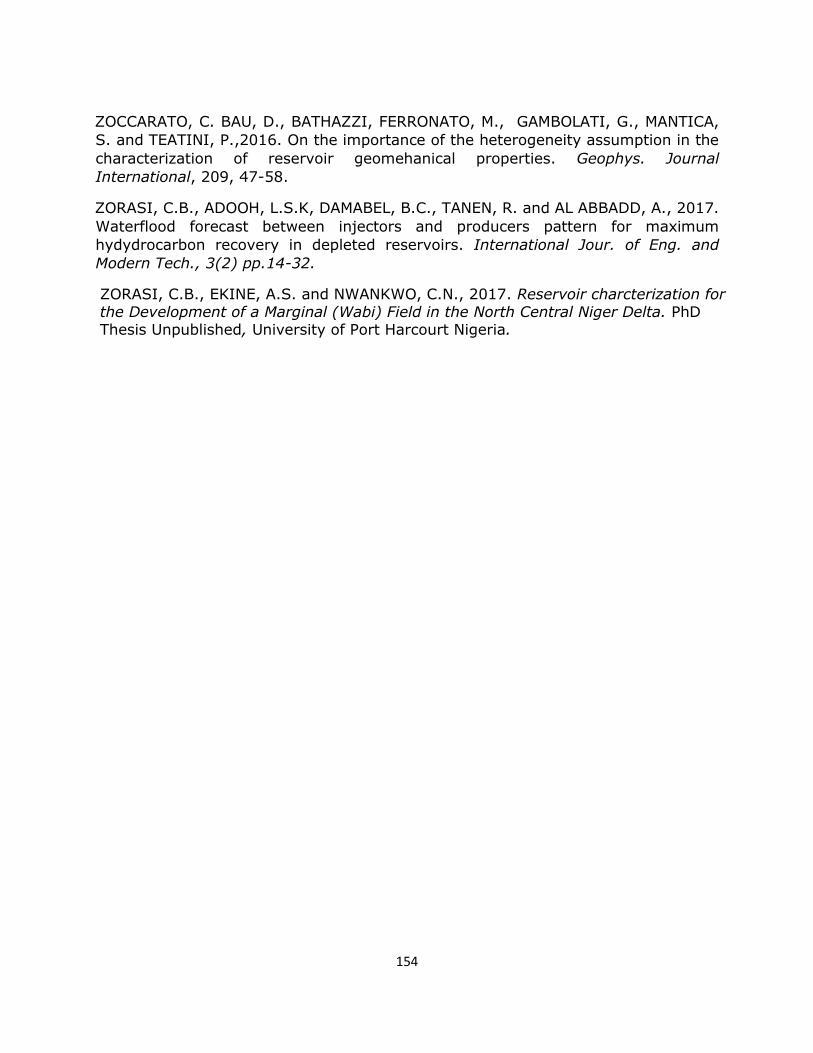
154
ZOCCARATO, C. BAU, D., BATHAZZI, FERRONATO, M., GAMBOLATI, G., MANTICA,
S. and TEATINI, P.,2016. On the importance of the heterogeneity assumption in the
characterization of reservoir geomehanical properties. Geophys. Journal
International, 209, 47-58.
ZORASI, C.B., ADOOH, L.S.K, DAMABEL, B.C., TANEN, R. and AL ABBADD, A., 2017.
Waterflood forecast between injectors and producers pattern for maximum
hydydrocarbon recovery in depleted reservoirs. International Jour. of Eng. and
Modern Tech., 3(2) pp.14-32.
ZORASI, C.B., EKINE, A.S. and NWANKWO, C.N., 2017. Reservoir charcterization for the Development of a Marginal (Wabi) Field in the North Central Niger Delta. PhD Thesis Unpublished, University of Port Harcourt Nigeria.
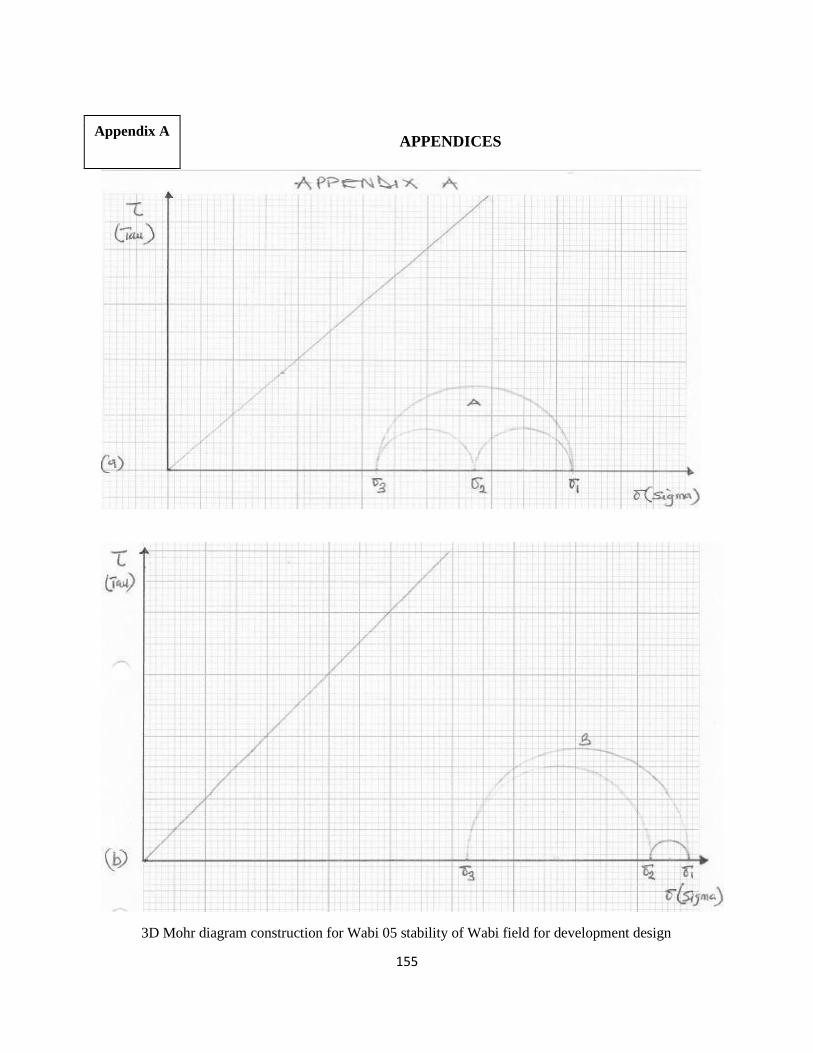
155
APPENDICES
3D Mohr diagram construction for Wabi 05 stability of Wabi field for development design
Appendix A
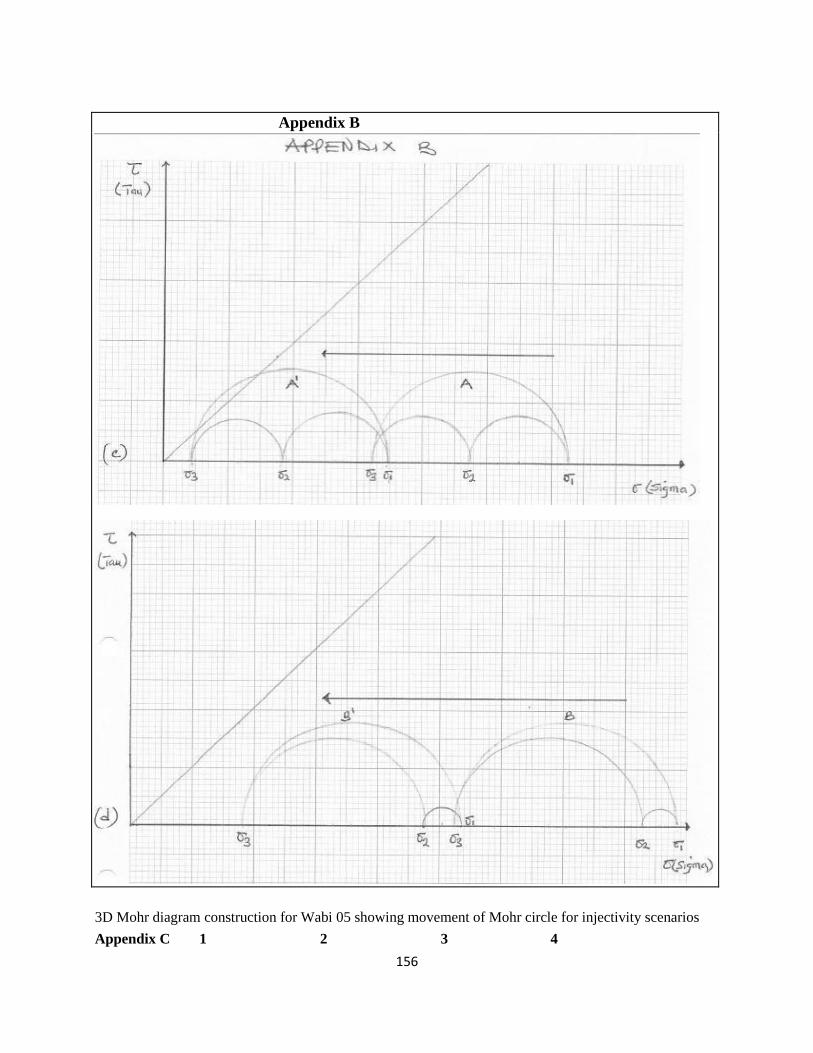
156
Appendix B
3D Mohr diagram construction for Wabi 05 showing movement of Mohr circle for injectivity scenarios
Appendix C 1 2 3 4
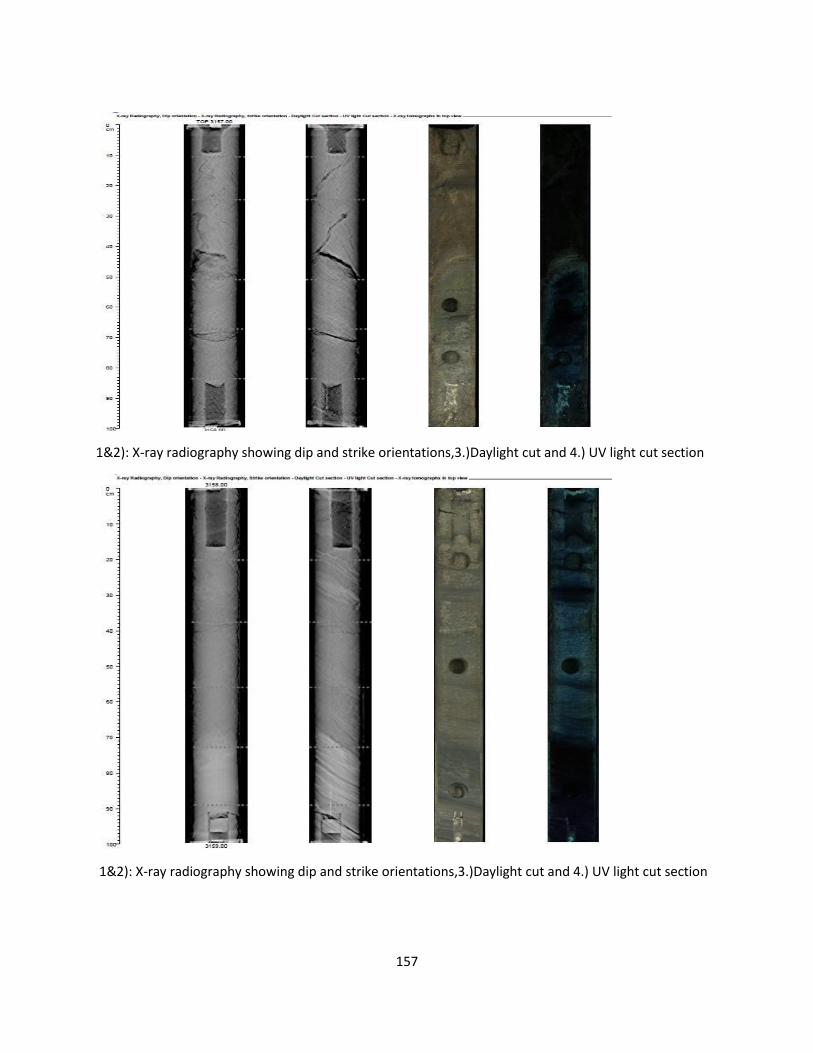
157
1&2): X-ray radiography showing dip and strike orientations,3.)Daylight cut and 4.) UV light cut section
1&2): X-ray radiography showing dip and strike orientations,3.)Daylight cut and 4.) UV light cut section
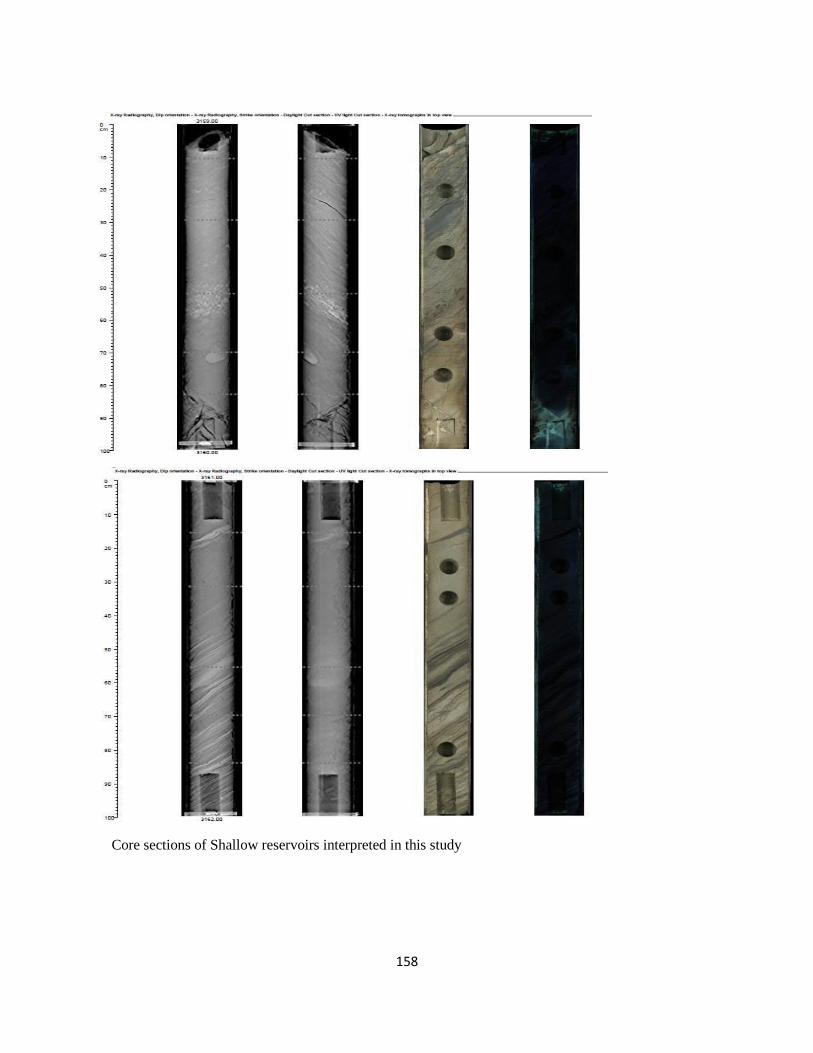
158
Core sections of Shallow reservoirs interpreted in this study
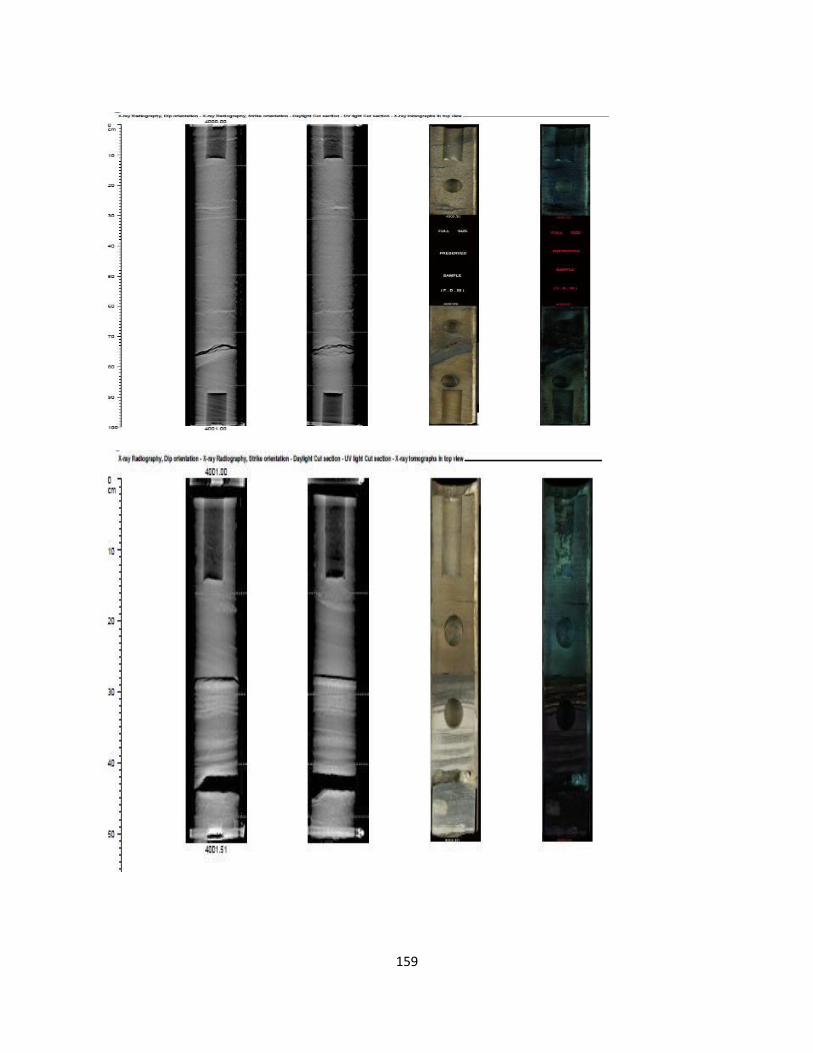
159

160
Core sections of deep reservoir interpreted in this study
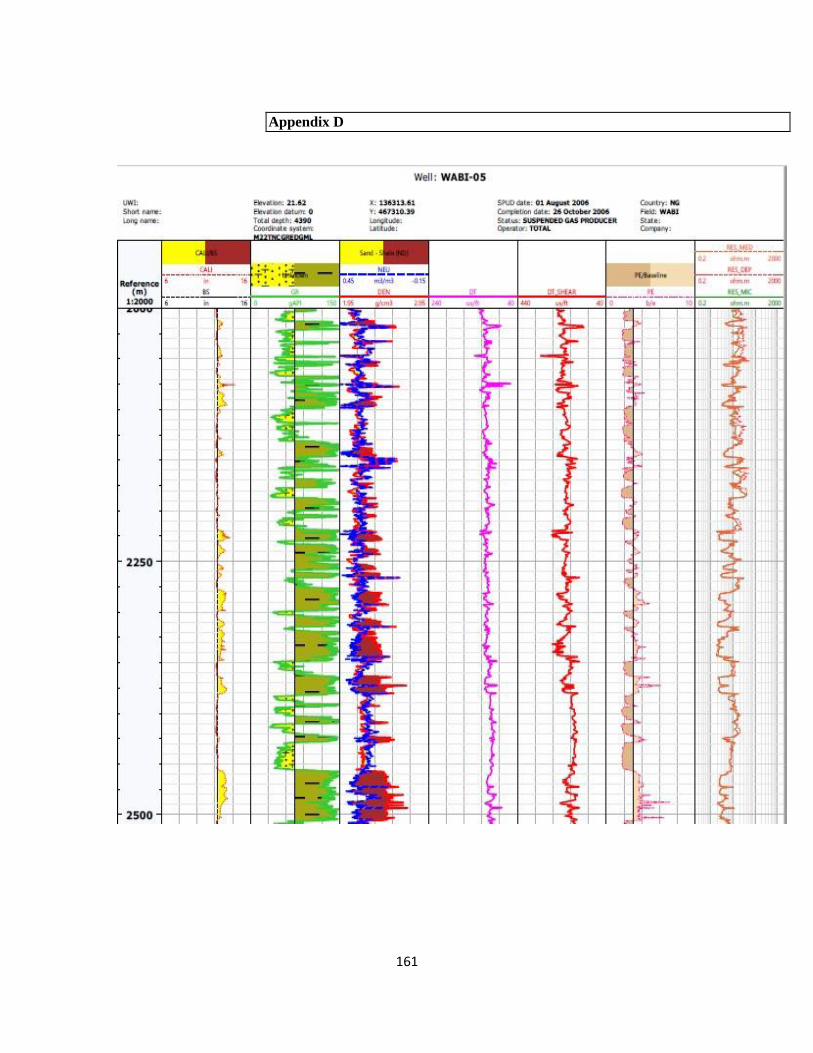
161
Appendix D
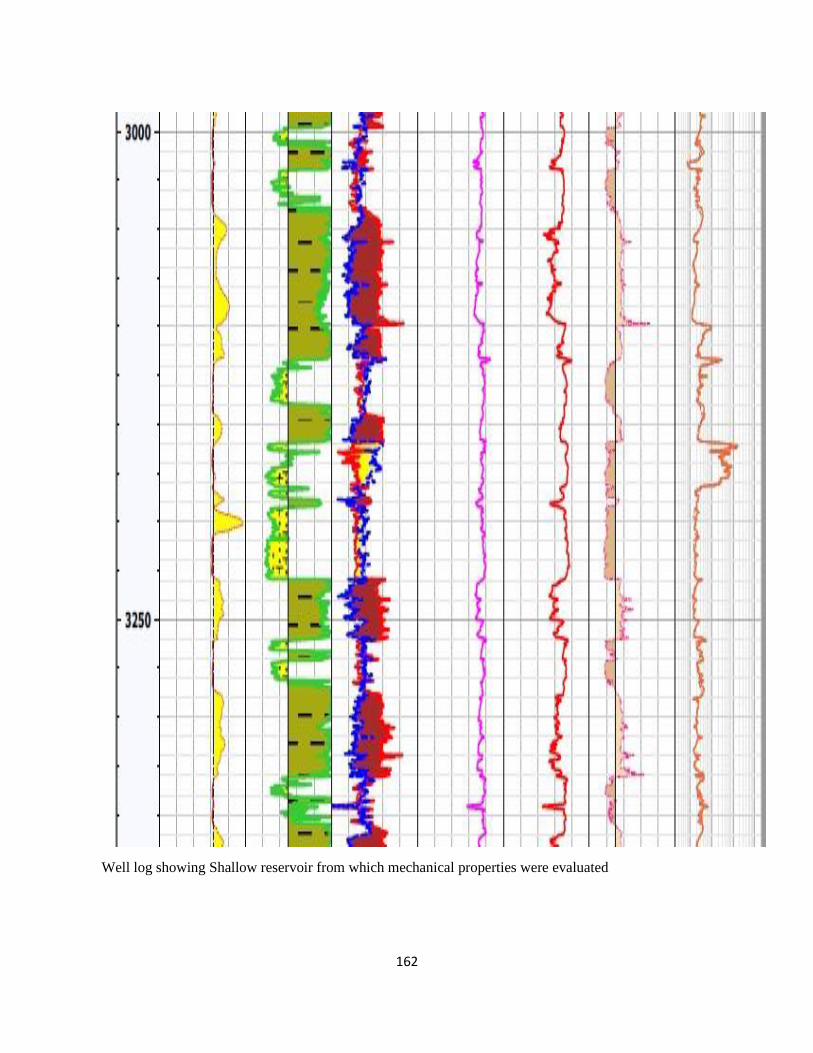
162
Well log showing Shallow reservoir from which mechanical properties were evaluated
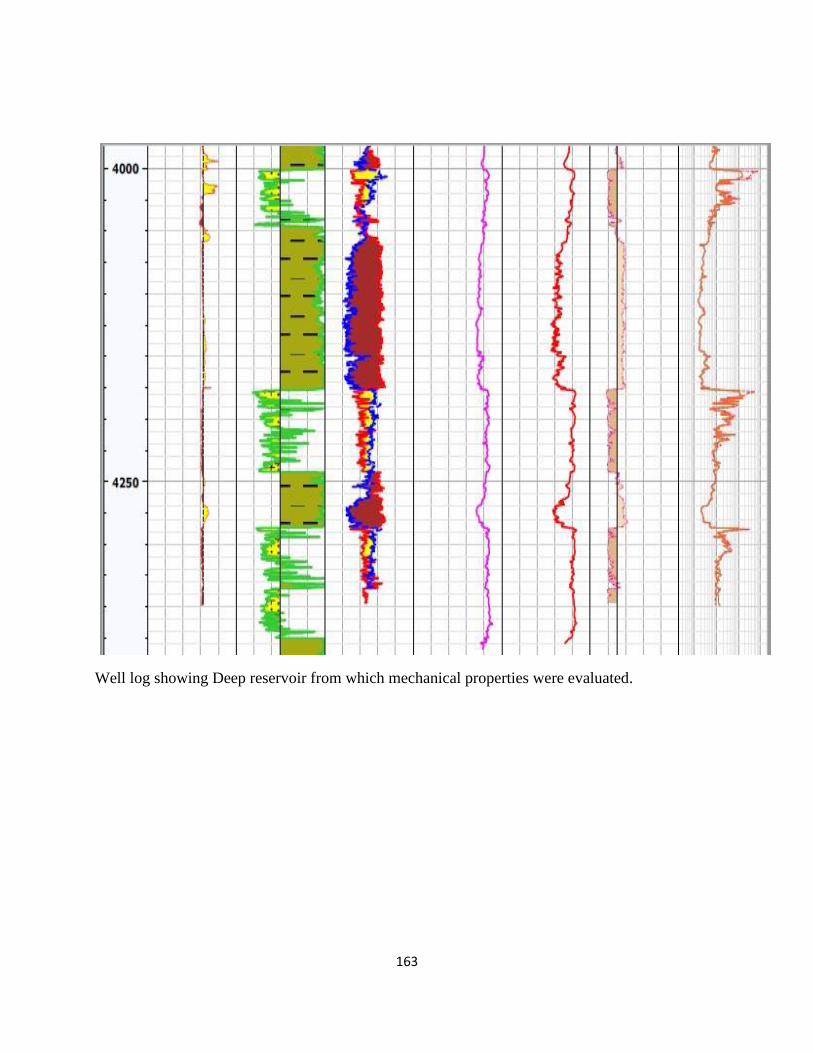
163
Well log showing Deep reservoir from which mechanical properties were evaluated.
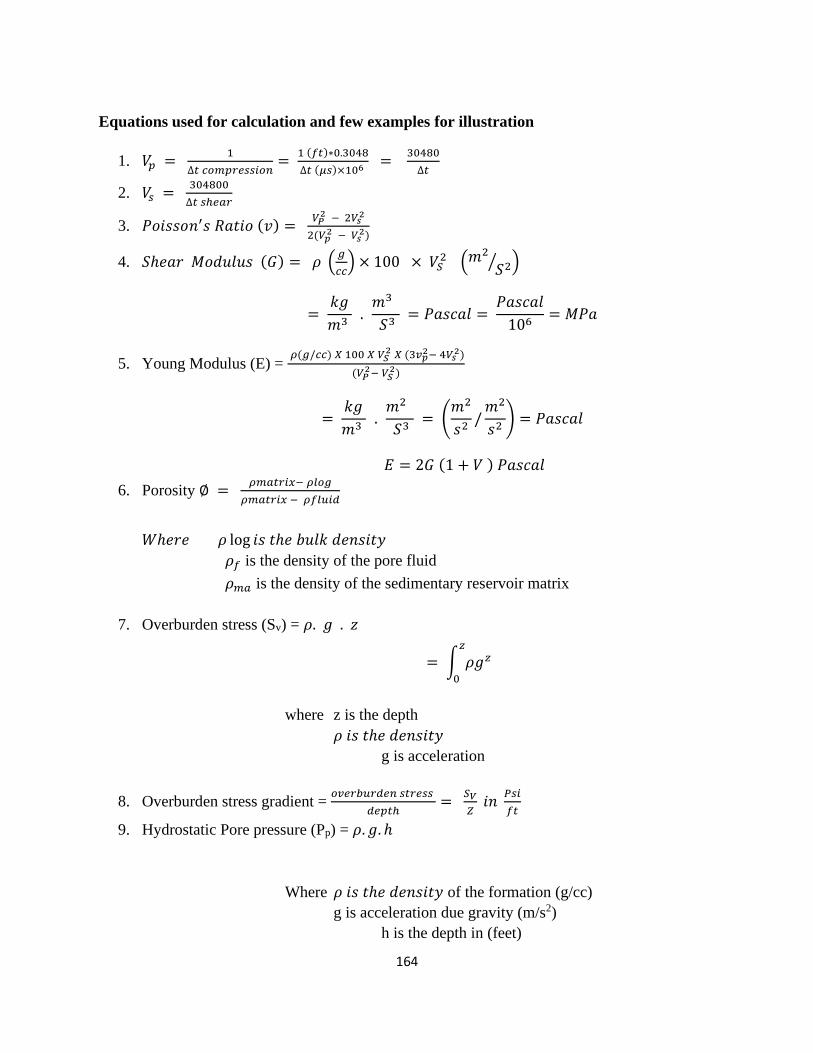
164
Equations used for calculation and few examples for illustration
1. 𝑉𝑝 = 1
∆𝑡 𝑐𝑜𝑚𝑝𝑟𝑒𝑠𝑠𝑖𝑜𝑛=
1 (𝑓𝑡)∗0.3048
∆𝑡 (𝜇𝑠)×106 = 30480
∆𝑡
2. 𝑉𝑠 = 304800
∆𝑡 𝑠ℎ𝑒𝑎𝑟
3. 𝑃𝑜𝑖𝑠𝑠𝑜𝑛′𝑠 𝑅𝑎𝑡𝑖𝑜 (𝑣) = 𝑉𝑃
2 − 2𝑉𝑠2
2(𝑉𝑝2 − 𝑉𝑠
2)
4. 𝑆ℎ𝑒𝑎𝑟 𝑀𝑜𝑑𝑢𝑙𝑢𝑠 (𝐺) = 𝜌 (𝑔
𝑐𝑐) × 100 × 𝑉𝑆
2 (𝑚2
𝑆2⁄ )
= 𝑘𝑔
𝑚3 .
𝑚3
𝑆3 = 𝑃𝑎𝑠𝑐𝑎𝑙 =
𝑃𝑎𝑠𝑐𝑎𝑙
106= 𝑀𝑃𝑎
5. Young Modulus (E) = 𝜌(𝑔/𝑐𝑐) 𝑋 100 𝑋 𝑉𝑆
2 𝑋 (3𝑣𝑝2− 4𝑉𝑠
2)
(𝑉𝑃2− 𝑉𝑆
2)
= 𝑘𝑔
𝑚3 .
𝑚2
𝑆3 = (
𝑚2
𝑠2/
𝑚2
𝑠2) = 𝑃𝑎𝑠𝑐𝑎𝑙
𝐸 = 2𝐺 (1 + 𝑉 ) 𝑃𝑎𝑠𝑐𝑎𝑙
6. Porosity ∅ = 𝜌𝑚𝑎𝑡𝑟𝑖𝑥− 𝜌𝑙𝑜𝑔
𝜌𝑚𝑎𝑡𝑟𝑖𝑥 − 𝜌𝑓𝑙𝑢𝑖𝑑
𝑊ℎ𝑒𝑟𝑒 𝜌 log 𝑖𝑠 𝑡ℎ𝑒 𝑏𝑢𝑙𝑘 𝑑𝑒𝑛𝑠𝑖𝑡𝑦
𝜌𝑓 is the density of the pore fluid
𝜌𝑚𝑎 is the density of the sedimentary reservoir matrix
7. Overburden stress (Sv) = 𝜌. 𝑔 . 𝑧
= ∫ 𝜌𝑔𝑧𝑧
0
where z is the depth
𝜌 𝑖𝑠 𝑡ℎ𝑒 𝑑𝑒𝑛𝑠𝑖𝑡𝑦
g is acceleration
8. Overburden stress gradient = 𝑜𝑣𝑒𝑟𝑏𝑢𝑟𝑑𝑒𝑛 𝑠𝑡𝑟𝑒𝑠𝑠
𝑑𝑒𝑝𝑡ℎ=
𝑆𝑉
𝑍 𝑖𝑛
𝑃𝑠𝑖
𝑓𝑡
9. Hydrostatic Pore pressure (Pp) = 𝜌. 𝑔. ℎ
Where 𝜌 𝑖𝑠 𝑡ℎ𝑒 𝑑𝑒𝑛𝑠𝑖𝑡𝑦 of the formation (g/cc)
g is acceleration due gravity (m/s2)
h is the depth in (feet)
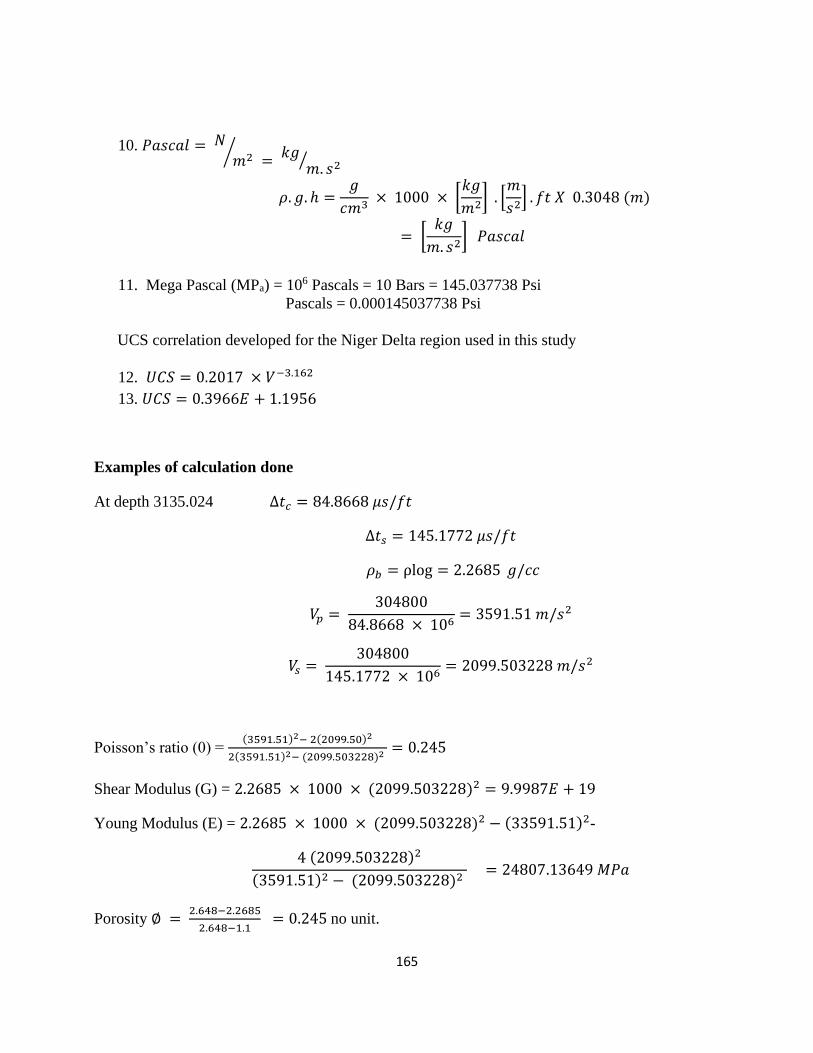
165
10. 𝑃𝑎𝑠𝑐𝑎𝑙 = 𝑁
𝑚2 = 𝑘𝑔
𝑚. 𝑠2⁄ ⁄
𝜌. 𝑔. ℎ =𝑔
𝑐𝑚3 × 1000 × [
𝑘𝑔
𝑚2] . [
𝑚
𝑠2] . 𝑓𝑡 𝑋 0.3048 (𝑚)
= [𝑘𝑔
𝑚. 𝑠2] 𝑃𝑎𝑠𝑐𝑎𝑙
11. Mega Pascal (MPa) = 106 Pascals = 10 Bars = 145.037738 Psi
Pascals = 0.000145037738 Psi
UCS correlation developed for the Niger Delta region used in this study
12. 𝑈𝐶𝑆 = 0.2017 × 𝑉−3.162
13. 𝑈𝐶𝑆 = 0.3966𝐸 + 1.1956
Examples of calculation done
At depth 3135.024 ∆𝑡𝑐 = 84.8668 𝜇𝑠/𝑓𝑡
∆𝑡𝑠 = 145.1772 𝜇𝑠/𝑓𝑡
𝜌𝑏 = ρlog = 2.2685 𝑔/𝑐𝑐
𝑉𝑝 = 304800
84.8668 × 106= 3591.51 𝑚/𝑠2
𝑉𝑠 = 304800
145.1772 × 106= 2099.503228 𝑚/𝑠2
Poisson’s ratio (0) = (3591.51)2− 2(2099.50)2
2(3591.51)2− (2099.503228)2 = 0.245
Shear Modulus (G) = 2.2685 × 1000 × (2099.503228)2 = 9.9987𝐸 + 19
Young Modulus (E) = 2.2685 × 1000 × (2099.503228)2 − (33591.51)2-
4 (2099.503228)2
(3591.51)2 − (2099.503228)2 = 24807.13649 𝑀𝑃𝑎
Porosity ∅ = 2.648−2.2685
2.648−1.1 = 0.245 no unit.

166
UCS (Young Modulus) = 0.3966 × (2480.13649) + 1.1956
= 9839.70593 MPa
Overburden stress (𝑆𝑉 = 𝜎1) = 2.2109 x 100 x 9.8 3135 x 0.3048 x 0.00014503778 = 3002.83627Psi
Overburden gradient = 3002.83627
3135= 0.957836𝑃𝑠𝑖