arab petrographical and geomechanical properties of the lower oligocene limestones from al ain city,...
TRANSCRIPT
Arab J Sci EngDOI 10.1007/s13369-013-0867-8
RESEARCH ARTICLE - EARTH SCIENCES
Petrographical and Geomechanical Properties of the LowerOligocene Limestones from Al Ain City, United Arab Emirates
Hasan Arman · Waheed Hashem ·Mohammed El Tokhi · Osman Abdelghany ·Ayman El Saiy
Received: 2 March 2012 / Accepted: 15 September 2012© King Fahd University of Petroleum and Minerals 2013
Abstract The Lower Oligocene limestones comprise mostof the foundational bedrock of Al Ain city, situated in thesouth eastern part of the UAE. The limestone outcrops southof the city are folded, dissected by several sets of joints, andhost abundant connected paleokarstic cavities of varied sizes.For this study, a number of rock samples were collected fromdifferent localities in the Lower Oligocene-aged rock units,for testing and analysis. The rocks are composed mainly ofcalcite with minor amounts of dolomite, quartz and clay min-erals. The studied rocks have been affected by diageneticprocesses including dissolution, dolomitization, compactionand cementation that partially control the mechanical behav-ior of the rocks. Investigating the physical and mechanicalproperties of the Lower Oligocene limestones lying at thefoundation level beneath Al Ain city is an important stepin dealing with the problem of foundation instabilities whichhave been reported in some parts of the city. The study clearlydemonstrates the relation between lithologic properties andtheir corresponding strength. It revealed that dolomatizationof limestones increases their strength, in contrary increasingthe chalk percent decreases rock’s strength. Consequently,there is a need to carefully categorize the local limestonerock properties as assistance to future infrastructural devel-opments.
Keywords Limestone · Jabal Hafit · Petrographicalproperties · Geomechanical properties
H. Arman (B) · W. Hashem · M. El Tokhi · O. Abdelghany · A. El SaiyGeology Department, United Arab Emirates University,P.O. Box: 15551, Al Ain, UAEe-mail: [email protected]
1 Introduction
The city of Al Ain, near the UAE–Oman international border(Fig. 1), is one of the fastest growing urbanized settlements inthe Emirates. The city is sited upon and surrounded by areasof aeolian sands, fluviatile, gravel deposits and conglomer-ates of Neogene and Quaternary ages [2], which form a thincover for the Lower Oligocene Asmari Formation limestonesthat dominate the bedrock beneath the central and southernparts of the city [3]. The rocks of this formation mainly con-sist of moderately dipping thick-bedded to massive dolomiticand chalky limestone interbedded with thin marls. Most of
123
Arab J Sci Eng
the rock exposures are porous, and characterized by an abun-dance of fractures and connected paleokarstic cavities [3].
A number of foundational instability problems have beenreported in the new construction areas within Al Ain citythat may be related to the extensive fracturing and cavitiesin the Lower Oligocene carbonate rocks. These continuingproblems provide a strong motive to conduct detailed fieldand laboratory studies to characterize the geological and geo-mechanical properties of the bedrocks. There have been nopreviously published engineering geological studies on car-bonate rocks of the Asmari Formation in this area.
The mechanical and physical parameters for rocks areessential information for engineered construction plans(building upon or within the bedrock), slope instability andothers. Various testing methods have been established andused to quantify the engineering properties of rocks. Suchproperties may be controlled by petrography, textures, com-position and environmental conditions [4,5]. The physicalproperties of the intact rocks are mainly controlled by rockmicrostructures such as mineral cleavage, grain boundariesand microfractures [6]. There is a good correspondencebetween the strength of the rocks and their mineral con-tent [7] and weathering processes [8]. The rock type, texture,percentage and fabric of its minerals have also great influ-ence on its physical properties [9]. The relationship betweenslake durability and rock properties is mainly controlled bynumber of cycles. The first and fourth cycles provide reli-able data on the durability for preliminary engineering designworks [10]. The physical and mechanical properties of car-bonate rocks can be predicted from sonic wave velocity tests[11,12]. The difference in the velocities may be related tomineralogy and porosity. In addition, the dissolution of car-bonate rocks is controlled by the geological characteristicsand inhomogeneity of physical properties [13]. The Schmidthammer rebound number may be valuable at the prelimi-nary engineering design stage, which are relatively cheapand easy to evaluate. However, it is important to rememberthat it has to be used with caution and only for the specifiedrock types [14]. Empirical relationships may provide a goodfirst approximation of the lower strength boundary of rockstrength. However, calibration of empirical relations betweenstrength and physical properties is necessary for confidence[15].
The present study reports specifically on the petrographi-cal aspects and relationship between geomechanical proper-ties, uniaxial compressive strength, point load index, indirecttensile strength, Schmidt hardness value, P-wave velocityand unit weight, of the limestones belonging to the LowerOligocene Asmari Formation in Al Ain city area. Theseproperties are obtained from bulk limestone samples col-lected from the rock outcrops south of the city. The studyalso describes the effects of the rock properties on their geo-mechanical behavior as local bedrock. Accordingly it would
benefit both researchers and engineers and assist them indealing with engineering problems associated with construc-tion activities located in, on or near these limestones. Theoutcomes of the work may be useful at a preliminary stagedesign, but they should be used with caution and only for thespecified rock type.
2 Geological Setting
The study area lies close to Hafit Mountain, a prominentanticlinal fold exposing strata of Eocene to Miocene age car-bonate rocks, which have been the focus of many previousstratigraphic studies. The entire Hafit sequence (Figs. 1, 2)was first studied by Hunting [16] who divided the sequenceinto eleven informal units. Cherif and El Deeb [17] collectedthese units and formally assigned them to formations. TheOligocene units were referred to as the Al Jaww Formation.This formation was later studied by Hamdan and Bahr [18]who revised it and renamed it the Asmari Formation, andsubdivided it into three members. Boukhary et al. [19] iden-tified the age of the Asmari Formation as early Oligocene(Rupelian), based on its larger foraminiferal assemblage. ElTokhi et al. [3] determined the absolute age of these rocks,using 87Sr/86Sr dating methods, to be in the interval 33.5–29.6 m.y. (Rupelian). The rock sequence in Jabal Hafit isdeformed into a large NNW–SSE trending doubly plungingasymmetric anticline that is thought to have developed syn-chronously with the sedimentation [20] over a main thrustfault underlying its eastern limb [21,22]. The folded rocksare dissected by several sets of faults and joints.
2.1 Stratigraphy and Structure of the Study Area Exposures
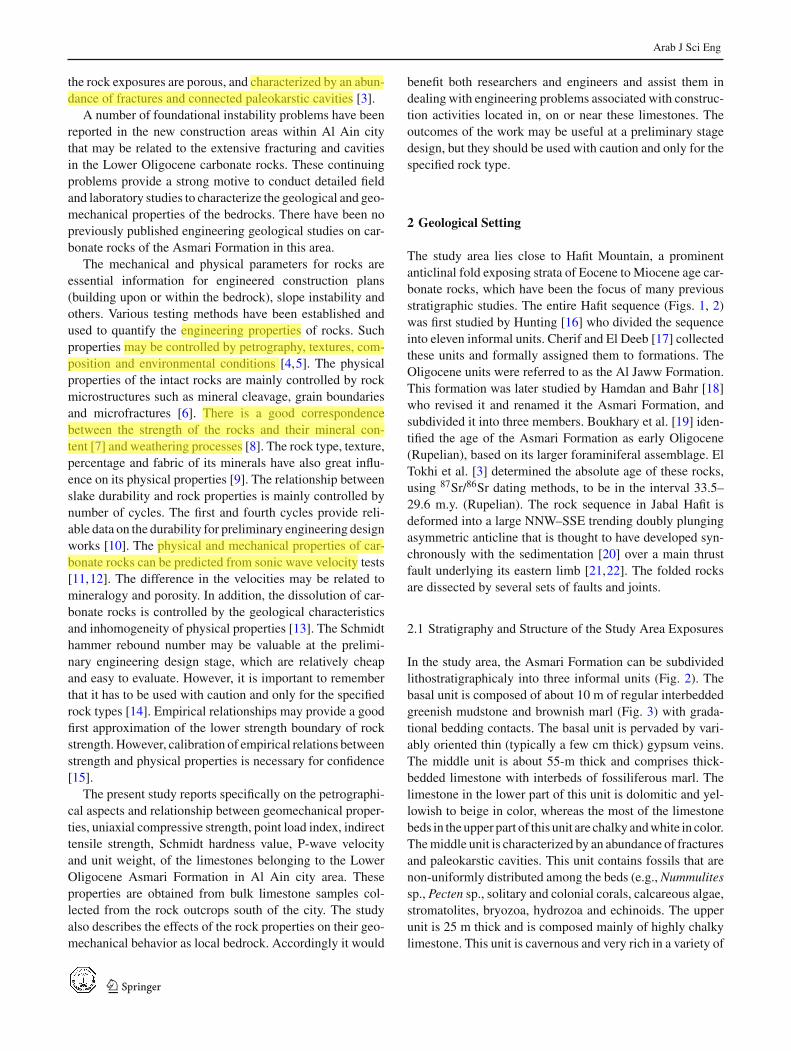
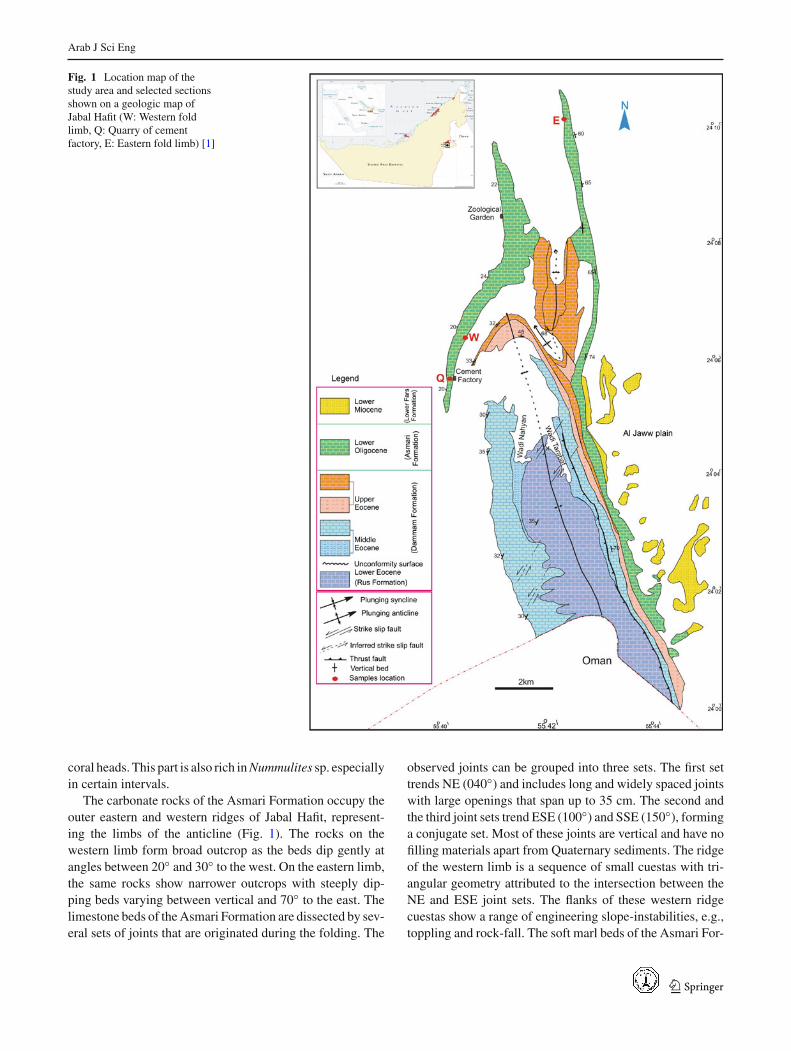
In the study area, the Asmari Formation can be subdividedlithostratigraphicaly into three informal units (Fig. 2). Thebasal unit is composed of about 10 m of regular interbeddedgreenish mudstone and brownish marl (Fig. 3) with grada-tional bedding contacts. The basal unit is pervaded by vari-ably oriented thin (typically a few cm thick) gypsum veins.The middle unit is about 55-m thick and comprises thick-bedded limestone with interbeds of fossiliferous marl. Thelimestone in the lower part of this unit is dolomitic and yel-lowish to beige in color, whereas the most of the limestonebeds in the upper part of this unit are chalky and white in color.The middle unit is characterized by an abundance of fracturesand paleokarstic cavities. This unit contains fossils that arenon-uniformly distributed among the beds (e.g., Nummulitessp., Pecten sp., solitary and colonial corals, calcareous algae,stromatolites, bryozoa, hydrozoa and echinoids. The upperunit is 25 m thick and is composed mainly of highly chalkylimestone. This unit is cavernous and very rich in a variety of
123
Arab J Sci Eng
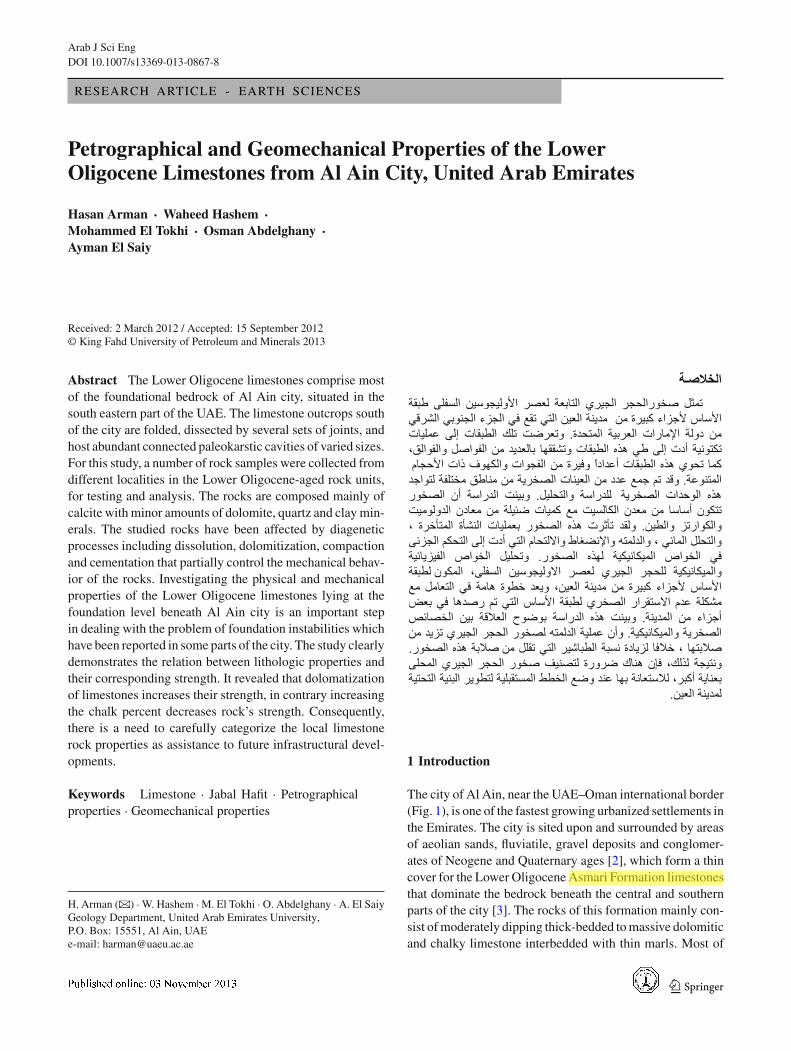
Fig. 1 Location map of thestudy area and selected sectionsshown on a geologic map ofJabal Hafit (W: Western foldlimb, Q: Quarry of cementfactory, E: Eastern fold limb) [1]
coral heads. This part is also rich in Nummulites sp. especiallyin certain intervals.
The carbonate rocks of the Asmari Formation occupy theouter eastern and western ridges of Jabal Hafit, represent-ing the limbs of the anticline (Fig. 1). The rocks on thewestern limb form broad outcrop as the beds dip gently atangles between 20◦ and 30◦ to the west. On the eastern limb,the same rocks show narrower outcrops with steeply dip-ping beds varying between vertical and 70◦ to the east. Thelimestone beds of the Asmari Formation are dissected by sev-eral sets of joints that are originated during the folding. The
observed joints can be grouped into three sets. The first settrends NE (040◦) and includes long and widely spaced jointswith large openings that span up to 35 cm. The second andthe third joint sets trend ESE (100◦) and SSE (150◦), forminga conjugate set. Most of these joints are vertical and have nofilling materials apart from Quaternary sediments. The ridgeof the western limb is a sequence of small cuestas with tri-angular geometry attributed to the intersection between theNE and ESE joint sets. The flanks of these western ridgecuestas show a range of engineering slope-instabilities, e.g.,toppling and rock-fall. The soft marl beds of the Asmari For-
123
Arab J Sci Eng
Fig. 2 A composite stratigraphic column represents three studied sec-tions of the Asmari Formation, Jabal Hafit fold anticline (W: Westernfold limb, Q: Quarry of cement factory, E: Eastern fold limb) [3]
mation have weathered faster than the overlying hard lime-stone beds that are, in turn, divided into separate blocks bythe SSE-oriented joints.
3 Rock Sampling
For the purposes of the present study, bedrock sampleswere collected more than 50 rock blocks from exposuresof the Lower Oligocene Asmari Formation on the outerridges of Jabal Hafit surrounding the southern part of Al
Mudstone
Marl
Marl Veins
Fig. 3 The mudstone and marl interbeds at the lower part of the AsmariFormation
Ain city (Figs. 1, 2). Large rock samples measuring at least0.50 × 0.50 × 0.50 m were selected for laboratory testingand analysis. A number of core samples for the required rockmechanical tests were obtained from each of these blocks.Fragments from the samples used for coring were set asidefor sectioning for petrographic and textural analysis.
4 Petrographic and Textural Properties
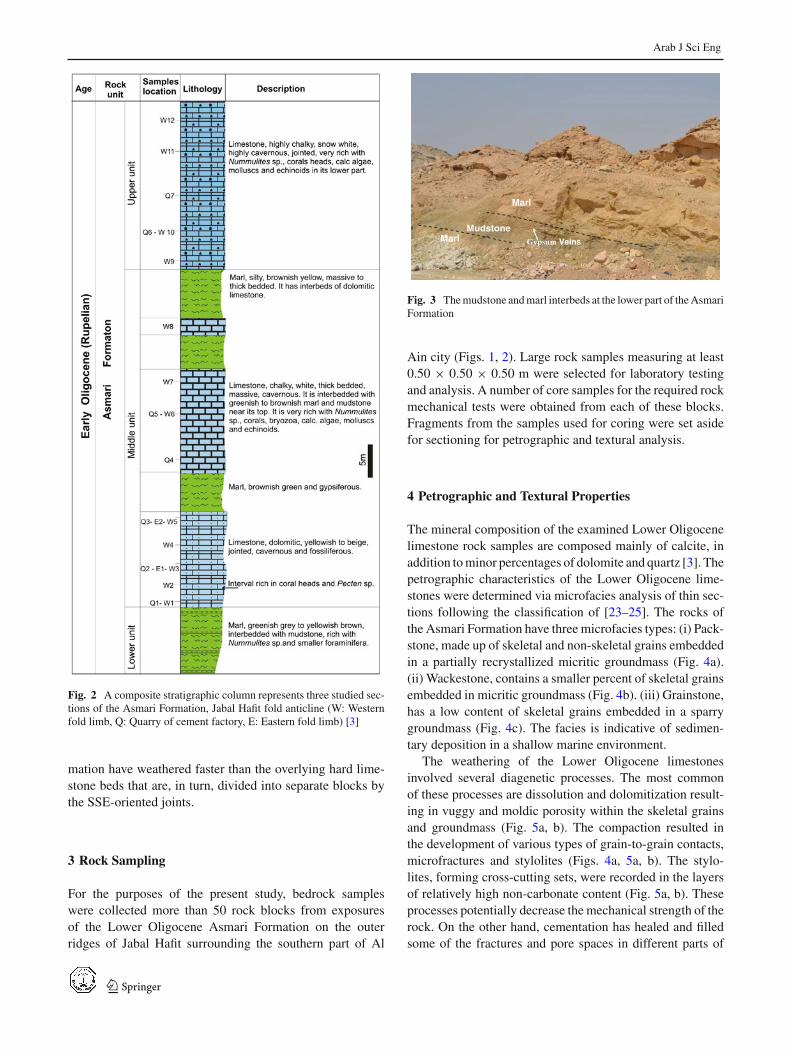
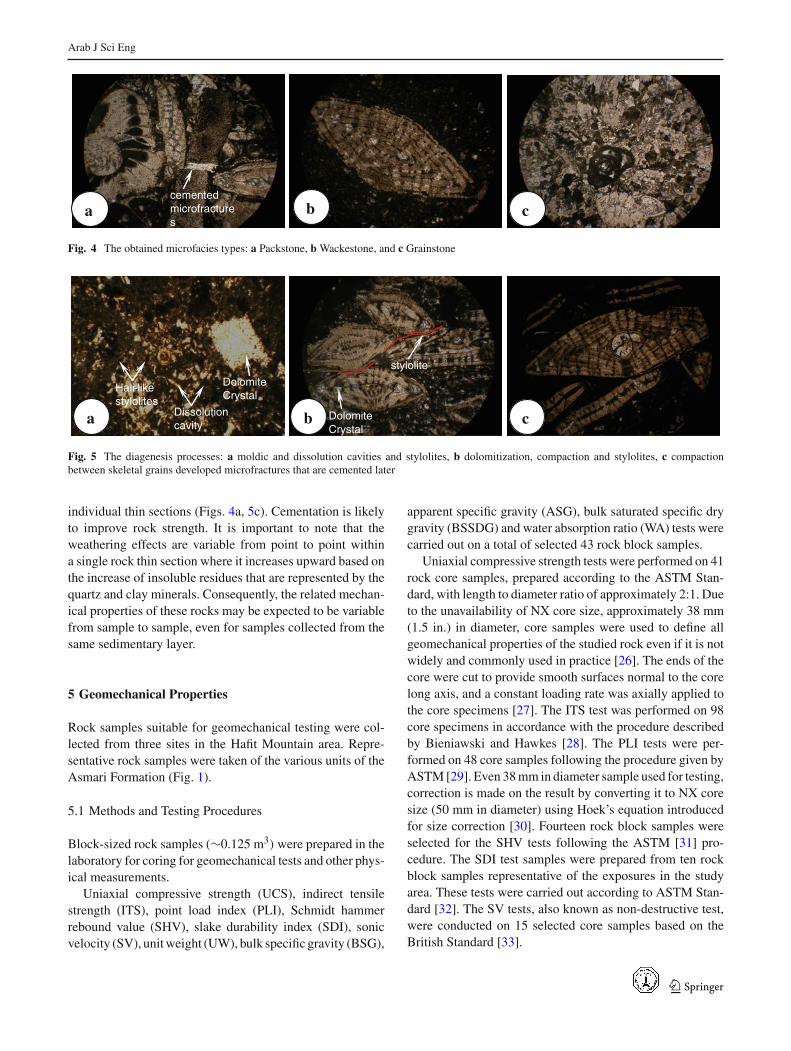
The mineral composition of the examined Lower Oligocenelimestone rock samples are composed mainly of calcite, inaddition to minor percentages of dolomite and quartz [3]. Thepetrographic characteristics of the Lower Oligocene lime-stones were determined via microfacies analysis of thin sec-tions following the classification of [23–25]. The rocks ofthe Asmari Formation have three microfacies types: (i) Pack-stone, made up of skeletal and non-skeletal grains embeddedin a partially recrystallized micritic groundmass (Fig. 4a).(ii) Wackestone, contains a smaller percent of skeletal grainsembedded in micritic groundmass (Fig. 4b). (iii) Grainstone,has a low content of skeletal grains embedded in a sparrygroundmass (Fig. 4c). The facies is indicative of sedimen-tary deposition in a shallow marine environment.
The weathering of the Lower Oligocene limestonesinvolved several diagenetic processes. The most commonof these processes are dissolution and dolomitization result-ing in vuggy and moldic porosity within the skeletal grainsand groundmass (Fig. 5a, b). The compaction resulted inthe development of various types of grain-to-grain contacts,microfractures and stylolites (Figs. 4a, 5a, b). The stylo-lites, forming cross-cutting sets, were recorded in the layersof relatively high non-carbonate content (Fig. 5a, b). Theseprocesses potentially decrease the mechanical strength of therock. On the other hand, cementation has healed and filledsome of the fractures and pore spaces in different parts of
123
Arab J Sci Eng
cemented microfractures
a b c
Fig. 4 The obtained microfacies types: a Packstone, b Wackestone, and c Grainstone
CementedMicrofractures
Dissolution cavitya c
Hair-like stylolites
Dolomite Crystal
b
stylolite
Dolomite Crystal
Fig. 5 The diagenesis processes: a moldic and dissolution cavities and stylolites, b dolomitization, compaction and stylolites, c compactionbetween skeletal grains developed microfractures that are cemented later
individual thin sections (Figs. 4a, 5c). Cementation is likelyto improve rock strength. It is important to note that theweathering effects are variable from point to point withina single rock thin section where it increases upward based onthe increase of insoluble residues that are represented by thequartz and clay minerals. Consequently, the related mechan-ical properties of these rocks may be expected to be variablefrom sample to sample, even for samples collected from thesame sedimentary layer.
5 Geomechanical Properties
Rock samples suitable for geomechanical testing were col-lected from three sites in the Hafit Mountain area. Repre-sentative rock samples were taken of the various units of theAsmari Formation (Fig. 1).
5.1 Methods and Testing Procedures
Block-sized rock samples (∼0.125 m3) were prepared in thelaboratory for coring for geomechanical tests and other phys-ical measurements.
Uniaxial compressive strength (UCS), indirect tensilestrength (ITS), point load index (PLI), Schmidt hammerrebound value (SHV), slake durability index (SDI), sonicvelocity (SV), unit weight (UW), bulk specific gravity (BSG),
apparent specific gravity (ASG), bulk saturated specific drygravity (BSSDG) and water absorption ratio (WA) tests werecarried out on a total of selected 43 rock block samples.
Uniaxial compressive strength tests were performed on 41rock core samples, prepared according to the ASTM Stan-dard, with length to diameter ratio of approximately 2:1. Dueto the unavailability of NX core size, approximately 38 mm(1.5 in.) in diameter, core samples were used to define allgeomechanical properties of the studied rock even if it is notwidely and commonly used in practice [26]. The ends of thecore were cut to provide smooth surfaces normal to the corelong axis, and a constant loading rate was axially applied tothe core specimens [27]. The ITS test was performed on 98core specimens in accordance with the procedure describedby Bieniawski and Hawkes [28]. The PLI tests were per-formed on 48 core samples following the procedure given byASTM [29]. Even 38 mm in diameter sample used for testing,correction is made on the result by converting it to NX coresize (50 mm in diameter) using Hoek’s equation introducedfor size correction [30]. Fourteen rock block samples wereselected for the SHV tests following the ASTM [31] pro-cedure. The SDI test samples were prepared from ten rockblock samples representative of the exposures in the studyarea. These tests were carried out according to ASTM Stan-dard [32]. The SV tests, also known as non-destructive test,were conducted on 15 selected core samples based on theBritish Standard [33].
123
Arab J Sci Eng
Tabl
e1
Mec
hani
calp
rope
rtie
sof
the
Low
erO
ligoc
ene
limes
tone
Sam
ple
no.
UC
S(M
Pa)
(mea
n )
PLI
(for
50m
min
diam
eter
size
sam
ple,
I s(5
0))
(MPa
)(m
ean )
ITS
(MPa
)(m
ean)
SHV
(N)
(mea
n)Sa
mpl
eno
.PL
I(f
or50
mm
indi
amet
ersi
zesa
mpl
e,I s
(50)
)(M
Pa)
SV (km
/s)
Sam
ple
no.
ITS
(MPa
)(m
ean )
Vp
(km
/s)
Sam
ple
no.
SDI
Vp
Vs
I d1
I d2
E1
43.5
55.
459
48.7
E2-
45.
928.
314.
6E
25.
148.
311A
98.2
997
.64
E2
32.5
95.
175.
1437
.5Q
1-C
1.58
6.68
4.58
Q1
3.88
6.68
1C98
.36
97.7
5
Q1
40.6
61.
583.
8838
Q2-
B4.
755.
53.
79Q
25.
335.
52D
97.6
495
.83
Q2
57.8
3.95
5.33
48.9
Q3-
I5.
829.
514.
95Q
34.
38.
212F
97.3
596
.66
Q3
30.9
13.
634.
340
Q3-
M3.
296.
912.
97Q
44.
076.
63I
98.4
697
.90
Q4
31.2
74.
74.
0738
Q4-
B1.
576.
063.
71W
18.
1110
.01
4B96
.71
95.5
7
W1
34.7
84.
518.
1142
Q4-
H1.
97.
144.
14W
46.
337.
825A
98.4
797
.91
W2
39.8
35.
546.
546
W1-
D3.
1510
.01
4.53
W6
7.6
9.27
6E96
.26
94.8
6
W4
34.4
54.
346.
3340
.2W
4-C
6.06
7.82
3.42
W8
8.08
9.4
7I98
.58
98.1
1
W6
20.3
96.
497.
637
.5W
6-B
7.69
9.27
5.64
W10
1.93
8.37
8L97
.54
96.7
1
W8
50.0
67.
68.
0848
.7W
8-B
8.14
9.17
5.55
W11
1.67
7.51
W10
16.9
81.
711.
9336
.3W
8-H
11.0
79.
625.
68W
121.
976.
72
W11
13.9
32.
191.
6735
.8W
10-D
2.34
8.37
4.94
W12
13.1
41.
281.
9729
.5W
11-C
1.96
7.51
4.21
W12
B1.
966.
724.
05
Min
.6.
80.
20.
721
1.9
5.5
2.97
0.7
5.5
96.2
694
.86
Max
.83
.911
.112
.558
11.0
710
.01
5.68
12.5
10.0
198
.58
98.1
1
Mea
n31
.14
4.53
5.33
42.5
4.53
7.91
4.45
5.33
7.91
97.7
696
.9
STD
16.3
82.
722.
967.
62.
721.
450.
842.
961.
450.
811.
15
Tota
l41
4898
14To
tal
1515
15To
tal
9212
Tota
l10
10sa
mpl
eR
ock
sam
ple
sam
ple
sam
ple
bloc
ks
UC
Sun
iaxi
alco
mpr
essi
vest
reng
th,P
LI
poin
tloa
din
dex,
ITS
indi
rect
tens
ilest
reng
th,S
HV
Schm
idth
ardn
ess
valu
e,SV
soni
cw
ave
velo
city
,SD
Isl
ake
dura
bilit
yin
dex,
STD
stan
dard
devi
atio
n,M
axm
axim
um,M
inm
inim
um
123
Arab J Sci Eng
Table 2 Physical properties ofthe Lower Oligocene limestone
UW unit weight, BSG bulkspecific gravity, ASG apparentspecific gravity, BSSDG bulksaturated surface dry gravity,WA water absorption, STDstandard deviation, Maxmaximum, Min minimum
Sample no. UW (kN/m3)
(mean)Sample no. BSG ASG BSSDG WA (%)
E1 24.21 1A 2.72 2.59 2.62 1.40
E2 23.72 2B 2.67 2.39 2.47 3.20
Q1 23.81 3C 2.71 2.48 2.54 2.50
Q2 23.81 4D 2.75 2.49 2.56 2.70
Q3 22.2 5E 2.69 2.56 2.60 1.30
Q4 22.25 6D 2.69 2.55 2.59 1.50
W1 24.66 7E 2.68 2.51 2.56 1.80
W2 23.58 8F 2.68 2.54 2.58 1.50
W4 24.7
W6 21.99
W8 24.96
W10 20.19
W11 20.71
W12 21.78
Min. 18.84 2.67 2.39 2.47 1.3
Max. 25.63 2.75 2.59 2.62 3.2
Mean 23.14 2.7 2.52 2.56 1.99
STD 0.17 0.03 0.06 0.05 0.71
Total sample 91 Total sample 8 8 8 8
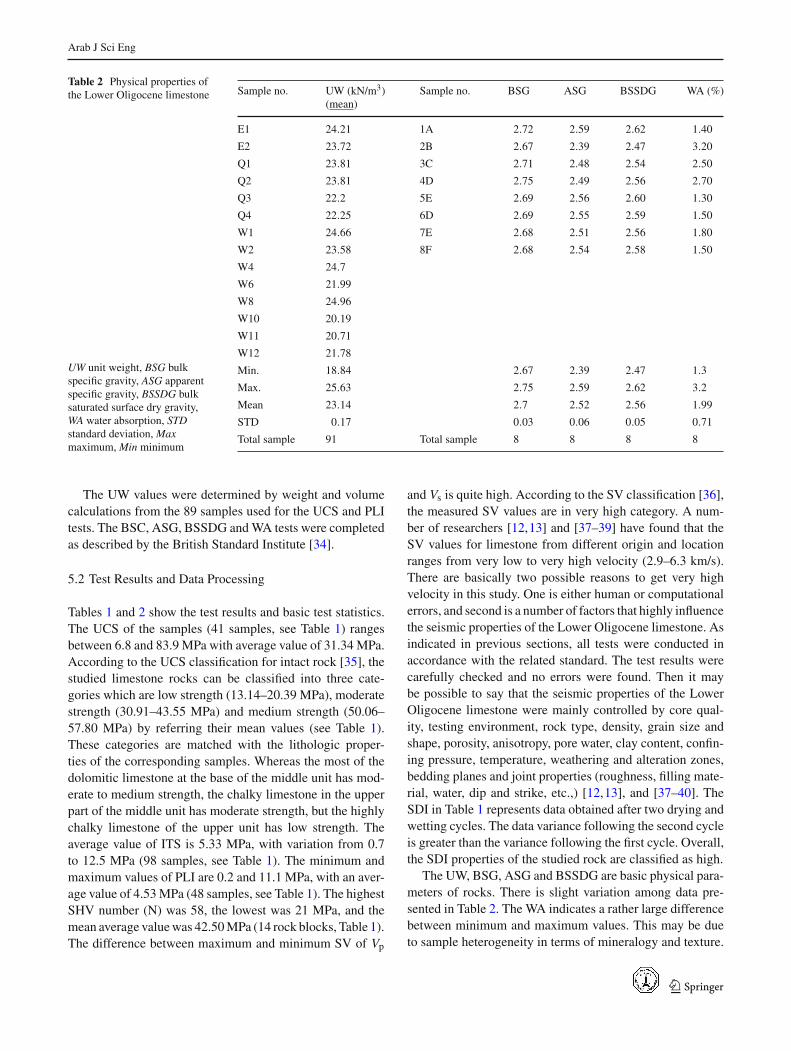
The UW values were determined by weight and volumecalculations from the 89 samples used for the UCS and PLItests. The BSC, ASG, BSSDG and WA tests were completedas described by the British Standard Institute [34].
5.2 Test Results and Data Processing
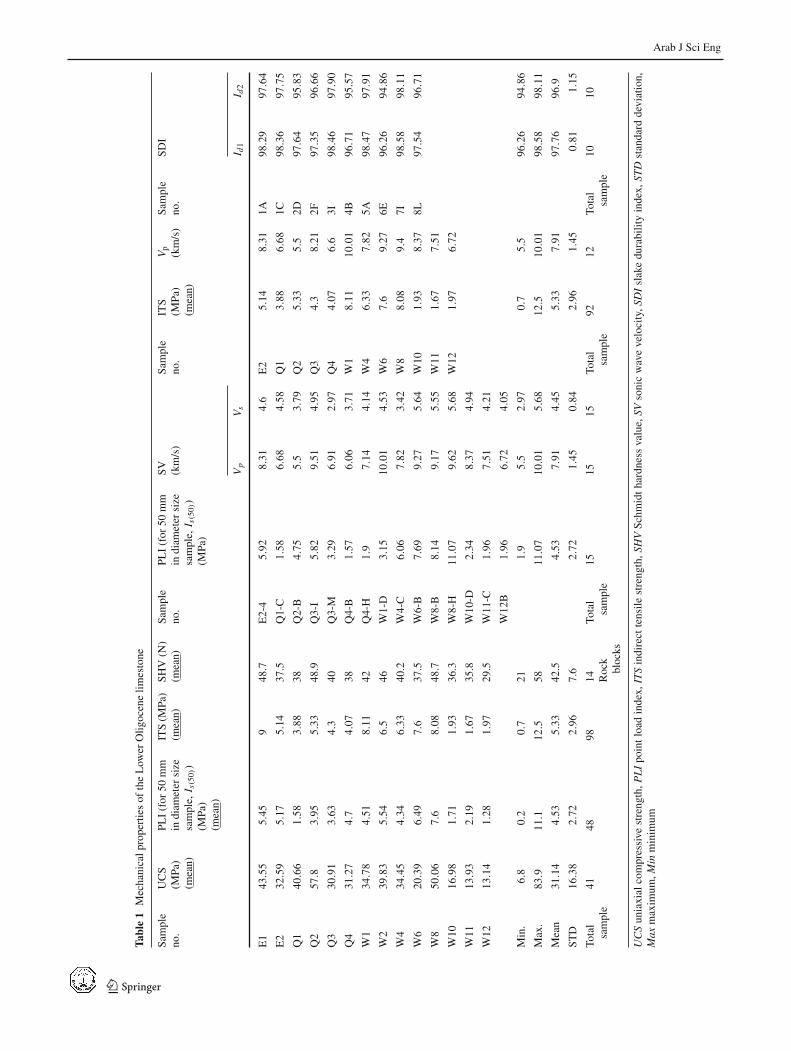
Tables 1 and 2 show the test results and basic test statistics.The UCS of the samples (41 samples, see Table 1) rangesbetween 6.8 and 83.9 MPa with average value of 31.34 MPa.According to the UCS classification for intact rock [35], thestudied limestone rocks can be classified into three cate-gories which are low strength (13.14–20.39 MPa), moderatestrength (30.91–43.55 MPa) and medium strength (50.06–57.80 MPa) by referring their mean values (see Table 1).These categories are matched with the lithologic proper-ties of the corresponding samples. Whereas the most of thedolomitic limestone at the base of the middle unit has mod-erate to medium strength, the chalky limestone in the upperpart of the middle unit has moderate strength, but the highlychalky limestone of the upper unit has low strength. Theaverage value of ITS is 5.33 MPa, with variation from 0.7to 12.5 MPa (98 samples, see Table 1). The minimum andmaximum values of PLI are 0.2 and 11.1 MPa, with an aver-age value of 4.53 MPa (48 samples, see Table 1). The highestSHV number (N) was 58, the lowest was 21 MPa, and themean average value was 42.50 MPa (14 rock blocks, Table 1).The difference between maximum and minimum SV of Vp
and Vs is quite high. According to the SV classification [36],the measured SV values are in very high category. A num-ber of researchers [12,13] and [37–39] have found that theSV values for limestone from different origin and locationranges from very low to very high velocity (2.9–6.3 km/s).There are basically two possible reasons to get very highvelocity in this study. One is either human or computationalerrors, and second is a number of factors that highly influencethe seismic properties of the Lower Oligocene limestone. Asindicated in previous sections, all tests were conducted inaccordance with the related standard. The test results werecarefully checked and no errors were found. Then it maybe possible to say that the seismic properties of the LowerOligocene limestone were mainly controlled by core qual-ity, testing environment, rock type, density, grain size andshape, porosity, anisotropy, pore water, clay content, confin-ing pressure, temperature, weathering and alteration zones,bedding planes and joint properties (roughness, filling mate-rial, water, dip and strike, etc.,) [12,13], and [37–40]. TheSDI in Table 1 represents data obtained after two drying andwetting cycles. The data variance following the second cycleis greater than the variance following the first cycle. Overall,the SDI properties of the studied rock are classified as high.
The UW, BSG, ASG and BSSDG are basic physical para-meters of rocks. There is slight variation among data pre-sented in Table 2. The WA indicates a rather large differencebetween minimum and maximum values. This may be dueto sample heterogeneity in terms of mineralogy and texture.
123
Arab J Sci Eng
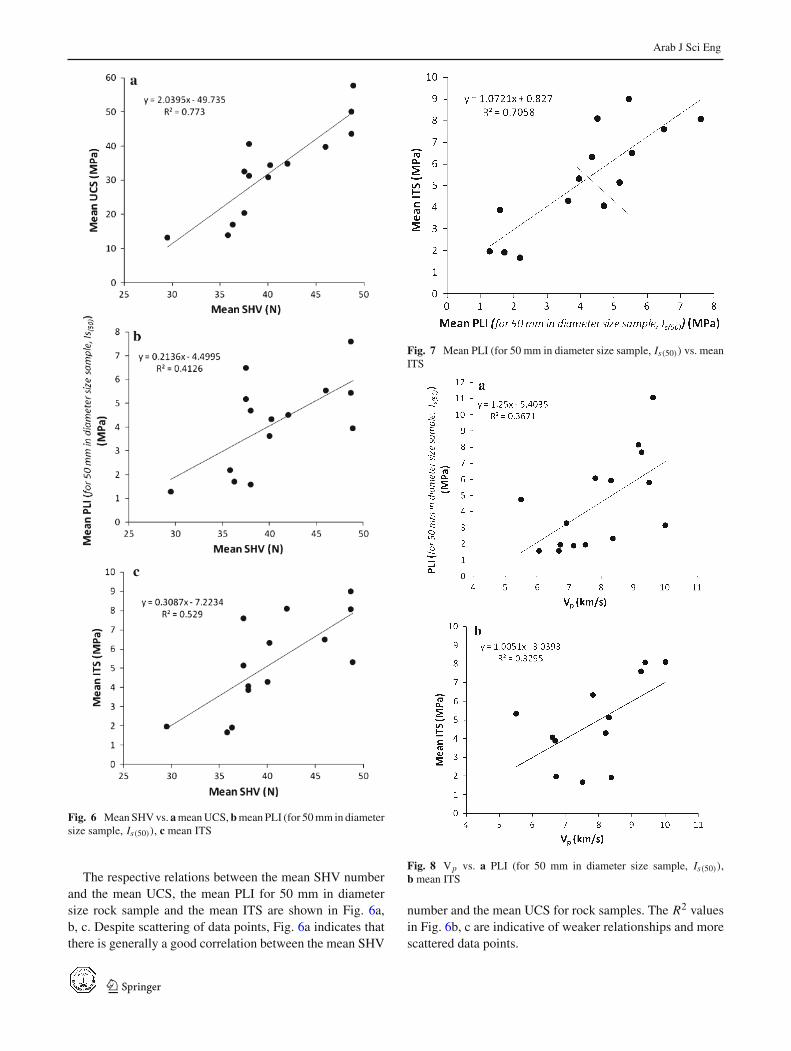
Fig. 6 Mean SHV vs. a mean UCS, b mean PLI (for 50 mm in diametersize sample, Is(50)), c mean ITS
The respective relations between the mean SHV numberand the mean UCS, the mean PLI for 50 mm in diametersize rock sample and the mean ITS are shown in Fig. 6a,b, c. Despite scattering of data points, Fig. 6a indicates thatthere is generally a good correlation between the mean SHV
Fig. 7 Mean PLI (for 50 mm in diameter size sample, Is(50)) vs. meanITS
Fig. 8 Vp vs. a PLI (for 50 mm in diameter size sample, Is(50)),b mean ITS
number and the mean UCS for rock samples. The R2 valuesin Fig. 6b, c are indicative of weaker relationships and morescattered data points.
123
Arab J Sci Eng
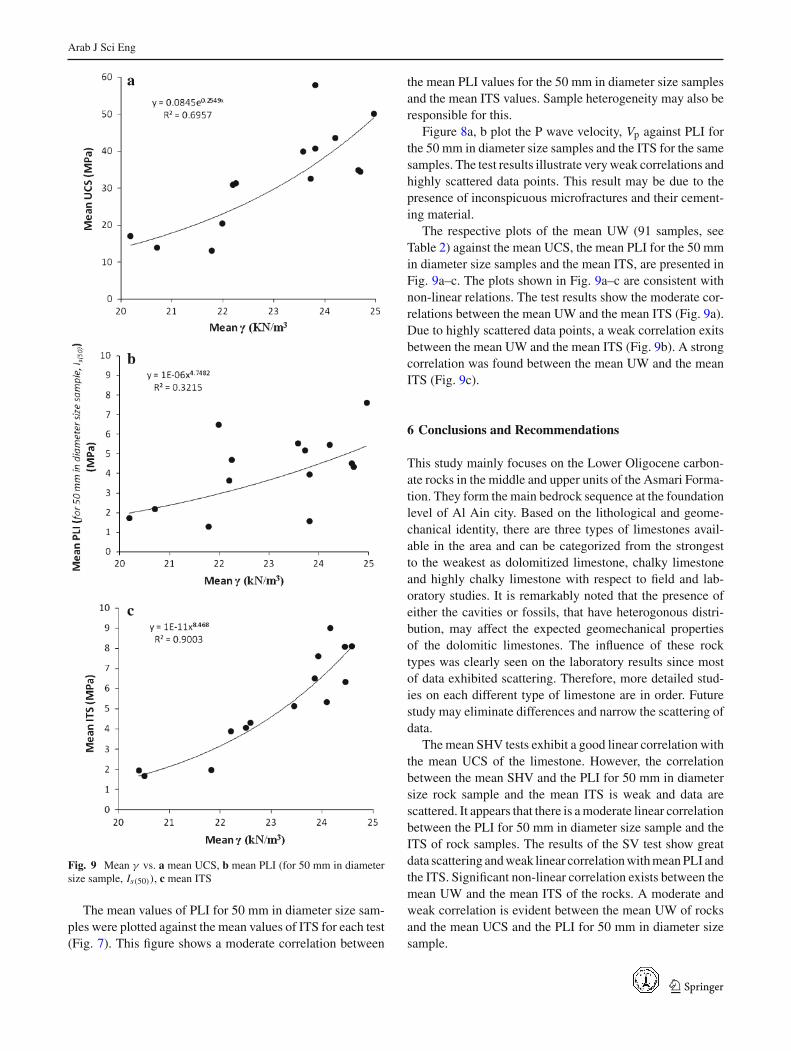
Fig. 9 Mean γ vs. a mean UCS, b mean PLI (for 50 mm in diametersize sample, Is(50)), c mean ITS
The mean values of PLI for 50 mm in diameter size sam-ples were plotted against the mean values of ITS for each test(Fig. 7). This figure shows a moderate correlation between
the mean PLI values for the 50 mm in diameter size samplesand the mean ITS values. Sample heterogeneity may also beresponsible for this.
Figure 8a, b plot the P wave velocity, Vp against PLI forthe 50 mm in diameter size samples and the ITS for the samesamples. The test results illustrate very weak correlations andhighly scattered data points. This result may be due to thepresence of inconspicuous microfractures and their cement-ing material.
The respective plots of the mean UW (91 samples, seeTable 2) against the mean UCS, the mean PLI for the 50 mmin diameter size samples and the mean ITS, are presented inFig. 9a–c. The plots shown in Fig. 9a–c are consistent withnon-linear relations. The test results show the moderate cor-relations between the mean UW and the mean ITS (Fig. 9a).Due to highly scattered data points, a weak correlation exitsbetween the mean UW and the mean ITS (Fig. 9b). A strongcorrelation was found between the mean UW and the meanITS (Fig. 9c).
6 Conclusions and Recommendations
This study mainly focuses on the Lower Oligocene carbon-ate rocks in the middle and upper units of the Asmari Forma-tion. They form the main bedrock sequence at the foundationlevel of Al Ain city. Based on the lithological and geome-chanical identity, there are three types of limestones avail-able in the area and can be categorized from the strongestto the weakest as dolomitized limestone, chalky limestoneand highly chalky limestone with respect to field and lab-oratory studies. It is remarkably noted that the presence ofeither the cavities or fossils, that have heterogonous distri-bution, may affect the expected geomechanical propertiesof the dolomitic limestones. The influence of these rocktypes was clearly seen on the laboratory results since mostof data exhibited scattering. Therefore, more detailed stud-ies on each different type of limestone are in order. Futurestudy may eliminate differences and narrow the scattering ofdata.
The mean SHV tests exhibit a good linear correlation withthe mean UCS of the limestone. However, the correlationbetween the mean SHV and the PLI for 50 mm in diametersize rock sample and the mean ITS is weak and data arescattered. It appears that there is a moderate linear correlationbetween the PLI for 50 mm in diameter size sample and theITS of rock samples. The results of the SV test show greatdata scattering and weak linear correlation with mean PLI andthe ITS. Significant non-linear correlation exists between themean UW and the mean ITS of the rocks. A moderate andweak correlation is evident between the mean UW of rocksand the mean UCS and the PLI for 50 mm in diameter sizesample.
123
Arab J Sci Eng
Some empirical methods such as the SHV, the PLI for50 mm in diameter size sample, the SV and the mean UWutilized in this study, were used to predict the mean UCS, theITS and the PLI for 50 mm in diameter size rock samples.However, the published equations are based mainly on rocktype and testing conditions. It may be necessary to includeother parameters in these equations or make clearer specifi-cations for their application.
As was expected, the BSG, ASG and BSSDG have verylimited range. However, because of sample characteristics,the UW and the WA exhibit a high range.
Accordingly, by knowing some physical and mechanicalcharacteristics of the Lower Oligocene limestone lying at thefoundation level beneath the Al Ain city, and on rock slopenear other new civil applications, it may be possible to avoidsome foundation instabilities previously experienced at somelocations within the city.
Acknowledgments The authors wish to express their sincere appreci-ation to the Spectra Jeotek Geotechnical Engineers, Abu Dhabi, UnitedArab Emirates for their kind help in laboratory tests and for makingtheir facilities available. Thanks go also to the Research Affairs officeat the United Arab Emirates University (UAEU) for providing financialsupport for this project. The authors are also very grateful to Assoc.Prof. Dr. James Thomas Fowler (UAEU) for his valuable comments ofthe manuscript.
References
1. Abdelghany, O.; Arman, H.; El Tokhi, M.; Hashem, W.; El Saiy, A.:Litho and biofacies of the Lower Oligocene rocks from the UnitedArab Emirates. In: 3rd International Paleontological CongressIPC3, London, 59 (2010)
2. Glennie, K.W.: The desert of Southeast Arabia. Manama, GulfPetroLink, Bahrain (2005)
3. Tokhi, M.; Arman, H.; Abdelghany, O.; Hashem, W.; El Saiy, A.:Isotope stratigraphy of Oligocene limestone in Al-Ain City, UnitedArab Emirates. Arab. J. Sci. Eng. 37, 1439–1449 (2012)
4. Shalabi, F.I.; Cording, E.J.; Al-Hattamleb, O.H.: Estimation of rockengineering properties using hardness tests. Eng. Geol. 90, 138–147 (2007)
5. ASTM Vol. 4.08. Soil and rock, building stones: Annual Book ofASTM Standards (1984)
6. ISRM Suggested methods. Rock characterization testing and mon-itoring. In: Brown, E.T. (ed.) International society for rock mechan-ics. Commission on testing methods, pp. 1–211. Pergamon press,Oxford, England (1981)
7. Wuerker, R.J.; McWilliams, J.R.: Microstructural techniques in thestudy of physical properties of rock. Int. J. Rock Mech. Min. Sci.6, 1–12 (1969)
8. Tugrul, A.; Zarif, I.H.: Engineering aspects of limestone weather-ing in Istanbul, Turkey. B. Eng. Geol. Environ. 58, 191–206 (2000)
9. Merriam, R.; Rieke, H.H.; Kim, Y.C.: Tensile strength related tomineralogy and texture of some granitic rocks. Eng. Geol. 4, 155–160 (1970)
10. Yagiz, S.: Correlation between slake durability and rock propertiesfor some carbonate rocks. B. Eng. Geol. Environ. 70, 377–383(2011)
11. Yasar, E.; Erdogan, Y.: Correlating sound velocity with the density,compressive strength and Young’s modulus of carbonate rocks. Int.J. Rock Mech. Min. Sci. 41, 871–875 (2004)
12. Kahraman, S.; Yeken, T.: Determination of physical properties ofcarbonate rocks from P-wave velocity. B. Eng. Geol. Environ. 67,277–281 (2008)
13. Sadeghi, H.; Khosravi, F.: A study of the effect of wave veloc-ity on solubility of limestone and chalk. In: Di, H.; Bendette,H. Geoffroy; Doanh, T.; Sauzeat, C. (ed.) Deformation charac-teristics of geometarial, pp. 409–413. Taylor and Francis, London(2003)
14. Yagiz, S.: Predicting uniaxial compressive strength, modulus ofelasticity and index properties of rock using the Schmidt hammer.B. Eng. Geol. Environ. 68, 55–63 (2009)
15. Chang, C.; Zoback, M.D.; Khaksar, A.: Empirical relationsbetween rock strength and physical properties in sedimentaryrocks. Eng. Geol. 51, 223–237 (2006)
16. Hunting Geology and Geophysics Limited. Report on a mineralsurvey of the U.A.E., Al-Ain area pp. 1–29. Ministry of Petroleumand Mineral Resources, Abu Dhabi (1979)
17. Cherif, O.H.; El-Deeb, W.M.Z.: The Middle Eocene-Oligocene ofthe northern Hafit area, south of Al Ain City (United Arab Emi-rates). Geo Mediterr. 11, 2007–217 (1984)
18. Hamdan, A.R.A.; Bahr, S.: Lithostratigraphy of the Paleocene suc-cession of northern Jabal Hafit, Al Ain area, United Arab Emi-rates. M.E.R.C. Ain Shams Univ., Earth Sci. Ser. 6, 201–224(1992)
19. Boukhary, M.; Abdelghany, O.; Hussein-Kamel, Y.; Bahr, S.;Alsayish, A.; Abdelrauf, M.: Oligocene larger foraminifera fromUnited Arab Emirates, Oman and Western Desert of Egypt. Hist.Biol. 22, 348–366 (2010)
20. Warrak, M.: Origin of the Hafit structure: implication for timing theTertiary deformation in the northern Oman Mountains. J. Struct.Geol. 18, 803–818 (1996)
21. Noweir, M.A.: Back-thrust origin of the Hafit structure, NorthernOman Mountain front, United Arab Emirates. GeoArabia. 5, 215–228 (2000)
22. Ali, Y.M.; Sirat, M.; Small, J.: Geophysical investigation of AlJaww plain, eastern Abu Dhabi: implications for structure and evo-lution of the frontal fold belts of Oman Mountains. GeoArabia. 13,91–118 (2008)
23. Dunham, R.J.: Classification of carbonate rocks according to depo-sitional texture. In: Ham, W.E. (ed.): Classification of carbonaterocks. AAPG Bull. Memoir. 1, 108–121 (1962)
24. Folk, R.L.: Practical classification of limestone. AAPG Bull. 43,1–38 (1959)
25. Folk, R.L.: Spectral subdivision of limestone types. In: Ham, W.E.(ed.) Classification of carbonate rocks. AAPG Bull. Memoir. 1,62–84 (1962)
26. ASTM D4543, 04.02. Standard practice for preparing rock corespecimens and determining dimensional and shape tolerances.Annual Book of ASTM Standards, pp. 600–603 (1986)
27. ASTM D2938, 04.08. Standard test method for unconfined com-pressive strength of intact rock core specimens. Annual Book ofASTM Standards, pp. 279–281 (1995)
28. Bieniawski, Z.T.; Hawkes, I.: Suggested methods for determiningthe tensile strength of rock materials; Parts II. Suggested methodsfor determining indirect tensile strength. ISRM Commission onStandardization of Laboratory and Field Tests. Int. J. Rock Mech.Min. Sci. 15, 102–103 (1978)
29. ASTM D5731, 04.0. Standard test method for determination of thepoint load strength index of rock. Annual Book of ASTM Stan-dards, pp. 501–507 (1995)
30. Hoek, E.: Rock mechanics laboratory testing in the context of aconsulting engineering organization. Int. J. Rock Mech. Min. Sci.14, 93–101 (1977)
31. ASTM D5873, 04.08. Standard test method for determination ofrock hardness by rebound hammer method. Annual Book of ASTMStandards. pp. 693–695 (1996)
123

Arab J Sci Eng
32. ASTM D4644. Standard test method for slake durability of shalesand similar weak rocks. Annual Book of ASTM Standards, pp. 1–4(2004)
33. BS 1881-203:1986 Recommendations for measurement of velocityof ultrasonic pulses in concrete. British Standard Institute, pp. 1–17(2004)
34. BS 812:1995 Testing aggregates-Part 2: Method of determinationof density. British Sstandard Institute, pp. 1–5 (2004)
35. ISRM: Standardization of laboratory and filed tests. Int. J. RockMech. Min. Sci. Geomech. Abst. vol. 15, p. 348 (1978)
36. Anon: Classification of rocks and soils for engineering geologicalmapping: Part 1-Rock and soils materials. Bull. Int. Assoc. Geo.19, 364–371 (1979a)
37. Yasar, E.; Erdogan, Y.: Correlating sound velocity with the density,compressive strength and Young’s modulus of carbonate rocks. Int.J. of Rock Mech. Min. Sci. 41, 871–975 [Technical Note] (2004)
38. Kahraman, S.; Ulker, U.; Delibalta, M.S.: A quality classificationof building stones from P-wave velocity and its application to stonecutting with gang saws. J. S. Afr. Inst. Min. Metall. 107, 427–430(2007)
39. Mavko, G.: Introduction to rock physics, Course notes, pp. 73–112.Spring quarter, Stanford Rock Physics Laboratory (2001)
40. Blum, P.: Physical properties handbook: a guide to the shipboardmeasurement of physical properties of deep-sea cores. ODP Tech.Note, 26 (1997). doi:10.2973/odp.tn.26
123