an integrated petrophysical and rock physics analysis to
TRANSCRIPT
An integrated petrophysical and rockphysics analysis to improve reservoircharacterization of Cretaceous sandintervals in Middle Indus Basin, Pakistan
Tahir Azeem1,2, Wang Yan Chun2, MonaLisa1, Perveiz Khalid3,Liu Xue Qing2, Muhammad Irfan Ehsan3, Muhammad Jawad Munawar4 andXie Wei2
1Department of Earth Sciences, Quaid-I-Azam University, Islamabad, Pakistan2 School of Geophysics and Information Technology, China University of Geosciences, Beijing 100083,People’s Republic of China3 Institute of Geology, University of the Punjab, 54590 Lahore, Pakistan4 School of Geosciences, China University of Petroleum, Qingdao, People’s Republic of China
E-mail: [email protected]
Received 15 October 2015, revised 24 November 2016Accepted for publication 30 November 2016Published 20 January 2017
AbstractThe sand intervals of the Lower Goru Formation of the Cretaceous age, widely distributed in theMiddle and Lower Indus Basin of Pakistan, are proven reservoirs. However, in the Sawan gasfield of the Middle Indus Basin, these sandstone intervals are very deep and extremelyheterogeneous in character, which makes it difficult to discriminate lithologies and fluidsaturation. Based on petrophysical analysis and rock physics modeling, an integrated approach isadopted to discriminate between lithologies and fluid saturation in the above-mentioned sandintervals. The seismic velocities are modeled using the Xu–White clay–sand mixing rock physicsmodel. The calibrated rock physics model shows good consistency between measured andmodeled velocities. The correlation between measured and modeled P and S wave velocities is92.76% and 84.99%, respectively. This calibrated model has been successfully used to estimateother elastic parameters, even in those wells where both shear and sonic logs were missing.These estimated elastic parameters were cross-plotted to discriminate between the lithology andfluid content in the target zone. Cross plots clearly separate the shale, shaly sand, and gas-bearingsand clusters, which was not possible through conventional petrophysical analysis. These dataclusters have been exported to the corresponding well for the purpose of interpolation betweenwells and to analyze the lateral and vertical variations in lithology and fluid content in thereservoir zone.
Keywords: petrophysics, rock physics modeling, elastic parameters, reservoir characterization,cross well correlation, Sawan gas field
(Some figures may appear in colour only in the online journal)
1. Introduction
Petrophysical analysis plays an important role in reservoircharacterization, especially in discriminating between thehydrocarbon and non-hydrocarbon bearing zones (Yuedong
and Hongwei 2007). In the literature, different techniqueshave been proposed for fluid and lithology discrimination(Castagna and Swan 1997, Chi and Han 2009, He et al 2011,Hu et al 2011, Ahmed et al 2016). Generally, petrophysicalanalysis is performed to transform the wireline log data into
Journal of Geophysics and Engineering
J. Geophys. Eng. 14 (2017) 212–225 (14pp) doi:10.1088/1742-2140/14/2/212
1742-2132/17/020212+14$33.00 © 2017 Sinopec Geophysical Research Institute Printed in the UK212
Dow
nloaded from https://academ
ic.oup.com/jge/article/14/2/212/5106858 by guest on 08 M
arch 2022
reservoir properties such as volume of shale, porosity, per-meability, and water and hydrocarbon saturation. Properanalysis of these reservoir properties can significantlyenhance the ability to discriminate between the hydrocarbonand non-hydrocarbon bearing zones (Ajisafe and Ako 2013).However, petrophysical results can be affected by bad bore-hole conditions, missing logs, temperature, pressure, andsalinity. In addition, based on single-well data, petrophysicalmodels are generally established for the particular interval ofinterest. Therefore, petrophysical models are often consistentover the particular interval of the well and sometimes fail toprovide good results between the wells, even when the wellsare very closely spaced (Bisht et al 2013). The integratedworkflows of petrophysics and rock physics are used to find aconsistent rock physics model for the entire area of interest.Once a consistent rock physics model has been established, itcan be effectively used to synthesize the elastic logs, identifythe inconsistencies in the well logs and quick well data ana-lysis, and improve seismic to well tie, which improves thereservoir characterization and minimizes the risk of uncer-tainty (Bisht et al 2013, Sams 2014). These calibrated modelsalso have the ability to accurately predict the variations inlithology and fluid saturation (Odegaard and Avseth 2004,Mavko et al 2009, Grana et al 2012). The most importantaspect of these integrated models is to use the accurate andconsistent mineral and fluid properties, which leads to anaccurate calibration of these rock physics models (Mavkoet al 2009). Accurate and consistent rock physics models notonly efficiently differentiate between the hydrocarbon- andnon-hydrocarbon-bearing zones but also indicate the pro-blems present in the well log data such as borehole washouts,data gaps, mud filtrate, and insufficient log suites (Avsethet al 2001).
Integrated rock physics models provide more accurateand reliable links between petrophysics and seismic andreservoir properties (Avseth 2000, Xu and Payne 2009, Heet al 2011, Khalid et al 2014b). A significant number of rockphysics models have been proposed by various workers(Mavko et al 2009). Avseth et al (2005) has classified thesemodels into different categories such as inclusion models(Kuster and Toksoz 1974, Cheng and Toksöz 1979, Berry-man 1980, Liu and Sun 2015), contact models (Mindlin 1949,Walton 1987, Dvorkin et al 1994, Dvorkin and Nur 1996),transformations (Gassmann 1951, Berryman and Mil-ton 1991), bounds (Voigt 1910, Reuss 1929, Hill 1952,Hashin and Shtrikman 1963), and computational models.Recently, Khalid et al (2014) proposed a modified rockphysics model based on thermodynamic properties of reser-voir fluids at in situ conditions.
Inclusion models ponder the rock as an elastic block ofminerals containing the pore spaces. Therefore, results ofthese models show better consistency with the measured welllog data. Xu and White (1995) proposed a clay–sand mixturemodel which is based on the Kuster and Toksoz (1974)inclusion model, supplemented by the Gassmann (1951) andeffective medium theories (Zhang 2008). This model canaccount for the effect of clay content on the seismic velocities,and is very useful for estimating shear wave velocity. A
combination of shear and acoustic velocities has beenextensively used as a seismic attribute in reservoir char-acterization (Avseth et al 2005, Chi and Han 2009). Seismicvelocities of rock provide information about minerals, porefluids, and their distribution within the rock skeleton (Mavkoet al 1998, Avseth 2000, Feng-Ying et al 2014). Like otherparameters such as porosity, permeability, fluid saturation,fluid composition, formation temperature, pressure, andmineralogy, clay content also influences the seismic proper-ties of a porous rock (Ahmed et al 2016, Wang et al 2015).The presence of clay decreases the seismic velocities(Minear 1982, Han et al 1986, Marion et al 1992, Ahmed atal 2016) and aspect ratio values (Sams and Andrea 2001,Sams and Focht 2013). Thus, it is important to account for thevolume and distribution of clay when trying to estimate theelastic velocities.
The Lower Goru Formation of the Cretaceous age is aproven reservoir in the middle and lower Indus Basin ofPakistan. In the Sawan gas field of the middle Indus Basin,the sand intervals of this formation are composed of quartz,feldspar, volcanic rock fragments, chlorite, clay, glauconite,and minor amounts of calcite. The core and wireline log datashow that the mineral composition of these sands is verymuch heterogeneous from one well to another, which makes itdifficult to use a single petrophysical model for reservoircharacterization. The aim of this study is to use an integratedapproach based on petrophysical analysis and a rock physicsmodel to solve the rock heterogeneity effects (Fitchet al 2015, Ahmed et al 2016, Khalid et al 2016) on seismicproperties such as velocities and elastic moduli of the sandintervals. The rock physics model proposed by Xu and White(1995) is calibrated using wireline logs for the study area.
2. Geological setting
The study area is located in the north–south trending prolificmiddle Indus Basin, which is bounded by the Indian shield inthe east; Kirther Ranges, Sulaiman Fold, and Thrust Belt inthe west; Sargodha High in the north; and Jacobabad–Khairpur High in the south (Kadri 1995). The location of thestudy area and Jacobabad High is shown in figure 1. In thenorthwest direction of the study area, the famous KhairpurHigh is located that exhibits very high geothermal gradient upto 4.8 °C/100 m. Khairpur High played an important role inthe formation of structural traps in the Kadanwari, Sawan, andsurrounding areas (Ahmad and Chaudhry 2002, Bergeret al 2009). Since the Indus Basin is rich in hydrocarbon andcontains several complete petroleum systems, a large numberof wells have been drilled in the middle and lower IndusBasin. The organic rich black shales of the Sembar Forma-tion, early Cretaceous in age, are the proven primary sourcerock in the basin. In the middle and lower Indus Basin, theSembar Formation, with variable thickness (0–260 m), hasbeen deposited in a marine environment (Iqbal andShah 1980). Sembar Formation mainly consists of type-IIIkerogen organic matter, which is mainly favorable for gasgeneration. This formation is deeper and thermally mature
213
J. Geophys. Eng. 14 (2017) 212 T Azeem et al
Dow
nloaded from https://academ
ic.oup.com/jge/article/14/2/212/5106858 by guest on 08 M
arch 2022
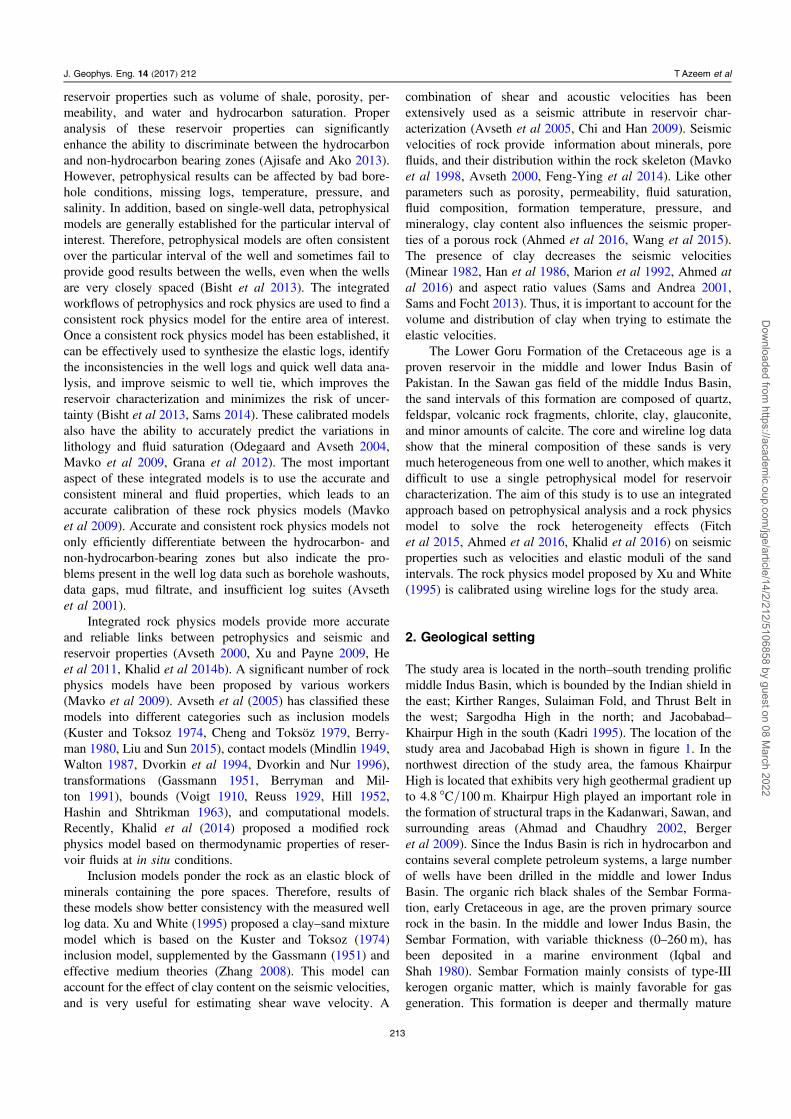
towards the western part, while it is shallower and less maturetowards the eastern part of the Indus Basin (Wandreyet al 2004). Sembar Formation is overlain by the Goru For-mation, which is divided into two parts. The upper part ismainly composed of shale and is termed the Upper Goruwhereas the lower part is termed the Lower Goru(Kadri 1995).
The medium to coarse grained sandstone of the LowerGoru Formation is the main reservoir rock in the middle IndusBasin, which is deposited in a shallow marine environment.This reservoir formation is composed of sandstone, siltstone,inter-bedded shale, and thin bedded limestone (Kazmi andJan 1997, Berger et al 2009). The lower sandy part of thisformation has been further divided (from bottom to top) intofour stratigraphic intervals, i.e., A, B, C, and D as shown infigure 2 (Krois et al 1998). The B, C, and D intervals act aspotential gas reservoirs in the study area (Ahmad et al 2004,Munir et al 2011). Petrographic analysis reveals that the Aand B intervals are quartz arenite, whereas the C interval issublithic to lithic arenite, which includes a significant amount(almost 13%) of partially altered basic volcanic rock frag-ments (McPhee and Enzendorfer 2004, Berger et al 2009).The upper part of the Lower Goru Formation acts as aregional seal which is mainly composed of transgressive,siderite cemented shales and siltstones. Chlorite acts ascement and comprises almost 80% of the clay fraction; thissignificant amount of the chlorite decreases the porosity of therocks (McPhee and Enzendorfer 2004).
3. Methodology
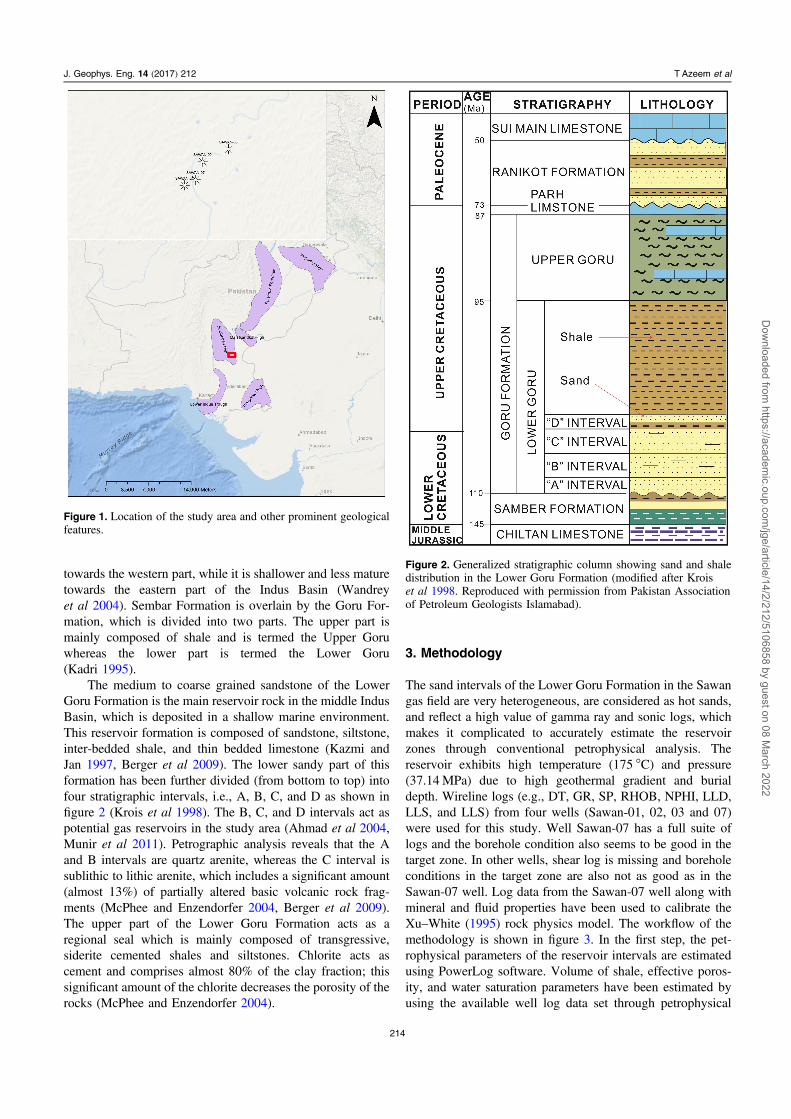
The sand intervals of the Lower Goru Formation in the Sawangas field are very heterogeneous, are considered as hot sands,and reflect a high value of gamma ray and sonic logs, whichmakes it complicated to accurately estimate the reservoirzones through conventional petrophysical analysis. Thereservoir exhibits high temperature (175 °C) and pressure(37.14MPa) due to high geothermal gradient and burialdepth. Wireline logs (e.g., DT, GR, SP, RHOB, NPHI, LLD,LLS, and LLS) from four wells (Sawan-01, 02, 03 and 07)were used for this study. Well Sawan-07 has a full suite oflogs and the borehole condition also seems to be good in thetarget zone. In other wells, shear log is missing and boreholeconditions in the target zone are also not as good as in theSawan-07 well. Log data from the Sawan-07 well along withmineral and fluid properties have been used to calibrate theXu–White (1995) rock physics model. The workflow of themethodology is shown in figure 3. In the first step, the pet-rophysical parameters of the reservoir intervals are estimatedusing PowerLog software. Volume of shale, effective poros-ity, and water saturation parameters have been estimated byusing the available well log data set through petrophysical
Figure 1. Location of the study area and other prominent geologicalfeatures.
Figure 2. Generalized stratigraphic column showing sand and shaledistribution in the Lower Goru Formation (modified after Kroiset al 1998. Reproduced with permission from Pakistan Associationof Petroleum Geologists Islamabad).
214
J. Geophys. Eng. 14 (2017) 212 T Azeem et al
Dow
nloaded from https://academ
ic.oup.com/jge/article/14/2/212/5106858 by guest on 08 M
arch 2022

analysis. In a second step, these estimated petrophysicalparameters along with fluid properties, solid mineral matrixvalues, and pore aspect ratios were utilized to calibrate theproposed model. Then, modeled and measured velocitieswere cross-plotted to check the degree of matching. In nextstep, this calibrated model was used to estimate elastic para-meters in the remaining available wells. These estimatedelastic parameters have been cross-plotted to mark the litho-fluid zones and cutoff values of each elastic and petrophysicalparameter. Finally, correlation between wells was performedto check the lateral and vertical variations in the target zone.
4. Results and discussion
The methodology proposed in the previous section is appliedon the wireline logs of four wells: Sawan-01, -02, -03, and-07. In this section, the petrophysical study of reservoirintervals is presented firstly. Then the results of rock physicsmodeling are thoroughly discussed. The calibrated rockphysics model and petrophysical analysis are used for reser-voir characterization in the reservoir intervals encountered inthe four wells of the study area.
4.1. Petrophysical analysis
Petrophysical analysis fills a gap between core and seismicdata and plays an important role in reservoir characterization.The estimation of various petrophysical parameters fromwireline logs with accuracy can significantly enhance theability to interpret the lithology and reservoir characterization(Fitch et al 2015). The quality of log data has a stronginfluence on the accuracy of rock physics models (Avsethet al 2001). Conventional well log curves such as density,gamma ray, caliper, resistivity, neutron porosity, and sonicare available in the Sawan-07 well. Considering the avail-ability of well log curves and borehole conditions, the Sawan-07 well was chosen as a reference well for this study.
Petrophysical parameters such as volume of shale, effectiveporosity, and water saturation were estimated as follows.
4.1.1. Volume of shale. Proper estimation of shale contentprovides the basis for accurately deriving the otherpetrophysical parameters such as porosity and watersaturation in the shaly formation. Different shale indicatormethods are used in practice, which are based on theestimation of gamma ray index (equation (1)) from thegamma ray log:
=-
-I
GR GR
GR GR, 1GR
log min
max min( )
where IGR is gamma ray index. GRlog represents gamma raylog value at a particular depth, while GRmin and GRmax areminimum and maximum values of gamma ray log in a givendepth interval. However, this linear method overestimates thevolume of shale in real formations (Poupon andGaymard 1970), whereas non-linear methods give moreaccurate results (Larionov 1969, Stieber 1970, Clavieret al 1971). Therefore, we have used these non-linearmethods to estimate the volume of shale (equations (2)–(4)). The value of IGR has been substituted in equations (2)–(4) to estimate the volume of shale:
= -´V _ 0.33 2 1 2Ish Larionov old
2 GR( ) ( )( )( )
=- ´
VI
I3 23GR
GRsh Stieber ( )( )
= - +V I1.7 3.38 0.7 . 4GRsh Clavier2( ) ( )( )
Here, Vsh(Larionov_old), Vsh(Stieber), and Vsh(Clavier) representvolume of shale measured using Larionov old rock, Stieber,and Clavier methods, respectively. The estimated shalevolumes are shown in figure 4. The purpose of using differentmethods was to choose the method which gives lowestvolume of shale in order to minimize the risk of errors due tothe presence of hot sands (sands including some content ofradioactive material, usually potassium or thorium, and
Figure 3. Schematic diagram of the technique used for improved reservoir characterization.
215
J. Geophys. Eng. 14 (2017) 212 T Azeem et al
Dow
nloaded from https://academ
ic.oup.com/jge/article/14/2/212/5106858 by guest on 08 M
arch 2022

showing high values of gamma ray log) or interbedded shales(Hussein and Ahmed 2012). In practice, the neutron-densitymethod is used to minimize the effect of radioactive minerals.However, in some cases, the neutron-density method does notprovide accurate results, especially when hot sand is saturatedwith gas or light hydrocarbon fluids (Hamada 1996, Adeotiet al 2009). In the case of dirty sand, modern spectral gammaray is a more appropriate technique for computing volume ofshale. Since spectral gamma ray was not available, non-linearmethods proposed by different authors (Larionov 1969,Stieber 1970, Clavier et al 1971) were used to calculate thevolume of shale of the target interval. Figure 4 clearlyindicates that the volume of shale calculated using the Stieber(1970) method is lower compared to other methods. More-over, the Stieber method is also suitable for gas reservoirs(Adeoti et al 2009). Therefore, volume of shale calculated byusing the Stieber method was utilized for further analysis.
4.1.2. Porosity. Gas saturation near the wellbore affects theporosity logs. In the gas-bearing zone the density porosity logshows high values whereas the neutron porosity log showslow values, so a combination of neutron and densityporosities is used to remove this effect. However, in shalyformation, it is necessary to remove the effect of shale as thepresence of shale affects the porosity. Equations (5) and (6)were used to remove the effect of shale on neutron anddensity porosities (Schlumberger 1974, Doveton 1999):
F = F - FV , 5NC N sh Nsh ( )
F = F - FV , . 6DC D sh Dsh ( )
Here, ΦNC and ΦDC are the corrected neutron and densityporosities; ΦN and ΦD represent neutron and density porositylog, respectively; while ΦNsh and ΦDsh represent neutron anddensity porosities in the shaly area, respectively. Finally, wecombined these corrected porosities in order to calculate theeffective porosity Φe:
F =F + F
2. 7e
NC2
DC2( ) ( ) ( )
4.1.3. Water saturation. As the presence of shale also affectsthe water saturation, we compensate for the effect of shale byapplying the Indonesian model (Poupon and Levaux 1971).This model improves the results reliability in shalyformations, as it is based on field observations(Widarsono 2012, Alao et al 2013). The mathematical formof this model is
⎪
⎪
⎪
⎪
⎡
⎣⎢⎢⎧⎨⎩
⎛⎝⎜
⎞⎠⎟
⎛⎝⎜
⎞⎠⎟
⎫⎬⎭
⎤
⎦⎥⎥
/ //
f= +
--
SV
R RR , 8w
Vem
wt
sh2
sh
1 2 1 2 2 1 2sh
( )
where Sw represents water saturation; Rsh, Rw, and Rt are theshale, water, and true resistivities, respectively; m iscementation factor and its value is 2.15; Vsh is volume ofshale; and fe is effective porosity. These estimatedpetrophysical parameters (volume of shale, porosity, andwater saturation) are shown in figure 5.
4.2. Rock physics modeling/calibration of rock physics model
Rock physics modeling is a process of finding an appropriatemodel that shows good consistency with the available welllog data (Walls et al 2004). The proposed Xu–White (1995)clay–sand mixing model is based on the Kuster and Toksoz(1974) model supplemented by the Gassmann (1951) andpore aspect ratio theories. This model has the ability toseparate the sand- and clay-related pores by assigning themdifferent aspect ratios. If αS and αc are the aspect ratios ofsand- and clay-related pores, ΦS and Φc are porosities of sandgrains and clay content, respectively. Then these sand andclay grains can be mixed through clay content in order tocalculate the elastic properties of dry rock porous media, asshown in equations (9)–(11):
⎛⎝⎜
⎞⎠⎟ åm m
a-+
=-+
F=
K K
K
K K
KT
3 4
1
3 3 4, 9
l s cl iijj l
d m
d m
f m
m m ,
( ) ( )
å
m mm m m m
m mm m
a
-+ + +
=-
+F
=
K K
KF
6 2 9 8
25 3 4, 10
l s cl l
d m
d m m m m m
f m
m m m ,
( ) ( )
( )( ) ( )
a aa
= -F TT
3, 11l iijj l
ijij l( ) ( )( )
( )
where Kd, Km, and Kf represent bulk modulus of dry rockframe, solid matrix, and pore fluid respectively, and μd, μm,and μf represent the corresponding shear modulus. Φ is theporosity, while Tiijj(αl) and Tijij(αl) are the scalar functionsof the aspect ratio, which have been calculated using theEshelby (1957) approach.
The elastic properties of clay are not well established inthis area and vary dramatically for different clay types. At theinitial stage of this model, we used the typical solid mineralvalues for clay and sand as proposed by Han et al (1986) and
Figure 4. Cross plot between gamma ray index and volume of shalecalculated by different methods.
216
J. Geophys. Eng. 14 (2017) 212 T Azeem et al
Dow
nloaded from https://academ
ic.oup.com/jge/article/14/2/212/5106858 by guest on 08 M
arch 2022
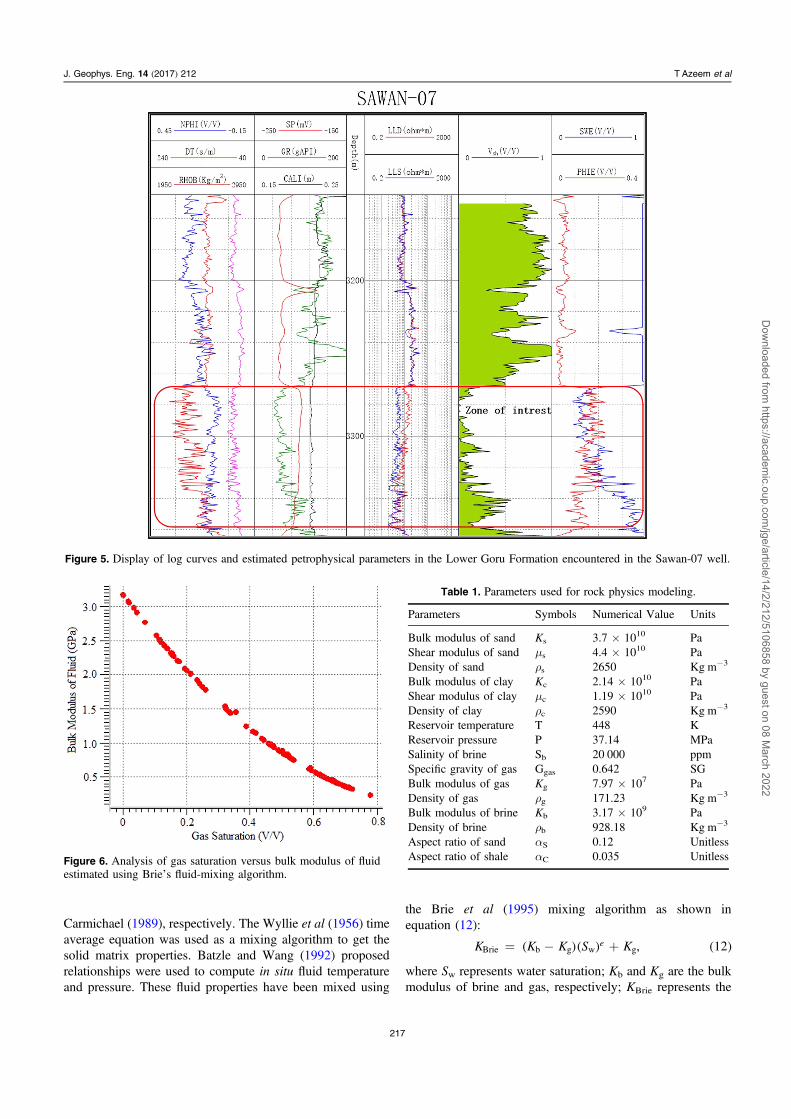
Carmichael (1989), respectively. The Wyllie et al (1956) timeaverage equation was used as a mixing algorithm to get thesolid matrix properties. Batzle and Wang (1992) proposedrelationships were used to compute in situ fluid temperatureand pressure. These fluid properties have been mixed using
the Brie et al (1995) mixing algorithm as shown inequation (12):
= - +K K K S K , 12eBrie b g w g( )( ) ( )
where Sw represents water saturation; Kb and Kg are the bulkmodulus of brine and gas, respectively; KBrie represents the
Figure 5. Display of log curves and estimated petrophysical parameters in the Lower Goru Formation encountered in the Sawan-07 well.
Figure 6. Analysis of gas saturation versus bulk modulus of fluidestimated using Brie’s fluid-mixing algorithm.
Table 1. Parameters used for rock physics modeling.
Parameters Symbols Numerical Value Units
Bulk modulus of sand Ks 3.7×10¹⁰ PaShear modulus of sand μs 4.4×10¹⁰ PaDensity of sand ρs 2650 Kg m−3
Bulk modulus of clay Kc 2.14×10¹⁰ PaShear modulus of clay μc 1.19×10¹⁰ PaDensity of clay ρc 2590 Kg m−3
Reservoir temperature T 448 KReservoir pressure P 37.14 MPaSalinity of brine Sb 20 000 ppmSpecific gravity of gas Ggas 0.642 SGBulk modulus of gas Kg 7.97×10⁷ PaDensity of gas ρg 171.23 Kg m−3
Bulk modulus of brine Kb 3.17×10⁹ PaDensity of brine ρb 928.18 Kg m−3
Aspect ratio of sand αS 0.12 UnitlessAspect ratio of shale αC 0.035 Unitless
217
J. Geophys. Eng. 14 (2017) 212 T Azeem et al
Dow
nloaded from https://academ
ic.oup.com/jge/article/14/2/212/5106858 by guest on 08 M
arch 2022

bulk modulus of fluid calculated using Brie’s approach; and eis the exponent of fluid mixing whose value varies from 1 to40. When e=1, the mixing is Voigt’s average and whene=40, the mixing results are very near to wood’s average(Brie et al 1995). Figure 6 clearly shows that the value offluid modulus (KBrie) increases with decrease in gas saturation(Sg) and vice versa. This behavior indicates that the stiffnessof effective modulus of gas-bearing sediments decreases withthe increase in gas saturation.
The elastic moduli of saturated rocks were calculatedusing the Gassmann (1951) fluid substitution model, whichgives the relationship between bulk modulus of saturatedrock, dry rock modulus, pore fluid, and solid matrix(equations (13) and (14)):
⎛⎝⎜
⎞⎠⎟
- =
-
F+
- F-
K K
K
K
K K
K
K
1
113sat d
d
m
2
f m
d
m2
( ) ( )
m m= . 14sat d ( )
Density of saturated rock was calculated usingequation (15):
r r r= F + - F1 . 15sat f m( ) ( )
Here, Ksat and μsat are the bulk and shear modulus of thesaturated rocks, respectively, whereas ρsat, ρf, and ρm repre-sent the densities of the saturated rock, pore fluid, and solidmatrix, respectively. Finally, we substitute Ksat, μsat, and ρsatvalues in equations (16) and (17) to obtain the elastic velo-cities
m
r=
+V
K4
3 16P
satsat
sat
( )
mr
=V . 17Ssat
sat
( )
Figure 7. Cross plot between measured and calculated velocitiesusing reference well data (Sawan-07): (a) P-wave velocity, (b)S-wave velocity; color coding represents measured depth. Figure 8. Comparison between measured and modeled elastic
properties to check the effectiveness of the model. (a) Measuredacoustic impedance versus VP/VS ratio. (b) Modeled acousticimpedance versus VP/VS ratio. The data points are color coded bygamma ray log.
218
J. Geophys. Eng. 14 (2017) 212 T Azeem et al
Dow
nloaded from https://academ
ic.oup.com/jge/article/14/2/212/5106858 by guest on 08 M
arch 2022
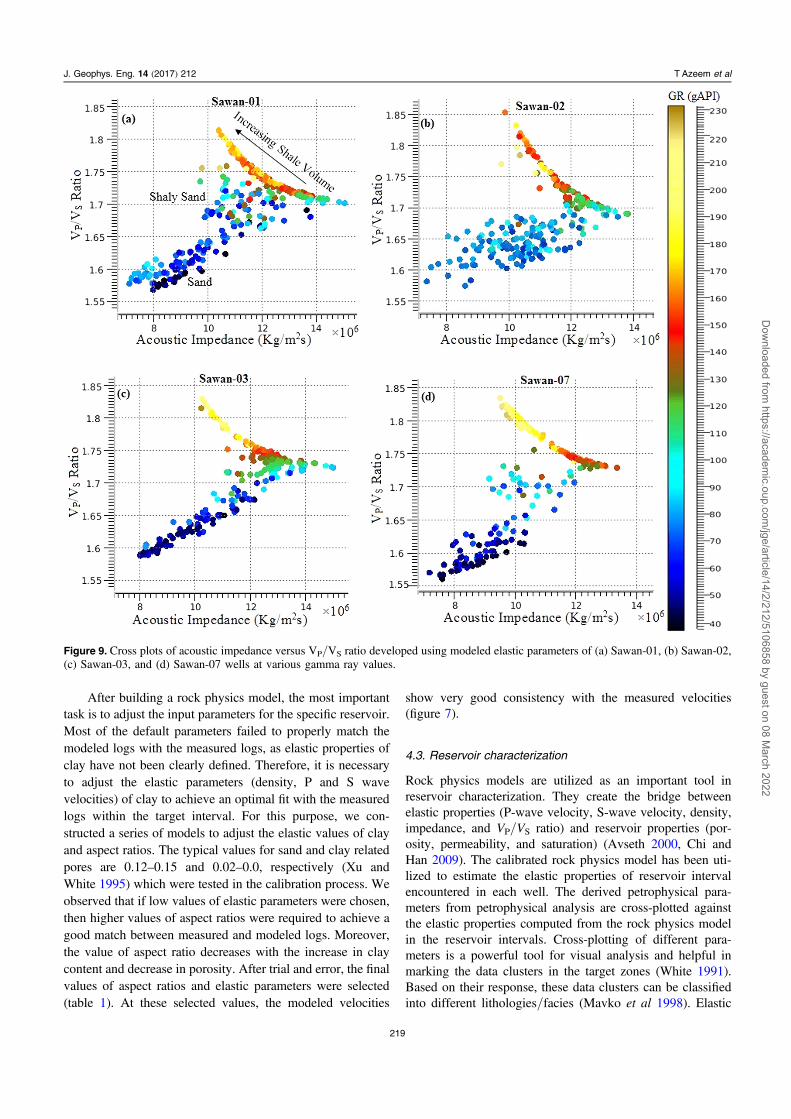
After building a rock physics model, the most importanttask is to adjust the input parameters for the specific reservoir.Most of the default parameters failed to properly match themodeled logs with the measured logs, as elastic properties ofclay have not been clearly defined. Therefore, it is necessaryto adjust the elastic parameters (density, P and S wavevelocities) of clay to achieve an optimal fit with the measuredlogs within the target interval. For this purpose, we con-structed a series of models to adjust the elastic values of clayand aspect ratios. The typical values for sand and clay relatedpores are 0.12–0.15 and 0.02–0.0, respectively (Xu andWhite 1995) which were tested in the calibration process. Weobserved that if low values of elastic parameters were chosen,then higher values of aspect ratios were required to achieve agood match between measured and modeled logs. Moreover,the value of aspect ratio decreases with the increase in claycontent and decrease in porosity. After trial and error, the finalvalues of aspect ratios and elastic parameters were selected(table 1). At these selected values, the modeled velocities
show very good consistency with the measured velocities(figure 7).
4.3. Reservoir characterization
Rock physics models are utilized as an important tool inreservoir characterization. They create the bridge betweenelastic properties (P-wave velocity, S-wave velocity, density,impedance, and VP/VS ratio) and reservoir properties (por-osity, permeability, and saturation) (Avseth 2000, Chi andHan 2009). The calibrated rock physics model has been uti-lized to estimate the elastic properties of reservoir intervalencountered in each well. The derived petrophysical para-meters from petrophysical analysis are cross-plotted againstthe elastic properties computed from the rock physics modelin the reservoir intervals. Cross-plotting of different para-meters is a powerful tool for visual analysis and helpful inmarking the data clusters in the target zones (White 1991).Based on their response, these data clusters can be classifiedinto different lithologies/facies (Mavko et al 1998). Elastic
Figure 9. Cross plots of acoustic impedance versus VP/VS ratio developed using modeled elastic parameters of (a) Sawan-01, (b) Sawan-02,(c) Sawan-03, and (d) Sawan-07 wells at various gamma ray values.
219
J. Geophys. Eng. 14 (2017) 212 T Azeem et al
Dow
nloaded from https://academ
ic.oup.com/jge/article/14/2/212/5106858 by guest on 08 M
arch 2022

attributes (VP/VS ratio) has the ability to discriminate betweendifferent type of lithology and payable sand in the target zone(Benzing et al 1983, Miller and Stewart 1990, Hugheset al 2008). However, a combination of P-impedance and VP/VS ratio can be utilized to efficiently predict the lithology andfluid saturation (Odegaard and Avseth 2004, Avseth andBachrach 2005, Chi and Han 2009).
To verify the effectiveness of the model, calculated andmeasured elastic impedance is cross-plotted against VP/VS
ratio for the entire reservoir interval (figure 8). The data pointsare color coded using gamma ray log. Figures 8(a) and (b) aretotally different from each other. The cross plot betweenmodeled parameters (figure 8(b)) clearly separates the dif-ferent types of facies whereas cross plot between measured(logs) parameters (figure 8(a)) fails to separate these facies.Since the measured log data is affected by different para-meters and environmental conditions, it is difficult to dis-criminate fluid contents or lithology from log data. However,in modeled data, we have more control over the input
parameters, so it is more suitable and effective for differ-entiating different type of facies as shown in figure 8. Thefacies against high GR values (shales) are clearly separatedfrom the facies of low GR values (sands). Keeping in mindthe effectiveness of the model, cross plots between VP/VS andacoustic impedance (figure 9) have been developed in order todiscriminate between the different type of facies in all wells.In each cross plot (figures 9(a)–(d)), different type of dataclusters can be clearly identified in the graphs. The datacluster present at the lower portion of the graph with lowacoustic impedance, VP/VS ratio, and gamma ray valuesrepresents clean sand. However, the upper part of the crossplots, where higher VP/VS ratio and gamma ray values areplotted in curve-like form, represent shale. The trends of theseparameters are closely matched with the cross plots done byCastagna et al (1993). Shaly sand exhibits different behaviorthan sand and shale, and it can be clearly identified at eachcross plot between these two sand and shale bodies. Shalysand sediments exhibit gamma ray values between 80 to 120
Figure 10. Cross plots of acoustic impedance versus VP/VS ratio developed using modeled elastic parameters of (a) Sawan-01, (b) Sawan-02,(c) Sawan-03, and (d) Sawan-07 wells at different water saturation values. Data cluster with low acoustic impedance, VP/VS ratio, and watersaturation shows gas saturation.
220
J. Geophys. Eng. 14 (2017) 212 T Azeem et al
Dow
nloaded from https://academ
ic.oup.com/jge/article/14/2/212/5106858 by guest on 08 M
arch 2022

API. On the other hand, if sand is saturated with gas, then thevalue of acoustic impedance, VP/VS ratio, and water satur-ation parameters will be on the lower side (figure 10). Thepresence of gas strongly affects the elastic parameters andcauses the acoustic impedance and VP/VS ratio values todecrease (Zhao et al 2013). From figures 10(a)–(d), it can be
clearly seen that the gas-bearing sediments have VP/VS andacoustic impedance values less than or equal to 1.65 and1.02×107, respectively.
Rock physics attributes such as acoustic and shearimpedances have been combined to discriminate fluid satur-ation. Water saturation is used to color code the data points
Figure 11. Cross plots of acoustic impedance versus shear impedance calculated using modeled elastic properties of (a) Sawan-01, (b) Sawan-02, (c) Sawan-03, and (d) Sawan-07 wells. Color coding represents water saturation. Data cluster with low water saturation, acousticimpedance, and shear impedance represents gas-saturated zone.
Table 2. Quantitative values (in average) of elastic and petrophysical parameters for different identified rock types.
Rock Type
Parameters Gas-Bearing Sand Shaly Sand Shale
Gamma ray (API) <80 80–120 >120Water saturation (V/V) <0.55 0.55–0.9 >0.9Porosity (V/V) >0.11 0.05–0.11 <0.05P-Impedance (Kg m−2*S) <1.02×10⁷ 1.02×10⁷–1.2×10⁷ >1.2×10⁷
S-Impedance(Kg m−2*S) 6.2×10⁶ 6.2×10⁶–7.2×10⁶ >7.2×10⁶
Vp/Vs ratio �1.65 >1.65–1.72 >1.72
221
J. Geophys. Eng. 14 (2017) 212 T Azeem et al
Dow
nloaded from https://academ
ic.oup.com/jge/article/14/2/212/5106858 by guest on 08 M
arch 2022
(figure 11). The cross plots of these attributes clearly sepa-rates the data points into three types of clusters. The clusterhaving low water saturation, acoustic impedance, and shearimpedance values represents gas-bearing sand. However, thecluster having high water saturation (100% saturation),acoustic impedance, and shear impedance values representsshale bodies with no gas saturation. The separation betweenthese two clusters (sand and shale) represents water saturation(figure 11). The water-bearing sediments exhibit highervalues of acoustic impedance and water saturation as com-pared to gas-bearing sediments. These water-bearing sedi-ments can also be clearly identified on the cross plots havingelastic and water saturation values between gas-bearing sandand shale bodies. On the basis of petrophysical and cross-plotanalysis, the average quantitative (cutoff) values of elastic andpetrophysical properties for different rock types have beendefined (table 2). The cross-plotting results show that ourcalibrated model effectively predicts the lithology and fluidcontent in the Sawan gas field, Middle Indus Basin, Pakistan.
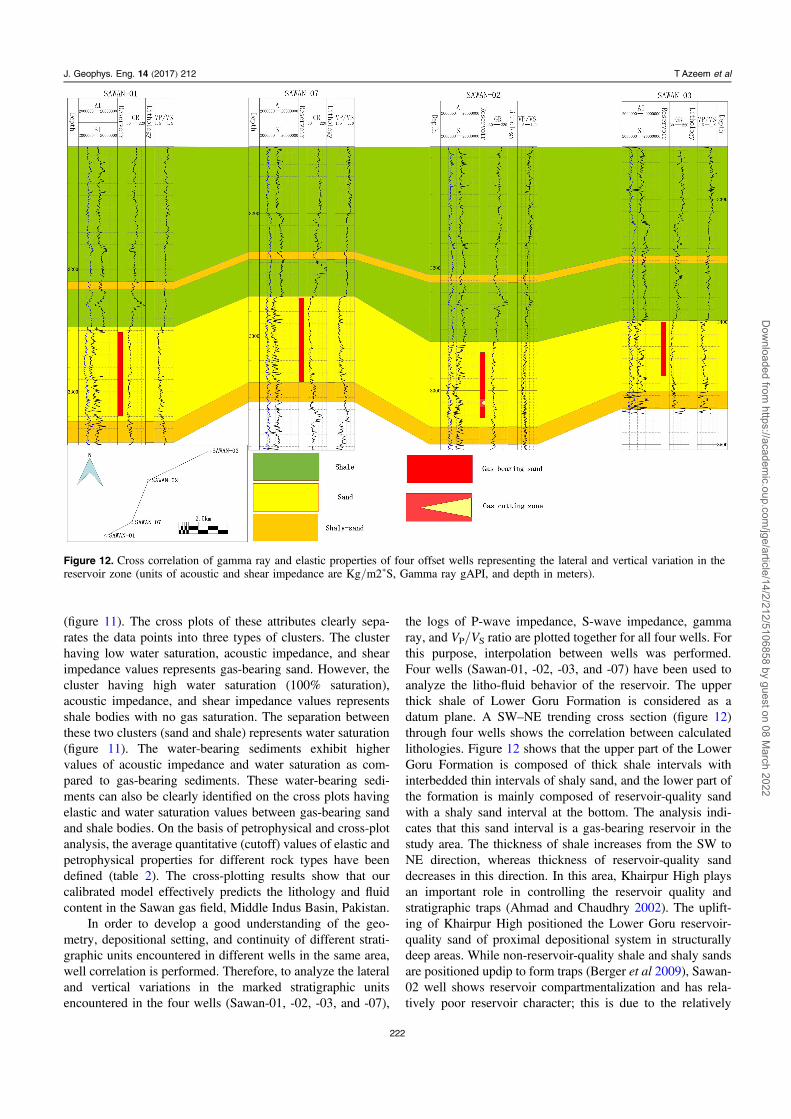
In order to develop a good understanding of the geo-metry, depositional setting, and continuity of different strati-graphic units encountered in different wells in the same area,well correlation is performed. Therefore, to analyze the lateraland vertical variations in the marked stratigraphic unitsencountered in the four wells (Sawan-01, -02, -03, and -07),
the logs of P-wave impedance, S-wave impedance, gammaray, and VP/VS ratio are plotted together for all four wells. Forthis purpose, interpolation between wells was performed.Four wells (Sawan-01, -02, -03, and -07) have been used toanalyze the litho-fluid behavior of the reservoir. The upperthick shale of Lower Goru Formation is considered as adatum plane. A SW–NE trending cross section (figure 12)through four wells shows the correlation between calculatedlithologies. Figure 12 shows that the upper part of the LowerGoru Formation is composed of thick shale intervals withinterbedded thin intervals of shaly sand, and the lower part ofthe formation is mainly composed of reservoir-quality sandwith a shaly sand interval at the bottom. The analysis indi-cates that this sand interval is a gas-bearing reservoir in thestudy area. The thickness of shale increases from the SW toNE direction, whereas thickness of reservoir-quality sanddecreases in this direction. In this area, Khairpur High playsan important role in controlling the reservoir quality andstratigraphic traps (Ahmad and Chaudhry 2002). The uplift-ing of Khairpur High positioned the Lower Goru reservoir-quality sand of proximal depositional system in structurallydeep areas. While non-reservoir-quality shale and shaly sandsare positioned updip to form traps (Berger et al 2009), Sawan-02 well shows reservoir compartmentalization and has rela-tively poor reservoir character; this is due to the relatively
Figure 12. Cross correlation of gamma ray and elastic properties of four offset wells representing the lateral and vertical variation in thereservoir zone (units of acoustic and shear impedance are Kg/m2*S, Gamma ray gAPI, and depth in meters).
222
J. Geophys. Eng. 14 (2017) 212 T Azeem et al
Dow
nloaded from https://academ
ic.oup.com/jge/article/14/2/212/5106858 by guest on 08 M
arch 2022

proximal location of the Sawan-02 well to Khairpur Highcompared to other wells.
5. Conclusions
In this study, an integrated petrophysical and rock physicsmodeling approach is adopted to understand the reservoircharacterization of the Lower Goru Formation in the SawanGas Field of the Middle Indus Basin, Pakistan. The developedmethodology helped us to build up an accurate and consistentrock physics model. The calibrated model shows good con-sistency between measured and modeled velocities. Thecorrelation between measured and modeled P and S wavevelocities is 92.76% and 84.99%, respectively (figure 7). Thegood consistency of the model laid a significant foundationfor improved reservoir characterization in the study area. Thecalibrated model has also proven helpful in accurately esti-mating the elastic parameters (density, P and S wave velo-cities) even in those wells (Sawan-02) where both sonic andshear logs were missing in the target zones. Cross plots ofthese calculated parameters clearly delineate the lithology andfluid content. On the basis of these cross plots, the quantita-tive values (average cutoff values) of elastic and petrophysicalparameters have been defined in order to discriminatebetween the gas-bearing sand, shale, and shaly sand zones. Itis found that the VP/VS ratio is more sensitive to gas-bearingsand followed by acoustic impedance. Lateral and verticalvariation in the reservoir is analyzed through cross-correlationmethodology. The correlation shows that thickness of shaleincreases whereas quality of sand decreases from the SW toNE direction. The proposed model allows for accurate dis-crimination between different types of facies and providesquick results. It can also be effectively utilized in seismicinversion to improve seismic reservoir characterization.
Acknowledgments
The authors would like to express their appreciation to theDirectorate General of Petroleum Concession (DGPC),Pakistan for the release of data used in this study. We extendour appreciation to the China Scholarship Council for pro-viding us a chance to enhance our research abilities. We arealso thankful to Mr Shafiq-ur-Rehman (meteorologist atPakistan Meteorological Department, Islamabad, Pakistan)and our labmates working in the Geodetection Lab of ChinaUniversity of Geosciences, Beijing for their valuable sug-gestions and fruitful discussions.
References
Adeoti L, Ayolabi E A and James P L 2009 An integrated approachto volume of shale analysis: Niger Delta example, offshorefield World Appl. Sci. J. 7 448–52
Ahmad N and Chaudhry S 2002 Kadanwari gas field, Pakistan: adisappointment turns into an attractive developmentopportunity Petrol. Geosci. 8 307–16
Ahmed N, Fink P, Sturrock S, Mahmood T and Ibrahim M 2004Sequence stratigraphy as predictive tool in Lower GoruFairway, Lower and Middle Indus Platform, Pakistan PakistanAssociation of Petroleum Geoscientist (PAPG), AnnualTechnical Conference (ATC) 85–104
Ahmed N, Khalid P and Anwar A W 2016 Rock physics modelingto assess the impact of spatial distribution pattern of pore fluidand clay contents on acoustic signatures of partially-saturatedreservoirs Acta Geod. Geophys. 51 1–13
Ajisafe Y C and Ako B D 2013 3D seismic attributes for reservoircharacterization of ‘Y’ field Niger Delta, Nigeria IOSRJ. Appli. Geol. Geophys. 1 23–31
Alao P A, Ata A I and Nwoke C E 2013 Subsurface andpetrophysical studies of shaly-sand reservoir targets in Apetefield, Niger Delta ISRN Geophys. 2013 102450
Avseth P 2000 Combining rock physics and sedimentology forseismic reservoir characterization of North Sea turbiditesystems PhD Thesis Stanford University, CA
Avseth P and Bachrach R 2005 Seismic properties of unconsolidatedsands: tangential stiffness, Vp/Vs ratios and diagenesis 75thAnnual Meeting SEG Expanded Abstracts pp 1473–6
Avseth P, Mukerji T and Mavko G 2005 Quantitative SeismicInterpretation–Applying Rock Physics Tools to ReduceInterpretation Risk (Cambridge: Cambridge University Press)
Avseth P, Mukerji T, Jorstad A, Mavko G and Veggeland T 2001Seismic reservoir mapping from 3D AVO in a NorthSea turbidite system Geophys. Soc. Expl. Geophys. 661157–76
Batzle M L and Wang Z 1992 Seismic properties of fluidsGeophysics 57 1396–408
Benzing W M, Byerly P E and Hopkins J R 1983 Shear andcompressional wave data interpretation—Midland basin, Texas53rd SEG Annual Meeting, Las Vegas Expanded Abstractspp 358–9
Berger A, Gier S and Krois P 2009 Porosity-preserving chloritecements in shallow–marine volcanic clastic sandstones:evidence of the Sawan gas field, Pakistan AAPG Bulletin 93595–615
Berryman J G 1980 Long-wavelength propagation in compositeelastic media J. Acoust. Soc. Am. 68 1809–31
Beryman J G and Milton G W 1991 Exact results for generalizedGassmann’s equations in composite porous media with twoconstituents Geophysics 56 1950–60
Bisht B S, Sas S K, Chaudhuri P K, Singh R B N and Singh S K2013 Integration of petrophysics & rock-physics modeling insingle workflow reduces uncertainty in seismic reservoircharacterization: a case study Geohorizons 44–7
Brie A, Pampuri F, Marsala A F and Meazza O 1995 Shear sonicinterpretation in gas bearing sands SPE Annual TechnicalConference and Exhibition SE-30595-MS
Carmichael R S 1989 Practical Handbook of Physical Properties ofRocks and Minerals (Boca Raton, FL: CRC Press)
Castagna J P and Swan H W 1997 Principles of AVO crossplottingLead. Edge 17 337–42
Castagna J P, Batzle M L and Kan T K 1993 Rock physics—the linkbetween rock properties and AVO response Offset-DependentReflectivity–Theory and Practice of AVO Analysis (Tulsa, OK:Society of Exploration Geophysicists) vol 8, pp 135–71
Cheng C H and Toksöz M N 1979 Inversion of seismic velocities forthe pore aspect ratio spectrum of a rock J. Geophys. Res. 847533–43
Chi X and Han D 2009 Lithology and fluid differentiation using rockphysics templates Lead. Edge 28 60–5
Clavier C, Hoyle W and Meunier D 1971 Quantitative interpretationof thermal neutron decay time logs: I. Fundamentals andtechniques J. Petrol. Technol. 23 743–55
223
J. Geophys. Eng. 14 (2017) 212 T Azeem et al
Dow
nloaded from https://academ
ic.oup.com/jge/article/14/2/212/5106858 by guest on 08 M
arch 2022
Doveton H 1999 Basic Oil and Gas Log Analysis Kansas GeologicalSurvey USA 8–16
Dvorkin J and Nur A 1996 Elasticity of high-porosity sandstones,theory for two North Sea data sets Geophysics 61 559–64
Dvorkin J, Nur A and Yin H 1994 Effective properties of cementedgranular material Mech. Master 18 351–66
Eshelby J D 1957 The determination of the elastic field of anellipsoidal inclusion and related problems Proc. R. Soc. Lond.Ser. A 241 376–96
Feng-Ying Y, Xing-Yao Y and Bo L 2014 S-wave velocity self-adaptive prediction based on a variable dry rock frameequivalent model J. Geophys. Eng. 11 045015
Fitch P J, Lovell M A, Davies S J, Pritchard T and Harvey P K 2015An integrated and quantitative approach to petrophysicalheterogeneity Mar. Pet. Geol. 63 82–96
Gassmann F 1951 Uber die elastizitat poroser medien Vier. derNatur Gesellschaft 96 1–23
Grana D, Pirrone M and Mukerji M 2012 Quantitative loginterpretation and uncertainty propagation of petrophysicalproperties and facies classification from rock-physics modelingand formation evaluation analysis Geophysics 77 45–63
Hamada G M 1996 An integrated approach to determine shalevolume and hydrocarbon potential in shaly sand Presented atSCA Int. Symp. 2093–107
Hashin Z and Shtrikman S 1963 A variational approach to the elasticbehavior of multiphase materials J. Mech. Phys. Solids 11127–40
He F B, You J and Chen K Y 2011 Gas sand distribution predictionby elastic inversion based on rock physics modelling andanalysis Appl. Geophys. 8 197–205
Hill R 1952 The elastic behaviour of a crystalline aggregate Proc.Phys. Soc. London 65 349–54
Hu R Y, Holden T and Broussard M 2011 Petrophysics and rockphysics modeling to improve seismic reservoir characterization—case study of lower hackberry sandstone AAPG AnnualConvention and Exhibition (Houston, Texas, USA) Article #40774
Hughes P, Eykenhof V R and Mesdag P 2008 Estimation ofHydrocarbons in-Place by Simultaneous (AVO) Inversion,Constrained by Iteratively Derived Low Frequency Models(Stavanger, Norway: Fugro-Jason)
Hussein R A and Ahmed M E B 2012 Petrophysical evaluation ofshaly sand reservoirs in Palouge-Fal oilfield, Melut Basin,South East of Sudan. Engineering and computer sciences(ECS) J. Sci. Technol. 13 2
Iqbal M W A and Shah S M I 1980 A A Guide to the Stratigraphy ofPakistan 53 (Geological Survey of Pakistan)
Kadri I B 1995 Petroleum Geology of Pakistan 1st edn (Karachi,Pakistan: Pakistan Petroleum Ltd)
Kazmi A H and Jan M Q 1997 Geology and Tectonics of Pakistan1st edn (Karachi, Pakistan: Graphic Publishers)
Khalid P, Ahmed N, Naeem M and Khan K A 2014 A modelingstudy of AVO-derived attributes to differentiate reservoirfacies from non-reservoirs facies and fluid discrimination inPenobscot area, Nova Scotia Geosci. J. 19 471–80
Khalid P, Broseta D, Nichita D V and Blanco J 2014(b) A modifiedrock physics model for analysis of seismic signatures of lowgas-saturated rocks Arab. J. Geosci. 7 3281–95
Khalid P, Ahmed N, Mahmood A and Saleem M A 2016 Anintegrated seismic interpretation and rock physics attributeanalysis for pore fluid discrimination Arab. J. Sci. Eng. 41191–200
Krois P, Mahmood T and Milan G 1998 Miano Field, Pakistan, acase history of model driven exploration Proc. PakistanPetroleum Convention, Pakistan Assoc. Petroleum Geologists,Islamabad pp 111–31
Kuster G T and Toksoz M N 1974 Velocity and attenuation ofseismic waves in two-phase media: 1. Theoretical formulationGeophysics 39 587–606
Larionov V V 1969 Radiometry of Boreholes (in Russian) (Moscow:Nedra)
Liu Z S and Sun S Z 2015 The differential Kuster–Toksöz rockphysics model for predicting s-wave velocity J. Geophys. Eng.12 839
Marion D, Nur A, Yin H and Han D 1992 Compressional velocityand porosity in sand–clay mixtures Geophys. 57 554–63
Mavko G, Mukerji T and Dvorkin J 1998 The Rock PhysicsHandbook; Tools for Seismic Analysis in Porous Media 1stedn (New York: Cambridge University Press)
Mavko G, Mukerji T and Dvorkin J 2009 The Rock PhysicsHandbook; Tools for Seismic Analysis of Porous Media 2ndedn (New York: Cambridge University Press)
McPhee C A and Enzendorfer C K 2004 Sand management solutionsfor high-rate gas wells, Sawan field, Pakistan SPEInternational Symposium and Exhibition on FormationDamage Control 94–103
Mindlin R D 1949 Compliance of elastic bodies in contact J Appl.Mech. 16 259–68
Minear M J 1982 Clay models and acoustic velocities 57th AnnualMeeting American Institute of Mining and MetallurgicalEngineers (New Orleans) Paper 11031-MS SPE
Munir K, Iqbal M A, Farid A and Shabih S M 2011 Mapping theproductive sands of Lower Goru Formation by using seismicstratigraphy and rock physical studies in Sawan area, southernPakistan: a case study J. Petrol. Explor. Prod. Technol. 133–42
Odegaard E and Avseth P 2004 Well log and seismic data analysisusing rock physics templates First Break 23 37–43
Poupon A and Gaymard R 1970 The evaluation of clay content fromlogs SPWLA 11th Annual Logging Symp. Conf. Paper 1970-G
Poupon A and Levaux J 1971 Evaluation of water saturation in shalyformations Society of Professional Well Log Analysts 12thAnnual Logging Symp. Transactions paper SPWLA-1971-vXIIn4a1
Reuss A 1929 Berechnung der fliessgrense von mischkristallen aufgrund der plastizitatbedingung fur einkristalle Zeitschrift furAnge-Wandte Mathematikaus Mechnik 9 49–58
Sams M 2014 Constraining petrophysics with rock physics EAGE/FESM Joint Regional Conf. Petrophysics Meets Geoscience(Kuala Lumpur, Malaysia)
Sams M S and Andrea M 2001 The effect of clay distribution on theelastic properties of sandstones Geophys. Prospect. 49 128–50
Sams M S and Focht T 2013 An effective inclusion-based rockphysics model for a sand–shale sequence First Break 31 61–71
Schlumberger Limited 1974 Log Interpretation: Applications 2Stieber S J 1970 Pulsed Neutron Capture Log Evaluation—
Louisiana Gulf Coast Society of Petroleum Engineers (https://doi.org/10.2118/2961-MS)
Voigt W 1910 Lehrbuch der Kristallphysik (Leipzig: Teubner)Walls J, Dvorkin J and Carr M 2004 Well logs and rock physics in
seismic reservoir characterization Offshore Technology Conf.Offshore Technology Conf.
Walton K 1987 The effective elastic moduli of a random packing ofspheres J. Mech. Phys. Solids 35 213–26
Wandrey C J, Law B E and Shah H A 2004 Sembar Goru/Ghazijcomposite total petroleum system, Indus and Sulaiman-Kirthargeologic provinces, Pakistan and India (No. 2208-C)
Wang Q, Wang Y, Guo S G, Xing S T and Liu Z W 2015 The effectof shale properties on the anisotropic brittleness criterion indexfrom laboratory study J. Geophys. Eng. 12 866
White R E 1991 Properties of instantaneous seismic attributes Lead.Edge 10 26–32
Widarsono B 2012 Choice of water saturation model in log analysisand its implication to water saturation estimates–a furtherinvestigation Sci. Contrib. Oil Gas 35 3
Wyllie M R J, Gregory A R and Gardner L W 1956 Elastic wavevelocities in heterogeneous and porous media Geophysics 2141–70
224
J. Geophys. Eng. 14 (2017) 212 T Azeem et al
Dow
nloaded from https://academ
ic.oup.com/jge/article/14/2/212/5106858 by guest on 08 M
arch 2022

Xu S and Payne M A 2009 Modelling elastic properties in carbonaterocks Lead. Edge 28 66–74
Xu S and White R E 1995 A new velocity model for clay-sandmixtures Geophys. Prospect. 43 91–118
Yuedong Q and Hongwei A 2007 Study of petrophysical parametersensitivity from well log data Appl. Geophys. 4 282–7
Zhang Z 2008 A rock physics model for hydrates bearing sedimentsof near surface SEG Las Vegas Annual Meeting pp 1799–803
Zhao L, Geng J, Han D H, Cheng J and Guo T 2013 Rock physics basedprobabilistic lithology and fluid prediction in a heterogeneouscarbonate reservoir Annual SEG Meeting Houston (USA)pp 2387–91 (http://dx.doi.org/10.1190/segam2013-0486.1)
225
J. Geophys. Eng. 14 (2017) 212 T Azeem et al
Dow
nloaded from https://academ
ic.oup.com/jge/article/14/2/212/5106858 by guest on 08 M
arch 2022