predictive correlations for the compaction of clean sands
TRANSCRIPT

1
Predictive Correlations for the Compaction of Clean Sands
Iolli Salvatore1, Modoni Giuseppe
1*, Chiaro Gabriele
2 and Salvatore Erminio
1
1 University of Cassino and Southern Lazio, Via Di Biasio 43, Cassino 03043,Italy
2 Department of Civil and Natural Resources Engineering, University of Canterbury, Christchurch,
New Zealand
*Corresponding Author (email: [email protected])
Abstract: This paper presents a summary of a laboratory investigation on the compaction of clean
sands and a method to predict the density of material as a function of the applied energy. The
experiments, carried out on marine quarzitic-calcareous sand systematically assorted to obtain
sixteen different grain size distributions, include the determination of minimum and maximum index
dry density together with Proctor compaction tests performed with different levels of energy. The
outcomes of this experimentation have then been merged with the results of several previous works
to form an extensive database used to validate the correlation among the different variables. After an
overview of the literature to identify the fundamental factors of compaction and examine the existing
correlations, it is suggested to synthetically express the role of all the inherent properties of the soil
aggregate i.e. grading, shape and roughness of grain, with the maximum index void ratio (emax). The
efficacy of this choice is confirmed by the straight dependency on emax of the compactability of the
material, defined as the difference between maximum and minimum index void ratios (emax - emin),
and of the void ratios obtained with Proctor tests at fixed levels of energy. In particular, the
combined role of emax and compaction energy is quantified by an artificial neural network to
formulate a predictive chart giving errors lower than 10%.
Keywords: compaction, granular materials, prediction, artificial neural networks

2
List of symbols
e = void ratio
emax = maximum index void ratio (ASTM D4254, 2014)
emin = minimum index void ratio (ASTM D4253, 2014)
r = radius of the largest sphere fully contained in the grain
x = distance from the center of the largest sphere included in a particle to the most distant edge
Cu = uniformity coefficient
D = particle diameter
D50 = mean particle diameter
Ec = compaction energy (kJ/m3) (ASTM D698-12; ASTM D1557-12)
F = compressibility index max
minmax
e
ee −=
R = roundness coefficients
RE= relative error between predicted and experimental void ratio exp
exp
e
eep −=
γd = dry unit weight
γd max= maximum index dry unit weight
�� = ∑������
�
��� (Pearson, 1948), where Oi is the observed frequency and Ai the expected
frequency according to a prescribed distribution.
3
1 Introduction
The artificial compaction of soil is the oldest and most traditional ground improvement technique,
being used from ancient ages to improve the performance of earthworks (Kerisel, 1985). From a
practical viewpoint, the importance of packing and the associated dilatancy on the deformability and
shear resistance of granular materials has been intuitively acknowledged well before the birth of
modern geotechnical engineering (Reynolds, 1885). Thereafter, systematic studies, aimed at
experimentally evaluating the effectiveness of compaction on site were carried out by Proctor (1930),
who established a procedure to quantify the role of moisture content and compaction energy and to
control the density of earth-fills and embankments. Nowadays, there are plenty of constitutive
models for sandy materials (e.g. Jefferies, 1993; Chiaro et al., 2013), which include the role of
density, but only a few studies attempt to perform an overall prediction of the effects of compaction.
Recognition of the role of the inherent characteristics of the soil and quantification of the efficacy of
the compaction methods would lead, on the contrary, to a more aware choice of materials, to
optimize compaction and to define appropriate in-situ control tests.
In an attempt to identify the factors governing the compactability of granular materials,
Kolbuszewski (1948) and Youd (1973) observed that the conventional minimum and maximum
index void ratios (emin and emax, respectively) decrease with the uniformity coefficient (Cu) and with
the roundness of particles. Miura et al. (1997) performed a comprehensive laboratory investigation
on approximately two hundred granular materials including clean sands, glass beads and lightweight
aggregates, and found a reduction of emax and emin with the mean grain size (D50) and with Cu. Patra
et al. (2010a, b) focused on the role of compaction energy, subjecting 55 different clean sands to a
series of Proctor tests with variable levels of energy, and proposed an empirical relationship between
density, energy per unit volume and D50. Similar studies have also been performed by Korfiatis et al.
(1982) and Chiaro et al. (2012).

4
In spite of their indubitable originality, these studies focus on single aspects (e.g. grading) and
often characterize the soil on an empirical basis (e.g. D50), neglecting factors supposed to play an
important role (e.g. the heterogeneity of grain size distribution or the shape of grains). The present
study, confined to clean sands, is aimed at comprehensively predicting the density of a soil assembly
based on its inherent characteristics and to quantify the role of compaction energy. In order to fulfil
this objective, numerous sandy materials size were assembled with variable grain size distributions.
Then a series of tests was performed; including standard compaction tests for the determination of
maximum and minimum index density (ASTM D4254, 2014; and ASTM D4253, 2014) and
compaction Proctor tests (ASTM D698, 2012; ASTM D1557, 2012) with increasing energy. The test
results, combined with relevant data taken from the literature to form a wider casuistry, were used to
establish general predictive relationships for the void ratio under different testing conditions.
In comparison with the previous studies, there is an effort to summarize, in a practical yet
rational and effective way, the role of the most relevant soil index properties and to enlarge the
experimental basis used for validation. With this aim, an artificial neural network (ANN) was
implemented to capture the underlying dependency among the different variables, crossing the
information from the experimental data and using this relationship to perform future predictions.
2 Experimental setup
The investigated sand was quarried in Fossanova, Southern Italy, from a series of dunes deposited in
a coastal environment. From a mineralogical viewpoint, the grains are composed of quartzitic and
calcareous materials present with similar percentage in the soil mass. Before starting the
experiments, the sand was oven-dried and sieved (ASTM C136, 2014) in order to remove the
material passing the #200 (i.e. 0.075 mm) sieve and to separate five relatively homogeneous classes:
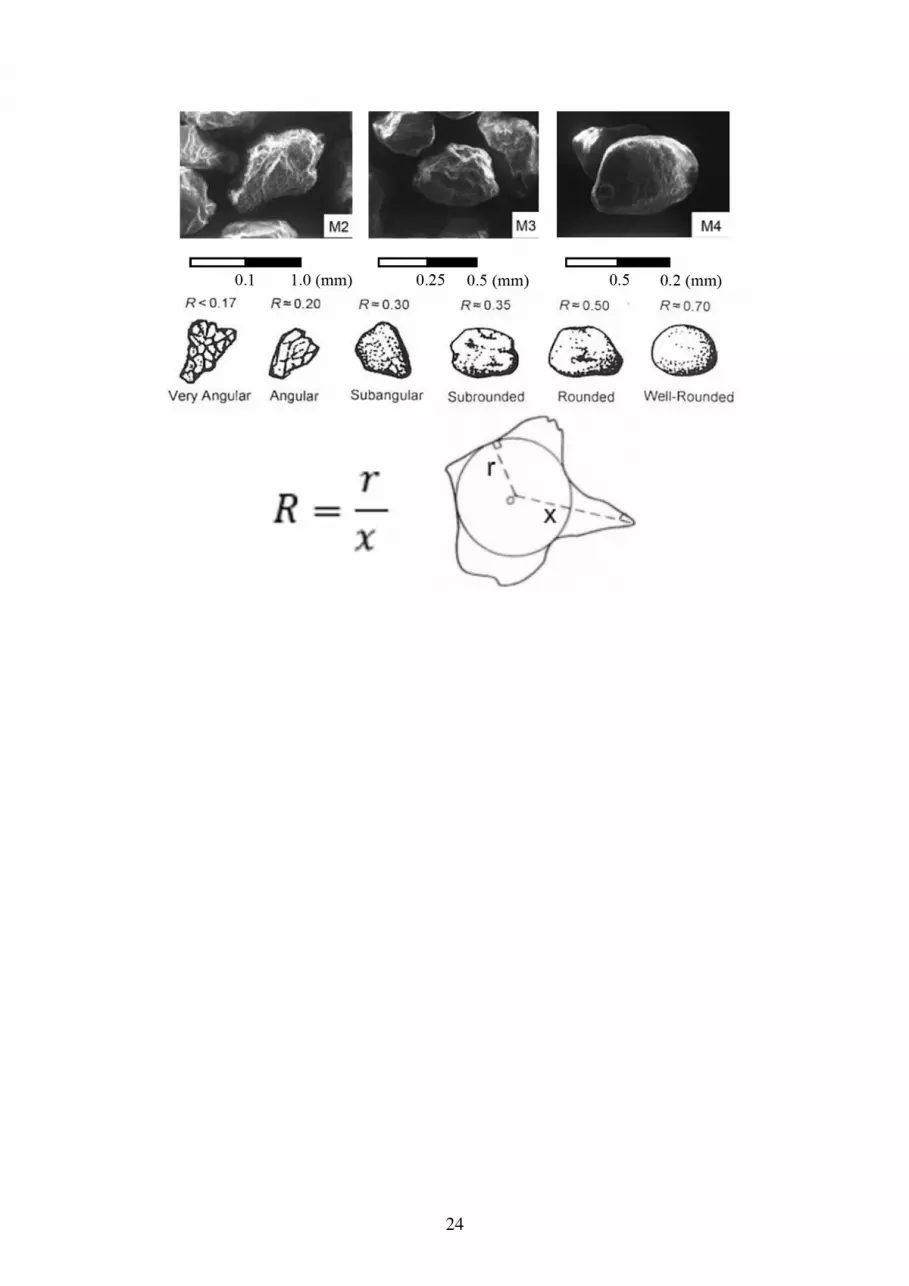
M0 (4.75>D≥2.00), M1 (2.00>D≥1.00), M2 (1.00>D≥0.42), M3 (0.42>D≥0.18), M4
(0.18>D≥0.075), with the particle diameter (D) expressed in millimeters. Comparing the images
scanned with an electron microscope (where a tension of 30 kV was applied at a working distance of

5
10 mm to produce 5000 times amplification), reported in Fig. 1(a), and the classification proposed by
Youd (1973) (Fig. 1(b)), the grain shape varies largely with the diameter from angular (M2) to
rounded (M4), possibly due to a higher abrasion of the smaller particles in comparison with the
larger ones. According to this classification, the roundness coefficients (R), defined as the ratio
between the radius (r) of the largest sphere fully contained in the grain and the distance (x) from the
center of this sphere to the most distant edge (Fig. 1(c)) should vary between 0.20 and 0.50
depending on the composition of the material.
The five homogeneous classes were then combined to produce an additional fourteen mixes with
grading curves distributed over a relatively wide range, with D50 between 0.12 and 1.40 mm and Cu
varying between 1.43 and 11.9. Fig. 2 shows the grain size distribution of all the tested materials,
including two of the homogeneous classes (M3 and M4) and the fourteen above mentioned mixes.
The emin and emax were determined for each sample in accordance with the ASTM standards
D4254-14 and D4253-14. Then, in a second phase, the role of compaction energy was evaluated by
performing compaction tests with the standard and modified Proctor equipment (ASTM D698-12;
ASTM D1557-12), subdividing the mold into respectively three and five layers and varying the
number of blows per layer as listed in Table 1. The table shows that eight compaction tests were
performed on each material. However, considering that in the standard Proctor equipment a hammer
of 2.49 kg mass falls from 0.305 m, while in the modified tests a hammer of 4.54 kg mass falls from
0.457 m, the same energy Ec=1185 kJ/m3 is inferred by the standard test with 50 blows/layer and by
the modified test with 11 blows/layer.
Unlike plastic soils, moisture content is recognized as not particularly relevant for the
compaction of cohesionless materials (Hilf, 1991). However, a preliminary series of tests was
conducted on some of the tested soils to verify this assumption. In Fig.3 the dry unit weights
obtained with Standard Proctor tests on two materials, one formed by particles of intermediate
dimensions (M3) the other including the finest particles (M4), compacted at variable water contents
6
are reported for example. Indeed, the dry density remains quite constant (with variations lower than
3%), showing no evident trend with the water content. For this reason, all compaction tests were
conducted giving a water content equal approximately to 4%. The complete list of void ratios
obtained in each test is reported in Table 1 together with the parameters summarily defining the grain
size distribution of the different materials.
2.1 Maximum index void ratio (emax)
In order to assess the influence of the grading on the packing of particles, emax evaluated by the
ASTM D4254-14 tests were plotted versus Cu (Fig. 4.a). This variable was chosen to represent the
soil properties, instead of D50 adopted by other researchers (e.g. Miura et al., 1997), considering the
heterogeneity of grain size distribution as more relevant for the packing of particles. In the same
figure, the set of curves suggested by Youd et al. (1973) for different values of R were also plotted
for reference. The trend shown by these curves is obviously consistent with the fact that, in the more
heterogeneous materials, the smaller grains tend to fill the pores contained within the larger ones.
Additionally, the roundness of particles facilitates the movement (e.g. sliding and rotation), and thus
the packing of the soil mass.
The tested materials (whose grading can be seen from Figure 2 and Table 1) generally follow a
similar trend, with lower emax for increasing Cu and the experimental points falling within the curves
corresponding to R equal to 0.20-0.35, i.e. similar to those inferred from Figure 1.a and 1.b. Clearly,
it is difficult to identify a unique R value for soil mixes containing particles of different size and
shape. However, the R values estimated for each tested material from Figure 4.a, plotted as function
of the D50 (see Figure 4.b), provides a possible explanation of the limited reduction of emax with Cu
shown by the experimental data. Additionally, this relationship might explain the dependency of the
compactability of sands on their D50, observed by some authors (e.g. Miura et al., 1997; Patra et al.,
2010.a and b) and not logical from a purely theoretical viewpoint.

7
The roundness effect noticed by Youd et al. (1973) on emax seems, for the heterogeneous soil
mixes, dominated by the coarser fractions, being the latter less rounded (see Figures 1.a and 1.b). In
conclusion, the combination of Figures 4.a and 4.b implies that emax of a granular material reduces
with the grain size heterogeneity but is also dictated by the shape of the predominant fraction.
This result, quantified by Figure 4.a hides a methodology to estimate emax from the soil grain
size distribution and from the shape of the grains. However, the present investigation suggests that
assigning a unique R value to a soil mass is not simple, firstly because the recognition of the grain
shape requires a high quality scanning electron microscope (SEM) like the one used in the present
study, secondly because the determination of a representative R value for assemblies of particles
having different dimension and shapes may be somehow arbitrary.
For these reasons, and considering the relative ease of execution of the ASTM D4254-14 tests,
it is alternatively proposed to evaluate emax from experiments, thus reducing the role of subjective
choices, and to use this value to predict the void ratios at different compaction energy. More clearly,
emax is used in the following to cumulatively represent the influence of all inherent properties of the
assembly (shape, roughness and size distribution of particles). This choice has the other not
secondary advantage of allowing the enlargement of the experimental database, as most of the data
published in the literature report emax instead of the inherent characteristics of the tested material.
2.2 Minimum index void ratio (emin)
In the following, a correlation is firstly searched between the minimum (emin) and maximum (emax)
index void ratios. To this aim, the data of Table 1 were combined with those provided by other
studies, selecting those obtained on sandy materials with a fines content lower than 5%. Finally, a
extensive database containing 316 data points could be created (Table 2). In Fig. 5(a) the results
obtained by each study are reported with different symbols.
8
The persistent overlapping of points confirmed the existence of a strong correlation between emax
and emin, as already acknowledged by relevant past studies. In particular, Cubrinovski and Ishihara
(2002) proposed to relate emax and emin by the following formula:
[1] minmax 53.1072.0 ee +=
The validation of this formula with the above mentioned database (Fig. 5(a)) shows that all
points but a few fall in a range of ±15% around the line expressed by Eqn. (1). Such a deviation
implies a precision on the estimate of the maximum dry unit weight γd max ranging from 2 to 8 %
(corresponding to emin equal to respectively 0.2 and 1).
The scattering can be explained partly by the inaccuracy of measurements, partly with a
possible dependency on other properties here not taken into account. For instance, the information
available from the original papers do not allow the quantification of factors like grain breakage,
which could play a different role in the determination of the maximum and minimum index densities.
In an attempt to improve the quality of prediction, the dependency of emin on other variables here
neglected (e.g. D50 or Cu) has been investigated on the experimental data. However, the minimal
noticed improvement suggests not to abandon the practical simplicity of Eqn. (1) for more complex
relations.
Another convenient way to express the above results is to compute the compressibility index (F)
defined as follows:
[2] max
minmax
e
eeF
−=
which is slightly different from the index introduced by Terzaghi (1925), where the difference emax-
emin is divided by emin. The advantage of using F is given by its very limited variation for all the
considered soils (Fig. 5(b)). To this regard, the statistical analysis of F gives a normal distribution
having a mean value equal to 0.39 and a standard deviation equal to 0.05. As a straight consequence

9
of this observation, the compactability of granular materials, quantified by the range emax-emin, is
governed by the inherent properties of the soil in the same manner as emax.
3 Influence of the compaction energy
As for the previous analysis, the outcomes of the Proctor tests (Table 1) were combined with the
experimental results of Patra et al. (2010a and 2010b) to form a larger database. Patra et al. tested 55
different soils with very low fine content (<5%) changing the mechanical energy applied during
compaction. Although the procedure used to vary energy is similar to the present study, they used
slightly different numbers of blows per layer. In particular, four different levels of energy were given
(356, 593, 1293, 2694 kJ/m3) applying respectively the number of blows/layer equal to 15 and 25
with the Standard Proctor equipment, to 12 and 25 with Modified Proctor equipment. Accumulating
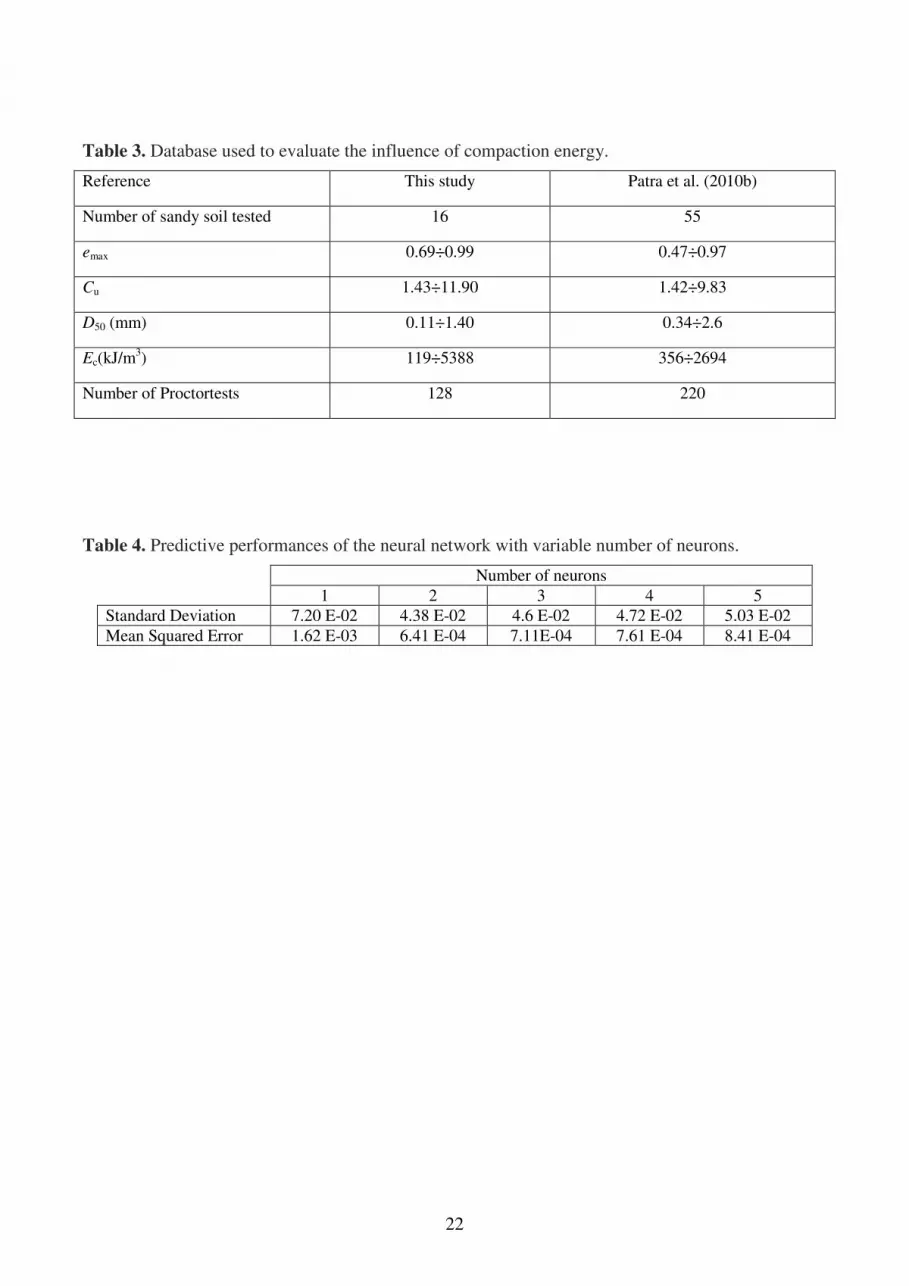
this data with those from the present study, a total of 348 tests was obtained, as summarized in Table
3, where the properties of each dataset are reported. Therefore, the correlation between void ratio and
compaction energy (Ec) is sought with an ANN trained on the experimental database, quantifying the
role of the soil characteristics with emax.
3.1 Artificial Neural Networks
The basic principle of Artificial Neural Networks (ANN) consists in learning the connection between
input and output variables of a phenomenon in a way similar to the human brain i.e. establishing
logical connections directly from the observation of data, without preconditioned or arbitrary
assumptions (McCulloch and Pitts, 1943), and using the established relation to predict future
occurrences. The main advantage of using ANN consists in by-passing the development of
conceptual models, sometimes very tortuous or inaccurate, or the use of subjective interpolating
mathematical functions, to interpret the phenomenon. This tool has already been adopted with
success in many different geotechnical problems such as the calibration of constitutive models (e.g.
Agrawal et al. 1994), the prediction of pile baring capacity (e.g. Chan et al., 1995), the performance

10
assessment of ground improvement techniques (Ochmański et al., 2014), and the back analysis of
complex tunnelling processes (e.g. Pichler et al., 2003). With specific reference to the compaction of
granular soils, predictions with ANN’s have been implemented by Sinha and Wang (2008) and by
Tizpa et al. (2015).
For a wider and more complete description of the theory and capabilities of ANN, one can
refer to the specific literature (e.g. Haykin, 1999). In summary, the predictive tool is created by
describing the problem with a number of input and output variables, by selecting the most
appropriate computational algorithm and by training it with a number of cases where the response of
the system is known. The algorithm consists of a number of logical operators, called neurons,
arranged in a sequence of layers, one for the input, one or more (hidden) at intermediate levels and
one for the output (Fig. 6). In each layer, the incoming information xi (from a scalar quantity to a
multidimensional vector) is multiplied by a synaptic weight wki, added to an external bias wk0 used
when necessary to amplify its importance, and transferred to the next layer. At the beginning of the
analysis, the operator should fix the number of hidden layers, the number of neurons forming each
layer and the activation functions of each neuron. Training consists in the quantification of the
synaptic weights and biases with experimental observations where input and correspondent output
variables are simultaneously known.
Pursuing a combination of simplicity and efficacy, the neural network chosen for the present
study has a feed-forward type architecture (Masters, 1996) with one hidden layer. A sigmoid
activation function, providing highly stable convergence thanks to continuous positive derivatives,
was used for the hidden layer, while a linear function was adopted in the output layer. Both functions
were trained with the Levenberg-Marquard technique (Marquardt, 1963), consisting in an automatic
sequence of training, validation and testing operations iteratively carried out to minimize the square
mean error between observed and predicted outputs. The number of neurons in the hidden layer was
fixed equal to two after a parametric study where it was varied from one to five. This value was then

11
selected as it minimizes the Standard Deviation of the Mean Squared Error between prediction and
observation (Table 4).
3.2 Quality of the prediction
Fig. 7.a shows show the continuous dependency of the void ratio on the compaction energy (from
100 to 5600 kJ/m3) seen on a number of tested materials. For clarity, the results of the present
experimental investigation are plotted with open dots in order to distinguish them from the data
obtained by Patra et al. (2010b), plotted with full dots. Considering that the two series of tests were
conducted with different equipment and numbers of blows per layer, the similar trend followed by all
points (open and close) implies that the variables introduced to quantify the soil properties and
compaction effort (emax and Ec) are representative of the observed phenomenon. Furthermore, the
experimental tendency is well captured by the curves obtained with ANN.
A summary of prediction is then reported in Figure 7.b, plotting with thicker curves the trends
pertaining to selected emax (from 0.5 to 1.0 with 0.1 step), with thinner lines the interval ±0.05 around
the above lines. The continuous and smooth dependency on the different levels of energy and emax is
particularly remarkable from the viewpoint of prediction. It must be in fact recalled that ANNs tend
sometime to overfit the experimental points with unrealistic waving curves, and that this effect was
here avoided thanks to an appropriate selection of the ANN’s architecture, pursued balancing
accuracy and stability.
From a physical viewpoint, Fig. 7.b shows that the packing of particles is mainly dictated by the
inherent characteristics of the material, namely grading and shape of particles summarized with emax,
than by compaction. The latter is more important in the first stage, up to about 2000 kJ/m3, then it
becomes always less relevant and practically ineffective at the highest levels.
Based on the above considerations, the graph in Fig. 7.b can be thus used to forecast the void
ratio obtained at different compaction energies. In order to evaluate the reliability of this prediction,

12
a test was carried out where the experimental void ratios are compared with those predicted with
ANN (Fig. 8(a)). This prediction is made each time by removing the datum from the experimental
sample and training the network on the remaining data. From this plot a relatively narrow scattering
can be appreciated, with almost all points contained in a range ±9%. It is worth noting that this
deviation implies a precision on the estimate of the dry unit weight γd ranging from 1 to 5 %
(dependent on the void ratio).
For a quantitative estimate of this scattering, the relative error distribution of REi (Eqn.3) where
eexp,i representing the experimental value and ep,i the predicted one) is computed as:
[3]
i
iip
ie
eeRE
exp,
exp,, −=
Its statistical distribution, plotted in Fig. 8(b), presents the typical bell shape with nearly zero
mean (0.001) and standard deviation equal to 0.044. The χ2 goodness of fit test (Pearson, 1948)
allows to assume RE distributed with a Gauss function. In fact, the computed value of �� =
∑������
�
��� , where Oi and Ai are the expected and observed frequencies in each of the K classes
subdividing the range of data, is equal to 1.29, while its critical value χ2
c correspondent to the
assumed significance level for the tests (0.05) is equal to 5.99.
It means that the prediction with the chart of Figure 7 is unbiased and relatively precise. However,
to account for such a small error in the prediction, a multiplying factor equal to 1.09 may be applied
to the void ratio obtained from Figure 7, to have only 5% risk of underestimating the void ratio (i.e.
overestimating the effects of compaction).
4 Proctor vs vibratory compaction
From the combination of the results shown in Figs. 5 and 7, it was possible to evaluate the
effectiveness of compaction with the Proctor technique in relation with the vibratory method used to
reach the maximum index density. To this aim, the void ratios corresponding to different compaction

13
energies are reported along lines for increasing emax (Fig. 9) together with the lines representative of
emax and emin ratios (the latter computed by Eqn. (1)). As before, the experimental points obtained at
the different specific energies are reported, distinguishing the data from the present investigation
from those obtained by Patra et al. (2010a and 2010b). It is again immediate to see that the
effectiveness of tamping reduces progressively with the applied compaction effort. In fact, the
reduction of void ratio from a curve to the lower one becomes progressively less meaningful in spite
of significant increases of the input energy. Even at the highest levels of compaction (Ec=5500
kJ/m3), the Proctor technique is never able to attain the maximum index density obtained by
vibration with the standard methodology ASTM D4254-14. In other words, the vibratory technique
seems more suitable than tamping for the compaction of sandy soils. The difference between
minimum void ratio attainable with the Proctor test and emin is relatively low for initially dense soils
(low emax), but increases significantly for looser materials (larger emax). From the viewpoint of
prediction, such a result implies that it is not possible to establish a unique relationship between
specific compaction energy and relative density (ASTM D4254-00, 2006), which would be desirable
for design purposes.
5 Conclusions
A comprehensive study of the factors governing the compaction of clean sands was made by
collecting a large amount of data from the existing literature, combining them with original
laboratory investigations and interpreting the obtained experimental database with data mining tools.
The laboratory tests confirmed a strong dependency of the void ratio on the inherent soil properties,
primarily grain size distribution, shape and roughness of particles, but also on the adopted
compaction methodology, characterized by the type of action and the inferred energy.
The performed experiments allowed the validation of the conceptual model defined by Youd
(1973), where the maximum index void ratio emax depends on the heterogeneity of grain size
distribution (quantified by Cu) and on the roundness of particles. For assemblies containing particles
14
of different dimension and shape, where the determination of a characteristic roundness is uncertain,
density seems to depend on the more angular coarser fraction (represented by D50).
This study has then highlighted the importance of emax in resuming the fundamental
characteristics of material with regard to compaction. This variable has the advantage of being
determined with simple tests (ASTM D4253-14) and is able to synthetically and immediately express
the effects of soil composition on the compaction.
In fact, based on emax it is possible to estimate the minimum index void ratio (ASTM D4254,
2014) with a precision of ±15% (corresponding to a precision on γd max variable between 2 and 8%)
or, equivalently, the compactibility of material (emax-emin is approximately equal to 40% of emax).
The performed Proctor tests (ASTM D698-12; ASTM D1557-12) have proven that this
methodology is very effective at lower energies where meaningful reductions of void ratio are
produced. On the contrary, additional efforts beyond specific energies larger than 2000 kJ/m3
become
less relevant or useless. In any case, the maximum density achievable by the Proctor method was
always lower than the maximum index density obtainable with the standard vibratory technique
(ASTM standards D4254-14), the difference increasing notably for the materials having an initial
looser fabric.
A chart obtained with the artificial neural network allows to compute the void ratio produced by
Proctor tests as function of emax and of the given impact energy with a precision of ±9%, equivalent
to a precision of 1 to 5% on the dry unit weight γd. Based on the statistical analysis of the error, it is
suggested to multiply the void ratio obtained from Figure 7 by a factor of 1.09, to reduce the risk of
overestimating the compaction effectiveness.
In summary, the correlations inherent in Figures 3, 4 and 9 allow to quantify the role of the
different factors (soil composition and compaction procedure) on the density of sandy materials. In
the preliminary design of earthworks, these relationships can be used to perform table estimates of
the properties (e.g. void ratio, relative density) achievable with compaction simply based on the soil

15
grain characteristics, and to indirectly estimate properties like the friction angle (e.g. Schmertmann,
1978) or the hydraulic conductivity (U.S. Department of Navy, 1971) of the material. In the more
advanced construction stage, these relationships give the trace for the creation of expert databases
aimed at predicting and controlling on time the effects of compaction in the field (Puls, 2008). For
instance, faster and simpler ASTM D4253-14 tests for the determination of the minimum index
density could be routinely used in a QC/QA program, instead of the more time consuming Proctor
tests.
More generally, the dependency of void ratio on the compaction energy, here found for the
Proctor methodology, could be extended, but appropriate investigation is needed, to predict the
efficiency of vibratory methods. Such a relationship could form the principle to interpret the
mechanisms induced by the ground improvement techniques based on vibration (e.g. Kirsch and
Kirsch, 2010).
It is finally worth reminding once more that the present study was confined to clean sands i.e. to soil
containing nil amount of plastic material. A promising concept to extend the above results to sands
containing finer materials seems to be the equivalent inter-particle void ratio, introduced by
Thevanayagam (2000) and already adopted with success to generalize mechanical concepts like
Critical State Locus (e.g. Huang and Chuang, 2011; Rahman et al., 2008; Rahman et al., 2011;
Stamatopoulos C., 2010) . This definition, valid for relatively limited contents of finer materials (say
up to 20-30%), considers the void ratio of the sole sandy matrix as effective for the soil response.
However, appropriate experimental investigation is needed to validate this hypothesis.
References
Agrawal, G., Weeraratne, S. and Khilnani, K. 1994. Estimating clay liner and cover permeability
using computational neural networks. Proc. of the 1st Congress on Computing in Civil
Enginweering, Washington, USA, 20-22.

16
ASTM 136-14, Standard test methods for sieve analysis of fine and coarse aggregates, Annual Book
of ASTM Standards, Section 04.02 (Soils and Rocks), Conshohocken, PA.
ASTM 698-12, Standard test methods for laboratory compaction characteristics of coil using
standard effort, Annual Book of ASTM Standards, Section 04.08 (Soils and Rocks),
Conshohocken, PA.
ASTM 1557-12, Standard test methods for laboratory compaction characteristics of soil using
modified effort, Annual Book of ASTM Standards, Section 04.08 (Soils and Rocks),
Conshohocken, PA.
ASTM 4253-14, Standard test methods for maximum index density and unit weight of soils using a
vibratory table, Annual Book of ASTM Standards, Section 04.08 (Soils and Rocks),
Conshohocken, PA.
ASTM 4254-14, Standard test methods for minimum index density and unit weight of soils and
calculation of relative density, Annual Book of ASTM Standards, Section 04.08 (Soils and
Rocks), Conshohocken, PA.
ASTM D4254-00 2006, Standard test methods for minimum index density and unit weight of soils
and calculation of relative density. Annual Book of ASTM Standards, Section 04.08 (Soils and
Rocks), Conshohocken, PA.
Been, K., Jefferies, M. and Hachey, J. 1991. The critical state of sands. Géotechnique, 41(3), 365-
381.
Chan, W., Chow, Y. and Liu, L. 1995. Neural network: an alternative to pile driving formulas.
Computers and Geotechnics, 17(2), 135–156.
Chiaro, G., Gazzellone, A. and Modoni, G. 2012. Laboratory investigation on the compactability of
clean sands. Proc. of the International Conference on Ground Improvement and Ground Control,
Wollongong, Australia, Vol. 2, 1031-1037.
17
Chiaro, G., Koseki, J. and De Silva, L.I.N. 2013. A density- and stress-dependent elasto-plastic
model for sands subjected to monotonic torsional shear loading. Geotechnical Engineering
Journal SEAGS, 44(2), 18-26.
Chiaro, G., Modoni, G. and Salvatore, E. 2014. Prediction of the effects of compaction on granular
materials. Proc. of the International Symposium on Geomechanics from Micro to Macro,
Cambridge, UK, Soga et al. (Eds), Taylor & Francis Group (London), 1189-1194.
Cubrinovski, M. and Ishihara, K. 2002. Maximum and minimum void ratio characteristics of sands.
Soils and Foundations, 42(6), 65-78.
Fukumoto, T. and Sumisaki, N. 1999. Investigation of shear characteristics of natural sands in Japan.
Soils and Foundations, 39(1), 113-120.
Haykin, S., 1999. Neural networks: a comprehensive foundation. Pearson Education, Delhi, India.
Hilf, J. 1991. Compacted fill. Foundation Engineering Handbook (2 ed.). New York: Van Nostrand
Reinhold.
Huang AB, Chuang SY (2011) Correlating cyclic strength with fines contents through state
parameters. Soils Found 51(6):991-1001.
Jefferies, M. G. 1993. Nor-Sand: a simple critical state model forsand. Gèotechnique, 43(1), 91–103.
Kolbuszewski, J. 1948. An experimental study of the maximum and minimum porosities of sands.
Proc. of the 2nd
International Conference on Soil Mechanics, Rotterdam, Vol. 1, 158–165.
Korfiatis, G. P. and Manicopoulos, C. 1982. Correlation of maximum dry density and grain size.
Journal of Geotechnical Engineering ASCE, 108(GT9), 1171-1176.
Kerisel, J. 1985. The history of geotechnical engineering up until 1700. Proc. of the 11th
International Conference on Soil Mechanics and Foundation Engineering, San Francisco, USA,
Golden Jubilee Volume, 3 - 94.
Kirsch K. and Kirsch F., (2010) Ground Improvement by deep vibratory methods, Spon press,
Taylor & Francis group, London & New York, 198 pp.
18
Marquardt, D. 1963. An Algorithm for least-squares estimation of nonlinear parameters. SIAM
Journal on Applied Mathematics, 11(2), 431–441.
Masters, T. 1996. Sieci neuronowe w praktyce. Programowani e w języku C++, WNT, Warszawa (in
polish).
McCulloch, W. and Pitts, W. 1943. A logical calculus of the ideas immanent in nervous activity.
Bulletin of Mathematical Biophysics, 7, 115-133.
Miura, K., Maeda, K., Furukawa, M. and Tok, S. 1997. Physical characteristics of sands with
different primary properties. Soils and Foundations, 37(3), 53-64.
Ochmański M., Modoni G. and Bzówka J. 2015. Prediction of the diameter of jet grouting columns
with artificial neural networks, Soils and Foundations, 55(2), in press.
Patra, C., Sivakugan, N. and Das, B. 2010a. Relative density and median grain-size correlation from
laboratory. International Journal of Geotechnical Engineering, 4, 55-62.
Patra, C., Sivakugan, N., Das, B. and Rout, S. 2010b. Correlations for relative density of clean sand
with median grain size and compaction energy. International Journal of Geotechnical
Engineering, 4(2), 195-203.
Pearson, K. (1948) On the criterion, that a given system of deviations from the probable in the case
of a correlated system of variables is such that it can be reasonably supposed to have arisen from
random sampling. In: Karl Pearson's Early Statistical Papers. Cambridge University Press, pp.
339–357. First published in 1900 in Philos. Mag. (5th Ser) 50, 157–175 (1948).
Pichler, B., Lackner, R. and Mang, H.A. 2003. Back analysis of model parameters in geotechnical
engineering by means of soft computing. International Journal for Numerical Methods in
Engineering, 57(14), 1943–1978.
Puls, J. M. 2008. Compaction models for predicting moisture-density-energy relationships for earth
materials. Master thesis, Iowa State University.
19
Rahman MM, Lo SR, Gnanendran CT (2008) On equivalent granular void ratio and steady state
behaviour of loose sand with fines. Can Geotech J 45(10):1439-1456.
Rahman MM, Lo SR, Baki MAL (2011) Equivalent granular state parameter and undrained
behaviour of sand-fines mixtures. Acta Geotechnica 6(4):183-194.
Reynolds, O. 1885. On the dilatancy of media composed of rigid particles in contact, with
experimental illustration. Phil. Mag. 20, 469-81.
Shamoto, Y., Sato, M. and Zhang, J. M. 1996. Simplified estimation of earthquake-induced
settlements in saturated sands deposits. Soils and Foundation, 36(1), 39-50.
Schmertmann, J. H. 1978. Guidelines for cone penetration test, performance and design. US Federal
Highway Administration, Washington, DC, Report FHWATS-78-209, pp. 145.
Sinha, S. and Wang, M. (2008). Artificial Neural Network Prediction Models for Soil Compaction
and Permeability. Geotechnical and Geological Engineering 26(1): 47-64.
Stamatopoulos C. (2010) An experimental study of the liquefaction strength of silty sands in terms of
the state parameter. Soil Dynamic Earthquake Engineering 30(8), pp.662-678.
Terzaghi, K. 1925. Erdbaumechanik auf bodenphysikalischer. Grundlage, Vienna, Deuticke.
Thevanayagam S. (2000) Liquefaction potential and undrained fragility of silty soils. In: Proceedings
of the 12th World Conference on Earthquake Engineering, New Zealand Society of Earthquake
Engineering, Upper Hutt, New Zealand.
Tizpa, P., Jamshidi Chenari, R., Karimpour Fard, M. and Lemos Machado, S. (2015). ANN
prediction of some geotechnical properties of soil from their index parameters. Arabian Journal
of Geosciences 8(5): 2911-2920.
U.S. Department of Navy (1971). "Design Manual -Soil Mechanics, Foundntions. and Earth
Structures, NAV FAC D M -7, U.S. Government Printing Office. Washington, D.C.
Vaid, Y., Fisher, J., Kuerbis, R. and Negussey, D. 1990. Particle gradation and liquefaction. Journal
of Geotechnical Engineering ASCE, 116(4), 698-703.

20
Youd, T. 1973. Factors controlling maximum and minimum densities of sands. Evaluation of
Relative Density and Its Role in Geotechnical Projects Involving Cohesionless Soils. STP 523
ASTM, Philadelphia, 98-122.

21
Table 1. Void ratio obtained from each compaction tests and index properties of tested soils
Test Standard Proctor ModifiedProctor
Number
blows/layer 5 11 25 50 5 11 25 50
Energy (kJ/m3) 119 261 593 1185 539 1185 2694 5388
emax emin D50 Cu Cc Material Void ratio (e)
M3 0.818 0.740 0.710 0.695 0.759 0.644 0.697 0.690 0.849 0.528 0.28 1.54 0.916
M4 0.874 0.798 0.762 0.714 0.790 0.704 0.705 0.655 0.927 0.555 0.12 1.56 0.915
S1 0.748 0.712 0.678 0.662 0.725 0.615 0.673 0.659 0.816 0.506 0.53 2.58 1.103
S2 0.749 0.716 0.691 0.670 0.717 0.619 0.663 0.660 0.821 0.512 0.34 1.89 0.874
S3 0.729 0.668 0.644 0.618 0.653 0.570 0.585 0.567 0.768 0.438 0.53 6.15 0.467
S4 0.764 0,708 0,677 0,655 0,656 0,611 0,591 0,574 0,812 0,488 0,15 1,91 0,877
S5 0.813 0.736 0.710 0.687 0.737 0.639 0.671 0.654 0.844 0.539 0.22 2.61 1.098
S6 0.829 0.751 0.709 0.682 0.736 0.655 0.653 0.637 0.863 0.531 0.15 1.91 0.877
S7 0.759 0.683 0.651 0.642 0.672 0.585 0.594 0.587 0.784 0.471 0.28 3.70 0.773
S8 0.693 0.619 0.601 0.581 0.614 0.572 0.521 0.507 0.760 0.461 0.93 4.66 0.697
S9 0.698 0.614 0.586 0.557 0.619 0.574 0.551 0.540 0.765 0.464 0.34 4.58 0.755
S10 0.667 0.566 0.545 0.525 0.587 0.515 0.487 0.471 0.732 0.441 1.08 9.04 1.097
S11 0.622 0.534 0.512 0.486 0.541 0.506 0.481 0.458 0.685 0.408 1.00 11.90 0.272
S12 0.867 0.785 0.769 0.770 0.792 0.776 0.763 0.755 0.989 0.615 1.40 1.43 0.927
S13 0.800 0.704 0.672 0.656 0.723 0.687 0.636 0.622 0.885 0.546 0.72 2.48 1.081
S14 0.832 0.737 0.703 0.721 0.755 0.715 0.704 0.718 0.930 0.576 0.35 2.09 0.853
Notes: emaxandemin= maximum and minimum index void ratios (ASTM D4253-14 and D4254-14), respectively;
D50= mean diameter;Cu= uniformity coefficient;Cc= coefficient of curvature
Table 2. Experimental database used to evaluate the correlation between emax and emin
Reference Number
of data
emin emax
Fukumoto and Sumisaki (1999) 16 0.532-1.047 0.857-1.622
Shamoto et al. (1996) 4 0.558-0.785 0.918-1.322
Vaid et al. (1990) 3 0.370-0.630 0.610-0.940
Been et al. (1990) 3 0.527-0.665 0.753-1.023
Cubrinovski and Ishihara (2002) 8 0.330-0.540 0.600-0.940
Hilf (1991) 8 0.330-0.540 0.600-0.940
Patra et al. (2010b) 55 0.225-0.678 0.470-0.967
This study 16 0.408-0.615 0.685-0.989
Miura et al. (1997) 203 0.420-0.875 0.720-1.910
22
Table 3. Database used to evaluate the influence of compaction energy.
Reference This study Patra et al. (2010b)
Number of sandy soil tested 16 55
emax 0.69÷0.99 0.47÷0.97
Cu 1.43÷11.90 1.42÷9.83
D50 (mm) 0.11÷1.40 0.34÷2.6
Ec(kJ/m3) 119÷5388 356÷2694
Number of Proctortests 128 220
Table 4. Predictive performances of the neural network with variable number of neurons.
Number of neurons
1 2 3 4 5
Standard Deviation 7.20 E-02 4.38 E-02 4.6 E-02 4.72 E-02 5.03 E-02
Mean Squared Error 1.62 E-03 6.41 E-04 7.11E-04 7.61 E-04 8.41 E-04

23
Fig. 1 (a) Scanning electron microscope images of the grains of Fossanova sand; (b)
classification of the grain shape; and (c) definition of the roundess coefficient (after
Youd, 1973)........................................................................
Fig. 2
Fig. 3
Grain size distributions of the tested materials..................................................
Effects of water content on the dry unit weight of materials compacted with Standard Proctor
Tests
Fig. 4 Maximum index void ratio (emax) as function of the uniformity coefficient (Cu) and of the
roundness parameter (R) defined by Youd (1973)...................
Fig. 5 Relationship between (a) emax and emin and (b) emax and F of sandy soils……
Fig. 6 Structure of the artificial neural network……………………………………...
Fig. 7 Void ratio as function of emax and of the compaction energy…………………
Fig. 8 (a) Comparison between observed and predicted values of void ratio; and (b) statistical
diistribution of the relative error……………………………………
Fig. 9 Effectiveness of compaction with Proctor and vibratory tests………………
24

25

26

27

28

29

30

31

32