comparative study of asphalt concrete laboratory compaction methods to simulate field compaction
TRANSCRIPT
Ž .Construction and Building Materials 12 1998 373]384
Comparative study of asphalt concrete laboratory compactionmethods to simulate field compaction
Ziauddin A. KhanU , Hamad I. Al-Abdul Wahab, Ibrahim Asi, Rezqallah Ramadhan
Center for Engineering Research, Research Institute, King Fahd Uni ersity of Petroleum and Minerals, KFUPM Box 987, Dhahran 31261,Saudi Arabia
Received 6 December 1996; received in revised form 18 March 1998; accepted 27 March 1998
Abstract
The main objective of this study was to compare different laboratory compaction methods to field compaction and to select theŽ .laboratory method that was similar or close in compaction to that of the field. The candidate compaction methods were: a
Ž . Ž . Ž .Marshall Automatic Impact Compaction; b Marshall Manual Impact Compaction; c California Kneading Compaction; dŽ . Ž . Ž .Gyratory Shear Compaction angle of gyration 1.258 ; and e Gyratory Shear Compaction angle of gyration 68 . The evaluation
of the five laboratory compaction methods was based on the similarity between the engineering properties of the laboratorycompacted samples and the field cores. The engineering properties studied were resilient modulus, air voids, bulk density, andstatic creep behavior. The laboratory compacted specimens and field cores were also evaluated with the objective of identifying apromising laboratory compaction technique which would be able to produce mixtures with engineering properties closest to thoseof mixtures compacted in the field. Samples for this study were selected from four projects located at different locations in the
ŽEastern Province of Saudi Arabia. The principal conclusion of the study was that the Gyratory Shear Compaction angle of.gyration 1.258 method best represented the engineering properties of the field cores. Q 1998 Elsevier Science Ltd. All rights
reserved.
Keywords: Asphalt; Concrete; Compaction; Marshall test
1. Introduction
The difference between laboratory mix design meth-ods is not only the result of the evaluation procedurebut is also the consequence of the compaction tech-nique used. The goal of a mix design procedure is tocombine aggregates and a binder in a proportion that isable to satisfy a desired level of performance. Realisticprocedures for evaluating the strength of bituminousmixtures is therefore quite important. There are sev-eral factors that affect the strength of bituminous mix-tures; one of them is the method of forming a realistictest specimen in the laboratory that represents the
U Corresponding author. Fax: q966 3 8603996; e-mail:[email protected]
structure of the paving mixture when it is placed in thefield. Duplicating the composition of a field mixture inthe laboratory presents some problems, but they areminor compared to producing in the laboratory a speci-men of the mixture that truly represents the mixture as
w xit exists in the field 1 .The quality of an asphalt pavement depends largely
on the quality of the construction techniques used. Anasphalt mix might be well designed and well produced,but if it is placed in the road in an improper way, thepavement performance will be poor. Therefore next tomix design, construction, homogeneity, and degree ofcompaction must be considered the main qualityparameters of a laid asphalt mixture. A well designedand well produced mixture performs better, has betterdurability, and has better mechanical properties when
w xit is well compacted 2 .
0950-0618r98r$ - see front matter Q 1998 Elsevier Science Ltd. All rights reserved.Ž .P I I S 0 9 5 0 - 0 6 1 8 9 8 0 0 0 1 5 - 4
( )Z.A. Khan et al. r Construction and Building Materials 12 1998 373]384374
The compaction methods used to simulate field con-struction conditions include direct compression, impacthammering, kneading action, gyratory shear, vibrationand simulated rolling. Standard mix design proceduresare differentiated on their method of compaction, whichis assumed to simulate field compaction. With theMarshall design methods, specimens are prepared byimpact compaction, while in the Hveem mix designmethod, specimens are fabricated by kneading com-paction. This type of compaction was developed toproduce realistic specimens which compared favorablyto in-service mixtures after traffic compaction. Thegyratory compaction technique was introduced to simu-late the increasing loads and tire pressures of vehiclesoperating on the pavement. Prior to this compactiontechnique, it was not possible to achieve a realistic field
w xdensity in laboratory specimens 3 . Recently, theŽ .Strategic Highway Research Program SHRP adopted,
with some modification, the gyratory compaction proce-w xdure in asphalt mix design 4 .
The local asphalt pavement industry has long de-bated which laboratory compaction method best repli-cates the compacted mix achieved by field compactionprocedures. This study is a comparative evaluation oflaboratory compaction methods based on their abilityto simulate field compaction. Reproduction of the com-pacted mix in the laboratory and correlation of thecompacted mix to the in-service properties of the ma-terial will provide useful data for improving mix designprocedures.
The goal of this study was to compare and evaluate avariety of laboratory compaction methods that arewidely used andror resemble as closely as possible fieldcompacted mixtures. The objective of this study was toselect a compaction technique that is able to achieve
Žmaterial and engineering properties such as air voids,.resilient moduli, density, and stiffness which are simi-
lar to those of material placed in the field using stan-dard compaction practices. The selected compactiontechniques for this study were Marshall AutomaticImpact Compaction, Marshall Manual Impact Com-paction, California Kneading Compaction, Gyratory
Ž .Shear Compaction 1.258 angle of gyration , and Gyra-Ž .tory Shear Compaction 68 angle of gyration . Asphalt
mixtures sampled from behind the paver were com-pacted using the selected techniques. Field cores wereextracted from a number of locations before the roadwas opened to traffic. The laboratory prepared speci-mens and the extracted field cores were evaluatedusing static creep, modulus of resilient, and Marshallstability. The particle orientation of both the laboratoryand the field compacted specimens was analyzed. Thelaboratory compacted specimens were compared to thefield cores to determine a compaction technique whichis able to best reflect field compaction.
2. Background
Compaction of asphaltic concrete mixtures in flexiblepavements plays a major role in the performance ofthese pavements. Mix properties, such as air voids arehighly dependent on the degree and the method ofcompaction. These properties, in turn, affect pavementperformance indicators, such as rutting and fatiguecracking.
Mix design procedures and specifications are usuallyderived from laboratory experiments conducted on ma-terials that are to be used in the field. Laboratoryconditions are less time consuming and relatively easyto control for these purposes. However, laboratory testsshould simulate to a high degree the conditions in thefield. In this context, laboratory compaction proceduresshould simulate compaction in the field, not only interms of density but also in terms of aggregate particleorientation.
w xLinden et al. 5 conducted a study on how com-paction, measured by air voids, influences the perfor-mance of dense asphalt concrete pavement surfaces.They found that a 1% increase in air voids tends toproduce approximately a 10% loss in pavement life.The used base-course air void level was 7%, and thedata were collected from 48 state highway agencies inthe United States. The analysis in this study was doneon the basis of two performance indicators: fatiguecracking and aging.
A high degree of compaction improves the stiffnessof asphaltic concrete materials and hence improves theability of the material to distribute traffic loads moreeffectively over lower pavement layers and the soil
w xfoundation 6 . Good compaction with a target void of4]7% also increases the resistance of asphaltic-boundlayers to deformation and improves their durability.
There are many factors affecting the degree of com-paction of an asphaltic bound material. These includematerial temperature, thickness of the laid materialsŽ .lift thickness , binder content, and type and grading ofthe aggregates used in the asphaltic concrete mixture.
w xScherocman and Acott 7 studied the effect of com-paction in terms of a number of factors and rated thesefactors on the basis of the degree to which they con-tributed to the cause of each pavement distress: perma-nent deformation; fatigue cracking; low-temperaturecracking; and moisture damage. It was concluded that
Žseveral factors environmental conditions, lift thickness,mix properties, type of compaction equipment, and
.roller operation played a role in influencing pavementperformance indicators except in relation to low-tem-perature cracking.
As part of the Strategic Highway Research ProgramŽ .SHRP project A-003, ‘performance related to testingand measuring asphalt]aggregate interaction and mix-tures’, three compaction methods were studied by Sousa
( )Z.A. Khan et al. r Construction and Building Materials 12 1998 373]384 375
w xet al. 8 to determine the extent to which the com-paction method affects the fundamental mixtureproperties of importance to pavement performance in-service. Two gyratory shear compactors, a kneadingcompactor and a rolling-wheel compactor, were stud-ied. A total of 16 asphalt]aggregate mixtures weretested, and it was found that the method of compactionaffected the way test specimens respond to laboratoryloading. Regarding resistance to permanent deforma-tion, the kneading compaction produced the most re-sistant specimens. This was followed in order byrolling-wheel compaction and gyratory compaction. Re-garding mixture stiffness, the rolling-wheel compactionproduced the stiffest mixtures. This was followed inorder by kneading compaction and gyratory com-paction. Among the studied compaction methods, therolling-wheel compaction seemed to be the best insimulating field-compacted mixtures.
The gyratory testing machine is a combination of akneading compactor and a shear testing machine. It isa realistic simulator of the abrasion effects caused byrepetitive stress and inter-granular movement of themass of material within a flexible pavement structurew x9 . This method of compaction was developed to simu-late the increasing load and tire pressures of vehicles
w xoperating on flexible pavements 2 . It was standardizedas ASTM D3387 to be used for guidance in selectingoptimum asphalt content and establishing density re-quirements, in addition to obtaining the shear strengthfactor with regard to shear under load and strain
w xconditions to be adopted in a mix design 10 .w xSigurjonsson and Ruth 11 used the gyratory testing
machine to evaluate the asphalt]aggregate mixtures ofknown performance in terms of their rutting resistance.They concluded that the gyratory compaction machineproduced mixtures which were not sensitive to reason-able changes in binder content, gradation, and mineralfiller content. This key conclusion eliminated the needfor multiple parameter criteria, which can eventuallysimplify both design and quality control processes. Re-
Ž .cently, the Strategic Research Program SHRP adoptedthe use of the gyratory compaction method in theSUPERPAVE mix design under SHRP Designation
w xM-002 12,13 .w xConsuergra et al. 14 performed a combined field
and laboratory study that evaluated the ability of fivecompaction devices to simulate field compaction. Thecompaction devices evaluated were selected on thebasis of their availability and on their uniqueness inmechanical manipulation of the mixture. The devices
Ž . Ž .evaluated were: a the Texas Gyratory Compactor; bŽ .the California Kneading Compactor; c the Marshall
Ž .Impact Hammer; d the Mobile Steel Wheel Simula-Ž .tor; and e the Arizona Vibratory Kneading Com-
pactor. The results of their study showed that the TexasGyratory Compactor was best in terms of its ability toproduce compacted mixtures with engineering proper-ties similar to those produced in the field. The Califor-nia Kneading Compactor was ranked second on thebasis of its ability to replicate field conditions. Neitherthe Marshall Impact Hammer nor the Arizona Vibra-tory Kneading Compactor were found to be veryeffective.
3. Study approach
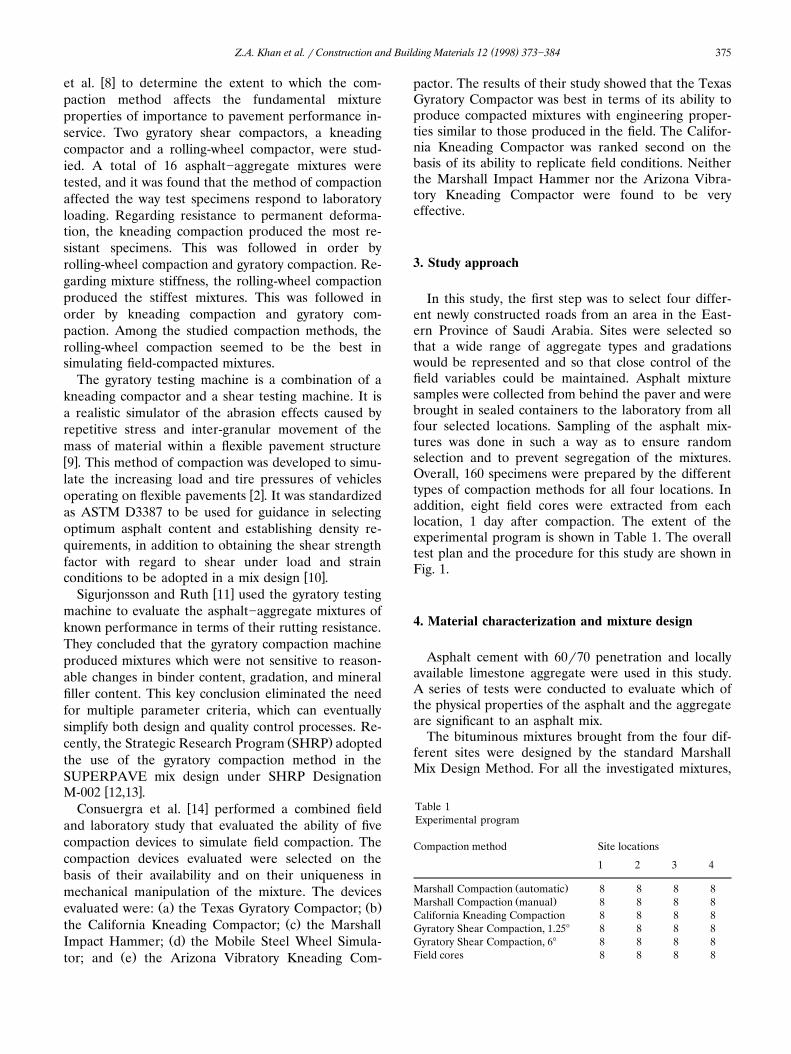
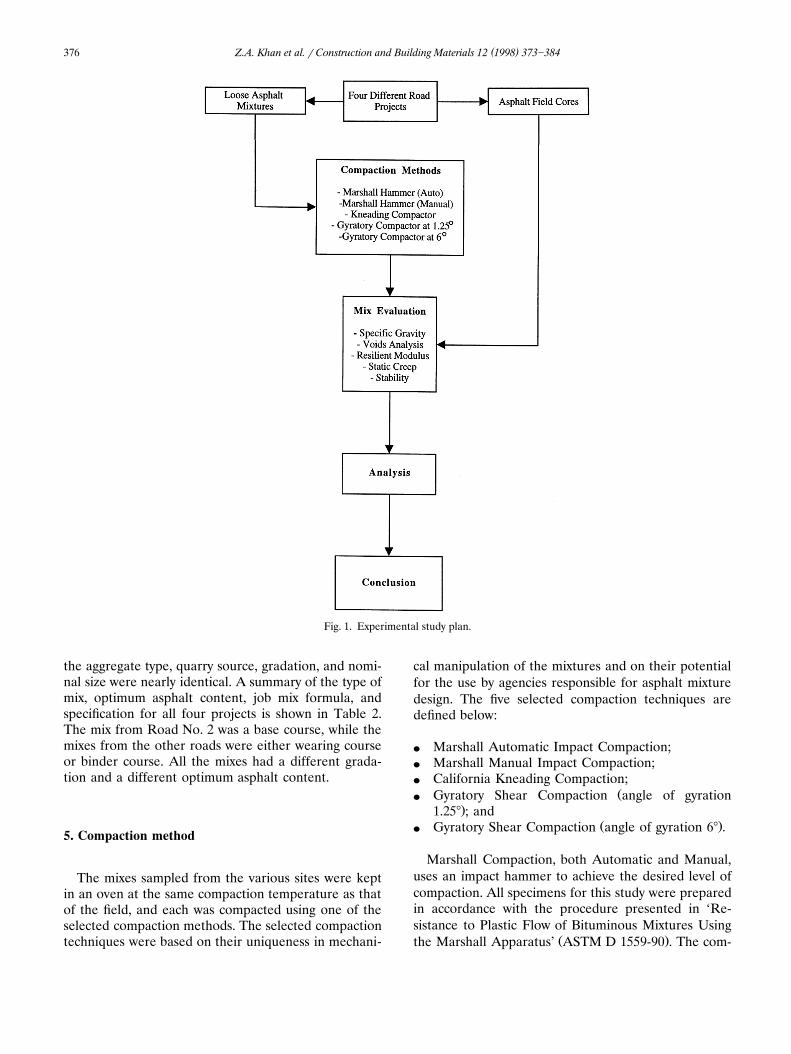
In this study, the first step was to select four differ-ent newly constructed roads from an area in the East-ern Province of Saudi Arabia. Sites were selected sothat a wide range of aggregate types and gradationswould be represented and so that close control of thefield variables could be maintained. Asphalt mixturesamples were collected from behind the paver and werebrought in sealed containers to the laboratory from allfour selected locations. Sampling of the asphalt mix-tures was done in such a way as to ensure randomselection and to prevent segregation of the mixtures.Overall, 160 specimens were prepared by the differenttypes of compaction methods for all four locations. Inaddition, eight field cores were extracted from eachlocation, 1 day after compaction. The extent of theexperimental program is shown in Table 1. The overalltest plan and the procedure for this study are shown inFig. 1.
4. Material characterization and mixture design
Asphalt cement with 60r70 penetration and locallyavailable limestone aggregate were used in this study.A series of tests were conducted to evaluate which ofthe physical properties of the asphalt and the aggregateare significant to an asphalt mix.
The bituminous mixtures brought from the four dif-ferent sites were designed by the standard MarshallMix Design Method. For all the investigated mixtures,
Table 1Experimental program
Compaction method Site locations
1 2 3 4
Ž .Marshall Compaction automatic 8 8 8 8Ž .Marshall Compaction manual 8 8 8 8
California Kneading Compaction 8 8 8 8Gyratory Shear Compaction, 1.258 8 8 8 8Gyratory Shear Compaction, 68 8 8 8 8Field cores 8 8 8 8
( )Z.A. Khan et al. r Construction and Building Materials 12 1998 373]384376
Fig. 1. Experimental study plan.
the aggregate type, quarry source, gradation, and nomi-nal size were nearly identical. A summary of the type ofmix, optimum asphalt content, job mix formula, andspecification for all four projects is shown in Table 2.The mix from Road No. 2 was a base course, while themixes from the other roads were either wearing courseor binder course. All the mixes had a different grada-tion and a different optimum asphalt content.
5. Compaction method
The mixes sampled from the various sites were keptin an oven at the same compaction temperature as thatof the field, and each was compacted using one of theselected compaction methods. The selected compactiontechniques were based on their uniqueness in mechani-
cal manipulation of the mixtures and on their potentialfor the use by agencies responsible for asphalt mixturedesign. The five selected compaction techniques aredefined below:
v Marshall Automatic Impact Compaction;v Marshall Manual Impact Compaction;v California Kneading Compaction;
Žv Gyratory Shear Compaction angle of gyration.1.258 ; and
Ž .v Gyratory Shear Compaction angle of gyration 68 .
Marshall Compaction, both Automatic and Manual,uses an impact hammer to achieve the desired level ofcompaction. All specimens for this study were preparedin accordance with the procedure presented in ‘Re-sistance to Plastic Flow of Bituminous Mixtures Using
Ž .the Marshall Apparatus’ ASTM D 1559-90 . The com-
( )Z.A. Khan et al. r Construction and Building Materials 12 1998 373]384 377
Table 2Summary of job mix formulation and specifications for selected projects
Road No. Type of mix Optimum asphalt SpedificationsJob mix formulaŽ .content % AASHO sieve Passing percent
1 Wearing course 5.23 3r4 inches 100 1001r2 inches 86 80]95No. 4 56 48]62No. 10 40 32]45No. 40 23 16]26No. 80 12 8]18No. 200 5 4]8
2 Base course 5.12 3r4 inches 100 1001r2 inches 89 80]1003r8 inches 80 70]90No. 4 57 50]70No. 8 41 35]50No. 30 26 18]29No. 50 18 13]23No. 100 11 8]16No. 200 5.9 4]10
3 Binder course 4.96 1 inch 100 1003r4 inches 99 90]993r8 inches 66 60]80No. 4 42 35]65No. 8 35 20]50No. 50 18 8]20No. 200 4 3]8
4 Wearing course 4.70 3r4 inches 100 1001r2 inches 86.4 80]95No. 4 52.2 48]62No. 10 34.4 32]45No. 40 21.1 16]26No. 80 11.8 8]18No. 200 5.2 4]8
paction energy was controlled by the number of blowsthe specimen was subjected to in the compactionprocess. The sample mixes brought from all four siteswere compacted using both an automatic and a manualMarshall hammer, with 75 blows per side applied toeach sample. Eight specimens from each location wereprepared for each type of compaction.
The California Kneading Compaction method wasused in this study to simulate the kneading type ofcompaction which would allow inter-particle movementsimilar to that obtained under a rubber-tired roller. Allspecimens were compacted in accordance with the‘Preparation of Test Specimens of Bituminous Mix-tures by Means of the California Kneading Compactor’Ž .ASTM D 3202-90 test method. In this type of com-paction method, forces are applied to a portion of thefree face of an otherwise confined asphalt concretemix. Compaction forces are applied uniformly aroundthe free face. The partial free face allows particles tomove relative to each other. This creates a kneadingaction that densifies the mix. As a standard, 20 tamping
blows were applied at 250 psi foot pressure, followed by150 tamping blows at 1500 psi foot pressure. Then, a1000 psi static leveling load was used to finish compact-ing the specimens. Overall, 32 specimens were prepared
Ž .by this compaction method eight for each location .The major operational aspects of the gyratory com-
paction method have been thoroughly discussed in thew x Ž .literature 15,16 and ASTM D 4013-90 . The gyratory
compaction method applies normal forces that are sup-plemented with a rocking or gyratory motion to workthe mix into a denser configuration while it is totallyconfined. The gyratory compaction method has threevariable parameters: vertical ram pressure; number ofgyrations; and gyratory inclination angle. The gyratorycompactor used in this study was modified to incor-porate both the 1.258 and the 68 angles of gyration.Sample thicknesses were measured at different num-bers of gyrations for specimens prepared at the 1.258angle of gyration. Compaction was stopped when the
Žtarget value for the total air voids 5% based on the job.mix formula was obtained.
( )Z.A. Khan et al. r Construction and Building Materials 12 1998 373]384378
6. Testing methods and results
Laboratory and field compacted specimens were sub-jected to the following laboratory characterization tests:
v Bulk Specific Gravity and Voids Content Determi-Ž .nation ASTM D-2726 ;
Ž .v Marshall Stability ASTM D-1559 ;v Resilient Modulus Test;
Ž .v Static Creep Test Shell Method ; andv Particle Orientation Analysis.
The bulk specific gravity test was performed aftersamples had cooled to room temperature, according toASTM D2726. Furthermore, the maximum specificgravity test was performed using the Rice Method onthe sampled material from all four roads. Air voidswere calculated using bulk specific gravity and maxi-mum theoretical specific gravity data. Three of theeight specimens for each type of compaction and eachlocation were tested for Marshall Stability as per ASTMD-1559. Specimens were placed in a water bath at 608Cfor a period of 30 min and were tested for MarshallStability and flow. A summary of the air voids, bulkdensity, Marshall Stability, and flow for all the field andlaboratory compacted specimens is presented in Table3. A comparative analysis of Marshall Stability, bulk
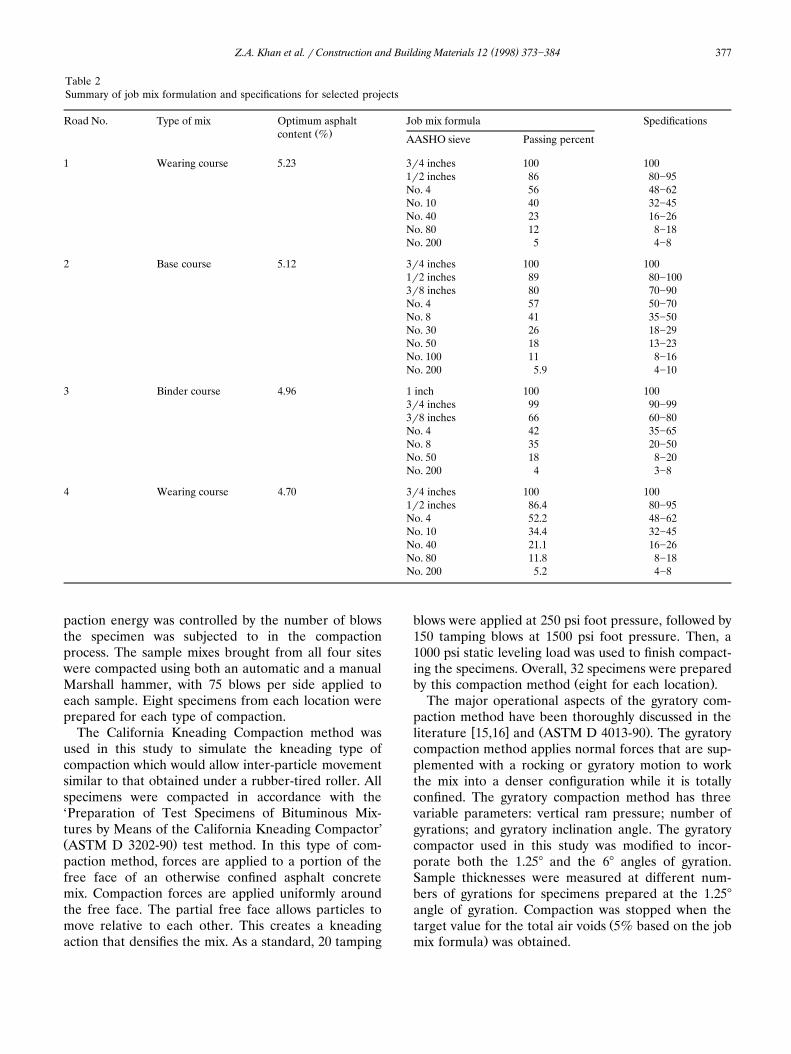
density, and air voids for samples prepared by differenttypes of compaction techniques are further elaboratedin Figs. 2]4, respectively.
It should be noted from Fig. 2 that the specimenscompacted by a 1.258 angle of gyratory compactionyielded Marshall Stability closest to the samples takenfrom the field. Moreover, Marshall Manual ImpactCompaction consistently gave a denser specimen withhigher stability values than those prepared with theautomatic Marshall compactor. The stability values forspecimens compacted with the kneading compactorwere low compared to specimens compacted by othercompaction techniques. Furthermore, the stability val-ues of samples compacted with the gyratory shearcompactor at a 68 angle gave higher values than thosecompacted by the same compaction technique at a1.258 angle.
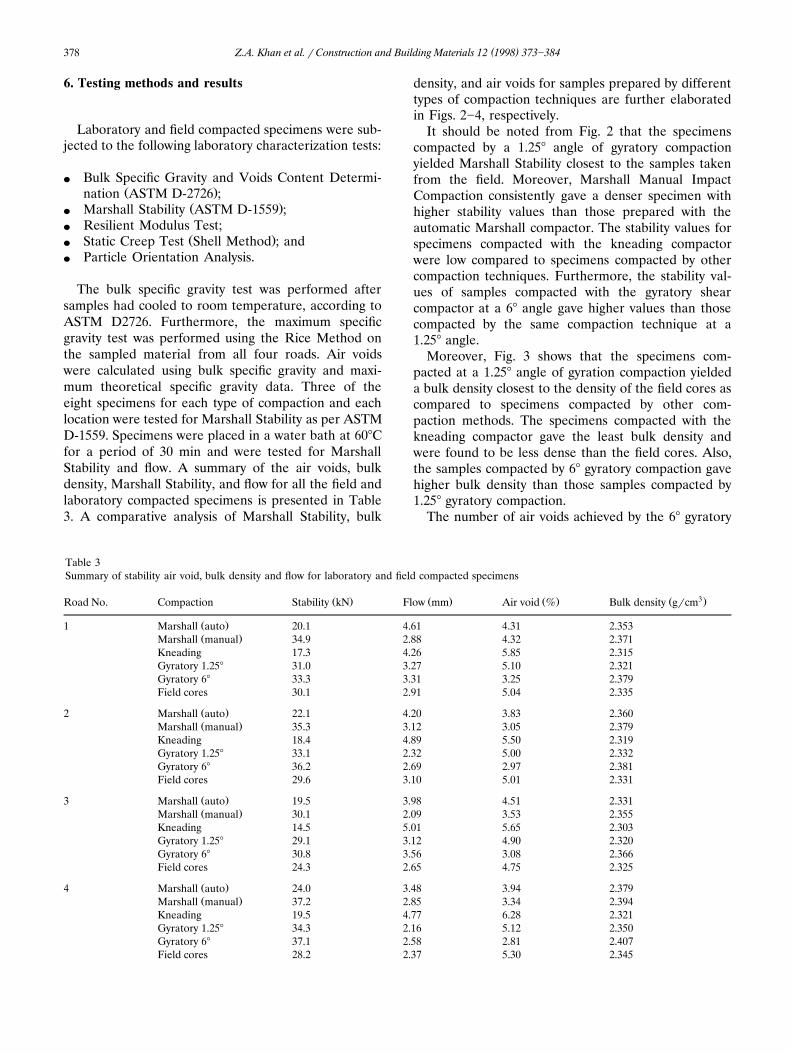
Moreover, Fig. 3 shows that the specimens com-pacted at a 1.258 angle of gyration compaction yieldeda bulk density closest to the density of the field cores ascompared to specimens compacted by other com-paction methods. The specimens compacted with thekneading compactor gave the least bulk density andwere found to be less dense than the field cores. Also,the samples compacted by 68 gyratory compaction gavehigher bulk density than those samples compacted by1.258 gyratory compaction.
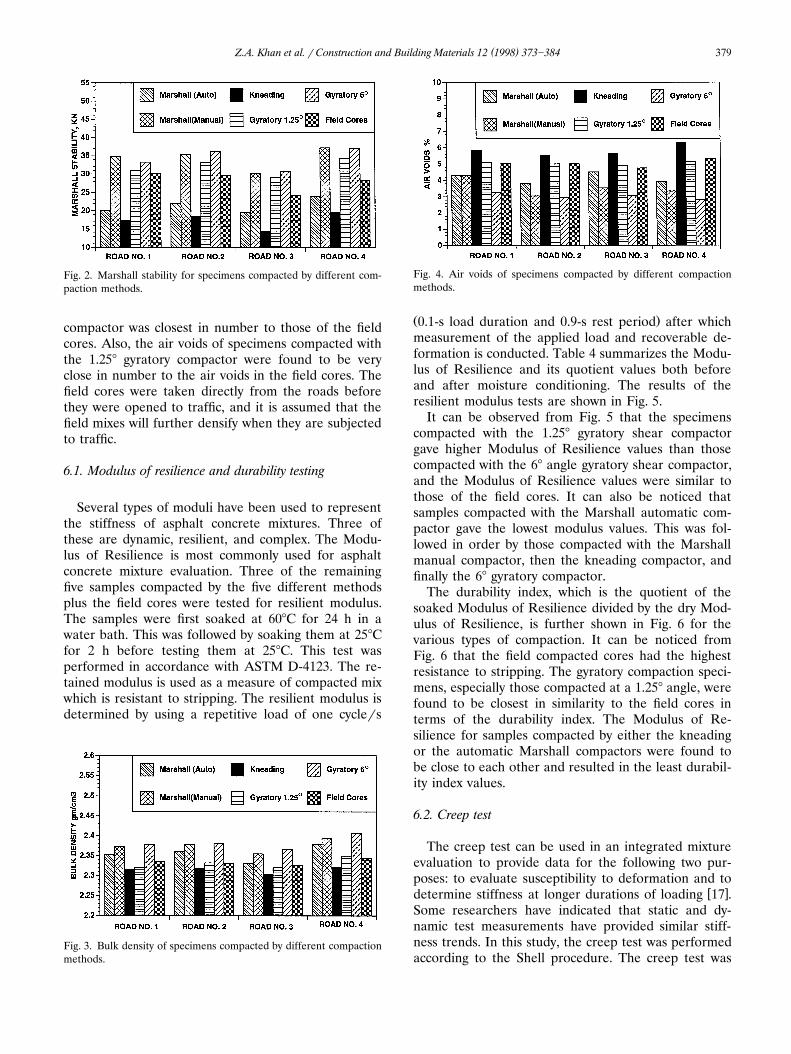
The number of air voids achieved by the 68 gyratory
Table 3Summary of stability air void, bulk density and flow for laboratory and field compacted specimens
3Ž . Ž . Ž . Ž .Road No. Compaction Stability kN Flow mm Air void % Bulk density grcm
Ž .1 Marshall auto 20.1 4.61 4.31 2.353Ž .Marshall manual 34.9 2.88 4.32 2.371
Kneading 17.3 4.26 5.85 2.315Gyratory 1.258 31.0 3.27 5.10 2.321Gyratory 68 33.3 3.31 3.25 2.379Field cores 30.1 2.91 5.04 2.335
Ž .2 Marshall auto 22.1 4.20 3.83 2.360Ž .Marshall manual 35.3 3.12 3.05 2.379
Kneading 18.4 4.89 5.50 2.319Gyratory 1.258 33.1 2.32 5.00 2.332Gyratory 68 36.2 2.69 2.97 2.381Field cores 29.6 3.10 5.01 2.331
Ž .3 Marshall auto 19.5 3.98 4.51 2.331Ž .Marshall manual 30.1 2.09 3.53 2.355
Kneading 14.5 5.01 5.65 2.303Gyratory 1.258 29.1 3.12 4.90 2.320Gyratory 68 30.8 3.56 3.08 2.366Field cores 24.3 2.65 4.75 2.325
Ž .4 Marshall auto 24.0 3.48 3.94 2.379Ž .Marshall manual 37.2 2.85 3.34 2.394
Kneading 19.5 4.77 6.28 2.321Gyratory 1.258 34.3 2.16 5.12 2.350Gyratory 68 37.1 2.58 2.81 2.407Field cores 28.2 2.37 5.30 2.345
( )Z.A. Khan et al. r Construction and Building Materials 12 1998 373]384 379
Fig. 2. Marshall stability for specimens compacted by different com-paction methods.
compactor was closest in number to those of the fieldcores. Also, the air voids of specimens compacted withthe 1.258 gyratory compactor were found to be veryclose in number to the air voids in the field cores. Thefield cores were taken directly from the roads beforethey were opened to traffic, and it is assumed that thefield mixes will further densify when they are subjectedto traffic.
6.1. Modulus of resilience and durability testing
Several types of moduli have been used to representthe stiffness of asphalt concrete mixtures. Three ofthese are dynamic, resilient, and complex. The Modu-lus of Resilience is most commonly used for asphaltconcrete mixture evaluation. Three of the remainingfive samples compacted by the five different methodsplus the field cores were tested for resilient modulus.The samples were first soaked at 608C for 24 h in awater bath. This was followed by soaking them at 258Cfor 2 h before testing them at 258C. This test wasperformed in accordance with ASTM D-4123. The re-tained modulus is used as a measure of compacted mixwhich is resistant to stripping. The resilient modulus isdetermined by using a repetitive load of one cyclers
Fig. 3. Bulk density of specimens compacted by different compactionmethods.
Fig. 4. Air voids of specimens compacted by different compactionmethods.
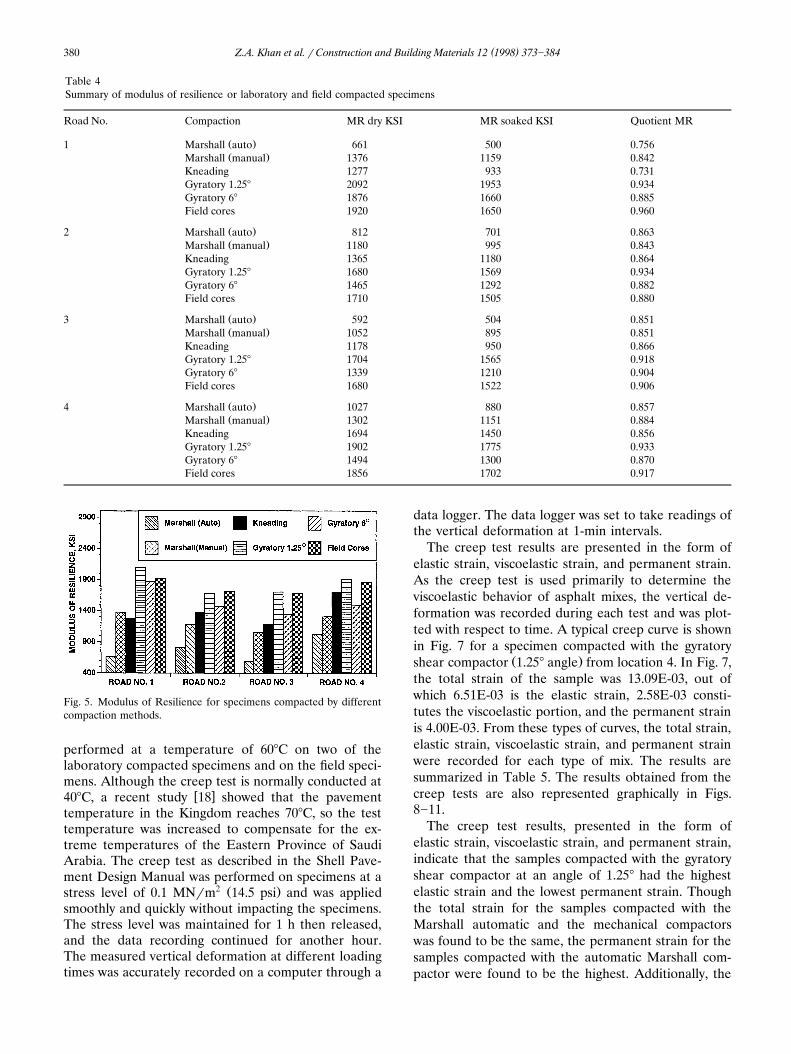
Ž .0.1-s load duration and 0.9-s rest period after whichmeasurement of the applied load and recoverable de-formation is conducted. Table 4 summarizes the Modu-lus of Resilience and its quotient values both beforeand after moisture conditioning. The results of theresilient modulus tests are shown in Fig. 5.
It can be observed from Fig. 5 that the specimenscompacted with the 1.258 gyratory shear compactorgave higher Modulus of Resilience values than thosecompacted with the 68 angle gyratory shear compactor,and the Modulus of Resilience values were similar tothose of the field cores. It can also be noticed thatsamples compacted with the Marshall automatic com-pactor gave the lowest modulus values. This was fol-lowed in order by those compacted with the Marshallmanual compactor, then the kneading compactor, andfinally the 68 gyratory compactor.
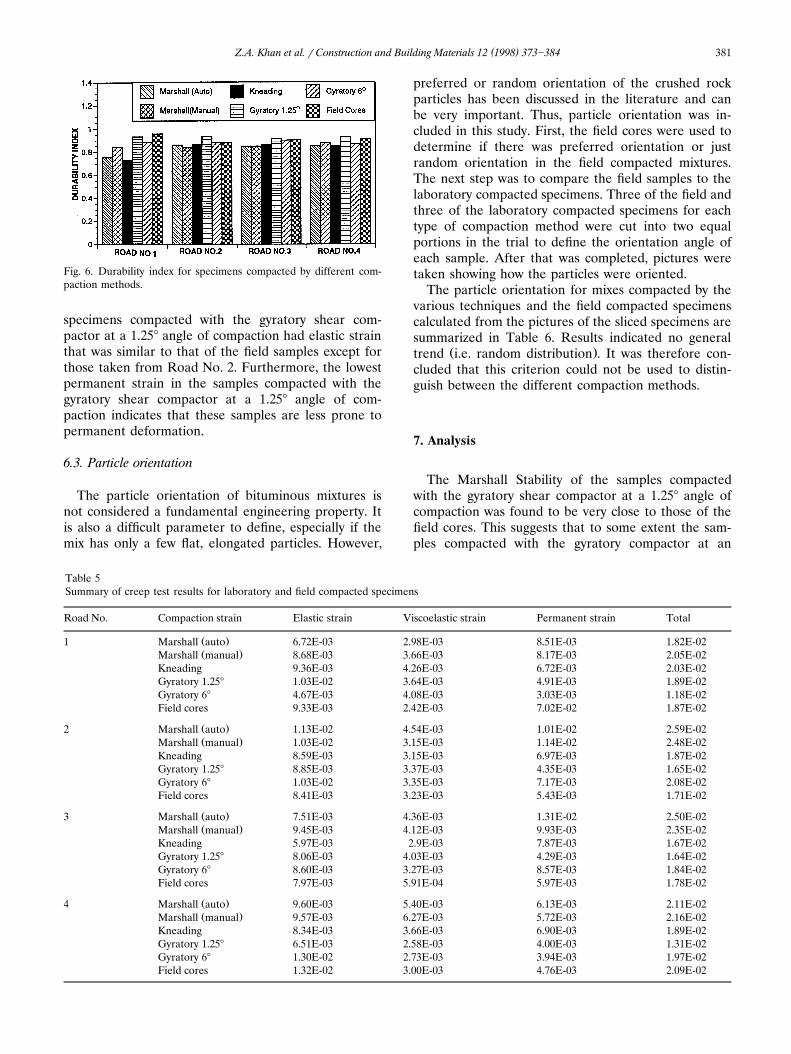
The durability index, which is the quotient of thesoaked Modulus of Resilience divided by the dry Mod-ulus of Resilience, is further shown in Fig. 6 for thevarious types of compaction. It can be noticed fromFig. 6 that the field compacted cores had the highestresistance to stripping. The gyratory compaction speci-mens, especially those compacted at a 1.258 angle, werefound to be closest in similarity to the field cores interms of the durability index. The Modulus of Re-silience for samples compacted by either the kneadingor the automatic Marshall compactors were found tobe close to each other and resulted in the least durabil-ity index values.
6.2. Creep test
The creep test can be used in an integrated mixtureevaluation to provide data for the following two pur-poses: to evaluate susceptibility to deformation and to
w xdetermine stiffness at longer durations of loading 17 .Some researchers have indicated that static and dy-namic test measurements have provided similar stiff-ness trends. In this study, the creep test was performedaccording to the Shell procedure. The creep test was
( )Z.A. Khan et al. r Construction and Building Materials 12 1998 373]384380
Table 4Summary of modulus of resilience or laboratory and field compacted specimens
Road No. Compaction MR dry KSI MR soaked KSI Quotient MR
Ž .1 Marshall auto 661 500 0.756Ž .Marshall manual 1376 1159 0.842
Kneading 1277 933 0.731Gyratory 1.258 2092 1953 0.934Gyratory 68 1876 1660 0.885Field cores 1920 1650 0.960
Ž .2 Marshall auto 812 701 0.863Ž .Marshall manual 1180 995 0.843
Kneading 1365 1180 0.864Gyratory 1.258 1680 1569 0.934Gyratory 68 1465 1292 0.882Field cores 1710 1505 0.880
Ž .3 Marshall auto 592 504 0.851Ž .Marshall manual 1052 895 0.851
Kneading 1178 950 0.866Gyratory 1.258 1704 1565 0.918Gyratory 68 1339 1210 0.904Field cores 1680 1522 0.906
Ž .4 Marshall auto 1027 880 0.857Ž .Marshall manual 1302 1151 0.884
Kneading 1694 1450 0.856Gyratory 1.258 1902 1775 0.933Gyratory 68 1494 1300 0.870Field cores 1856 1702 0.917
Fig. 5. Modulus of Resilience for specimens compacted by differentcompaction methods.
performed at a temperature of 608C on two of thelaboratory compacted specimens and on the field speci-mens. Although the creep test is normally conducted at
w x408C, a recent study 18 showed that the pavementtemperature in the Kingdom reaches 708C, so the testtemperature was increased to compensate for the ex-treme temperatures of the Eastern Province of SaudiArabia. The creep test as described in the Shell Pave-ment Design Manual was performed on specimens at a
2 Ž .stress level of 0.1 MNrm 14.5 psi and was appliedsmoothly and quickly without impacting the specimens.The stress level was maintained for 1 h then released,and the data recording continued for another hour.The measured vertical deformation at different loadingtimes was accurately recorded on a computer through a
data logger. The data logger was set to take readings ofthe vertical deformation at 1-min intervals.
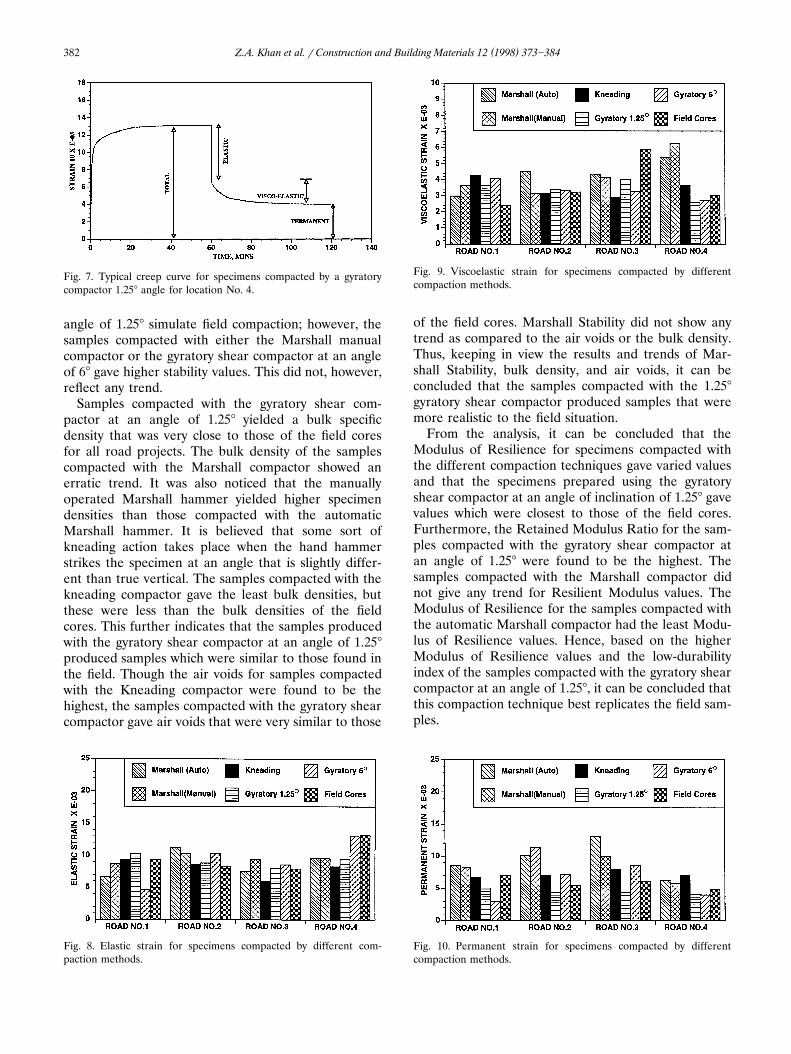
The creep test results are presented in the form ofelastic strain, viscoelastic strain, and permanent strain.As the creep test is used primarily to determine theviscoelastic behavior of asphalt mixes, the vertical de-formation was recorded during each test and was plot-ted with respect to time. A typical creep curve is shownin Fig. 7 for a specimen compacted with the gyratory
Ž .shear compactor 1.258 angle from location 4. In Fig. 7,the total strain of the sample was 13.09E-03, out ofwhich 6.51E-03 is the elastic strain, 2.58E-03 consti-tutes the viscoelastic portion, and the permanent strainis 4.00E-03. From these types of curves, the total strain,elastic strain, viscoelastic strain, and permanent strainwere recorded for each type of mix. The results aresummarized in Table 5. The results obtained from thecreep tests are also represented graphically in Figs.8]11.
The creep test results, presented in the form ofelastic strain, viscoelastic strain, and permanent strain,indicate that the samples compacted with the gyratoryshear compactor at an angle of 1.258 had the highestelastic strain and the lowest permanent strain. Thoughthe total strain for the samples compacted with theMarshall automatic and the mechanical compactorswas found to be the same, the permanent strain for thesamples compacted with the automatic Marshall com-pactor were found to be the highest. Additionally, the
( )Z.A. Khan et al. r Construction and Building Materials 12 1998 373]384 381
Fig. 6. Durability index for specimens compacted by different com-paction methods.
specimens compacted with the gyratory shear com-pactor at a 1.258 angle of compaction had elastic strainthat was similar to that of the field samples except forthose taken from Road No. 2. Furthermore, the lowestpermanent strain in the samples compacted with thegyratory shear compactor at a 1.258 angle of com-paction indicates that these samples are less prone topermanent deformation.
6.3. Particle orientation
The particle orientation of bituminous mixtures isnot considered a fundamental engineering property. Itis also a difficult parameter to define, especially if themix has only a few flat, elongated particles. However,
preferred or random orientation of the crushed rockparticles has been discussed in the literature and canbe very important. Thus, particle orientation was in-cluded in this study. First, the field cores were used todetermine if there was preferred orientation or justrandom orientation in the field compacted mixtures.The next step was to compare the field samples to thelaboratory compacted specimens. Three of the field andthree of the laboratory compacted specimens for eachtype of compaction method were cut into two equalportions in the trial to define the orientation angle ofeach sample. After that was completed, pictures weretaken showing how the particles were oriented.
The particle orientation for mixes compacted by thevarious techniques and the field compacted specimenscalculated from the pictures of the sliced specimens aresummarized in Table 6. Results indicated no general
Ž .trend i.e. random distribution . It was therefore con-cluded that this criterion could not be used to distin-guish between the different compaction methods.
7. Analysis
The Marshall Stability of the samples compactedwith the gyratory shear compactor at a 1.258 angle ofcompaction was found to be very close to those of thefield cores. This suggests that to some extent the sam-ples compacted with the gyratory compactor at an
Table 5Summary of creep test results for laboratory and field compacted specimens
Road No. Compaction strain Elastic strain Viscoelastic strain Permanent strain Total
Ž .1 Marshall auto 6.72E-03 2.98E-03 8.51E-03 1.82E-02Ž .Marshall manual 8.68E-03 3.66E-03 8.17E-03 2.05E-02
Kneading 9.36E-03 4.26E-03 6.72E-03 2.03E-02Gyratory 1.258 1.03E-02 3.64E-03 4.91E-03 1.89E-02Gyratory 68 4.67E-03 4.08E-03 3.03E-03 1.18E-02Field cores 9.33E-03 2.42E-03 7.02E-02 1.87E-02
Ž .2 Marshall auto 1.13E-02 4.54E-03 1.01E-02 2.59E-02Ž .Marshall manual 1.03E-02 3.15E-03 1.14E-02 2.48E-02
Kneading 8.59E-03 3.15E-03 6.97E-03 1.87E-02Gyratory 1.258 8.85E-03 3.37E-03 4.35E-03 1.65E-02Gyratory 68 1.03E-02 3.35E-03 7.17E-03 2.08E-02Field cores 8.41E-03 3.23E-03 5.43E-03 1.71E-02
Ž .3 Marshall auto 7.51E-03 4.36E-03 1.31E-02 2.50E-02Ž .Marshall manual 9.45E-03 4.12E-03 9.93E-03 2.35E-02
Kneading 5.97E-03 2.9E-03 7.87E-03 1.67E-02Gyratory 1.258 8.06E-03 4.03E-03 4.29E-03 1.64E-02Gyratory 68 8.60E-03 3.27E-03 8.57E-03 1.84E-02Field cores 7.97E-03 5.91E-04 5.97E-03 1.78E-02
Ž .4 Marshall auto 9.60E-03 5.40E-03 6.13E-03 2.11E-02Ž .Marshall manual 9.57E-03 6.27E-03 5.72E-03 2.16E-02
Kneading 8.34E-03 3.66E-03 6.90E-03 1.89E-02Gyratory 1.258 6.51E-03 2.58E-03 4.00E-03 1.31E-02Gyratory 68 1.30E-02 2.73E-03 3.94E-03 1.97E-02Field cores 1.32E-02 3.00E-03 4.76E-03 2.09E-02
( )Z.A. Khan et al. r Construction and Building Materials 12 1998 373]384382
Fig. 7. Typical creep curve for specimens compacted by a gyratorycompactor 1.258 angle for location No. 4.
angle of 1.258 simulate field compaction; however, thesamples compacted with either the Marshall manualcompactor or the gyratory shear compactor at an angleof 68 gave higher stability values. This did not, however,reflect any trend.
Samples compacted with the gyratory shear com-pactor at an angle of 1.258 yielded a bulk specificdensity that was very close to those of the field coresfor all road projects. The bulk density of the samplescompacted with the Marshall compactor showed anerratic trend. It was also noticed that the manuallyoperated Marshall hammer yielded higher specimendensities than those compacted with the automaticMarshall hammer. It is believed that some sort ofkneading action takes place when the hand hammerstrikes the specimen at an angle that is slightly differ-ent than true vertical. The samples compacted with thekneading compactor gave the least bulk densities, butthese were less than the bulk densities of the fieldcores. This further indicates that the samples producedwith the gyratory shear compactor at an angle of 1.258produced samples which were similar to those found inthe field. Though the air voids for samples compactedwith the Kneading compactor were found to be thehighest, the samples compacted with the gyratory shearcompactor gave air voids that were very similar to those
Fig. 8. Elastic strain for specimens compacted by different com-paction methods.
Fig. 9. Viscoelastic strain for specimens compacted by differentcompaction methods.
of the field cores. Marshall Stability did not show anytrend as compared to the air voids or the bulk density.Thus, keeping in view the results and trends of Mar-shall Stability, bulk density, and air voids, it can beconcluded that the samples compacted with the 1.258gyratory shear compactor produced samples that weremore realistic to the field situation.
From the analysis, it can be concluded that theModulus of Resilience for specimens compacted withthe different compaction techniques gave varied valuesand that the specimens prepared using the gyratoryshear compactor at an angle of inclination of 1.258 gavevalues which were closest to those of the field cores.Furthermore, the Retained Modulus Ratio for the sam-ples compacted with the gyratory shear compactor atan angle of 1.258 were found to be the highest. Thesamples compacted with the Marshall compactor didnot give any trend for Resilient Modulus values. TheModulus of Resilience for the samples compacted withthe automatic Marshall compactor had the least Modu-lus of Resilience values. Hence, based on the higherModulus of Resilience values and the low-durabilityindex of the samples compacted with the gyratory shearcompactor at an angle of 1.258, it can be concluded thatthis compaction technique best replicates the field sam-ples.
Fig. 10. Permanent strain for specimens compacted by differentcompaction methods.
( )Z.A. Khan et al. r Construction and Building Materials 12 1998 373]384 383
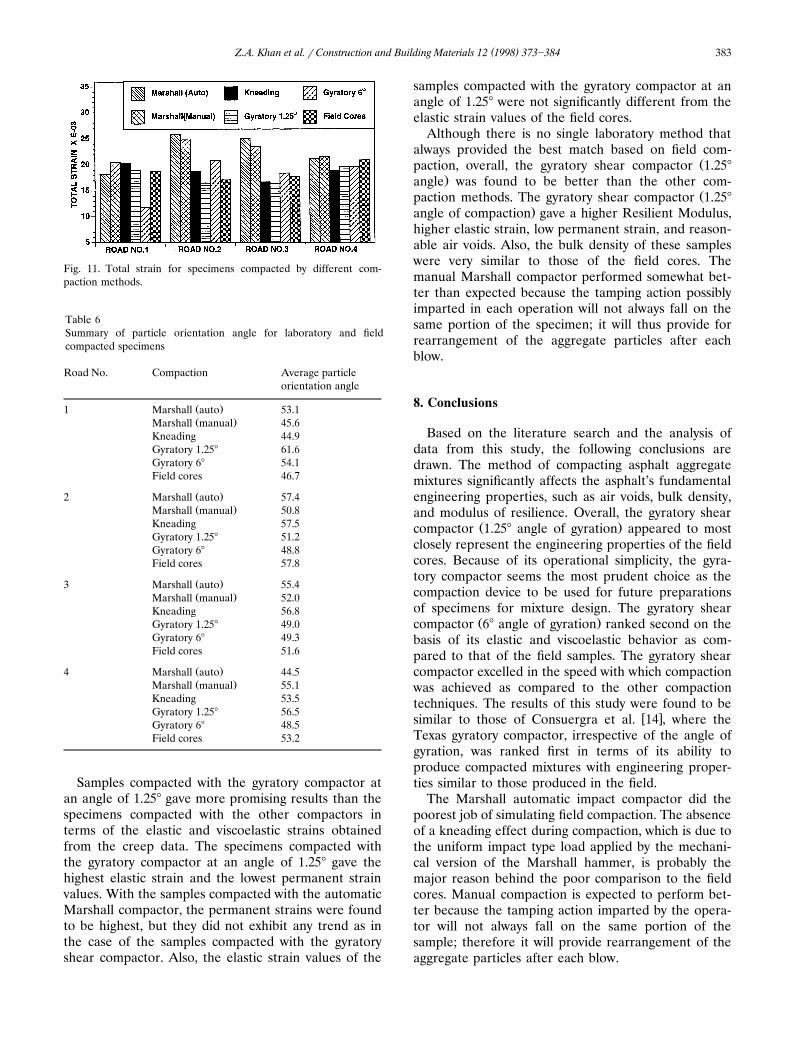
Fig. 11. Total strain for specimens compacted by different com-paction methods.
Table 6Summary of particle orientation angle for laboratory and fieldcompacted specimens
Road No. Compaction Average particleorientation angle
Ž .1 Marshall auto 53.1Ž .Marshall manual 45.6
Kneading 44.9Gyratory 1.258 61.6Gyratory 68 54.1Field cores 46.7
Ž .2 Marshall auto 57.4Ž .Marshall manual 50.8
Kneading 57.5Gyratory 1.258 51.2Gyratory 68 48.8Field cores 57.8
Ž .3 Marshall auto 55.4Ž .Marshall manual 52.0
Kneading 56.8Gyratory 1.258 49.0Gyratory 68 49.3Field cores 51.6
Ž .4 Marshall auto 44.5Ž .Marshall manual 55.1
Kneading 53.5Gyratory 1.258 56.5Gyratory 68 48.5Field cores 53.2
Samples compacted with the gyratory compactor atan angle of 1.258 gave more promising results than thespecimens compacted with the other compactors interms of the elastic and viscoelastic strains obtainedfrom the creep data. The specimens compacted withthe gyratory compactor at an angle of 1.258 gave thehighest elastic strain and the lowest permanent strainvalues. With the samples compacted with the automaticMarshall compactor, the permanent strains were foundto be highest, but they did not exhibit any trend as inthe case of the samples compacted with the gyratoryshear compactor. Also, the elastic strain values of the
samples compacted with the gyratory compactor at anangle of 1.258 were not significantly different from theelastic strain values of the field cores.
Although there is no single laboratory method thatalways provided the best match based on field com-
Žpaction, overall, the gyratory shear compactor 1.258.angle was found to be better than the other com-
Žpaction methods. The gyratory shear compactor 1.258.angle of compaction gave a higher Resilient Modulus,
higher elastic strain, low permanent strain, and reason-able air voids. Also, the bulk density of these sampleswere very similar to those of the field cores. Themanual Marshall compactor performed somewhat bet-ter than expected because the tamping action possiblyimparted in each operation will not always fall on thesame portion of the specimen; it will thus provide forrearrangement of the aggregate particles after eachblow.
8. Conclusions
Based on the literature search and the analysis ofdata from this study, the following conclusions aredrawn. The method of compacting asphalt aggregatemixtures significantly affects the asphalt’s fundamentalengineering properties, such as air voids, bulk density,and modulus of resilience. Overall, the gyratory shear
Ž .compactor 1.258 angle of gyration appeared to mostclosely represent the engineering properties of the fieldcores. Because of its operational simplicity, the gyra-tory compactor seems the most prudent choice as thecompaction device to be used for future preparationsof specimens for mixture design. The gyratory shear
Ž .compactor 68 angle of gyration ranked second on thebasis of its elastic and viscoelastic behavior as com-pared to that of the field samples. The gyratory shearcompactor excelled in the speed with which compactionwas achieved as compared to the other compactiontechniques. The results of this study were found to be
w xsimilar to those of Consuergra et al. 14 , where theTexas gyratory compactor, irrespective of the angle ofgyration, was ranked first in terms of its ability toproduce compacted mixtures with engineering proper-ties similar to those produced in the field.
The Marshall automatic impact compactor did thepoorest job of simulating field compaction. The absenceof a kneading effect during compaction, which is due tothe uniform impact type load applied by the mechani-cal version of the Marshall hammer, is probably themajor reason behind the poor comparison to the fieldcores. Manual compaction is expected to perform bet-ter because the tamping action imparted by the opera-tor will not always fall on the same portion of thesample; therefore it will provide rearrangement of theaggregate particles after each blow.
( )Z.A. Khan et al. r Construction and Building Materials 12 1998 373]384384
The California kneading compactor also closelysimulated field compaction based on the air voids ofthe compacted mix. Furthermore, the California knead-ing compactor is the only device that is capable offabricating any size of cylindrical or rectangular beamssuch as those used in beam fatigue testing. This flex-ibility makes the California kneading compactor alsoan appealing choice for compaction purposes.
This comparison of laboratory and field compactionis based on samples cored from the field without trafficdensificaton. Thus, a final analysis of the ability oflaboratory compaction to duplicate in situ conditionsmust await further testing by extracting cores from thesame field pavement section at a later date and evaluat-ing them.
Acknowledgements
The authors acknowledge the support provided bythe Research Institute and the Department of CivilEngineering, King Fahd University of Petroleum andMinerals.
References
w x1 Goetz WH. The evolution of asphalt concrete mix design.ASTM STP 1041, 1989.
w x2 Linden F, Van Der Heiden J. Some aspect of the compactionof asphalt mix and its influence on mix properties. Proc AssocAsphalt Paving Technol 1989;58:571]623.
w x3 Kumar A, Goetz WH. The gyratory testing machine a designtool and an instrument for bituminous mixture evaluation. ProcAssoc Asphalt Paving Technol 1974;43:350]371.
w x4 National Center Of Asphalt Technology. Introduction to theSHRP SUPERPAVE system level 1 mixture design. LectureNotes, November, 1993.
w x5 Linden RN, Mahoney JP, Jackson NC. Effect of compaction onasphalt concrete performance. Transportation research recordNo. 1217. Washington, DC: Transportation Research Board,National Research Council, 1992:20]28.
w x6 Powel WD, Lister NW. Compaction of bituminous materials.
In: Pell PS, editor. Developments in highway pavement engi-neering } 1, London: Applied Science Publishers,1978:127]162.
w x7 Scherocman JA, Acott M. Hot mix asphalt production, place-ment, and compaction related to pavement performance. ProcAssoc Asphalt Paving Technol 1989;58:571]623.
w x8 Sousa JB, Deacon JA, Monismith CL. Effect of the laboratorycompaction method on permanent deformation characteristicsof asphalt aggregate mixtures.. Proc Assoc Asphalt PavingTechnol 1991;60:533]585.
w x9 George KP. Resilient testing of soils using gyratory testingmachine. Transportation research record No. 1369. Washing-ton, DC: Transportation Research Board, National ResearchCouncil, 1994:63]72.
w x10 ASTM. Compaction and shear properties of bituminous mix-tures by means of US corps of engineers gyratory testingmachine. ASTM D 3387, ASTM Part 15, 1982.
w x11 Sigurjonsson S, Ruth B. Use of gyratory testing machine toevaluate shear resistance of asphalt paving mixture.Transportation research record No. 1259. Washington, DC:Transportation Research Board, National Research Council,1992:63]72.
w x12 SHRP. The SUPERPAVE mix design system, manual of speci-fications, test methods, and practices. In: Harrigan ET, editor.Washington, DC: National Research Council, 1994.
w x13 Anderson RM. SUPERPAVE level 1 mixture design example.Lexington: Asphalt Institute, 1993.
w x14 Consuergra A, Little DN, Quintus HV, Burati J. Comparativeevaluation of laboratory compaction devices based on theirability to produce mixtures with engineering properties similarto those produced in the field. Transportation research recordNo. 1228. Washington, DC: Transportation Research Board,National Research Council, 1992:80]87.
w x15 Busching HW, Goetz WH. Use of gyratory testing machine inevaluating bituminous mixtures. Highway research record 51.Washington, DC: HRB National Research Council, 1964:1]43.
w x16 Development of gyratory Texas machine and procedures fortesting bituminous mixtures. Technical report 3595. Vicksburg,MS: US Army Engineers, Waterways Experiment Station, 1962.
w x17 Van de Loo PJ. The creep test: a key tool in asphalt mix designand in the prediction of pavement rutting. Proc Assoc AsphaltPaving Technol 1978;47:522]557.
w x18 Al-Abdul Wahab HI, Ramadhan RH. Manifestation of tem-perature variation of flexible and rigid pavements in Dhahranin Saudi Arabia. Fourth Saudi Engineering Conference JeddahSaudi Arabia, July 1995.