compaction of embankments^ subgrades^ and bases
TRANSCRIPT
HIGHWAY R E S E A R C H BOARD
Bulletin 58
Compaction of Embankments^ Subgrades^
and Bases
kGADEMY
R £ $ £ A R C H
Ncitioncii Accsdemy of Sciences—
Nationol Research Council publication 240
H I G H W A Y R E S E A R C H B O A R D 1952
R . H . BALDOCK, Chairman W . H . ROOT, Vice Chairman FRED BURGGRAF, Director
Executive Committee
THOMAS H . MACDONALD, Commissioner, Bureau of Public Roads
H A L H . H A L E , Executive Secretary, American Association of State Highway Officials
LOUIS JORDAN, Executive Secretary, Division of Engineering and Industrial Research, National Research Council
R . H . BALDOCK, State Highway Engineer, Oregon State Highway Commission
W . H . ROOT, Maintenance Engineer, Iowa State Highway Commission
H . P . BiGLER, Former Executive Vice President, Connors Steel Company
P Y K E JOHNSON, President, Automotive Safety Foundation
G . DONALD KENNEDY, Consulting Engineer and Assistant to President, Portland Cement Association
BURTON W . MARSH, Director, Safety and Traffic Engineering Department, American Automobile Association
R . A. MOVER, Research Engineer, Institute of Transportation and Traffic Engineering, University of California
F . V . REAGEL, Engineer of Materials, Missouri State Highway Department
Editorial Staff
FRED BURGGRAF W . N . CAREY, JR. W . J . M I L L E R
2101 Constitution Avenue, Washington 25, D . C.
The opinions and conrlu.sions expressed in this publication are those of the authors and not necessai'ily those of the Hi^hwiiy Research Board.
HIGHWAY R E S E A R C H BOARD
Bulletin 58
Compaction of Embankments^ Suhgrades^
and Bases
1952 Washington, D. C.
DEPARTMENT OF SOILS
Harold Allen, Chairman; Principal Highway Engineer
Bureau of Public Roads
COMMITTEE ON COMPACTION OF SUBGRADES AND EMBANKMENTS
L. D. Hicks, Chairman; North Carolina State Highway and Public Works Commission
W. F. Abercrombie, Engineer of Materials and Tests, Georgia Department of Highways
C. W. Allen, Research Engineer, Ohio Department of Highways W. H. Campen, Director, Omaha Testing Laboratories C. A. Hogentogler J r . , Chevy Chase, Maryland T. A. Middlebrooks, Chief, Soil Mechanics Branch, Office Chief of
Engineers W. H. Mills, District Engineer, Asphalt Institute, Atlanta O. J . Porter, Consulting Engineer, Newark, New Jersey T. B. Pringle, Chief, Roads and Airfields Section, Office, Chief of
Engineers C. R. Reid, Los Angeles, California L. J . Ritter, Professor of Civil Engineering, New York University J. R. Schuyler, Principal Engineer (Soils), New Jersey State Highway
Department T. E. Shelbume, Director of Research, Virginia Council of Highway
Investigation and Research S. E . Sime, Supervising Design Engineer, Bureau of Public Roads,
Kansas City W. T. Spencer, Soils Engineer, Indiana State Highway Commission
iv
Preface
• THE ORIGINAL Wartime Road Problems No. 11 "Compaction of Subgrades and Embankments" was published in August 1945 during World War n . It presented information on the mechanics of compaction, on moisture-density relationships, soil classification, suitability of soils for embankments, methods for controlling moisture content and density during compaction, and maximum limiting slopes for embankment construction. It also presented a review of practices current in 1945 and gave a list of selected references on compaction and allied subject matter.
During and following the war, highways were subjected to a larger number of heavier wheel loads than prior to the publication of Wartime Road Problems No. 11. That increase in heavy vehicles has emphasized the need for compaction of subgrades and bases for pavements. Also, since that time more information has been developed on the amount of compaction needed in highway and airport subgrades and bases and the relative permanence of moisture content and density. Recent data are available from carefully controlled e}Q>eriments in field rolling which throw some light on the practicable limits of field compaction for different types and weights of equipment Some in vestigations have been completed and others are in progress to determine the feasibility of using vibration as a means of compacting soils, especially soils of a granular nature.
During the war, attention was given to the use of sheepsfoot rollers having high tamping-foot contact pressures. Also, efforts were made to use heavy pneumatic-tire wheel loads for compacting subgrades and bases on some airfields. The result of some of those efforts has been a trend toward the manufacture of heavier compaction equipment, both in the sheepsfoot and rubber-tired types on the premise that they offer possibilities for greater densities or con4>action to greater depths.
This bulletin is the result of efforts by the Committee to list practices pertaining to compaction equipment and its use and specifications which govern compaction of embankments, subgrade soils, and bases. In addition, this bulletin attempts to present latest developments in the technology of soil compaction with special reference to the use of equipment heavier than that discussed in Wartime Road Problems No. 11.
Contents PREFACE V DEFINITIONS OF TERMS 1 FUNDAMENTALS OF COMPACTION 2
Factors Influencing Density, 2 Influence of Soil Moisture Content, 2 Influence of Soil Type, 2 Influence of Compactive Effort, 4 Other Factors Which Influence Soil Density, 5
INFLUENCE OF DENSIFICATION ON PHYSICAL PROPERTIES OF SOILS 6 FACTORS INFLUENCING PERMANENCE OF DENSIFICATION 9 DEGREE OF DENSIFICATION NEEDED 10
Embankments, 10 Subgrades, Subbases and Bases, 12 Practicable Limits of Densification, 13 Correlation of Need, Practicable Densification Limits and Permanence, 17
Embankments, 18 Subgrade Materials and Bases, 18 Shoulder Materials, 21
METHODS OF SPECIFYING COMPACTION REQUIREMENTS 21 Control of Density, 21 Control of Compactive Effort, 22
SELECTION AND USE OF EQUIPMENT 23 Ehimping and Spreading, 23 Adding Water to Soil, 25 Handling Excessively Wet Soil, 25 Sheepsfoot-Type Rollers, 25
Methods of Rolling, 27 Smooth-Wheel Power Rollers, 29 Pneumatic-Tire Rollers, 32 Roller Performance on Different Types of Soil, 33
NEW TYPES OF COMPACTION EQUIPMENT 34 Pneumatic-Tire Compactor with Vibratory Unit, 34 Heavy Pneumatic-Tire Rollers, 34 Grid-Type Steel-Wheel Rollers, 36 Three-Wheel Type with Scalloped Ribs on Rolls, 36 Tandem Type with Segmented Front Roll, 36 Tandem Type with Vibratory Intermediate Roll, 36 Vibrating-Base Compactors, 36 Tampers, 36
FIELD CONTROL OF COMPACTION 38 Moisture Content and Density Control, 38
Inspection and Test Methods, 38 Examination Methods, 39 Proctor Penetration Needle, 39 Drying to Constant Weight, 40 In-Place Density Measurement, 41 Moisture-Density Relationship, 42 Correcting for Coarse-Aggregate Content, 46
vi i
CURRENT PRACTICES IN COMPACTION METHODS AND EQUIPMENT 50 Li f t Thickness in Embankment Construction, 51 Control of Compaction, 51
Embankments, 51 Subgrades, 51 Bases, 51
Cost of Compaction, 51 Methods of Testing, 55 Backfilling of Trenches, Pipe Culverts and Sewers, 55 Group A - Compaction Without Density Control, 58
Tamping Methods and Equipment, 58 Li f t Thickness, 58 Moisture Control, 59 Materials Requirements, 59 Provision for Saturating, Flooding or Puddling, 59
Group B - Compaction With Density Control, 59 Density Requirements, 59 Li f t Thickness, 62 Moisture Control, 63 Materials Reqmrements, 63 Provision for Saturating, Flooding or Puddling, 63
Statement of Requirements for Backfilling Sewers, 63 Backfilling Structural Excavation, 66
Li f t Thickness, 67 Compaction, 67
COMPACTION EQUIPMENT 67 Sheepsfoot-Type Rollers, 67
Contact Area of Tamper Feet, 67 Contact Pressure, 67 Pneumatic-Tire Rollers, 76 Smooth-Wheeled Power Rollers, 76 Granular-Base Compaction, 76 Smooth-Wheel Power Rollers, 76
APPENDIX: MANUFACTURERS' SPECIFICATIONS 78
v i i i
Compaction of Embankments, Subgrades, and Bases
• THIS BULLETIN discusses fundamentals of compaction, the purpose for which the compaction is intended, and the amount needed for various soils in different parts of the road structure in the light of how compaction is affected by climatic, load, and road conditions. From those considerations, suggestions are made on recommended practice for compacting embankments, subgrades, and granular bases and for the control of compaction.
Soils work for highways maybe classified broadly into four categories: (1) selection of soil as to quality; (2) prediction and control of behavior of soil under load; (3) protection of soils against effects of climate; and (4) improvement of bearing value of soil by drainage, incorporation of admixtures, or compaction.
There is no other single treatment which can be applied to natural soils which produces so marked a change in their physical properties at so low a cost as does compaction, when it is controlled to meet the desired needs. The bearing value of some soils may be increased several times by increase in density of the order 3 to 5 pcf. Because compaction has great influence on the manner in which soils behave, i t is worthwhile presenting not only a discussion of factors which influence compaction and how compaction is obtained but also how it influences the nature of soils and how it is affected once it is obtained. The committee believes this broad perspective of compaction is necessary if it is to be used to the fullest advantage in the preparation of embankments, subgrade materials and bases for pavements.
DEFINITIONS OF TERMS I
The terms embankment, embankment foundation, subgrade materials, bases, and subbases, as used here, comply with the definitions set forth in Standard Definitions of Terms Relating to Subgrade, Soil
Aggregate, and F i l l Materials, AASHO Designation: M 146-49, except as noted.
Settlement of Embankment. Decrease in elevation of the surface of an embankment due to consolidation of the soil in the embankment due to its own weight and the effect of traffic, over a period of time following construction.
Subsidence of Embankment. Decrease in the elevation of the surface of an embankment due to consolidation or displacement of the foundation soil over a period of time during or following construction.
Embankment Foundation. The material on which an embankment is placed.
Embankment (Fill). A raised structure of soil, soil-aggregate, or rock.
Subgrade Material (Basement Soil). The material in excavation (cuts), em-bankment (fills), and embankment foundations immediately below the f i rs t layer of subbase, base, or pavement and to such depth as may affect the structural design.
Subbase. Specified or selected material of planned thickness placed as a foundation for a base.
Base. Specified or selected material of planned thickness placed as foundation for a pavement.
Compaction. The practice of a r t i f i cially densifying and incorporating definite density into the soil mass by rolling, tamping, or other means.
Consolidation. The decrease in the volume of voids, or the increase in density, for the most part inelastic, which is caused by the stresses imposed in the supporting soils by permanent foundation loads, or by the repeated passage of highway or airplane traffic under actual service conditions. (P)
Bearing Value. The unit load JSj for a specified amount of settlement (A) and a specified loaded area (A).
Bearing Capacity. That unit pressure greater than which progressive settlement wil l occur leading to failure.
1051
95
.90
85
80
-Modlfiet \
AASilO
. J /
A" -lorido So
_ - • \ ^ \ \ Id
\ -AASH -AASH X Method siano Clay
\ ,
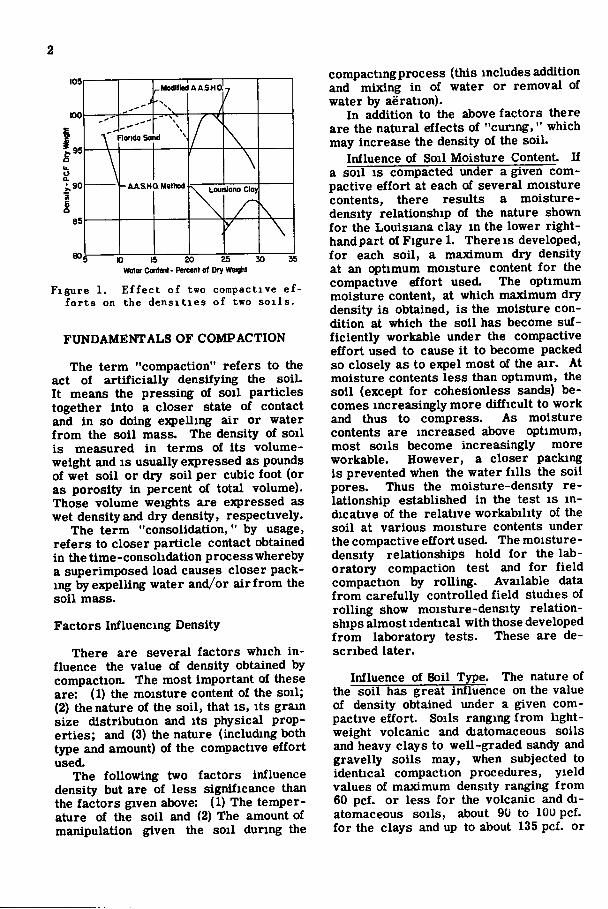
water Content- Percent of Dry Weigtit Figure 1. E f f e c t of two compactive ef
for t s on the dens i t i e s of two s o i l s .
FUNDAMENTALS OF COMPACTION
The term "compaction" refers to the act of artificially densifying the soil. It means the pressing of soil particles together into a closer state of contact and in so doing e}q>elling air or water from the soil mass. The density of soil is measured in terms of its volume-weight and is usually expressed as pounds of wet soil or dry soil per cubic foot (or as porosity in percent of total volume). Those volume weights are expressed as wet density and dry density, respectively.
The term "consolidation," by usage, refers to closer particle contact obtained in the time-consolidation process whereby a superimposed load causes closer packing by expelling water and/or air from the soil mass.
Factors Influencing Density
There are several factors which influence the value of density obtained by compaction. The most important of these are: (1) the moisture content of the soil; (2) the nature of the soil, that is, its grain size distribution and its physical properties; and (3) the nature (including both type and amount) of the compactive effort used.
The following two factors influence density but are of less significance than the factors given above: (1) The temperature of the soil and (2) The amount of manipulation given the soil during the
compactingprocess (this includes addition and mixing in of water or removal of water by aeration).
In addition to the above factors there are the natural effects of "curing," which may increase the density of the soil.
Influence of Soil Moisture Content If a soil IS compacted under a given compactive effort at each of several moisture contents, there results a moisture-density relationship of the nature shown for the Louisiana clay m the lower right-hand part of Figure 1. There is developed, for each soil, a maximum dry density at an optimum moisture content for the compactive effort used. The optimum moisture content, at which maximum dry density is obtained, is the moisture condition at which the soil has become sufficiently workable under the compactive effort used to cause it to become packed so closely as to expel most of the air. At moisture contents less than optimum, the soil (except for cohesionless sands) becomes increasingly more difficult to work and thus to compress. As moisture contents are increased above optimum, most soils become increasingly more workable. However, a closer packing is prevented when the water f i l l s the soil pores. Thus the moisture-density relationship established in the test is indicative of the relative workability of the soil at various moisture contents under the compactive effort used. The moisture-density relationships hold for the laboratory compaction test and for field compaction by rolling. Available data from carefully controlled field studies of rolling show moisture-density relationships almost identical with those developed from laboratory tests. These are described later.
Influence of Soil Type. The nature of the soil has great influence on the value of density obtained under a given compactive effort. Soils ranging from lightweight volcanic and diatomaceous soils and heavy clays to well-graded sandy and gravelly soils may, when subjected to identical compaction procedures, yield values of maximum density ranging from 60 pcf. or less for the volcanic and diatomaceous soils, about 9U to lOU pcf. for the clays and up to about 135 pcf. or
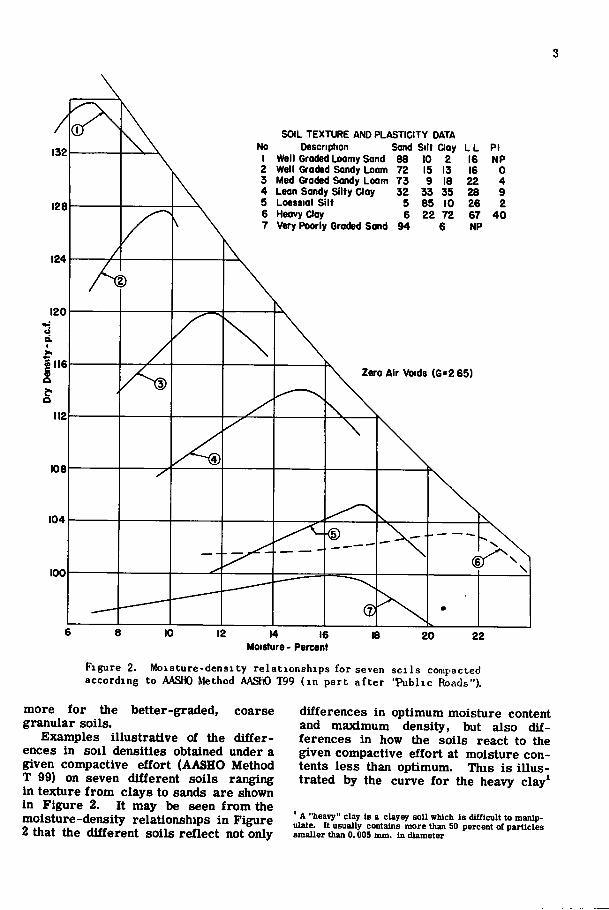
SOIL TEXTURE AND PLASTICITY DATA No Description Sand Silt Qay L L PI
1 Well Graded Loomy Sand 88 10 2 16 NP 2 Well Graded Sandy Loom 72 15 13 16 0 3 Med Graded Sandy Loam 73 9 18 22 4 4 Lean Sandy Silty Clay 32 33 35 28 9 5 Loessial Silt 5 85 10 26 2 6 Heovy Cloy 6 22 72 67 40 7 Very Poorly Graded Sand 94 6 NP
Zero Air Voids (G0265)
10 12 14 16 Moisture - Percent
20 22
Figure 2. Moisture-density relationships for seven s c i l s compacted according to AASHO Method AASHO T99 ( in part after 'Public Roads").
more for the better-graded, coarse granular soils.
Examples illustrative of the differences in soil densities obtained under a given compactive effort (AASHO Method T 99) on seven different soils ranging in texture from clays to sands are shown in Figure 2. It may be seen from the moisture-density relationships in Figure 2 that the different soils reflect not only
differences in optimum moisture content and maximum density, but also differences in how the soils react to the given compactive effort at moisture contents less than optimum. This is illustrated by the curve for the heavy clay'
' A "heavy" clay Is a clayey soil which is difficult to manipulate. It usually contains more than 50 percent of parUcles smaller than 0.005 mm. in diameter
tit -3
' no
90i es
a a
Stona y
i a a
. • . i a a r o
1—
Dry D m Solkto
tty of ne MIxtu •
' - ^ — i
X
Dry Oenfl ity of S< II Mortar
•
0 e 20 90 40 so 60 Pareatitoga of Stone in Dry Soil-stona Hliture
CI 20
80,
Soil Mo 29% 1".
•to • ^ j^Slona
\ ^
1 1 Soil Mortar Only
• Saturotio n'Llna
• Soil Mortar « 90%
i-.J-st*,. 1 9 10 19 20 2 9 30 39
Mototura Content of Soil Mortar . % of Dry Soil
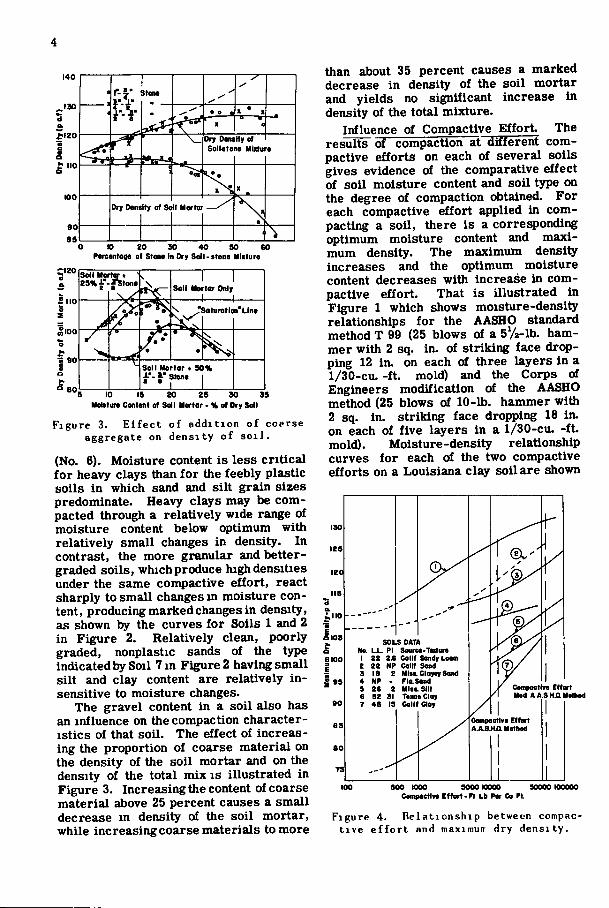
Figure 3. E l f e c t of addition of coerse aggregate on density of s o i l .
(No. 6). Moisture content is less critical for heavy clays than for the feebly plastic soils in which sand and silt grain sizes predominate. Heavy clays may be compacted through a relatively wide range of moisture content below optimum with relatively small changes in density. In contrast, the more granular and better-graded soils, whichproduce high densities under the same compactive effort, react sharply to small changes m moisture content, producing marked changes in density, as shown by the curves for Soils 1 and 2 in Figure 2. Relatively clean, poorly graded, nonplastic sands of the type indicated by Soil 7 in Figure 2 having small silt and clay content are relatively insensitive to moisture changes.
The gravel content in a soil also has an influence on the compaction characteristics of that soil. The effect of increasing the proportion of coarse material on the density of the soil mortar and on the density of the total mix is illustrated in Figure 3. Increasing the content of coarse material above 25 percent causes a small decrease in density of the soil mortar, while increasing coarse materials to more
than about 35 percent causes a marked decrease in density of the soil mortar and yields no significant increase in density of the total mixture.
Influence of Compactive Effor t The results of compaction at different compactive efforts on each of several soils gives evidence of the comparative effect of soil moisture content and soil t3rpe on the degree of compaction obtained. For each compactive effort applied m compacting a soil, there is a corresponding optimum moisture content and maximum density. The maximum density increases and the optimum moisture content decreases with increase m compactive effort. That is illustrated in Figure 1 which shows moisture-density relationships for the AASHO standard method T 99 (25 blows of a 5y2-lb. hammer with 2 sq. in. of striking face dropping 12 in. on each of three layers in a 1/30-cu. - f t . mold) and the Corps of Engineers modification of the AASHO method (25 blows of 10-lb. hammer with 2 sq. In. striking face dropping 18 in. on each of five layers in a 1/30-cu. - f t . mold). Moisture-density relationship curves for each of the two compactive efforts on a Louisiana clay soil are shown
190
1251
tiio SIOS I
r \ 99
90
89
80
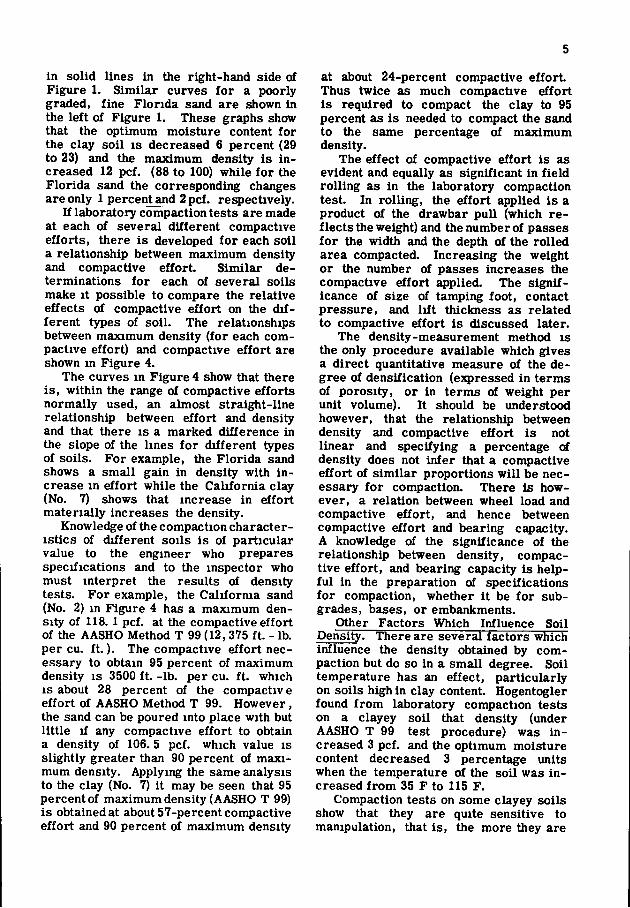
SOILS DATA Na L i - PI Souree-TMim 1 22 2« Calif Sandy Loom 2 22 NP Com Sand 3 18 2 M l u Clam Sand 4 NP - FlaSond 9 26 2 Mil l . Silt 6 82 91 TwoaCloy 7 49 19 Calif Cloy
Compoctln Effort AJk.SHjai Mathod
Compoctin Effort
100 900 1000 9000ICOOO 50000 100000 Compaetln Effort-Ft Lb Par Co Ft
Figure 4. ne lat ionship between compact ive e f f o r t and tnaximun- dry density.
in solid lines in the right-hand side of Figure 1. Similar curves for a poorly graded, fine Florida sand are shown in the left of Figure 1. These graphs show that the optimum moisture content for the clay soil is decreased 6 percent (29 to 23) and the maximum density is increased 12 pcf. (88 to 100) while for the Florida sand the corresponding changes are only 1 percent and 2 pcf. respectively.
If laboratory compaction tests are made at each of several different compactive efforts, there is developed for each soil a relationship between maximum density and compactive effort. Similar determinations for each of several soils make it possible to compare the relative effects of compactive effort on the different types of soil. The relationships between maximum density (for each compactive effort) and compactive effort are shown in Figure 4.
The curves in Figure 4 show that there is, within the range of compactive efforts normally used, an almost straight-line relationship between effort and density and that there is a marked difference in the slope of the lines for different types of soils. For example, the Florida sand shows a small gain in density with increase m effort while the California clay (No. 7) shows that increase in effort materially increases the density.
Knowledge of the compaction characteristics of different soils is of particular value to the engineer who prepares specifications and to the inspector who must interpret the results of density tests. For example, the California sand (No. 2) in Figure 4 has a maximum density of 118. 1 pcf. at the compactive effort of the AASHO Method T 99 (12,375 f t . - lb. per cu. f t . ) . The compactive effort necessary to obtain 95 percent of maximum density is 3500 f t . -lb. per cu. f t . which is about 28 percent of the compactive effort of AASHO Method T 99. However, the sand can be poured into place with but little if any compactive effort to obtain a density of 106. 5 pcf. which value is slightly greater than 90 percent of maximum density. Applying the same analysis to the clay (No. 7) i t may be seen that 95 percent of maximum density (AASHO T 99) is obtained at about 57-percent compactive effort and 90 percent of maximum density
at about 24-percent compactive effort. Thus twice as much compactive effort is required to compact the clay to 95 percent as is needed to compact the sand to the same percentage of maximum density.
The effect of compactive effort is as evident and equally as significant in field rolling as in the laboratory compaction test. In rolling, the effort applied is a product of the drawbar pull (which reflects the weight) and the number of passes for the width and the depth of the rolled area compacted. Increasing the weight or the number of passes increases the compactive effort applied. The significance of size of tamping foot, contact pressure, and l i f t thickness as related to compactive effort is discussed later.
The density-measurement method is the only procedure available which gives a direct quantitative measure of the degree of densification (e^ressed in terms of porosity, or in terms of weight per unit volume). It should be understood however, that the relationship between density and compactive effort is not linear and specifying a percentage of density does not infer that a compactive effort of similar proportions wi l l be necessary for compaction. There is however, a relation between wheel load and compactive effort, and hence between compactive effort and bearing capacity. A knowledge of the significance of the relationship between density, compactive effort, and bearing capacity is helpful in the preparation of specifications for compaction, whether i t be for sub-grades, bases, or embankments.
Other Factors Which Influence Soil Density. There are several factors which influence the density obtained by compaction but do so in a small degree. Soil temperature has an effect, particularly on soils high in clay content. Hogentogler found from laboratory compaction tests on a clayey soil that density (under AASHO T 99 test procedure) was increased 3 pcf. and the optimum moisture content decreased 3 percentage units when the temperature of the soil was increased from 35 F to 115 F.
Compaction tests on some clayey soils show that they are quite sensitive to manipulation, that is, the more they are
ILDFhMOptVa 4 0 ^ l A » I L L o o 4
a C w m g M I
IITFMdOplWCL eojOooiA wkMi uod
ISOntMOMWC 1,900 WOBUt m M
40JOOOU
IISFtaMOpt wc 4 S 0 » a l a n n t a o l
Cont R i p m n t t Lofteratari otFMM
ILi FhM Opt WC t M p f . l S b M p a l M I
r u F i i M Opt wc 0>M,900L6 Tractor
s
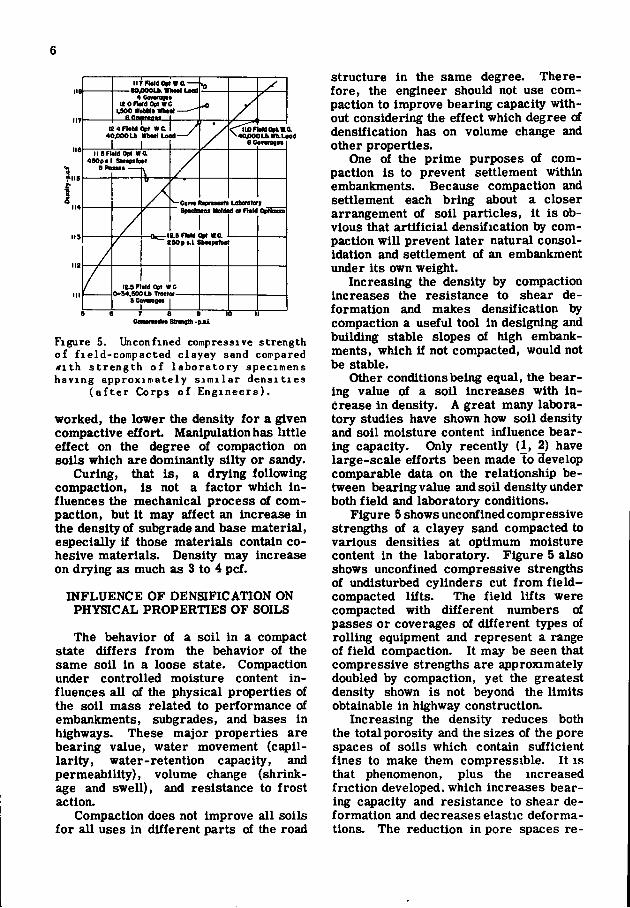
Figure 5. Unconfined compressive strength of field-compacted clayey sand con'pared # i th s trength of laboratory specimens having approximately s i m i l a r d e n s i t i e s
( a f t e r Corps of E n g i n e e r s ) .
worked, the lower the density for a given compactive effort. Manipulation has little effect on the degree of compaction on soils which are dominantly silty or sandy.
Curing, that is, a drying following compaction, is not a factor which influences the mechanical process cf compaction, but it may affect an increase in the density of subgrade and base material, especially if those materials contain cohesive materials. Density may increase on drying as much as 3 to 4 pcf.
INFLUENCE OF DENSIFICATION ON PHYSICAL PROPERTIES OF SOILS
The behavior of a soil in a compact state differs from the behavior of the same soil in a loose state. Compaction under controlled moisture content influences all of the physical properties of the soil mass related to performance of embankments, subgrades, and bases in highways. These major properties are bearing value, water movement (capillarity, water-retention capacity, and permeability), volume change (shrinkage and swell), and resistance to frost action.
Compaction does not improve all soils for all uses in different parts of the road
structure in the same degree. Therefore, the engineer should not use compaction to Improve bearing capacity without considering the effect which degree of densification has on volume change and other properties.
One of the prime purposes of compaction is to prevent settlement within embankments. Because compaction and settlement each bring about a closer arrangement of soil particles, i t is obvious that artificial densification by compaction wil l prevent later natural consolidation and settlement of an embankment under its own weight.
Increasing the density by compaction increases the resistance to shear deformation and makes densification by compaction a useful tool in designing and building stable slopes of high embankments, which if not compacted, would not be stable.
Other conditions being equal, the bearing value of a soil increases with increase in density. A great many laboratory studies have shown how soil density and soil moisture content influence bearing capacity. Only recently (1, 2) have large-scale efforts been made to develop comparable data on the relationship between bearing value and soil density under both field and laboratory conditions.
Figure 5 shows unconfined compressive strengths of a clayey sand compacted to various densities at optimum moisture content in the laboratory. Figure 5 also shows unconfined compressive strengths of undisturbed cylinders cut from f i e ld -compacted lifts. The field l i f ts were compacted with different numbers of passes or coverages of different types of rolling equipment and represent a range of field compaction. It may be seen that compressive strengths are approximately doubled by compaction, yet the greatest density shown is not beyond the limits obtainable in highway construction.
Increasing the density reduces both the total porosity and the sizes of the pore spaces of soils which contain sufficient fines to make them compressible. It is that phenomenon, plus the increased friction developed, which increases bearing capacity and resistance to shear deformation and decreases elastic deformations. The reduction in pore spaces re-
ISO
^125
1100 £
75
50
25
0
140
135
130
i .S l25 >> •8 120
o 115 I'
i ia
1 1
V
* *
5 10 15 Water content in percent dry weight
Molding \M)ter Content vs. Density ond CBR
0 • a-A -
Layers 5 5 5
Blows per layer 55 26 12
LEGEND Weight
hammer 10 lb. 10 Ibi 10 lb
Drop in inches
18 (Mod AASHO effort) 18 l8(Equiv.std AASHO effort)
NOTES' Specimens compacted in 60in.dia.mold Tested as molded
Figure beside curve is molding water content
e 125
115 120 125 130 Molded dry density in lbs. per cu. ft.
Density vs. CBR
,126 1 1 1 1 Figure beside curve is
\ , m >lded dry density
124 128 Note X point
A h t n i n a H f p m s m —
_ I 2 2 \\ \ center plot
s m —
_ I 2 2
\\. \ \ X \ 120
>
>
5 6 7 8 9 10 II 12 Molding water content in percent dry weight
Water Content vs. CBR
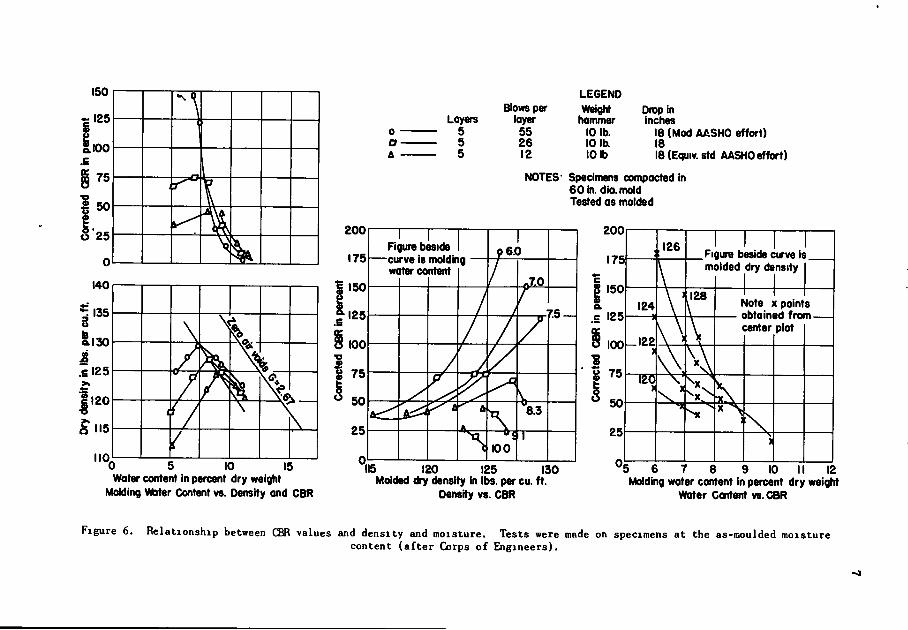
Figure 6. Relationsliip between CBR values and density and moisture. Tests were made on specimens at the as-moulded moisture content (af ter Corps of Engineers).
8
duces permeability, thus restricting percolation of water. When compaction is accomplished with proper moisture control for the particular soil, i t restricts capillary movements, making the soil less susceptible to increase in moisture by absorption, and thus restricts changes in bearing capacity.
The importance of reducing the porosity in finely grained soils and its relation to bearing capacity may be seen by comparing porosities with the porosity at the plastic l im i t The plastic l imit is a critical moisture content affecting the bearing capacity of fine-grain soils which are characterized by becoming plastic when wet. At or slightly above the plastic limit, small increases In load yield large increases in deformation. It is practically possible to compact nearly all soils to densities having porosities less than the porosity at the plastic limit. Compactive efforts equal to 100 percent or more of standard (AASHO Method T 99) may be required to reduce the porosity below that which holds for the plastic limit for very heavy clays. That may not be desirable for subgrades for high-sweUing clay soils. Volume change (shrink and swell) is an important soil property which affects the behavior of subgrade materials. Soils which exhibit volume change may swell nonuniformly on absorbing water and suffer a reduction in bearing capacity. In swelling they may become the cause of rough riding pavements. They may also shrink nonuniformly and cause uneven settlement and contribute to fractures In pavements.
Compaction has a marked influence on the volume change of clay soils. Density influences volume change, the greater the density the greater the potential swell, unless the soil is restrained by force. An expansive clay soil should be compacted at a water content and to a density at which swelling wil l be a minimum. Likewise, i t should be compacted so shrinkage wil l be a minimum. Although the two conditions may not be the same, a soil exhibiting volume change can be compacted at a moisture content to a density where both swell and shrink wi l l be near a minimum for any given condition of exposure.
Many investigations have been made.
both in the field and in the laboratory, to determine the desirable range of moisture-density control to hold volume change to a minimum. The work of Allen and Johnson (3), McDowell (4), Russell (5), and the Corps of Engineers (6) is indicative of the nature of work done.
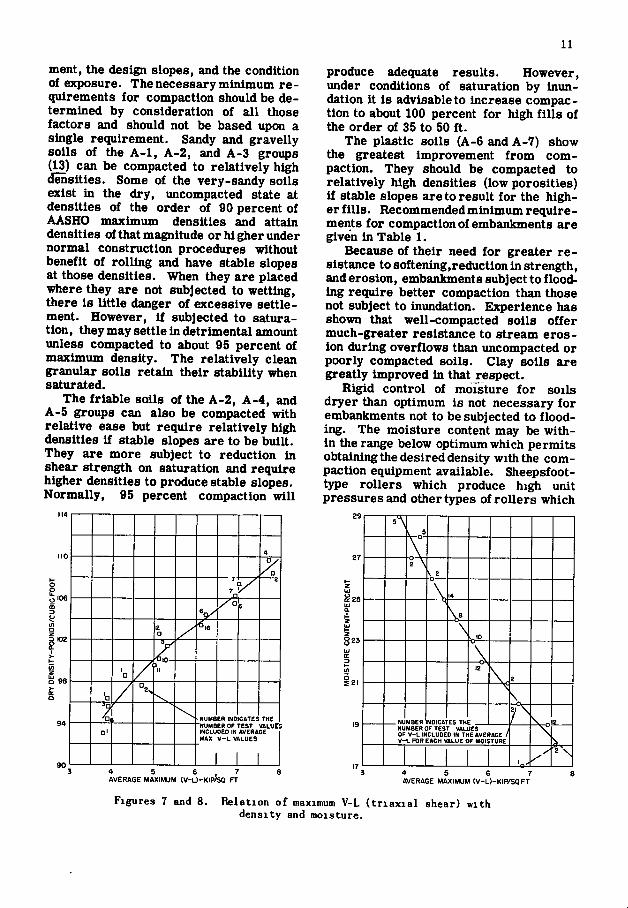
Swell or shrinkage and its relation to initial density and moisture content is easily determined by direct swell and shrinkage tests. Normal soils (not including micaceous, diatomaceous, and other soils having certain constituents) show a good relationship between swell and plasticity index (when correction is made for plus No. 4 mesh sieve content). The fact that swell is so important has caused most investigators to test soils for bearing capacity in an expanded condition by fabricating specimens in a wet condition for testing or testing specimens after they have had an opportunity to absorb water and swell. The work of TurnbuU and McRae (8) shown in Figure 6, indicates the relationship between moisture content, density, and bearing capacity as e^qiressed by the California Bearing Ratio (CBR) for a given soiL The work of Benkelman and Olmstead (7), shown in Figure 7 and 8, indicates the relationship between soil strength, as determined the triaxial testing apparatus, and soil density and moisture content
The relationship between soil-density-moisture-content and volume change I S , in itself, a broad subject. Space does not permit complete coverage here. The best results may be obtained by recognizing the influence of compaction and moisture control on the related properties of volume change and bearing capacity and compacting subgrade soils so that the range of shrinkage and swell wi l l be a minimum.
Increasing recognition is being given to the influence of moisture and density control on the susceptibility of soils to cause segregation of ice on freezing and subsequent reduction in bearing capacity during the frost-melting period. Reliable data on the influence of controlled compaction on damage due to freezing are yet too meager from which to draw con-
' Whether interpreted through bearing tests, compression or shear tests
9
elusions on which to base a recommended practice.
FACTORS INFLUENCING PERMANENCE OF DENSinCATION
There are several factors which tend to change soil density. The two p r i mary factors are climate and t r a f f i c . Others are of a secondary nature, as f o r example, condition of pavement surface and nature of base and subbase or shoulders which influence the degree of exposure.
There is no evidence that the main body of an ordinary embankment suffers any decrease in density due to swelling of clay soils, unless i t i s subject to p ro longed inundation. The surface slopes may increase in porosity with t ime, but f o r most cases only surface softening w i l l result. Likewise, there is no evidence that i t continues to settle in detrimental amounts f o r some period following adequate and uniform compaction, either as a result of climatic or t r a f f i c conditions. For practical purposes normal embankments retain their degree of compaction, except in the upper and outer portions subject to seasonal wetting and drying and f ros t action: The item of permanence is significant f o r compacted embankments only when they are subjected to unusual conditions.
Subgrade materials, subbases, and bases are subject to more severe exposure to climatic changes and t ra f f ic than embankments. Climatic conditions may bring about permanent or seasonal reduction or gain in soil moisture and, as a result, may decrease or increase soil density and cause distortion of the road surface.
In considering the permanence of compaction, the engineer needs to take into account two stages in the l i f e of the road. The f i r s t concerns the period during which the road adjusts i tself to i ts environment, that i s , f r o m the "as-built" to the " i n -service" condition. The second concerns changes in density of the subgrade mater ia ls which result f r o m seasonal or longtime changes in climatic conditions after the road has been in service f o r some time. If the soil i s compacted too l i t t le or too much, too wet or too dry, there
w i l l be a change as i t adjusts itself to the new conditions under the pavement
High-volume-change soils, i f compacted at moisture contents less than optimum, may gain in moisture, swell , and suffer a reduction in density and bearing edac i ty f r o m the as-built condition. Contrariwise, i f compacted too wet they may lose moisture and shrink in a degree sufficient to crack the pavement The studies made by several highway departments (9) showed clearly the need f o r control of moisture content and density to ^p roach a condition of least swell and least shrinkage i f damaging effects of moisture and density changes on high-volume-change clays f r o m the as-built to the in-service condition are to be held to a minimum.
Granular soils retain a large measure of their compaction. The clayey-sands, sandy clays, and the si l ty soils are affected in a lesser degree and need to be compacted i n accordance with the degree of protection offered by the type thickness and cross-section of the pavement used and other conditions which prevail locally. Seasonal changes which affect swell and shrinkage are the most severe in areas near and bordering semi-ar id regions where long, hot dry periods may occur. Even more-severe seasonal changes may occur in humid regions where deep freezing occurs.
The freezing of wet soils results i n the formation and often the segregation of ice, which on thawing, may cause a reduction in soi l density. Upon the redistribution of the thaw water in the soi l , there is a re gain in soil density. There is evidence that some reduction occurs in the density of fine-grained soils, i f they are in a saturated condition p r i o r to freezing.
The incidence of a greater number of near-legal-axle weights i n recent years and the experience on airf ields give evidence that t r a f f i c has an influence on the permanence of compaction in bases and subbases. Heavy t ra f f i c may bring about an increase in density over that obtained during construction, causing a rutt ing of a flexible-type pavement or subsidence of a r ig id pavement. Although there are a few factual data, i t is quite generally believed that even relatively clean, coarse granular bases suffer some
10
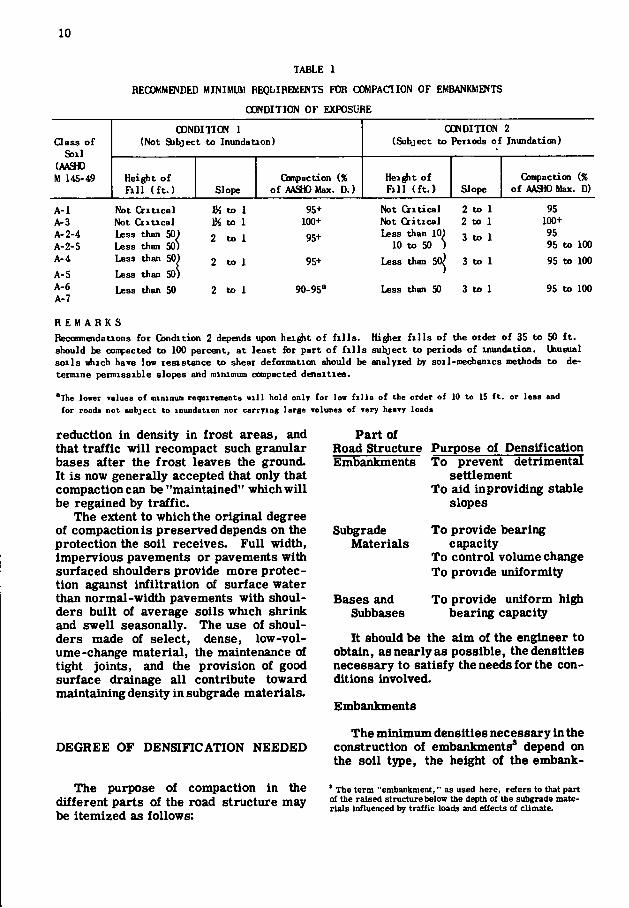
TABLE 1
REOOV.MENDED MINIMUM REQblREMEl^TS FOR OOMPACIION OF EMBANKMENTS
CONDITION OF EXPOSURE
a ass of Soil
(AA9C M 145-49
CONDITION 1 (Not Subject to InundaUon)
Height of F i l l ( f t . ) Slope
CDtnpaction (% of AASHOMax. D.)
CONDITION 2 (Subject to Periods of Inundation)
Height of F i l l ( f t . ) Slope
Coinpaction (% of AASHO Max. D)
A-1 A-3 A-2-4 A-2-5 A-4
A-5 A-6 A-7
Not a i t i c a l Not C i i U c a l Less than Less than Less than 50̂
Less than SO
Less than 50
W to 1 IK to 1
2 to 1
2 to 1
2 to 1
95+ 100+
95+
95+
90-95'
Not Cri t ica l Not Cr i t i ca l Less than 10̂
10 to 50
Less than 5(
2 to 1 2 to 1
3 to 1
3 to 1
Less than SO 3 to 1
95 100+ 95 95 to 100
95 to 100
95 to 100
R E M A R K S Recoimiendations for (jondition 2 depends upon height of f i l l s . Higher f i l l s of the order of 35 to 50 f t . should be oompscted to 100 percent, at least for part of f i l l s subject to periods of inundation. Ihusual so i l s nhich have low resistance to shear deformation should be analyzed by soil-mechanics methods to determine permissible slopes and minimum compacted doisit ies .
'The lower values of m i n l n m n requirements < i l l h o l d o n l y for l o w f i l l s of Che order of 10 t o IS f t . o r less and
for r o a d s n o t s u b j e c t t o i n u n d a t i o n n o r c a r r y i n g l a r g e Tolumes of v e r y h e a v y l o a d s
reduction in density in f ros t areas, and that t r a f f i c w i l l recompact such granular bases after the f ros t leaves the ground. I t i s now generally accepted that only that compaction can be "maintained" which w i l l be regained by t r a f f i c .
The extent to which the original degree of compaction is preserved depends on the protection the soil receives. Ful l width, impervious pavements or pavements with surfaced shoulders provide more protection against inf i l t ra t ion of surface water than normal-width pavements with shoulders built of average soils which shrink and swell seasonally. The use of shoulders made of select, dense, low-vol ume-change material , the maintenance of tight joints, and the provision of good surface drainage a l l contribute toward maintaining density in subgrade materials.
Part of Road Structure Purpose of Densification Embankments To prevent detrimental
settlement To aid in providing stable
slopes
Subgrade Materials
Bases and Subbases
To provide bearing capacity
To control volume change To provide uniformity
To provide uniform hig^ bearing capacity
It should be the aim of the engineer to obtain, as nearly as possible, the densities necessary to satisfy the needs fo r the conditions involved.
Embankments
DEGREE OF DENSIFICATION NEEDED
The purpose of compaction in the different parts of the road structure may be itemized as follows:
The minimum densities necessary in the construction of embankments^ depend on the soil type, the height of the embank-
' The term "embankment," as used here, refers to that part of the raised structure below the depth of the subgrade materials influenced by traffic loads and effects of climate.
11
ment, the design slopes, and the condition of exposure. The necessary minimum r e quirements for compaction should be determined by consideration of a l l those factors and should not be based upon a single requirement. Sandy and gravelly soils of the A - 1 , A - 2 , and A-3 groups (13) can be compacted to relatively high densities. Some of the very-sandy soils exist in the dry, uncompacted state at densities of the order of 90 percent of AASHO maximum densities and attain densities of that magnitude or hi gher under normal construction procedures without benefit of ro l l ing and have stable slopes at those densities. When they are placed where they are not subjected to wetting, there is l i t t le danger of excessive settlement. However, i f subjected to saturat ion, they may settle in detrimental amount unless compacted to about 95 percent of maximum density. The relatively clean granular soils retain their stability when saturated.
The f r iable soils of the A - 2 , A - 4 , and A-5 groups can also be compacted with relative ease but require relatively high densities i f stable slopes are to be buil t . They are more subject to reduction in shear strength on saturation and require higher densities to produce stable slopes. Normally, 95 percent compaction w i l l
S 98
4 z 7
7 y y
5
2 •
•^16
to 1 •
3 II
' •
/ NUUE ER IND C « T E ! THE NUMB INCLU MAX
ER OF T E S T VALUES DED IN AVERAGE V - L V A L U E S
1 1
ER OF T E S T VALUES DED IN AVERAGE V - L V A L U E S
1 1 •» 5 6 , 7 AVERAGE MAXIMUM (V-O-KIP/SO FT
produce adequate results. However, under conditions of saturation by inundation i t is advisable to increase compaction to about 100 percent for high f i l l s of the order of 35 to 50 f t .
The plastic soils (A-6 and A-7) show the greatest improvement f r o m compaction. They should be compacted to relatively high densities (low porosities) i f stable slopes are to result fo r the higher f i l l s . Recommended minimum requirements fo r compaction of embankments are given in Table 1.
Because of their need f o r greater r e sistance to softening,reduction i n strength, and erosion, embankments subject to flooding require better compaction than those not subject to inundation. Experience has shown that well-compacted soils of fer much-greater resistance to stream erosion during overflows than uncompacted or poorly compacted soils. Clay soils are greatly improved in that respect.
Rigid control of moisture f o r soils dryer than optimum is not necessary f o r embankments not to be subjected to f looding. The moisture content may be wi th in the range below optimum which permits obtainingthe desired density with the compaction equipment available. Sheepsfoot-type ro l lers which produce high unit pressures and other types of ro l le rs which
825
V 0* K \ 14
V \
o
12
2
\
NU MSER INOICA E S TH E 2 NUMBER OF T E S T VALUES ^ OF V - L INCLUDED IN THE AVERAGE / V - L FOR EACH VALUE OF MOISTURE
2 \ V
4 5 6 7 AVERAGE MAXIMUM (V-L)-KIP/SQ FT
F i g u r e s 7 and 8. R e l a t i o n o f maximum V - L ( t n a x i a l s h e a r ) wi th d e n s i t y and mois ture .
12
SI(VM - U S standard Siiei 100 40 eo 10
Sand-Clay andy Clay Slltyday HMViaaz
HMvyClay SDty Clay Sandy Clay Sand Bnwtl-Sand-Cloy
oa 009 09 I 8 Portlela Sb«-mm Oloimtar
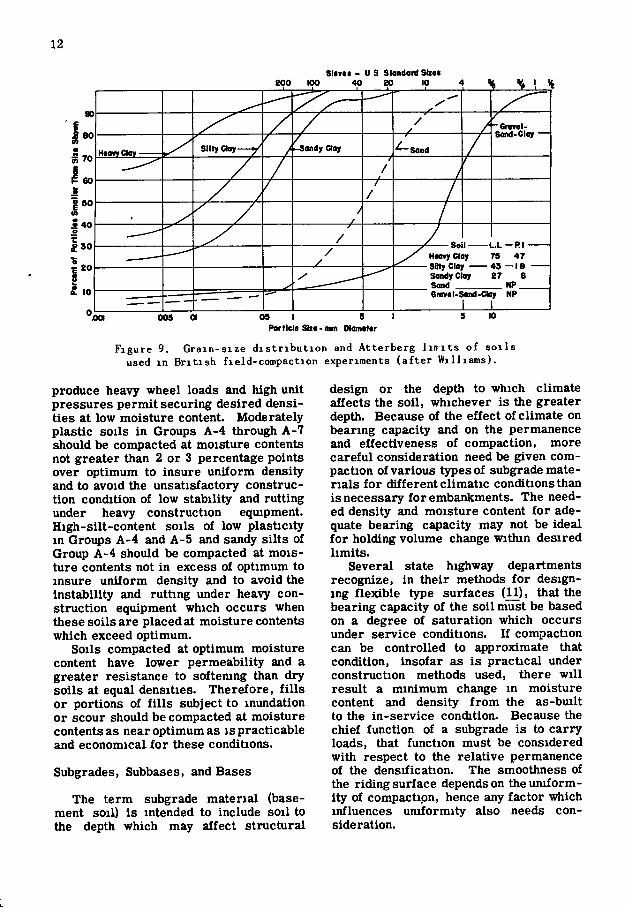
F i g u r e 9. G r a i n - s i z e d i s t r i b u t i o n and A t t e r b e r g l i n i t s o f s o i l s used i n B r i t i s h f i e ld -compact ion experiments ( a f t e r W i l l i a m s ) .
produce heavy wheel loads and high unit pressures permit securing desired densities at low moisture content. Moderately plastic soils i n Groups A-4 through A-7 should be compacted at moisture contents not greater than 2 or 3 percentage points over optimum to insure uniform density and to avoid the unsatisfactory construction condition of low stability and rutting under heavy construction eqmpment. High-silt-content soils of low plasticity in Groups A-4 and A-5 and sandy sil ts of Group A-4 should be compacted at moisture contents not in excess of optimum to insure uniform density and to avoid the instability and rutting under heavy construction equipment which occurs when these soils are placed at moisture contents which exceed optimum.
Soils compacted at optimum moisture content have lower permeability and a greater resistance to softemng than dry soils at equal densities. Therefore, f i l l s or portions of f i l l s subject to inundation or scour should be compacted at moisture contents as near optimum as is practicable and economical f o r these conditions.
Subgrades, Subbases, and Bases
The te rm subgrade material (basement soil) is intended to include soil to the depth which may affect structural
design or the depth to which climate affects the soi l , whichever is the greater depth. Because of the effect of climate on bearing capacity and on the permanence and effectiveness of compaction, more careful consideration need be given compaction of various types of subgrade mater ia ls f o r different climatic conditions than is necessary f o r embankments. The needed density and moisture content f o r adequate bearing capacity may not be ideal f o r holding volume change within desired l imi t s .
Several state highway departments recognize, in their methods f o r designing flexible type surfaces (11), that the bearing capacity of the soi l must be based on a degree of saturation which occurs under service conditions. I f compaction can be controlled to approximate that condition, insofar as is practical under construction methods used, there w i l l result a minimum change in moisture content and density f r o m the as-built to the in-service condition. Because the chief function of a subgrade is to carry loads, that function must be considered with respect to the relative permanence of the densification. The smoothness of the riding surface depends on the uni formity of compaction, hence any factor which influences uniformity also needs consideration.
13
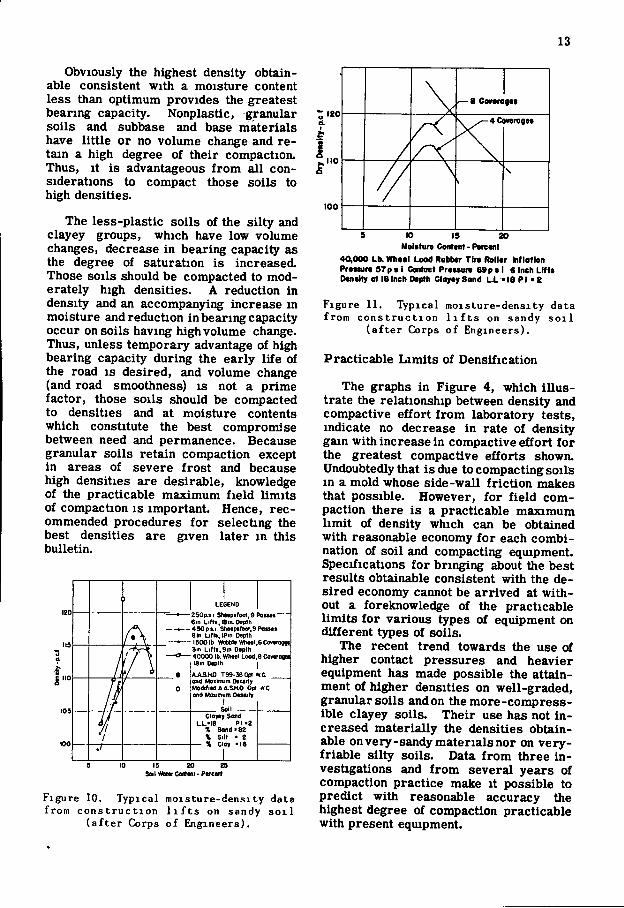
Obviously the highest density obtainable consistent with a moisture content less than optimum provides the greatest bearing capacity. Nonplastic, granular soils and subbase and base materials have l i t t l e or no volume change and re tain a high degree of their compaction. Thus, i t is advantageous f r o m al l considerations to compact those soils to high densities.
The less-plastic soils of the si l ty and clayey groups, which have low volume changes, decrease in bearing capacity as the degree of saturation is increased. Those soils should be compacted to moderately high densities. A reduction in density and an accompanying increase in moisture and reduction in bearing capacity occur on soils having high volume change. Thus, unless temporary advantage of high bearing capacity during the early l i fe of the road is desired, and volume change (and road smoothness) is not a prime factor, those soils should be compacted to densities and at moisture contents which constitute the best compromise between need and permanence. Because granular soils retain compaction except in areas of severe f ros t and because high densities are desirable, knowledge of the practicable maximum f i e ld l imi t s of compaction is important. Hence, recommended procedures f o r selecting the best densities are given later in this bulletin.
LEGEND -• 250IH I Sll«p»tool,9 RlMM-
Sin Li(H,l8in.0«pm 490pt . i Shnpstool,9Pfl«Mt ein Liflt,IPin Depth
-•—15001b VIUI>l>Winl,6Cimragn| 3in L i t l l , 9 i i i D«plh
-a— 40O0O lb. Wh««l Lood.e CowrogeJ I8in D«pth I
AASHO T99-3eOpl WC and Moxifnjm Oaniity ModlfiMAA.SKO Opt «C ond Maximum Otnsity
Soil Cloyay Sand
L-ie P I - 2 % Sand-SZ » SiH • 2 X Cla> ' I S
IS 20 23 Sal tUbtirCartant- Percent
: 120 CL
.110
100
•—S Conn
/ wtragn
F i g u r e 10. T y p i c a l m o i s t u r e - d e n s i t y data from c o n s t r u c t i o n l i f t s on sandy s o i l
( a f t e r Corps o f E n g i n e e r s ) .
9 10 19 20 Molttura Conttnt- Plrcmt
40,000 Lb. Whttl Lood Rubbtr T in Rolltr hf lotion Protura 97p • I Contoct Prouaro 69p s I 6 Inch Lift* Dwisily ot le Inch Depth Clayey Sand UL • 18 PI • £
F i g u r e 11. T y p i c a l m o i s t u r e - d e n s i t y data from c o n s t r u c t i o n l i f t s on sandy s o i l
( a f t e r Corps o f E n g i n e e r s ) .
Practicable L imi t s of Densification
The graphs in Figure 4, which i l l u s trate the relationship between density and compactive effor t f r o m laboratory tests, indicate no decrease in rate of density gain with increase in compactive effor t f o r the greatest compactive efforts shown. Undoubtedly that is due to compacting soils in a mold whose side-waU f r i c t i on makes that possible. However, f o r f i e l d compaction there is a practicable maximum l i m i t of density which can be obtained with reasonable economy f o r each combination of soil and compacting equipment. Specifications f o r bringing about the best results obtainable consistent with the desired economy cannot be arr ived at wi th out a foreknowledge of the practicable l imi t s f o r various types of equipment on different types of soils.
The recent trend towards the use of higher contact pressures and heavier equipment has made possible the attainment of higher densities on well-graded, granular soils and on the more-compressible clayey soils. Their use has not i n creased materially the densities obtainable onvery-sandy materials nor on very-f r iable sil ty soils. Data f r o m three i n vestigations and f r o m several years of compaction practice make i t possible to predict with reasonable accuracy the highest degree of compaction practicable with present equipment.
14
120
d IIS
no
105
100
water Content - Percent of Dry Weight 10 15 20 25
Modified A AS.HO / \ \ -~ltt«l M a l l l y ^Zfiro Air \ 'olds
Field Co 20,000 on
Load 6
/ mpoctlon — 140p00lh Coverages
Wheel \ \ \ \ ^ \
AASMO » — T 9 9 - 3 (
e t h o d - v / )
A AASMO » — T 9 9 - 3 (
/ / S h 1
290^000 and 790P.8I eepsfbot Rollers 6 Poss
1 u
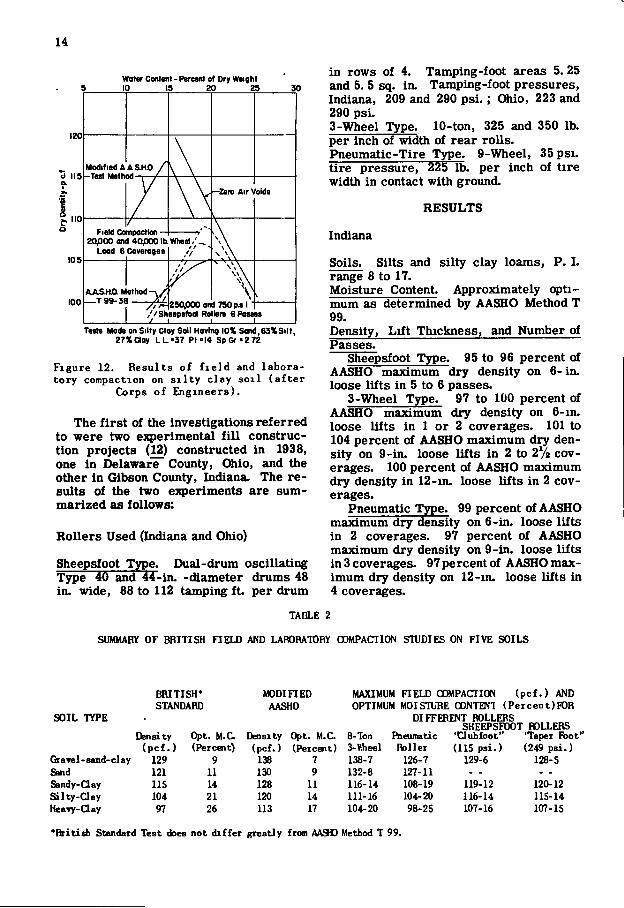
in rows of 4. Tamping-foot areas 5. 25 vi and 5. 5 sq. in. Tamping-foot pressures,
Indiana, 209 and 290 p s i . : Ohio, 223 and 290 psi. 3-Wheel Type. 10-ton, 325 and 350 lb. per inch of width of rear ro l l s . Pneumatic-Tire Type- 9-Wheel, 35 psi . t i re pressure, 225 lb. per inch of t i r e width in contact with ground.
Testa Made an Silty Cloy Sail Having 10% Sond,63%Silt, 27%Clay L L ' 3 7 P I » I 4 S p G f 2 7 2
F i g u r e 12. R e s u l t s o f f i e l d and l a b o r a tory compaction on s i l t y c l a y s o i l ( a f t e r
&>rps o f E n g i n e e r s ) .
The f i r s t of the investigations referred to were two e:q)erimental f i l l construction projects (12) constructed in 1938, one In Delaware County, Ohio, and the other i n Gibson County, Indiana. The r e sults of the two experiments are summarized as follows:
Rollers Used (Indiana and Ohio)
Sheepsfoot Tsrpe. Dual-drum oscillating Type 40 and 44-in. -diameter drums 48 in. wide, 88 to 112 tamping f t . per drum
RESULTS
Indiana
Soils. Silts and si l ty clay loams, P. I . range 8 to 17. Moisture Content. Approximately op t i mum as determined AASHO Method T 99. Density, L i f t Thickness, and Number of Passes.
Sheepsfoot Type. 95 to 96 percent of AASHO maximum dry density on 6- in . loose l i f t s i n 5 to 6 passes.
3-Wheel Type. 97 to 100 percent of AASHO maximum dry density on 6-in. loose l i f t s in 1 or 2 coverages. 101 to 104 percent of AASHO maximum dry density on 9-in. loose l i f t s i n 2 to 2% coverages. 100 percent of AASHO maximum dry density in 12-in. loose l i f t s in 2 coverages.
Pneumatic Type. 99 percent of AASHO maximum dry density on 6-in. loose l i f t s in 2 coverages. 97 percent of AASHO maximum dry density on 9-in. loose l i f t s in 3 coverages. 97 percent of AASHO maximum dry density on 12-in. loose l i f t s in 4 coverages.
TABLE 2
SUMMARY OF BRITISH F I E L D AND LABORATORY COMPACTION STTJDIES ON F I V E SOILS
BRITISH* STANDARD
SOIL TYPE
MODIFIED MAXIMUM F I E L D COMPACTION ( p c f . ) A N D AASHO OPTIMUM MOISTURE CONTENT (Percent)FOR
DIFFERENT ROLLERS
Density Opt. M.C Density Opt. M.C. 8-Ton I^eunatic •aubfoot" 'Taper Foot" ( p c f . ) (Percent) (pcf . ) (Percoit) 3-Wheel Roller (115 ps i . ) (249 ps i . )
Gravel-sand-clay 129 9 138 7 138-7 126-7 129-6 128-5 &nd 121 11 130 9 132-8 127-11 - - - -Sandy-aay 115 14 128 11 116-14 108-19 119-12 120-12 S i l t y - a a y 104 21 120 14 111-16 104-20 116-14 115-14 Heavy-Qay 97 26 113 17 104-20 98-25 107-16 107-15
' f t i t i d i Standard Test does not differ greatly from AA90 Method T 99.
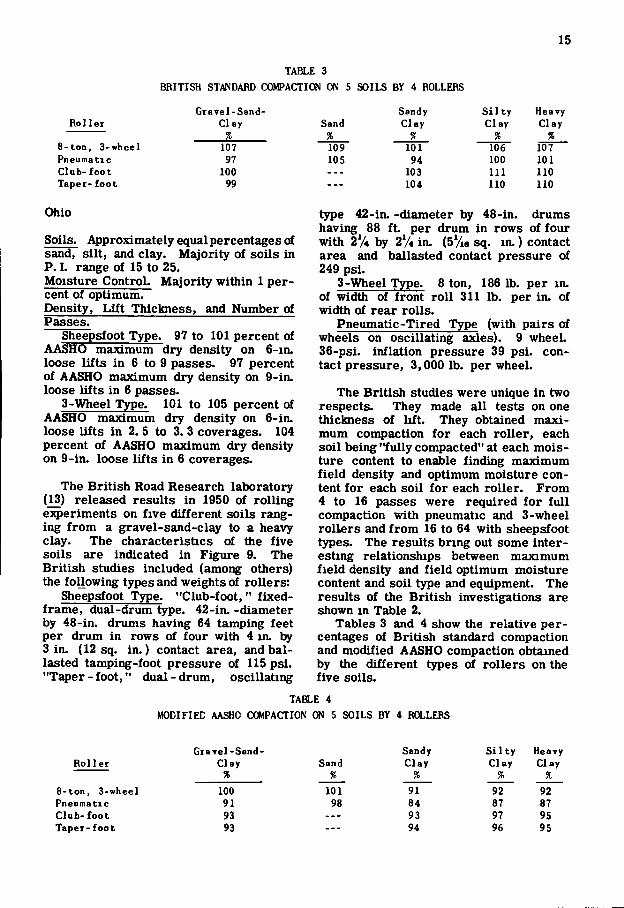
TABLE 3
BRITISH STANDARD COMPACTION ON 5 SOILS BY 4 ROLLERS
15
Grave l -Sand- Sandy S i l t y Heavy R o l l e r C l a y Sand Clay C l a y Clay
% % •n % % 8- ton , 3-wheel 107 109 101 106 107 Pneumatic 97 105 94 100 101 Club- foot 100 — 103 111 110 Taper - foo t 99 --- 104 110 110
Ohio
Soils. Approximately equal percentages of sand, s i l t , and clay. Majori ty of soils in P. I . range of 15 to 25. Moisture Control. Major i ty within 1 percent of optimum. Density, L i f t Thickness, and Number of Passes.
Sheepsfoot Type. 97 to 101 percent of AASHO maximum dry density on 6-in. loose l i f t s i n 6 to 9 passes. 97 percent of AASHO maximum dry density on 9-in. loose l i f t s in 6 passes.
3-Wheel Type. 101 to 105 percent of AASHO maximum dry density on 6-in. loose l i f t s i n 2. 5 to 3. 3 coverages. 104 percent of AASHO maximum dry density on 9-in. loose l i f t s i n 6 coverages.
The Br i t i sh Road Research laboratory (13) released results in 1950 of rol l ing e}q)eriments on f ive different soils ranging f r o m a gravel-sand-clay to a heavy clay. The characteristics of the f ive soils are indicated in Figure 9. The Br i t i sh studies included (among others) the foUowing types and weights of rol lers:
Sheepsfoot Type. "Club-foot, " f ixed-f rame, dual-drum type. 42-in. -diameter by 48-in. drums having 64 tamping feet per drum in rows of four with 4 in. by 3 in . (12 sq. in . ) contact area, and ballasted tamping-foot pressure of 115 psi. "Taper - foo t , " dua l -d rum, oscillating
type 42-in. -diameter by 48-in. drums having 88 f t per drum in rows of four with 2V4 by 2% in . (SVw sq. i n . ) contact area and ballasted contact pressure of 249 psi.
3-Wheel Type. 8 ton, 186 lb. per in . of width of f ront r o l l 311 lb, per in . of width of rear ro l l s .
Pneumatic-Tired Type (with pairs of wheels on oscillating axles). 9 wheeL 36-psi. inflation pressure 39 psi. contact pressure, 3,000 1b. per wheel.
The Br i t i sh studies were unique in two respects. They made a l l tests on one thickness of l i f t . They obtained maximum compaction f o r each ro l le r , each soil being " fu l ly compacted" at each moisture content to enable finding maximum f i e ld density and optimum moisture content f o r each soil f o r each ro l le r . F rom 4 to 16 passes were required f o r f u l l compaction with pneumatic and 3-wheel ro l le rs and f r o m 16 to 64 with sheepsfoot types. The results bring out some interesting relationships between maximum f i e l d density and f i e l d optimum moisture content and soil type and equipment. The results of the Br i t i sh investigations are shown in Table 2.
Tables 3 and 4 show the relative percentages of Br i t i sh standard compaction and modified AASHO compaction obtained by the different types of ro l lers on the f ive soils.
TABLE 4
MODIFIED AASHO COMPACTION CW 5 SOILS BY 4 ROLLERS
G r a v e l - S a n d - Sandy S i l t y Heavy R o l l e r Clay Sand C l a y C l a y Clay
% % % % % 8-ton, 3-wheel 100 101 91 92 92 Pneumatic 91 98 84 87 87 Club- foot 93 — 93 97 95 T a p e r - f o o t 93 --- 94 96 95
16
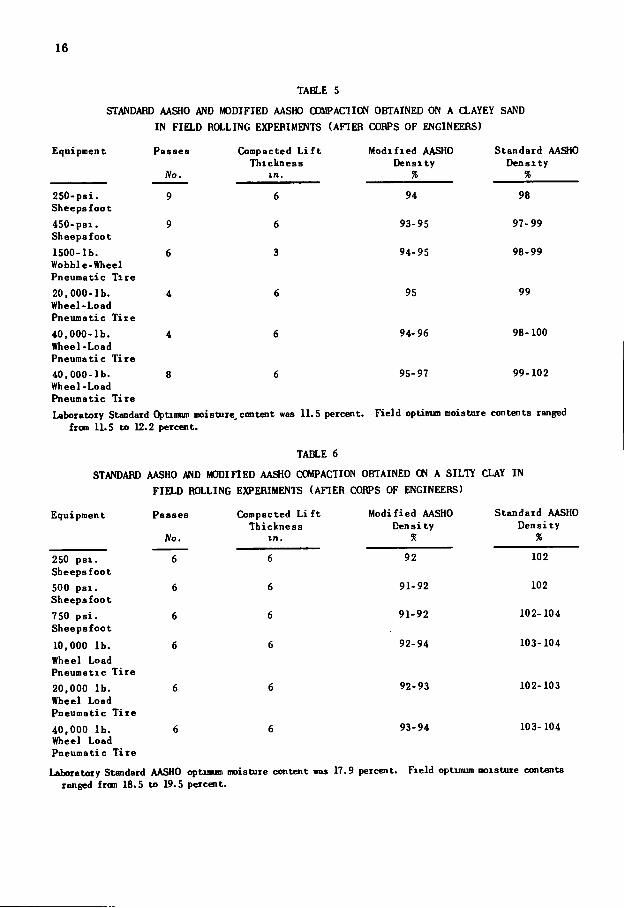
TABLE 5
STANDARD AASHO AND MODIFIED AASHO OOMPACIION OBTAINED ON A aAYEY SAND
IN F I E L D ROLLING EXPERIMENTS ( A H E R CORPS OF ENGINEERS)
Equipment Passes
Afo.
Compacted L i f t Th ickness
m .
Modif ied AASHO Densi ty
%
94
Standard AASHO Dens i ty %
98 2 5 0 - p s i . 9 6 Sheepsfoot
4 5 0 - p a i . 9 6 93-95 97-99 Sheepsfoot
1500- lb . 6 3 94-95 98-99 Wobble-Wheel Pneumatic T i r e 2 0 , 0 0 0 - I b . 4 6 95 99 Wheel-Load Pneumatic T i t e 4 0 , 0 0 0 - l b . 4 6 94-96 98-100 Wheel-Load Pneumatic T i r e 4 0 , 0 0 0 - l b . 8 6 95-97 99-102 Wheel-Load Pneumatic T i r e Laboratory Standard Optimum moisture, content was 11.5 percent. Fie ld optimum moisture contents ranged
from 11.5 to 12.2 perceit.
TABLE 6
STANDARD AASHO AND MODIFIED AASHO COMPACTION OBTAINED ON A SILTlf CLAY IN
F I E L D ROLLING EXPERIMENIS ( A H E R CORPS OF ENGINEERS)
Equipment
250 p s i . Sheepsfoot
500 p s i . Sheepsfoot
750 p s i . Sheepsfoot
10,000 l b . Wheel Load Pneumatic T i r e
20,000 l b . Wheel Load Pneumatic T i r e
40,000 l b . Wheel Load Pneumatic T i r e
Passes
Wo.
6
6
6
6
Compacted L i f t Th ickness
m .
6
6
6
Modif ied AASHO Densi ty
%
92
91-92
91- 92
92- 94
92- 93
93- 94
Standard AASHO Dens i ty
%
102
102
102- 104
103- 104
102- 103
103- 104
Laboratory Standard AASHO optimum moisture content was 17.9 percent. Field optimum moisture contents ranged fran 18.5 to 19.5 percent.
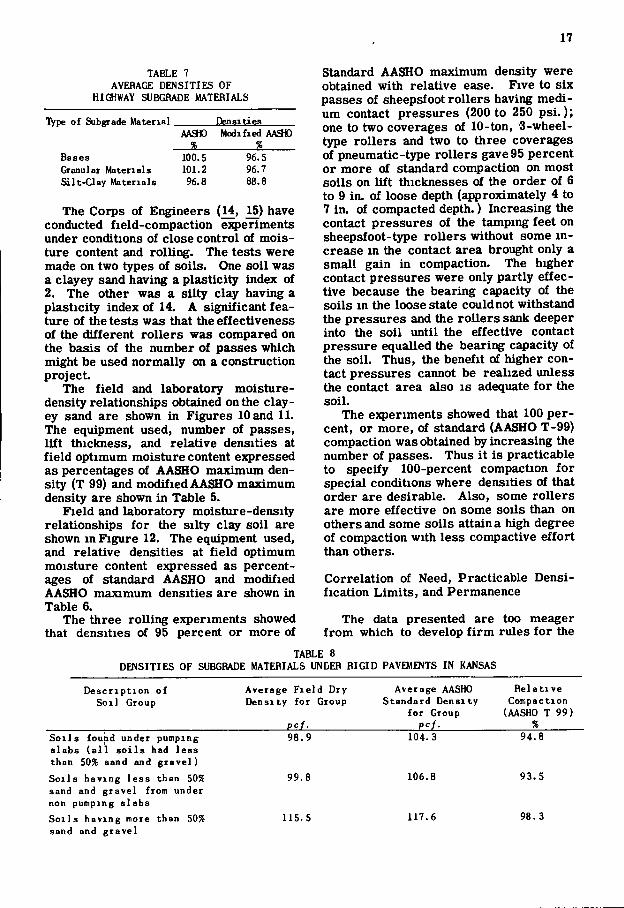
17
TABLE 7 AVERAGE DENSITIES OF
HIGHWAY SUBGRADE MATERIALS
Type of Subgrade Material .
Bases
Granular Materials Si l t -Clay Materials
Densities AAa» Modified AA30
100.5 101.2 96.8
96.5 96.7 88.8
The Corps of Engineers (14, 15) have conducted field-compaction e:q)eriments under conditions of close control of moisture content and rol l ing. The tests were made on two types of soils. One soil was a clayey sand having a plasticity index of 2, The other was a sil ty clay having a plasticity index of 14. A significant feature of the tests was that the effectiveness of the different ro l lers was compared on the basis of the number of passes which might be used normally on a construction project.
The f i e l d and laboratory moisture-density relationships obtained on the clayey sand are shown in Figures 10 and 11. The equipment used, number of passes, l i f t thickness, and relative densities at f i e ld optimum moisture content expressed as percentages of AASHO maximum density (T 99) and modified AASHO maximum density are shown in Table 5.
Field and laboratory moisture-density relationships fo r the sil ty clay soil are shown in Figure 12. The equipment used, and relative densities at f i e ld optimum moisture content expressed as percentages of standard AASHO and modified AASHO maximum densities are shown in Table 6.
The three rol l ing experiments showed that densities of 95 percent or more of
Standard AASHO maximum density were obtained with relative ease. Five to six passes of sheepsfoot ro l le rs having medium contact pressures (200 to 250 p s L ) ; one to two coverages of 10-ton, 3-wheel-type ro l le rs and two to three coverages of pneumatic-t}rpe ro l lers gave 95 percent or more of standard compaction on most soils on l i f t thicknesses of the order of 6 to 9 in . of loose depth (approximately 4 to 7 in . of compacted depth.) Increasing the contact pressures of the tamping feet on sheepsfoot-type ro l lers without some i n crease in the contact area brought only a small gain in compaction. The higher contact pressures were only part ly effective because the bearing capacity of the soils i n the loose state could not withstand the pressures and the ro l le rs sank deeper into the soil unti l the effective contact pressure equalled the bearing capacity of the soil . Thus, the benefit of higher contact pressures cannot be realized unless the contact area also is adequate f o r the soil .
The e3q)eriments showed that 100 percent, or more, of standard (AASHO T-99) compaction was obtained by increasing the number of passes. Thus i t is practicable to specify 100-percent compaction f o r special conditions where densities of that order are desirable. Also, some rol lers are more effective on some soils than on others and some soils attain a high degree of compaction with less compactive effor t than others.
Correlation of Need, Practicable Densi-fication L imi t s , and Permanence
The data presented are too meager f r o m which to develop f i r m rules f o r the
TABLE 8 DENSITIES OF SUBGRADE MATERIALS UNDER RIGID PAVEMENTS IN KANSAS
D e s c r i p t i o n of S o i l Group
Average F i e l d Dry Densi ty for Group
RcL
Average AASHO Standard Densi ty
for Group
R e l a t i v e Compaction
(AASHO T 99)
S o i l s found under pumping s l a b s ( a l l s o i l s had l e s s than 50% sand and g r a v e l )
S o i l s having l e s s than 50% sand and gravel from under non pumping s l a b s
S o i l s having more than 50% sand and gravel
98 .9
99.8
115.5
104.3
106.8
117.6
94.8
93 .5
98 .3
18
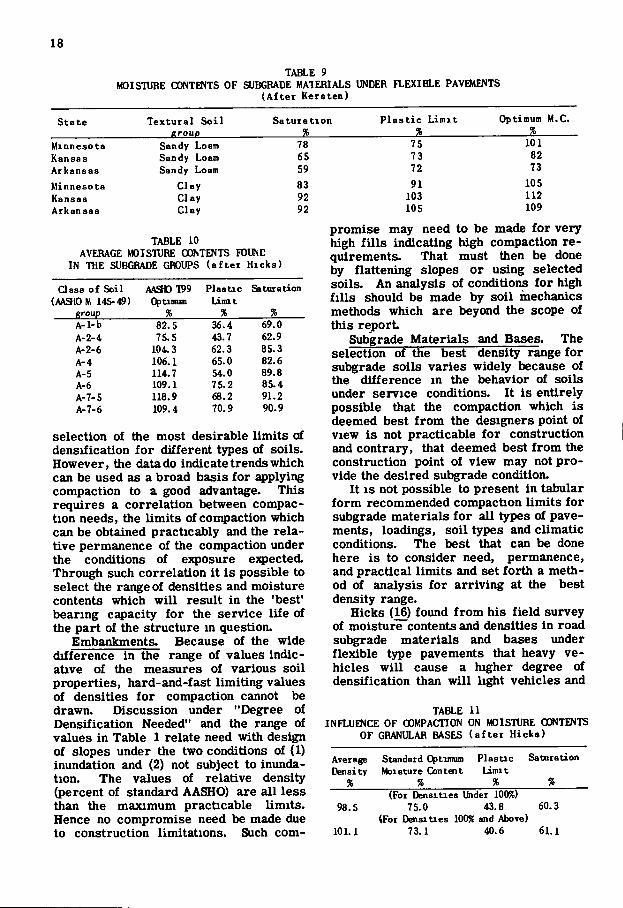
TABLE 9 MOISTURE CONTENTS OF SUBGRADE MATERIALS UNDER FLEXIBLE PAVEMENTS
( A f t e r K e r s t e n )
S t a t e T e x t u r a l S o i l group
Sa t u r a t i o n 2
P l a s t i c L i m i t Optimum M.C.
Minnesota Kansas Arkansas
Minnesota Kansas Arkansas
Sandy Loam Sandy Loam Sandy Loam
Clay Clay Clay
78 65 59
83 92 92
TABLE 10 AVERAGE MOISTURE CONTENTS POUND
IN THE SUBGRADE GROUPS ( a f t e r H i c k s )
Class of Soil (AA310 W 145-49)
AA30T99 Optimum
Plas t ic Limit
Saturation
A-l-b A-2-4 A-2-6 A-4 A-5 A-6 A-7-5 A-7-6
82.5 75.5
104.3 106.1 114.7 109.1 118.9 109.4
36.4 43.7 62.3 65.0 54.0 75.2 68.2 70.9
69.0 62.9 85.3 82.6 89.8 85.4 91.2 90.9
selection of the most desirable l imi t s of densification f o r different types of soils. However, the data do indicate trends which can be used as a broad basis f o r applying compaction to a good advantage. This requires a correlation between compaction needs, the l imi t s of compaction which can be obtained practicably and the re lative permanence of the compaction under the conditions of exposure e3q)ected. Through such correlation i t i s possible to select the range of densities and moisture contents which w i l l result i n the 'best' bearing capacity f o r the service l i f e of the par t of the structure m question.
Embankments. Because of the wide difference in the range of values indicative of the measures of various soil properties, hard-and-fast l imi t ing values of densities f o r compaction cannot be drawn. Discussion under "Degree of Densification Needed" and the range of values in Table 1 relate need with design of slopes under the two conditions of (1) inundation and (2) not subject to inundation. The values of relative density (percent of standard AASHO) are a l l less than the maximum practicable l imi t s . Hence no compromise need be made due to construction limitations. Such com-
75 73 72
91 103 105
101 82 73
105 112 109
promise may need to be made f o r very high f i l l s indicating high compaction re quirements. That must then be done by flattening slopes or using selected soils. An analysis of conditionjs f o r high f i l l s should be made by soil mechanics methods which are beyond the scope of this r epor t
Subgrade Materials and Bases. The selection of the best density range f o r subgrade soils varies widely because of the difference m the behavior of soils under service conditions. I t is entirely possible that the compaction which is deemed best f r o m the designers point of view is not practicable f o r construction and contrary, that deemed best f r o m the construction point of view may not p ro vide the desired subgrade condition.
I t I S not possible to present i n tabular f o r m recommended compaction l imi t s f o r subgrade materials f o r a l l types of pavements, loadings, soi l types and climatic conditions. The best that can be done here i s to consider need, permanence, and practical l imi t s and set fo r th a method of analysis f o r a r r iv ing at the best density range.
Hicks (16) found f r o m his f i e ld survey of moisture contents and densities in road subgrade materials and bases under flexible type pavements that heavy vehicles w i l l cause a higher degree of densification than w i l l l ight vehicles and
TABLE 11 INFLUENCE OF COMPACTION ON MOISTURE CONTENTS
OF GRANULAR BASES ( a f t e r H i c k s )
Average Standard Optimum Plast ic Saturation Density Moisture Content l imi t
% % % % (For Densities Under lOOX)
98.5 7 5.0 43.8 60.3 (For DensiUes 100% and Above)
l O L l 73.1 40.6 6 L 1
19
a large volume of t ra f f ic w i l l bring about density equilibrium quicker than w i l l a small volume of t r a f f i c . Thus t r a f f i c i s an important consideration. He found that t r a f f i c w i l l maintain densities greater than 100 percent of AASHO maximum density in granular subgrade material but densities in s i l t -c lay subgrade material were much lower. Average values f r o m his survey are given in Table 7.
Some of the recent studies of pumping of r i g id type pavements yielded data on relative densities of subgrade soils under pavements which had been in service several years. The results f r o m the Kansas Investigation (17) which was l imi ted largely to the eastern one-half of the State show average values of density f o r each of three broad soil groups fo r that locality. The results are shown in Table 8.
The densities found in granular soils under r i g i d type pavements in service were found higher than those of the f iner grained soils.
Kersten's (18, 19) study of the moisture contents of soils under flexible pavements and the reports of the Highway Research Board Committees on Warping (20) and Pumping (21) of Concrete Pavements provide evidence of the range of moisture contents which exist in subgrade mater ia ls under pavements. The average values obtained in three States f r o m Kersten's work indicate the range of so i l moisture found under flexible pavements in those localities. The values are given in Table 9 f o r only two different types of soils to show the difference in soil moisture content f o r sandy loam soils and clay soils.
Hicks' 1948 report of seasonal measurements of subgrade soil moisture contents under f lexible type pavements also showed that soU moisture is related to soil texture. The relationship expressed in terms of average moisture contents found in the various Subgrade Soil Groups, (Soil Classification Method AASHO M 145-49) I S shown in Table 10.
Generally the soi l moisture increased during the f a l l and winter, reached a maximum during the month of A p r i l and receded to a minimum during late summer or early f a l l .
Hicks also reported on the relationship
between densities and average moisture contents of granular bases. The average densities (es^ressed as percentages of AASHO T 99 maximum densities) and moisture contents are given in Table 11.
Studies in Tennessee showed average moisture contents of 23 percent compared to an average plastic l i m i t of 19 f o r fine grained plastic subgrade soils (having less than SOpercent sand and gravel) under r ig id type pavements. The corresponding values f o r Kansas were 24. 8 and 19.4 respectively. Moisture contents of the more granular soils (having more than 50% sand and gravel) were 17. 7 and 13. 6 and their plastic l imi t s were 15 and 14.1 respectively. Moisture contents in I l l inois subgrade soils underlying granular bases averaged 22. 5 percent and corresponded to an average plastic l i m i t of 21.3 percent Thus the fine grain subgrade soils existed at a condition near saturation while the granular soils existed at a condition of about 83 percent saturation.
I t is recognized that the values given w i l l not hold f o r al l climatic conditions. They do however, point out that there is a range f o r density and f o r moisture content which can be maintained f o r each type of soil and type of pavement f o r a given locality. I t follows that the least volume change w i l l occur i f compaction is aimed at the range which is most apt to "stay put" i n the subgrade material . The range of desirable moisture content can be obtained fo r any locality by a survey of f i e l d conditions on pavements which have been in service f o r some time. I t should be kept i n mind that they reflect in some degree the in i t i a l moisture contents and densities at which they were compacted.
In a r r iv ing at the best ranges of moisture content and density, i t is desirable to make an analysis of the needs f o r the conditions and correlate those needs with other factors. One way of making such analysis consists of stating design and construction requirements and the corresponding ranges of moisture content and density. The desirable values f o r one may not coincide with that f o r the other, necessitating a compromise to obtain the best practicable values. Examples 1 and 2 i l lustrate that approach f o r determining the best range of values.
20
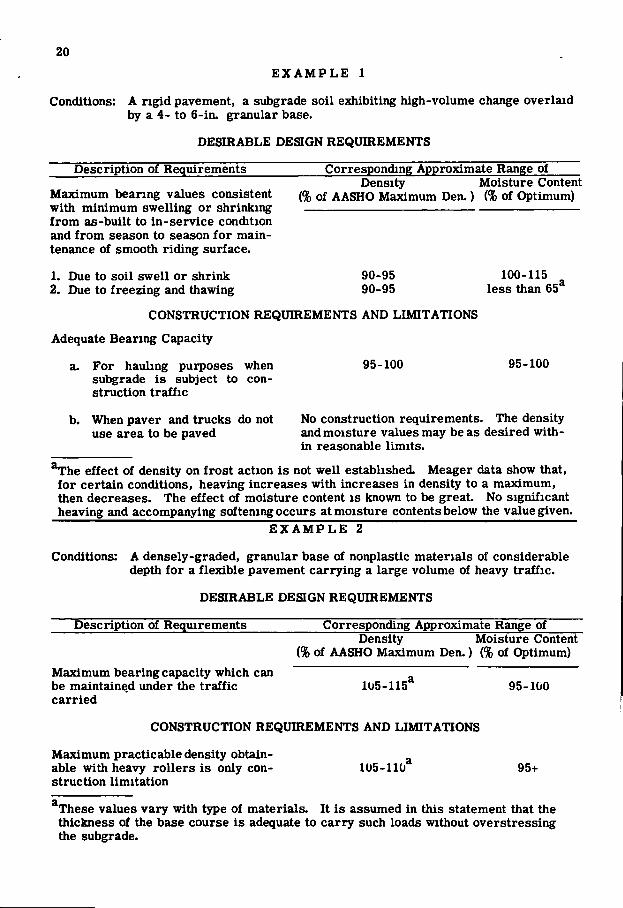
E X A M P L E 1
Conditions: A r ig id pavement, a subgrade soil exhibiting high-volume change overlaid by a 4- to 6-in. granular base.
DESIRABLE DESIGN REQUIREMENTS
Description of Requirements Corresponding Approximate Range of Density Moisture Content
Maximum bearing values consistent (% of AASHO Maximum Den.) (% of Optimum) with minimum swelling or shrinking f r o m as-built to in-service condition and f r o m season to season f o r maintenance of smooth r iding surface.
1. Due to soil swell or shrink 90-95 100-115 2. Due to freezing and thawing 90-95 less than 65
CONSTRUCTION REQUIREMENTS AND LIMITATIONS
Adequate Bearing Capacity
a. For hauling purposes when 95-100 95-100 subgrade is subject to construction t r a f f i c
b. When paver and trucks do not No construction requirements. The density use area to be paved and moisture values may be as desired wi th
in reasonable l imi t s .
^ h e effect of density on f ros t action is not wel l established. Meager data show that, f o r certain conditions, heaving increases with increases in density to a maximum, then decreases. The effect of moisture content is known to be great. No significant heaving and accompanying softening occurs at moisture contents below the value given.
E X A M P L E 2
Conditions: A densely-graded, granular base of nonplastic materials of considerable depth f o r a f lexible pavement carrying a large volume of heavy t r a f f i c .
DESIRABLE DESIGN REQUIREMENTS
Description of Requirements Corresponding Approximate Range of Density Moisture Content
(% of AASHO Maximum Den.) (% of Optimum)
Maximum bearing capacity which can ^ be maintained under the t r a f f i c 105-115 95-100 carr ied
CONSTRUCTION REQUIREMENTS AND LIMITATIONS
Maximum practicable density obtainable with heavy ro l l struction l imitat ion able with heavy ro l le rs is only con- 105-110 95+
These values vary with type of materials. I t i s assumed in this statement that the thickness of the base course is adequate to carry such loads without overstressing the subgrade.
21
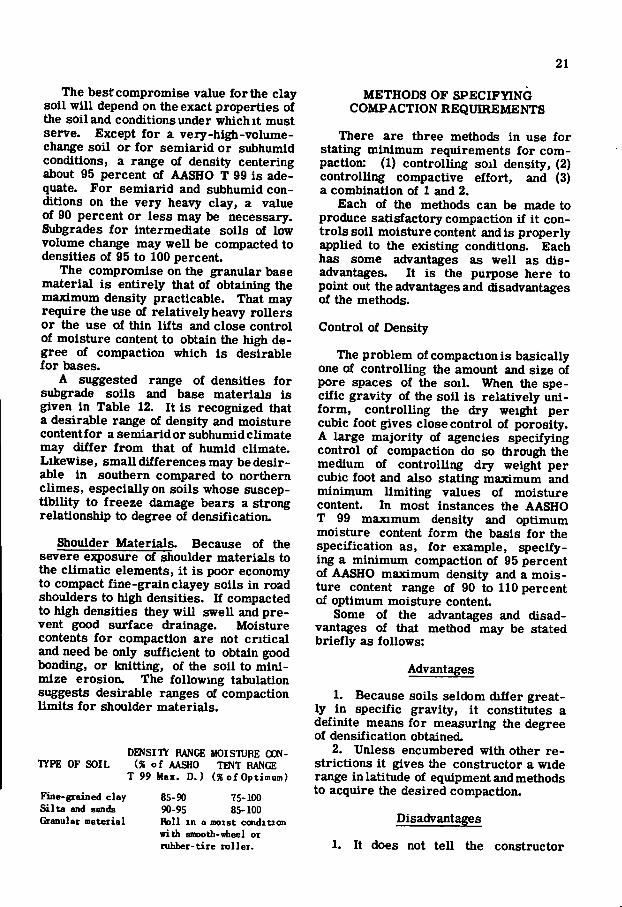
The best compromise value f o r the clay soil w i l l depend on the exact properties of the soil and conditions under which i t must serve. Except f o r a very-hig^-volume-change soi l or f o r semiarid or subhumid conditions, a range of density centering about 95 percent of AASHO T 99 is adequate. For semiarid and subhumid conditions on the very heavy clay, a value of 90 percent or less may be necessary. Subgrades f o r intermediate soils of low volume change may wel l be compacted to densities of 95 to 100 percent.
The compromise on the granular base material i s entirely that of obtaining the maximum density practicable. That may require the use of relatively heavy rol lers or the use of thin l i f t s and close control of moisture content to obtain the high degree of compaction which is desirable f o r bases.
A suggested range of densities f o r subgrade soils and base materials is given in Table 12. I t i s recognized that a desirable range of density and moisture contentf or a semiarid or subhumid climate may d i f fe r f r o m that of humid climate. Likewise, small differences may be desirable in southern compared to northern climes, especially on soils whose suscept ib i l i ty to freeze damage bears a strong relationship to degree of densification.
Shoulder Materials. Because of the severe exposure of shoulder materials to the cl imatic elements, i t i s poor economy to compact f ine-grain clayey soils i n road shoulders to high densities. I f compacted to high densities they w i l l swell and prevent good surface drainage. Moisture contents f o r compaction are not c r i t i ca l and need be only sufficient to obtain good bonding, or knitting, of the soil to m i n i mize erosion. The following tabulation suggests desirable ranges of compaction l imi t s f o r shoulder materials.
TYPE OF SOIL
Fine-grained clay S i l t a and sands Granular material
DENSITlf RANGE MOISTURE CON-(% of AASHO TENT RANGE
T 99 Max. D . ) (% of Optimum)
85-90 75-100 90-95 85-100 Roll in a moist condiuon with smooth-wheel or cubber-tire rol ler .
METHODS OF SPECIFYING COMPACTION REQUIREMENTS
There are three methods in use f o r stating minimum reqvdrements f o r compaction: (1) controlling soil density, (2) controlling compactive effor t , and (3) a combination of 1 and 2.
Each of the methods can be made to produce satisfactory compaction i f i t cont ro ls so i l moisture content and is properly applied to the existing conditions. Each has some advantages as wel l as disadvantages. I t i s the purpose here to point out the advantages and disadvantages of the methods.
Control of Density
The problem of compaction is basically one of controlling the amount and size of pore spaces of the soi l . When the specif ic gravity of the soi l is relatively unif o r m , controlling the dry weight per cubic foot gives close control of porosity. A large majori ty of agencies specifying control of compaction do so throu^^ the medium of controlling dry weight per cubic foot and also stating maximum and minimum l imi t ing values of moisture content. In most instances the AASHO T 99 maximum density and optimum moisture content f o r m the basis f o r the specification as, f o r example, specifying a minimum compaction of 95 percent of AASHO maximum density and a moisture content range of 90 to 110 percent of optimum moisture content
Some of the advantages and disadvantages of that method may be stated br ief ly as follows:
Advantages
1. Because soils seldom di f fe r greatly in specific gravity, i t constitutes a definite means f o r measuring the degree of densification obtained.
2. Unless encumbered with other re strictions i t gives the constructor a wide range in latitude of equipment and methods to acquire the desired compaction.
Disadvantages
1. I t does not te l l the constructor
22
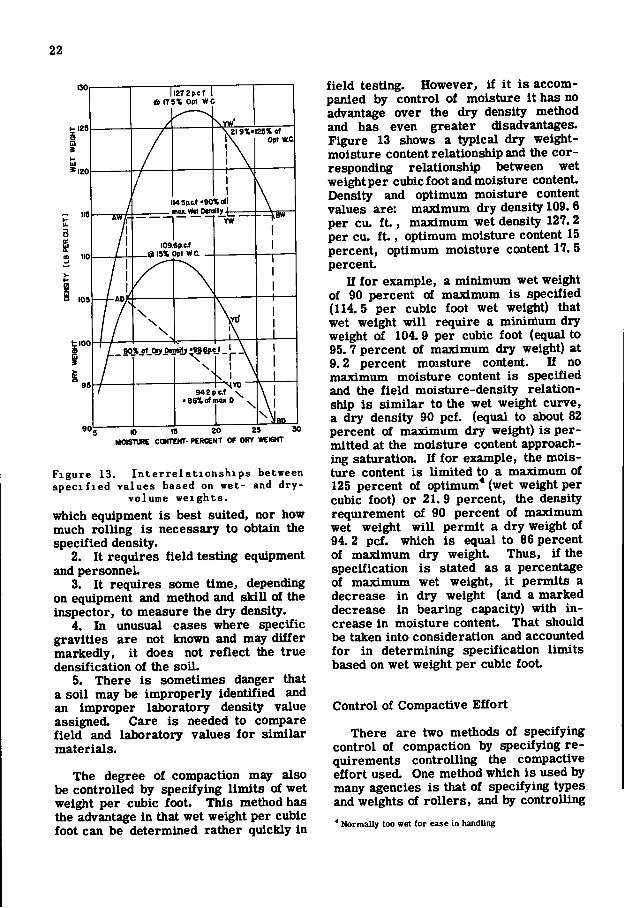
larzpief e 173% opt wc
2l9X-l29Xof o p t « q
114 Spitt'90X0(1
I09i6p.ci eisxopt wc.
94Zpe.l \ B6Xal
MOISTURE CONTEMT- PERCENT OF DRY WEKSHT
F i g u r e 13 . I n t e r r e l a t i o n s h i p s between s p e c i f i e d v a l u e s based on wet - and d r y -
vo lume w e i g h t s .
which equipment i s best suited, nor how much ro l l ing is necessary to obtain the specified density.
2. I t requires f i e l d testing equipment and personneL
3. I t requires some t ime, depending on equipment and method and sk i l l of the inspector, to measure the dry density.
4. In unusual cases where sfpecific gravities are not known and may d i f fe r markedly, i t does not reflect the true densification of the soi l .
5. There is sometimes danger that a soi l may be improperly identified and an improper laboratory density value assigned. Care is needed to compare f i e l d and laboratory values f o r s imi lar materials.
The degree of compaction may also be controlled by specifying l i m i t s of wet weight per cubic foot. This method has the advantage in that wet weight per cubic foot can be determined rather quickly in
f i e l d testing. However, i f i t i s accompanied by control of moisture i t has no advantage over the dry density method and has even greater disadvantages. Figure 13 shows a typical dry weight-moisture content relationship and the corresponding relationship between wet weight per cubic foot and moisture content. Density and optimum moisture content values are: maximum dry density 109. 6 per cu. f t . , maximum wet density 127.2 per cu. f t , optimum moisture content 15 percent, optimum moisture content 17. 5 percent
If f o r example, a minimum wet weight of 90 percent of maximum i s specified (114.5 per cubic foot wet weight) that wet weight w i l l require a mininium dry weight of 104.9 per cubic foot (equal to 95. 7 percent of maximum dry weight) at 9.2 percent moisture content. I f no maximum moisture content is specified and the f i e l d moisture-density relat ionship i s s imi la r to the wet weight curve, a dry density 90 pcf. (equal to about 82 percent of maximum dry weight) i s permitted at the moisture content approaching saturation. I f f o r example, the moisture content is l imi ted to a maximum of 125 percent of optimum* (wet weight per cubic foot) or 21. 9 percent, the density requirement of 90 percent of maximum wet weight wiU permit a dry weig^it of 94. 2 pcf. which is equal to 86 percent of maximum dry weight Thus, i f the specification is stated as a percentage of maximum wet weight, i t permits a decrease in dry weight (and a marked decrease in bearing capacity) with i n crease in moisture content. That should be taken into consideration and accounted f o r i n determining specification l imi t s based on wet weight per cubic f o o t
Control of Compactive Ef fo r t
There are two methods of specifying control of compaction by specifying re quirements controlling the compactive ef for t used. One method which i s used by many agencies is that of specifying types and weights of ro l l e r s , and by controlling
* Normally too wet for ease in handUng

23
l i f t thickness and the amount of rol l ing. The amount of ro l l ing is governed by specifying the number of passes or coverages or by including ro l le r hours as a bidding i tem and placing control of the total ef for t used under the immediate supervision of the project engineer. This method of control usually includes control of soi l moisture content Often this method also includes specification requirements relating the number of compaction units to the rate of earth moving or requires a maximum output per compaction unit.
A second method which has been p ro posed by some engineers di f fers f r o m the present density-control method only in the manner m which i t is put to use. I t consists of specifying a given compactive eff o r t f o r the material to be compacted, i f i t be embankment, subgrade, or base. For example, i t is indicated that some base materials can be compacted in the f i e l d to the density obtained in the laboratory under two AASHO T 99 compactive efforts (2 times 12,375 f t - l b . per cu- f t ) . That compactive ef for t then fo rms the basic requirement and the maximum density obtained at the compactive effor t i s the density to be obtained in the f ie ld . The compactive effor t can be applied to the identical sample removed f r o m the base in the in-place density test, and used to determine the sufficiency of f i e ld compaction. I f , f o r example, i t is found that a density less than that of Standard AASHO Method T 99 is required f o r a clay sub-grade soi l , specifications might be based on compactive effor t equal to 80 percent of standard effor t (9,900 f t - l b . per cu. f t ) which would be equivalent to 20 blows of a 5%-lb. hammer dropping 1 f t on each of three layers.
The f i r s t method given above has the advantage of keeping control i n the hands of the engineer. The effectiveness and economy of the method depend in a large degree on the care with which the quanti t ies are set up and the resourcefulness of the project engineer and his knowledge of soils and the use of equipment fo r compaction. I t has the disadvantage of preventing resourceful contractors f r o m developing and using better equipment and methods f o r compacting soil to arrive at a lower construction cost.
The second method has not yet been developed. I t has the obvious advantages of the density method without the disadvantage of present methods which specify some percentage, usually less than 100 percent, of the density obtained under standard compactive effor t .
Most specifications f o r compaction combine density control with control over equipment, giving minimum requirements f o r equipment (as to size, weight, and ratio of units to rate of earth moving), l i f t thickness, and control of moisture content.
SELECTION AND USE OF EQUIPMENT
The success, that i s , the economy and ease, of obtaining compaction depends i n large measure on the methods and on the type and weight of equipment used f o r r o l l ing. I t also depends on the equipment and methods used in placing and preparing the soil f o r rol l ing.
Dumping and Spreading
Compaction depends on the size of the loaded area, the pressure exerted on the loaded area, and on the l i f t thickness. L i f t thickness is an important factor governing the degree of compaction obtained. Many of the diff icul t ies of obtaining the desired compaction can be traced to l i f t thickness in excess of that which can be handled by the rol l ing equipment used. I t varies f o r different types of soils f o r a given piece of rol l ing equipment
Proper spreading is largely a matter of attention to the job. I t can be done d i rectly by adjusting scrapers during dumping. Proper spacing of dumps f r o m wagons makes a simple job of bulldozing or blading of the loose soil to proper l i f t thickness. Close attention to the effectiveness of the ro l le r in early t r i a l runs w i l l soon indicate the best l i f t thickness f o r the various types of soils.
I t is not possible to predict the exact l i f t thickness which results i n the most economical ro l l ing f o r a l l soils and types and weights of equipment However, some general rules can be laid down. Generally, the heavier the equipment the greater the l i f t thickness which can be handled. The rule does not hold in the
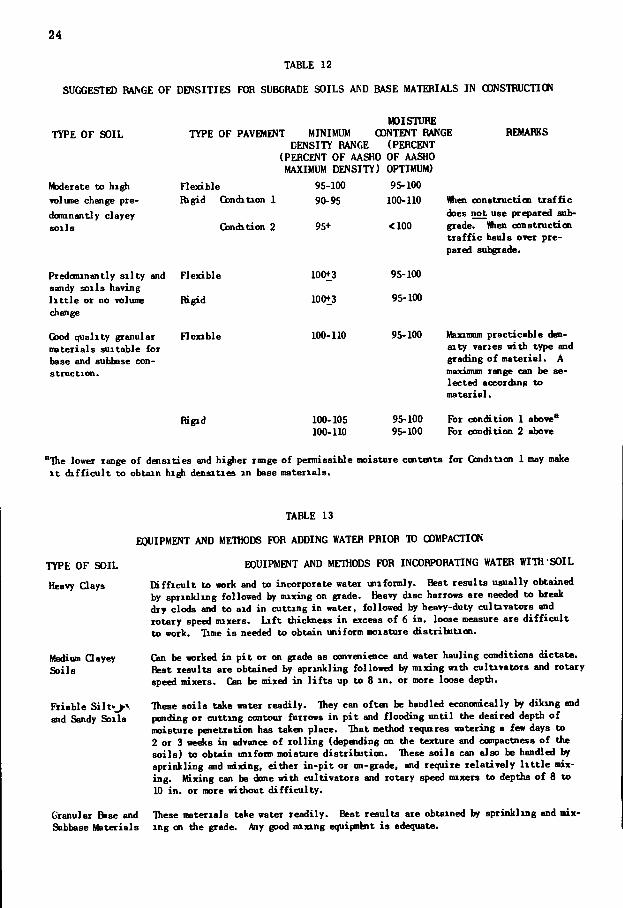
24
TABLE 12
SUGGESTED RA^GE OF DENSITIES FOR SUBGRADE SOILS AND BASE MATERIALS IN CDNSTRUCTICN
TYPE OF SOIL
Moderate to hi§^ volime change pre-dcminantly clayey soi l s
Predoninantly s i l ty and sandy soi ls having l i t t l e or no volume change
Good quality granular materials suitable for base and subbase construction.
MOISIVRE TYPE OF PAVEMENT MINIMUM CONTENT RANGE
DENSITY RANGE (PERCENT (PERCENT OF AASHO OF AASHO MAXIMUM DENSITY) OPTIMUM)
REMARKS
Flexible
Ihgid Condition 1
Condition 2
Flexible
Rigid
Flexible
95-100
90-95
95+
100+3
100+3
100-110
95-100
100-110
<100
95-100
95-100
95-100
When construction t r a f f i c does not use prepared sub-grade. Wien construction t r a f f i c hauls over prepared subgrade.
Rigid 100-105 100-110
95-100 95-100
Maxmum practicable density varies with type and grading of material. A maximum range can be selected according to material.
For condition 1 above" For condition 2 above
"The lower range of densities and h i ^ e r rmge of permissible moisture coDtoits f o r Condition 1 may make I t d i f f i c u l t to obtain h i ^ densities in base materials .
TABLE 13
EQUIPMENT AND METHODS FOB ADDING WATER PRIOR TO COMPACTION
TYPE OF SOIL EQUIPMENT AND METHODS FOR INCORPORATING WATER WITH SOIL
Heavy Qays
Medium Qayey Soi ls
Friable S i l t v J - \ and Sandy Soils
Granular ftse and Subbase Materials
D i f f i cu l t to work and to incorporate water uiifonnly. Beat results usually obtained by sprinkling followed by mixing on grade. Heavy disc harrows are needed to break dry clods and to aid in cutting in water, followed by heavy-duty culUvators and rotary speed mixers. L i f t thickness in excess of 6 in . loose measure are d i f f i c u l t to work. Time i s needed to obtain uniform moisture distribution.
Can be worked in p i t or on grade as convenience and water hauling conditions dictate. Best results are obtained by sprinkling followed by mixing with cultivators and rotary speed mixers. Can be mixed in l i f t s up to 8 i n . or more loose depth.
These so i l s take water readily. They can often be handled economically by diking and ponding or cutting contour furrows in p i t and flooding unti l the desired depth of moisture penetration has taken place. That method requires watering a few days to 2 or 3 weeks in advance of rol l ing (depending on the texture and compactness of the so i l s ) to obtain uniform moisture distribution. These so i l s can alao be handled by sprinkling and mixing, either in-pi t ot on-grade, and require relatively l i t t l e mixing. Mixing can be done with cultivators and rotary speed mixers to depths of 8 to 10 in . or more without d i f f i cu l ty .
These materials take water readily. Best results are obtained by sprinkling and mixing on the grade. Any good mixing equipnbit i s adequate.
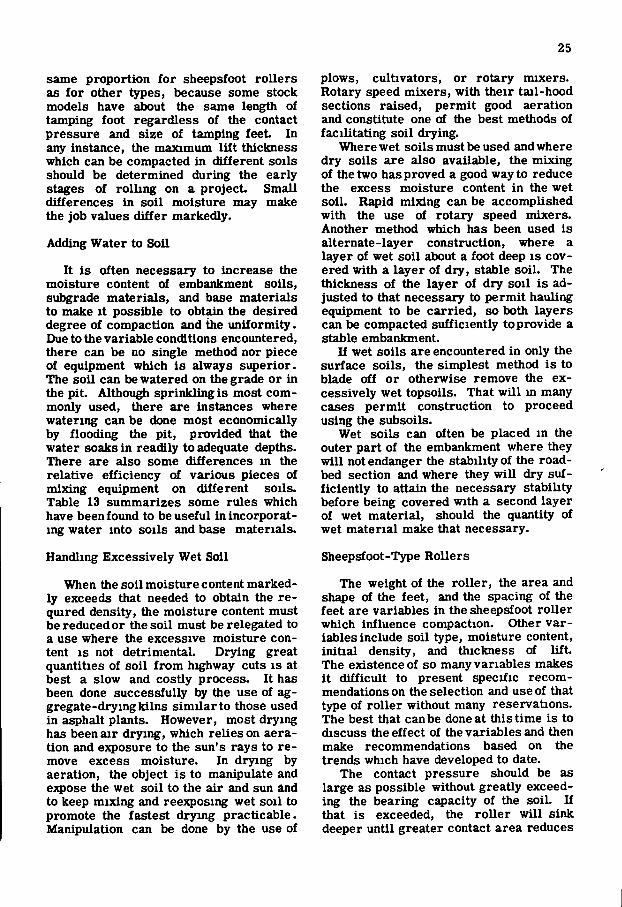
25
same proportion for sheepsfoot rollers as for other types, because some stock models have about the same length of tamping foot regardless of the contact pressure and size of tamping feet In any instance, the maximum l i f t thickness which can be compacted in different soils should be determined during the early stages of rolling on a project Small differences in soil moisture may make the job values differ markedly.
Adding Water to Soil
It is often necessary to increase the moisture content of embankment soils, subgrade materials, and base materials to make it possible to obtain the desired degree of compaction and the uniformity. Due to the variable conditions encountered, there can be no single method nor piece of equipment which is always superior. The soil can be watered on the grade or in the p i t Although sprinkling is most commonly used, there are instances where watering can be done most economically by flooding the pit, provided that the water soaks in readily to adequate depths. There are also some differences in the relative efficiency of various pieces of mixing equipment on different soils. Table 13 summarizes some rules which have been found to be useful in incorporating water into soils and base materials.
Handling Excessively Wet Soil
When the soil moisture content markedly exceeds that needed to obtain the required density, the moisture content must be reduced or the soil must be relegated to a use where the excessive moisture content is not detrimental. Drying great quantities of soil from highway cuts is at best a slow and costly process. It has been done successfully the use of aggregate-drying kilns similar to those used in asphalt plants. However, most drying has been air drying, which relies on aeration and exposure to the sun's rays to remove excess moisture. In drying by aeration, the object is to manipulate and expose the wet soil to the air and sun and to keep mixing and reexposing wet soil to promote the fastest drymg practicable. Manipulation can be done by the use of
plows, cultivators, or rotary mixers. Rotary speed mixers, with their tail-hood sections raised, permit good aeration and constitute one of the best methods of facilitating soil drying.
Where wet soils must be used and where dry soils are also available, the mixing of the two has proved a good way to reduce the excess moisture content in the wet soil. Rapid mixing can be accomplished with the use of rotary speed mixers. Another method which has been used is alternate-layer construction, where a layer of wet soil about a foot deep is covered with a layer of dry, stable soil. The thickness of the layer of dry soil is adjusted to that necessary to permit hauling equipment to be carried, so both layers can be compacted sufficiently to provide a stable embankment.
If wet soils are encountered in only the surface soils, the simplest method is to blade off or otherwise remove the excessively wet topsoils. That wi l l m many cases permit construction to proceed using the subsoils.
Wet soils can often be placed in the outer part of the embankment where they wil l not endanger the stability of the roadbed section and where they wil l dry sufficiently to attain the necessary stability before being covered with a second layer of wet material, should the quantity of wet material make that necessary.
Sheepsfoot-Type Rollers
The weight of the roller, the area and shape of the feet, and the spacing of the feet are variables in the sheepsfoot roller which influence compaction. Other variables include soil type, moisture content, initial density, and thickness of l i f t The existence of so many variables makes it difficult to present specific recommendations on the selection and use of that type of roller without many reservations. The best that can be done at this time is to discuss the effect of the variables and then make recommendations based on the trends which have developed to date.
The contact pressure should be as large as possible without greatly exceeding the bearing capacity of the soil. If that is exceeded, the roller wi l l sink deeper until greater contact area reduces
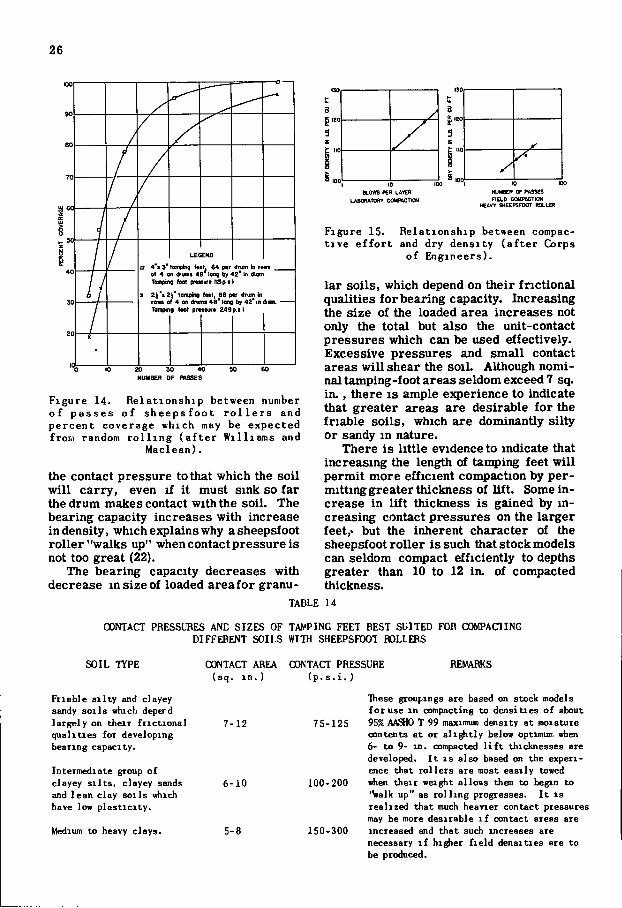
26
a 4 a 9 toniping fMt, 64 p«r dnim In rowi of 4 en 46 long by 42 ' In Dion Ttenplng foot pnsnrt tISp 11
2J « zr lompUg f w l , 66 p<f drum In ro«« of 4 on drnni 4 8 ' long by 42" in dum. nminig fool p m u r t 249p. i l
NUM6ER OF KSSES
Figure 14. Relat ionship between number o f p a s s e s of sheeps foo t r o l l e r s and percent coverage which may be expected from random r o l l i n g ( a f t e r Williams and
Maclean).
the contact pressure to that which the soil wi l l carry, even if it must sink so far the drum makes contact with the soil. The bearing capacity increases with increase in density, which explains why a sheepsfoot roller "walks up" when contact pressure is not too great (22).
The bearing capacity decreases with decrease in size of loaded areafor granu-
BL0W5 PER LAYER LABCRATORY CGHPACT10N
NUUBER OF PASSES FIELD COUPACTION
KAVT WEEPSFOOr ROLLER
Figure 15. Relationship between compac-t ive e f for t and dry density (a f ter Ckirps
of Engineers) .
lar soils, which depend on their fnctional qualities forbearing capacity. Increasing the size of the loaded area increases not only the total but also the unit-contact pressures which can be used effectively. Excessive pressures and small contact areas wi l l shear the soil. Although nominal tamping-foot areas seldom exceed 7 sq. i n . , there is ample experience to indicate that greater areas are desirable for the friable soils, which are dominantly silty or sandy in nature.
There is little evidence to indicate that increasing the length of tamping feet wi l l permit more efficient compaction by permitting greater thickness of l i f t . Some increase in l i f t thickness is gained by increasing contact pressures on the larger feet,> but the inherent character of the sheepsfoot roller is such that stock models can seldom compact efficiently to depths greater than 10 to 12 in. of compacted thickness.
TABLE 14
CONTACT PRESSURES AND SIZES OF TAVPING FEET BEST SUITED FOR COMPAaiNG DIFFERENT SOILS WITH SHEEPSFOOT HOLLERS
SOIL TYPE
Friable silty and clayey sandy soils which depend largely on their fnctional qualities for developing bearing capacity.
Inteimediate group of clayey silts, clayey sands and lean clay soils which have low plasticity.
Medium to heavy clays.
CONTACT AREA (sq. i n . )
7-12
CONTACT PRESSURE ( p . s . i . )
REMARKS
6-10
5-8
These groupings are based on stock models for use m compacting to densities of about
75-125 95% AAEHO T 99 maximum density at moisture contents at or s l i^t ly below optimuir, when 6- to 9- in. compacted l i f t thicknesses are developed. I t is also based on the experience that rollers are most easily towed
100-200 when their weight allows them to begin to 'Vialk up" as rolling progresses. I t is realized that much heavier contact pressures may be more desirable i f contact areas are
150-300 increased and that such increases are necessary i f higher field densities are to be produced.
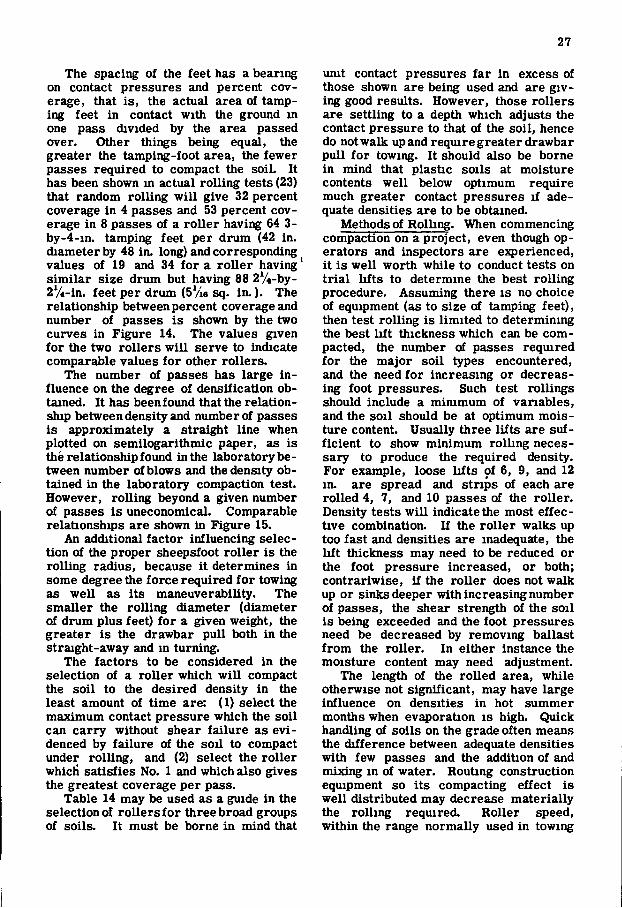
27
The spacing of the feet has a bearing on contact pressures and percent coverage, that is, the actual area of tamping feet in contact with the ground in one pass divided by the area passed over. Other things being equal, the greater the tamping-foot area, the fewer passes required to compact the soiL It has been shown in actual rolling tests (23) that random rolling wi l l give 32 percent coverage in 4 passes and 53 percent coverage in 8 passes of a roller having 64 3-by-4-in. tamping feet per drum (42 in. diameter by 48 in. long) and corresponding values of 19 and 34 for a roller having' similar size drum but having 88 2%-by-2V4-in. feet per drum (SVis sq. in.) . The relationship between percent coverage and number of passes is shown by the two curves in Figure 14. The values given for the two rollers wi l l serve to indicate comparable values for other rollers.
The number of passes has large influence on the degree of densification obtained. It has beenfound that the relationship between density and number of passes is approximately a straight line when plotted on semilogarithmic paper, as is the relationship found in the laboratory between number of blows and the density obtained in the laboratory compaction test. However, rolling beyond a given number of passes is uneconomical. Comparable relationships are shown in Figure 15.
An additional factor influencing selection of the proper sheepsfoot roller is the rolling radius, because i t determines in some degree the force required for towing as well as its maneuverability. The smaller the rolling diameter (diameter of drum plus feet) for a given weight, the greater is the drawbar pull both in the straight-away and m turning.
The factors to be considered in the selection of a roller which wi l l compact the soil to the desired density in the least amount of time are: (1) select the maximum contact pressure which the soil can carry without shear failure as evidenced by failure of the soil to compact under rolling, and (2) select the roller whicH satisfies No. 1 and which also gives the greatest coverage per pass.
Table 14 may be used as a guide in the selection o! rollers for three broad groups of soils. It must be borne in mind that
umt contact pressures far in excess of those shown are being used and are giving good results. However, those rollers are settling to a depth which adjusts the contact pressure to that of the soil, hence do not walk up and require greater drawbar pull for towing. It should also be borne in mind that plastic soils at moisture contents well below optimum require much greater contact pressures if adequate densities are to be obtained.
Methods of Rolling. When commencing compaction on a project, even though operators and inspectors are e:q)erienced, it is well worth while to conduct tests on tr ial lifts to determine the best rolling procedure. Assuming there is no choice of equipment (as to size of tamping feet), then test rolling is limited to determining the best l i f t thickness which can be compacted, the number of passes required for the major soil types encountered, and the need for increasing or decreasing foot pressures. Such test rollings should include a minimum of variables, and the soil should be at optimum moisture content. Usually three l if ts are sufficient to show minimum rolling necessary to produce the required density. For example, loose lifts of 6, 9, and 12 in. are spread and strips of each are rolled 4, 7, and 10 passes of the roller. Density tests wi l l indicate the most effective combination. If the roller walks up too fast and densities are inadequate, the hf t thickness may need to be reduced or the foot pressure increased, or both; contrariwise, if the roller does not walk up or sinks deeper with increasing number of passes, the shear strength of the soil is being exceeded and the foot pressures need be decreased by removing ballast from the roller. In either instance the moisture content may need adjustment.
The length of the roUed area, while otherwise not significant, may have large influence on densities in hot summer months when evaporation is high. Quick handling of soils on the grade often means the difference between adequate densities with few passes and the addition of and mixing m of water. Routing construction equipment so its compacting effect is well distributed may decrease materially the rolling required. Roller speed, within the range normally used in towing
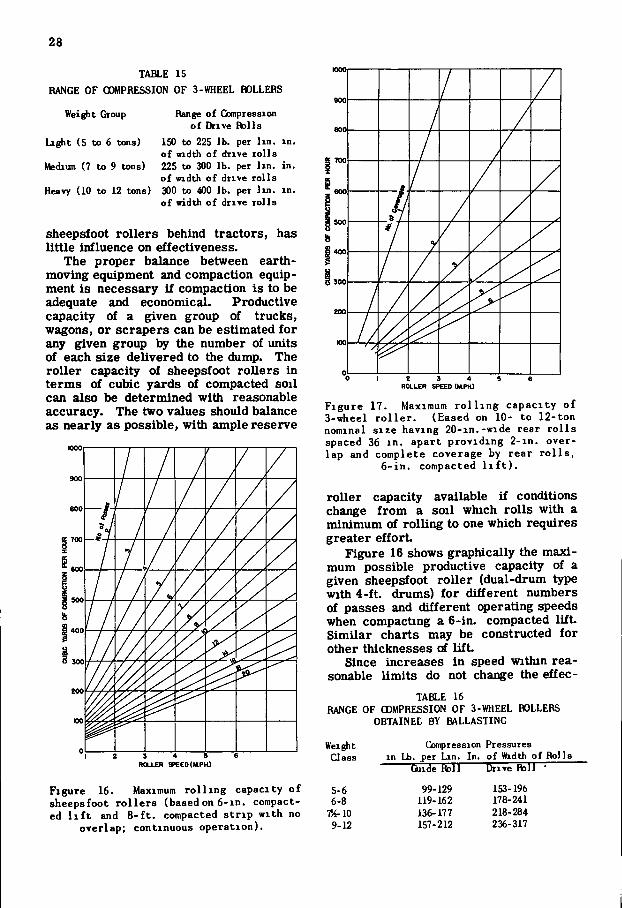
28
TABLE 15 RANGE OF QOHPRESSION OF 3-WHEEL ROLLERS
Weight Gtoup
Light (5 to 6 tons)
Medium (7 to 9 tons)
Heavy (10 to 12 tons)
Range of Compression of Drive Ralls
ISO to 225 lb. per l in. in. of width of drive rolls 225 to 300 lb. per lin. in. of width of drive rolls 300 to 400 lb. per lin. in. of width of drive rolls
sheepsfoot rollers behind tractors, has little influence on effectiveness.
The proper balance between earth-moving equipment and compaction equipment is necessary if compaction is to be adequate and economical. Productive capacity of a given group of trucks, wagons, or scrapers can be estimated for any given group by the number of units of each size delivered to the dump. The roller capacity of sheepsfoot rollers in terms of cubic yards of compacted soil can also be determined with reasonable accuracy. The two values should balance as nearly as possible, with ample reserve
S 4 5 RXLER SPEED (UPH)
Figure 16. Maximum rol l ing capacity of sheepsfoot ro l lers (based on 6-in. compacted l i f t and 8-f t . compacted s tr ip with no
overlap; continuous operation).
I S 4 ROLLER SPEED (UPHJ
Figure 17. Maximum r o l l i n g capacity of 3-wheel r o l l e r . (Eased on 10- to 12-ton nominal s ize having 20-in.-wide rear ro l l s spaced 36 in . apart providing 2-in. overlap and complete coverage by rear r o l l s ,
6 - in . compacted l i f t ) .
roller capacity available i f conditions change from a soil which rolls with a minimum of rolling to one which requires greater effort
Figure 16 shows graphically the maximum possible productive capacity of a given sheepsfoot roller (dual-drum type with 4-ft. drums) for different numbers of passes and different operating speeds when compacting a 6-in. compacted l i f t . Similar charts may be constructed for other thicknesses of l i f t
Since increases in speed within reasonable limits do not change the effec-
TABLE 16 RANGE OF (DMPRESSION OF 3-WHEEL HOLLERS
OBTAINED BY BALLASTING
Weight Class
5- 6 6- 8
r/4-10 9-12
Compression Pressures in Lb. j>er Un. In. of Width of Rolls
Guide [toll Drive Roll •
99-129 119-162 136-177 157-212
153-196 178-241 218-284 236-317
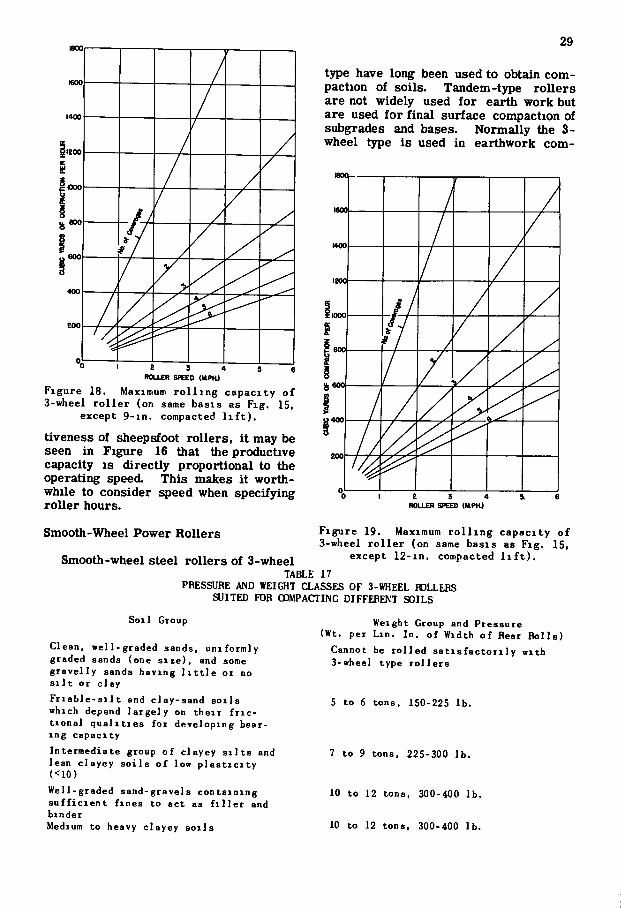
29
type have long been used to obtain compaction of soils. Tandem-type rollers are not widely used for earth work but are used for final surface compaction of subgrades and bases. Normally the 3-wheel type is used in earthwork com-
2 3 4 9 6 ROLLER SPEED (MPK)
Figure 18. Maximum r o l l i n g capacity of 3-wheel r o l l e r (on same basis as Fig. 15,
except 9- in . compacted l i f t ) .
tiveness of sheepsfoot rollers, i t may be seen in Figure 16 that the productive capacity is directly proportional to the operating speed. This makes i t worthwhile to consider speed when specifying roller hours.
Smooth-Wheel Power Rollers
XKXX)
U400
2 9 4 ROLLER SPEED (MPK)
Figure 19. Maximum r o l l i n g capacity of 3-wheel r o l l e r (on same basis as F ig . 15,
except 12-in. compacted l i f t ) . Smooth-wheel steel rollers of 3-wheel TABLE 17
PRESSURE AND WEIGHT CLASSES OF 3-WHEEL HOLLERS SUITED FOR COMPACTING DIFFERENT SOILS
Soil Group
Clean, well-graded sands, uniformly graded sands (one s i ze ) , and some gravelly sands having l i t t l e or no s i l t or clay F r i a b l e - s i l t and clay-sand soi ls which depend largely on their f r i c -tional qualit ies for developing bearing capacity Intermediate group of clayey s i l t s and lean clayey so i l s of low plas t ic i ty (<10) Well-graded sand-gravels containing suff ic ient fines to act as f i l l e r and binder Medium to heavy clayey soi ls
Weight Group and Pressure (Wt. per L in . In . of Width of Rear Rol ls)
Cannot be rolled sat i s factor i ly with 3-wheel type rol lers
5 to 6 tons, 150-225 lb.
7 to 9 tons, 225-300 lb.
10 to 12 tons, 300-400 lb.
10 to 12 tons, 300-400 lb.
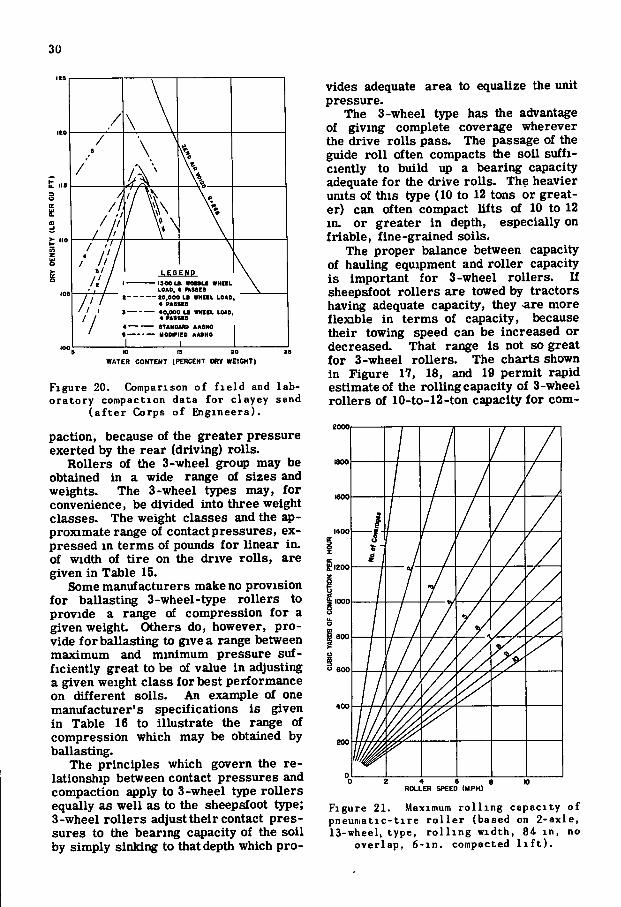
30
1900 IB. W0B8LC WHCEL LOAD, e P U S E S 2 0 , 0 0 0 LB WHEEL LOAD 4 PASSES
S 4 0 , 0 0 0 LB WHEEL LOAD.
BTAHOARO AASHO HODIFIED AA8H0
WATER CONTENT (PERCENT DRY WEIGHT)
Figure 20. (Comparison of f i e l d and laboratory compaction data for clayey sand
( a f t e r (Corps of Engineers) .
paction, because of the greater pressure exerted by the rear (driving) rolls.
Rollers of the 3-wheel group may be obtained in a wide range of sizes and weights. The 3-wheel types may, for convenience, be divided into three weight classes. The weight classes and the ^ -proximate range of contactpressures, expressed in terms of pounds for linear in. of width of tire on the drive rolls, are given in Table 15.
Some manufacturers make no provision for ballasting 3-wheel-type rollers to provide a range of compression for a given weight Others do, however, provide for ballasting to give a range between maximum and minimum pressure sufficiently great to be of value in adjusting a given weight class for best performance on different soils. An example of one manufacturer's specifications is given in Table 16 to illustrate the range of compression which may be obtained by ballasting.
The principles which govern the relationship between contact pressures and compaction apply to 3-wheel type rollers equally as well as to the sheepsfoot tjrpe; 3-wheel rollers adjust their contact pressures to the bearing capacity of the soil by simply sinking to that depth which pro
vides adequate area to equalize the unit pressure.
The 3-wheel type has the advantage of giving complete coverage wherever the drive rolls pass. The passage of the guide rol l often compacts the soil sufficiently to build up a bearing capacity adequate for the drive rolls. The heavier umts of this type (10 to 12 tons or greater) can often compact lifts of 10 to 12 m. or greater in depth, especially on friable, fine-grained soils.
The proper balance between capacity of hauling equipment and roller capacity is important for 3-wheel rollers. If sheepsfoot rollers are towed by tractors having adequate capacity, they -are more flexible in terms of capacity, because their towing speed can be increased or decreased. That range is not so great for 3-wheel roUers. The charts shown in Figure 17, 18, and 19 permit rapid estimate of the rolling capacity of 3-wheel rollers of lO-to-12-ton capacity for com-
u 600
4 6 8 ROLLER SPEED (M.PM)
Figure 21. Maximum r o l l i n g capacity of pneuniatic-tire r o l l e r (based on 2-axle, 13-wheel, type, r o l l i n g width, 84 i n , no
overlap, 6 - i n . compacted l i f t ) .
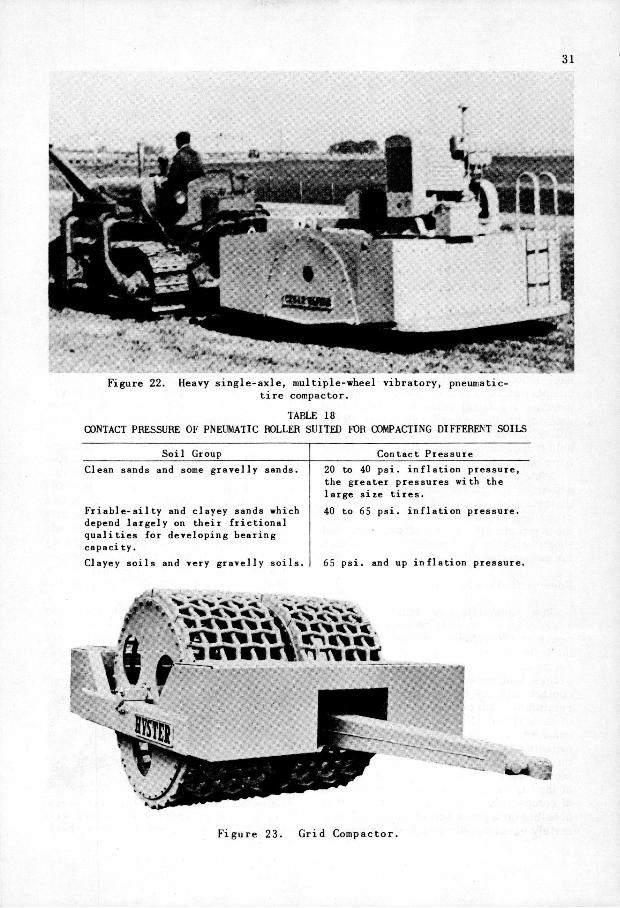
31
Figure 22. Heavy single-axle, multiple-wheel vibratory, pneumatic-t i r e compactor.
TABLE 18 CONTACT PRESSURE OF PNEUMATIC ROLLER SUITED FOR COMPACTING DIFFERENT SOILS
Soil Group Contact Pressure Clean sands and some gravelly sands.
Fr iab le - s i l ty and clayey sands which depend largely on their fr ict ional qualit ies for developing bearing capaci ty. Clayey so i l s and very gravelly so i l s .
20 to 40 ps i . inf lat ion pressure, the greater pressures with the large size t i re s .
40 to 65 ps i . inf lat ion pressure.
65 ps i . and up inf lat ion pressure.
Figure 23. G r i d Compactor.
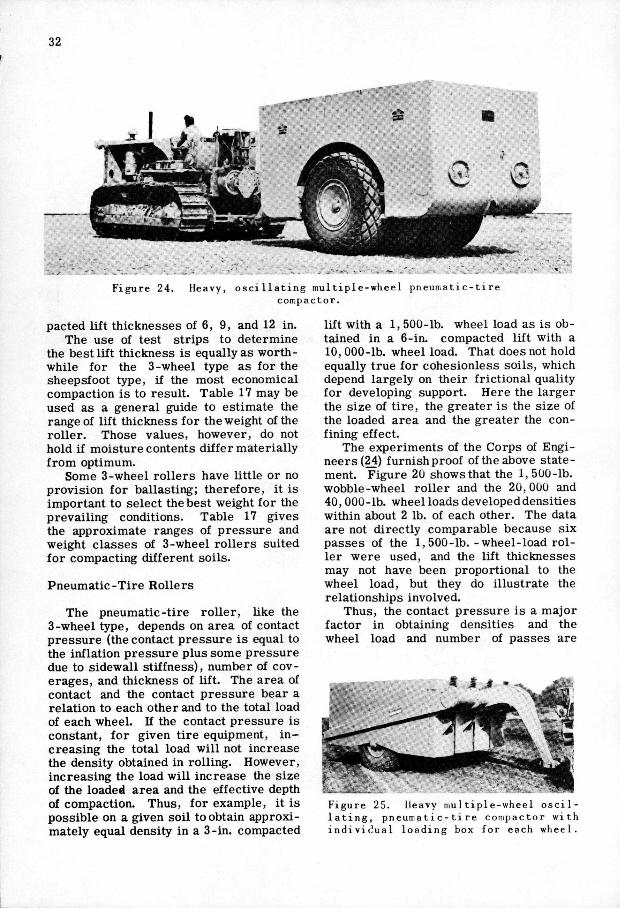
32
Figure 24. Heavy, o s c i l l a t i n g multipie-wheel pneurr.atic-tire compactor.
pacted lift thicknesses of 6, 9, and 12 in. The use of test strips to determine
the best lift thickness is equally as worthwhile for the 3-wheel type as for the sheepsfoot type, if the most economical compaction is to result. Table 17 may be used as a general guide to estimate the range of lift thickness for the weight of the roller. Those values, however, do not hold if moisture contents differ materially from optimum.
Some 3-wheel rollers have little or no provision for ballasting; therefore, it is important to select the best weight for the prevailing conditions. Table 17 gives the approximate ranges of pressure and weight classes of 3-wheel rollers suited for compacting different soils.
Pneumatic-Tire Rollers
The pneumatic-tire roller, like the 3-wheel type, depends on area of contact pressure (the contact pressure is equal to the inflation pressure plus some pressure due to sidewall stiffness), number of coverages, and thickness of lift. The area of contact and the contact pressure bear a relation to each other and to the total load of each wheel. If the contact pressure is constant, for given tire equipment, increasing the total load will not increase the density obtained in rolling. However, increasing the load will increase the size of the loaded area and the effective depth of compaction. Thus, for example, it is possible on a given soil to obtain approximately equal density in a 3-in. compacted
lift with a 1, 500-lb. wheel load as is obtained in a 6-in. compacted lift with a 10, 000-lb. wheel load. That does not hold equally true for cohesionless soils, which depend largely on their frictional quality for developing support. Here the larger the size of tire, the greater is the size of the loaded area and the greater the confining effect.
The experiments of the Corps of Engineers (24) furnishproof of the above statement. Figure 20 shows that the 1, 500-lb. wobble-wheel roller and the 20,000 and 40, 000-lb. wheel loads developed densities within about 2 lb. of each other. The data are not directly comparable because six passes of the 1, 500-lb.-wheel-load roller were used, and the lift thicknesses may not have been proportional to the wheel load, but they do illustrate the relationships involved.
Thus, the contact pressure is a major factor in obtaining densities and the wheel load and number of passes are
Figure 25. Heavy mu1tipie-wheel o s c i l l a t i n g , pneuir a t i c - t i re compactor with indivi<!ual loading box for each wheel.
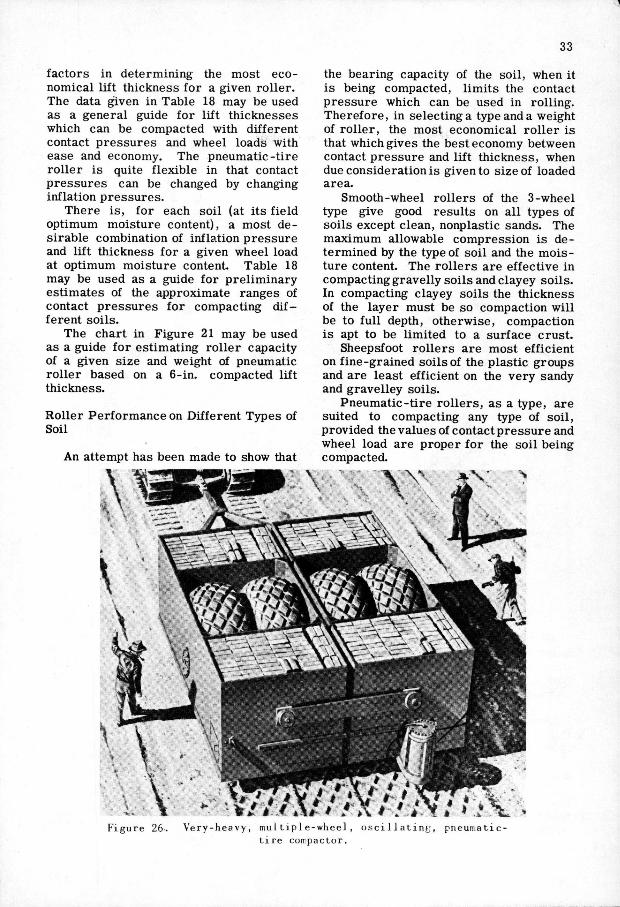
33
factors in determining the most economical lift thickness for a given roller. The data given in Table 18 may be used as a general guide for lift thicknesses which can be compacted with different contact pressures and wheel loads with ease and economy. The pneumatic-tire roller is quite flexible in that contact pressures can be changed by changing inflation pressures.
There is, for each soil (at its field optimum moisture content), a most desirable combination of inflation pressure and lift thickness for a given wheel load at optimum moisture content. Table 18 may be used as a guide for preliminary estimates of the approximate ranges of contact pressures for compacting different soils.
The chart in Figure 21 may be used as a guide for estimating roller capacity of a given size and weight of pneumatic roller based on a 6-in. compacted lift thickness.
Roller Performance on Different Types of Soil
An attempt has been made to show that
the bearing capacity of the soil, when it is being compacted, limits the contact pressure which can be used in rolling. Therefore, in selecting a type and a weight of roller, the most economical roller is that which gives the best economy between contact pressure and lift thickness, when due consideration is given to size of loaded area.
Smooth-wheel rollers of the 3-wheel type give good results on all types of soils except clean, nonplastic sands. The maximum allowable compression is determined by the type of soil and the moisture content. The rollers are effective in compacting gravelly soils and clayey soils. In compacting clayey soils the thickness of the layer must be so compaction will be to full depth, otherwise, compaction is apt to be limited to a surface crust.
Sheepsfoot rollers are most efficient on fine-grained soils of the plastic groups and are least efficient on the very sandy and gravelley soils.
Pneumatic-tire rollers, as a type, are suited to compacting any type of soil, provided the values of contact pressure and wheel load are proper for the soil being compacted.
\
pneumatic-Figure 26. Very-heavy, tnul t i p 1 e-wheel , o s c i l l a t i n g , t i r e conr^pactor.
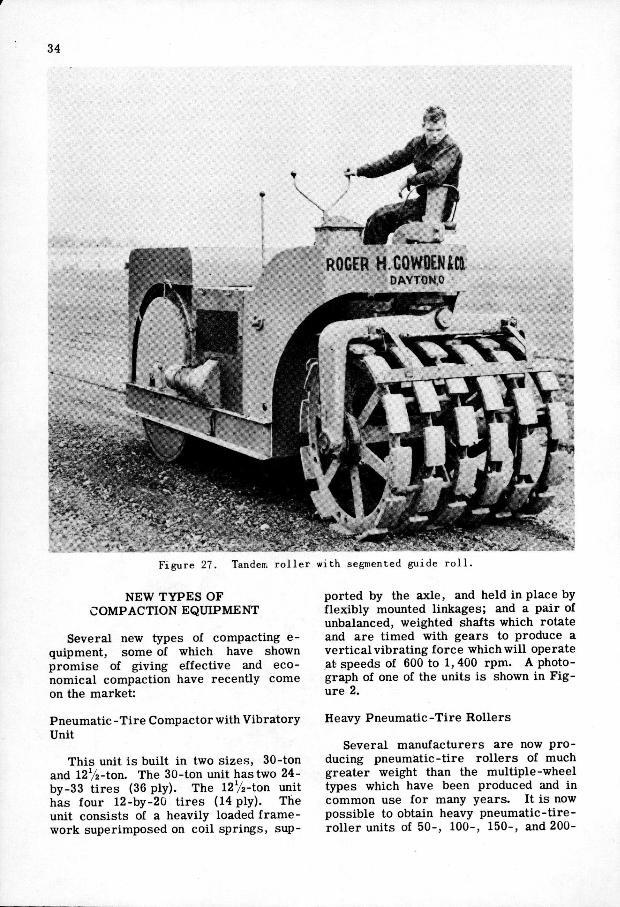
34
R O G E R H . C O W K N m OAYTON.O
V
.-5
Figure 27. Tanderr. ro l l e r with segmented guide r o l l .
NEW TYPES OF COMPACTION EQUIPMENT
Several new types of compacting e-quipment, some of which have shown promise of giving effective and economical compaction have recently come on the market:
Pneumatic -Tire Compactor with Vibratory Unit
This unit is built in two sizes, 30-ton and 12y2-ton. The 30-ton unit has two 24-by-33 tires (36 ply). The 12y2-ton unit has four 12-by-20 tires (14 ply). The unit consists of a heavily loaded framework superimposed on coil springs, sup
ported by the axle, and held in place by flexibly mounted linkages; and a pair of unbalanced, weighted shafts which rotate and are timed with gears to produce a vertical vibrating force which will operate at speeds of 600 to 1, 400 rpm. A photograph of one of the units is shown in Figure 2.
Heavy Pneumatic-Tire Rollers
Several manufacturers are now producing pneumatic-tire rollers of much greater weight than the multiple-wheel types which have been produced and in common use for many years. It is now possible to obtain heavy pneumatic-tire-roller units of 50-, 100-, 150-, and 200-
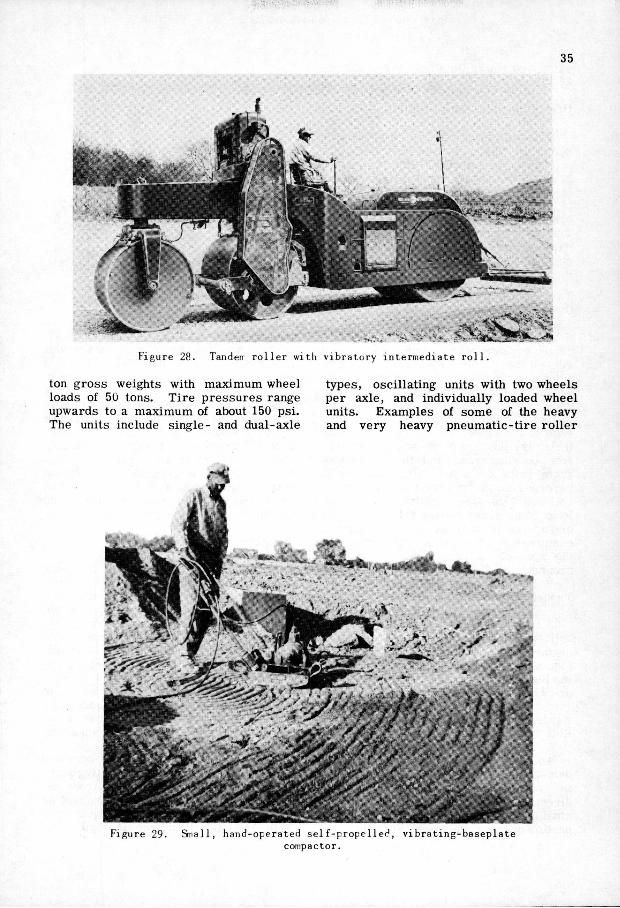
35
Figure 28. Tanden r o l l e r wi th v ib ra tory intermediate r o l l .
ton gross weights with maximum wheel loads of 50 tons. Tire pressures range upwards to a maximum of about 150 psi. The units include single- and dual-axle
types, oscillating units with two wheels per axle, and individually loaded wheel units. Examples of some of the heavy and very heavy pneumatic-tire roller
#1*
Figure 29. Small, hand-operated s e l f -p rope l l ed , vibrat ing-baseplate compactor.
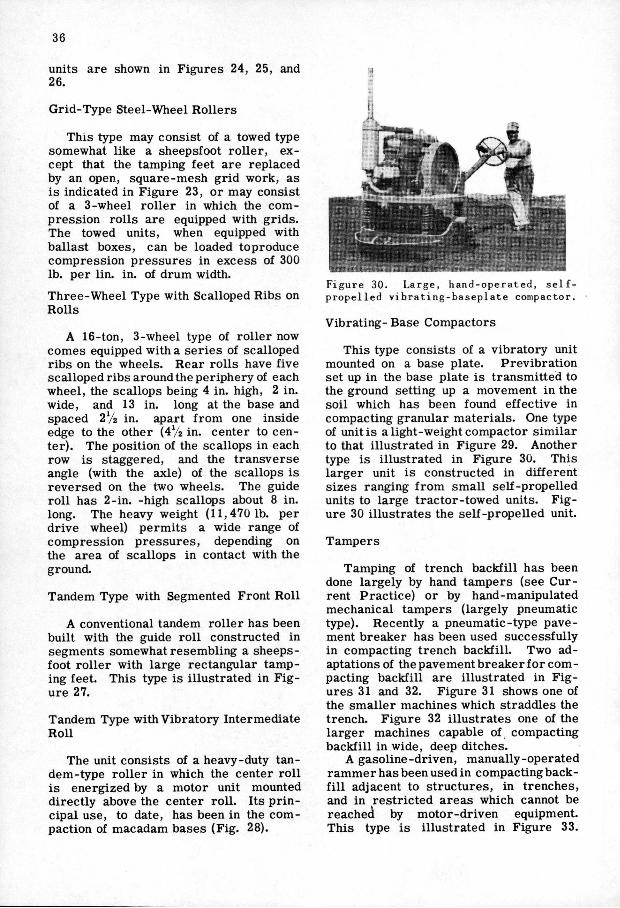
36
units are shown in Figures 24, 25, and 26.
Grid-Type Steel-Wheel Rollers
This type may consist of a towed type somewhat like a sheepsfoot roller, except that the tamping feet are replaced by an open, square-mesh grid work, as is indicated in Figure 23, or may consist of a 3-wheel roller in which the compression rolls are equipped with grids. The towed units, when equipped with ballast boxes, can be loaded toproduce compression pressures in excess of 300 lb. per lin. in. of drum width. Three-Wheel Type with Scalloped Ribs on Rolls
A 16-ton, 3-wheel type of roller now comes equipped with a series of scalloped ribs on the wheels. Rear rolls have five scalloped ribs around the periphery of each wheel, the scallops being 4 in. high, 2 in. wide, and 13 in. long at the base and spaced 272 in. apart from one inside edge to the other (4V2 in. center to center). The position of the scallops in each row is staggered, and the transverse angle (with the axle) of the scallops is reversed on the two wheels. The guide roll has 2-in. -high scallops about 8 in. long. The heavy weight (11,470 1b. per drive wheel) permits a wide range of compression pressures, depending on the area of scallops in contact with the ground.
Tandem Type with Segmented Front Roll
A conventional tandem roller has been built with the guide roll constructed in segments somewhat resemblii^ a sheepsfoot roller with large rectangular tamping feet. This type is illustrated in Figure 27.
Tandem Type with Vibratory Intermediate Roll
The unit consists of a heavy-duty tandem-type roller in which the center roll is energized by a motor unit mounted directly above the center roll. Its principal use, to date, has been in the compaction of macadam bases (Fig. 28).
Figure 30. Large, hand-operated, s e l f -propelled vibrating-baseplate compactor.
Vibrating- Base Compactors
This type consists of a vibratory unit mounted on a base plate. Previbration set up in the base plate is transmitted to the ground setting up a movement in the soil which has been found effective in compacting granular materials. One type of unit is a light-weight compactor similar to that illustrated in Figure 29. Another type is illustrated in Figure 30. This larger unit is constructed in different sizes ranging from small self-propelled units to large tractor-towed units. Figure 30 illustrates the self-propelled unit.
Tampers
Tamping of trench backfill has been done largely by hand tampers (see Current Practice) or by hand-manipulated mechanical tampers (largely pneumatic type). Recently a pneumatic-type pavement breaker has been used successfully in compacting trench backfill. Two adaptations of thepavementbreakerforcompacting backfill are illustrated in Figures 31 and 32. Figure 31 shows one of the smaller machines which straddles the trench. Figure 32 illustrates one of the larger machines capable of compacting backfill in wide, deep ditches.
A gasoline-driven, manually-operated rammer has been used in compacting backfill adjacent to structures, in trenches, and in restricted areas which cannot be reached by motor-driven equipment. This type is illustrated in Figure 33.
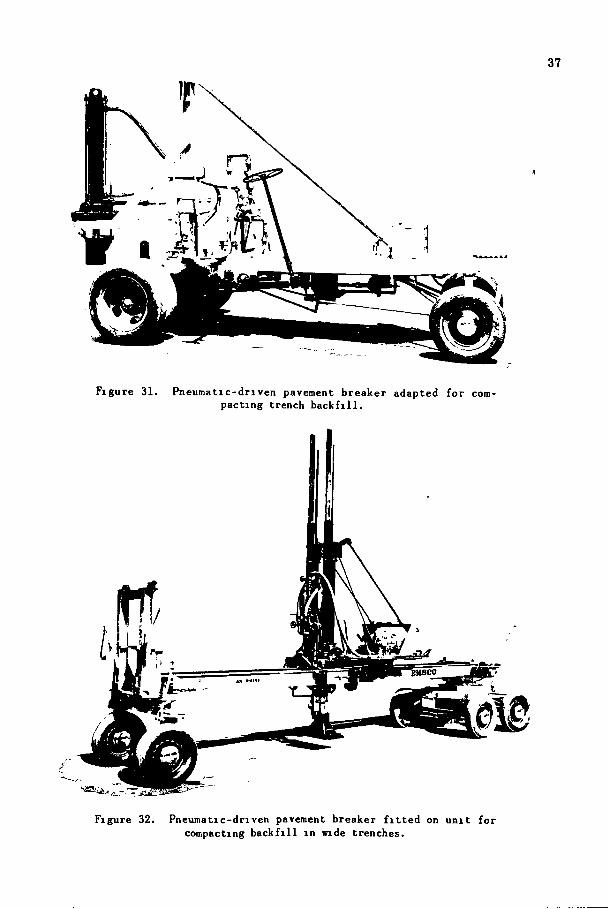
37
Figure 31. Pneumatic-driven pavement breaker adapted for con pacting trench b a c k f i l l .
euaco
Figure 32. Pneumatic-dnven pavement breaker f i t t e d on unit for compacting backf i l l in wide trenches.
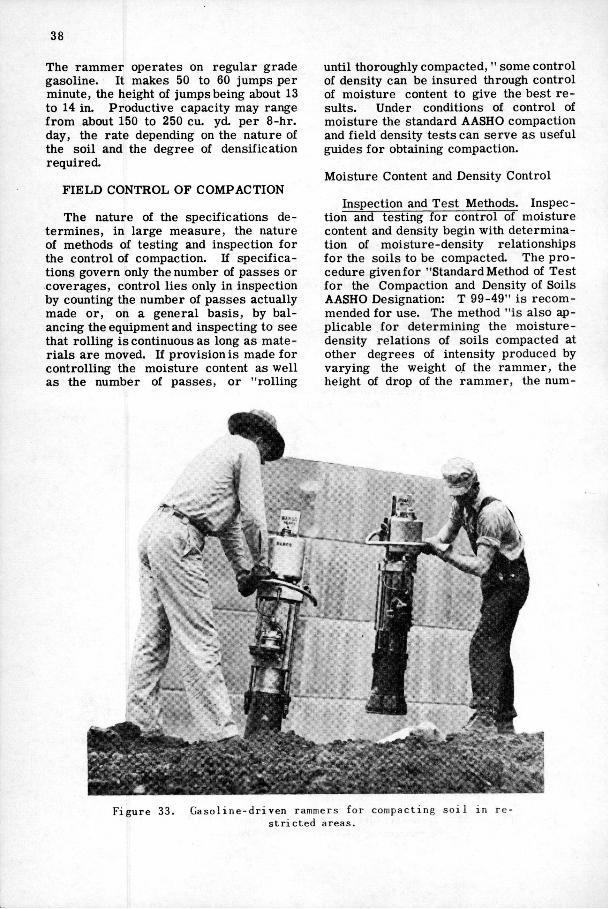
38
The rammer operates on regular grade gasoline. It makes 50 to 60 jumps per minute, the height of jumps being about 13 to 14 in. Productive capacity may range from about 150 to 250 cu. yd. per 8-hr. day, the rate depending on the nature of the soil and the degree of densification required.
FIELD CONTROL OF COMPACTION
The nature of the specifications determines, in large measure, the nature of methods of testing and inspection for the control of compaction. If specifications govern only the number of passes or coverages, control lies only in inspection by counting the number of passes actually made or, on a general basis, by balancing the equipment and inspecting to see that rolling is continuous as long as materials are moved. It provision is made for controlling the moisture content as well as the number of passes, or "rolling
until thoroughly compacted," some control of density can be insured through control of moisture content to give the best results. Under conditions of control of moisture the standard AASHO compaction and field density tests can serve as useful guides for obtaining compaction.
Moisture Content and Density Control
Inspection and Test Methods. Inspection and testing for control of moisture content and density begin with determination of moisture-density relationships for the soils to be compacted. The procedure given for "Standard Method of Test for the Compaction and Density of Soils AASHO Designation: T 99-49" is recommended for use. The method "is also applicable for determining the moisture-density relations of soils compacted at other degrees of intensity produced by varying the weight of the rammer, the height of drop of the rammer, the num-
Figure 33. G a s o l i n e - d r i v e n rammers f o r compacting s o i l str icted areas.
i n r e -
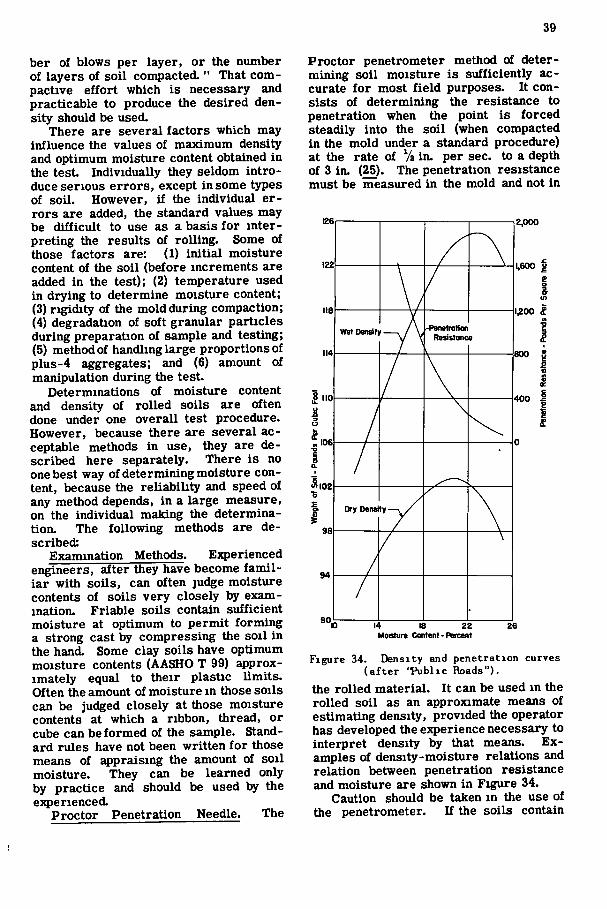
39
ber of blows per layer, or the number of layers of soil compacted. " That com-pactive effort which is necessary and practicable to produce the desired density should be used.
There are several factors which may influence the values of maximum density and optimum moisture content obtained in the test Individually they seldom introduce serious errors, except in some types of soil. However, if the individual errors are added, the standard values may be difficult to use as a basis for interpreting the results of rolling. Some of those factors are: (1) initial moisture content of the soil (before increments are added in the test); (2) temperature used in drying to determine moisture content; (3) rigidity of the mold during compaction; (4) degradation of soft granular particles during preparation of sample and testing; (5) method of handling large proportions of plus-4 aggregates; and (6) amount of manipulation during the test.
Determinations of moisture content and density of rolled soils are often done under one overall test procedure. However, because there are several acceptable methods in use, they are described here separately. There is no one best way of determining moisture content, because the reliability and speed of any method depends, in a large measure, on the individual making the determination. The following methods are described:
Examination Methods. Experienced engineers, after they have become familiar with soils, can often judge moisture contents of soils very closely by examination. Friable soils contain sufficient moisture at optimum to permit forming a strong cast by compressing the soil in the hand. Some clay soils have optimum moisture contents (AASHO T 99) approximately equal to their plastic limits. Often the amount of moisture in those soils can be judged closely at those moisture contents at which a ribbon, thread, or cube can be formed of the sample. Standard rules have not been written for those means of appraising the amount of soil moisture. They can be learned only by practice and should be used by the experienced.
Proctor Penetration Needle. The
Proctor penetrometer method of determining soil moisture is sufficiently accurate for most field purposes. It consists of determining the resistance to penetration when the point is forced steadily into the soil (when compacted in the mold under a standard procedure) at the rate of V2 in. per sec. to a depth of 3 in. (25). The penetration resistance must be measured in the mold and not in
zpoo
Penetration Resistance Wet Density
Dry Density
1,600
1^00
800
400
14 18 22 Mosttire Content - Percent
Figure 34. Density and penetration curves (after 'Public Roads").
the rolled material. It can be used in the rolled soil as an approximate means of estimating density, provided the operator has developed the experience necessary to interpret density by that means. Examples of density-moisture relations and relation between penetration resistance and moisture are shown in Figure 34.
Caution should be taken in the use of the penetrometer. If the soils contain
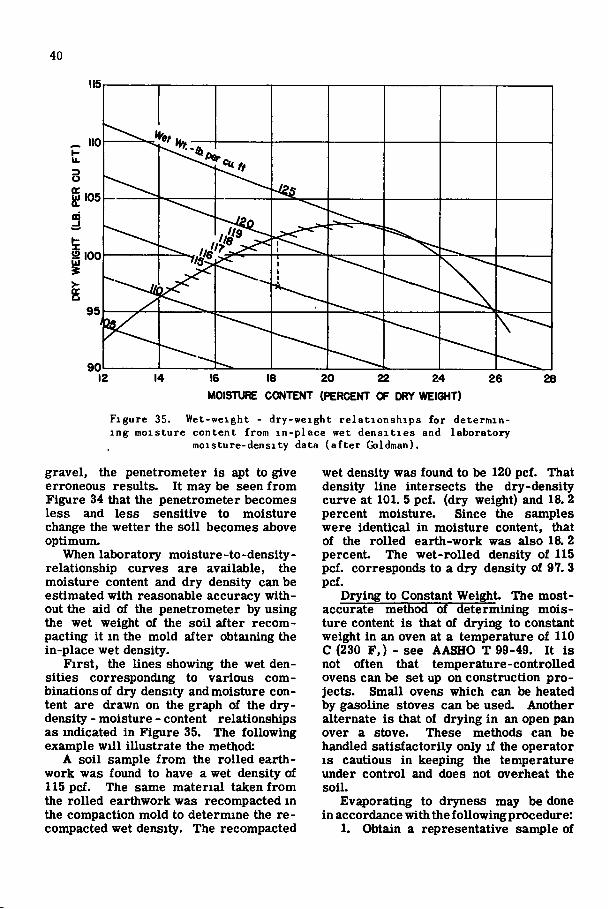
40
f/a Ue 2 100
16 18 20 22 24
MOISTURE CONTENT {PERCENT OF DRY WEIGHT) 26 28
Figure 35. Wet-weight - dry-weight re lat ionships for determining moisture content from in-place wet dens i t i es and laboratory
moisture-density data (after Goldman).
gravel, the penetrometer is apt to give erroneous results. It may be seen from Figure 34 that the penetrometer becomes less and less sensitive to moisture change the wetter the soil becomes above optimum.
When laboratory moisture-to-density-relationship curves are available, the moisture content and dry density can be estimated with reasonable accuracy without the aid of the penetrometer by using the wet weight of the soil after recom-pacting i t in the mold after obtaining the in-place wet density.
First, the lines showing the wet densities corresponding to various combinations of dry density and moisture content are drawn on the graph of the dry-density - moisture - content relationships as indicated in Figure 35. The following example wil l illustrate the method:
A soil sample from the rolled earthwork was found to have a wet density of 115 pcf. The same material taken from the rolled earthwork was recompacted in the compaction mold to determine the re-compacted wet density. The recompacted
wet density was found to be 120 pcf. That density line intersects the dry-density curve at 101. 5 pcf. (dry weig^it) and 18. 2 percent moisture. Since the samples were identical in moisture content, that of the rolled earth-work was also 18. 2 percent The wet-rolled density of 115 pcf. corresponds to a dry density of 97. 3 pcf.
Drying to Constant Weight The most-accurate method of determining moisture content is that of drying to constant weight in an oven at a temperature of 110 C (230 F,) - see AASHO T 99-49. It is not often that temperature-controlled ovens can be set up on construction projects. Small ovens which can be heated by gasoline stoves can be used. Another alternate is that of drying in an open pan over a stove. These methods can be handled satisfactorily only if the operator IS cautious in keeping the temperature under control and does not overheat the soil.
Evaporating to dryness may be done in accordance with the foUowingprocedure:
1. Obtain a representative sample of

41
about 100 grams or less, the size to be convenient and within the accuracy of the scale used.
2. Weight sample and record weight. 3. Spread soil to uniform depth in a
pan. 4. Place in oven or, if drying over
burner, place in a second pan to aid in preventing burning.
5. Dry to constant weight at a temperature of 230 F. (110 C.). If over stove, stir often to prevent overheating.
6. Allow to cool sufficiently to handle. 7. Compute moisture content as
follows:
Percent _ wt. wet soil - w t dry soil ^ moisture wt. dry soil
The alcohol-burning method may also be used to evaporate to dryness. That method consists of mixing damp soil with sufficient denatured grain alcohol to form a slurry in a perforated metal cup, igniting the alcohol, and allowing i t to burn off. The alcohol method wi l l produce resists equivalent to those obtained under careful laboratory drying. A perforated metal cup (26) is used for drying the soil. The suggested procedure is as follows:
1. Weigh perforated cup with f i l ter paper in place in bottom. Record weight.
2. Obtain representative sample of about 25 to 35 grams.
3. Place sample in cup and weigh sample and cup and record weight.
4. Place perforated cup in outside metal saucer and stir alcohol into the soil sample with a glass rod until the mixture has the consistency of a thin mud or slurry. Clean rod.
5. Ignite the alcohol in saucer and sample and bum off all alcohol.
6. Repeat the process three times, each time completely burning off the alcohol.
7. Weigh perforated cup and dry soil after third burmng. The weight of dry soil equals this weight minus weight of cup and fil ter.
8. Calculate moisture content as shown under the previous method shown above.
There are other methods which can be used for field determination of soil moisture. One of these, proposed by Bouyoucos (27) and further developed by Bonar (28)
consists of thoroughly dispersing the soil in alcohol and determimng the amount of water removed from the soil by the alcohol by measuring the change in specific gravity of the alcohol by means of a hydrometer.
Another method (29) involves the use of a pressure-type volumeter which can be used to measure the volume of specimens and to determine the percentage of water in the soil by means of air pressure.
There are several other methods for determining soil moisture which are in the developmental stage but which have not been used sufficiently to test their reliability. Each of the methods described above is reliable. There is some difference in the relative accuracy of the methods. Drying to constant weight at a constanttemperatureof 110 C. is the most reliable. The alcohol method is equally reliable if at least three burnings are used. The penetrometer and the wet-density methods are reasonably qmck ways of estimating moisture content and are not intended to yield values having the accuracy of the drying methods. They can, however, if used by e:q>erienced operators, be made to yield values within one or two percentage units of the correct value where care is taken in their use.
In-Place Density Measurement. There are a numt)er of methods which are suitable, both in speed and reliability, for use in determining in-place wet and dry densities of soils. Standard methods of Test for the Field Determination of Density of Soil In-Place, AASHO Designation T 147-49, provides procedures for two general methods, namely; the undisturbed-sample method and the disturbed-sample method.
The undisturbed-sample method consists of removing a sample in as nearly as is practicable the undisturbed state. Properly designed sampling tubes wi l l , in most instances, cause only very minor changes in soil moisture content and density. The method of obtaining a sample with a minimum of disturbance consists of removing the soil, by use of small, sharp hand tools (for example, a knife) from around a column of soil. The column of soil may then be coated with a known weight and volume of paraff in and the volume of the column deter-
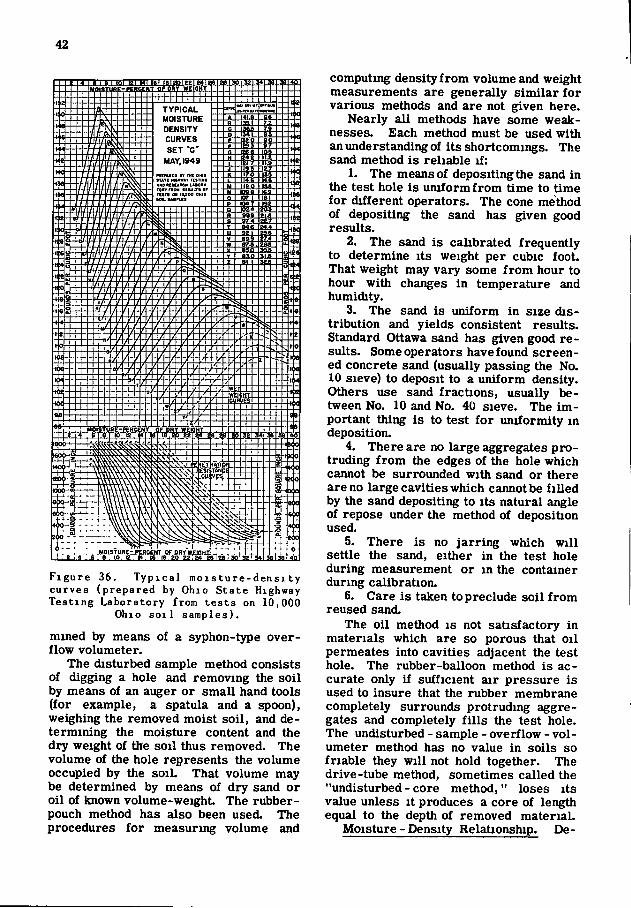
42
M01STUBE=.PERCEMT OF D H Y ' w p C H B
CEETB QF CRY we 0 mSTUR
TYPICAL MOISTURE DENSITY CURVES
F i g u r e 36. T y p i c a l moisture-den s i t y curves (prepared by Ohio State Highway Test ing Laboratory from tes t s on 10,000
Ohio s o i l samples) .
mined by means of a syphon-type overflow volumeter.
The disturbed sample method consists of digging a hole and removing the soil by means of an auger or small hand tools (for example, a spatula and a spoon), weighing the removed moist soil, and determining the moisture content and the dry weight of the soil thus removed. The volume of the hole represents the volume occupied by the soil. That volume may be determined by means of dry sand or oil of known volume-weight The rubber-pouch method has also been used. The procedures for measuring volume and
computing density from volume and weight measurements are generally similar for various methods and are not given here.
Nearly all methods have some weaknesses. Each method must be used with an understanding of its shortcomings. The sand method is reliable if:
1. The means of depositing the sand in the test hole is uniform from time to time for different operators. The cone method of depositing the sand has given good results.
2. The sand is calibrated frequently to determine its weight per cubic foot. That weight may vary some from hour to hour with changes in temperature and humidity.
3. The sand is uniform in size distribution and yields consistent results. Standard Ottawa sand has given good results. Some operators have found screened concrete sand (usually passing the No. 10 sieve) to deposit to a uniform density. Others use sand fractions, usually between No. 10 and No. 40 sieve. The important thing is to test for uniformity in deposition.
4. There are no large aggregates protruding from the edges of the hole which caimot be surrounded with sand or there are no large cavities which cannot be filled by the sand depositing to its natural angle of repose under the method of deposition used.
5. There is no jarring which wil l settle the sand, either in the test hole during measurement or in the container during calibration.
6. Care is taken to preclude soil from reused sand.
The oil method is not satisfactory in materials which are so porous that oil permeates into cavities adjacent the test hole. The rubber-balloon method is accurate only if sufficient air pressure is used to insure that the rubber membrane completely surrounds protruding aggregates and completely f i l l s the test hole. The undisturbed - sample - overflow - volumeter method has no value in soils so friable they wil l not hold together. The drive-tube method, sometimes called the "undisturbed - core method," loses its value unless i t produces a core of length equal to the depth of removed material.
Moisture - Density Relationship. De-
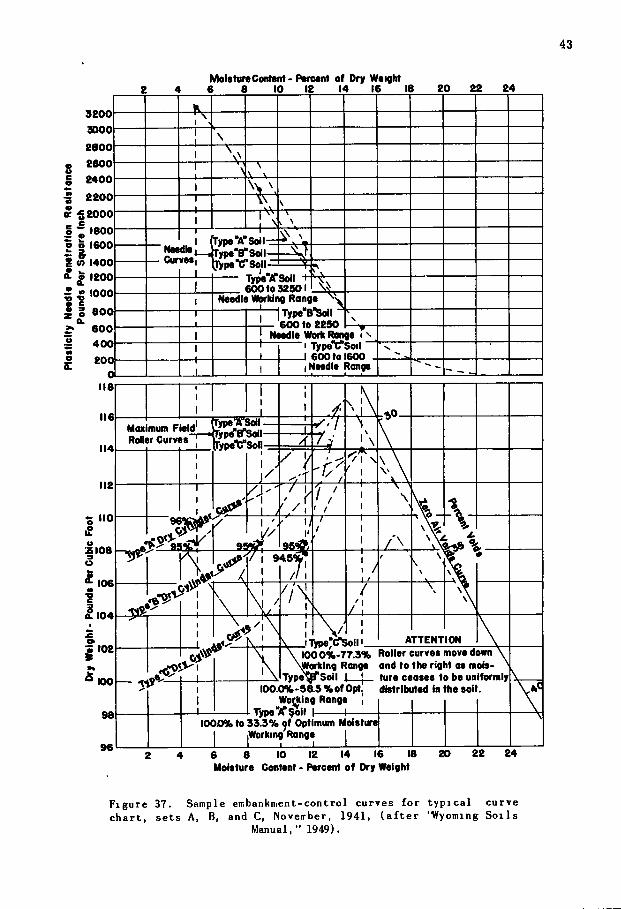
43
MolstureContent- Psrcent of Dry Weight 6 8 10 12 14 16 18
3200
2600 2400
2 2 0 0
^ 2 0 0 0
I rypa'A'Soil I—i rype"B"Soil I IjVpeVSoll OT 1400
TypeVrSoil 9 1200 600 to 32901
Needle VltorMno Range T y p e ' s * ^ ! 600 to 2290
N6Sdlo Woffc RQnQ6 I ^ I—: 1 TypeVSoil
600 to 1600 I Needle Range
CTypeTTSoil e'ersoii
rypeVSon
Maximum Field Rofler Curves
iType'CTSoili Roller curves move down and to the right as moisture ceases to be uniformly distributed in the soil
IOOO%-77.3% Working Range
Type'^Soi l i IOO.O%-9a3%ofOpt,
Wo{|ilng Range TypeVSoi l | 1
1000% to 33 .3% of Optimum Moisture Wbrlcing Range
6 8 10 12 14 16 18 Moisture Content - Percent of Dry Weight
Figure 37. Sample embankment-control curves for typ ica l curve char t , sets A, B, and C, Noverber, 1941, ( a f t e r 'Wyoming S o i l s
Manual," 1949).
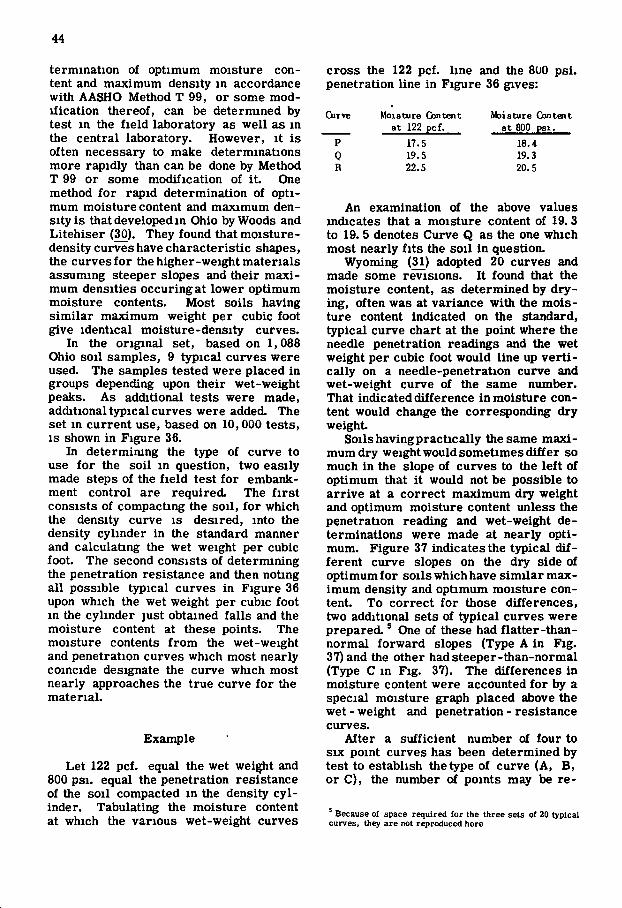
44
termination of optimum moisture content and maximum density in accordance with AASHO Method T 99, or some modification thereof, can be determined by test in the field laboratory as well as in the central laboratory. However, i t is often necessary to make determinations more rapidly than can be done by Method T 99 or some modification of i t One method for rapid determination of optimum moisture content and maximum density is that developed in Ohio by Woods and Litehiser (30). They found that moisture-density curves have characteristic shapes, the curves for the higher-weight materials assuming steeper slopes and their maximum densities occuringat lower optimum moisture contents. Most soils having similar maximum weight per cubic foot give identical moisture-density curves.
In the original set, based on 1,088 Ohio soil samples, 9 typical curves were used. The samples tested were placed in groups depending upon their wet-weight peaks. As additional tests were made, additional typical curves were added. The set in current use, based on 10,000 tests, IS shown in Figure 36.
In determimng the type of curve to use for the soil in question, two easily made steps of the field test for embankment control are required. The f i rs t consists of compacting the soil, for which the density curve is desired, into the density cylinder in the standard manner and calculating the wet weight per cubic foot. The second consists of determining the penetration resistance and then noting all possible typical curves in Figure 36 upon which the wet weight per cubic foot in the cylinder just obtained falls and the moisture content at these points. The moisture contents from the wet-weight and penetration curves which most nearly coincide designate the curve which most nearly approaches the true curve for the material.
Example
Let 122 pcf. equal the wet we i^ t and 800 psi. equal the penetration resistance of the soil compacted in the density cylinder. Tabulating the moisture content at which the various wet-weight curves
cross the 122 pcf. line and the 800 psi. penetration line in Figure 36 gives:
GirvB Moisture Content Moisture Content at 122 pcf. at 800 psi.
P 17.5 18.4 0 19.5 19.3 R 22.5 20.5
An examination of the above values indicates that a moisture content of 19. 3 to 19. 5 denotes Curve Q as the one which most nearly fits the soil in question.
Wyoming (31) adopted 20 curves and made some revisions. It found that the moisture content, as determined by drying, often was at variance with the moisture content indicated on the standard, typical curve chart at the point where the needle penetration readings and the wet weight per cubic foot would line up vert ically on a needle-penetration curve and wet-weight curve of the same number. That indicated difference in moisture content would change the corresponding dry weight
Soils having practically the same maximum dry weight would sometimes differ so much in the slope of curves to the left of optimum that it would not be possible to arrive at a correct maximum dry weight and optimum moisture content unless the penetration reading and wet-weight determinations were made at nearly optimum. Figure 37 indicates the typical different curve slopes on the dry side of optimum for soils which have similar maximum density and optimum moisture content. To correct for those differences, two additional sets of typical curves were prepared.' One of these had flatter-than-normal forward slopes (Type A in Fig. 37) and the other hadsteeper-than-normal (Type C in Fig. 37), The differences in moisture content were accounted for by a special moisture graph placed above the wet - weight and penetration - resistance curves.
After a sufficient number of four to SIX point curves has been determined by test to establish the type of curve (A, B, or C), the number of points may be re-
Because of space required tor the three sets of 20 typical curves, they are not reproduced here
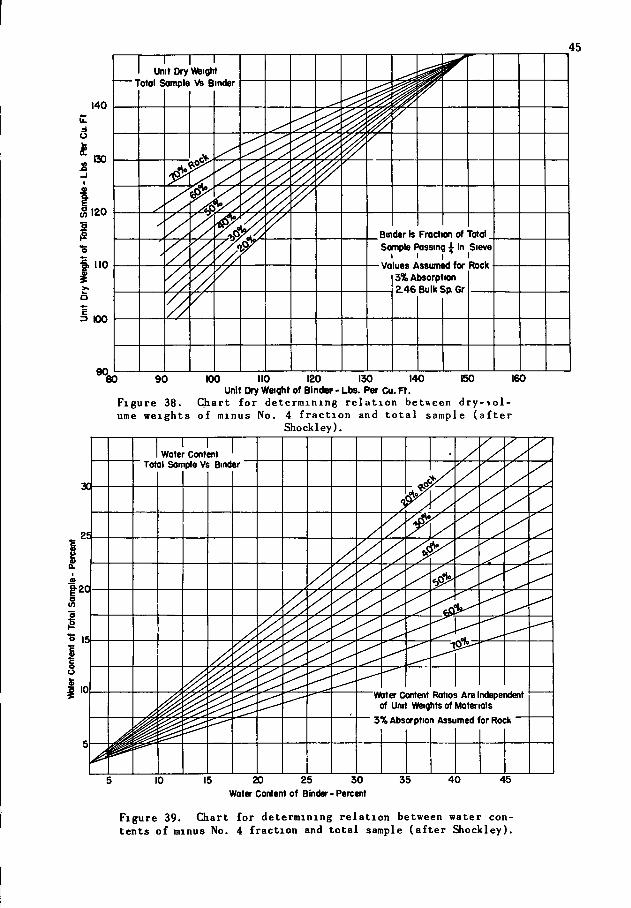
45
140
u
130
I I Unit Dry Weight
Total Sample Vs Binder
120
|2 •s
110
5 OO
60.
. Binder Is Fraction of Total _ Sample Passing ^ In Sieve
I I I I -Values Assumed for Rock
3% Absorption 2.46 BulkSpGr
80 90 150 100 110 120 130 140 Unit Dry Weight of Binder - Lbs. Per Cu. Ft.
Figure 38. Chart for determining r e l a t i o n between dry->o l -uir.e weights of minus No. 4 f r a c t i o n and t o t a l sample ( a f t e r
Shockley).
160
Water Content Total Sample Vs Binder
Water Content Ratios Are Independent of Unit Weights of Materials
3% Absorption Assumed for Rock
15 20 25 30 Water Content of Binder - Percent
Figure 39. Chart for determining re la t ion between water contents of minus No. 4 fraction and total sample (a f t er Shockley).
46
duced to one to three and the correct curve (or tabulated data) used for associating the penetration resistance and wet weight to obtain the correct dry weight
It was found from the typical curves that the amount of field moisture required to secure the same percent of compaction with the roller varies with the curve type, i . e., i t is necessary to work in a narrower moisture range closer to optimum with steep-curve soils (Type C) than with flat-curve soils (Type A). A method was developed for calculating the approximate minimum moisture content required for a sheepsfoot roller having a contact pressure of 325 psi. to obtain 90 to 95 percent of maximum dry weight in the field when the moisture is well distributed through the soil and l if ts are 5 in. or less loose depth.
Determination of the minimum moisture content is done by (1) determining the curve type, (2) selecting the percent of maximum dry weight which wUl define minimum moisture-content requirements, (3) plot the dry weight thus obtained (see Fig. 37) on the dry side of the dry weight curve. The vertical line through that point (Fig. 37) indicates the minimum moisture content The 95 percent-density point, which is usually about the maximum that can be e3q)ected from the roller, is plotted on this line of minimum moisture content
The working moisture content is the average of th^ minimum and optimum moisture contents. The working range is between the two values as is indicated in Figure 37.
Correcting for Coarse-Aggregate Content The present AASHO Method of Test T 99 requires separation of the dried material on the No. 4 sieve and compaction of that portion passing the sieve. It does not provide for determination of the compacted weight of the total soil (including the plus-4 material) either by test or by computation. The same is true for the corresponding ASTM TestD-698-42T.
Where i t is desirable to calculate the weight per cubic foot and optimum moisture content, for the entire sample i t is necessary to determine the specific gravity and absorption of the coarse materials. Data from the compaction test
on the material passing the No. 4 sieve and from specific gravity and absorption tests can be used for determining, by calculation, the theoretical maximum dry weight and optimum moisture content of the entire sample.
Case 1. Where the minus-4 material is sufficient in quantity to f i l l the voids in the plus-4 material.
The maximum dry weight of the total soil is computed from the following f orinula:
WjXW^ t F W^ + C W^(l + A^) where
W.
W,
Dry weight per cubic foot of entire sample at its optimum moisture content. Dry weight per cubic foot of minus-No. 4-sieve material at its optimum moisture content
W = Weight per cubic foot of plus-No. 4-sieve material = sp. gr. x 62.4 = 153.5
F = Percent minus-4 material expressed as a decimal.
C = Percent plus-4 material expressed as a decimal.
A = Percent absorption of plus-4 ma-^ terial expressed as a decimaL
If test data: Remain on No. 4 Sieve
35% = 0. 35 2. 46 = sp. gr.
Absorp. 3% = 0. 03
Pass No. 4 Sieve
65% = 0. 65 ^ 117. 4 = pcf. dry wt.
opt. m. c. =17%
Then: ^ _ 117. 4 X 153.5 • ^ t - . 6 5 x l S 3 . 5 + .35 x 117.4 (1 + 0.03)
_ 18020.9 _ 0, . - 142. 068 - ^26- 82 pcf.
The optimum moisture content of the total material wi l l be:
M j = (CA^ + FMj) where
47
M. = Moisture content of the total soil C = Percent retained on No. 4 sieve ex
pressed as a decimal A = Percent absorption of material re
tained on No. 4 sieve expressed as a decimal
F = Percent passing the No. 4 sieVe expressed as a decimal
M, = Moisture content of minus-No. -4-sieve material expressed as a decimal
'̂ f
The umt dry weight of the minus-No. -4-sieve material can be computed from the formula:
F W j W ^ f W^ - W^ C (1 + A^)
If the test data are as given above then: ^ _ 0. 65 X 126. 82 x 153. 5 ^ f ~ 153. 5 - 126. 82 X 0. 35 (1 + 0.03)
12653. 5 = 107.78 = * P'̂ *-
The moisture content of the minus-No. -4-sieve portion wi l l be
M , - CA. M,
The percentage of rock, moisture content, and dry weight per cubic foot may vary from one individual sample to another. It is desirable to compute the moisture and density relationships between total samples and the minus-No. -4 fraction and construct families of curves for different values of moisture content and percent rock. Such charts have been prepared by Shockley (32) and are reproduced here as Figures^S and 39. The curves are for coarse aggregate (plus-No. -4-sieve material) having a specific gravity of 2. 46 and an absorption value of 3 percent. The use of the curves is illustrated by the following example:
Given: Unit dry weight of total sample = 120 pcf. Plus-No. -4-sieve material = 50 percent. Moisture content of total sample = 15 percent.
To determine: (A) Unit weight of minus-4 material. On Figure 38 enter the scale on the left side of the chart at 120 pcf. and continue across to the intersection with the 50 percent plus-4-ma-terial line. From that point read direct
ly down to the bottom of the scale to 100 pcf. which is the umt weight of minus-4 material desired.
(B) Moisture content of minus-4-sieve material. On Figure 39 enter the scale on the left side of the chart at 15 percent moisture content and continue across to the intersection with the 50-percent-plus-4-sieve line. From that line read directly down to the bottom of the scale to 27 percent, which is the moisture content of the minus-4 material.
Case 2. Where the minus-4-sieve material is insufficient to f i l l the voids in the plus-4 material.
Acceptable subgrade and f i l l material and base-course material can be obtained in which the minus-No. -4 material IS not sufficient to f i l l the voids in the plus-4 material. Reagel (33) has developed a chart and a nomograph to facilitate determination of standard dry weights for that condition. The chart is reproduced in Figure 40 and the nomograph in Figure 41.
In the chart, the dry weight of the minus-4 material has been determined as 112 pcf. and the specific gravity of the plus-4 material is 2. 55. The f i rs t step IS to locate Point A in the parallelogram of the chart at the intersection of the 112-Ib. value with specific gravity of 2.55. This point on the coordinates is the condition where the plus-4 voids are just fi l led and shows the percent passing the No. 4 sieve to be 33. 5 percent and the combined dry weight to be 139. 4 pcf. The material m question has only 32 percent passing the No. 4 sieve. Then locate Point B by a 2. 55 line in the parallelogram to a point at the intersection of 32 percent on the coordinate. The point on the other coordinate gives Point C and the solution as 135. 7 pcf. for the standard weight of the combined material.
In the case of the nomograph (Fig. 41) the specific gravity given is 2. 45 and the dry weight of the minus 4 material is again 112 pcf. A straight line connecting these values gives a value of 34. 7 percent (Point A). The material has only 33 percent passing (Point B) which is less than 34. 7 percent A straight line from Point B through the specific gravity value of 2. 45 intersects the combined weight
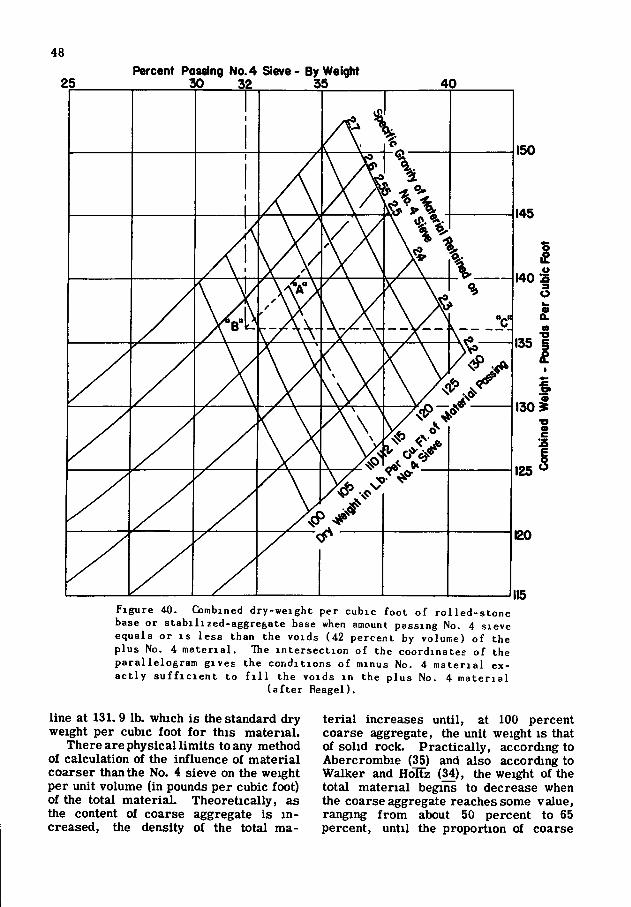
48
25 Percent Passing No. 4
J O 32 Sieve - By Weight
35 40
5 ?
Figure 40. Combined dry-weight per cubic foot of rol led-stone base or stabilized-aggregate base when amount passing No. 4 sieve equals or i s l ess than the voids (42 percent by volume) of the plus No. 4 material . The intersection of the coordinates of the parallelogram gives the conditions of minus No. 4 material exac t ly s u f f i c i e n t to f i l l the voids in the plus No. 4 material
(af ter Reagel).
line at 131. 9 lb. which is the standard dry weight per cubic foot for this material.
There are physical limits to any method of calculation of the influence of material coarser than the No. 4 sieve on the weight per unit volume (in pounds per cubic foot) of the total materiaL Theoretically, as the content of coarse aggregate is increased, the density of the total ma
terial increases until, at 100 percent coarse aggregate, the unit weight is that of solid rock. Practically, according to Abercrombie (35) and also according to Walker and Holtz (34), the weight of the total material begins to decrease when the coarse aggregate reaches some value, ranging from about 50 percent to 65 percent, until the proportion of coarse
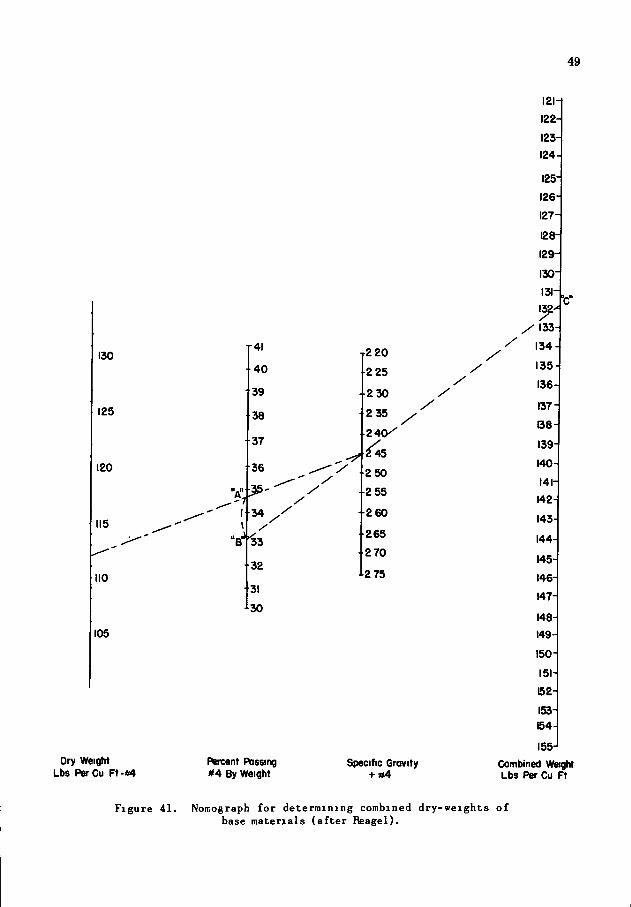
49
130
125
120
115
no
105
•41
4 0
39
38
37
36
1-34
33
32
31
30
121-
122-
123-
124-
125-
126-
127-
128-
129-
130-
131-.
132-' /
/ 133-
134-t 2 20 y
134-
2 25 y 135-
136-2 3 0 X
136-
137-
2 35 y 0 8 -2 4 0 /
0 8 -
. ^ 4 5 139-
140-2 50
141-2 55
142-- 2 6 0 143-2 6 5 144-2 70
145-2 75 146-
147-
148-
149-
150-
151-
B 2 -
153-154-
155-Dry Weight
Lbs PerCu Ft-«4 Percent Passing 0̂ 4 By Weight
Specific Gravity + # 4
Combined Weight Lbs Per Cu Ft
Figure 41. Nomograph for determining combined dry-weights of base materials (after Reagel).
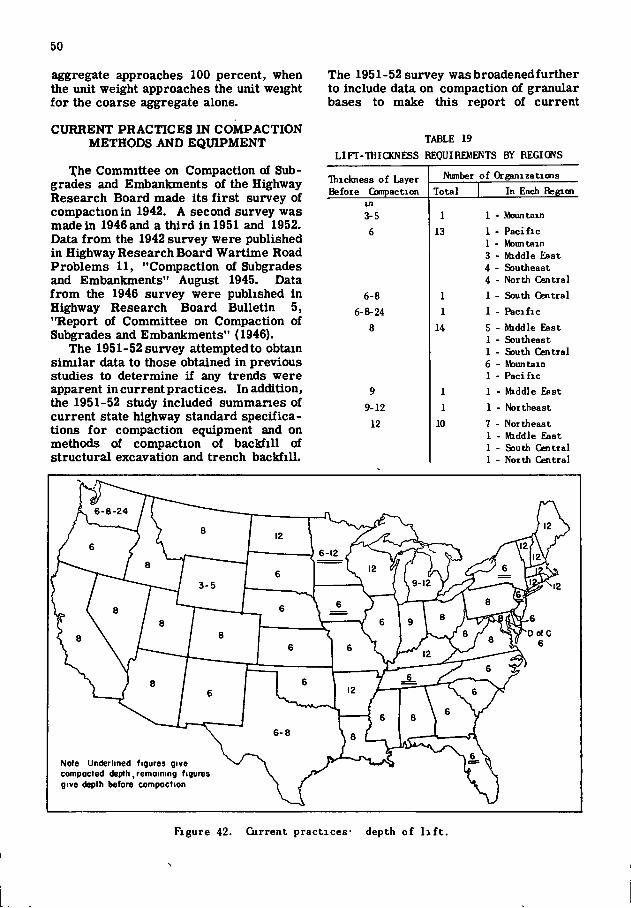
50
aggregate approaches 100 percent, when the unit weight approaches the unit weight for the coarse aggregate alone.
CURRENT PRACTICES IN COMPACTION METHODS AND EQUIPMENT
The Committee on Compaction of Sub-grades and Embankments of the Highway Research Board made its f i rs t survey of compaction in 1942. A second survey was made in 1946 and a third in 1951 and 1952. Data from the 1942 survey were published in Highway Research Board Wartime Road Problems 11, "Compaction of Subgrades and Embankments" August 1945. Data from the 1946 survey were published in Highway Research Board Bulletin 5, "Report of Committee on Compaction of Subgrades and Embankments" (1946).
The 1951-52 survey attemptedto obtain similar data to those obtained in previous studies to determine if any trends were apparent in current practices. In addition, the 1951-52 study included summaries of current state highway standard specifications for compaction equipment and on methods of compaction of backfill of structural excavation and trench backfill.
The 1951-52 survey was broadened further to include data on compaction of granular bases to make this report of current
TABLE 19 LIFT-THICKNESS REQUIREMENTS BY REGIONS
Thickness of Layer Before Compaction
Number of Organizations Thickness of Layer Before Compaction Total In Each Region
m 3-5 1 1 - Mountain 6 13 1 - Pacific
1 - Mountain 3 - Middle East 4 - Southeast 4 - North Central
6-8 1 1 - South Central 6-8-24 1 1 - Pacific
8 14 5 - Middle East 1 - Southeast 1 - South Central 6 - Mountain 1 - Pacific
9 1 1 - Middle East 9-12 1 1 - Northeast
12 10 7 - Northeast 1 - Middle East 1 - South Central 1 - North Central
DofC
Note Underlined figures give compacted deptli,remaining figures give depth before compaction
Figure 42. Current practices- depth of l i f t .
51
practices more nearly complete. Reporting of the data from the 1951-52 survey is made on the same regional basis as was made in 1942 and 1946.
Li f t Thickness in Embankment Construction
The 1946 report brought out that there was a wide variance in l i f t thickness and showed that a majority of state highway departments specified a maximum l i f t thickness of 6 to 8 i n . , 17 organizations using a 6-in. -maximum and 13 using an 8-in. -maximum l i f t thickness. Those did not include 7 organizations which had more than one class of specifications, one of which fe l l in the 6-or 8-in. -depth group. The report also showed 8 organizations which used a 12-in. -maximum depth of l i f t The 1942 and 1946 reports did not bring out whether the depth of l i f t was depth before compaction or compacted thickness.
The 1951-52 survey showed that of the state highway departments and the District of Columbia, 42 organizations specify thickness of l i f t before compaction and 7 specify thickness of l i f t after compaction.
A summary of l i f t thickness requirements of the 42 organizations by regions is given in Table 19.
Seven states specify compacted thickness. Six require 6 in. of compacted l i f t thickness, and one has two classes of compaction - requiring 6 and 12 in. of compacted depth respectively. Those states are all in the East.
The states specifying the 6-in. l if ts (before compaction) specify slightly lower average density requirements than does the group which specifies the 8-in. loose depth. That may be due inpart to the fact that those states contain fairly large areas of clayey soils which are difficult to compact to high densities.
I t is significant that 7 of the 10 states requiring a 12-in. depth before compaction are in New England, where generally the soils contain h i ^ percentages of coarse material, and where fine-grained soils are friable and can be compacted in l if ts of greater thickness than can heavy clay soils.
Control of Compaction
Embankments. Compaction and moisture control requirements for embank-mentshave changedsome, butnot greatly, since the 1946 report The results of the 1951-52 survey are given in Table 20 and in Figures 42 and 43.
Subgrades. The 1951-52 survey sought information on methods of specifying compaction and moisture control for sub-grades. The results of the survey are shown in Table 21. Thirty-four organizations indicated compaction requirements were no different from the requirements for embankments. The remaining replies indicated that closer attention, more rigid control, was beinggivento obtaincompac-tion and moisture content in subgrades. Several states specify higher compaction for subgrades. Table 21 shows a wide variance in depth of compaction in the subgrade zone. In most instances the depth was given as 6 m. or was considered as surface rolling. Others required compaction to a depth of 8, 12, 18 and 30 i n . , as may be seen in Table 21.
Bases. Previous surveys did not record the compaction given granular bases (stabilized bases, clay-gravel bases, and sand-clay bases and other bases of natural aggregates; this does not include crushed-rock bases nor bases containing plastic or cementitious binders). The 1951-52 survey indicates that about three eights of the states provide for greater compaction of bases than of embankments (see Table 22). That is accomplished by decreasing l i f t thickness, increasing roller weight, specifying higher densities, or otherwise exercising more rigid control of rolling.
Cost of Compaction
Compaction is paid for directly in 12 states at an average cost for each state ranging from 372 to 25 cents per cu. yd. with an overall average cost of slightly over 9 cents per cu. yd. Six of the e-leven are from the Mountain States region; two from the South Central and one each from the Northeast, North Central, and Pacific areas. In the remaimng states the cost of compaction is included in the bid price for excavation and borrow
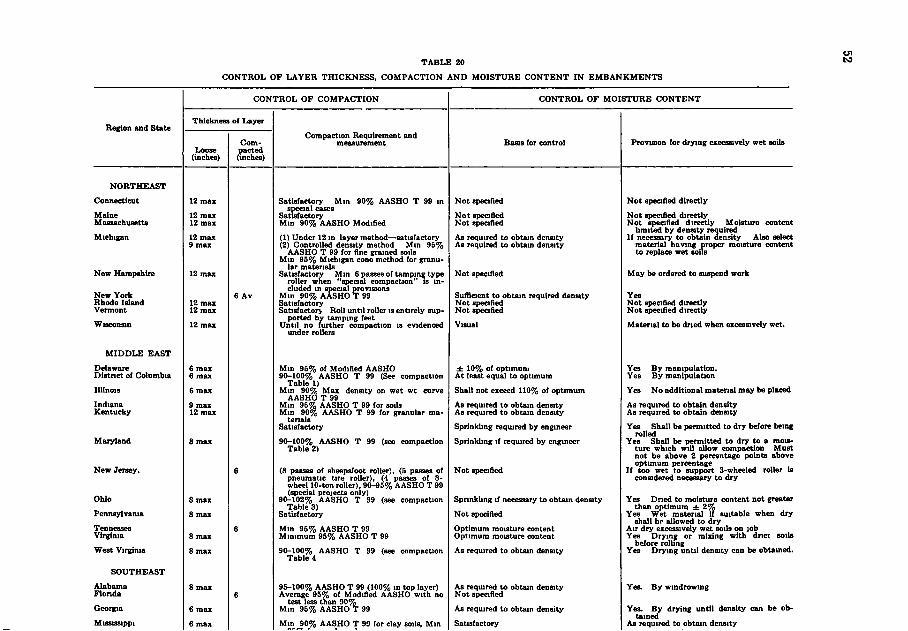
T A B L E 20
C O N T R O L O F L A Y E R T H I C K N E S S . COMPACTION AND M O I S T U R E C O N T E N T I N E M B A N K M E N T S
Region and State
C O N T R O L O F COMPACTION
Thickness of Layer
Loose (inches)
Compacted (inches)
Compaction Requirement and measurement
C O N T R O L O F M O I S T U R E C O N T E N T
Basis for control Provision for drying excessively wet soils
N O R T H E A S T
Connecticut
Maine Massachusetts
Michigan
New Hampshire
New York Rhode Island Vermont
Wisconsin
M I D D L E E A S T
Delaware Distnct of Columbia
Indiana Kentucky
Maryland
New Jersey.
Ohio
Pennsylvania
Tennessee Virginia
West Virginia
SOUTHEAST
Alabama Florida
Georgia
Mississippi
12 max 12 max
12 max 9 max
12 max 12 max
6 max 6 max
9 max 12 max
S max
8 max
8 max
8 max
6 max
6 max
Satisfactory Mm 90% AASHO T 99 in special cases
Satisfactory Mm 90% AASHO Modified
(1) Under 12 in layer method—satisfactory (2) Controlled density method Min 95%
AASHO T 99 for fine grained soils Min 95% Michigan cone method for granu
lar materials Satisfactory Min 6 passes of tamping type
roller when "special compaction" Is included in special provisions
Min 90% AASHO T 99 Satisfactory Satisfactory Roll until roller is entirely sup
ported by tamping feet Until no further compaction is evidenced
under rollers
Mm 95% of Modified AASHO 90-100% AASHO T 99 (See compaction
Table 1) Min 90% Max density on wet wt curve
AASHO T 99 Mm 96% AASHO T 99 for soils Mm 90% AASHO T 99 for granular ma
terials Satisfactory
90-100% AASHO T 99 (see compaction Table 2)
(8 passes of sheepsfoot roller), (5 passes of pneumatic tire roller), (4 passes of 3-wheel 10-ton roller), 90-95% AASHO T 99 (special projects only)
90-102% AASHO T 99 (see compaction Tables)
Satisfactory
Min 95% AASHO T 99 Minimum 95% AASHO T 99
90-100% AASHO T Table 4
(see compaction
95-100% AASHO T 99 (100% in top layer) Average 95% of Modified AASHO with no
test less than 90% Mm 96% AASHO T 99
Min 90% AASHO T 99 for clay soils, Mm
Not speafled
Not specified Not specified
As required to obtain density As required to obtam density
Not specified
Sufficient to obtain required density Not specified Not specified
Visual
± 10% of optimum At least equal to optimum
Shall not exceed 110% of optimum
As required to obtain density As required to obtam density
Sprinkling reqmred by engineer
Sprinkling if required by engineer
Not specified
Spnnkling if necessary to obtain density
Not specified
Optimum moisture content Optimum moisture content
As required to obtam density
As required to obuin density Not specified
As required to obtain density
Satisfactory
Not specified directly
Not specified directly Not specified directly Moisture content
hmited by density required If necessary to obtain density Also select
material having proper moisture content to replace wet soils
May be ordered to suspend work
Yea Not specified directly Not specified directly
Material to be dried when excessively wet.
Yes By manipulation. Yes By manipulation
Yes No additional material may be placed
As required to obtain density As required to obtain density
Yes Shall be permitted to dry before being rolled
Yes Shall be permitted to dry to a moisture which will allow compaction Must not be above 2 percentage points above optimum percentage
If too wet to support 3-wheeled roller is considered necessary to dry
Yes Dned to moisture content not greater than optimum ± 2%
Yes Wet material if suiUble when dry shall be allowed to dry
Air dry excessively wet soils on job Yes Drying or mixing with dner soils
before rolhng Yes Drying until density can be obtamed.
Yes. By windrowmg
Yes. By drying until density can be obtained
As required to obUin density
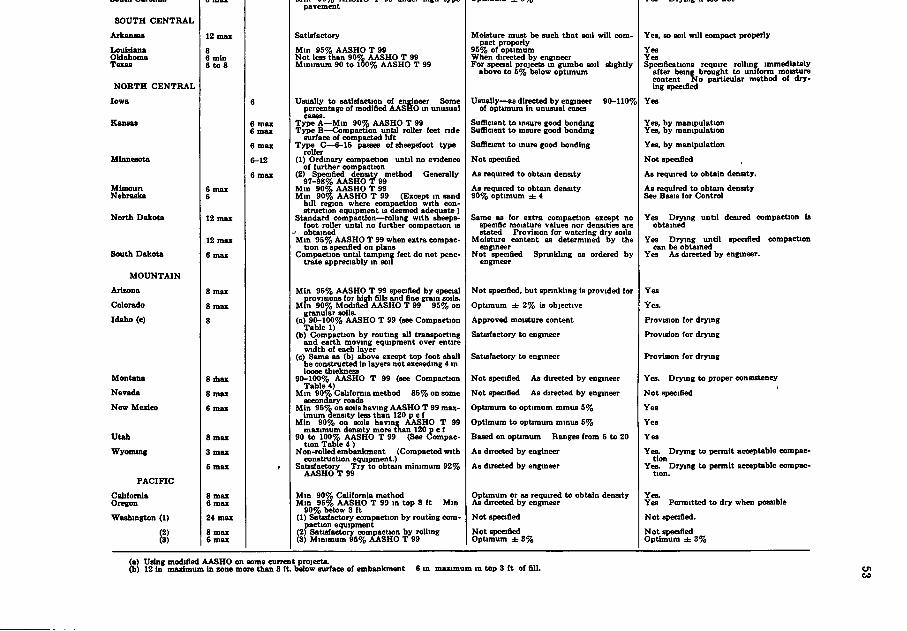
OUUUl V t̂UUllUtt b max
SOUTH C E N T R A L
ArkanBos 12 max
Louisiana Oklahoma Texas
8 6 min 6 to 8
N O R T H C E N T R A L
Iowa 6
Knnffwp 6 max 6 max
6 max
Minnesota 6-12
6 max Mlssoun Nebraska
6 max 6
North Dakota 12 max
12 max
South Dakota 6 max
MOUNTAIN
Arizona 8 max
Colorado 8 max
Idaho (c) 8
Montana 8 ihax
Nevada 8 max
New Mexico 6 max
Utah 8 max
Wyommg 3 max
6 max r
P A C I F I C
California Oregon
8 max 6 max
Washington <1)
[i!
24 max
8 max 6 max
mm W7o AAon\7 pavement
Satisfactory
1 99 unatir ni|[Q lypo
Min 95% AASHO T 99 Not less than 90% AASHO T 99 Minimum 90 to 100% AASHO T 99
Usually to satisfaction of engineer Some percentage of modified AASHO in unusual
Tj^?eA—Mm 90% AASHO T 99 Type B—Compaction until roller feet ride
surface of compacted lift Type C—6-16 passes of sheepsfoot type
roller (1) Ordinary compaction until no evidence
of further compaction (2) Specified density method Generally
97-98% AASHO T 99 Min 90% AASHO T 99 Min 90% AASHO T 99 (Except in sand
hill region where compaction with construction equipment is deemed adequate )
Standard compaction—rolling with sheepsfoot roller until no further compaction is
^ obtained Min 95% AASHO T 99 when extra compac
tion IS specified on plans Compaction until tamping feet do not pene
trate appreciably in soil
Min 95% AASHO T 99 specified by special rvisions for high fills and fine grain soils. 90% Modified AASHO T 99 95% on
granular soils. (a) 90-100% AASHO T 99 (see Compaction
Table 1) (b) Compaction by routing all transporting
and earth moving equipment over entire width of each layer
(c) Same as (b) above except top foot shall be constructed in layers not exceeding 4 in loose thickness
90-100% AASHO T 99 (see Compaction Table 4)
Min 90% California method 85% on some secondary roads
Min 95% on soils having AASHO T 99 maximum density less than 120 p c (
Min 90% on soils having AASHO T 99 maximum density more than 120 p c f
90 to 100% AASHO T 99 (See Compaction Table 4 )
Non-rolled embankment (Compacted with construction equipment.)
Satisfactory Try to obtain minimum 92% AASHO T 99
Min 90% California method Min 95% AASHO T 99 in top 3 ft Mm
90% below 3 ft (1) Satisfactory compaction by routing com
paction equipment (2) Satisfactory compaction by rollmg (3) Minimum 95% AASHO T 99
Moisture must be such that soil will compact properly
95% of optimum When directed by engineer For special projects in gumbo soil slightly
above to 6% below optimum
Usually—as directed by engineer 90-110% of optimum in unusual cases
Sufficient to insure good bonding Sufficient to insure good bondmg
Sufficient to inure good bonding
Not specified
As required to obtain density
As required to obtain density 90% optimum ± 4
Same as for extra compaction except no specific moisture values nor densities are stated Provision for watering dry soils
Moisture content as determined by the engineer
Not specified Sprinkling as ordered by engineer
Not specified, but spnnkling is provided for
Optimum ± 2% is objective
Approved moisture content
Satisfactory to engineer
Satisfactory to engineer
Not specified As directed by engineer
Not specified As directed by engineer
Optimum to optimum minus 5%
Optimum to optimum minus 6%
Based on optimum Ranges from 5 to 20
As directed by engineer
As directed by engineer
Optimum or as required to obtain density As directed by engineer
Not specified
Not specified Optimum db 8%
I va t r y i n g a wo wet
Yea, so soil will compact properly
Yes Yes Specifications require rollinfc immediately
after being brought to uniform moisture content No particular method of drying specified
Yes
Yes, by manipulation Yes, by manipulation
Yes, by manipulation
Not specified
As required to obtain density.
As required to obtain density See Basis for Control
Yes Drying until desired compaction is obtained
Yes Drying until specified compaction can be obtained
Yes As directed by engmeer.
Yes
Yes.
Provision for drying
Provision for drymg
Provision for drymg
Yes. Drying to proper consistency
Not specified
Yes
Yea
Yes
Yes. Drying to permit acceptable compaction
Yes. Drying to permit acceptable compaction.
Y ^ Permitted to dry when possible
Not specified.
Not specified Optimum ± 3%
(a) Using modified AASHO on some current projects. (b) 12 in maximum in sone more than 3 ft. below surface of embankment 6 m maximum in top 8 ft of fill.
CO
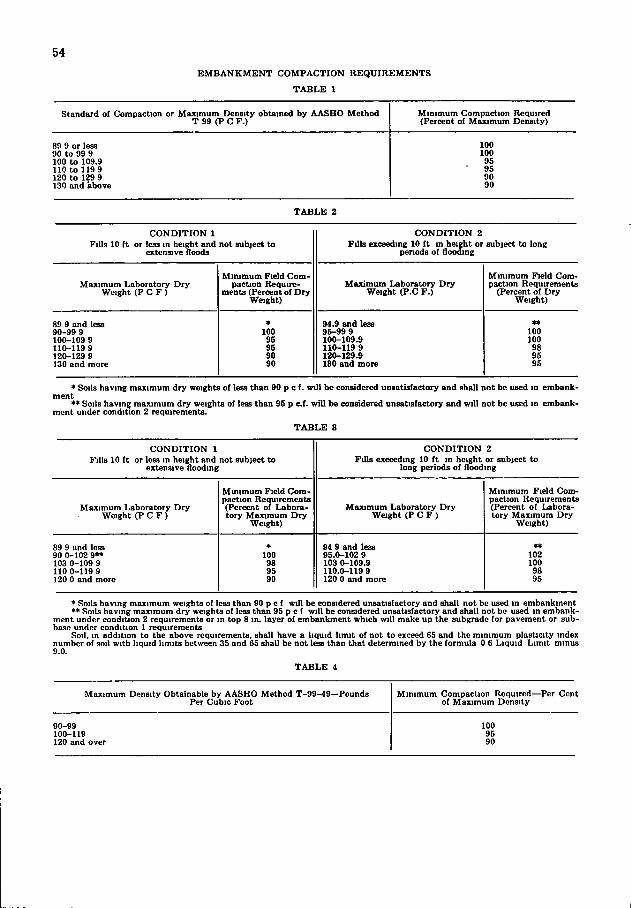
54
EMBANKMENT COMPACTION REQUIREMENTS
T A B L E 1
Standard of Compaction or Maximum Density obtained by AASHO Method T 99 (P C F.)
Minimum Compaction Required (Percent of Maximum Density)
89 9 or less 90 to 99 9 100 to 109.9 110 to 119 9 120 to 129 9 130 and above
100 100 95 95 90 90
T A B L E 2
CONDITION 1 Fills 10 ft or less in height and not subject to
extensive floods
CONDITION 2 Fills exceeding 10 ft m height or subject to long
penods of flooding
Maximum Laboratory Dry Weight (P C F )
Mimmum Field Compaction Require
ments (Percent of Dry Weight)
Maximum Laboratory Dry Weight (P.C F.)
Minimum Field Compaction Requirements
(Percent of Dry Weight)
89 9 and less 90-99 9 100-109 9 110-119 9 120-129 9 130 and more
* 100 95 95 90 90
94.9 and less 95-99 9 100-109.9 110-119 9 120-129.9 130 and more
*« 100 100 98 95 95
* Soils having maximum dry weights of less than 90 p c f. will be considered unsatisfactory and shall not be used in embankment
Soils having maximum dry weights of less than 95 p c.f. will be consider^ unsatisfactory and will not be used in embankment under condition 2 requirements.
T A B L E 3
CONDITION 1 Fills 10 ft or less in height and not subject to
extensive flooding
CONDITION 2 Fills exceeding 10 ft in height or subject to
long periods of flooding
Maximum Laboratory Dry Weight (P C F )
Minimum Field Compaction Requirements (Percent of Laboratory Maximum Dry
Weight)
Maximum Laboratory Dry Weight (P C F )
Minimum Field Compaction Requirements (Percent of Laboratory Maximum Dry
Weight)
89 9 and less 90 0-102 9** 103 0-109 9 110 0-119 9 120 0 and more
* 100 98 95 90
94 9 and less 95.0-102 9 103 0-109.9 110.0-119 9 120 0 and more
102 100 98 95
* Soils having maximum weights of less than 90 p c f will be considered unsatisfactory and shall not be used in embankment *• Soils having maximum dry weights of less than 95 p c f will be considered unsatisfactory and shall not be used in embank
ment under condition 2 requirements or in top 8 in. layer of embankment which will make up the subgradc for pavement or sub-base under condition 1 requirements
Soil, in addition to the above requirements, shall have a liquid limit of not to exceed 65 and the minimum plasticity index number of soil with liquid limits between 35 and 65 shall be not less than that determined by the formula 0 6 Liquid Limit minus 9.0.
T A B L E 4
Maximum Density Obtainable by AASHO Method T-99-49—Pounds Per Cubic Foot
Minimum Compaction Required—Per Cent of Maximum Density
90-99 100 100-U9 95 120 and over 90
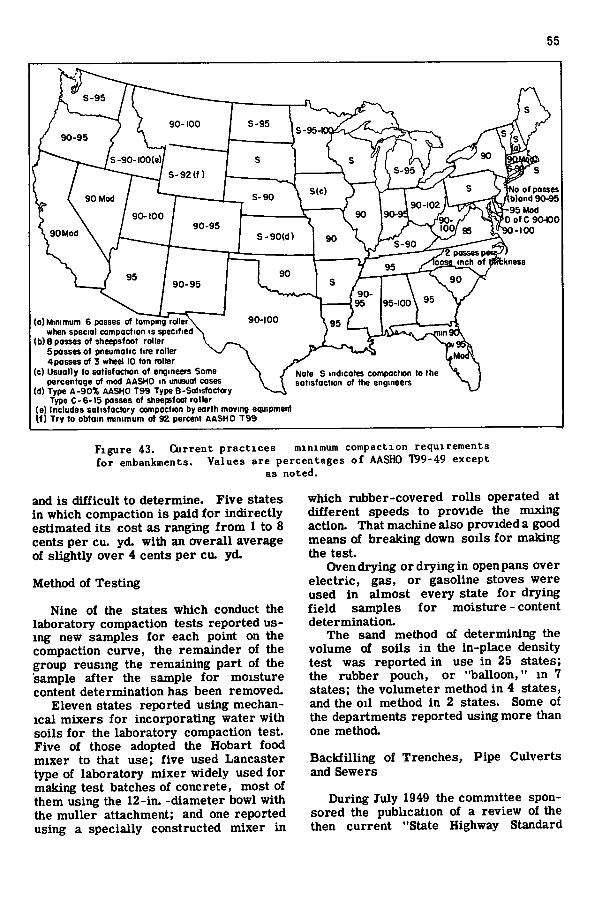
55
S-95
90- ICQ 90-95
S-90-100(e)
b and 90-95 95 Mod
D o f C 9 0 « 0 90Mod
kness
compoctio engineers satisfaction
(a) Mini mum 6 passes of tamping when special compaction is specified
(b) B posses of sheepsfoot roller 5 passes of pneumatic tire roller 4posses of 3 wheel 10 ton roller
(c) Usually to satisfaction of engineers Some percentage of mod AASHO in unusual coses
(d) Type A-90% AASHO T99 Type B-Solisfoctory Type C-6-15 posses of sheepsfoot roller
(e) Includes satisfactory compoction byeorth moving equipment i f ) Try to obtain minimum at 92 percent AASHO T99
Figure 43. Ciirrent pract ices minimum compaction requirements for embankments. Values are percentages of AASHO T99-49 except
as noted.
and is difficult to determine. Five states in which compaction is paid for indirectly estimated its cost as ranging from 1 to 8 cents per cu. yd. with an overall average of slightly over 4 cents per cu. yd.
Method of Testing
Nine of the states which conduct the laboratory compaction tests reported using new samples for each point on the compaction curve, the remainder of the group reusing the remaining part of the sample after the sample for moisture content determination has been removed.
Eleven states reported using mechanical mixers for incorporating water with soils for the laboratory compaction test. Five of those adopted the Hobart food mixer to that use; five used Lancaster type of laboratory mixer widely used for making test batches of concrete, most of them using the 12-in. -diameter bowl with the muUer attachment; and one reported using a specially constructed mixer in
which rubber-covered rolls operated at different speeds to provide the mixing action. That machine also provided a good means of breaking down soils for making the test.
Oven drying or drying in open pans over electric, gas, or gasoline stoves were used in almost every state for drying field samples for moisture - content determination.
The sand method of determining the volume of soils in the in-place density test was reported in use in 25 states; the rubber pouch, or "balloon," in 7 states; the volumeter method in 4 states, and the oil method in 2 states. Some of the departments reported using more than one method.
Backfilling of and Sewers
Trenches, Pipe Culverts
During July 1949 the committee sponsored the publication of a review of the then current "State Highway Standard

TABLE 21
CONTROL OF COMPACTION AND MOISTURE CONTENT IN SUBGRADES
Region and State .Compaction requirements and measuremt nts Depth of subgrade compaction
Region and State .Compaction requirements and measuremt nts In cuts In previously compacted fills
NORTHEAST
Connecticut
Maine
Massachusetts
Michigan New Hampshire New York
Rhode Island
Vermont Wisconsin
Thoroughly and uniformly compacted 10-ton 3-wheel roller.
Compacted 10-ton, 3-wheel or approved pneumatic tired roller.
Compacted self-propelled roller weighing not less than 12 tons.
When required, same as for embankments Rolled to a firm unyielding surface with 10-
ton, 3-wheel roller Min 95 percent AASHO T 99 for top 4 ft be
low crown grade, 2 ft wider than pavement and downward and outward on 1 to 1 slope
Compacted uniformly with approved roller weighing not less than 10 tons
Compacted with 3-wheel power roller Same as for embankments
Not less than 8 inches No requirement
MIDDLE EAST
Delaware Minimum 95 percent Modified AASHO Constructing equipment will probably compact sufliciently
12 inches
Covered by special provisions in special cases
No requirement District of Columbia
Illinois 90-100 percent AASHO T 99 (See compaction
table 1-S). Compaction to the satisfaction of the engineer
Constructing equipment will probably compact sufliciently
12 inches
Covered by special provisions in special cases
12 inch (old fills)
Same as for other locations Indiana Same as for embankments
Constructing equipment will probably compact sufliciently
12 inches
Covered by special provisions in special cases
Kentucky
Maryland
New Jersey Ohio
Satisfactory All soft and yielding material replaced with suitable material
Compaction with tandem or 3-wheel, 10-ton roller, also sheepsfoot or any other method to secure required compaction
Same as for embankments 95-105 percent AASHO T 99 (See compac
tion table 2-S) Surface rolling Min 6 inches
Surface rolling Mm 6 inches
Pennsylvania Same as for embankments Excavate 9 ins below final grade Tennessee
Virginia West Virgmia
SOUTHEAST
Same as embankments Compaction performed with 10-ton roller or pneumatic tired roller
Minimum 95 percent AASHO T 99 Scarified to not more than 4" and compacted
with 10-ton, 3-wheel roller to firm unyielding surface
8 inches 4 inches
6 inches max
8 inches 4 inches
Alabama Minimum 100 percent AASHO T 99 6 inches 6 inches Florida
Ciporgia Same as for embankments (Av , 95% Modified
AASHO with no test less than 90% Same as for embankments, Minimum (95%
AASHO T 99)
12 if stabilization is required— 6 if no stabilization is required
6 in except 12 in over solid rock 6 inches
0 3
Moisture control requirements
No requirements specified
No requirements specified
No requirements specified
Same as for embankments No requirements specified
Sufficient to obtain density Same as for embankments
No requirements specified
No requirements specified No requirements specified
Optimum ± 10 percent
At least equal to optimum
Provision for wetting or drying subgrade
As required to obtain density Must be satisfactory at time of paving or placing sub base
See compaction requirements
Soft, unstable material shall be removed
No requirements specified Not greater than optimum +2% (see com
paction table) Not greater than optimum in elastic soils
No requirements specified Excessively wet material removed
Control by field and laboratory tests
Optimum moisture content No requirements specified but must be firm
and unyielding
Only as required to obtain density Manipulation until dry enough to compact
Optimum used as guide only Provision for drying
No requirements specified
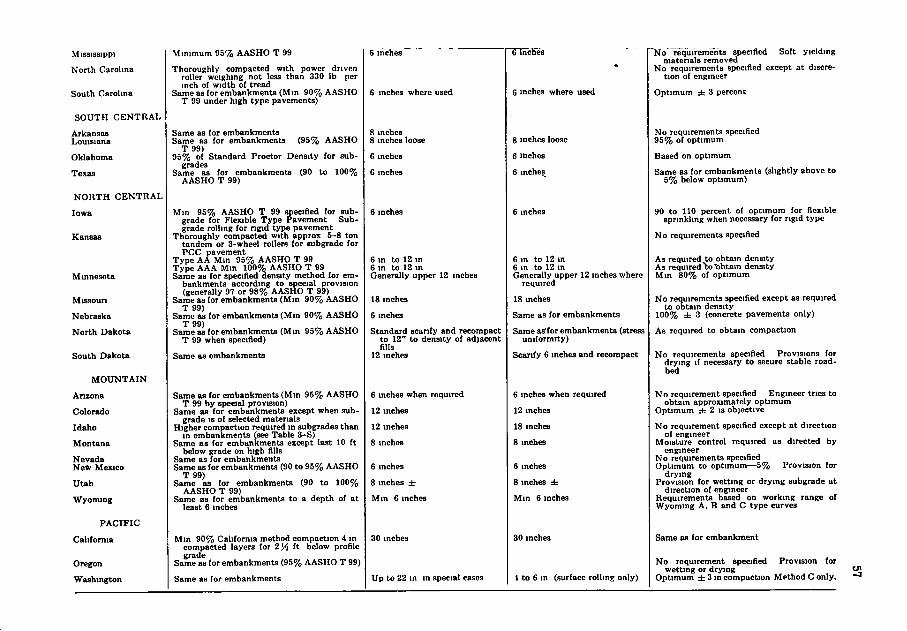
M i s s i s s i p p i
N o r t h C a r o l i n a
S o u t h C a r o h n a
S O U T H C E N T R A L
A r k a n s a s L o u i s i a n a
O k l a h o m a
T e x a s
N O R T H C E N T R A L
I o w a
K a n s a s
M i n n e s o t a
M i s s o u r i
N e b r a s k a
N o r t h D a k o t a
S o u t h D a k o t a
M O U N T A I N
A r i z o n a
C o l o r a d o
I d a h o
M o n t a n a
N e v a d a N e * M e x i c o
U t a h
W y o m i n g
P A C I F I C
C a l i f o r n i a
O r e g o n
W a s h i n g t o n
M i n i m u m 9 5 % A A S H O T 99
T h o r o u g h l y c o m p a c t e d w i t h p o w e r d r i v e n r o l l e r w e i g h i n g n o t less t h a n 3 3 0 l b pe r i n c h o f w i d t h o f t r e a d
S a m e as f o r e m b a n k m e n t s ( M i n 9 0 % A A S H O T 99 u n d e r h i g h t y p e p a v e m e n t s )
S a m e as f o r e m b a n k m e n t s S a m e as f o r e m b a n k m e n t s ( 9 5 % A A S H O
T 99 ) 9 5 % o f S t a n d a r d P r o c t o r D e n s i t y f o r s u b -
g rades S a m e as f o r e m b a n k m e n t s (90 t o 1 0 0 %
A A S H O T 99 )
M i n 9 5 % A A S H O T 99 s p e c i f i e d f o r s u b -g r a d e f o r F l e x i b l e T y p e P a v e m e n t S u b -g r a d e r o l l i n g f o r r i g i d t y p e p a v e m e n t
T h o r o u g h l y c o m p a c t e d w i t h a p p r o x 5 - 8 t o n t a n d e m or 3 - w h e e l ro l l e r s f o r s u b g r a d e f o r P C C p a v e m e n t
T y p e A A M i n 9 5 % A A S H O T 99 T y p e A A A M i n 1 0 0 % A A S H O T 99 S a m e as f o r s p e c i f i e d d e n s i t y m e t h o d f o r e m
b a n k m e n t s a c c o r d i n g t o s p e c i a l p r o v i s i o n ( g e n e r a l l y 97 o r 9 8 % A A S H O T 99 )
S a m e as f o r e m b a n k m e n t s ( M m 9 0 % A A S H O T 99 )
S a m e as f o r e m b a n k m e n t s ( M m 9 0 % A A S H O T 99 )
S a m e as (or e m b a n k m e n t s ( M m 9 5 % A A S H O T 99 w h e n s p e c i f i e d )
S a m e as e m b a n k m e n t s
S a m e as f o r e m b a n k m e n t s ( M m 9 5 % A A S H O T 9 9 b y spec i a l p r o v i a i o n )
S a m e as f o r e m b a n k m e n t s e x c e p t w h e n s u b -g r a d e IS o f se lec ted m a t e r i a l s
H i g h e r c o m p a c t i o n r e q u i r e d i n s u b g r a d e s t h a n i n e m b a n k m e n t s (see T a b l e 3 - S )
S a m e a s f o r e m b a n k m e n t s e x c e p t l a s t 10 f t b e l o w g r a d e o n h i g h f i l l s
S a m e as f o r e m b a n k m e n t s S a m e as f o r e m b a n k m e n t s (90 t o 9 5 % A A S H O
T 9 9 ) S a m e as f o r e m b a n k m e n t s (90 t o 1 0 0 %
A A S H O T 99 ) ' ° S a m e as ( o r e m b a n k m e n t s t o a d e p t h o f a t
l eas t 6 inches
M m 9 0 % C a l i f o r n i a m e t h o d c o m p a c t i o n 4 i n c o m p a c t e d l a y e r s f o r 2 H f t b e l o w p r o f i l e g r a d e
S a m e as f o r e m b a n k m e n t s ( 9 5 % A A S H O T 99 )
S a m e as f o r e m b a n k m e n t s
6 i nches
6 inches w h e r e used
8 i nches 8 i nches loose
6 i nches
6 i nches
6 inches
6 i n t o 12 i n 6 i n t o 12 m G e n e r a l l y u p p e r 12 inches
18 i nches
6 inches
S t a n d a r d s c a r i f y a n d r e c o m p a c t t o 1 2 " t o d e n s i t y o f a d j a c e n t f i l l s
12 inches
6 i nches w h e n r e q u i r e d
12 i nches
12 i n c h e s
8 i nches
6 i n c h e s
8 i n c h e s ±
M m 6 i nches
3 0 i nches
U p t o 2 2 i n i n s p e c i a l cases
6 i nches
6 inches w h e r e used
8 i nches loose
6 i nches
6 inches
6 i nches
6 i n t o 12 i n 6 i n t o 12 i n G e n e r a l l y u p p e r 12 i nches w h e r e
r e q u i r e d
18 inches
S a m e as f o r e m b a n k m e n t s
S a m e as ' fo r e m b a n k m e n t s (s tress u n i f o r m i t y )
S c a r i f y 6 inches a n d r e c o m p a c t
6 i nches w h e n r e q u i r e d
12 i nches
18 inches
8 inches
6 inches
8 i nches ±
M m 6 inches
3 0 i n c h e s
1 t o 6 i n ( s u r f a c e r o l l i n g o n l y )
N o r e q u i r e m e n t s s p e c i f i e d S o f t y i e l d i n g m a t e r i a l s r e m o v e d
N o r e q u i r e m e n t s spec i f i ed e x c e p t a t d i s c r e t i o n o f eng inee r
O p t i m u m ± 3 p e r c e n t
N o r e q u i r e m e n t s s p e c i f i e d 9 5 % o f o p t i m u m
B a s e d on o p t i m u m
S a m e as f o r e m b a n k m e n t s ( s l i g h t l y a b o v e t o 5 % b e l o w o p t i m u m )
9 0 t o 110 p e r c e n t of o p t i m u m f o r f l e x i b l e s p r i n k l i n g w h e n necessary f o r r i g i d t y p e
N o r e q u i r e m e n t s s p e c i f i e d
A s r e q u i r e d t o o b t a i n d e n s i t y A s r e q u i r e d t o ' b b t a i n d e n s i t y M i n 8 0 % of o p t i m u m
N o r e q u i r e m e n t s s p e c i f i e d e x c e p t as r e q u i r e d t o o b t a i n d e n s i t y
1 0 0 % ± 3 ( c o n c r e t e p a v e m e n t s o n l y )
A s r e q u i r e d t o o b t a i n c o m p a c t i o n
N o r e q u i r e m e n t s s p e c i f i e d P r o v i s i o n s f o r d r y i n g i f necessary t o secure s t a b l e r o a d b e d
N o r e q u i r e m e n t s p e c i f i e d E n g i n e e r t r i e s t o o b t a i n a p p r o x i m a t e l y o p t i m u m
O p t i m u m ± 2 IS o b j e c t i v e
N o r e q u i r e m e n t s p e c i f i e d e x c e p t a t d i r e c t i o n o f e n g i n e e r
M o i s t u r e c o n t r o l r e q u i r e d as d i r e c t e d b y e n g i n e e r
N o r e q u i r e m e n t s s p e c i f i e d O p t i m u m t o o p t i m u m — 5 % P r o v i s i o n f o r
d r y i n g P r o v i s i o n f o r w e t t i n g o r d r y i n g s u b g r a d e a t
d i r e c t i o n o f e n g i n e e r R e q u i r e m e n t s based o n w o r k i n g r a n g e o f W y o m i n g A , B a n d C t y p e c u r v e s
S a m e as f o r e m b a n k m e n t
N o r e q u i r e m e n t s p e c i f i e d P r o v i s i o n f o r w e t t i n g o r d r y i n g UJ
O p t i m u m ± 3 i n c o m p a c t i o n M e t h o d C o n l y .
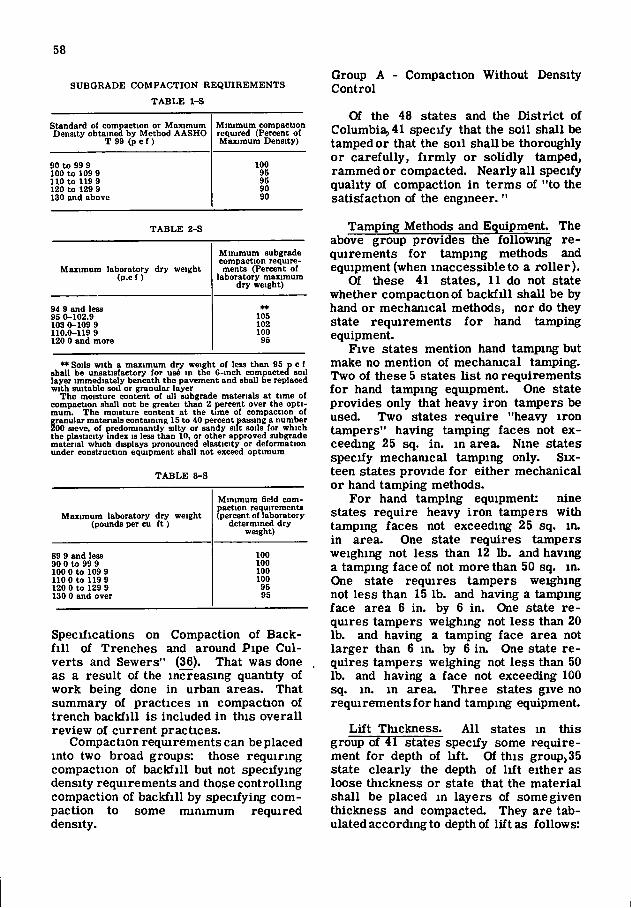
58
S U B G R A D E C O M P A C T I O N R E Q U I R E M E N T S Group A Control
Compaction Without Density
T A B L E 1-S
S t a n d a r d o f c o m p a c t i o n o r M a x i m u m D e n s i t y o b t a i n e d b y M e t h o d A A S H O
T 99 ( p c f )
M i n i m u m c o m p a c t i o n r e q u i r e d ( P e r c e n t o f M a x i m u m D e n s i t y )
9 0 t o 99 9 100 t o 109 9 110 t o 119 9 120 t o 129 9 130 a n d a b o v e
100 95 95 9 0 9 0
T A B L E 2 - S
M a x i m u m l a b o r a t o r y d r y w e i g h t ( p . c t)
M i n i m u m s u b g r a d e c o m p a c t i o n r e q u i r e m e n t s ( P e r c e n t o f
l a b o r a t o r y m a x i m u m d r y w e i g h t )
94 9 a n d less 95 0 - 1 0 2 . 9 103 0 - 1 0 9 9 1 1 0 . 0 - 1 1 9 9 120 0 a n d m o r e
** 105 102 100
9 6
* * So i l s w i t h a m a x i m u m d r y w e i g h t o f less t h a n 95 p c f s h a l l b e u n s a t i s f a c t o r y f o r u s ^ i n t h e 6 - i n c h c o m p a c t e d s o i l l a y e r i m m e d i a t e l y b e n e a t h t h e p a v e m e n t a n d s h a l l b e r e p l a c e d w i t h s u i t a b l e s o i l o r g r a n u l a r l a y e r
T h e m o i s t u r e c o n t e n t o f a l l s u b g r a d e m a t e r i a l s a t t i m e o f c o m p a c t i o n s h a l l n o t be g r ea t e r t h a n 2 p e r c e n t o v e r t h e o p t i m u m . T h e m o i s t u r e c o n t e n t a t t h e t i m e o f c o m p a c t i o n o f g r a n u l a r m a t e r i a l s c o n t a i n i n g 15 t o 40 p e r c e n t pa s s ing a n u m b e r 2 0 0 s ieve , o f p r e d o m i n a n t l y s i l t y o r s a n d y s i f t so i l s f o r w h i c h t h e p l a s t i c i t y i n d e x is less t h a n 10 , o r o t h e r a p p r o v e d s u b g r a d e m a t e r i a l w h i c h d i s p l a y s p r o n o u n c e d e l a s t i c i t y o r d e f o r m a t i o n u n d e r c o n s t r u c t i o n e q u i p m e n t s h a l l n o t exceed o p t i m u m
T A B L E 3 - S
M a x i m u m l a b o r a t o r y d r y w e i g h t ( p o u n d s per c u f t )
M i n i m u m field c o m p a c t i o n r e q u i r e m e n t s ( p e r c e n t o f l a b o r a t o r y
d e t e r m i n e d d r y w e i g h t )
89 9 a n d less 100 9 0 0 t o 99 9 100 100 0 t o 109 9 100 110 0 t o 119 9 100 120 0 t o 129 9 95 130 0 a n d o v e r 9 5
Specifications on Compaction of Backfill of Trenches and around Pipe Culverts and Sewers" (36). That was done as a result of the increasing quantity of work being done in urban areas. That summary of practices in compaction of trench backfill is included in this overall review of current practices.
Compaction requirements can beplaced into two broad groups: those requiring compaction of backfill but not specifying density requirements and those controlling compaction of backfill by specifying compaction to some minimum required density.
Of the 48 states and the District of Columbia, 41 specify that the soil shall be tamped or that the soil shall be thoroughly or carefully, firmly or solidly tamped, rammed or compacted. Nearly all specify quality of compaction in terms of "to the satisfaction of the engineer. "
Tamping Methods and Equipment. The above group provides the followmg requirements for tamping methods and equipment (when inaccessible to a roller).
Of these 41 states, 11 do not state whether compaction of backfill shall be by hand or mechanical methods, nor do they state requirements for hand tamping equipment.
Five states mention hand tamping but make no mention of mechanical tamping. Two of these 5 states list no requirements for hand tamping equipment. One state provides only that heavy iron tampers be used. Two states require "heavy iron tampers" having tamping faces not exceeding 25 sq. in. in area. Nine states specify mechanical tamping only. Sixteen states provide for either mechanical or hand tamping methods.
For hand tamping equipment: nine states require heavy iron tampers with tamping faces not exceeding 25 sq. in. in area. One state requires tampers weighing not less than 12 lb. and having a tamping face of not more than 50 sq. in. One state requires tampers weighing not less than 15 lb. and having a tamping face area 6 in. by 6 in. One state requires tampers weighing not less than 20 lb. and having a tamping face area not larger than 6 in. by 6 iiL One state requires tampers weighing not less than 50 lb. and having a face not exceeding 100 sq. in. in area. Three states give no requirements for hand tamping equipment.
Lift Thickness. All states in this group of 41 states specify some requirement for depth of lift Of this group)35 state clearly the depth of lift either as loose thickness or state that the material shall be placed in layers of some given thickness and compacted. They are tabulated according to depth of lift as follows:
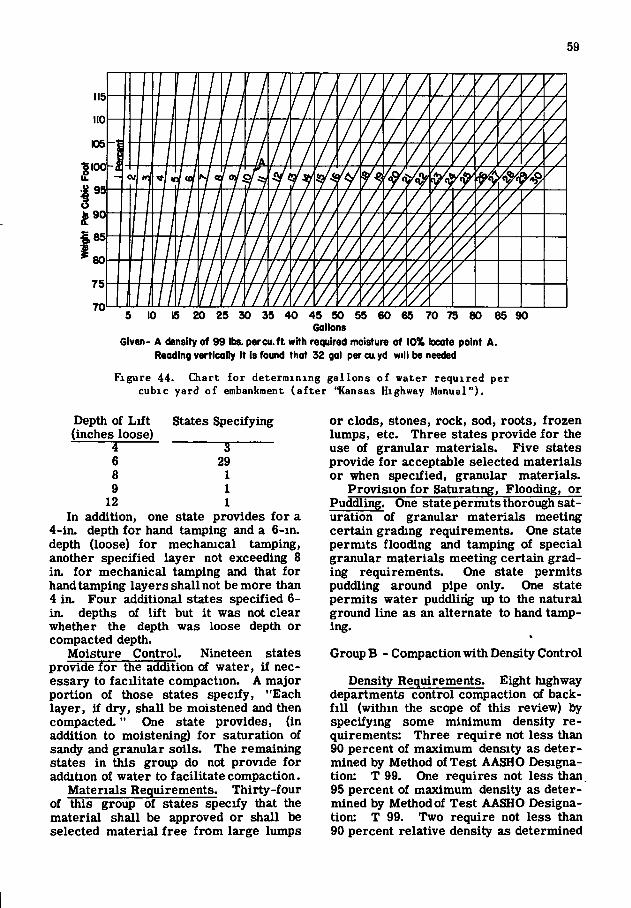
59
85 90 20 25 30 35 40 45 50 55 60 65 70 75 80 Gallons
Given- A density of 99 lbs. percu.ft with required moisture of 10% locate point A. Reading vertically It Is found that 32 gal percayd will be needed
Figure 44. Chart for determining gallons of water required per cubic yard of embankment (af ter "Kansas Highway Manual").
Depth of Lift (inches loose)
3 6 8 9
12 addition,
States Specifying
5
29 1 1 1
In addition, one state provides for a 4-in. depth for hand tamping and a 6-in. depth (loose) for mechanical tamping, another specified layer not exceeding 8 in. for mechanical tamping and that for hand tamping layers shall not be more than 4 in. Four additional states specified 6-in. depths of lift but it was not clear whether the depth was loose depth or compacted depth.
Moisture Control. Nineteen states provide for the addition of water, if necessary to facilitate compaction. A major portion of those states specify, "Each layer, if dry, shall be moistened and then compacted." One state provides, (in addition to moistening) for saturation of sandy and granular soils. The remaining states in this group do not provide for addition of water to facilitate compaction.
Materials Requirements. Thirty-four of this group of states specify that the material shall be approved or shall be selected material free from large lumps
or clods, stones, rock, sod, roots, frozen lumps, etc. Three states provide for the use of granular materials. Five states provide for acceptable selected materials or when specified, granular materials.
Provision for Saturating, Flooding, or Puddling. One state permits thorough saturation of granular materials meeting certain grading requirements. One state permits flooding and tamping of special granular materials meeting certain grading requirements. One state permits puddling around pipe only. One state permits water puddling up to the natural ground line as an alternate to hand tamping.
Group B - Compaction with Density Control
Density Requirements. Eight highway departments control compaction of backfill (within the scope of this review) by specifying some minimum density requirements: Three require not less than 90 percent of maximum density as determined by Method of Test AASHO Designation: T 99. One requires not less than 95 percent of maximum density as determined by Method of Test AASHO Designation: T 99. Two require not less than 90 percent relative density as determined
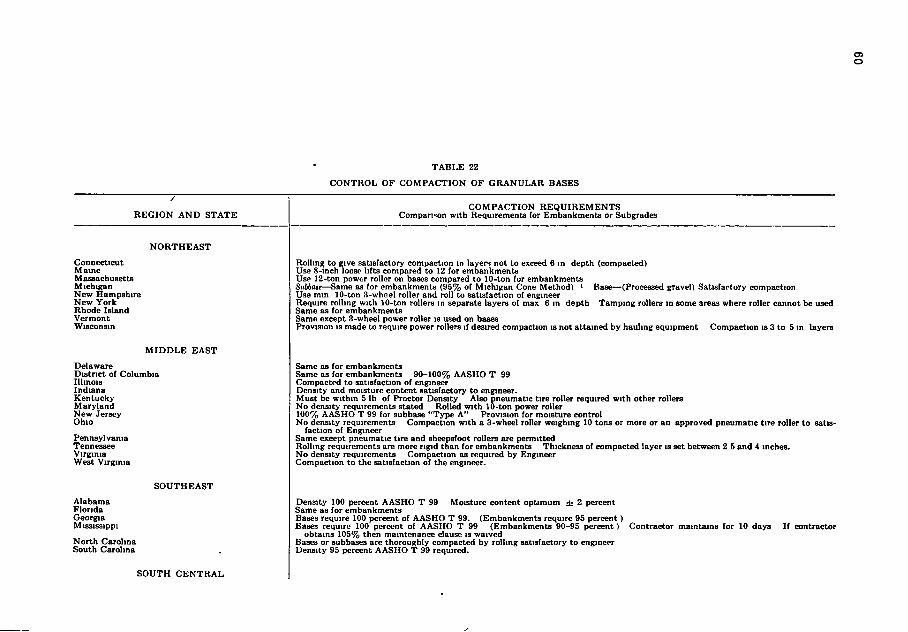
o
T A B L E 2 2
C O N T R O L O F C O M P A C T I O N O F G R A N U L A R B A S E S
/
R E G I O N A N D S T A T E C O M P A C T I O N R E Q U I R E M E N T S
Compart<^on w i t h R e q u i r e m e n t s f o r E m b a n k m e n t s o r S u b g r a d e s
N O R T H E A S T
C o n n e c t i c u t M a i n e M a s s a c h u s e t t s M i c h i g a n N e w H a m p s h i r e N e w Y o r k R h o d e I s l a n d V e r m o n t W i s c o n s i n
R o l l i n g t o g i v e s a t i s f a c t o r y c o m p a c t i o n i n l a y e r s n o t t o exceed 6 i n d e p t h ( c o m p a c t e d ) U s e 8 - i n c h loose l i f t s c o m p a r e d t o 12 f o r e m b a n k m e n t s U s e 1 2 - t o n p o w e r r o l l e r o n bases c o m p a r e d t o 1 0 - t o n f o r e m b a n k m e n t s Subbate—Same as f o r e m b a n k m e n t s ( 9 5 % o f M i c h i g a n C o n e M e t h o d ) ' Base—(Processed g r a v e l ) S a t i s f a c t o r y c o m p a c t i o n U s e m i n 1 0 - t o n I l - w h c e l r o l l e r a n d r o l l t o s a t i s f a c t i o n o f eng inee r R e q u i r e r o l l i n g w i t h 1 0 - t o n ro l l e r s i n s epa ra t e l a y e r s o f m a x 6 i n d e p t h T a m p i n g r o l l e r s i n s o m e areas w h e r e r o l l e r c a n n o t be used S a m e as f o r e m b a n k m e n t s S a m e e x c e p t 3 - w h e e l p o w e r r o l l e r is u sed o n bases P r o v i s i o n i s m a d e t o r e q u i r e p o w e r r o l l e r s i f de s i r ed c o m p a c t i o n i s n o t a t t a i n e d b y h a u l i n g e q u i p m e n t C o m p a c t i o n i s 3 t o 5 i n l a y e r s
M I D D L E E A S T
D e l a w a r e D i s t r i c t o f C o l u m b i a I l l i n o i s I n d i a n a K e n t u c k y M a r y l a n d N e w J e r s e y O h i o
P e n n s y l v a n i a Tennes see V i r g i n i a W e s t V i r g i n i a
S a m e as f o r e m b a n k m e n t s S a m e as f o r e m b a n k m e n t s 9 0 - 1 0 0 % A A S H O T 99 C o m p a c t e d t o s a t i s f a c t i o n o f eng inee r D e n s i t y a n d m o i s t u r e c o n t e n t s a t i s f a c t o r y t o eng inee r . M u s t be w i t h i n 5 l b o f P r o c t o r D e n s i t y A l s o p n e u m a t i c t i r e r o l l e r r e q u i r e d w i t h o t h e r r o l l e r s N o d e n s i t y r e q u i r e m e n t s s t a t e d R o l l e d w i t h l O - t o n p o w e r r o l l e r 1 0 0 % A A S H O T 99 f o r subbase " T y p e A " P r o v i s i o n f o r m o i s t u r e c o n t r o l N o d e n s i t y r e q u i r e m e n t s C o m p a c t i o n w i t h a 3 - w h e e l r o l l e r w e i g h i n g 10 t o n s o r m o r e o r a n a p p r o v e d p n e u m a t i c t i r e r o l l e r t o s a t i s
f a c t i o n o f E n g i n e e r S a m e e x c e p t p n e u m a t i c t i r e a n d s h e e p s f o o t r o l l e r s a r e p e r m i t t e d R o l l i n g r e q u i r e m e n t s are m o r e r i g i d t h a n f o r e m b a n k m e n t s T h i c k n e s s o f c o m p a c t e d l a y e r i s set b e t w e e n 2 5 a n d 4 i n c h e s . N o d e n s i t y r e q u i r e m e n t s C o m p a c t i o n as r e q u i r e d b y E n g i n e e r C o m p a c t i o n t o t h e s a t i s f a c t i o n o f t h e eng inee r .
S O U T H E A S T
A l a b a m a F l o r i d a G e o r g i a M i s s i s s i p p i
N o r t h C a r o l i n a S o u t h C a r o l i n a
D e n s i t y 100 p e r c e n t A A S H O T 99 M o i s t u r e c o n t e n t o p t i m u m ± 2 p e r c e n t S a m e as f o r e m b a n k m e n t s Bases r e q u i r e 100 p e r c e n t o f A A S H O T 9 9 . ( E m b a n k m e n t s r e q u i r e 95 p e r c e n t ) Bases r e q u i r e 100 p e r c e n t o f A A S H O T 99 ( E m b a n k m e n t s 9 0 - 9 5 p e r c e n t ) C o n t r a c t o r m a i n t a i n s f o r 10 d a y s I f c o n t r a c t o r
o b t a i n s 1 0 5 % t h e n m a i n t e n a n c e clause is w a i v e d Bases o r subbases a re t h o r o u g h l y c o m p a c t e d b y r o l l i n g s a t i s f a c t o r y t o e n g i n e e r D e n s i t y 95 p e r c e n t A A S H O T 99 r e q u i r e d .
S O U T H C E N T R A L
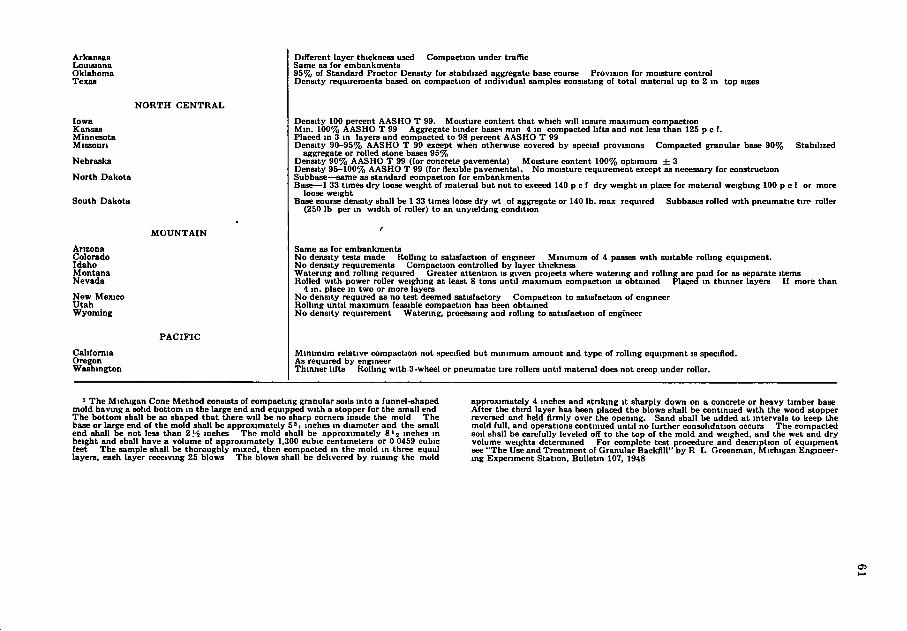
A r k a n s a s L o u i s i a n a O k l a h o m a T e x a s
N O R T H C E N T R A L
D i f f e r e n t l a y e r t h i c k n e s s used C o m p a c t i o n u n d e r t r a f f i c S a m e as f o r e m b a n k m e n t s 9 5 % o f S t a n d a r d P r o c t o r D e n s i t y f o r s t a b i l i z e d agg rega t e base course P r o v i s i o n f o r m o i s t u r e c o n t r o l D e n s i t y r e q u i r e m e n t s based o n c o m p a c t i o n o f i n d i v i d u a l s a m p l e s c o n s i s t i n g o f t o t a l m a t e n a l u p t o 2 i n t o p sizes
I o w a K a n s a s M i n n e s o t a M i s s o u r i
N e b r a s k a
N o r t h D a k o t a
S o u t h D a k o t a
D e n s i t y 100 p e r c e n t A A S H O T 9 9 . M o i s t u r e c o n t e n t t h a t w h i c h w i l l i n s u r e m a x i m u m c o m p a c t i o n M i n . 1 0 0 % A A S H O T 99 A g g r e g a t e b i n d e r bases m i n 4 i n c o m p a c t e d l i f t s a n d n o t less t h a n 125 p c f . P l a c e d i n 3 i n l a y e r s a n d c o m p a c t e d t o 98 p e r c e n t A A S H O T 99 D e n s i t y 9 0 - 9 5 % A A S H O T 99 e x c e p t w h e n o t h e r w i s e c o v e r e d b y spec i a l p r o v i s i o n s C o m p a c t e d g r a n u l a r base 9 0 % S t a b i l i z e d
a e e r e g a t e o r r o l l e d s t o n e bases 9 5 % D e n s i t y 9 0 % A A S H O T 99 ( f o r c o n c r e t e p a v e m e n t s ) M o i s t u r e c o n t e n t 1 0 0 % o p t i m u m db 3 D e n s i t y 9 5 - 1 0 0 % A A S H O T 99 ( f o r f l e x i b l e p a v e m e n t s ) . N o m o i s t u r e r e q u i r e m e n t e x c e p t as necessary f o r c o n s t r u c t i o n S u b b a s e — s a m e as s t a n d a r d c o m p a c t i o n f o r e m b a n k m e n t s B a s e — 1 33 t i m e s d r y loose w e i g h t o f m a t e r i a l b u t n o t t o exceed 140 p c f d r y w e i g h t i n p l a c e f o r m a t e r i a l w e i g h i n g 100 p c f o r m o r e
loose w e i g h t B a s e course d e n s i t y s h a l l be 1 33 t i m e s loose d r y w t o f agg rega t e o r 140 l b . m a x r e q u i r e d Subbases r o l l e d w i t h p n e u m a t i c t i r e r o l l e r
( 250 l b pe r i n w i d t h o f r o l l e r ) t o a n u n y i e l d i n g c o n d i t i o n
M O U N T A I N f A r i z o n a C o l o r a d o I d a h o M o n t a n a N e v a d a
N e w M e x i c o U t a h W y o m i n g
P A C I F I C
S a m e as f o r e m b a n k m e n t s N o d e n s i t y t es t s m a d e R o l l i n g t o s a t i s f a c t i o n o f eng inee r M i n i m u m o f 4 passes w i t h s u i t a b l e r o l l i n g e q u i p m e n t . N o d e n s i t y r e q u i r e m e n t s C o m p a c t i o n c o n t r o l l e d b y l a y e r t h i c k n e s s W a t e r i n g a n d r o l l i n g r e q u i r e d G r e a t e r a t t e n t i o n i s g i v e n p r o j e c t s w h e r e w a t e r i n g a n d r o l l i n g are p a i d f o r as s epa ra t e i t e m s R o l l e d w i t h p o w e r r o l l e r w e i g h i n g a t l eas t 8 t o n s u n t i l m a x i m u m c o m p a c t i o n is o b t a i n e d P l a c e d m t h i n n e r l a y e r s I f m o r e t h a n
4 i n . p l ace i n t w o o r m o r e l a y e r s N o d e n s i t y r e q u i r e d as n o t e s t d e e m e d s a t i s f a c t o r y C o m p a c t i o n t o s a t i s f a c t i o n o f e n g i n e e r R o l l i n g u n t i l m a x i m u m feas ib l e c o m p a c t i o n has been o b t a i n e d N o d e n s i t y r e q u i r e m e n t W a t e r i n g , p roces s ing a n d r o l l i n g t o s a t i s f a c t i o n o f e n g i n e e r
C a l i f o r n i a O r e g o n W a s h i n g t o n
M i n i m u m r e l a t i v e c o m p a c t i o n n o t spec i f i ed b u t m i n i m u m a m o u n t a n d t y p e o f r o l l i n g e q u i p m e n t i s s p e c i f i e d . A s r e q u i r e d b y eng inee r T h i n n e r l i f t s R o l l i n g w i t h 3 - w h e e l o r p n e u m a t i c t i r e ro l l e r s u n t i l m a t e r i a l does n o t creep u n d e r r o l l e r .
1 T h e M i c h i g a n C o n e M e t h o d cons i s t s o f c o m p a c t i n g g r a n u l a r so i l s i n t o a f u n n e l - s h a p e d m o l d h a v i n g a s o l i d b o t t o m i n t h e l a r g e e n d a n d e q u i p p e d w i t h a s t o p p e r f o r t h e s m a l l e n d T h e b o t t o m s h a l l be so s h a p e d t h a t t h e r e w i l l b e n o s h a r p c o r n e r s m s i d e t h e m o l d T h e base o r l a r g e e n d o f t h e m o l d s h a l l be a p p r o x i m a t e l y 5 ' i i n c h e s i n d i a m e t e r a n d t h e s m a l l e n d s h a l l be n o t less t h a n 2 ?4 i n c h e s T h e m o l d s h a l l be a p p r o x i m a t e l y 8 > -i i nches m h e i g h t a n d s h a l l h a v e a v o l u m e o f a p p r o x i m a t e l y 1,300 c u b i c c e n t i m e t e r s o r 0 0459 c u b i c f e e t T h e s a m p l e s h a l l be t h o r o u g h l y m i x e d , t h e n c o m p a c t e d i n t h e m o l d i n t h r e e e q u a l l a y e r s , e a c h l a y e r r e c e i v i n g 25 b l o w s T h e b l o w s s h a l l be d e l i v e r e d b y r a i s i n g t h e m o l d
a p p r o x i m a t e l y 4 i n c h e s a n d s t n k i n g i t s h a r p l y d o w n o n a c o n c r e t e o r h e a v y t i m b e r base A f t e r t h e t h i r d l a y e r has been p l a c e d t h e b l o w s s h a l l be c o n t i n u e d w i t h t h e w o o d s t o p p e r r eve r sed a n d h e l d f i r m l y o v e r t h e o p e n i n g . S a n d s h a l l be a d d e d a t i n t e r v a l s t o keep t h e m o l d f u l l , a n d o p e r a t i o n s c o n t i n u e d u n t i l n o f u r t h e r c o n s o l i d a t i o n occu r s T h e c o m p a c t e d s o i l s h a l l be c a r e f u l l y l e v e l e d o f f t o t h e t o p o f t h e m o l d a n d w e i g h e d , a n d t h e w e t a n d d r y v o l u m e w e i g h t e d e t e r m i n e d F o r c o m p l e t e t e s t p r o c e d u r e a n d d e s c r i p t i o n o f e q u i p m e n t see " T h e Use a n d T r e a t m e n t o f G r a n u l a r B a c k f i l l " b y R L G r e e n m a n , M i c h i g a n E n g i n e e r i n g E x p e r i m e n t S t a t i o n , B u l l e t i n 107, 1948
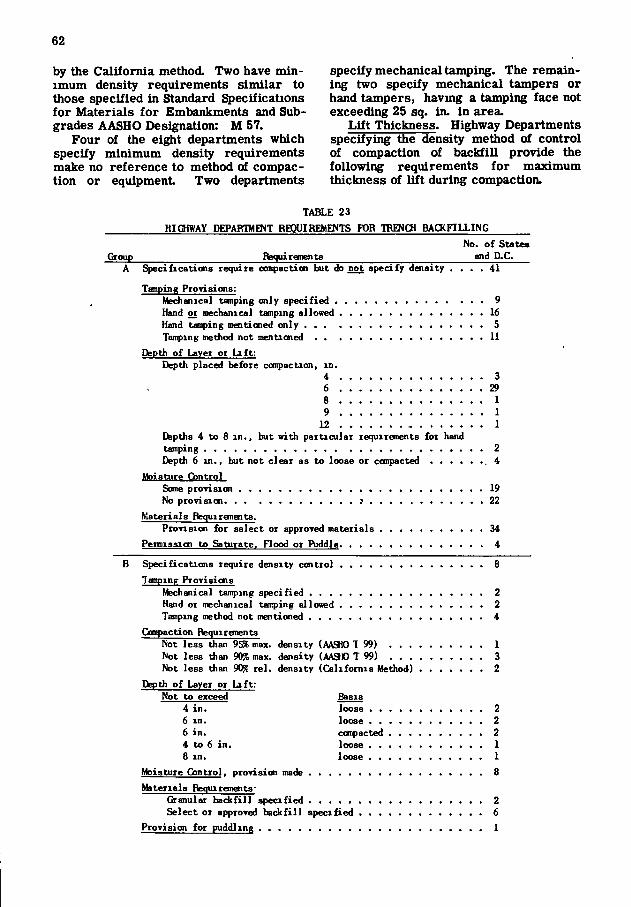
62
by the California method. Two have minimum density requirements similar to those specified in Standard Specifications for Materials for Embankments and Sub-grades AASHO Designation: M 57.
Four of the eight departments which specify minimum density requirements make no reference to method of compaction or equipment Two departments
specify mechanical tamping. The remaining two specify mechanical tampers or hand tampers, havmg a tamping face not exceeding 25 sq. in. in area.
Lift Thickness. Highway Departments specifying the density method of control of compaction of backfill provide the following requirements for maximum thickness of l^t during compaction.
TABLE 23 HIGHWAY DEPAfflWEM RiXJUIBEMENTS FOR TRiWCH BACXnLLING
No. of States Bequirementa and D-C.
Specifications lequire confjaction but do not specify density . . . . 41
TanpinR Provisions: Mechanical tamping only specified 9 Hand oi mechanical tamping allowed 16 Hand tonping moitioned only 5 Tamping method not mentioned 11
Depth of Layer or Lift: Depth placed before compaction, in.
4 3 6 29 8 1 9 1
12 1 Depths 4 to 8 in . , but with particular requirements for hand tamping 2 Depth 6 in . , but not clear as to loose or canpacted . 4
Moisture Control Some provision 19 No provision ; 22
Materials Requirements. Provision for select or approved materials 34
Pennissim to Saturate. Flood or Riddle 4
Specifications require density control 8 Tanping Provisions
Mechanical tamping specified 2 Hand or mechanical tamping alloved 2 Temping method not mentioned 4
Ccpipaction Requirements Not less than 95% max. density (AASIO 1 99) 1 Not less than 90% max. density (AA310 T 99) 3 Not less than 9(^ rel. density (California Method) 2
Depth of Layer or Lift: Not to exceed Basis
4 in. loose 2 6 in. loose 2 6 in. coTipacted 2 4 to 6 in. loose 1 8 in. loose 1
Moisture Control, provision made 8 Materials Requirements-
Granular backfill specified 2 Select or approved backfill specified 6
Provision for puddling 1
Group
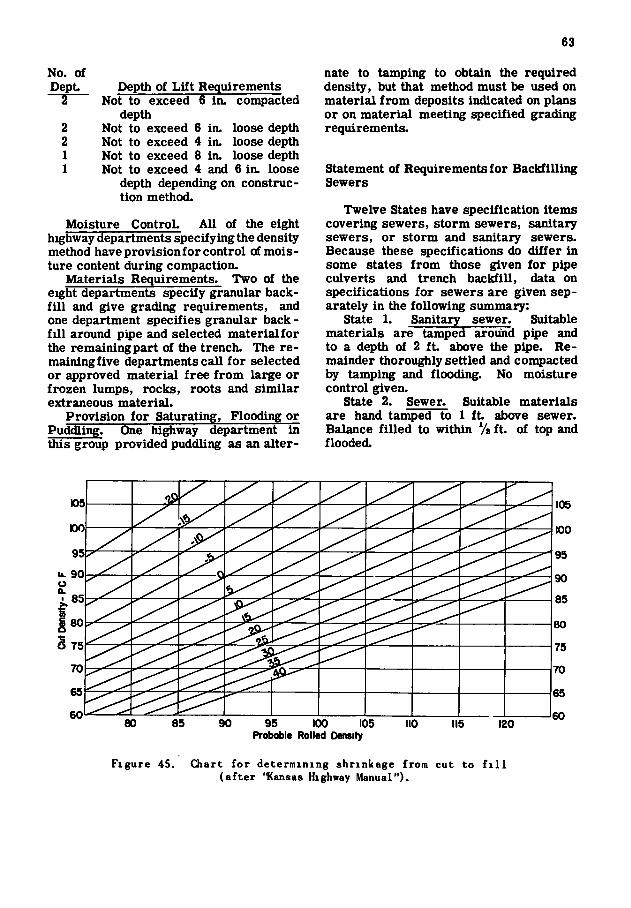
63
No. of Dept —2
2 2 1 1
Depth of Lift Requirements Not to exceed 6 in. compacted
depth Not to exceed 6 in. loose depth Not to exceed 4 in. loose depth Not to exceed 8 in. loose depth Not to exceed 4 and 6 in. loose
depth depending on construction method.
Moisture ControL All of the eight highway departments specifying the density method have provisionf or control of moisture content during compaction.
Materials Requirements. Two of the eight departments specify granular backfill and give grading requirements, and one department specifies granular back -fill around pipe and selected material for the remaining part of the trench. The re-mainingfive departments call for selected or approved material free from large or frozen lumps, rocks, roots and similar extraneous material.
Provision for Saturating, Flooding or Puddling. One highway department in this group provided puddling as an alter
nate to tamping to obtain the required density, but that method must be used on material from deposits indicated on plans or on material meeting specified grading requirements.
Statement of Requirements for Backfilling Sewers
Twelve States have specification items covering sewers, storm sewers, sanitary sewers, or storm and sanitary sewers. Because these specifications do differ in some states from those given for pipe culverts and trench backfill, data on specifications for sewers are given separately in the following summary:
State 1. Sanitary sewer. Suitable materials are tamped around pipe and to a depth of 2 f t above the pipe. Remainder thorou^ly settled and compacted by tamping and flooding. No moisture control given.
State 2. Sewer, Suitable materials are hand tamped to 1 ft above sewer. Balance filled to within Va ft. of top and flooded.
u. 90
80 85 90 95 100 105 Probable Rolled Density
110 115 120
Figure 45. Chart for determining shrinkage from cut to f i l l (a f ter 'Kansas Highway Manual").

T A B L E 24
C U R R E N T S T A T E H I G H W A Y S T A N D A R D S P E C I F I C A T I O N S F O R C O M P A C T I O N O F B A C K F I L L F O R S T R U C T U R A L E X C A V A T I O N
R e g i o n a n d S t a t e D e p t h o f L i f t C o m p a c t i o n M o i s t u r e C o n t r o l T a m p i n g E q u i p m e n t a n d M e t h o d s
N O R T H E A S T
C o n n e c t i c u t
M a i n e Massachuse t t s
M i c h i g a n
N e w H a m p s h i r e N e w Y o r k
R h o d e I s l a n d
V e r m o n t
W i s c o n s i n
M I D D L E E A S T
D e l a w a r e
D i s t n c t o f C o l u m b i a
I l l i n o i s I n d i a n a
K e n t u c k y
M a r y l a n d
N e w Jersey
O h i o
P e n n s y l v a n i a Tennessee
12 i n m a x . loose
9 i n m a x loose 6 i n m a x loose
9 i n m a x loose
8 m . m a x loose 4 i n m a x loose
12 i n m a x loose
12 i n m a x loose
12 i n m a x loose
6 i n m a x loose ( p o w e r e q u i p m e n t )
4 i n m a x I oose ( h a n d e q u i p )
6 i n m a x loose
6 i n m a x G r a d e B special b o r r o w m a x
6 i n loose Specia l filling m a t e n a l 12 m m a x loose 6 i n m a x loose
6 i n m a x loose
6 i n m a x (subsur face s t r u c t u r e e x c a v a t i o n )
4 i n . m a x loose
4 i n m a x loose 6 i n m a x loose f o r t a m p i n g
r o l l e r 3 " m a x loose f o r mechan ica l t a m p .
V i r g i n i a 6 i n m a x loose
W e s t V i r g i n i a 6 i n 4 i n
m a x m a x
loose f o r ro l l infc loose f o r t a m p i n g
S O U T H E A S T
A l a b a m a 6 i n m a x . loose
F l o r i d a 8 m m a x loose
4 i n m a x loose
Georg i a 6 i n 6 i n
m a x m a x
c o m p a c t e d loose
M m 9 5 % A A S H O T 99
T h o r o u g h l y c o m p a c t e d T h o r o u g h l y c o m p a c t e d
Same as E m b c o n t r o l l e d d e n s i t y m e t h o d f o r g r a n u l a r m a t e r i a l ( 9 5 % c o n e m e t h o d )
T h o r o u g h l y conso l ida ted M i n 9 6 % A A S H O T 99
W e l l c o m p a c t e d
T h o r o u g h l y c o m p a c t e d
T h o r o u g h l y c o m p a c t e d
M i n 9 5 % M o d i f i e d A A S H O
Same as e m b a n k m e n t s ( 9 0 - 1 0 0 % A A S H O T 99)
T h o r o u g h l y t a m p e d T h o r o u g h l y c o m p a c t e d
T h o r o u g h l y s a t u r a t e d
T h o r o u g h l y c o m p a c t e d
S a m e as e m b a n k m e n t s ( 9 0 - 1 0 0 % A A S H O T 99) S a t i s f a c t o r y
Same as e m b a n k m e n t s ( 9 0 - 1 0 2 % A A S H O T 99) T h o r o u g h l y t a m p e d o r ro l l ed T h o r o u g h l y c o m p a c t i n g each
l a y e r
T h o r o u g h l y t a m p e d
T h o r o u g h l y c o m p a c t e d
Same as e m b a n k m e n t s . '95% A A S H O T 99) T h o r o u g h l y c o m p a c t e d
T h o r o u g h l y c o m p a c t e d
W e l l t a m p e d M m 9 5 % A A S H O T 99
P u d d l i n g p e r m i t t e d
N o t speci f ied N o t speci f ied
Same as f o r e m b a n k m e n t s
N o t specifiGd A s r e q u i r e d t o o b t a i n dens i ty
N o t speci f ied
N o t spec i f ied
N o t speci f ied
O p t i m u m ± 10 percen t
A t least equa l t o o p t i m u m
N o t speci f ied N o t speci f ied
S u f f i c i e n t t o insure desired c o m p a c t i o n a n d d e n s i t y
S u f f i c i e n t t o insure proper c o m p a c t i o n
N o t speci f ied
S u f f i c i e n t t o i n su re d e n s i t y
N o t spec i f ied C o m p a c t e d a t o p t i m u m mois
t u r e c o n t e n t as d e t e r m i n e d b y l a b o r a t o r y tests on b a c k fill m a t e n a l
N o t speci f ied
N o t speci f ied
P r o v i s i o n f o r a d d i n g water o r d r y i n g
P r o v i s i o n f o r a d d i n g w a t e r o r d r y i n g
P r o v i s i o n f o r a d d i n g wa te r o r d r j i n g
N o t spec i f ied S u f f i c i e n t t o a l l o w s p e a f i e d
P o w e r ro l le r s , m o t o n z e d e q u i p m e n t o r h a n d e q u i p m e n t of t y p e ( b ) . a n d v i b r a t o r y e q u i p m e n t
T a m p i n g o r flushing w i t h w a t e r T a m p e d E q u i p m e n t n o t s h o w n u n d e r e x c a v a t i o n f o r s t r u c
t u r e b u t t y p e (a) e q u i p m e n t s h o w n u n d e r b a c k f i l l m g of p i p e c u l v e r t s P u d d l i n g o f c lean g r a n u l a r m a t e n a l p e r m i t t e d
P o w e r a n d h a n d e q u i p m e n t . D e t a i l s o n t a m p i n g e q u i p m e n t n o t g i v e n V i b r a t o r y e q u i p m e n t used e x t e n s i v e l y F l o o d i n g p e r m i t t e d o n p e r m i s s i o n o f engineer
A p p r o v e d p o w e r t a m p i n g devices M e c h a n i c a l r o l l i n g o r t a m p i n g M e c h a n i c a l t a m p e r s sha l l
be equa l i n w e i g h t a n d power t o I n g e r s o l l - R a n d N o . C C 4 5 w i t h a t a m p i n g f o o t area n o t t o exceed 50 sq i n .
E q u i p m e n t n o t spec i f i ed u n d e r s t r u c t u r e e x c a v a t i o n a n d b a c k fill b u t m e c h a n i c a l t a m p e r s o r h a n d t a m p e r s t y p e (a) s h o w n u n d e r b e d d i n g a n d b a c k f i l l f o r p i p e c u l v e r t s
M e c h a n i c a l o r h a n d t a m p e r s . D e t a i l s o n t a m p i n g e q u i p m e n t n o t g i v e n .
E q u i p m e n t n o t spec i f i ed u n d e r e x c a v a t i o n f o r s t r u c t u r e s
M e c h a n i c a l t a m p e r s g i v e n
D e t a i l s o n t a m p i n g e q u i p m e n t n o t
P o w e r ro l l e r s o r m e c h a n i c a l t a m p e r s M e c h a n i c a l t a m p e r s capable of e x e r t i n g a b l o w e q u a l t o 250 l b per sq f t of t a m p i n g area a n d h a v e a d e a d w e i g h t i n excess o f 4 0 l b
M e c h a n i c a l t a m p e r s of a p p r o v e d des ign M e c h a n i c a l t a m p s ( p r e f e r a b l y ) . F o r s m a l l areas h a n d t a m p s ,
rain w e i g h t 15 l b h a v i n g a face area 6 b y 6 i n
A p p r o v e d m e c h a n i c a l t a m p i n g devices
M e c h a n i c a l t a m p e r s
M e c h a n i c a l t a m p e r s P u d d l i n g of f o u n d a t i o n e x c a v a t i o n a n d subsur face s t r u c t u r e e x c a v a t i o n D e t a i l s o n e q u i p m e n t n o t spec i f ied
P n e u m a t i c U m p e r s
M e c h a n i c a l t a m p e r s T a m p i n g ro l l e r s a n d m e c h a n i c a l t a m p a are used
M e c h a n i c a l t a m p e r capab le of e x e r t i n g a b l o w equa l t o 250 p s r o f t a m p i n g area
R o l l e r m i n i m u m w e i g h t 10 t o n s P n e u m a t i c b a c k f i l l t a m p e r (25 t o 35 l b ) h a v i n g a p i s t o n b l o w r a t h e r t h a n a h a m m e r b l o w
M e c h a n i c a l t a m p i n g a n d / o r r o l l i n g
A p p r o v e d mechan ica l e q u i p m e n t
A p p r o v e d h a n d t a m p e r s w e i g h i n g n o t less t h a n 50 l b a n d h a v i n g a f ace area n o t exceeding 100 s q i n
( F o u n d a t i o n s e x c a v a t i o n f o r b n d g e s ) P o w e r d n v e n t a m p e r ( E m b a n k m e n t a d j a c e n t t o s t r u c t u r e s ) R o l l e r o r p o w e r d n v e n
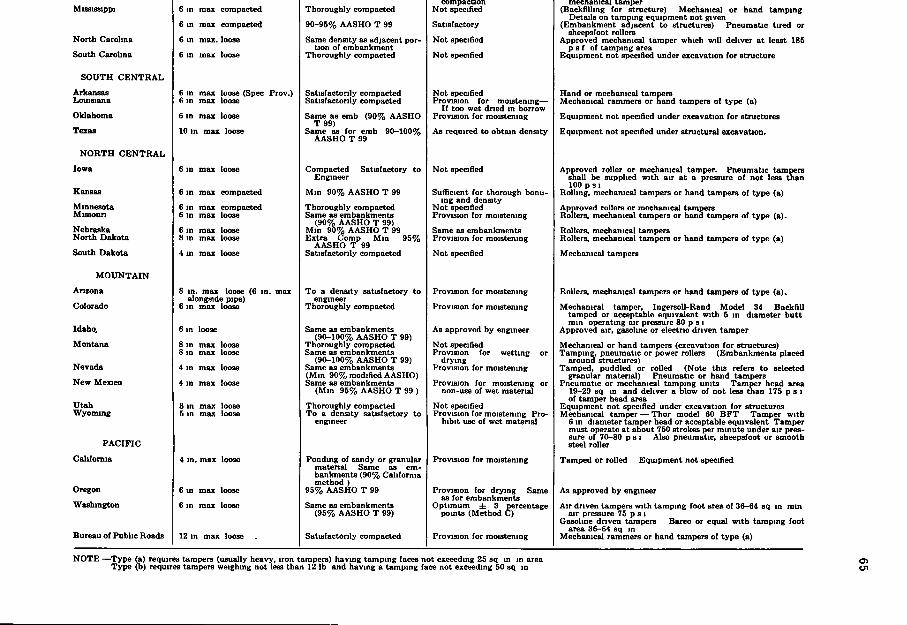
M i s s i s s i p p i 6 i n m a x c o m p a c t e d
6 i n m a x c o m p a c t e d
N o r t h C a r o l i n a 6 i n m a x . loose
S o u t h C a r o l i n a 6 i n m a x loose
S O U T H C E N T R A L
A r k a n s a s 6 i n m a x loose (Spec Liou is iana 6 i n m a x loose
O k l a h o m a 6 i n m a x loose
T e x a s 10 m m a x loose
N O R T H C E N T R A L
I o w a 6 i n m a x loose
K a n s a s 6 i n m a x c o m p a c t e d
M i n n e s o t a 6 i n m a x c o m p a c t e d loose M i s s o u r i 6 i n m a x c o m p a c t e d loose
N e b r a s k a 6 i n m a x loose N o r t h D a k o t a 8 i n m a x loose
S o u t h D a k o t a 4 i n m a x loose
M O U N T A I N
A r i z o n a
C o l o r a d o
Idaho^ 6 i n loose
M o n t a n a 8 i n m a x loose 8 m m a x loose
N e v a d a 4 i n m a x loose
N e w M e x i c o 4 i n m a x loose
U t a h 8 i n m a x loose W y o m m g 5 i n m a x loose
P A C I F I C
C a l i f o r n i a 4 i n m a x loose
O r e g o n 6 i n m a x loose
W a s h i n g t o n 6 i n m a x loose
B u r e a u o ( P u b l i c Roads 12 i n m a x loose
5 i n . m a x loose (6 i n . m a x a longside p ipe )
6 i n m a x loose
T h o r o u g h l y c o m p a c t e d
9 0 - 9 5 % A A S H O T 99
Same d e n s i t y as a d j a c e n t p o r t i o n of e m b a n k m e n t
T h o r o u g h l y c o m p a c t e d
S a t i s f a c t o r i l y c o m p a c t e d S a t i s f a c t o r i l y c o m p a c t e d
S a m e as e m b ( 9 0 % A A S H O T 99)
S a m e as f o r e m b 9 0 - 1 0 0 % A A S H O T 99
C o m p a c t e d E n g i n e e r
S a t i s f a c t o r y t o
M m 9 0 % A A S H O T 99
T h o r o u g h l y c o m p a c t e d Same as e m b a n k m e n t s
( 9 0 % A A S H O T 99) M i n 9 0 % A A S H O T 99 E x t r a C o m p M m 9 5 %
A A S H O T 99 S a t i s f a c t o r i l y c o m p a c t e d
T o a d e n s i t y s a t i s f a c t o r y t o engineer
T h o r o u g h l y c o m p a c t e d
Same as e m b a n k m e n t s ( 9 0 - 1 0 0 % A A S H O T 99)
T h o r o u g h l y c o m p a c t e d Same as e m b a n k m e n t s
( 9 0 - 1 0 0 % A A S H O T 99) S a m e as e m b a n k m e n t s ( M m 9 0 % m o d i f i e d A A S H O ) Same as e m b a n k m e n t s
( M i n 9 5 % A A S H O T 9 9 )
T h o r o u g h l y c o m p a c t e d T o a d e n s i t y s a t i s f a c t o r y t o
engineer
P o n d i n g o f sandy o r g r a n u l a r m a t e r i a l Same as e m b a n k m e n t s ( 9 0 % C a l i f o r n i a m e t h o d )
9 5 % A A S H O T 99
Same as e m b a n k m e n t s ( 9 5 % A A S H O T 99)
S a t i s f a c t o n l y c o m p a c t e d
c o m p a c t i o n N o t speci f ied
S a t i s f a c t o r y
N o t spec i f i ed
N o t spec i f i ed
N o t spec i f i ed P r o v i s i o n f o r m o i s t e n i n g —
I f t o o w e t d n e d i n b o r r o w P r o v i s i o n f o r m o i s t e n i n g
A s r e q u i r e d t o o b t a i n d e n s i t y
N o t spec i f i ed
S u f f i c i e n t f o r t h o r o u g h b o n u -i n g a n d d e n s i t y
N o t spec i f i ed P r o v i s i o n f o r m o i s t e n i n g
Same as e m b a n k m e n t s P r o v i s i o n f o r m o i s t e n i n g
N o t spec i f i ed
P r o v i s i o n f o r m o i s t e n i n g
P r o v i s i o n f o r m o i s t e n i n g
A s a p p r o v e d b y engineer
N o t spec i f i ed P r o v i s i o n f o r w e t t m g or
d r y i n g P r o v i s i o n f o r m o i s t e n m g
P r o v i s i o n f o r m o i s t e n i n g o r non-use o f w e t maten&J
N o t spec i f ied P r o v i s i o n f o r m o i s t e n i n g P r o
h i b i t use of w e t m a t e r i a l
P r o v i s i o n f o r m o i s t e n i n g
P r o v i s i o n f o r d r y i n g Same as f o r e m b a n k m e n t s
O p t i m u m ± 3 percentage p o i n t s ( M e t h o d C )
P r o v i s i o n f o r m o i s t e n i n g
m e c h a n i c a l t a m p e r ( B a c k f i l l i n g f o r s t r u c t u r e ) M e c h a n i c a l o r h a n d t a m p i n g
D e t a i l s o n t a m p i n g e q u i p m e n t n o t g i v e n ( E m b a n k m e n t a d j a c e n t t o s t r u c t u r e s ) P n e u m a t i c t i r e d o r
sheepsfoot ro l l e r s A p p r o v e d mechan ica l t a m p e r w h i c h w i l l d e l i v e r a t leas t 185
p s f of t a m p i n g area E q u i p m e n t n o t spec i f i ed unde r e x c a v a t i o n f o r s t r u c t u r e
H a n d o r mechan ica l t a m p e r s
M e c h a n i c a l r a m m e r s o r h a n d t a m p e r s of t y p e (a)
E q u i p m e n t n o t spec i f ied u n d e r e x c a v a t i o n f o r s t r u c t u r e s
E q u i p m e n t n o t spec i f ied unde r s t r u c t u r a l e x c a v a t i o n .
A p p r o v e d ro l l e r o r mechan ica l t a m p e r . P n e u m a t i c t a m p e r sha l l be s u p p l i e d w i t h a i r a t a pressure o f n o t less t n a i 100 p 3 I
R o l l i n g , mechan ica l t a m p e r s or h a n d t a m p e r s o f t y p e (a)
A p p r o v e d ro l l e r s o r m e c h a n i c a l t a m p e r s Rol le r s , m e c h a n i c a l t a m p e r s o r h a n d t a m p e r s o f t y p e ( a ) .
Ro l le r s , m e c h a n i c a l t a m p e r s
R o l l e r s , m e c h a n i c a l t a m p e r s o r h a n d t a m p e r s o f t y p e (a )
M e c h a n i c a l t a m p e r s
Rol le r s , m e c h a n i c a l t a m p e r s o r h a n d t a m p e r s o f t y p e ( a ) .
M e c h a n i c a l t a m p e r , I n g e r s o U - R a n d M o d e l 34 B a c k f i l l t a m p e d o r acceptable e q u i v a l e n t w i t h 6 i n d i a m e t e r b u t t m i n o p e r a t i n g a i r pressure 80 p s i
A p p r o v e d a i r . gasol ine o r e l ec t r i c d r i v e n t a m p e r
M e c h a n i c a l o r h a n d t a m p e r s ( e x c a v a t i o n f o r s t r u c t u r e s ) T a m p i n g , p n e u m a t i c o r power ro l le rs ( E m b a n k m e n t s p l aced
a r o u n d s t r u c t u r e s ) T a m p e d , p u d d l e d o r r o l l e d ( N o t e t h i s re fers t o selected
g r a n u l a r m a t e n a l ) P n e u m a t i c o r h a n d t a m p e r s P n e u m a t i c o r mechan ica l t a m p i n g u n i t s T a m p e r head area
19-29 sq i n a n d d e l i v e r a b l o w o f n o t less t h a n 175 p s i o f t a m p e r head area
E q u i p m e n t n o t speci f ied unde r e x c a v a t i o n f o r s t r u c t u r e s M e c h a n i c a l t a m p e r — T h o r m o d e l 60 B F T T a m p e r w i t h
6 i n d i a m e t e r t a m p e r head o r acceptable e q u i v a l e n t T a m p e r m u s t ope ra t e a t a b o u t 750 s t rokes per m i n u t e u n d e r a i r p res sure of 7 0 - 8 0 p s 1 A l s o p n e u m a t i c , sheepsfoot o r s m o o t h steel r o l l e r
T a m p e d o r r o l l e d E q u i p m e n t n o t spec i f i ed
A s a p p r o v e d b y engineer
A i r d r i v e n t a m p e r s w i t h t a m p i n g f o o t area of 3 6 - 6 4 sq i n m m a i r pressure 75 p s i
Gaso l ine d r i v e n t a m p e r s B a r c o o r equa l w i t h t a m p i n g f o o t area 3 6 - 6 4 sq i n
M e c h a n i c a l r a m m e r s o r h a n d t a m p e r s of t y p e (a)
N O T E — T y p e (a) r equ i res t a m p e r s ( u s u a l l y h e a v y , i r o n t a m p e r s ) h a v m g t a m p i n g faces n o t exceeding 25 sq i n i n area T y p e (b ) requi res t a m p e r s w e i g h i n g n o t less t h a n 12 l b a n d h a v i n g a t a m p i n g face n o t exceeding 50 sq i n
66
State 3. Storm sewers. Suitable materials are placed in 4-in. layers and thoroughly tamped to a depth of 1 f t above the pipe. Materials for the remaining depth are placed in 6-in. layers and each layer tamped. No moisture control given.
State 4. Storm sewers. Suitable materials are placed and compacted in accordance with one of three methods. Method 1. Placed in layers of 6 inch loose depth and tamped. Method 2. Use Method 1 to 12 in. above the pipe. Remaining materials are placed in lifts of 12 in. and each lift inundated. Method 3. Same as Method 2 except that the trench is filled and jetted to within two feet of the pipe. No moisture control specified for Methods 1 and 2.
State 5. Storm sewers - If under pavement Selected granular materials are used. If crushed stone is used it is tamped in layers not exceeding 6 in. If sand or gravel is used it is placed in 12 -in. layers, each layer is thoroughly saturated to secure maximum compaction. If not under pavement. Selected granular and ordinary materials are used. Selected granular materials are placed in 4-in. layers to a height of 1 ft. above the pipe. Ordinary materials are thoroughly tamped in 6-in. layers for the remainder of the depth. No moisture control specified.
State 6. storm and sanitary sewers. Ordinary materials are carefully hand tamped in 4-in. layers up to a height of 6-in. above the pipe. Remainder tamped in 6-in. lifts. No moisture control specified.
State 7. Pipe sewers. Ordinary materials are used if satisfactory. If not satisfactory, pit-run sand with 100 percent passing a 3-in. sieve is placed in layers not exceeding 6-in. and each layer thoroughly compacted. No moisture control specified.
state 8. storm sewers. Ordinary suitable materials are placed in layers not exceeding 4 in. loose measure and compacted to density requirements given for roadway(AASHO T-99 table of densities). Moisture control required but no limits given.
state 9. Sewers. Suitable materials are placed in 6-in. layers and solidly
tamped. Provision is made for adding water to dry soils.
state 10. Sewers. Suitable materials passing a 1-in. ring are compacted to the level of the top of the pipe. Water settling may be used above top of pipe when specially permitted by the engineer. No moisture control specified.
state 11. storm sewers. Selected soil, sand, or rock dust is thoroughly tamped. No specified depth of lift nor moisture control are given. Puddling is recommended for sandy or gravelly materials.
State 12. Storm sewers. Approved materials shall be used. If stone gravel or slag is specified for backfilling, the sewer pipe shall be covered with clean gravel or broken stone or slag placed around and above it to a height of not less than 4 in. above the surface of the pipe. Material shall be deposited simultaneously on both sides of the pipe in uniform layers not to exceed 4 in. in thickness, solidly tamped or rammed with proper tools so as not to injure pipe. No moisture control specified.
The foregoing statement of requirements for backfilling over sewer pipe can be summarized more briefly as follows:
Six of the twelve states provide only for compaction, with no provision for pud-dhng, flooding, or jetting. Two states provide for compaction and indicate that flooding or puddling may be permitted, one stating specifically that puddling is recommended only for sandy soils and gravelly soils. One state specified that the material shall be thoroughly settled by tamping and flooding. One state has provisions for use of compaction, flooding and jetting. One state provides for compaction of ordinary and angular (crushed rock) granular materials, permitting flooding only on rounded granular materials. Only one state provides simply for "flooding" without any qualifications or reservations.
Backfilling Structural Excavation
The 1951-52 survey included a review of Current State Highway Standard Specifications to summarize compaction and moisture control requirements for backfilling of structural excavation (see Table 24).
67
Lift Thickness. The specifications show a wide range of variation in thickness of lift Four states specify a 6-in. compacted thickness. Two do not specify layer thickness. The remainder (two specifications are shown for some states) are divided in specifying thickness of lift (loose measurement):
Loose Depth in.
i
5 6 8 9
10 12
4-6 4-8 6-12
Not specified a
Number of Organizations Spec^ying
24" 5 2
Five states required a 6-in. compacted depth.
Compaction. Thirty organizations stated their requirements for backfill compaction simply in terms of being thoroughly or satisfactorily compacted or well tamped or in similar terms. Seventeen states which required compaction in terms of some percent of a maximum density showed identical requirements for embankments and structural backfilL Four specified 90 percent of AASHO T 99, seven specified 95 percent, one specified 90-95 percent, 5 specified 90-100, one specified 90-102, two re-qmred 90 percent and one required 95 percent of a modified method. There are 16 organizations which specify density control of backfill compared to 39 which specify density control of embankments.
Nearly all organizations provided for the use of mechanical tamping equipment; ' 32 required mechanical tampers; several states provided for hand-tamping equipment The hand equipment referred to was of two types. Type A was usually referred to as heavy iron tampers having tamping faces not exceeding 25 sq. in. in area. Type B tampers were de
scribed as weighing not less than 12 lb. and having a tamping face not exceeding 50 sq. in.
COMPACTION EQUIPMENT
Because of the important part of equipment in obtaining compaction, a summary has been made of State Highway Department Standard Specifications for rolling and tamping equipment. Data on various items wMch are mentioned in specifications are given in Table 25.
Sheepsfoot-Type Rollers
Contact Area of Tamping Feet. Most organizations allow a wide range of size of tamping-foot contact area. This may be seen from the summary of specification requirements:
Range in Contact Area (sq. in.)
No. of Organizations
2 2 8 2 1 2 1 3 I 1 2 1 1
Uo8 4 to 9 4 to 10 4 to 12 4 to 13 4 to 18 5 min. 5 approx. 5 to 8 5 to 10 5% min. 6 to 8 8 to 12 13 max.
(Note: Two states provide for two ranges of sizes. They are incorporated in the above tabulation.)
An analysis of the specifications on a regional basis shows no difference in specifications for contact area for any specific region.
Contact Pressure. An analysis of standard specifications covering pressures of sheepsfoot-type rollers also showed a wide range in minimum contact pressure requirements. The range is:
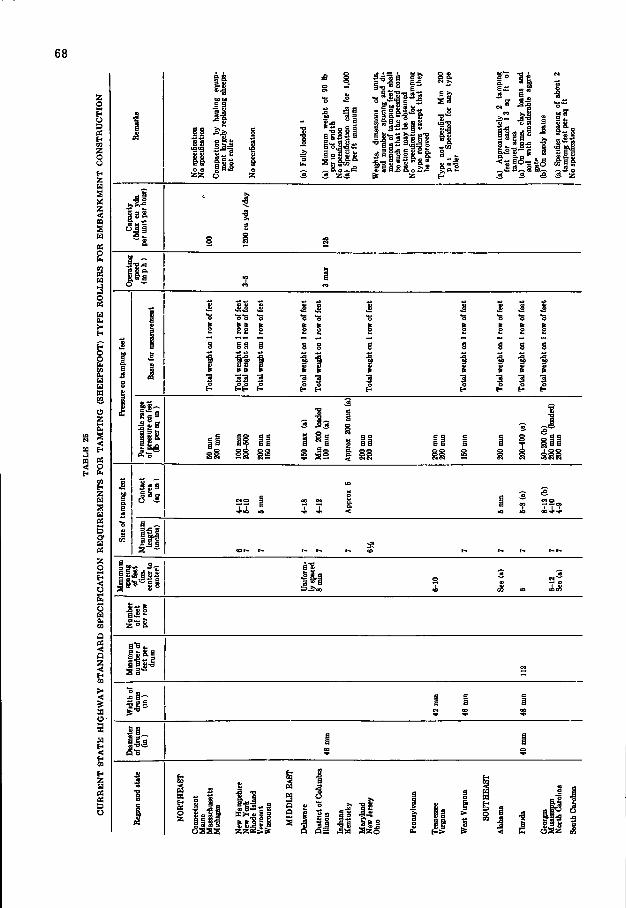
68
3 ^
^ g z cq S a S
s O
I IJ
n
I I
i l l
I
2
I I I ! as::
mm ! i J If-
filf-lil Ml i s e A z
.11
"a
IP
•s-s I I
I I
J J
I I I
11 s S
III
i P j l l
^ • 3 a
i l t l
§ 2 =
Jill l l l j l
I J | i I I & M l£ a l l ;Saz J
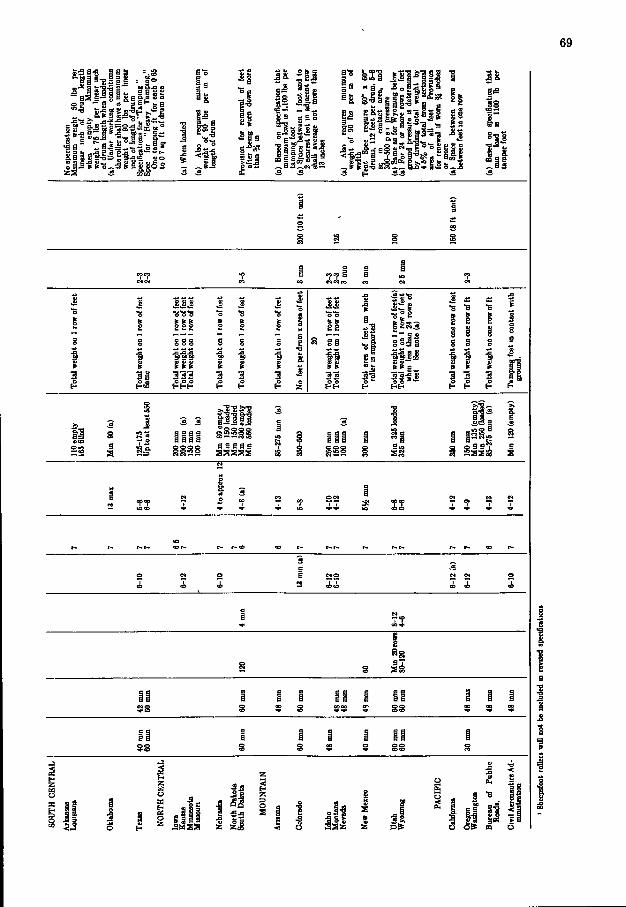
69
' ss i-^ i s s 6 3 . 1 s S o
i s 1̂
1̂
1!^ HI
i l l
2̂1 i i p i i i
A £ AS.
SB
S o S
I I I I I I I I
i l i a a e a s a a a a e s
M O C4 M
1̂
i i s s 11
s .2
ill i aaa
^5
2az a 2 4
I
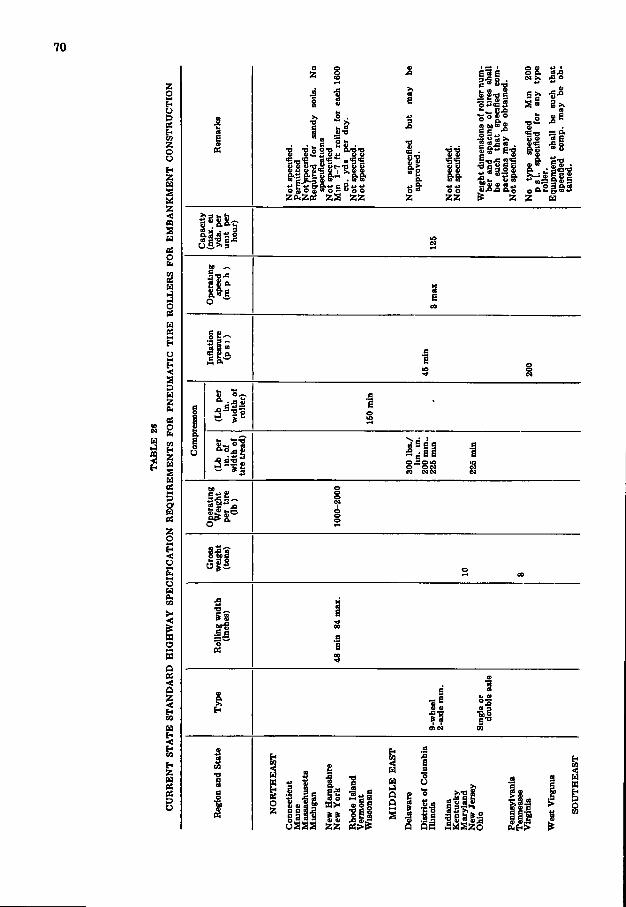
70
I I
•SOS"
l i l . i l
i f
zz ^ I
i t •si
^̂ 11̂ 00 .SI&3 Z a
o
S
11 §̂
=1
•5̂
if ia i f iS I I I a I I I Ig^iii
I I " ! i
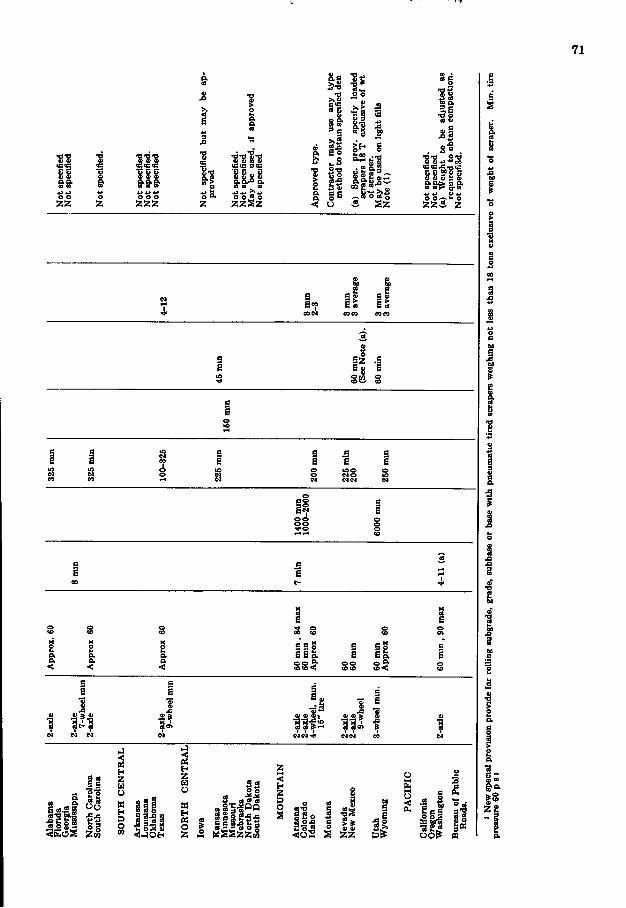
71
Is Is
11 o o o
^ C3
g too .—
5 si
I I •S8
mil ZZ-S Z
D9C4 >i 11 B d coos « c o
.5 e
SS-< 5 <
ill .̂1
•35
I l l s
•5 6 m o,
e
Z !
<SUS Zm
H Z H O
H
i IJil
H Z H O
a « o z l l l l z J
i lie I d i l l J is •«!0S S ZZ
l l 35̂
I n
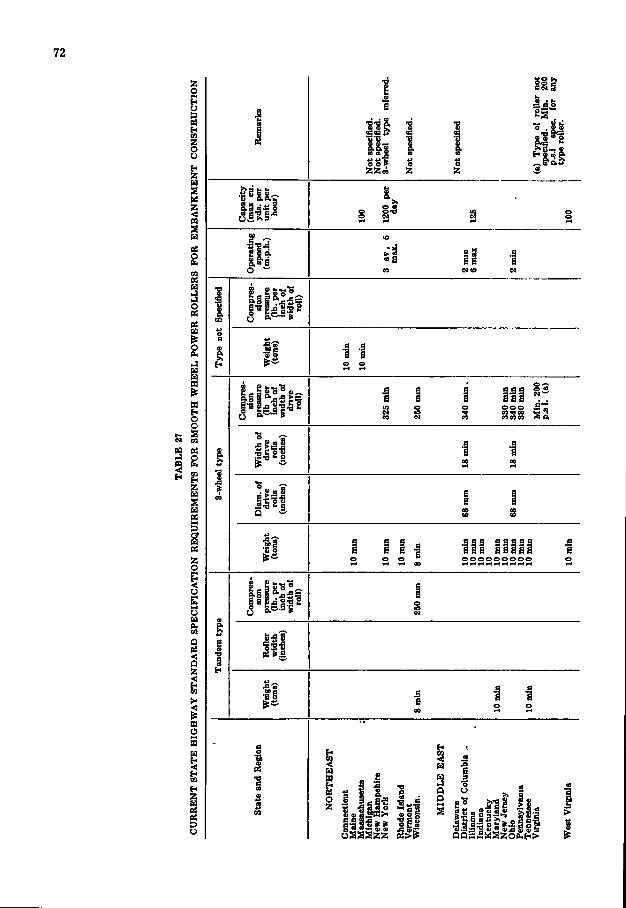
72
m S H
OS
g
i o:
I a g o s
2 g
^ s z H
s 3 z o
1 i Q
Q Z
n o
1 I j l j .
5 5 ? o Z Z « Z
o ^ > ^ « 8
M I S
.a a
14%
1 -I
<soo J!
3 a
j s s ssssa saa aiaaa ooooooooo
I I I
I I
I 3
n g o z
2
1/ s » ^SSSM s a g
l l l l l l III I 1
• l l | | g | l l g l f
I > I
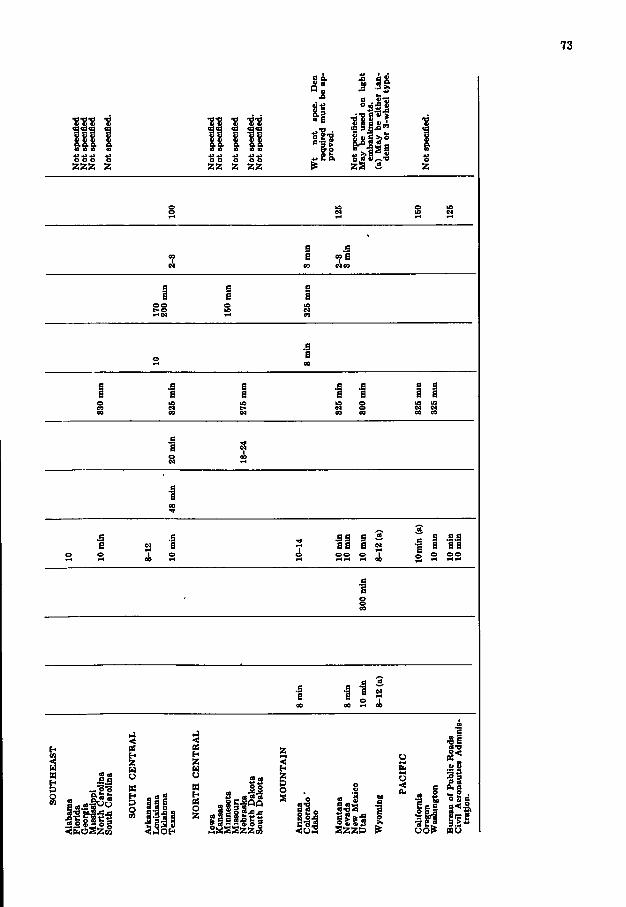
73
111 1
o o o o o ZZ Z ZZ
- I
I
I I I
C4 § ai a N
I
I S w
s ^ s I
H O
I ^ l l l s l l l SgiNP i l l lEsI I
S « S S Z Z 5 < o S SZZ& ^
If lO
-3 'Si
i t
fit P Q U
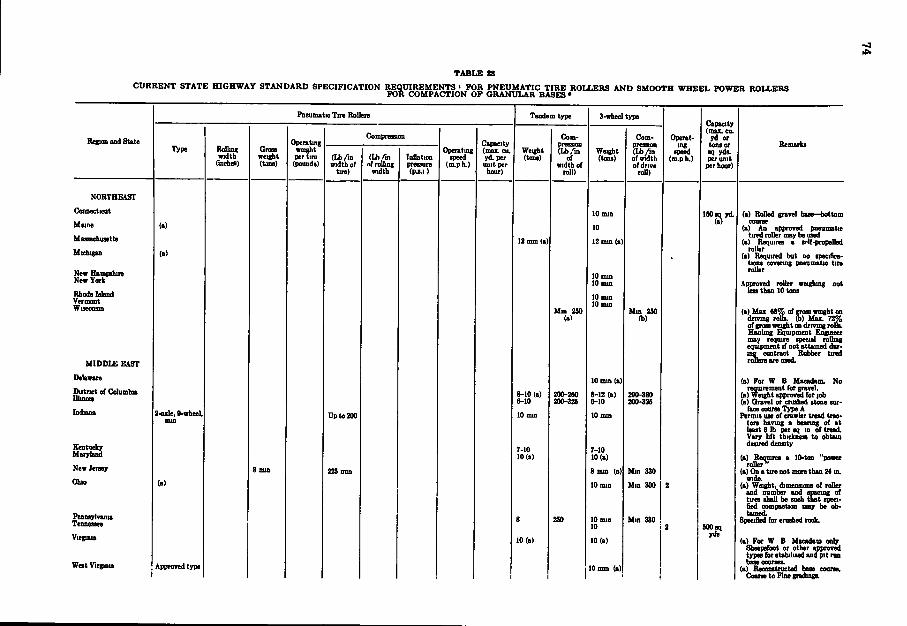
TABLE 28
CURRENT STATE m C H W A Y STANDARD SPECIFICATION REQUIREMENTS ' FOR PNEUMATIC TIRE ROLLERS AND SMOOTH WHEEL POWER ROLLERS FOR COMPACTION OF GRANULAR BASES •
Paeumatio Tire RoUers Tandem tjrpe 3-wheel type Capacity (max. cu.
yd or tons or sg yds. per unit
per hour)
Region and State Operating weight per tire (pounds)
CoinpressioD Capacity (max. ciL yd. per unit per hour)
Compression (Lb An
of width of
roU)
Compression ( L b / m of width of drive
roU)
Operat-mg
speed (m.p h.)
Capacity (max. cu.
yd or tons or sg yds. per unit
per hour)
Remarks Type Rolliiui
width Cinches)
Gross w e i ^ t (tons)
Operating weight per tire (pounds)
( L b / i n width of
tire)
Oh An t j rolhng
width
Inflation presBore (p j .1 )
Operating speed
(QLph.)
Capacity (max. ciL yd. per unit per hour)
Weight (tons)
Compression (Lb An
of width of
roU)
Weight (tons)
Compression ( L b / m of width of drive
roU)
Operat-mg
speed (m.p h.)
Capacity (max. cu.
yd or tons or sg yds. per unit
per hour)
Remarks
NORTHEAOT
CflODecticat
Mune
ManBcbusetts 12 mm (a)
10 DUD
10
12 mm (a)
150 BO yd. (a)
(a) RoDed gravel base—bottom coarse
(a) An approved pneumatic tired roller may be osad
(a) Requires a s>'lf-propelled roller
(a) Reqmred but no specifira-tions covermg pneomatie tire
MiehigBO (a)
(a) RoDed gravel base—bottom coarse
(a) An approved pneumatic tired roller may be osad
(a) Requires a s>'lf-propelled roller
(a) Reqmred but no specifira-tions covermg pneomatie tire
New Hampahtre New York
Rhode Tifhtnd Vermont Wtseonsio M m 2S0
(a>
10 DUD
10 mm
10 mm 10 DUD M m 250
fb)
roller
.\pproved roller weighing Dot less than 10 tons
(a) Max 68% of gross weight on drmng rolb. (b) Max. 72% of groes weight on drmng rods. Haubng Equipment Eogmeer may reqmre. special roDing eqmpment i f not attained dor-tng contract Rubber tirvd roUers are used.
M I D D L E EAST
roller
.\pproved roller weighing Dot less than 10 tons
(a) Max 68% of gross weight on drmng rolb. (b) Max. 72% of groes weight on drmng rods. Haubng Equipment Eogmeer may reqmre. special roDing eqmpment i f not attained dor-tng contract Rubber tirvd roUers are used.
Delaware
DiBtnet of Cohimbu nbnou
Indiana
Eentqcky Maryland
2-aile. 9-wheel. min
Upto200
»-10 (a) 6- iO
10 nun
7- 10 10 (s)
200-280 200-32S
10 mm (a)
8-12 (a) 6- 10
10 mm
7- 10 10 (a)
200-380 200-^25
(a) For W B MaeadaiD. No requirement for gravel.
(a) Weight an>rov«l for job (a) Qravel or crushed stone sur
face coarse Type A Permit use of crawler tread trac
tors having a bearmg of at least 6 lb per sq m of tread. Vary l i f t thickniea to obtau desired density
(fk) Reamres a K^ton "power New Jersey 8 nun 225 DUO 8 nun (a) Min 330
roller'* (a) OD a tire not more than 24 m.
Ohio (a) 10 mm M m 300 2 wide.
(a) Wfligbtt dimeosiaDS of roDer and number and spacing of tires shall be such that spea-fod^mpsetion may be ob-
Pennsyhrama Tennessee
8 250 10 mm 10
M m 330 2 500 sq
Specified for crushed rock.
Virginia 10(a) 10(8) yds
(a) For W B Macadam only Sieepsfoot or other approved types for stabilised and pi t nm base courses.
(a) Reeoostmeted base course. Coarse to Fine gradmgs.
West Virgiou Approved type 1 10 nun (a) 1
(a) For W B Macadam only Sieepsfoot or other approved types for stabilised and pi t nm base courses.
(a) Reeoostmeted base course. Coarse to Fine gradmgs.
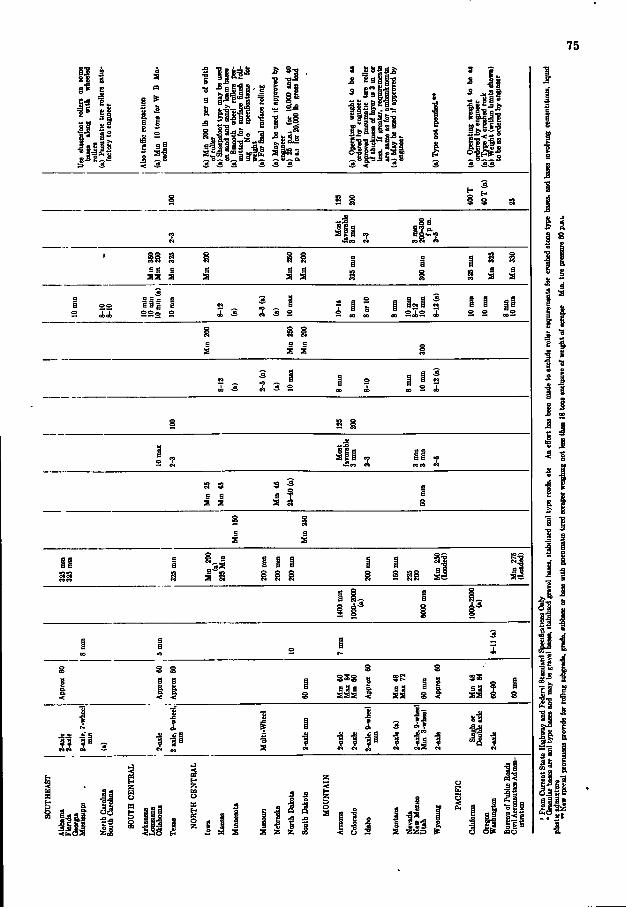
75
11 5 it a s ea
111 s 3 3 3
i l l SB
s s s as s 5
a s a a a
10 m
m
8-10
8-
10
5 a S a 9 a a g 1
2 2 o 2 I 3 t (a)
10 m
ax
5 i i eo 00
1 I M i 04
10 m
m
10 i
mn
8 m
m
10 m
m
Mm
200
Mm
25
0
Mm
20
0
300
8-12
(a)
2-5
(a)
(a)
10 m
ax
' 8
mm
8-10
8 m
m
10 m
m
8-12
(a)
S ^ i
s
i s
- 9
• a
f j !
s I
1 a
111 i i
a s
325
mm
32
5 m
m
325
mm
Mm
20
0 (a
) 22
5 M
m
e B a g 9 1 1 § i 20
0 m
m
160
TP'"
200
Mm
25
0 (L
oadi
d)
1̂ a i ae
1400
min
1000
-200
0 (a
)
6000
mm
100O
-20O
0 (a
)
S £ 00
S a to
o 4-11
(a)
i I I
III I I II
11 3
a
. Is "J
J III I
l i El
lis! I l l
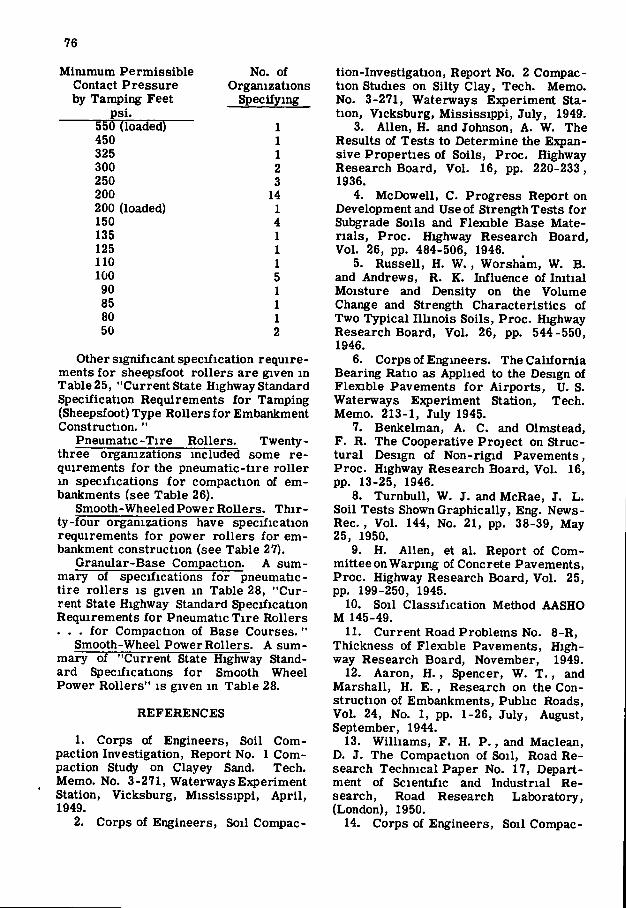
76
Minimum Permissible Contact Pressure by Tamping Feet
psi.
No. of Organizations
Specifying
550 (loaded) 1 450 1 325 1 300 2 250 3 200 14 200 (loaded) 1 150 4 135 1 125 1 110 1 100 5 90 1 85 1 80 1 50 2
Other significant specification requirements for sheepsfoot rollers are given in Table 25, "Current State Highway Standard Specification Requirements for Tamping (Sheepsfoot) Type Rollers for Embankment Construction. "
Pneumatic-Tire Rollers. Twenty-three organizations included some requirements for the pneumatic-tire roller m specifications for compaction of embankments (see Table 26).
Smooth-Wheeled Power Rollers. Thirty-four organizations have specification requirements for power rollers for embankment construction (see Table 27).
Granular-Base Compaction. A summary of specifications for pneumatic-tire rollers is given in Table 28, "Current State Highway Standard Specification Requirements for Pneumatic Tire Rollers . . . for Compaction of Base Courses."
Smooth-Wheel Power Rollers. A summary of "Current State Highway Standard Specifications for Smooth Wheel Power Rollers" is given in Table 28.
REFERENCES
1. Corps of Engineers, Soil Compaction Investigation, Report No. 1 Compaction Study on Clayey Sand. Tech. Memo. No. 3-271, Waterways Experiment Station, Vicksburg, Mississippi, April, 1949.
2. Corps of Engineers, Soil Compac
tion-Investigation, Report No. 2 Compaction Studies on Silty Clay, Tech. Memo. No. 3-271, Waterways Experiment Station, Vicksburg, Mississippi, July, 1949.
3. Allen, H. and Johnson, A. W. The Results of Tests to Determine the Expansive Properties of Soils, Proc. Highway Research Board, Vol. 16, pp. 220-233, 1936.
4. McDowell, C. Progress Report on Development and Use of Strength Tests for Sul^rade Soils and Flexible Base Materials, Proc. Highway Research Board, Vol. 26, pp. 484-506, 1946.
5. Russell, H. W., Worsham, W. B. and Andrews, R. K. Influence of Initial Moisture and Density on the Volume Change and Strength Characteristics of Two Typical Illinois Soils, Proc. Highway Research Board, Vol. 26, pp. 544-550, 1946.
6. Corps of Engineers. The California Bearing Ratio as Applied to the Design of Flexible Pavements for Airports, U. S. Waterways Experiment Station, Tech. Memo. 213-1, July 1945.
7. Benkelman, A. C. and Olmstead, F. R. The Cooperative Project on Structural Design of Non-rigid Pavements, Proc. Highway Research Board, Vol. 16, pp. 13-25, 1946.
8. Turnbull, W. J . and McRae, J . L . Soil Tests Shown Graphically, Eng. News-Rec., Vol. 144, No. 21, pp. 38-39, May 25, 1950.
9. H. Allen, et al. Report of Committee on Warping of Concrete Pavements, Proc. Highway Research Board, Vol. 25, pp. 199-250, 1945.
10. Soil Classification Method AASHO M 145-49.
11. Current Road Problems No. 8-R, Thickness of Flexible Pavements, Highway Research Board, November, 1949.
12. Aaron, H. , Spencer, W. T . , and Marshall, H. E . , Research on the Construction of Embankments, Public Roads, Vol. 24, No. 1, pp. 1-26, July, August, September, 1944.
13. Williams, F. H. P . , and Maclean, D. J . The Compaction of Soil, Road Research Technical Paper No. 17, Department of Scientific and Industrial Research, Road Research Laboratory, (London), 1950.
14. Corps of Engineers, Soil Compac-
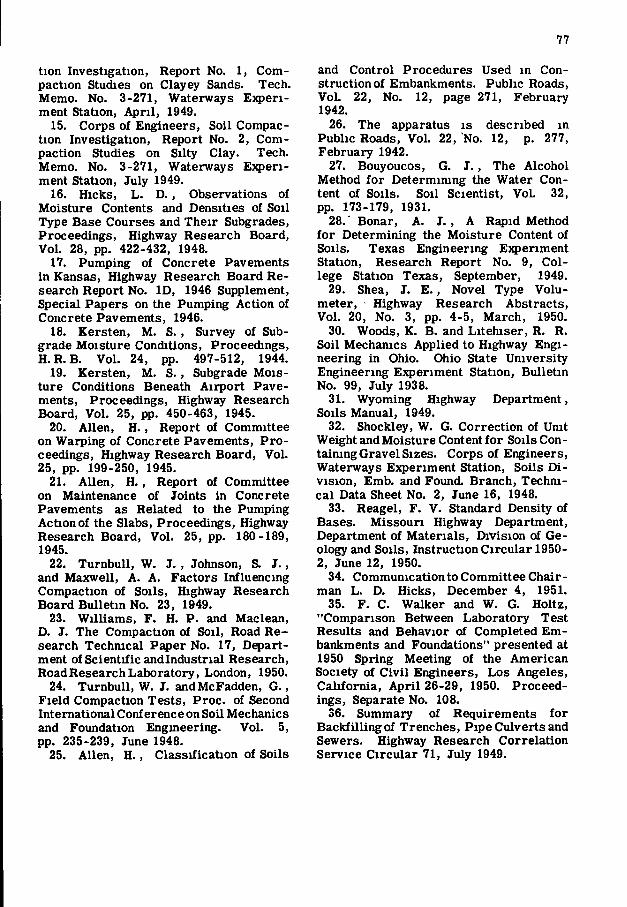
77
tion Investigation, Report No. 1, Compaction Studies on Clayey Sands. Tech. Memo. No. 3-271, Waterways E;q)eri-ment Station, April, 1949.
15. Corps of Engineers, Soil Compaction Investigation, Report No. 2, Compaction Studies on Silty Clay. Tech. Memo. No. 3-271, Waterways Experiment Station, July 1949.
16. Hicks, L . D. , Observations of Moisture Contents and Densities of Soil Type Base Courses and Their Subgrades, Proceedings, Highway Research Board, Vol. 28, pp. 422-432, 1948.
17. Pumping of Concrete Pavements in Kansas, Highway Research Board Research Report No. ID, 1946 Supplement, Special Papers on the Pumping Action of Concrete Pavements, 1946.
18. Kersten, M. S., Survey of Sub-grade Moisture Conditions, Proceedings, H.R.B. Vol. 24, pp. 497-512, 1944.
19. Kersten, M. S., Subgrade Moisture Conditions Beneath Airport Pavements, Proceedings, Highway Research Board, Vol. 25, pp. 450-463, 1945.
20. Allen, H. , Report of Committee on Warping of Concrete Pavements, Proceedings, Highway Research Board, Vol. 25, pp. 199-250, 1945.
21. Allen, H. , Report of Committee on Maintenance of Joints in Concrete Pavements as Related to the Pumping Action of the Slabs, Proceedings, Highway Research Board, Vol. 25, pp. 180-189, 1945.
22. TurnbuU, W. J . , Johnson, S. J . , and Maxwell, A. A. Factors Influencing Compaction of Soils, Highway Research Board Bulletin No. 23, 1949.
23. Williams, F . H. P. and Maclean, D. J . The Compaction of Soil, Road Research Technical Paper No. 17, Department of Scientific andlndustrial Research, Road Research Laboratory, London, 1950.
24. TurnbuU, W. J. andMcFadden, G. , Field Compaction Tests, Proc. of Second International Conference on Soil Mechanics and Foundation Engineering. Vol. 5, pp. 235-239, June 1948.
25. Allen, H. , Classification of Soils
and Control Procedures Used in Construction of Embankments. Public Roads, Vol. 22, No. 12, page 271, February 1942.
26. The apparatus is described in Public Roads, Vol. 22, No. 12, p. 277, February 1942.
27. Bouyoucos, G. J . , The Alcohol Method for Determimng the Water Content of Soils. Soil Scientist, Vol. 32, pp. 173-179, 1931.
28. ' Bonar, A. J. , A Rapid Method for Determining the Moisture Content of Soils. Texas Engineering E}q)eriment Station, Research Report No. 9, College Station Texas, September, 1949.
29. Shea, J . E . , Novel Type Volumeter, Highway Research Abstracts, Vol. 20, No. 3, pp. 4-5, March, 1950.
30. Woods, K. B. and Litehiser, R. R. Soil Mechanics Applied to Highway Engineering in Ohio. Ohio State University Engineering Experiment Station, Bulletin No. 99, July 1938.
31. Wyoming Highway Department, Soils Manual, 1949.
32. Shockley, W. G. Correction of Unit Weight and Moisture Content for Soils Con-taimngGravel Sizes. Corps of Engineers, Waterways Experiment Station, Soils Division, Emb. and Found. Branch, Technical Data Sheet No. 2, June 16, 1948.
33. Reagel, F. V. Standard Density of Bases. Missouri Highway Department, Department of Materials, Division of Geology and Soils, Instruction Circular 1950-2, June 12, 1950.
34. Communicationto Committee Chairman L. D. Hicks, December 4, 1951.
35. F. C. Walker and W. G. Holtz, "Comparison Between Laboratory Test Results and Behavior of Completed Embankments and Foundations" presented at 1950 Spring Meeting of the American Society of Civil Engineers, Los Angeles, California, April 26-29, 1950. Proceedings, Separate No. 108.
36. Summary of Requirements for Backfilling of Trenches, Pipe Culverts and Sewers. Highway Research Correlation Service Circular 71, July 1949.
78
Appendix
MANUFACTURERS' SPECIFICATIONS
The 1951-52 survey of current practice includes data on current state highway and federal specifications for various types and sizes of compacting equipment. In order to present more nearly complete data on compacting equipment, manufacturers who were known producers of such equipment were contacted by letter requesting equipment specifications. Tables A through E include data received in reply to those requests.
The list of manufacturers is not complete but is sufficiently inclusive to indicate the ranges m types and sizes of equipment and may be of value in preparation of specifications for compacting equipment. The data are presented in the tables following.
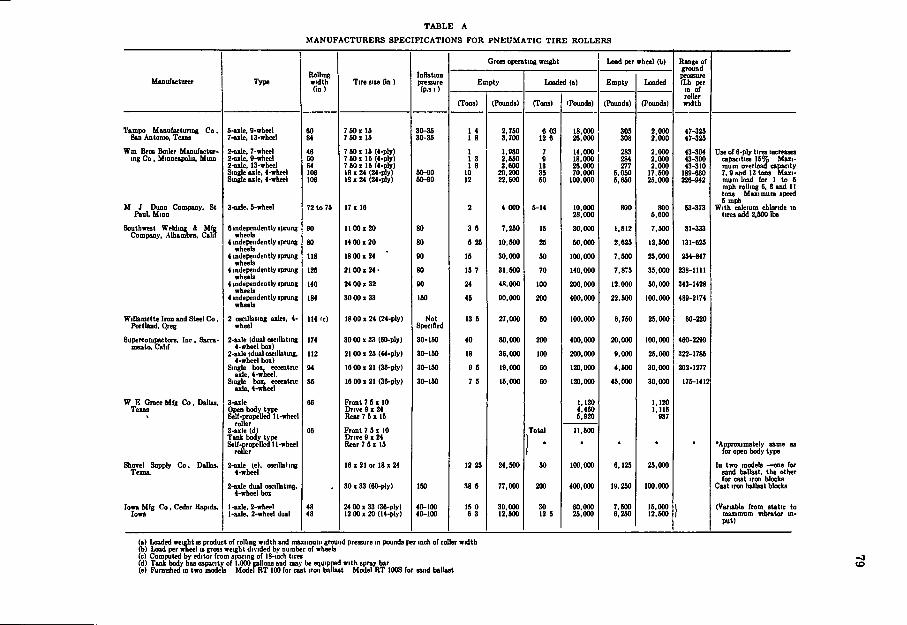
T A B L E A
M A N U F A C T U R E R S S P E C I F I C A T I O N S F O R P N E U M A T I C T I R E R O L L E R S
Groos operating weight Load per wheel (b) Range of ground pressure (Lb per
in of Manufacturer Type
Rolling width fin)
Tire site fin) Inflation pressure (p.s 1 )
Empty Loaded (a) Empty Loaded
Range of ground pressure (Lb per
in of
Rolling width fin)
Inflation pressure (p.s 1 )
(Tons) (Pounds) (Tons) rPounds) (Pounds) (Pounds) roller width
Tampo Manufactunng Co , San Antonio, Teiaa
5-azle, 9-wbeel 7-axle, 13-wheel
60 84
7 to X IS 7 90 X 15
30-36 30-35
1 4 1 8
2,750 3,700
6 03 12 6
18,000 26,000
305 308
2,000 2,000
47-325 47-325
W m Bros Boiler Manufacturing Co , Minneapolis, Mum
M J Dunn Company, St Paul, Minn
2-aile, 7-wheel 2-axle. 9-wheel 2- axle, 13-wheel Single axle, 4-wbeel Single axle, 4-wheel
3- axle, 5-wheel
46 60 84 106 106
72 to 78
7 SO X 16 (4-ply) 7 SO X 15 (4-ply) 7 50 X 15 (4-ply) 18 X 24 (24-ply) 13 X 24 (24-ply)
17 I 16
50-00 60-90
1 1 3 1 8
10 12
2
1,080 2,690 3,600
20,200 22,600
4 000
7 0
13 35 50
5-14
14,000 18,000 26,000 70,000
100,000
10,000 28,000
283 284 277
5,050 5,650
800
2,000 2,000 2,000
17,500 25,000
800 6,600
43-304 43-300 43-310
189-660 220-042
63-373
Use of 6-ply tires tncmsea capacities 15% Maximum overloaii cacocity 7, 9 ood 13 tons Maximum load for 1 to 5 mph rolling 6, 8 and 11 tons Maximum speed 5 mph
With calcium chloride in tires add 2,fiOO lbs
Southwest Welding i Mfg Company, Albambra, Calif
6 Independently sprung whecb
4 independently sprung wheels
4 independently sprung wheels
4 independently sprung wheels
4 independently sprung wheels
4 independently sprung wheeb
90
80
118
1100x20
14 00 X 20
18 00 x 24
80
80
00
3 6
6 25
15
7,290
10,500
30,000
15
25
60
30,000
50,000
100,000
1,812
2,629
7,500
7,900
12,600
29,000
81-333
131-029
2S4-847
6 Independently sprung whecb
4 independently sprung wheels
4 independently sprung wheels
4 independently sprung wheels
4 independently sprung wheels
4 independently sprung wheeb
126 2100 x 24- 80 IS 7 31,600 70 140,000 7,875 35,000 238-1111
6 Independently sprung whecb
4 independently sprung wheels
4 independently sprung wheels
4 independently sprung wheels
4 independently sprung wheels
4 independently sprung wheeb
140
184
24 00 X 32
30 00 x 33
90
160
24
45
48,000
90,000
100
200
200,000
400,000
12,000
22,600
S0,000
100,000
343-1428
489-2174
Willamette Iron and Steel Co, Portland, Qreg
2 oscilhting axles, 4-wheel
114 ic) 18 00 X 24 (24-ply) Not Specified
13 5 27,000 50 100,000 6,750 29,000 60-220
Supercompactors, Inc , Sacramento, Cahf
2-axle (dual oscillating 4-wheel box)
2-axle tdual oscillatuig, 4-wheel box)
Single box, eccentric axle, 4-wheel.
Single box, eccentric axle, 4-wheel
174
112
04
8S
30 00 x 33 (60-ply)
21 00 1 25 (44-ply)
I6 00 x 21 (36-ply)
16 00 i21(36-p ly )
30-150
30-150
30-150
30-150
40
18
9 5
7 5
80,000
36,000
19,000
15,000
200
100
60
60
400,000
200,000
120,000
120,000
20,000
9,000
4,500
45,000
100,000
29,000
30,000
30,000
460-2299
322-1785
202-1277
175-1412
W E Grace M f g Co , Dallas, Tcias
3-axle Open body type Self-propelled 11-whecl
roller 3-aile (d) Tank body type Self-propelled ll-wbeel
roller
66 Front 7 S > 10 Drive 0 X 24 Rear 7 S i IS
1,120 4,460 6,920
1,120 1,116
087
3-axle Open body type Self-propelled 11-whecl
roller 3-aile (d) Tank body type Self-propelled ll-wbeel
roller
eg Front 7 S X 10 Drive 0 X 24 Rear 7 S i IS
Total
1 • 11,500
' • • 'Approximately same as for open body type
Shovel Supply Co , Dallas, Texas.
2-axle (e). oecillating 4-wbeel
2-axle dual osclUatms, 4-wbeel box
-
16 I 21 or 18 X 24
30 X 33 (60-ply) 150
12 29
38 5
24,500
77,000
50
200
100,000
400,000
6,12S
19,250
29,000
100,000
In two modeb —one for sand ballast, the other for cast iron blocks
Cast iron ballast blocks
Iowa Mfg Co , Cedar Rapids, Iowa
I -axle, 2-wheel 1-axle, 2-wheel dual
48 48
24 00 X 33 (3e-ply) 12 00 x 20 (l4-ply)
40-100 40-100
IS 0 6 3
30,000 12,500
30 12 5
60,000 25,000
7,500 6,250
15,000 12,500 ) (Variable from static to
maximum vibrator in-put)
(a) Loaded weioht is product of rolling width and maximum ground pressure in pounds per inch of roller width (b) Load per wneel ts gross weight divided by number of wheeb (e) Computed by editor from spacing of IS-inch tires (d) Tank body has capacity of 1,000 galloos and may be equipped with spray bar (e) Furnished xa two modeb Model RT 100 for cast iron ballast Model RT lOOS for sand ballast
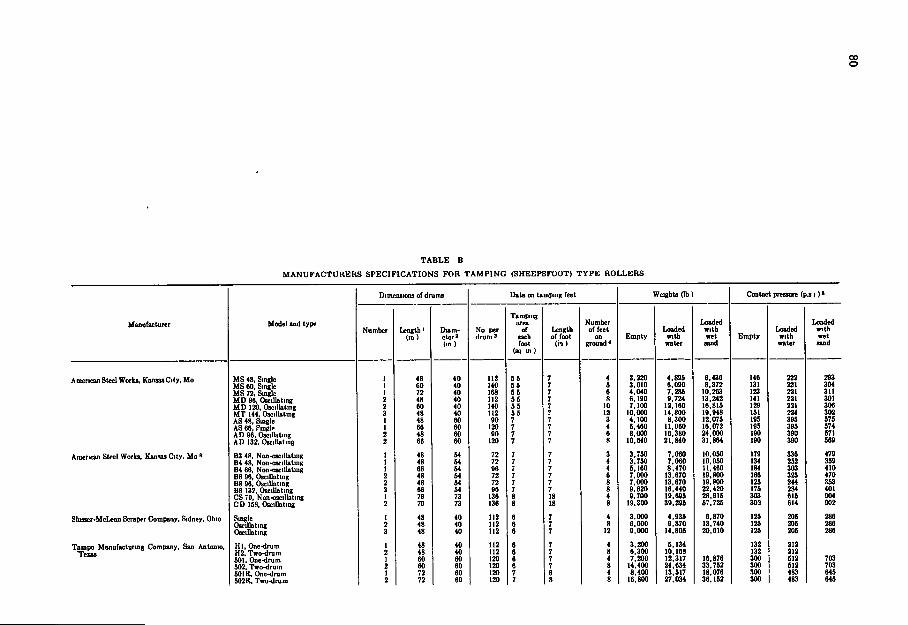
00 o
T A B L E B
M A N U F A C T U R E R S S P E C I F I C A T I O N S F O R T A M P I N G (SHEEPSFOOT) T Y P E R O L L E R S
Dimensions of drums Data on tamping feet Weights Ob) Contact pressure (p,81) *
Manufacturer Model and type Number Length i
(in ) Diameter 2 (in )
No per drum3
Tamping area
of each foot
(sq in )
Length of foot
( h )
Number of feet
on ground *
Empty Loaded
with water
Loaded with wet sand
Empty Loaded
with water
Loaded with wet sand
American Steel Works, KansasCity, Mo MS 48, Single MS 60. Single MS 72, Single M D 96, Oscillating M D 120, Oscillating M T 144, Oscillating AS 48, Single AS 66, PinKlp A D 96, Oscillating A D 132, Oscillating
1 1 1 2 2 3 1 1 2 2
48 60 72
60 48 48 66 48 66
40 40 40 40 40 40 60 60 60 60
112 140 168 112 140 112 90
120 00
120
55 59 55 55 5 9 5 9 7 7 7 7
\
4 5 6 8
10 12 3 4 6 8
3,220 3,610 4,040 6,100 7,100
10,000 4,100 5,460 8,000
10,640
4,805 6,000 7,285 0,724
12,160 14,800 8,300
11,060 16,380 21,840
6.436 8.372
10.283 13.242 16,815 10,048 12,076 16,072 24,000 31,864
146 131 123 141 129 151 105 195 100 100
222 221 221 221 221 224 306 395 390 390
203 304 311 301 306 302 979 574 671 560
American Steel Worb , Kansas City, Mo *> B3 48, Non-oscilbting 84 48, Non-oscillating B4 66, Non-nscillating B6 96. Oscillating B8 96. Oscillating B8 132. Oscillating CS 79, Non-oscillating C D 158, Oscillating
1 1 1 2 2 2 1 2
48 48 66 48 48 66 79 79
54 54 54 54 94 54 73 73
72 72 06 72 72 06
136 136
7 7 7 7 7 7 8 8
18 18
3 4 4 6 8 8 4 8
3,750 3,750 5,160 7,000 7,000 9,820 9,700
19,300
7,060 7,060 8,470
13,670 13,670 16,440 111,605 30,209
10,050 10,050 11,460 10,800 10,800 22,420 28,015 57,725
170 134 184 166 125 176 303 302
336 252 303 325 244 284 619 614
470 359 410 470 393 401 004 002
Slusser-McLeon Scrapfr Company, Sidney, Ohio Single Oscillating Oscillating
1 2 3
48 48 48
40 40 40
112 112 112
6 6 6
? 4 8
12
3,000 6,000 0,000
4,036 0,870
14.809
6.870 13.740 20,610
125 125 125
205 205 206
286 286 286
Tampo Manufacturing Company, San Antonio, Teias
H I , One-drum H2. Two-drum 501. One-drum 502, Two-drum 501R. One-drum 502R. Two-drum
1 2 1 2 1 2
48 48 60 60 72 72
40 40 60 60 60 60
112 112 120 120 120 120
« 6 6 6 7 7
8 8
4 8 4 8 4 8
3,200 6,300 7,200
14,400 8,400
16,800
6.134 10,168 12,317 24,634 13.617 27.034
16,876 33,762 18,076 36,152
132 132 300 300 300 300
212 212 912 912 483 483
703 703 649 649
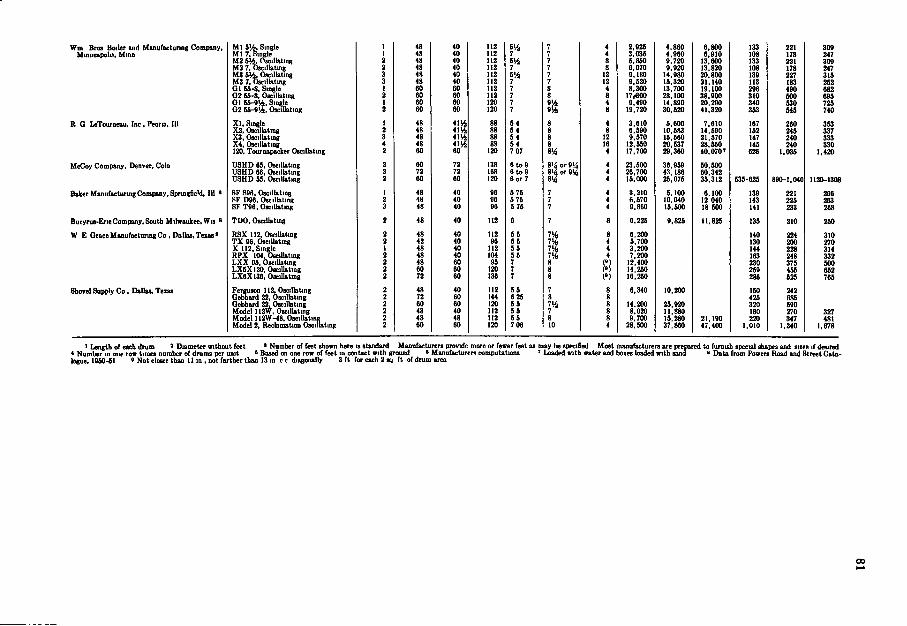
Wm Bras Boiler and Manufacturing Company. MinDeapolUi MinD
R G LeTourneau, Inc , Peoru, I I I
McCoy Company, Denver, Colo
Baker Manufacturmg Company, SprmgficM, I I I B
Bucynu-ErieCompany. South Milwaukee, Wia a
W E GraceManufaetunngCo, Dallas, Texas'
Shovel Supply C o , Dallas, Teiaa
M l fi<A Single M l 7, Single M2 S^jOscilUting M2 7,it)scilhituig M3 6 ^ Oscillating M3 7,t)jcill«ting 0 1 55-8. Single G2 55-8. Oscillating G l 55-eV4, Single G2 55-S^, Oscillating
X I , Single X2, Oscilhiting X3, Oscillatmg X4, Oscillating 120. Tournapacker Oscillating
USUD 65. Oscillating USUD 66, Oscillating USHD 55, Oscillating
SF S96, Oscillating PF D96, Oscillaling SF TS6, Oscillating
TOO, Oscillating
RSX 112, Oscillating T X 96, Oscillating X 112, Single RPX 10«,t)Bcillating L X X 95, Oscillating L X 5 X I 2 0 , Oscillating LX6X136, Oscillatmg
Ferguson 112, Oscillatmg Gebhard 22, Oscillating Oebhard 22, Oscillatmg Model 112W. Oscillatmg Model 112W-48, Oscillatinfi Model 2. Reclamation O s A t i n g
1 48 40 112 514 7 4 2,925 4.860 6.800 133 221 300 ] 48 40 112 7 7 4 3,035 4.060 6.910 108 178 247
48 40 112 614 7 8 6,850 9.720 13,600 133 221 300 48 40 112 7 7 8 e,070 9.920 13,820 108 178 247 48 40 112 516 7 12 9.180 14.980 20,800 139 227 315 48 40 112 7 7 12 9.520 15,320 21,140 113 183 252
1 60 60 112 7 8 4 8.300 13.700 19.100 296 490 682 60 60 112 7 8 8 17i«00 28.100 38.000 310 600 695
1 60 60 120 7 814 4 9.490 14.890 20.290 340 530 725 60 60 120 7 914 8 19,720 30,520 41.320 353 545 740
I 48 4IV6 88 5 4 8 4 3,610 5,606 7.610 167 260 353 2 48 4H4 88 5 4 8 8 6,590 10,583 14,500 152 245 337 3 48 4 1 % 88 5 4 8 12 9.570 15,560 21,570 147 240 333
330 4 43 4114 88 5 4 8 16 12.550 20,537 29,360
28.550 145 240 333 330
2 60 60 120 7 07 814 4 17,700 20,537 29,360 40.070' 626 1.035 1.420
2 60 72 138 6 to 9 8<4 or 914 4 23,500 36,959 50,500 2 72 72 168 6 to 9 8<4 or e>4 4 26.700 43.186 60,342 2 60 eo 120 6 or 7 8!4 4 15.000 25.075 35,312 535-625 890-1.040 1120-1308
1 48 40 96 5 75 7 4 3,210 5.100 6,100 139 221 266 2 48 40 96 6 76 7 4 6.570 10.040 12 040 143 225 263 3 48 40 96 5 75 7 4 9.860 15.600 18 500 141 233 268
2 48 40 112 6 7 8 e.225 9.825 11.825 135 210 250
2 48 40 112 6 5 714 8 e,20O 140 224 310 2 42 40 96 55 714 4 5.700 130 200 270 1 48 40 112 5 5 714 4 3.200 144 228 314 2 48 40 104 55 714 4 7.200 163 248 332 2 48 60 95 7 8 (•) 12.400 230 375 500 2 eo 60 120 7 8 P ) 14,250 259 455 652 2 72 60 130 7 8 (•) 16.250 286 525 765
2 48 40 112 55 7 8 6.340 10.200 150 242 2 72 60 144 625 8 8
6.340 10.200 425 685
2 60 eo 120 5 5 714 8 14.200 25.920 320 590 2 48 40 112 55 7 8 8.020 11.880 180 270 327 2 48 48 112 55 8 8 9.700 15,280 21.190 220 347 481 2 60 60 120 706 10 4 28.500 37,860 47.400 1.010 1.340 1.678
1 Length of each drum ' Diameter without feet > Number of feet shown here is standard Manufacturers provide more or fewer feet as may \ » specified Most manufacturers are prepared to furnish specml shapes and sues if desired ' Number in one row times number of drums per unit » Based on one row of feet m contact with ground • Manufacturer! computations ' Loaded with water and boxes loaded with sand » Data from Powers Road and Street Catalogue. 1960-61 • Not closer than I I in , not farther than 13 m e e disgonally 3 f t for each 2 sq f t of drum area
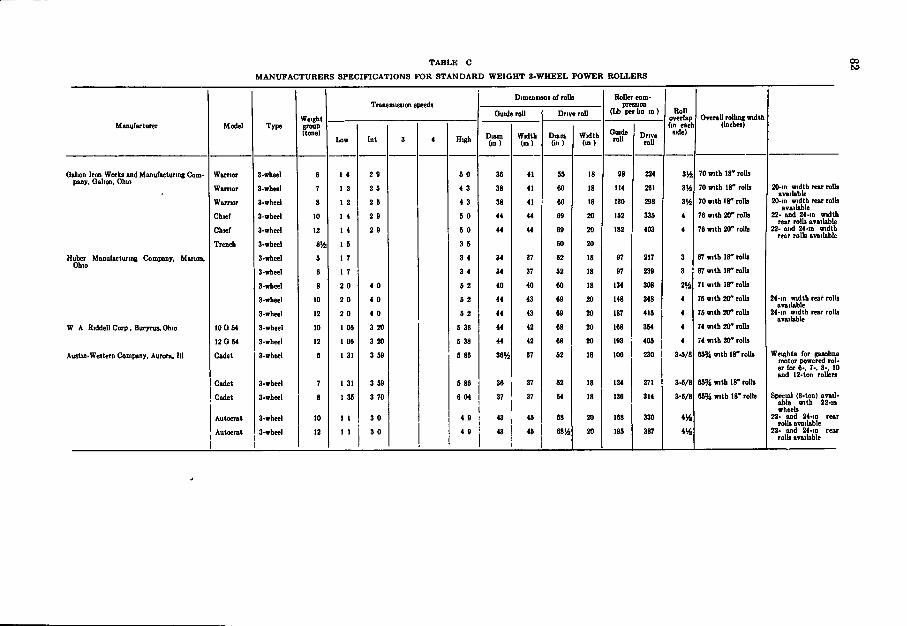
T A B L E C
M A N U F A C T U R E R S S P E C I F I C A T I O N S F O R S T A N D A R D W E I G H T 3 - W H E E L P O W E R R O L L E R S
00
Transmission speeds Dimensions of rolls Roller com
pression (Lb per bn in )
Weight group (tons)
Guide roll Drive roll
Roller compression
(Lb per bn in ) Roll overlap Overall rolling width
(inches) Manufacturer Model Type Weight group (tons)
Low Int 3 4 High Diam ( m )
Width ( m )
Dmro ( io )
Width ( m )
Gmde roU Drive
roU
(in each side)
Overall rolling width (inches)
Gallon Iron Works and Manufacturing Company, Gallon, Ohio
Warrior 3-wheel 6 1 4 2 9 6 0 36 41 55 18 98 224 m 70 with 18" rolls Gallon Iron Works and Manufacturing Company, Gallon, Ohio
Warrior 3-wheel 7 1 2 2 5 4 3 38 41 60 18 114 261 3>A 70 with 18' rolls 20-in width rear raUs avaibible
20-m width rear rolls available
22- and 24-in width rear rolls available
22- and 24-in width rear rolls available
Warrior
Chief
Chief
Trench
3-wheel
3-wheel
3-whcel
3-wheel
8
10
12
8%
1 2 2 5
2 0
2 9
4 3
5 0
5 0
3 6
38
44
44
41
44
44
60
69
69
60
13
20
20
20
130
152
182
298
336
403
3!4
4
4
70 with 18'rolls
76 with 20" rolls
76 with 20 ' rolls
20-in width rear raUs avaibible
20-m width rear rolls available
22- and 24-in width rear rolls available
22- and 24-in width rear rolls available
Hubcr Manufacturing Company, Marion, Ohio
3-wheel 5 1 7 3 4 34 37 52 18 97 217 3 67 with 18' rolls Hubcr Manufacturing Company, Marion, Ohio
3-wheel 6 1 7 3 4 34 37 52 18 97 239 3 67 wi th 18' rolb
3-whecl 8 3 0 4 0 5 2 40 40 60 18 134 308 2V4 71 with i r rolls
3-wheel
3-wheel
10
12
2 0
2 0
4 0
4 0
5 2
6 2
44
44
43
43
69
69
20
20
148
187
348
416
4
4
76 with 20 ' rolls
76 with 20" rolls
24-in width rear rolls available
24-in width rear rolb available
W A Hiddell Corp, Bucyrus, Ohio 10G64 3-wheel 10 1 OS 3 20 5 38 44 42 68 20 168 364 4 74 with 20 ' rolls
24-in width rear rolls available
24-in width rear rolb available
12G 54 3-wheel 12 1 oe 3 20 5 38 44 42 68 20 193 405 4 74 with 20* rolb
Auatm-Westem Company, Aurora, I I I Cadet 3-whecl e 1 31 3 59 5 88 36V2 37 52 18 loe 230 3-5/8 66% with 18* rolls Weights for gasoline motor powered ro l -er for 6-, 7-, 8-, 10 and 12-ton rollers
Cadet 3-wheel 7 1 31 3 59 6 88 36 37 52 18 124 271 3-6/8 66% with i r rolls
Weights for gasoline motor powered ro l -er for 6-, 7-, 8-, 10 and 12-ton rollers
Cadet
Autocrat
Autocrat
i
3-wbeel
3-wheel
3-wheel
1
8
10
12
I 36
1 1
1 1
3 70
3 0
3 0
e 04
4 9
4 9
37
43
43
37
45
45
54
63
68 Vi
18
20
20
136
168
105
314
330
387
3-5/8
f A
4%
66% with 18" rolls Special (8-ton) available with 22-tn wheeb
22- and 24-in rear rolb avaibble
22- and 24-in rear rolls available
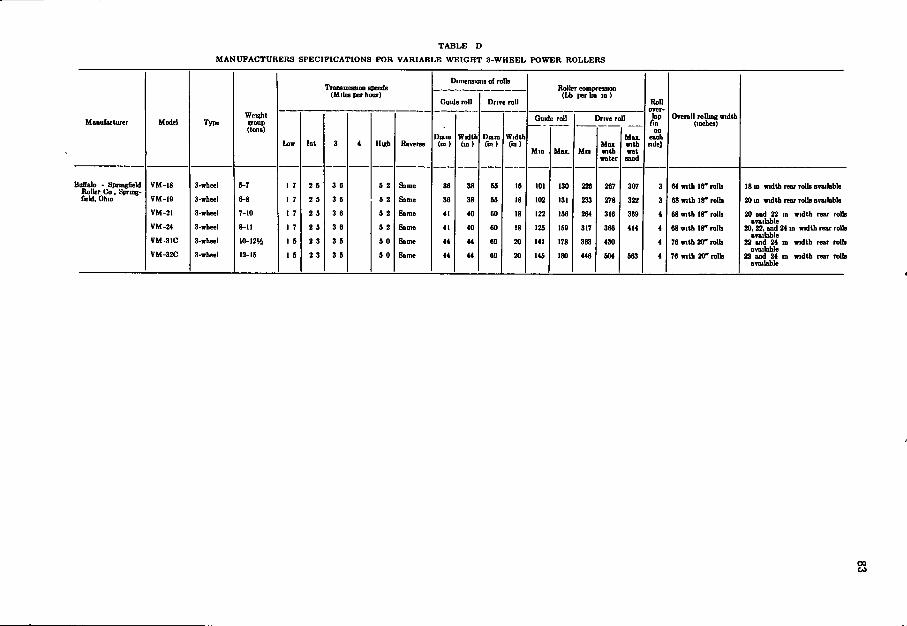
TABLE D
MANUFACTURERS SPECIFICATIONS FOR VARIABLE WEIGHT 3-WHEEL POWER ROLLERS
Buffalo - Springfield Roller C o , Sprmg-field, Ohio
VM-18
VM-10
VM-21
VM-24
VM-31C
VM-32C
Type
3-wheel
3-wbeel
3-wheel
3-wheel
3-wheel
3-wheel
Weight group (tons)
5- 7
6- 8
7- 10
8- 11
10-1214
12-15
Transmission speeds (Miles per hour)
3 6
3 e 3 9
3 6
High
6 2
5 2
6 2
6 2
9 0
6 0
Reverae
Same
Same
Same
Same
Same
Same
Dimensions of rolls
D u m ( m )
Width ( i n )
D u m ( i n )
Width ( i n )
Roller compression (Lb per lin in )
M a i with
water
M a i . with wet sand
Roll over-
Up On
00 each side)
Overall rothog width (inches)
64 With 16* ralb
68 with 18* rolls
68 with 18* rolls
68 wi th 18- rolls
76 with 20* roUs
76 with 20* rolls
18 u width rear rolls available
20 m width rear rolls available
20 and 22 in width rear rolls available
20, 22, and 24 tn width rear rolb available
23 and 24 m width rear roUs available
23 and 24 in width rear rolb available
00
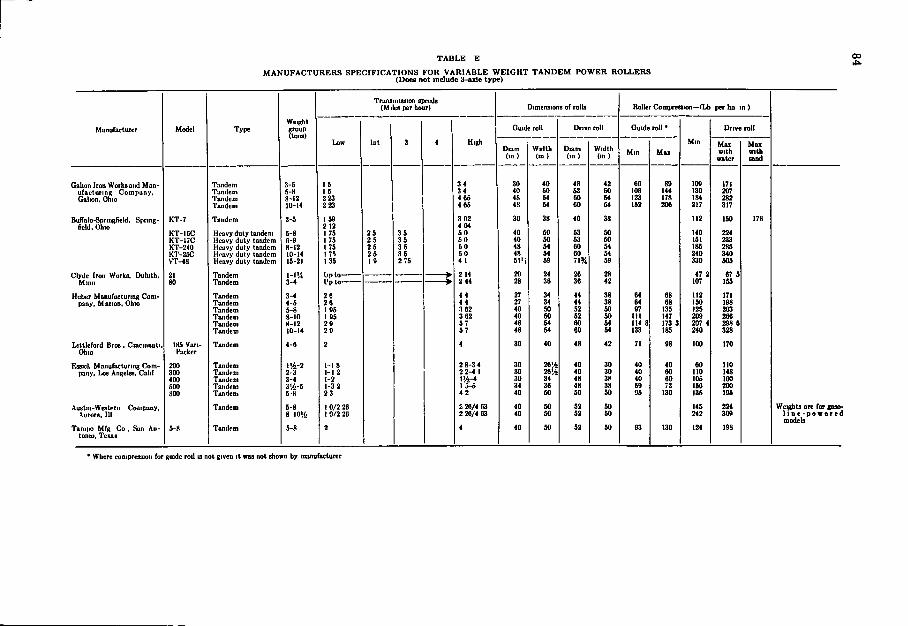
00
M A N U F A C T U R E R S S P E C I F I C A T I O N S F O R V A R I A B L E W E I G H T T A N D E M P O W E R R O L L E R S (Does not include 3-axle type)
Gabon Iron Works and Manufacturing Company, Cialion, Ohio
Buifalo-Spriiiglicld. Spritig-Geld, Ohio
Clyde Iron Works, Duluth, Minn
Huber Manuructurtng Coni-patiy, Marion, Ohio
Lit t leford Bros, Cincinnati, Ohio
Esaick Manufacturing Company, Los Angeles. Calif
Austin-Western \iirora. 111
ComiKiny,
TaniiK) Mfg C o , Kan Antonio, Texas
KT-7
KT- I6C KT-17C KT-240 KT-25C VT-48
21 80
185 Van-Packer
30O 400 50O
Type
Tandem Tandem Tandcni Tandem
Tandem
Heavy duty tandem Heavy duty tandem Heavy duty tandem Hravy duty tandem Heavy duty tandem
Tandem Tandem
Tandem Tandem Tandem Tandem Tandem Tandem
Tandem
Tandem Tandem Tandem Tandem Tandem
Tandem
Weight group (tomi)
3-6 5-8 8-12 10-14
3-5
5- 8 6- 9 8-12 10-14 15-21
1-IU 3-4
3- 4 4- 5 5- 8 8-10 8-12 10-14
4-6
114-2 2- 3 3 - 4
m-i 5-8 5-8 8 1014
Transmission speeds (Miles per hour)
I 5 1 5 223 223
159 2 12 I 75 I 75 I 75 I 7^ 135
l ; p t o -I 'p l o -
26 2 0 195 1 95 29
1-1 8 l - l 2 1-2 1-3 2 23
I 0/2 26 I 0/2 20
35 35 35 35 2 75
High
3 4 34 465 465
3 02 404 5 0 5 0 5 0 5 0 4 I
2 14 2 44
44 4 4 3 62 3 62 57 57
2 8-3 4 2 2-4 I 114-4 1 5-6 4 2
2 26/4 63 2 20/4 63
Dimensions of rolb
Guide roll
Dmm Width (in ) (in )
30 40 48 48
30
40 40 48 48 51'1
20
2614
36 50
Drive roll
Diam Width (in ) (in )
63 63 00 60 71%
26 36
44 44 52 52
Roller Compression—fLb per lln in )
Guide roll •
66 108
64 64 97
111 114
144 178 206
68 135 147 173 3 185
130 184 217
140 151 185 240 330
47 2| 107
112 150 125 209 207 4| 240
100
110 105 156 136
145 242
M o i with
water
171 207 282 317
233 285 340 505
67 6| 156
171 198 203 266 298 6
110 148 160
M a i with sand
Weights are for gaso-I i n e - p o w e r e d modeb
* Where compression for guide roll is not given i t was not shown by manufacturer
The Highway Research Board is organized under the auspices of the Division of Engineering and Industrial Research of the National Research Council to provide a clearinghouse for highway research activities and information. The National Research Council is the operating agency of the National Academy of Sciences, a private organization of eminent American scientists chartered in 1863 (under a special act of Congress) to "investigate, examine, experiment, and report on any subject of science
or art."