fluoride contamination in groundwater resources of alleppey, southern india
TRANSCRIPT
Accepted Manuscript
Fluoride contamination in groundwater resources of Alleppey, southern India
Dhanya Raj, E. Shaji
PII: S1674-9871(16)00008-6
DOI: 10.1016/j.gsf.2016.01.002
Reference: GSF 425
To appear in: Geoscience Frontiers
Please cite this article as: Raj, D., Shaji, E., Fluoride contamination in groundwater resources ofAlleppey, southern India, Geoscience Frontiers (2016), doi: 10.1016/j.gsf.2016.01.002.
This is a PDF file of an unedited manuscript that has been accepted for publication. As a service toour customers we are providing this early version of the manuscript. The manuscript will undergocopyediting, typesetting, and review of the resulting proof before it is published in its final form. Pleasenote that during the production process errors may be discovered which could affect the content, and alllegal disclaimers that apply to the journal pertain.

MANUSCRIP
T
ACCEPTED
ACCEPTED MANUSCRIPT

MANUSCRIP
T
ACCEPTED
ACCEPTED MANUSCRIPTP a g e | 1
Fluoride contamination in groundwater resources of 1
Alleppey, southern India 2
3
Dhanya Raj, E. Shaji* 4
Department of Geology, University of Kerala, Kariavattom, Trivandrum 695 581, 5
India 6
*Corresponding author. E-mail address: [email protected] 7
8
Abstract 9
Alleppey is one of the thickly populated coastal towns of the Kerala state in southern 10
India. Groundwater is the main source of drinking water for the 240,991 people living 11
in this region. The groundwater is being extracted from a multi-layer aquifer system 12
of unconsolidated to semi-consolidated sedimentary formations, which range in age 13
from Recent to Tertiary. The public water distribution system uses dug and tube 14
wells. Though there were reports on fluoride contamination, this study reports for the 15
first time excess fluoride and excess salinity in the drinking water of the region. The 16
quality parameters, like Electrical Conductivity (EC) ranges from 266 to 3900 µ 17
Siemens, the fluoride content ranges from 0.68 to 2.88 mg/L, and the chloride 18
ranges between the 5.7 to 1253 mg/L. The main water types are Na-HCO3, Na-CO3 19
and Na-Cl. The aqueous concentrations of F- and CO32- show positive correlation 20
whereas F- and Ca2+ show negative correlation. The source of fluoride in the 21
groundwater could be from dissolution of fluorapatite, which is a common mineral in 22
the Tertiary sediments of the area. Long residence time, sediment–groundwater 23
interaction and facies changes (Ca-HCO3 to Na-HCO3) during groundwater flow 24

MANUSCRIP
T
ACCEPTED
ACCEPTED MANUSCRIPTP a g e | 2
regime are the major factors responsible for the high fluoride content in the 25
groundwater in the area. High strontium content and high EC in some of the wells 26
indicate saline water intrusion that could be due to the excess pumping from the 27
deeper aquifers of the area. The water quality index computation has revealed that 28
62% of groundwater belongs to poor quality and is not suitable for domestic 29
purposes as per BIS and WHO standards. Since the groundwater is the only source 30
of drinking water in the area, proper treatment strategies and regulating the 31
groundwater extraction are required as the quality deterioration poses serious threat 32
to human health. 33
34
Key words: Fluoride contamination; Groundwater; Coastal aquifers; Health hazard; 35
Alleppey 36
37
38
1. Introduction 39
40
Groundwater is a renewable resource, yet the world's supply of groundwater 41
is steadily decreasing especially in Asia and North America (Gleeson et al., 2012). 42
Groundwater quality deterioration and supply of safe drinking water is a major 43
concern throughout the world. Groundwater with high fluoride concentration (>1.5 44
mg/L), according to WHO (1984), is affecting more than 260 million people around 45
the world (Amini et al., 2008). Globally, fluoride contamination in groundwater is 46
widespread especially in China, India, Nigeria, South America (Andes and Western 47
Brazil) and Africa (Rift valley zone), northwest Iran, Pakistan, Kenya, and Sri Lanka 48
(Gaciri and Davies, 1993; Brunt et al., 2004b; Moghaddam et al., 2008; Rafique et al., 49

MANUSCRIP
T
ACCEPTED
ACCEPTED MANUSCRIPTP a g e | 3
2009; Chandrajith et al., 2012; Craig et al., 2015). Several studies have 50
demonstrated that areas with fluoride contamination in groundwater are mostly 51
characterized by the presence of crystalline basement rocks/volcanic bedrocks with 52
the dissolution of F- promoted by arid-semi-arid climatic conditions, Ca deficient Na-53
HCO3 type groundwater, long groundwater residence time and distance from the 54
recharge area (Handa, 1975; Apambire et al., 1997; Rao N. Srinivasa, 1997; Genxu 55
and Guodong, 2001; Saxena and Ahmed, 2001; Edmunds and Smedley, 2005; 56
Jacks et al., 2005; Sreedevi et al., 2006; Guoet al., 2007; Shaji et al., 2007; Amini et 57
al., 2008). 58
59
High fluoride in groundwater has been reported from 19 states in India 60
(CGWB, 2010) with fluoride contamination in groundwater resources being 61
widespread, intense, and alarming. Endemic fluorosis is prevalent in India since 62
1937 (Shortt et al., 1937). Jacks et al. (2005) observed that high fluoride in 63
groundwater in many parts of India was due to evapotranspiration of groundwater 64
with residual alkalinity. High fluoride content in the deeper aquifers of Maharashtra is 65
due to long residence time than the shallow aquifers (Madhnure et al., 2007). The 66
granitic rocks in Nalgonda district contain fluoride from 325 to 3200 mg/kg and are 67
the main source of fluoride in groundwater (Brindha et al., 2011 and references 68
therein). High fluoride groundwater has been reported from Palghat, Kerala by Shaji 69
et al. (2007). 70
Groundwater is one of the primary sources of water for domestic and 71
agriculture uses in Kerala. During the last two decades, the groundwater scenario of 72
Kerala has been witnessing several changes (Shaji et al., 2008) with over 73
dependence on this resource due to the bad quality of surface water. 74

MANUSCRIP
T
ACCEPTED
ACCEPTED MANUSCRIPTP a g e | 4
Alleppey is one of the small coastal towns and famous tourist destinations of 75
Kerala with a population of over 240,991. The whole water distribution system of the 76
area is fully depended on groundwater. Although groundwater characteristics of 77
Alleppey has been investigated in some previous studies (Born, 1990; Shaji et al., 78
2009) no detailed investigations have been done on the nature of aquifers, and 79
quality parameters with regard to suitability of groundwater for drinking as per WHO 80
and BIS standards. In this study, we report the results of a systematic investigation 81
of the hydrogeochemical scenario of the aquifer units of the region with a view to 82
evaluate the water quality and drinking water standards. 83
84
2. Study area 85
86
The study area (260 km2) located within the Alleppey district lies between 87
latitude 9°35′00″N and longitude 76°10′00′′E (Fig. 1). The major townships are 88
Alleppey municipality, Mararikulam, Neerkunnam, Sherthala, Thaneermukam etc. 89
The Pampa River drains through the major part of the study area with its tributaries 90
Achankovil and Manimala rivers. The Vembanad Lake flanking the eastern part of 91
the area plays an important role in the hydrology and drainage network of the area 92
(Fig. 1). The general elevation of the area is less than 6 m above mean sea level and 93
certain areas lie below mean sea level also. The area lying below mean sea level is 94
prone to continued flood submergence during monsoon. The Thaneermukkam 95
barrier, constructed in the north of Vembanad Lake, is aimed to prevent salinity 96
intrusion in dry season to the lakes as well as to maintain the fresh water availability 97
from rivers. Geomorphologically, the area lies in the coastal plain and major units are 98
beaches, shore platforms, spit and bars, beach ridges etc. 99

MANUSCRIP
T
ACCEPTED
ACCEPTED MANUSCRIPTP a g e | 5
100
3. Materials and methods 101
102
Detailed hydrogeological investigations were carried out in the area. Key wells were 103
established for water level monitoring and sampling (Fig. 1). Sixteen water samples 104
were collected from open wells and tube wells (water supply wells) spaced ~4.0 km 105
apart, covering the entire study area. Samples were analysed in the chemical 106
laboratory of Geology Department for the physico-chemical attributes like pH, 107
electrical conductivity (EC), total hardness (TH), dissolved oxygen (DO), total 108
dissolved solids (TDS), dissolved silica and major ions (Ca2+, Mg2+, Na+, K+, Cl–, 109
HCO3– and SO4
2–). The methods used for the analysis were standardized as per 110
producers laid down by APHA (1985). ESICO Digital Clinical Flame Photometer 391 111
was used for analyses. The hydrogen ion concentration (pH), electrical conductivity 112
(EC), total dissolves solids (TDS) are computed with the help of the portable pH 113
meter. Fluoride content of the groundwater is determined using ion chromatography 114
(IC, Basic Plus, Metrohm) at the Laboratory of Environmental Engineering Division, 115
School of Mechanical and Building Sciences, VIT University, Chennai, India. The 116
trace element chemistry is determined using ICP-MS (iCAP-QC, Thermoscientific) at 117
central facility of University of Kerala. Sample introduction of ICP-MS consists of the 118
standard PFA-ST Nebulizers with cyclonic and spray chamber. All quantitative 119
measurements were performed using the instrument software (Qtegra). Working 120
voltage of the instrument is 1550 W. Reagents: mixed element standard solutions 121
(Tune B ICAP Q, Setup solution ICAP Q) which were used to calibrate ICP-MS were 122
obtained from Thermo Scientific Germany. Multi element standards for the analysis 123
were purchased from Thermo scientific. All the spatial variation maps are prepared 124

MANUSCRIP
T
ACCEPTED
ACCEPTED MANUSCRIPTP a g e | 6
by using ArcGIS 9.3. The graphical representation of the parameters plots the help 125
of the Gnu plot 4.6 software. 126
127
128
4. Hydrogeological settings 129
130
The sedimentary formations of the area represented by Tertiary beds are overlain by 131
laterites and Recent alluvium (CGWB, 1993) and underlain by Precambrian 132
crystalline basement. The Tertiary formations of Kerala are composed of four distinct 133
units known as Warkali bed (late Miocene to early Pliocene), Quilon bed (early 134
Miocene), Vaikom bed and Alleppey bed (CGWB, 1993).The Alleppey bed is 135
composed of highly carbonaceous clay with intercalations of sandstone, with 136
thickness ranging from 4 to 140 m, and the thickest portion occurring around 137
Alleppey town. The Vaikom bed overlying the Alleppey bed with thickness varying 138
from 25 to 238 m is a potential aquifer. It is composed of gravel, coarse sand, clay 139
and lignite. The Quilon bed (6 to 10 m thick) comprises of limestone and occurs 140
above the Vaikam bed. The groundwater in the zone is not very promising and is 141
mostly brackish. The Warkali bed overlying the Quilon bed is another potential 142
aquifer, and is the most extensively developed aquifer in the study area. Lithology 143
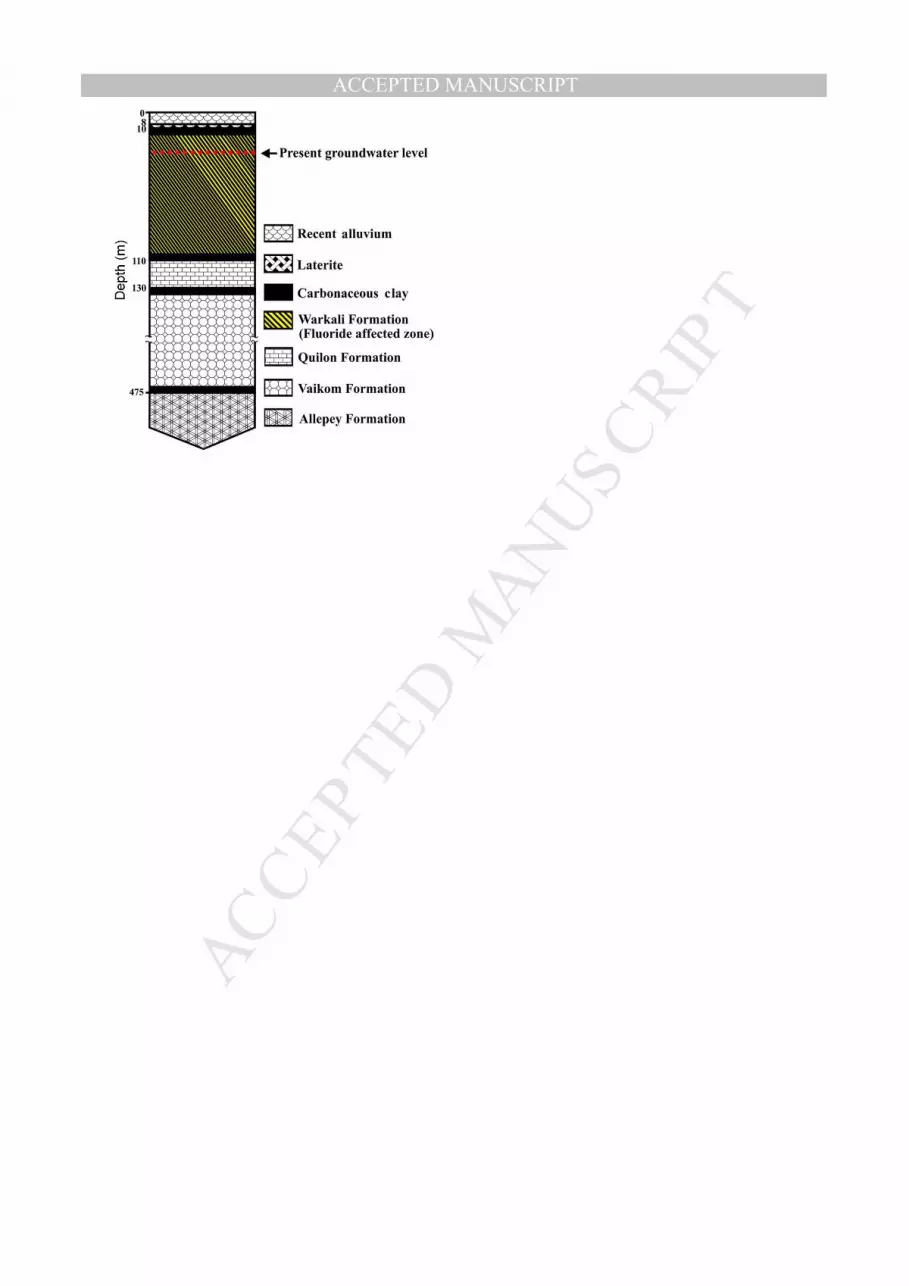
prepared based on CGWB data (SIDA report, CGWB, 1993) is given in Fig. 2. The 144
Tertiary formations are separated from the recent alluvium by a confining clay layer, 145
which prevents in situ recharge from rain fall (Fig. 2). The alluvial formations are 146
represented by the deposits along the coast, the backwater and lagoons. The 147
deposits were brought down by the west flowing rivers and the other types of 148
deposits in the swamps and estuaries and subsequently reworked by wave action. 149

MANUSCRIP
T
ACCEPTED
ACCEPTED MANUSCRIPTP a g e | 7
These deposits comprise pure quartz sand including the glass sand deposits around 150
Sherthalai and the placer deposits of heavy minerals all along the coast, silty sand, 151
silts and various types/colours of clays. The thickness of these beds varies from a 152
few metres to more than 50 m at Kattoor north of Alleppey. 153
154
Groundwater occurs in unconfined condition in the top alluvial zones and 155
confined condition in the Tertiary sequences. Groundwater is extracted from the 156
Warkali beds and top alluvium. The groundwater from other aquifer units remains 157
untapped. Hence this study focuses on the groundwater from the alluvial and Warkali 158
aquifers. The depth to water level in the alluvial zone ranges from 2 to 5 mbgl. The 159
piezometric surface in the Warkali formation (monitored from the tube wells) ranges 160
from 10 to 35 mbgl (Fig. 2). Initially (around 15 years back) the wells were artesian 161
wells with piezometric head above the ground level. Due to excessive pumping from 162
the aquifer the piezometric head has gone down considerably. 163
164
4.1. Hydrochemistry 165
The chemical analysis data of 16 groundwater samples are presented in Table 1. 166
The data shows deterioration in the groundwater quality as per the BIS standards. 167
The electrical conductivity (EC) ranges between 266 and 3900 µs and indicates the 168
level of mineralisation. The fluoride concentration ranges between 0.68 and 2.88 169
mg/L, far exceeding the permissible limit of F- as 1.5 mg/L. Chloride is in the range 170
between 5.7 and 1253 mg/L, bicarbonate ranges from 71 to 300 mg/L and calcium is 171
in the range between 14 and 71.8 mg/L. Spatial variation maps of these parameters 172
were prepared with the help of the ArcGIS 9.3. Figs. 3 and 4 represent the spatial 173
variation of electrical conductivity and fluoride respectively. 174

MANUSCRIP
T
ACCEPTED
ACCEPTED MANUSCRIPTP a g e | 8
4.1.1. Piper diagram 175
Water-quality interpretation is attempted by plotting the data in the Piper 176
diagram. The anions and cations of 16 samples were plotted in the piper diagram 177
using the software of Geochemist’s workbench student10.0. This diagram consists of 178
three distinct fields including two triangular fields and a diamond-shaped field. The 179
cations expressed as percentage of total cations in meq/L as a single point on the 180
left triangle while anions plot in the right triangle (Piper, 1944). Each point is then 181
projected into the upper field along a line parallel to the upper margin of the field and 182
the point where the extension intersects indicates the character of the water as 183
represented by the relationship among Na⁺, K⁺, Ca2⁺, Mg2
⁺, CO3⁻, HCO3⁻ and Cl⁻, 184
SO42⁻ ions. Similarities and differences among groundwater samples can be 185
revealed from the trilinear diagram because water of similar qualities will tend to plot 186
together as groups.The data plots in the Piper diagram (Fig. 5) show that 50% of the 187
samples fall in the central part of the diamond field, which indicates the non-188
domination of any of the cation or anion pairs. The plot reveals that the main water 189
types is Na-HCO3 < Na-CO3 < Na-Cl < Ca-HCO3.The water types are listed in the 190
Table 2. 191
192
4.1.2. Saturation index 193
Since high F is observed in the area, groundwater geochemistry is examined 194
based on saturation with respect to fluorite and its nature as revealed by the Piper 195
diagram. Saturation indices are used to evaluate the degree of equilibrium between 196
water and minerals. Changes in saturation state are useful to distinguish different 197
stages of hydrochemical evolution and help to identify which geochemical reactions 198
are important in controlling water chemistry (Güler and Thyne, 2004). The saturation 199

MANUSCRIP
T
ACCEPTED
ACCEPTED MANUSCRIPTP a g e | 9
index of a mineral is obtained from the following equation (Appelo and Postma, 200
1996): 201
202
SI = log(IAP/Ksp) (1) 203
where IAP is the ion activity product of the dissociated chemical species in solution, 204
Ksp is the equilibrium solubility product for the chemical involved at the sample 205
temperature. Saturation indices of minerals are useful for evaluating the extent to 206
which water chemistry is controlled by equilibrium with solid phases (Appelo and 207
Postma, 1996; Dreverj, 1997). When the SI is below zero, the water is under-208
saturated with respect to the mineral fluorite. An SI of zero means water is in 209
equilibrium with the mineral, whereas an SI greater than zero means a 210
supersaturated solution with respect to the mineral in question (Yidanaa et al., 2008). 211
212
The saturation indices with respect to CaF� were calculated for the 16 samples and 213
given in Table 2. The solubility product of the fluorite at 25 °C and 1 atmosphere was 214
taken as 1010.96. The ionic strength ranged from -0.21 to -2.74. Here the extended 215
Debye-Huckel equation was used to calculate the activity coefficients of ionic 216
strength and the saturation index was calculated with the activities of Ca and F 217
instead of their concentration (Shaji et al., 2007). The intensity of soluble minerals is 218
expressed as saturation index. A range of values for saturation index near zero are 219
generally considered to be within the equilibrium zone for a mineral. Saturation index 220
±5% is considered here. It is found that all the samples are in under-saturated 221
condition with respect to CaF2. The computed saturation index and ionic strengths 222
are given in Table 2. In the under saturation condition could be due the long 223

MANUSCRIP
T
ACCEPTED
ACCEPTED MANUSCRIPTP a g e | 10
residence time of groundwater, high rock water interaction and cation exchange 224
especially between Na and Ca. 225
226
4.1.3. Gibbs diagram 227
In order to prove the rock water interaction the data is plotted in the Gibbs diagram, 228
which is widely used to establish the relationship of water composition and aquifer 229
lithological characteristics. Three distinct fields such as precipitation dominance, 230
evaporation dominance and rock–water interaction dominance areas are shown in 231
the Gibbs diagram (Gibbs, 1970). The samples fall in the rock–water interaction 232
dominance and evaporation dominance field of the Gibbs diagram (Fig. 6a and b). 233
The rock–water interaction dominance field indicates the interaction between rock 234
chemistry and the chemistry of the percolated waters under the subsurface. The 235
figure shows that the samples fall in the rock–water interaction dominance field. 236
Hence the chemistry of the water is mainly controlled by the facies changes during 237
the groundwater interaction with the aquifer material. 238
239
4.1.4. Water quality index calculation 240
241
The water quality index (WQI) is calculated for evaluating the quality of water and the 242
influence of natural and anthropogenic activities based on several key parameters of 243
groundwater chemistry. To calculate the WQI, the weight has been assigned for the 244
physico-chemical parameters according to the parameters of relative importance in 245
the overall quality of water for drinking water purposes. Water quality index (WQI) is 246
an important parameter for identifying the water quality and its sustainability for 247
drinking purposes (Rao N. Subba, 1997; Mitra, 2006; Magesh et al., 2013). World 248

MANUSCRIP
T
ACCEPTED
ACCEPTED MANUSCRIPTP a g e | 11
Health Organization (2011) standards for drinking water quality have been used to 249
calculate the WQI. The assigned weight ranges from 1 to 5. The maximum weight of 250
5 has been assigned for fluoride, EC for 4, the total hardness for 3 and chloride for 2 251
(Vasanthavigar et al., 2010). The relative weight is computed from the following 252
equation: 253
∑=
=n
iiii wwW
1
/ ……………………………… (2) 254
where Wi is the relative weight, wi is the weight of each parameter, n is the number 255
of parameters. 256
The quality rating scale for each parameter is calculated by dividing its concentration 257
in each water sample by its respective standards (World Health Organization, 2011) 258
and multiplied by 100. The relative weight and water quality parameters used for 259
calculation are listed in Table 3. 260
261
The quality rating is determined using the formula: 262
qi = (Ci/Si)×100 …………………………………….. (3) 263
where, qi is the quality rating, Ci is the concentration of each chemical parameter in 264
each sample in mg/L, Si is the World Health Organization standard for each chemical 265
parameter in mg/L according to the guidelines of WHO (2011). 266
For computing the final stage of WQI, the SI is first determined for each parameter. 267
The sum of SI values gives the water quality index for each sample. 268
Sli = Wi × qi………………………… (4) 269
270
where Sli is the sub-index of ith parameter, qi is the rating based on concentration of 271
ith parameter, n is the number of parameters. 272

MANUSCRIP
T
ACCEPTED
ACCEPTED MANUSCRIPTP a g e | 12
The water quality classification is based on the WQI values. If the values are within 273
the range between 50 and 100, the water is considered to be good quality; and if the 274
values are between 100 and 300, the water is considered to be not suitable for 275
drinking purposes. 276
The water quality index is determined using the formula: 277
WQI = ∑SIi …………………. (5) 278
The water quality index (Table 4) shows that 50% of the samples belong to 279
poor quality (WQI values: 68 to 361), 13% come under very poor to unsuitable water 280
category, and 37% under good water quality. 281
282
4.1.5. Groundwater quality zonation 283
Based on the analytical data, a groundwater quality zonation map has been 284
prepared, by assessing suitable rank and weightages to relevant water quality 285
parameters, which do have explicit control on the quality of the water in the region as 286
shown in Table 5. The groundwater zonation map prepared using GIS (Fig. 7) for 287
various parameters like EC, Cl-1 and TH reveals that 47% of study area falls in the 288
unsuitable category and 27% falls under moderate quality condition. 289
290
4.2. Trace element hydrochemistry 291
The trace element hydrochemistry was determined using ICP-MS. All the 292
parameters are in the permissible limit of BIS except for strontium and the data is 293
given in Table 6. The increase in Sr content in groundwater indicates sea water 294
intrusion into the aquifer. This is the first report of high Sr in the deeper aquifers of 295

MANUSCRIP
T
ACCEPTED
ACCEPTED MANUSCRIPTP a g e | 13
Alleppey and the results indicate that saline water is slowly intruding into the Warkali 296
formation due to excess pumping from the aquifer units. 297
298
5. Discussion 299
300
Detailed hydrogeological investigations have revealed that the groundwater is Ca-301
HCO3 type south of the study area (Kayamkulam) and it changes to Na-HCO3 type in 302
the study area. The geochemical profile shows a decline in calcium content 303
accompanied by an increase in sodium. Magnesium also decreases but the 304
decrease is not as pronounced as that of calcium. The anion continues to be 305
dominated by bicarbonate. In some areas, the water is dominated by mixed cation 306
and bicarbonate. The electrical conductivity (EC) shows an increase in trend in 307
groundwater marked by mixed cation-Cl type or Na-Cl type. The change in degree 308
and type of mineralisation of the water in the Warkali aquifer can be explained as 309
reflection of the different stages of interaction of the recharging fresh water with 310
sediments deposited under marine environment. Initially, Ca-HCO3 type water was 311
formed by the chemical reaction of rainwater containing CO2 on CaCO3 bearing 312
minerals in the recharge zone. During its movement, the water exchanges Ca for Na 313
by ion exchange process. This resulted in Na-HCO3 type water, which also explains 314
the higher flouride content in Alleppey area, since the alkaline water depleted in Ca 315
is effective in releasing flouride from the minerals like flourapatite. The zone with 316
high fluoride groundwater is marked in Fig. 2 and the present groundwater level of 317
the Warkali confined aquifer is also shown. In the aquifer system, the process of 318
flushing/freshening is incomplete or the groundwater movement was sluggish, with 319
hard brackish water of Ca-Mg-Cl or Na-Cl type (Agerstrand et al., 1981). The 320

MANUSCRIP
T
ACCEPTED
ACCEPTED MANUSCRIPTP a g e | 14
relationship between Ca2+ values and F in the groundwater is studied and 321
comparative plots prepared using Gnu plot 4.6 (Fig. 8). This plot shows an inverse 322
relationship as the Ca2+ decreases the fluoride content increases in the water. The 323
facies classification indicates that the water type is Na-HCO3<Na-CO3<Na-Cl<Ca-324
HCO3, supporting our observation. The groundwater is calcium depleted; hence 325
fluorine can independently exist in the water. The groundwater zonation map 326
reveals that 47% of study area falls in the unsuitable category and 27% falls under 327
moderate quality condition. The water quality index (Table 4) shows that 50% of the 328
samples belong to poor quality (WQI values: 68 to 361), 13% of the samples come 329
under very poor to unsuitable water category, and 37% of the samples fall under 330
good water quality. The analyses show that the groundwater extracted from the 331
aquifers of the region is contaminated with geogenic materials. Since groundwater is 332
the only dependable source for drinking water in this region, our study alerts that the 333
water needs to be treated properly before supplying to the people. Continuous 334
consumption of this high fluoride water would lead to serious health hazards. 335
336
6. Conclusion 337
The major conclusions arising from our study are as follows. 338
(1) Groundwater is the prime source of drinking water for the populace of 339
Alleppey coastal town and the heavy groundwater extraction has resulted in the 340
decline of groundwater level (piezometric head) up to 35 mbgl. This poses a 341
threat to the efficiency of the pumping wells and productivity of Warkali aquifers 342
of the region. 343
(2) Groundwater (drinking water) shows high fluoride content (up to 2.88 mg/L) 344
and high salinity and is only confined to the Warkali formation. 345

MANUSCRIP
T
ACCEPTED
ACCEPTED MANUSCRIPTP a g e | 15
(3) Water type is identified as Na-HCO3<Na-CO3<Na-Cl<Ca-HCO3. 346
(4) Gibbs diagram reveals that the water samples fall in the rock water interaction 347
dominance field and the hydrochemistry of water is evolved by the continuous 348
interaction of water with sediments. 349
(5) Na-HCO3 type groundwater favours the higher flouride content and the Ca 350
depleted alkaline water under high pH conditions is effective in releasing flouride 351
from the minerals like flourapatite. 352
(6) In the confined aquifer system, the process of flushing/freshening is 353
incomplete or the groundwater movement was sluggish, as evidenced by the 354
occurrence of hard brackish water of Ca-Mg-Cl or Na-Cl type, because of the lack 355
of direct recharge from the rainfall. 356
(7) The water quality index shows that 50% of the samples belong to poor quality 357
(WQI values: 68 to 361), 13% of the samples come under very poor to unsuitable 358
water category, and 37% of the samples fall under good water quality. 359
(8) Zonation map reveals that 47% of water is not suitable for the drinking 360
purpose. 361
(9) Groundwater samples with high Sr content indicate saline water intrusion. 362
(10) Proper treatment strategies are recommended in all the pumping stations of 363
the region including individual households. 364
365
Acknowledgements 366
367
Sincere thanks are due to Dr. Shihabudhen Maliyakal, VIT University, Chennai, for 368
Fluoride analysis. Smt. Bindhu J. Viju Scientists, CGWB Kerala region, Dr. 369
Satheesh, Department of future study, University of Kerala, Dr. Jobin Thomas 370
MANUSCRIP
T
ACCEPTED
ACCEPTED MANUSCRIPTP a g e | 16
research associate, Dr. A.P. Pradeepkumar, Head and SAP coordinator, Department 371
of Geology, Julekh, technical officer in ICP-MS lab in University of Kerala are 372
thanked for their respective inputs. Field work component is supported by UGC SAP 373
DRS II. 374
375
376
References 377
Agerstrand, T., Hanson, G., Jacks, G., 1981. Effect on groundwater composition of 378
sequential flooding of aquifers with fresh and saline water. In: Proc. 7th Salt 379
Water Intrusion Meeting, Uppsala, Sweden Sept. 59-64. 380
381
Amini, M., Mueller K., Abbaspour, K.C., Rosenberg, T., Afyuni, M., Moller, K.N., Sarr, 382
M., Johnson, C.A., 2008. Statistical modelling of global geogenic fluoride 383
contamination in groundwaters. Environmental Science and Technology 42, 384
3662-3668. 385
386
Apambire, W.B., Boyle, D. R., Michel, F. A., 1997. Geochemistry, genesis, and 387
health implications of fluoriferous groundwaters in the upper regions of 388
Ghana. Environmental Geology 33, 13-24. 389
390
APHA, 1995. Standard Methods for the Examination of Water and Wastewater, 19th 391
ed. American Public Health Association, Washington, 1–467. 392
393
Appelo, C.A.J., Postma, D., 1996. Geochemistry, Groundwater and Pollution. CRC 394
Press, Balkema. 395

MANUSCRIP
T
ACCEPTED
ACCEPTED MANUSCRIPTP a g e | 17
BIS, 1991. Indian standard specification for drinking water. IS:10500, Indian 396
Standard Institute. 397
Born, S. M., Sonzogni, W. C., Mayers, J., Morton, J. A., 1990. The exceptional 398
waters approach-A Focus for Coordinated Natural Resources Management. 399
North American Journal of Fisheries Management 10(3), 279-289. 400
Brindha, K., Rajesh R., Murugan R., Elango,L., 2011. Fluoride contamination in 401
groundwater in parts of Nalgonda district, Andhra Pradesh, India. 402
Environmental monitoring and assessment 172(1-4), 481-492. 403
404
Brunt, R., Vasak, L., Griffioen, J., 2004. Fluoride in groundwater: probability of 405
occurrence of excessive concentration on global scale. IGRAC, Netherlands. 406
CGWB, 1993. Groundwater resource and development potential of Alleppey. CGWB, 407
Kerala Region, p88 (Unpublished report). 408
CGWB, 2010. Groundwater quality in shallow aquifers of India. CGWB, Faridabad, 409
p64 (Unpublished report). 410
Chandrajith, R., Padmasiri, J.P., Dissanayake, C.B., Prematilaka, K.M., 2012. 411
Spatial distribution of fluoride in groundwater of Sri Lanka. J Natl Sci Found 412
Sri Lanka 40, no. 4, 303-309. 413
Craig, L., Stillings L. L., Decker, D. L., Thomas, J. M., 2015. Comparing activated 414
alumina with indigenous laterite and bauxite as potential sorbents for 415
removing fluoride from drinking water in Ghana. Applied Geochemistry 56, 50-416
66. 417
418
Drever, J. I., 1997. The Geochemistry of Natural Waters: Surface and Groundwater 419
Environments. Prentice hall. Eaglewood Cliffs, New Jersy, USA, 420

MANUSCRIP
T
ACCEPTED
ACCEPTED MANUSCRIPTP a g e | 18
Edmunds,W.M., Smedley P.L., 2005. Fluoride in natural waters. In: Selinus, O. (Ed.), 421
Essentials of Medical Geology. Elsevier Academic Press, London, 301-329. 422
423
Gaciri, S. J., Davies, T. C., 1993. The occurrence and geochemistry of fluoride in 424
some natural waters of Kenya. Journal of Hydrology 143(3), 395-412. 425
426
Genxu W., Guodong C., 2001. Fluoride distribution in water and the governing 427
factors of environment in arid north-west China. Journal of the Arid 428
Environment 49, 601-614. 429
430
Gibbs, R.J., 1970. Mechanisms controlling world water chemistry. Science, 170 431
(3962), 1088-1090. 432
433
Güler, C., Thyne, G.D., 2004. Delineation of hydrochemical facies distribution in a 434
regional groundwater system by means of fuzzy c-means clustering. Water 435
Resources Research 40(12), W12503, doi:10.1029/2004WR003299. 436
. 437
438
Guo, Q., Wang, Y., Ma, T., Ma, R., 2007. Geochemical processes controlling the 439
elevated fluoride concentrations in groundwater of the Taiyuan Basin, 440
Northern China. Journal of Geochemical Exploration 93, 1-12 441
Handa, B.K., 1975. Geochemistry and genesis of fluoride-containing groundwater in 442
India. Groundwater 13, 275-281. 443
444

MANUSCRIP
T
ACCEPTED
ACCEPTED MANUSCRIPTP a g e | 19
Jacks,G., Bhattacharya,P., Chaudhary, V., Singh, K. P. 2005. Controls on the 445
genesis of some high-fluoride groundwaters in India. Applied Geochemistry 446
20(2), 221-228. 447
448
Madhnure, Pandith., D. B., Malpe.,2007. Fluoride contamination of groundwater in 449
rural parts of Yavatmal District, Maharashtra—Causes and remedies. 450
Gondwana Geological Magazine 11, 127-135. 451
452
Magesh,NS., Krishnakumar, S., Chandrasekar N., Soundranayagam, JP., 2013. 453
Groundwater quality assessment using WQI and GIS techniques, Dindigul 454
district, Tamil Nadu, India. Arabian Journal of Geosciences 6(11), 4179–4189. 455
456
Mitra, B.K., Sasaki, C., Keijirou, E., 2006. Spatial and temporal variation of ground 457
water quality in sand dune area of aomori prefecture in Japan. In: 2006 ASAE 458
Annual Meeting. American Society of Agricultural and Biological Engineers, 1. 459
Moghaddam, A.A., Fijani, E., 2008. Distribution of fluoride in groundwater of Maku 460
area, northwest of Iran. Environmental geology 56(2), 281-287. 461
Piper, A.M., 1944. A graphic procedure in the geochemical interpretation of 462
water analyses. Eos, Transactions American Geophysical Union, 25(6), 463
914-928. 464
Rafique, T., Naseem, S., Usmani, T. H., Bashir, E., Khan, F. A., Bhanger, M. I., 465
2009. Geochemical factors controlling the occurrence of high fluoride 466
groundwater in the Nagar Parkar area, Sindh, Pakistan. Journal of hazardous 467
materials 171(1), 424-430. 468
469

MANUSCRIP
T
ACCEPTED
ACCEPTED MANUSCRIPTP a g e | 20
Rao, N. Srinivasa, 1997. The occurrence and behaviour of fluoride in the 470
groundwater of the Lower Vamsadhara river basin, India. Hydrological 471
Sciences Journal 42, 877-892. 472
Rao, N. Subba, 1997. Studies of water quality index in hard rock terrain of Guntur 473
district, Andrapradesh, India. In: National Seminar on Hydrology of 474
Precambrian Terrains and hard rock areas, 129–134. 475
476
Rao, N.S., 2006. Seasonal variation of groundwater quality in apart of Guntur district, 477
Andhra Pradesh, India. Environmental Geology 49, 413–429. 478
479
Saxena, V.K., Ahmed S., 2001. Dissolution of fluoride in groundwater: water rock 480
interaction study. Environmental Geology 40, 1084-1087. 481
482
Shaji, E., Bindu, J. V., Thambi, D. S., 2007. High fluoride in groundwater of Palghat 483
District, Kerala. Current Science 92(2), 240. 484
485
Shaji, E., Nayagam, S. P., Kunjambu, V., Thambi, D.S., 2008. Change in 486
groundwater scenario in Kerala over the last two decades. Golden jubilee 487
memoir, Journal of Geological society of India 69, 67-85. 488
Shaji, E., Vinayachandran, N., Thambi, D.S., 2009. Hydrogeochemical 489
characteristics of groundwater in coastal pheratic aquifers of Alleppey district, 490
Kerala. Journal of Geological society of India 74, 585-90 491
492
Shortt, H. E., Pandit, C. G., Raghavachari, T. N. S., 1937. Endemic fluorosis in 493
Nellore district, south India. Indian Medical Gazette 72, 396-398. 494

MANUSCRIP
T
ACCEPTED
ACCEPTED MANUSCRIPTP a g e | 21
495
Sreedevi, P.D., Ahmed S., Made B., Ledoux E., Gandolfi J.M., 2006. Association of 496
hydrogeological factors in temporal variations of fluoride concentration in a 497
crystalline aquifer in India. Environmental Geology 50, 1-11. 498
499
500
Vasanthavigar, M., Srinivasamoorthy, K., Vijayaragavan, K., Ganthi, R. R., 501
Chidambaramam, S., Anandan, P., Manivannan, R., Vasudevan, S., 2010. 502
Application of water quality index for groundwater quality assessment: 503
Thirumanimuttar sub-basin, Tamilnadu, India. Environmental Monitoring and 504
Assessment 171(1-4), 595-609. 505
506
WHO, 2011. Guidelines for drinking-water quality, fourth ed. World Health 507
Organization. 508
509
Yidana, S. M., Banoeng-Yakubo, B., Akabzaa, T. M., 2010. Analysis of groundwater 510
quality using multivariate and spatial analyses in the Keta basin, Ghana. 511
Journal of African Earth Sciences 58(2), 220-234. 512
513
Figure captions 514
Figure 1. Location map of study area. 515
Figure 2 Lithology shows fluoride affected zone and groundwater level. 516
Figure 3 Spatial variation of electrical conductivity (EC). 517
Figure 4 Spatial variation of fluoride. 518
Figure 5 Chemical data plots in Piper diagram to classify water types. 519
Figure 6 Gibb’s diagram of cation (a) and anion (b). 520
Figure 7 Water quality zonation map. 521

MANUSCRIP
T
ACCEPTED
ACCEPTED MANUSCRIPTP a g e | 22
Figure 8 Relationship between fluoride and calcium. 522
Table 1 Geochemical data of groundwater samples from Alleppey. 523
Table 2 Saturation index, ionic strength and water types. 524
Table 3 Relative weight of physico-chemical parameters. 525
Table 4 Water quality index (WQI) classification. 526
Table 5 Ranking of parameters to delineate groundwater quality zones. 527
Table 6 Trace element hydrochemistry of samples from Alleppey (in ppm). 528
529
530

MANUSCRIP
T
ACCEPTED
ACCEPTED MANUSCRIPT
Table 1 Geochemical data of groundwater samples from Alleppey.
No. pH Ec (µs) Ca2+
(mg/L)
Mg2+
(mg/L)
Na+
(mg/L)
K+
(mg/L)
HCO3-
(mg/L)
SO42-
(mg/L)
Cl-
(mg/L)
F-
(mg/L)
1 9.04 882 14.028 36.432 93 8 205 19.63 53.25 1.86
2 10.15 812 42.084 31.538 60 17 170 35.27 39.05 0.81
3 10.26 639 26.052 35.2 57 8 215 15.08 10.65 0.68
4 10.22 733 20.04 27.92 77 7 225 15.21 24.85 1.63
5 10.43 883 20.04 36.425 77 7 300 14.56 35.5 1.34
6 9.97 2870 56.112 58.25 198 12 265 18.72 337.25 2.36
7 8.3 705 14.028 21.852 63 6 200 12.35 24.85 2.88
8 9 476 14 9.7 75 8.9 234 0.81 21 1.72
9 8.61 266 22 1.5 26 2.4 71 8.4 35 1.52
10 7.25 1415 15.86 15.3 98 9 300 0.39 349.5 2.62
11 7.08 449 17.6 9.1 29 6 230 19.63 364.8 1.58
12 7.4 690 24.5 15.7 28 7 230 27.56 108.8 1.64
13 7.33 431 17.6 12.6 22 6 220 25.22 36.4 1.32
14 6.65 3900 71.8 34 98 12 190 15.08 1253 1.41
15 8.74 371 41 13 12 4.1 212 0.81 5.7 1.06
16 6.93 885 20.5 11.5 29 6 252 1.56 155.5 2.04

MANUSCRIP
T
ACCEPTED
ACCEPTED MANUSCRIPT
Table 2 Saturation index, ionic strength and water types.
No. Location Ionic strength Saturation Index Water Type
1 Chandanakavu 0.25 -2.34 Na-HCO3
2 Vadakkalpunnapra 0.29 -2.28 Na-CO3
3 Karumadi 0.32 -2.24 Na-CO3
4 Chudukadu 0.36 -2.1 Na-CO3
5 Karumadipattukulam 0.5 -0.21 Na-CO3
6 Kulamakkikolani 0.57 -2.03 Na-Cl
7 Kattor 0.19 -2.45 Na-HCO3
8 Vandanam 0.2 -2.13 Na-HCO3
9 Purakkad 0.1 -2.74 Na-HCO3
10 Mararikulam 0.39 -2.17 Na-Cl
11 Chandanakavu 0.36 -2.19 Na-Cl
12 Pazhaveedu 0.258 -2.33 Na-HCO3
13 Ambalapuzha 0.2 -2.43 Na-HCO3
14 Karumadi 0.9 -1.89 Na-Cl
15 Kanichukulangara 0.15 -2.55 Ca-HCO3
16 Kommadi 0.23 -2.37 Na-HCO3

MANUSCRIP
T
ACCEPTED
ACCEPTED MANUSCRIPT
Table 3 Relative weight of physico-chemical parameters.
Chemical
parameters
WHO
standards
Weight (wi) Relative weights
∑=
=n
iiii wwW
1
/
Ec (µs/cm) 500 4 0.28
F (mg/L) 1.5 5 0.35
TH (mg/L) 300 3 0.21
Cl (mg/L) 250 2 0.14
∑wi = 14 ∑Wi=1

MANUSCRIP
T
ACCEPTED
ACCEPTED MANUSCRIPT
Table 4 Water quality index (WQI) classification.
No Location Source WQI Type
1 Chandanakavu Water supply well 130.42 Poor
2 Vadakkalpunnapra Dug well ( domestic) 92.46 Good
3 Karumadi Water supply well 74.88 Good
4 Chudukadu Water supply well 111.04 Poor
5 Karumadipattukulam Water supply well 112.34 Poor
6 Kulamakkikolani Water supply well 288.81 Very poor
7 Kattor Water supply well 150.42 Poor
8 Vandanam Water supply well 93.35 Good
9 Purakkad Dug well ( domestic) 74.26 Good
10 Mararikulam Water supply well 200.59 Poor
11 Chandanakavu Water supply well 106.58 Poor
12 Pazhaveedu Water supply well 110.95 Poor
13 Ambalapuzha Water supply well 79.09 Good
14 Karumadi Water supply well 361.27 Unsuitable
15 Kanichukulangara Water supply well 68.98 Good
16 Kommadi Water supply well 136.56 Poor

MANUSCRIP
T
ACCEPTED
ACCEPTED MANUSCRIPT
Table 5 Ranking of parameters to delineate groundwater quality zones.
SI No. Parameter Class Rank Weightage Index
1
EC (µs/cm)
<750 1
45
45
750–1000 2 90
1000–1200 3 135
>1200 4 180
2
F (mg/L)
<0.5 1
40
40
1–1.5 2 80
1.5–2 3 120
>2 4 160
3
TH (mg/L)
<100 1
10
10
100–150 2 20
150–200 3 30
>200 4 40
4
Cl (mg/L)
<50 1
5
5
50–100 2 10
100–150 3 15
>150 4 20

MANUSCRIP
T
ACCEPTED
ACCEPTED MANUSCRIPT
Table 6 Trace element hydrochemistry of samples from Alleppey (in ppm).
Sample
No. Sr Ba As Fe Cr Mn Pb
1 0.4334 0.05158 0.00017 0.006952 0.00014 0.000054 0.000147
2 0.1824 0.0219 0.01111 0.01416 0.000602 0.00045 0.000169
3 0.3742 0.01052 0.01858 0.0292 0.000433 0.000268 0.000276
4 0.4969 0.04783 0.000266 0.008796 0.000185 0.000125 0.000123
5 0.4389 0.08683 0.000232 0.08598 0.000236 0.000085 0.000125
6 0.465 0.1203 0.000184 0.09704 0.00062 0.000252 0.000258
7 0.3572 0.03482 0.000055 0.04852 0.000544 0.000048 0.000115
8 0.03208 0.00592 0.000048 0.06356 0.000328 0.000225 0.000315
9 0.2541 0.09577 0.00013 0.05646 0.000425 0.000145 0.00016
10 2.405 0.05749 0.005509 0.01438 0.00016 0.000109 0.000034
11 0.2987 0.06866 0.0003 0.006327 0.000404 0.000254 0.000211
12 0.3412 0.02244 0.000184 0.01691 0.000819 0.000989 0.000362

MANUSCRIP
T
ACCEPTED
ACCEPTED MANUSCRIPT
MANUSCRIP
T
ACCEPTED
ACCEPTED MANUSCRIPT

MANUSCRIP
T
ACCEPTED
ACCEPTED MANUSCRIPT

MANUSCRIP
T
ACCEPTED
ACCEPTED MANUSCRIPT

MANUSCRIP
T
ACCEPTED
ACCEPTED MANUSCRIPT

MANUSCRIP
T
ACCEPTED
ACCEPTED MANUSCRIPT

MANUSCRIP
T
ACCEPTED
ACCEPTED MANUSCRIPT

MANUSCRIP
T
ACCEPTED
ACCEPTED MANUSCRIPT

MANUSCRIP
T
ACCEPTED
ACCEPTED MANUSCRIPT
Fluoride contamination in groundwater resources of
Alleppey, southern India
Dhanya Raj, E. Shaji*
Department of Geology, University of Kerala, Kariavattom, Trivandrum 695 581, India
*Corresponding author. E-mail address: [email protected]
Highlights .
• First report of excess fluoride and salinity in the drinking water of the region
• Water quality index shows that 50% of the water samples belong to poor quality
• Heavy groundwater extraction resulted in the decline of water level up to 35 mbgl
• Groundwater is being supplied to the local populace without proper treatment