hydrogeogenic fluoride in groundwater and dental fluorosis in
TRANSCRIPT
Rojanaworarit et al. BMC Oral Health (2021) 21:545 https://doi.org/10.1186/s12903-021-01902-8
RESEARCH ARTICLE
Hydrogeogenic fluoride in groundwater and dental fluorosis in Thai agrarian communities: a prevalence survey and case–control studyChanapong Rojanaworarit1* , Luz Claudio2, Nopporn Howteerakul3, Auamduan Siramahamongkol4, Pattraravith Ngernthong4, Pornpimol Kongtip5 and Susan Woskie6
Abstract
Background: Dental fluorosis can be a disease of social inequity in access to safe drinking water. This dental public health issue becomes prominent in socially disadvantaged agrarian communities in fluoride endemic areas where the standard irrigation system is unavailable and groundwater containing natural fluoride is the major drinking water source. This study aimed to determine the prevalence and severity of dental fluorosis in children and to evaluate its association with fluoride in groundwater in the aforementioned setting in Thailand.
Methods: A cross-sectional survey of 289 children in Nakhon Pathom Province was conducted in 2015. Children with very mild to severe fluorosis were regarded as ‘cases’ while their counterparts were ‘controls’ for a subsequent case–control study. Records of fluoride concentrations in groundwater used for household supply corresponding to resident and number of years by age of each child during 2008–2015 were retrieved. Other exposure variables were measured using a questionnaire. Prevalence ratio (PR), a measure indicating the relative effect of different levels of fluoride on dental fluorosis, was obtained from Poisson regression with robust standard error.
Result: There were 157 children with very mild to moderate dental fluorosis (54.3% prevalence). The univariable analysis revealed that the prevalence of dental fluorosis among children with fluoride concentrations in water sources of 0.7–1.49 (index category 1) and ≥ 1.5 ppm (index category 2) was 1.62 (95% CI; 0.78, 3.34) and 2.75 (95% CI; 1.42, 5.31) times the prevalence among those with fluoride < 0.7 ppm (referent category). After adjusting for all covari-ates, the adjusted prevalence ratios in both index categories were 1.64 (95% CI; 0.24, 11.24) and 2.85 (95% CI; 0.44, 18.52) which were close to their corresponding crude estimates. Since the magnitude of confounding, measured by (PRcrude–PRadjusted)/PRadjusted, were less than 10% for both index categories; this indicated the limited confounding effect of all covariates.
Conclusions: In fluoride endemic areas, groundwater containing natural fluoride utilized for household consump-tion resulted in high dental fluorosis prevalence, particularly in the groundwater with fluoride concentrations of ≥ 1.5 ppm.
Keywords: Dental fluorosis, Groundwater, Oral health, Environmental health, Epidemiology
© The Author(s) 2021. Open Access This article is licensed under a Creative Commons Attribution 4.0 International License, which permits use, sharing, adaptation, distribution and reproduction in any medium or format, as long as you give appropriate credit to the original author(s) and the source, provide a link to the Creative Commons licence, and indicate if changes were made. The images or other third party material in this article are included in the article’s Creative Commons licence, unless indicated otherwise in a credit line to the material. If material is not included in the article’s Creative Commons licence and your intended use is not permitted by statutory regulation or exceeds the permitted use, you will need to obtain permission directly from the copyright holder. To view a copy of this licence, visit http:// creat iveco mmons. org/ licen ses/ by/4. 0/. The Creative Commons Public Domain Dedication waiver (http:// creat iveco mmons. org/ publi cdoma in/ zero/1. 0/) applies to the data made available in this article, unless otherwise stated in a credit line to the data.
Open Access
*Correspondence: [email protected] Department of Health Professions, School of Health Professions and Human Services, Hofstra University, Hempstead, NY, USAFull list of author information is available at the end of the article
Page 2 of 16Rojanaworarit et al. BMC Oral Health (2021) 21:545
BackgroundEtiologic patterns of dental fluorosis vary across different populations and settings. To explain the variation in the etiologic mechanisms of oral diseases, epidemiological models including the epidemiologic triad and Sufficient-Component Cause Model have been previously applied [1–3].
A classical model of the epidemiologic triad consid-ers the interrelationship between host, agent, and envi-ronment in the causation of diseases [4]. In fluoride non-endemic areas, the environmental influence in the etiology of dental fluorosis is limited because the expo-sure of the susceptible population–children between the age of 6–8 years old with developing dental enamel [5]—is limited to manufactured fluoride products—i.e., fluoride toothpaste [6]. In contrast, the likelihood of host-agent interaction is heightened in fluoride endemic areas. Since the groundwater can serve as an abundant source of natural environmental fluoride, the risk of exposure to excessive fluoride is increased, as is the potential for dental fluorosis [7, 8]. Nonetheless, simply residing in a geological fluoride belt is not sufficient to cause dental fluorosis. Multiple factors are required to promote that necessary host-agent interaction. In a unique setting of socially disadvantaged rural agrarian communities, social determinants of health, including the low socioeconomic status and social inequity in access to a safe drinking water source, can increase the likelihood of excessive environmental fluoride exposure through the use of natu-ral water sources [9].
Since this etiologic pattern requires not only the geo-graphical presence of environmental fluoride but also other causal factors, the Sufficient-Component Cause Model can be applied to further elaborate the causal mechanism [10]. A sufficient cause in the model refers to a minimum set of causal factors or ‘component causes’ that inevitably produce disease [10, 11]. In the fluoride endemic areas, there may be several sufficient causes of dental fluorosis that vary in their components, although some components may be shared among vari-ous sufficient causes [12]. A sufficient cause that pro-duces dental fluorosis in one individual may consist of three component causes comprising: (1) the presence of high fluoride in environmental sources, (2) lack of safe drinking water sources, and (3) low socioeconomic sta-tus that drives hosts to use the natural sources of water [13]. While a sufficient cause in another individual may comprise five-component causes including (1) swallow-ing of fluoride toothpaste, (2) use of local water sources for formula instead of breast milk, and (3–5) the three-component causes similar to those in the first individual [14, 15]. Nonetheless, dental fluorosis in individuals shar-ing the same sufficient cause components can still vary
in severity levels. This suggests the need for a probabil-istic causality approach [16] in dental fluorosis research to further describe the probability of an effect given a particular level of exposure [16]. Furthermore, causal directed acyclic graphs (DAGs) which is a graphic tool to visualize a causal structure can be applied to provide a better understanding of variables’ roles—i.e., exposure and confounder—in the etiology of dental fluorosis [17, 18].
In the environment, fluoride naturally occurs in rocks, soil, water, plants, animals, and human beings [8]. Fluoride-containing rocks such as fluorite (CaF2) and fluorapatite [Ca5(PO4)3F] release fluoride into soil and water through weathering process and dissolution in water and give rise to exposable environmental sources of fluoride [19]. Fluoride concentration in surface water such as rivers is normally lower than 0.1 mg per liter (mg/L) or parts per million (ppm) [20]. Nonetheless, fluoride concentration in the groundwater varies greatly and can be considerably higher, depending on composi-tion in the host rock, climate, and hydrogeology [21]. Since fluoride in the human body is mainly obtained from drinking water, the inappropriate source of drinking water can result in excessive fluoride intake. The optimal fluoride concentration in drinking water is recommended not to exceed 0.7 mg/L [20, 22]. Excessive fluoride expo-sure during the development of dental organs would lead to the mineralization defect which causes dental fluorosis [5]. The critical period of dental fluorosis development in permanent dentition is from birth to 8 years old [23]. Therefore, dental fluorosis can be prevented by avoid-ing excessive fluoride intake in children age under 8 [24]. Investigation of natural water sources used for drinking and their association to the prevalence of dental fluorosis would provide evidence for the practical management of the natural sources of household water supply to control and prevent this disease in the community.
In the context of Thailand, there are large fluoride endemic areas mainly in the North and the West [21, 25]. In several villages of Bang Len, a district in Nak-hon Pathom Province, Thailand, an excessive amount of fluoride is found in local drinking water sources and the common occurrence of dental fluorosis in children was observed by local public health professionals. Nonethe-less, the magnitude and distribution of dental fluorosis corresponding to drinking water sources with varying fluoride concentrations have not been investigated. The provincial dental public health officers established a dental fluorosis surveillance system in these fluoride endemic areas to identify, control, and prevent dental fluorosis. The purposes of this study were to utilize this surveillance data to identify the prevalence and severity of dental fluorosis in children and to further evaluate a
Page 3 of 16Rojanaworarit et al. BMC Oral Health (2021) 21:545
hypothesis that natural fluoride in the groundwater used for household water supply with concentration exceed-ing 0.7 ppm would increase the risk of dental fluorosis among children in these socially disadvantaged rural agrarian communities in Thailand.
MethodsStudy designThis study comprises two phases of investigation: a cross-sectional survey to determine the prevalence and severity of dental fluorosis and a case–control study to examine the plausible association between environmental fluoride in groundwater used for household consumption and dental fluorosis occurrence. Application of two epidemi-ological designs in one study-to estimate the prevalence of disease by a cross-sectional survey before evaluation of the disease’s associated factors using case–control study-has previously been illustrated in several studies [26–28].
Study setting and participantsThe study was undertaken in Bang Len District, Nakhon Pathom Province, Thailand in 2015. Five subdistricts of Bang Len; including Bang Luang, Hin Mun, Bang Sai Pa, Sai Ngam, and Nin Phet; were selected from the total of 15 subdistricts due to the unique characteristics of (a) being fluoride endemic areas with pre-existing records of fluoride concentrations in the village water sources beyond 0.7 ppm, (b) being rural agrarian communities where rice growing is a major economic activity, (c) being socially-disadvantaged in terms of having lower average income compared to the provincial average value and unavailability of a standardized water irrigation system provided by Provincial Waterworks Authority (PWA), (d) using the groundwater from the community well used for village water supply for drinking and cooking with the improper treatment of fluoride in the water (i.e., boiling), and (e) being targeted areas of the local public health office’s initiative to establish a dental fluorosis surveil-lance system as a result of reports of dental fluorosis. This study initially aimed to include all 12 primary schools located in the 5 subdistricts. Only one school declined to serve as a research site. Finally, 11 schools provided per-mission and participated in this study. Eligible criteria for participants in this study were: (1) the first and second-grade students of the schools that provided permission and participated in this study; (2) have resided within the five subdistricts since birth; (3) their caregivers provided written consent for the participation in this research and (4) were present at schools on the day of an oral exami-nation. After assessing their eligibility, all the first and second-grade students in all 11 schools were eligible and included, and none of them declined to participate.
Study sizeThe study size was estimated according to the two research objectives. Firstly, to measure dental fluoro-sis prevalence, a study size of 203 individuals was esti-mated according to the method described by Daniel [29] to have a 95% confidence level and precision of 5% [30]. The value of the expected prevalence of dental fluorosis in the calculation was obtained from the reported 15.6% in a previous study in Thailand [20]. Secondly, to evalu-ate the association between fluoride in groundwater and dental fluorosis given unknown exposure proportions in the anticipated cases and controls in this community, the study size was estimated according to the method described in a previous case–control study conducted in a fluoridated community [31]. The study size of 34 cases and 34 controls were estimated to have a 95% confidence level, 80% statistical power, 5% exposure among controls, and an estimated risk ratio of 5.4 [31].
Outcome measurementIn the first phase of the cross-sectional survey, the out-come of dental fluorosis was evaluated as a part of rou-tine school-based oral health check-ups in all students. An authorized public health officer from the Nakhon Pathom Provincial Public Health Office, who has been in charge of the province’s school oral health program and also served as an author (AS), collaborated with local public health officers in Bang Lan District to inform school principals of the dental check-up program and to obtain permission. Teachers of grade 1 and 2 stu-dents were informed of the program and requested to distribute informed consent forms to caregivers of their students. The public health officers scheduled an exami-nation date with the schools after obtaining the signed informed consent forms. On the examination date, teach-ers brought students to the organized inspection area, facilitated and monitored the examination. The oral examination protocol was based on the standardized method of the National Oral Health Survey [32]. Dental fluorosis was examined by only one authorized dentist from Nakhon Pathom Provincial Public Health Office, who was also an author (PN). Intra-examiner calibration was carried during training for oral health examination and record of data for the National Oral Health Sur-vey at Nakhon Pathom Provincial Public Health Office. Using Kappa statistics, intra-examiner consistency was assessed, and the result achieved was 0.9, indicat-ing nearly perfect agreement [33]. Visual inspection on anterior teeth was a method of examination as recom-mended by the World Health Organization (WHO) for a practical reason [33]. Dean’s index (1942) was applied to classify the severity of dental fluorosis. Six levels of the
Page 4 of 16Rojanaworarit et al. BMC Oral Health (2021) 21:545
classification include normal, questionable, very mild, mild, moderate, and severe [34]. From the survey result, children with very mild to severe fluorosis were regarded as ‘cases’ while their counterparts were ‘controls’ for a subsequent case–control study.
Exposure measurementIn the case–control study, the exposure and behavio-ral factors of each child were traced backward until birth. The major exposure was fluoride concentration in groundwater used for household water supply. Since the Bureau of Dental Health, Ministry of Public Health, Thai-land, has designated Bang Len District as an area under surveillance for dental fluorosis since 1999, water sam-ples have been collected annually from drinking water sources (i.e., artesian wells, village water supplies) that covered all addresses of residents to be examined for flu-oride content at the Bureau of Dental Health’s lab using ion-selective electrode technique. Fluoride concentra-tion has been recorded correspondingly to the location and the source of water sampled. The database of fluoride concentration was then shared with the provincial pub-lic health office. For this study, annual records of fluoride concentrations in the groundwater used for the house-hold water supply corresponding to the residence of each child from 2008 to 2015 were retrieved from the database at Nakhon Pathom Provincial Public Health Office. These records were verified by the public health officer who has routinely managed the database (AS).
Other explanatory variables included child’s sex and age, caregiver’s education, family income per month, breastfeeding, brushing frequency before and after 2 years old, toothpaste type, toothpaste size, and fluoride supplement. A child’s sex was classified as either male or female, and the age was from birth until 2015—stated in years. The family income per month was an estimated total monthly income of all family members expressed in Thai Bahts. The family income per month was dichoto-mously categorized during analysis using the average family expenditure per month in 2015 of 26,025 Thai Bahts (THB) in Nakhon Pathom. We classified sufficient income (≥ cut-off value) versus insufficient (< cut-off value) for family income. Breastfeeding was a dichoto-mous variable (yes/no) indicating whether the child had been breastfed for at least 6 months. Tooth brushing fre-quency was ascertained for the periods before and after 2 years old based on the difference in the child’s capa-bility of tooth brushing [6, 35, 36]. Toothpaste size was dichotomously categorized into pea-sized and larger than pea-sized [6]. These explanatory variables were ascertained using an interview questionnaire (Additional file 1). The face-to-face interview with the caregivers was undertaken through the existing community public
health network. The district public health officers trained village health volunteers on how to conduct face-to-face interviews for data collection and provided lists of stu-dents to be contacted in their villages. Each village health volunteer contacted caregivers of the assigned students to inform them about this research project, related pro-cedures, and anticipated use of data they provided for subsequent research and local health system develop-ment. After informed consent was obtained, the volun-teer interviewed the caregiver and recorded information in the paper questionnaire.
Data management and statistical analysisThe dependent variable for this study was the preva-lence of dental fluorosis in children. The prevalence was calculated by the number of children having very mild to severe dental fluorosis divided by the total number of children surveyed [37]. The main exposure was fluoride concentration in groundwater used for household water supply. For each child, available measures of groundwa-ter fluoride concentrations in the drinking water source supplying the child’s residence were time-averaged over the period of birth to the survey. The time-averaged fluo-ride concentration was then categorized into three lev-els including < 0.7, 0.7–1.49, and ≥ 1.5 ppm respectively. These cut-off points were based on the locally recom-mended fluoride concentration in drinking water which is less than 0.7 ppm [20] and the WHO’s recommended fluoride concentration which is less than 1.5 ppm [7]. Other explanatory variables which were regarded as potential confounders in the analysis phase included the child’s demographic factors (age and sex), caregiver fac-tors (education and family income), history of breastfeed-ing, fluoride supplementation, and children’s oral health behaviors (tooth brushing frequency, fluoride toothpaste use, and toothpaste size).
Characteristics of children and caregivers were sum-marized using descriptive statistics. The exact probability test was applied to test for differences in proportions [38]. A Wilcoxon-type test for trend was applied to examine the trend of dental fluorosis occurrence across ordered levels of fluoride concentration [39]. Since the outcome of dental fluorosis was expected to be common especially in the fluoride endemic areas in Thailand [25], Poisson regression with robust standard errors was employed to estimate the effect measure of dental fluorosis preva-lence ratio (PR) [40]. The technique was applied to avoid overestimating the odds ratio when the outcome occur-rence is common [40–42]. Univariable analysis was con-ducted to evaluate the crude association between each explanatory variable and dental fluorosis. The univari-able analysis of the main exposure of fluoride in village water sources and dental fluorosis served as the crude
Page 5 of 16Rojanaworarit et al. BMC Oral Health (2021) 21:545
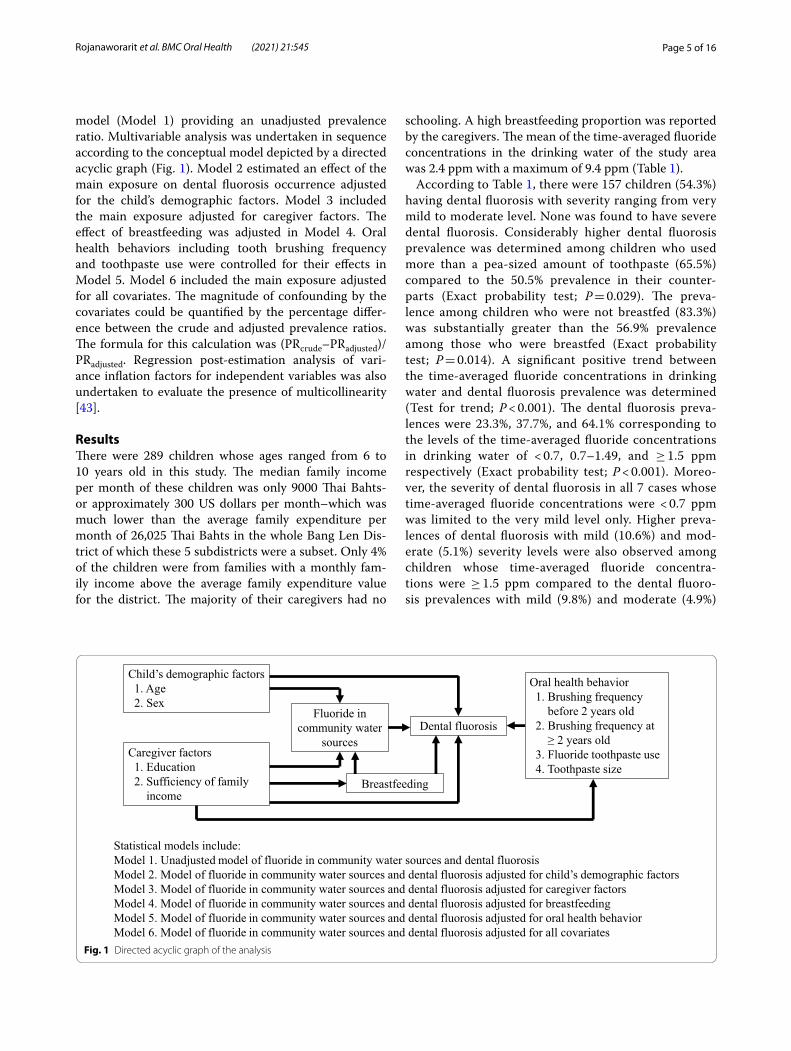
model (Model 1) providing an unadjusted prevalence ratio. Multivariable analysis was undertaken in sequence according to the conceptual model depicted by a directed acyclic graph (Fig. 1). Model 2 estimated an effect of the main exposure on dental fluorosis occurrence adjusted for the child’s demographic factors. Model 3 included the main exposure adjusted for caregiver factors. The effect of breastfeeding was adjusted in Model 4. Oral health behaviors including tooth brushing frequency and toothpaste use were controlled for their effects in Model 5. Model 6 included the main exposure adjusted for all covariates. The magnitude of confounding by the covariates could be quantified by the percentage differ-ence between the crude and adjusted prevalence ratios. The formula for this calculation was (PRcrude–PRadjusted)/PRadjusted. Regression post-estimation analysis of vari-ance inflation factors for independent variables was also undertaken to evaluate the presence of multicollinearity [43].
ResultsThere were 289 children whose ages ranged from 6 to 10 years old in this study. The median family income per month of these children was only 9000 Thai Bahts-or approximately 300 US dollars per month–which was much lower than the average family expenditure per month of 26,025 Thai Bahts in the whole Bang Len Dis-trict of which these 5 subdistricts were a subset. Only 4% of the children were from families with a monthly fam-ily income above the average family expenditure value for the district. The majority of their caregivers had no
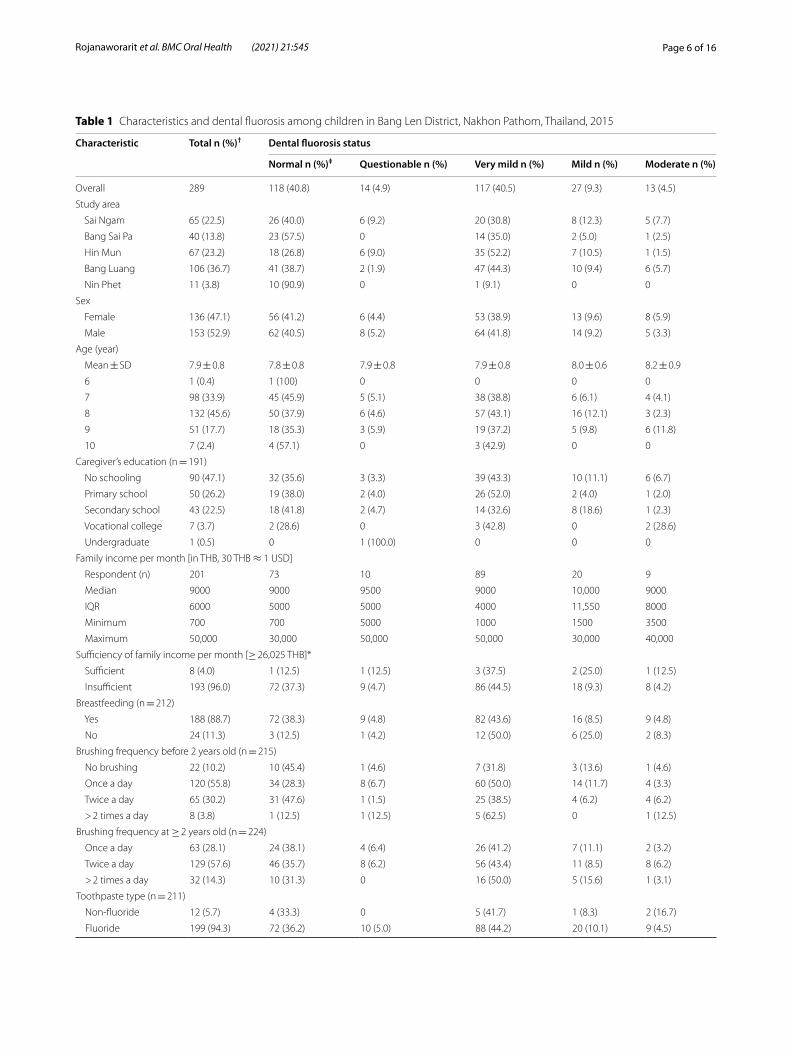
schooling. A high breastfeeding proportion was reported by the caregivers. The mean of the time-averaged fluoride concentrations in the drinking water of the study area was 2.4 ppm with a maximum of 9.4 ppm (Table 1).
According to Table 1, there were 157 children (54.3%) having dental fluorosis with severity ranging from very mild to moderate level. None was found to have severe dental fluorosis. Considerably higher dental fluorosis prevalence was determined among children who used more than a pea-sized amount of toothpaste (65.5%) compared to the 50.5% prevalence in their counter-parts (Exact probability test; P = 0.029). The preva-lence among children who were not breastfed (83.3%) was substantially greater than the 56.9% prevalence among those who were breastfed (Exact probability test; P = 0.014). A significant positive trend between the time-averaged fluoride concentrations in drinking water and dental fluorosis prevalence was determined (Test for trend; P < 0.001). The dental fluorosis preva-lences were 23.3%, 37.7%, and 64.1% corresponding to the levels of the time-averaged fluoride concentrations in drinking water of < 0.7, 0.7–1.49, and ≥ 1.5 ppm respectively (Exact probability test; P < 0.001). Moreo-ver, the severity of dental fluorosis in all 7 cases whose time-averaged fluoride concentrations were < 0.7 ppm was limited to the very mild level only. Higher preva-lences of dental fluorosis with mild (10.6%) and mod-erate (5.1%) severity levels were also observed among children whose time-averaged fluoride concentra-tions were ≥ 1.5 ppm compared to the dental fluoro-sis prevalences with mild (9.8%) and moderate (4.9%)
Breastfeeding
Child’s demographic factors1. Age2. Sex
Caregiver factors1. Education2. Sufficiency of family
income
Dental fluorosisFluoride in
community water sources
Oral health behavior1. Brushing frequency
before 2 years old2. Brushing frequency at
≥ 2 years old3. Fluoride toothpaste use4. Toothpaste size
Statistical models include:Model 1. Unadjusted model of fluoride in community water sources and dental fluorosisModel 2. Model of fluoride in community water sources and dental fluorosis adjusted for child’s demographic factorsModel 3. Model of fluoride in community water sources and dental fluorosis adjusted for caregiver factorsModel 4. Model of fluoride in community water sources and dental fluorosis adjusted for breastfeedingModel 5. Model of fluoride in community water sources and dental fluorosis adjusted for oral health behaviorModel 6. Model of fluoride in community water sources and dental fluorosis adjusted for all covariates
Fig. 1 Directed acyclic graph of the analysis
Page 6 of 16Rojanaworarit et al. BMC Oral Health (2021) 21:545
Table 1 Characteristics and dental fluorosis among children in Bang Len District, Nakhon Pathom, Thailand, 2015
Characteristic Total n (%)† Dental fluorosis status
Normal n (%)‡ Questionable n (%) Very mild n (%) Mild n (%) Moderate n (%)
Overall 289 118 (40.8) 14 (4.9) 117 (40.5) 27 (9.3) 13 (4.5)
Study area
Sai Ngam 65 (22.5) 26 (40.0) 6 (9.2) 20 (30.8) 8 (12.3) 5 (7.7)
Bang Sai Pa 40 (13.8) 23 (57.5) 0 14 (35.0) 2 (5.0) 1 (2.5)
Hin Mun 67 (23.2) 18 (26.8) 6 (9.0) 35 (52.2) 7 (10.5) 1 (1.5)
Bang Luang 106 (36.7) 41 (38.7) 2 (1.9) 47 (44.3) 10 (9.4) 6 (5.7)
Nin Phet 11 (3.8) 10 (90.9) 0 1 (9.1) 0 0
Sex
Female 136 (47.1) 56 (41.2) 6 (4.4) 53 (38.9) 13 (9.6) 8 (5.9)
Male 153 (52.9) 62 (40.5) 8 (5.2) 64 (41.8) 14 (9.2) 5 (3.3)
Age (year)
Mean ± SD 7.9 ± 0.8 7.8 ± 0.8 7.9 ± 0.8 7.9 ± 0.8 8.0 ± 0.6 8.2 ± 0.9
6 1 (0.4) 1 (100) 0 0 0 0
7 98 (33.9) 45 (45.9) 5 (5.1) 38 (38.8) 6 (6.1) 4 (4.1)
8 132 (45.6) 50 (37.9) 6 (4.6) 57 (43.1) 16 (12.1) 3 (2.3)
9 51 (17.7) 18 (35.3) 3 (5.9) 19 (37.2) 5 (9.8) 6 (11.8)
10 7 (2.4) 4 (57.1) 0 3 (42.9) 0 0
Caregiver’s education (n = 191)
No schooling 90 (47.1) 32 (35.6) 3 (3.3) 39 (43.3) 10 (11.1) 6 (6.7)
Primary school 50 (26.2) 19 (38.0) 2 (4.0) 26 (52.0) 2 (4.0) 1 (2.0)
Secondary school 43 (22.5) 18 (41.8) 2 (4.7) 14 (32.6) 8 (18.6) 1 (2.3)
Vocational college 7 (3.7) 2 (28.6) 0 3 (42.8) 0 2 (28.6)
Undergraduate 1 (0.5) 0 1 (100.0) 0 0 0
Family income per month [in THB, 30 THB ≈ 1 USD]
Respondent (n) 201 73 10 89 20 9
Median 9000 9000 9500 9000 10,000 9000
IQR 6000 5000 5000 4000 11,550 8000
Minimum 700 700 5000 1000 1500 3500
Maximum 50,000 30,000 50,000 50,000 30,000 40,000
Sufficiency of family income per month [≥ 26,025 THB]*
Sufficient 8 (4.0) 1 (12.5) 1 (12.5) 3 (37.5) 2 (25.0) 1 (12.5)
Insufficient 193 (96.0) 72 (37.3) 9 (4.7) 86 (44.5) 18 (9.3) 8 (4.2)
Breastfeeding (n = 212)
Yes 188 (88.7) 72 (38.3) 9 (4.8) 82 (43.6) 16 (8.5) 9 (4.8)
No 24 (11.3) 3 (12.5) 1 (4.2) 12 (50.0) 6 (25.0) 2 (8.3)
Brushing frequency before 2 years old (n = 215)
No brushing 22 (10.2) 10 (45.4) 1 (4.6) 7 (31.8) 3 (13.6) 1 (4.6)
Once a day 120 (55.8) 34 (28.3) 8 (6.7) 60 (50.0) 14 (11.7) 4 (3.3)
Twice a day 65 (30.2) 31 (47.6) 1 (1.5) 25 (38.5) 4 (6.2) 4 (6.2)
> 2 times a day 8 (3.8) 1 (12.5) 1 (12.5) 5 (62.5) 0 1 (12.5)
Brushing frequency at ≥ 2 years old (n = 224)
Once a day 63 (28.1) 24 (38.1) 4 (6.4) 26 (41.2) 7 (11.1) 2 (3.2)
Twice a day 129 (57.6) 46 (35.7) 8 (6.2) 56 (43.4) 11 (8.5) 8 (6.2)
> 2 times a day 32 (14.3) 10 (31.3) 0 16 (50.0) 5 (15.6) 1 (3.1)
Toothpaste type (n = 211)
Non-fluoride 12 (5.7) 4 (33.3) 0 5 (41.7) 1 (8.3) 2 (16.7)
Fluoride 199 (94.3) 72 (36.2) 10 (5.0) 88 (44.2) 20 (10.1) 9 (4.5)
Page 7 of 16Rojanaworarit et al. BMC Oral Health (2021) 21:545
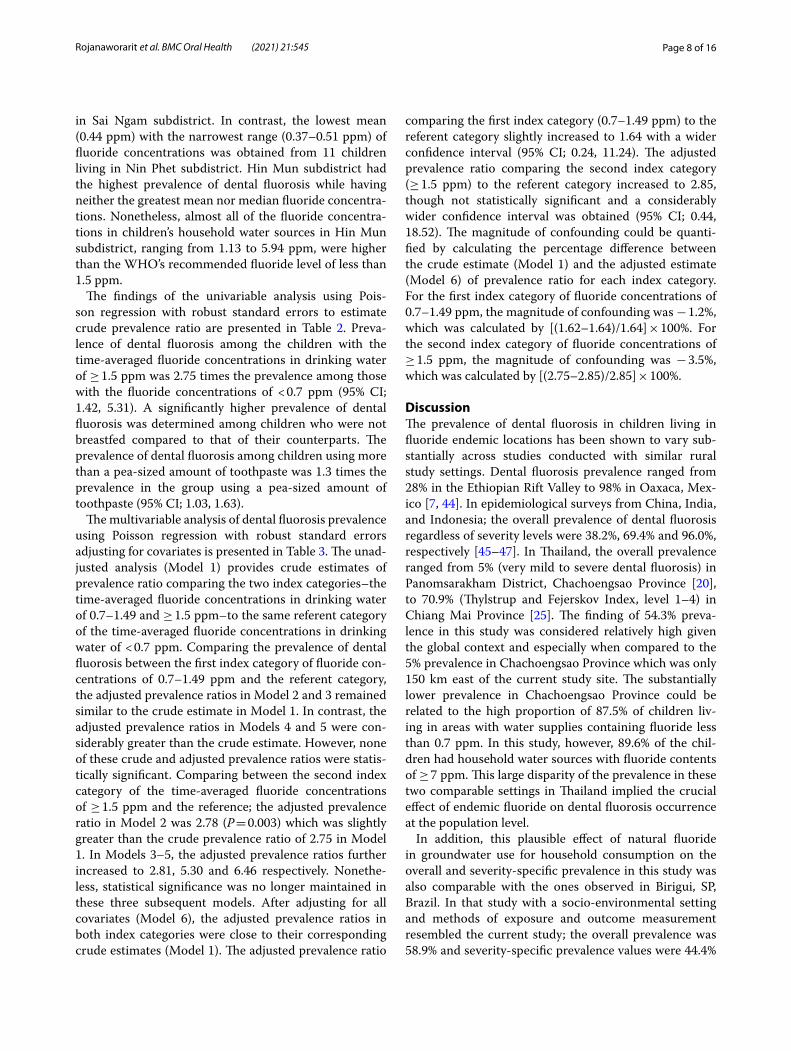
severity in the group with the time-averaged fluoride concentrations of 0.7–1.49 ppm. Note that the exact probability test and the chi-square test for trend were applicable only for some variables. The test results were thus explained here and not in Table 1.
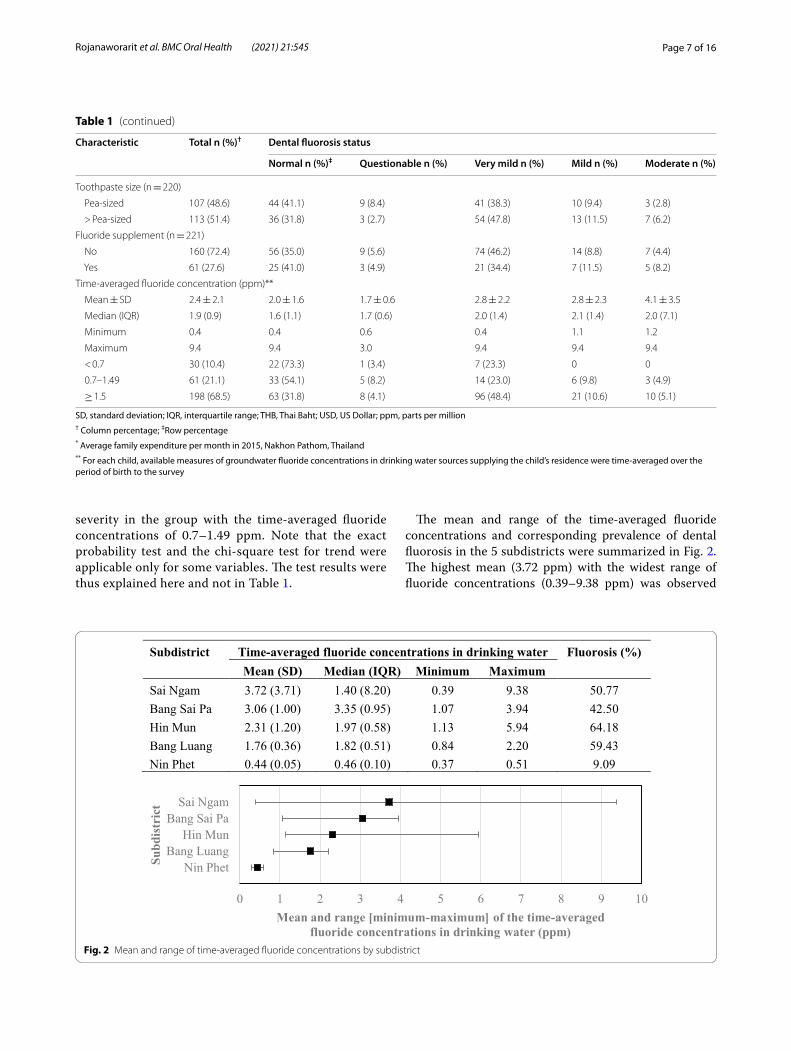
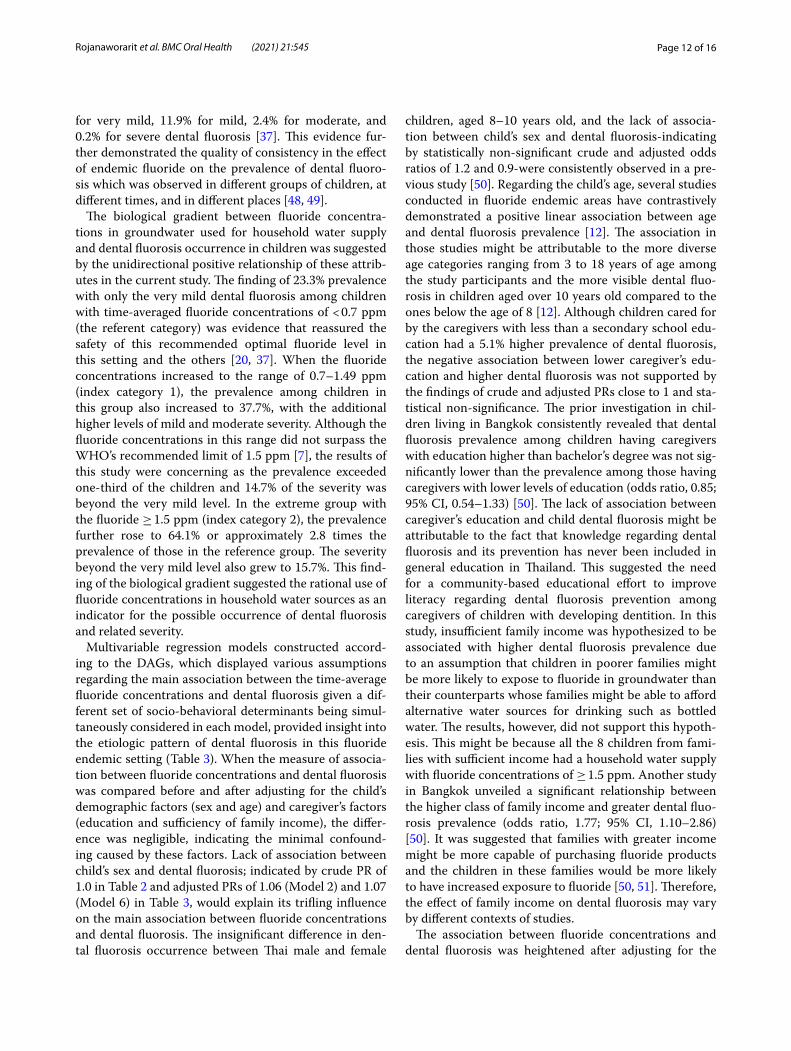
The mean and range of the time-averaged fluoride concentrations and corresponding prevalence of dental fluorosis in the 5 subdistricts were summarized in Fig. 2. The highest mean (3.72 ppm) with the widest range of fluoride concentrations (0.39–9.38 ppm) was observed
SD, standard deviation; IQR, interquartile range; THB, Thai Baht; USD, US Dollar; ppm, parts per million† Column percentage; ‡Row percentage* Average family expenditure per month in 2015, Nakhon Pathom, Thailand** For each child, available measures of groundwater fluoride concentrations in drinking water sources supplying the child’s residence were time-averaged over the period of birth to the survey
Table 1 (continued)
Characteristic Total n (%)† Dental fluorosis status
Normal n (%)‡ Questionable n (%) Very mild n (%) Mild n (%) Moderate n (%)
Toothpaste size (n = 220)
Pea-sized 107 (48.6) 44 (41.1) 9 (8.4) 41 (38.3) 10 (9.4) 3 (2.8)
> Pea-sized 113 (51.4) 36 (31.8) 3 (2.7) 54 (47.8) 13 (11.5) 7 (6.2)
Fluoride supplement (n = 221)
No 160 (72.4) 56 (35.0) 9 (5.6) 74 (46.2) 14 (8.8) 7 (4.4)
Yes 61 (27.6) 25 (41.0) 3 (4.9) 21 (34.4) 7 (11.5) 5 (8.2)
Time-averaged fluoride concentration (ppm)**
Mean ± SD 2.4 ± 2.1 2.0 ± 1.6 1.7 ± 0.6 2.8 ± 2.2 2.8 ± 2.3 4.1 ± 3.5
Median (IQR) 1.9 (0.9) 1.6 (1.1) 1.7 (0.6) 2.0 (1.4) 2.1 (1.4) 2.0 (7.1)
Minimum 0.4 0.4 0.6 0.4 1.1 1.2
Maximum 9.4 9.4 3.0 9.4 9.4 9.4
< 0.7 30 (10.4) 22 (73.3) 1 (3.4) 7 (23.3) 0 0
0.7–1.49 61 (21.1) 33 (54.1) 5 (8.2) 14 (23.0) 6 (9.8) 3 (4.9)
≥ 1.5 198 (68.5) 63 (31.8) 8 (4.1) 96 (48.4) 21 (10.6) 10 (5.1)
Subdistrict Time-averaged fluoride concentrations in drinking water Fluorosis (%)Mean (SD) Median (IQR) Minimum Maximum
Sai Ngam 3.72 (3.71) 1.40 (8.20) 0.39 9.38 50.77Bang Sai Pa 3.06 (1.00) 3.35 (0.95) 1.07 3.94 42.50Hin Mun 2.31 (1.20) 1.97 (0.58) 1.13 5.94 64.18Bang Luang 1.76 (0.36) 1.82 (0.51) 0.84 2.20 59.43Nin Phet 0.44 (0.05) 0.46 (0.10) 0.37 0.51 9.09
0 1 2 3 4 5 6 7 8 9 10
Sai NgamBang Sai Pa
Hin MunBang Luang
Nin Phet
Mean and range [minimum-maximum] of the time-averaged fluoride concentrations in drinking water (ppm)
Subd
istr
ict
Fig. 2 Mean and range of time-averaged fluoride concentrations by subdistrict
Page 8 of 16Rojanaworarit et al. BMC Oral Health (2021) 21:545
in Sai Ngam subdistrict. In contrast, the lowest mean (0.44 ppm) with the narrowest range (0.37–0.51 ppm) of fluoride concentrations was obtained from 11 children living in Nin Phet subdistrict. Hin Mun subdistrict had the highest prevalence of dental fluorosis while having neither the greatest mean nor median fluoride concentra-tions. Nonetheless, almost all of the fluoride concentra-tions in children’s household water sources in Hin Mun subdistrict, ranging from 1.13 to 5.94 ppm, were higher than the WHO’s recommended fluoride level of less than 1.5 ppm.
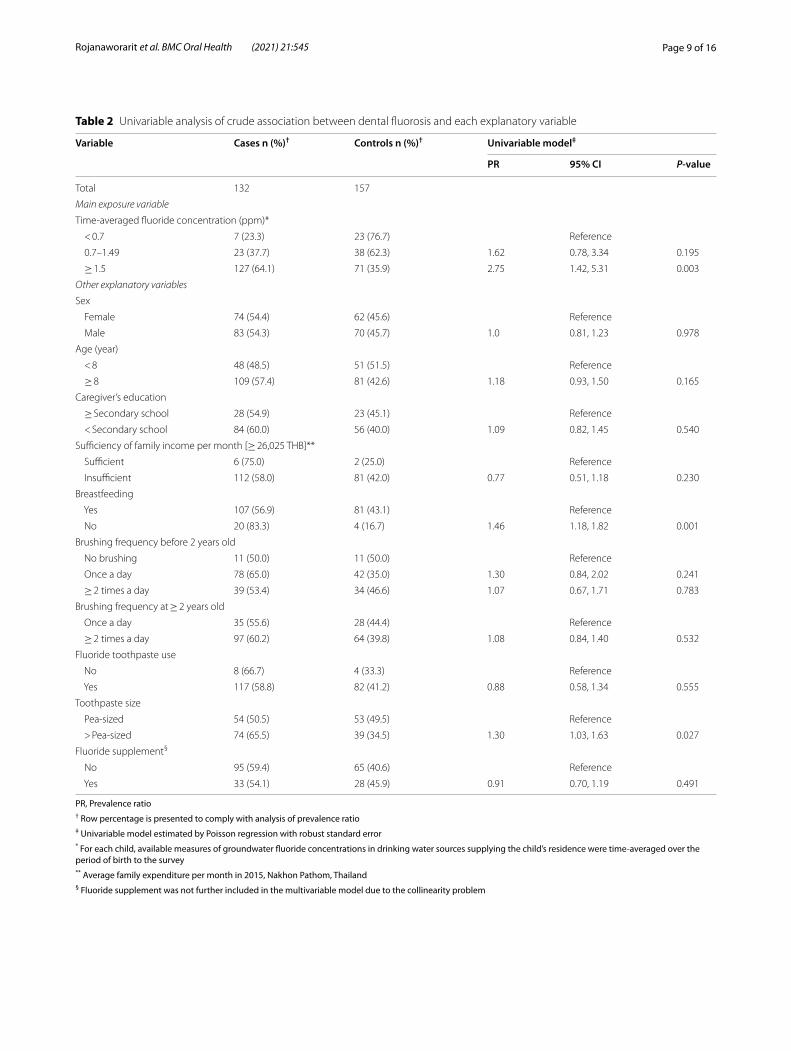
The findings of the univariable analysis using Pois-son regression with robust standard errors to estimate crude prevalence ratio are presented in Table 2. Preva-lence of dental fluorosis among the children with the time-averaged fluoride concentrations in drinking water of ≥ 1.5 ppm was 2.75 times the prevalence among those with the fluoride concentrations of < 0.7 ppm (95% CI; 1.42, 5.31). A significantly higher prevalence of dental fluorosis was determined among children who were not breastfed compared to that of their counterparts. The prevalence of dental fluorosis among children using more than a pea-sized amount of toothpaste was 1.3 times the prevalence in the group using a pea-sized amount of toothpaste (95% CI; 1.03, 1.63).
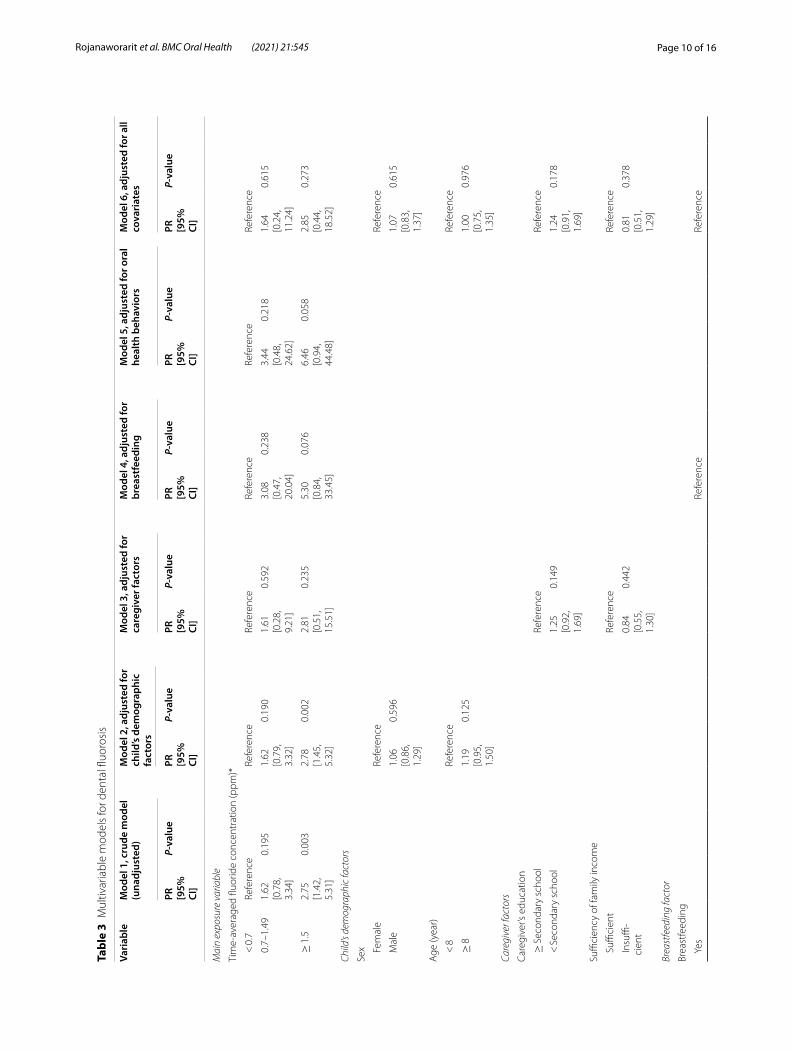
The multivariable analysis of dental fluorosis prevalence using Poisson regression with robust standard errors adjusting for covariates is presented in Table 3. The unad-justed analysis (Model 1) provides crude estimates of prevalence ratio comparing the two index categories–the time-averaged fluoride concentrations in drinking water of 0.7–1.49 and ≥ 1.5 ppm–to the same referent category of the time-averaged fluoride concentrations in drinking water of < 0.7 ppm. Comparing the prevalence of dental fluorosis between the first index category of fluoride con-centrations of 0.7–1.49 ppm and the referent category, the adjusted prevalence ratios in Model 2 and 3 remained similar to the crude estimate in Model 1. In contrast, the adjusted prevalence ratios in Models 4 and 5 were con-siderably greater than the crude estimate. However, none of these crude and adjusted prevalence ratios were statis-tically significant. Comparing between the second index category of the time-averaged fluoride concentrations of ≥ 1.5 ppm and the reference; the adjusted prevalence ratio in Model 2 was 2.78 (P = 0.003) which was slightly greater than the crude prevalence ratio of 2.75 in Model 1. In Models 3–5, the adjusted prevalence ratios further increased to 2.81, 5.30 and 6.46 respectively. Nonethe-less, statistical significance was no longer maintained in these three subsequent models. After adjusting for all covariates (Model 6), the adjusted prevalence ratios in both index categories were close to their corresponding crude estimates (Model 1). The adjusted prevalence ratio
comparing the first index category (0.7–1.49 ppm) to the referent category slightly increased to 1.64 with a wider confidence interval (95% CI; 0.24, 11.24). The adjusted prevalence ratio comparing the second index category (≥ 1.5 ppm) to the referent category increased to 2.85, though not statistically significant and a considerably wider confidence interval was obtained (95% CI; 0.44, 18.52). The magnitude of confounding could be quanti-fied by calculating the percentage difference between the crude estimate (Model 1) and the adjusted estimate (Model 6) of prevalence ratio for each index category. For the first index category of fluoride concentrations of 0.7–1.49 ppm, the magnitude of confounding was − 1.2%, which was calculated by [(1.62–1.64)/1.64] × 100%. For the second index category of fluoride concentrations of ≥ 1.5 ppm, the magnitude of confounding was − 3.5%, which was calculated by [(2.75–2.85)/2.85] × 100%.
DiscussionThe prevalence of dental fluorosis in children living in fluoride endemic locations has been shown to vary sub-stantially across studies conducted with similar rural study settings. Dental fluorosis prevalence ranged from 28% in the Ethiopian Rift Valley to 98% in Oaxaca, Mex-ico [7, 44]. In epidemiological surveys from China, India, and Indonesia; the overall prevalence of dental fluorosis regardless of severity levels were 38.2%, 69.4% and 96.0%, respectively [45–47]. In Thailand, the overall prevalence ranged from 5% (very mild to severe dental fluorosis) in Panomsarakham District, Chachoengsao Province [20], to 70.9% (Thylstrup and Fejerskov Index, level 1–4) in Chiang Mai Province [25]. The finding of 54.3% preva-lence in this study was considered relatively high given the global context and especially when compared to the 5% prevalence in Chachoengsao Province which was only 150 km east of the current study site. The substantially lower prevalence in Chachoengsao Province could be related to the high proportion of 87.5% of children liv-ing in areas with water supplies containing fluoride less than 0.7 ppm. In this study, however, 89.6% of the chil-dren had household water sources with fluoride contents of ≥ 7 ppm. This large disparity of the prevalence in these two comparable settings in Thailand implied the crucial effect of endemic fluoride on dental fluorosis occurrence at the population level.
In addition, this plausible effect of natural fluoride in groundwater use for household consumption on the overall and severity-specific prevalence in this study was also comparable with the ones observed in Birigui, SP, Brazil. In that study with a socio-environmental setting and methods of exposure and outcome measurement resembled the current study; the overall prevalence was 58.9% and severity-specific prevalence values were 44.4%
Page 9 of 16Rojanaworarit et al. BMC Oral Health (2021) 21:545
Table 2 Univariable analysis of crude association between dental fluorosis and each explanatory variable
PR, Prevalence ratio† Row percentage is presented to comply with analysis of prevalence ratio‡ Univariable model estimated by Poisson regression with robust standard error* For each child, available measures of groundwater fluoride concentrations in drinking water sources supplying the child’s residence were time-averaged over the period of birth to the survey** Average family expenditure per month in 2015, Nakhon Pathom, Thailand§ Fluoride supplement was not further included in the multivariable model due to the collinearity problem
Variable Cases n (%)† Controls n (%)† Univariable model‡
PR 95% CI P-value
Total 132 157
Main exposure variable
Time-averaged fluoride concentration (ppm)*
< 0.7 7 (23.3) 23 (76.7) Reference
0.7–1.49 23 (37.7) 38 (62.3) 1.62 0.78, 3.34 0.195
≥ 1.5 127 (64.1) 71 (35.9) 2.75 1.42, 5.31 0.003
Other explanatory variables
Sex
Female 74 (54.4) 62 (45.6) Reference
Male 83 (54.3) 70 (45.7) 1.0 0.81, 1.23 0.978
Age (year)
< 8 48 (48.5) 51 (51.5) Reference
≥ 8 109 (57.4) 81 (42.6) 1.18 0.93, 1.50 0.165
Caregiver’s education
≥ Secondary school 28 (54.9) 23 (45.1) Reference
< Secondary school 84 (60.0) 56 (40.0) 1.09 0.82, 1.45 0.540
Sufficiency of family income per month [≥ 26,025 THB]**
Sufficient 6 (75.0) 2 (25.0) Reference
Insufficient 112 (58.0) 81 (42.0) 0.77 0.51, 1.18 0.230
Breastfeeding
Yes 107 (56.9) 81 (43.1) Reference
No 20 (83.3) 4 (16.7) 1.46 1.18, 1.82 0.001
Brushing frequency before 2 years old
No brushing 11 (50.0) 11 (50.0) Reference
Once a day 78 (65.0) 42 (35.0) 1.30 0.84, 2.02 0.241
≥ 2 times a day 39 (53.4) 34 (46.6) 1.07 0.67, 1.71 0.783
Brushing frequency at ≥ 2 years old
Once a day 35 (55.6) 28 (44.4) Reference
≥ 2 times a day 97 (60.2) 64 (39.8) 1.08 0.84, 1.40 0.532
Fluoride toothpaste use
No 8 (66.7) 4 (33.3) Reference
Yes 117 (58.8) 82 (41.2) 0.88 0.58, 1.34 0.555
Toothpaste size
Pea-sized 54 (50.5) 53 (49.5) Reference
> Pea-sized 74 (65.5) 39 (34.5) 1.30 1.03, 1.63 0.027
Fluoride supplement§
No 95 (59.4) 65 (40.6) Reference
Yes 33 (54.1) 28 (45.9) 0.91 0.70, 1.19 0.491
Page 10 of 16Rojanaworarit et al. BMC Oral Health (2021) 21:545
Tabl
e 3
Mul
tivar
iabl
e m
odel
s fo
r den
tal fl
uoro
sis
Vari
able
Mod
el 1
, cru
de m
odel
(u
nadj
uste
d)M
odel
2, a
djus
ted
for
child
’s de
mog
raph
ic
fact
ors
Mod
el 3
, adj
uste
d fo
r ca
regi
ver f
acto
rsM
odel
4, a
djus
ted
for
brea
stfe
edin
gM
odel
5, a
djus
ted
for o
ral
heal
th b
ehav
iors
Mod
el 6
, adj
uste
d fo
r all
cova
riat
es
PR
[95%
CI
]
P-va
lue
PR
[95%
CI
]
P-va
lue
PR
[95%
CI
]
P-va
lue
PR
[95%
CI
]
P-va
lue
PR
[95%
CI
]
P-va
lue
PR
[95%
CI
]
P-va
lue
Mai
n ex
posu
re v
aria
ble
Tim
e-av
erag
ed fl
uorid
e co
ncen
trat
ion
(ppm
)*
< 0
.7Re
fere
nce
Refe
renc
eRe
fere
nce
Refe
renc
eRe
fere
nce
Refe
renc
e
0.7
–1.4
91.
62
[0.7
8,
3.34
]
0.19
51.
62
[0.7
9,
3.32
]
0.19
01.
61
[0.2
8,
9.21
]
0.59
23.
08
[0.4
7,
20.0
4]
0.23
83.
44
[0.4
8,
24.6
2]
0.21
81.
64
[0.2
4,
11.2
4]
0.61
5
≥ 1
.52.
75
[1.4
2,
5.31
]
0.00
32.
78
[1.4
5,
5.32
]
0.00
22.
81
[0.5
1,
15.5
1]
0.23
55.
30
[0.8
4,
33.4
5]
0.07
66.
46
[0.9
4,
44.4
8]
0.05
82.
85
[0.4
4,
18.5
2]
0.27
3
Child
’s de
mog
raph
ic fa
ctor
s
Sex Fem
ale
Refe
renc
eRe
fere
nce
Mal
e1.
06
[0.8
6,
1.29
]
0.59
61.
07
[0.8
3,
1.37
]
0.61
5
Age
(yea
r)
< 8
Refe
renc
eRe
fere
nce
≥ 8
1.19
[0
.95,
1.
50]
0.12
51.
00
[0.7
5,
1.35
]
0.97
6
Care
give
r fac
tors
Care
give
r’s e
duca
tion
≥ S
econ
dary
sch
ool
Refe
renc
eRe
fere
nce
< S
econ
dary
sch
ool
1.25
[0
.92,
1.
69]
0.14
91.
24
[0.9
1,
1.69
]
0.17
8
Suffi
cien
cy o
f fam
ily in
com
e
Suffi
cien
tRe
fere
nce
Refe
renc
e
Insu
ffi-
cien
t0.
84
[0.5
5,
1.30
]
0.44
20.
81
[0.5
1,
1.29
]
0.37
8
Brea
stfe
edin
g fa
ctor
Brea
stfe
edin
g
Yes
Refe
renc
eRe
fere
nce
Page 11 of 16Rojanaworarit et al. BMC Oral Health (2021) 21:545
Tabl
e 3
(con
tinue
d)
Vari
able
Mod
el 1
, cru
de m
odel
(u
nadj
uste
d)M
odel
2, a
djus
ted
for
child
’s de
mog
raph
ic
fact
ors
Mod
el 3
, adj
uste
d fo
r ca
regi
ver f
acto
rsM
odel
4, a
djus
ted
for
brea
stfe
edin
gM
odel
5, a
djus
ted
for o
ral
heal
th b
ehav
iors
Mod
el 6
, adj
uste
d fo
r all
cova
riat
es
PR
[95%
CI
]
P-va
lue
PR
[95%
CI
]
P-va
lue
PR
[95%
CI
]
P-va
lue
PR
[95%
CI
]
P-va
lue
PR
[95%
CI
]
P-va
lue
PR
[95%
CI
]
P-va
lue
No
1.28
[1
.04,
1.
57]
0.01
91.
31
[0.9
7,
1.77
]
0.07
8
Ora
l hea
lth b
ehav
iors
Brus
hing
freq
uenc
y be
fore
2 y
ears
old
No
brus
h-in
gRe
fere
nce
Refe
renc
e
Onc
e a
day
1.29
[0
.80,
2.
08]
0.30
31.
24
[0.7
6,
2.03
]
0.39
7
≥ 2
tim
es
a da
y0.
94
[0.5
5,
1.59
]
0.80
50.
95
[0.5
5,
1.65
]
0.85
4
Brus
hing
freq
uenc
y at
≥ 2
yea
rs o
ld
Onc
e a
day
Refe
renc
eRe
fere
nce
≥ 2
tim
es
a da
y1.
18
[0.8
9,
1.56
]
0.25
31.
16
[0.8
3,
1.63
]
0.37
8
Fluo
ride
toot
hpas
te u
se
No
Refe
renc
eRe
fere
nce
Yes
1.06
[0
.68,
1.
65]
0.79
71.
23
[0.4
6,
3.28
]
0.68
5
Toot
hpas
te s
ize
Pea
-siz
edRe
fere
nce
Refe
renc
e
> P
ea-
size
d1.
20
[0.9
6,
1.50
]
0.10
81.
24
[0.9
4,
1.63
]
0.13
0
Mul
tivar
iabl
e m
odel
s w
ere
estim
ated
by
Pois
son
regr
essi
on w
ith ro
bust
sta
ndar
d er
rors
PR, P
reva
lenc
e ra
tio
*For
eac
h ch
ild, a
vaila
ble
mea
sure
s of
gro
undw
ater
fluo
ride
conc
entr
atio
ns in
drin
king
wat
er s
ourc
es s
uppl
ying
the
child
’s re
side
nce
wer
e tim
e-av
erag
ed o
ver t
he p
erio
d of
birt
h to
the
surv
ey
Page 12 of 16Rojanaworarit et al. BMC Oral Health (2021) 21:545
for very mild, 11.9% for mild, 2.4% for moderate, and 0.2% for severe dental fluorosis [37]. This evidence fur-ther demonstrated the quality of consistency in the effect of endemic fluoride on the prevalence of dental fluoro-sis which was observed in different groups of children, at different times, and in different places [48, 49].
The biological gradient between fluoride concentra-tions in groundwater used for household water supply and dental fluorosis occurrence in children was suggested by the unidirectional positive relationship of these attrib-utes in the current study. The finding of 23.3% prevalence with only the very mild dental fluorosis among children with time-averaged fluoride concentrations of < 0.7 ppm (the referent category) was evidence that reassured the safety of this recommended optimal fluoride level in this setting and the others [20, 37]. When the fluoride concentrations increased to the range of 0.7–1.49 ppm (index category 1), the prevalence among children in this group also increased to 37.7%, with the additional higher levels of mild and moderate severity. Although the fluoride concentrations in this range did not surpass the WHO’s recommended limit of 1.5 ppm [7], the results of this study were concerning as the prevalence exceeded one-third of the children and 14.7% of the severity was beyond the very mild level. In the extreme group with the fluoride ≥ 1.5 ppm (index category 2), the prevalence further rose to 64.1% or approximately 2.8 times the prevalence of those in the reference group. The severity beyond the very mild level also grew to 15.7%. This find-ing of the biological gradient suggested the rational use of fluoride concentrations in household water sources as an indicator for the possible occurrence of dental fluorosis and related severity.
Multivariable regression models constructed accord-ing to the DAGs, which displayed various assumptions regarding the main association between the time-average fluoride concentrations and dental fluorosis given a dif-ferent set of socio-behavioral determinants being simul-taneously considered in each model, provided insight into the etiologic pattern of dental fluorosis in this fluoride endemic setting (Table 3). When the measure of associa-tion between fluoride concentrations and dental fluorosis was compared before and after adjusting for the child’s demographic factors (sex and age) and caregiver’s factors (education and sufficiency of family income), the differ-ence was negligible, indicating the minimal confound-ing caused by these factors. Lack of association between child’s sex and dental fluorosis; indicated by crude PR of 1.0 in Table 2 and adjusted PRs of 1.06 (Model 2) and 1.07 (Model 6) in Table 3, would explain its trifling influence on the main association between fluoride concentrations and dental fluorosis. The insignificant difference in den-tal fluorosis occurrence between Thai male and female
children, aged 8–10 years old, and the lack of associa-tion between child’s sex and dental fluorosis-indicating by statistically non-significant crude and adjusted odds ratios of 1.2 and 0.9-were consistently observed in a pre-vious study [50]. Regarding the child’s age, several studies conducted in fluoride endemic areas have contrastively demonstrated a positive linear association between age and dental fluorosis prevalence [12]. The association in those studies might be attributable to the more diverse age categories ranging from 3 to 18 years of age among the study participants and the more visible dental fluo-rosis in children aged over 10 years old compared to the ones below the age of 8 [12]. Although children cared for by the caregivers with less than a secondary school edu-cation had a 5.1% higher prevalence of dental fluorosis, the negative association between lower caregiver’s edu-cation and higher dental fluorosis was not supported by the findings of crude and adjusted PRs close to 1 and sta-tistical non-significance. The prior investigation in chil-dren living in Bangkok consistently revealed that dental fluorosis prevalence among children having caregivers with education higher than bachelor’s degree was not sig-nificantly lower than the prevalence among those having caregivers with lower levels of education (odds ratio, 0.85; 95% CI, 0.54–1.33) [50]. The lack of association between caregiver’s education and child dental fluorosis might be attributable to the fact that knowledge regarding dental fluorosis and its prevention has never been included in general education in Thailand. This suggested the need for a community-based educational effort to improve literacy regarding dental fluorosis prevention among caregivers of children with developing dentition. In this study, insufficient family income was hypothesized to be associated with higher dental fluorosis prevalence due to an assumption that children in poorer families might be more likely to expose to fluoride in groundwater than their counterparts whose families might be able to afford alternative water sources for drinking such as bottled water. The results, however, did not support this hypoth-esis. This might be because all the 8 children from fami-lies with sufficient income had a household water supply with fluoride concentrations of ≥ 1.5 ppm. Another study in Bangkok unveiled a significant relationship between the higher class of family income and greater dental fluo-rosis prevalence (odds ratio, 1.77; 95% CI, 1.10–2.86) [50]. It was suggested that families with greater income might be more capable of purchasing fluoride products and the children in these families would be more likely to have increased exposure to fluoride [50, 51]. Therefore, the effect of family income on dental fluorosis may vary by different contexts of studies.
The association between fluoride concentrations and dental fluorosis was heightened after adjusting for the
Page 13 of 16Rojanaworarit et al. BMC Oral Health (2021) 21:545
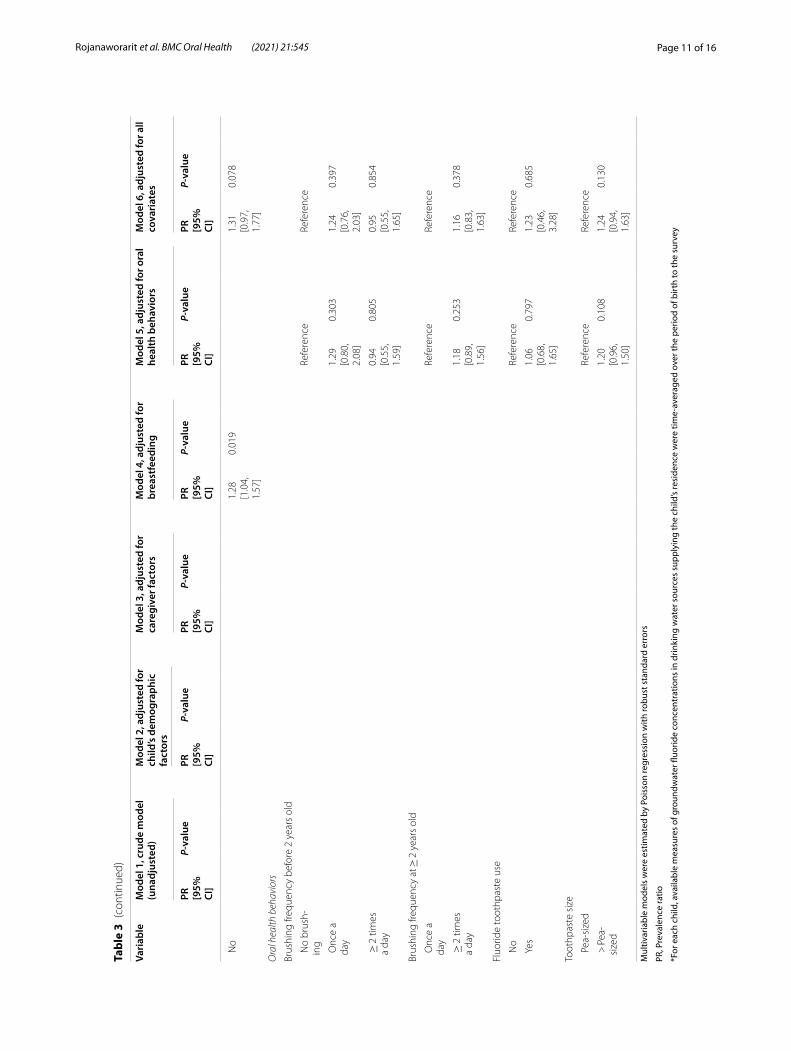
effect of breastfeeding and children’s oral health behav-iors (Table 3). The dental fluorosis PR comparing the fluoride concentrations of 0.7–1.49 ppm (index cat-egory 1) to < 0.7 ppm (the referent category) consider-ably increased from 1.62 (Model 1) to 3.08 (Model 4) and 3.44 (Model 5), indicating confounding magnitudes of − 47.4% by breastfeeding and − 52.9% by children’s oral health behaviors. The fluorosis PR comparing the con-centrations of ≥ 1.5 ppm (index category 2) to the refer-ent category also greatly increased from 2.75 (Model 1) to 5.30 (Model 4) and 6.46 (Model 5), showing confound-ing magnitudes of − 48.1% by breastfeeding and − 57.4% by children’s oral health behaviors. The large confound-ing magnitudes created by these factors highlighted their influential role in the etiologic mechanism of dental fluo-rosis in the fluoride-endemic environment, accentuating the need to consider these factors when measuring the exposure-outcome association between natural fluoride in water used for consumption and dental fluorosis in settings similar to the current ones. Regarding the role of breastfeeding, a prolonged period of breastfeeding has been demonstrated to protect against dental fluoro-sis [52–55]. Breast milk was shown to have only a trace amount of fluoride regardless of the quantity of fluoride consumed by mothers [56]. Breastfeeding during the first two years of life, which aligns with the active period of enamel formation, thus appears to prevent dental fluoro-sis [54]. In the current study, breastfeeding might reduce the exposure to fluoride through the use of water con-taining natural fluoride to prepare powdered formula. Concerning the role of children’s oral health behaviors, early toothbrushing before 2 years old was shown to be strongly associated with mild-to-moderate fluorosis [6]. This habit was also common in this study, having 89.8% of children brushing once a day or more. Fluoride expo-sure could be heightened in this context as this habit coincided with 94.3% of children using fluoride tooth-paste and 51.4% of children using more than pea-sized toothpaste amounts. Ingesting toothpaste during the period of developing enamel could lead to dental fluo-rosis [57] and this would explain the collective influence of children’s oral health behaviors on dental fluorosis in this setting. Ultimately, the main association between fluoride concentrations and dental fluorosis attenuated after taking full control of all covariates (Model 6), rul-ing out alternative explanations given information of all other covariates for the observed effect of higher classes of fluoride concentrations (index category 1 and 2) on increased dental fluorosis prevalence beyond the ones of the referent category. By comparing the prevalence ratios for both index categories of fluoride concentrations in Model 6 to Model 1, the adjusted estimates differed only slightly from their corresponding crude estimates
and the confounding magnitudes of − 1.2% and − 3.5% created by all covariates simultaneously considered in Model 6 were trivial. The limited confounding effect of all covariates allowed a conclusion to be drawn based on the crude estimates [58] that consumption of groundwa-ter containing natural fluoride concentrations beyond 0.7 ppm increased the prevalence of dental fluorosis, par-ticularly fluoride levels of 1.5 ppm or higher significantly increased the prevalence by 2.75 times compared to the ones of fluoride levels below 0.7 ppm.
DAGs have brought a new perspective on evaluating exposure-outcome associations by depicting plausible causal pathways that take into consideration the interplay of etiologic factors [17]. Unlike conventional univariable regression analysis, which evaluates the one-on-one sta-tistical association between each independent variable and an outcome to determine which explanatory varia-bles to be included in a multivariable model; DAGs depict the various roles of independent variables (i.e., main exposure, confounder, mediator) in the causal pathways that ease the selection of potential confounders and avoid adjusting for mediator variables [59]. Statistical adjust-ment by multivariable regression that adopts the list of significant explanatory variables from the aforemen-tioned univariable analysis could even produce a biased or over-adjusted estimate if collider or intermediate variable is controlled [60]. Furthermore, a multivariable model that controls the effect of all extraneous variables simultaneously would not allow the measurement of con-founding magnitude caused by each subset of extraneous variables, limiting knowledge of the relative influence of different extraneous variables on the association of inter-est. DAGs can serve as a conceptual framework for con-ducting multivariable analyses that sequentially include different sets of extraneous variables. This technique has been previously applied in dental research to elucidate a variation in etiologic patterns of early childhood caries [61, 62]. This study pioneered in applying the approach in dental fluorosis research and illustrating the need of tak-ing into account the substantial confounding influence of breastfeeding and children’s oral health behavior on the association between natural fluoride in groundwater and dental fluorosis in children.
This study was limited in the use of an external out-come assessor due to the lack of trained dentists work-ing at the local public health officials. To enable the oral examination by using a qualified dentist who served as a co-investigator of this study might also raise concern regarding bias in outcome assessment. Therefore, we val-idated the comparability of the dental fluorosis outcome in this study with previous records of routine dental fluo-rosis examinations in the same area that were archived at the provincial public health office. Recall bias might
Page 14 of 16Rojanaworarit et al. BMC Oral Health (2021) 21:545
also be another concern since this study traced the past exposure status until the birth of each child. Nonetheless, caregivers of children with different fluorosis outcomes would not have differential attempts to recall since the fluorosis examination results were not disclosed until the end of the data collection phase. Recall errors from not being able to recall would also be possible. However, the exposure variables being recalled were relatively persis-tent (i.e., caregiver’s education) or habitual (i.e., breast-feeding) which would ease valid recall.
The strength of this study primarily lied in its study participants who could reflect the population-level den-tal fluorosis problem and pave the path for public health initiatives needed to address the condition in future gen-erations of children in these fluoride endemic areas. The case–control study design along with the application of causal directed acyclic graphs not only allowed evalua-tion of the temporal association between natural fluoride in groundwater and dental fluorosis but also provided a plausible elucidation of the dental fluorosis’s etiologic pattern taken various socio-behavioral determinants into account. The evidence of high dental fluorosis prevalence necessitated multi-level public health initiatives to man-age the problem. Children who were affected by dental fluorosis in the forms of physical damage or apparent stain on dental enamel should be provided with access to public dental care. Public communication to inform and educate the residents, especially the families of children at the ages of developing dentition, about dental fluoro-sis and its prevention should be carried out by local pub-lic health officers and village health volunteers. Fluoride mapping based on the annual records of fluoride con-centrations in the groundwater used for household water supply should be utilized to identify water sources with ≥ 0.7 ppm fluoride which must be avoided for drinking and cooking. Engaging all community stakeholders to have shared accountability in developing a solution for safe water allocation to all residents should be imple-mented. School-based dental fluorosis surveillance should continue to monitor the situation of dental fluoro-sis and further provide information for pertinent public health actions.
ConclusionIn fluoride endemic areas, groundwater containing natu-ral fluoride utilized for household consumption resulted in high dental fluorosis prevalence, particularly in the groundwater with fluoride concentrations of ≥ 1.5 ppm.
AbbreviationsCI: Confidence interval; DAGs: Directed acyclic graphs; mg/L: Milligrams per liter; ppm: Parts per million; PR: Prevalence ratio; PRcrude: Crude prevalence ratio; PRadjusted: Adjusted prevalence ratio; WHO: World Health Organization.
Supplementary InformationThe online version contains supplementary material available at https:// doi. org/ 10. 1186/ s12903- 021- 01902-8.
Additional file 1. Interview questionnaire.
AcknowledgementsThis research study was initiated and supported by Nakhon Pathom Provincial Public Health Office. We acknowledge Mahidol University and Icahn School of Medicine at Mount Sinai for support during study protocol development. We acknowledge all school administrators, public health officers, and village health volunteers for collaboration and support during data collection. We are grateful to all participants–children and their caregivers–for their cooperation and contribution to this study.
Authors’ contributionsConceptualization: CR, AS, and PN; Methodology: CR, LC, NH, AS, PK and SW; Data collection: AS and PN; Data validation: CR, AS, and PN. Statistical analysis: CR; Writing: CR; Supervision: LC, NH, PK, and SW; Project administration: CR, AS, and PN; Funding acquisition: NH, PK and SW. All authors have read and agreed to the final version of the manuscript.
FundingThis research was funded by the Fogarty International Center of the National Institutes of Health under Award Number U2RTW010088. The funding body played no role in the design of the study and collection, analysis, and interpretation of data and in writing the manuscript. The content is solely the responsibility of the authors and does not necessarily represent the official views of the National Institutes of Health.
Availability of data and materialsThe datasets used and/or analysed during the current study are available from the corresponding author on reasonable request.
Declarations
Ethics approval and consent to participateEthical approval was obtained from the Human Research Ethics Committee, Department of Health, Ministry of Public Health, Thailand (Project No. 116). Permission of parents along with the consent of the children was obtained and the informed consent was documented by a signed and dated written consent.
Consent for publicationNot applicable.
Competing interestsThe authors declare that they have no competing interests.
Author details1 Department of Health Professions, School of Health Professions and Human Services, Hofstra University, Hempstead, NY, USA. 2 Department of Environmen-tal Medicine and Public Health, Icahn School of Medicine at Mount Sinai, New York, NY, USA. 3 Department of Epidemiology, Faculty of Public Health, Mahidol University, Bangkok, Thailand. 4 Nakhon Pathom Provincial Public Health Office, Nakhon Pathom, Thailand. 5 Department of Occupational Health and Safety, Faculty of Public Health, Mahidol University, Bangkok, Thailand. 6 Department of Public Health, University of Massachusetts Lowell, Lowell, MA, USA.
Received: 15 July 2021 Accepted: 12 October 2021
References 1. Curtis DC, Ortega F, Eckhart S, Monar J, Thompson P. Utilizing the caries
risk assessment model (caries management by risk assessment) in Ecua-dor. J Int Oral Health. 2018;10(6):287–92.
Page 15 of 16Rojanaworarit et al. BMC Oral Health (2021) 21:545
2. Bokhout B, Hofman FX, van Limbeek J, Prahl-Andersen B. A “sufficient cause” model for dental caries. J Epidemiol Biostat. 2000;5(3):203–8.
3. Ha DH, Spencer AJ, Moynihan P, Thomson WM, Do LG. Excess risk of dental caries from higher free sugars intake combined with low exposure to water fluoridation. J Dent Res. 2021;100:1243–50.
4. Gulis G, Fujino Y. Epidemiology, population health, and health impact assessment. J Epidemiol. 2015;25(3):179–80.
5. Hong L, Levy SM, Broffitt B, Warren JJ, Kanellis MJ, Wefel JS, Dawson DV. Timing of fluoride intake in relation to development of fluorosis on maxil-lary central incisors. Community Dent Oral Epidemiol. 2006;34:299–309.
6. Pendrys DG, Katz RV, Morse DE. Risk factors for enamel fluorosis in a nonfluoridated population. Am J Epidemiol. 1996;143(8):808–15.
7. Demelash H, Beyene A, Abebe Z, Melese A. Fluoride concentration in ground water and prevalence of dental fluorosis in Ethiopian Rift Valley: systematic review and meta-analysis. BMC Public Health. 2019;19(1):1298.
8. Chen H, Yan M, Yang X, Chen Z, Wang G, Schmidt-Vogt D, Xu Y, Xu J. Spatial distribution and temporal variation of high fluoride contents in groundwater and prevalence of fluorosis in humans in Yuanmou County Southwest China. J Hazard Mater. 2012;235–236:201–9.
9. Onipe T, Edokpayi JN, Odiyo JO. A review on the potential sources and health implications of fluoride in groundwater of Sub-Saharan Africa. J Environ Sci Health A Tox Hazard Subst Environ Eng. 2020;55(9):1078–93.
10. Alrawahi AH. New approaches to disease causation research based on the sufficient-component cause model. J Public Health Res. 2020;9(3):1726.
11. Parascandola M, Weed DL. Causation in epidemiology. J Epidemiol Com-munity Health. 2001;55(12):905–12.
12. Akuno MH, Nocella G, Milia EP, Gutierrez L. Factors influencing the relationship between fluoride in drinking water and dental fluoro-sis: a ten-year systematic review and meta-analysis. J Water Health. 2019;17(6):845–62.
13. Pérez-Pérez N, Irigoyen-Camacho ME, Boges-Yañez AS. Factors affecting dental fluorosis in low socioeconomic status children in Mexico. Com-munity Dent Health. 2017;34(2):66–71.
14. Mascarenhas AK, Burt BA. Fluorosis risk from early exposure to fluoride toothpaste. Community Dent Oral Epidemiol. 1998;26(4):241–8.
15. Zohoori FV, Whaley G, Moynihan PJ, Maguire A. Fluoride intake of infants living in non-fluoridated and fluoridated areas. Br Dent J. 2014;216(2):E3.
16. Parascandola M. Causes, risks, and probabilities: probabilistic con-cepts of causation in chronic disease epidemiology. Prev Med. 2011;53(4–5):232–4.
17. Akinkugbe AA, Sharma S, Ohrbach R, Slade GD, Poole C. Directed acyclic graphs for oral disease research. J Dent Res. 2016;95(8):853–9.
18. Suttorp MM, Siegerink B, Jager KJ, Zoccali C, Dekker FW. Graphical presen-tation of confounding in directed acyclic graphs. Nephrol Dial Transpl. 2015;30(9):1418–23.
19. Banerjee A. Groundwater fluoride contamination: a reappraisal. Geosci Front. 2015;6:277–84.
20. Danpipat N. Fluoride in drinking water and dental fluorosis in panomsara-kham district, chachoengsao province; problem solved by community participation. J Health Syst Res. 2007;1(2):19–27.
21. Chuah CJ, Lye HR, Ziegler AD, Wood SH, Kongpun C, Rajchagool S. Fluo-ride: a naturally-occurring health hazard in drinking-water resources of Northern Thailand. Sci Total Environ. 2016;545–546:266–79.
22. Public US. Health service recommendation for fluoride concentration in drinking water for the prevention of dental caries. Public Health Rep. 2015;130(4):318–31.
23. Bhagavatula P, Levy SM, Broffitt B, Weber-Gasparoni K, Warren JJ. Timing of fluoride intake and dental fluorosis on late-erupting permanent teeth. Community Dent Oral Epidemiol. 2016;44:32–45.
24. Shahroom NSB, Mani G, Ramakrishnan M. Interventions in management of dental fluorosis, an endemic disease: a systematic review. J Family Med Prim Care. 2019;8(10):3108–13.
25. McGrady MG, Ellwood RP, Srisilapanan P, Korwanich N, Worthington HV, Pretty IA. Dental fluorosis in populations from Chiang Mai, Thailand with different fluoride exposures—paper 1: assessing fluorosis risk, predictors of fluorosis and the potential role of food preparation. BMC Oral Health. 2012;12:16.
26. Reintjes R, Pohle M, Vieth U, Lyytikainen O, Timm H, Schreier E, Petersen L. Community-wide outbreak of enteroviral illness caused by echovirus
30: a cross-sectional survey and a case-control study. Pediatr Infect Dis J. 1999;18(2):104–8.
27. Jarvis HG, Heslop P, Kisima J, Gray WK, Ndossi G, Maguire A, Walker RW. Prevalence and aetiology of juvenile skeletal fluorosis in the south-west of the Hai district, Tanzania–a community-based prevalence and case-control study. Trop Med Int Health. 2013;18(2):222–9.
28. Odenwald M, Neuner F, Schauer M, Elbert T, Catani C, Lingenfelder B, Hinkel H, Häfner H, Rockstroh B. Khat use as risk factor for psychotic disorders: a cross-sectional and case-control study in Somalia. BMC Med. 2005;3:5.
29. Daniel WW. Biostatistics: a foundation for analysis in the health sciences. 7th ed. New York: Wiley; 1999.
30. Naing L, Winn T, Rusli BN. Practical issues in calculating the sample size for prevalence studies. Arch Orofac Sci. 2006;1:9–14.
31. Osuji OO, Leake JL, Chipman ML, Nikiforuk G, Locker D, Levine N. Risk factors for dental fluorosis in a fluoridated community. J Dent Res. 1988;67(12):1488–92.
32. Dental Health Division. The 7th National Oral Health Survey 2012, Bangkok, Thailand. Nonthaburi: Department of Health, Ministry of Public Health; 2012.
33. Petersen PE, Baez RJ. Oral health surveys: basic methods. 5th ed. Geneva: World Health Organization; 2013.
34. Rozier RG. Epidemiologic indices for measuring the clinical mani-festations of dental fluorosis: overview and critique. Adv Dent Res. 1994;8(1):39–55.
35. Shaghaghian S, Zeraatkar M. Factors affecting oral hygiene and tooth brushing in preschool children, Shiraz/Iran. J Dent Biomater. 2017;4(2):394–402.
36. Pullishery F, Panchmal GS, Shenoy R. Parental attitudes and tooth brushing habits in preschool children in Mangalore, Karnataka: a cross-sectional study. Int J Clin Pediatr Dent. 2013;6(3):156–60.
37. Moimaz SAS, Saliba O, Marques LB, Garbin CAS, Saliba N. Dental fluorosis and its influence on children’s life. Braz Oral Res. 2015;29(1):1–7.
38. Armitage P, Berry G. Statistical methods in medical research. Oxford: Blackwell Scientific Publications; 1994.
39. Cuzick J. A Wilcoxon-type test for trend. Stat Med. 1985;4(1):87–90. 40. Rojanaworarit C, Wong JJ. Investigating the source of a disease outbreak
based on risk estimation: a simulation study comparing risk estimates obtained from logistic and poisson regression applied to a dichotomous outcome. Ochsner J. 2019;19(3):220–6.
41. Greenland S. Model-based estimation of relative risks and other epide-miologic measures in studies of common outcomes and in case-control studies. Am J Epidemiol. 2004;160(4):301–5.
42. Cook TD. Advanced statistics: up with odds ratios! A case for odds ratios when outcomes are common. Acad Emerg Med. 2002;9(12):1430–4.
43. Kim JH. Multicollinearity and misleading statistical results. Korean J Anes-thesiol. 2019;72(6):558–69.
44. García-Pérez A, Pérez-Pérez NG, Flores-Rojas AI, Barrera-Ortega CC, González-Aragón Pineda AE, Villanueva GT. Marginalization and fluorosis its relationship with dental caries in rural children in Mexico: a cross-sectional study. Community Dent Health. 2020;37(3):216–22.
45. Zhu C, Bai G, Liu X, Li Y. Screening high-fluoride and high-arsenic drinking waters and surveying endemic fluorosis and arsenism in Shaanxi prov-ince in western China. Water Res. 2006;40(16):3015–22.
46. Chandrashekar J, Anuradha KP. Prevalence of dental fluorosis in rural areas of Davangere, India. Int Dent J. 2004;54(5):235–9.
47. Budipramana ES, Hapsoro A, Irmawati ES, Kuntari S. Dental fluorosis and caries prevalence in the fluorosis endemic area of Asembagus. Indonesia Int J Paediatr Dent. 2002;12(6):415–22.
48. Cox LA Jr. Modernizing the Bradford Hill criteria for assessing causal relationships in observational data. Crit Rev Toxicol. 2018;48(8):682–712.
49. Schünemann H, Hill S, Guyatt G, Akl EA, Ahmed F. The GRADE approach and Bradford Hill’s criteria for causation. J Epidemiol Community Health. 2011;65(5):392–5.
50. Nakornchai S, Hopattaraput P, Vichayanrat T. Prevalence, severity and factors associated with dental fluorosis among children aged 8–10 years in Bangkok, Thailand. Southeast Asian J Trop Med Public Health. 2016;47(5):1105–11.
51. Sami E, Vichayanrat T, Satitvipawee P. Dental fluorosis and its relation to socioeconomic status, parent’s knowledge and awareness among
Page 16 of 16Rojanaworarit et al. BMC Oral Health (2021) 21:545
• fast, convenient online submission
•
thorough peer review by experienced researchers in your field
• rapid publication on acceptance
• support for research data, including large and complex data types
•
gold Open Access which fosters wider collaboration and increased citations
maximum visibility for your research: over 100M website views per year •
At BMC, research is always in progress.
Learn more biomedcentral.com/submissions
Ready to submit your researchReady to submit your research ? Choose BMC and benefit from: ? Choose BMC and benefit from:
12-year-old schoolchildren in Quetta, Pakistan. Southeast Asian J Trop Med Public Health. 2015;46(2):360–8.
52. Brothwell DJ, Limeback H. Fluorosis risk in grade 2 students residing in a rural area with widely varying natural fluoride. Community Dent Oral Epidemiol. 1999;27(2):130–6.
53. Brothwell D, Limeback H. Breastfeeding is protective against dental fluorosis in a nonfluoridated rural area of Ontario, Canada. J Hum Lact. 2003;19(4):386–90.
54. Wondwossen F, Astrøm AN, Bjorvatn K, Bårdsen A. Sociodemographic and behavioral correlates of severe dental fluorosis. Int J Paediatr Dent. 2006;16(2):95–103.
55. Teixeira AK, de Menezes LMB, Dias AA, de Alencar CHM, de Almeida MEL. Analysis of protection or risk factors for dental fluorosis in 6 to 8 year-old children in Fortaleza. Brazil Rev Panam Salud Publica. 2010;28(6):421–8.
56. Ekstrand J, Spak CJ, Falch J, Afseth J, Ulvestad H. Distribution of fluoride to human breast milk following intake of high doses of fluoride. Caries Res. 1984;18(1):93–5.
57. American Dental Association Council on Scientific Affairs. Fluoride tooth-paste use for young children. J Am Dent Assoc. 2014;145(2):190–1.
58. Skelly AC, Dettori JR, Brodt ED. Assessing bias: the importance of consid-ering confounding. Evid Based Spine Care J. 2012;3(1):9–12.
59. Merchant AT, Pitiphat W. Directed acyclic graphs (DAGs): an aid to assess confounding in dental research. Community Dent Oral Epidemiol. 2002;30(6):399–404.
60. Janszky I, Ahlbom A, Svensson AC. The Janus face of statistical adjust-ment: confounders versus colliders. Eur J Epidemiol. 2010;25(6):361–3.
61. Birungi N, Fadnes LT, Kasangaki A, Nankabirwa V, Okullo I, Lie SA, Tumwine JK, Åstrøm AN. PROMISE-EBF study group. Assessing causal effects of early life-course factors on early childhood caries in 5-year-old Ugandan children using directed acyclic graphs (DAGs): A prospective cohort study. Community Dent Oral Epidemiol. 2017;45(6):512–21.
62. Hariyani N, Do LG, Spencer AJ, Thomson WM, Scott JA, Ha DH. Maternal caries experience influences offspring’s early childhood caries-a birth cohort study. Community Dent Oral Epidemiol. 2020;48(6):561–9.
Publisher’s NoteSpringer Nature remains neutral with regard to jurisdictional claims in pub-lished maps and institutional affiliations.