a case study on the changing pattern of wetlands in west bengal and its possible impacts on...
TRANSCRIPT
129
Workshop on "Sustainable development and management of ground water in West Bengal and
future of irrigation vis-a-vis arsenic contamination in ground water” Central Ground Water Authority & Central Ground Water Board
Eastern Region, Kolkata-700 091 19th February 2013
A CASE STUDY ON THE CHANGING PATTERN OF WETLANDS IN WEST
BENGAL AND ITS POSSIBLE IMPACTS ON GROUNDWATER RESOURCES
Sayan Sinha, Lipi Kundu Basu, Anindya Halder* and Tapan Chakraborty
Geological Studies Unit, Indian statistical Institute, Kolkata-700108
INTRODUCTION
Water is the most valuable natural resource and is indispensable for all economic and social
development. However, with ever increasing population, industrial growth, water pollution and
atmospheric changes, the water availability per capita is shrinking day by day. Growing water
scarcity and increasing water demands are expected to reduce diversion of water for agriculture in the
future. Efforts are needed to utilize the available limited water resources efficiently. Water resources
not only provides water for irrigation but also provide water for a range of other productive uses such
as home gardens, livestock, fishing and aquatic products, and micro enterprises such as brick making.
In the lower gangetic plain of West Bengal, wetlands are used as multiple systems and have
significant impacts on livelihoods of the local people through the most important benefit arising from
fisheries as well as wetland cultivation and jute retting. We know that wetlands are the one of most
important natural source of water and it maintains the food chain, ecological balance and absorb
pollution. Wetlands are known to play important role in ground water recharge, flood control,
reduction of soil erosion and detoxifying surface water from many of its toxic and metal ion
concentration (Greb et al., 2006)But the wetlands are threatened by the continuous expansion of the
urbanization.
ROLE OF GROUND WATER IN WETLANDS:
Groundwater hydrology is fundamentally important to wetland science. The absence of groundwater
beneath a wetland, may prevent the build-up of saturated conditions at the surface and groundwater
inflow in many wetlands, and is a critical component of their budget. For most wetlands, the temporal
pattern of drainage to and from groundwater storage provides a key control on the water table regime.
Where upward groundwater flow occurs, water table can be maintains close to the wetland surface
even in times of droughts. In contrast, in the absence of groundwater flow, rapid water table draw
down can occur if precipitations fall during times of high evapotranspiration. Alternatively, a reduced
flux of water, comprising groundwater recharge from a wetland, can produce a rapid or sustained
water table fall. Ground water also tends to be chemically distinct from surface waters with higher
concentrations of many elements, particularly K+
and Ca2+, and lower concentration of phosphate in
comparison with other water sources (Wassen et al. 1990). Ground water fed wetlands therefore tend
to be more nutrient rich than those fed by solely surface water and may enable ground water fed
wetlands to support distinctive vegetation communities characterized by higher biomass and plant
height, in comparison with adjacent areas that do not receive ground water inflow.

130
Fig.1 A schematic diagram illustrating the role of ground water storage and fluxes in the hydrology
of wetlands.
Ground fed wetlands may also be vulnerable to pollution where ground water receives recharge from
urban or intensively farmed areas. In urban areas, these pollutants can consist of heavy metal,
hydrocarbons and de-icing salts.
In this backdrop, we investigated the status of surface wetlands in West Bengal. Our investigation
was concentrated in the peri-urban areas of situated in the floodplains of Hoogly and the interfluves
regions between Damodor and Hoogly. We present here the preliminary findings of this
investigation.
WETLANDS IN HOOGLY-DAMODAR INTERFLUVE
LOCATION
SRTM section across in the area between the Damodar-Darakeswar River in the west and Hoogly
River in the east is a topographically low-lying area with depressions up to 13 m deep. The area
dominantly comprises of interfluves channels (like Saraswati R., now completely covered up by
anthropogenic activity), levees of the main channels and large bodies of permanently waterlogged
marshes. The bottom of the depressed areas lies close to the mean sea level or very close to the water
level in the Hoogly River. In the field the 2.5 m thick dug sections near Dankuni Railway Station
(22°40’06.06”N 88°17’49.74” E) show multiple layers of grey hydromorphic soils and peat layers
alternating with silty fine sand indicating long standing position of these areas close to water table.
131
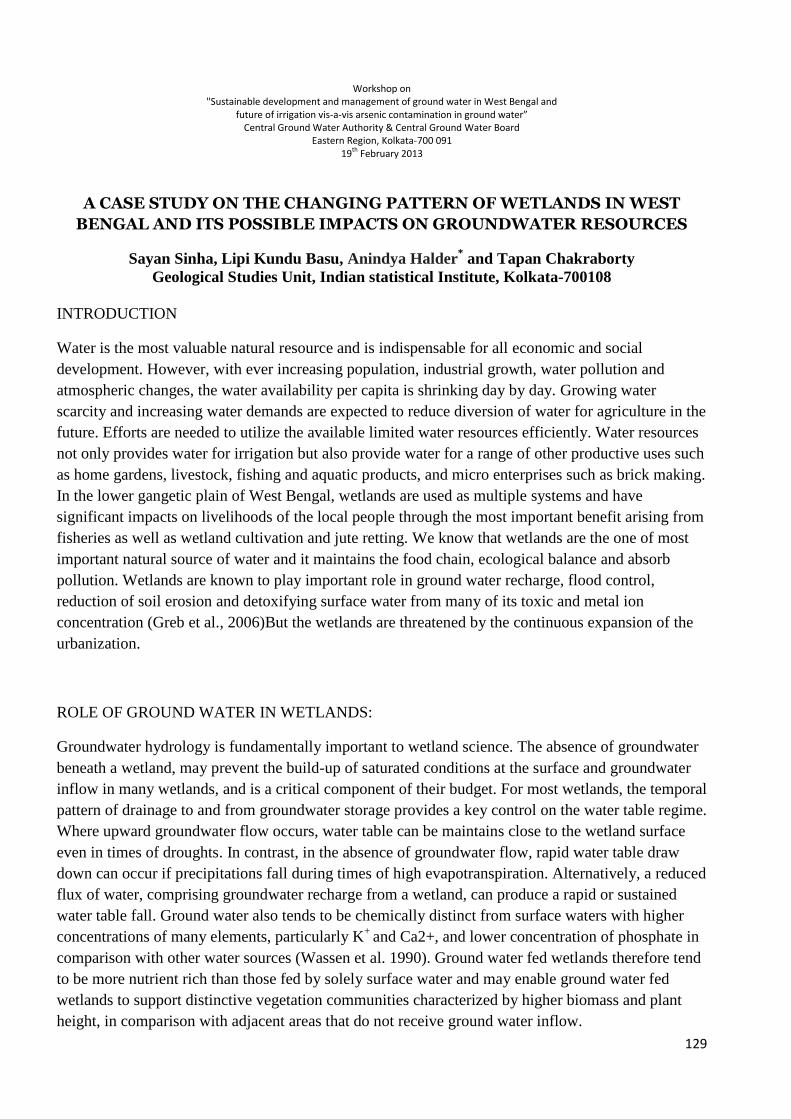
Silty sand layers probably denote periodic records of flood from flanking interfluve channels. Based
on micro-topographic analysis, shallow boreholes, resistivity logs Geological Survey of India has
also reported thick units of carbonaceous mud, coaly layers, peats and extensive wetlands in
Dankuni-Hindmotor area (unpublished report GSI, 1973, 2000).
Fig.2 A SRTM DEM visualization of the study area. A section through the study area shows a
depressed area that forms large wetland bodies. Note the cross section of the Hoogly River and the
base of the wetland are in the same level.
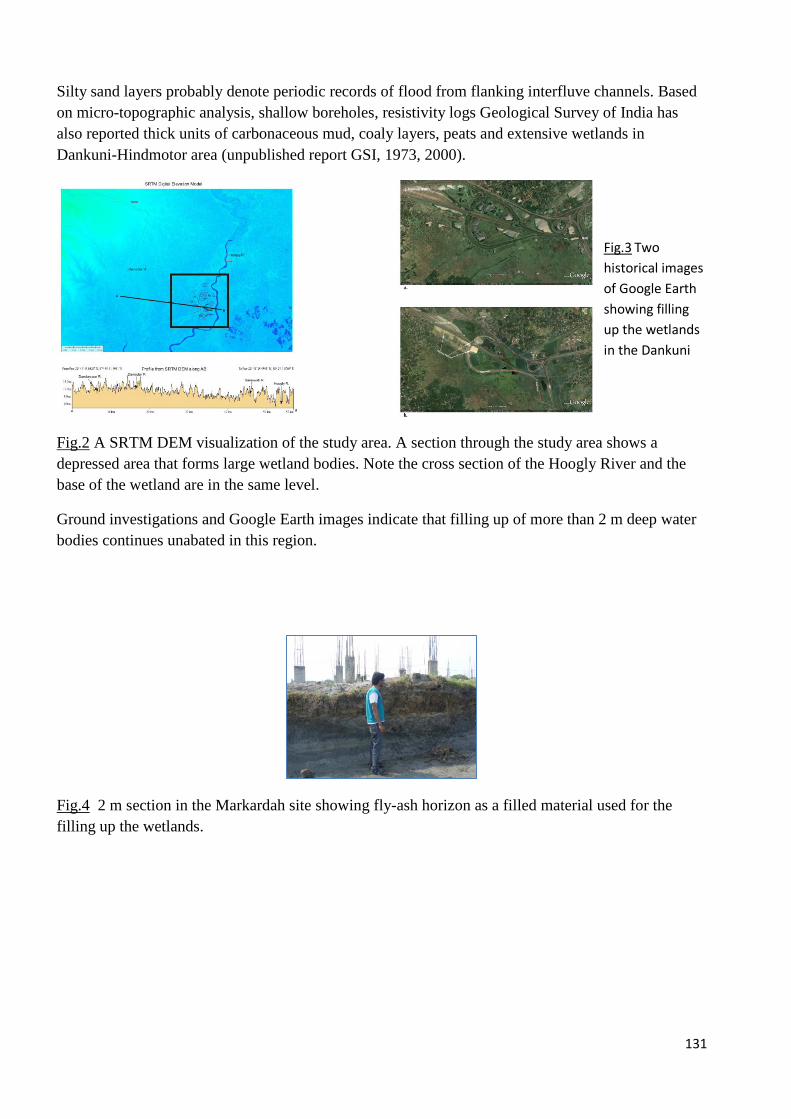
Ground investigations and Google Earth images indicate that filling up of more than 2 m deep water
bodies continues unabated in this region.
Fig.4 2 m section in the Markardah site showing fly-ash horizon as a filled material used for the
filling up the wetlands.
Fig.3 Two
historical images
of Google Earth
showing filling
up the wetlands
in the Dankuni
area.
132
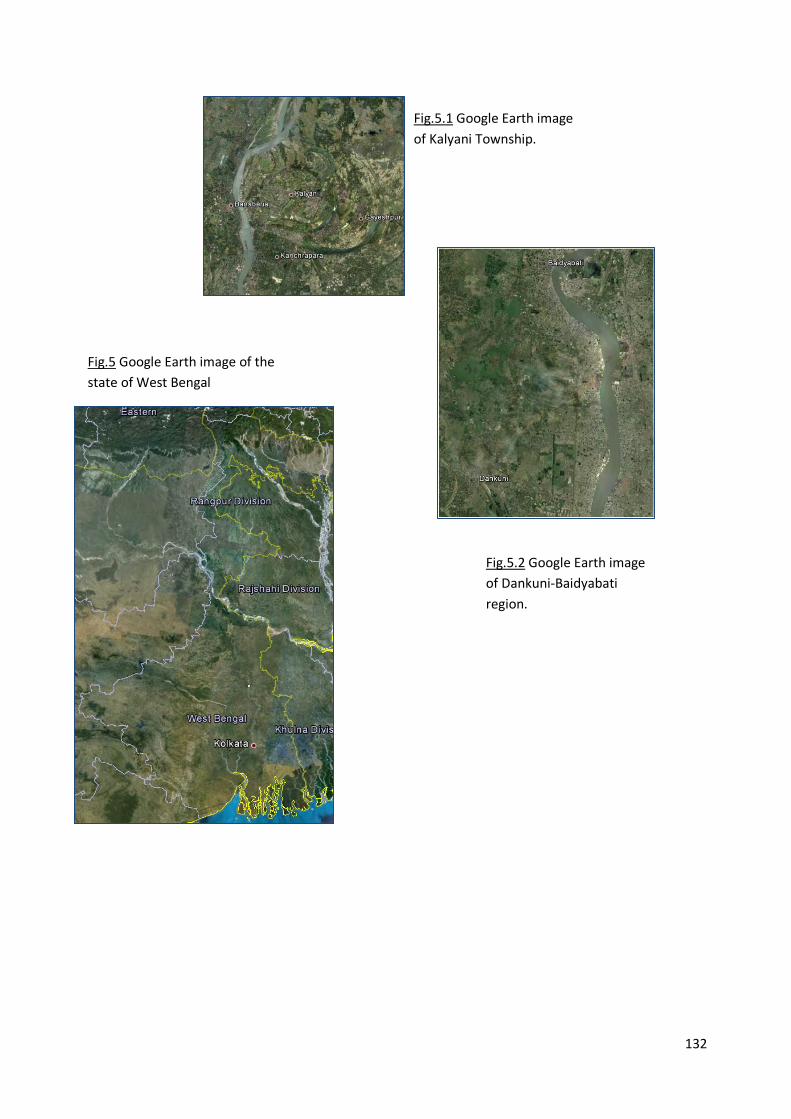
Fig.5.1 Google Earth image
of Kalyani Township.
Fig.5 Google Earth image of the
state of West Bengal
Fig.5.2 Google Earth image
of Dankuni-Baidyabati
region.
133
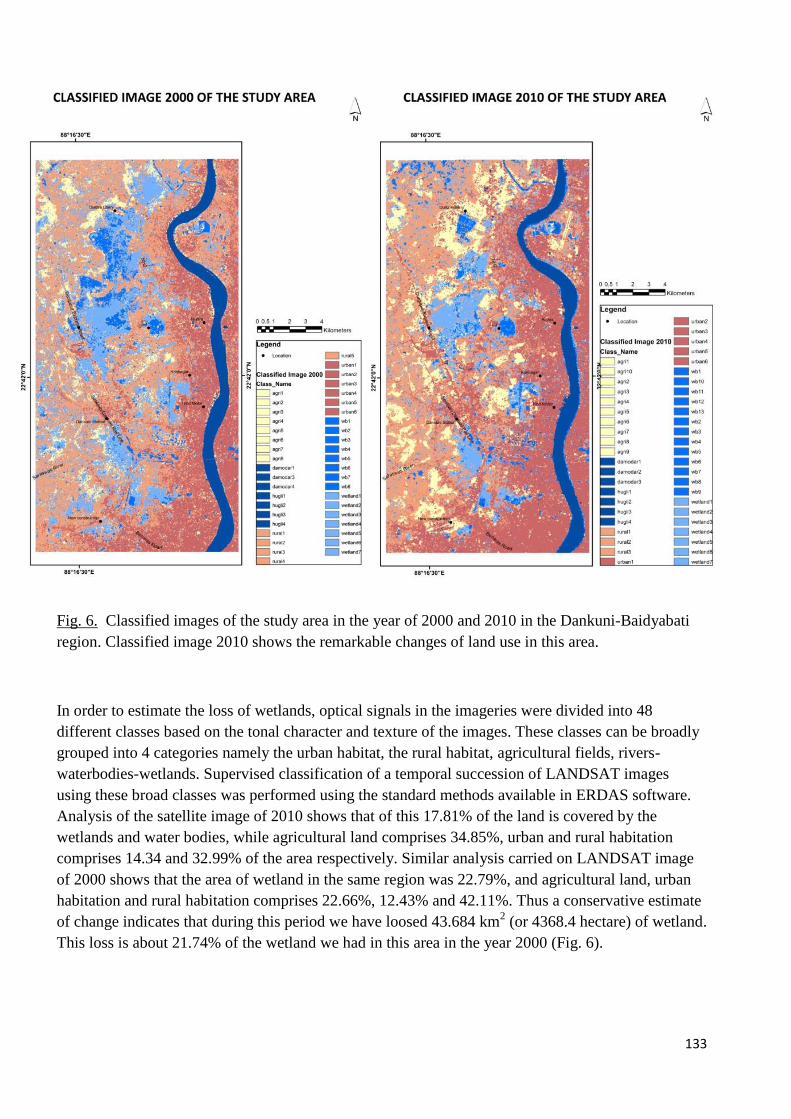
Fig. 6. Classified images of the study area in the year of 2000 and 2010 in the Dankuni-Baidyabati
region. Classified image 2010 shows the remarkable changes of land use in this area.
In order to estimate the loss of wetlands, optical signals in the imageries were divided into 48
different classes based on the tonal character and texture of the images. These classes can be broadly
grouped into 4 categories namely the urban habitat, the rural habitat, agricultural fields, rivers-
waterbodies-wetlands. Supervised classification of a temporal succession of LANDSAT images
using these broad classes was performed using the standard methods available in ERDAS software.
Analysis of the satellite image of 2010 shows that of this 17.81% of the land is covered by the
wetlands and water bodies, while agricultural land comprises 34.85%, urban and rural habitation
comprises 14.34 and 32.99% of the area respectively. Similar analysis carried on LANDSAT image
of 2000 shows that the area of wetland in the same region was 22.79%, and agricultural land, urban
habitation and rural habitation comprises 22.66%, 12.43% and 42.11%. Thus a conservative estimate
of change indicates that during this period we have loosed 43.684 km2 (or 4368.4 hectare) of wetland.
This loss is about 21.74% of the wetland we had in this area in the year 2000 (Fig. 6).
134
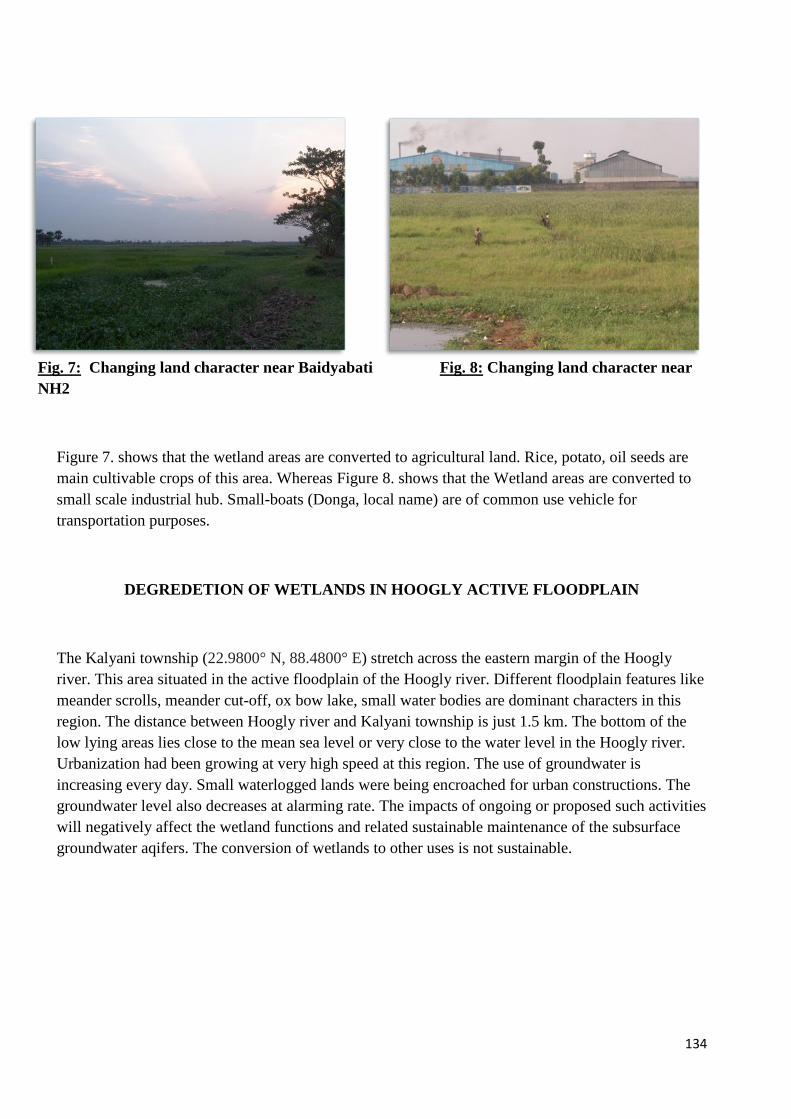
Fig. 7: Changing land character near Baidyabati Fig. 8: Changing land character near
NH2
Figure 7. shows that the wetland areas are converted to agricultural land. Rice, potato, oil seeds are
main cultivable crops of this area. Whereas Figure 8. shows that the Wetland areas are converted to
small scale industrial hub. Small-boats (Donga, local name) are of common use vehicle for
transportation purposes.
DEGREDETION OF WETLANDS IN HOOGLY ACTIVE FLOODPLAIN
The Kalyani township (22.9800° N, 88.4800° E) stretch across the eastern margin of the Hoogly
river. This area situated in the active floodplain of the Hoogly river. Different floodplain features like
meander scrolls, meander cut-off, ox bow lake, small water bodies are dominant characters in this
region. The distance between Hoogly river and Kalyani township is just 1.5 km. The bottom of the
low lying areas lies close to the mean sea level or very close to the water level in the Hoogly river.
Urbanization had been growing at very high speed at this region. The use of groundwater is
increasing every day. Small waterlogged lands were being encroached for urban constructions. The
groundwater level also decreases at alarming rate. The impacts of ongoing or proposed such activities
will negatively affect the wetland functions and related sustainable maintenance of the subsurface
groundwater aqifers. The conversion of wetlands to other uses is not sustainable.
135
-
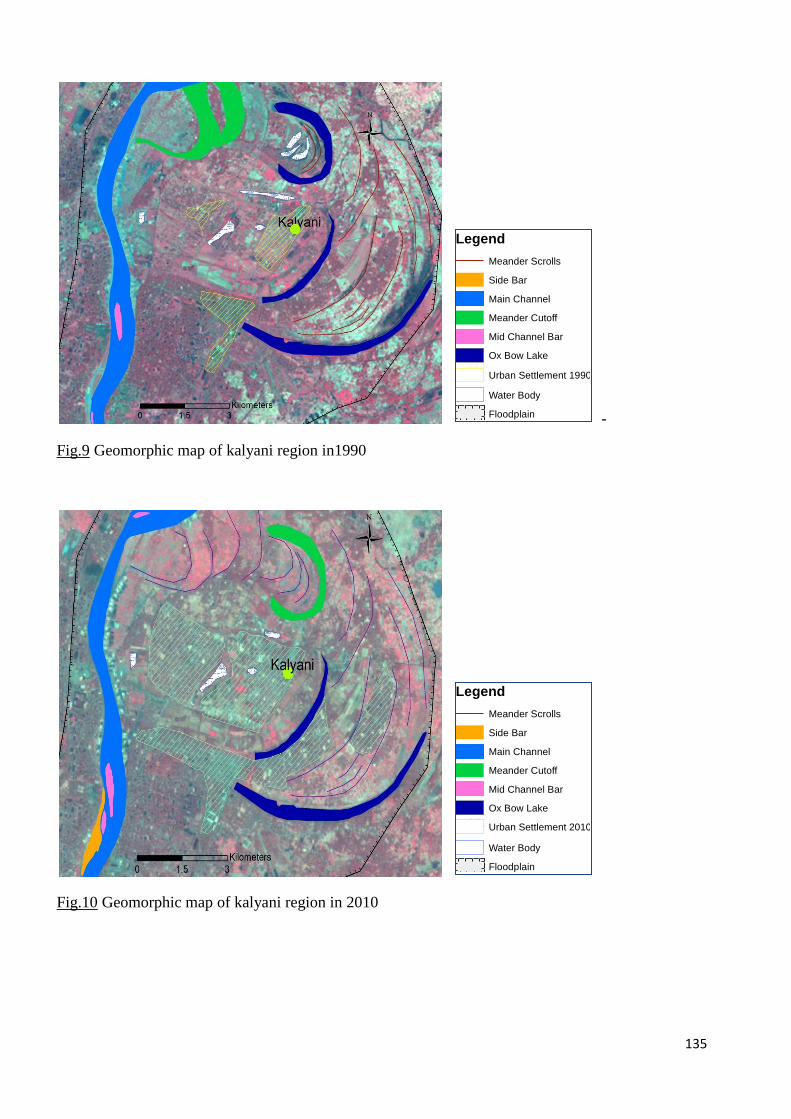
Fig.9 Geomorphic map of kalyani region in1990
Fig.10 Geomorphic map of kalyani region in 2010
Urban Settlement 1990
Legend
Side Bar
Main Channel
Meander Cutoff
Mid Channel Bar
Ox Bow Lake
Water Body
Floodplain
Meander Scrolls
Legend
Side Bar
Main Channel
Meander Cutoff
Mid Channel Bar
Ox Bow Lake
Urban Settlement 2010
Water Body
Floodplain
Meander Scrolls
136
In the year 1990 kalyani township contained only 4.22 sq. km. area approximately. Whereas 2010 the
town ship comprehend 17.69 sq. km approximately. Between these twenty years 13.47 sq. km. area
added to the township.
We are trying to develop a new methodology borrowing the idea of pattern recognition for detection
of changes in the the landform in this area. The tentative idea is discuss below….
PROPOSED CHANGE DETECTION APPROACH:
Let X1 and X2 be two co-registered multispectral remotely sensed images of size P×Q acquired on the
same geographical area at different times t1 and t2. Let B be the number of spectral channels of each
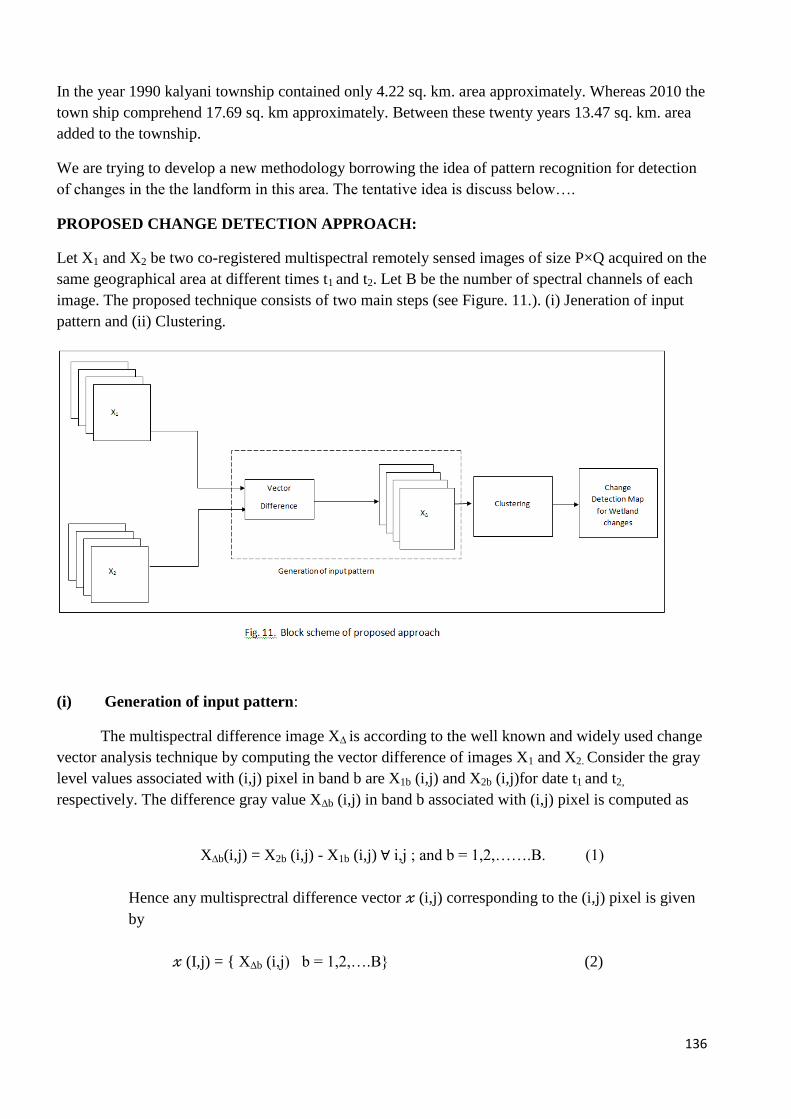
image. The proposed technique consists of two main steps (see Figure. 11.). (i) Jeneration of input
pattern and (ii) Clustering.
(i) Generation of input pattern:
The multispectral difference image X∆ is according to the well known and widely used change
vector analysis technique by computing the vector difference of images X1 and X2. Consider the gray
level values associated with (i,j) pixel in band b are X1b (i,j) and X2b (i,j)for date t1 and t2,
respectively. The difference gray value X∆b (i,j) in band b associated with (i,j) pixel is computed as
X∆b(i,j) = X2b (i,j) - X1b (i,j) i,j ; and b = 1,2,…….B. (1)
Hence any multisprectral difference vector (i,j) corresponding to the (i,j) pixel is given
by
(I,j) = { X∆b (i,j) b = 1,2,….B} (2)
137
will be considered a pattern for the clustering step.
(ii) Clustering:
From the previous step we got the multispectral difference vector X, i, j, corresponding
to the each pixel (i,j) and this set of multispectral difference vector will constitute set of
patterns for the clustering step. Here appropriate clustering technique will be followed to
jenerate two clusters. (a) corresponding to change class (wetland changes) and (b)
cooresponding to unchanged class (no wetland change).
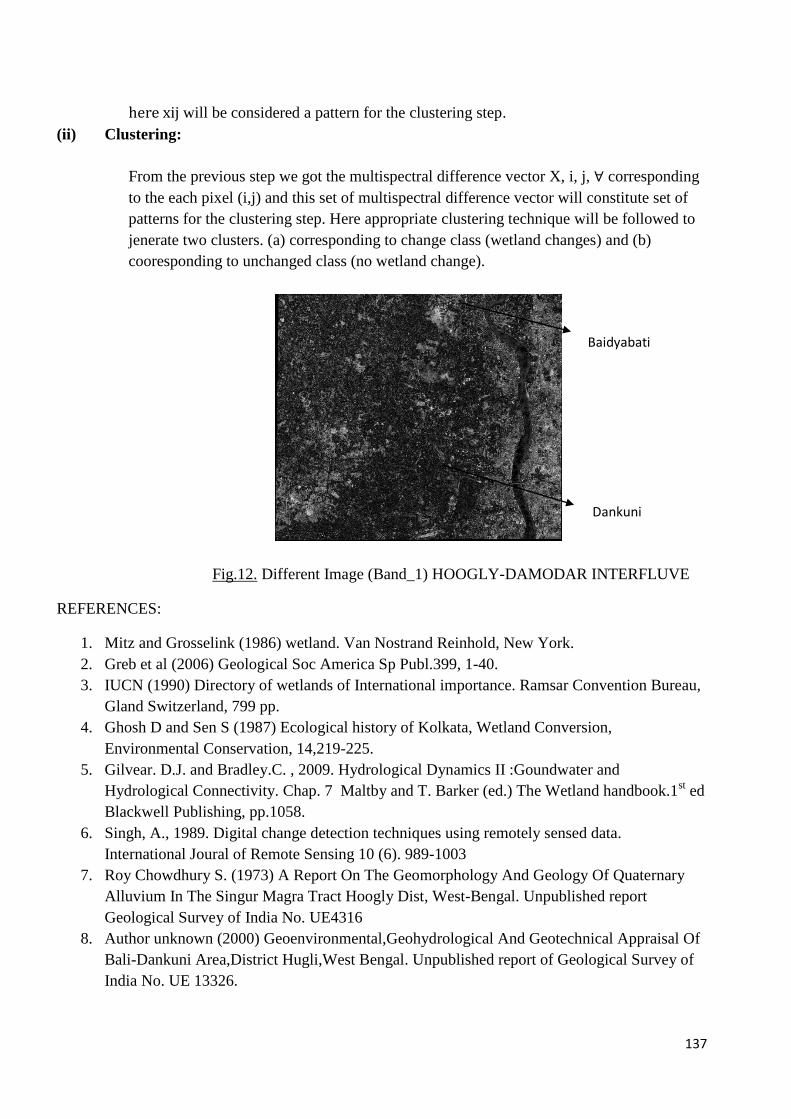
Fig.12. Different Image (Band_1) HOOGLY-DAMODAR INTERFLUVE
REFERENCES:
1. Mitz and Grosselink (1986) wetland. Van Nostrand Reinhold, New York.
2. Greb et al (2006) Geological Soc America Sp Publ.399, 1-40.
3. IUCN (1990) Directory of wetlands of International importance. Ramsar Convention Bureau,
Gland Switzerland, 799 pp.
4. Ghosh D and Sen S (1987) Ecological history of Kolkata, Wetland Conversion,
Environmental Conservation, 14,219-225.
5. Gilvear. D.J. and Bradley.C. , 2009. Hydrological Dynamics II :Goundwater and
Hydrological Connectivity. Chap. 7 Maltby and T. Barker (ed.) The Wetland handbook.1st ed
Blackwell Publishing, pp.1058.
6. Singh, A., 1989. Digital change detection techniques using remotely sensed data.
International Joural of Remote Sensing 10 (6). 989-1003
7. Roy Chowdhury S. (1973) A Report On The Geomorphology And Geology Of Quaternary
Alluvium In The Singur Magra Tract Hoogly Dist, West-Bengal. Unpublished report
Geological Survey of India No. UE4316
8. Author unknown (2000) Geoenvironmental,Geohydrological And Geotechnical Appraisal Of
Bali-Dankuni Area,District Hugli,West Bengal. Unpublished report of Geological Survey of
India No. UE 13326.
Baidyabati
Dankuni

138