journal of fluid science and technology - j-stage
TRANSCRIPT
Journal of Fluid Science and
Technology
Vol. 6, No. 6, 2011
932
Numerical Analysis of Air Flow in Dichotomous Respiratory Channel with Asymmetric Compliance under HFOV Condition*
Hiroyuki HIRAHARA**, Katsuya IWAZAKI***, Mahtab Uddin AHMMED*** and Masanori NAKAMURA**
**Division of Human Support and Production Sciences, Saitama University Shimo-Okubo-255, Sakura, Saitama, 338-8570, Japan
E-mail: [email protected] ***Graduate School of Science and Engineering, Saitama University,
Abstract Gas flow in high frequency oscillatory ventilation (HFOV) was numerically investigated. This artificial respiration technique has features of low tidal volume and high frequency. Although molecular diffusion appears to be influential in gas transports at lower airways, the effect of flow convection never vanishes. The present paper is aimed to discuss the contribution of flow convection to gas transports in such lower airways and obtain physical understandings of old air evacuation in the lower airways. For calculating flow in the lower region airway, boundary conditions based on compliance and resistance of airways were introduced. The obtained air flows appeared to be laminar and reversible. However, particle trackings revealed that the pathlines deviated slightly from one respiratory cycle to another, envisaging irreversible trajectories. The Lagrangian analysis also manifested the longitudinal gas redistribution characterized by the incoming central flow and the outgoing near-wall flow. Those effects would be accumulated through repetitive respiration, and result in the effective gas mixing in HFOV.
Key words: Human Lung, Respiratory Region, HFOV, Computational Fluid Dynamics, Alveoli, Air Trajectory, Gas Redistribution
1. Introduction
Gas flow mechanism in high frequency oscillatory ventilation (HFOV) is different from that in the normal breathing. This artificial respiration technique has the features of low tidal volume and high frequency. Pulmonary patients suffering from acute respiratory distress syndrome (ARDS) or acute lung injury (ALI) seriously face an insufficient gas exchange between O2 and CO2. Over the past 40 years, HFOV has been developed to assist such patient respiration. Now, it becomes a strong clinical tool to support the respiratory patients and enhance their gas exchange. Since detail of the gas exchange mechanism has not been cleared yet, driving conditions of HFOV were determined by trials and errors through animal and clinical experiments. Overview of HFOV was reported by Chang (1), Pillow (2), Fessler and Hess (3) and Duval et al. (4).
Air flow in lungs is featured by bulk convection, asymmetric velocity profile, irreversible velocity profile between the inspiration and expiration, pendelluft between the bronchi, cardiogenic mixing, and molecular diffusion. According to the Weibel’s model(5), the hierarchy of airways consists of 23 generations. While a gas mixing occurring from trachea to 6 or 7 generations has gained many attentions of scientists who are involved in the study of turbulence, a flow in lower airways where an actual gas exchange takes place
*Received 25 June, 2011 (No. 11-0346) [DOI: 10.1299/jfst.6.932]
Copyright © 2011 by JSME
Journal of Fluid Science and Technology
Vol. 6, No. 6, 2011
933
has been left behind. For a given set of geometrical, mechanical and physical properties of the lung, it is considered that both convection and diffusion appear to play an important role in gas mixing in the lower airways. Additionally, it is speculated that flow convection and molecular diffusion interact with each other, thereby bringing about synergistic effects.
A lumped parameter model has been employed to examine the major physical parameters such as tidal volume and frequency on airflows in the lung. Using this model, Otis et al. (6) showed that the breathing frequency is an important factor to characterize the pendelluft flow when time-constants of bifurcated pathways are incongruent, which are determined by the product of resistance and compliance. The pulmonary resistance that occupies 10 to 30% of total resistance is too insensitive to detect obstructions in the peripheral airway. Thus, the resistance is usually estimated from the wall friction in laminar and turbulent tubes. On the other hand, the compliance is estimated by measurements. The dependency of dynamic compliance on the frequency was reported by Woolcock et al. (7) who compared the dynamic compliance with static compliance. They pointed out that the abnormality in ventilation was observed when the dynamic compliance was significantly less than the static value. An RLC model including inertia effects in HFOV was discussed by Ultman et al. (8) and High et al. (9). They studied the pendelluft flow for tidal volumes of 5 to 15 mL and respiratory frequency of 6 to 26 Hz, and concluded that the asymmetry in compliance and inertance produced greater pendelluft than the asymmetry in resistance.
A nonlinear lumped-parameter model for asymmetric bronchial bifurcations was studied by Elad et al. (10). They showed that the asymmetric compliance of peripheral airways might affect a flow distribution in daughter tubes, thereby leading to larger pendelluft. Polak and Lutchen (11) reported a computational model to predict maximal expiration through a morphometry-based asymmetrical bronchial tree with Horsfield-like geometry of the airway structure. They gained several insights into the flow limitation and found that increased inhomogeneity of a lung structure yielded what could not be either explained or re-created with the symmetrical structure. Ben-Tal (12) presented a hierarchy of models with increasing complexity for gas exchange in the human lungs. A review of several mathematical models in this report manifested priority of a simple model as it showed a good agreement with experimental results.
Geometric configurations of bronchial channel, i.e. curved or straight tube, rigid or flexible tube, cylindrical or rectangular model, and symmetric or asymmetric model are important factors to consider in flow. The effective diffusion is greater in curved and bifurcated tubes than in straight tubes for secondary flow during HFOV conditions (13,14). The respiratory flows along realistic and idealized model channels were investigated. The secondary flow was intensive in realistic geometry than in the idealized geometry (15). Theunissen and Riethmuller (16) experimentally studied the three dimensional flow character and particle trajectories from high Reynolds number (Re~1000) to low Reynolds number (Re~0.1) and presented the irreversibility of the flow. Liu et al. (17) reported that the flow structure was influenced not by lateral branches but by daughter branches.
Many CFD simulations (laminar, LES, k-ε model) have been conducted to investigate flow mechanisms in a human lung. Yang et al. (18) simulated the pulmonary flow along obstructive airways that mimics chronic obstructive pulmonary disease (COPD). They concluded that the obstructive airway has significant effects on the air flow by causing flow separation in bifurcation. A hybrid CFD model with 1-D line-like model for small airway was developed to estimate the lung input impedance in upper airways by Ma and Lutchen (19). They discussed the relation between the lung’s impedance, flow rate and frequency. However the obtained flow division ratio was unacceptably inaccurate. Inagaki et al. (20) also investigated the oscillatory flow in realistic model human airways and concluded that the expiration flow strongly depended on the airway geometry. Nagels and Cater (21) investigated the suitability of using LES within trachea and bronchi and showed the
Journal of Fluid Science and Technology
Vol. 6, No. 6, 2011
934
occurrence of pendelluft by transient oscillatory flow separation in high Reynolds number, Re=8132. Choi et al. (22) studied the counter-flow phenomena numerically with CT-based human airway model. They concluded that counter flow accounted for about 20% of gas mixing in HFOV.
Particle deposition depends on the airway geometry even if flow conditions are the same. The CFD simulation based on the Weibel model and CT scan of a cadaver lung cast model shows the drastic differences in particle trapping between the two models (23). The dissimilarity in particle trajectories was reported from experiments and CFD simulations for different wall and impaction conditions. Gemi et al. (24) and Evegren et al. (25) investigated the effects of geometrical asymmetries on the downstream flow and the mass transport in asymmetric geometry. They reported that this asymmetry did not have significant effects on velocity distribution. It was also found that over a cycle the mass flow distribution at outlets could be affected by the inlet velocity conditions. The validation of CFD predictions in comparison with experimental data was presented by Ertbruggen et al. (26) and Ma et al. (27) for flow in alveolated bend during normal breathing. The velocity obtained numerically with STAR-CCM+ (CD-Adapco) was compared with the experimental values, and showed a good agreement within 1% in the central duct and in the alveolar cavities within 15% (26). On the basis of these data, they suggested that CFD techniques were promising to predict acinar-type flow.
As described above, clinical studies demonstrated better outcomes of HOFV than other artificial techniques that are carried out at the same frequency as normal breathing. Although the gas-mixing in HFOV is considered to take place predominantly in lower airways than upper airways upon taking account of the low tidal volume and highly-frequent oscillation, the papers on gas-mixing, which have been published so far, focused mainly on air flow in the upper airways. They demonstrated that the turbulence is induced by the asymmetry of the airway’s configuration as well as the flow dividing in inspiration and merging in expiration. In contrast, flow in the lower airways later than 17th generation has remained unclear. In particular, redistribution of the incoming fresh air and old gas for the case of HFOV is poorly understood. A lack in the knowledge of gas-exchange mechanisms in the lower airways resulted in a situation where developments and improvements of HFOV are dependent upon trials and errors or intuitions of engineers. Thus, the present study is designed to gain fluid mechanical insights into the mechanisms of gas exchanges when HFOV is applied to a patient. On the basis of our experimental studies using particle image velocimetry (PIV)(28, 29), we hypothesize that an oscillatory laminar flow induces an effective and active gas mixing mechanism in the lower airways. The primary aim of this study is to understand the contribution of flow convection by high frequency oscillation to a gas redistribution in the lower airways. We also discuss longitudinal gas redistribution induced by HFOV-driven flow.
2. Physiology of airway and flow regime
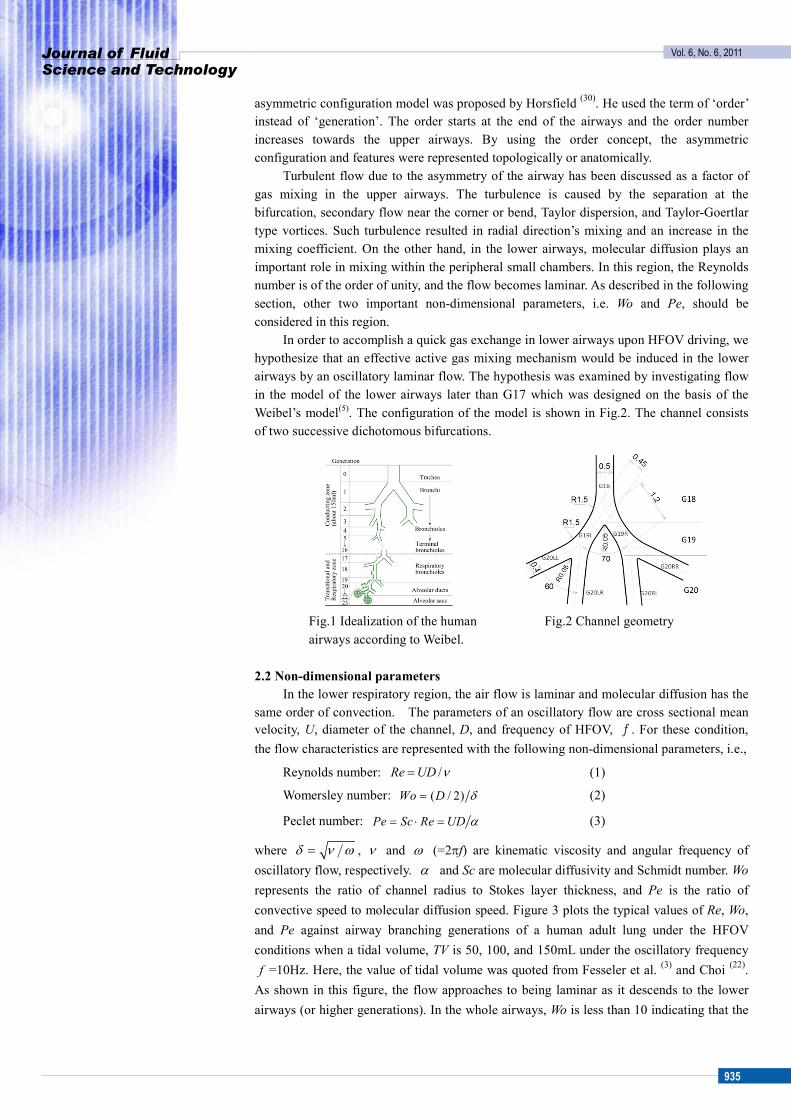
2.1 Configuration of the channel An idealized airway configuration was presented by Weibel (5) as shown in Fig.1. He
regarded the airway such that it had a symmetrically dichotomous branching structure from trachea to alveoli. The capillary network in the deep region is wrapped around by bubble-shaped terminal segments. The airway is categorized into 0th to 23rd generations depending on how many times the airway bifurcates to reach the airway of an interest. An inhaled gas is transported from trachea, G0 (0th generation), to the terminal bronchioles, G16 without any gas exchange. Gas exchange takes place in the respiratory zone from G17 to G23 consisting of respiratory bronchioles, alveolar ducts and alveolar sacs. In this region, the unit called acinus consisting of six to nine chambers are connected to airways. An
Journal of Fluid Science and Technology
Vol. 6, No. 6, 2011
935
asymmetric configuration model was proposed by Horsfield (30). He used the term of ‘order’ instead of ‘generation’. The order starts at the end of the airways and the order number increases towards the upper airways. By using the order concept, the asymmetric configuration and features were represented topologically or anatomically.
Turbulent flow due to the asymmetry of the airway has been discussed as a factor of gas mixing in the upper airways. The turbulence is caused by the separation at the bifurcation, secondary flow near the corner or bend, Taylor dispersion, and Taylor-Goertlar type vortices. Such turbulence resulted in radial direction’s mixing and an increase in the mixing coefficient. On the other hand, in the lower airways, molecular diffusion plays an important role in mixing within the peripheral small chambers. In this region, the Reynolds number is of the order of unity, and the flow becomes laminar. As described in the following section, other two important non-dimensional parameters, i.e. Wo and Pe, should be considered in this region.
In order to accomplish a quick gas exchange in lower airways upon HFOV driving, we hypothesize that an effective active gas mixing mechanism would be induced in the lower airways by an oscillatory laminar flow. The hypothesis was examined by investigating flow in the model of the lower airways later than G17 which was designed on the basis of the Weibel’s model(5). The configuration of the model is shown in Fig.2. The channel consists of two successive dichotomous bifurcations.
Fig.1 Idealization of the human airways according to Weibel.
Fig.2 Channel geometry
2.2 Non-dimensional parameters
In the lower respiratory region, the air flow is laminar and molecular diffusion has the same order of convection. The parameters of an oscillatory flow are cross sectional mean velocity, U, diameter of the channel, D, and frequency of HFOV, f . For these condition, the flow characteristics are represented with the following non-dimensional parameters, i.e.,
Reynolds number: ν/UDRe = (1)
Womersley number: ( / 2) δ=Wo D (2)
Peclet number: α= ⋅ =Pe Sc Re UD (3)
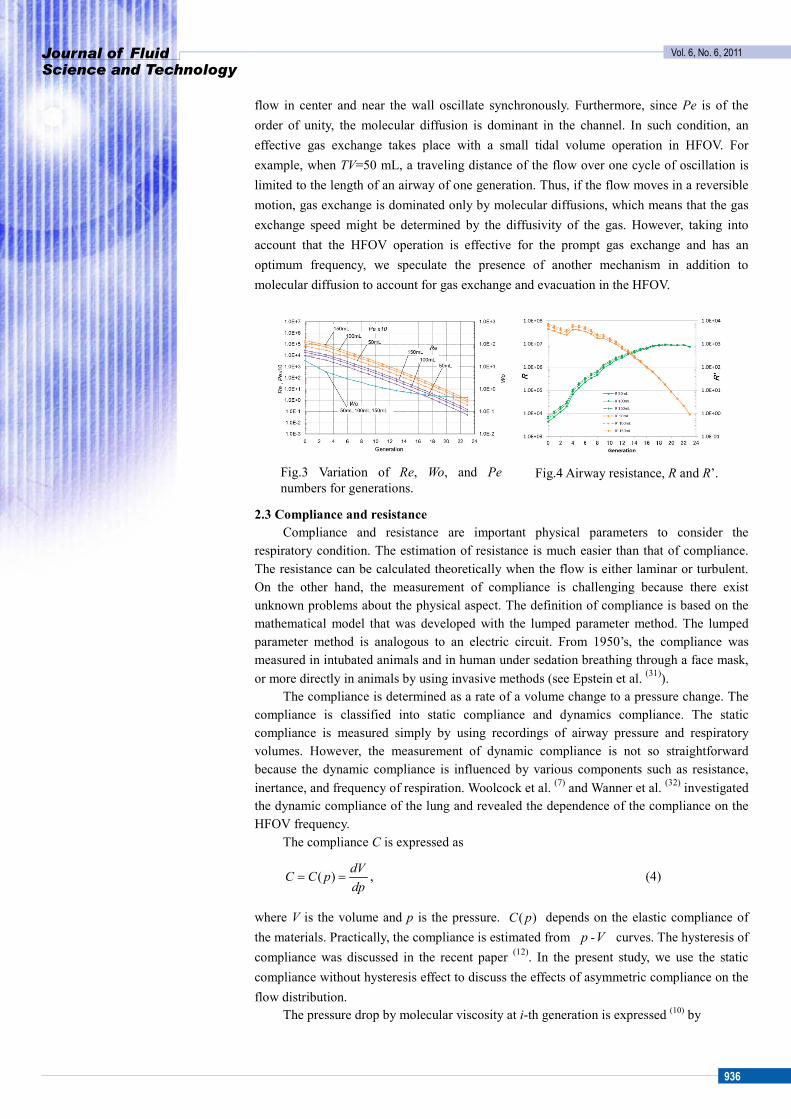
where /δ ν ω= , ν and ω (=2πf) are kinematic viscosity and angular frequency of oscillatory flow, respectively. α and Sc are molecular diffusivity and Schmidt number. Wo represents the ratio of channel radius to Stokes layer thickness, and Pe is the ratio of convective speed to molecular diffusion speed. Figure 3 plots the typical values of Re, Wo, and Pe against airway branching generations of a human adult lung under the HFOV conditions when a tidal volume, TV is 50, 100, and 150mL under the oscillatory frequency f =10Hz. Here, the value of tidal volume was quoted from Fesseler et al. (3) and Choi (22).
As shown in this figure, the flow approaches to being laminar as it descends to the lower airways (or higher generations). In the whole airways, Wo is less than 10 indicating that the
Journal of Fluid Science and Technology
Vol. 6, No. 6, 2011
936
flow in center and near the wall oscillate synchronously. Furthermore, since Pe is of the order of unity, the molecular diffusion is dominant in the channel. In such condition, an effective gas exchange takes place with a small tidal volume operation in HFOV. For example, when TV=50 mL, a traveling distance of the flow over one cycle of oscillation is limited to the length of an airway of one generation. Thus, if the flow moves in a reversible motion, gas exchange is dominated only by molecular diffusions, which means that the gas exchange speed might be determined by the diffusivity of the gas. However, taking into account that the HFOV operation is effective for the prompt gas exchange and has an optimum frequency, we speculate the presence of another mechanism in addition to molecular diffusion to account for gas exchange and evacuation in the HFOV.
Fig.3 Variation of Re, Wo, and Pe numbers for generations.
Fig.4 Airway resistance, R and R’.
2.3 Compliance and resistance Compliance and resistance are important physical parameters to consider the
respiratory condition. The estimation of resistance is much easier than that of compliance. The resistance can be calculated theoretically when the flow is either laminar or turbulent. On the other hand, the measurement of compliance is challenging because there exist unknown problems about the physical aspect. The definition of compliance is based on the mathematical model that was developed with the lumped parameter method. The lumped parameter method is analogous to an electric circuit. From 1950’s, the compliance was measured in intubated animals and in human under sedation breathing through a face mask, or more directly in animals by using invasive methods (see Epstein et al. (31)).
The compliance is determined as a rate of a volume change to a pressure change. The compliance is classified into static compliance and dynamics compliance. The static compliance is measured simply by using recordings of airway pressure and respiratory volumes. However, the measurement of dynamic compliance is not so straightforward because the dynamic compliance is influenced by various components such as resistance, inertance, and frequency of respiration. Woolcock et al. (7) and Wanner et al. (32) investigated the dynamic compliance of the lung and revealed the dependence of the compliance on the HFOV frequency.
The compliance C is expressed as
( ) dVC C pdp
= = , (4)
where V is the volume and p is the pressure. ( )C p depends on the elastic compliance of the materials. Practically, the compliance is estimated from p -V curves. The hysteresis of compliance was discussed in the recent paper (12). In the present study, we use the static compliance without hysteresis effect to discuss the effects of asymmetric compliance on the flow distribution.
The pressure drop by molecular viscosity at i-th generation is expressed (10) by
Journal of Fluid Science and Technology
Vol. 6, No. 6, 2011
937
QRQRRqp iL )Re067.0556.0(
2+=′==∆ (5)
4
128L
lRdµ
π= (6)
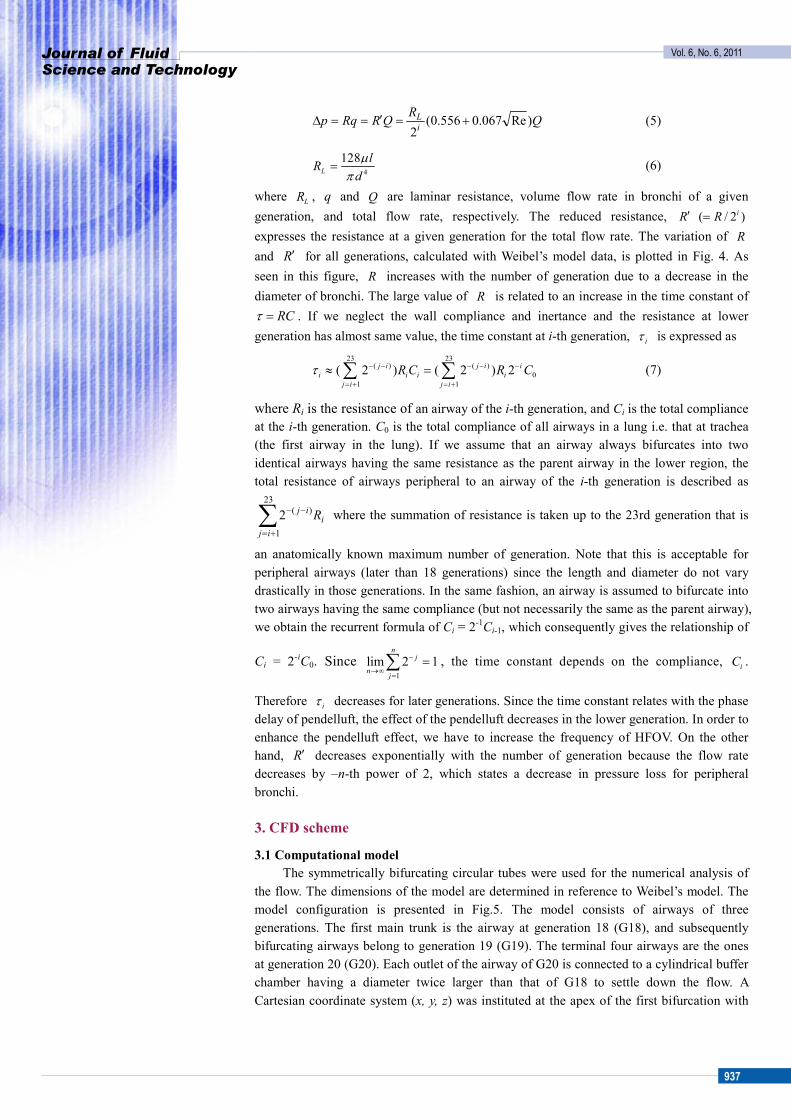
where LR , q and Q are laminar resistance, volume flow rate in bronchi of a given generation, and total flow rate, respectively. The reduced resistance, R′ ( / 2 )iR= expresses the resistance at a given generation for the total flow rate. The variation of R and R′ for all generations, calculated with Weibel’s model data, is plotted in Fig. 4. As seen in this figure, R increases with the number of generation due to a decrease in the diameter of bronchi. The large value of R is related to an increase in the time constant of
RCτ = . If we neglect the wall compliance and inertance and the resistance at lower generation has almost same value, the time constant at i-th generation, iτ is expressed as
23 23
( ) ( )0
1 1( 2 ) ( 2 ) 2τ − − − − −
= + = +
≈ =∑ ∑j i j i ii i i i
j i j iR C R C
(7)
where Ri is the resistance of an airway of the i-th generation, and Ci is the total compliance at the i-th generation. C0 is the total compliance of all airways in a lung i.e. that at trachea (the first airway in the lung). If we assume that an airway always bifurcates into two identical airways having the same resistance as the parent airway in the lower region, the total resistance of airways peripheral to an airway of the i-th generation is described as
iij
ij R∑+=
−−23
1
)(2 where the summation of resistance is taken up to the 23rd generation that is
an anatomically known maximum number of generation. Note that this is acceptable for peripheral airways (later than 18 generations) since the length and diameter do not vary drastically in those generations. In the same fashion, an airway is assumed to bifurcate into two airways having the same compliance (but not necessarily the same as the parent airway), we obtain the recurrent formula of Ci = 2-1Ci-1, which consequently gives the relationship of
Ci = 2-iC0. Since 1
lim 2 1−
→∞=
=∑n
j
n j
, the time constant depends on the compliance, iC .
Therefore iτ decreases for later generations. Since the time constant relates with the phase delay of pendelluft, the effect of the pendelluft decreases in the lower generation. In order to enhance the pendelluft effect, we have to increase the frequency of HFOV. On the other hand, R′ decreases exponentially with the number of generation because the flow rate decreases by –n-th power of 2, which states a decrease in pressure loss for peripheral bronchi. 3. CFD scheme
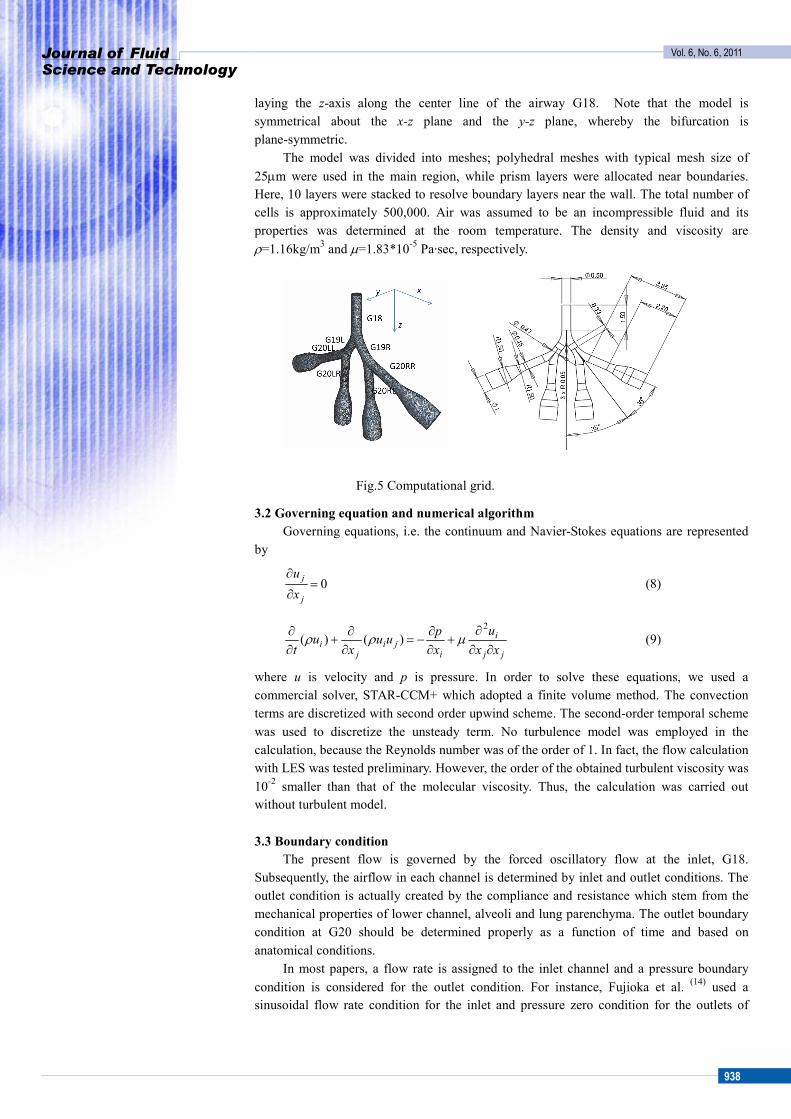
3.1 Computational model The symmetrically bifurcating circular tubes were used for the numerical analysis of
the flow. The dimensions of the model are determined in reference to Weibel’s model. The model configuration is presented in Fig.5. The model consists of airways of three generations. The first main trunk is the airway at generation 18 (G18), and subsequently bifurcating airways belong to generation 19 (G19). The terminal four airways are the ones at generation 20 (G20). Each outlet of the airway of G20 is connected to a cylindrical buffer chamber having a diameter twice larger than that of G18 to settle down the flow. A Cartesian coordinate system (x, y, z) was instituted at the apex of the first bifurcation with
Journal of Fluid Science and Technology
Vol. 6, No. 6, 2011
938
laying the z-axis along the center line of the airway G18. Note that the model is symmetrical about the x-z plane and the y-z plane, whereby the bifurcation is plane-symmetric.
The model was divided into meshes; polyhedral meshes with typical mesh size of 25µm were used in the main region, while prism layers were allocated near boundaries. Here, 10 layers were stacked to resolve boundary layers near the wall. The total number of cells is approximately 500,000. Air was assumed to be an incompressible fluid and its properties was determined at the room temperature. The density and viscosity are ρ=1.16kg/m3 and µ=1.83*10-5 Pa·sec, respectively.
Fig.5 Computational grid.
3.2 Governing equation and numerical algorithm Governing equations, i.e. the continuum and Navier-Stokes equations are represented
by
0=∂
∂
j
j
xu
(8)
jj
i
iji
ji xx
uxpuu
xu
t ∂∂∂
+∂∂
−=∂∂
+∂∂ 2
)()( µρρ (9)
where u is velocity and p is pressure. In order to solve these equations, we used a commercial solver, STAR-CCM+ which adopted a finite volume method. The convection terms are discretized with second order upwind scheme. The second-order temporal scheme was used to discretize the unsteady term. No turbulence model was employed in the calculation, because the Reynolds number was of the order of 1. In fact, the flow calculation with LES was tested preliminary. However, the order of the obtained turbulent viscosity was 10-2 smaller than that of the molecular viscosity. Thus, the calculation was carried out without turbulent model.
3.3 Boundary condition
The present flow is governed by the forced oscillatory flow at the inlet, G18. Subsequently, the airflow in each channel is determined by inlet and outlet conditions. The outlet condition is actually created by the compliance and resistance which stem from the mechanical properties of lower channel, alveoli and lung parenchyma. The outlet boundary condition at G20 should be determined properly as a function of time and based on anatomical conditions.
In most papers, a flow rate is assigned to the inlet channel and a pressure boundary condition is considered for the outlet condition. For instance, Fujioka et al. (14) used a sinusoidal flow rate condition for the inlet and pressure zero condition for the outlets of
Journal of Fluid Science and Technology
Vol. 6, No. 6, 2011
939
daughter tubes. Kurujareon et al. (33) discussed the inlet boundary condition. Calay et al. (34) calculated a respiratory flow pattern within the human lung with the tidal volume variations by measuring them with spirometer. Their model was based on the morphological data by Horsfield et al. (35). Ma and Lutchen (19) carried out 1-D and 3-D hybrid computation where the 3-D flow simulation in upper and central airways was coupled with 1-D transmission line-like model for the small airways. They used a constant phase viscoelastic model which was built as the model of the alveolar tissue unit. In their report, the impedance of small airways calculated from a one-dimensional transmission line model. According to Hantos et al. (36), the impedance of alveoli tissue was given by
( )t
G jHZ αω−
= (10)
2 arctan HG
απ
=
(11)
where G and H are coefficients for tissue damping and elastance, respectively. From the impedance, the pressure is obtained by
t t tP Z Q= . (12)
They compared three outlet boundary conditions, namely, the impedance, the constant pressure, and the constant flow ratio. Ma and Lutchen (19) used the impedance boundary condition for the periodic flow calculation and concluded that this boundary condition provided the means of simulating structure function relations in the lung more realistically and accurately. Tadjfar (37) simulated a flow in arterial blanch model. They used the different pressure conditions at the outlet boundary. Lin et al. (38) used the flow rate condition at the inlet and spatially uniform velocities at each outlet to simulate turbulent laryngeal jet for analyzing its effect on the flow in intra-thoracic airways. van Ertbruggen et al. (26) carried out an experiment with a 50 times scale-upped alveolar model and a simulation with STAR-CCM+. Their results show a fair agreement within 15 % between the experiment and the simulation. Nagels and Cater (21) discussed the pendelluft effect in the upper three generations in the lung. In their report, the LES model, in which transient inlet condition and zero pressure outlet condition were assigned, was validated. The pendelluft was simulated due to the geometrical asymmetry.
In the present paper, we used a more direct expression of compliance and resistance for the outlet boundary conditions to provide more general pressure condition than Eqs. (10)-(12). The pressure boundary condition at the outlet of i-th generation is expressed as a sum of pressure loss due to viscous frictions and compliance of airways peripheral to an airway of the i-th generation. Mathematically, it is given by
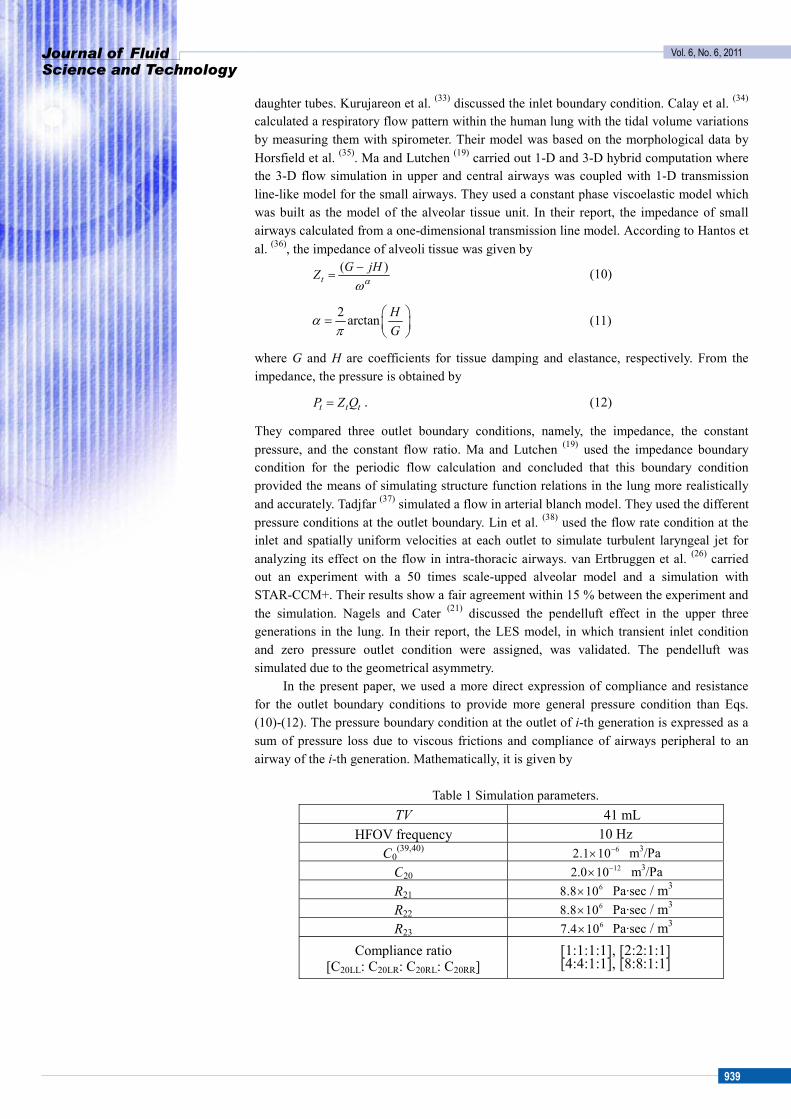
Table 1 Simulation parameters.
TV 41 mL HFOV frequency 10 Hz
C0(39,40) 62.1 10−× m3/Pa C20
122.0 10−× m3/Pa R21
68.8 10× Pa·sec / m3 R22
68.8 10× Pa·sec / m3
R2367.4 10× Pa·sec / m3
Compliance ratio [C20LL: C20LR: C20RL: C20RR]
[1:1:1:1], [2:2:1:1] [4:4:1:1], [8:8:1:1]
Journal of Fluid Science and Technology
Vol. 6, No. 6, 2011
940
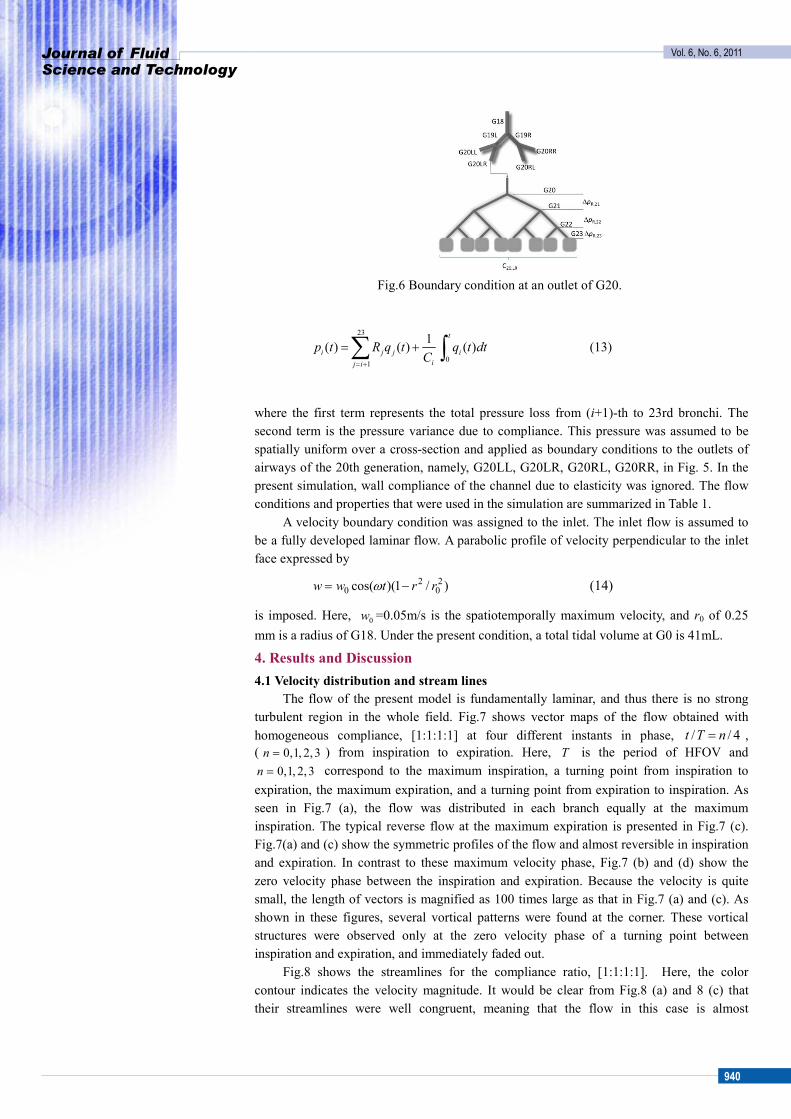
Fig.6 Boundary condition at an outlet of G20.
23
01
1( ) ( ) ( )t
i j j iij i
p t R q t q t dtC
= +
= +∑ ∫ (13)
where the first term represents the total pressure loss from (i+1)-th to 23rd bronchi. The second term is the pressure variance due to compliance. This pressure was assumed to be spatially uniform over a cross-section and applied as boundary conditions to the outlets of airways of the 20th generation, namely, G20LL, G20LR, G20RL, G20RR, in Fig. 5. In the present simulation, wall compliance of the channel due to elasticity was ignored. The flow conditions and properties that were used in the simulation are summarized in Table 1.
A velocity boundary condition was assigned to the inlet. The inlet flow is assumed to be a fully developed laminar flow. A parabolic profile of velocity perpendicular to the inlet face expressed by
)/1)(cos( 20
20 rrtww −= ω (14)
is imposed. Here, 0w =0.05m/s is the spatiotemporally maximum velocity, and r0 of 0.25 mm is a radius of G18. Under the present condition, a total tidal volume at G0 is 41mL.
4. Results and Discussion 4.1 Velocity distribution and stream lines
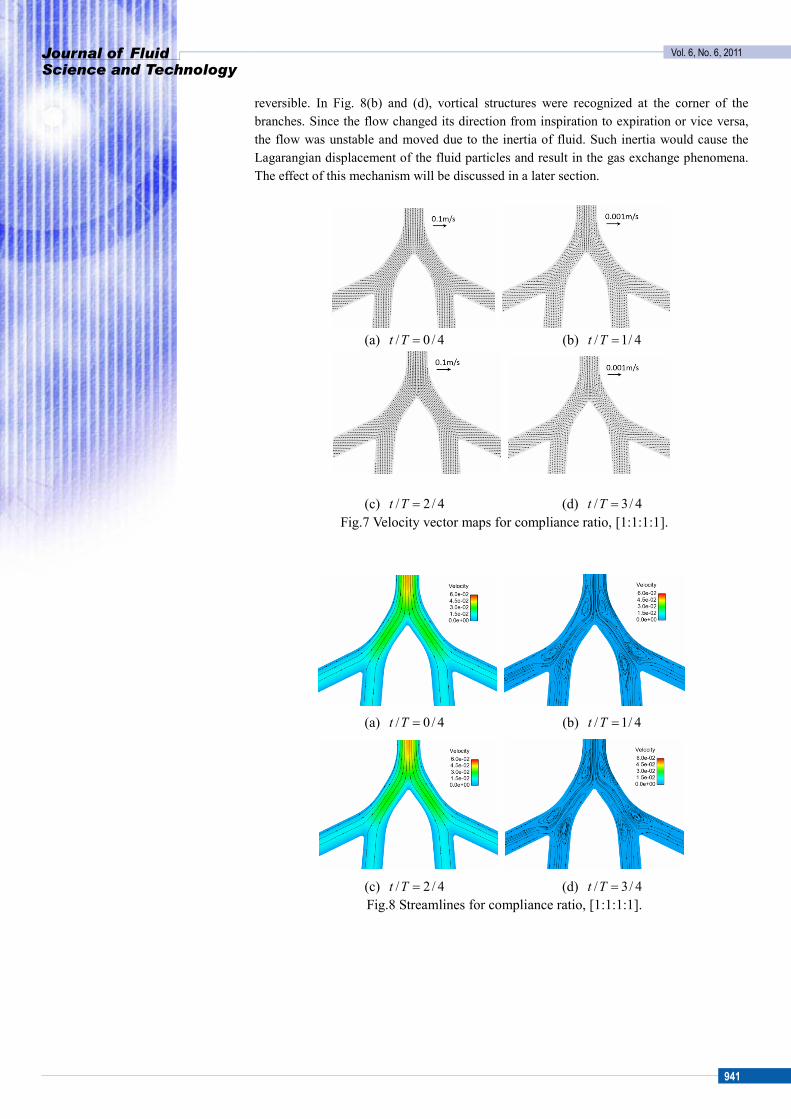
The flow of the present model is fundamentally laminar, and thus there is no strong turbulent region in the whole field. Fig.7 shows vector maps of the flow obtained with homogeneous compliance, [1:1:1:1] at four different instants in phase, / / 4=t T n , ( 0,1, 2,3n = ) from inspiration to expiration. Here, T is the period of HFOV and
0,1, 2,3n = correspond to the maximum inspiration, a turning point from inspiration to expiration, the maximum expiration, and a turning point from expiration to inspiration. As seen in Fig.7 (a), the flow was distributed in each branch equally at the maximum inspiration. The typical reverse flow at the maximum expiration is presented in Fig.7 (c). Fig.7(a) and (c) show the symmetric profiles of the flow and almost reversible in inspiration and expiration. In contrast to these maximum velocity phase, Fig.7 (b) and (d) show the zero velocity phase between the inspiration and expiration. Because the velocity is quite small, the length of vectors is magnified as 100 times large as that in Fig.7 (a) and (c). As shown in these figures, several vortical patterns were found at the corner. These vortical structures were observed only at the zero velocity phase of a turning point between inspiration and expiration, and immediately faded out.
Fig.8 shows the streamlines for the compliance ratio, [1:1:1:1]. Here, the color contour indicates the velocity magnitude. It would be clear from Fig.8 (a) and 8 (c) that their streamlines were well congruent, meaning that the flow in this case is almost
Journal of Fluid Science and Technology
Vol. 6, No. 6, 2011
941
reversible. In Fig. 8(b) and (d), vortical structures were recognized at the corner of the branches. Since the flow changed its direction from inspiration to expiration or vice versa, the flow was unstable and moved due to the inertia of fluid. Such inertia would cause the Lagarangian displacement of the fluid particles and result in the gas exchange phenomena. The effect of this mechanism will be discussed in a later section.
(a) / 0 / 4=t T (b) / 1/ 4=t T
(c) / 2 / 4=t T (d) / 3/ 4=t T Fig.7 Velocity vector maps for compliance ratio, [1:1:1:1].
(a) / 0 / 4=t T (b) / 1/ 4=t T
(c) / 2 / 4=t T (d) / 3/ 4=t T Fig.8 Streamlines for compliance ratio, [1:1:1:1].
Journal of Fluid Science and Technology
Vol. 6, No. 6, 2011
942
(a) / 0 / 4=t T (b) / 1/ 4=t T
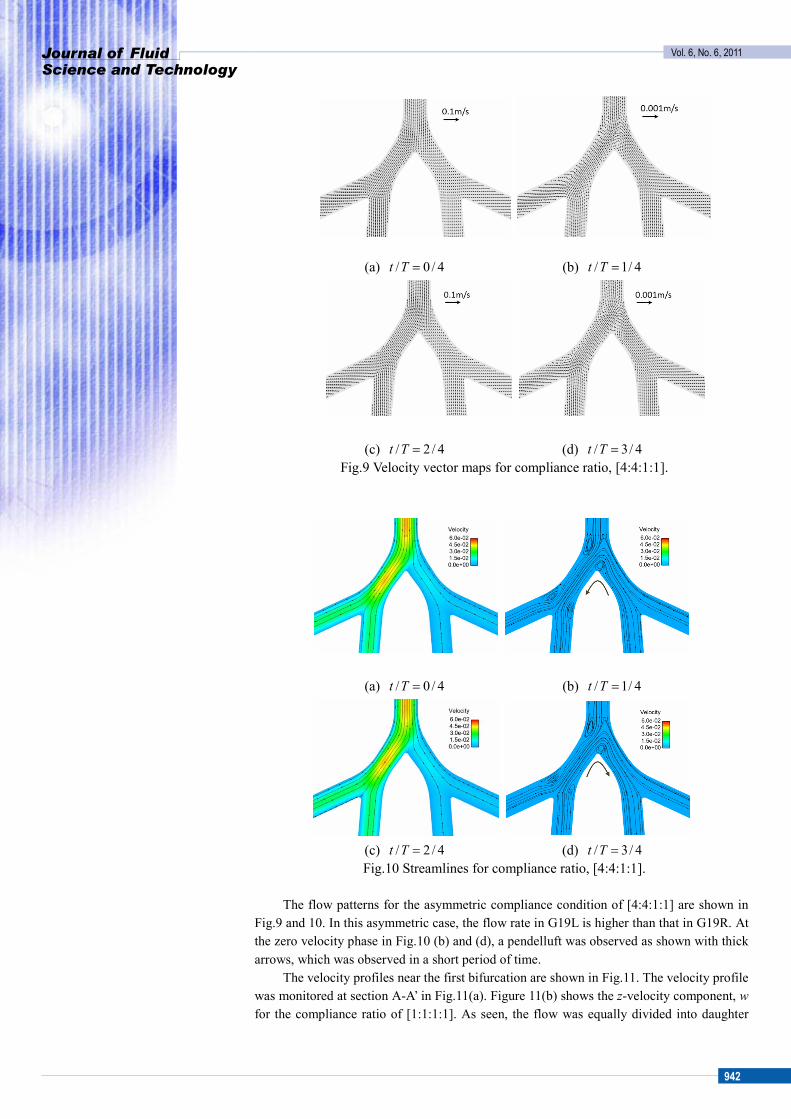
(c) / 2 / 4=t T (d) / 3/ 4=t T Fig.9 Velocity vector maps for compliance ratio, [4:4:1:1].
(a) / 0 / 4=t T (b) / 1/ 4=t T
(c) / 2 / 4=t T (d) / 3/ 4=t T Fig.10 Streamlines for compliance ratio, [4:4:1:1].
The flow patterns for the asymmetric compliance condition of [4:4:1:1] are shown in
Fig.9 and 10. In this asymmetric case, the flow rate in G19L is higher than that in G19R. At the zero velocity phase in Fig.10 (b) and (d), a pendelluft was observed as shown with thick arrows, which was observed in a short period of time.
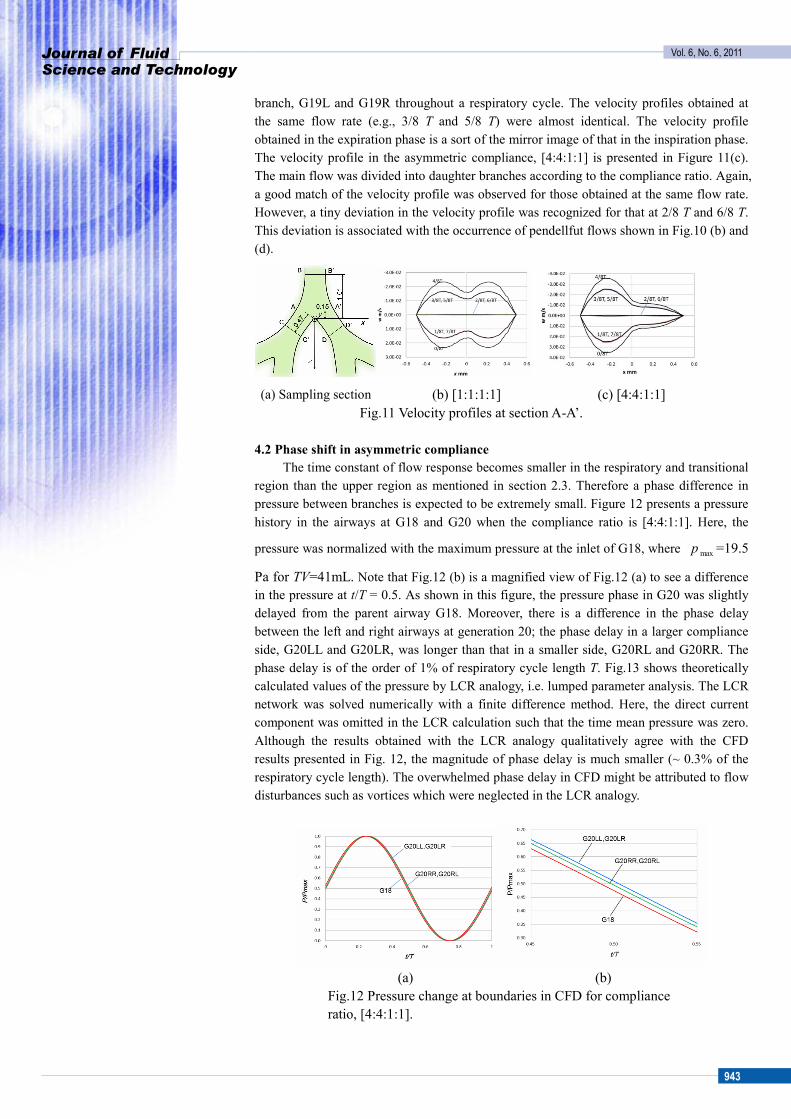
The velocity profiles near the first bifurcation are shown in Fig.11. The velocity profile was monitored at section A-A’ in Fig.11(a). Figure 11(b) shows the z-velocity component, w for the compliance ratio of [1:1:1:1]. As seen, the flow was equally divided into daughter
Journal of Fluid Science and Technology
Vol. 6, No. 6, 2011
943
branch, G19L and G19R throughout a respiratory cycle. The velocity profiles obtained at the same flow rate (e.g., 3/8 T and 5/8 T) were almost identical. The velocity profile obtained in the expiration phase is a sort of the mirror image of that in the inspiration phase. The velocity profile in the asymmetric compliance, [4:4:1:1] is presented in Figure 11(c). The main flow was divided into daughter branches according to the compliance ratio. Again, a good match of the velocity profile was observed for those obtained at the same flow rate. However, a tiny deviation in the velocity profile was recognized for that at 2/8 T and 6/8 T. This deviation is associated with the occurrence of pendellfut flows shown in Fig.10 (b) and (d).
(a) Sampling section (b) [1:1:1:1] (c) [4:4:1:1]
Fig.11 Velocity profiles at section A-A’. 4.2 Phase shift in asymmetric compliance
The time constant of flow response becomes smaller in the respiratory and transitional region than the upper region as mentioned in section 2.3. Therefore a phase difference in pressure between branches is expected to be extremely small. Figure 12 presents a pressure history in the airways at G18 and G20 when the compliance ratio is [4:4:1:1]. Here, the
pressure was normalized with the maximum pressure at the inlet of G18, where maxp =19.5
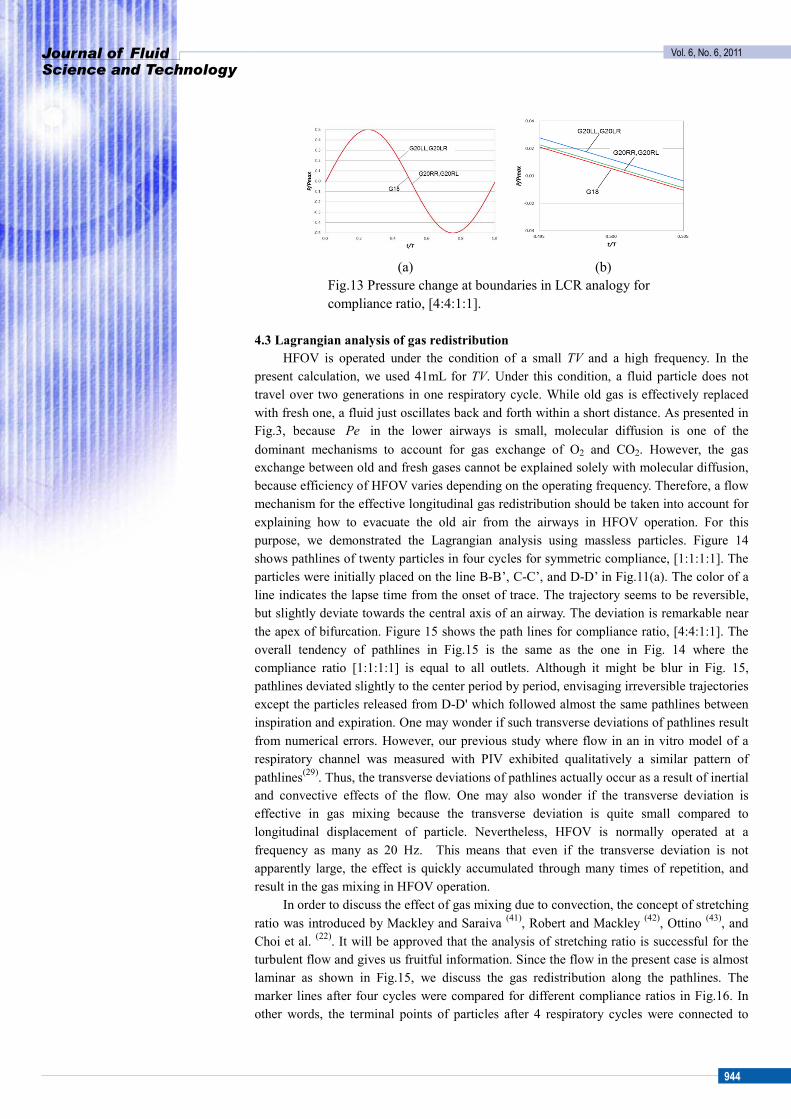
Pa for TV=41mL. Note that Fig.12 (b) is a magnified view of Fig.12 (a) to see a difference in the pressure at t/T = 0.5. As shown in this figure, the pressure phase in G20 was slightly delayed from the parent airway G18. Moreover, there is a difference in the phase delay between the left and right airways at generation 20; the phase delay in a larger compliance side, G20LL and G20LR, was longer than that in a smaller side, G20RL and G20RR. The phase delay is of the order of 1% of respiratory cycle length T. Fig.13 shows theoretically calculated values of the pressure by LCR analogy, i.e. lumped parameter analysis. The LCR network was solved numerically with a finite difference method. Here, the direct current component was omitted in the LCR calculation such that the time mean pressure was zero. Although the results obtained with the LCR analogy qualitatively agree with the CFD results presented in Fig. 12, the magnitude of phase delay is much smaller (~ 0.3% of the respiratory cycle length). The overwhelmed phase delay in CFD might be attributed to flow disturbances such as vortices which were neglected in the LCR analogy.
(a) (b)
Fig.12 Pressure change at boundaries in CFD for compliance ratio, [4:4:1:1].
Journal of Fluid Science and Technology
Vol. 6, No. 6, 2011
944
(a) (b)
Fig.13 Pressure change at boundaries in LCR analogy for compliance ratio, [4:4:1:1].
4.3 Lagrangian analysis of gas redistribution
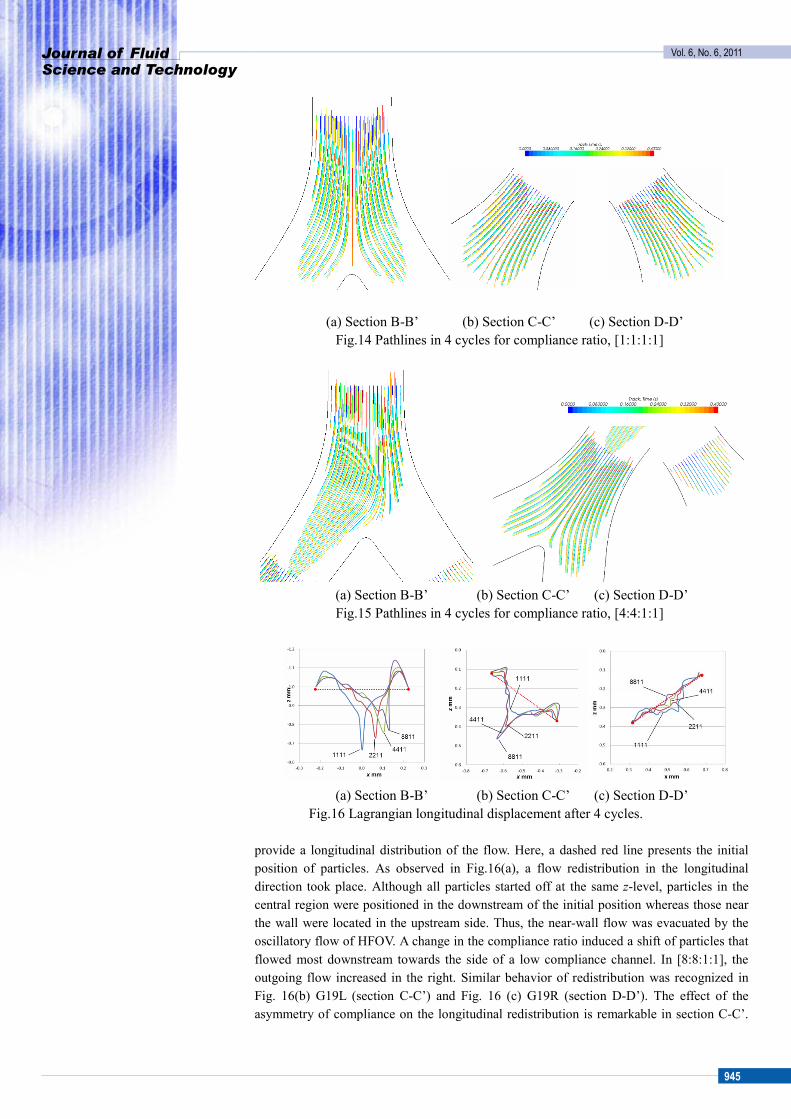
HFOV is operated under the condition of a small TV and a high frequency. In the present calculation, we used 41mL for TV. Under this condition, a fluid particle does not travel over two generations in one respiratory cycle. While old gas is effectively replaced with fresh one, a fluid just oscillates back and forth within a short distance. As presented in Fig.3, because Pe in the lower airways is small, molecular diffusion is one of the dominant mechanisms to account for gas exchange of O2 and CO2. However, the gas exchange between old and fresh gases cannot be explained solely with molecular diffusion, because efficiency of HFOV varies depending on the operating frequency. Therefore, a flow mechanism for the effective longitudinal gas redistribution should be taken into account for explaining how to evacuate the old air from the airways in HFOV operation. For this purpose, we demonstrated the Lagrangian analysis using massless particles. Figure 14 shows pathlines of twenty particles in four cycles for symmetric compliance, [1:1:1:1]. The particles were initially placed on the line B-B’, C-C’, and D-D’ in Fig.11(a). The color of a line indicates the lapse time from the onset of trace. The trajectory seems to be reversible, but slightly deviate towards the central axis of an airway. The deviation is remarkable near the apex of bifurcation. Figure 15 shows the path lines for compliance ratio, [4:4:1:1]. The overall tendency of pathlines in Fig.15 is the same as the one in Fig. 14 where the compliance ratio [1:1:1:1] is equal to all outlets. Although it might be blur in Fig. 15, pathlines deviated slightly to the center period by period, envisaging irreversible trajectories except the particles released from D-D' which followed almost the same pathlines between inspiration and expiration. One may wonder if such transverse deviations of pathlines result from numerical errors. However, our previous study where flow in an in vitro model of a respiratory channel was measured with PIV exhibited qualitatively a similar pattern of pathlines(29). Thus, the transverse deviations of pathlines actually occur as a result of inertial and convective effects of the flow. One may also wonder if the transverse deviation is effective in gas mixing because the transverse deviation is quite small compared to longitudinal displacement of particle. Nevertheless, HFOV is normally operated at a frequency as many as 20 Hz. This means that even if the transverse deviation is not apparently large, the effect is quickly accumulated through many times of repetition, and result in the gas mixing in HFOV operation.
In order to discuss the effect of gas mixing due to convection, the concept of stretching ratio was introduced by Mackley and Saraiva (41), Robert and Mackley (42), Ottino (43), and Choi et al. (22). It will be approved that the analysis of stretching ratio is successful for the turbulent flow and gives us fruitful information. Since the flow in the present case is almost laminar as shown in Fig.15, we discuss the gas redistribution along the pathlines. The marker lines after four cycles were compared for different compliance ratios in Fig.16. In other words, the terminal points of particles after 4 respiratory cycles were connected to
Journal of Fluid Science and Technology
Vol. 6, No. 6, 2011
945
(a) Section B-B’ (b) Section C-C’ (c) Section D-D’ Fig.14 Pathlines in 4 cycles for compliance ratio, [1:1:1:1]
(a) Section B-B’ (b) Section C-C’ (c) Section D-D’Fig.15 Pathlines in 4 cycles for compliance ratio, [4:4:1:1]
(a) Section B-B’ (b) Section C-C’ (c) Section D-D’
Fig.16 Lagrangian longitudinal displacement after 4 cycles.
provide a longitudinal distribution of the flow. Here, a dashed red line presents the initial position of particles. As observed in Fig.16(a), a flow redistribution in the longitudinal direction took place. Although all particles started off at the same z-level, particles in the central region were positioned in the downstream of the initial position whereas those near the wall were located in the upstream side. Thus, the near-wall flow was evacuated by the oscillatory flow of HFOV. A change in the compliance ratio induced a shift of particles that flowed most downstream towards the side of a low compliance channel. In [8:8:1:1], the outgoing flow increased in the right. Similar behavior of redistribution was recognized in Fig. 16(b) G19L (section C-C’) and Fig. 16 (c) G19R (section D-D’). The effect of the asymmetry of compliance on the longitudinal redistribution is remarkable in section C-C’.
Journal of Fluid Science and Technology
Vol. 6, No. 6, 2011
946
These results suggest that the asymmetry of compliance at the outlets of airways gives rise to enhancement of gas mixing in the lower airways.
5. Conclusion A HFOV driven flow in the lower airways of a human lung was simulated. The convection effect was discussed in a geometrically symmetric dichotomous respiratory channel from G18 to G20. The conclusions were summarized as follows. 1) A compliance–resistance coupled boundary condition was introduced directly into the simulation. The simulations for various compliance ratios were carried out. The simulated flow shows the reasonable results to provoke compliance of peripheral airways. 2) The flows were almost laminar in the whole field and seemed to be reversible according to the vector maps at the maximum velocity phase. At turning points between inspiration and expiration, flow became unstable due to the inertia of fluid, causing pendellfut flows. 3) Under the asymmetric compliance, the pressure shows a phase delay of order of 1% in period. The phase delay obtained with CFD was slightly larger than that in the lumped parameter analysis. 4) The Lagrangian pathline analysis was carried out to discuss the gas redistribution. The pathlines deviated slightly from one respiratory cycle to another, in particular during a zero-velocity phase, envisaging irreversible trajectories. This effect will be accumulated through repetitive respiration, and result in the gas mixing in HFOV operation. Those results suggest that if we design a driving waveform of HFOV such that it has a longer zero-velocity phase, more efficient gas mixing would be attained in HFOV. 5) A longitudinal gas distribution was demonstrated by showing the terminal positions of markers. The gas redistribution was characterized by the incoming center flow and the outgoing near-wall flow. The results suggest that the asymmetry of compliance at the outlets of airways gives rise to gas redistribution, thereby enhancing gas mixing in the lower airways.
Acknowledgments The authors would like to appreciate Mr. Tomonori Yamamoto and Mr. Akira Urushikubo for their help in performing the present research.
References (1) Chang, H.K., Mechanisms of gas transport during ventilation by high-frequency
oscillation, J. Appl. Physiol., Vol.56 (1984), pp.553-563. (2) Pillow, J.J., High-frequency oscillatory ventilation: mechanisms of gas exchange and
lung mechanics, Critical. Care Med., Vol. 33, No.3(2005), pp.135-141. (3) Fessler, H. E., Hess, D. R., Does high-frequency ventilation offer benefits over
conventional ventilation in adult patients with acute respiratory distress syndrome?, Respiratory Care, Vol.52, No.5(2007), pp.595-608.
(4) Duval, E.L.IM, Markhorst, D.G., van Vught, A.J., High frequency oscillatory ventilation in children: an overview, Respir. Med. CME, Vol.2 (2009), pp.155-161.
(5) Weibel, E. R. Morphometry of the Human Lung , Springer-Verlag, (1963) (6) Otis, A.B., Mckerrow, C.B., Bartlett, R.A., Mead, J., Mcilroy, M.B., Selverstone, N.J.,
Radford, E.P., Mechanical factors in distribution of pulmonary ventilation, J. Appl. Physiol., Vol.8 (1956), pp.427-443.
Journal of Fluid Science and Technology
Vol. 6, No. 6, 2011
947
(7) Woolcock, A. J., Vincent, N. J., Macklem, P. T., Frequency dependence of compliance as a test for obstruction in the small airways, J. Clin. Invest., Vol. 48 (1969), pp. 1097-1106.
(8) Ultman, J.S., Shaw, R.G., Fabiano, D.C., Cooke, K.A., Pendelluft and mixing in a single bifurcation lung model during high frequency oscillation, J. Appl. Physiol., Vol.65 (1988), pp.146-1558.
(9) High, K.C., Ultman, J.S., Karl, S.R., Mechanically induced pendelluft flow in model airway bifurcation during high frequency oscillation, J. Biomech. Eng., Vol.113 (1991), pp.342-347.
(10) Elad, D., Shochat, A., Shiner, R.J., Computational model of oscillatory airflow in a bronchial bifurcation, Respir. Physiol., Vol.112 (1998), pp.95-111.
(11) Polak, A. G., and Mroczka, J., Nonlinear model for mechanical ventilation of human lungs, Comput. Biol. Med., Vol. 36 (2006), pp. 41–58.
(12) Ben-Tal, A., Simplified models for gas exchange in the human lungs, J. Theor. Biol., Vol.238 (2006), pp.474-495.
(13) Grotberg, J.B., Pulmonary flow and transport phenomena, Annu. Rev. Fluid Mech., Vol.26 (1994), pp.529-71.
(14) Fujioka, H., Oka, K., Tanishita, K., Oscillatory flow and gas transport through a symmetrical bifurcation, J. Biomech. Eng., Vol.123 (2001), pp.145-153.
(15) Heraty, K.B., Laffey, J.G., Quinlan, N.J., Fluid dynamics of gas exchange in high-frequency oscillatory ventilation: in vitro investigations in idealized and anatomically realistic airway bifurcation models, Ann. Biomed. Eng., Vol.36 (2008), pp.1856-1869.
(16) Theunissen, R., Riethmuller, M.L., Particle image velocimetry in lung bifurcation models, Topics Appl. Phys., Vol.112 (2008), pp.73-101.
(17) Liu, Y., So, R. M. C., Zhang, C. H., Modeling the bifurcating flow in an asymmetric human lung airway, J. Biomech., Vol. 36 (2003), pp. 951-959.
(18) Yang, X. L., Liu, Y., Luo, H.Y., Respiratory flow in obstructed airways, J. Biomech., Vol. 39 (2006), pp. 2743-2751.
(19) Ma, B., Lutchen, K. R., An anatomically based hybrid computational model of the human lung and its application to low frequency oscillatory mechanics, Ann. Biomed. Eng., Vol. 34 (2006), No. 11, pp. 2743-2751.
(20) Inagaki, G., Tanaka, G., Hishida, M., Haneishi, H., Hu, X., Numerical simulation of oscillatory flow in realistic model human airways, J. Fluid Sci. Tech., Vol.4(2009), No.3, pp.602-613.
(21) Nagels, M.A., Cater, J.E., Large eddy simulation of high frequency oscillating flow in an asymmetric branching airway model, Med. Eng. Phys., Vol.31 (2009), pp.1148-1153.
(22) Choi, J. Xia, G., Tawhai, M.H., Hoffman, E.A., Lin, C-L., Numerical study of high-frequency oscillatory air flow and convective mixing in a CT-based human airway model, Ann. Biomed. Eng., Vol. 38, No. 12 (2010), pp.3550-3571.
(23) Nowak, N., Kakade, P. P., Annapragada, a. V., Computational fluid dynamics simulation of airflow and aerosol deposition in human lungs, Ann. Biomed. Eng., Vol. 31 (2003), pp. 374-390.
(24) Gemci, T., Ponyavin, V., Chen, Y., Chen, H., Collins, R., Computational model of airflow in upper 17 generations of human respiratory tract, J. Biomech., Vol. 41 (2008), pp. 2047-2054.
(25) Evegren, P., Revstedt, J., Fuchs, L., Pulsatile flow and mass transfer in an asymmetric system of bifurcations, Comput. Fluids, accepted paper, 2011.
Journal of Fluid Science and Technology
Vol. 6, No. 6, 2011
948
(26) Ertbruggen, C., Corieri, P., Theunissen, R., Riethmuller, M. L., Darquenne, C., Validation of CFD predictions of flow in a 3D alveolated bend with experimental data, J. Biomech., Vol. 41 (2008), pp. 399-405.
(27) Ma, B., Ruwet, V., Corierib, P., Theunissen, R. Riethmuller, M., Darquenne, C., CFD simulation and experimental validation of fluid flow and particle transport in a model of alveolated airways, J. Aerosol. Sci., Vol.40 (2009), No.5, pp.403-414.
(28) Lee, W. J., Kawahashi, M., and Hirahara, H., Experimental Investigation of oscillatory air flow in a bronchial tube model with HFOV mode, J. Vis., Vol.9, No.1(2006), pp.39-47.
(29) Ahmmed, M.U., Hirahara, H., Yamamoto, T., Iwazaki, K., Investigation of gas redistribution in doubly bifurcated respiratory channel of human lung, J. Biomech. Sci. Eng., Vol.6, No.1 (2011), pp.1-14.
(30) Horsfield, K. Pulmonary airways and blood vellsels considered as confluent trees. The lung. Second Edition, (1997), pp. 1073-1079.
(31) Epstein, A., Godfrey, S., Bar-Yishay, E., Putilov, A., Bark, H., Non-invasive measurement of total respiratory compliance and resistance in cats, Respir. Physiol. Neurobiol., Vol.156 (2007) pp.179–186.
(32) Wanner, A., Zarzecki, S., Atkins, N., Zapata, A., Sackner, M., Relationship between Frequency Dependence of Lung Compliance and Distribution of Ventilation, J. Clin. Invest., Vol. 54 (1974), pp.1200-1213.
(33) Kurujareon, J., Holdø, A.E., Calay, R.K., Effects of boundary conditions for the CFD modeling of respiratory flow in an asymmetric bifurcation. ASME Advances in Bioengineering, BED 39, (1998), pp.103–104.
(34) Calay, R.K., Kurujareon, J., Holdo, A.E., Numerical simulation of respiratory flow patterns within human lung, Respir. Physiol. Neurobiol., Vol.130 (2002), pp.201–221.
(35) Horsfield, K., Dart, G., Olson, D.E., Filley, G.F., Cumming, G., Models of the human bronchial tree, J. Appl. Physiol., Vol.31(1971), pp. 207–217.
(36) Hantos, Z., Daroczy, B., Suki, B., Nagy, S., Fredberg, J.J., Input impedance and peripheral inhomogeneity of dog lungs, J. Appl. Physiol., Vol.72(1992), pp.168–178.
(37) Tadjfar, M. Flow in arterial branch model. J. Eng. Math., Vol.54(2006), pp.359–374. (38) Lin, C-L., Tawhai, M.H., McLennan, G., Hoffman, E.C., Characteristics of the
turbulent laryngeal jet and its effect on airflow in the human intra-thoracic airways, Respir. Physiol. Neurobiol., Vol.157 (2007), pp.295–309.
(39) DuBois, A.B, Brody, A.W., Lewis, D.H., Burgess, B.F., Oscillation mechanics of lungs and chest in man, J. Appl. Physiol., Vol.8 (1956), pp.587-594.
(40) Sharp, J.T., Henry, J.P., Sweany, S.K., The total work of breathing in normal and obese men, J. Clin. Invest., Vol.43 (1964), pp.728-739.
(41) Mackley, M. R., Neves Saraiva, R. M. C., The quantitative description of fluid mixing using Lagrangian- and concentration-based numerical approaches. Chem. Eng. Sci. Vol.54(1999), pp159–170.
(42) Roberts, E. P. L., Mackley, M. R., The simulation of stretch rates for the quantitative prediction and mapping of mixing within a channel flow. Chem. Eng. Sci. Vol.50(1995), pp3727–3746.
(43) Ottino, J. M. The Kinematics of Mixing: Stretching, Chaos and Transport. (1989), Cambridge University Press.