moshe lubin university of rochester - j-stage
TRANSCRIPT
Implosion Experiment of the National User's Facility •š
Moshe Lubin
University of Rochester
1. Introduction
I don't describe implosion experiment so much as a discussion has perhaps
some of differences in diagnostics, if one had not heard today. I report some
of feature of symmetrical illumination facility that has been operating at Uni-
versity of Rochester for the last year, and presently scheduled beginning oper-
ation of 24 beam configuration. I first deal very briefly with a laser perform-
ance, secondly deal with the evolution of small minor technology that makes dra-
matic differenece in laser system performance. Third I deal with series of the
diagnostics that have become common place in our laboratory for high density di-
agnostics of purely compressed core. And finally from where we stand I would
like to summarize the status of laser inertial fusion.
2. The Overview of Zeta Experiments
The 6 beam Zeta laser system at University of Rochester has been operating
for the past year. Up to this time it has exercised more than 1200 shots on the
target at the power level of 2 or 3 TW depending on target design.
The 24 beam system has been recently completed in the construction as shown
in Fig.l. The first 6 beams was constructed in two beam clusters. The 24 beam
operation of the facility will take place in November with 24 beam target ir-
radiation facility being able in May or June of 1980.
During the last year the parameter space that we have operated for the pur-
pose of looking at compression of laser fusion targets have been 6 beam symmet-
rical illumination using circularly polalized light, using the laser power of up
to 4 TW in pulse width between 50 and 150 ps. The pulse contrast of this system
has been in excess 108. This particular laser system has no dye cells. The co-
ntrast between the laser pulse shape itself is obtained through very high resolu-
tion, high dynamic range silicon switching.
The experiment that has been conducting over the laser year involves the
series of calibration experiment in exploding pusher mode, a series of experiment
to test transport, and finally a series of experiment combined with energy deposi-
tion to achieve high density.
* Gictated by N . Miyanaga
―165―
3. Semiconductor Switch and Its Applications
The feature which gives this laser system extremely high contrast is es-
sentially high resistivity Si or GaAs switching, that has the feature as shown
in Fig.3. It has a time constant of 1 ps. It is virtually jitter free, that
is, has a jitter of less than 1 ps and has extremely wide band width. Figure 4
shows, in federative transmission of optical pulse width on the switch, feature
of this switch which turns Si from a very good insulator to a very good conduct-
or over very brief time, very effectively, by extremely low incident port energy,
μ J.
We use this technique for jitter free switch-out on the laser system. We
use this technique in all about active pulse shaping with a rise time of 40 ps,
and use this technique in all about the streak camera opration with 1 ps pre-
cision and with the jitter less than 1 ps. Allowing us to very carefully sweep
out with diagnostics, the contrast ratio between what is the head of pulse and
what is detailed pulse shape is 10.An example of the technique of jitter free
streak camera operation is shown in Fig.6. This schematic explains an important
role in determining the zero time fiduciary associated with the incident laser
pulse on target when we use x-ray streak camera to see first x-ray emission comes
out relative to the initiation of laser pulse.
4. Zeta Expbrimental Program
The nature of laser used program (see Fig.7), this was the program conduct-
ed in 1979 and now completed, involved the series of experiment in which the
fuel density was typically 1 to 100 times solid and neutron yield was in excess
of 108. These are the calibration experiments of illumination configuration.
The second series of experiment was completed that involved the modeling of trans-
port looking at both inhibited and uninhibited transport and x-ray emission and
involved fuel density of roughly 10 x. During experiment 20 times liquid density
is measured when neutron yield is 107. Finally there are multi-layered targets
which have been examined and continue to be examined which involve density in
excess 20 gr/cm3.
The 6 beam illumination configuration is symmetrical illumination system
(see Fig.8). In the transport experiment particularly, main diagnostic tools
were x-ray streak camera, soft x-ray detector and spectrometer as well as bank
of x-ray detector.
In explosive pusher experiment (the calibration experiment) not only pin-
―166―
hole camera but x-ray zone plate was used, as well as neutron yield as a major
diagnostics. I'll come back to use spectral resolution of a time of flight
measurement, as a crucial diagnostics to help to answer the question, Dr.
Holtzrichter talks about a spectrum whether or not one can rely on a particle
image for determination of the core condition.
5. x-ray Measurement: Pinhole camera, spectroscopy,
streak camera and interferometer
The 6 beam illumination condition facility in its hard ware is something
shown in Fig. 9, where we are looking in a port of streak camera. The feature
of this particular system are that the illumination geometry is very symmetrical.
Figure 10 is a symmetrical explosive pusher measurement one can not determine the
large scale deviation from symmetry. This is not to say however that symmetry is
good enough for greatful compression, not anywhere near good enough point at this
time.
It is extention of 6 beam illumination to the 24 beam configuration, that
we turn to improve the symmetry to study the basic target behavior. Now the
thrust of this particular illumination configuration is to come as close as pos-
sible to joint theoretical-experimental-mutual replicaiton, that is, to replicate
as close as possible in both theory and experiment the same phenomena, hence to
do control experiment and not be confused, if possible, by two demensional effect
which tends to confuse basic physics whether or not will be successful and 24
beam illumination remains to be seen.
Some of the diagnostics, which has stood and which one heard about, are
compared with our one dimensional code calculations. We derived from our bank
of x-ray detector x-ray spectrum with solid line being the x-ray measurement and
dotted line being the prediction of code as shown in Fig.11.
X-ray spectroscopy has been standard tool in our laboratory for some time.
The urn set of the emission of certain lines gives a way to the physical proper-
ties of the behavior of the compressed fuel. Figure 12 is monochromatic images
if plastic coated microballoon, in which the lines of chlorine and silicon come
from outer pusher, and the central argon spike comes from the fuel itself.
The fuel in this case is mixture of fuel DT and argon.
This monochromatic image is just but the most superficial kind of diagnos-
tics for spatial resolution. Indeed what one would like to do is to compare, as
best we can in this high density regime, the line profiles actually measured and
the calculated line shape (see Fig.l3).
These line shape becomes complicated when you have combined spectra of both
―167―
the outer layer of target and inside. When you have a combination of argon
emission and calcium in this case, the combined fitting, two or over all ex-
perimental profiles, is a sensitive function not only of the peaks and width
between the peaks in LYƒÀ for argon butalso of a half width of the slope. It
is fairly said, in this regime of sensity and temperature, one must fit complete
profiles, half width and amplitude. The total of profiles fitting is what is
quite confidence in the density estimation.
When turning to time resolved x-ray measurement it is relatively easy and
indeed standard at most major laboratory to have x-ray streak cameras. And a
simple x-ray streak of the initiation of target absorption and alternated be-
havior of target can be shown in Fig. 15 by two burst as recorded on film. A micro-
densitometer trace of Fig.l5 shows rather invidious profiles. The question is
how do you relate this (profile measure) to the theoretical calculation to con-
trol the overall behavior of the target. One way is to resolve the x-ray emis-
sion spatially through pinhole. Figure 16 shows a spatially resolved behavior
of the target which is now compressed in the center where most of the emission
come from. One could pick out in time using as arbitrary zero, because one don't
know where the zero is, the two peaks is this emission and then compared not only
the time between the peaks but amplitude with some theoretical calculation in-
cluding the complicated response of the x-ray photo-cathode.
One of experiment designed was to look at the effect of inhibited process
and uninhibited transport. One expected to see a x-ray signal that might look
something like a trace in Fig.17. The important time of interest is the time be-
tween the peak of laser pulse and the high point of the second peak. The first
peak of x-ray emission come from initial interaction in outer layer of the target,
and the second peak is related somehow to the target behavior in a center. This
is not a collapse time. In all the experiment we see difference in this time for
inhibited transport and uninhibited transport. One need to determine the position
of this laser pulse relative to the x-ray pulse very accurately, that is, with
accuracy better than 20-30 ps. So we take the 4w timing pulse out of the laser
system itself. Thre is superimposed two sections of photocathode which then pro-
vide not only time resolved x-ray emission but also the timing markers (see Fig.18).
These makers are synchronized with the laser pulse. We evoluted to do that again
because of the jitter free switching. And we synchronized 4w pulses with main
laser pulse, x-ray emission pulse and the streak camera to obtain the full band-
width of X-ray streak camera.
The bottom trace in Fig.19 is the 4w timing pulses with the bounce time be-
tween ebullience to relate that time to the urn set of the first x-ray peak and
urn set of the second x-ray peak. Then we can measure the time from the first
―168―
peak and urn set of the second x-ray peak. Then we can measure the time from
the first peak of 4w pulses to the second x-ray peak and actually compared with
one dimensional calculations.
There is the second technique which is under development in our laboratory.
One technique we are developing in x-ray regime is x-ray interferometer. It is
a kind of next step beyond back-lighting. And that has not yet been put in a
dynamic situation to study laser plasma target. We are simply developing an
equipment where we can see a fringe pattern from a complicated wedge that has a
150pm spacing between the fringes and the final structual spacing associated with
problem deviations in the wedge as shown in Fig.20. The purposes to see what kind
of resolution we can get in this fringe spacing in order to look a compressed
target is spatial feature on the over 10 or 15ƒÊm.
6. Reaction Product Measurement
Now let me turn to reaction product measurement. a time of flight measure-
ment have been used in KMS Fusion and elsewhere. One of the feature of these
measurement is that with the DT reaction and contain information, for example,
of the temperature of the middle region on the half width. More over if one com-
pare the a particle traces with a fiduciary, you can essentially determine the
overall deviation of the peak and hence something about potential of the expand-
ing target. One can win a image from the core. That image is not confused by
significant electrostatic potential that exist on the target being compressed and
expanding. Here is two cases which have identical neutron yield and almost identi-
cal laser power, 1.3 and 1.2TW, and listed in Fig.21. The upper trace was a case
of a larger target, and lower was a smaller target. The difference between these
two cases is whether the laser pulse exist when the emission of nuclear particle
occur. In th case of shot #1843 the laser pulse was gone when, in fact, the
neutrons were produced. That phenomena is explained in Fig.22 which shows the
position of the laser pulse. In one case the laser pulse still overlap with the
emission time, and the other case does not or hardly has overlapping. The poten-
tial has been measured looking at the shifting of a particle spectrum as well as
broadenning in the case that the potential is generated during the absorption pro-
cess of the laser on a plasma. And a plasma can generate the potential of up to
400-500 keV with no problem. Now the beauty of this is the a particles are basi-
cally test particles, and in principle we should be able to form the compressed
region from the nuclear emission by following the potential about the particle
produced through the chamber. We should be able to map in time and space.
―169―
The potential of the pellet during the expanstion phase in turn should be re-
lated to the overall behavior of the target.
A calculation of a typical a particle spectrum is shown in Fig.23. We com-
pare a measred spectrum with the one dimenstional code we use for designing these
experiments. A major neutron yield was 108 with the predicted neutron yield of
about 108. The mean a energy was 3.02MeV and code-predicted energy of plasma 2.8MeV.
A temperature derived from present measurement was 2.2KeV, and the predicted tem-
perature was 2.3KeV. Figure 23 shows that kind of agreement that we seek endu-
eing these basic experiment. Quite wide a and proton energies are important dia-
gnostics. Figure 23 is an example of a traces and reluctant proton traces on the
same shot that can be measured the ratio to determine temperature. This was a
shot of plasma by 2TW laser with yield of 3x10⁸, and a energy and proton energy are
around 3MeV.
If one compares the experimental data with the calculated data, one can com-
pare the neutron yield that now is easy but relative insensitive. In the case of
the power of 1.3TW the measured yield is 2x10⁸ and the predicted yield is approxi-
mately 2x10⁸. The measured ion temperature is 3.2KeV, and we can calculate the
temperature of 2.7KeV. At higher power the measured temperature is 4.1KeV with
predicted temperature of 3.7KeV (see Fig.25).
Figure 26 is a slide Dr. Holtzrichter shows the progress of density in g/cm3.
These open darts are the Livermore points. The Zeta experiment, the middle sec-
tion of experiment are in that:region, and that is where Zeta facility presently
operating at about 20 times liquid density of DT.
7. Summary
We summarize in Fig.27 the status of laser fusion, that is, fusion require-
ments and experiments to date.
―170―
Fig. 1.
Fig. 2.
Fig. 3.
―171―
Fig. 4.
Fig. 5.
Fig. 6.
―172―
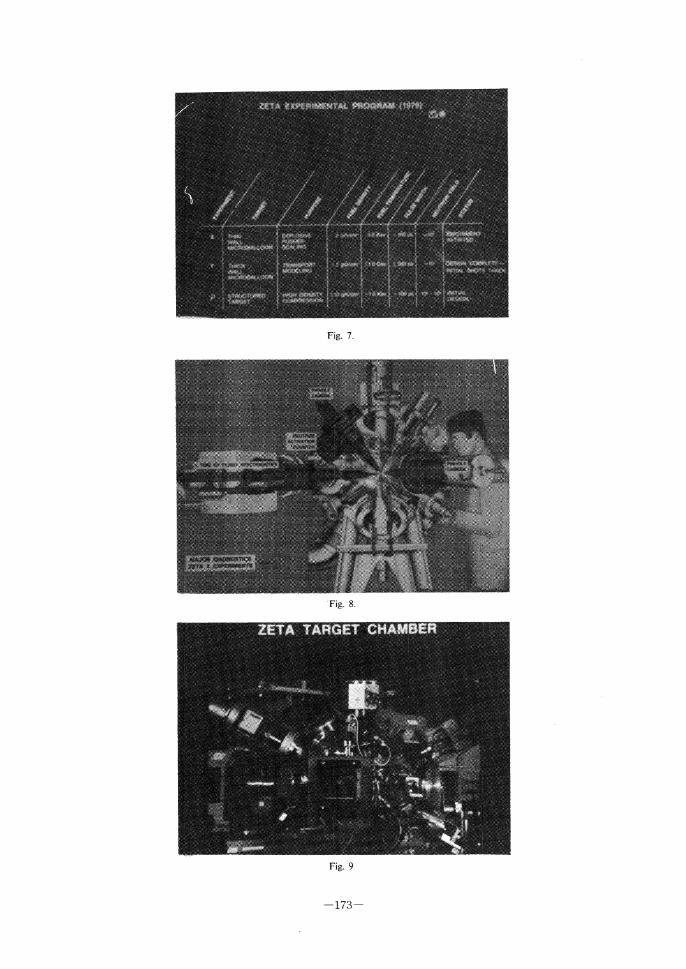
Fig. 7.
Fig. 8.
Fig. 9
―173―
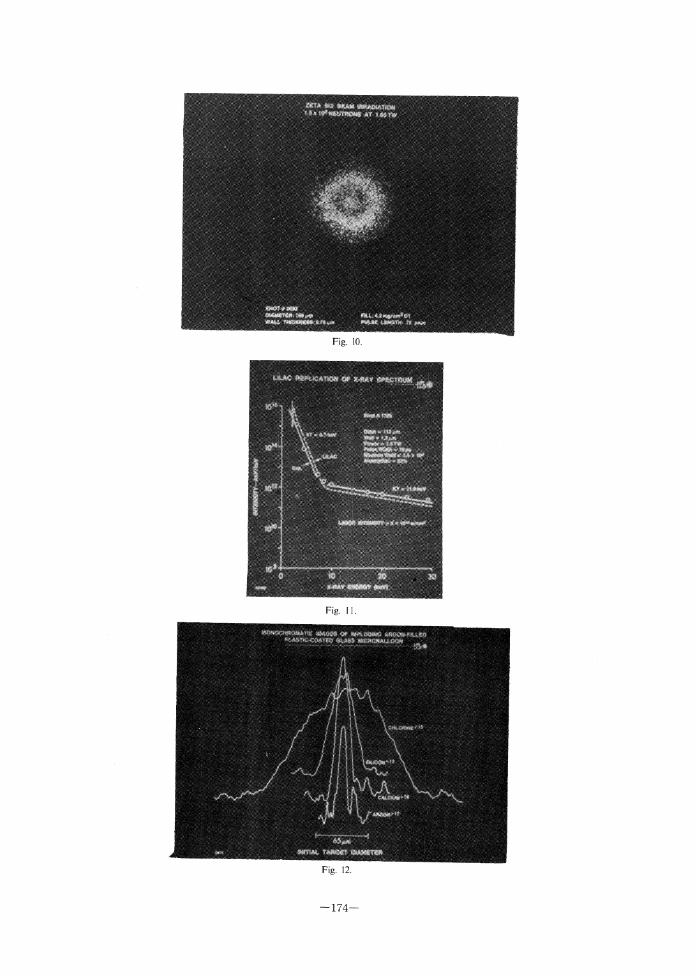
Fig. 10.
Fig. 11.
Fig. 12.
―174―
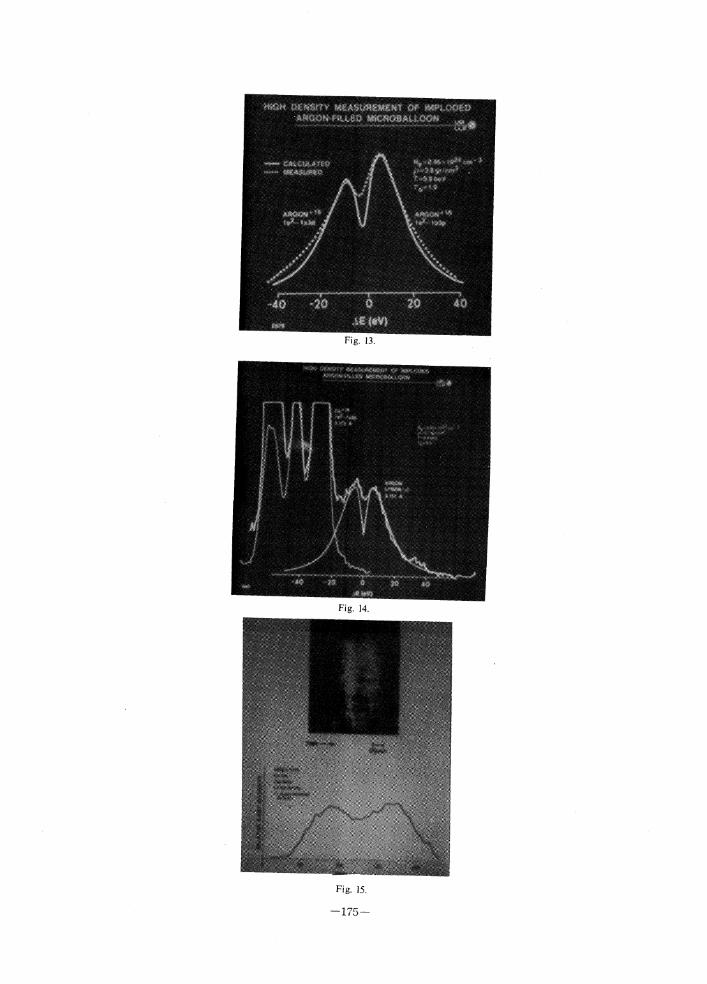
Fig. 13.
Fig. 14.
Fig. 15.
―175―
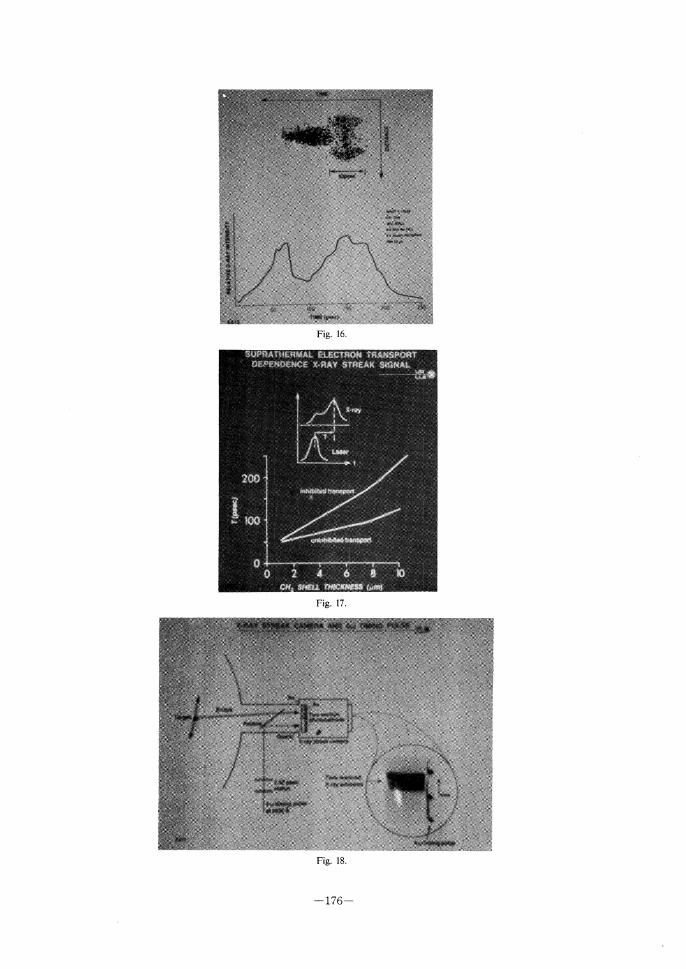
Fig. 16.
Fig. 17.
Fig. 18.
―176―
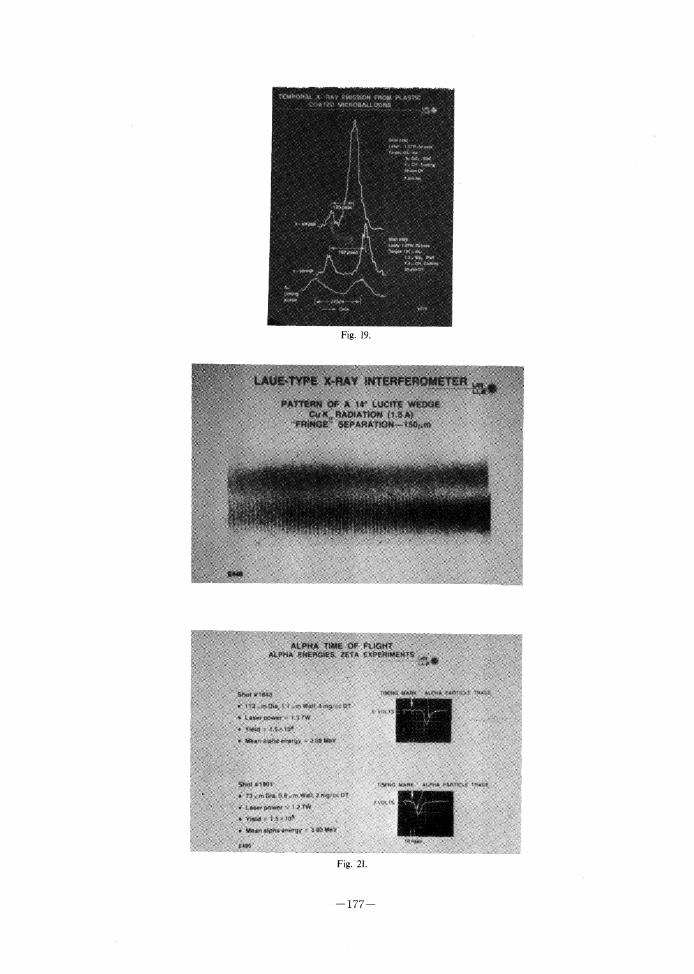
Fig. 19.
Fig. 21.
―177―
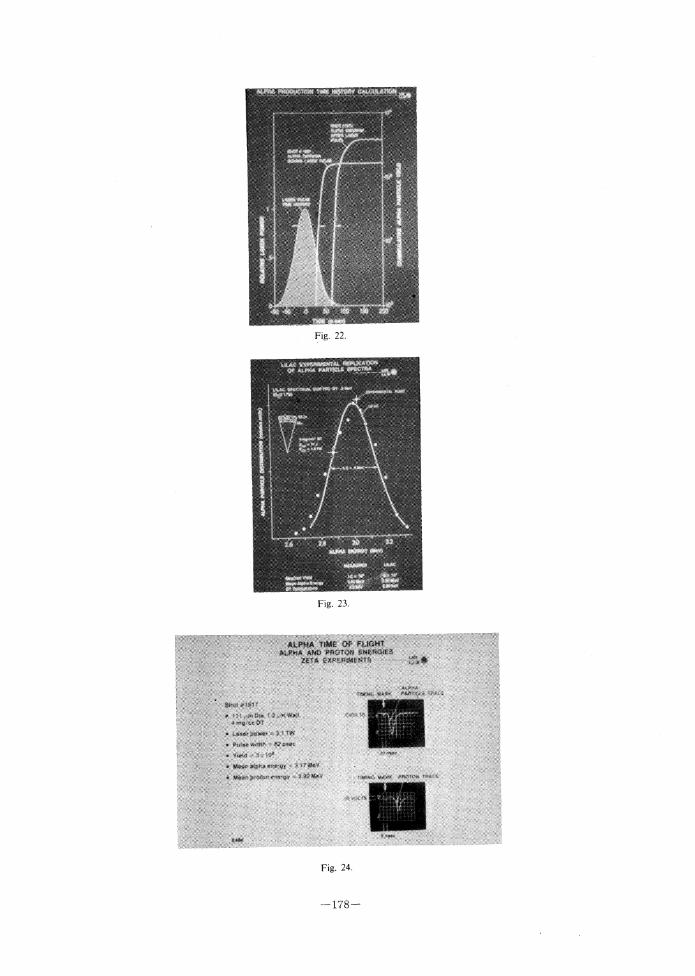
Fig. 22.
Fig. 23.
Fig. 24.
―178―
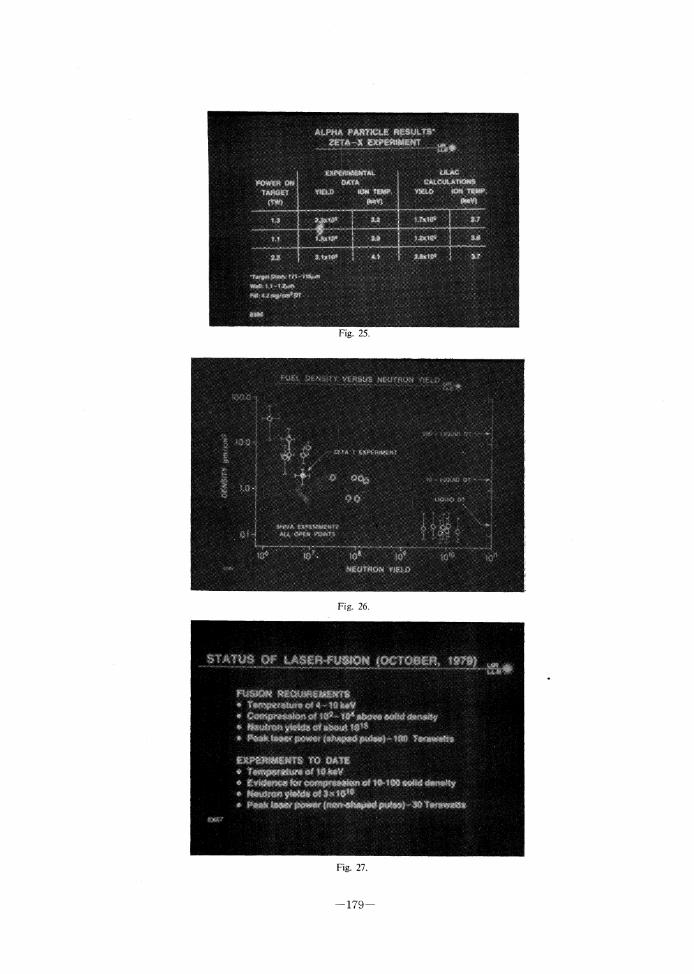
Fig. 25.
Fig. 26.
Fig. 27.
―179―