tribology online - j-stage
TRANSCRIPT

41
Tribology OnlineJapanese Society of Tribologists
http://www.tribology.jp/trol/
Vol. 14, No. 2 (2019) 41-52.ISSN 1881-2198
DOI 10.2474/trol.14.41
Article
Cobalt Oxide Diffusion Kinetics in Ultra-Thin Amorphous Carbon Films
Robert J. Waltman*
Western Digital Company, 5601 Great Oaks Parkway, San Jose, CA 95119-1003, USA
*Corresponding author: Robert J. Waltman ([email protected])
Manuscript received 27 December 2018; accepted 22 April 2019; published 15 June 2019
Abstract
The diffusion of oxidized cobalt metal (CoOx) through a sputtered amorphous carbon film is investigated as a function of carbon film thickness and of temperature in dry air. A kinetic model is developed using the experimental data. The kinetic model is based on Fickian diffusion and includes modifications for carbon film porosity, tortuosity and for pore-clogging. The experimentally determined effective diffusion coefficient, Deff, increases with increasing temperature and decreasing carbon film thickness. However, the bulk diffusion coefficient D is independent of carbon film thickness whilst strongly dependent on temperature. The diffusibility Deff /D is thus a strong function of COC film thickness but is independent of temperature, indicative that the structure of the COC film is the significant determinant. An Arrhenius treatment yields an activation energy of 19 kcal/mol. The fitting parameters required to simulate the CoOx diffusion kinetics is tabulated. CoOx diffusion is modelled at 60°C as a function of carbon film thickness.
Keywords
carbon overcoat film, thermooxidation, hard disk drives, kinetics
Copyright © 2019 Japanese Society of TribologistsThis article is distributed under the terms of the latest version of CC BY-NC-ND defined by the Creative Commons Attribution License.
1 Introduction
The thin-film magnetic layers used in rigid computer disks are based on cobalt alloys. Their corrosion is prevented by an amorphous hard carbon “overcoat” film that separates the sputtered cobalt alloys from the external environment. In today’s hard-disk drives (HDDs), approximately 25-30 Å of carbon overcoat appears to suffice. However, continuous improvement paths for storage capacity often include further reductions in the carbon overcoat film thickness whenever possible. At these reduced thicknesses, their ability to provide full coverage of the underlying magnetic alloy is severely challenged. Failure to do so results ultimately in the formation of cobalt-rich particles, primarily as oxides or hydroxides, on the overcoat surface [1]. The surface decoration is attributed to cobalt oxidation and diffusion through the overcoat film [2]. These cobalt-rich particles interfere with the low-flying read-write head and can cause catastrophic failure of the HDD. Consequently, a variety of “component” corrosion tests are used to judge the corrosion susceptibility of rigid magnetic disks during design optimization. These tests typically expose the disks to elevated temperatures, humidity, and/or acid environments as a function of time and of carbon overcoat film thickness and quantify the Co oxide evolution by various metrology. Increases in the carbon film density and/or changes to their composition often allow improved corrosion protection at reduced overcoat film thicknesses [3-6].
A rather straightforward assessment of corrosion susceptibility of the rigid magnetic disk at the component level employs thermooxidation as a function of carbon overcoat film thickness and of time. Co oxide evolution is easily detected and quantified by FTIR. In this work, we develop the diffusion kinetics for Co oxide evolution and migration through the carbon film based on Fickian diffusion corrected for porosity, tortuosity and pore-filling. The diffusion equation well-predicts the Co oxide evolution as a function of time and of carbon overcoat film thickness. Temperature-dependent data is collected to quantify the activation energy from which diffusion kinetics at any temperature can be modeled.
2 Experimental
Rigid magnetic disks were made by sputter-deposition of a Co-based magnetic recording layer (CoPtCr) onto smooth AlMg-NiP substrates as typically used in the industry. The topmost CoPtCr layer was approximately 40 Å with a mean roughness of 5 Å as determined by X-Ray Reflectivity (Panalytical X’pert Pro). Amorphous carbon overcoat films were next sputter-deposited to various film thicknesses between 18 and 32 Å. They were produced on an Anelva C-3750 using PE-CVD (Plasma Enhanced Chemical Vapor Deposition) using CxHy hydrocarbon and nitrogen gases. Both the deposited carbon film thicknesses and compositions were characterized by Auger Electron Spectroscopy. The analyses were performed on a Phi-200 Auger

Tribology Online, Vol. 14, No. 2 (2019) /42Japanese Society of Tribologists (http://www.tribology.jp/)
Robert J. Waltman
system. For each sample, two film thickness measurements were taken and averaged. These data are summarized in Table 1. The RMS roughness of the carbon films were approximately 5.2 Å as measured by XRR (X-Ray Reflectivity). Figure 1 illustrates the various film stacks used in these experiments. Most of the thermooxidation kinetics are conducted on the “carbon-Mag disks”, Fig. 1(a), which represent the focal point of these studies. We will report one set of data using the “finished disk”, Fig. 1(b). The finished disk differs from the carbon disk by a topically applied 10 Å perfluoropolyether lubricant film. During the course of these experiments we found it necessary to perform some deconvolution experiments to facilitate spectroscopic interpretation. For these purposes, additional experiments were conducted on carbon films deposited directly on the Al-Mg/Ni-P substrate with no CoPtCr magnetic layer, Fig. 1(c), and a bare CoPtCr magnetic layer with no carbon film, Fig. 1(d).
Thermooxidation kinetics as a function of carbon film thickness were conducted using a Despatch Model LLC oven. Temperatures of 60, 90, 105, 120 and 135°C in air were used. Multiple temperatures were used to provide a reliable Arrhenius treatment. 60°C represents the internal temperature of the HDD. The IR spectra were recorded as a function of carbon film thickness and of time at each temperature. Two measurements were made on each sample surface and averaged. The 1 sigma error is shown in the summary kinetics plots. A Thermo-Fisher Model 590 FTIR spectrometer equipped with a Harrick reflectance attachment was used. The angle of incidence was 70° and 32 scans at a resolution of 4 cm-1 was used to record the IR spectra.
ESCA data were taken using a Phi Quantum 2000 with Al Kα irradiation. Grazing and perpendicular measurements were conducted at 15 and 89 degrees of analyzer take-off angle, respectively, under 3 × 10⁻⁹ torr vacuum, 140 eV pass energy, and 0.25 eV step size for 30 min (grazing) and 10 min (perpendicular).
3 Results and discussion
When a rigid magnetic disk is annealed in dry air, new absorption bands in the infrared spectrum are created on both the carbon-Mag disk and the finished disk. The presence of the 10 Å lubricant film in the latter has little effect on the
thermooxidation kinetics. The rate at which these absorption bands form is a strong function of the properties of the carbon overcoat (COC) film used to separate the underlying magnetic film from the external environment. They are the COC film thickness, film density, and the composition (atomic % N, O). The objective is to quantify the diffusion kinetics based on the observed changes in the infrared spectra as a function of time, temperature and COC film thickness. An Arrhenius treatment is used to obtain the activation energy for the diffusing species.
3.1 Changes in the IR spectrum of the annealed disk surface Representative kinetics data for the changes in the infrared
(IR) spectrum of the carbon-Mag disk (Fig. 1(a)) as a function of annealing time and of temperature in air are shown in Figs. 2 and 3 as illustrative examples. Figure 2 shows the changes in the IR spectrum for 24.8 Å COC as a function of temperature at 135, 120, 105 and 90°C and for 23.1 Å COC at 60°C. Figure 3 shows the isothermal (T = 135°C) changes in the IR spectrum as a function of COC film thickness for 31.5, 26.3, 21.1 and 18.2 Å. In all cases the changes in the IR spectra are qualitatively
Co-Pt-CrMagnetic Layer
Carbon FilmLubricant Film
Carbon Film
Co-Pt-CrMagnetic Layer
Carbon Film
Ni-P
Al-Mg Co-Pt-CrMagnetic Layer
(a) (b)
(c) (d)
Fig. 1 Cartoon illustrating the disk architectures used in this study. (a) carbon-Mag disk; (b) finished disk; (c) carbon-substrate disk; (d) Mag disk. The finished disk has 10 Å of perfluoropolyether lubricant film.
Sample Name COC Thickness (Å) ± 0.2 Å
At % N ± 0.2%
At % O ± 0.2%
Carbon‐mag disk (Fig. 1(a)) 32.4 12.6 3.4
Carbon‐mag disk (Fig. 1(a)) 31.5 12.5 3.3
Carbon‐mag disk (Fig. 1(a)) 28.9 12.2 3.9
Carbon‐mag disk (Fig. 1(a)) 26.3 12.5 4.3
Carbon‐mag disk (Fig. 1(a)) 24.8 12.7 3.9
Carbon‐mag disk (Fig. 1(a)) 23.1 12.7 4.5
Carbon‐mag disk (Fig. 1(a)) 21.1 13.1 4.9
Carbon‐mag disk (Fig. 1(a)) 19.3 13.9 6.6
Carbon‐mag disk (Fig. 1(a)) 18.2 14.9 5.1
Finished Disk (Fig. 1(b)) 28.0 13.1 3.8
Carbon‐substrate disk (Fig. 1(c)) 26.2 13.2 4.4
Co‐Pt‐Cr Mag disk (Fig. 1(d)) 0
Table 1 Average carbon film properties as quantified by AES

Tribology Online, Vol. 14, No. 2 (2019) /43Japanese Society of Tribologists (http://www.tribology.jp/)
Cobalt Oxide Diffusion Kinetics in Ultra-Thin Amorphous Carbon Films
ubiquitous. An absorption band near 1760 cm-1 is initially observed after short time thermooxidation of all of the COC surfaces. This band is attributed to the carbonyl C=O stretching vibration of oxidized COC and is always produced first. The formation rates are independent of COC film thickness which is indicative that the 1760 cm-1 band originates from the carbon layer, Fig. 4. With increasing thermooxidation time the carbonyl
absorption band disappears together with the evolution of several new absorption bands near 1600 and 1400 cm-1, Figs. 2, 3. After the 1600/1400 cm-1 bands are produced, further thermooxidation eventually produces another prominent new absorption band near 680 cm-1. Graphs plotting the intensity of the 1600/1400 versus the 680 cm-1 absorption bands indicate that they are not kinetically correlated and is possibly indicative
2000 1600 1200 8000.000
0.001
0.002
0.003
COC = 24.8 AT = 135 oC
0
16
41
65
89
113
162
234
Wavenumber (cm-1)
2000 1600 1200 8000.000
0.001
0.002
0.003408
264
168
144120
72
47
24
COC = 24.8 AT = 120 oC
Wavenumber (cm-1)
2000 1600 1200 8000.000
0.001
0.002
0.003 1319
623
383
311
215
143
119
71
COC = 24.8 AT = 105 oC
Wavenumber (cm-1)
2000 1600 1200 8000.000
0.001
0.002
0.003
246
582
726
846
918
1062
1278
1590
COC = 24.8 AT = 90 oC
Wavenumber (cm-1)2000 1600 1200 800
0.000
0.001
0.002
0.003
168
1152
1680
2280
2520
2780
3072
COC = 23.1 AT = 60 oC
Wavenumber (cm-1)
680 cm-1
1600 cm-11400 cm-1
(a) (b) (c)
(d) (e)
2000 1600 1200 8000.000
0.001
0.002
0.003
016416589113162234330426
COC = 31.5 AT = 135 oC
Wavenumber (cm-1)
2000 1600 1200 8000.000
0.001
0.002
0.003
0
1641
65
89113
162234330
COC = 26.3 AT = 135 oC
Wavenumber (cm-1)
2000 1600 1200 8000.000
0.001
0.002
0.003
0
16
41
65
89113162
234
COC = 21.1 AT = 135 oC
Wavenumber (cm-1)2000 1600 1200 800
0.000
0.001
0.002
0.003
0
16
41
65
89113
162
234
COC = 18.2 AT = 135 oC
Wavenumber (cm-1)
(a) (b) (c) (d)
680 cm-1
1600 cm-1
1400 cm-1
Fig. 2 Specular reflectance IR spectra of the carbon-mag disk as a function of annealing temperature and of time in air. (a) T = 135°C; (b) T = 120°C; (c) T = 105°C; (d) T = 90°C; (e) T = 60°C. The carbon film thicknesses are (a)-(d) 24.8 Å; (e) 23.1 Å. To the right of each IR spectrum is the annealing time in hours.
Fig. 3 Specular reflectance IR spectra of the carbon-mag disk as a function of carbon film thickness and of time in air at a constant temperature of T = 135°C. (a) 31.5 Å; (b) 26.3 Å; (c) 21.1 Å; (d) 18.2 Å. To the right of each IR spectrum is the annealing time in hours.

Tribology Online, Vol. 14, No. 2 (2019) /44Japanese Society of Tribologists (http://www.tribology.jp/)
Robert J. Waltman
that another chemical species has formed. The formation rates of these new bands are COC thickness-dependent and increases with decreasing COC thickness and/or increasing temperature. If the 1600/1400 cm-1 bands had originated from the COC film itself then the evolution kinetics should have been independent of COC film thickness much like the like the 1760 cm-1 band. Instead, their formation rate is strongly dependent on COC film thickness indicating that the chemical species producing these absorption bands as a result of thermooxidation could have other origins. The kinetics of the 1600/1400 cm-1 band formation is the focal point of this investigation and will be treated in detail below. We briefly attempt to identify the chemical species that may be associated with the formation of these IR bands from which the kinetics analyses is based thereunto.
We first begin with Fig. 5 which shows the thermooxidation kinetics of the carbon-Mag disk with 26.3 Å and 0 Å of carbon film thickness, Figs. 5(a) and (b), respectively, and 26.2 Å of carbon film thickness on the Al-Mg/Ni-P substrate, Fig. 5(c). Since the COC film thicknesses are identical for carbon-Mag (Fig. 5(a)) and the carbon film on Al-Mg/Ni-P (Fig. 5(c)), their thermooxidation kinetics can be compared directly. We first
compare the carbon-Mag thermooxidation kinetics at 26 and 0 Å, respectively. The major change observed as a function on annealing is the evolution of the 680 cm-1 band for the carbon-Mag with 0 Å of carbon film thickness. This band is attributed to oxidized cobalt [7]. Without the protective COC film, the 680 cm-1 absorption band appears after only 24 hr compared to 162 hr with 26 Å of COC. In the absence of the carbon film, the 1760 and the 1600/1400 cm-1 bands are not observed. For 26 Å of COC on the Al-Mg/Ni-P substrate, Fig. 5(c), the characteristic carbon oxidation at 1760 cm-1 is observed, but there is no evolution of the 1600/1400 cm-1 bands even after 288 hr of thermooxidation. With a CoPtCr Mag layer underneath the carbon film, these bands appear after 90 hr. Thus the formation of the 1600/1400 cm-1 bands appear to require the COC/Co-Pt-Cr interface.
Figure 6 shows the salient relationship between the changes in the IR spectrum of the annealed disk and the corresponding changes in the ESCA Co 2p3/2 peak. Before annealing, the IR spectrum shows no absorption bands at 1600/1400 cm-1 and the corresponding ESCA scan shows only metallic Co, curve 1 in both Figs. 6(a), (b). As the 1600/1400 cm-1 bands develop in the IR spectrum, the corresponding ESCA data shows that most of the metallic Co becomes oxidized as evidenced by the shift in the Co 2p3/2 binding energy from 778 to 781 eV, curve 5 in both Figs. 6(a), (b). With further thermooxidation, all of the Co is oxidized, curve 6 in both Figs. 6(a), (b). The ESCA data indicates that Co is already oxidized well before the 680 cm-1 band even develops. These data indicate that the 1600/1400 cm-1 bands in the IR spectrum could be used to probe Co oxidation.
The changes in the ESCA Co 2p3/2 binding energy of the annealed finished disk is consistent with literature data for Co (II, III) oxide species, hereafter referred to generically as CoOx [8]. The origin for the CoOx is the magnetic layer beneath the COC film. CoOx diffuses through the COC film to reach the surface [1]. Additional evidence is provided next by interrogating the ESCA grazing (15°) to perpendicular (89°) ratio (Grz/Perp ratio) as a function of annealing. Table 2 shows the results of the Grz/Perp analyses of the CoOx migration before and after annealing the finished disk (curves 1 and 6 on Fig. 6). The element stacking order proceeds from top to bottom based on the largest to smallest Grz/Perp ratio. Since these are “finished disks” the topical perfluoropolyether lubricant film
0 100 200 300 400 5000.0000
0.0002
0.0004
0.0006T = 135 oC
Inte
nsity
Time (hr)
23.1 24.8 26.3 28.9 31.5 32.4
Fig. 4 Changes in the IR intensity of the 1760 cm-1 carbonyl band in the carbon-mag disk as a function of time and of carbon film thickness at T = 135°C. The inset specifies the COC film thickness in angstroms.
2000 1600 1200 8000.000
0.001
0.002
0.003
0
16
4165
89
113162234330
COC = 26.3 AT = 135 oC
Wavenumber (cm-1)
2000 1600 1200 8000.000
0.001
0.002
0.003
1470 1410
0
48
24
108
680COC = 0 AT = 135 oC
Wavenumber (cm-1)
2000 1600 1200 8000.000
0.001
0.002
0.003
COC = 26.2 AT = 135 oCAl-Mg/Ni-P/COC
288
192
96
24
0
Wavenumber (cm-1)
(a) (b) (c)Fig. 5 Specular reflectance IR spectra of carbon-Mag disk with: (a) 26.3 Å carbon film; and (b) 0 Å carbon film; and (c)
carbon-substrate disk (Fig. 1(c)) as a function of time in air at T = 135°C. To the right of each IR spectrum is the annealing time in hours.

Tribology Online, Vol. 14, No. 2 (2019) /45Japanese Society of Tribologists (http://www.tribology.jp/)
Cobalt Oxide Diffusion Kinetics in Ultra-Thin Amorphous Carbon Films
(F, C, O elements) is located topmost at the surface, followed next by the COC film (O, C, N elements), then the magnetic film (Pt, Co, Cr elements), before annealing. The significant change to note in Table 2 is that, after annealing, the Co Grz/Perp has increased from 0.142 before annealing to 0.659 after annealing. This indicates that the Co has migrated from beneath the COC film (N Grz/Perp = 0.783 before anneal) into or above the COC film (N Grz/Perp = 0.569 after anneal). The ESCA data strongly indicate that CoOx is the diffusing species whose source is the underlying magnetic film.
Referring now to the 1600/1400 cm-1 IR bands, numerous works show the IR spectrum of cobalt oxides exhibit two bands near 1600 and 1400 cm-1 [8-15]. These bands are not attributed directly to CoOx but instead originate from organic species that are chemi- and/or physi-sorbed on the CoOx surface. The observation discussed previously in Fig. 5 of the requirement of the COC/Co-Pt-Cr interface for the formation of the 1600/1400 cm-1 IR bands upon thermooxidation appears to be in agreement with literature data. These bands have been variously attributed to the asymmetric C=O stretch (~ 1600, 1380 cm-1 for cobalt oxalate); OH deformation (~ 1600, 1400 cm-1 for cobalt hydroxide); and/or surface bidentate carbonate species that are formed through the interaction of lattice oxygen of CoOx and adsorbed CO species (~ 1600 cm-1, ~ 1300 cm-1). In the case of oxalate ions, shifts in the IR absorption bands can occur as
a result of chemical structural details such as oxalate planarity or non-planarity [15]. Significant wavenumber shifts in the 1600/1400 cm-1 absorption bands are also observed between neutral, anionic and dianionic oxalates, varying from ~ 1590 to 1750 cm-1 and 1224-1394 cm-1 for the higher and lower frequency absorption bands, respectively [16-18].
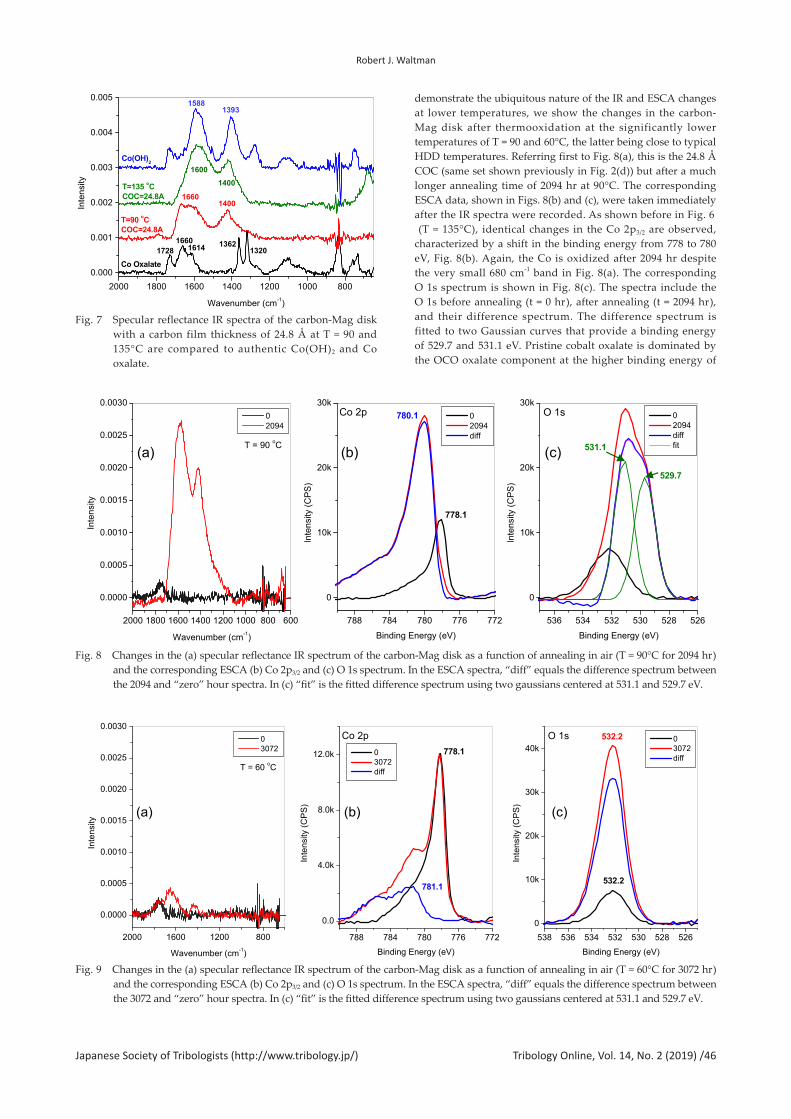
In order to better understand the 1600/1400 cm-1 absorption bands that are produced by the thermooxidation of the carbon-Mag disks (Figs. 2, 3), we compare in Fig. 7 the reflection IR spectrum of the annealed carbon-Mag disk to authentic cobalt (II) oxalate dihydrate, Co(C2O4) . 2H2O, and cobalt (II) hydroxide, Co(OH)2. The Co oxalate and Co hydroxide reflection IR spectra were produced by smearing the materials onto an unannealed carbon-Mag disk and collecting their IR spectra under identical conditions as the annealed carbon-Mag disks. Comparisons between the various spectra show significant overlap between the 1600/1400 cm-1 bands of the annealed carbon-Mag disk and the major IR absorption bands of authentic Co(OH)2 and Co(C2O4) . 2H2O. However, there are still enough differences between their IR spectra to make unequivocal species identification ambiguous, i.e., we are not able to conclude on whether or not the 1600/1400 cm-1 bands are due to Co(OH)2 and Co(C2O4) . 2H2O species.
Figures 8 and 9 compare the IR and ESCA O1s and Co 2p3/2 spectra of more annealed carbon-Mag disks. In order to
790 788 786 784 782 780 778 776 774 7720.0
0.2
0.4
0.6
0.8
1.0
Inte
nsity
(CPS
x 1
0-5)
Binding Energy (eV)
(1)
(5)
(6)
Co 2p3/2
Co
CoOx
(b)
3200 2800 2400 2000 1600 1200 800
Wavenumber (cm-1)
Inte
nsity
(1)
(5)
(6)
1760
16001400
(a)
(2)
(3)
(4)
680
Fig. 6 Changes in the (a) specular reflectance IR spectrum of the carbon-Mag disk as a function of annealing in air and (b) the corresponding ESCA Co 2p3/2 spectrum. The IR and the corresponding ESCA curve spectra are numbered in the figure, i.e., curve 5 in the ESCA spectra is taken immediately after the curve 5 IR spectrum is recorded.
Element Order Before Anneal
G/P Before Anneal
Element Order After Anneal
G/P After Anneal
F 2.082 F 2.479
O 1.239 C 1.063
C 0.785 O 0.772
N 0.783 Co 0.659
Pt 0.165 N 0.569
Co 0.142 Pt 0.084
Cr 0.000 Cr 0.013
Table 2 ESCA element stacking order (top to bottom) as determined by the grazing to perpendicular ratio (G/P) before and after annealing at T = 135°C in air for 260 hr. Since these are “finished disks” with a topical perfluoropolyether lubricant film (F, C, O elements), the lubricant layer remains on top after annealing.
Tribology Online, Vol. 14, No. 2 (2019) /46Japanese Society of Tribologists (http://www.tribology.jp/)
Robert J. Waltman
demonstrate the ubiquitous nature of the IR and ESCA changes at lower temperatures, we show the changes in the carbon-Mag disk after thermooxidation at the significantly lower temperatures of T = 90 and 60°C, the latter being close to typical HDD temperatures. Referring first to Fig. 8(a), this is the 24.8 Å COC (same set shown previously in Fig. 2(d)) but after a much longer annealing time of 2094 hr at 90°C. The corresponding ESCA data, shown in Figs. 8(b) and (c), were taken immediately after the IR spectra were recorded. As shown before in Fig. 6 (T = 135°C), identical changes in the Co 2p3/2 are observed, characterized by a shift in the binding energy from 778 to 780 eV, Fig. 8(b). Again, the Co is oxidized after 2094 hr despite the very small 680 cm-1 band in Fig. 8(a). The corresponding O 1s spectrum is shown in Fig. 8(c). The spectra include the O 1s before annealing (t = 0 hr), after annealing (t = 2094 hr), and their difference spectrum. The difference spectrum is fitted to two Gaussian curves that provide a binding energy of 529.7 and 531.1 eV. Pristine cobalt oxalate is dominated by the OCO oxalate component at the higher binding energy of
2000 1800 1600 1400 1200 1000 8000.000
0.001
0.002
0.003
0.004
0.005
T=135 oCCOC=24.8A
T=90 oCCOC=24.8A
Co Oxalate
Co(OH)2
Inte
nsity
Wavenumber (cm-1)
15881393
14001600
14001660
166016141728
13621320
Fig. 7 Specular reflectance IR spectra of the carbon-Mag disk with a carbon film thickness of 24.8 Å at T = 90 and 135°C are compared to authentic Co(OH)2 and Co oxalate.
536 534 532 530 528 526
0
10k
20k
30k
529.7
531.1
O 1s
Inte
nsity
(CPS
)
Binding Energy (eV)
0 2094 diff fit
788 784 780 776 772
0
10k
20k
30k780.1
778.1
0 2094 diff
Co 2p
Inte
nsity
(CPS
)
Binding Energy (eV)2000 1800 1600 1400 1200 1000 800 600
0.0000
0.0005
0.0010
0.0015
0.0020
0.0025
0.0030
T = 90 oC
0 2094
Inte
nsity
Wavenumber (cm-1)
(a) (b) (c)
Fig. 8 Changes in the (a) specular reflectance IR spectrum of the carbon-Mag disk as a function of annealing in air (T = 90°C for 2094 hr) and the corresponding ESCA (b) Co 2p3/2 and (c) O 1s spectrum. In the ESCA spectra, “diff” equals the difference spectrum between the 2094 and “zero” hour spectra. In (c) “fit” is the fitted difference spectrum using two gaussians centered at 531.1 and 529.7 eV.
2000 1600 1200 800
0.0000
0.0005
0.0010
0.0015
0.0020
0.0025
0.0030
T = 60 oC
0 3072
Inte
nsity
Wavenumber (cm-1)
788 784 780 776 772
0.0
4.0k
8.0k
12.0k
781.1
778.1 0 3072 diff
Co 2p
Inte
nsity
(CPS
)
Binding Energy (eV)538 536 534 532 530 528 526
0
10k
20k
30k
40k
532.2
532.2O 1s
Inte
nsity
(CPS
)
Binding Energy (eV)
0 3072 diff
(a) (b) (c)
Fig. 9 Changes in the (a) specular reflectance IR spectrum of the carbon-Mag disk as a function of annealing in air (T = 60°C for 3072 hr) and the corresponding ESCA (b) Co 2p3/2 and (c) O 1s spectrum. In the ESCA spectra, “diff” equals the difference spectrum between the 3072 and “zero” hour spectra. In (c) “fit” is the fitted difference spectrum using two gaussians centered at 531.1 and 529.7 eV.

Tribology Online, Vol. 14, No. 2 (2019) /47Japanese Society of Tribologists (http://www.tribology.jp/)
Cobalt Oxide Diffusion Kinetics in Ultra-Thin Amorphous Carbon Films
532 eV [19]. Decomposition of the oxalate with the formation of Co-O products presents an O1s peak near 530 eV [19, 20]. We can only conclude that the O1s spectrum of the annealed disk does not well-match the pristine cobalt oxalate dihydrate [19]. Comparison of the O1s spectrum of the annealed disk to authentic Co(OH)2, CoO(OH) and Co3O4 have overlapping features but again, do not provide unequivocal chemical identity [21].
Figure 9(a) shows the changes in the IR spectrum of the 23.1 Å COC after 3072 hr annealing time at 60°C. The evolution of the 1600/1400 cm-1 bands are just beginning under these conditions. The 680 cm-1 band is not even present. The corresponding ESCA data, shown in Figs. 9(b) and (c), were taken immediately after the IR spectra were recorded. As shown before in Figs. 6 and 8, considerable CoOx formation has occurred as indicated by the shift in the binding energy from 778 to 781 eV in the Co 2p3/2 spectrum, Fig. 9(b). Here the Co is only partially oxidized after 3072 hr which is consistent with the smaller progress shown in the IR spectra, Fig. 9(a). The corresponding O 1s spectrum is shown in Fig. 9(c). The spectra before and after annealing appear to be quite similar, again indicative that oxidation progress is considerably slower at the lower 60°C temperature.
From these data, we conclude that the 1600 and 1400 cm-1 absorption bands detected in the IR are associated with oxidized cobalt species (CoOx) that originate from the underlying magnetic film. The kinetics of the IR band changes for the evolution of the 1600/1400 cm-1 bands is next investigated.
3.2 Diffusion modeling The kinetics data represented by Figs. 2, 3 are analyzed by
Fickian diffusion, Eq. (1).
(1)
C is the concentration and Deff is the effective diffusion constant. Deff is correlated to the bulk diffusion coefficient, D, by Eq. (2).
Deff = Df (ε) g(s) (2)
f(ε) and g(s) are the normalized functions of porosity and pore-filling (saturation), respectively. Since the carbon film is porous, the effective transport equation is corrected for by a tortuosity factor and pore-filling. The porosity function originates from tortuosity. The tortuosity τ is defined as the shortest pathway through a porous structure, Δℓ, divided by the Euclidean distance between the starting and the end-point of the same
path, Δx, i.e., τ = Δℓ/Δx, Fig. 10. Constrictions or bottlenecks in the porous structure are not considered in this definition. Tortuosity must also include a description for the resistance of the medium to a flux, termed the tortuosity factor [22]. The relationship between the tortuosity factor, κ, and tortuosity is given in Eq. (3) [22].
κ = τ2 (3)
Tortuosity is difficult to quantify and is often related to the experimentally more accessible porosity ε. The most widely used tortuosity-porosity relationship is the Bruggeman equation based on an effective medium approach for a random porous medium [23-26].
κ = ε-1/2 (4)
Thus
f(ε) = ε/κ = ε1.5 (5)
Based upon the IR data discussed above, the oxidation of cobalt results in CoOx product. For heavy metals, the oxide has a volume which is considerably larger than that of the metal [27]. The volume increase restricts CoOx diffusion in the COC film by reducing the diffusion area and creating a more tortuous diffusion path, Fig. 10. We model this by the normalization function g(s).
(6)
Co is the asymptotic concentration given by the asymptotic intensity of the IR spectrum (e.g., Fig. 2). The exponent n can vary from approximately n = 1.5 to 5 depending upon the pore-network model [28]. In this work we limit n = 1.5 ± 0.1 for consistency to effective medium theory [29]. Equation (7) is used to model the diffusion kinetics.
(7)
Equation (7) requires the porosity as a function of carbon film thickness. Figure 11(a) shows the porosity as a function of film thickness for the carbon-Mag disks used here (Table 1). We emphasize that Fig. 11(a) is unique to the carbon films used in these experiments as ε will depend upon their composition and density which in turn is determined by the details of the sputter process used to produce the carbon films. The porosity is calculated from the carbon film density, ρ, using ε = 1 – ρ/ρo. The carbon film density used in these studies was determined
∂t∂C = Deff
∂2x∂2C
Pore clogging
CoOx
Carbon Film
Magnetic LayerDead-end pore
Open pore
COC“clusters”
Tortuosity
Δx
Δl
Fig. 10 Cartoon illustrating the tortuosity and pore-clogging concepts used to simulate the IR kinetics
g (s) = (1 − )n
Co
C
Dε1.5 (1 − )1.5Deff = Co
C

Tribology Online, Vol. 14, No. 2 (2019) /48Japanese Society of Tribologists (http://www.tribology.jp/)
Robert J. Waltman
by measuring their coverage properties as a function of film density as described previously in the literature [30, 31]. Figure 11(b) shows the critical carbon film thickness for coverage is equal to ~ 26 Å for this set of carbon films. Whilst not the focal point of these studies, Fig. 11(b) shows the perfluoropolyether (PFPE) “titrated thickness” as a function of COC film thickness used to determine the critical thickness for coverage [30, 31]. Here the PFPE is used as a sensitive molecular probe whose film thickness increases rather abruptly with decreasing carbon film thickness. This change in PFPE film thickness can be readily quantified by simple FTIR or ESCA spectroscopy. The change in the titrated PFPE film thickness with decreasing carbon film thickness provides the critical COC film thickness where its behavior towards the PFPE transitions from a bulk-like to a non-bulk-like carbon film [30, 31]. This transition thickness identifies the critical thickness for coverage [31]. Figure 11(c) shows a summary plot of the critical film thickness as a function of normalized carbon film density, ρ/ρo, where ρo = 3.52 g/cm3 for diamond [30]. A coverage value of 26 Å corresponds to a ρ/
ρo = 0.75 for this carbon film. Therefore, ε = 0.25 at 26 Å. Equation (7) was used to estimate the porosity of the
carbon films as a function of thickness (Fig. 11(a)) using the experimentally-derived ε = 0.25 at 26.3 Å. Figure 12(a) shows a plot of the concentration versus time at T = 135°C for all of the COC thicknesses in Table 1. Figure 12(a) provides the experimental Deff values at 135°C listed in Table 3. For the 26.3 Å carbon film, Deff is equal to 0.80 Å2/hr. Equation (6) provides a D = 7.5 Å2/hr. Since D is independent of COC film thickness, ε as a function of COC film thickness is solved iteratively to reproduce the diffusion kinetics using D = 7.5 ± 0.6 Å2/hr, Figs. 12(b), (c), and Table 4. Figure 12(b) shows all of the kinetics fits at T = 135°C. Figure 12(c) compares the experimentally derived Deff to those obtained using Eq. (7). The excellent fits validate the ε values of Fig. 11(a).
3.3 IR kinetics of the annealed disk surfaceThe CoOx diffusion kinetics at T = 135, 120, 105, 90 and
60°C are now discussed. Since the critical thickness for coverage
0 5 10 15 20 25 30 350.0
0.2
0.4
0.6
0.8
1.0
1 -
/o
Auger COC Thickness (A)16 20 24 28 32
30
40
50
60
70
Titra
ted
Thic
knes
s (A
)
COC Thickness (A)0.3 0.4 0.5 0.6 0.7 0.8 0.9 1.0
0
10
20
30
40
50
60
70
k=8
k=6
k=10k=12
k=4
Cov
erag
e Th
ickn
ess
(Ang
stro
m)
/o
ThisWork
(a) (b) (c)
Fig. 11 (a) The porosity as a function of COC thickness. (b) The titrated thickness for this set of carbon-Mag films. (c) The coverage thickness is used to identify the normalized density for this set of carbon-Mag films. In (c) k is equal to the number of COC layers needed for coverage [30].
0.00 0.01 0.02 0.03 0.04-9.0
-8.5
-8.0
-7.5
-7.0
-6.5
-6.0
T = 135 oC
28.9 26.3 24.8 23.1 21.1 19.3 18.2
ln C
Time-1 (hr-1)16 20 24 28 32
0
2
4
6
8
7.5 +/- 0.6
T = 135 oCD
(A2 /h
r)
COC Thickness (Angstrom)
Deff (Expmt) Deff (Fit) D (Fit)
0 100 200 300 400
0.0000
0.0004
0.0008
0.0012
0.0016
0.0020
0.0024T = 135 oC 19.3
21.1 23.1 24.8 26.3 28.9 31.5 32.4
Inte
nsity
Time (hr)
(a) (b) (c)
Fig. 12 (a) Plots of the logarithm of the IR band intensity (C) as a function of inverse time and of COC film thickness (carbon-Mag disk) for T = 135°C kinetics. (b) Changes in the IR band intensity as a function of time for T = 135°C kinetics. The lines through the data points are derived from the kinetics modeling. (c) Comparison of Deff and D values derived from this study.

Tribology Online, Vol. 14, No. 2 (2019) /49Japanese Society of Tribologists (http://www.tribology.jp/)
Cobalt Oxide Diffusion Kinetics in Ultra-Thin Amorphous Carbon Films
is determined to be near 26 Å for this set of carbon films, emphasis is placed on the CoOx diffusion kinetics for COC film thicknesses at 24.8, 26.3 and 28.9 Å. Figure 13 plots the logarithm of the concentration (IR intensity) as a function of inverse time. Linear fits are obtained in all cases to provide the experimental Deff values, Table 3. Figure 14 shows the corresponding experimental kinetics data. The solid lines passing through the experimental data points are fitted using Eq. (7) and the fitting parameters are listed in Table 4. In all cases excellent fits are obtained.
Figures 15(a)-(c) show plots of D, Deff, and the Deff /D ratio as a function of carbon film thickness. The temperatures for all figures are specified in the Fig. 15(b) legend. Figure 15(a) shows the average D decreases with decreasing temperature. As expected, D is approximately independent of COC film thickness. In contrast, Fig. 15(b) shows that Deff is a strong function of both temperature and of COC film thickness. This is because Deff is a strong function of porosity, Eq. (2). Finally, Fig. 15(c) plots the Deff /D ratio, termed “diffusibility”. The diffusibility is a strong function of COC film thickness but is observed to be independent of temperature. Hence the structure of the COC film is the significant determinant of diffusibility. Therefore, the temperature dependence of Deff originates from the corresponding temperature dependence of D.
Figure 16(a) shows D versus temperature. The goal
of this work is to provide a reliable extrapolation of the thermooxidation kinetics to HDD temperature, say, 60°C. The experimentally determined D = 0.05 Å2/hr at 60°C. Figure 16(b) shows an Arrhenius plot which provides an activation energy of 19.5 kcal/mol (0.85 eV). These data can be used to simulate CoOx diffusion at 60°C. Figure 17(a) shows CoOx diffusion as a function of distance into the COC film using the parameters of the 26.3 Å COC film.
Aproximately 20,000 hr (833 days) are required for CoOx to diffuse to the surface of the COC film. Figure 17(b) shows CoOx evolution as a function of time for the 24.8, 26.3 and 28.9 Å COC films. We define a CoOx “onset” concentration as detectable by FTIR to be 0.0004 intensity units which corresponds to the IR spectrum of Fig. 6(a) curve 3. This is close to the IR intensity at which CoOx is first observed on the carbon disk. The CoOx onset is not correlated to HDD performance in any way. Figure 17(b) shows that either increasing or decreasing the carbon film thickness by a mere 1 to 2 Å significantly impacts the time required to CoOx onset. For the “nominal” 26.3 Å film, approximately 240 days are required. A decrease in the COC film thickness by a mere 1.5 Å significantly reduces the CoOx onset time to approximately 170 days. Conversely, an increase in the carbon film thickness by several Å nearly doubles the CoOx onset time to 480 days.
COC (Å) Deff (135°C) Deff (120°C) Deff (105°C) Deff (90°C) Deff (60°C) 32.4 31.5 28.9 0.44 0.14 0.039 26.3 0.80 0.30 0.10 0.048 24.8 1.30 1.01 0.45 0.11 23.1 1.93 0.021 21.1 2.00 19.3 2.36 18.2 2.68
Table 3 Experimental Deff values determined from Figs. 12 and 13. Deff values are in units of Å2/hr.
T (oC) COC (Å) Deff (Å2/hr) D (Å2/hr) Deff / D Co n 135 32.4 0.16 7.00 0.023 0.0016 1.50 135 31.5 0.17 6.00 0.028 0.0016 1.50 135 28.9 0.49 7.50 0.065 0.0016 1.50 135 26.3 0.89 7.50 0.12 0.0016 1.50 135 24.8 1.22 7.70 0.16 0.0016 1.50 135 23.1 1.69 8.00 0.21 0.0016 1.50 135 21.1 2.12 7.50 0.28 0.0016 1.50 135 19.3 2.83 8.00 0.35 0.0016 1.60 135 18.2 3.18 8.00 0.40 0.0016 1.70 120 28.9 0.26 4.00 0.065 0.0021 1.50 120 26.3 0.53 4.50 0.12 0.0022 1.50 120 24.8 0.80 5.00 0.16 0.0022 1.45 105 28.9 0.049 0.75 0.065 0.0024 1.50 105 26.3 0.12 1.05 0.12 0.0024 1.40 105 24.8 0.24 1.50 0.16 0.0024 1.40 90 28.9 90 26.3 0.033 0.30 0.11 0.0022 1.50 90 24.8 0.092 0.60 0.16 0.0024 1.45 60 26.3 60 24.8 60 23.1 0.011 0.050 0.22 0.0024 1.50
Table 4 Calculated Deff and D values from fitting using Eq. 7

Tribology Online, Vol. 14, No. 2 (2019) /50Japanese Society of Tribologists (http://www.tribology.jp/)
Robert J. Waltman
0.000 0.005 0.010 0.015 0.020 0.025 0.030-9.0
-8.5
-8.0
-7.5
-7.0
-6.5
-6.0
T = 135 oC
ln C
Time-1 (hr-1)
24.8 26.3 28.9
0.000 0.005 0.010 0.015 0.020 0.025-10
-9
-8
-7
-6
T = 120 oC
ln C
Time-1 (hr-1)
24.8 26.3 28.9
0.000 0.002 0.004 0.006 0.008 0.010-10
-9
-8
-7
-6
T = 105 oC
ln C
Time-1 (hr-1)
24.8 26.3 28.9
0.0000 0.0004 0.0008 0.0012 0.0016-9.0
-8.5
-8.0
-7.5
-7.0
-6.5
-6.0
-5.5
T = 90 oC
ln C
Time-1 (hr-1)
24.8 26.3
0.0000 0.0002 0.0004 0.0006 0.0008 0.0010-11.0
-10.5
-10.0
-9.5
-9.0
-8.5
-8.0
-7.5
-7.0
T = 60 oC
ln C
Time-1 (hr-1)
23.1
(a) (b) (c)
(d) (e)
0 100 200 300 400
0.0000
0.0004
0.0008
0.0012
0.0016
0.0020
0.0024
0.0028
T = 135 oC
24.8 26.3 28.9
Inte
nsity
Time (hr)0 100 200 300 400 500 600
0.0000
0.0004
0.0008
0.0012
0.0016
0.0020
0.0024
0.0028
T = 120 oC
24.8 26.3 28.9
Inte
nsity
Time (hr)0 400 800 1200 1600
0.0000
0.0004
0.0008
0.0012
0.0016
0.0020
0.0024
0.0028 24.8 26.3 28.9
T = 105 oC
Inte
nsity
Time (hr)
0 500 1000 1500 2000 2500 3000 3500
0.0000
0.0004
0.0008
0.0012
0.0016
0.0020
0.0024
0.0028
T = 60 oC
Inte
nsity
Time (hr)
23.1 24.8 26.3
0 500 1000 1500 2000 2500 3000
0.0000
0.0004
0.0008
0.0012
0.0016
0.0020
0.0024
0.0028
T = 90 oC
Inte
nsity
Time (hr)
24.8 26.3 28.9
(a) (b) (c)
(d) (e)
Fig. 14 Changes in the IR band intensity as a function of time and of COC film thickness for (a) T = 135°C; (b) T = 120°C; (c) T = 105°C; (d) T = 90°C; (e) T = 60°C kinetics. The inset specifies the COC film thickness in angstroms. The lines through the data points are derived from the kinetics modeling.
Fig. 13 Plots of the logarithm of the IR band intensity (C) as a function of inverse time and of COC film thickness (carbon-Mag disk) for (a) T = 135°C; (b) T = 120°C; (c) T = 105°C; (d) T = 90°C; (e) T = 60°C kinetics. The inset specifies the COC film thickness in angstroms. The lines through the data points are derived from a least squares fit.

Tribology Online, Vol. 14, No. 2 (2019) /51Japanese Society of Tribologists (http://www.tribology.jp/)
Cobalt Oxide Diffusion Kinetics in Ultra-Thin Amorphous Carbon Films
18 20 22 24 26 28 30 32 34
0
2
4
6
8
D (A
2 /hr)
COC Thickness (A)18 20 22 24 26 28 30 32 34
0.0
0.5
1.0
1.5
2.0
2.5
3.0
3.5
T=135 oC T=120 oC T=105 oC T=90 oC T=60 oC
Def
f (A2 /h
r)
COC Thickness (A)18 20 22 24 26 28 30 32 34
0.0
0.1
0.2
0.3
0.4
Def
f / D
COC Thickness (A)
7.57 ± 0.12
4.50 ± 0.50
1.10 ± 0.38
0.45 ± 0.210.05(a) (b) (c)
Fig. 15 Comparison of Deff and D values derived from this study. (a) D versus COC thickness. (b) Deff versus COC thickness. (c) Deff /D versus COC thickness. The inset in figure b couples the data symbol to the temperature of the kinetics studies for all three figures.
60 80 100 120 1400.01
0.1
1
10
D (A
2 /hr)
Temperature (oC)
0.0024 0.0026 0.0028 0.0030-58
-57
-56
-55
-54
-53
-52
ln D
(m2 /s
ec)
1/T (Kelvin)
(a) (b)
0 4000 8000 12000 16000 20000
0.0000
0.0004
0.0008
0.0012
0.0016
0.0020
0.0024
T = 60 oC
479days
238days
167days
CoOxonset
C
onc
Time (hr)
28.9 A 26.3 A 24.8 A
0 5 10 15 20 25 30 35 40 45 50
0.00000
0.00004
0.00008
0.00012
0.00016
0.00020T = 60 oCCOC = 26.3 A
Con
c
COC Thickness (A)
7000 hr 14000 hr 20000 hr 40000 hr
(a) (b)
Fig. 17 Kinetics modeling for (a) the changes in the IR intensity (Conc) as a function of annealing time for a 26.3 Å COC film thickness (carbon-Mag disk) at T = 60°C; and (b) the changes in the IR intensity (Conc) as a function of annealing time and of COC film thickness at T = 60°C. In (b) the “onset” formation intensity of the 1600/1400 cm-1 band is specified at 0.0004.
Fig. 16 Arrhenius plots from the kinetics study

Tribology Online, Vol. 14, No. 2 (2019) /52Japanese Society of Tribologists (http://www.tribology.jp/)
Robert J. Waltman
4 Conclusions
We have developed a kinetic model to describe CoOx diffusion through a sputtered amorphous carbon film based on diffusion parameters derived of experimental thermooxidation studies as a function of carbon film thickness. The kinetic model is based on Fickian diffusion modified for carbon film porosity, tortuosity and pore-clogging. The experimentally-derived effective diffusion coefficient, Deff, increased with increasing temperature and decreasing COC film thickness. The bulk diffusion coefficient D was found to be independent of COC film thickness but increased with increasing temperature. Consequently the diffusibility, Deff /D, was a strong function of COC film thickness but independent of temperature. Hence it was determined that the structure of the COC film was the significant determinant of diffusibility. An Arrhenius plot for D yielded an activation energy of 19 kcal/mol. The equations and the fitting parameters required to simulate the CoOx diffusion through the carbon film was tabulated.
Acknowledgements
We thank X.-C. Guo for the ESCA data, J. Forrest for the Auger data, and Q.-F. Xiao for the XRR data.
References
[1] Waltman, R. J., Joseph, J. and Guo, X.-C., “An AFM Study of Corrosion on Rigid Magnetic Disks,” Corrosion Science, 52, 4, 2010, 1258-1262.
[2] Novotny, V. and Staud, N., “Correlation between Environmental and Electrochemical Corrosion of Thin Film Magnetic Recording Media,” J. Electrochem. Soc., 135, 12, 1988, 2931-2938.
[3] Anoikin, E. V., Ng, G. S., Yang, M. M., Chao, J. L., Elings, J. R. and Brown, D. W., “Ultrathin Protective Overcoats on Magnetic Hard Disks,” IEEE Trans. Magn., 34, 4, 1998, 1717-1719.
[4] Franco, L. P., Chen, M.-M., Gorman, G. L., Castillo, G., Viswanathan, L. and Duran, J., “Density Dependence of the Electrochemical Characteristics of Carbon Overcoated Thin Film Media,” J. Vac. Sci. Technol., A8, 1990, 1344-1347.
[5] Dai, Q., Yen, B. K., White, R. L., Peterson, P. J. and Marchon, B., “Toward an Understanding of Overcoat Corrosion Protection,” IEEE Trans. Magn., 39, 5, 2003, 2450-2452.
[6] Yen, B. K., White, R. L., Waltman, R. J., Mate, C. M., Sonobe, Y. and Marchon, B., “Coverage and Properties of a-SiNx Hard Disk Overcoat,” J. Appl. Phys., 93, 10, 2003, 8704-8706.
[7] Devadatha, D. and Raveendran, R., “Structural and Dielectric Characterization of Nickel-Cobalt Oxide Nanocomposite,” J. Mater. Sci. Eng., S11, 2013, 1-5.
[8] Menenzes, P. W., Indra, A., Gonzalez-Flores, D., Sahraie, N. R., Zaharieva, I., Schwarze, M., Strasser, P., Dau, H. and Driess, M., “High-Performance Oxygen Redox Catalysis with Multifunctional Cobalt Oxide Nanochains: Morphology-Dependent Activity,” ACS Catal., 5, 4, 2015, 2017-2027.
[9] Xu, H., Gao, L., Zhang, Q., Li, J., Diwu, J., Chou, X., Tang, J. and Xue, C., “Preparation Method of Co3O4 Nanoparticles Using Degreasing Cotton and Their Electrochemical Performances in Supercapacitors,” J. Nanomaterials, 2014, 723057.
[10] Patil, S. U. and Chaudhari, R. T., “Study of Transition Metal Cobalt Oxalate Crystal in Agar Agar Gel,” Arch. Appl. Sci. Res., 8, 2016, 41-46.
[11] Edwards, H. G. M. and Hardman, P. H., “A Vibrational Spectroscopic Study of Cobalt(II) Oxalate Dihydrate and the Dipotassium Bisoxalatocobalt(II) Complex,” J. Molec. Struct., 273, 1992, 73-84.
[12] Fujita, J., Martell, A. E. and Nakamoto, K., “Infrared Spectra of Metal
Chelate Compounds. VIII. Infrared Spectra of Co(III) Carbonato Complexes,” J. Chem. Phys., 36, 2, 1962, 339-345.
[13] Lin, H.-K., Wang, C.-B., Chiu, H.-C. and Chien, S.-H., “In Situ FTIR Study of Cobalt Oxides for the Oxidation of Carbon Monoxide,” Catalysis Lett., 86, 1-3, 2003, 63-68.
[14] Fujita, J., Nakamoto, K. and Kobayashi, M., “Infrared Spectra of Metallic Complexes. III. The Infrared Spectra of Metallic Oxalates,” J. Phys. Chem., 61, 7, 1957, 1014-1015.
[15] Peterson, K. I. and Pullman, D. P., “Determining the Structure of Oxalate Anion Using Infrared and Raman Spectroscopy Coupled with Gaussian Calculations,” J. Chem. Educ., 93, 6, 2016, 1130-1133.
[16] Jung, Y. M., “Characterization of pH-Dependent IR Spectra of Oxalic Acid: Comparison of Self-Modeling Curve Resolution Analysis with Calculation of IR Frequencies,” Bull. Korean Chem. Soc., 24, 9, 2003, 1410-1412.
[17] Ito, K. and Bernstein, H. J., “The Vibrational Spectra of the Formate, Acetate, and Oxalate Ions,” Can. J. Chem., 34, 2, 1956, 170-178.
[18] Bowen, P., Pujol, O., Jongen, N., Lemaitre, J., Fink, A., Stadleman, P. and Hofman, H., “Control of Morphology and Nanostructure of Copper and Cobalt Oxalates: Effect of Complexing Ions, Polymeric Additives and Molecular Weight,” Nanoscale, 2, 11, 2010, 2470-2477.
[19] Chenakin, S. P., Szukiewicz, R., Barbosa, R. and Kruse, N., “Surface Analysis of Transition Metal Oxalates: Damage Aspects,” J. Electron Spectrosc. Related Phenom., 209, 2016, 66-77.
[20] Nikumbh, A. K., Athare, A. E. and Raut, V. B., “A Study of the Thermal Decomposition of Cobalt(II) and Nickel(II) Oxalate Dihydrate using Direct Current Electr ical Conductivi ty Measurements,” Thermochim. Acta, 186, 2, 1991, 217-233.
[21] Yang, J., Liu, H., Martens, W. N. and Frost, R. L., “Synthesis and Characterization of Cobalt Hydroxide, Cobalt Oxyhydroxide, and Cobalt Oxide Nanodiscs,” J. Phys. Chem. C, 114, 1, 2010, 111-119.
[22] Epstein, N., “On Tortuosity and the Tortuosity Factor in Flow and Diffusion through Porous Media,” Chem. Eng. Sci., 44, 3, 1989, 777-779.
[23] Tjaden, B., Brett, D. J. and Shearing, P. R., “Tortuosity in Electrochemical Devices: A Review of Calculation Approaches,” Int. Mater. Rev., 63, 2, 2018, 47-67.
[24] Bruggeman, D. A. G., “Calculation of Various Physics Constants in Heterogeneous Substances. I. Dielectricity Constants and Conductivity of Mixed Bodies from Isotropic Substances,” Ann. Phys., 416, 1935, 636-664.
[25] Tjaden, B., Cooper, S. J., Brett, D. J. L., Kramer, D. and Shearing, P. R., “On the Origin and Application of the Bruggeman Correlation for Analysing Transport Phenomena in Electrochemical Systems,” Current Opinion in Chem. Eng., 12, 2016, 44-51.
[26] Zamel, N., Astrath, N. G. C., Li, X., Shen, J., Zhou, J., Astrath, F. B. G., Wang, H. and Liu, Z.-S., “Experimental Measurements of Effective Diffusion Coefficient of Oxygen-Nitrogen Mixture in PEM Fuel Cell Diffusion Media,” Chem. Eng. Sci., 65, 2, 2010, 931-937.
[27] Wranglen, G., “An Introduction to Corrosion and Protection of Metals,” Chapman and Hall, Ltd., New York, 1985, 140.
[28] Hwang, G. S. and Weber, A. Z., “Effective-Diffusivity Measurement of Partially-Saturated Fuel-Cell Gas-Diffusion Layers,” J. Electrochem. Soc., 159, 11, 2012, F683-F692.
[29] Pasaogullari, U. and Wang, Y. C., “Liquid Water Transport in Gas Diffusion Layer of Polymer Electrolyte Fuel Cells,” J. Electrochem. Soc., 151, 3, 2004, A399-A406.
[30] Yen, B. K., White, R. L., Waltman, R. J., Mate, C. M., Sonobe, Y. and Marchon, B., “Coverage and Properties of a-SiNx Hard Disk Overcoat,” J. Appl. Phys., 93, 2003, 8704-8706.
[31] Waltman, R. J., Zhang, H., Khurshudov, A., Pocker, D., Karplus, M. A., York, B., Xiao, Q.-F., Zadoori, H., Thiele, J.-U. and Tyndall, G. W., “The Effect of Carbon Overcoat Thickness on the Zdol Boundary Lubricant Film,” Tribol. Lett., 12, 1, 2002, 51-60.