hybridization of selected nigerian lignocellulosic - j-stage
TRANSCRIPT
1
Journal of Oleo ScienceCopyright ©2021 by Japan Oil Chemists’ SocietyJ-STAGE Advance Publication date : June 11, 2021doi : 10.5650/jos.ess21038J. Oleo Sci.
Hybridization of Selected Nigerian Lignocellulosic Biomass Feedstocks for Bioethanol Production: Modeling and Optimization of Pretreatment and Fermentation Process Parameters Using Response Surface MethodologyAdeolu A. Awoyale1,2* and David Lokhat1
1 Reactor Technology Research Group, School of Engineering, University of KwaZulu-Natal, Durban, SOUTH AFRICA2 Petroleum and Natural Gas Processing Department, Petroleum Training Institute, Effurun, NIGERIA
1 IntroductionLignocellulosic biomass obtained from agricultural resi-
dues has been a good raw material in the production of fuel bioethanol as they are readily available, cheaply acquired(as they are waste materials that would have been discard-ed), and most importantly, they are very rich in polysac-charide(cellulose, hemicellulose, and lignin)1). Nigeria is blessed with a large expanse of arable land for crop cultiva-tion from which lignocellulosic biomasses can be obtained as wastes after processing. Till now, the economy of Nigeria is worryingly dependent on crude oil with the country oc-cupying 8th position among the largest global oil producers and accounts for close to 3% of the entire world’s oil pro-duction2). Crude oil being a fossil fuel is non-renewable and not environmentally friendly3). The use of bioethanol pro-duced from lignocellulosic biomasses such as cassava peels,
*Correspondence to: Reactor Technology Research Group, School of Engineering, University of KwaZulu-Natal, Durban, SOUTH AFRICAE-mail: [email protected], [email protected] ORCID ID: https://orcid.org/0000-0002-9759-1227Accepted March 23, 2021 (received for review January 25, 2021)Journal of Oleo Science ISSN 1345-8957 print / ISSN 1347-3352 onlinehttp://www.jstage.jst.go.jp/browse/jos/ http://mc.manusriptcentral.com/jjocs
yam peels, rice husks, corn cobs, among others as an alter-native source of fuel for automobiles is a positive develop-ment and is currently being embraced by many countries of the world.
Bioethanol is an evaporative, colorless liquid that is pro-duced by the fermentation and subsequent distillation of starchy food crops such as yam, corn, cassava, potatoes, and so on. The production of bioethanol meant for aug-mentation/replacement of the conventional automobile fuel(gasoline)from lignocellulosic biomass is a process that is vigorously being pursued by many researchers world over because of its environmental friendliness and renewability4, 5). In comparison with gasoline fuel, bioethanol is more benefi-cial because of its very high octane number, wider flamma-bility limits, better heat of vaporization, and most impor-tantly, the lesser release of acid gases such as carbon(iv)
Abstract: In this study, hybridized feedstocks (mixtures of biomass) of cassava peels plus yam peels, as well as corn cobs plus rice husks biomass, were optimized using the response surface methodology centered on the statistical design of experiments (DOE) of the Box-Behnken design (BBD), to produce bioethanol. The feedstocks were locally sourced, hybridized (mixed), pretreated, and fermented before being distilled in a UOP3CC continuous distillation column. The BBD was applied using a 3-level, 3-factor process variables using pH, time, and particle size, and indicated as X1, X2, and X3, respectively. The bioethanol yield from the two hybridized biomass feedstocks was predicted by the developed quadratic polynomial models from BBD. For the hybridized biomass mixture of cassava peels plus yam peels, the optimal condition was statistically predicted as pH 5.00, fermentation time of 120.00 hours, and particle size of 362.5 microns, the predicted bioethanol yield under the optimal condition was 115.75 mL per 1500 g of hybridized biomass and the average volume of bioethanol obtained was 125.00 mL per 1500 g of biomass, which is within the projected range of the model equation, same applies to rice husks plus corn cobs hybridized biomass, but with a better prospect for bioethanol production.
Key words: bioethanol, Box–Behnken design, pretreatment, modeling, optimization
A. A. Awoyale and D. Lokhat
J. Oleo Sci.
2
oxide and Sulphur(iv)oxide6). Aside from its use as fuel, bioethanol obtained from lig-
nocellulosic biomasses can be used for other important purposes in the food industry such as for food preserva-tion7).
At present globally, the use of combined lignocellulosic biomass feedstock for bioethanol production is not being adequately harnessed. There is a dearth of information globally on the performance of hybridized(mixed)feed-stocks in bioethanol production, however, the little infor-mation that could be gathered from previous researches shows that the use of combined feedstock can influence massive savings in the production process when compared to the use of single feedstocks as it ensures availability of enough feedstocks for bioethanol production. Also, the in-formation available shows that the use of mixed feedstock in bioethanol production gives a higher yield of bioethanol than the single feedstocks8).
The modeling and optimization of the bioethanol produc-tion process help in the improvement of the process design and operation of process units for improved production of bioethanol from some of the available lignocellulosic biomass available in Nigeria. The importance of bioethanol in the emerging renewable energy development in Nigeria makes the optimization of its production process a worthy venture to provide information that serves as a reference for future researchers and industrialists in this field of study. Numerous designs of experiments(DOEs)notably Box-Behnken design(BBD), central composite design(CCD), and face-centered composite design(FCCD)can be used for research purposes9).
Response surface methodology(RSM)is a compendium comprising of mathematical and statistical methods used for optimizing processes involving many process variables to give desirable responses and the major goal is to opti-mize the responses obtained. RSM expresses the impact of the identified process variables singly and/or their collab-orative effects on the response of the process. From a few experiments, RSM develops a huge quantity of information that describes the characteristics of the system and devel-ops a second-order polynomial projecting model that cor-relates the response of the process to the independent process variables10, 11).
Box -Behnken design(BBD)is a set of rotatable or almost rotatable second-order models centered on 3-level partial factorial models The BBD is an effective design for re-sponse surface methodology as it evaluates factors of qua-dratic model, develops successive models, utilizes blocks, and identifies lack of fit of a model12).
RSM comes with the advantages of requiring a much lower number of experimental runs required to assess nu-merous parameters(independent variables)and their rela-tionships, also, the process can be easily modeled mathe-matically and is time and cost-saving. Other design
methods such as artificial Neural network(ANN)has a major disadvantage of requiring numerous data points for the analysis13).
Timung et al.14)worked on the comparative study of the optimization of dilute acid and hot water pretreatment of different lignocellulosic biomass. The major focus of their work involved the comparison of the total reducing sugars(TRS)after the acid and hot water pretreatment on the different lignocellulosic biomass and the results obtained showed that the maximum production of TRS was noticed at run order 8 in both the acid and hot water pretreatment for sugar cane bagasse biomass.
Chen et al.15)worked on understanding alkaline pretreat-ment parameters for corn stover enzymatic saccharifica-tion. The total number of experiments required to investi-gate the correlation between pretreatment parameters and compositional change of pretreated corn stover, as well as its glucan/xylan transformation was investigated using the central composite design to reduce the total number of ex-periments. The result of their work showed that the sodium hydroxide loading is the most prevailing variable for enzymatic digestibility.
The objective of this work is to optimize the production of bioethanol from hybridized i.e a mixture of cassava peels plus yam peels and corn cobs pus rice husks biomass using the Box-Behnken design(BBD)of the response surface methodology(RSM). Hybridization of the biomass feed-stock is expected to impart some unique behaviors to the process which ultimately improves the bioethanol yield and purity of the produced bioethanol. Furthermore, there is little information about the potentials of yam peels biomass for bioethanol production in the literature. The hydridized feedstocks are more representative of commercial practice, as it would be difficult to operate at scale with single biomass sources. This is the particularly novel component of this study. The BBD was used to generate the experi-mental runs to acquire data which were then used for the modeling and optimization of the pretreatment and fer-mentation parameters namely; time, pH, and particle size for response surface methodology. The success of this in-vestigation will help to determine the best approach for bioethanol production from hybridized(mixed)biomass of different particle sizes.
2 Experimental Section2.1 Materials and biomass preparation and pretreatment
Materials and Biomass provision. The rice husks were obtained from a local rice mill in Ekperi, Etsako Central Local government Area of Edo State Nigeria, the corn cobs were obtained from Ogume, Ndokwa West Local Govern-ment Area of Delta State Nigeria, the cassava peels, yam peels, and sugar cane bagasse were all sourced from
Bioethanol, Box–Behnken design, pretreatment, modeling, optimization
J. Oleo Sci.
3
Effurun, Uvwie Local Government Area of Delta State Nigeria. The biomass was afterward sundried for about seven days and then grounded in a mill after which they were sieved into two particle sizes of 300 and 425 microns respectively. Analytical grade chemical reagents such as sodium hydroxide pellets, hydrogen peroxide, and tetraox-osulphate(VI)acid were used. To study the effects of biomass combinations, 750 g each of 300 microns particle size cassava and yam peels biomass and corn cobs and rice husks biomass was measured and transferred into different vessels. The pretreatment and characterization of the biomass have been discussed in our previous work16). Ap-proximately 10 liters of each of the pretreated biomass were obtained and made up to 15 liters by the addition of water and transferred to the fermentation vessels.
2.2 FermentationIndustrial grade S. cerevisiae Y-461159 yeast produced
by Nike Chemical India was used for the fermentation of the pretreated hybridized biomass samples. The procedure used by Pratto et al.17)was followed in the activation of the S. cerevisiae yeast. The process was activated in an Erlen-meyer flask. 10 g/L yeast extract, 20 g/L peptones, and 40 g/L glucose were thoroughly mixed in an incubator at a temperature of 34℃ for four hours before about 3 g/L dry cell weight each was introduced in the pretreated hybrid-ized biomass after the pretreated samples were adjusted for pH in the range of 5.7 to 6.0. They were then left to ferment for 5 and 7 days at ambient temperature before being harvested for distillation.
2.3 Distillation of produced bioethanolThe fermented supernatants were harvested on the 5th
and 7th day and made to undergo distillation in a UOP3CC continuous distillation column supplied by Armfield. The UOP3CC is equipped with a matching computer, fully in-stalled with Armfield software, to supply output informa-tion received from its sensors.
The distillate received from the UOP3CC continuous dis-tillation column was measured with a measuring cylinder and recorded.
2.4 Optimization process using response surface meth-odology(RSM)
The use of the conventional approach to determine the optimum levels of all the process parameters comes with some disadvantages such as; waste of time, more experi-mental runs which may not be reliable and makes the total process cost unnecessarily over-bloated. All these short-comings can be mitigated by the optimization of all the process conditions using RSM, which is an example of the statistical experimental model. This approach is most notably an expense of time and resources as well as more reliability. The Design-Expert 8.0.3.1 software(Stat-Ease Inc., Minneapolis, MN, USA)was used for the design, mod-eling, and optimization studies. Three different parameters were chosen as independent variables: pH, time, and Parti-cle Size, and assigned as X1, X2, and X3, respectively in Table 1. The low, middle, and high levels of each variable were coded as -1, 0, and +1, respectively. Box-Behnken was employed for the design of the experiment for the op-timization studies involving Cassava peels plus yam peels biomass. In this study, Box-Behnken design(BBD), a class of rotatable or nearly rotatable second-order design based on three-level incomplete factorial designs, was selected for the experimental design. Box-Behnken can be applied as an effective method to develop the second-order re-sponse models. The Box-Behnken consists of three sec-tions including the full or fractional factorial design points(where the factor levels were coded to the upper level to +1 and the lower level to -1 values), axial points(some-times called “star” points), and the center point. A three-level-three-factor design was applied, which generated 17 experimental runs for bioethanol production as shown in Table 2. This included 12 factorial points and 5 central points to supply data involving the core of the experimen-tal region. Response surface methodology(RSM)was used to optimize the bioethanol production process from the hy-bridized feedstocks and regression equation analysis was used to assess the response surface model. To relate the response variable to the independent factors, numerous regressions were used to match the coefficient of the poly-nomial model of the response. The property of the fit of the model was assessed using the test of significance and analysis of variance(ANOVA). The generalized response surface model for describing the variation in the response
Table 1 Coding of experimental factors and levels for bioethanol production from hybridized biomass samples.
Variable Unit SymbolsCoded factors
-1 0 +1pH X1 5 7.5 10
Time hr X2 120 144 168Particle Size Microns X3 300 362.5 425
A. A. Awoyale and D. Lokhat
J. Oleo Sci.
4
variable is given as:
Y=b0+Σk
i=1bi Xi+Σ
k
i=1bii Xi
2+Σk
i<jbij Xi+e (2)
Where Y is the response variable, bo is the intercept value, bi(i=1, 2... k)is the first-order model coefficient, bij is the interaction effect, and bii represents the quadratic coeffi-cients of Xi. Xi and Xj are the input variables that influence the response variable and e represents the random error.
2.5 Analysis of the produced bioethanol The produced bioethanol samples were then taken to
Lighthouse Petroleum Engineering Company Limited, Effurun GRA, Delta State, Nigeria for characterization for physical and fuel properties using the test methods as shown in Table 3.
3 Results and Discussion3.1 Regression model and statistical analysis for the pro-
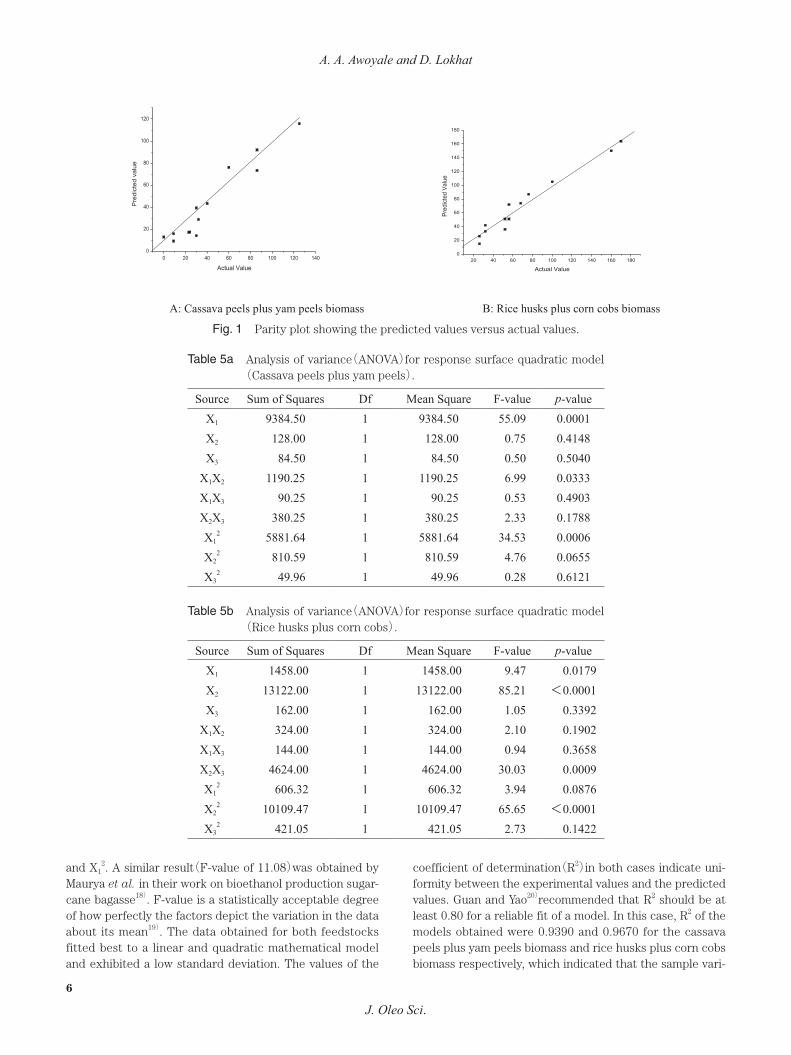
duced bioethanol from the hybridized feedstocksTables 4a and 4b depict the data for actual, predicted
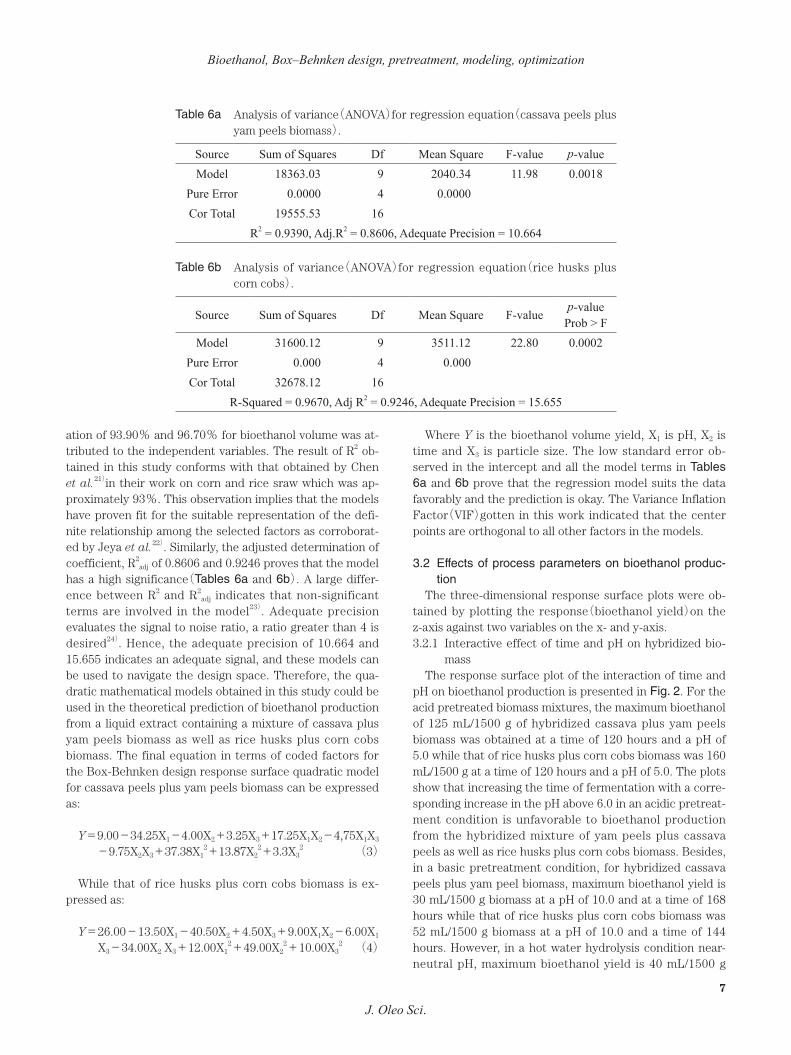
and residual values gotten and the parity curve is shown in Fig. 1. Tables 5a and 5b show the results of BBD analysis of variance(ANOVA)for the response surface quadratic model. The outcomes revealed that the p-values of X1, X2, and X1
2 of the model terms were significant(i.e. p<0.05)while others are non-significant for the two hybridized feedstocks. The high Fisher test F-value of 11.98 and 22.80 as shown in the analysis of Variance(ANOVA)for Regres-sion Equation of Tables 6a and 6b for cassava plus yam peels and rice husks plus corn cobs respectively implies the model is significant which is also reflected in X1, X2,
Table 2 Box Behnken for three independent factors for bioethanol production showing coded and actual value(in bracket).
Std Run X1 X2 (hr) X3 (microns)1 -1 (5) -1 (120) 0 (362.5)2 1 (5) -1 (120) 0 (362.5)3 -1 (5) 1 (168) 0 (362.5)4 1 (10) 1 (168) 0 (362.5)5 -1 (5) 0 (144) -1 (300)6 1 (10) 0 (144) -1 (300)7 -1 (5) 0 (144) 1 (425)8 1 (10) 0 (144) 1 (425)9 0 (7.5) -1 (120) -1 (300)10 0 (7.5) 1 (168) -1 (300)11 0 (7.5) -1 (120) 1 (425)12 0 (7.5) 1 (168) 1 (425)13 0 (7.5) 0 (144) 0 (362.5)14 0 (7.5) 0 (144) 0 (362.5)15 0 (7.5) 0 (144) 0 (362.5)16 0 (7.5) 0 (144) 0 (362.5)17 0 (7.5) 0 (144) 0 (362.5)
Table 3 Test methods used for characterization of the produced bioethanol.
Parameter Test methodBoiling Point, °F ASTM D2892Density, lb/gal ASTM D1298RVP, psi ASTM D 323-99aFlashpoint, ℃ ATM D93-13Heat of vaporization, Btu/lb ASTM E2071Autoignition point, °F ASTM E659, ASTM D1929Flammability Limit, % ASTM E918Air: Fuel Ratio, Weight %Flame Temperature, °FHeat of Combustion, Btu/gal ASTM D240Octane number ASTM D 2700Lower Heating Value, Btu/lb ASTM E711, ASTM D5865Higher Heating value, Btu/lb ASTM E711, ASTM D5865Melting point, °F ASTM D 87Specific Gravity ASTM D 1298-99

Bioethanol, Box–Behnken design, pretreatment, modeling, optimization
J. Oleo Sci.
5
Table 4a Experimental data for observed yield, predicted yield, and residual values for bioethanol production from cassava peels plus yam peels.
Std Observed Volume (mL/1500 g biomass)
Predicted Volume (mL/1500 g biomass) Residual Values
1 125.00 115.75 9.252 0.000 12.75 -12.753 86.00 73.25 12.754 30.00 39.25 -9.255 60.00 76.00 -16.006 23.00 17.00 6.007 86.00 92.00 -6.008 30.00 14.00 16.009 24.00 17.25 6.75
10 32.00 28.75 3.2511 40.00 43.25 -3.2512 9.00 15.75 -6.7513 9.00 9.00 0.00014 9.00 9.00 0.00015 9.00 9.00 0.00016 9.00 9.00 0.00017 9.00 9.00 0.000
Table 4b Experimental data for observed yield, predicted yield, and residual values for bioethanol production from rice husks plus corn cobs biomass.
Std Observed volume(mL/1500 g biomass)
Predicted volume(mL/1500 g biomass) Residual value
1 160.00 150.00 10.002 100.00 105.00 -5.003 56.00 51.00 5.004 32.00 42.00 -10.005 52.00 51.00 1.006 52.00 36.00 16.007 56.00 72.00 -16.008 32.00 33.00 -1.009 76.00 87.00 -11.0010 68.00 74.00 -6.0011 170.00 164.00 6.0012 26.00 15.00 11.0013 26.00 26.00 0.00014 26.00 26.00 0.00015 26.00 26.00 0.00016 26.00 26.00 0.00017 26.00 26.00 0.000
A. A. Awoyale and D. Lokhat
J. Oleo Sci.
6
and X12. A similar result(F-value of 11.08)was obtained by
Maurya et al. in their work on bioethanol production sugar-cane bagasse18). F-value is a statistically acceptable degree of how perfectly the factors depict the variation in the data about its mean19). The data obtained for both feedstocks fitted best to a linear and quadratic mathematical model and exhibited a low standard deviation. The values of the
coefficient of determination(R2)in both cases indicate uni-formity between the experimental values and the predicted values. Guan and Yao20)recommended that R2 should be at least 0.80 for a reliable fit of a model. In this case, R2 of the models obtained were 0.9390 and 0.9670 for the cassava peels plus yam peels biomass and rice husks plus corn cobs biomass respectively, which indicated that the sample vari-
Fig. 1 Parity plot showing the predicted values versus actual values.
Table 5a Analysis of variance(ANOVA)for response surface quadratic model(Cassava peels plus yam peels).
Source Sum of Squares Df Mean Square F-value p-valueX1 9384.50 1 9384.50 55.09 0.0001X2 128.00 1 128.00 0.75 0.4148X3 84.50 1 84.50 0.50 0.5040
X1X2 1190.25 1 1190.25 6.99 0.0333X1X3 90.25 1 90.25 0.53 0.4903X2X3 380.25 1 380.25 2.33 0.1788X1
2 5881.64 1 5881.64 34.53 0.0006X2
2 810.59 1 810.59 4.76 0.0655X3
2 49.96 1 49.96 0.28 0.6121
Table 5b Analysis of variance(ANOVA)for response surface quadratic model(Rice husks plus corn cobs).
Source Sum of Squares Df Mean Square F-value p-valueX1 1458.00 1 1458.00 9.47 0.0179X2 13122.00 1 13122.00 85.21 <0.0001X3 162.00 1 162.00 1.05 0.3392
X1X2 324.00 1 324.00 2.10 0.1902X1X3 144.00 1 144.00 0.94 0.3658X2X3 4624.00 1 4624.00 30.03 0.0009X1
2 606.32 1 606.32 3.94 0.0876X2
2 10109.47 1 10109.47 65.65 <0.0001X3
2 421.05 1 421.05 2.73 0.1422
Bioethanol, Box–Behnken design, pretreatment, modeling, optimization
J. Oleo Sci.
7
ation of 93.90% and 96.70% for bioethanol volume was at-tributed to the independent variables. The result of R2 ob-tained in this study conforms with that obtained by Chen et al.21)in their work on corn and rice sraw which was ap-proximately 93%. This observation implies that the models have proven fit for the suitable representation of the defi-nite relationship among the selected factors as corroborat-ed by Jeya et al.22). Similarly, the adjusted determination of coefficient, R2
adj of 0.8606 and 0.9246 proves that the model has a high significance(Tables 6a and 6b). A large differ-ence between R2 and R2
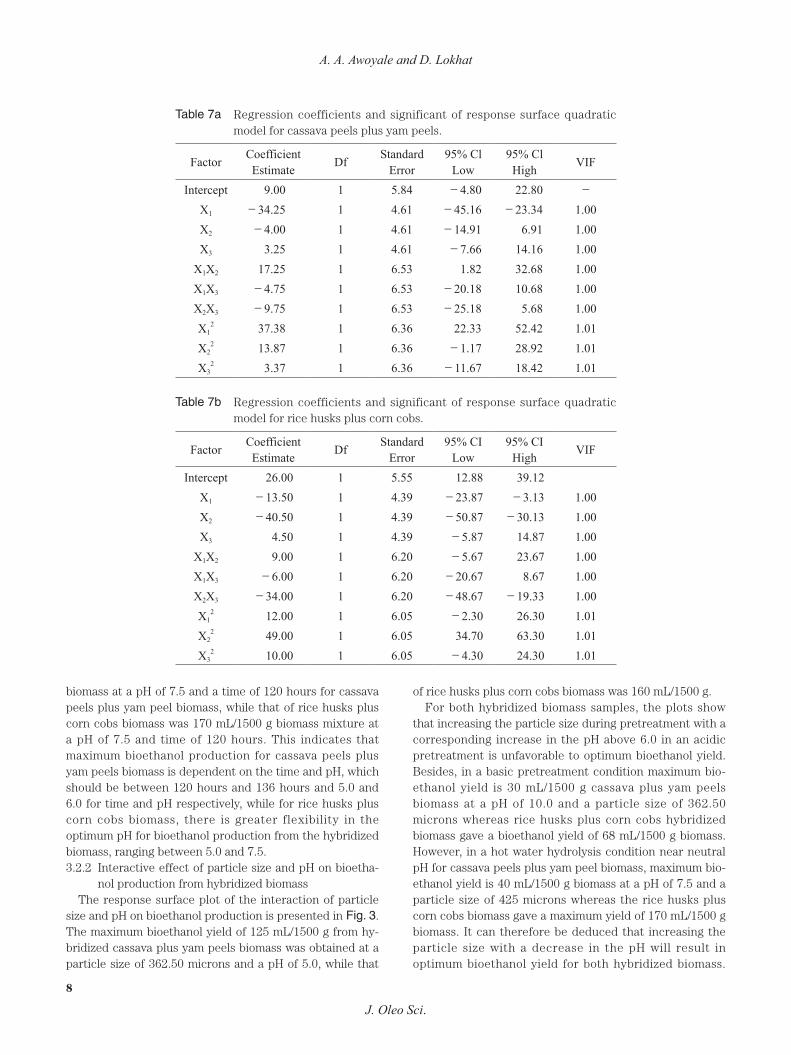
adj indicates that non-significant terms are involved in the model23). Adequate precision evaluates the signal to noise ratio, a ratio greater than 4 is desired24). Hence, the adequate precision of 10.664 and 15.655 indicates an adequate signal, and these models can be used to navigate the design space. Therefore, the qua-dratic mathematical models obtained in this study could be used in the theoretical prediction of bioethanol production from a liquid extract containing a mixture of cassava plus yam peels biomass as well as rice husks plus corn cobs biomass. The final equation in terms of coded factors for the Box-Behnken design response surface quadratic model for cassava peels plus yam peels biomass can be expressed as:
Y= 9.00-34.25X1-4.00X2+3.25X3+17.25X1X2-4,75X1X3
-9.75X2X3+37.38X12+13.87X2
2+3.3X32 (3)
While that of rice husks plus corn cobs biomass is ex-pressed as:
Y= 26.00-13.50X1-40.50X2+4.50X3+9.00X1X2-6.00X1 X3-34.00X2 X3+12.00X1
2+49.00X22+10.00X3
2 (4)
Where Y is the bioethanol volume yield, X1 is pH, X2 is time and X3 is particle size. The low standard error ob-served in the intercept and all the model terms in Tables 6a and 6b prove that the regression model suits the data favorably and the prediction is okay. The Variance Inflation Factor(VIF)gotten in this work indicated that the center points are orthogonal to all other factors in the models.
3.2 Effects of process parameters on bioethanol produc-tion
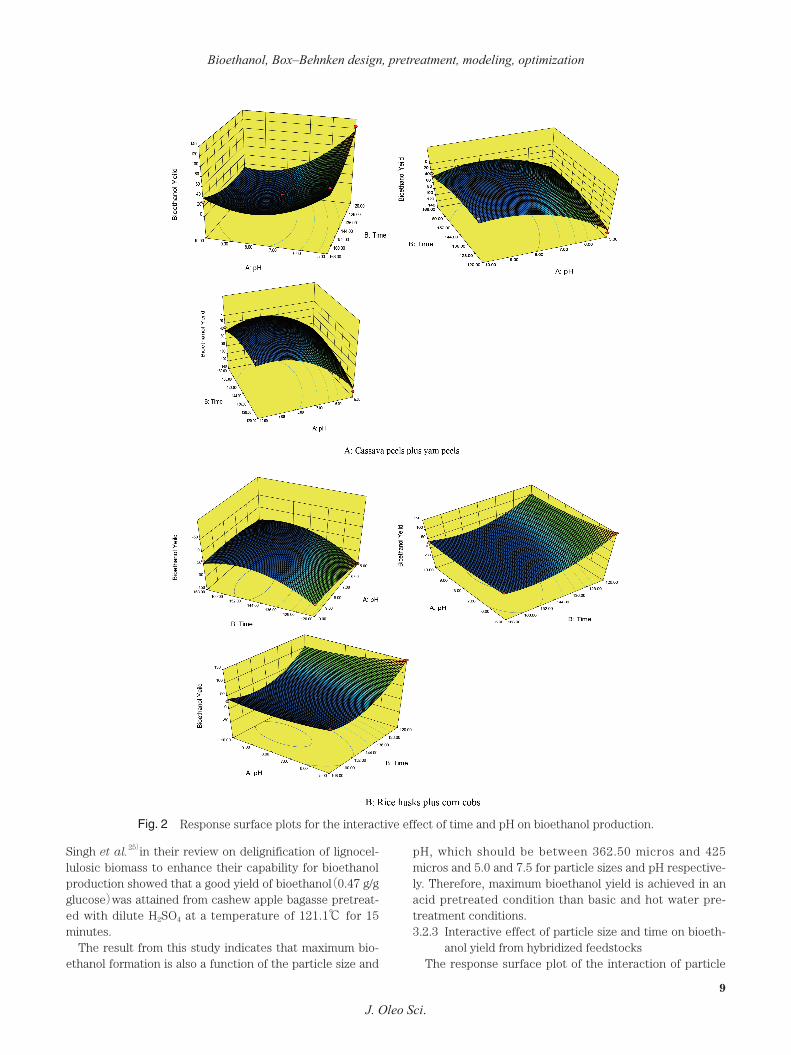
The three-dimensional response surface plots were ob-tained by plotting the response(bioethanol yield)on the z-axis against two variables on the x- and y-axis. 3.2.1 Interactive effect of time and pH on hybridized bio-
mass The response surface plot of the interaction of time and
pH on bioethanol production is presented in Fig. 2. For the acid pretreated biomass mixtures, the maximum bioethanol of 125 mL/1500 g of hybridized cassava plus yam peels biomass was obtained at a time of 120 hours and a pH of 5.0 while that of rice husks plus corn cobs biomass was 160 mL/1500 g at a time of 120 hours and a pH of 5.0. The plots show that increasing the time of fermentation with a corre-sponding increase in the pH above 6.0 in an acidic pretreat-ment condition is unfavorable to bioethanol production from the hybridized mixture of yam peels plus cassava peels as well as rice husks plus corn cobs biomass. Besides, in a basic pretreatment condition, for hybridized cassava peels plus yam peel biomass, maximum bioethanol yield is 30 mL/1500 g biomass at a pH of 10.0 and at a time of 168 hours while that of rice husks plus corn cobs biomass was 52 mL/1500 g biomass at a pH of 10.0 and a time of 144 hours. However, in a hot water hydrolysis condition near-neutral pH, maximum bioethanol yield is 40 mL/1500 g
Table 6a Analysis of variance(ANOVA)for regression equation(cassava peels plus yam peels biomass).
Source Sum of Squares Df Mean Square F-value p-valueModel 18363.03 9 2040.34 11.98 0.0018
Pure Error 0.0000 4 0.0000Cor Total 19555.53 16
R2 = 0.9390, Adj.R2 = 0.8606, Adequate Precision = 10.664
Table 6b Analysis of variance(ANOVA)for regression equation(rice husks plus corn cobs).
Source Sum of Squares Df Mean Square F-valuep-value
Prob > FModel 31600.12 9 3511.12 22.80 0.0002
Pure Error 0.000 4 0.000Cor Total 32678.12 16
R-Squared = 0.9670, Adj R2 = 0.9246, Adequate Precision = 15.655
A. A. Awoyale and D. Lokhat
J. Oleo Sci.
8
biomass at a pH of 7.5 and a time of 120 hours for cassava peels plus yam peel biomass, while that of rice husks plus corn cobs biomass was 170 mL/1500 g biomass mixture at a pH of 7.5 and time of 120 hours. This indicates that maximum bioethanol production for cassava peels plus yam peels biomass is dependent on the time and pH, which should be between 120 hours and 136 hours and 5.0 and 6.0 for time and pH respectively, while for rice husks plus corn cobs biomass, there is greater flexibility in the optimum pH for bioethanol production from the hybridized biomass, ranging between 5.0 and 7.5. 3.2.2 Interactive effect of particle size and pH on bioetha-
nol production from hybridized biomassThe response surface plot of the interaction of particle
size and pH on bioethanol production is presented in Fig. 3. The maximum bioethanol yield of 125 mL/1500 g from hy-bridized cassava plus yam peels biomass was obtained at a particle size of 362.50 microns and a pH of 5.0, while that
of rice husks plus corn cobs biomass was 160 mL/1500 g.For both hybridized biomass samples, the plots show
that increasing the particle size during pretreatment with a corresponding increase in the pH above 6.0 in an acidic pretreatment is unfavorable to optimum bioethanol yield. Besides, in a basic pretreatment condition maximum bio-ethanol yield is 30 mL/1500 g cassava plus yam peels biomass at a pH of 10.0 and a particle size of 362.50 microns whereas rice husks plus corn cobs hybridized biomass gave a bioethanol yield of 68 mL/1500 g biomass. However, in a hot water hydrolysis condition near neutral pH for cassava peels plus yam peel biomass, maximum bio-ethanol yield is 40 mL/1500 g biomass at a pH of 7.5 and a particle size of 425 microns whereas the rice husks plus corn cobs biomass gave a maximum yield of 170 mL/1500 g biomass. It can therefore be deduced that increasing the particle size with a decrease in the pH will result in optimum bioethanol yield for both hybridized biomass.
Table 7a Regression coefficients and significant of response surface quadratic model for cassava peels plus yam peels.
Factor CoefficientEstimate Df Standard
Error95% Cl
Low95% Cl
High VIF
Intercept 9.00 1 5.84 -4.80 22.80 -X1 -34.25 1 4.61 -45.16 -23.34 1.00X2 -4.00 1 4.61 -14.91 6.91 1.00X3 3.25 1 4.61 -7.66 14.16 1.00
X1X2 17.25 1 6.53 1.82 32.68 1.00X1X3 -4.75 1 6.53 -20.18 10.68 1.00X2X3 -9.75 1 6.53 -25.18 5.68 1.00X1
2 37.38 1 6.36 22.33 52.42 1.01X2
2 13.87 1 6.36 -1.17 28.92 1.01X3
2 3.37 1 6.36 -11.67 18.42 1.01
Table 7b Regression coefficients and significant of response surface quadratic model for rice husks plus corn cobs.
Factor CoefficientEstimate Df Standard
Error95% CI
Low95% CI
High VIF
Intercept 26.00 1 5.55 12.88 39.12X1 -13.50 1 4.39 -23.87 -3.13 1.00X2 -40.50 1 4.39 -50.87 -30.13 1.00X3 4.50 1 4.39 -5.87 14.87 1.00
X1X2 9.00 1 6.20 -5.67 23.67 1.00X1X3 -6.00 1 6.20 -20.67 8.67 1.00X2X3 -34.00 1 6.20 -48.67 -19.33 1.00X1
2 12.00 1 6.05 -2.30 26.30 1.01X2
2 49.00 1 6.05 34.70 63.30 1.01X3
2 10.00 1 6.05 -4.30 24.30 1.01
Bioethanol, Box–Behnken design, pretreatment, modeling, optimization
J. Oleo Sci.
9
Singh et al.25)in their review on delignification of lignocel-lulosic biomass to enhance their capability for bioethanol production showed that a good yield of bioethanol(0.47 g/g glucose)was attained from cashew apple bagasse pretreat-ed with dilute H2SO4 at a temperature of 121.1℃ for 15 minutes.
The result from this study indicates that maximum bio-ethanol formation is also a function of the particle size and
pH, which should be between 362.50 micros and 425 micros and 5.0 and 7.5 for particle sizes and pH respective-ly. Therefore, maximum bioethanol yield is achieved in an acid pretreated condition than basic and hot water pre-treatment conditions.3.2.3 Interactive effect of particle size and time on bioeth-
anol yield from hybridized feedstocksThe response surface plot of the interaction of particle
Fig. 2 Response surface plots for the interactive effect of time and pH on bioethanol production.

A. A. Awoyale and D. Lokhat
J. Oleo Sci.
10
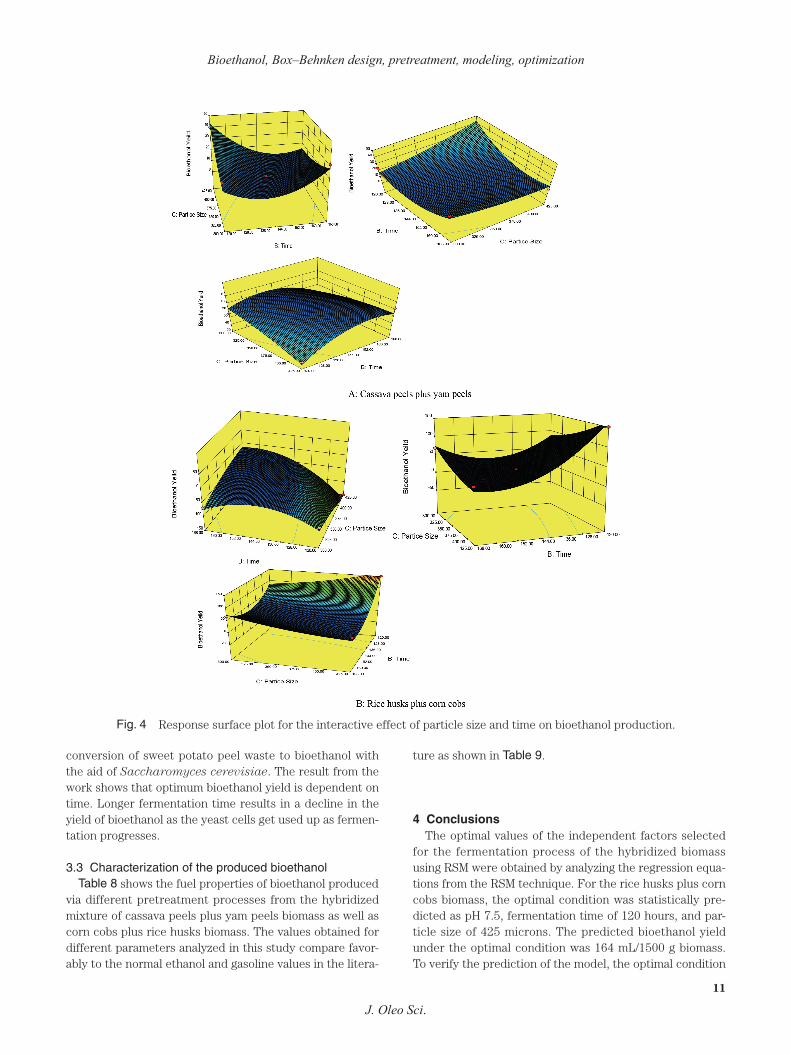
size and time on bioethanol production is presented in Fig. 4. Bioethanol yield of 40 mL/1500 g biomass was obtained at the highest particle size of 425 microns and at a time of 120 hours for cassava plus yam peels biomass while for that of rice husks plus corn cobs was 170 mL/1500 g biomass. The plot shows that maintaining a range of particle sizes between 350 microns and 375 microns with a correspond-ing increase in fermentation time results in a decrease in
bioethanol yield which is unfavorable. However, increasing the particle sizes beyond the stipulated range or a decrease beyond the stated range with a corresponding decrease in fermentation time results in an increase in bioethanol yield. This indicates that maximum bioethanol formation is de-pendent on the particle size and time especially for the rice husks and corn cobs hybridized biomass which has been corroborated by Ojewumi et al.26)in their work on the bio-
Fig. 3 Response surface plot for the interactive effect of particle size and pH on bioethanol production
Bioethanol, Box–Behnken design, pretreatment, modeling, optimization
J. Oleo Sci.
11
conversion of sweet potato peel waste to bioethanol with the aid of Saccharomyces cerevisiae. The result from the work shows that optimum bioethanol yield is dependent on time. Longer fermentation time results in a decline in the yield of bioethanol as the yeast cells get used up as fermen-tation progresses.
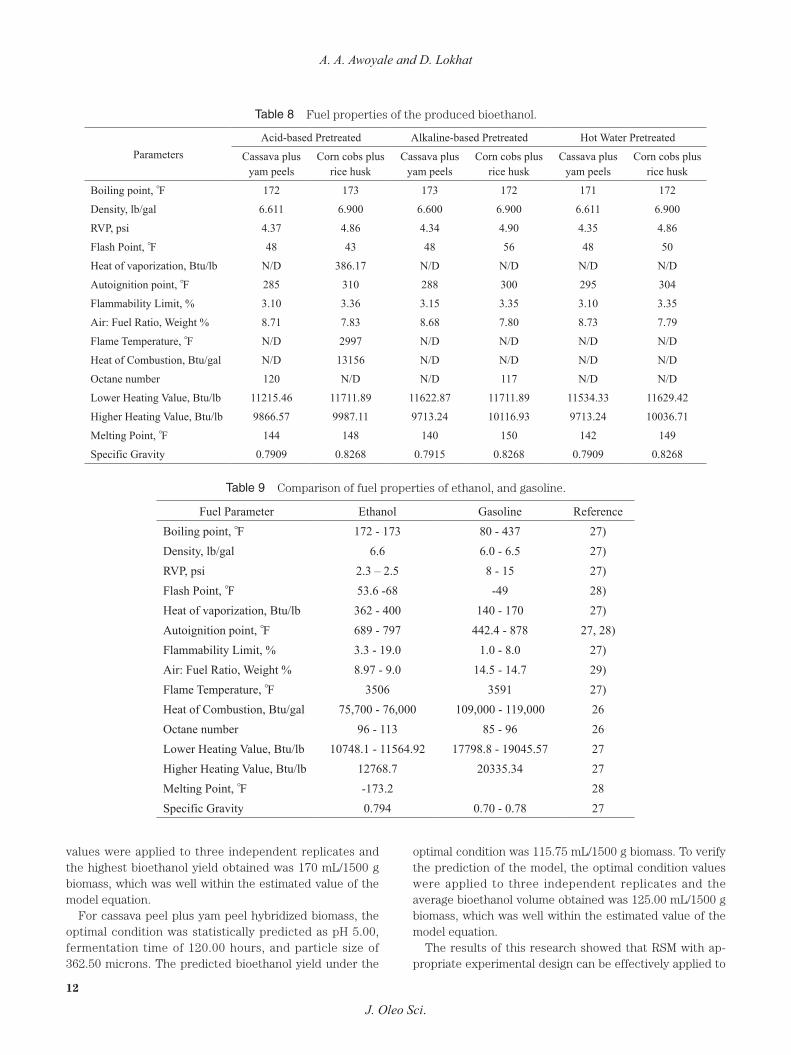
3.3 Characterization of the produced bioethanolTable 8 shows the fuel properties of bioethanol produced
via different pretreatment processes from the hybridized mixture of cassava peels plus yam peels biomass as well as corn cobs plus rice husks biomass. The values obtained for different parameters analyzed in this study compare favor-ably to the normal ethanol and gasoline values in the litera-
ture as shown in Table 9.
4 ConclusionsThe optimal values of the independent factors selected
for the fermentation process of the hybridized biomass using RSM were obtained by analyzing the regression equa-tions from the RSM technique. For the rice husks plus corn cobs biomass, the optimal condition was statistically pre-dicted as pH 7.5, fermentation time of 120 hours, and par-ticle size of 425 microns. The predicted bioethanol yield under the optimal condition was 164 mL/1500 g biomass. To verify the prediction of the model, the optimal condition
Fig. 4 Response surface plot for the interactive effect of particle size and time on bioethanol production.
A. A. Awoyale and D. Lokhat
J. Oleo Sci.
12
values were applied to three independent replicates and the highest bioethanol yield obtained was 170 mL/1500 g biomass, which was well within the estimated value of the model equation.
For cassava peel plus yam peel hybridized biomass, the optimal condition was statistically predicted as pH 5.00, fermentation time of 120.00 hours, and particle size of 362.50 microns. The predicted bioethanol yield under the
optimal condition was 115.75 mL/1500 g biomass. To verify the prediction of the model, the optimal condition values were applied to three independent replicates and the average bioethanol volume obtained was 125.00 mL/1500 g biomass, which was well within the estimated value of the model equation.
The results of this research showed that RSM with ap-propriate experimental design can be effectively applied to
Table 8 Fuel properties of the produced bioethanol.
ParametersAcid-based Pretreated Alkaline-based Pretreated Hot Water Pretreated
Cassava plus yam peels
Corn cobs plus rice husk
Cassava plus yam peels
Corn cobs plus rice husk
Cassava plus yam peels
Corn cobs plus rice husk
Boiling point, °F 172 173 173 172 171 172
Density, lb/gal 6.611 6.900 6.600 6.900 6.611 6.900
RVP, psi 4.37 4.86 4.34 4.90 4.35 4.86
Flash Point, °F 48 43 48 56 48 50
Heat of vaporization, Btu/lb N/D 386.17 N/D N/D N/D N/D
Autoignition point, °F 285 310 288 300 295 304
Flammability Limit, % 3.10 3.36 3.15 3.35 3.10 3.35
Air: Fuel Ratio, Weight % 8.71 7.83 8.68 7.80 8.73 7.79
Flame Temperature, °F N/D 2997 N/D N/D N/D N/D
Heat of Combustion, Btu/gal N/D 13156 N/D N/D N/D N/D
Octane number 120 N/D N/D 117 N/D N/D
Lower Heating Value, Btu/lb 11215.46 11711.89 11622.87 11711.89 11534.33 11629.42
Higher Heating Value, Btu/lb 9866.57 9987.11 9713.24 10116.93 9713.24 10036.71
Melting Point, °F 144 148 140 150 142 149
Specific Gravity 0.7909 0.8268 0.7915 0.8268 0.7909 0.8268
Table 9 Comparison of fuel properties of ethanol, and gasoline.
Fuel Parameter Ethanol Gasoline ReferenceBoiling point, °F 172 - 173 80 - 437 27)Density, lb/gal 6.6 6.0 - 6.5 27)RVP, psi 2.3 – 2.5 8 - 15 27)Flash Point, °F 53.6 -68 -49 28)Heat of vaporization, Btu/lb 362 - 400 140 - 170 27)Autoignition point, °F 689 - 797 442.4 - 878 27, 28)Flammability Limit, % 3.3 - 19.0 1.0 - 8.0 27)Air: Fuel Ratio, Weight % 8.97 - 9.0 14.5 - 14.7 29)Flame Temperature, °F 3506 3591 27)Heat of Combustion, Btu/gal 75,700 - 76,000 109,000 - 119,000 26Octane number 96 - 113 85 - 96 26Lower Heating Value, Btu/lb 10748.1 - 11564.92 17798.8 - 19045.57 27Higher Heating Value, Btu/lb 12768.7 20335.34 27Melting Point, °F -173.2 28Specific Gravity 0.794 0.70 - 0.78 27

Bioethanol, Box–Behnken design, pretreatment, modeling, optimization
J. Oleo Sci.
13
the optimization of the process variables in bioethanol pro-duction using biomass mixture of corn cob plus rice husk as well as cassava peels plus yam peels as feedstocks for the process. This may provide useful information regarding the development of an economic and efficient fermentation process as well as information on the behavior of hybrid-ized feedstocks for industrial bioethanol production.
AcknowledgementsThe authors appreciate the support provided by the Uni-
versity of Kwazulu-Natal(UKZN), Durban, South Africa, and the Petroleum Training Institute, Effurun, Nigeria.
Author ContributionA.A.A and D.L conceptualized the research, A.A.A
carried out the experimental work and developed the man-uscript, D.L corrected and updated the manuscript.
References1) Pérez-Pimienta, J.A.; Papa, G.; Gladden, J.M.; Sim-
mons, B.A.; Sanchez, A. The effect of continuous tu-bular reactor technologies on the pretreatment of lig-nocellulosic biomass at pilot-scale for bioethanol production. RSC Advances 10, 18147-18159(2020).
2) Iye, E.; Bilsborrow, P. Cellulosic ethanol production from agricultural residues in Nigeria. Energy Policy 63, 207-214(2013).
3) Olatunji, O.O.; Akinlabi, S.; Madushele, N.; Adedeji, P.A.; Ndolomingo, M.J. Geospatial investigation of physicochemical properties and thermodynamic pa-rameters of biomass residue for energy generation. Biomass Convers. Bior. 1-15(2020).
4) Awoyale, A.A.; Lokhat, D. Harnessing the potential of bio-ethanol production from lignocellulosic biomass in Nigeria-A review. Biofuel. Bioprod. Biorefin. 13, 192-207(2019).
5) Awoyale, A.; Lokhat, D.; Eloka-Eboka, A. Experimen-tal characterization of selected Nigerian lignocellulosic biomasses in bioethanol production. Int. J. Ambient Energy doi:10.1080/01430750.2019.1594375(2019).
6) Chen, H.; Fu, X. Industrial technologies for bioethanol production from lignocellulosic biomass. Renew. Sust. Energ. Rev. 57, 468-478(2016).
7) Ogidi, C.O.; George, O.H.; Aladejana, O.M.; Malomo, O.; Famurewa, O. Fruit preservation with bioethanol ob-tained from the fermentation of brewer’s spent grain with Saccharomyces carlsbergensis. Revista Facul-tad Nacional de Agronomía Medellín 73, 9321-9331
(2020).8) Oke, M.A.; Annuar, M.S.M.; Simarani, K. Mixed feed-
stock approach to lignocellulosic ethanol production-Prospects and limitations. Bioenergy Res. 9, 1189-1203(2016).
9) Onoji, S.E.; Iyuke, S.E.; Igbafe, A.I.; Daramola, M.O. Hevea brasiliensis(rubber seed)oil: Modeling and optimization of extraction process parameters using response surface methodology and artificial neural network techniques. Biofuels 10, 677-691(2019).
10) Baş, D.; Boyacı, I.H. Modeling and optimization I: Us-ability of response surface methodology. J. Food Eng. 78, 836-845(2007).
11) Dong, H.; Zhao, X.; Ma, Y.; Zhang, M. Optimization of a synthetic medium for ethanol production by xylose-fermenting Zymomonas mobilis using response sur-face methodology. Chin. Sci. Bull. 57, 3782-3789(2012).
12) Ferreira, S.C.; Bruns, R.E.; Ferreira, H.S.; Matos, G.D.; David, J.M.; Brandão, G.C.; da Silva, E.P.; Portugal, L.A.; Dos Reis, P.S.; Souza, A.S.; Dos Santos, W.N.L. Box-Behnken design: An alternative for the optimiza-tion of analytical methods. Anal. Chim. Acta 597, 179-186(2007).
13) Betiku, E.; Taiwo, A.E. Modeling and optimization of bioethanol production from breadfruit starch hydroly-zate vis-à-vis response surface methodology and artifi-cial neural network. Renew. Energy 74, 87-94(2015).
14) Timung, R.; Mohan, M.; Chilukoti, B.; Sasmal, S.; Ba-nerjee, T.; Goud, V. V. Optimization of dilute acid and hot water pretreatment of different lignocellulosic bio-mass: a comparative study. Biomass Bioenergy 81, 9-18(2015).
15) Chen, Y.; Stevens, M.A.; Zhu, Y.; Holmes, J.; Xu, H. Un-derstanding of alkaline pretreatment parameters for corn stover enzymatic saccharification. Biotechnol. Biofuels 6, 8(2013).
16) Awoyale, A.A.; Lokhat, D. Experimental determination of the effects of pretreatment on selected Nigerian lig-nocellulosic biomass in bioethanol production. Sci. Rep. 11, 557, doi:10.1038/s41598-020-78105-8(2021).
17) Pratto, B.; dos Santos-Rocha, M.S.R.; Longati, A.A.; de Sousa Júnior, R.; Cruz, A.J.G. Experimental optimiza-tion and techno-economic analysis of bioethanol pro-duction by simultaneous saccharification and fermen-tation process using sugarcane straw. Bioresour. Technol. 297, 122494(2020).
18) Maurya, D.P.; Vats, S.; Rai, S.; Negi, S. Optimization of enzymatic saccharification of microwave pretreated sugarcane tops through response surface methodology for biofuel. Indian J. Exp. Biol. 51, 992-996(2013).
19) Betiku, E.; Adesina, O.A. Statistical approach to the optimization of citric acid production using filamen-tous fungus Aspergillus niger grown on sweet potato
A. A. Awoyale and D. Lokhat
J. Oleo Sci.
14
starch hydrolyzate. Biomass Bioenergy 55, 350-354(2013).
20) Guan, X.; Yao, H. Optimization of Viscozyme L-assisted extraction of oat bran protein using response surface methodology. Food Chem. 106, 345-351(2008).
21) Chen, L.; Wei, Y.; Shi, M,; Li, Z.; Zhang, S.H.; Statistical optimization of a cellulase from Aspergillus glaucus CCHA for hydrolyzing corn and rice straw by RSM to enhance yield of reducing sugar. Biotechnol. Lett. 42, 583-595(2020).
22) Jeya, M.; Zhang, Y.-W.; Kim, I.-W.; Lee, J.K. Enhanced saccharification of alkali-treated rice straw by cellu-lase from Trametes hirsuta and statistical optimization of hydrolysis conditions by RSM. Bioresour. Technol. 100, 5155-5161(2009).
23) Noshadi, I.; Amin, N.; Parnas, R.S. Continuous produc-tion of biodiesel from waste cooking oil in a reactive distillation column catalyzed by solid heteropolyacid: Optimization using response surface methodology(RSM). Fuel 94, 156-164(2012).
24) Betiku, E.; Omilakin, O.R.; Ajala, S.O.; Okeleye, A.A.; Taiwo, A.E.; Solomon, B.O . Mathematical modeling and process parameters optimization studies by artifi-cial neural network and response surface methodolo-
gy: A case of non-edible neem(Azadirachta indica)seed oil biodiesel synthesis. Energy 72, 266-273(2014).
25) Singh, R.; Shukla, A.; Tiwari, S.; Srivastava, M. A re-view on delignification of lignocellulosic biomass for enhancement of ethanol production potential. Renew. Sust. Energ. Rev. 32, 713-728(2014).
26) Ojewumi, M.E.; Akwayo, I.J.; Taiwo, O.S.; Obanla, O.M.; Ayoola, A.A.; Ojewumi, E.O.; Oyeniyi, E.A. Bio-conver-sion of sweet potato peel waste to bioethanol using Saccharomyces cerevisiae. Environ. Eng. 8, 46-54(2018).
27) Sinor, J.E.; Bailey, B.K. Current and potential future performance of ethanol fuels. Report No. 0148-7191(SAE Technical Paper)(1993).
28) Paloboran, M.E.; Sutantra, I.N.; Sudarmanta, B.; Palo-boran, M.E.N.; Sutantra, I.N.; Sudarmanta, B. Perfor-mances and emissions characteristics of three main types composition of gasoline-ethanol blended in spark ignition engines. Int. Rev. Mech. Eng. 10, 552(2016).
29) Freitas, J.G.; Doulatyari, B.; Molson, J.W.; Barker, J.F. Oxygenated gasoline release in the unsaturated zone, Part 2: Downgradient transport of ethanol and hydro-carbons. J. Contam. Hydrol. 125, 70-85(2011).