arrow@tu dublin agro-industrial lignocellulosic biomass
TRANSCRIPT
Technological University Dublin Technological University Dublin
ARROW@TU Dublin ARROW@TU Dublin
Doctoral Tourism and Food
2018-12
Agro-industrial Lignocellulosic Biomass: A Sustainable Platform Agro-industrial Lignocellulosic Biomass: A Sustainable Platform
for the Production of α-amylase and xylanase A for the Production of -amylase and xylanase A
RAJEEV RAVINDRAN [Thesis] Technological University Dublin
Follow this and additional works at: https://arrow.tudublin.ie/tourdoc
Part of the Food Science Commons
Recommended Citation Recommended Citation RAVINDRAN, R. (2018) Agro-industrial Lignocellulosic Biomass: A Sustainable Platform for the Production of α-amylase and xylanase A, Doctoral Thesis, Technological University Dublin.
This Theses, Ph.D is brought to you for free and open access by the Tourism and Food at ARROW@TU Dublin. It has been accepted for inclusion in Doctoral by an authorized administrator of ARROW@TU Dublin. For more information, please contact [email protected], [email protected].
This work is licensed under a Creative Commons Attribution-Noncommercial-Share Alike 4.0 License
1
Agro-industrial Lignocellulosic Biomass:
A Sustainable Platform for the Production of
α-amylase and xylanase
A THESIS SUBMIITTED TO THE TECHNICAL UNIVERSITY OF DUBLIN
FOR THE AWARD OF
DOCTOR OF PHILOSOPHY
RAJEEV RAVINDRAN, B.Tech, M.Tech.
School of Food Science and Environmental Health,
College of Sciences and Health,
Dublin Institute of Technology, Dublin, Ireland
Dec 2018
Supervisor: Dr. Amit K. Jaiswal
Advisory Supervisor: Dr. Gwilym Williams
2
Abstract
Enzymes such as α-amylase and xylanase offer potential for numerous industrial applications such as food,
beverage, and animal feed production, detergents, textile, cosmetics and biodiesel production. Economic
factors such as achievement of optimum yields and production cost are the main deterrents in the industrial
use of these enzymes. Enzymes are generally produced via microbial fermentation using expensive mediums
which account for 30 to 40% of the production cost. Food industry wastes such as spent coffee waste (SCW)
and Brewers’ spent grain (BSG) are two of the most common food waste products expelled by the food and
beverage industry here in Ireland and are environmental burden. However, these inexpensive food wastes can
be utilized as a substrate for the production of enzymes, which can significantly reduce the production cost
of the enzymes and also enhance the value of underutilized food waste. Based on the above facts, the aim of
this study is to exploit the lignocellulosic food industry waste such as BSG and SCW for the production of
industrially viable enzymes such as α-amylase and xylanase. Although high in polysaccharide content, the
effective utilisation of SCW and BSG requires specific pretreatment measures that result in a decrease in
recalcitrance by removal of the lignin fraction. The aim of the project was achieved through the following
objectives:
▪ Identification and development of the best pretreatment strategy for SCW and BSG that would enhance
their enzymatic digestibility and liberation of higher amount of fermentable sugars.
▪ Optimisation of SCW and BSG for the production of enzymes such as α-amylase and xylanase.
The effect of the pretreatments was primarily analysed as changes that occurred in the composition of SCW
and BSG. A number of analytical techniques were used to characterise the pretreated waste samples,
including FTIR, FESEM, XRD and DSC.
Overall, the following observations were made:
▪ Conc. phosphoric acid acetone pretreatment and ammonia fibre explosion (AFEX) was the best
pretreatment measures in reducing recalcitrance in SCW. In lieu of devising further efficient
pretreatments for SCW two strategies viz. two-step sequential pretreatment and ultrasound assisted
pretreatment were developed and successfully tested for lignin and hemicellulose removal from the
lignocellulosic substrate.
▪ Subjecting BSG to six different pretreatments revealed microwave assisted alkali pretreatment was the
best in terms of reduction in lignin content.
▪ Screening test for four Bacillus sp. viz. B. subtilis, B. megaterium, B. cereus and B. stearothermophilus
revealed that all the strains were amylase producing organisms. B. stearothermophilus amylase was
found to be stable in a temperature range of 60°C to 100°C and in an alkaline pH range (5-10).
▪ Pretreated BSG was hydrolysed using cellulolytic enzymes and used as a growth medium supplement
for cultivation of the thermophilic bacterium, Bacillus stearothermophilus in the production of α-
amylase. Optimisation trials revealed that maximal amylase production (198.09 U/ml) occurred with a
medium composition of starch (0.2%w/v), peptone (0.2% w/v), KCl.4 H2O (0.02% w/v), MgSO4.7 H2O
(0.01% w/v) and hydrolysate (0.22% v/v). A 1.3-fold increase in amylase activity was obtained
following novel media composition.
▪ B. stearothermophilus α-amylase was successfully tested as an antibiofilm activity against three
pathogens viz. S. aureus NCTC 1803, S. aureus ATCC 25923 and P. aeruginosa ATCC 27835
inhibiting their biofilm producing capacity by 62%, 55% and 50% respectively.
▪ Pretreated SCW was used as the sole carbon source for xylanase production in solid state fermentation
mode. The mycelial fungus, Aspergillus niger, was used as the fermentative microbe. Under optimised
SSF conditions an enzyme activity of 6495.6 U/g of dry SCW was recorded, which was approximately
1.39-fold higher than a control culture (4649 U/g of dry SCW).
▪ The efficacy of the purified xylanase as a juice enrichment agent for strawberry, blueberry and raspberry
pulp was also investigated. The xylanase produced by A. niger ATCC® was found to be an excellent
fruit juice clarification agent.
3
Declaration
I certify that this report which I now submit to confirm that the thesis which I submit
for examination for the award of Doctor of Philosophy is entirely my own work and
has not been taken from the work of others, save and to the extent that such work has
been cited and acknowledged within the text of my work.
This thesis has been prepared according to the regulations for postgraduate study by
research of the “Dublin Institute of Technology” and has not been submitted in whole
or in part for another award in any other third level institution.
The work reported on in this thesis conforms to the principles and requirements of the
DIT's guidelines for ethics in research.
The institute has permission to keep, lend or copy this thesis in whole or in part on
condition that such use of the material of the thesis is duly acknowledged.
Signature Date 15/07/2019
Rajeev Ravindran
4
Acknowledgement
I would like to express my sincerest gratitude to my supervisor Dr. Amit K. Jaiswal
who has been a tremendous mentor for me. Thank you, sir, for your continuous
support, patience and motivation without which I would not have been able to
complete this feat. I could not have asked for a better supervisor for my PhD study. I
would also like to thank Dr. Gwilym Williams whose contribution during the later
stage of my PhD has been invaluable. Thank you, sir, for your patience and diligence
in teaching me all the skills necessary to complete my work.
Besides my supervisors, I would like to thank my lab mates, Dr Emer Shannon,
Alessandra Ghion, Deimante Zizyte and Dr Elena Balboa for their assistance, constant
encouragement and support. I would like to devote special thanks to Harshita
Venkatratnam for being there whenever I needed her. I would also like to thank
Priyanka for clearing my doubts and lending me reagents and chemicals when I ran
short. Special thanks to Katie O’Callaghan who is an embodiment of hard work and
perseverance. You will always inspire me. I would like to sincerely thank the technical
officers, Jyoti Nair, Plunkett Clarke, Noel Grace and Tony Hutchinson for being kind
to me when I needed help.
Also, I certainly couldn’t have made it this far without the companionship of my
friends and flatmates, Dr Yash Dixit, Dr Chaitanya Sarangapani and Dr Anuj Pratap
Singh. Thank you, guys, for being so cool. I would also like to thank my brother,
Rajesh Ravindran and my friends Jayalekshmi and Nikhil and my teacher, Dr Manoj
Narayanan who constantly reassured me of my abilities when I was in self-doubt.
And to my parents, Mr. K. N. Ravindran and Mrs. M. K. Santhamma: For all the efforts
you have made for my wellbeing I hope I have made you proud.
5
List of Abbreviations
SCW Spent Coffee Waste
BSG Brewer’s Spent Grain
NREL National Renewable Energy Laboratory
FTIR Fourier Transform Infra-red
FESEM Field Emission Scanning Electron Microscopy
XRD X-Ray Diffraction
DSC Differential Scanning Calorimetry
AFEX Ammonia Fibre Explosion
NCTC National Collection of Type Cultures
ATCC American Type Culture Collection
CCD Central Composite Design
SSF Solid State Fermentation
SDS-PAGE Sodium Dodecyl Sulphate
EU European Union
CRI Crystallinity Index
CMC Carboxymethyl Cellulose
EDTA Ethylene Triamine Tetra Acetic Acid
6
Table of Contents
1. General Introduction ....................................................................................... 18
1.1 Motivation .................................................................................................. 19
1.2 Aim and Objectives .................................................................................... 20
1.3 Organisation of Thesis ............................................................................... 21
2. Literature review .............................................................................................. 24
2.1 Introduction ................................................................................................ 24
2.2 Lignocellulosic Food Industry Waste ........................................................ 25
2.3 Food Industry waste as a renewable resource ............................................ 26
2.4 Market potential ......................................................................................... 27
2.5 Enzymes Production using lignocellulosic food industry waste ................ 28
2.5.1 Lignocellulose as a raw material ................................................................ 28
2.5.2 Structure of lignocellulose ......................................................................... 33
2.5.3 Pretreatment of Lignocellulose .................................................................. 35
2.5.4 Factors influencing the choice of pretreatment .......................................... 36
2.5.5 Pretreatment techniques ............................................................................. 38
2.5.6 Formation of inhibitors .............................................................................. 53
2.5.7 Choice of Microorganism .......................................................................... 54
2.6 Fermentation Strategies .............................................................................. 57
2.6.1 Solid State Fermentation ............................................................................ 57
2.6.2 Submerged Fermentation ........................................................................... 58
2.6.3 Isolation, purification and recovery of enzymes ........................................ 58
2.6.4 Source of enzyme ....................................................................................... 59
2.6.5 Isolation of enzymes .................................................................................. 59
2.7 A review of enzymes produced using agro-industry waste ....................... 62
2.7.1 Enzymes that act on polysaccharides ......................................................... 62
3. Materials and methods .................................................................................... 74
3.1 Instruments ................................................................................................. 76
3.2 Software ..................................................................................................... 76
3.3 Analytical Techniques ................................................................................ 76
3.3.1 Compositional analysis .............................................................................. 76
3.3.2 Reducing sugar analysis ............................................................................. 77
3.3.3 Individual sugar and inhibitor analysis ...................................................... 77
3.3.4 Fourier Transform Infra-Red Spectroscopy analysis ................................. 78
7
3.3.5 X-ray diffraction......................................................................................... 79
3.3.6 Thermal Behavior analysis ......................................................................... 79
3.3.7 Scanning Electron Microscopy .................................................................. 81
3.4 Optimisation of enzymatic hydrolysis of SCW ......................................... 81
3.5 Optimisation of enzymatic hydrolysis of BSG .......................................... 83
3.6 Statistical Analysis ..................................................................................... 84
4. Development of novel pretreatment for enhanced enzymatic hydrolysis of
spent coffee waste ..................................................................................................... 86
4.1 Introduction ................................................................................................ 87
4.2 Methodology .............................................................................................. 89
4.2.1 Screening of various pretreatments for spent coffee waste ........................ 90
4.2.1.1 Dilute acid hydrolysis ........................................................................ 90
4.2.1.2 Steam explosion ................................................................................. 90
4.2.1.3 Ammonia Fiber explosion .................................................................. 90
4.2.1.4 Concentrated phosphoric acid pretreatment ....................................... 91
4.2.1.5 Pretreatment using atmospheric air plasma ....................................... 91
4.2.1.6 Pretreatment using Ferric Chloride .................................................... 92
4.2.1.7 Organosolv Pretreatment .................................................................... 92
4.2.1.8 Microwave assisted alkali pretreatment ............................................. 93
4.2.1.9 Sequential pretreatment of spent coffee waste ................................... 93
4.2.2 Composition analysis ................................................................................. 94
4.2.3 Enzymatic hydrolysis ................................................................................. 95
4.2.4 Individual sugar, inhibition and organic acid analysis ............................... 95
4.3 Characterisation of native and pretreated substrates .................................. 95
4.3.1 Scanning electron microscopy ................................................................... 95
4.3.2 X-ray diffraction......................................................................................... 95
4.3.3 Fourier Transform Infrared Spectroscopy analysis .................................... 95
4.3.4 Thermal Behavior....................................................................................... 96
4.4 Results and discussion ............................................................................... 96
4.4.1 Composition analysis of native spent coffee waste.................................... 96
4.4.2 Optimisation of enzymatic hydrolysis parameters using response surface
methodology ........................................................................................................... 96
4.4.3 Influence of pretreatments on composition of SCW and reducing sugar yield
101
8
4.4.4 Individual sugar, inhibitor and organic acid analysis .............................. 107
4.4.5 SEM, XRD and FTIR profiles of untreated and pretreated spent coffee
wastes 108
4.4.6 Thermal behaviour study using differential scanning colorimetry .......... 113
4.5 Conclusion ............................................................................................... 115
5. Evaluation of ultrasound assisted potassium permanganate pretreatment of
spent coffee waste ................................................................................................... 116
5.1 Introduction .............................................................................................. 117
5.2 Methodology ............................................................................................ 119
5.2.1 Pretreatment of SCW ............................................................................... 119
5.2.1.1 Ultrasound-assisted potassium permanganate pretreatment ............ 119
5.2.1.2 Alkali assisted ultrasonication.......................................................... 119
5.2.2 Enzymatic hydrolysis ............................................................................... 120
5.2.3 Compositional analysis ............................................................................ 120
5.2.4 Characterisation of raw and pretreated substrate ..................................... 121
5.2.4.1 FTIR analysis ................................................................................... 121
5.2.4.2 X-ray diffraction............................................................................... 121
5.2.4.3 Thermal behavior ............................................................................. 121
5.2.4.4 Scanning Electron Microscopy ........................................................ 121
5.2.5 Statistical analysis .................................................................................... 121
5.3 Result and discussion ............................................................................... 122
5.3.1 Effect of pre-treatment on composition of spent coffee waste ................ 122
5.4 Characterisation of pretreated spent coffee waste .................................... 125
5.4.1 Fourier transform infrared spectroscopy .................................................. 125
5.4.2 X ray diffraction ....................................................................................... 127
5.4.3 Differential Scanning Calorimetry ........................................................... 129
5.4.4 Scanning Electron Microscopy ................................................................ 130
5.5 Conclusion ............................................................................................... 131
6. Evaluation of the effects of pretreatment on properties of brewers spent
grain 132
6.1 Introduction .............................................................................................. 132
6.2 Methodology ............................................................................................ 135
6.2.1 Screening of various pretreatments of BSG ............................................. 135
6.2.1.1 Dilute acid hydrolysis ...................................................................... 135
9
6.2.1.2 Steam Explosion .............................................................................. 136
6.2.1.3 Ammonia Fiber Explosion (AFEX) ................................................. 136
6.2.1.4 Pretreatment using Ferric Chloride .................................................. 136
6.2.1.5 Organosolv Pretreatment .................................................................. 137
6.2.1.6 Microwave assisted alkali pretreatment ........................................... 137
6.2.2 Compositional analysis ............................................................................ 138
6.2.3 Enzymatic hydrolysis of BSG .................................................................. 138
6.2.4 Individual sugar inhibitor and organic acid analysis................................ 138
6.2.5 Characterization of native and pretreated substrate ................................. 138
6.2.5.1 X-ray diffraction............................................................................... 138
6.2.5.2 FTIR analysis ................................................................................... 138
6.2.5.3 Thermal behavior ............................................................................. 139
6.3 Results and discussion ............................................................................. 139
6.3.1 Optimisation of enzymatic hydrolysis parameters using RSM ................ 139
6.3.2 Influence of pretreatments on composition of BSG and reducing sugar yield
143
6.3.3 Individual sugar, inhibitor and organic acid analysis .............................. 149
6.3.4 XRD and FTIR profiles of BSG .............................................................. 149
6.3.5 Thermal behaviour study using differential scanning calorimetry .......... 151
6.4 Conclusion ............................................................................................... 153
7. Evaluation of brewer’s spent grain hydrolysate as a substrate for production
of thermostable α-amylase produced by Bacillus stearothermophilus ............... 156
7.1 Introduction .............................................................................................. 157
7.2 Methodology ............................................................................................ 159
7.2.1 Microorganism ......................................................................................... 159
7.2.2 Screening for amylase producing Bacillus strains ................................... 160
7.2.3 Preparation of M9 media and amylase production .................................. 160
7.2.4 Amylase production using starch, peptone and meat extract ................... 161
7.2.5 Lipid extraction from BSG....................................................................... 161
7.2.6 Microorganism and amylase production .................................................. 161
7.2.7 Analytical methods................................................................................... 162
7.2.7.1 Amylase assay .................................................................................. 162
7.2.7.2 Effect of pH and temperature on amylase activity ........................... 162
7.2.8 Pretreatment and enzyme hydrolysis of BSG .......................................... 162
10
7.2.9 Optimisation of novel media composition for amylase production ......... 163
7.2.10 Control Experiment................................................................................ 164
7.2.11 Dry cell weight analysis ......................................................................... 164
7.2.12 Purification of α-amylase ....................................................................... 164
7.2.13 Screening of pathogens for biofilm production capacity ....................... 165
7.2.14 Biofilm formation assay......................................................................... 165
7.3 Results and discussion ............................................................................. 166
7.3.1 Screening of amylase producing Bacillus sp. .......................................... 166
7.3.2 Utilisation of BSG hydrolysate as media component for amylase production
172
7.3.3 Purification of thermostable B. stearothermophilus amylase .................. 179
7.3.4 Antibiofilm activity of α-amylase and determination of inhibitory
concentration ........................................................................................................ 182
7.4 Conclusion ............................................................................................... 185
8. Spent coffee waste as a potential media component for xylanase production
employing Aspergillus niger ATCC® 6275 ........................................................... 187
8.1 Introduction .............................................................................................. 187
8.2 Methodology ............................................................................................ 189
8.2.1 Lipid extraction from SCW ...................................................................... 189
8.2.2 Screening of fungal species for xylanase production capacity ................ 189
8.2.3 Microorganism and xylanase production ................................................. 190
8.2.4 Substrate preparation and solid-state fermentation .................................. 190
8.2.5 Enzyme extraction and assay ................................................................... 191
8.2.6 Optimisation of process parameters ......................................................... 191
8.2.6.1 Optimisation of physical parameters ................................................ 191
8.2.6.2 Plackett-Burman design for identification of significant variables.. 192
8.2.7 Optimisation of media composition ......................................................... 193
8.2.8 Purification of xylanase............................................................................ 194
8.2.9 Application of xylanase for fruit juice clarification ................................. 195
8.2.10 Preparation of puree ............................................................................... 195
8.2.11 Juice enrichment by xylanase treatment ................................................ 195
8.2.12 Determination of reducing sugar and clarity ......................................... 196
8.3 Results and Discussion ............................................................................. 196
8.3.1 Optimisation of fermentation parameters................................................. 196
11
8.3.2 Optimisation of media components ......................................................... 202
8.3.2.1 Screening of media components ...................................................... 202
8.3.2.2 Optimisation of media components ................................................. 204
8.3.3 Purification of xylanase from A. niger ..................................................... 208
8.3.4 Effect of pH and temperature on enzyme activity ................................... 210
8.3.5 Application of xylanase in fruit juice enrichment .................................... 212
8.3.6 Effect of enzyme dosage .......................................................................... 212
8.3.7 Effect of temperature................................................................................ 215
8.3.8 Effect of incubation time .......................................................................... 217
8.4 Conclusion ............................................................................................... 219
9. General Conclusion and Future Recommendation ..................................... 221
9.1 General Conclusion .................................................................................. 221
9.2 Future recommendations .......................................................................... 224
9.2.1 Screening and isolation of novel microbial strains for enzyme production
224
9.2.2 In-depth analysis of substrate utilisation and scale up of fermentation
process225
9.2.3 Innovation in enzyme application by immobilisation .............................. 225
10. References ....................................................................................................... 228
11. Peer Review Publications .............................................................................. 248
12. Oral/ Poster Presentations ............................................................................. 249
13. Book Chapters ................................................................................................ 251
12
List of Tables
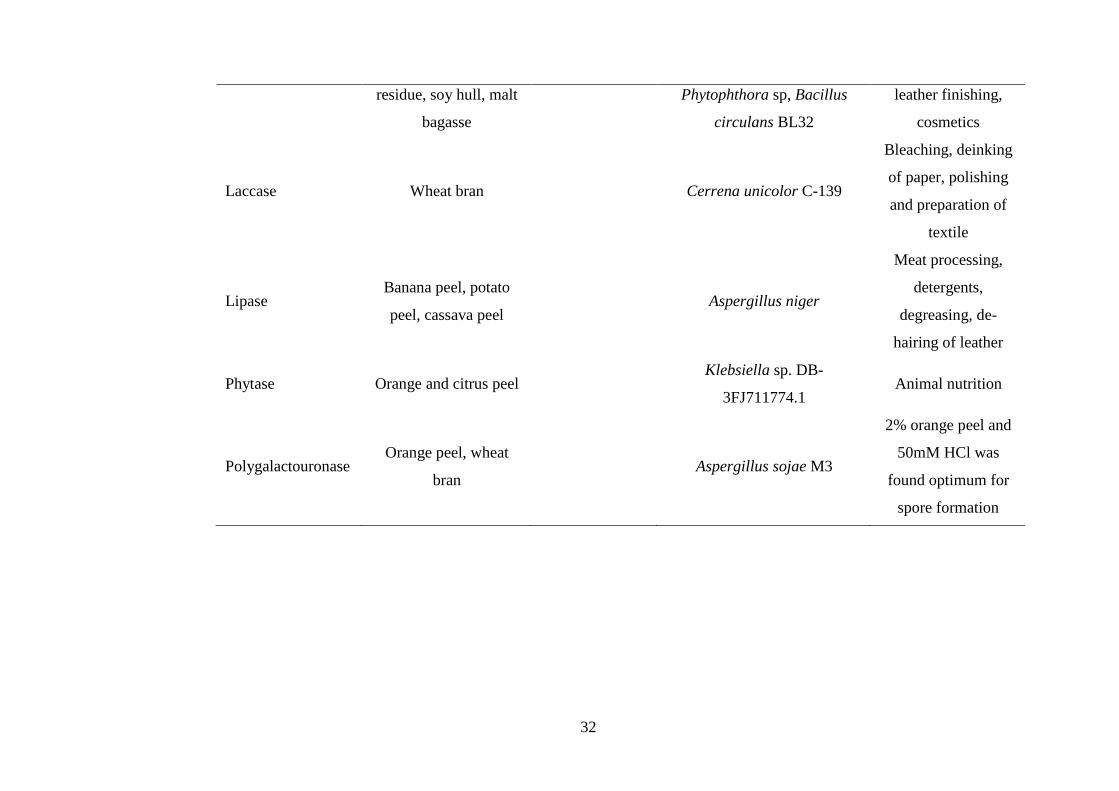
Table 2.1 Pretreatment of different agricultural biomass for the production of
industrially important enzymes (Ravindran et al., 2017) ............................. 29
Table 3.1 Common chemicals and their sources ......................................... 75
Table 3.2 Fourier Transform Infrared Absorbance Bands in Biomass Study
...................................................................................................................... 78
Table 3.3 Process variables and level in CCD for enzymatic hydrolysis of
SCW ............................................................................................................. 82
Table 3.4. Process variables and level in CCD for enzymatic hydrolysis of
BSG .............................................................................................................. 83
Table 4.1 CCD experimental designs for five independent variables,
experimental and predicted values for total reducing sugar ........................ 97
Table 4.2 Component analysis of SCW after different pretreatments ....... 103
Table 6.1 CCD experimental designs for five independent variables,
experimental and predicted values for total reducing sugar ...................... 139
Table 6.2 Compositional analysis of untreated and pretreated samples of BSG
.................................................................................................................... 144
Table 7.1 Process variables and different levels in CCD........................... 163
Table 7.2 CCD experimental design for five independent variables,
experimental and predicted values for amylase activity ............................ 173
Table 7.3 Analysis of variance obtained for amylase activity ................... 175
Table 7.4 Purification of α-amylase from B. stearothermophilus .............. 180
Table 8.1 Variables and level for Box-Behnken Design for the Optimisation
of physical parameters ............................................................................... 192
Table 8.2 Nutrient supplements for the screening of nutrients using Plackett-
Burman method .......................................................................................... 193
Table 8.3 Variables and level for Box-Behnken Design for the optimisation
of nutrient supplements .............................................................................. 194
Table 8.4 Box-Behnken experimental design for SSF Optimisation
employing three independent variables, experimental and predicted values for
xylanase activity......................................................................................... 198
Table 8.5 Analysis of variance obtained for xylanase activity .................. 199
Table 8.6 Experimental design for the screening of nutrients using Plackett-
Burman method .......................................................................................... 203
13
Table 8.7 Box-Behnken experimental design for SSF optimisation employing
three independent variables, experimental and predicted values for xylanase
activity........................................................................................................ 206
Table 8.8 Box-Behnken experimental design for SSF optimisation
employing three independent variables, experimental and predicted values for
xylanase activity......................................................................................... 207
Table 8.9 Purification of xylanase from A. niger ....................................... 208
14
List of Figures
Figure 2.1 Hierarchy of waste processing (adopted and modified from Lin et
al. (2013) ...................................................................................................... 27
Figure 2.2 Classification of pre-treatments strategy for lignocellulosic
biomass ........................................................................................................ 40
Figure 3.1 A typical DSC curve of a polymer ............................................. 80
Figure 4.1 Sequential pretreatment flow diagram........................................ 94
Figure 4.2. Response surface plots representing the effect of independent
variables on reducing sugar yield (4.2a) the effect of cellulase and
hemicellulase on reducing sugar yield when the response surface is fixed at
CSG = 3.0 g/50 ml, time = 72 h and pH = 6.0; (4.2b) representing the effect
of time and CSG on reducing sugar yield, when the response surface is fixed
at cellulase = 0.9 ml/50 ml, hemicellulase = 0.9 mg/50 ml, pH = 6.0; (4.2c)
representing the effect of cellulase, time on reducing sugar yield, when the
response surface is fixed at CSG = 3 g/50ml, hemicellulase = 0.9 ml/50 ml,
pH = 6.0; (4.2d) representing the effect of hemicellulase and CSG on
reducing sugar yield, when the response surface is fixed at cellulase = 0.9
(mg/50 ml), time = 72 h, pH = 6.0; (4.2e) representing the effect of CSG and
pH on reducing sugar yield, when the response surface is fixed at cellulase =
0.9 ml/50 ml, hemicellulase = 0.9 ml/50 ml, time = 72 h, and (3f) representing
the effect of CSG and cellulase on reducing sugar yield, when the response
surface is fixed at hemicellulase = 0.9 ml/50 ml, time = 72 h, pH = 6.0. .. 100
Figure 4.3 Effect of acid concentration and time on reducing sugar release
.................................................................................................................... 103
Figure 4.4 Effect of voltage and time on reducing sugar release ............... 104
Figure 4.5 Total reducing sugar released after enzymatic hydrolysis of
pretreated SCW .......................................................................................... 105
Figure 4.6 Individual Sugars in SCW hydrolysate .................................... 108
Figure 4.7 SEM images of sequentially pretreated (A) and native (B) SCW
.................................................................................................................... 110
Figure 4.8 FTIR spectra of pretreated and untreated SCW ....................... 111
Figure 4.9 XRD spectra of untreated and pretreated SCW ........................ 113
Figure 4.10 DSC thermogram of native and pretreated SCW ................... 115
15
Figure 5.1 Effect of potassium permanganate concentration on the recoveries
of SCW residues after pretreatment ........................................................... 123
Figure 5.2. Effect of ultrasound exposure on the recoveries of SCW residues
after pretreatment ....................................................................................... 125
Figure 5.3. FTIR Spectrum of ultrasound assisted KMnO4 pretreated SCW
and raw SCW ............................................................................................. 127
Figure 5.4 XRD spectra for native and pretreated SCW ........................... 128
Figure 5.5 DSC thermogram of native and pretreated SCW ..................... 130
Figure 5.6 SEM image of the spent coffee waste (SCW) (A) native and (B)
pretreated.................................................................................................... 130
Figure 6.1 Response surface plots representing the effect of independent
variables on reducing sugar yield (6.1a) the effect of cellulase and time on
reducing sugar yield when the response surface is fixed at BSG = 0.6 g/10 ml,
hemicellulase = 180 μl/10 ml and pH = 6.0; (6.2b) representing the effect of
time and BSG on reducing sugar yield, when the response surface is fixed at
cellulase = 450 μl /10 ml, hemicellulase = 180 μl/10 ml, pH = 6.0; (6.3c)
representing the effect of cellulase and hemicellulase on reducing sugar yield,
when the response surface is fixed at BSG = 0.6 g/10 ml, time = 72h, pH =
6.0; (6.4d) representing the effect of hemicellulase and BSG on reducing
sugar yield, when the response surface is fixed at cellulase = 450 μl /10 ml,
time = 72 h, pH = 6.0; (6.5e) representing the effect of BSG and cellulase on
reducing sugar yield, when the response surface is fixed at hemicellulase =
180 μl /10 ml, time = 72 h, and pH = 6.0 (6.6f) representing the effect of time
and pH on reducing sugar yield, when the response surface is fixed at BSG =
0.6 g/10 ml, hemicellulase = 180 μl /10 ml, cellulase = 450 μl/10 ml. ..... 142
Figure 6.2 Total reducing sugar released after enzymatic hydrolysis of
pretreated BSG ........................................................................................... 146
Figure 6.3 : Dilute acid hydrolysis (effect of acid concentration and time on
reducing sugar release) .............................................................................. 147
Figure 6.4 FTIR spectra and native and pretreated BSG ........................... 151
Figure 6.5 XRD spectra of native and pretreated BSG .............................. 151
Figure 6.6 DSC thermogram of native and pretreated BSG ...................... 153
Figure 7.1 Zones of clearance observed after flooding starch agar plates with
Gram’s iodine............................................................................................. 167
16
Figure 7.2 Growth profiles of amylase producing Bacillus strains in (A)
starch, peptone, beef extract media and (B) M9 minimal salts media ....... 169
Figure 7.3 Amylase activity profile of Bacillus strains in (A) starch, peptone,
beef extract media and (B) minimal salts media ........................................ 170
Figure 7.4 pH profile for amylase derived from Bacillus strains .............. 171
Figure 7.5 Temperature profile for amylase derived from Bacillus strains172
Figure 7.6 Response surface plots representing the effect of independent
variables on amylase activity: (1a) the effect of starch and peptone when the
response surface is fixed at KCl = 0.03%, MgSO4 = 0.03 and hydrolysate =
0.3% (1b) the effect of KCl and peptone when the response surface is fixed
at starch= 0.3%, MgSO4 = 0.03 and hydrolysate = 0.3% (1c) the effect of
MgSO4 and hydrolysate when the response surface is fixed at starch= 0.3%,
KCl= 0.03 and MgSO4= 0.03% (1d) the effect of starch and hydrolysate when
the response surface is fixed at peptone= 0.6%, MgSO4 = 0.03% and KCl=
0.03% (1e) the effect of hydrolysate and starch on amylase activity when
response surface is fixed at peptone=0.6%, KCl=0.03% and MgSO4=0.03%
(1f) the effect of hydrolysate and KCl on amylase activity when response
surface is fixed at starch=0.3%, peptone=0.6%, MgSO4=0.03% .............. 176
Figure 7.7 Elution profile of α-amylase from DEAE Sepharose Fast Flow
.................................................................................................................... 180
Figure 7.8 SDS-PAGE illustrates different stages of purification: (A)
molecular size markers (B) Cell free supernatant (crude enzyme), (C) enzyme
after ammonium sulphate precipitation (D) Enzyme after
ultrafiltration/diafiltraion (E) enzyme after DEAE-Sepharose Fast Flow
Chromatography ........................................................................................ 182
Figure 7.9 Biofilm formation in BHI agar supplemented with congo red: the
appearance of black crystalline colonies indicate exopolysaccharide
production (a) S. aureus NCTC 1803 (b) S. aureus ATCC 25923 (c) P.
aeruginosa ATCC 27835 (d) control.......................................................... 183
Figure 7.10 Quantitative determination of BIC for commercial α-amylase
enzyme (a) and (b) crude α-amylase from B. stearothermophilus ............. 184
Figure 8.1 Screening of fungal strains for xylanase production capacity .. 190
Figure 8.2 Response surface plots representing the effect of independent
variables on xylanase activity: (8.2a) the effect of inoculum size (log no. of
17
spores) and moisture content (%) when response surface is fixed at
temperature = 30°C (8.2b) the effect of inoculum size (log no. of spores) and
temperature (°C) when response surface is fixed at moisture content = 70%
(8.2c) the effect of temperature (°C) and moisture content (%) when response
surface is fixed at inoculum size (log no. of spores) = 0.5. ....................... 201
Figure 8.3 Response surface plots representing the effect of independent
variables on xylanase activity: (8.3a) the effect of KH2PO4 and yeast extract
on xylanase activity when response surface is fixed at MgSO4 = 0.1 g/g of
SCW (8.3b) the effect of MgSO4 and yeast extract on xylanase activity when
response surface is fixed at KH2PO4 = 0.1 g/g of SCW (8.3c) the effect of
KH2PO4 and MgSO4 on xylanase activity when response surface is fixed at
yeast extract = 0.5 g/g of SCW .................................................................. 205
Figure 8.4 SDS-PAGE (1) molecular size markers (2) purified xylanase. Step
elution was performed by various salt concentrations (0.1, 0.2, 0.3, 0.4 and
0.5 M KCl) ................................................................................................. 210
Figure 8.5 a) Effect of pH on activity and stability of xylanase (b) effect of
temperature on activity of xylanase ........................................................... 211
Figure 8.6 Effect of enzyme dosage on juice enrichment with respect to
reducing sugar content ( ) clarity ( ) and yield ( ● ) (A) of strawberry, (B)
blueberry and (C) raspberry ....................................................................... 214
Figure 8.7 Effect of temperature on juice enrichment with respect to reducing
sugar content ( ) clarity ( ) and yield (●) of (a) strawberry (b) blueberry
and (c) raspberry ........................................................................................ 216
Figure 8.8 Effect of incubation time on juice enrichment with respect to
reducing sugar content ( ) clarity ( ) and yield ( ● ) of (a) strawberry, (b)
blueberry and (c) raspberry ........................................................................ 218
18
1. General Introduction
Chapter 1
General Introduction
This chapter presents a brief explanation of the motivation behind the work, and a
summary of the principal objectives.
19
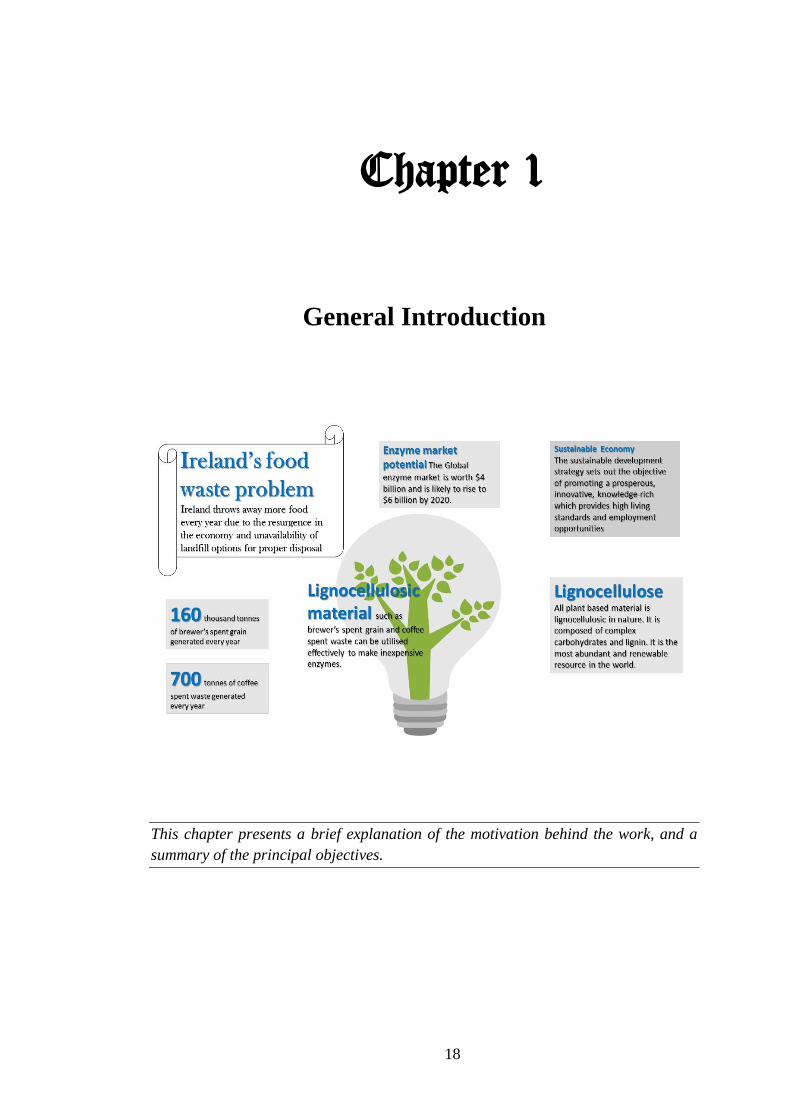
1.1 Motivation
The global population is expanding at an exponential rate every year. There is a huge
demand for food and energy to meet the needs of the society. Rapid urbanisation as
compared to slow progress in the development of in effective waste management
strategies leads to the accumulation of food waste. A study published by the EU in
2010 revealed that almost 90 million tonnes of food waste is expelled from the food
manufacturing industry every year. Consequently, the revised EU waste legislation
was adopted in the May of 2018 that calls on EU countries to act to reduce food waste
at each stage of food supply chain. Furthermore, the member states of the EU have
pledged to halve per capita food waste at the retail and consumer level by 2030. Food
waste being high in nutritional content putrefies on accumulation turning out to be
breeding grounds for disease causing organisms. This poses serious environmental
issues and very few options exist today to deal with them. While preventive measures
can be taken to reduce to the generation of food waste it is necessary to deal with the
existing lot of accumulated food waste. The idea of converting food waste in to energy
and other bio-based chemicals used for our day to day activities is an area of research
with huge potential and opportunities. Lignocellulose is one of the most abundant yet
underutilized bio-resource in the world. It is the best source of cheap carbohydrates.
Apart from its abundance and easy availability, the fact that 75% of its composition is
contributed by polysaccharide makes it a fiercely sought out raw material for the
production of value-added products (bioethanol, biodiesel, biobutanol and enzyme
production, bioactives compounds etc).
Enzymes are very efficient biocatalysts for various reactions and typically applied in
many industries, and since last decade, the use of enzymes in industrial processes has
20
significantly increased. However, according to a recent report, 30-40% cost of these
enzymes depends on the growth medium which is the major stumbling block in the
current usage of enzymes in industrial processes. Effective utilization of inexpensive,
renewable, abundant food-industry waste as cheaper media for production of
industrially important enzymes could not only be helpful in lowering the cost of
enzyme but also in enhancing the value of underutilized substrates thus improving the
economy by solving dual purpose in a symbiotic manner.
However, the heterogeneous nature of biomass hinders them to be efficient nutrients
for microbial growth for the production of bio-based chemicals including enzymes.
Furthermore, regardless of lignocellulose being a cheap polysaccharide reservoir not
many feasible techniques are available for mining its vast availability. Techniques
pertaining to the usage of lignocellulosic food waste are so varied that there is no single
solution to producing enzymes from lignocellulose. The most sustainable solutions are
likely to be those that are designed according to the local conditions and demand. Other
benefits such as high purity and reusability of enzymes are required alongside
inexpensiveness are required to provide an advantage over conventional produced
enzymes.
1.2 Aim and Objectives
Considering the above facts that a substantial part of industrial enzymes production
cost is contributed by the cost of the fermentation medium and food-industry waste as
a major economic and environmental burden, the aim of this thesis is to present the
best procedures for converting lignocellulosic food waste such as spent coffee waste
(SCW) and brewer’s spent grain (BSG) into enzymes such as α-amylase and protease.
In order to achieve the aim of the thesis following objectives have been identified:
21
1. Review of current state of technology.
2. Investigate the effects of pretreatments on the chemical composition of SCW
and BSG and evaluating the formation of inhibitors during respective pretreatment.
3. Designing new and state of art pretreatment techniques intended for better
enzymatic hydrolysis of SCW and BSG for the maximum liberation of fermentable
sugars.
4. Screening of microorganisms for α-amylase and xylanase production.
5. Investigating the sustainability of employing pretreated SCW and BSG
hydrolysate as a media component for amylase and xylanase production.
6. Application of α-amylase in antibiofilm removal and xylanase in fruit juice
enrichment.
1.3 Organisation of Thesis
This thesis is designed in a manner to begin with a thorough investigation of the present
state of current research on the valorisation of lignocellulosic food waste for enzyme
production, the laws and the problems pertaining to the impediment of
commercialization of the concept (Chapter 1 and 2). Chapter 3 presents protocols of
various existing and newly designed pretreatments on the composition, structure,
thermal properties and formation of inhibitors. Furthermore, it discusses the
optimisation of enzymatic hydrolysis conditions with respect to SCW and BSG.
Section A, focused on pretreatment strategy of selected lignocellulosic wastes and
includes three chapters, where chapter 4 and 5 discusses the effects of conventional
and customised pretreatments for SCW, while chapter 6 deals with BSG pretreatment
and how they affect the release of sugar following enzymatic hydrolysis respectively.
Section B is dedicated to enzyme production using lignocellulose waste. There are two
chapters in this section. Chapter 7 discusses the observations pertaining the screening
22
of microorganisms for amylase production, utilisation of BSG hydrolysate for enzyme
production, purification of the enzyme and its application as an antibiofilm agent.
Chapter 8 investigates the efficacy of SCW as a fermentation medium for fungal
xylanase production and subsequent utilisation of the purified enzyme for fruit juice
enrichment. The last chapter summarises the findings of this study and provides a brief
insight to the potential avenues for practical applications of enzymes produced by the
utilisation of lignocellulosic waste.
In conclusion, this thesis makes a focused and comprehensive effort to identify the
‘usability’ of plant-based food waste for the production of industrially viable enzymes.
Hurdles such as recalcitrance is addressed to develop innovative and novel technology
for its removal. This is followed by processing of SCW and BSG through enzymatic
hydrolysis to obtain sugar-rich hydrolysate. The viability of the hydrolysate as a
potential media component for the production of amylase and xylanase was
investigated. The enzymes produced were then successfully tested for potential
industrial applications.
23
Chapter 2
Literature Review
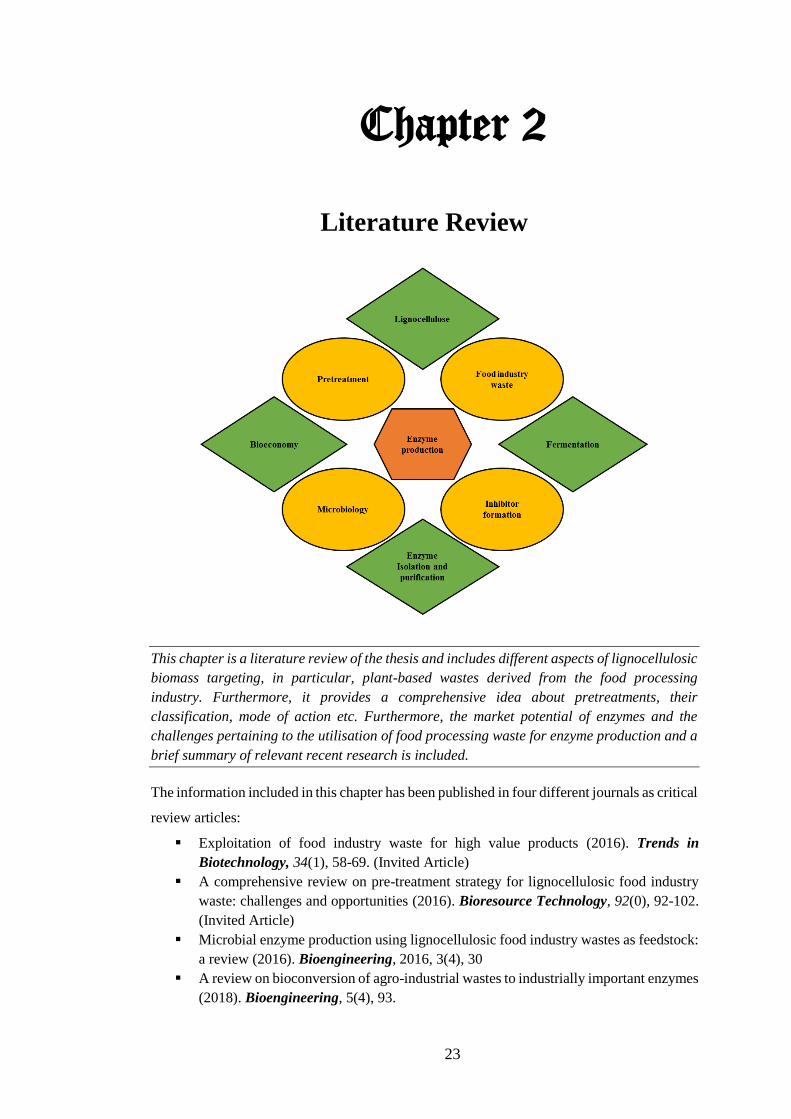
This chapter is a literature review of the thesis and includes different aspects of lignocellulosic
biomass targeting, in particular, plant-based wastes derived from the food processing
industry. Furthermore, it provides a comprehensive idea about pretreatments, their
classification, mode of action etc. Furthermore, the market potential of enzymes and the
challenges pertaining to the utilisation of food processing waste for enzyme production and a
brief summary of relevant recent research is included.
The information included in this chapter has been published in four different journals as critical
review articles:
▪ Exploitation of food industry waste for high value products (2016). Trends in
Biotechnology, 34(1), 58-69. (Invited Article)
▪ A comprehensive review on pre-treatment strategy for lignocellulosic food industry
waste: challenges and opportunities (2016). Bioresource Technology, 92(0), 92-102.
(Invited Article)
▪ Microbial enzyme production using lignocellulosic food industry wastes as feedstock:
a review (2016). Bioengineering, 2016, 3(4), 30
▪ A review on bioconversion of agro-industrial wastes to industrially important enzymes
(2018). Bioengineering, 5(4), 93.
24
2. Literature review
2.1 Introduction
Lignocellulose is one of the most abundant yet underutilised bio-resource in the world.
It is considered among the best source of cheap carbohydrates and applied as a
potential substrate for the production of a range of high value products including
bioethanol, enzymes and biogas. Apart from its abundance and easy availability, the
fact that 75% of its composition is contributed by polysaccharide makes it a fiercely
sought out raw material for the biofuel production (Sun & Cheng, 2002). Besides
biofuels lignocellulose can be used as primal matter for the production of other value-
added products such as enzymes.
In 2010, an article was published in the Ethanol Producer magazine entitled ‘The
economics of enzyme production’ according to which the cost of producing cellulosic
bioethanol is majorly dependent upon to the cost of enzymes used in the process.
Although, this scenario has improved, there are still a few worries regarding harnessing
the cost of production of bioethanol to becoming economically feasible. One such
problem that needs to be addressed immediately is the carbohydrate source used for
enzyme production. Theoretically, it is possible to recycle cheap carbohydrate sources
from industries and use it as a sugar source for enzyme production. However, the
heterogeneous nature of biomass carbohydrate sources hinders them to be efficient
nutrients, leading to incompetent growth of the enzyme producing microorganisms.
This is due to the fact that 5-C and 6-C sugars are absorbed by the microbe at different
rates during fermentation (Abdel-Rahman et al., 2015). Furthermore, these
carbohydrate sources comprise of other substances that may act as inhibitors of
microbial growth, and leads to poor fermentation yields and subsequently raising the
production costs for the desired products.
25
An efficient technique to remove components that inhibit microbial growth and
enzymatic degradation of lignocellulose is a potential solution to increase its utility.
With this aim, several studies have been dedicated to devising various pre-treatment
methods with differing nature. The lignocellulosic substance undergoes a single or a
sequential pre-treatment before its efficacy as a carbon source is evaluated.
2.2 Lignocellulosic Food Industry Waste
The food processing industry in the EU is progressing at a very fast pace. According
to the report published by FoodDrinkEurope the European food and drink industry is
the largest manufacturing sector in the continent and had a turnover of €1,048 billion
in 2012 which was a 3.1% increase from 2011. Such a growing trend in the industry
can give rise to more waste that is eventually left untreated due to lack of feasible
options. Land filling remains the cheapest option for waste management by industries.
Other options include incineration, which requires a lot of energy and, composting, a
process that is quite slow. Improper treatment of these wastes leads to their
putrefaction giving rise to toxic gases such as methane and leaching of other toxic
liquids proving hazardous to the environment. Most of the waste generated from the
food industry is lignocellulosic in nature, and thus can be potential substrates for the
production of high value products. Products that can be produced from food and
industry waste include fossil fuel alternatives such as ethanol, butanol, biogas, and fuel
oil, food supplements such as prebiotics and bioactive compounds, volatile fatty acids
and enzymes that are of commercial importance (Uçkun Kiran et al., 2014; Yin et al.,
2014).
The European Commission has coined a new term, ‘Bioeconomy’ which focuses on
addressing the environmental challenges that the world faces today. An article
26
published by the European Commission in 2009 states that EU produces an estimated
138 million tons of bio-waste from industries every year of which 40% is being used
as landfill. The motivation behind bioeconomy is to reduce relying on natural
resources by transforming the manufacturing sector. This can be achieved by
promoting sustainable production of renewable resources from land, fisheries and
aquaculture and their conversion into food, feed, fibre, bio-based products and bio-
energy, while generating more jobs and giving rise to new industries (Commission,
2009).
2.3 Food Industry waste as a renewable resource
Food industry waste is particularly interesting for renewable energy researchers as it
is mostly lignocellulosic in nature with high cellulose and lignin content (except
animal-derived food waste). Many studies have reported on various technologies on
the conversion of food waste such as apple pomace and brewer’s spent grain into
biofuel (Parmar and Rupasinghe, 2013; Liguori, Soccol et al., 2015). Cellulose and
hemicelluloses upon enzymatic breakdown releases glucose and xylose, which can be
converted into ethanol by fermentative microorganism (Das, Ravindran et al., 2012).
Furthermore, lignin upon pyrolysis and anaerobic digestion yields H2 and CH4 (Azadi,
Inderwildi et al., 2013). In the quest of renewable energy resources at the backdrop of
rising oil prices one overlooks the fact that food waste is a reservoir of other value
added chemicals. Recent studies suggest that the production of bulk chemicals from
biomass waste is 3.5 times more profitable than converting it into biofuel (Tock et al.;
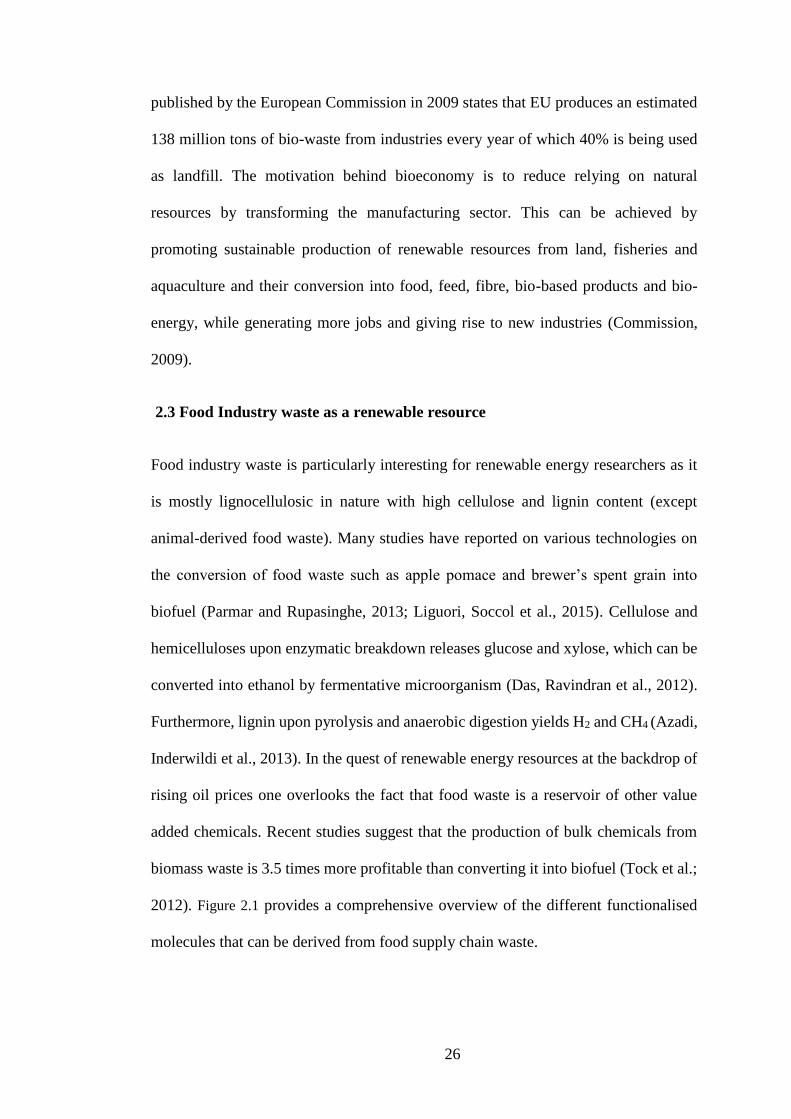
2012). Figure 2.1 provides a comprehensive overview of the different functionalised
molecules that can be derived from food supply chain waste.
27
Figure 2.1 Hierarchy of waste processing (adopted and modified from Lin et al.
(2013)
2.4 Market potential
The global enzyme industry is growing at a fast pace. It was worth almost $4.8 billion
in 2013 and is estimated that by 2018 will be worth a staggering $7.1 billion (BCC
research, 2014). Enzymes are predominantly used for the production of several
products that we use in our day-to-day lives (Jegannathan & Nielsen, 2013). Besides,
new-found interest in bioenergy has led to an increased demand for enzymes
applicable in the biofuel sector (Phitsuwan et. al., 2013). Enzymes can be prepared for
customized applications for different industrial processes with the help of recombinant
DNA technology and protein engineering. According to a report published by the
“National Renewable Energy Laboratory”, cellulosic ethanol prices are highly
28
dependent on the cost of enzymes that can break down complex carbohydrates into
fermentable sugars. Therefore, decreasing the cost of enzymes can increase the market
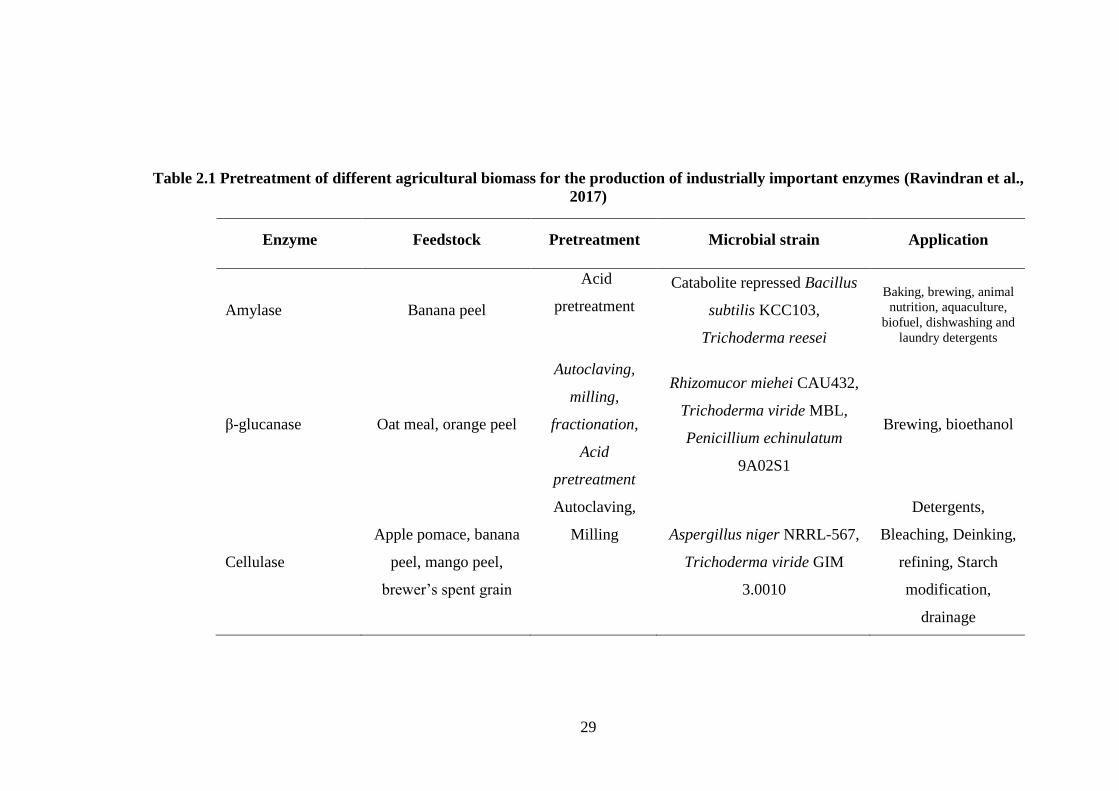
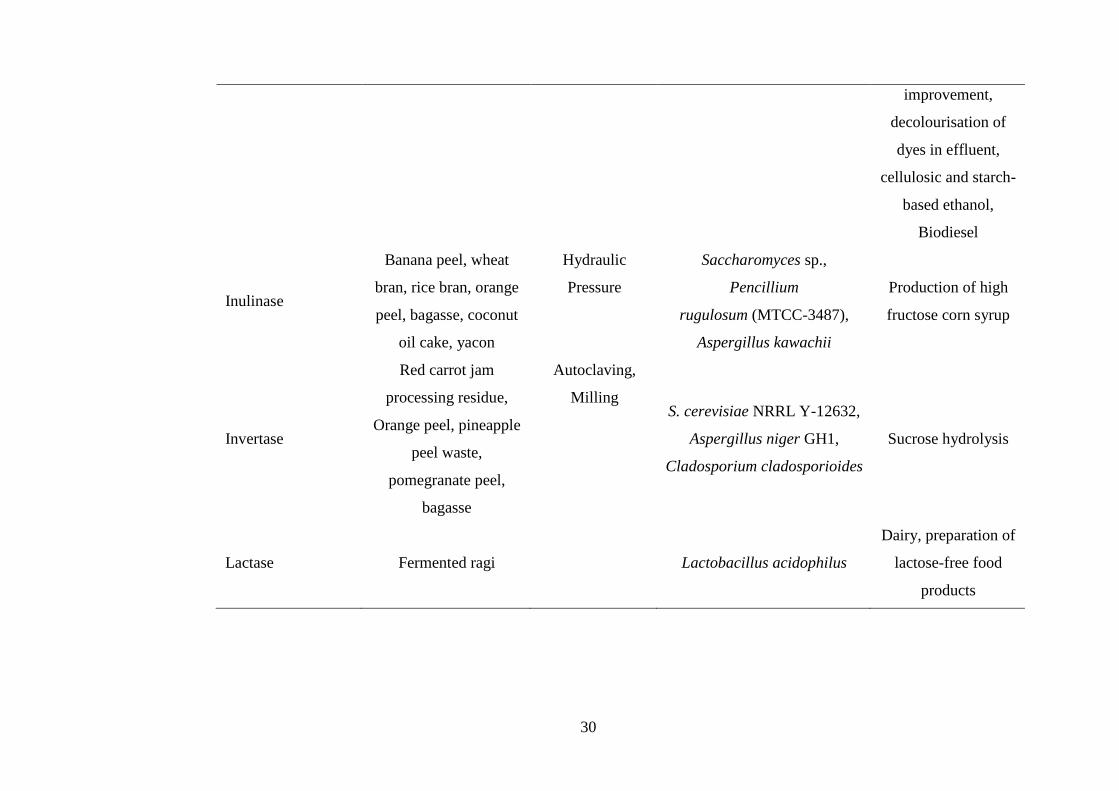
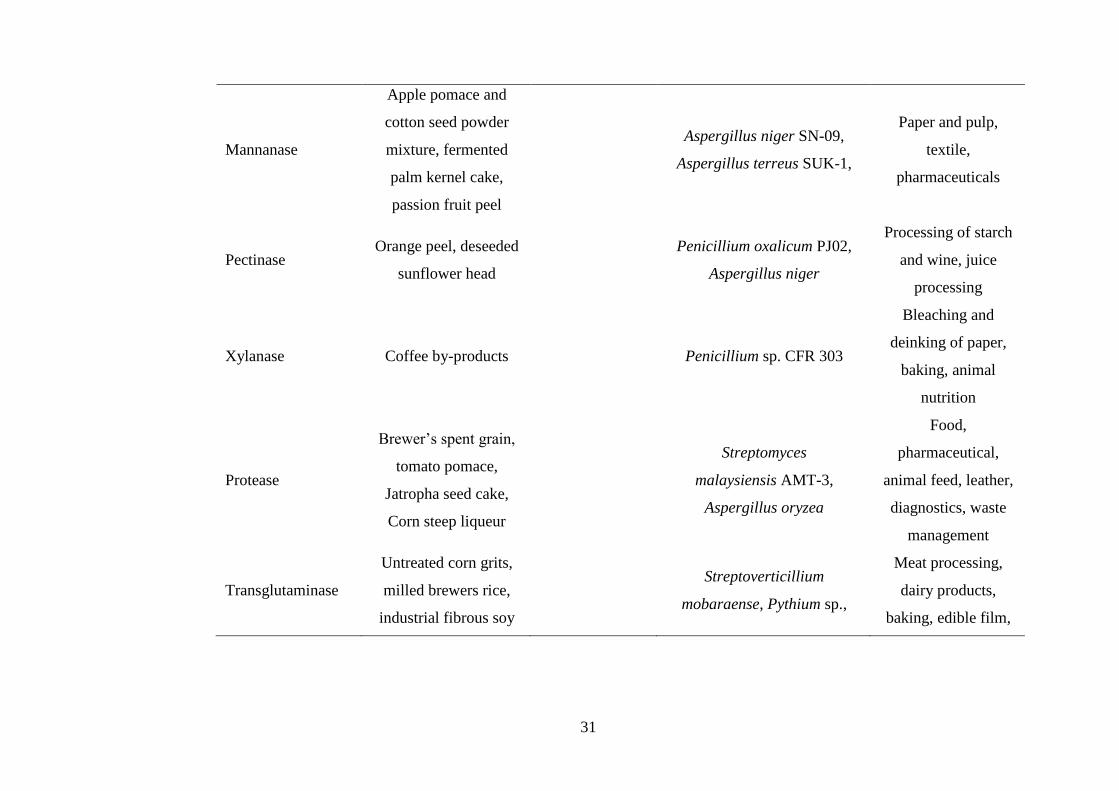
potential of biofuels and also other value-added products (NREL, 2010). Table 2.1
Pretreatment of different agricultural biomass for the production of industrially
important enzymes. Table 2.1 provides a comprehensive idea about on the use of
lignocellulosic materials as raw materials for enzyme production.
2.5 Enzymes Production using lignocellulosic food industry waste
2.5.1 Lignocellulose as a raw material
Lignocellulose is essentially a complex polymer which is made up of polysaccharides
and phenolic polymers (lignin). All plant matter is composed of lignocellulose, and
lignin is the most recalcitrant substance found in them. It imparts physical strength to
the plant cell wall. It is a complex polymer made up of coniferyl alcohol, synapyl
alcohol and p-hydroxyphenyl alcohol (Ragauskas et al., 2014). The presence of lignin
in lignocellulose prevents its effective enzymatic degradation and subsequent
utilization of fermentable sugars by microbes (Zeng et al., 2014). This calls for
effective measures for lignin removal through various pretreatment techniques (Chang
et al., 2000; Ghaffar et al., 2013). The crystalline nature of lignocellulose is another
major hurdle in its efficient utilization. Crystallinity of the biomass material is
imparted by the presence of crystalline cellulose, which, if not converted into its
amorphous form, is not susceptible to enzymatic hydrolysis (Bansal et al., 2010;
Gurgel et al., 2012).
29
Table 2.1 Pretreatment of different agricultural biomass for the production of industrially important enzymes (Ravindran et al.,
2017)
Enzyme Feedstock Pretreatment Microbial strain Application
Amylase Banana peel
Acid
pretreatment
Catabolite repressed Bacillus
subtilis KCC103,
Trichoderma reesei
Baking, brewing, animal
nutrition, aquaculture,
biofuel, dishwashing and
laundry detergents
β-glucanase Oat meal, orange peel
Autoclaving,
milling,
fractionation,
Acid
pretreatment
Rhizomucor miehei CAU432,
Trichoderma viride MBL,
Penicillium echinulatum
9A02S1
Brewing, bioethanol
Cellulase
Apple pomace, banana
peel, mango peel,
brewer’s spent grain
Autoclaving,
Milling Aspergillus niger NRRL-567,
Trichoderma viride GIM
3.0010
Detergents,
Bleaching, Deinking,
refining, Starch
modification,
drainage
30
improvement,
decolourisation of
dyes in effluent,
cellulosic and starch-
based ethanol,
Biodiesel
Inulinase
Banana peel, wheat
bran, rice bran, orange
peel, bagasse, coconut
oil cake, yacon
Hydraulic
Pressure
Saccharomyces sp.,
Pencillium
rugulosum (MTCC-3487),
Aspergillus kawachii
Production of high
fructose corn syrup
Invertase
Red carrot jam
processing residue,
Orange peel, pineapple
peel waste,
pomegranate peel,
bagasse
Autoclaving,
Milling S. cerevisiae NRRL Y-12632,
Aspergillus niger GH1,
Cladosporium cladosporioides
Sucrose hydrolysis
Lactase Fermented ragi
Lactobacillus acidophilus
Dairy, preparation of
lactose-free food
products
31
Mannanase
Apple pomace and
cotton seed powder
mixture, fermented
palm kernel cake,
passion fruit peel
Aspergillus niger SN-09,
Aspergillus terreus SUK-1,
Paper and pulp,
textile,
pharmaceuticals
Pectinase Orange peel, deseeded
sunflower head
Penicillium oxalicum PJ02,
Aspergillus niger
Processing of starch
and wine, juice
processing
Xylanase Coffee by-products
Penicillium sp. CFR 303
Bleaching and
deinking of paper,
baking, animal
nutrition
Protease
Brewer’s spent grain,
tomato pomace,
Jatropha seed cake,
Corn steep liqueur
Streptomyces
malaysiensis AMT-3,
Aspergillus oryzea
Food,
pharmaceutical,
animal feed, leather,
diagnostics, waste
management
Transglutaminase
Untreated corn grits,
milled brewers rice,
industrial fibrous soy
Streptoverticillium
mobaraense, Pythium sp.,
Meat processing,
dairy products,
baking, edible film,
32
residue, soy hull, malt
bagasse
Phytophthora sp, Bacillus
circulans BL32
leather finishing,
cosmetics
Laccase Wheat bran
Cerrena unicolor C-139
Bleaching, deinking
of paper, polishing
and preparation of
textile
Lipase Banana peel, potato
peel, cassava peel
Aspergillus niger
Meat processing,
detergents,
degreasing, de-
hairing of leather
Phytase Orange and citrus peel Klebsiella sp. DB-
3FJ711774.1 Animal nutrition
Polygalactouronase Orange peel, wheat
bran
Aspergillus sojae M3
2% orange peel and
50mM HCl was
found optimum for
spore formation
33
2.5.2 Structure of lignocellulose
Lignocellulose is made of lignin and carbohydrates like cellulose, hemicellulose,
pectin, ash, salts and minerals.
Cellulose is a polysaccharide that is made up of D-glucose bonded to each by β (1→4)
linkage forming linear chains. Cellulose is mainly found in the cell wall of plant
biomass. The plant cell wall is composed of microfibrils that are formed by cellulose
chains bound together by hydrogen bonds. Microfibrils are insoluble long-chained
compounds made up of 36 glucan chains held together by hydrogen bonds and each
chain contains about 5,000 to 14,000 glucose molecules. Cellulose can exist in
different polymorphs that are crystalline in nature. Natural cellulose is found in a
polymorph structure called polymorph I. Three other polymorphs of cellulose have
been attained via different pre-treatments viz. polymorphs II, III and IV. Cellulose also
exists in amorphous form which is soluble and can be easily digested by enzymes
(Kulasinski et al., 2014).
Hemicellulose is a heterogeneous polymer made up of short chains of polysaccharide
molecules. They constitute 15-35% of the plant biomass and are composed of five
different sugar monomers viz. D-xylose, L-arabinose (pentoses), D-galactose, D-
mannose and D-glucose (hexoses). They are usually found in the form of O-acetyl-4-
O-methylglucuronoxylans and O-acetyl-galactoglucomannans depending upon the
source of biomass. Uronic acids, like α-D-glucuronic, α-D-4-O-methylgalacturonic
and α-D-galacturonic acids have also been found in hemicellulose. Other sugars such
as α-l-rhamnose and α-l-fucose may also be existent in small quantities.
Hemicelluloses are linked to cellulose by hydrogen bonds and to lignin by covalent
bonds (Sun et al., 2014).
34
Lignin is the most abundant constituent in plant biomass. It has an aromatic and
amorphous nature and its structure varies according to the plant species it is derived
from. Lignin monomers are basically phenyl-propane units that differ only in the
substitution of methoxyl groups on the aromatic rings. The three main monolignols
(lignin monomers) that form the lignin polymer are p-hydroxyphenyl alcohol (H),
coniferyl alcohol (G), and synapyl alcohol (S). Softwoods usually contain more of the
H subunit as compared to G and S, where as in grass varieties all the monolignols are
found in equal proportions (Duval & Lawoko, 2014).
One of the most important limiting factors for making lignocellulose susceptible to
microbial attack is the lignin content. Research has shown that the removal of lignin
facilitates cellulose hydrolysis. The mechanism by which lignin obstructs hydrolysis
of cellulose is still not completely understood. However, two reasons have been
proposed that may be the lead to this phenomenon. Firstly, lignin is a structural
polysaccharide which imparts strength to the plant cell wall by covalently linking to
hemicellulose (Yuan et al., 2013). The covalent bonding between lignin and cellulose
prevents the carbohydrate to be exposed for enzymatic hydrolysis. Secondly, woody
biomass is harder to treat as compared to grass biomass. A comparison of lignin
structures in both substrates reveals that the extent of cross-linking and the phenyl
content lignin found in wood is far more complex than that of grassy substrates
(Ververis et al., 2004).
Another property of lignin, which is detrimental for cellulose activity is its capacity to
irreversibly adsorb enzymes. A study on the adsorption kinetics of enzyme to lignin
and the effect of temperature revealed that higher temperatures accelerated the
adsorption process attaining equilibrium. This may be a problem when conducting
enzymatic hydrolysis at higher temperatures. The addition of surfactants was seen to
35
reduce the adsorption of cellulase to lignin (Tu et al., 2009). Certain pre-treatments
have been observed to be more effective against lignin-enzyme adsorption as
compared to others. For example, Kumar et al. (2013) reported that ammonia fibre
expansion pre-treatment was superior over SO2 and acid-pre-treatment in terms of
cellulase adsorption capacity.
2.5.3 Pretreatment of Lignocellulose
The utilisation of cellulose in biomass as a carbon source via enzymatic hydrolysis is
a complicated process. It involves the adsorption of enzymes on the substrate surface,
the synergistic effects of other protein components on hydrolysis, and the release of
hydrolysed product into the bulk liquid. A lot of factors influence this process and they
can be broadly categorised into the structural features of lignocellulose and the
mechanisms and interactions related to enzyme kinetics. Nonetheless, addressing the
factors related to the structure of lignocellulose holds the key to efficient hydrolysis of
substrate. The aspects that influence the difficulty in the degradation of biomass
residues include lignin content, hemicellulose, available amorphous cellulose as
compared to its crystalline counterpart, the degree of polymerisation, acetyl groups,
plant protein-enzyme interaction, the association of cellulose with hemicellulose and
lignin, the accessible surface area to enzymatic degradation and porosity and the
residual surface area of biomass (Singh et al., 2015).
Pre-treatments are necessary practises to address these issues by bringing in structural
and compositional changes in lignocellulose. This is achieved by exerting high
pressure or temperature or a combination of both, treatment with corrosive chemicals
such as acids and alkali or the usage of molecular disruption techniques such as
36
ultrasound and plasma etc. Pre-treatments can remove lignin and hemicellulose to a
certain extent and increase the porosity and the concentration of amorphous cellulose.
2.5.4 Factors influencing the choice of pretreatment
There are a number of factors that need to be considered while employing a pre-
treatment strategy for a particular biomass residue before it is used as a substrate for
the fermentation. These factors include low capital and energy investments, overall
effectiveness and applicability over a wide variety of substrates. Subjecting the
lignocellulosic biomass to pre-treatment should not render the sample unusable for
further use. Added advantages, such as the ability to retrieve the hemicellulose content
in the aqueous solution, are desired. Most importantly, pre-treatments should lower the
capital cost, the operational cost and the biomass cost. Besides all these factors, there
are a few parameters that should be taken in consideration when pre-treatments are
chosen for lignocellulose. These parameters depend upon the physical and chemical
features of the biomass that help or resist enzymatic hydrolysis. The best pre-treatment
result in end products which support the growth of desired microbes, not result in
unemployable substrate molecules and also not give rise to inhibitory substances that
hinder the growth or prove to be harmful to producers.
Crystalline cellulose exists in different polymorphs and is seen in microfibrils in plant
cell wall. They are formed by long chains of (1, 4) β-D glucan bonded together by
hydrogen bonds. The presence of hydrogen bonds between chains resists enzymatic
and microbial attack while breaking them enhance depolymerisation (Chundawat et
al., 2010). Studies have shown that during hydrolysis digestion of amorphous cellulose
takes place before crystalline cellulose. The crystallinity of cellulose can be measured
37
by the different X-ray diffraction methods. The crystallinity index is used to measure
the degree of crystallinity in biomass and pulps and is determined by the equation 2.1:
𝐂𝐫𝐲𝐬𝐭𝐚𝐥𝐥𝐢𝐧𝐢𝐭𝐲 𝐢𝐧𝐝𝐞𝐱 (𝐂𝐑𝐈)(%) = (𝑰𝟎𝟎𝟐−𝑰𝒂𝒎) ×𝟏𝟎𝟎
𝑰𝟎𝟎𝟐 Equation 2.1
I002 is the intensity of diffraction of 002 peak at 2θ ≈ 22.5o and Iam is the scattering
intensity of amorphous region (2θ ≈ 18.7o) (Bansal et al. (2010).
Degree of polymerisation of cellulose is an important parameter in determining
biomass recalcitrance. Pre-treatment of lignocellulose as well as enzymatic hydrolysis
is a depolymerisation process of cellulose (Meng & Ragauskas, 2014). Size exclusion
chromatography (SEC) studies can reveal the degree of polymerization of a particular
substrate sample. Melander and Vuorinen (2001) conducted a study to determine the
depolymerisation of carboxy-methyl cellulose after enzymatic digestion using SEC.
They detected the separated CMC hydrolysates as total carbon content and reducing
sugars. The degree of depolymerisation was determined by dividing the number of
anhydroglucose units by the reducing sugar concentration. Several studies have been
focused on the efficacy of pre-treatments on the depolymerisation of cellulose. Steam
explosion treatment of cotton stalks enhanced the saccharification of the substrate by
reducing the degree of polymerization of cellulose (Huang et al., 2015).
The process of hydrolysis of cellulose greatly depends upon the adsorption of enzyme
onto the substrate. This is determined by the accessible surface area, making it a
limiting factor for efficient enzymatic digestion. The accessible surface area is in turn
dependent upon particle size, porosity and pore volume. The measurement of surface
area of the substrate can be carried out by Brunauer–Emmett–Teller method (Chen et
al., 2011). According to this method increase in surface area in sugar cane bagasse can
38
be achieved by using dilute H2SO4 assisted by microwave heating. Variations in the
pore size distribution can be determined by using differential scanning calorimetry. In
general, the measure of porosity of the substrate is considered as a direct indication of
the accessible surface area. Ye and Berson (2014) reported an enhanced rate of
cellulose hydrolysis on increase in substrate binding surface area.
Acetyl groups form the backbone of hemicellulose structures in plant cell wall. Studies
have shown that the presence of acetyl group can hinder the effective digestion of
cellulose. The degree of acylation has been reported to be a crucial factor in cellulose
hydrolysis (Jiang et al., 2014). Liquid hot water pre-treatment has found to be effective
in removing the acetyl groups found in hemicellulose and converting them into acetic
acid (Jiang et al., 2015). The acetyl groups may inhibit enzyme activity by interfering
with the hydrogen bond formation between cellulose and cellulose binding domains.
The negative effects of acetyl group inhibition can be eliminated by saponification
(Balat et al., 2008).
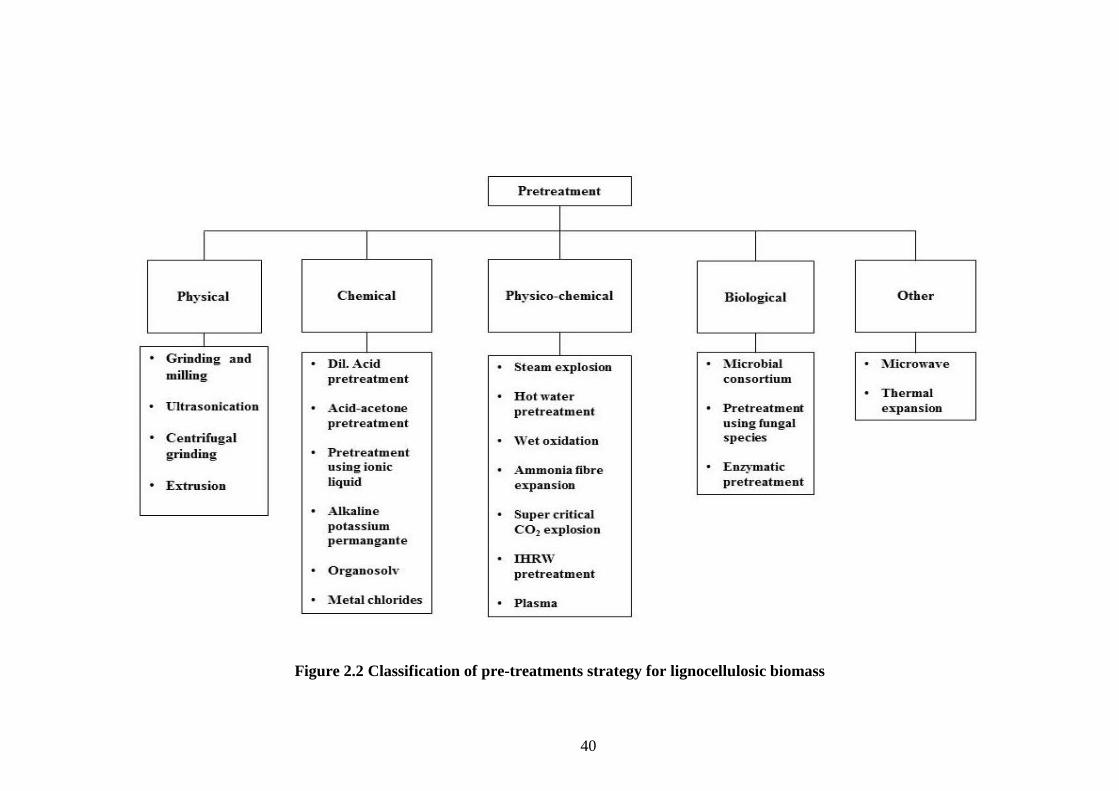
2.5.5 Pretreatment techniques
The aim of pre-treatments is to facilitate or increase the efficacy of lignocellulose
hydrolysis by improving accessibility towards cellulose-rich fractions. This is
achieved by the removal of lignin and hemicellulose, factors which affect the
availability of cellulose for microbial degradation. It also focuses on the purging other
factors that have been detailed in an earlier section. The past three decades have
witnessed a tremendous amount of research being done in the area of pre-treatments.
Different techniques have been employed to investigate the efficiency as a pre-
treatment measure. The synergistic effects on effective lignin removal have also been
explored on a wide scale. Pre-treatment techniques can be classified in various ways.
Depending on the pH that is maintained during the process pre-treatments can be
39
grouped in to three: acidic, neutral and alkaline (Singh et al., 2015). A comprehensive
classification of pre-treatments involves the assembly of different techniques based on
their mode of action. Accordingly, pre-treatment methods can be broadly categorised
in to physical, chemical, physico-chemical and biological. As the name implies
physico-chemical pre-treatments involves a combination of physical or biological
methods with chemical strategies. Table 2.1 depicts a classification of various pre-
treatments methods for lignocellulose suggested, based on extensive literature review.
40
Figure 2.2 Classification of pre-treatments strategy for lignocellulosic biomass

41
42
Grinding is a size reduction technique used for biomass pre-treatment that increases
the surface area and does not release any effluents. The size of the sample is
preliminarily reduced by cutting and milling. Ultra-fine powder is collected by the use
of a sieve. The choice of sieve depends upon the final particle size reduction that is
aimed to be achieved. The effects of grinding include alterations in the degree of
polymerisation, porosity, surface area and crystallinity. The final particle size mainly
depends upon the conditions and intensity of grinding. Silva et al. (2012) achieved
progressive particle size reduction by employing sieve based grindings, ball milling
and jet milling. The enzymatic degradability of the substrate was improved by this
process. Zakaria et al. (2015) used wet disk milling as a secondary pre-treatment step
to extract sugars from recalcitrant oil palm mesocarp fibre. They found that wet disk
milling increased the surface area accessible for the conversion of cellulose to glucose.
Ultrasonic pre-treatment employs ultrasound to breakdown the complex network of
polymerisation in biomass. Cavitation produced due to the pulsating high frequency
ultrasonic waves penetrates in to polysaccharides and disrupts the mesh of cross
linking polymers facilitating better enzymatic degradation. The biomass suspension is
irradiated for 10 minutes with ultrasound at 20 kHz and 200 KW before enzymatic
treatment. Nakayama and Imai (2013) reported the increase in adsorption of cellulase
when the authors used ultrasonic pre-treated Kenaf leaves for enzymatic hydrolysis.
Employing pre-treatment designed by augmenting ionic liquids and ultra-sonication of
rice straw. Ultrasonic pre-treatment assisted with FeCL3 was found to improve the acid
hydrolysis of cellulose thereby enhancing the crystallinity (Li et al., 2015).
Centrifugal grinding a modified grinding mechanism which utilises an advanced
grinder. This technique results in size reduction of biomass to increase contact surface
43
area and reduce cellulose crystallinity leading to better exposure of polymers for
hydrolysis. Centrifugal grinding is superior over ordinary grinding in such a way that
it exerts multiple effects viz. impact and shear. Centrifugal grinding, done in successive
steps, result in the reduction of particle to a great degree. In a particularly interesting
study, Silva and Xavier (2011) examined the chemical composition of fractions
obtained after passing grinded wheat straw through sieves of different sizes. They
found out that larger fractions were mostly made up of cellulose while the smaller
fractions had protein and ash in them.
Extrusion is a process where uniformly moistened biomass material is passed through
a screw assembly and applied pressure upon under high temperature at a particular
frequency. It requires a device called the extruder; the biomass can be mixed with
different chemicals like sodium hydroxide, urea or thio-urea to increase the severity of
the pre-treatment process. Lamsal et al. (2010) reported in higher reducing sugar yields
using extrusion pre-treatment as opposed to grinding using wheat bran as substrate.
Parameters, such as screw speed, barrel temperature and their collaboration has a
substantial impact on sugar recovery from biomass. A comparative study between
three pre-treatment strategies viz. dilute acid, alkali and extrusion was conducted using
soybean hulls as the lignocellulosic substrate. It was found that post pre-treatment the
glucose yield after enzymatic hydrolysis compared with untreated substrate increased
by 69.6%, 128.7% and 132.2%, respectively (Yoo et al., 2011).
Dilute acid pre-treatment hydrolyses hemicellulose and makes cellulose more
susceptible to enzymatic degradation. Strong acids, like sulphuric acid, in diluted form
are used to treat the lignocellulosic biomass. The biomass samples are immersed in
dilute acids and the temperature is raised to 160°C and maintained for 10 minutes.
With dilute-acid pre-treatment a considerable reduction in galactosyl and xylosyl
44
groups (hemicellulose) can be achieved however, with a higher lignin content (Zhou
et al., 2014). Jatropha curcas shells were used to study the effect of dilute sulphuric
acid pre-treatment on hydrolysis. Almost 70% of enzymatic conversion of cellulose
was obtained after following this pre-treatment protocol (Martín et al., 2015).
Acid-acetone pre-treatment takes advantage of acidolysis at high temperatures
followed by cold shock. A quantified amount of biomass is mixed with concentrated
phosphoric acid (not less than 85%) and kept in a rotary air-bath for 1h at 120 rpm and
50°C. The slurry is then mixed with pre-cold acetone and mixed thoroughly. After
centrifuging the slurry for 10 minutes at 8000 rpm the supernatant is collected for
reducing sugar analysis while solids are washed again thrice in distilled water and then
used for enzymatic hydrolysis. Studies have shown that over 99% of the total cellulose
content in acid-acetone pre-treated lignocellulose was available for enzymatic
hydrolysis to obtain glucose (Qin et al., 2014).
Ionic liquids are thermally stable organic solvents that are capable of polar and non-
polar organic, inorganic and polymeric compounds. They have low volatility, are non-
flammable and can be recycled. This can be considered an advantage considering how
cost intensive pre-treatments can be. Pre-treatments using ionic liquids do not require
much energy as well. Some of the ionic liquids that are used for treating lignocellulose
are an anionic chloride, formate, acetate or alkylophosphonate; moieties that can form
strong hydrogen bonds with cellulose and other carbohydrates. Pre-treatment using ILs
involves mixing it with the biomass at a ratio of 20:1 and then heating it for 120°C for
30 minutes. Deionised water is then added in to the mixture to form a ratio of 5:1. The
IL/water mixture is then separated from the biomass by vacuum filtration. In a study
involving energy cane bagasse, 7.9% or lignin removal was achieved using IL pre-

45
treatment. The insufficient removal of lignin was attributed to its location in the lignin-
carbohydrate complex (Qiu et al., 2012).
Alkaline Potassium permanganate pre-treatment takes advantage of the strong
oxidation property of potassium permanganate. Potassium permanganate is generally
considered safe as compared to ozone and ionic liquids. Alkaline potassium
permanganate solution (APP) has the ability to de-lignify biomass by oxidation with
high carbohydrate retention. This is done by breaking the ester and ether bonds
between lignin and carbohydrates. Corn bobs were used in a study employing APP
pre-treatment as the lignin removal strategy. Researchers were able to find that the
optimum time of exposure for maximum lignin removal was 6 hours. Also, it was
observed that higher temperatures favoured the pre-treatment process (Ma et al., 2015).
Organosolv pre-treatment is normally performed by using strong inorganic acid
catalyst like sulphuric acid which hydrolyses the bonds in lignin. The advantage of this
process is the option to recover lignin as a value-added product. Additionally, solvent
recovery requires minimal energy. Amiri et al. (2014) reported the use of aqueous
ethanol containing 1% w/w of sulphuric acid for pre-treating rice straw with a solid-
liquid ratio of 1:8. The temperature of the mixture was maintained at 150-180°C for
30-60 minutes. After cooling it in an ice bath, the pre-treated material was finally
washed with 60% ethanol and kept drying overnight. The treatment of the biomass for
1 hour at 180°C resulted in 60% removal besides the partial dissolution of
hemicellulose in the organic liquor. Developments in this mode of pre-treatments
involve the use of other chemicals such as formaldehyde, acetylene, sulphuric acid
catalysed ethanol and auto-catalysed ethanol (Chen et al., 2015).
46
Metal chloride pretreatment requires a high pressure reactor to perform the pre-
treatment. Biomass is loaded in the reactor along with metal chlorides (FeCl3, FeCl2,
CrCl3, ZnCl2, and AlCl3). The reactants are heated to 170°C for 30 minutes. The pre-
treated solids are removed via filtration. A study conducted by Chen et al. (2014)
revealed that using metal chlorides for pre-treatment of lignocellulose results in the
decrease in the total mass of the substrate. Most of the carbohydrate gets degraded in
the acid environment and a major share of it appeared in the effluent. The hydrolysis
of bamboo biomass by dilute hydrochloric acid in ionic liquid involving metal ions
such as Na+, K+, Mg2+, Ca2+, Cu2+ and Fe3+ was conducted to study the effects. A
maximum sugar yield of 67.1% was obtained at 100°C and Cu2+ was found to be the
best metal ion for this process (Wang et al., 2014).
Plasma-assisted pre-treatment technique employs plasma to make changes on the
surface of cellulose. Plasma treatment results in extirpation resulting in the increase
in coarseness of cellulose. Plasma generated high reactive species such as HO• and
H2O2 which degraded cellulose to obtain glucose. A study was conducted to find out
the changes on the surface of cellulose when exposed to dielectric barrier discharge
plasma. AFM and XPS were the analytical tools for investigating the surface bound
changes. According to the data obtained from AFM, the corresponding changes can
influence the adhesion of molecules (preferably protein and enzyme) on the substrate
surface (Flynn et al., 2013). Experiments involving plasma pre-treated biomass for
bioethanol production resulted in a maximum ethanol yield of 52% (Schultz-Jensen et
al., 2011).
Steam-assisted fractionation of biomass materials (also called autohydrolysis) is one
of the oldest and yet the most effective pre-treatment methods that facilitate enzymatic
hydrolysis. The process involves subjecting the biomass to high pressure and
47
temperature for a certain amount of time after which the sample is rapidly
decompressed resulting in the breakdown of the lignin-carbohydrate complex.
However, a drawback that has been reported with this method is that with woody
substrates the extent of delignification is very less leading to lesser enzymatic
hydrolysis of cellulose (Kumar et al., 2012). A study using corn fibre as substrate
employed steam explosion as the pre-treatment strategy with 6% SO2 at 190°C.
Accordingly, sequential SO2 combined steam explosion followed by enzymatic
hydrolysis resulted in a high polysaccharide conversion of 81% (Vivekanand, Olsen,
Eijsink, & Horn, 2014). Sequential pre-treatment using steam explosion and 1% H2SO4
was found to assist enzymatic digestibility of cotton stalks and also resulted in high
sugar-ethanol yield (Huang et al., 2015).
Hot water-assisted pre-treatment is ideal for lignocellulose substrates where the
addition of chemicals for delignification can result in loss of useful biomass. This
method does not require corrosion resistant reactors or chemicals and the formation of
toxic compounds is almost absent (Jiang et al., 2015). The process is performed in a
customized high-pressure reactor. 100 g of dried substrate is loaded in to the reactor
along with a 900 ml of deionised water and 2g of NaOH. The stirring speed is
maintained at 600 rpm with a temperature of 230°C. After pre-treatment the reactor is
cooled in cold, running water and as the temperature lowers to 80°C the slurry is
separated in solid and liquid fractions using vacuum filtration (Li et al., 2014).
Wet oxidation technique relies on the high pressure and temperature in aqueous
conditions for the breakdown on lignocellulose. It employs oxidative agents and results
in the formation of hydroxyl radicals which corrode in to lignin and carbohydrates.
Experiments are conducted in a loop reactor with the over-head chamber filled with
12 bars of oxygen gas. After the reaction the solids are separated from the liquid by
48
vacuum filtration. Wet oxidation has been reported as a safe pre-treatment method as
no harmful compounds result from it. Using clover and rye grass as substrate, a team
of researchers were able to attain an enzymatic hydrolysis conversion efficiency of
93.6%. Furthermore, the overall glucose yield post-pre-treatment and hydrolysis was
found to be 75.5% (Martín et al., 2008).
Ammonia fibre expansion (AFEX) is one of the most successfully tested
lignocellulose pre-treatment methods for the production of fermentable sugars from
biomass. Anhydrous or highly concentrated ammonia is added (ammonia loading) to
wet substrate (water loading) at moderate temperatures and high pressure conditions.
This condition is maintained for a while (residence time) before the pressure is
released. This leads to the vaporisation of ammonia which can be collected, recycled
and used again. AFEX pre-treatment is most suitable for preventing cellulase
adsorption to lignin. A comparative study of AFEX pre-treatment on corn stover pre-
soaked in hydrogen peroxide and normal substrate showed that using the former, the
enzymatic digestibility was enhanced with values of 87.78% and 90.64% for glucan
and xylose respectively (Zhao et al., 2014).
Super critical carbon dioxide (SCCO2) is a modified steam explosion involving CO2
instead of atmospheric air. A specified amount of biomass is wetted and loaded in a
reactor after which the pressure within the reactor is built up by means of super critical
CO2. This condition is maintained for some time following which the pressure in the
reactor is suddenly realised resulting in fractionation of the lignocellulosic substrate
(Srinivasan & Ju, 2012). Super critical CO2 diffuses in to the crystalline structure of
cellulose and the explosion created subsequently disrupts the biomass cell wall and
facilitates easy access to cellulytic enzymes towards the substrate. A maximum
49
glucose yield of 30% was obtained from corn stover samples after SCCO2 pre-
treatment and consequent hydrolysis (Narayanaswamy et al., 2011).
Integrated hydroxyl radicals and hot water (IHRWT) pre-treatment is a
combination of hot water treatment and pre-treatment using hydroxyl radicals.
Hydroxyl radicals have the capability to break hydrogen bonds in carbohydrates and
lignin. In a study conducted by (Gao et al., 2015) hydroxyl radicals were generated in
vivo by the Fenton or Haber-Wiess reaction by mixing H2O2 and FeSO4 at
concentrations of 0.0.18% and 11.9 mM respectively. The biomass was initially
exposed to hot water pre-treatment (100°C, 30 minutes) which deteriorated the
complex polymeric structures in lignocellulose to expose lignin and polysaccharides.
As a result a glucose yield of 59.9 mg/g DM was obtained with a cellulose conversion
rate of 88.1 % on enzymatic hydrolysis.
Biological pre-treatment systems rely on biological agents to delignify
lignocellulose and make the process of enzymatic hydrolysis more convenient. Unlike
physical and chemical pre-treatment methods, biological pre-treatments do not involve
high temperature and/or pressure and does not require acids, alkali or any reactive
species. Additionally, the process does not generate any undesirable products.
However, the disadvantage of using biological pre-treatment strategies is that there is
limited control over the whole process. Moreover, it is a slow process and thus time
consuming. Nonetheless, one may employ these pre-treatment techniques for lesser
capital costs and environmental benefits. Biological pre-treatment procedures may
broadly be classified in to use of microbial consortium, fungal treatments and
enzymatic treatments.
50
The idea of using mixed cultures for lignocellulose processing spawns from the fact
that using a single species for lignin removal does not concur with the same process
occurring in nature; lignocellulosic material is degraded as a cooperative effort of
many microbial species regardless of the aerobic/anaerobic conditions. Employing a
microbial consortium for delignification eliminates several drawbacks encountered in
a single species treatment such as metabolite repression and feedback regulation
(Zhang et al., 2011). Meanwhile, ensilage is a conventional technology used for the
storage of animal feed. Naturally occurring bacteria produces enzymes that digest the
lignocellulosic material providing substrates that is more easily digested by ruminant
animals. Lactobacillaceae appears as the dominant species in the consortium of
microbes that ferment biomass during ensilation. Although, the capability to degrade
lignin is virtually absent, the effects on the biomass made by the microbial consortium
improve the yield of fermentable sugars derived from the substrate (Chen et al., 2007).
For this reason, ensilage storage cannot be counted upon as a stand-alone pre-treatment
process.
Delignification of biomass using fungal species is an area that has witnessed a lot of
research in recent years. ‘White rot fungi’ is a small group of basidiomycetic fungus
that thrive on wood. They are capable of breaking down and demineralizing lignin.
They do this with the help of one of their two enzyme systems viz. the oxidative
lignolytic system which attacks the phenyl rings in lignin and the hydrolytic enzyme
system degrades cellulose and hemicellulose to release fermentable sugars. The
oxidative lignolytic system comprises of three major enzymes: lignin peroxide,
manganese peroxide and laccase. The most common species of white rot fungi that has
been employed for treatment of lignocellulose include Phanerochaete
chrysosporium, Phanerochaete carnosa, Ganoderma lucidum, Pleurotus ostreatus,
51
Pleurotus pulmonarius, Phanerochaete chrysosporium and Trametes sp (Vicuña,
2000).
Brown rot fungi are another class of lignocellulose degrading fungi that uses enzymes
to degrade cellulose and hemicellulose with minimal removal of lignin. It has been
theorized that the removal of lignin by brown rot fungus follows a non-enzymatic
pathway using hydroxyl radicals (Jensen et al., 2001). According to research done by
Schilling et al. (2009) delignification is step undertaken by brown rot fungi as a pre-
treatment of sorts: to facilitate saccharification. In another study conducted by
Schilling et al. (2012) using different types of wood, the saccharification rates after
pre-treatment increased three folds by using brown rot fungi (specifically Gloeophyll
umtrabeum and Postia placenta).
While fungal pre-treatment methods directly use white rot fungi to remove lignin from
biomass, enzymatic pre-treatment procedures employ pure enzymes derived from the
same organisms to achieve a common goal. Laccase, manganese peroxide and versatile
peroxide are enzymes that are used extensively to treat the lignocellulosic substrate.
Laccases are phenol oxidases containing multiple copper ions and they catalyse the
oxidation of phenols, anilines and aromatic thiols. Phenol removal by laccase enhances
microbial growth, improves fermentation capability and reduces the time the organism
spends in lag phase (Oliva-Taravilla et al., 2015). Manganese peroxidase is another
enzyme produced by white rot fungi which takes advantage of the manganese in
woody substrates. It is generally thought that the inability of brown rot fungi to
produce this enzyme have compelled it depend on hydroxyl radicals and Fenton
reaction to degrade lignin. Manganese peroxidase contains a heme component with a
catalytic cycle and it is uniquely selective for Mn2+ ions for oxidation. The oxidation
of Mn2+ to Mn3+ is coupled by the reduction of hydrogen peroxide to water. Mn3+ is a
52
highly reactive species capable of interactions with phenols, non-phenolic aromatic
compounds and long chain unsaturated fatty acids leading to bond cleavage in lignin
(Brown & Chang, 2014).
Thermal expansionary pre-treatment is a two-step process involving boiling of
biomass at high pressure followed by rapid decompression. A process temperature
ranges from 170-200°C is applied for a residence of 0-60 minutes. Torrefaction is kind
of thermal pre-treatment which involved temperatures in the range of 200-300°C.
Torrefaction can be categorised as wet and dry depending upon the presence and
absence of water. Wet torrefaction involves hot compressed water at temperatures of
200-260°C in a pressure reactor. Dry torrefaction, also known as low temperature
pyrolysis were the biomass is exposed to an environment with an inert gas such as
nitrogen at temperatures ranging from 200 to 300°C. A study conducted to compare
the effect of both torrefaction effects on the equilibrium moisture content of biomass
revealed that pre-treated biomass is more hydrophobic than raw biomass (Acharjee et
al., 2011).
Microwave pre-treatment is a modified version of thermal pre-treatment. As
opposed to thermal pre-treatment, heat is provided to the biomass material directly in
the form of microwave radiation which converts to thermal energy. The microwaves
penetrate the material and heat the entire volume from the inside. The process is rapid
and uniform in nature. The advantages of this process are not confined to uniform
heating and lower time requirement but increased energy efficiency, controlled heating
and excellent control over the whole process. Different microwave-assisted pre-
treatments have been tried and tested and found to be very effective. About 46% of
lignin was removed retaining 90% of glucose and 76% of hemicellulose when sweet
53
sorghum bagasse was subjected to microwave-assisted dilute ammonia pre-treatment
(Chen et al., 2012).
2.5.6 Formation of inhibitors
Compounds formed during the pre-treatment process of lignocellulose may prove
inhibitory to enzyme activity, microbial growth and metabolism. Potential inhibitory
chemicals that can be released from cellulose, hemicellulose and lignin when
employing thermochemical treatments are aliphatic acids such as acetic, formic and
levulinic acid, furaldehydes such as furfural and 5-hydroxymethylfurfural (HMF) and,
uronic acid, 4-hydroxybenzoic acid, vanillic acid, vanillin, phenol, cinnamaldehyde,
and formaldehyde. Furan derivatives are formed by the thermal breakdown of pentose
and hexose sugars. The two furan derived representatives, 2-furaldehyde (furfural) and
hydroxyl methyl furfural arise from the decomposition of pentose and hexose sugars
on treating lignocellulose with diluted sulphuric acid. Furan derivatives are detrimental
to the activity of several enzymes that are involved in microbial metabolism such as
hexokinase, aldolase, phosphofructokinase, triosephosphate dehydrogenase, and
alcohol dehydrogenase (Behera et al., 2014).
Aliphatic acids are by-products of thermal augmented acid treatment of sugars.
Lignocellulose hydrolysate derived aliphatic acids include acetic acid, formic acid and
levulinic acid. Acetic acid is formed by two ways: the acetyl groups in hemicellulose
are dissociated during hydrolysis to form acetic acid. Secondly, acetic acid is a by-
product of the fermentation process (Taherzadeh et al., 1997). Formic acid is the
dissociation product of furfural while HMF is the precursor for levulinic acid
formation (Ulbricht et al., 1984). Phenolic compounds are a derivative of lignin
degradation when lignocellulose undergoes thermal pre-treatment augmented by acid
catalysis (Trajano et al., 2013). Phenolic compounds are also generated by the
54
breakdown of sugars. Several recent researches showed that phenolic compounds
inhibits the growth of microorganisms; though, the precise process by which phenolic
compounds inhibit microbial growth and fermentation process is yet not elucidated
convincingly. The measurement of phenolic compounds in the pre-treated
lignocellulose can be assessed by performing gas chromatography-mass spectroscopy
(GC-MS), high performance liquid chromatography (HPLC) and liquid
chromatography coupled with mass spectrometry (Jonsson et al., 2013).
2.5.7 Choice of Microorganism
Considerable research has been conducted to reveal several microorganisms belonging
to the fungi, yeast, bacteria and actinomycetes categories. Screening of
microorganisms is one of the most efficient means of finding new enzymes viable to
the industry. This is particularly true in the case of thermophilic microorganisms that
are isolated from exotic locations and subsequent extraction of enzymes. One of the
greatest advantages of employing thermophilic microorganisms for enzyme
production is reducing the risk of contamination due to bioprocessing operations being
conducted at higher temperatures. Furthermore, elevated temperatures also result in
lesser viscosity and greater solubility of substrates, subsequently resulting in increased
product yields due to favourable displacement of the equilibrium in endothermic
reactions (Vandenberghe et al., 2016).
Enzymes of microbial origin employed in the industry are commercially available as
enzyme preparations. These preparations not only contain the desired enzyme, but also
other metabolites of the production strain, along with additional preservatives and
stabilizers that are food grade and comply with applicable regulatory standards. While
evaluating the safety of an enzyme, the safety of the production strain remains the
primary consideration. Toxigenic potential is defined as the ability of a microorganism
55
to produce chemicals (toxins) that can cause food poisoning (Arslan et al., 2014).
Strains that are meticulously characterized to be non-pathogenic and non-toxigenic,
particularly those with a history of being safe, are reasonable choices for the
production of industrial enzymes (Pariza et al., 2014).
A majority of the industrially important enzymes has been derived from a rather small
group of bacterial and fungal strains, primarily Bacillus subtilis, Bacillus
licheniformis, Aspergillus niger and Aspergillus oryzea. These microbes have
historically been used for the commercial production of various metabolites, leading
to a thorough understanding of their characteristics and metabolic reactions, and have
been documented to be efficient for industrial scale production. They can also be
genetically manipulated easily and are known for their ability to overexpress proteins
of interest in fermentation media. These features make these microorganisms
extremely desirable as hosts for a variety of heterologous enzymes. Furthermore,
genetic engineering has enabled several microorganisms with no history of use in the
industrial production of native enzymes, such as Escherichia coli K-12, Fusarium
venenatum and Pseudomonas fluorescens to be successfully utilized as hosts for
expression of industrially important enzymes (Olempska-Beer et al., 2006).
Wild-type strains produce a variety of extracellular enzymes, which may naturally
produce enzymes that have industrial importance. A common method exploited to find
these microbes is bioprospecting. Microbes are collected from specific environmental
niches and their ability to hydrolyze specific substrates is investigated. Subsequently,
the best candidate is selected based on screening for the production of an enzyme of
interest. Another method is analyzing the genetic composition using metagenomic
tools. Probes and group-specific primers are employed to find new enzymes. The
major drawback with this method is qualitative: the metabolic potential cannot be
56
measured since the isolation and culturing of the microorganism is not performed.
Comparative genome analysis of microbial strains assists in the screening of
prospective microbes in a short time. This facilitates the evaluation of the proteome of
the microorganism (Youssef et al., 2013).
The concept of metabolic engineering was introduced by Bailey in 1991 and relates to
‘the improvement of cellular activities by manipulation of enzymatic, transport, and
regulatory functions of the cell with the use of recombinant DNA technology (Nevoigt
et al., 2008). A metabolic pathway (or pathways) associated with the production a
desired chemical compound by fermentation is/are over-expressed in a cell by genetic
engineering employing classical mutagenesis and selection and/or recombinant
techniques. Cells are “evolved” in the laboratory to make them tolerant to high product
concentrations by removing the normal genetic and biochemical regulation of the
genes and enzymes associated with the pathway by genetic manipulation. Finally, a
robust fermentation process is developed that allows mass production of the desired
compound (Keasling et al., 2012).
While traditional metabolic pathway engineering approaches have been successful in
producing engineered microbes, novel techniques need to be called upon to develop
microorganism and processes that are cost-competitive with existing large-scale, low-
cost chemical manufacturing processes, to produce the same compounds in high-
volume and at low-cost. Techniques, like genome sequencing, and new fields of study,
like bioinformatics, systems biology and metabolomics, have greatly helped
researchers to embellish the competences of metabolic engineering over the past
decades to deliver new, highly engineered organisms that are capable of high
throughput performance using renewable resources as substrates, lowering the cost of
production even further (Agrimi et al., 2012; Buschke et al., 2013).
57
2.6 Fermentation Strategies
2.6.1 Solid State Fermentation
Solid state fermentation has been used for the production of several industrial
enzymes. This mode of fermentation encourages the growth of fungal species, such as
ascomycetes, basidiomycetes and deuteromycetes, on solid substrates, and the
development of conidiospores in particular (Batche et al., 2014). Most of the industrial
enzymes are of fungal origin. The genetic expression of fungal organisms differs in
solid state fermentation and submerged fermentation (Barrios-González et al., 2012).
However, solid state fermentation has not been adopted for large-scale production
because of its inability to standardize processes and limited reproducibility of results.
Temperatures can rise to unprecedented levels with fewer measures to control them,
which can denature the enzymes that are produced in the reactor. Aeration has been
proposed as a measure to address this issue. This can, however, lead to water loss due
to evaporation (Hölker et al., 2005).
Advances in fermentation technology have seen some success in formulating methods
to make solid state fermentation an amenable process. Ito et al. (2013) constructed a
non-air flow box (NAB) with a moisture permeable membrane. Water vapour escapes
through the membrane keeping the substrate dry, resulting in uniform culture growth
and rapid enzyme production with high reproducibility (Ito et al., 2013). Solid state
fermentation promises high volumetric productivity with a high concentration of
products, along with lesser effluent production, leading to minimal downstream
processing (Singhania el al., 2010). However, a study involving the use of organic
waste for the production of enzymes using the solid-state fermentation regime reported
the emission of volatile organic compounds (VOC) such as CH4, N2O and NH3
(Maulini-Duran et al., 2015).
58
2.6.2 Submerged Fermentation
The submerged fermentation strategy is the most sought-out method for large-scale
production of enzymes. It involves water-based medium within the reactor, which
helps in maintaining the pH and temperature and provides provisions for aeration and
agitation within the vessel. A sterile environment can be maintained within the reactor
with lesser chance of contamination. Submerged fermentation maintains a
homogenous environment, with the reactor facilitating better control over process
parameters. While this helps optimization studies and the even distribution of nutrients
and oxygen to the growing microbe, the presence of negative factors such as butylated
hydroxytoluene, hydrogen peroxide and metal ions, which induce oxidative stress, can
undermine the whole operation (Roukas et al., 2016). Several filamentous fungal
species are employed for the production of various enzymes and bioactive compounds.
Although submerged fermentation is employed for the cultivation of these microbes
in the industry, several studies prove that it is not the best method available (Gibbs et
al., 2000). Submerged fermentation is not as economical as solid-state fermentation
due to the requirement of large and sophisticated equipment. A comparative study
involving the production of biodiesel revealed that the capital investment required for
submerged fermentation was 78% more than that of the solid-state mode (Zhang el al.,
2012).
2.6.3 Isolation, purification and recovery of enzymes
Once the production stage ends, enzymes are formed in the media in the form of crude
extract. Although the crude extract exhibits the desired enzyme activity, low rates of
reaction and the presence of impurities, such as media components used for microbial
cultivation, metabolites and toxins released by the microorganisms, prevent its use as
a commercial entity. Therefore, isolation and purification are the last steps of any
59
enzyme production process. Purifying the enzyme increases its specific activity and
removes any unwanted factors from the finished product. Protein purification
techniques have been an area of research for many decades owing to the product’s
commercial importance. Obtaining the finalized product requires strenuous measures,
which start with cell disruption (depending on the source), extraction, fractionation
and the final product.
2.6.4 Source of enzyme
All biological systems are a source of enzymes and there is bound to be considerable
variation in the concentration of the concerned enzyme, its activity, stability,
availability and presence of inhibitory factors. Traditional animal, plant and microbial
sources have given way to genetically-engineered organisms with the introduction of
recombinant DNA technology. Eukaryotic proteins cloned and expressed in bacterial
hosts, such as Escherichia coli and Bacillus subtilis, may be located in different
locations within the cell (cytoplasm, periplasmic space) or may be truly extracellular.
Enzymes accumulating in the periplasm may be released into the fermentation media
by changing the culture conditions (Fakruddin et al., 2013). However, recombination
techniques allow the gene of interest to be equipped with an “affinity tag”, such as His-
tag, which will help in the purification of the enzyme. This tag can later be removed
by using highly-specific proteolytic enzymes (Young et al., 2012).
2.6.5 Isolation of enzymes
Isolating the protein from a solid source is a compromise between quality and quantity.
The best isolation measure should facilitate the release of the enzyme of interest while
leaving behind tough contaminants (nucleic acids, bacteria and viruses). Care should
also be taken whereby the protein extracted is not degraded/denatured during the
process. Homogenization is the most popular method for protein extraction from the
60
cellular environment. Another method used for cell disruption is ultrasonication.
Ultrasonication facilitates the disruption of cells and exposes internal proteins to the
growth medium. Ultrasonication techniques use high-frequency waves to cause
cavitation on the microbial cell wall, thereby destroying it. However, prolonged
exposure to ultrasound can denature the protein released upon cell lysis. Therefore,
sonication cycles should be optimized in a manner where only cell disruption is
achieved while the protein of interest is left intact (Liu et al., 2014). The cell disruption
technique is usually followed by centrifugation or filtration aimed at the clarification
of the extract prior to column chromatography.
Characteristics of the isolation medium are determined by the conditions that are
necessary for the stability of the protein released. The main factors that govern the
preparation of the isolation medium are pH, detergents, reducing agents, chelators or
metal ions, proteolytic inhibitors and bacterial contamination. The pH is usually
chosen to be the value in which the enzyme exhibits maximum activity. However, this
may not always be the case. In the case of trypsin, maximum activity is attained at pH
8–9, while the enzyme is most stable at pH 3 (Pečová et al., 2013). Detergents are used
to relieve the enzyme of bonds to membranes by hydrophobic interactions. Several of
the detergents used for isolation (such as Triton X-100 and Sodium dodecyl sulfate,
SDS) do not denature the globular proteins or affect their catalytic activity. The use of
detergents is usually limited to the isolation medium. Detergents, being amphiphatic
molecules, aggregate to form ‘micelles’ at the critical micelle concentration (CMC).
This can interfere with the purification process during column chromatography.
Therefore, the concentration of detergent used during isolation must be lesser than
CMC (Malinsky et al., 2013).
61
Many enzymes have exposed thiol groups which can oxidize when the protein is
released from the cytosol to the growth medium during isolation. This is prevented by
the addition of reducing agents such as mercaptoethanol, dithiothreitol (DTT), or
ascorbic acid. The concentration of these reducing agents can normally be kept as low
as 10–25 mM, while keeping the internal disulphide bonds intact (Mathieson et al.,
2013). Metal ions, proteases and bacterial contamination are three problems faced
during enzyme isolation. The presence of metal ions leads to the enhanced oxidation
of thiol groups and may form complexes with specific groups, which can cause
problems. Heavy metals can be removed by treatment with chelating agents such as
ethylene diamine tetra-acetic acid (EDTA) and ethylene glycol tetra-acetic acid
(EGTA). EDTA is a buffer whose addition can change the pH of the buffer. Therefore,
care should be taken to adjust the pH post addition of EDTA (Campden et al., 2015).
Proteases that are naturally present in the cell lysate pose a serious threat to the protein
of interest. The simplest way to prevent the proteolytic action is by adding protease
inhibitors. This can be a bit of a problem in large-scale processes, since proteolytic
inhibitors are expensive. Nonetheless, other pragmatic measures to tackle this problem
include the adsorption of proteases onto hydrophobic adsorbents and adjusting the pH
to a value where proteases are rendered ineffective. Researchers have recently
established that the addition of doxycycline indirectly inhibits proteolytic activity of
tryptic peptidases (Kanada et al., 2012). The key to avoiding bacterial growth in
enzyme preparation is following measures to ensure sterility. Some buffers, such as
phosphate and acetate, among others, are more prone to supporting the growth of
bacteria at neutral pH. The addition of antimicrobial agents to buffers whenever
feasible is also a tactic to prevent contamination (Yang et al., 2013).
62
2.7 A review of enzymes produced using agro-industry waste
2.7.1 Enzymes that act on polysaccharides
Alpha amylases (endo-1, 4-α-d-glucanglucanohydrolase EC 3.2.1.1) are a family of
enzymes that randomly cleave α-1, 4 linkages between adjacent glucose subunits in
polysaccharides resulting in the release of short chain oligomers and α-limit dextrin.
Alpha amylases find wide range of applications in bread and brewing industry, textile,
paper and pulp industry and pharmaceuticals. (Sahnoun, Kriaa, Elgharbi, Ayadi, Bejar,
& Kammoun, 2015). Alpha amylases are industrially produced via submerged
fermentation using genetically improved Bacillus and Aspergillus species. A large
spectrum of bacterial and fungal species has found to produce alpha amylase enzyme
with different characteristics such as thermos-stability, halo-tolerance, psycho-
tolerance and alkali-stability (Prakash, Vidyasagar, Madhukumar, Muralikrishna, &
Sreeramulu, 2009; Roohi & Kuddus, 2014; Sen, Dora, Bandyopadhyay, Mohapatra, &
Raut, 2014). Alpha amylase can also be synthesised following solid-state fermentation
method (Sundarram & Murthy, 2014).
In lieu of decreasing the production cost, a lot of research has been dedicated to using
lignocellulose as a viable carbon source for amylase production. Rajagopalan and
Krishnan (2008) were able to achieve a maximum α-amylase enzyme activity of 67.4
U ml-1 by adding sugarcane bagasse hydrolysate to the nutrient medium using
catabolite de-repressed Bacillus subtilis KCC103 as the enzyme producer. Banana
waste was used as substrate for the production of high titres of α-amylase using B.
subtilis CBTK 106 (Krishna & Chandrasekaran, 1996). Meanwhile, Francis, Sabu,
Nampoothiri, Ramachandran, Ghosh, Szakacs, et al. (2003) conducted optimization
studies for the production of α-amylase using spent brewer’s grain as substrate.
Aspergillus oryzea was used as the fermentative microbe in solid state condition.
63
Amyloglucosidases (E.C. 3.1.2.3) are also known as glucoamylases and can cleave
the α-1, 4 linkages found in starch to release glucose molecules. It is an exoamylase;
it cleaves β-D glucose from the non-reducing ends of amylose, amylopectin and
glycogen (James & Lee, 1997). Amyloglucosidase (AMG) also breaks α-1, 6
glycosidic bonds but at a slower rate (Espinosa-Ramírez, Pérez-Carrillo, & Serna-
Saldívar, 2014). Amyloglucosidases exhibits optimum activity at a pH range of 4.5-5
and a temperature range of 40-60 ºC (Kumar & Satyanarayana, 2009). AMG finds
applications in the food, brewery and pasty industry (Diler, Chevallier, Pöhlmann,
Guyon, Guilloux, & Le-Bail, 2015). A. niger and A. oryzea are common strains that
are used by the industry for the production of commercial AMG (Espinosa-Ramírez,
Pérez-Carrillo, & Serna-Saldívar, 2014; H. Singh & Soni, 2001). However, Bacillus
sp., Rhizopus sp. and Saccharomyces sp. have been reported to synthesise AMG (Ali,
Mahmood, Alam, & Hossain, 1989; Shin, Kong, Lee, & Lee, 2000).
Several lignocellulose residues have been used as an alternate carbon source for the
production of AMG. A. Pandey, Selvakumar, and Ashakumary (1994) reported
improved yields in the production of glucoamylase using A. niger on rice bran using
additional nitrogen sources. Using A. niger in solid state fermentation conditions and
wheat bran as substrate 5-6-fold increase in enzyme yield was obtained with
productivity measures of 520–560 IU enzyme per gram dry substrate (Ashok Pandey,
1990). This was achieved by improved nutrient addition and better process parameter
control. Agro-residues such as cassava, yam, banana, plaintain and banana peels have
also been employed as alternate carbon sources for the production of fungal AMG
(Adeniran, Abiose, & Ogunsua, 2010).
Cellulose: The depolymerisation of cellulose in to component glucose molecules
require a combined hydrolysis of three key enzymes: endoglucanase (E.C. 3.2.1.4),
64
exoglucanase or cellobiohydrolase (E.C. 3.2.1.176) (E.C. 3.2.1.91) and β-glucosidase
(E.C. 3.2.1.21). They are categorized in the glycoside hydrolase family and they
catalyse the cleavage of glycosidic bonds (Juturu & Wu, 2014). Cellulases are enzymes
of great commercial importance especially because of the inevitable role they play in
bioethanol production (Singhania, Saini, Saini, Adsul, Mathur, Gupta, et al., 2014).
Besides biofuels, cellulases find application in bread and brewing industry, textile and
detergent industry and, paper and pulp industry (Ferreira, Margeot, Blanquet, &
Berrin, 2014). A wide range of bacterial and fungal species produce cellulase enzyme.
In bacteria, cellulases are found in the form of large, extracellular aggregates which
are called cellulosomes (Doi & Kosugi, 2004). Some of the bacterial species which
produce cellulosomes include Clostridium thermocellum, Bacillus circulans, Proteus
vulgaris, Klebsiella pneumonia, Escherichia coli and Cellulomonas sp. Fungal species
have also been found to synthesise cellulases (Juturu & Wu, 2014). Commercial
cellulases are produced by improved strains of Trichodermareesei. Examples of other
fungal organisms that produce cellulase enzyme are Schizophyllum commune,
Melanocarpussp., Aspergillus sp., Pencillium sp., and Fusarium sp (Várnai, Mäkelä,
Djajadi, Rahikainen, Hatakka, & Viikari, 2014).
Owing to its influence in the economics of bioethanol production cheaper methods to
produce cellulase has been the focus of researchers over the past two decades (Klein‐
Marcuschamer, Oleskowicz‐Popiel, Simmons, & Blanch, 2012). Several studies have
been conducted to test the efficacy of lignocellulosic food waste as a suitable carbon
source for cellulase production. Sun, Li, Zhao, and Peng (2013) evaluated the
feasibility of using banana peel for cellulase production by Trichoderma viride GIM
3.0010 in solid-state fermentation. An optimized media was formulated using mango
peel as carbon source for cellulase production by Trichoderma reesei (Saravanan,
65
Muthuvelayudham, & Viruthagiri, 2012). Trichoderma reesei QM9414 was used as
the enzyme producer in a study involving brewer’s spent grain as the substrate (Sim &
Oh, 1990). In separate studies the effectiveness of apple pomace and corn steep liquor
as carbon source for the production of cellulase was evaluated (Dhillon, Kaur, Brar, &
Verma, 2012; Farid & El-Shahed, 1993).
Xylanases (E. C. 3.2.1.8, 1, 4-β-xylanxylanohydrolase) are enzymes that break down
xylan which is an integral part of plant polysaccharide. Xylan is a complex
polysaccharide made of xylose-residue backbone each subunit linked to each other by
a β-1, 4-glycosidic bond (Ramalingam & Harris, 2010). Xylanases are produced by
several bacterial and fungal species. Filamentous fungi that synthesise this enzyme are
of particular interest because they secrete the enzyme in to the media in large quantities
in comparison to bacteria (Knob, Beitel, Fortkamp, Terrasan, #xe9, Fanchini, et al.,
2013). Xylan, being a complex polysaccharide, requires a consortium of enzymes for
total hydrolysis. Xylanases are an enzyme complex comprising of different enzymes
that are specific to different substrates and cleave chemical bonds of different nature.
This enzyme system consists of endoxylanases, β-xylosidases, ferulic acid esterase, p-
coumaric acid esterase, acetylxylan esterase and α-glucuronidase. Endoxylanases and
β-xylosidases are most extensively studied components of this system (Polizeli,
Rizzatti, Monti, Terenzi, Jorge, & Amorim, 2005). Xylanases have wide applications
in food industry, biomedical industry, animal feed industry, and bioethanol production
(Das, Ravindran, Ahmed, Das, Goyal, Fontes, et al., 2012; Goswami & Pathak, 2013;
Ramalingam & Harris, 2010).
The efficiency of lignocellulosic food waste as carbon source for the production of
commercial xylanase has been studied by many researchers. Lowe, Theodorou, and
Trinci (1987) experimented with wheat straw as a viable carbon source for the
66
production of anaerobic rumen fungus xylanase achieving high levels of xylanase
activity. A. niger and A. terreus strains were employed on moistened wheat bran by
Gawande and Kamat (1999) to attain 74.5 IU ml-1 of xylanase. In another study, grape
pomace was used as the substrate for the production of xylanase using A. awamori as
the enzyme producer (Botella, Diaz, de Ory, Webb, & Blandino, 2007). Apple pomace,
melon peel and hazelnut shell was used by Seyis and Aksoz (2005) for xylanase
production from Trichoderma harzianum 1073 D3 achieving a maximum activity of
26.5 U/mg.
The importance of inulinase arises from the emergence of fructose and
fructooligosaccharides as a safe sweetner compared to sucrose in the food and
pharmaceutical industry. Inulinase acts upon inulin which is a polyfructose chain
terminated by a glucose molecule. The fructose units in inulin is bonded together by
β-2, 1-linkage (Vandamme & Derycke, 1983). Commercially, fructose syrup is
produced by the combined activity of α-amylase and amylosglucosidase followed by
glucose isomerase which converts glucose in to fructose. However, the best yield that
can be procured from such a process is 45% of fructose, 50% of glucose and the rest
being oligosaccharides. The activity of inulinase results in the complete conversion of
the substrate to fructose (Zittan, 1981). Inulinase also finds applications in the
production of bioethanol, citric acid, butanedoil and lactic acid as well.
Inulinases can be classified in to exo-inulinases (β-D-fructanfructohydrolase, EC
3.2.1.80) and endo-inulinases (2, 1-β-D-fructanfructohydrolase, EC 3.2.1.7)
depending upon their modes of activity (Vijayaraghavan, Yamini, Ambika, & Sravya
Sowdamini, 2009). Several bacterial and fungal species such as Streptococcus
salivarius, Actinomyces viscosus, Kluyveromyces fragilis, Chrysosporium pannorum,
Penicillium sp. and Aspergillus niger have been known to synthesise differ forms of
67
inulinase (Chi, Chi, Zhang, Liu, & Yue, 2009). The production of inulinase using
lignocellulsic substrate has been investigated by many researchers. A. K. Gupta, Kaur,
and Singh (1989) reported that when Fusarium oxysporum is grown on the aqueous
extracts of roots of Cichorium intybus it produces extracellular inulinase which can be
useful for the production of fructose. A newly isolated Saccharomyces sp. from
spontaneously fermented sugar cane synthesised inulinase when grown on substrates
such as banana peel, wheat bran, rice bran, orange peel and bagasse (A. Onilude,
Fadaunsi, & Garuba, 2012). Coconut oil cake was used in study which involved the
media optimization for inulinase production by employing Pencillium
rugulosum (MTCC-3487) (Dilipkumar, Rajasimman, & Rajamohan, 2014). Sugar
cane baggase and yacon have also been used as substrates in different studies for
inulinase production (Chesini, Neila, Parra, Rojas, Esquivel, Cavalitto, et al., 2013;
Mazutti, Bender, Treichel, & Luccio, 2006).
Mannanases are a cluster of enzymes that degrade mannan which is an integral part
of the plant cell wall. Mannan is a representative of hemicellulose which is the second
most abundant polysaccharide found in plants. Three major enzymes are involved in
the degradation of linear mannans viz. 1, 4-β-D mannohydrolases or β-mannanases(EC
3.2.1.78), 1,4-β-D mannopyranoside hydrolases or β-mannosidases (EC 3.2.1.25) and
1,4-β-D glucoside glucohydrolases or β-glucosidases (EC 3.2.1.21)(Chauhan, Puri,
Sharma, & Gupta, 2012). β-mannanases show endo-hydrolysis activity by cleaving the
internal glycosidic bonds resulting in the release of short chain t β-1,4-manno-
oligosaccharides (McCleary & Matheson, 1983). On the other hand, β-mannosidases
possess exo-hydrolase activity attacking the polymer at the non-reducing terminal and
degrading mannobiose in to individual mannose units (Gomes, Terler, Kratzer, Kainz,
& Steiner, 2007). β-glucosidase activity results in the excision of 1,4-glucopyranose
68
units from the non-reducing terminal ends of oligomers released from glucomannan
and galactoglucomannan hydrolysis (Mamma, Hatzinikolaou, & Christakopoulos,
2004). Several Bacillus sp. including different B. subtitlis strains have been reported
to produce several mannan degrading enzymes. Among fungal organisms many
Aspergillus sp. have been found to produce mannanase (Dhawan & Kaur, 2007). Other
bacterial and fungal species such as Clostridium sp., Pencillium sp. and Sterptomyces
sp. have also been known to synthesise mannanase (Chauhan, Puri, Sharma, & Gupta,
2012).
Due to its ability to effectively remove hemicellulose mannase has sparked an
increasing interest in the paper and pulp industry (Clarke, Davidson, Rixon, Halstead,
Fransen, Gilbert, et al., 2000). Mannases also find applications in the food, oil, feed
and textile industries (Christgau, Andersen, Kauppinen, Heldt-Hansen, & Dalboege,
1994; Cuperus, Herweijer, Van Ooijen, & Van Schouwen, 2003; Naganagouda,
Salimath, & Mulimani, 2009). Many researchers have studied the production of
mannanase using lignocellulose and agro-food industry waste as a substrate. Yin,
Liang, Li, and Sun (2013) used a mixture of apple pomace and cottonseed powder as
raw material to produce β-mannanase by Aspergillus niger SN-09 in solid state
fermentation. On optimization of process conditions an activity of 561.3 U/g was
attained which was 45.7 % higher than that observed in basal medium. The efficacy of
mixed substrate fermentation for mannanase production was investigated by Olaniyi,
Osunla, and Olaleye using enzyme producers Penicillium italicum and
Trichosporonoides oedocephalis. They experimented with lime, grape, tangerine and
sweet orange peels in different concentrations and reported that mixed substrate
fermentation resulted in appreciable enzyme activity. Fermented palm kernel cake was
used in another study as the substrate for mannanase production by growing
69
Aspergillus terreus SUK-1 in a column reactor (Rashid, Samat, & Yusoff, 2013).
Plantain peels, mango peels, sugar cane pulp, potato peels, soy bean meal, passion fruit
peel, locust bean gum etc. have also been reported to be excellent choices of raw
material for the production of β-mannosidase and β-glucosidases(J. M. Almeida, Lima,
Giloni-Lima, & Knob, 2015; Gomes, Terler, Kratzer, Kainz, & Steiner, 2007; A. A.
Onilude, Fadahunsi, Antia, Garuba, & Ja’afaru).
Lactase, otherwise known as β-d-galactohydrolase (EC 3.2.1.23), hydrolyses lactose
in to glucose and galactose (Duan, Sun, & Wu, 2014; Nakkharat & Haltrich, 2006).
Lactose is the sugar which is found in milk. Humans produce this enzyme only as
infants and this ability lessens as they grow older which leads to lactose intolerance
(Kies, 2014). Hence, lactase is a very important enzyme in the dairy and food industry.
Industrial lactase is produced by employing selected strains of Kluyveromyces lactis
(Bonekamp & Oosterom, 1994). However, several articles can be found that report
other organisms that produce lactase. Candida pseudotropicalis has been reported to
produce lactase when grown on de-proteinized whey (de Bales & Castillo, 1979).
Trichoderma viride ATCC 32098 produces a high thermostable lactase enzyme which
is shows 90% activity in a pH range of 3.0-7.5(Seyis & Aksoz, 2004). Macris (1981)
reported the production of extracellular lactase from Fusarium moniliforme using
wheat bran solid medium. The addition of agriculture by-products such as molasses
and whey increased enzyme yield.
A few studies have been done to increase the economic feasibility of lactase production
by the addition of media components that cheaply available and lignocellulosic in
nature. A Lactobacillus acidophilus strain isolated from was reported to produce
lactase enzyme even when the lactose content in the media was reduced to 0.75%
supplemented with 1% ragi (Akolkar, Sajgure, & Lele, 2005). However, lactose was
70
found to be the best carbon source for lactase enzyme production. A study conducted
by Mustranta, Karvonen, Ojamo, and Linko (1981) employed a mutant strain of A.
niger for lactase production and attained threefold increase in enzyme yield. They
observed that the mutated strain of A.niger produces high levels of lactase enzyme in
a medium supplemented by wheat bran.
Beta Glucanases: 1, 3-1, 4-β-glucans are polysaccharides made up of glucose units
that are found in endosperm cell walls of cereals such as barley, rye, sorghum, oats
etc. (Celestino, Cunha, & Felix, 2006). Endo-1, 3-1, 4-β-glucanases are enzymes that
can hydrolyse the β-1, 4 glycosidic linkages at the non-reducing ends of glucan to
release cellobiosyl-D-glucose and 3-O-β-D-cellotriosyl-D-glucose. This enzyme is
particularly important in the brewing industry. β-glucanases along with a consortium
of xylanase and cellulase facilitate the reduction of viscosity in fluids with higher solid
content. This leads to less water consumption during production process, saves energy
and eliminates the need for several raw materials (Tang, He, Chen, Zhang, & Ali,
2004). β-glucanases also finds application in the wine industry along with pectinases
by facilitating a smooth and fast filtration process along with increasing the quality of
the product (Villettaz, Steiner, & Trogus, 1984).
Several microorganisms have been tried and tested for the production of β-glucanase
using lignocellulosic industry waste as substrate. Rhizomucor miehei CAU432 was
grown under solid state fermentation conditions using oat meal as the sole carbon
source to obtain a β-1,3-1,4-glucanase activity of 20 025 U g–1 dry substrate which
was the highest ever reported (Yang, Xiong, Yang, Yan, & Jiang, 2015). Irshad,
Anwar, and Afroz (2012) reported the characterization of exo 1, 4-β glucanase from
Tricoderma viride MBL by culturing the organism in solid state fermentation using
orange peel waste as substrate. Fusarium oxysporum, Bacillus subtilis, Penicillium
71
echinulatum, Sclerotium rolfsii have also been reported to produce high levels of endo
and exoglucanase when grown on biomass sources (Christakopoulos, Kekos, Kolisis,
& Macris, 1995; Sachslehner, Nidetzky, Kulbe, & Haltrich, 1998; Tang, He, Chen,
Zhang, & Ali, 2004; Zampieri, Guerra, Camassola, & Dillon, 2013).
Invertase, technically known as β-fructofuranosidase (EC.3.2.1.26) is a glycoprotein
which catalyses the hydrolysis of sucrose in to glucose (dextrose) and fructose.
Invertase exhibits optimum activity at a pH of 4.5 and temperature of 55 ºC.
Saccharomyces cerevisiae is the chief strain used in the production of invertase
enzyme in the industry (Neumann & Lampen, 1967). Invertase is used for the
production of invert sugar which was earlier done by acid hydrolysis. Acid hydrolysis
of sucrose results in the 50% conversion of sucrose in to invert sugar. Moreover, acid
hydrolysis product also contains impurities whose formation cannot be controlled
during inversion. The use of invertase results in 100% inversion of sucrose without the
formation of impurities (Kulshrestha, Tyagi, Sindhi, & Yadavilli, 2013). Since
invertase is a commercially expensive enzyme, many researchers have attempted to
use cheap carbon sources for its production. Rashad and Nooman (2009) used red
carrot jam processing residue as a medium for solid state fermentation to characterise
invertase synthesised by S. cerevisiae NRRL Y-12632. Hang and Woodams (1995)
tested the efficacy of apple pomace as potential carbon source for the production of
invertase from Aspergillus foetidus NRRL 337. Orange peel, pineapple peel waste,
pomegranate peel, wheat bran, baggase waste etc. have all been tested and found to be
excellent carbon source substitutes for invertase production employing different
microbial species (Alegre, Polizeli, Terenzi, Jorge, & Guimarães, 2009; C Uma,
Gomathi, Muthulakshmi, & Gopalakrishnan, 2010; C. Uma, Gomathi, Ravikumar,
72
Kalaiselvi, & Palaniswamy, 2012; Veana, Martínez-Hernández, Aguilar, Rodríguez-
Herrera, & Michelena, 2014).
Pectinases are a class of enzymes that catalyse the disintegration of pectin containing
compounds. Pectin compounds are an integral part of the plant cell wall. Pectinases
can be classified in to two groups according to their mode of action. Pectin esterases
catalyses the de-esterification of methyl groups found in pectin to produce pectic acid.
Depolymerase enzymes cleaves the glycosidic bonds found in pectic acid to release
various simpler compounds based on their mode of enzyme action. Protopectinases
solubilizes protopectin in to highly polymerised form of soluble pectin (Sakai,
Sakamoto, Hallaert, & Vandamme, 1993). Pectinases are used in the fruit juice
industry and wine making for clarification and removal of turbidity in the finished
product. It also intensifies the colour in the fruit extract while aiding in stabilization,
clarification, and filtration (Servili, Begliomini, Montedoro, Petruccioli, & Federici,
1992).
A lot of agro residue varieties have been tried and tested for the production of
pectinases using different microbial species. Apple pomace and grape pomace have
extensively used in studies to determine their efficacy as suitable substrates for
pectinase production (Botella, Diaz, de Ory, Webb, & Blandino, 2007; Hours, Voget,
& Ertola, 1988). S. A. Singh, Ramakrishna, and Appu Rao (1999) successfully
optimised parameters for the downstream processing parameters for pectinase
produced using fermented bran. A novel approach was devised by Raj Kashyap,
Kumar Soni, and Tewari (2003) where they supplemented the fermentation media with
neurobion (a multi-vitamin) and polygalacturonic acid while producing pectinase
using wheat bran as the carbon source. Maximum enzyme activity was reported to be
8050 U/g dry substrate. A mixture of orange bagasse and wheat bran in the ratio (1:1)
73
employed as media for pectinase production using filamentous fungus Penicillium
viridicatum RFC3 yielded highest enzyme activities of 0.7 and 8.33 U ml−1 for endo-
and exo-polygalacturonase and 100 U ml−1 for pectin liase on performing the
fermentation process in polypropylene packs (Silva, Tokuioshi, da Silva Martins, Da
Silva, & Gomes, 2005). Seedless sunflower heads and barley spent grain are
lignocellulosic food processing wastes among others that have been studied as
potential media additives for pectinase production (C. Almeida, Brányik, Moradas-
Ferreira, & Teixeira, 2003; Patil & Dayanand, 2006).
Pectinases have also been produced using a mixture of wastes. Biz, Finkler, Pitol,
Medina, Krieger, and Mitchell (2016) developed an ingenious method to produce
pectinases employing citrus peel and sugar cane bagasse in solid state fermentation
mode while avoiding overheating problems. A pilot-scale packed bed reactor was used
for this purpose. A uniform pectinase activity of 34-41 U/ml was obtained though out
the bed. Combination of different biomass ensured temperature control while avoiding
problems such a bed shrinkage, agglomerate formation etc. since sugar cane bagasse
was highly porous in nature. Aspergillus oryzea was used as the fermentative microbe.
74
Chapter 3
Materials & Methods
This section of the thesis gives a comprehensive account of the scientific procedures
and materials utilized for accomplishing the experimental work.
3. Materials and methods
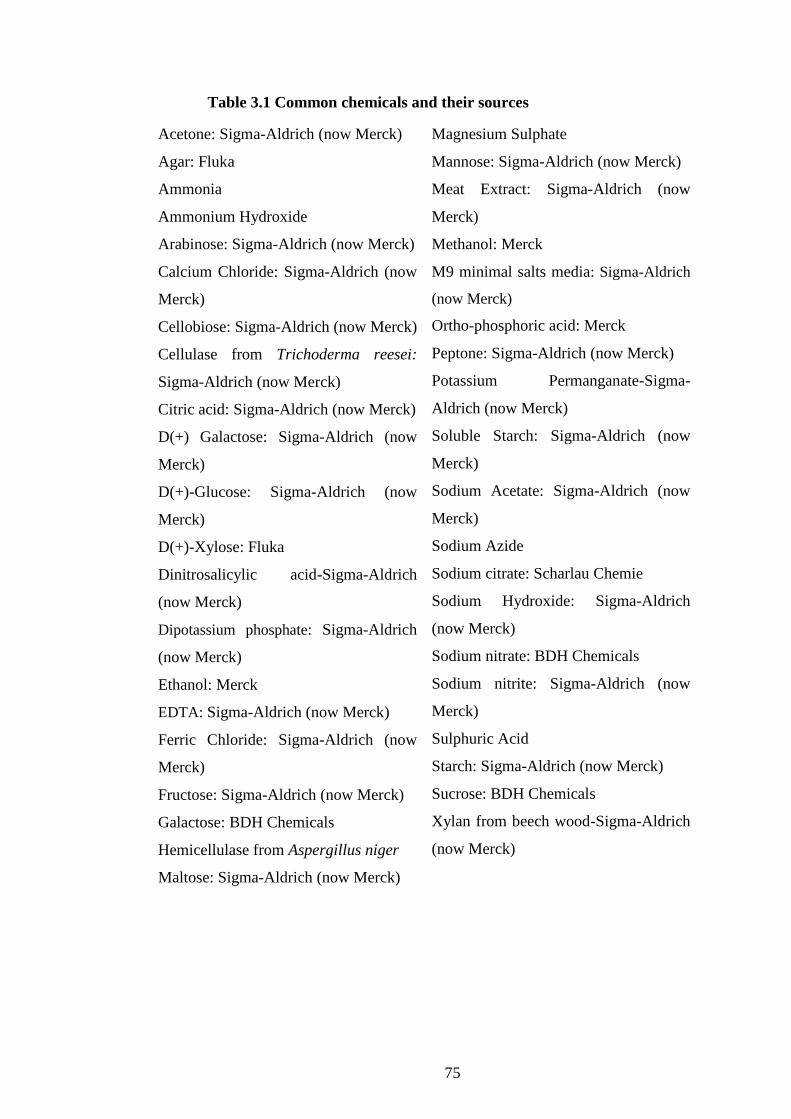
75
Table 3.1 Common chemicals and their sources
▪ Acetone: Sigma-Aldrich (now Merck)
▪ Agar: Fluka
▪ Ammonia
▪ Ammonium Hydroxide
▪ Arabinose: Sigma-Aldrich (now Merck)
▪ Calcium Chloride: Sigma-Aldrich (now
Merck)
▪ Cellobiose: Sigma-Aldrich (now Merck)
▪ Cellulase from Trichoderma reesei:
Sigma-Aldrich (now Merck)
▪ Citric acid: Sigma-Aldrich (now Merck)
▪ D(+) Galactose: Sigma-Aldrich (now
Merck)
▪ D(+)-Glucose: Sigma-Aldrich (now
Merck)
▪ D(+)-Xylose: Fluka
▪ Dinitrosalicylic acid-Sigma-Aldrich
(now Merck)
▪ Dipotassium phosphate: Sigma-Aldrich
(now Merck)
▪ Ethanol: Merck
▪ EDTA: Sigma-Aldrich (now Merck)
▪ Ferric Chloride: Sigma-Aldrich (now
Merck)
▪ Fructose: Sigma-Aldrich (now Merck)
▪ Galactose: BDH Chemicals
▪ Hemicellulase from Aspergillus niger
▪ Maltose: Sigma-Aldrich (now Merck)
▪ Magnesium Sulphate
▪ Mannose: Sigma-Aldrich (now Merck)
▪ Meat Extract: Sigma-Aldrich (now
Merck)
Methanol: Merck
▪ M9 minimal salts media: Sigma-Aldrich
(now Merck)
▪ Ortho-phosphoric acid: Merck
▪ Peptone: Sigma-Aldrich (now Merck)
▪ Potassium Permanganate-Sigma-
Aldrich (now Merck)
▪ Soluble Starch: Sigma-Aldrich (now
Merck)
▪ Sodium Acetate: Sigma-Aldrich (now
Merck)
▪ Sodium Azide
▪ Sodium citrate: Scharlau Chemie
▪ Sodium Hydroxide: Sigma-Aldrich
(now Merck)
▪ Sodium nitrate: BDH Chemicals
▪ Sodium nitrite: Sigma-Aldrich (now
Merck)
▪ Sulphuric Acid
▪ Starch: Sigma-Aldrich (now Merck)
▪ Sucrose: BDH Chemicals
▪ Xylan from beech wood-Sigma-Aldrich
(now Merck)
76
3.1 Instruments
▪ Alliance HPLC (Waters, e2695 Separations module): Waters, Milford, MA.
▪ Guard column (50×7.8mm): Phenomenex, UK.
▪ Microwave oven: Sharp, Model R 244; Sharp electronics, UK.
▪ Millipore filter: Millipore, Bedford, MA.
▪ Rezex ROA-Organic Acid H+(8%) (350×7.8mm): Phenomenex, UK (particle size
8 µm).
▪ Shaking incubator: Innova 42, Mason Technology, Ireland.
▪ Ultrasonicator (ULTRAsonik™ 57X, Ney Dental Inc., USA).
▪ Perkin Elmer Spectrum GX FTIR (UATR) Microscope (USA)
▪ Siemens’s BN D-500 X-ray diffractometer
▪ Shimadzu DSC-60 installed with TA-60WS software
▪ Field Emission Scanning Electron Microscopy (Hitachi SU-70)
3.2 Software
▪ Empower: Empower Software Solutions, Inc., Orlando, FL.
▪ Minitab® 16
▪ STATGRAPHICS Centurion XV: StatPoint Technologies, Inc., Warrenton, VA.
3.3 Analytical Techniques
3.3.1 Compositional analysis
Compositional analysis of the pretreated and native lignocellulose samples were
performed by two stage acid hydrolysis according to National Renewable Energy
Laboratory (NREL) protocol (Sluiter et al., 2005). The samples were subjected to acid
hydrolysis using 72% H2SO4 at 30°C for 60 min. The mixture was then diluted to 4%
H2SO4 concentration by adding deionised water and autoclaved for 60 min. The solids
were filtered using a filtration crucible and dried at 105°C for 48h to remove all the
77
moisture content or until constant weight was achieved. The dried solids were then
burned in blast furnace for 24h at 595°C to obtain acid insoluble lignin. The acid
soluble lignin content in the liquid was determined using UV-VIS spectrophotometry
at 205 nm.
3.3.2 Reducing sugar analysis
The reducing sugar concentration in the hydrolysate was estimated by dinitrosalicylic
acid (DNS) method (Miller, 1959). Briefly, each hydrolysate (1 ml) was diluted 1:10
in dH2O before addition of dinitrosalicylic acid reagent (1 ml) and dH2O (2 ml). The
mixture was submerged in a water bath for 5 min at 100 °C. The volume was made up
to 10 ml by the addition of dH2O (6 ml). Absorbance was measured at 540 nm.
3.3.3 Individual sugar and inhibitor analysis
The presence and quantification of monosaccharides was done on an Alliance High
Performance Liquid Chromatography (HPLC) (Waters, e2695 Separation module,
Waters, Milford, MA, USA) equipped with an auto-sampler and controller with dual
pump was used (Jaiswal et al., 2012). The detection system consisted of a Waters 486
UV detector and a Waters 410 Differential Refractometer (RI detector) connected in
series. The detector was maintained at room temperature. Empower® software was
used for data acquisition and analysis. An aliquot (20 µL) was injected into a
thermostatically controlled compartment set to 65 °C, followed by elution through a
Rezex ROA-Organic acid H+ (8%) (350 mm × 7.8 mm, Phenomenex, Macclesfield,
UK, particle size: 8 µm) column fitted with a guard column (50 mm × 7.8 mm,
Phenomenex, Macclesfield, UK), at a flow rate of 0.6 ml·min−1. The mobile phase was
H2SO4 (5 mM). The run time for each sample injection was set at 30 min. All solutions
were filtered through a 0.22 µm Millipore® filter (Millipore, Merck-Millipore,
Billerica, MA, USA) before being injected into the instrument.
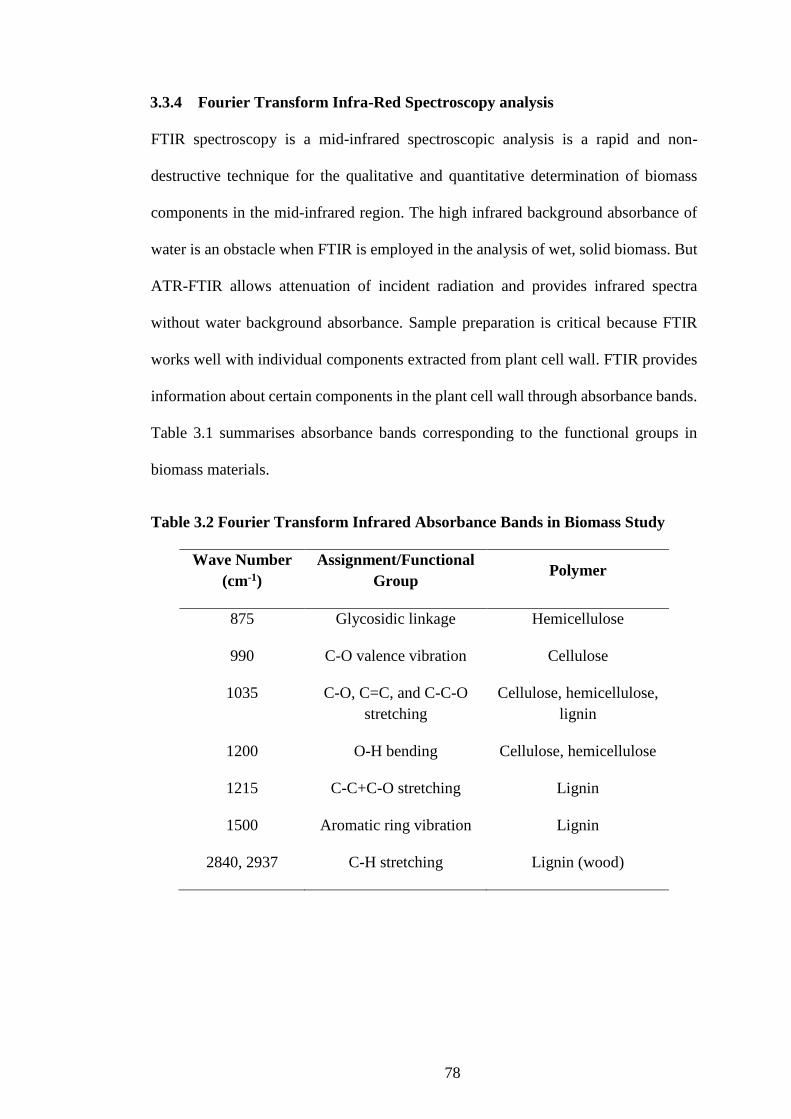
78
3.3.4 Fourier Transform Infra-Red Spectroscopy analysis
FTIR spectroscopy is a mid-infrared spectroscopic analysis is a rapid and non-
destructive technique for the qualitative and quantitative determination of biomass
components in the mid-infrared region. The high infrared background absorbance of
water is an obstacle when FTIR is employed in the analysis of wet, solid biomass. But
ATR-FTIR allows attenuation of incident radiation and provides infrared spectra
without water background absorbance. Sample preparation is critical because FTIR
works well with individual components extracted from plant cell wall. FTIR provides
information about certain components in the plant cell wall through absorbance bands.
Table 3.1 summarises absorbance bands corresponding to the functional groups in
biomass materials.
Table 3.2 Fourier Transform Infrared Absorbance Bands in Biomass Study
Wave Number
(cm-1)
Assignment/Functional
Group Polymer
875 Glycosidic linkage Hemicellulose
990 C-O valence vibration Cellulose
1035 C-O, C=C, and C-C-O
stretching
Cellulose, hemicellulose,
lignin
1200 O-H bending Cellulose, hemicellulose
1215 C-C+C-O stretching Lignin
1500 Aromatic ring vibration Lignin
2840, 2937 C-H stretching Lignin (wood)
79
FTIR spectroscopy studies were performed to observe any changes in the composition
as a reflection of the variations in the functional groups in pretreated BSG at the
backdrop of its raw counterpart. A Perkin Elmer Spectrum GX FTIR (UATR)
Microscope (USA) (located in School of Food Science and Environmental Health,
DIT) was employed for this study. The FTIR spectra was recorded from 3000 to 800
cm-1 with 32 scans at a resolution of 0.3 cm-1 in transmission mode (Raghavi et al.,
2016).
3.3.5 X-ray diffraction
X-ray diffraction analysis of lignocellulosic biomass is conducted to analyse the
crystallinity of the material. Atoms in a crystal are arranged in such as fashion that
when X-ray beam hits the atom, the rays that are diffracted in all directions will be in
phase. X-ray diffraction studies were conducted to analyse the changes in crystallinity
of spent coffee waste and brewer’s spent grain imparted by each pretreatment. This
was done using a Siemens’s BN D-500 X-ray diffractometer (located in FOCAS, DIT)
with diffraction angles spanned from 2θ=5°-50°. The radiation was generated at a
voltage of 40 kV and current of 30 mA using Cu Kα as the radiation source (λ=0.154
nm) (Binod et al., 2012).
3.3.6 Thermal Behavior analysis
Differential scanning calorimetry is a technique used to study the behaviour of
polymers when they are heated. It provides an idea about the thermal transitions of the
polymer such as glass transition, crystallisation and melting of crystalline materials
(Figure 3.1). Tg (glass transient temperature) is the temperature at which amorphous
component of the lignocellulose is converted from a brittle form into a rubbery,
flexible form. Parameters such as specific heat, coefficient of thermal expansion, the
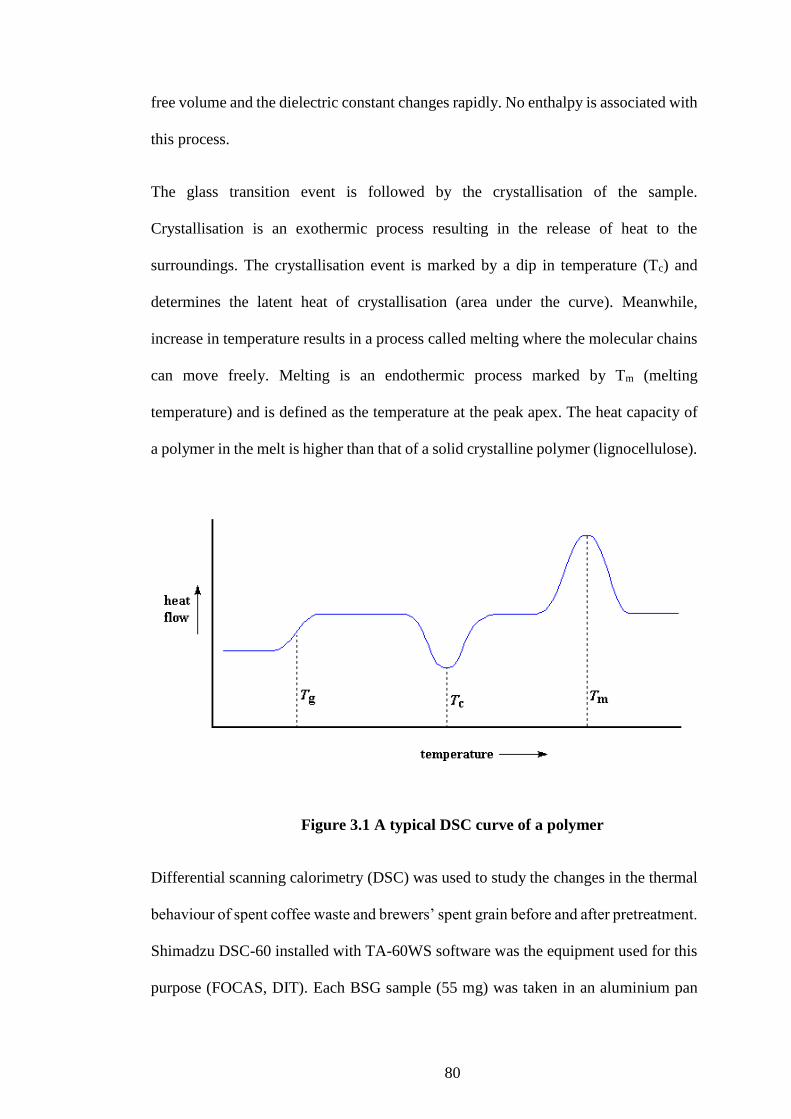
80
free volume and the dielectric constant changes rapidly. No enthalpy is associated with
this process.
The glass transition event is followed by the crystallisation of the sample.
Crystallisation is an exothermic process resulting in the release of heat to the
surroundings. The crystallisation event is marked by a dip in temperature (Tc) and
determines the latent heat of crystallisation (area under the curve). Meanwhile,
increase in temperature results in a process called melting where the molecular chains
can move freely. Melting is an endothermic process marked by Tm (melting
temperature) and is defined as the temperature at the peak apex. The heat capacity of
a polymer in the melt is higher than that of a solid crystalline polymer (lignocellulose).
Figure 3.1 A typical DSC curve of a polymer
Differential scanning calorimetry (DSC) was used to study the changes in the thermal
behaviour of spent coffee waste and brewers’ spent grain before and after pretreatment.
Shimadzu DSC-60 installed with TA-60WS software was the equipment used for this
purpose (FOCAS, DIT). Each BSG sample (55 mg) was taken in an aluminium pan
81
with an empty pan used as a reference. All the measurements were carried out between
25°C and 500°C with a linear increase of 10°C/minute (Ferraz et al., 2013).
3.3.7 Scanning Electron Microscopy
FESEM is used to visualise very small topographical details on the surface of entire or
fractioned objects. It may be used to study synthetic and naturally occurring polymeric
structures. FESEM makes use of an electron beam instead of a light source and the
reflected electrons is used re-construct the image of an object. Electrons are emitted
from a field emission source in a high electron field gradient. These (primary) electrons
are focussed on the object using electronic lenses in a high vacuum column. After
bombarding the object, the (secondary) electrons are scattered in different directions
and angles based on the surface morphology.
A detector catches these electrons and generates a corresponding electronic signal
which is amplified and transformed into an image or video. The morphological
structure of spent coffee waste and the effect of pretreatment on the same were
analysed by performing field emission scanning electron microscopy (FESEM,
Hitachi SU-70) in FOCAS, DIT. (Raghavi et al., 2016). Dried samples of the untreated
and pretreated SCW were subject to FESEM, operating at the electron beam energy of
0.5 keV.
3.4 Optimisation of enzymatic hydrolysis of SCW
The enzymatic hydrolysis of SCW was performed by employing commercially
available cellulase and hemicellulase purchased from Sigma-Aldrich (now Merck)
Aldrich, Ireland. Response Surface Methodology (RSM) was applied to statistically
optimise the reaction conditions for enzymatic hydrolysis of SCW to evaluate the main
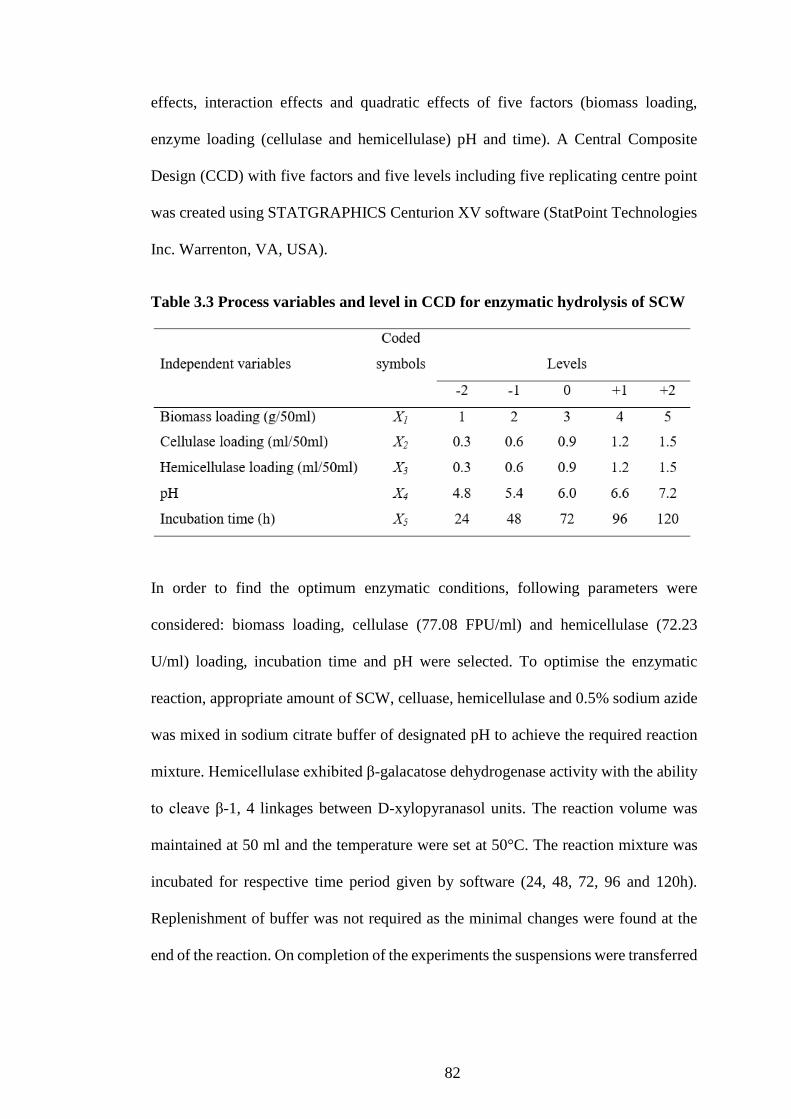
82
effects, interaction effects and quadratic effects of five factors (biomass loading,
enzyme loading (cellulase and hemicellulase) pH and time). A Central Composite
Design (CCD) with five factors and five levels including five replicating centre point
was created using STATGRAPHICS Centurion XV software (StatPoint Technologies
Inc. Warrenton, VA, USA).
Table 3.3 Process variables and level in CCD for enzymatic hydrolysis of SCW
In order to find the optimum enzymatic conditions, following parameters were
considered: biomass loading, cellulase (77.08 FPU/ml) and hemicellulase (72.23
U/ml) loading, incubation time and pH were selected. To optimise the enzymatic
reaction, appropriate amount of SCW, celluase, hemicellulase and 0.5% sodium azide
was mixed in sodium citrate buffer of designated pH to achieve the required reaction
mixture. Hemicellulase exhibited β-galacatose dehydrogenase activity with the ability
to cleave β-1, 4 linkages between D-xylopyranasol units. The reaction volume was
maintained at 50 ml and the temperature were set at 50°C. The reaction mixture was
incubated for respective time period given by software (24, 48, 72, 96 and 120h).
Replenishment of buffer was not required as the minimal changes were found at the
end of the reaction. On completion of the experiments the suspensions were transferred
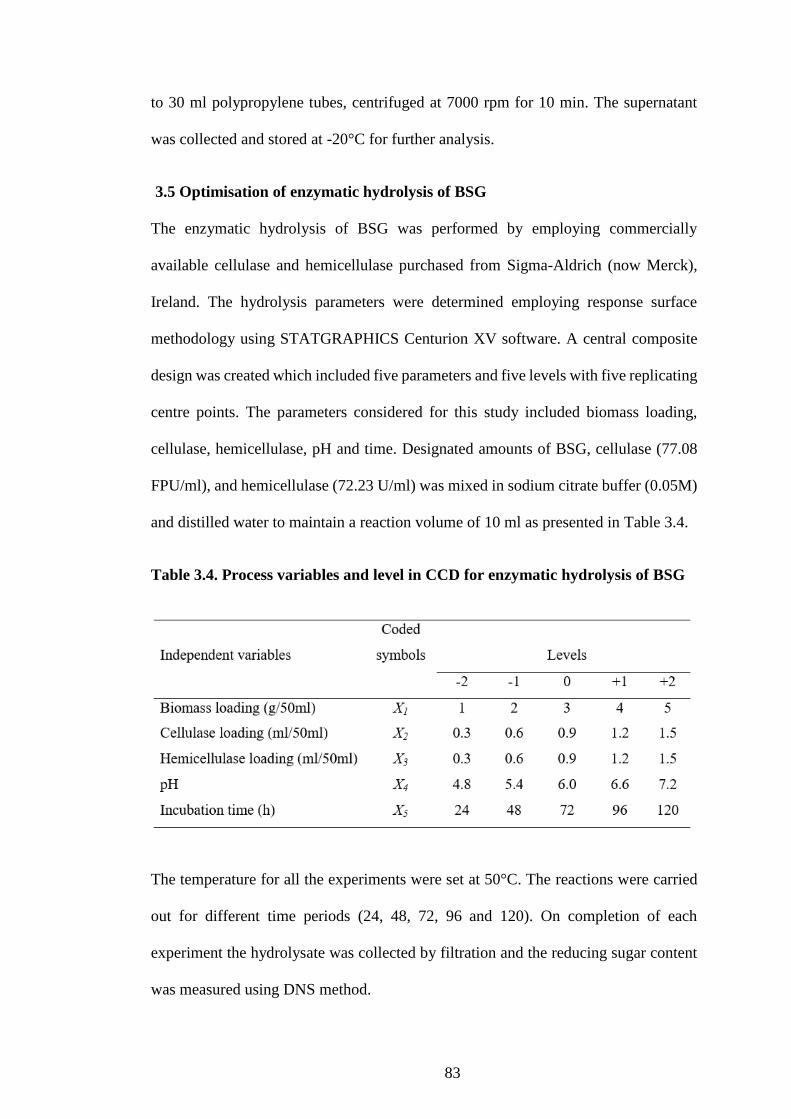
83
to 30 ml polypropylene tubes, centrifuged at 7000 rpm for 10 min. The supernatant
was collected and stored at -20°C for further analysis.
3.5 Optimisation of enzymatic hydrolysis of BSG
The enzymatic hydrolysis of BSG was performed by employing commercially
available cellulase and hemicellulase purchased from Sigma-Aldrich (now Merck),
Ireland. The hydrolysis parameters were determined employing response surface
methodology using STATGRAPHICS Centurion XV software. A central composite
design was created which included five parameters and five levels with five replicating
centre points. The parameters considered for this study included biomass loading,
cellulase, hemicellulase, pH and time. Designated amounts of BSG, cellulase (77.08
FPU/ml), and hemicellulase (72.23 U/ml) was mixed in sodium citrate buffer (0.05M)
and distilled water to maintain a reaction volume of 10 ml as presented in Table 3.4.
Table 3.4. Process variables and level in CCD for enzymatic hydrolysis of BSG
The temperature for all the experiments were set at 50°C. The reactions were carried
out for different time periods (24, 48, 72, 96 and 120). On completion of each
experiment the hydrolysate was collected by filtration and the reducing sugar content
was measured using DNS method.
84
3.6 Statistical Analysis
All the experiments were carried out in triplicate and replicated twice unless stated.
Significant differences were computed by employing analysis of variance (ANOVA)
and multiple comparisons (Fischer’s least significant difference test) by employing
STATGRAPHICS Centurion XV software (StatPoint Technologies Inc. Warrenton,
VA, USA). Value of p < 0.05 was considered as significant value.
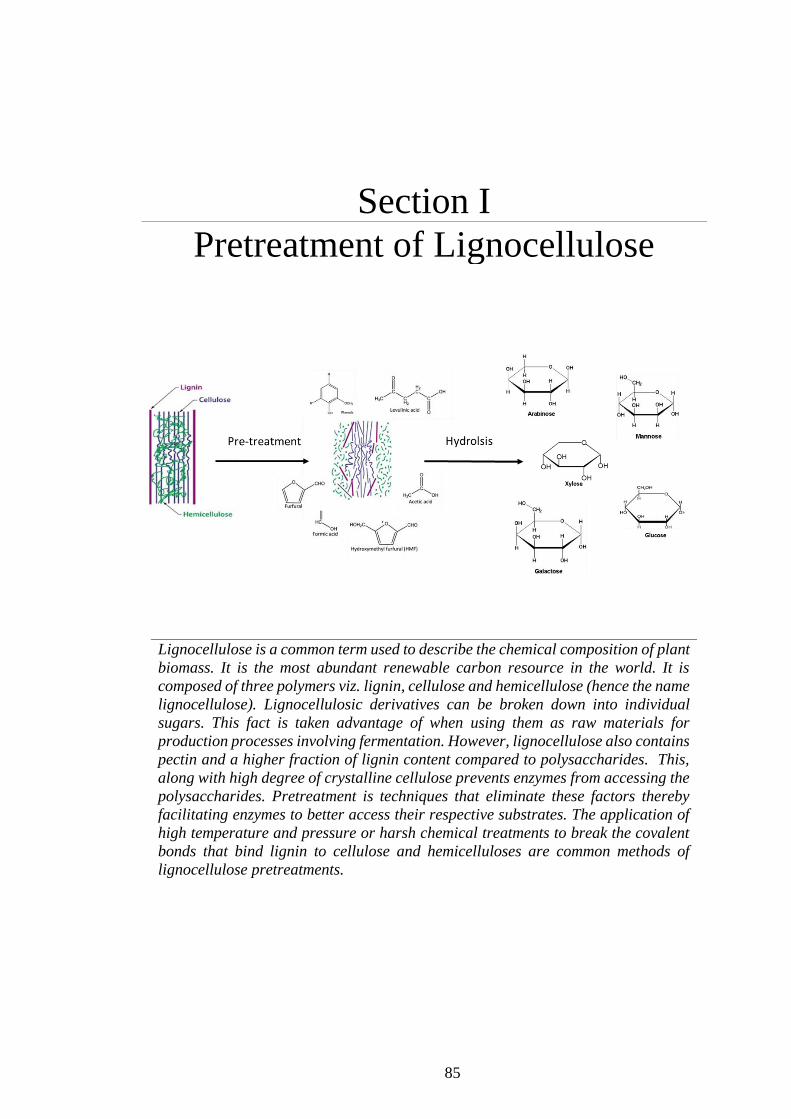
85
Section I
Pretreatment of Lignocellulose
Lignocellulose is a common term used to describe the chemical composition of plant
biomass. It is the most abundant renewable carbon resource in the world. It is
composed of three polymers viz. lignin, cellulose and hemicellulose (hence the name
lignocellulose). Lignocellulosic derivatives can be broken down into individual
sugars. This fact is taken advantage of when using them as raw materials for
production processes involving fermentation. However, lignocellulose also contains
pectin and a higher fraction of lignin content compared to polysaccharides. This,
along with high degree of crystalline cellulose prevents enzymes from accessing the
polysaccharides. Pretreatment is techniques that eliminate these factors thereby
facilitating enzymes to better access their respective substrates. The application of
high temperature and pressure or harsh chemical treatments to break the covalent
bonds that bind lignin to cellulose and hemicelluloses are common methods of
lignocellulose pretreatments.
86
Chapter 4
Development of Novel Pretreatment for the
Enhanced Enzymatic Hydrolysis of Coffee
Spent Waste
In this chapter, a range of pretreatments namely, physical, chemical and physico-
chemical followed by a sequential, combinatorial pretreatment strategy was applied
to spent coffee waste (SCW) to attain maximum sugar yield. All the pretreated samples
were analysed for total reducing sugar, individual sugars and generation of inhibitory
compounds such as furfural and hydroxymethyl furfural (HMF) which can hinder
microbial growth and enzyme activity. Native SCW was high in hemicellulose content.
Galactose was found to be the predominant sugar in SCW. Results showed that
sequential pretreatment yielded 350.12mg of reducing sugar/g of substrate, which was
1.7-fold higher than native SCW (203.4 mg/g of substrate). Organosov pretreatment
of SCW gave rise to the furfural formation in the liquor (12.42 mg/g). Furthermore,
extensive delignification was achieved using sequential pretreatment strategy. XRD,
FTIR, and DSC profiles of the pretreated substrates were studied to analyse the
various changes incurred as opposed to native SCW.
Work described in this chapter has been published as peer review article:
Two-step sequential pretreatment for the enhanced enzymatic hydrolysis of coffee spent waste
(2017). Bioresource Technology, 239, 276-284.
4. Development of novel pretreatment for enhanced enzymatic
hydrolysis of spent coffee waste
87
4.1 Introduction
Coffee is one of the most popular hot beverages and is the second most traded
commodity in the world after petroleum. Global coffee production has increased by
17% from 2002 to 2014 due to its increased consumption. This gives rise to huge
amounts of coffee processing residues leading to serious waste management issues
(Campos-Vega et al., 2015). Spent coffee waste (SCW) is generated as a result of
production of instant coffee from roasted coffee beans. In 2008/09 the EU introduced
‘The New Waste Framework Directive’ as a new approach to curb food waste such as
SCW and as well as new processes for reuse and recycling (Ravindran & Jaiswal,
2016b). Additionally, the EU adopted a four directives in 2018 to solidify Europe’s
leading position in solid waste management. According to the Directive (EU)
2018/850, member states are to reduce waste disposal by landfilling. Additionally, the
member states are to adopt waste management systems that are sustainable and value
waste as a resource. This is on the backdrop of the Circular Economy Package adopted
by the EU. SCW is rich in a variety of organic compounds such as carbohydrates,
lignin, fatty acids and antioxidant compounds which makes it an excellent candidate
for the production of value-added substances. It is also rich in phenolic compounds,
caffeine, trigonelline, and Maillard reaction products. Furthermore, chlorogenic acid
and gallic acid constitute bulk of polyophenols in SCW (Ballesteros et al., 2014).
Commercially viable goods such as bioethanol, biodiesel, sugars, activated carbon,
compost and sorbent material for metal ion removal fall into the spectrum of value-
added products that can be derived from SCW (Go et al., 2016; Kwon et al., 2013;
Utomo & Hunter, 2006).
SCW, being lignocellulosic in nature, is mainly rich in polysaccharides, lignin, lipids
and a small fraction of proteins. The polysaccharides in SCW are composed of
88
cellulose and hemicellulose and comprise almost all of its dry weight. Cellulose is a
polymer made of repeating units of glucose, while hemicellulose is heterogeneous in
nature and composed of galactose, mannose and arabinose structurally arranged as
arabinogalactan and galactomannan (Ballesteros et al., 2015). Although high in
carbohydrate content, the extraction of monomeric sugars from SCW is a tedious task.
Its ability to withstand high temperatures during roasting and extraction is indicative
of its recalcitrant nature. Recalcitrance in SCW is imparted by the orderly structure of
the component material along with the presence of lignin, a phenolic polymer.
Pretreatments are essential strategies that can disrupt the structure of lignocellulose for
the efficient utilisation of the inherent polysaccharides (Ravindran & Jaiswal, 2016a).
Pretreatment methods are intended to increase the efficiency of lignocellulose
hydrolysis by improving accessibility towards polysaccharide fractions. These
strategies can be classified into physical, chemical, biological and combinatorial based
on their modes of action. An efficient pretreatment strategy is generally simple to
perform and releases highly fermentable products with the minimal formation of
indigestible compounds. The polysaccharide fraction is least affected so that no
inhibitory compounds are formed during the process. Furthermore, the energy and cost
requirements should not be so high to render the whole process economically futile.
Several studies pertaining to the pretreatment of SCW for the production of value-
added products have been described in literature. Rocha et al. (2014) employed ultra-
sonication as a pretreatment measure to produce bioethanol and biodiesel from SCW.
Dilute acid hydrolysis was used as the pretreatment strategy in a study involving the
extraction of sugars and lipids from SCW (Go et al., 2016). Pretreated SCW has also
been used for enzyme production. Murthy and Naidu (2012) used acid and alkali
pretreated SCW was used a solid substrate medium for the production of xylanase
89
employing Pencillium sp. However, few studies are available that investigate the
effects of pretreatment methods on the various aspects of SCW.
This study proposes a two-step pretreatment strategy to increase, reducing sugar
recovery after subjecting SCW to enzymatic hydrolysis. Initially, eight different
pretreatments were performed for SCW and the changes in its chemical composition,
structural conformation, crystallinity and thermal behaviour was analysed and
compared. All the pretreated SCW samples were then subjected to enzymatic
hydrolysis (using celluclast and hemicellulase from A. niger) using optimised
parameters. Furthermore, the incidence of inhibitory compounds after each
pretreatment were also investigated. Finally, two of the most effective pretreatments
determined in this investigation were combined and performed sequentially to increase
the sugar recovery from the enzymatic hydrolysis of SCW.
4.2 Methodology
Spent coffee waste was generously supplied by a local Starbucks outlet in Dublin city.
The SCW was dried at 80°C for 48h and stored at room temperature in a cool and dry
place for further experiments (Kwon et al., 2013). All the chemicals such as cellulase
from Trichoderma reesei, hemicellulase from Aspergillus niger, conc. H2SO4, alkaline
potassium permanganate, ethanol, ferric chloride, conc. H3PO4, acetone and other
chemicals required for experimentation were purchased from Sigma-Aldrich (now
Merck), Ireland. Cellulase activity was assayed by following laboratory analytical
procedures for the measurement of cellulase activity devised by National Renewable
Energy Laboratory (Adney & Baker, 1996). Meanwhile hemicellulase activity was
assayed followed protocols described by Rickard and Laughlin (1980). Cellulase
90
enzyme registered an enzyme activity of 77 FPU/ml while hemicellulase showed 72
U/ml enzyme activity.
4.2.1 Screening of various pretreatments for spent coffee waste
4.2.1.1 Dilute acid hydrolysis
Hydrolysis experiments were performed in an autoclave. SCW (1% w/v) was mixed
with 10 ml of different concentrations of sulphuric acid (1%, 1.3% and 1.6%) in a 100
ml flask. The reaction mixture was subjected to different temperatures (10, 20 and 30
min) (Zheng et al., 2013). After pretreatment the solids were separated from liquids by
centrifugation at 8000 rpm for 12 min and the supernatant was analysed for total and
individual sugars and by-products such as acetic acid, furfural and hydroxymethyl
furfural. The solids were dried and stored in cool and dry place until further analysis.
4.2.1.2 Steam explosion
The steam explosion pretreatment of SCW was performed as described by Huang et
al. (2015) with certain modifications. Five grams of SCW were sprayed with de-
ionized water to attain 50% moisture content (w/v) and then stored at room
temperature. The samples were then loaded into a stainless-steel autoclave (TOMY,
SS-325, USA). The temperature was raised and maintained at 121°C for 30 min after
which the pressure was released by opening the pressure valve subjecting the biomass
to an ‘explosion’. The steam exploded SCW was collected, dried and stored in sealed
plastic bags for further analysis.
4.2.1.3 Ammonia Fiber explosion
The SCW (2.5 g) was soaked in 25 ml of NH4OH and subjected to high pressure and
temperature in an autoclave. The experiment was carried out at varying temperatures
91
(70–120 °C), water loadings (0.2–2.0 ml water/g dry biomass), and residence time (1–
30 min). The treated biomass was removed from the autoclave and air-dried overnight
(≈ 12 h) in a fume hood to remove residual ammonia. The treated samples were stored
in sealed plastic bags in a cool and dry place (Shao et al., 2013).
4.2.1.4 Concentrated phosphoric acid pretreatment
Pretreatment of SCW was performed as described by Li et al. (2009). Five grams of
SCW were mixed well with 50 ml of concentrated phosphoric acid (85%) in a 100 ml
glass beaker. The mixture was incubated at 50 ºC and 120 rpm for 1 h. After the
reaction, the slurry was poured into 120 ml of pre-cold acetone and centrifuged at 8000
rpm. The supernatant was collected for analysis of inhibitory compounds. The solids
were mixed with distilled water and centrifuged iteratively as a means of washing off
the residual acid. After four repeated washing steps during the last washing step, the
pH was adjusted to 6.0 with 10 M NaOH. The solids were dried and stored for further
use.
4.2.1.5 Pretreatment using atmospheric air plasma
Five grams of spent coffee waste were placed in polyethylene terephthalate (PET) trays
(0.15m × 0.15m × 0.035m) which were sealed in polymeric films of thickness 50 μm
thickness with very low gas transmission rates (oxygen transmission rate of 9.49 × 10-
9 mol m-2 s-1 at 23 °C and 101325 Pa, Cryovac BB3050, Sealed Air, Ireland). These
packages were placed in the inter electrode space of the dielectric barrier discharge set
up. The SCW samples were subjected to non-thermal plasma in triplicates for 2 min,
4 min and 6 min at three discreet voltages of 60 kV, 70 kV and 80 kV and subsequently
stored for 24 h at 10°C. The plasma reactor was installed in ventilated room and the
92
controlled was placed a minimum distance of 10m as safety measures. The pretreated
SCW was then stored in a cool and dry place until further analysis.
4.2.1.6 Pretreatment using Ferric Chloride
Pretreatment of SCW using ferric chloride was performed according to the procedure
described by Chen et al. (2015). SCW (1% w/v) was mixed in 50 ml of 0.1M FeCl3 in
an Erlenmeyer flask and the subjected to high pressure (15 psi) and temperature (120
°C) for 30 min in an autoclave. The mixture was immediately allowed to cool down
and the solids were separated from the liquid. The solids were then washed several
times with deionized water to remove any residual FeCl3. The Fe (III) in the liquor was
precipitated by gradually the neutralising the solution using 0.1M NaOH. Once the
precipitate was removed the salt free liquor was subjected to HPLC analysis to identify
and quantify individual sugars and hydroxyl-5-methyl furfural and furfural content.
4.2.1.7 Organosolv Pretreatment
Organosolv pretreatment was performed as described by Ostovareh et al. (2015) with
minor modifications. The SCW (1% dry) was mixed in 25 ml of ethanol-water mixture
(50-70% ethanol (v/v) in an Erlenmeyer flask. In all experiments, 1% of sulphuric acid
(w/w) per gram substrate was added as a catalyst. The reaction temperature was set at
120 °C for 30 min. After the reaction the flasks were then placed in an ice chamber to
cool the contents quickly to room temperature. The contents were filtered and washed
with 250 ml of 50% ethanol mixture to extract the soluble products into the liquid
phase. The pretreated substrate was separated from the liquid phase by filtration and
was washed several times with distilled water until pH 7 was obtained. Ethanol was
evaporated from the liquid fraction and recovered by condensation. To obtain a
precipitated solid, the solid fraction, mainly contained lignin, was separated by
93
centrifugation. The pretreated SCW was dried and stored for enzymatic hydrolysis and
further analysis.
4.2.1.8 Microwave assisted alkali pretreatment
Microwave-alkali pretreatment was carried out following the procedure described by
Binod et al. (2012) with minor modifications. The biomass (10% (w/v)) were loaded
to 1% NaOH (w/v) solution in a stoppered flask and subjected to microwave radiation
at varying power settings of 850 W, 600 W, 300 W, and 180 W for different residence
time varying from 30 to 120 s. After pretreatment, the biomass was thoroughly washed
with distilled water till pH 6.0 and air dried. The dried solid residue was used for
enzymatic hydrolysis and compositional analysis.
4.2.1.9 Sequential pretreatment of spent coffee waste
Based on the observations obtained from the extensive pretreatment study conducted
using SCW, a two-step sequential pretreatment technique was devised to achieve
enhanced lignin removal, coupled by increasing yield of reducing sugars and recovery
of polysaccharide content. As a consequence, concentrated phosphoric acid acetone
pretreatment was improvised to include the effects of AFEX pretreatment (Fig. 4.1).
SCW was mixed with concentrated phosphoric acid in the ratio of 1:10 and incubated
at 50 ºC for 1 h in a shaker incubator at 120 rpm. The mixture was then mixed with ice
cold acetone, which resulted in a slurry. The slurry was then centrifuged at 8000 rpm
for 10 min to remove the solids from the liquid. The solids were washed several times
to remove any reminiscent acid and acetone and then dried overnight at 80 ºC. The
dried SCW was weighed and 2.5g of the sample was mixed with 25 ml of ammonia.
The mixture was then exposed to high temperature (120 ºC) and pressure (15 lbs/sq.
inch) in an autoclave for 30 min. The sequentially pretreated SCW was then kept in a
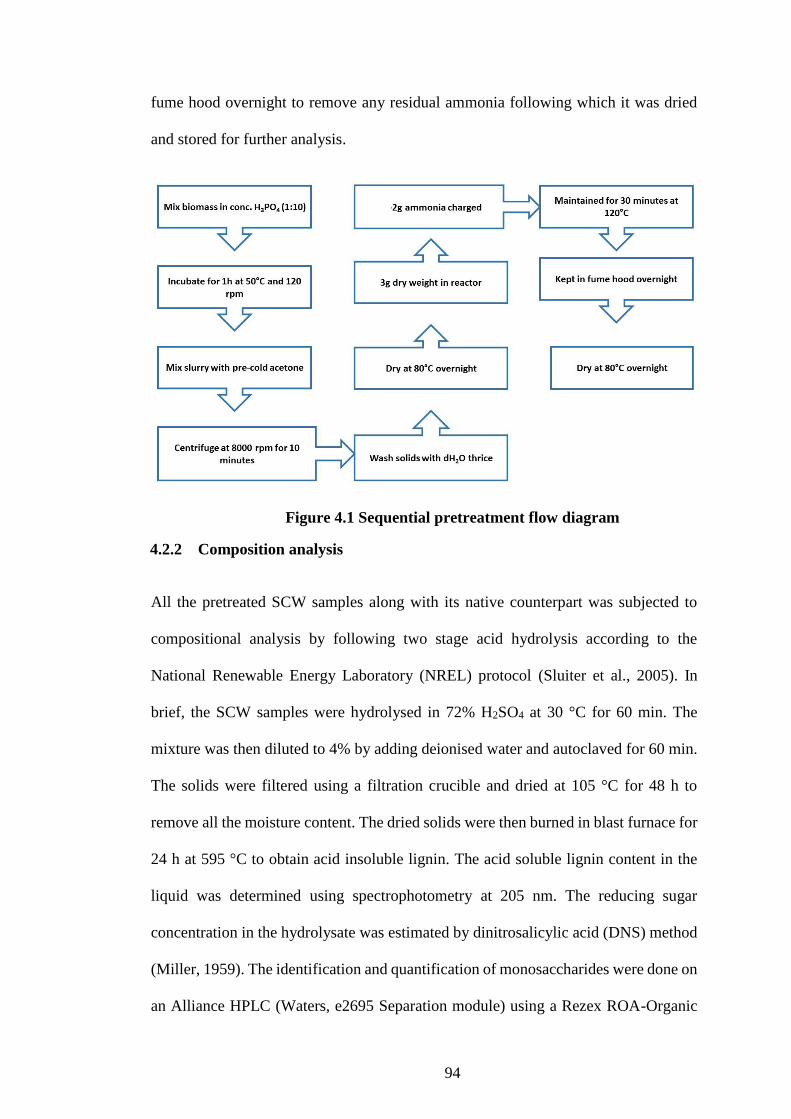
94
fume hood overnight to remove any residual ammonia following which it was dried
and stored for further analysis.
Figure 4.1 Sequential pretreatment flow diagram
4.2.2 Composition analysis
All the pretreated SCW samples along with its native counterpart was subjected to
compositional analysis by following two stage acid hydrolysis according to the
National Renewable Energy Laboratory (NREL) protocol (Sluiter et al., 2005). In
brief, the SCW samples were hydrolysed in 72% H2SO4 at 30 °C for 60 min. The
mixture was then diluted to 4% by adding deionised water and autoclaved for 60 min.
The solids were filtered using a filtration crucible and dried at 105 °C for 48 h to
remove all the moisture content. The dried solids were then burned in blast furnace for
24 h at 595 °C to obtain acid insoluble lignin. The acid soluble lignin content in the
liquid was determined using spectrophotometry at 205 nm. The reducing sugar
concentration in the hydrolysate was estimated by dinitrosalicylic acid (DNS) method
(Miller, 1959). The identification and quantification of monosaccharides were done on
an Alliance HPLC (Waters, e2695 Separation module) using a Rezex ROA-Organic
95
Acid H+ (8%) column, (350 x 7.8 mm; Phenomenex, UK) with 5 mM H2SO4 as the
mobile phase at 65 °C maintaining a flow rate of 0.6 ml/min (Jaiswal et al., 2012).
4.2.3 Enzymatic hydrolysis
The enzymatic hydrolysis (celluclast and hemicellulose from A. niger) of SCW was
performed according to the procedure mentioned in section 3.3.2.
4.2.4 Individual sugar, inhibition and organic acid analysis
The identification and quantification of monosaccharides and organic acids was done
on following the protocol described in section 3.3.3.
4.3 Characterisation of native and pretreated substrates
4.3.1 Scanning electron microscopy
Scanning electron microscopy was performed in accordance to protocol described in
section 3.3.7
4.3.2 X-ray diffraction
The changes in crystallinity of the pretreated and untreated substrates were studied
following methodology detailed in section 3.3.5.
4.3.3 Fourier Transform Infrared Spectroscopy analysis
The changes in functional groups inflicted by pretreating the biomass was assessed
using FTIR spectroscopy according to section 3.3.4.
96
4.3.4 Thermal Behavior
The thermal behaviour of the treated and raw samples was studied and compared using
differential scanning calorimetry (DSC) by following methodology described in
section 3.3.6
4.4 Results and discussion
4.4.1 Composition analysis of native spent coffee waste
The chemical composition of original SCW was determined and have been
summarised in Table 4.2. SCW was abundant in four types of sugars viz. glucose,
mannose, arabinose and galactose. Xylose was minimal in SCW. The presence of these
sugars in high amounts indicated that the SCW is rich in galactomannan,
arabinogalactan and cellulose structures. These findings are in consensus with other
studies on the chemical composition of the SCW (Mussatto et al., 2011, Pujol et al.,
2013). The chemical compositional analysis of the native substrate revealed that SCW
is abundant in hemicellulose content (33.5g/100g) as compared to cellulose
(8.6g/100g). Lignin amounted to 19.6g/100g of SCW. Of this, only 3.7g was
contributed by acid soluble lignin. Variations in SCW compositions can be a result of
the coffee bean raw material, the conditions that prevailed during roasting among other
factors (Jooste et al., 2013).
4.4.2 Optimisation of enzymatic hydrolysis parameters using response surface
methodology
The aim of the optimization study was to find the optimum parameters that would
maximise reducing sugar yields. Total reducing sugar after enzymatic saccharification
of pretreated biomass obtained from 30 experiments are listed in Table 4.1. The models
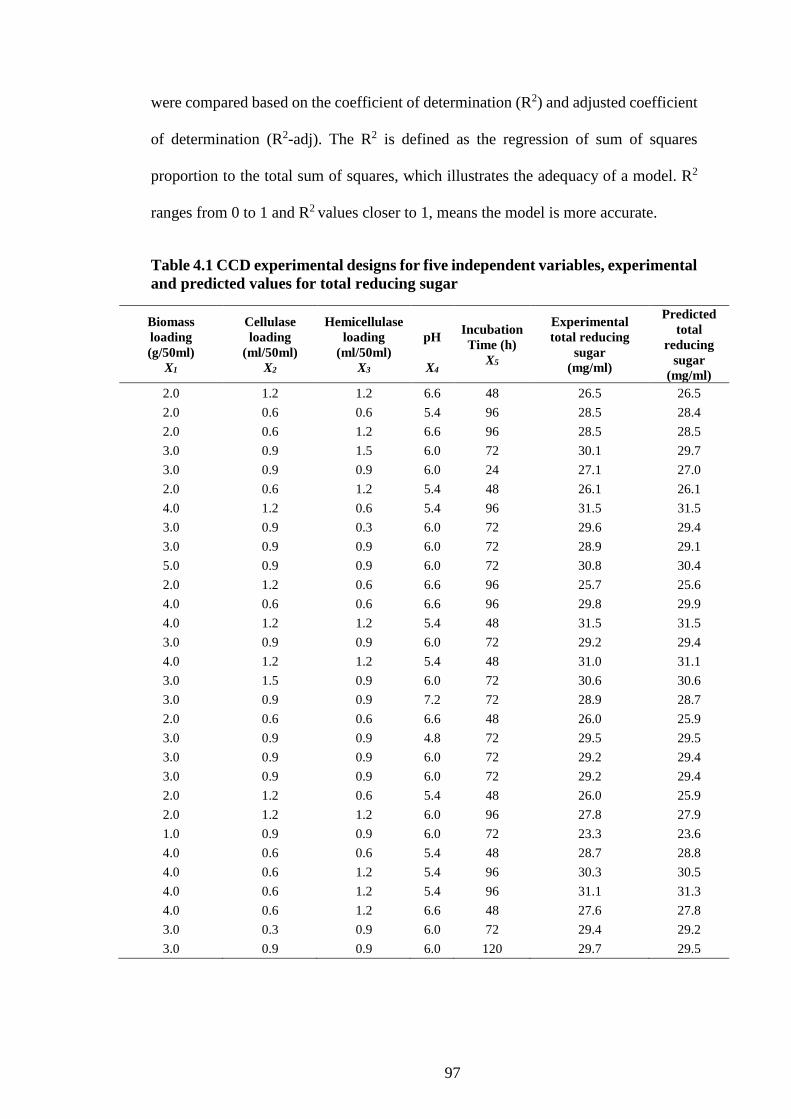
97
were compared based on the coefficient of determination (R2) and adjusted coefficient
of determination (R2-adj). The R2 is defined as the regression of sum of squares
proportion to the total sum of squares, which illustrates the adequacy of a model. R2
ranges from 0 to 1 and R2 values closer to 1, means the model is more accurate.
Table 4.1 CCD experimental designs for five independent variables, experimental
and predicted values for total reducing sugar
Biomass
loading
(g/50ml)
X1
Cellulase
loading
(ml/50ml)
X2
Hemicellulase
loading
(ml/50ml)
X3
pH
X4
Incubation
Time (h)
X5
Experimental
total reducing
sugar
(mg/ml)
Predicted
total
reducing
sugar
(mg/ml)
2.0 1.2 1.2 6.6 48 26.5 26.5
2.0 0.6 0.6 5.4 96 28.5 28.4
2.0 0.6 1.2 6.6 96 28.5 28.5
3.0 0.9 1.5 6.0 72 30.1 29.7
3.0 0.9 0.9 6.0 24 27.1 27.0
2.0 0.6 1.2 5.4 48 26.1 26.1
4.0 1.2 0.6 5.4 96 31.5 31.5
3.0 0.9 0.3 6.0 72 29.6 29.4
3.0 0.9 0.9 6.0 72 28.9 29.1
5.0 0.9 0.9 6.0 72 30.8 30.4
2.0 1.2 0.6 6.6 96 25.7 25.6
4.0 0.6 0.6 6.6 96 29.8 29.9
4.0 1.2 1.2 5.4 48 31.5 31.5
3.0 0.9 0.9 6.0 72 29.2 29.4
4.0 1.2 1.2 5.4 48 31.0 31.1
3.0 1.5 0.9 6.0 72 30.6 30.6
3.0 0.9 0.9 7.2 72 28.9 28.7
2.0 0.6 0.6 6.6 48 26.0 25.9
3.0 0.9 0.9 4.8 72 29.5 29.5
3.0 0.9 0.9 6.0 72 29.2 29.4
3.0 0.9 0.9 6.0 72 29.2 29.4
2.0 1.2 0.6 5.4 48 26.0 25.9
2.0 1.2 1.2 6.0 96 27.8 27.9
1.0 0.9 0.9 6.0 72 23.3 23.6
4.0 0.6 0.6 5.4 48 28.7 28.8
4.0 0.6 1.2 5.4 96 30.3 30.5
4.0 0.6 1.2 5.4 96 31.1 31.3
4.0 0.6 1.2 6.6 48 27.6 27.8
3.0 0.3 0.9 6.0 72 29.4 29.2
3.0 0.9 0.9 6.0 120 29.7 29.5
98
A value of 99.26% R2 was observed in the present study while R2-adj was 97.62%
illustrates the model adequately fits the data. The data obtained from the central
composite design were fitted to second order polynomial equations. The polynomial
equation for the model is given below:
Reducing sugar (mg/ml) = 8.0815 + 4.0795Χ1 - 6.346Χ2 - 1.318Χ3 + 0.218Χ4 + 2.478Χ5
- 0.592Χ12 + 2.425Χ1Χ2 - 0.870Χ1Χ3 - 0.00515Χ1Χ4 +
0.0270Χ1Χ5 + 1.505Χ22 + 1.722Χ2Χ3 - 0.0659Χ2Χ4 + 0.111Χ2Χ5
+ 0.130Χ32 + 0.0289Χ3Χ4 + 0.0902Χ3Χ5 - 0.00047Χ4
2 -
0.0125Χ4Χ5 - 0.179Χ52
where X1, X2, X3, X4 and X5 represents biomass loading, cellulase loading,
hemicellulase loading, pH and incubation time, respectively. The significance of the
coefficients of the models was determined by analysis of variance (ANOVA).
ANOVA table showed that 13 effects have P-values less than 0.05, indicating that they
are significantly different from zero at the 95.0% confidence level, indicating the
considerable effect of these coefficients on reducing sugar yield. All the linear
coefficients were found positive significant effect (p < 0.05) on the maximum reducing
sugar yield from pretreated SCW. However, only biomass, cellulase loading,
hemicellulase loading and time showed positive significant interaction effect (p <
0.05) on the maximum reducing sugar yield. Among quadratic coefficients only
cellulase loading had positive effect on the maximising reducing sugar yield.
Three-dimensional response surfaces generated further gave insights on the interaction
between the five factors tested (Figure 4.2). The contour plots revealed that there was
significant interaction between each parameter taken in this study albeit in varying
degrees. The highest interactions were recorded between SCW and time (Figure 4.2b)
and, SCW and hemicellulase (Figure 4.2d). The highly significant interactions
99
between SCW and hemicellulase can be attributed to the high hemicellulose content
in the biomass. As is evident from the graphs cellulase and hemicellulase enzymes has
least interaction with each other (Figure 4.2a). The highest point on the three-
dimensional plot determines the optimal value for each parameter to attain maximum
reducing sugar yield. A maximum reducing yield was observed with high biomass
loading (5g/50 ml), cellulase (1.5 ml/50ml), hemicellulase (0.37 ml/50ml), pH (6.7)
and a short incubation time (24 h). Furthermore, the model predicted the maximum
sugar yield to be 35.64 mg/ml of reaction volume. For the validation of the model a
confirmation experiment was conducted using the optimised parameters.
Experimentally obtained values of total reducing sugar amounted to 35.15 ± 0.2
mg/ml, which suggested that there was little disparity (< 5%) between predicted and
observed values, and the model was adequate to predict the optimum parameters for
saccharification of SCW. Since the time period for completion of the reaction was 24
h scale-up of this model is a feasible option (Sánchez, 2009).
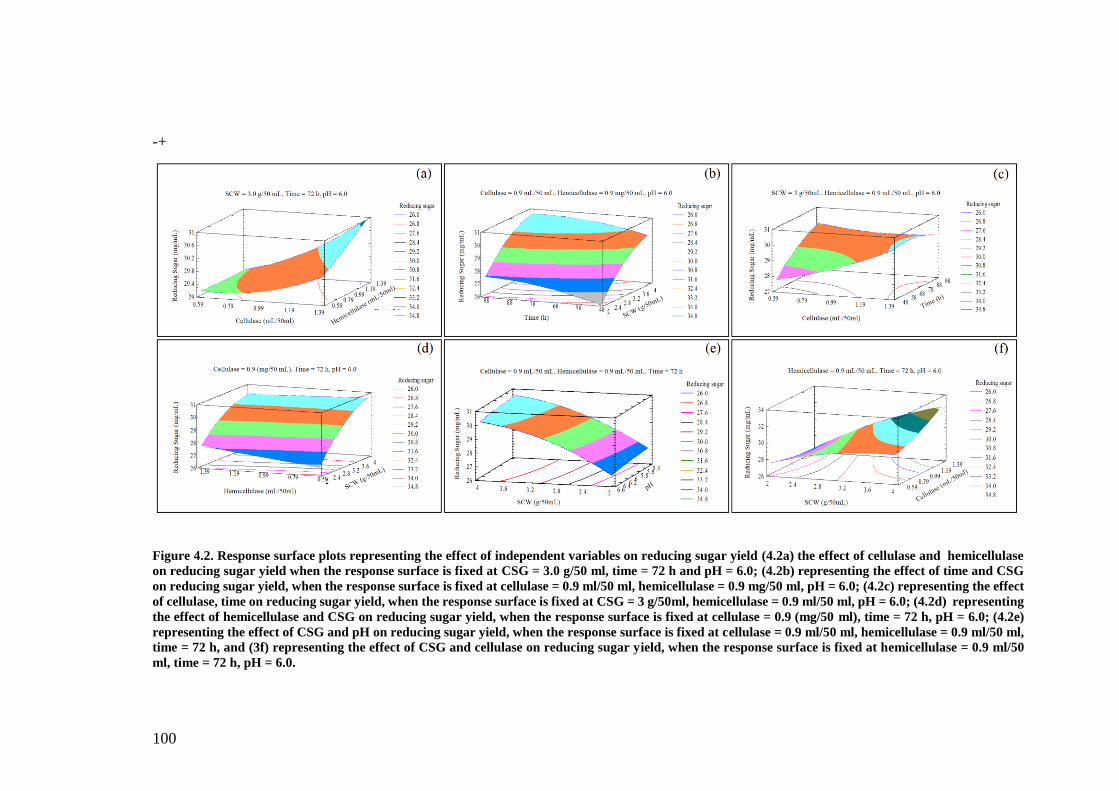
100
-+
Figure 4.2. Response surface plots representing the effect of independent variables on reducing sugar yield (4.2a) the effect of cellulase and hemicellulase
on reducing sugar yield when the response surface is fixed at CSG = 3.0 g/50 ml, time = 72 h and pH = 6.0; (4.2b) representing the effect of time and CSG
on reducing sugar yield, when the response surface is fixed at cellulase = 0.9 ml/50 ml, hemicellulase = 0.9 mg/50 ml, pH = 6.0; (4.2c) representing the effect
of cellulase, time on reducing sugar yield, when the response surface is fixed at CSG = 3 g/50ml, hemicellulase = 0.9 ml/50 ml, pH = 6.0; (4.2d) representing
the effect of hemicellulase and CSG on reducing sugar yield, when the response surface is fixed at cellulase = 0.9 (mg/50 ml), time = 72 h, pH = 6.0; (4.2e)
representing the effect of CSG and pH on reducing sugar yield, when the response surface is fixed at cellulase = 0.9 ml/50 ml, hemicellulase = 0.9 ml/50 ml,
time = 72 h, and (3f) representing the effect of CSG and cellulase on reducing sugar yield, when the response surface is fixed at hemicellulase = 0.9 ml/50
ml, time = 72 h, pH = 6.0.
101
4.4.3 Influence of pretreatments on composition of SCW and reducing sugar
yield
Eight pretreatments were tested at various conditions to study the effect of each
strategy on the composition of SCW. The final chemical composition of the biomass
post pretreatment is an important factor that governs the efficiency of enzymatic
hydrolysis. For a lignocellulosic substrate to be effectively used in a bioconversion
process it is necessary to relatively expose cellulose fibres along with possible removal
of hemicellulose and lignin fractions. SCW was subjected to chemical composition
analysis at each stage of pretreatment. The data obtained from the analysis have been
summarised in Table 4.2.
Different experimental settings were tested for dilute acid hydrolysis (acid
concentration 1%, 1.3% and 1.6%; time 10, 20 and 30 mins). High reducing sugar
release was recorded for SCW pretreated with acid for 20 min at high temperature
regardless of the concentration of the acid (Figure 4.3). This may be explained by the
adverse impact of longer treatment times on the polysaccharide fraction of
lignocellulosic biomass. Based on the reducing sugar yield employing an acid
concentration of 1.6% for 20 min was found to be the best dilute acid hydrolysis
strategy for SCW (263.68 mg/g of SCW). Compositional analysis of the biomass
revealed that subjecting SCW to dilute acid hydrolysis resulted in the increase in
cellulose content as well as removal of considerable fractions of hemicellulose. This
was evident in the reduction in the galactan, mannan and arabinan content. However,
it is worth noting that acid soluble lignin was also removed from the biomass as a result
of dilute acid hydrolysis, which is characteristic to this pretreatment.
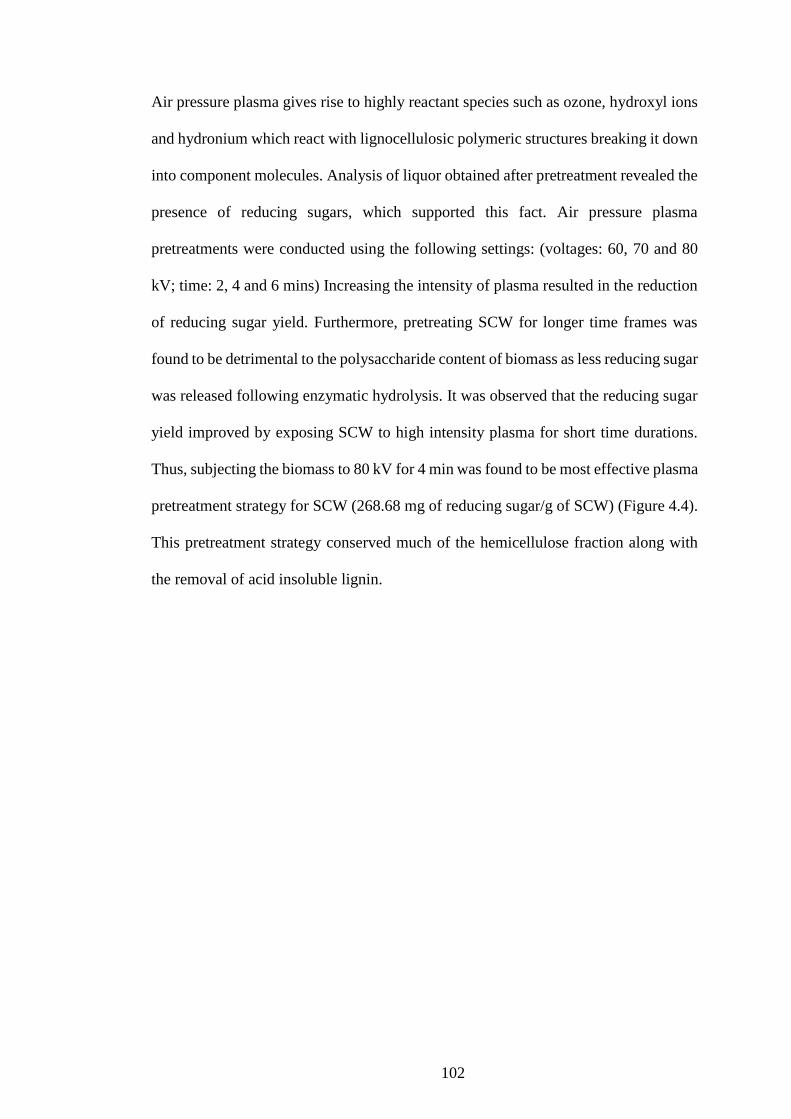
102
Air pressure plasma gives rise to highly reactant species such as ozone, hydroxyl ions
and hydronium which react with lignocellulosic polymeric structures breaking it down
into component molecules. Analysis of liquor obtained after pretreatment revealed the
presence of reducing sugars, which supported this fact. Air pressure plasma
pretreatments were conducted using the following settings: (voltages: 60, 70 and 80
kV; time: 2, 4 and 6 mins) Increasing the intensity of plasma resulted in the reduction
of reducing sugar yield. Furthermore, pretreating SCW for longer time frames was
found to be detrimental to the polysaccharide content of biomass as less reducing sugar
was released following enzymatic hydrolysis. It was observed that the reducing sugar
yield improved by exposing SCW to high intensity plasma for short time durations.
Thus, subjecting the biomass to 80 kV for 4 min was found to be most effective plasma
pretreatment strategy for SCW (268.68 mg of reducing sugar/g of SCW) (Figure 4.4).
This pretreatment strategy conserved much of the hemicellulose fraction along with
the removal of acid insoluble lignin.
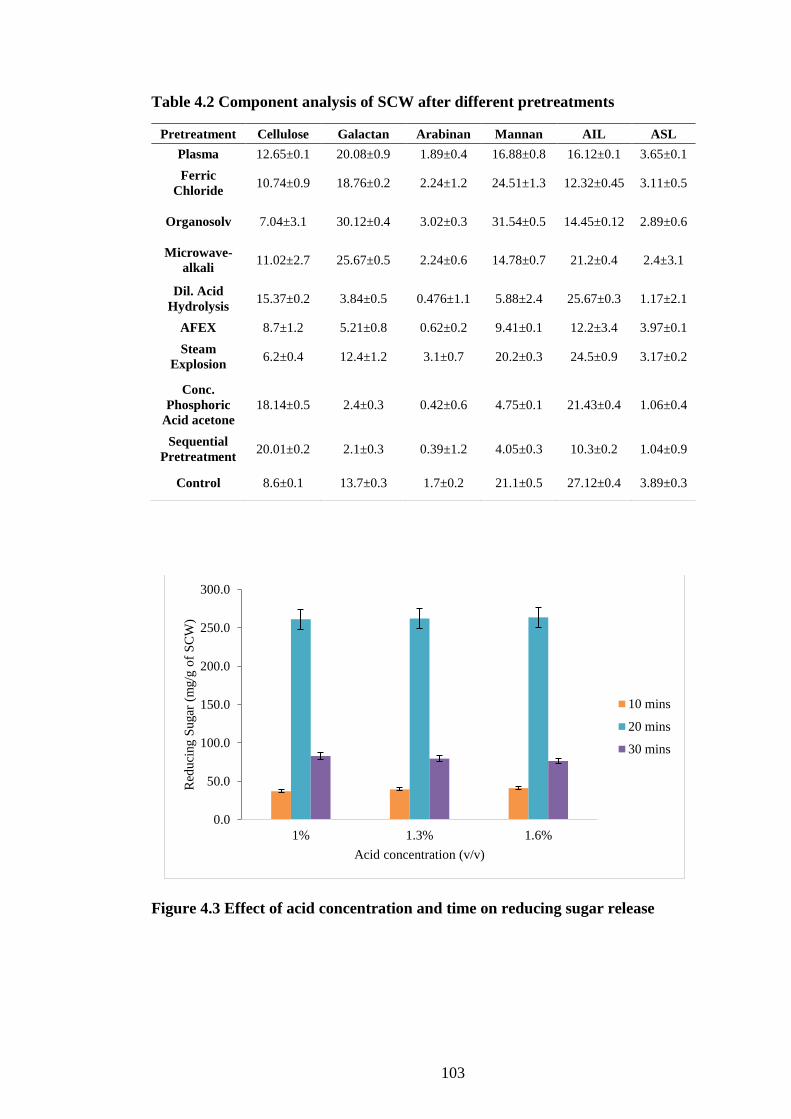
103
Table 4.2 Component analysis of SCW after different pretreatments
Figure 4.3 Effect of acid concentration and time on reducing sugar release
0.0
50.0
100.0
150.0
200.0
250.0
300.0
1% 1.3% 1.6%
Red
uci
ng S
ugar
(m
g/g
of
SC
W)
Acid concentration (v/v)
10 mins
20 mins
30 mins
Pretreatment Cellulose Galactan Arabinan Mannan AIL ASL
Plasma 12.65±0.1 20.08±0.9 1.89±0.4 16.88±0.8 16.12±0.1 3.65±0.1
Ferric
Chloride 10.74±0.9 18.76±0.2 2.24±1.2 24.51±1.3 12.32±0.45 3.11±0.5
Organosolv 7.04±3.1 30.12±0.4 3.02±0.3 31.54±0.5 14.45±0.12 2.89±0.6
Microwave-
alkali 11.02±2.7 25.67±0.5 2.24±0.6 14.78±0.7 21.2±0.4 2.4±3.1
Dil. Acid
Hydrolysis 15.37±0.2 3.84±0.5 0.476±1.1 5.88±2.4 25.67±0.3 1.17±2.1
AFEX 8.7±1.2 5.21±0.8 0.62±0.2 9.41±0.1 12.2±3.4 3.97±0.1
Steam
Explosion 6.2±0.4 12.4±1.2 3.1±0.7 20.2±0.3 24.5±0.9 3.17±0.2
Conc.
Phosphoric
Acid acetone
18.14±0.5 2.4±0.3 0.42±0.6 4.75±0.1 21.43±0.4 1.06±0.4
Sequential
Pretreatment 20.01±0.2 2.1±0.3 0.39±1.2 4.05±0.3 10.3±0.2 1.04±0.9
Control 8.6±0.1 13.7±0.3 1.7±0.2 21.1±0.5 27.12±0.4 3.89±0.3
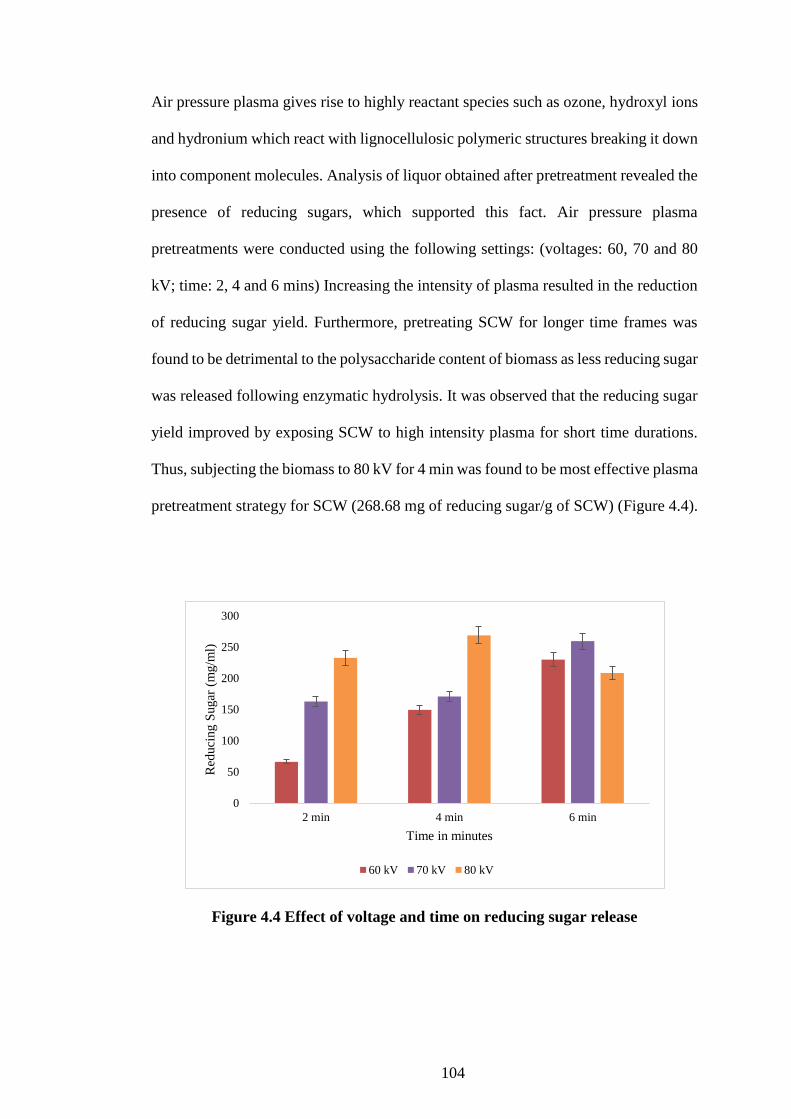
104
Air pressure plasma gives rise to highly reactant species such as ozone, hydroxyl ions
and hydronium which react with lignocellulosic polymeric structures breaking it down
into component molecules. Analysis of liquor obtained after pretreatment revealed the
presence of reducing sugars, which supported this fact. Air pressure plasma
pretreatments were conducted using the following settings: (voltages: 60, 70 and 80
kV; time: 2, 4 and 6 mins) Increasing the intensity of plasma resulted in the reduction
of reducing sugar yield. Furthermore, pretreating SCW for longer time frames was
found to be detrimental to the polysaccharide content of biomass as less reducing sugar
was released following enzymatic hydrolysis. It was observed that the reducing sugar
yield improved by exposing SCW to high intensity plasma for short time durations.
Thus, subjecting the biomass to 80 kV for 4 min was found to be most effective plasma
pretreatment strategy for SCW (268.68 mg of reducing sugar/g of SCW) (Figure 4.4).
Figure 4.4 Effect of voltage and time on reducing sugar release
0
50
100
150
200
250
300
2 min 4 min 6 min
Red
uci
ng S
ugar
(m
g/m
l)
Time in minutes
60 kV 70 kV 80 kV
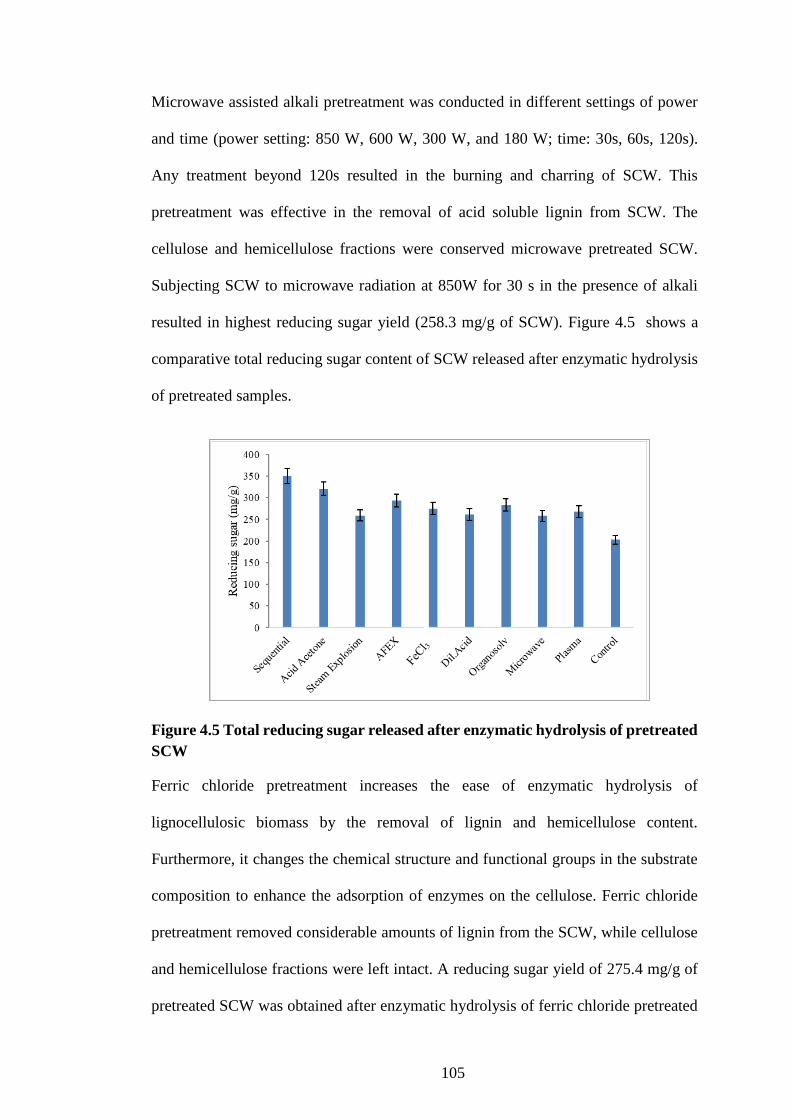
105
Microwave assisted alkali pretreatment was conducted in different settings of power
and time (power setting: 850 W, 600 W, 300 W, and 180 W; time: 30s, 60s, 120s).
Any treatment beyond 120s resulted in the burning and charring of SCW. This
pretreatment was effective in the removal of acid soluble lignin from SCW. The
cellulose and hemicellulose fractions were conserved microwave pretreated SCW.
Subjecting SCW to microwave radiation at 850W for 30 s in the presence of alkali
resulted in highest reducing sugar yield (258.3 mg/g of SCW). Figure 4.5 shows a
comparative total reducing sugar content of SCW released after enzymatic hydrolysis
of pretreated samples.
Figure 4.5 Total reducing sugar released after enzymatic hydrolysis of pretreated
SCW
Ferric chloride pretreatment increases the ease of enzymatic hydrolysis of
lignocellulosic biomass by the removal of lignin and hemicellulose content.
Furthermore, it changes the chemical structure and functional groups in the substrate
composition to enhance the adsorption of enzymes on the cellulose. Ferric chloride
pretreatment removed considerable amounts of lignin from the SCW, while cellulose
and hemicellulose fractions were left intact. A reducing sugar yield of 275.4 mg/g of
pretreated SCW was obtained after enzymatic hydrolysis of ferric chloride pretreated
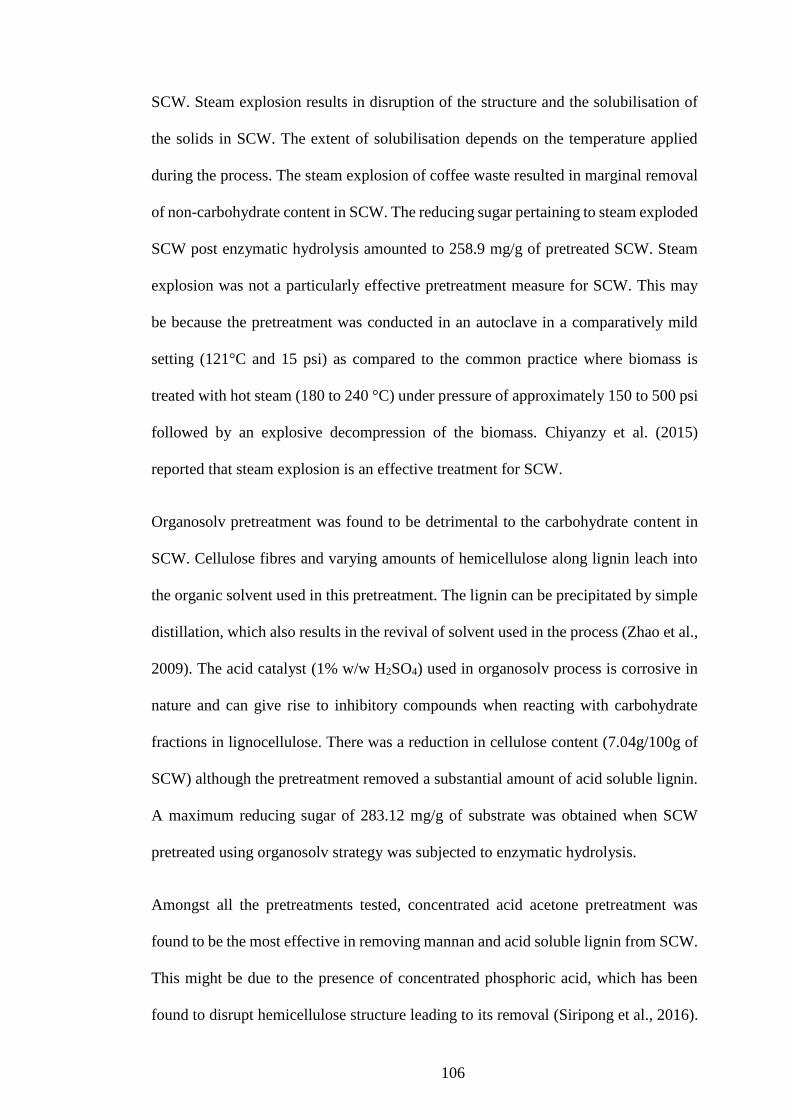
106
SCW. Steam explosion results in disruption of the structure and the solubilisation of
the solids in SCW. The extent of solubilisation depends on the temperature applied
during the process. The steam explosion of coffee waste resulted in marginal removal
of non-carbohydrate content in SCW. The reducing sugar pertaining to steam exploded
SCW post enzymatic hydrolysis amounted to 258.9 mg/g of pretreated SCW. Steam
explosion was not a particularly effective pretreatment measure for SCW. This may
be because the pretreatment was conducted in an autoclave in a comparatively mild
setting (121°C and 15 psi) as compared to the common practice where biomass is
treated with hot steam (180 to 240 °C) under pressure of approximately 150 to 500 psi
followed by an explosive decompression of the biomass. Chiyanzy et al. (2015)
reported that steam explosion is an effective treatment for SCW.
Organosolv pretreatment was found to be detrimental to the carbohydrate content in
SCW. Cellulose fibres and varying amounts of hemicellulose along lignin leach into
the organic solvent used in this pretreatment. The lignin can be precipitated by simple
distillation, which also results in the revival of solvent used in the process (Zhao et al.,
2009). The acid catalyst (1% w/w H2SO4) used in organosolv process is corrosive in
nature and can give rise to inhibitory compounds when reacting with carbohydrate
fractions in lignocellulose. There was a reduction in cellulose content (7.04g/100g of
SCW) although the pretreatment removed a substantial amount of acid soluble lignin.
A maximum reducing sugar of 283.12 mg/g of substrate was obtained when SCW
pretreated using organosolv strategy was subjected to enzymatic hydrolysis.
Amongst all the pretreatments tested, concentrated acid acetone pretreatment was
found to be the most effective in removing mannan and acid soluble lignin from SCW.
This might be due to the presence of concentrated phosphoric acid, which has been
found to disrupt hemicellulose structure leading to its removal (Siripong et al., 2016).
107
Meanwhile, AFEX pretreatment caused biomass swelling disrupting the fibres and
thus breaking down linkages between lignin and carbohydrates thereby increasing the
available surface area. However, this pretreatment did not affect the composition of
SCW to a great extent, except for the removal of acid insoluble lignin. Of all the
pretreatments tested, AFEX pretreated SCW had the least amount of acid-insoluble
lignin (AIL) (12.2 g/100g of SCW). Uppugundla et al. (2014) in a study using
pretreated corn stover for bioethanol production reported the decrease of AIL from
17.2g/100g of biomass to 12.2g/100g of biomass following AFEX pretreatment
Combining the varying effects of these two pretreatments was the motivation behind
the sequential pretreatment strategy. Employing concentrated acid, acetone
pretreatment resulted in the removal of hemicellulose and lignin content in SCW. This
was followed up with the AFEX pretreatment at low temperature which resulted in the
removal of acid insoluble lignin, while preserving the cellulose content (Table 1).
Furthermore, by using sequential pretreatment a 1.7-fold (350.12 mg/g of SCW)
increase was observed in the reducing sugar yield as compared to native SCW (203.4
mg/g of substrate).
4.4.4 Individual sugar, inhibitor and organic acid analysis
HPLC analysis of the hydrolysate obtained after enzymatic hydrolysis of each
pretreated SCW identified four monosaccharides (glucose, mannose, galactose and
arabinose) (Figure 4.6). Kwon et al. (2013) had reported the presence of these four
sugars in a study involving the use of SCW for the co-production of bioethanol and
biodiesel which validated the findings of the present study. Galactose was found to be
the major sugar in the hydrolysate while xylose was not observed in the SCW, which
could be understood by the fact that SCW is high in hemicellulose content. Ballesteros
108
et al. (2015) had reported similar findings in their study on the component sugars found
in SCW. The liquor obtained after pretreatment was analysed for the presence of any
individual sugars, organic acids and inhibitory compounds. All pretreatments released
small but insignificant amounts of galactose and arabinose in the liquor. Interestingly,
a considerable amount of furfural (12.42g/100g of SCW) was detected in the liquor
obtained after organosolv pretreatment. The formation of furfural may be assisted by
the presence of acid as catalysts coupled with high temperature in the organosolv
process, which leads to the formation of furfural as a result of degradation of
monosaccharides.
Figure 4.6 Individual Sugars in SCW hydrolysate
4.4.5 SEM, XRD and FTIR profiles of untreated and pretreated spent coffee
wastes
SEM was employed to study the structural changes in SCW brought about the
sequential pretreatment process. Fig. 4.6 reveals the changes pertaining to SCW before
and after sequential pretreatment. SCW is different from other lignocellulosic
109
substrates in terms of particle shape, size and nature. It is highly porous, non-fibrous
and exhibits a sheet like structure (Ballesteros et al., 2014). The main effects that can
be observed in the SEM images of SCW is the reduction in size. Smaller particles can
be easily identified in the pretreated SCW SEM image (Figure 4.7 A). This can be
attributed to the efficiency of the pretreatment in the removal of hemicellulose
structures which otherwise would have physically hindered the accessibility of the
enzyme to cellulose. Furthermore, the hemicellulase fraction would have adsorbed the
hydrolytic enzymes, resulting in low enzyme concentration. Extensive disintegration
of cell structure of the biomass was achieved by the combination of two strategies
resulted in a substantial increase in external surface area. All these factors contributed
to a better saccharification of pretreated SCW.
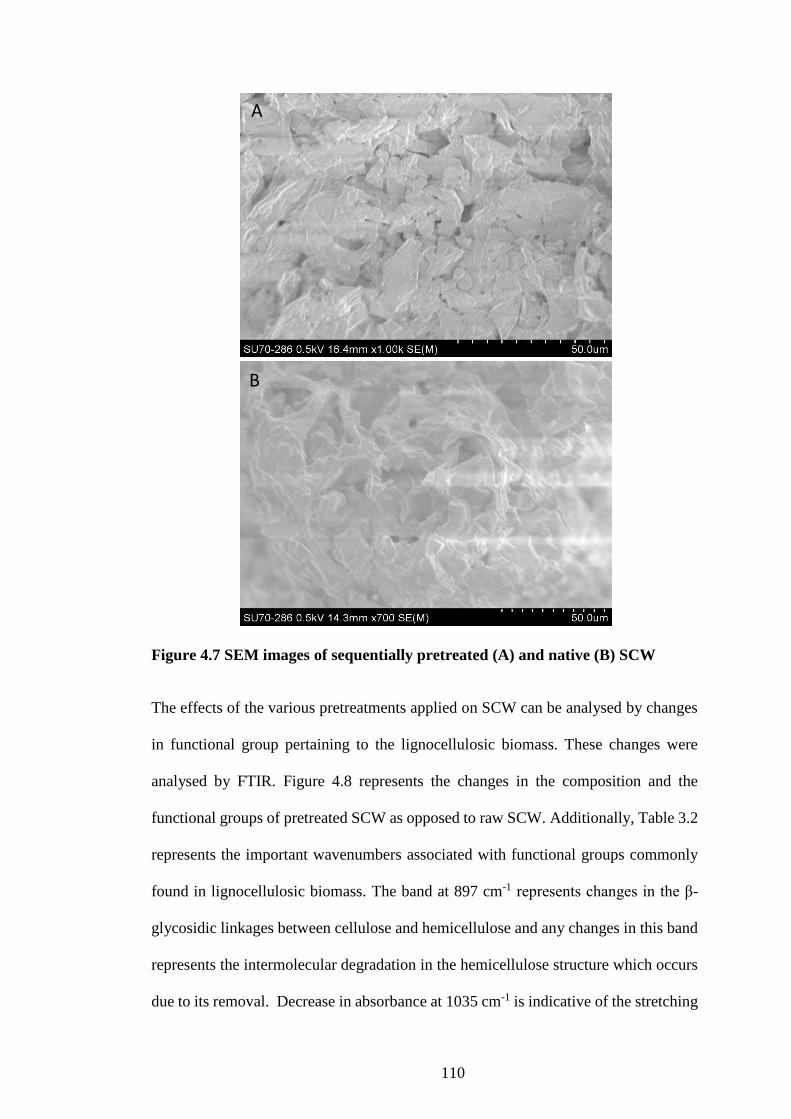
110
Figure 4.7 SEM images of sequentially pretreated (A) and native (B) SCW
The effects of the various pretreatments applied on SCW can be analysed by changes
in functional group pertaining to the lignocellulosic biomass. These changes were
analysed by FTIR. Figure 4.8 represents the changes in the composition and the
functional groups of pretreated SCW as opposed to raw SCW. Additionally, Table 3.2
represents the important wavenumbers associated with functional groups commonly
found in lignocellulosic biomass. The band at 897 cm-1 represents changes in the β-
glycosidic linkages between cellulose and hemicellulose and any changes in this band
represents the intermolecular degradation in the hemicellulose structure which occurs
due to its removal. Decrease in absorbance at 1035 cm-1 is indicative of the stretching
A
B
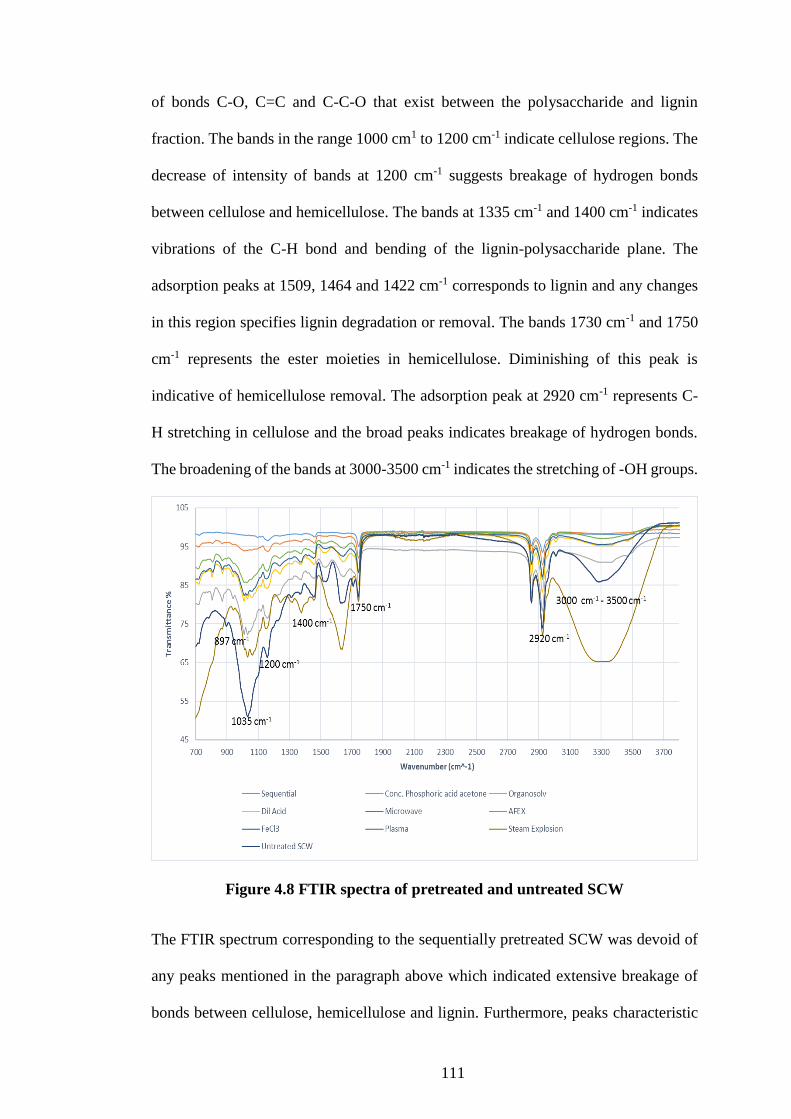
111
of bonds C-O, C=C and C-C-O that exist between the polysaccharide and lignin
fraction. The bands in the range 1000 cm1 to 1200 cm-1 indicate cellulose regions. The
decrease of intensity of bands at 1200 cm-1 suggests breakage of hydrogen bonds
between cellulose and hemicellulose. The bands at 1335 cm-1 and 1400 cm-1 indicates
vibrations of the C-H bond and bending of the lignin-polysaccharide plane. The
adsorption peaks at 1509, 1464 and 1422 cm-1 corresponds to lignin and any changes
in this region specifies lignin degradation or removal. The bands 1730 cm-1 and 1750
cm-1 represents the ester moieties in hemicellulose. Diminishing of this peak is
indicative of hemicellulose removal. The adsorption peak at 2920 cm-1 represents C-
H stretching in cellulose and the broad peaks indicates breakage of hydrogen bonds.
The broadening of the bands at 3000-3500 cm-1 indicates the stretching of -OH groups.
Figure 4.8 FTIR spectra of pretreated and untreated SCW
The FTIR spectrum corresponding to the sequentially pretreated SCW was devoid of
any peaks mentioned in the paragraph above which indicated extensive breakage of
bonds between cellulose, hemicellulose and lignin. Furthermore, peaks characteristic
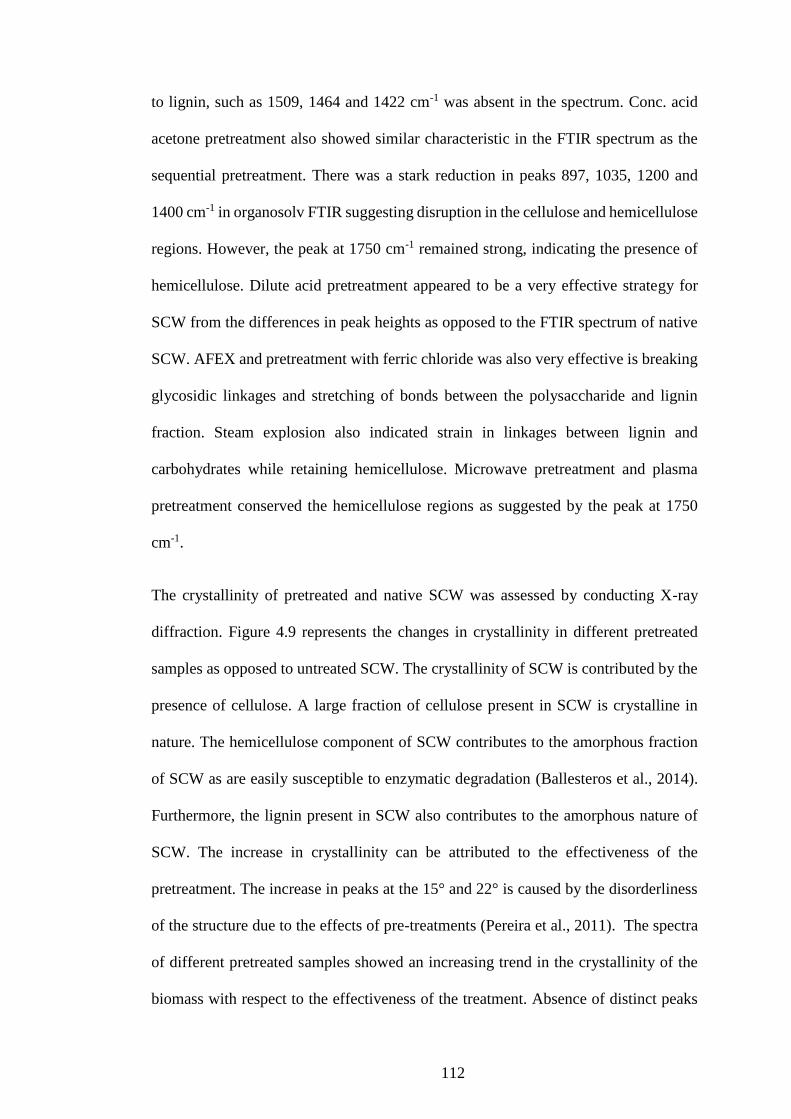
112
to lignin, such as 1509, 1464 and 1422 cm-1 was absent in the spectrum. Conc. acid
acetone pretreatment also showed similar characteristic in the FTIR spectrum as the
sequential pretreatment. There was a stark reduction in peaks 897, 1035, 1200 and
1400 cm-1 in organosolv FTIR suggesting disruption in the cellulose and hemicellulose
regions. However, the peak at 1750 cm-1 remained strong, indicating the presence of
hemicellulose. Dilute acid pretreatment appeared to be a very effective strategy for
SCW from the differences in peak heights as opposed to the FTIR spectrum of native
SCW. AFEX and pretreatment with ferric chloride was also very effective is breaking
glycosidic linkages and stretching of bonds between the polysaccharide and lignin
fraction. Steam explosion also indicated strain in linkages between lignin and
carbohydrates while retaining hemicellulose. Microwave pretreatment and plasma
pretreatment conserved the hemicellulose regions as suggested by the peak at 1750
cm-1.
The crystallinity of pretreated and native SCW was assessed by conducting X-ray
diffraction. Figure 4.9 represents the changes in crystallinity in different pretreated
samples as opposed to untreated SCW. The crystallinity of SCW is contributed by the
presence of cellulose. A large fraction of cellulose present in SCW is crystalline in
nature. The hemicellulose component of SCW contributes to the amorphous fraction
of SCW as are easily susceptible to enzymatic degradation (Ballesteros et al., 2014).
Furthermore, the lignin present in SCW also contributes to the amorphous nature of
SCW. The increase in crystallinity can be attributed to the effectiveness of the
pretreatment. The increase in peaks at the 15° and 22° is caused by the disorderliness
of the structure due to the effects of pre-treatments (Pereira et al., 2011). The spectra
of different pretreated samples showed an increasing trend in the crystallinity of the
biomass with respect to the effectiveness of the treatment. Absence of distinct peaks
113
for amorphous region was observed as a general trend in the XRD spectra of all the
pretreated SCW samples except for acid acetone pretreatement and alkali assisted
microwave pretreatment. Sequentially pretreated SCW exhibited highest crystallinity
compared to all the other pretreated SCW. Comparatively, microwave pretreated SCW
exhibited lowest crystallinity among all the pretreated substrates with distinct peaks
from amorphous and crystalline regions respectively. The increase in the crystalline
nature of the pretreated samples can be attributed to the attrition in the amorphous
components of SCW such as lignin and hemicellulose. Similar observations were
reported by Binod et al. (2012) when employing short duration microwave
pretreatment to improve the enzymatic hydrolysis of sugar cane bagasse. Also,
Raghavi et al. (2016) reported an increase in biomass crystallinity as a result of various
pretreatments.
Figure 4.9 XRD spectra of untreated and pretreated SCW
4.4.6 Thermal behaviour study using differential scanning colorimetry
Differential scanning calorimetry is a technique used to determine the heat effects
associated with phase transitions and chemical reactions. In this method, heat flow
0
500
1000
1500
2000
2500
3000
12 14 16 18 20 22 24 26
Inte
nsi
ty
2θ
FeCl3 Microwave Organosolv Steam Explosion
Dil. acid Native SCW AFEX Acid Acetone
Sequential Plasma
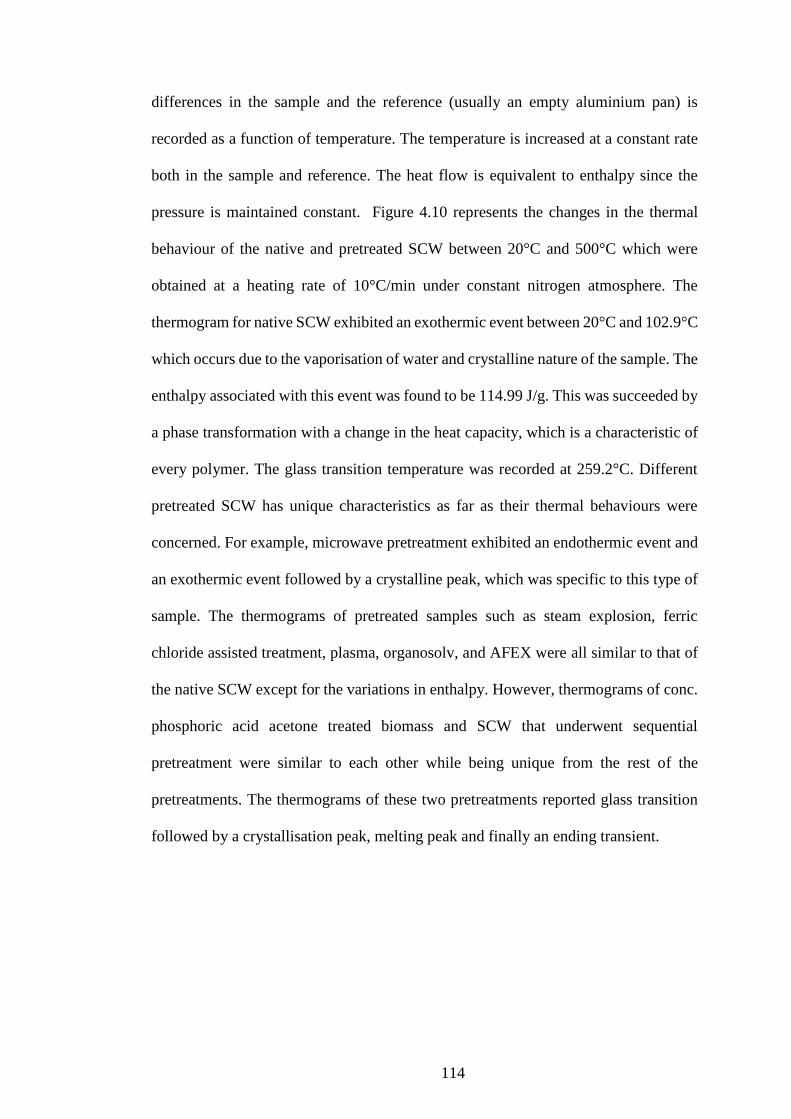
114
differences in the sample and the reference (usually an empty aluminium pan) is
recorded as a function of temperature. The temperature is increased at a constant rate
both in the sample and reference. The heat flow is equivalent to enthalpy since the
pressure is maintained constant. Figure 4.10 represents the changes in the thermal
behaviour of the native and pretreated SCW between 20°C and 500°C which were
obtained at a heating rate of 10°C/min under constant nitrogen atmosphere. The
thermogram for native SCW exhibited an exothermic event between 20°C and 102.9°C
which occurs due to the vaporisation of water and crystalline nature of the sample. The
enthalpy associated with this event was found to be 114.99 J/g. This was succeeded by
a phase transformation with a change in the heat capacity, which is a characteristic of
every polymer. The glass transition temperature was recorded at 259.2°C. Different
pretreated SCW has unique characteristics as far as their thermal behaviours were
concerned. For example, microwave pretreatment exhibited an endothermic event and
an exothermic event followed by a crystalline peak, which was specific to this type of
sample. The thermograms of pretreated samples such as steam explosion, ferric
chloride assisted treatment, plasma, organosolv, and AFEX were all similar to that of
the native SCW except for the variations in enthalpy. However, thermograms of conc.
phosphoric acid acetone treated biomass and SCW that underwent sequential
pretreatment were similar to each other while being unique from the rest of the
pretreatments. The thermograms of these two pretreatments reported glass transition
followed by a crystallisation peak, melting peak and finally an ending transient.
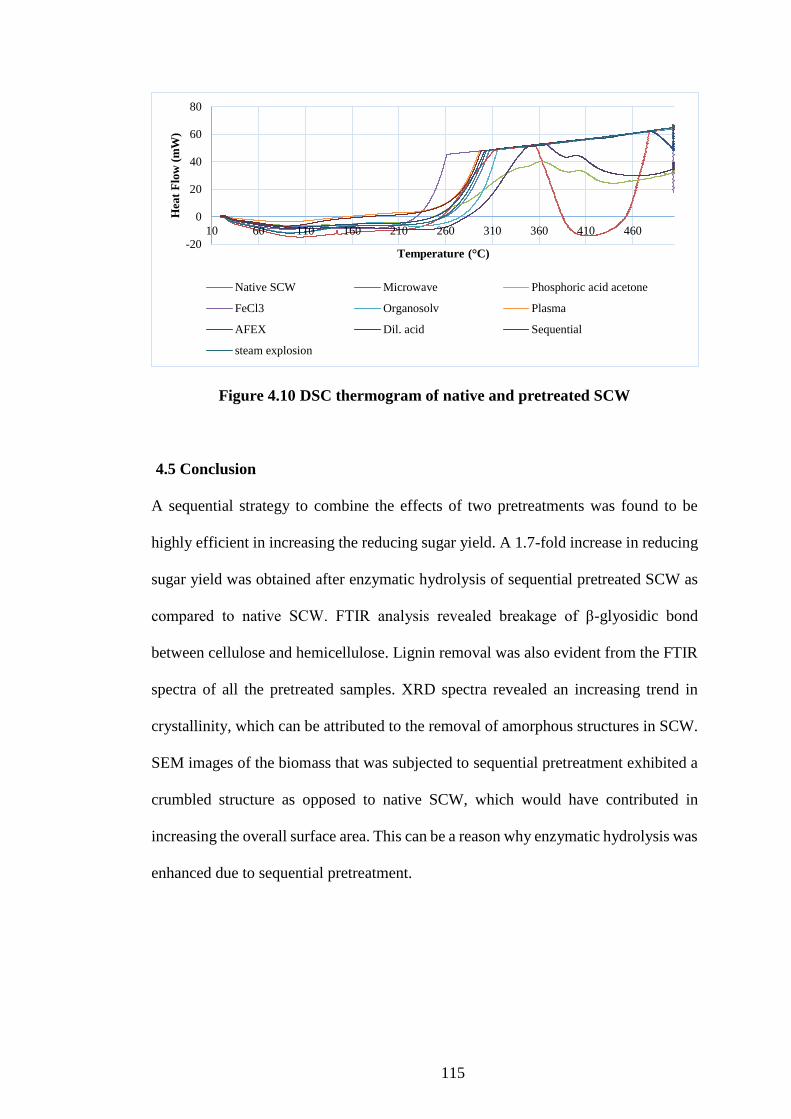
115
Figure 4.10 DSC thermogram of native and pretreated SCW
4.5 Conclusion
A sequential strategy to combine the effects of two pretreatments was found to be
highly efficient in increasing the reducing sugar yield. A 1.7-fold increase in reducing
sugar yield was obtained after enzymatic hydrolysis of sequential pretreated SCW as
compared to native SCW. FTIR analysis revealed breakage of β-glyosidic bond
between cellulose and hemicellulose. Lignin removal was also evident from the FTIR
spectra of all the pretreated samples. XRD spectra revealed an increasing trend in
crystallinity, which can be attributed to the removal of amorphous structures in SCW.
SEM images of the biomass that was subjected to sequential pretreatment exhibited a
crumbled structure as opposed to native SCW, which would have contributed in
increasing the overall surface area. This can be a reason why enzymatic hydrolysis was
enhanced due to sequential pretreatment.
-20
0
20
40
60
80
10 60 110 160 210 260 310 360 410 460
Hea
t F
low
(m
W)
Temperature (°C)
Native SCW Microwave Phosphoric acid acetone
FeCl3 Organosolv Plasma
AFEX Dil. acid Sequential
steam explosion
116
Chapter 5
Evaluation of ultrasound assisted potassium
permanganate pretreatment of spent coffee
waste
In this chapter, novel pre-treatment for spent coffee waste (SCW) has been proposed
which utilises the superior oxidising capacity of alkaline KMnO4 assisted by ultra-
sonication. The pre-treatment was conducted for different exposure times (10, 20, 30
and 40 min) using different concentrations of KMnO4 (1, 2, 3, 4, 5% w/v) at room
temperature with solid/liquid ratio of 1:10. Pretreating SCW with 4% KMnO4 and
exposing it to ultrasound for 20 min resulted in 98% cellulose recovery and a
maximum lignin removal of 46%. 1.7-fold increase in reducing sugar yield was
obtained after enzymatic hydrolysis of KMnO4 pretreated SCW as compared to raw.
SEM, XRD and FTIR analysis of the pretreated SCW revealed the various effects of
pretreatment. Thermal behaviour of the pretreated substrate against the native
biomass was also studied using DSC. Ultrasound-assisted potassium permanganate
oxidation was found to be an effective pretreatment for SCW and can be a used as a
potential feedstock pretreatment strategy.
Work described in this chapter has been published as peer review article:
Evaluation of ultrasound assisted potassium permanganate pre-treatment of spent coffee waste
(2017). Bioresource Technology, 224, 680-687.
5. Evaluation of ultrasound assisted potassium permanganate
pretreatment of spent coffee waste
117
5.1 Introduction
Spent coffee waste (SCW) is the solid material obtained after brewing of instant
coffee. It is rich source of lignocellulose. Over the past few years’ global coffee
production and consumption has been on the rise. It is estimated that the global coffee
production in 2015/16 amounted up to 8,604 million tonnes (ICO, 2016). Several
pretreatment methods have been devised for lignocellulose over the past decade
(Ravindran & Jaiswal, 2016). Dilute acid hydrolysis, steam explosion, dilute alkali
assisted microwave treatment, ammonia fibre explosion, wet oxidation, and conc.
phosphoric acid-acetone pretreatment are some of the most popular and effect
pretreatment strategies for lignocellulose. However, very few studies have been
reported on pretreatment of spent coffee waste. Kwon et al. (2013) conducted a study
based on SCW by subjecting it to dilute acid pretreatment and subsequent conversion
to ethanol. Characterisation of polysaccharides extracted from alkali pretreated SCW
was performed by Ballesteros et al. (2015). Hydrothermal pretreatment was selected
as the pretreatment strategy by Conde and Mussatto (2015) for the isolation of
polyphenols from SCW. Similarly, Scully et al. (2016) investigated spent coffee waste
as a renewable source of bioactive compounds and industrially important sugars and
considered hydrothermal pretreatment before subjecting to enzymatic saccharification
process.
Ultrasonication pretreatment is a novel and effective pretreatment method for
lignocellulose (Velmurugan & Muthukumar, 2012a). In an aqueous environment
ultrasound waves induce cavitation which in bubbles form tend to collapse and expand
with ultrasound waves until they collapse. This leads to the generation of heat with
localised temperatures reaching 4730°C and pressures of 14700 psi. The collapse also
118
leads to the formation of reactive radical species (H, OH, HO2, O3 etc.). Ultrasonic
reactors can be of probe (horn) type or water bath type. Water bath sonicators are mild
in nature compared to probe sonicators (Bussemaker & Zhang, 2013). In a recently
published study by Liyakathali et al. (2016) evaluated the effect of frequency and
reaction time required for pretreating cane bagasse using ultrasound for bioethanol
production. Correspondingly, permanganate oxidation is an effective method in lignin
degradation (Bose et al., 1998). Potassium permanganate is inexpensive and
potentially less toxic compared to acids and alkalis. It has been widely used for water
purification. Although a pretreatment strategy employing potassium permanganate
will lead to effluents consisting of the oxidizing agent it will gradually precipitate by
generating manganese oxide rendering no harm to the environment (Ma et al., 2015).
In the present chapter, an attempt was made to combine the effects of ultrasound and
potassium permanganate oxidation by using a water bath ultrasonic reactor. The
optimum potassium permanganate concentration and reaction time were analysed to
obtain high cellulose and hemicellulose recovery while achieving maximum lignin
removal. Characterisation of the hydrolysate, physical characteristics, crystallinity and
structure of the pretreated SCW was analysed by high performance liquid
chromatography (HPLC), Field emission scanning electron microscopy (FESEM), X-
ray diffraction (XRD) and Fourier transform infrared spectroscopy (FTIR)
respectively. Furthermore, the thermal behaviour of native as well as pretreated SCW
was studies by performing differential scanning calorimetry (DSC).
119
5.2 Methodology
5.2.1 Pretreatment of SCW
5.2.1.1 Ultrasound-assisted potassium permanganate pretreatment
Dry SCW was dispersed in potassium permanganate solution in conical flasks with a
biomass loading of 10% w/v. The reaction times were maintained for 10, 20, 30 and
40 min respectively. The effect of different potassium permanganate solutions (pH
11.5-12) were also studied ranging from 1%, 2%, 3%, 4% and 5%. The samples were
subjected to ultrasound radiation in an ultrasonic bath at frequency of 47 kHz and an
emission power of 310W (ULTRAsonik™ 57X, Ney Dental Inc., USA). All the
experiments were performed at room temperature. The pre-treated residues were
washed with distilled water, filtered and then dried at 80°C until constant weight was
attained. The dried residues were subjected to compositional analysis to determine the
optimal conditions for pretreatment using two step sequential acid hydrolysis (Sluiter
et al., 2008). All the tests were done in triplicates.
5.2.1.2 Alkali assisted ultrasonication
For comparative studies, 1g of SCW was taken in a 100 ml conical flask and was
suspended in 10 ml of NaOH in 1.0, 2.0, 3.0, 4.0 and 5.0% concentration (w/v). The
contents were mixed well and sonicated for 30 min at 25 kHz frequency with an
effective ultrasonic power of 150 W using an ultrasonicator (ULTRAsonik™ 57X,
Ney Dental Inc., USA). The resultant liquid after ultrasonication was analysed for
reducing sugar, hydroxymethyl furfural (HMF) and furfural. The residue after
repeated washings with deionized water was dried in an oven at 50°C for 48 h and
analysed for different components (Gabhane et al., 2014).
120
5.2.2 Enzymatic hydrolysis
Enzymatic hydrolysis was performed accordingly to protocol described in section 3.4
5.2.3 Compositional analysis
Raw and pretreated SCW were subjected to compositional analysis by following two-
stage acid hydrolysis according to The National Renewable Energy Laboratory
(NREL) protocol (Sluiter et al., 2005). The reducing sugar concentration in the
hydrolysate was estimated by dinitro salicylic acid (DNS) method (Miller, 1959). The
presence and quantification of monosaccharides, organic acids and any inhibitors in
the form of furfural and hydroxymethylfurfural was done on an Alliance HPLC
(Waters, e2695 Separation module) using a Rezex ROA-Organic acid H+ (8%)
column, (350 x 7.8 mm; Phenomenex, UK) with 5 mM H2SO4 as the mobile phase at
65°C maintaining a flow rate of 0.6 ml/min (Jaiswal et al., 2012).
The percentage recovery and percentage removal were calculated using the following
formula:
% recovery = Wpre / Wraw x 100
% removal = 1 - % recovery
where, Wpre and Wraw are the weight of the corresponding component (cellulose,
hemicellulose and lignin) in pre-treated and raw SCW (g) respectively (Ma et al.,
2015).
121
5.2.4 Characterisation of raw and pretreated substrate
5.2.4.1 FTIR analysis
The changes in functional groups inflicted by pretreating the biomass was assessed
using FTIR spectroscopy according to section 3.3.4.
5.2.4.2 X-ray diffraction
The changes in functional groups inflicted by pretreating the biomass was assessed
using FTIR spectroscopy according to section 3.3.5.
5.2.4.3 Thermal behavior
The thermal behaviour of the treated and raw samples was studied and compared using
differential scanning calorimetry (DSC) by following methodology described in
section 3.3.6.
5.2.4.4 Scanning Electron Microscopy
The physical changes incurred in pretreated biomass in comparison with untreated
biomass was observed by performing FESEM following procedure described in
section 3.3.7
5.2.5 Statistical analysis
All the experiments were carried out in triplicate and replicated twice unless stated.
Significant differences were computed by employing analysis of variance (ANOVA)
and multiple comparisons (Fischer’s least significant difference test) by employing
STATGRAPHICS Centurion XV software (StatPoint Technologies Inc. Warrenton,
VA, USA). Value of p < 0.05 was considered as significant value.
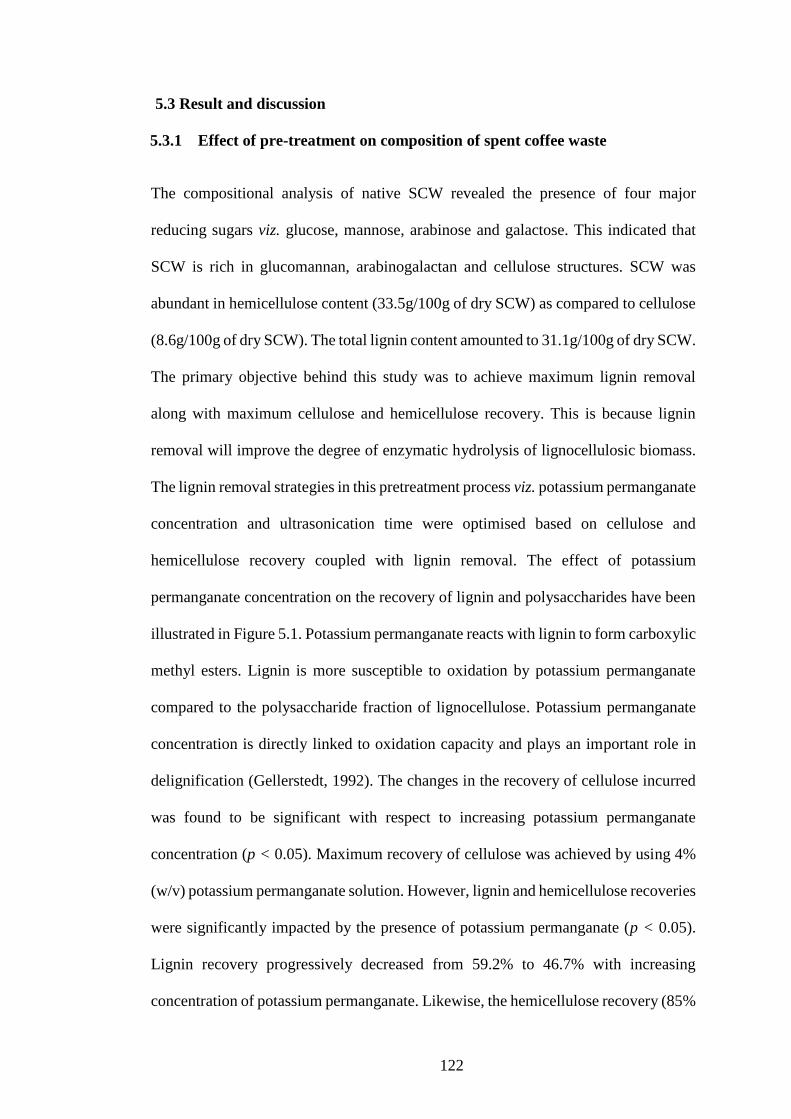
122
5.3 Result and discussion
5.3.1 Effect of pre-treatment on composition of spent coffee waste
The compositional analysis of native SCW revealed the presence of four major
reducing sugars viz. glucose, mannose, arabinose and galactose. This indicated that
SCW is rich in glucomannan, arabinogalactan and cellulose structures. SCW was
abundant in hemicellulose content (33.5g/100g of dry SCW) as compared to cellulose
(8.6g/100g of dry SCW). The total lignin content amounted to 31.1g/100g of dry SCW.
The primary objective behind this study was to achieve maximum lignin removal
along with maximum cellulose and hemicellulose recovery. This is because lignin
removal will improve the degree of enzymatic hydrolysis of lignocellulosic biomass.
The lignin removal strategies in this pretreatment process viz. potassium permanganate
concentration and ultrasonication time were optimised based on cellulose and
hemicellulose recovery coupled with lignin removal. The effect of potassium
permanganate concentration on the recovery of lignin and polysaccharides have been
illustrated in Figure 5.1. Potassium permanganate reacts with lignin to form carboxylic
methyl esters. Lignin is more susceptible to oxidation by potassium permanganate
compared to the polysaccharide fraction of lignocellulose. Potassium permanganate
concentration is directly linked to oxidation capacity and plays an important role in
delignification (Gellerstedt, 1992). The changes in the recovery of cellulose incurred
was found to be significant with respect to increasing potassium permanganate
concentration (p < 0.05). Maximum recovery of cellulose was achieved by using 4%
(w/v) potassium permanganate solution. However, lignin and hemicellulose recoveries
were significantly impacted by the presence of potassium permanganate (p < 0.05).
Lignin recovery progressively decreased from 59.2% to 46.7% with increasing
concentration of potassium permanganate. Likewise, the hemicellulose recovery (85%
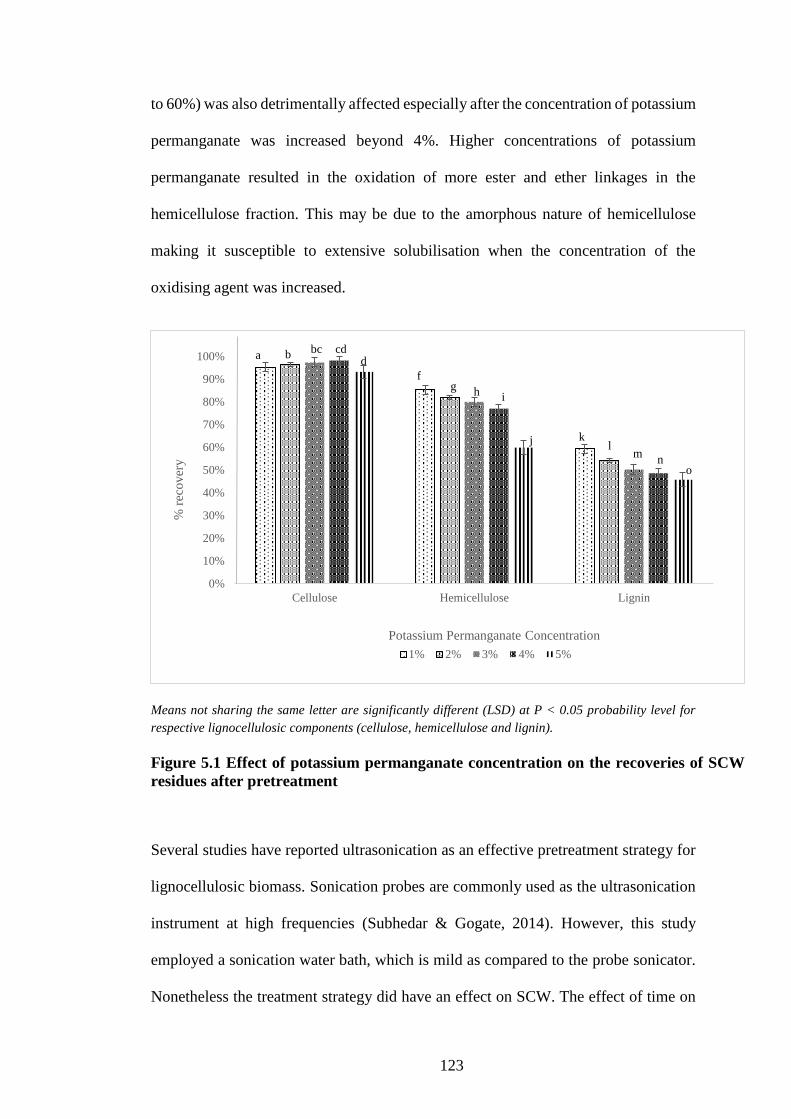
123
to 60%) was also detrimentally affected especially after the concentration of potassium
permanganate was increased beyond 4%. Higher concentrations of potassium
permanganate resulted in the oxidation of more ester and ether linkages in the
hemicellulose fraction. This may be due to the amorphous nature of hemicellulose
making it susceptible to extensive solubilisation when the concentration of the
oxidising agent was increased.
Means not sharing the same letter are significantly different (LSD) at P < 0.05 probability level for
respective lignocellulosic components (cellulose, hemicellulose and lignin).
Figure 5.1 Effect of potassium permanganate concentration on the recoveries of SCW
residues after pretreatment
Several studies have reported ultrasonication as an effective pretreatment strategy for
lignocellulosic biomass. Sonication probes are commonly used as the ultrasonication
instrument at high frequencies (Subhedar & Gogate, 2014). However, this study
employed a sonication water bath, which is mild as compared to the probe sonicator.
Nonetheless the treatment strategy did have an effect on SCW. The effect of time on
0%
10%
20%
30%
40%
50%
60%
70%
80%
90%
100%
Cellulose Hemicellulose Lignin
% r
eco
ver
y
Potassium Permanganate Concentration
1% 2% 3% 4% 5%
a b cdbcd
fg h i
j kl
mn
o
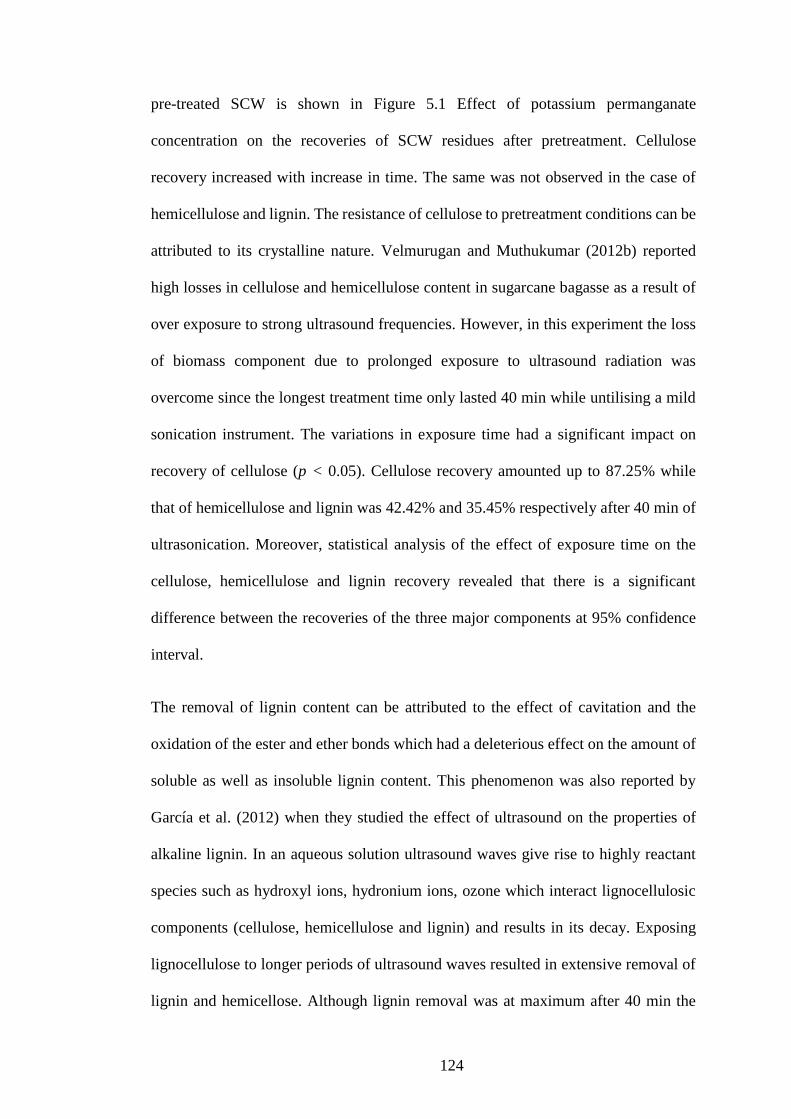
124
pre-treated SCW is shown in Figure 5.1 Effect of potassium permanganate
concentration on the recoveries of SCW residues after pretreatment. Cellulose
recovery increased with increase in time. The same was not observed in the case of
hemicellulose and lignin. The resistance of cellulose to pretreatment conditions can be
attributed to its crystalline nature. Velmurugan and Muthukumar (2012b) reported
high losses in cellulose and hemicellulose content in sugarcane bagasse as a result of
over exposure to strong ultrasound frequencies. However, in this experiment the loss
of biomass component due to prolonged exposure to ultrasound radiation was
overcome since the longest treatment time only lasted 40 min while untilising a mild
sonication instrument. The variations in exposure time had a significant impact on
recovery of cellulose (p < 0.05). Cellulose recovery amounted up to 87.25% while
that of hemicellulose and lignin was 42.42% and 35.45% respectively after 40 min of
ultrasonication. Moreover, statistical analysis of the effect of exposure time on the
cellulose, hemicellulose and lignin recovery revealed that there is a significant
difference between the recoveries of the three major components at 95% confidence
interval.
The removal of lignin content can be attributed to the effect of cavitation and the
oxidation of the ester and ether bonds which had a deleterious effect on the amount of
soluble as well as insoluble lignin content. This phenomenon was also reported by
García et al. (2012) when they studied the effect of ultrasound on the properties of
alkaline lignin. In an aqueous solution ultrasound waves give rise to highly reactant
species such as hydroxyl ions, hydronium ions, ozone which interact lignocellulosic
components (cellulose, hemicellulose and lignin) and results in its decay. Exposing
lignocellulose to longer periods of ultrasound waves resulted in extensive removal of
lignin and hemicellose. Although lignin removal was at maximum after 40 min the
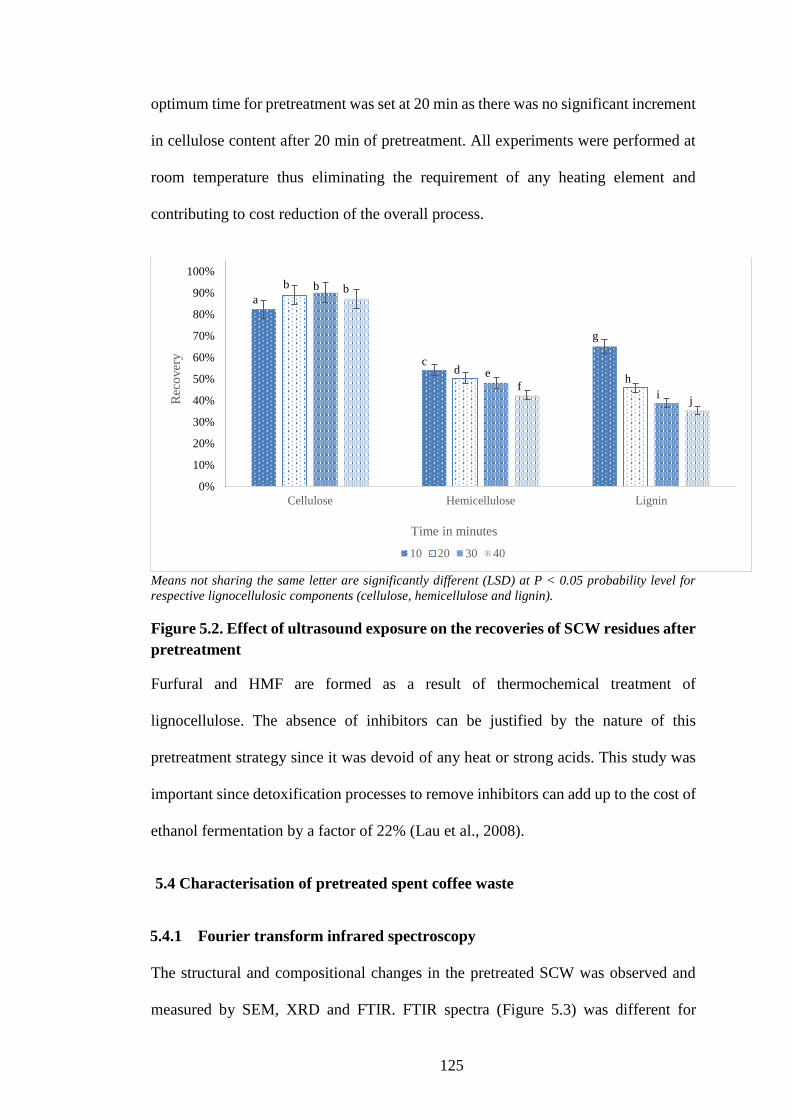
125
optimum time for pretreatment was set at 20 min as there was no significant increment
in cellulose content after 20 min of pretreatment. All experiments were performed at
room temperature thus eliminating the requirement of any heating element and
contributing to cost reduction of the overall process.
Means not sharing the same letter are significantly different (LSD) at P < 0.05 probability level for
respective lignocellulosic components (cellulose, hemicellulose and lignin).
Figure 5.2. Effect of ultrasound exposure on the recoveries of SCW residues after
pretreatment
Furfural and HMF are formed as a result of thermochemical treatment of
lignocellulose. The absence of inhibitors can be justified by the nature of this
pretreatment strategy since it was devoid of any heat or strong acids. This study was
important since detoxification processes to remove inhibitors can add up to the cost of
ethanol fermentation by a factor of 22% (Lau et al., 2008).
5.4 Characterisation of pretreated spent coffee waste
5.4.1 Fourier transform infrared spectroscopy
The structural and compositional changes in the pretreated SCW was observed and
measured by SEM, XRD and FTIR. FTIR spectra (Figure 5.3) was different for
0%
10%
20%
30%
40%
50%
60%
70%
80%
90%
100%
Cellulose Hemicellulose Lignin
Rec
over
y
Time in minutes
10 20 30 40
a
b b b
f
cd e
g
h
ij
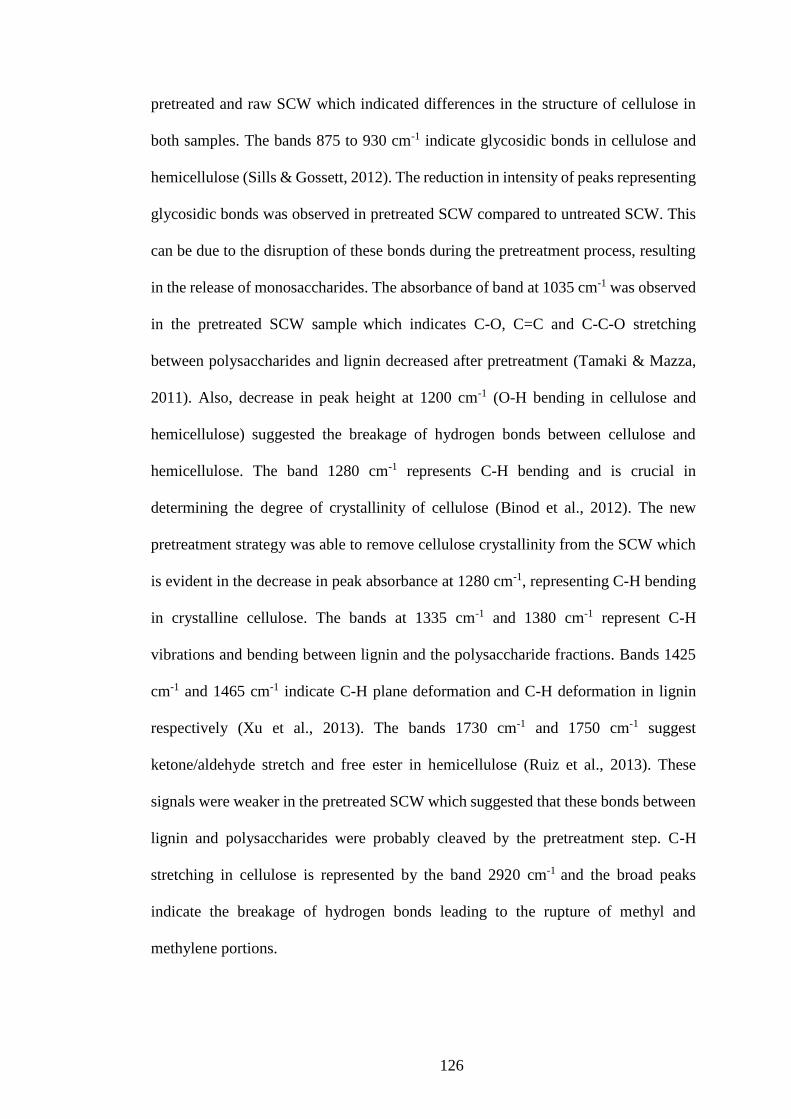
126
pretreated and raw SCW which indicated differences in the structure of cellulose in
both samples. The bands 875 to 930 cm-1 indicate glycosidic bonds in cellulose and
hemicellulose (Sills & Gossett, 2012). The reduction in intensity of peaks representing
glycosidic bonds was observed in pretreated SCW compared to untreated SCW. This
can be due to the disruption of these bonds during the pretreatment process, resulting
in the release of monosaccharides. The absorbance of band at 1035 cm-1 was observed
in the pretreated SCW sample which indicates C-O, C=C and C-C-O stretching
between polysaccharides and lignin decreased after pretreatment (Tamaki & Mazza,
2011). Also, decrease in peak height at 1200 cm-1 (O-H bending in cellulose and
hemicellulose) suggested the breakage of hydrogen bonds between cellulose and
hemicellulose. The band 1280 cm-1 represents C-H bending and is crucial in
determining the degree of crystallinity of cellulose (Binod et al., 2012). The new
pretreatment strategy was able to remove cellulose crystallinity from the SCW which
is evident in the decrease in peak absorbance at 1280 cm-1, representing C-H bending
in crystalline cellulose. The bands at 1335 cm-1 and 1380 cm-1 represent C-H
vibrations and bending between lignin and the polysaccharide fractions. Bands 1425
cm-1 and 1465 cm-1 indicate C-H plane deformation and C-H deformation in lignin
respectively (Xu et al., 2013). The bands 1730 cm-1 and 1750 cm-1 suggest
ketone/aldehyde stretch and free ester in hemicellulose (Ruiz et al., 2013). These
signals were weaker in the pretreated SCW which suggested that these bonds between
lignin and polysaccharides were probably cleaved by the pretreatment step. C-H
stretching in cellulose is represented by the band 2920 cm-1 and the broad peaks
indicate the breakage of hydrogen bonds leading to the rupture of methyl and
methylene portions.
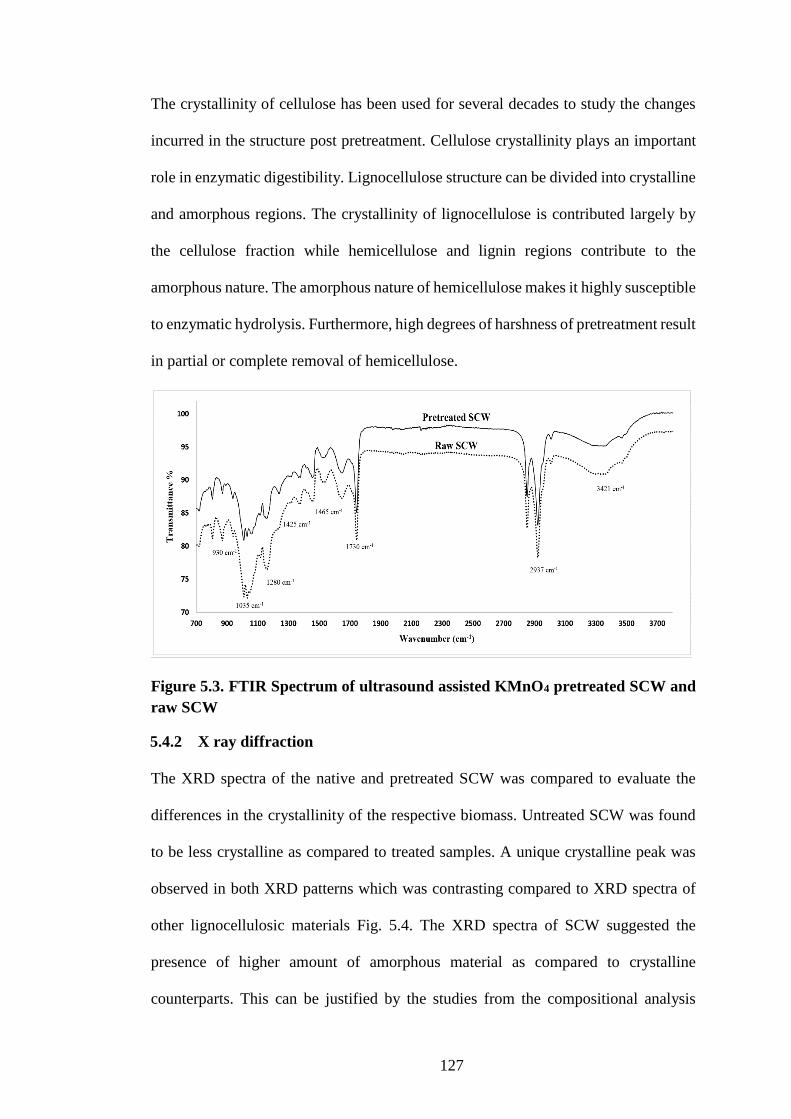
127
The crystallinity of cellulose has been used for several decades to study the changes
incurred in the structure post pretreatment. Cellulose crystallinity plays an important
role in enzymatic digestibility. Lignocellulose structure can be divided into crystalline
and amorphous regions. The crystallinity of lignocellulose is contributed largely by
the cellulose fraction while hemicellulose and lignin regions contribute to the
amorphous nature. The amorphous nature of hemicellulose makes it highly susceptible
to enzymatic hydrolysis. Furthermore, high degrees of harshness of pretreatment result
in partial or complete removal of hemicellulose.
Figure 5.3. FTIR Spectrum of ultrasound assisted KMnO4 pretreated SCW and
raw SCW
5.4.2 X ray diffraction
The XRD spectra of the native and pretreated SCW was compared to evaluate the
differences in the crystallinity of the respective biomass. Untreated SCW was found
to be less crystalline as compared to treated samples. A unique crystalline peak was
observed in both XRD patterns which was contrasting compared to XRD spectra of
other lignocellulosic materials Fig. 5.4. The XRD spectra of SCW suggested the
presence of higher amount of amorphous material as compared to crystalline
counterparts. This can be justified by the studies from the compositional analysis
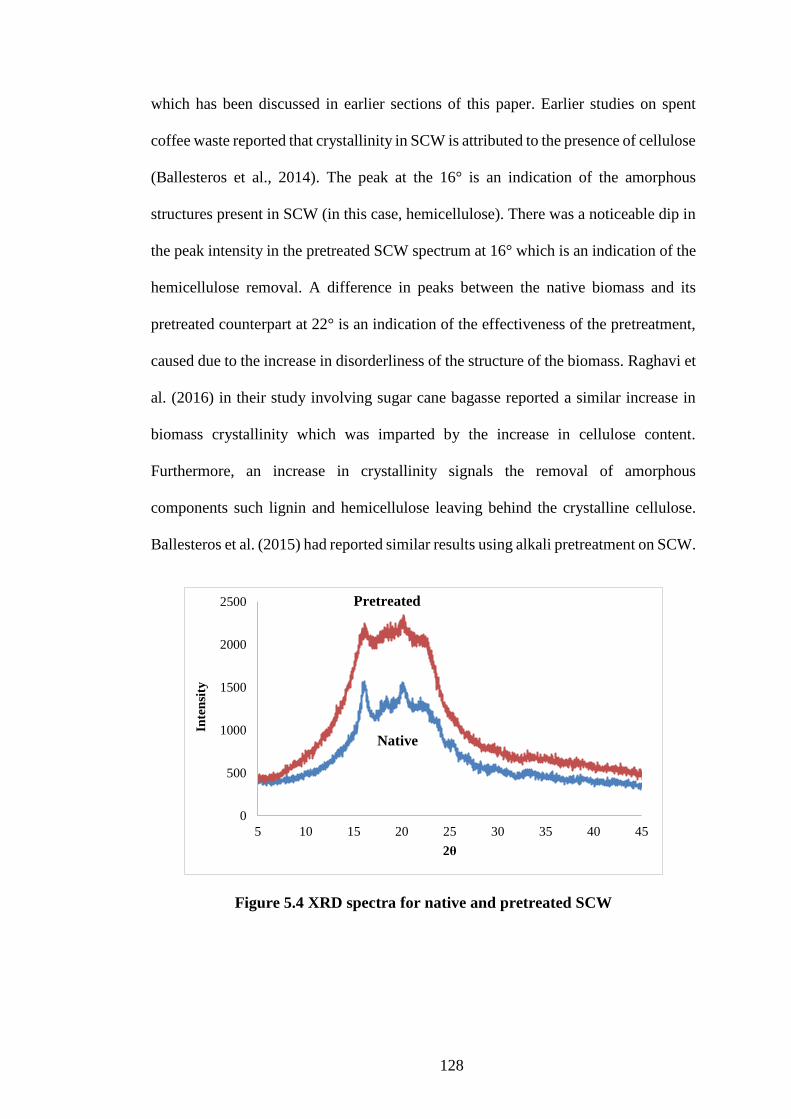
128
which has been discussed in earlier sections of this paper. Earlier studies on spent
coffee waste reported that crystallinity in SCW is attributed to the presence of cellulose
(Ballesteros et al., 2014). The peak at the 16° is an indication of the amorphous
structures present in SCW (in this case, hemicellulose). There was a noticeable dip in
the peak intensity in the pretreated SCW spectrum at 16° which is an indication of the
hemicellulose removal. A difference in peaks between the native biomass and its
pretreated counterpart at 22° is an indication of the effectiveness of the pretreatment,
caused due to the increase in disorderliness of the structure of the biomass. Raghavi et
al. (2016) in their study involving sugar cane bagasse reported a similar increase in
biomass crystallinity which was imparted by the increase in cellulose content.
Furthermore, an increase in crystallinity signals the removal of amorphous
components such lignin and hemicellulose leaving behind the crystalline cellulose.
Ballesteros et al. (2015) had reported similar results using alkali pretreatment on SCW.
Figure 5.4 XRD spectra for native and pretreated SCW
0
500
1000
1500
2000
2500
5 10 15 20 25 30 35 40 45
Inte
nsi
ty
2θ
Native
Pretreated
129
5.4.3 Differential Scanning Calorimetry
Differential scanning calorimetry determines the heat effects associated with phase
transitions and chemical reactions as a function of temperature. The difference in heat
flow in the sample and the reference (usually an empty aluminium pan) is recorded as
a function of temperature. The temperature is increased at a constant rate both in the
sample and reference. Since the pressure is maintained constant, the heat flow is
equivalent to enthalpy. The DSC thermogram (Fig. 5.5) represents the thermal
characteristics of the native and the pretreated SCW between 20°C and 500°C which
were obtained at a heating rate of 10°C/min. The thermogram for raw SCW exhibited
an exothermic event which initiated at 20°C and peaked at 102.9°C. This event can be
associated with the vaporisation of water. The enthalpy associated with this process
was found to be 114.99 J/g. This was succeeded by a phase transformation with a
change in the heat capacity which is a characteristic of every polymer. The glass
transition temperature was recorded at 259.2°C. Interestingly, the pretreated SCW
exhibited two events: an exothermic phase followed by an endothermic phase. The
exothermic phase was observed with a peak at 94.8°C. The enthalpy associated with
this event amounted to be 79.49 J/g. In contrast with the raw SCW, a crystallisation
change of 485.34 J/g. Melting events were not observed for pretreated SCW which
suggests the absence of any impurities.
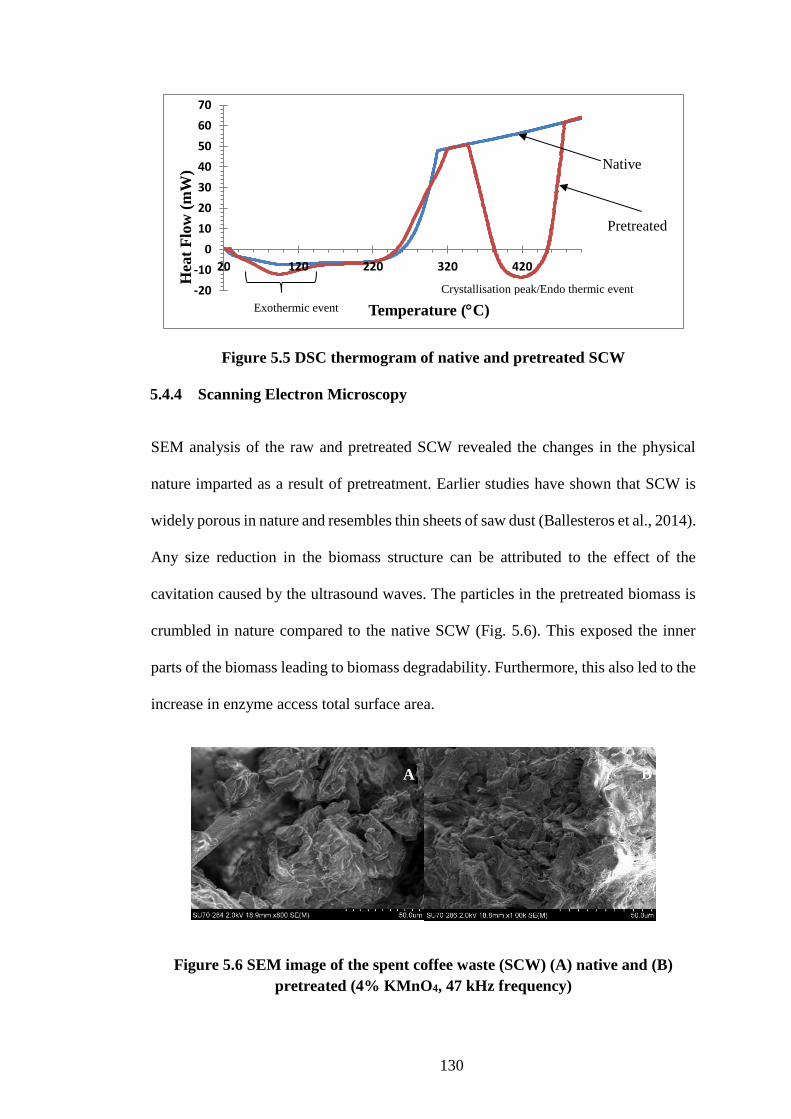
130
Figure 5.5 DSC thermogram of native and pretreated SCW
5.4.4 Scanning Electron Microscopy
SEM analysis of the raw and pretreated SCW revealed the changes in the physical
nature imparted as a result of pretreatment. Earlier studies have shown that SCW is
widely porous in nature and resembles thin sheets of saw dust (Ballesteros et al., 2014).
Any size reduction in the biomass structure can be attributed to the effect of the
cavitation caused by the ultrasound waves. The particles in the pretreated biomass is
crumbled in nature compared to the native SCW (Fig. 5.6). This exposed the inner
parts of the biomass leading to biomass degradability. Furthermore, this also led to the
increase in enzyme access total surface area.
Figure 5.6 SEM image of the spent coffee waste (SCW) (A) native and (B)
pretreated (4% KMnO4, 47 kHz frequency)
-20
-10
0
10
20
30
40
50
60
70
20 120 220 320 420
Hea
t F
low
(m
W)
Temperature (C)
Native
Pretreated
Crystallisation peak/Endo thermic event
A B A B
Exothermic event
131
5.5 Conclusion
The evaluation of ultrasound assisted potassium permanganate pretreatment revealed
that this method is very effective for lignin and hemicellulose removal from spent
coffee waste. Significant lignin removal (45.70%) was achieved with a KMnO4
concentration of 4% and ultrasound exposure time of 20 min. Additionally this process
was mild enough to safeguard the polysaccharide fraction (hemicellulose in
particular). A 1.7fold increase in reducing sugar yield was obtained when pretreated
SCW was subjected to enzymatic hydrolysis compared to untreated SCW. The most
important feature of ultrasound assisted potassium permanganate treatment is that no
heat was used as part of this process thus rendering this technique a simple, fast and
effective pretreatment strategy.
Chapter 6
Evaluation of the effects of pretreatment on
properties of brewers spent grain
In this chapter, a range of physical, chemical and physico-chemical pretreatments
were examined to study the effect of each pretreatment on increasing reducing sugar
yield from the brewer’s spent grain (BSG). Changes in chemical composition of native
as well as pretreated biomass was studied. Enzymatic hydrolysis was conducted based
on a response surface methodology study performed to obtain maximum reducing
sugar. Accordingly, a maximum reducing yield was observed with high biomass
132
loading (1g/10 ml), cellulase (158.76 μl/10ml), hemicellulase (153.3 μl /10ml), pH
(5.4) and an incubation time (120h). Brewers spent grain was high in cellulose
(19.21g/100g of BSG) and lignin content (30.84g/100g of BSG). Glucose and xylose
was found to be the predominant sugars in BSG. Microwave assisted alkali
pretreatment was found to be the most effective pretreatment for BSG. The
pretreatment was conducted at 10W was for a time period of 30s. Upon enzymatic
hydrolysis, microwave assisted alkali pretreated BSG yielded 228.25 mg of reducing
sugar /g of BSG which was 2.86-fold higher compared to native BSG (79.67 mg/g of
BSG). This pretreatment strategy was also successful in de-lignifying BSG. The
changes in functional groups, crystallinity and thermal behaviour was studies by
means of FTIR, XRD and DSC respectively.
Work described in this chapter has been published as a peer review article:
A comparative analysis of pretreatment strategies on the properties and hydrolysis of brewers’
spent grain (2018). Bioresource Technology, 248, 272-279.
6. Evaluation of the effects of pretreatment on properties of
brewers spent grain
6.1 Introduction
Brewer’s spent grain is a by-product of the brewing industry. It is obtained from barley
and is essentially the outer pericarp seed coat layer of the malted barley grain that
remains after the mashing process (Mussatto et al., 2006). It is structurally
heterogeneous in nature and consists of husk, pericarp and fractions of endosperm
(Forssell et al., 2008). Almost 30% of the starting malted grain end up as BSG by the
end of the brewing process. Every hectolitre of beer generated 15-20 kg of BSG which
corresponds to 34 million tonnes of wet BSG generated annually in Europe (Xiros &
Christakopoulos, 2012). Although rich in polysaccharides, proteins and lignin, which
can be used for industrial exploitation BSG is generally used as animal feed. ‘The New
Waste Framework Directive’ was introduced by the EU in 2008/09 as a new approach
to curb food waste such as BSG and as well as new processes for reuse and recycling
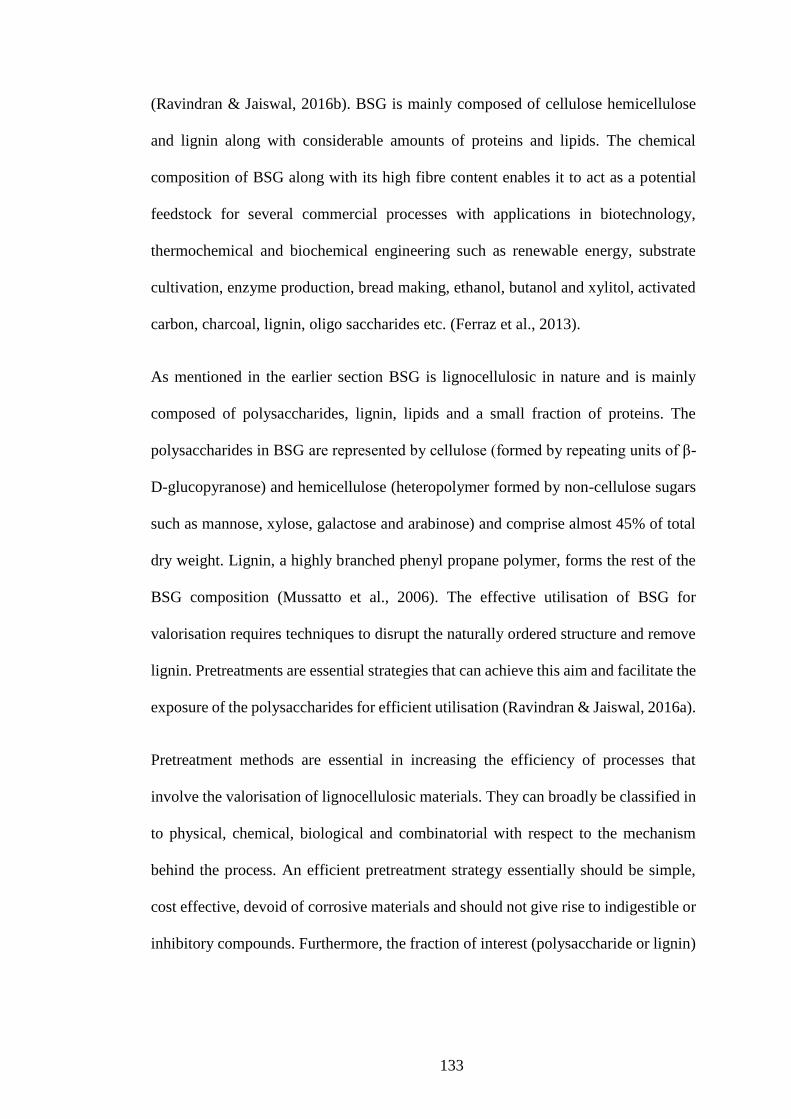
133
(Ravindran & Jaiswal, 2016b). BSG is mainly composed of cellulose hemicellulose
and lignin along with considerable amounts of proteins and lipids. The chemical
composition of BSG along with its high fibre content enables it to act as a potential
feedstock for several commercial processes with applications in biotechnology,
thermochemical and biochemical engineering such as renewable energy, substrate
cultivation, enzyme production, bread making, ethanol, butanol and xylitol, activated
carbon, charcoal, lignin, oligo saccharides etc. (Ferraz et al., 2013).
As mentioned in the earlier section BSG is lignocellulosic in nature and is mainly
composed of polysaccharides, lignin, lipids and a small fraction of proteins. The
polysaccharides in BSG are represented by cellulose (formed by repeating units of β-
D-glucopyranose) and hemicellulose (heteropolymer formed by non-cellulose sugars
such as mannose, xylose, galactose and arabinose) and comprise almost 45% of total
dry weight. Lignin, a highly branched phenyl propane polymer, forms the rest of the
BSG composition (Mussatto et al., 2006). The effective utilisation of BSG for
valorisation requires techniques to disrupt the naturally ordered structure and remove
lignin. Pretreatments are essential strategies that can achieve this aim and facilitate the
exposure of the polysaccharides for efficient utilisation (Ravindran & Jaiswal, 2016a).
Pretreatment methods are essential in increasing the efficiency of processes that
involve the valorisation of lignocellulosic materials. They can broadly be classified in
to physical, chemical, biological and combinatorial with respect to the mechanism
behind the process. An efficient pretreatment strategy essentially should be simple,
cost effective, devoid of corrosive materials and should not give rise to indigestible or
inhibitory compounds. Furthermore, the fraction of interest (polysaccharide or lignin)
134
should be safeguarded and should not result in its considerable loss. Lastly, the whole
process must be economically feasible.
The effect of several pretreatment studies have been studies in different studies as a
part of valorisation of brewers spent grain. Macheiner et al. (2003) used microwave
radiation as a pretreatment measure for BSG for increasing the efficiency of enzymatic
hydrolysis. Accordingly, 25% release of saccharides was achieved after 4h of
incubation at 50°C. An interesting study was published by Wolters et al. (2016) where
BSG was used for the production of erinacine C production, a secondary metabolite
produced by a medicinal fungus Hericium erinaceus. Acid hydrolysis using 0.2M
H2SO4 was employed as the pretreatment measure in this study. A novel pretreatment
for BSG was devised by Zhang and Zang (2016) where they used calcined red mud to
pre-treat BSG for subsequent hydrogen production. Liguori et al. (2015) utilised acid-
alkali pretreated BSG for ethanol production with 55% efficiency. However, a
comprehensive analysis on the effects of different physical and chemical pretreatments
on the composition of BSG and efficiency of enzymatic hydrolysis are yet to be
performed.
This chapter presents the various attributes of the changes undergone by BSG when it
was subjected to six different pretreatments. The changes in its chemical composition,
structural conformation, crystallinity and thermal behaviour was analysed and
compared upon subjecting BSG to different pretreatment strategies. The pretreated
BSG as well as native BSG samples were then subjected to enzymatic hydrolysis using
optimised parameters. The pretreatment liquor was analysed for the incidence of
monosaccharides and inhibitory compounds.
135
6.2 Methodology
Brewer’s spent grain was generously donated by Metalman Brewing Co., a brewery
in Waterford. The BSG was dried at 60°C for 48h and thereafter ground and sieved
using a 350 μm sieve. It was then stored at room temperature in a cool and dry place
for further experiments. All the chemicals such as cellulase from Trichoderma reesei,
hemicellulase from Aspergillus niger, conc. H2SO4, alkaline potassium permanganate,
ethanol, ferric chloride, and other chemicals required for experimentation were
purchased from Sigma-Aldrich (now Merck), Ireland. Cellulase activity was assayed
by following laboratory analytical procedures for the measurement of cellulase
activity devised by National Renewable Energy Laboratory (Adney & Baker, 1996).
Meanwhile hemicellulase activity was assayed followed protocols described by
Rickard and Laughlin (1980). Cellulase enzyme registered an enzyme activity of 77
FPU/ml while hemicellulase showed 72 U/ml enzyme activity.
6.2.1 Screening of various pretreatments of BSG
6.2.1.1 Dilute acid hydrolysis
BSG (1% w/v) was mixed with 10 ml of sulphuric acid (1%, 2% and 3% v/v) in a 100
ml flask. The reaction mixture was subjected to 121°C for 10, 20 and 30 min in an
autoclave (Zheng et al., 2013). The solids were separated from liquids by
centrifugation after pretreatment and the filtrate was analysed for the release of any
individual sugars and by-products such as acetic acid, furfural and hydroxymethyl
furfural. The solids were dried and stored in cool and dry place until further analysis.
136
6.2.1.2 Steam Explosion
Steam explosion of BSG was performed as described by Huang et al. (2015) with
certain modifications. Five grams of BSG was moistened with de-ionized water to
attain 50% moisture content (w/v). The samples were then loaded in to a stainless-
steel autoclave. The temperature was raised and maintained at 121°C for 30 minutes
after which the pressure was released by opening the pressure valve subjecting the
biomass to an ‘explosion’. The steam exploded BSG was collected, dried and stored
in sealed plastic bags for further analysis.
6.2.1.3 Ammonia Fiber Explosion (AFEX)
Ammonia Fibre Explosion was performed by soaking 2.5 g of BSG with 25 ml of
NH4OH and then subjecting it to high pressure and temperature in an autoclave. The
experiment was carried out at 120°C, water loading of 2.0 g water/g dry biomass, for
a residence time of 30 min. The treated biomass was removed from the autoclave and
air-dried overnight (about 12 h) in a fume hood to remove residual ammonia. The
treated samples were stored in a cool and dry place (Shao et al., 2013).
6.2.1.4 Pretreatment using Ferric Chloride
Ferric chloride pretreatment was implemented on BSG according to the procedure
described by Chen et al. (2015) with minor modifications. BSG (10% w/v) was mixed
in 50ml of 0.1M FeCl3 in an Erlenmeyer flask and the subjected to high pressure (15
psi) and temperature (120°C) for 30 minutes in an autoclave. The solids were separated
from the liquid after allowing the mixture to cool. The solids were then washed five
times with deionized water to remove any residual FeCl3. The Fe (III) in the liquor
was precipitated by gradually the neutralising the solution using 0.1M NaOH. Once
137
the precipitate was removed the salt free liquor was subjected to HPLC analysis to
identify and quantify any individual sugars present as well as hydroxyl-5-methyl
furfural and furfural content. The solids were dried and stored for enzymatic
hydrolysis and further analysis.
6.2.1.5 Organosolv Pretreatment
Organosolv pretreatment was performed as described by Ostovareh et al. (2015) with
minor modifications. 1% (w/v) dry BSG was mixed in 25 ml of ethanol-water mixture
(60% ethanol (v/v)) in an Erlenmeyer flask. In all experiments, 1% of sulphuric acid
(w/w) per gram substrate was added as a catalyst. The reaction temperature was set at
100 °C for 30 min. After the reaction the flasks were then placed in an ice chamber to
cool the contents quickly to room temperature. The contents were centrifuged at 8000
rpm for 12 minutes to separate the solids from the liquids. The solids were washed
with 250 ml of 50% ethanol mixture to extract the soluble products into the liquid
phase. The pre-treated substrate was then washed several times with distilled water
until pH 7 was obtained. Ethanol was evaporated from the liquid fraction and
recovered by condensation leaving behind a precipitate which mainly contained lignin.
The pretreated BSG was dried and stored for enzymatic hydrolysis and further
analysis.
6.2.1.6 Microwave assisted alkali pretreatment
Microwave-alkali pre-treatment was carried out following the procedure described by
Binod et al. (2012) with minor modifications. A domestic microwave (Sharp/R-269
KM) was employed for this purpose. 1% (w/v) biomass was loaded to 0.5% NaOH
(w/v) solution in a stoppered flask and subjected to microwave radiation at varying
power settings of 10 W, 50 W, and 100 W for different residence time varying from
138
30s, 60s and 120s. After pre-treatment, the biomass was thoroughly washed with
distilled water till pH 6.0 and dried in air. The dried solid residue was used for
enzymatic hydrolysis and compositional analysis.
6.2.2 Compositional analysis
Compositional analysis of pretreated and untreated BSG was performed according to
the protocol described in section 3.3.1
6.2.3 Enzymatic hydrolysis of BSG
Enzymatic hydrolysis of BSG was performed by applying optimized parameters
according to section 3.5
6.2.4 Individual sugar inhibitor and organic acid analysis
The liquor obtained after each pretreatment was analysed for the presence of
monosaccharides organic acids, acetyl or any inhibitory compounds such as furfural
and hydroxymethyl furfural following protocol described in section 3.3.3.
6.2.5 Characterization of native and pretreated substrate
6.2.5.1 X-ray diffraction
The changes in crystallinity of the pretreated and untreated substrates were studied
following methodology detailed in section 3.3.5.
6.2.5.2 FTIR analysis
The changes in functional groups inflicted by pretreating the biomass was assessed
using FTIR spectroscopy according to section 3.3.4.
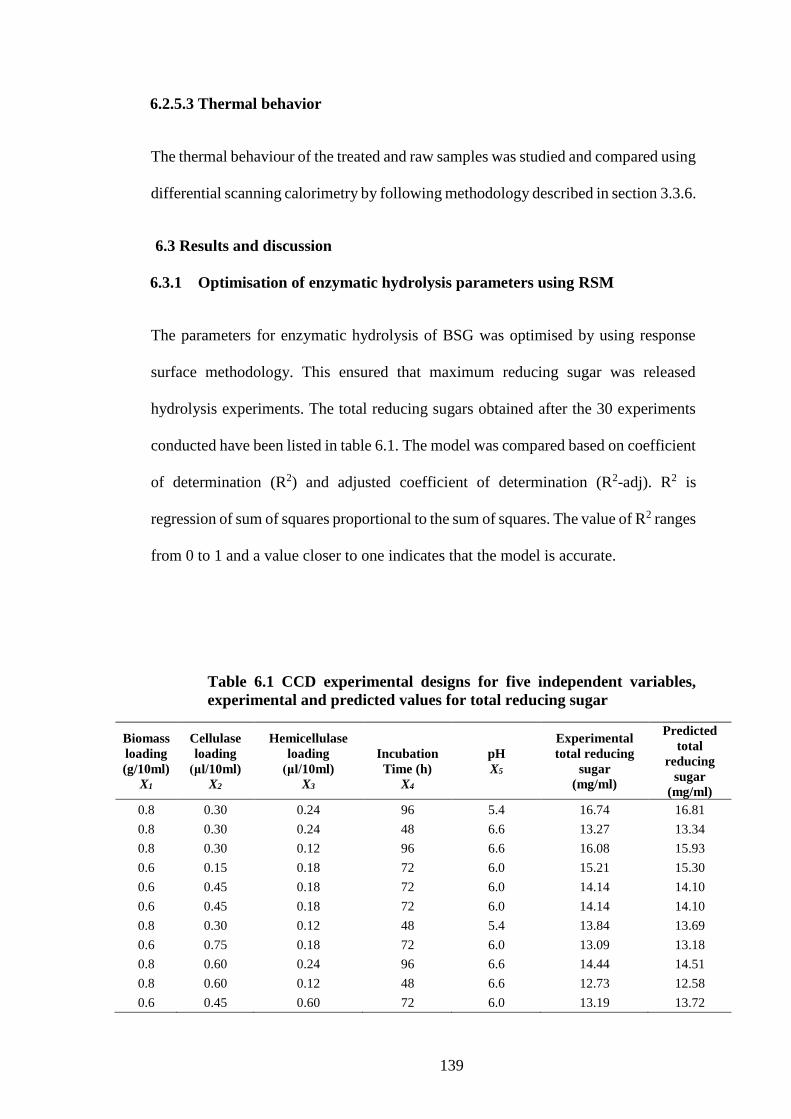
139
6.2.5.3 Thermal behavior
The thermal behaviour of the treated and raw samples was studied and compared using
differential scanning calorimetry by following methodology described in section 3.3.6.
6.3 Results and discussion
6.3.1 Optimisation of enzymatic hydrolysis parameters using RSM
The parameters for enzymatic hydrolysis of BSG was optimised by using response
surface methodology. This ensured that maximum reducing sugar was released
hydrolysis experiments. The total reducing sugars obtained after the 30 experiments
conducted have been listed in table 6.1. The model was compared based on coefficient
of determination (R2) and adjusted coefficient of determination (R2-adj). R2 is
regression of sum of squares proportional to the sum of squares. The value of R2 ranges
from 0 to 1 and a value closer to one indicates that the model is accurate.
Table 6.1 CCD experimental designs for five independent variables,
experimental and predicted values for total reducing sugar
Biomass
loading
(g/10ml)
X1
Cellulase
loading
(μl/10ml)
X2
Hemicellulase
loading
(μl/10ml)
X3
Incubation
Time (h)
X4
pH
X5
Experimental
total reducing
sugar
(mg/ml)
Predicted
total
reducing
sugar
(mg/ml)
0.8 0.30 0.24 96 5.4 16.74 16.81
0.8 0.30 0.24 48 6.6 13.27 13.34
0.8 0.30 0.12 96 6.6 16.08 15.93
0.6 0.15 0.18 72 6.0 15.21 15.30
0.6 0.45 0.18 72 6.0 14.14 14.10
0.6 0.45 0.18 72 6.0 14.14 14.10
0.8 0.30 0.12 48 5.4 13.84 13.69
0.6 0.75 0.18 72 6.0 13.09 13.18
0.8 0.60 0.24 96 6.6 14.44 14.51
0.8 0.60 0.12 48 6.6 12.73 12.58
0.6 0.45 0.60 72 6.0 13.19 13.72
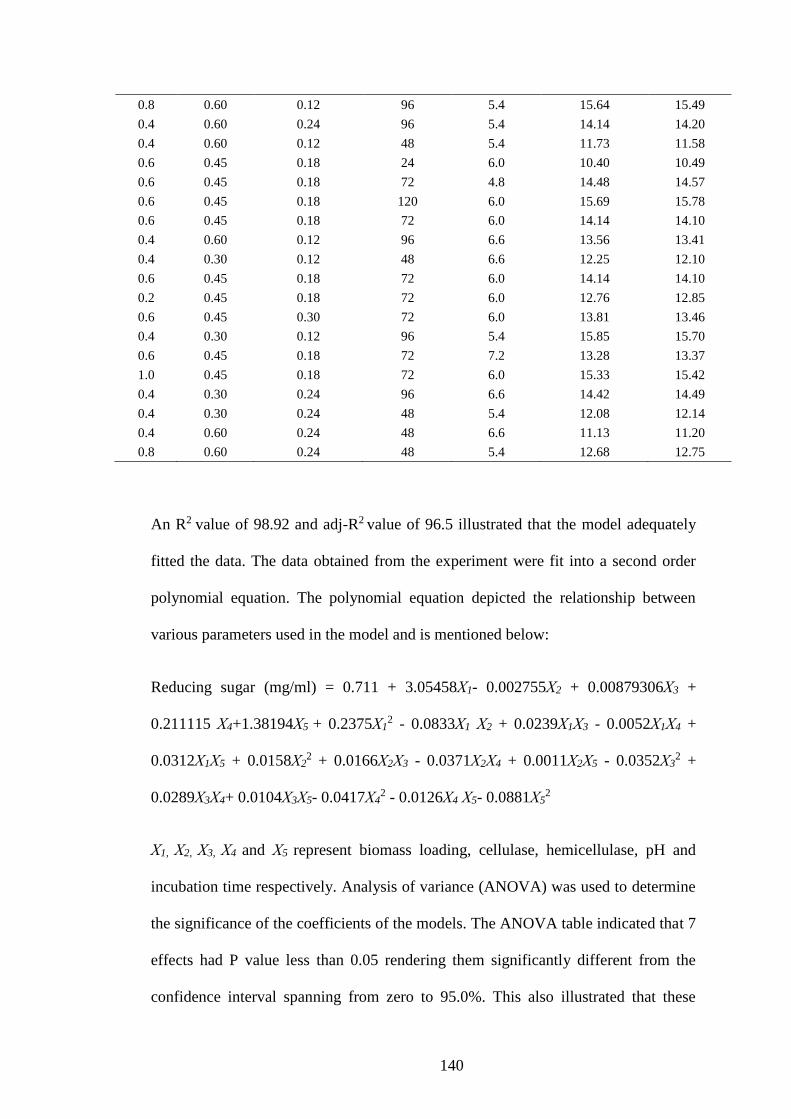
140
0.8 0.60 0.12 96 5.4 15.64 15.49
0.4 0.60 0.24 96 5.4 14.14 14.20
0.4 0.60 0.12 48 5.4 11.73 11.58
0.6 0.45 0.18 24 6.0 10.40 10.49
0.6 0.45 0.18 72 4.8 14.48 14.57
0.6 0.45 0.18 120 6.0 15.69 15.78
0.6 0.45 0.18 72 6.0 14.14 14.10
0.4 0.60 0.12 96 6.6 13.56 13.41
0.4 0.30 0.12 48 6.6 12.25 12.10
0.6 0.45 0.18 72 6.0 14.14 14.10
0.2 0.45 0.18 72 6.0 12.76 12.85
0.6 0.45 0.30 72 6.0 13.81 13.46
0.4 0.30 0.12 96 5.4 15.85 15.70
0.6 0.45 0.18 72 7.2 13.28 13.37
1.0 0.45 0.18 72 6.0 15.33 15.42
0.4 0.30 0.24 96 6.6 14.42 14.49
0.4 0.30 0.24 48 5.4 12.08 12.14
0.4 0.60 0.24 48 6.6 11.13 11.20
0.8 0.60 0.24 48 5.4 12.68 12.75
An R2 value of 98.92 and adj-R2 value of 96.5 illustrated that the model adequately
fitted the data. The data obtained from the experiment were fit into a second order
polynomial equation. The polynomial equation depicted the relationship between
various parameters used in the model and is mentioned below:
Reducing sugar (mg/ml) = 0.711 + 3.05458Χ1- 0.002755Χ2 + 0.00879306Χ3 +
0.211115 Χ4+1.38194Χ5 + 0.2375Χ12 - 0.0833Χ1 Χ2 + 0.0239Χ1Χ3 - 0.0052Χ1Χ4 +
0.0312Χ1Χ5 + 0.0158Χ22 + 0.0166Χ2Χ3 - 0.0371Χ2Χ4 + 0.0011Χ2Χ5 - 0.0352Χ3
2 +
0.0289Χ3Χ4+ 0.0104Χ3Χ5- 0.0417Χ42 - 0.0126Χ4 Χ5- 0.0881Χ5
2
Χ1, Χ2, Χ3, Χ4 and Χ5 represent biomass loading, cellulase, hemicellulase, pH and
incubation time respectively. Analysis of variance (ANOVA) was used to determine
the significance of the coefficients of the models. The ANOVA table indicated that 7
effects had P value less than 0.05 rendering them significantly different from the
confidence interval spanning from zero to 95.0%. This also illustrated that these
141
factors had considerable influence on the reducing sugar yield. All the linear
coefficients were found to have a positive effect on the reducing sugar yield. However,
positive significant interaction effects on reducing sugar release were exhibited only
by biomass loading and time.
Three-dimensional response plots were generated to understand the interactions
between different variables as well as to determine the optimal level of each variable
for maximum response (Fig. 6.1). This gave further insights on the interaction between
the five factors tested. The contour plots were indicative of significant interaction
between each parameter considered in this study. The highest point on the three-
dimensional plots represents the optimum conditions for maximum reducing sugar
release. Accordingly, a maximum reducing yield was observed with high biomass
loading (1g/10 ml), cellulase (158.76 μl/10ml), hemicellulase (153.3 μl /10ml), pH
(5.4) and an incubation time (120h). The model predicted the maximum sugar yield to
be 19.42 mg/ml when using the optimised parameters for enzymatic hydrolysis.
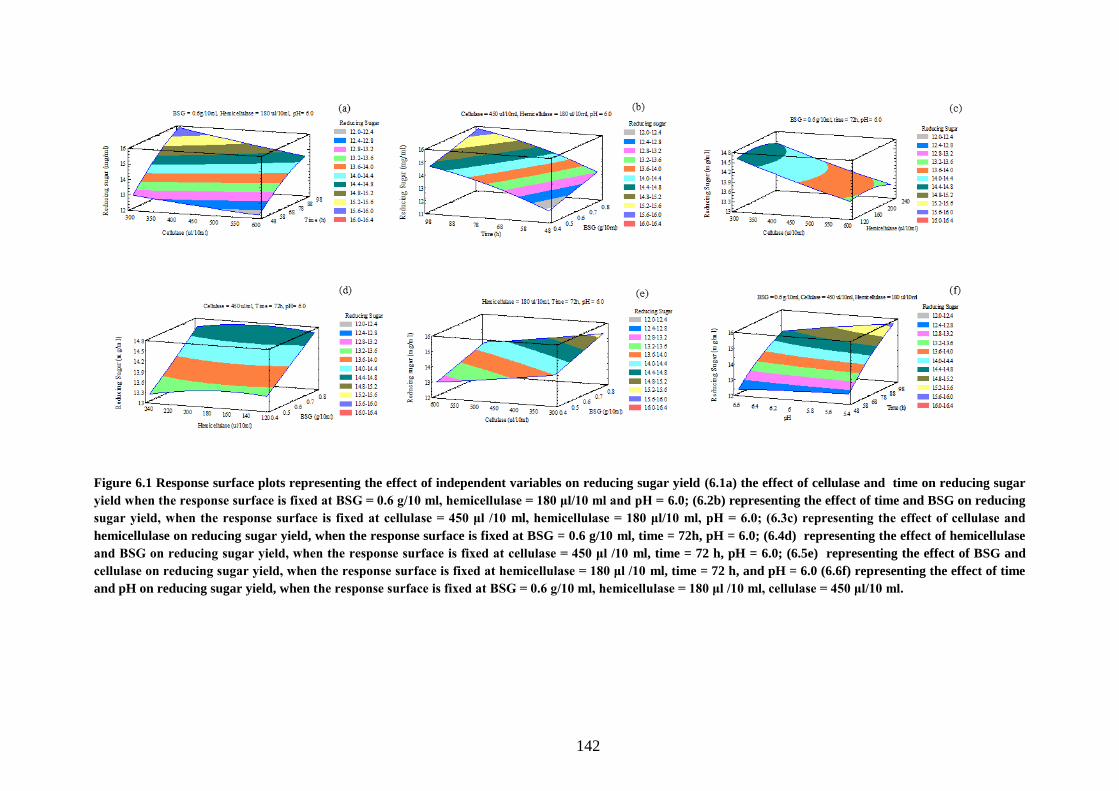
142
Figure 6.1 Response surface plots representing the effect of independent variables on reducing sugar yield (6.1a) the effect of cellulase and time on reducing sugar
yield when the response surface is fixed at BSG = 0.6 g/10 ml, hemicellulase = 180 μl/10 ml and pH = 6.0; (6.2b) representing the effect of time and BSG on reducing
sugar yield, when the response surface is fixed at cellulase = 450 μl /10 ml, hemicellulase = 180 μl/10 ml, pH = 6.0; (6.3c) representing the effect of cellulase and
hemicellulase on reducing sugar yield, when the response surface is fixed at BSG = 0.6 g/10 ml, time = 72h, pH = 6.0; (6.4d) representing the effect of hemicellulase
and BSG on reducing sugar yield, when the response surface is fixed at cellulase = 450 μl /10 ml, time = 72 h, pH = 6.0; (6.5e) representing the effect of BSG and
cellulase on reducing sugar yield, when the response surface is fixed at hemicellulase = 180 μl /10 ml, time = 72 h, and pH = 6.0 (6.6f) representing the effect of time
and pH on reducing sugar yield, when the response surface is fixed at BSG = 0.6 g/10 ml, hemicellulase = 180 μl /10 ml, cellulase = 450 μl/10 ml.
143
A reducing sugar concentration of 18.61 ± 0.5 mg/ml confirmed that the model was
valid for the enzymatic hydrolysis of BSG due to little disparity (< 5%) between
predicted and observed values.
6.3.2 Influence of pretreatments on composition of BSG and reducing sugar
yield
Pretreatments breakdown lignocellulose creating disorder in an otherwise orderly
structure with or without the removal of inherent components. The effect of each
pretreatment varies according to its mode of action (for example: physical, chemical,
physico-chemical and biological) (Ravindran & Jaiswal, 2016a). The final chemical
composition of the biomass post pretreatment is an important factor that governs the
efficiency of enzymatic hydrolysis. For a lignocellulosic substrate to be effectively
used in a bioconversion process it is necessary to relatively expose cellulose fibres
along with possible removal of hemicellulose and lignin fractions. BSG was
comprised of 19.21g of cellulose (glucose), 26.94g of hemicellulose and 30.48g per
100g of dry biomass (Table 6.2). The values obtained were more or less similar to
composition of BSG described elsewhere. Any variation can be attributed to the source
of collection of BSG. The composition of BSG can vary with respect to the barley
variety, harvest time and mashing conditions (Forssell et al., 2008; Robertson et al.,
2010). The aim of this study was to increase the cellulose content there by facilitating
better recovery of reducing sugars on enzymatic hydrolysis. In this study BSG was
subjected to six different pretreatments which were of physical and chemical in nature.
After each pretreatment the biomass was subjected to chemical composition analysis.
Furthermore, all the pretreated samples were subjected to hydrolysis employing
polysaccharide hydrolysing enzymes and optimised parameters.
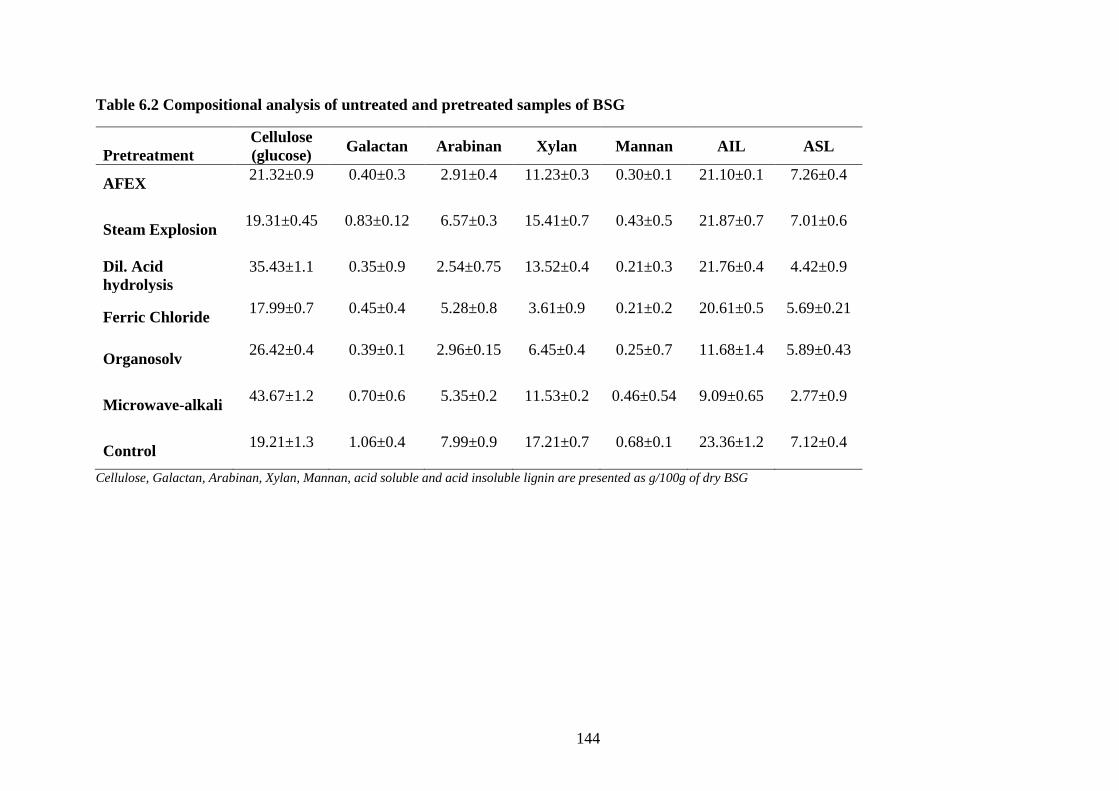
144
Table 6.2 Compositional analysis of untreated and pretreated samples of BSG
Pretreatment
Cellulose
(glucose) Galactan Arabinan Xylan Mannan AIL ASL
AFEX 21.32±0.9 0.40±0.3 2.91±0.4 11.23±0.3 0.30±0.1 21.10±0.1 7.26±0.4
Steam Explosion 19.31±0.45 0.83±0.12 6.57±0.3 15.41±0.7 0.43±0.5 21.87±0.7 7.01±0.6
Dil. Acid
hydrolysis
35.43±1.1 0.35±0.9 2.54±0.75 13.52±0.4 0.21±0.3 21.76±0.4 4.42±0.9
Ferric Chloride 17.99±0.7 0.45±0.4 5.28±0.8 3.61±0.9 0.21±0.2 20.61±0.5 5.69±0.21
Organosolv 26.42±0.4 0.39±0.1 2.96±0.15 6.45±0.4 0.25±0.7 11.68±1.4 5.89±0.43
Microwave-alkali 43.67±1.2 0.70±0.6 5.35±0.2 11.53±0.2 0.46±0.54 9.09±0.65 2.77±0.9
Control 19.21±1.3 1.06±0.4 7.99±0.9 17.21±0.7 0.68±0.1 23.36±1.2 7.12±0.4
Cellulose, Galactan, Arabinan, Xylan, Mannan, acid soluble and acid insoluble lignin are presented as g/100g of dry BSG
145
In general, all the pretreatments tested were effective in increasing the efficiency of
enzymatic hydrolysis. This was evident from the increase in reducing sugar release of
pretreated BSG samples (Fig. 6.2). Dilute acid hydrolysis was conducted for BSG
following different experimental settings. There was almost 50% loss in biomass post
pretreatment. The effect of acid concentration and reaction time on the effectiveness
of acid hydrolysis for BSG was studies by employing three acid concentrations (1%,
2% and 3%) and three different time settings (10, 20, and 30 min). The solids obtained
after pretreatment were subjected to enzymatic hydrolysis. Longer treatment times
resulted in reduction in reducing sugar yield (Fig. 6.3). Best results were achieved
when BSG was treated with 3% H2SO4 for 20 min (208.78 mg/g of BSG).
Compositional analysis of the biomass revealed that subjecting BSG to dilute acid
hydrolysis resulted in the increase in cellulose content (35.43g/100g of BSG) as well
as removal of considerable fractions of hemicellulose. This was evident in the
reduction in the xylan, galactan, mannan and arabinan content. Also, there was
obvious reduction in the acid soluble lignin fraction (4.42g/100g of BSG).
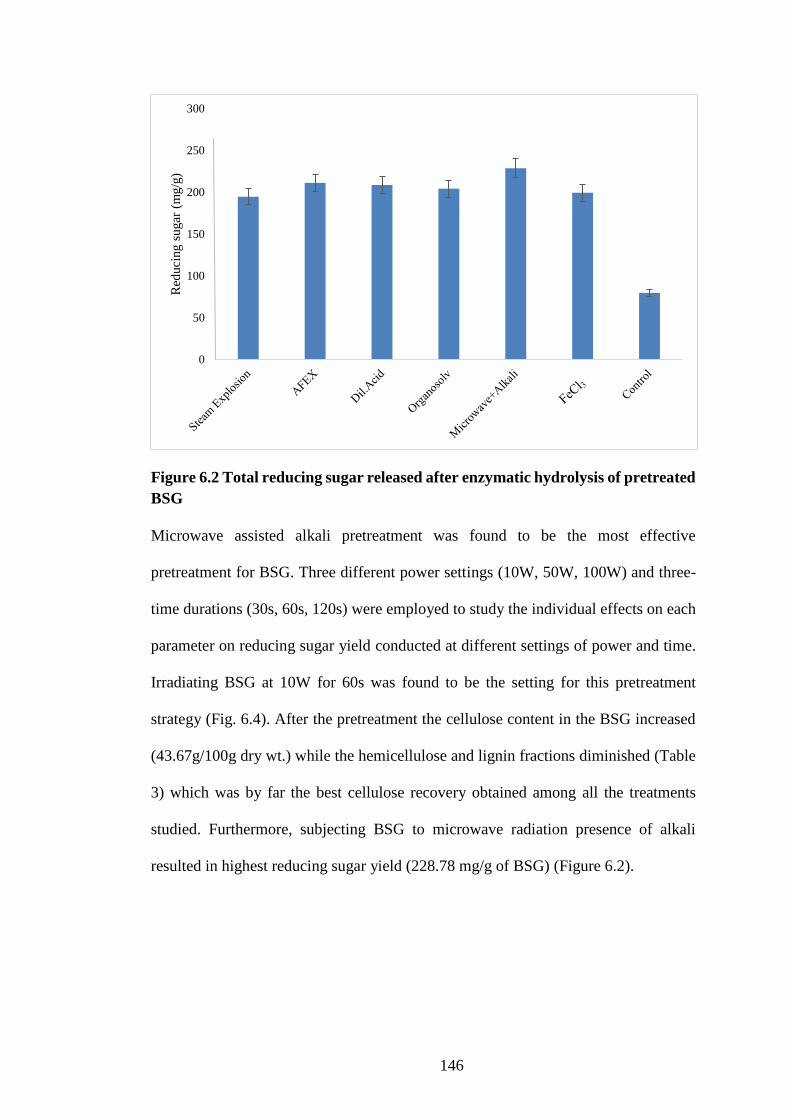
146
Figure 6.2 Total reducing sugar released after enzymatic hydrolysis of pretreated
BSG
Microwave assisted alkali pretreatment was found to be the most effective
pretreatment for BSG. Three different power settings (10W, 50W, 100W) and three-
time durations (30s, 60s, 120s) were employed to study the individual effects on each
parameter on reducing sugar yield conducted at different settings of power and time.
Irradiating BSG at 10W for 60s was found to be the setting for this pretreatment
strategy (Fig. 6.4). After the pretreatment the cellulose content in the BSG increased
(43.67g/100g dry wt.) while the hemicellulose and lignin fractions diminished (Table
3) which was by far the best cellulose recovery obtained among all the treatments
studied. Furthermore, subjecting BSG to microwave radiation presence of alkali
resulted in highest reducing sugar yield (228.78 mg/g of BSG) (Figure 6.2).
0
50
100
150
200
250
300
Red
uci
ng s
ugar
(m
g/g
)
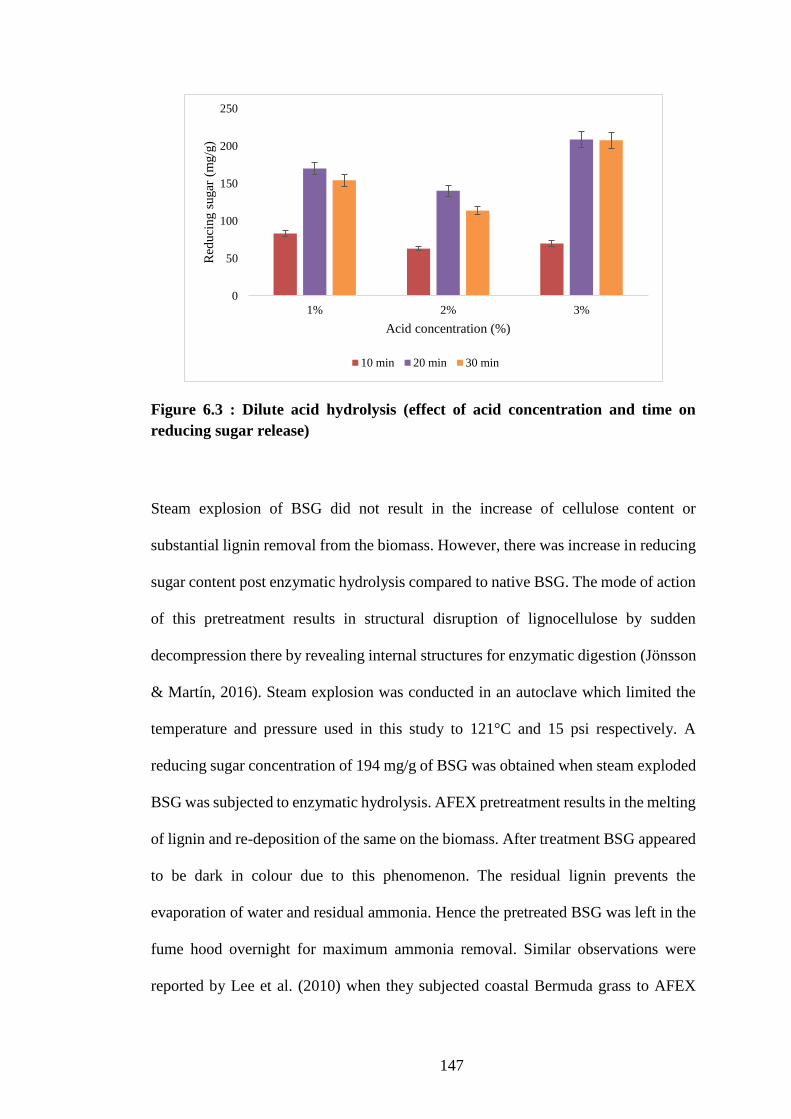
147
Figure 6.3 : Dilute acid hydrolysis (effect of acid concentration and time on
reducing sugar release)
Steam explosion of BSG did not result in the increase of cellulose content or
substantial lignin removal from the biomass. However, there was increase in reducing
sugar content post enzymatic hydrolysis compared to native BSG. The mode of action
of this pretreatment results in structural disruption of lignocellulose by sudden
decompression there by revealing internal structures for enzymatic digestion (Jönsson
& Martín, 2016). Steam explosion was conducted in an autoclave which limited the
temperature and pressure used in this study to 121°C and 15 psi respectively. A
reducing sugar concentration of 194 mg/g of BSG was obtained when steam exploded
BSG was subjected to enzymatic hydrolysis. AFEX pretreatment results in the melting
of lignin and re-deposition of the same on the biomass. After treatment BSG appeared
to be dark in colour due to this phenomenon. The residual lignin prevents the
evaporation of water and residual ammonia. Hence the pretreated BSG was left in the
fume hood overnight for maximum ammonia removal. Similar observations were
reported by Lee et al. (2010) when they subjected coastal Bermuda grass to AFEX
0
50
100
150
200
250
1% 2% 3%
Red
uci
ng s
ugar
(m
g/g
)
Acid concentration (%)
10 min 20 min 30 min
148
pretreatment. AFEX pretreatment resulted in a reducing sugar release of 211.2 mg/g
of BSG post enzymatic hydrolysis (Figure 6.2).
Organosolv pretreatment employs primary alcohols along with high temperatures are
a pretreatment measure for delignification of plant biomass. Methanol and ethanol are
employed for this purpose due to their low cost and availability. The advantage of this
pretreatment is that the solvent and the lignin dissolved by it can be recovered suing
simple distillation methods. (Zhao et al., 2009). The acid catalyst used in organosolv
process is corrosive in nature and can give rise to inhibitory compounds when reacting
with carbohydrate fractions in lignocellulose. However, in this case no inhibitory
compounds were formed. Furthermore, there was considerable delignification
(16.89g/100g of BSG) and increment in cellulose content (26.42g/100g of BSG)
(Table 6.2). Reducing sugar yields amounted to 204.3 mg/g of substrate when BSG
pretreated using organosolv strategy was subjected to enzymatic hydrolysis (Figure
6.2).
The effect of ferric chloride pretreatment is generally insignificant with respect to
delignification. This pretreatment results in the degradation of the polysaccharide
fraction into the pretreatment liquor (Chen et al., 2015). There was obvious loss in
weight of biomass after pretreatment. The cellulose content in the pretreated biomass
amounted to 17.99g/100g of BSG while the hemicellulose content was found to be
9.55g/100g of BSG. The total lignin content (26.3 mg/100g of BSG) remained the
same more or less compared to raw BSG (Table 6.2). 199.4 mg/g of reducing sugar
was obtained after enzymatic hydrolysis of BSG pretreated with ferric chloride (Figure
6.2).
149
6.3.3 Individual sugar, inhibitor and organic acid analysis
The hydrolysate obtained after the enzymatic hydrolysis experiment was analysed to
identify reducing sugars released from BSG. These sugars were identified to be
arabinose, xylose, mannose, galactose and glucose. Glucose and xylose were found to
be the most abundant monosaccharides in BSG making this type of food waste a good
feedstock for bioethanol production (Robertson et al., 2010). The liquor obtained after
each pretreatment were subjected to HPLC analysis to identify the presence of
individual sugars as well as inhibitory compounds such as furfural and hydroxymethyl
furfural. All the pretreatment tested resulted in the release of small of amounts of
different component sugars into the pretreatment liquor. A notable observation was
the formation of furfural when BSG was subjected to dilute acid pretreatment
(1.7g/100g of BSG). Furfural is formed as degradation product of xylose component
in lignocellulose. A study conducted by Djioleu and Carrier (2016) revealed that the
furfural formation from xylose is directly linked to the temperature applied during
dilute acid hydrolysis.
6.3.4 XRD and FTIR profiles of BSG
Fourier Transform Infrared spectroscopy (FTIR) is used to characterise the chemical
structure of lignocellulosic biomass by identifying the functional groups present in the
sample. Figure 6.4 represents the FTIR spectra for untreated and pretreated BSG
samples. The peak at 1739 cm-1 represents ester bonds or carboxylic linkages in lignin
and hemicellulose. This peak was evident in untreated BSG but diminished in
pretreated BSG samples according to the effectiveness of the pretreatment. The peak
1526 cm-1 represents C=C bonds in the aromatic ring of lignin. On the other hand, the
peak observed at 1247 cm-1 corresponds to aryl-alkyl ether bonds (C-O-C). While
these bands were present (albeit less prominent) in steam exploded, organosolv, ferric
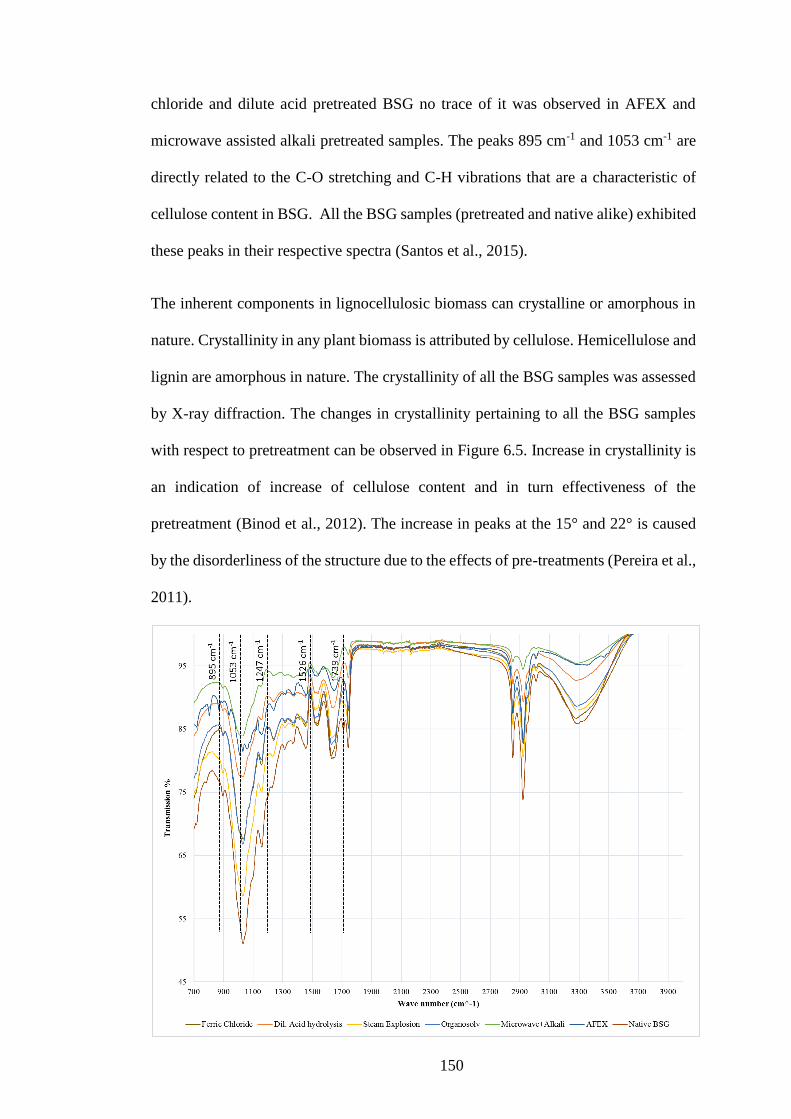
150
chloride and dilute acid pretreated BSG no trace of it was observed in AFEX and
microwave assisted alkali pretreated samples. The peaks 895 cm-1 and 1053 cm-1 are
directly related to the C-O stretching and C-H vibrations that are a characteristic of
cellulose content in BSG. All the BSG samples (pretreated and native alike) exhibited
these peaks in their respective spectra (Santos et al., 2015).
The inherent components in lignocellulosic biomass can crystalline or amorphous in
nature. Crystallinity in any plant biomass is attributed by cellulose. Hemicellulose and
lignin are amorphous in nature. The crystallinity of all the BSG samples was assessed
by X-ray diffraction. The changes in crystallinity pertaining to all the BSG samples
with respect to pretreatment can be observed in Figure 6.5. Increase in crystallinity is
an indication of increase of cellulose content and in turn effectiveness of the
pretreatment (Binod et al., 2012). The increase in peaks at the 15° and 22° is caused
by the disorderliness of the structure due to the effects of pre-treatments (Pereira et al.,
2011).
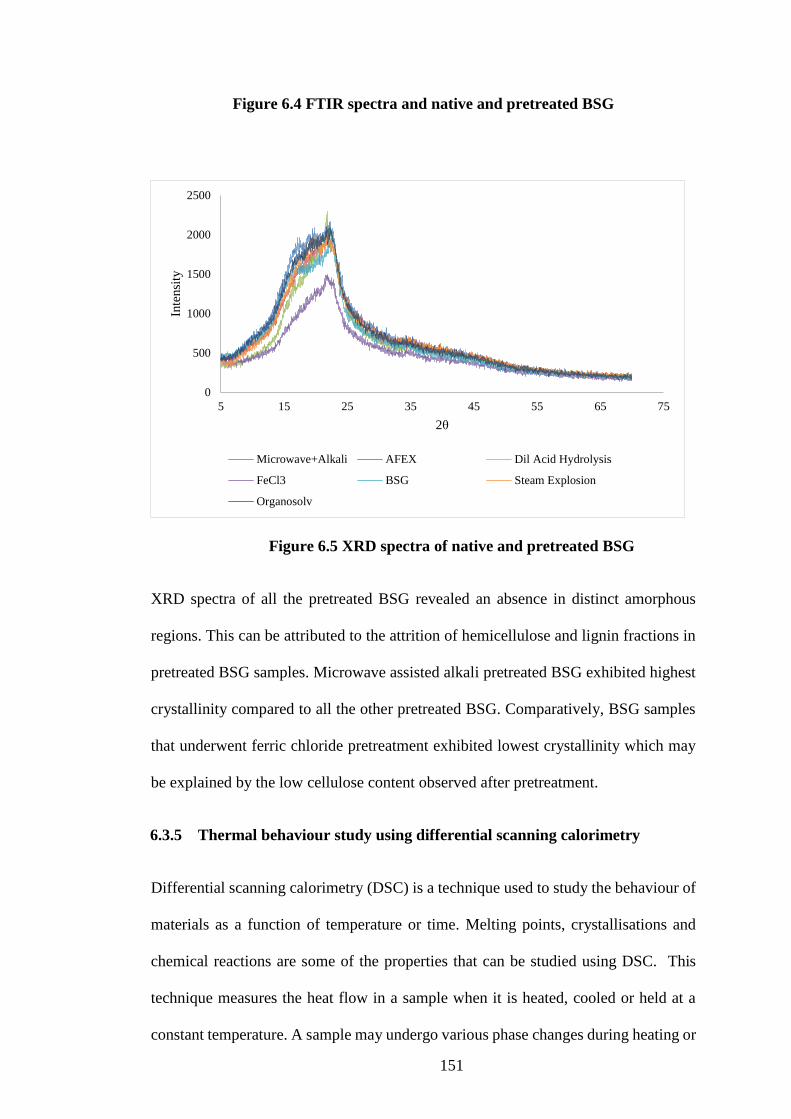
151
Figure 6.4 FTIR spectra and native and pretreated BSG
Figure 6.5 XRD spectra of native and pretreated BSG
XRD spectra of all the pretreated BSG revealed an absence in distinct amorphous
regions. This can be attributed to the attrition of hemicellulose and lignin fractions in
pretreated BSG samples. Microwave assisted alkali pretreated BSG exhibited highest
crystallinity compared to all the other pretreated BSG. Comparatively, BSG samples
that underwent ferric chloride pretreatment exhibited lowest crystallinity which may
be explained by the low cellulose content observed after pretreatment.
6.3.5 Thermal behaviour study using differential scanning calorimetry
Differential scanning calorimetry (DSC) is a technique used to study the behaviour of
materials as a function of temperature or time. Melting points, crystallisations and
chemical reactions are some of the properties that can be studied using DSC. This
technique measures the heat flow in a sample when it is heated, cooled or held at a
constant temperature. A sample may undergo various phase changes during heating or
0
500
1000
1500
2000
2500
5 15 25 35 45 55 65 75
Inte
nsi
ty
2θ
Microwave+Alkali AFEX Dil Acid Hydrolysis
FeCl3 BSG Steam Explosion
Organosolv
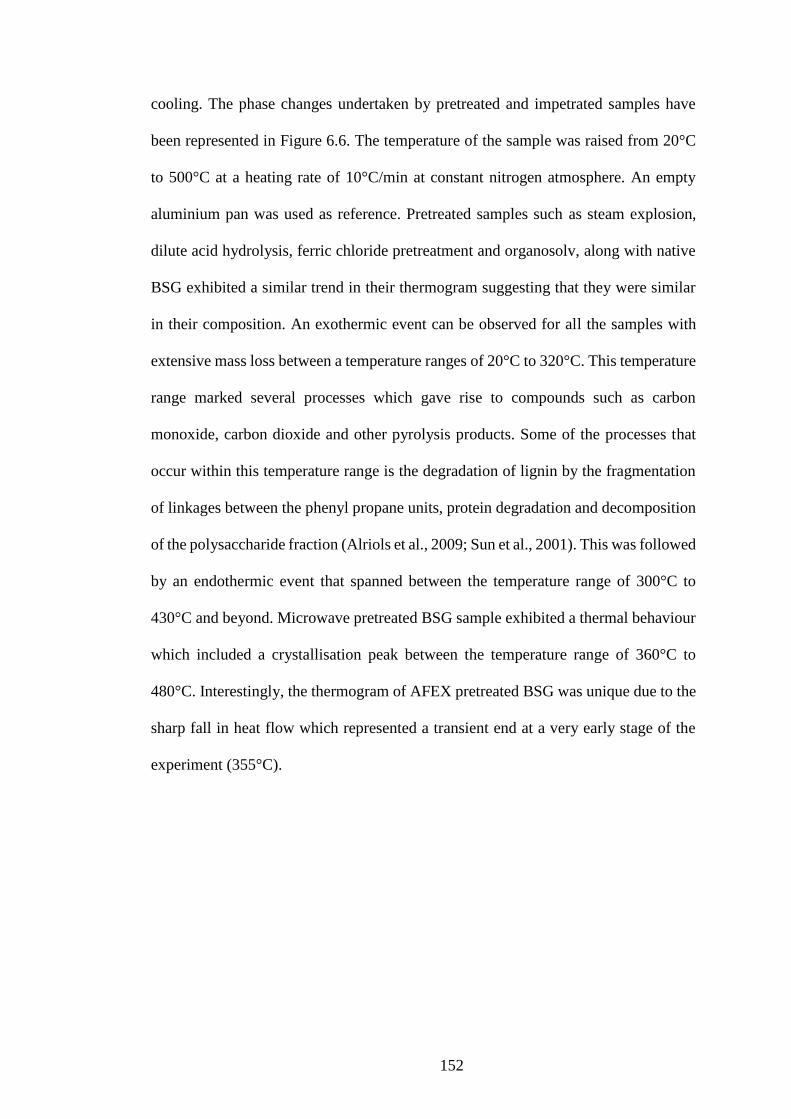
152
cooling. The phase changes undertaken by pretreated and impetrated samples have
been represented in Figure 6.6. The temperature of the sample was raised from 20°C
to 500°C at a heating rate of 10°C/min at constant nitrogen atmosphere. An empty
aluminium pan was used as reference. Pretreated samples such as steam explosion,
dilute acid hydrolysis, ferric chloride pretreatment and organosolv, along with native
BSG exhibited a similar trend in their thermogram suggesting that they were similar
in their composition. An exothermic event can be observed for all the samples with
extensive mass loss between a temperature ranges of 20°C to 320°C. This temperature
range marked several processes which gave rise to compounds such as carbon
monoxide, carbon dioxide and other pyrolysis products. Some of the processes that
occur within this temperature range is the degradation of lignin by the fragmentation
of linkages between the phenyl propane units, protein degradation and decomposition
of the polysaccharide fraction (Alriols et al., 2009; Sun et al., 2001). This was followed
by an endothermic event that spanned between the temperature range of 300°C to
430°C and beyond. Microwave pretreated BSG sample exhibited a thermal behaviour
which included a crystallisation peak between the temperature range of 360°C to
480°C. Interestingly, the thermogram of AFEX pretreated BSG was unique due to the
sharp fall in heat flow which represented a transient end at a very early stage of the
experiment (355°C).
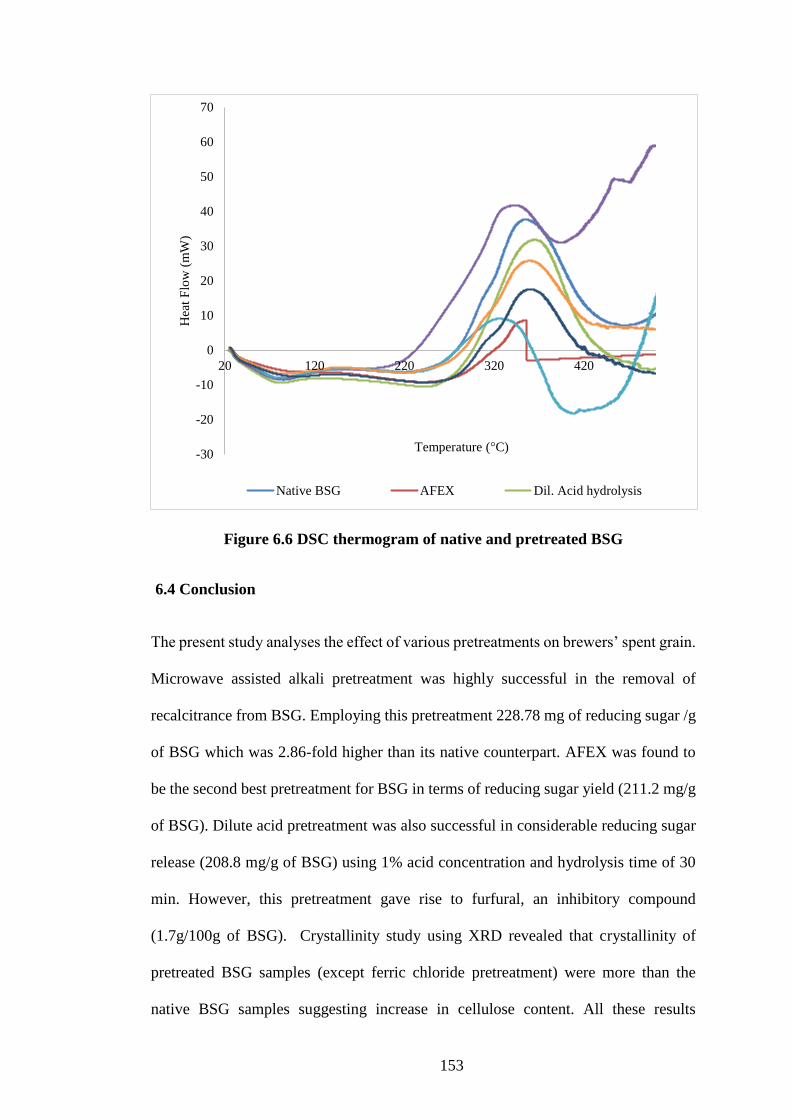
153
Figure 6.6 DSC thermogram of native and pretreated BSG
6.4 Conclusion
The present study analyses the effect of various pretreatments on brewers’ spent grain.
Microwave assisted alkali pretreatment was highly successful in the removal of
recalcitrance from BSG. Employing this pretreatment 228.78 mg of reducing sugar /g
of BSG which was 2.86-fold higher than its native counterpart. AFEX was found to
be the second best pretreatment for BSG in terms of reducing sugar yield (211.2 mg/g
of BSG). Dilute acid pretreatment was also successful in considerable reducing sugar
release (208.8 mg/g of BSG) using 1% acid concentration and hydrolysis time of 30
min. However, this pretreatment gave rise to furfural, an inhibitory compound
(1.7g/100g of BSG). Crystallinity study using XRD revealed that crystallinity of
pretreated BSG samples (except ferric chloride pretreatment) were more than the
native BSG samples suggesting increase in cellulose content. All these results
-30
-20
-10
0
10
20
30
40
50
60
70
20 120 220 320 420
Hea
t F
low
(m
W)
Temperature (°C)
Native BSG AFEX Dil. Acid hydrolysis
154
suggested that BSG which is an industrial by-product is with great potential as a
feedstock for the production of value added products.
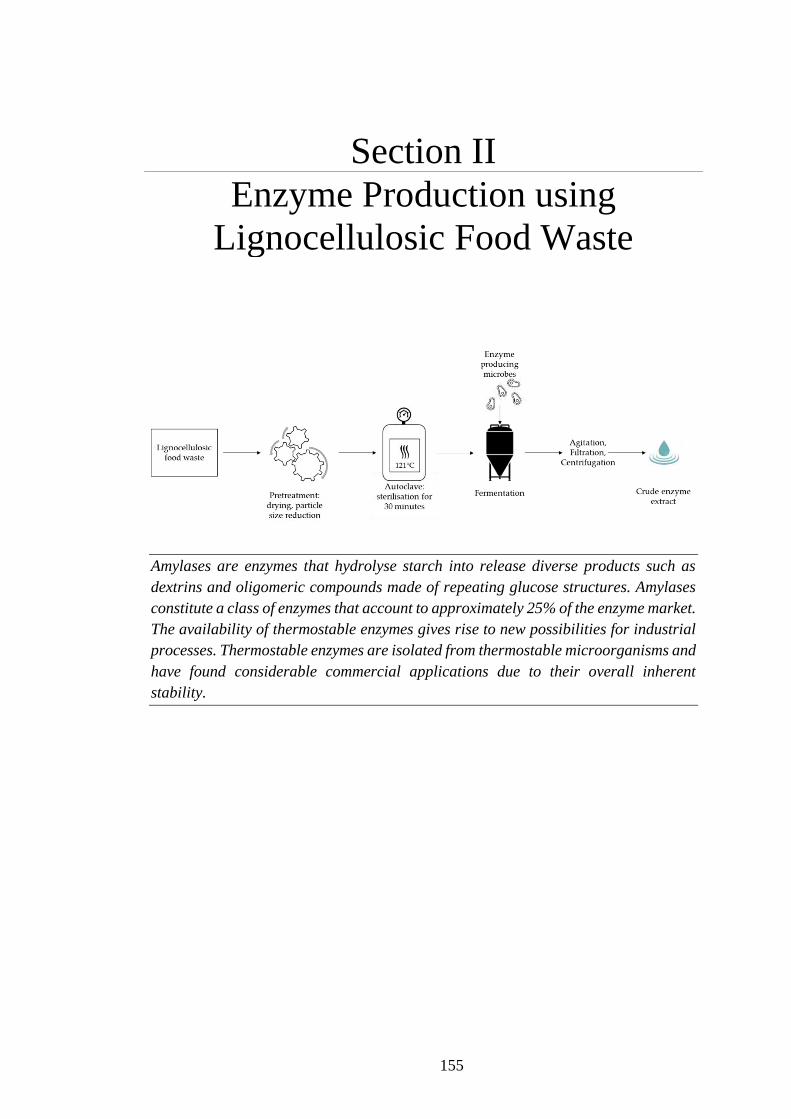
155
Section II
Enzyme Production using
Lignocellulosic Food Waste
Amylases are enzymes that hydrolyse starch into release diverse products such as
dextrins and oligomeric compounds made of repeating glucose structures. Amylases
constitute a class of enzymes that account to approximately 25% of the enzyme market.
The availability of thermostable enzymes gives rise to new possibilities for industrial
processes. Thermostable enzymes are isolated from thermostable microorganisms and
have found considerable commercial applications due to their overall inherent
stability.
156
Chapter 7
Evaluation of brewer’s spent grain hydrolysate as a
substrate for production of thermostable α-amylase
produced by Bacillus stearothermophilus
Brewer’s spent grain (BSG) is a by-product of the beer industry. Being highly
nutritious in nature and it can harbour and support microbial growth. The
current scenario where BSG is produced in large quantities call for novel
technologies for its efficient valorisation. In this study, BSG was hydrolysed using
cellulolytic enzymes and used as a growth medium supplement for cultivation of
the thermophilic bacterium, Bacillus stearothermophilus in the production of α-
amylase. A central composite design involving five parameters and four levels
viz. starch, peptone, KCl.4H2O, and MgSO4 along with BSG hydrolysate was
used to derive the optimal media composition. The fermentation was conducted
using shake flasks for 36h at a temperature of 50°C and pH 7.0 at 220 rpm.
Optimisation trials revealed that maximal amylase production (198.09 U/ml)
occurred with a medium composition of starch (0.2%w/v), peptone (0.2% w/v),
KCl.4 H2O (0.02% w/v), MgSO4.7 H2O (0.01% w/v) and hydrolysate (0.22% v/v).
A 1.3-fold increase in amylase activity was obtained following novel media
composition. All the factors considered in the study were found to be significant.
The enzyme was purified by three step purification strategy, characterised and
tested for anti-biofilm activity.
Work described in this chapter has been submitted as a research article:
Evaluation of brewer's spent grain hydrolysate as a substrate for production of thermostable
a-amylase by Bacillus stearothermophilus (2018). Bioresource Technology Reports 5, 141-
149.
7. Evaluation of brewer’s spent grain hydrolysate as a substrate for
production of thermostable α-amylase produced by Bacillus
stearothermophilus
157
7.1 Introduction
Brewer’s spent grain (BSG) is a by-product of the brewery industry. It is highly
nutritious and rich in carbohydrates, protein, lignin, fibre and lipids. Every hectolitre
of beer can result in 20 kg of BSG being produced accounting to the ~85% of the total
wastes generated (Łaba et al., 2017). In Ireland, 760 million litres of beer are produced
annually which may lead to the accumulation of approx. 152,000 tonnes of BSG
(Association, 2016). BSG constitutes of 20-30% dry matter and is susceptible to
microbial spoilage due to its high nutritional content. Since BSG is high in protein,
fibre and the presence of trace elements such as silicon, magnesium, phosphorus and
sulphur it finds wide applications as animal feed (Gregori et al., 2008). However, this
only accounts to a small fraction of the total BSG produced making it a huge
environmental burden on the brewery industry. This calls for innovative, sustainable
and commercially attractive processes for its efficient valorisation.
The race to develop sustainable technology over the past several decades has led to
the utilisation of agro-based industry wastes such as BSG for its exploitation or
bioconversion into commercially important compounds (Ravindran & Jaiswal, 2016).
The nutritious content and food grade quality of BSG makes it a valuable resource for
the development of relevant biotechnological processes (Ravindran et al., 2018). Since
BSG is abundantly available, numerous technologies have been developed to extract
value-added compounds BSG which belong to the nature of carbohydrates, proteins
or lipids. Due to its diverse composition, BSG perfectly fits into the concept of
biorefinery where multiple processes of chemical, enzymatic and biotechnological in
nature can be incorporated into a single production facility (Ravindran & Jaiswal,
2016).
158
Due to the inherent chemical nature of BSG, it supports microbial growth and has thus
been widely used for the production of enzymes. BSG has extensively been applied as
a potential raw material for the production of enzymes such as amylases,
amyloglucosidases, cellulases and hemicellulases. Most studies focus on the
utilisation of mycelial fungi for such applications. Among bacteria, Bacillus sp. has
gained considerable interest due to its ability to produce carbohydrate degrading
enzymes that are of industrial importance. Some of these species such as B. subtilis,
B. amyloliquefaciens, B. cereus, B. licheniformis and B. stearothermophilus are
important due to their ability to produce α and β amylases (Chen et al., 2015; Prajapati
et al., 2015; Vaikundamoorthy et al., 2018). Amylases derived from Bacillus sp. find
wide applications in the industry ranging from the production of fructose and glucose
syrup to bakery, detergents, textile and fuel ethanol production (Souza, 2010).
Amylases hold 30% of the global enzyme market share, having largely replaced
chemical hydrolysis of starch (Lal et al., 2017). Many BSG and BSG-based products
have been utilised as a media component for the production of α-amylases (Hashemi
et al., 2011).
An integral component of demonstrating the economic feasibility of adopting BSG for
fermentation processes is the identification of novel markets for enzyme products that
can provide a sustainable return on investment. Biofilms are formed by prokaryotic
microorganisms capable of producing exopolysaccharides (EPS) around the cell.
Many biofilm-producing organisms are pathogenic in nature, including Vibrio
cholerae, multi-drug resistant Staphylococcus aureus, and Pseudomonas aeruginosa
(Costerton et al., 1999; Hall-Stoodley & Stoodley, 2005; Mihailescu et al., 2014).
Biofilms produced by such microbes can cause disruption and reduction in efficiency
of industrial processes. Furthermore, these pathogenic strains are responsible for 10-
20% of all the hospital acquired infections (Jamal et al., 2018). Conventional
159
preventive measures against biofilm producers include chemical biosurfactants,
surface modifications and natural substances such as honey and oils. (Sadekuzzaman
et al., 2015). Exopolysaccharides produced by these microbes safeguard them from
attacks by antibiotics and other antimicrobial agents. However, recent studies have
shown enzymes as a promising technology in the prevention of EPS production and
biofilm formation. Some of the enzymes studied for this purpose include lysozyme,
proteinase K, trypsin and amylase (Shukla & Rao, 2013). These enzymes have been
studied individually and as cocktails as a deterrent for biofilm production (Kalpana et
al., 2012).
This study investigates the applications of BSG hydrolysate as a potential media
component for the production of a thermostable α-amylase by B. stearothermophilus.
The growth medium composition for amylase production was optimised by the
application of response surface methodology. This was followed by purification of the
enzyme via a three-stage strategy. The enzyme was then characterised to determine
the optimum pH and temperature for activity. Finally, initial proof-of-principle was
shown for the use of the α-amylase from B. stearothermophilus as an anti-biofilm
agent using multiple bacterial strains of medical significance.
7.2 Methodology
7.2.1 Microorganism
Four Bacillus strains viz. B. subtilis, B. cereus, B. megaterium and B.
stearothermophillus were revived from the microbiology repository maintained in the
School of Food Science and environmental health, Dublin Institute of Technology,
Ireland. The strains were revived in nutrient broth media at 37°C and 50°C (for B.
stearothermophilus) for 18h at 150 rpm. The cultures were regularly subcultured and
maintained at 4°C.
160
7.2.2 Screening for amylase producing Bacillus strains
Four strains viz. Bacillus subtilis, Bacillus cereus, Bacillus megaterium and Bacillus
stearothermophilus were cultured on starch agar plates which contained 3 mg/ml meat
extract, 5 mg/ml peptic digest, 2 mg/ml starch and 15 mg/ml of agar. The final pH of
the media was adjusted to 7.2. The plates were incubated at optimal growth conditions
for each strain (37 ºC for B. subtilis and B. megaterium, 30 ºC for B. cereus and 50 ºC
for B. stearothermophilus). After incubating the plates for 24h the plates were flooded
with Gram’s iodine and the plates with zones of clearance were identified and
maintained for amylase production (Sethi et al. 2013).
7.2.3 Preparation of M9 media and amylase production
M9 media was prepared by adding 5.64 g of the powder in 100 ml distilled water. The
solution was sterilised and stored. To prepare M9 minimum salts media the 20 ml of
the above prepared solution was diluted with sterile distilled water to make up a
volume of 100 ml. 2 ml of 20% starch solution was aseptically added into the media
along with 0.2 ml of sterile 1.0 M MgSO4 solution and if desired 0.1 ml sterile 1.0 M
CaCl2 solution. The flasks were autoclaved and cooled, after which they were
inoculated with 1% inoculum of 18h old Bacillus sp. cultures. The flasks were
incubated at 37 ºC for B. subtilis and B. megaterium, at 30ºC for B. cereus and at 50ºC
for B. stearothermophilus. The pH was maintained at 6 for all cultures. Samples were
drawn at different intervals (0h, 12h, 24h, 30h, 36h and 48h). The growth profile of
each strain was created at 600 nm using UV-visible spectrophotometry. The broth
containing extracellular proteins was centrifuged at 10000 rpm for 10 min at 4ºC to
remove the residual solids and were analysed for amylase activity (Song and Wei
2010).
161
7.2.4 Amylase production using starch, peptone and meat extract
Media for enzyme production comprised of 0.2% starch, 0.5% peptone, and 0.3% meat
extract (SPM). The medium (50 ml) was inoculated with 1 ml of inoculum of 18h old
Bacillus sp. cultures and incubated at different temperatures with respect to each
Bacillus strain as mentioned in the above section. Samples were harvested at different
intervals (as mentioned earlier). After amylase production the culture broth was
centrifuged at 10000 rpm for 10 min at 4 ºC and stored for further analysis. All
analyses were conducted within 48h.
7.2.5 Lipid extraction from BSG
The total lipid content in BSG was reduced using a modification of the protocol
devised by Niemi et al. (2012). Briefly, 10g of BSG was weighed, dispensed into a
cellulose thimble and stoppered with cellulose wool. A Soxhlet apparatus was set up
with 100 ml of acetone in a round bottom flask and anti-bumping granules added. The
extraction was conducted in reflux cycles for 5h. The lipid-free BSG was then dried
and stored for further experiments.
7.2.6 Microorganism and amylase production
Bacillus stearothermophilus LZT020 strain was supplied by the microbiology
repository at the School of Food Science and Environmental Health, Dublin Institute
of Technology. For seed culture, frozen glycerol stock maintained at –80°C was used
to inoculate liquid medium containing (in g/l) peptone (3.0), yeast extract (1.5), beef
extract (1.5) and NaCl (2.5). Cultures were maintained in 100 ml Erlenmeyer flasks
maintaining a working volume of 10%. The pH of the medium was adjusted to 7.0.
The culture was grown in at 50°C for 18h maintaining an agitation rate of 200 rpm.
162
7.2.7 Analytical methods
7.2.7.1 Amylase assay
For performing the amylase assay, 50 μl of soluble starch (1% (w/v) solution made in
phosphate buffer (50mM, pH 6) was incubated with analyte samples at 50°C for 5
min. The reaction was stopped by adding 3, 5-dinitrosalicylic acid reagent. Sample
absorbance was measured at 546 nm (Miller, 1959). Glucose was used as standard.
One unit of enzyme was defined as the amount of enzyme required to release 1μmol
of reducing sugar equivalent from soluble starch in one min under assay conditions.
Specific activity was expressed in U/mg of protein. Protein estimation was carried out
by the Bradford method using BSA as standard (Bradford, 1976).
7.2.7.2 Effect of pH and temperature on amylase activity
Activity of alpha amylase was determined at different temperature ranging from 0 °C
to 100 °C with the interval of 10 °C. Substrate was incubated for 3 min at desired
temperature ranging from 0 °C to 100 °C. Maximum activity obtained was taken as
100% and accordingly percentage relative activity was calculated. Percentage relative
activity was plotted against respective temperature. Alpha amylase is relatively stable
within a range of pH 4-9 under standard assay condition. Sodium acetate buffer was
used for determination of optimum pH (4-9). Relative activity determined considering
maximum enzyme activity as 100%.
7.2.8 Pretreatment and enzyme hydrolysis of BSG
BSG was first subjected to microwave assisted alkali pretreatment and subsequently
hydrolysed following the procedure mentioned in section 6.2.1.6 and 3.5 respectively.
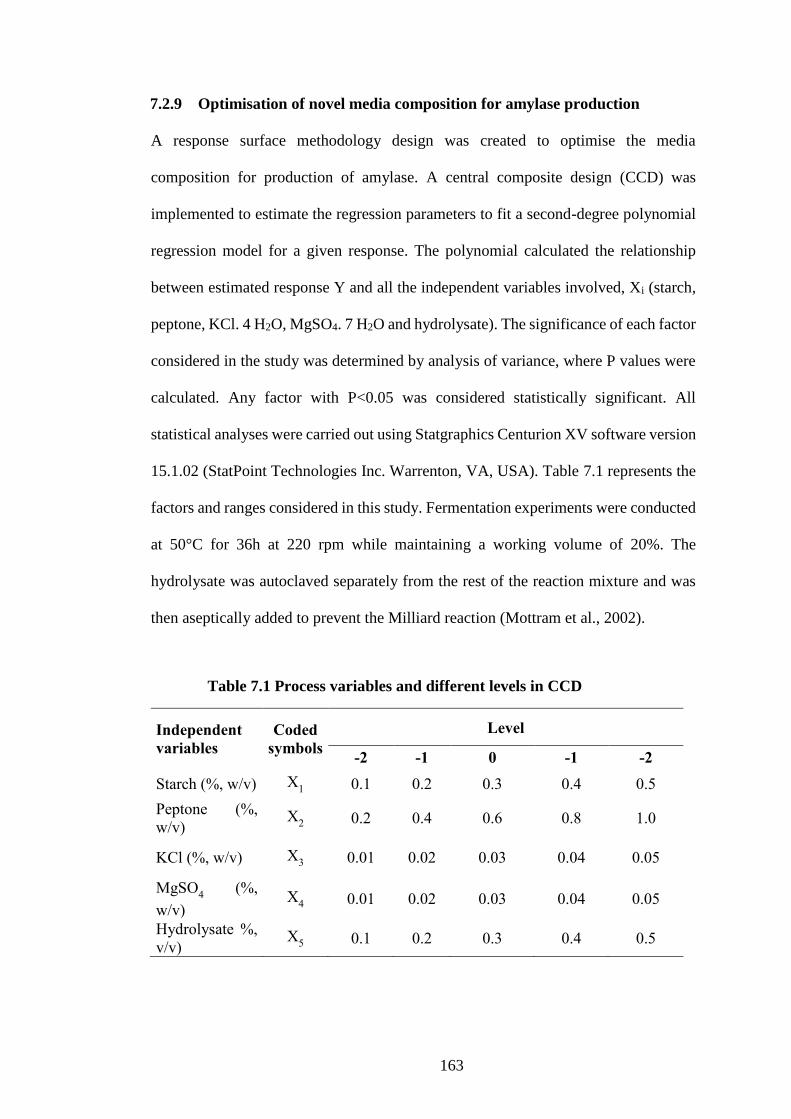
163
7.2.9 Optimisation of novel media composition for amylase production
A response surface methodology design was created to optimise the media
composition for production of amylase. A central composite design (CCD) was
implemented to estimate the regression parameters to fit a second-degree polynomial
regression model for a given response. The polynomial calculated the relationship
between estimated response Y and all the independent variables involved, Xi (starch,
peptone, KCl. 4 H2O, MgSO4. 7 H2O and hydrolysate). The significance of each factor
considered in the study was determined by analysis of variance, where P values were
calculated. Any factor with P<0.05 was considered statistically significant. All
statistical analyses were carried out using Statgraphics Centurion XV software version
15.1.02 (StatPoint Technologies Inc. Warrenton, VA, USA). Table 7.1 represents the
factors and ranges considered in this study. Fermentation experiments were conducted
at 50°C for 36h at 220 rpm while maintaining a working volume of 20%. The
hydrolysate was autoclaved separately from the rest of the reaction mixture and was
then aseptically added to prevent the Milliard reaction (Mottram et al., 2002).
Table 7.1 Process variables and different levels in CCD
Independent
variables
Coded
symbols
Level
-2 -1 0 -1 -2
Starch (%, w/v) X1 0.1 0.2 0.3 0.4 0.5
Peptone (%,
w/v) X
2 0.2 0.4 0.6 0.8 1.0
KCl (%, w/v) X3 0.01 0.02 0.03 0.04 0.05
MgSO4 (%,
w/v) X
4 0.01 0.02 0.03 0.04 0.05
Hydrolysate %,
v/v) X
5 0.1 0.2 0.3 0.4 0.5
164
7.2.10 Control Experiment
Control experiments for amylase production by B. stearothermophilus were set up
according to protocols devised by Al-Qodah (2006). Fermentation was conducted in
250 ml Erlenmeyer flask maintaining a reaction volume of 20%. The flasks were
incubated at 55°C in a shaking incubator rotating at 220 rpm for 36h. The culture
supernatant was collected by centrifugation at 12,000 rpm for 30 mins at 4°C and used
for further analysis.
7.2.11 Dry cell weight analysis
The effect of fermentation medium supplemented by BSG hydrolysate on the
production of biomass was studied by conducting dry cell weight analysis. Briefly,
temperature-resistant plastic universal bottles (20 ml capacity) was dried over in a hot
air oven at 105ºC with the lids separately retained. These were then carefully removed
from the oven and placed in a desiccator jar. Once the universals were cooled they
were weighed and the weights were recorded. Next, 15 ml aliquot of each test and
control fermentation cultures were decanted into the pre-weighed universal. The
universals were then centrifuged at 15,000 rpm for 30 minutes at 4ºC to pellet the cells.
The supernatant was carefully transferred into sterile bottles and stored for further
experiments. Meanwhile, the universals with cell pellets were dried at 105ºC in a hot
air oven for 24 hours and then placed in a desiccator jar. Finally, each universal was
re-weighed, and the dry cell weight was calculated in mg/ml.
7.2.12 Purification of α-amylase
Cell removal was performed by centrifugation at 15,000 rpm for 30 min at 4°C. The
cell free supernatant was then subjected to precipitation using ammonium sulphate
(60% (w/v)). The precipitate was re-suspended in 10 ml of 0.1 M sodium phosphate
165
buffer (pH 7.0). This was followed by salt removal-buffer exchange by diafiltration
(10 kDa MWCO, Amicon Corporation, Lexington, Mass., U.S.A.). Anion exchange
chromatography was performed following the protocol devised by Chakraborty et al.
(2000) with slight modifications. A DEAE-Sepharose Fast Flow column (2.6 cm × 50
cm) was used for this purpose. The column was equilibrated with 20 mM Tris-HCl
buffer (pH 8.0) before loading the sample. Elution was performed using 20 mM tris-
HCl containing 0.5 M NaCl (pH 8.0) and 2 ml fractions were collected at 15 ml/h and
absorbance was measured at 280 nm. The active fractions were pooled and
concentrated by ultrafiltration (10 kDa cut-off).
7.2.13 Screening of pathogens for biofilm production capacity
Pathogenic bacterial strains Staphylococcus aureus NCTC 1803, S. aureus ATCC
25923 and Pseudomonas aerogenosa ATCC 27853 were obtained from the DIT
microbiology repository. The strains were revived by growing them over night in LB
broth at 37°C for 18h. Each strain was then plated on brain-heart infusion agar
supplemented with 3.6% sucrose and 0.08% Congo red dye. The plates were incubated
for 48h at 37°C following which they were inspected for biofilm formation.
7.2.14 Biofilm formation assay
The effect of thermostable α-amylase on the growth of pathogenic organisms and its
capacity to inhibit biofilm formation were determined by UV-VIS spectrophotometric
assays. The assay was conducted following the protocol reported by Vaikundamoorthy
et al. (2018) with slight modifications. The crude α-amylase enzymes were taken in
different volumes ranging from 50, 100, 150, 200 and 250 μl/ml were suspended in
LB broth (pH 7.0) containing bacterial suspension at 106 CFU/ml. Meanwhile, the
efficacy of commercial amylase as an antibiofilm agent was also assessed. Different
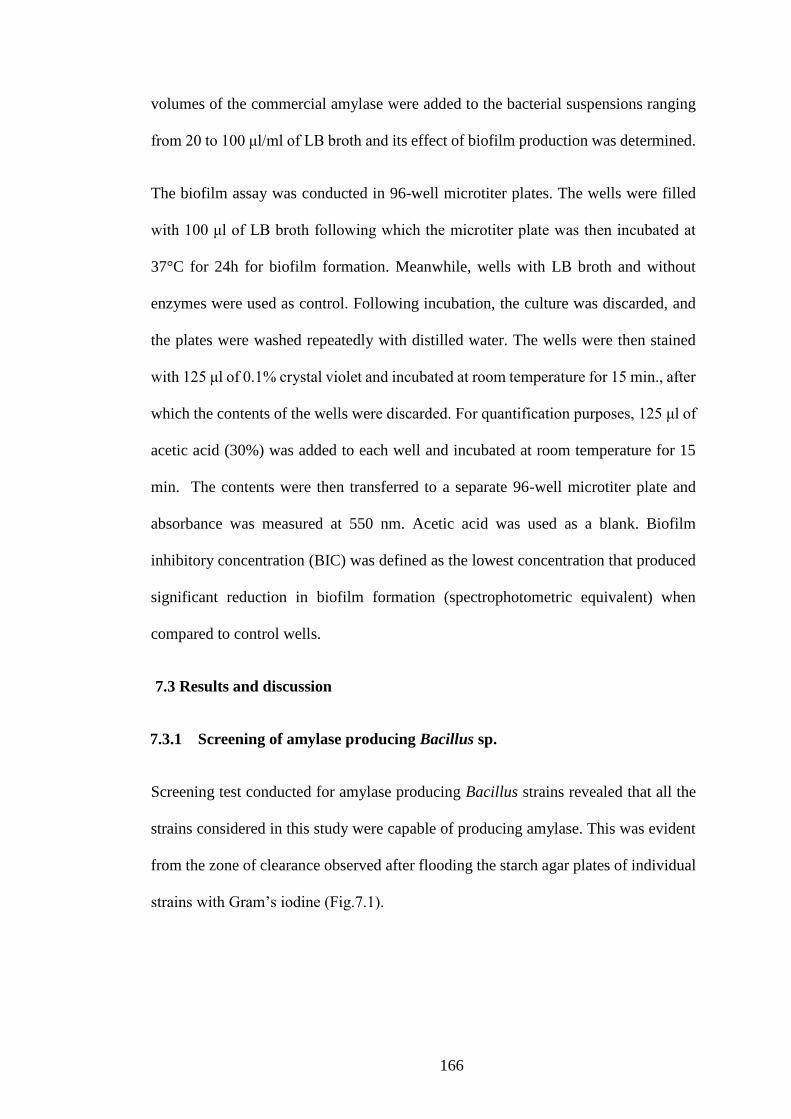
166
volumes of the commercial amylase were added to the bacterial suspensions ranging
from 20 to 100 μl/ml of LB broth and its effect of biofilm production was determined.
The biofilm assay was conducted in 96-well microtiter plates. The wells were filled
with 100 μl of LB broth following which the microtiter plate was then incubated at
37°C for 24h for biofilm formation. Meanwhile, wells with LB broth and without
enzymes were used as control. Following incubation, the culture was discarded, and
the plates were washed repeatedly with distilled water. The wells were then stained
with 125 μl of 0.1% crystal violet and incubated at room temperature for 15 min., after
which the contents of the wells were discarded. For quantification purposes, 125 μl of
acetic acid (30%) was added to each well and incubated at room temperature for 15
min. The contents were then transferred to a separate 96-well microtiter plate and
absorbance was measured at 550 nm. Acetic acid was used as a blank. Biofilm
inhibitory concentration (BIC) was defined as the lowest concentration that produced
significant reduction in biofilm formation (spectrophotometric equivalent) when
compared to control wells.
7.3 Results and discussion
7.3.1 Screening of amylase producing Bacillus sp.
Screening test conducted for amylase producing Bacillus strains revealed that all the
strains considered in this study were capable of producing amylase. This was evident
from the zone of clearance observed after flooding the starch agar plates of individual
strains with Gram’s iodine (Fig.7.1).
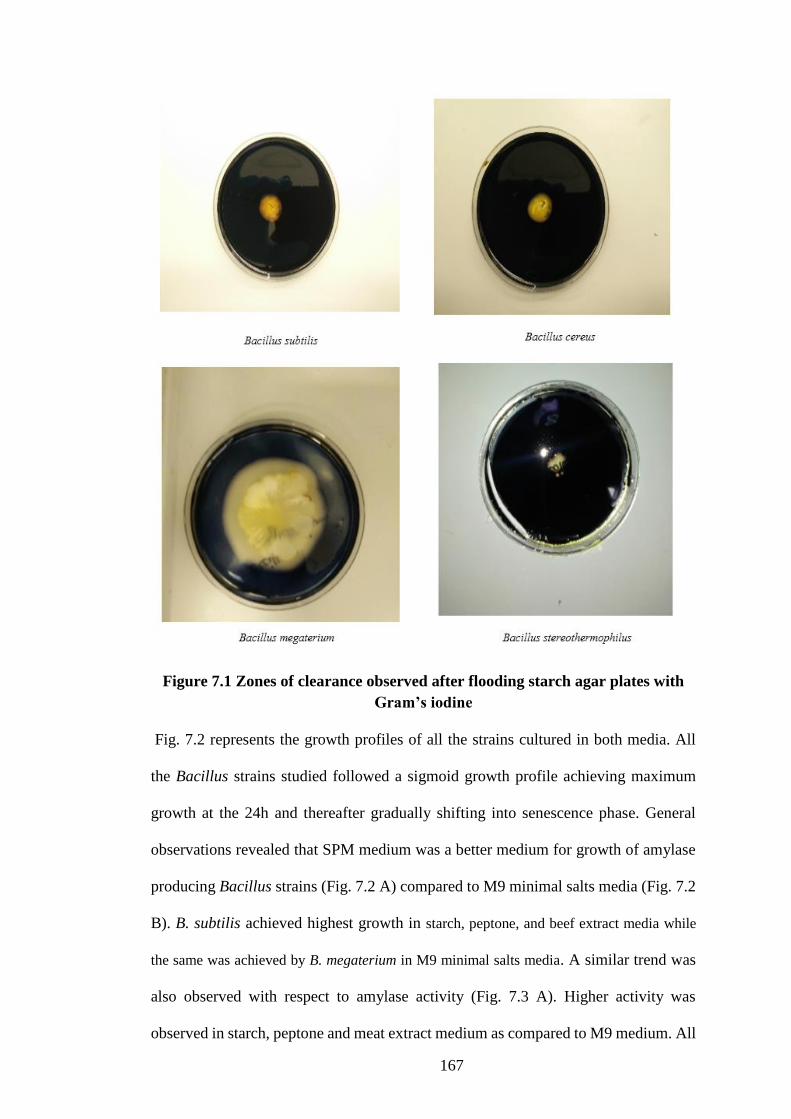
167
Figure 7.1 Zones of clearance observed after flooding starch agar plates with
Gram’s iodine
Fig. 7.2 represents the growth profiles of all the strains cultured in both media. All
the Bacillus strains studied followed a sigmoid growth profile achieving maximum
growth at the 24h and thereafter gradually shifting into senescence phase. General
observations revealed that SPM medium was a better medium for growth of amylase
producing Bacillus strains (Fig. 7.2 A) compared to M9 minimal salts media (Fig. 7.2
B). B. subtilis achieved highest growth in starch, peptone, and beef extract media while
the same was achieved by B. megaterium in M9 minimal salts media. A similar trend was
also observed with respect to amylase activity (Fig. 7.3 A). Higher activity was
observed in starch, peptone and meat extract medium as compared to M9 medium. All
168
the strains tested exhibited maximum amylase activity at 36h (Fig 3a&b). Maximum
amylase activity of 144.6 U/ml was registered by B. subtilis in the 36h employing SPM
medium. In comparison, B. megaterium exhibited highest activity using M9 media
(125.77 U/ml). B. stearothermophilus exhibited maximum enzyme activity of 80.44
U/ml in SPM medium and 81.60 U/ml in M9 medium (Fig 7.2A & 7.2B).
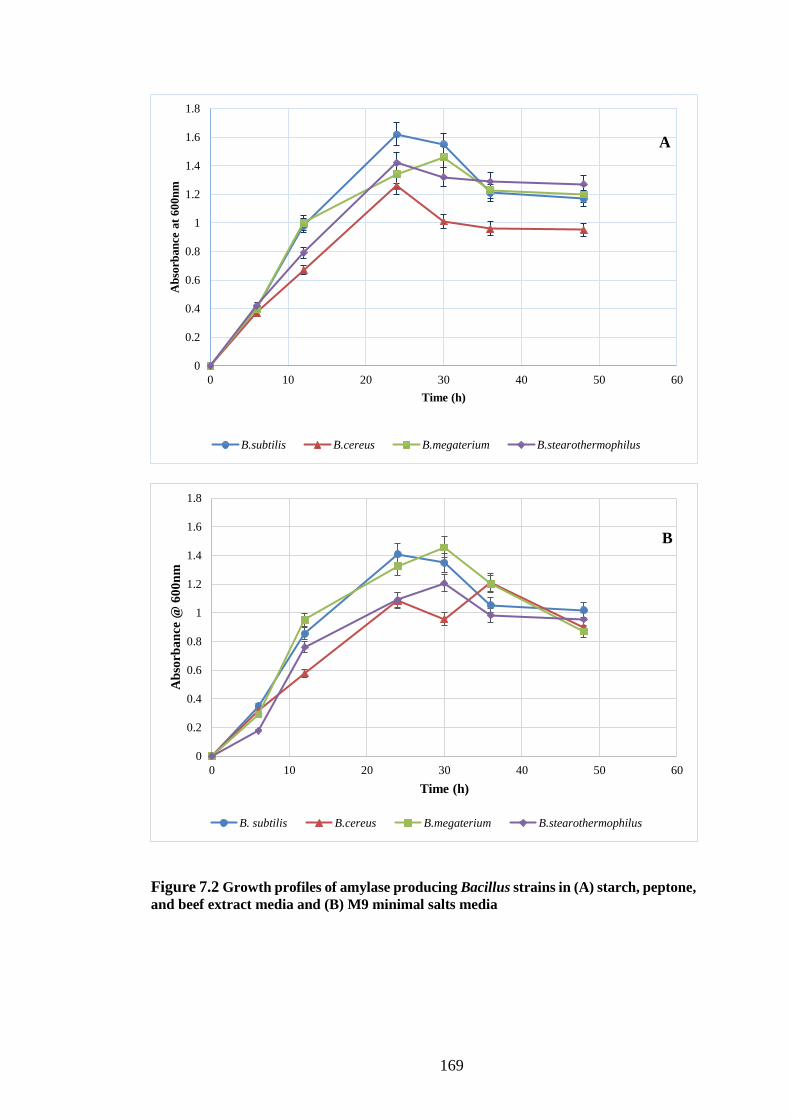
169
Figure 7.2 Growth profiles of amylase producing Bacillus strains in (A) starch, peptone,
and beef extract media and (B) M9 minimal salts media
0
0.2
0.4
0.6
0.8
1
1.2
1.4
1.6
1.8
0 10 20 30 40 50 60
Ab
sorb
an
ce a
t 6
00
nm
Time (h)
B.subtilis B.cereus B.megaterium B.stearothermophilus
0
0.2
0.4
0.6
0.8
1
1.2
1.4
1.6
1.8
0 10 20 30 40 50 60
Ab
sorb
an
ce @
60
0n
m
Time (h)
B. subtilis B.cereus B.megaterium B.stearothermophilus
A
B
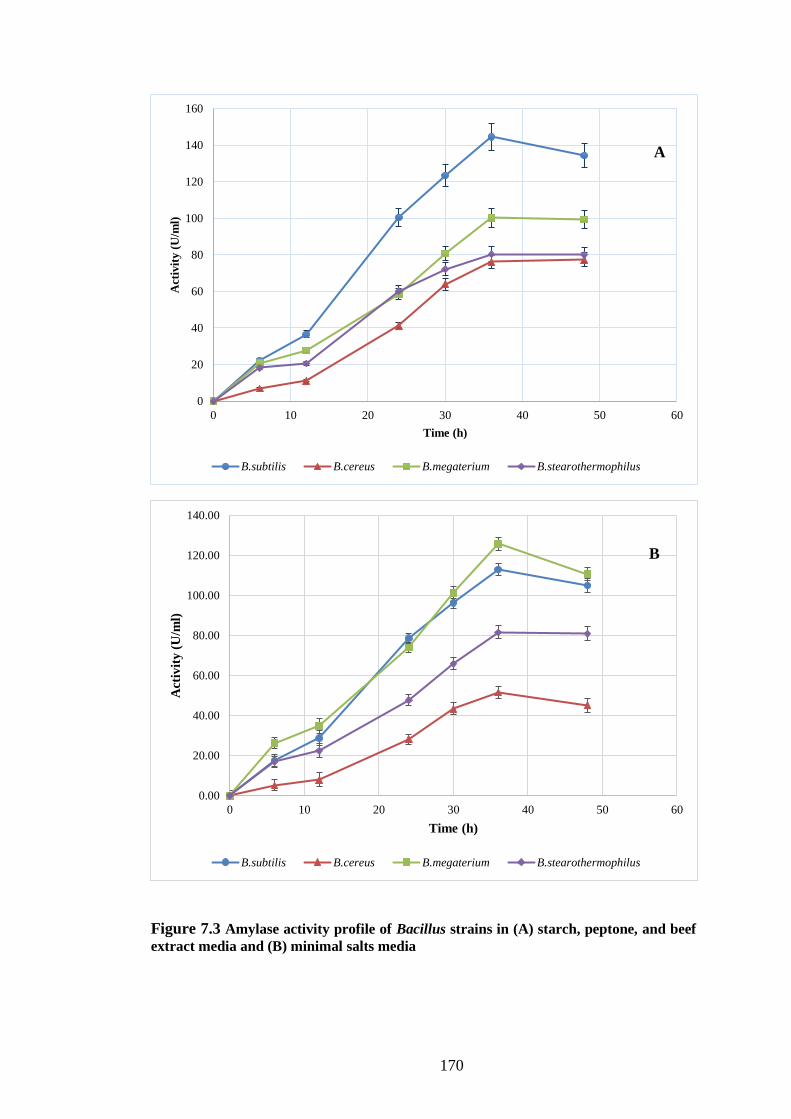
170
Figure 7.3 Amylase activity profile of Bacillus strains in (A) starch, peptone, and beef
extract media and (B) minimal salts media
0
20
40
60
80
100
120
140
160
0 10 20 30 40 50 60
Act
ivit
y (
U/m
l)
Time (h)
B.subtilis B.cereus B.megaterium B.stearothermophilus
A
0.00
20.00
40.00
60.00
80.00
100.00
120.00
140.00
0 10 20 30 40 50 60
Act
ivit
y (
U/m
l)
Time (h)
B.subtilis B.cereus B.megaterium B.stearothermophilus
B
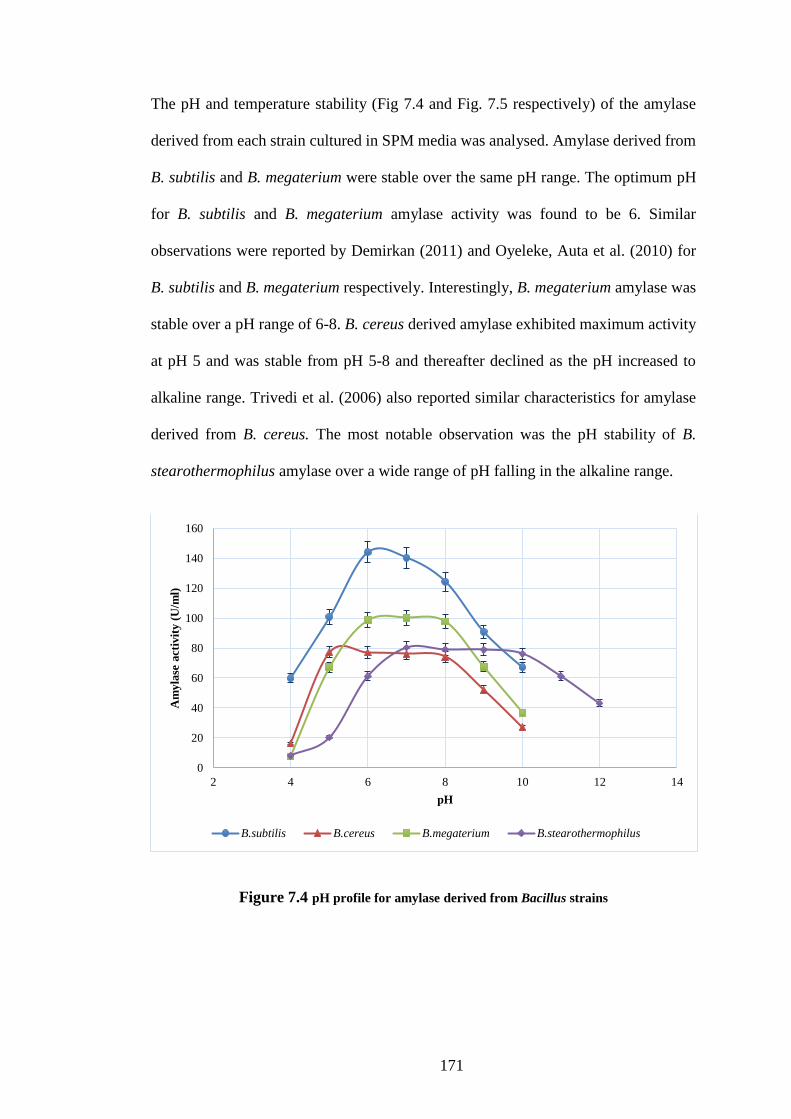
171
The pH and temperature stability (Fig 7.4 and Fig. 7.5 respectively) of the amylase
derived from each strain cultured in SPM media was analysed. Amylase derived from
B. subtilis and B. megaterium were stable over the same pH range. The optimum pH
for B. subtilis and B. megaterium amylase activity was found to be 6. Similar
observations were reported by Demirkan (2011) and Oyeleke, Auta et al. (2010) for
B. subtilis and B. megaterium respectively. Interestingly, B. megaterium amylase was
stable over a pH range of 6-8. B. cereus derived amylase exhibited maximum activity
at pH 5 and was stable from pH 5-8 and thereafter declined as the pH increased to
alkaline range. Trivedi et al. (2006) also reported similar characteristics for amylase
derived from B. cereus. The most notable observation was the pH stability of B.
stearothermophilus amylase over a wide range of pH falling in the alkaline range.
Figure 7.4 pH profile for amylase derived from Bacillus strains
0
20
40
60
80
100
120
140
160
2 4 6 8 10 12 14
Am
yla
se a
ctiv
ity
(U
/ml)
pH
B.subtilis B.cereus B.megaterium B.stearothermophilus
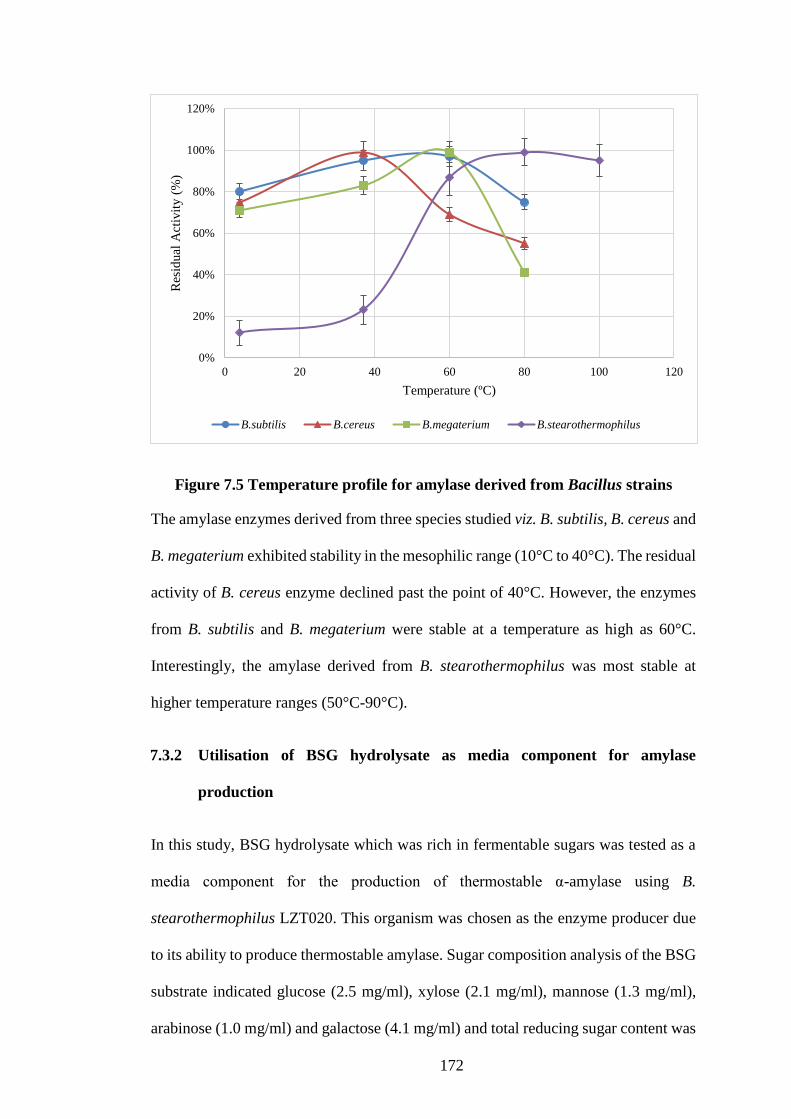
172
Figure 7.5 Temperature profile for amylase derived from Bacillus strains
The amylase enzymes derived from three species studied viz. B. subtilis, B. cereus and
B. megaterium exhibited stability in the mesophilic range (10°C to 40°C). The residual
activity of B. cereus enzyme declined past the point of 40°C. However, the enzymes
from B. subtilis and B. megaterium were stable at a temperature as high as 60°C.
Interestingly, the amylase derived from B. stearothermophilus was most stable at
higher temperature ranges (50°C-90°C).
7.3.2 Utilisation of BSG hydrolysate as media component for amylase
production
In this study, BSG hydrolysate which was rich in fermentable sugars was tested as a
media component for the production of thermostable α-amylase using B.
stearothermophilus LZT020. This organism was chosen as the enzyme producer due
to its ability to produce thermostable amylase. Sugar composition analysis of the BSG
substrate indicated glucose (2.5 mg/ml), xylose (2.1 mg/ml), mannose (1.3 mg/ml),
arabinose (1.0 mg/ml) and galactose (4.1 mg/ml) and total reducing sugar content was
0%
20%
40%
60%
80%
100%
120%
0 20 40 60 80 100 120
Res
idual
Act
ivit
y (
%)
Temperature (ºC)
B.subtilis B.cereus B.megaterium B.stearothermophilus
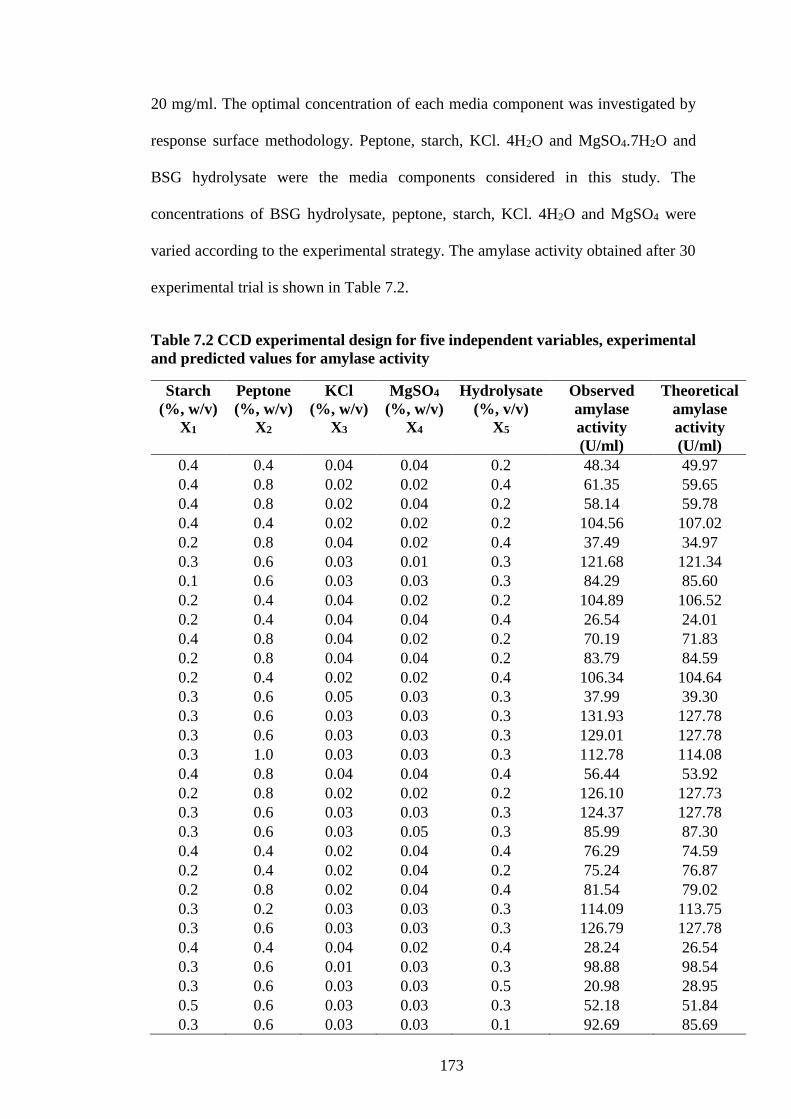
173
20 mg/ml. The optimal concentration of each media component was investigated by
response surface methodology. Peptone, starch, KCl. 4H2O and MgSO4.7H2O and
BSG hydrolysate were the media components considered in this study. The
concentrations of BSG hydrolysate, peptone, starch, KCl. 4H2O and MgSO4 were
varied according to the experimental strategy. The amylase activity obtained after 30
experimental trial is shown in Table 7.2.
Table 7.2 CCD experimental design for five independent variables, experimental
and predicted values for amylase activity
Starch
(%, w/v)
X1
Peptone
(%, w/v)
X2
KCl
(%, w/v)
X3
MgSO4
(%, w/v)
X4
Hydrolysate
(%, v/v)
X5
Observed
amylase
activity
(U/ml)
Theoretical
amylase
activity
(U/ml)
0.4 0.4 0.04 0.04 0.2 48.34 49.97
0.4 0.8 0.02 0.02 0.4 61.35 59.65
0.4 0.8 0.02 0.04 0.2 58.14 59.78
0.4 0.4 0.02 0.02 0.2 104.56 107.02
0.2 0.8 0.04 0.02 0.4 37.49 34.97
0.3 0.6 0.03 0.01 0.3 121.68 121.34
0.1 0.6 0.03 0.03 0.3 84.29 85.60
0.2 0.4 0.04 0.02 0.2 104.89 106.52
0.2 0.4 0.04 0.04 0.4 26.54 24.01
0.4 0.8 0.04 0.02 0.2 70.19 71.83
0.2 0.8 0.04 0.04 0.2 83.79 84.59
0.2 0.4 0.02 0.02 0.4 106.34 104.64
0.3 0.6 0.05 0.03 0.3 37.99 39.30
0.3 0.6 0.03 0.03 0.3 131.93 127.78
0.3 0.6 0.03 0.03 0.3 129.01 127.78
0.3 1.0 0.03 0.03 0.3 112.78 114.08
0.4 0.8 0.04 0.04 0.4 56.44 53.92
0.2 0.8 0.02 0.02 0.2 126.10 127.73
0.3 0.6 0.03 0.03 0.3 124.37 127.78
0.3 0.6 0.03 0.05 0.3 85.99 87.30
0.4 0.4 0.02 0.04 0.4 76.29 74.59
0.2 0.4 0.02 0.04 0.2 75.24 76.87
0.2 0.8 0.02 0.04 0.4 81.54 79.02
0.3 0.2 0.03 0.03 0.3 114.09 113.75
0.3 0.6 0.03 0.03 0.3 126.79 127.78
0.4 0.4 0.04 0.02 0.4 28.24 26.54
0.3 0.6 0.01 0.03 0.3 98.88 98.54
0.3 0.6 0.03 0.03 0.5 20.98 28.95
0.5 0.6 0.03 0.03 0.3 52.18 51.84
0.3 0.6 0.03 0.03 0.1 92.69 85.69
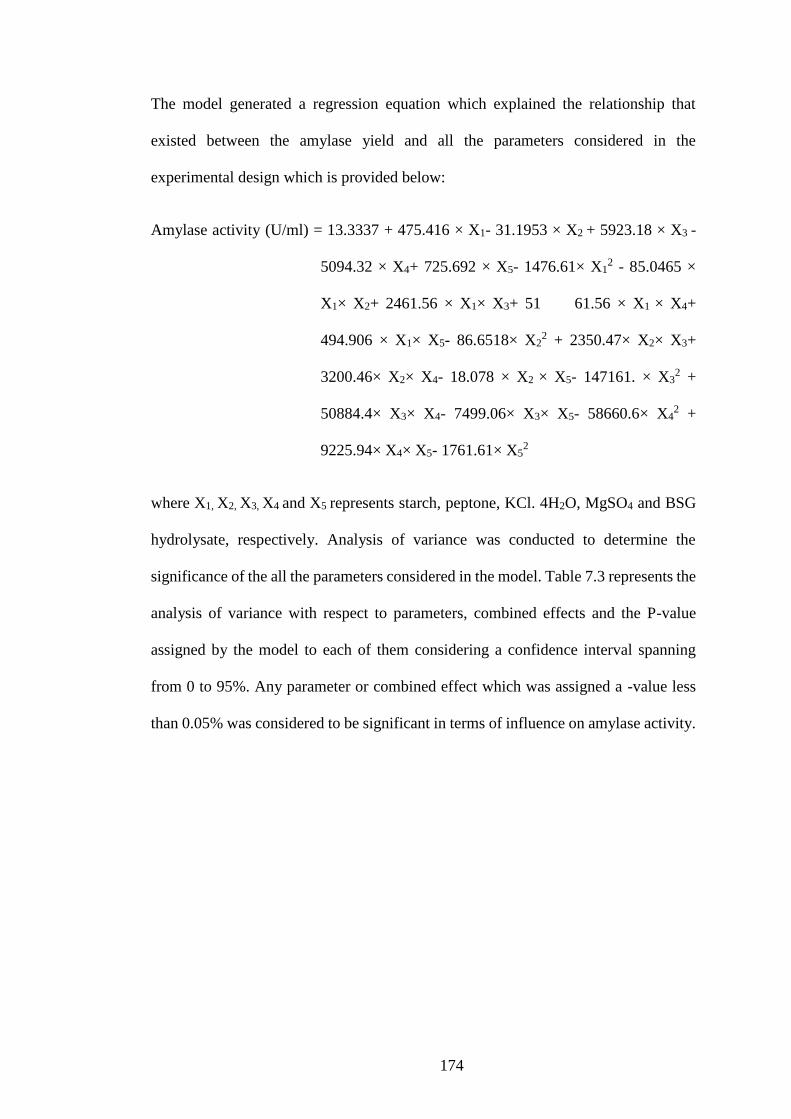
174
The model generated a regression equation which explained the relationship that
existed between the amylase yield and all the parameters considered in the
experimental design which is provided below:
Amylase activity (U/ml) = 13.3337 + 475.416 × X1- 31.1953 × X2 + 5923.18 × X3 -
5094.32 × X4+ 725.692 × X5- 1476.61× X12 - 85.0465 ×
X1× X2+ 2461.56 × X1× X3+ 51 61.56 × X1 × X4+
494.906 × X1× X5- 86.6518× X22 + 2350.47× X2× X3+
3200.46× X2× X4- 18.078 × X2 × X5- 147161. × X32 +
50884.4× X3× X4- 7499.06× X3× X5- 58660.6× X42 +
9225.94× X4× X5- 1761.61× X52
where X1, X2, X3, X4 and X5 represents starch, peptone, KCl. 4H2O, MgSO4 and BSG
hydrolysate, respectively. Analysis of variance was conducted to determine the
significance of the all the parameters considered in the model. Table 7.3 represents the
analysis of variance with respect to parameters, combined effects and the P-value
assigned by the model to each of them considering a confidence interval spanning
from 0 to 95%. Any parameter or combined effect which was assigned a -value less
than 0.05% was considered to be significant in terms of influence on amylase activity.
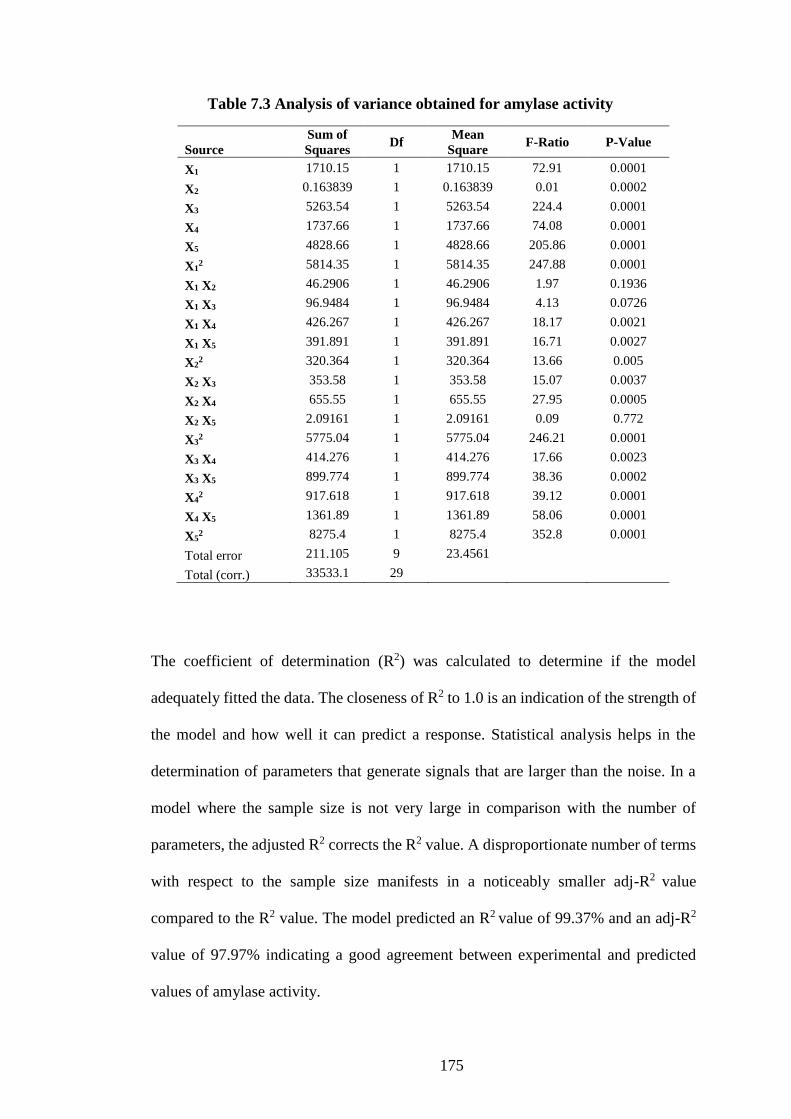
175
Table 7.3 Analysis of variance obtained for amylase activity
Source
Sum of
Squares Df
Mean
Square F-Ratio P-Value
X1 1710.15 1 1710.15 72.91 0.0001
X2 0.163839 1 0.163839 0.01 0.0002
X3 5263.54 1 5263.54 224.4 0.0001
X4 1737.66 1 1737.66 74.08 0.0001
X5 4828.66 1 4828.66 205.86 0.0001
X12 5814.35 1 5814.35 247.88 0.0001
X1 X2 46.2906 1 46.2906 1.97 0.1936
X1 X3 96.9484 1 96.9484 4.13 0.0726
X1 X4 426.267 1 426.267 18.17 0.0021
X1 X5 391.891 1 391.891 16.71 0.0027
X22 320.364 1 320.364 13.66 0.005
X2 X3 353.58 1 353.58 15.07 0.0037
X2 X4 655.55 1 655.55 27.95 0.0005
X2 X5 2.09161 1 2.09161 0.09 0.772
X32 5775.04 1 5775.04 246.21 0.0001
X3 X4 414.276 1 414.276 17.66 0.0023
X3 X5 899.774 1 899.774 38.36 0.0002
X42 917.618 1 917.618 39.12 0.0001
X4 X5 1361.89 1 1361.89 58.06 0.0001
X52 8275.4 1 8275.4 352.8 0.0001
Total error 211.105 9 23.4561
Total (corr.) 33533.1 29
The coefficient of determination (R2) was calculated to determine if the model
adequately fitted the data. The closeness of R2 to 1.0 is an indication of the strength of
the model and how well it can predict a response. Statistical analysis helps in the
determination of parameters that generate signals that are larger than the noise. In a
model where the sample size is not very large in comparison with the number of
parameters, the adjusted R2 corrects the R2 value. A disproportionate number of terms
with respect to the sample size manifests in a noticeably smaller adj-R2 value
compared to the R2 value. The model predicted an R2 value of 99.37% and an adj-R2
value of 97.97% indicating a good agreement between experimental and predicted
values of amylase activity.
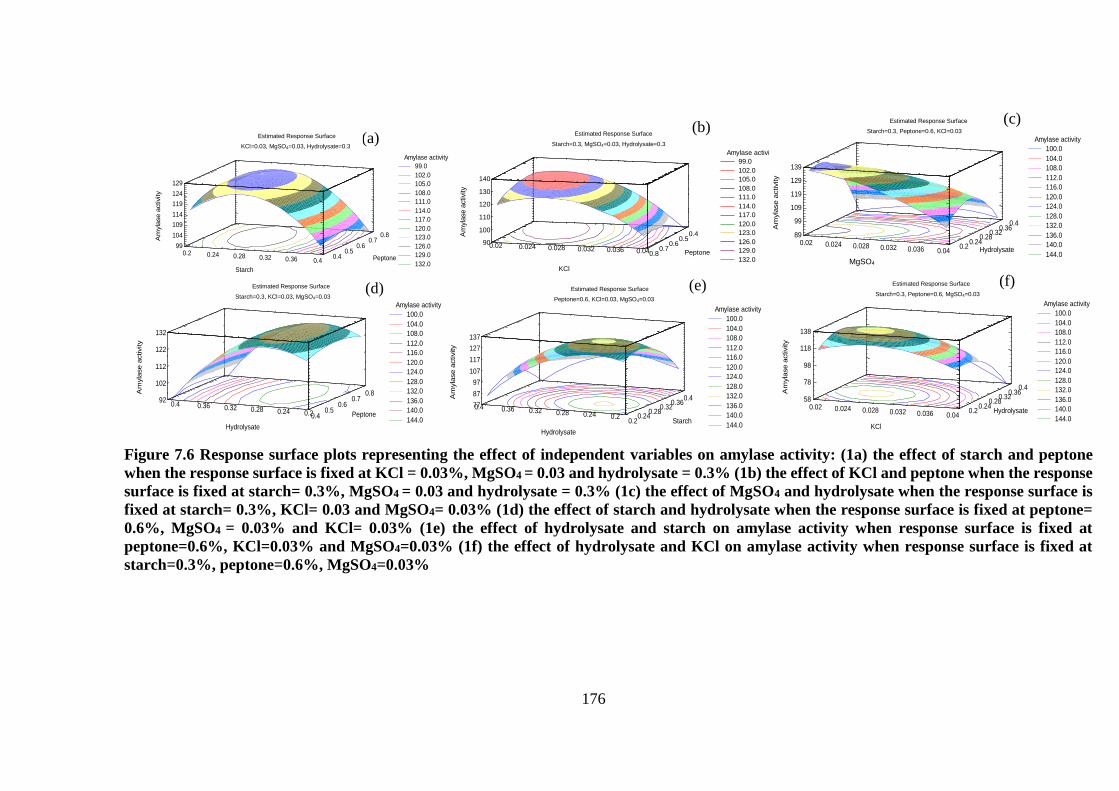
176
Estimated Response SurfaceKCl=0.03,MgSO4=0.03,Hydrolysate=0.3
Amylase activity
99.0
102.0
105.0
108.0
111.0
114.0
117.0
120.0
123.0
126.0
129.0
132.0
0.2 0.24 0.28 0.32 0.36 0.4
Starch
0.40.5
0.60.7
0.8
Peptone
99
104
109
114
119
124
129
Am
yla
se a
ctivity
Estimated Response SurfaceStarch=0.3,MgSO4=0.03,Hydrolysate=0.3
Amylase activity
99.0
102.0
105.0
108.0
111.0
114.0
117.0
120.0
123.0
126.0
129.0
132.0
0.40.5
0.60.7
0.8 Peptone0.02 0.024 0.028 0.032 0.036 0.04
KCl
90
100
110
120
130
140
Am
yla
se a
ctivity
(a)
Estimated Response SurfaceStarch=0.3,Peptone=0.6,KCl=0.03
Amylase activity
100.0
104.0
108.0
112.0
116.0
120.0
124.0
128.0
132.0
136.0
140.0
144.0
0.02 0.024 0.028 0.032 0.036 0.04MgSO4
0.20.24
0.280.32
0.360.4
Hydrolysate
89
99
109
119
129
139
Am
yla
se a
ctivity
Estimated Response SurfaceStarch=0.3,Peptone=0.6,MgSO4=0.03
Amylase activity
100.0
104.0
108.0
112.0
116.0
120.0
124.0
128.0
132.0
136.0
140.0
144.0
0.02 0.024 0.028 0.032 0.036 0.04
KCl
0.20.24
0.280.32
0.360.4
Hydrolysate
58
78
98
118
138
Am
yla
se a
ctivity
Estimated Response SurfaceStarch=0.3,KCl=0.03,MgSO4=0.03
Amylase activity
100.0
104.0
108.0
112.0
116.0
120.0
124.0
128.0
132.0
136.0
140.0
144.00.4
0.50.6
0.70.8
Peptone0.20.240.280.320.360.4
Hydrolysate
92
102
112
122
132
Am
yla
se a
ctivity
Estimated Response SurfacePeptone=0.6,KCl=0.03,MgSO4=0.03
Amylase activity
100.0
104.0
108.0
112.0
116.0
120.0
124.0
128.0
132.0
136.0
140.0
144.00.2
0.240.28
0.320.36
0.4
Starch0.20.240.280.320.360.4
Hydrolysate
77
87
97
107
117
127
137
Am
yla
se a
ctivity
(b) (c)
(d) (e) (f)
Figure 7.6 Response surface plots representing the effect of independent variables on amylase activity: (1a) the effect of starch and peptone
when the response surface is fixed at KCl = 0.03%, MgSO4 = 0.03 and hydrolysate = 0.3% (1b) the effect of KCl and peptone when the response
surface is fixed at starch= 0.3%, MgSO4 = 0.03 and hydrolysate = 0.3% (1c) the effect of MgSO4 and hydrolysate when the response surface is
fixed at starch= 0.3%, KCl= 0.03 and MgSO4= 0.03% (1d) the effect of starch and hydrolysate when the response surface is fixed at peptone=
0.6%, MgSO4 = 0.03% and KCl= 0.03% (1e) the effect of hydrolysate and starch on amylase activity when response surface is fixed at
peptone=0.6%, KCl=0.03% and MgSO4=0.03% (1f) the effect of hydrolysate and KCl on amylase activity when response surface is fixed at
starch=0.3%, peptone=0.6%, MgSO4=0.03%
Estimated Response Surface
KCl=0.03, MgSO4=0.03, Hydrolysate=0.3
Estimated Response Surface
Starch=0.3, KCl=0.03, MgSO4=0.03
Estimated Response Surface
Peptone=0.6, KCl=0.03, MgSO4=0.03
Estimated Response Surface
Starch=0.3, MgSO4=0.03, Hydrolysate=0.3
Estimated Response Surface
Starch=0.3, Peptone=0.6, KCl=0.03
Estimated Response Surface
Starch=0.3, Peptone=0.6, MgSO4=0.03
MgSO4
177
All the factors considered in the model were found to have a significant effect and
enhanced the production of amylase activity. Inorganic salts like MgSO4 and KCl have
been reported to have a positive influence on α-amylase production by B.
stearothermophilus (Srivastava & Baruah, 1986). Furthermore, starch and other
polysaccharides positively influences α-amylase production by Bacillus sp.
(Gangadharan et al., 2008). The P-values also indicated that some of the interactive
effects of the media components were significant with respect to α-amylase
production.
The interactive effects of all the media components on the amylase activity was
analyzed by generating 3-D response surface plots (Fig 7.6). In all the cases the lower
concentration of BSG hydrolysate tended to enhance amylase activity. Maximum
amylase activity was achieved at a BSG hydrolysate concentration range of 0.2 to 0.24
%. Any increase in hydrolysate concentration in the media beyond this range was
found to be detrimental to enzyme activity. A higher hydrolysate concentration was
found to be inhibitory for amylase production. This might be due to catabolite
repression due to the presence of glucose in the hydrolysate (Ravindran et al., 2018).
In a recent study, Ouattara et al. (2017) had reported incidences of catabolite
repression due to the presence of glucose in the fermentation media when Bacillus sp.
was used as the enzyme producer. Although a higher concentration of glucose can
result in catabolite repression, the presence of this monosaccharide in the fermentation
medium enhances the growth of the bacteria. In fact, lower concentrations of maltose
and glucose have been reported to enhance amylase activity in B. stearothermophilus
(Rahmati et al., 2017). A higher biomass production does not necessarily have to
translate into similar enzyme production kinetics. Simair et al. (2017) conducted an
178
extensive study to determine the best carbon and nitrogen sources for Bacillus sp. BCC
01-50 amylase. Although there was no significant difference in biomass formation
glucose augmented medium compared to that containing starch, the latter resulted in
higher amylase activity.
To study the effects of BSG hydrolysate on biomass formation dry cell weight studies
were conducted. Consequently, a 22% increase in biomass was observed in the
experimental trial when compared to control. These all point to the fact that low
concentrations of BSG hydrolysate is favourable for cell biomass formation and α-
amylase production. An increase in peptone content also positively influences the
amylase activity. Rajagopalan and Krishnan (2008) had reported similar findings in a
study involving the effects of peptone concentration in media on the production of α-
amylase by Bacillus subtilis KCC103.
The RSM experimental design generated optimized levels for every factor upon
analyzing the observed amylase activity after each trial. Accordingly, the optimized
values for each media component was as follows: starch 0.2% (w/v), peptone 0.2%
(w/v), KCl.4 H2O 0.02% (w/v), MgSO4.7H2O 0.01% (w/v) and hydrolysate 0.22%
(v/v). The model predicted an enzyme activity of 203.3 U/ml on testing the optimized
conditions. Validation experiments following optimized media composition resulted
in 198.09 U/ml of amylase activity. Minimal disparity between predicted and observed
values (<5%) confirmed that the model was valid and also indicated that it was
adequate enough to predict the optimum values for variables considered for amylase
production. Furthermore, the amylase yield obtained after optimizing the media
formulation was 1.3-fold higher than that observed after control fermentation (152.3
U/ml).
179
7.3.3 Purification of thermostable B. stearothermophilus amylase
Enzymes are commonly purified by a multi-step process. These steps may be specific
or non-specific depending upon the purification strategy adopted. Increasing the
number of steps in protein purification strategy can result in a low final yield (Bajpai,
2014). Ion exchange chromatography is a common technique used for the purification
of α-amylase. In this study, a three-step strategy was adopted to purify the
thermostable α-amylase. The summary of the purification stages has been provided in
table 7.4. The crude enzyme which exhibited a total activity of 9152 U and specific
activity of 34.63 U/mg was subjected to ammonium sulphate precipitation (65% w/v)
at 4°C. This step resulted in a purification of 1.24-fold and theoretical yield of 76%.
This was followed by an ultrafiltration/diafiltration step which led to an increase in
purification fold by 12.44-fold. The final purification strategy involved ion exchange
chromatography where the concentrate was loaded on to DEAE-Sepharose Fast Flow
column and eluted using 0.5 M NaCl via isocratic mode after removal of unwanted
proteins. The active fractions were collected and concentrated by diafiltration. The last
stage of purification resulted in the final enzyme preparation achieving 13.09-fold
purification and a theoretical yield of 25.1%. As shown in Fig. 7.7, a single, salt-eluted
peak (A280) was obtained in ion-exchange chromatography. The theoretical yield and
purification folds can be comparable with earlier published studies. Chakraborty et al.
(2000) in studies involving B. stearothermophilus for amylase production had reported
a yield of 56% and purification fold of 6.7.
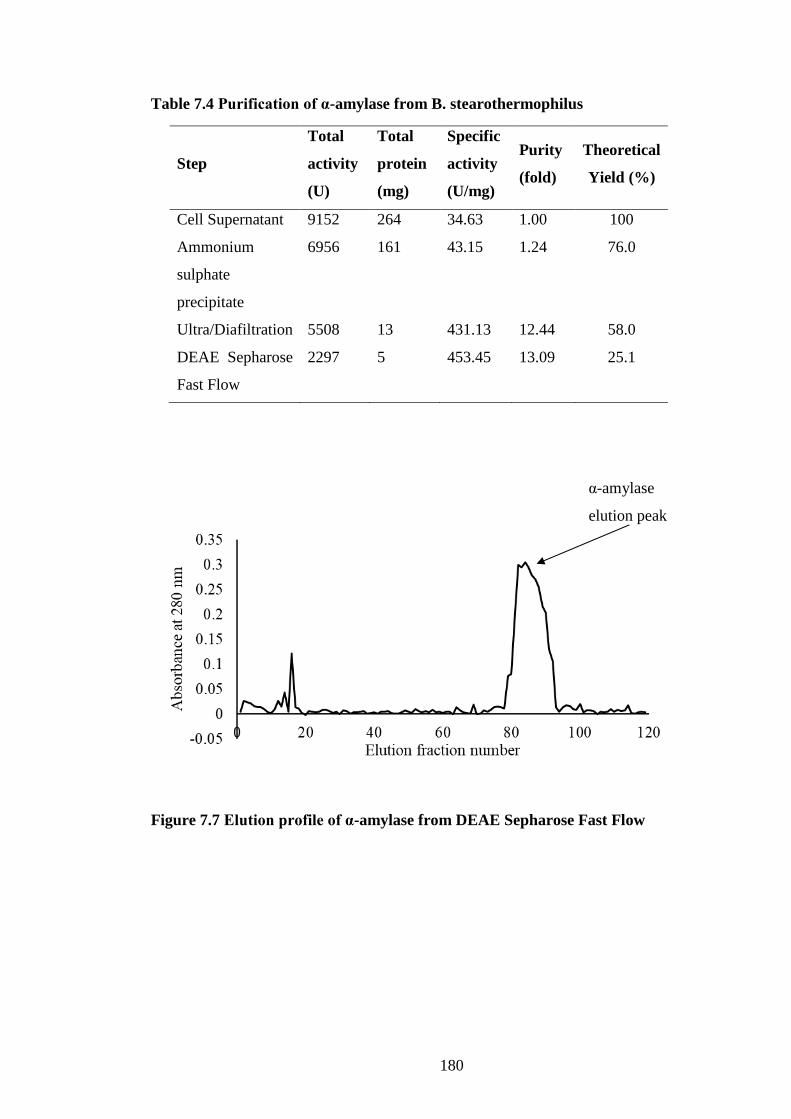
180
Table 7.4 Purification of α-amylase from B. stearothermophilus
Step
Total
activity
(U)
Total
protein
(mg)
Specific
activity
(U/mg)
Purity
(fold)
Theoretical
Yield (%)
Cell Supernatant 9152 264 34.63 1.00 100
Ammonium
sulphate
precipitate
6956 161 43.15 1.24 76.0
Ultra/Diafiltration 5508 13 431.13 12.44 58.0
DEAE Sepharose
Fast Flow
2297 5 453.45 13.09 25.1
Figure 7.7 Elution profile of α-amylase from DEAE Sepharose Fast Flow
α-amylase
elution peak
181
Similarly, Fincan and Enez (2014) reported a purification fold of 65 and yield of 46%
employing a four-step purification strategy that involved size exclusion
chromatography (Sephadex G-100) followed by ion exchange chromatography
employing DEAE cellulose. The three-stage purification strategy adopted in this study
for thermostable α-amylase enabled the authors to perform biochemical
characterization to determine the optimum pH and temperature for enzyme activity.
Furthermore, the purification fold and yield of the α-amylase was high with less
number of purification stages. This purification procedure can be easily adopted for
large-scale purification.
The molecular weight of denatured thermostable α-amylase was determined by
relative mobility of standard proteins on SDS-PAGE. The relative molecular mass of
the enzyme was estimated via 10% SDS-PAGE and appeared to be 64 kDa (Fig 3).
The enzyme appeared as a single protein band suggesting that it was a homogenous
monomer with a single polypeptide chain. This was in agreement to reports published
elsewhere. For example, Fincan and Enez (2014) conducted an extensive study that
purified and characterized α-amylase produced by Geobacillus stearothermophilus
where molecular weight of thermostable amylase was found to be 63 kDa.
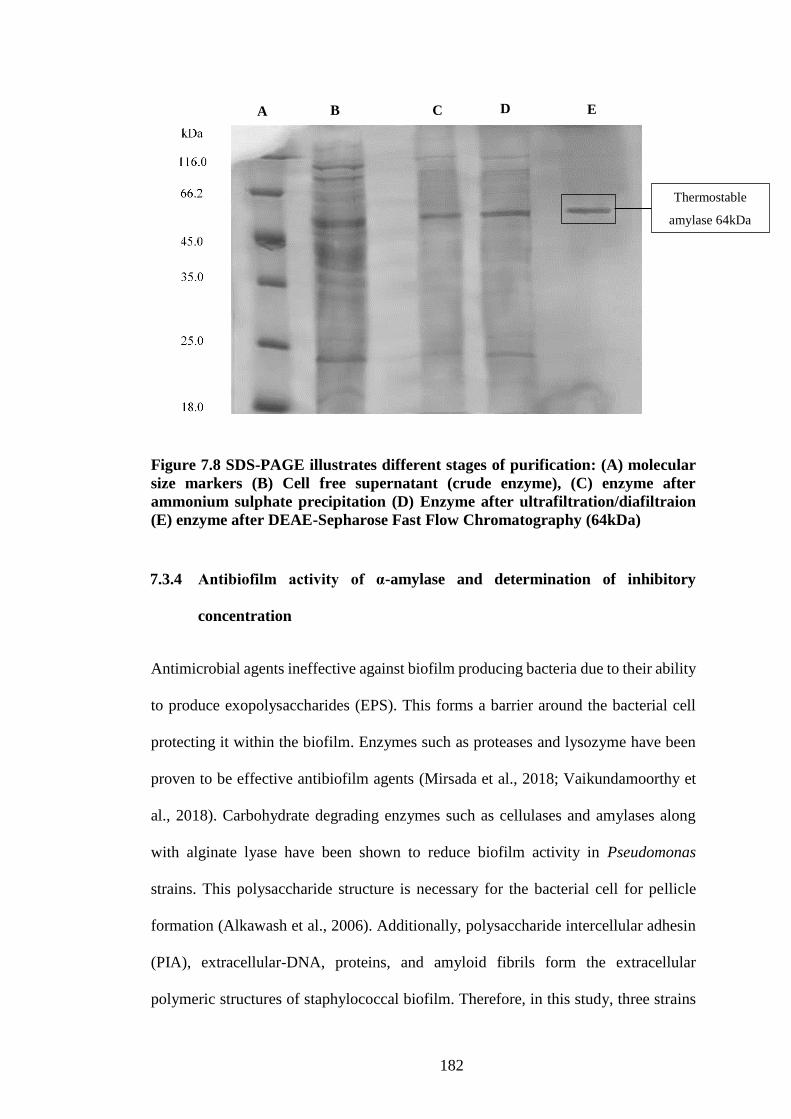
182
Figure 7.8 SDS-PAGE illustrates different stages of purification: (A) molecular
size markers (B) Cell free supernatant (crude enzyme), (C) enzyme after
ammonium sulphate precipitation (D) Enzyme after ultrafiltration/diafiltraion
(E) enzyme after DEAE-Sepharose Fast Flow Chromatography (64kDa)
7.3.4 Antibiofilm activity of α-amylase and determination of inhibitory
concentration
Antimicrobial agents ineffective against biofilm producing bacteria due to their ability
to produce exopolysaccharides (EPS). This forms a barrier around the bacterial cell
protecting it within the biofilm. Enzymes such as proteases and lysozyme have been
proven to be effective antibiofilm agents (Mirsada et al., 2018; Vaikundamoorthy et
al., 2018). Carbohydrate degrading enzymes such as cellulases and amylases along
with alginate lyase have been shown to reduce biofilm activity in Pseudomonas
strains. This polysaccharide structure is necessary for the bacterial cell for pellicle
formation (Alkawash et al., 2006). Additionally, polysaccharide intercellular adhesin
(PIA), extracellular-DNA, proteins, and amyloid fibrils form the extracellular
polymeric structures of staphylococcal biofilm. Therefore, in this study, three strains
A B C D E
Thermostable
amylase 64kDa
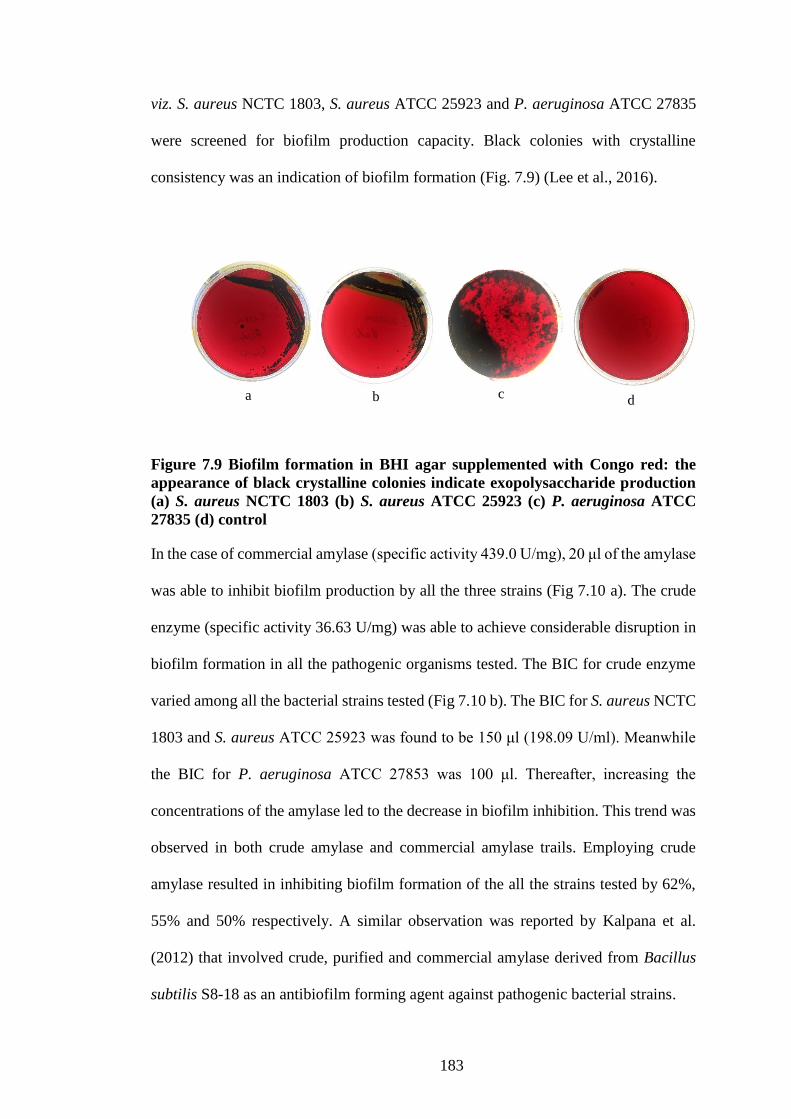
183
viz. S. aureus NCTC 1803, S. aureus ATCC 25923 and P. aeruginosa ATCC 27835
were screened for biofilm production capacity. Black colonies with crystalline
consistency was an indication of biofilm formation (Fig. 7.9) (Lee et al., 2016).
Figure 7.9 Biofilm formation in BHI agar supplemented with Congo red: the
appearance of black crystalline colonies indicate exopolysaccharide production
(a) S. aureus NCTC 1803 (b) S. aureus ATCC 25923 (c) P. aeruginosa ATCC
27835 (d) control
In the case of commercial amylase (specific activity 439.0 U/mg), 20 μl of the amylase
was able to inhibit biofilm production by all the three strains (Fig 7.10 a). The crude
enzyme (specific activity 36.63 U/mg) was able to achieve considerable disruption in
biofilm formation in all the pathogenic organisms tested. The BIC for crude enzyme
varied among all the bacterial strains tested (Fig 7.10 b). The BIC for S. aureus NCTC
1803 and S. aureus ATCC 25923 was found to be 150 μl (198.09 U/ml). Meanwhile
the BIC for P. aeruginosa ATCC 27853 was 100 μl. Thereafter, increasing the
concentrations of the amylase led to the decrease in biofilm inhibition. This trend was
observed in both crude amylase and commercial amylase trails. Employing crude
amylase resulted in inhibiting biofilm formation of the all the strains tested by 62%,
55% and 50% respectively. A similar observation was reported by Kalpana et al.
(2012) that involved crude, purified and commercial amylase derived from Bacillus
subtilis S8-18 as an antibiofilm forming agent against pathogenic bacterial strains.
a b c d
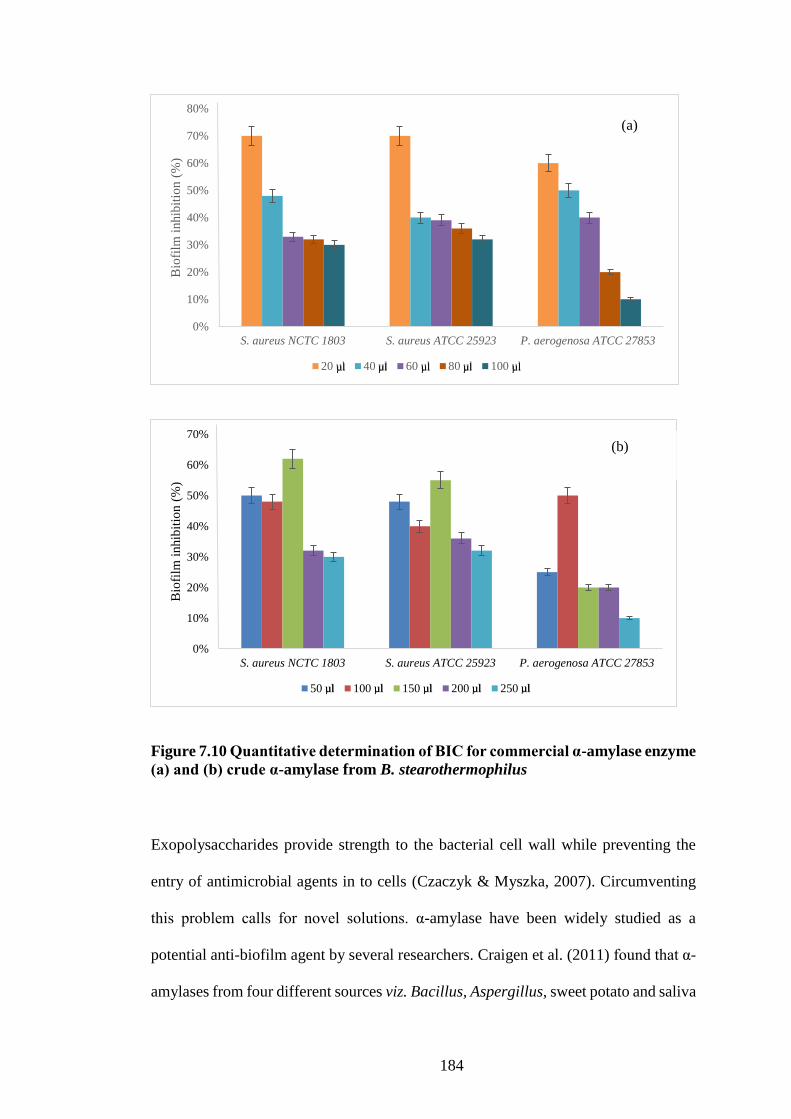
184
Figure 7.10 Quantitative determination of BIC for commercial α-amylase enzyme
(a) and (b) crude α-amylase from B. stearothermophilus
Exopolysaccharides provide strength to the bacterial cell wall while preventing the
entry of antimicrobial agents in to cells (Czaczyk & Myszka, 2007). Circumventing
this problem calls for novel solutions. α-amylase have been widely studied as a
potential anti-biofilm agent by several researchers. Craigen et al. (2011) found that α-
amylases from four different sources viz. Bacillus, Aspergillus, sweet potato and saliva
0%
10%
20%
30%
40%
50%
60%
70%
80%
S. aureus NCTC 1803 S. aureus ATCC 25923 P. aerogenosa ATCC 27853
Bio
film
inhib
itio
n (
%)
20 ul 40 ul 60 ul 80 ul 100 ul
(a)
0%
10%
20%
30%
40%
50%
60%
70%
S. aureus NCTC 1803 S. aureus ATCC 25923 P. aerogenosa ATCC 27853
Bio
film
inhib
itio
n (
%)
50 ul 100 ul 150 ul 200 ul 250 ul
(b)
µl µl µl µl µl
µl µl µl µl µl
185
was effective against biofilm producing capacity of Staphylococcus aureus. Other
studies have reported that proteases are better at preventing biofilm formation and
antimicrobial activity compared to α-amylases (Mitrofanova et al., 2017; Molobela et
al., 2010). Some studies report the use of an antimicrobial enzyme cocktail including
proteases, lysozyme, oxidative enzymes, amylases etc. to prevent or remove biofilm
formation. However, the presence of protease can lead to the degradation of other
enzymes leading to partial removal of biofilm (Kalpana et al., 2012). Hence this study
was solely focused on the effect of thermostable B. stearothermophilus α-amylase on
biofilm formation.
7.4 Conclusion
In this study, for the first time BSG hydrolysate was used to successfully formulate
media for the production of thermostable α-amylase by B. stearothermophilus. The
presence of hydrolysate in small quantities enhanced the growth and enzyme yield of
B. stearothermophilus. This resulted in an increase of enzyme yield by 1.3-fold. The
enzyme produced was purified by three-step purification strategy. This resulted in a
13.09-fold purification with a yield of 25%. On characterizing the enzyme, α-amylase
exhibited maximum activity at a pH range of 7-8 and temperature range of 60°C to
70°C. Furthermore, B. stearothermophilus α-amylase was successfully tested as an
antibiofilm activity against three pathogens viz. S. aureus NCTC 1803, S. aureus
ATCC 25923 and P. aeruginosa ATCC 27835 inhibiting their biofilm producing
capacity by 62%, 55% and 50% respectively. Hence this study concludes that BSG
hydrolysate can be a potential media component for α-amylase production.
186
Chapter 8
Spent coffee waste as a potential media component
for xylanase production employing Aspergillus niger
ATCC® 6275
f spent coffee waste as a potential media component for
Xylanases are enzymes that hydrolyse xylan into xylose or oligomeric mixtures. It has
been widely used in the bleaching of paper as well as in baking and juice clarification.
Spent Coffee Waste (SCW) is an important by-product of the coffee industry. It is
highly rich lipids, proteins and polysaccharides. In this study SCW was used as the
sole carbon source for xylanase production in solid state fermentation mode. Mycelial
fungi, Aspergillus niger was used as the fermentative microbe. A Box-Behnken design
was constructed using three parameters viz. temperature, initial moisture content and
log no. of spores to determine the optimal fermentation condition for xylanase
production. The data obtained was fitted into the model and an optimum level was
obtained on which nutrient supplementation for the fermentation was optimised. A
Plackett-Burman design was used to screen ten nutrient components. Further
observations revealed that yeast extract, K2HPO4 and MgSO4 exerted maximum
influence on the xylanase production. The media for fermentation was further
optimised using a Box-Behnken design. The best fermentation conditions for xylanase
production was found to be incubation at 30°C with an initial moisture content of 70%
and using an inoculum of 6.5×10⁶ spores/g of dry SCW. Furthermore, the design of
experiments revealed that maintaining a medium composition of 0.2g of yeast extract,
0.04g of K2HPO4 and 0.03g of MgSO4 increased xylanase production. Under
optimised SSF conditions an enzyme activity of 6495.6 U/g of dry SCW was registered
which was approximately 1.39-fold higher than control (4649 U/g of dry SCW). The
efficacy of the purified xylanase as a juice enrichment agent for strawberry, blueberry
and raspberry pulp.
187
8. Spent coffee waste as a potential media component for xylanase
production employing Aspergillus niger ATCC® 6275
8.1 Introduction
Lignocellulosic residues are plant-based materials that are generated in large quantities
by the agriculture industry. They are rich in carbohydrates and lignin, with small
amounts of other potentially valuable compounds such as proteins, lipids and
polyphenols. They have gained considerable interest as a cheap carbon source in
fermentation processes (Anwar et al., 2014). The polysaccharide fraction of
lignocellulose can be broadly classified into cellulose and hemicellulose, depending
upon the composition. After cellulose, hemicellulose is the most abundant
carbohydrate fraction in lignocellulosic materials and constitutes 30% of the plant cell
walls (Das & Ray, 2016). Xylan is one of the main components that comprise
hemicellulose. Xylan is degraded enzymatically by several bacterial and fungal
species by synthesising a specific group of enzymes called xylanases. Xylanases are
hemicellulolytic enzymes that specifically degrade β-1, 4-xylans, and find wide
application in areas such as juice and wine clarification, food processing and paper
pulping (Irfan et al., 2014). They are also used in combination with cellulase in the
digestion of silage to improve nutritional qualities. Xylanase is commercially
produced in large scale by the utilisation of xylan as the key carbon source in
fermentation. This process adds to the cost of production. Xylan can arguably be
replaced by cheap agricultural, lignocellulosic residues which are abundantly available
thereby reducing enzyme production costs.
Most enzymes are commercially produced in large scale by following submerged
fermentation strategy due to ease of process control. However, solid state fermentation
is an alternative fermentation strategy that has numerous advantages, such as high
188
volumetric productivity, less effluent generation, simplistic instrumentation and
equipment, and most importantly, low capital investment and operational cost
(Ajijolakewu et al., 2017; Irfan et al., 2014). Filamentous fungi are excellent producers
of lignocellulytic enzymes such as cellulases and xylanases and are perfect strains for
enzyme production via the solid-state fermentation mode; combined with a
lignocellulosic substrate holds advantages of low-cost operation coupled with high
enzyme titre (Ang et al., 2013). Some of the common lignocellulosic residues
employed in SSF-based enzyme production studies include rice bran, wheat bran, corn
cob, sugar cane bagasse (Irfan et al., 2014). Coffee by-products are one such
lignocellulose residue which is produced in abundance by the growing global coffee
industry. Some of the by-products derived from coffee are coffee husk, silver skin,
pulp and spent coffee. While coffee husk is high in cellulose and lipid content, spent
coffee is high in hemicellulose content, in addition to representing a valuable reservoir
of cellulose, lipids, proteins and polyphenols. This makes spent coffee an ideal
substrate for enzyme production (Ballesteros et al., 2014). Despite the high nutritional
value, not many studies are available that utilise spent coffee in SSF mode for the
production of xylanases. Murthy and Naidu (2012) published an interesting study
where coffee by-products were used in SSF mode to produce xylanases employing
Pencillium sp. CFR 303 as the enzyme producer.
In the present study, we have attempted to utilise spent coffee waste (SCW) as the sole
carbon source for xylanase production. Aspergillus niger ATCC® 6275 was employed
as the enzyme producing fungus. The process parameters for SSF mode were
optimised by the application of response surface methodology. The xylanase was
subsequently purified by a three-step strategy following and preliminary
189
characterization performed. The purified xylanase was finally tested as a potential
juice enrichment agent for three fruit pulp varieties.
8.2 Methodology
8.2.1 Lipid extraction from SCW
The total lipids were extracted from SCW by following the protocol described by
(Ahangari & Sargolzaei, 2013). Briefly, 10g of SCW was weighed and taken in a
cellulose thimble which was then stoppered with cellulose wool. A Soxhlet apparatus
was set up with 100 ml of petroleum ether in a round bottom flask and anti-bumping
granules. Extraction was conducted for 6h in reflux cycles or until constant weight of
petroleum ether-oil mixture was attained. The petroleum ether was then evaporated
off leaving behind the freshly extracted SCW lipids. The weight of the lipids recovered
was recorded and the lipid-free SCW was stored for further experiments.
8.2.2 Screening of fungal species for xylanase production capacity
Four fungal strains viz. Aspergillus fumigatus (A1), Paecilomyces variotii (A2),
Penicillium roqueforti (A3) and Aspergillus niger (A4) were selected for screening of
xylanase producing capacity. Czapek Dox Agar supplemented with 1% xylan was
inoculated with the strains and allowed to grow for 72h. The plates were then flooded
with 1% Congo red and allowed to stand for 15 min. The plates was washed with 1%
NaCl and then observed for zones of clearance. A. niger exhibited largest zone of
clearance and was thus selected for further studies.
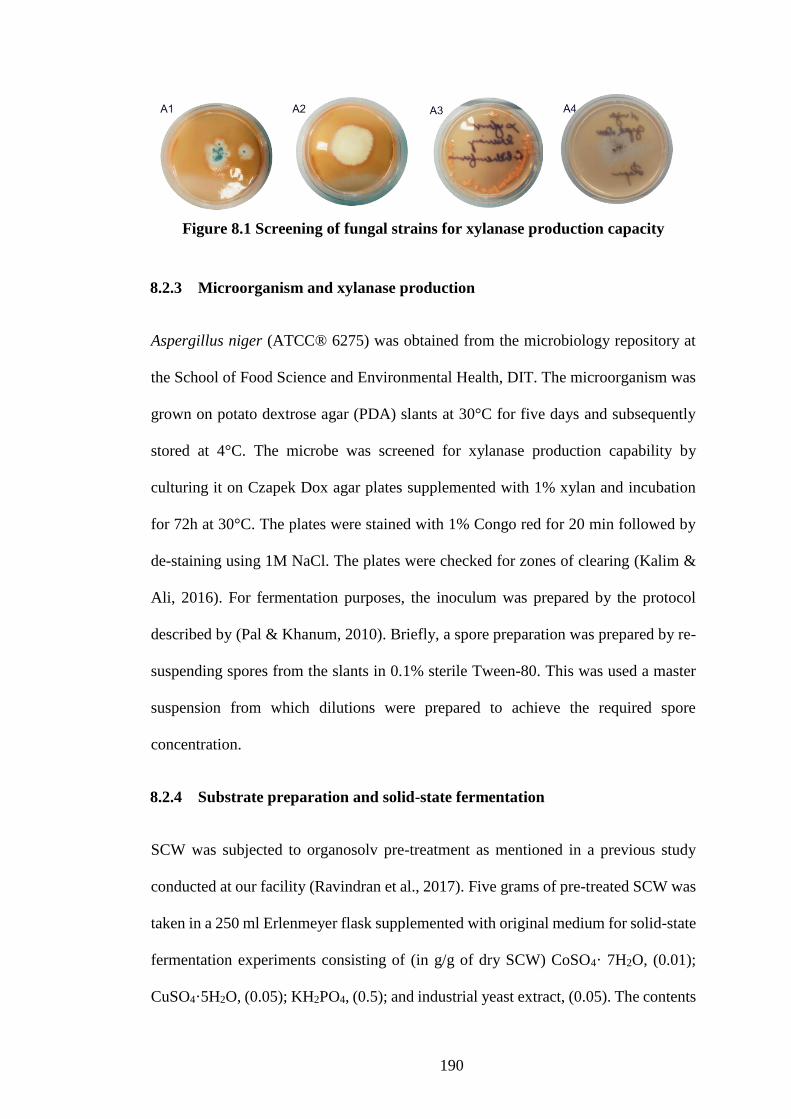
190
Figure 8.1 Screening of fungal strains for xylanase production capacity
8.2.3 Microorganism and xylanase production
Aspergillus niger (ATCC® 6275) was obtained from the microbiology repository at
the School of Food Science and Environmental Health, DIT. The microorganism was
grown on potato dextrose agar (PDA) slants at 30°C for five days and subsequently
stored at 4°C. The microbe was screened for xylanase production capability by
culturing it on Czapek Dox agar plates supplemented with 1% xylan and incubation
for 72h at 30°C. The plates were stained with 1% Congo red for 20 min followed by
de-staining using 1M NaCl. The plates were checked for zones of clearing (Kalim &
Ali, 2016). For fermentation purposes, the inoculum was prepared by the protocol
described by (Pal & Khanum, 2010). Briefly, a spore preparation was prepared by re-
suspending spores from the slants in 0.1% sterile Tween-80. This was used a master
suspension from which dilutions were prepared to achieve the required spore
concentration.
8.2.4 Substrate preparation and solid-state fermentation
SCW was subjected to organosolv pre-treatment as mentioned in a previous study
conducted at our facility (Ravindran et al., 2017). Five grams of pre-treated SCW was
taken in a 250 ml Erlenmeyer flask supplemented with original medium for solid-state
fermentation experiments consisting of (in g/g of dry SCW) CoSO4· 7H2O, (0.01);
CuSO4·5H2O, (0.05); KH2PO4, (0.5); and industrial yeast extract, (0.05). The contents
191
of the flask were autoclaved at 121°C for 30 min followed by which it was inoculated
with 1 ml of inoculum (~1 × 10⁶ spores/ml). Fermentation was carried out for 120h
followed by enzyme extraction (Park et al., 2002). SSF was conducted for 96h. After
each trial the fermented samples were subjected to an enzyme extraction process and
assayed for xylanase activity and soluble protein content.
8.2.5 Enzyme extraction and assay
On completion of each fermentation experiment, the contents of each flask were re-
suspended by the addition of citrate buffer (0.05M, pH 5.0). A solid-to-liquid ratio of
1 g initial dry substrate/ 12 ml of buffer was maintained for xylanase extraction. This
mixture was homogenised for 20 min and centrifuged for 1,200 rpm for 30 min at 4°C.
The solids were separated from the liquids by centrifugation followed by filtration
through Whatman No. 1 filter paper to remove any particulate matter. The filtrate was
collected and then assayed for xylanase activity. Xylanase activity was estimated as
follows: 50 μl of enzyme solution was mixed with 100 μl of 1% Birchwood xylan
prepared in 0.05 M citrate buffer (pH 4.8). The mixture was incubated for 20 min at
50°C (Park et al., 2002). This was followed by determination of reducing sugar by the
dinitrosalicylic acid method (Miller, 1959). Xylose was used as a standard. One unit
was defined as the amount of enzyme that releases 1μmol of xylose in 1 min under
assay conditions.
8.2.6 Optimisation of process parameters
8.2.6.1 Optimisation of physical parameters
In this study the three physical parameters pertaining to solid state fermentation viz.
temperature, moisture content and inoculum size (log no. of spores) was optimised by
the application of response surface methodology. A Box Behnken design was
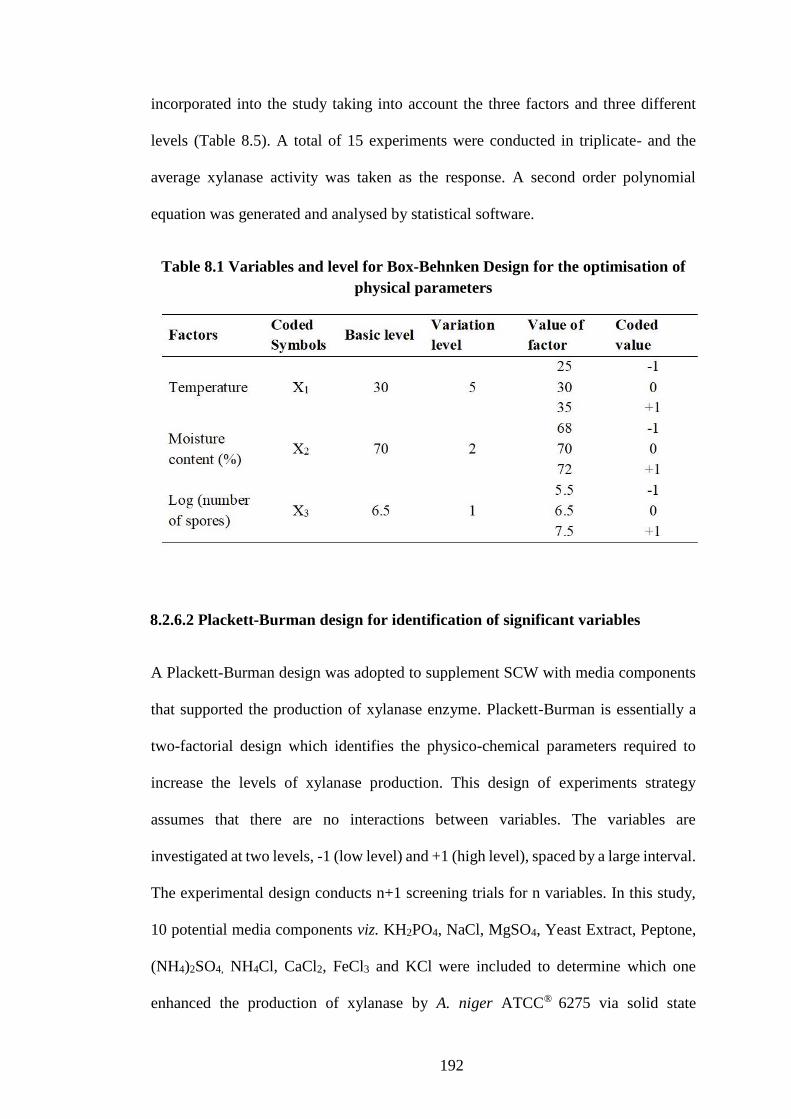
192
incorporated into the study taking into account the three factors and three different
levels (Table 8.5). A total of 15 experiments were conducted in triplicate- and the
average xylanase activity was taken as the response. A second order polynomial
equation was generated and analysed by statistical software.
Table 8.1 Variables and level for Box-Behnken Design for the optimisation of
physical parameters
8.2.6.2 Plackett-Burman design for identification of significant variables
A Plackett-Burman design was adopted to supplement SCW with media components
that supported the production of xylanase enzyme. Plackett-Burman is essentially a
two-factorial design which identifies the physico-chemical parameters required to
increase the levels of xylanase production. This design of experiments strategy
assumes that there are no interactions between variables. The variables are
investigated at two levels, -1 (low level) and +1 (high level), spaced by a large interval.
The experimental design conducts n+1 screening trials for n variables. In this study,
10 potential media components viz. KH2PO4, NaCl, MgSO4, Yeast Extract, Peptone,
(NH4)2SO4, NH4Cl, CaCl2, FeCl3 and KCl were included to determine which one
enhanced the production of xylanase by A. niger ATCC® 6275 via solid state
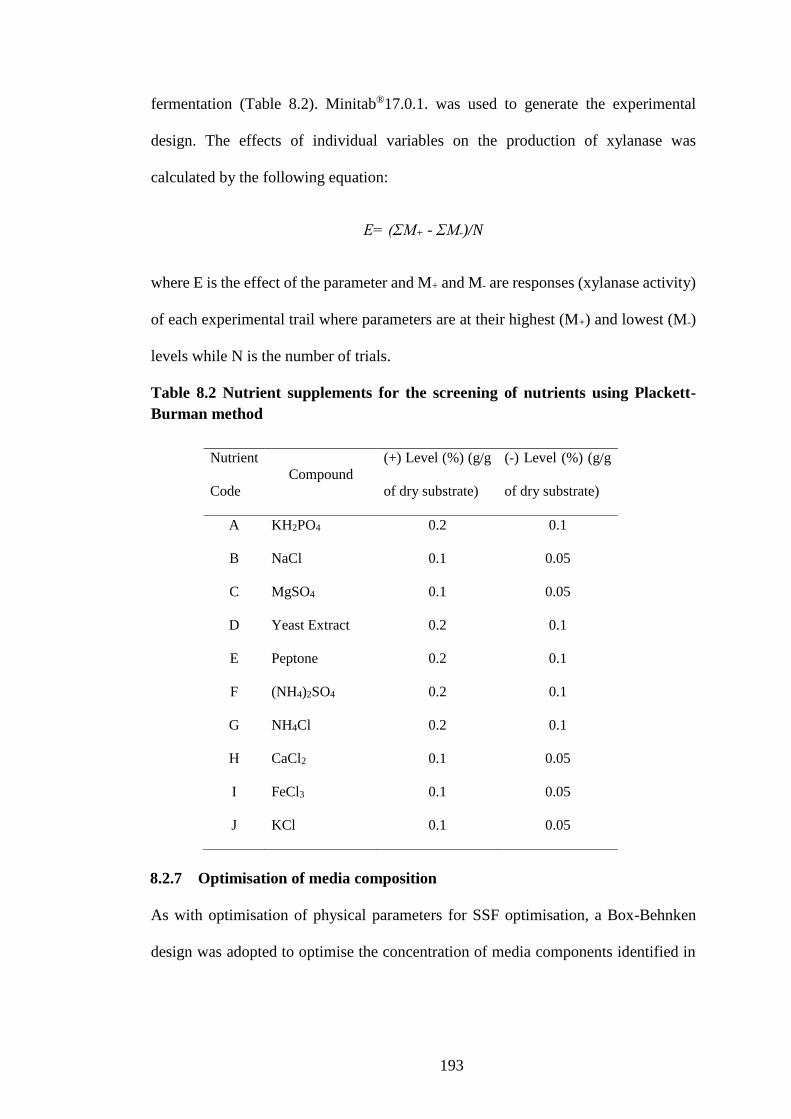
193
fermentation (Table 8.2). Minitab®17.0.1. was used to generate the experimental
design. The effects of individual variables on the production of xylanase was
calculated by the following equation:
E= (ΣM+ - ΣM-)/N
where E is the effect of the parameter and M+ and M- are responses (xylanase activity)
of each experimental trail where parameters are at their highest (M+) and lowest (M-)
levels while N is the number of trials.
Table 8.2 Nutrient supplements for the screening of nutrients using Plackett-
Burman method
8.2.7 Optimisation of media composition
As with optimisation of physical parameters for SSF optimisation, a Box-Behnken
design was adopted to optimise the concentration of media components identified in
Nutrient
Code
Compound
(+) Level (%) (g/g
of dry substrate)
(-) Level (%) (g/g
of dry substrate)
A KH2PO4 0.2 0.1
B NaCl 0.1 0.05
C MgSO4 0.1 0.05
D Yeast Extract 0.2 0.1
E Peptone 0.2 0.1
F (NH4)2SO4 0.2 0.1
G NH4Cl 0.2 0.1
H CaCl2 0.1 0.05
I FeCl3 0.1 0.05
J KCl 0.1 0.05
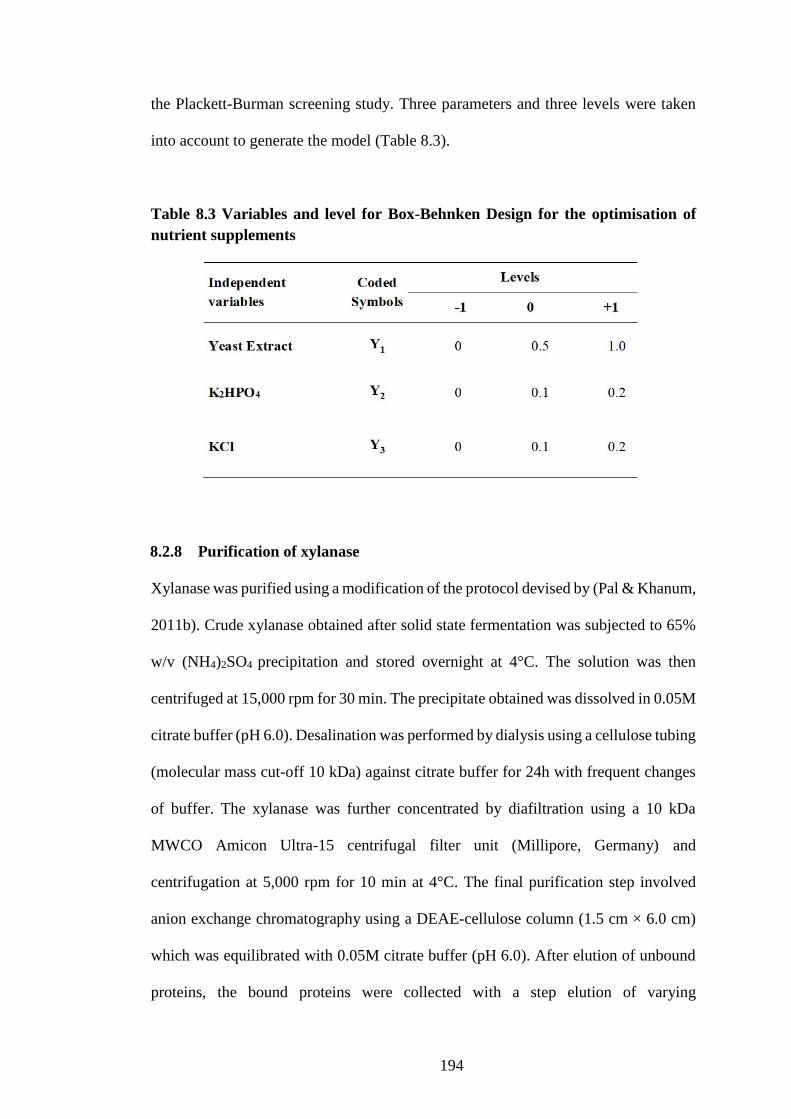
194
the Plackett-Burman screening study. Three parameters and three levels were taken
into account to generate the model (Table 8.3).
Table 8.3 Variables and level for Box-Behnken Design for the optimisation of
nutrient supplements
8.2.8 Purification of xylanase
Xylanase was purified using a modification of the protocol devised by (Pal & Khanum,
2011b). Crude xylanase obtained after solid state fermentation was subjected to 65%
w/v (NH4)2SO4 precipitation and stored overnight at 4°C. The solution was then
centrifuged at 15,000 rpm for 30 min. The precipitate obtained was dissolved in 0.05M
citrate buffer (pH 6.0). Desalination was performed by dialysis using a cellulose tubing
(molecular mass cut-off 10 kDa) against citrate buffer for 24h with frequent changes
of buffer. The xylanase was further concentrated by diafiltration using a 10 kDa
MWCO Amicon Ultra-15 centrifugal filter unit (Millipore, Germany) and
centrifugation at 5,000 rpm for 10 min at 4°C. The final purification step involved
anion exchange chromatography using a DEAE-cellulose column (1.5 cm × 6.0 cm)
which was equilibrated with 0.05M citrate buffer (pH 6.0). After elution of unbound
proteins, the bound proteins were collected with a step elution of varying
195
concentrations from 0.1~0.5M KCl in the same buffer by collecting 3 ml fractions
while maintaining a flow rate of 30 ml/h. The active fractions were pooled and
concentrated by ultrafiltration (10 kDa cut-off).
8.2.9 Application of xylanase for fruit juice clarification
8.2.10 Preparation of puree
Ripened varieties of three berries viz. strawberries (Fragaria ananassa), blueberries
(Cyanococcus) and raspberries (Rubus idaeus) were purchased from a local market in
Dublin city. They were thoroughly washed and inspected for any microbial growth
and stored at 4°C for not more than 2 days. The berries were macerated using a blender
until a smooth puree was obtained. The puree was then filtered using a cheese cloth to
separate the pulp from the juice.
8.2.11 Juice enrichment by xylanase treatment
The effectiveness of the purified xylanase for juice clarification was inspected by
determining the incubation time, the incubation temperature and enzyme dosage. The
dosage used for juice clarification was optimised between the ranges of 5 to 25 U/g of
fruit pulp. The incubation time and temperature required for optimal reducing sugar
release, juice yield and clarification were determined by conducting experimental
trials at different temperatures, ranging from 30°C to 60°C for different time periods
(30-120 min). For enzyme dosage and incubation experimental trials, pulp devoid of
any enzyme at a retention time of 0 was taken as control. However, pulp maintained
at 27°C was used as control for temperature optimisation experiments. After each
experiment, the enzymes were deactivated by subjecting the pulp to 80°C for two
minutes, after which the pulp was strained through a cheese cloth to obtain juice after
enzymatic treatment.
196
8.2.12 Determination of reducing sugar and clarity
The clarity in the pulp was measured by determining the percentage transmittance. A
UV-VIS spectrophotometer (Perkin Elmer Lambda 900, US) was employed for this
purpose. Transmittance was measured at a wavelength of 660 nm. Distilled water was
used as reference. Juice clarity was estimated as a measure of percentage
transmittance. The release of reducing sugar from puree following enzymatic
treatment was measured by using dinitrosalicylic acid method (Miller, 1959). For yield
measurement, the enzymatically treated fruit pulp was filtered using filter paper
(Whatman No. 1). The filtrate was measured, and the yield was expressed as % w/v
(Pal & Khanum, 2011a).
8.3 Results and Discussion
8.3.1 Optimisation of fermentation parameters
SCW was initially subjected to lipid extraction process followed by organosolv
pretreatment as a part of the upstream processing strategy. The detailed observations
of these experiments have been published in literature elsewhere as part of different
studies performed in our facility (Ravindran et al., 2018; Ravindran et al., 2017).
According to our study, 13.4% of the total weight of dry SCW was contributed by
lipids (results not shown). Furthermore, SCW was found to be high in hemicellulose
content. This fraction of the biomass was subjected to organosolv pretreatment to
enhance xylanase production.
Solid state fermentation for xylanase production using pre-treated SSF was conducted
by the application of a Box-Behnken Design. Three parameters viz. temperature,
moisture content and inoculum size were taken into consideration for optimisation.
Table 8.4 represents the variables, and each variation level. The theoretical and
197
observed xylanase activity with respect to the Box-Behnken design has been provided
in Table 1c. The models were compared based on the coefficient of determination (R2)
and adjusted coefficient of determination (R2-adj). The R2 is the regression of sum of
squares proportion to the total sum of squares and illustrates the adequacy of a model.
R2 ranges from 0 to 1, and a value closer to 1 indicates that the model is considerably
accurate. A value of 99.65% R2 was observed in the present study, while R2-adj was
97.04%, illustrating that the model adequately fitted the data. The results obtained
from the Box Behnken design were fitted to a second order polynomial equation. The
polynomial equation for the model is given below:
Xylanase activity (U/g) = – 1.04829×10⁶ + 2508.5×X1 + 27204.3×X2+ 17259.2×X3 –
20.65×X12 – 18.2×X1×X2 – 12.15×X1×X3 – 184.813×X2
2 –
88.125×X2×X3 – 778.0×X32
where X1, X2 and X3 represents temperature (°C), moisture content [% (w/w)] and
inoculum size (log no. of spores/g of dry substrate).
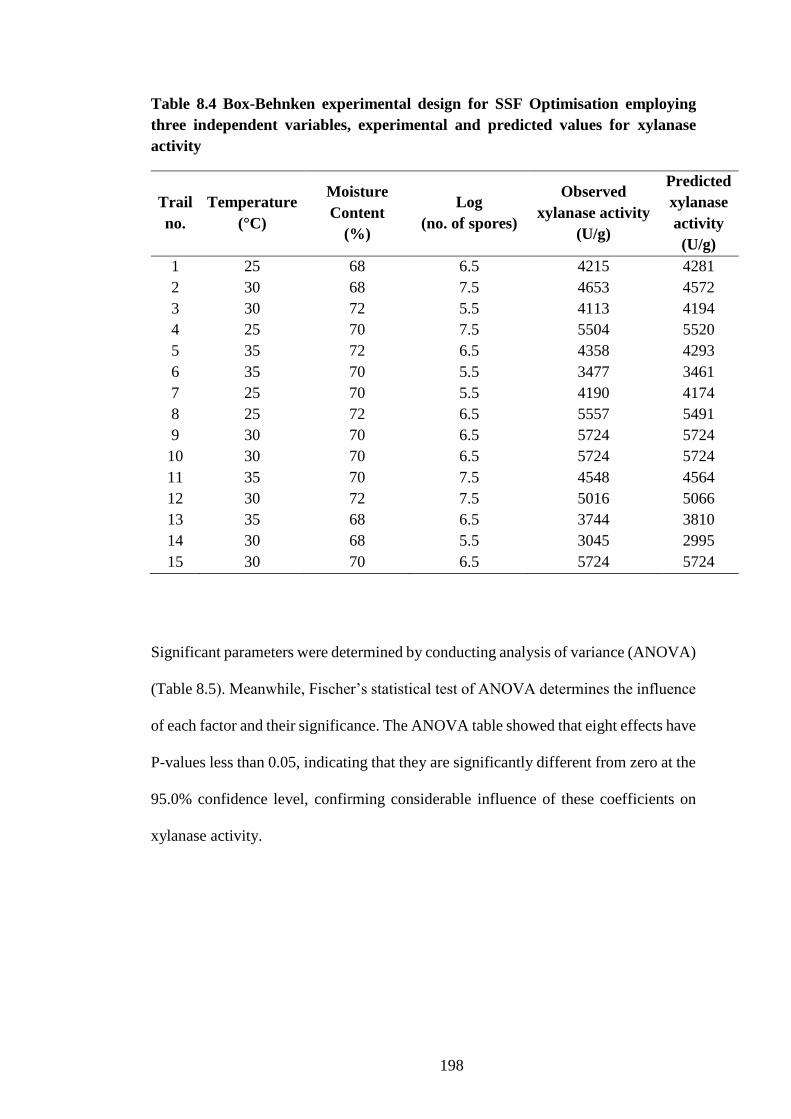
198
Table 8.4 Box-Behnken experimental design for SSF Optimisation employing
three independent variables, experimental and predicted values for xylanase
activity
Trail
no.
Temperature
(°C)
Moisture
Content
(%)
Log
(no. of spores)
Observed
xylanase activity
(U/g)
Predicted
xylanase
activity
(U/g)
1 25 68 6.5 4215 4281
2 30 68 7.5 4653 4572
3 30 72 5.5 4113 4194
4 25 70 7.5 5504 5520
5 35 72 6.5 4358 4293
6 35 70 5.5 3477 3461
7 25 70 5.5 4190 4174
8 25 72 6.5 5557 5491
9 30 70 6.5 5724 5724
10 30 70 6.5 5724 5724
11 35 70 7.5 4548 4564
12 30 72 7.5 5016 5066
13 35 68 6.5 3744 3810
14 30 68 5.5 3045 2995
15 30 70 6.5 5724 5724
Significant parameters were determined by conducting analysis of variance (ANOVA)
(Table 8.5). Meanwhile, Fischer’s statistical test of ANOVA determines the influence
of each factor and their significance. The ANOVA table showed that eight effects have
P-values less than 0.05, indicating that they are significantly different from zero at the
95.0% confidence level, confirming considerable influence of these coefficients on
xylanase activity.
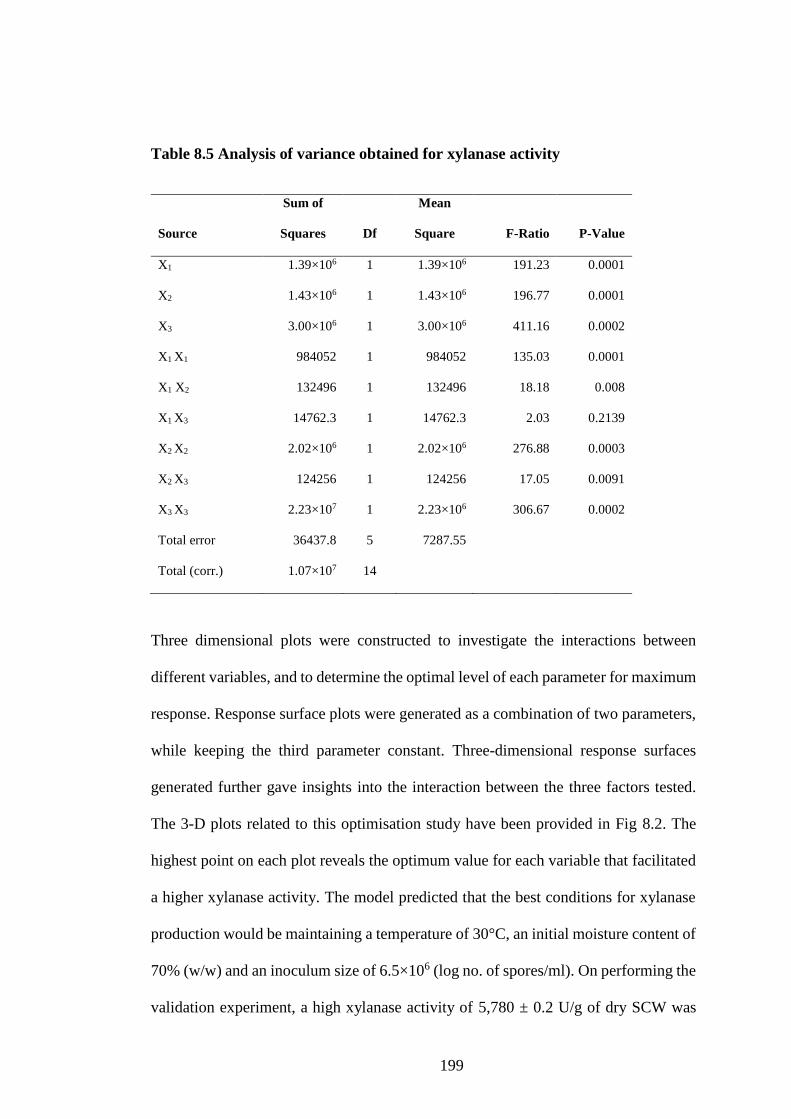
199
Table 8.5 Analysis of variance obtained for xylanase activity
Source
Sum of
Squares Df
Mean
Square F-Ratio P-Value
X1 1.39×10⁶ 1 1.39×10⁶ 191.23 0.0001
X2 1.43×10⁶ 1 1.43×10⁶ 196.77 0.0001
X3 3.00×10⁶ 1 3.00×10⁶ 411.16 0.0002
X1 X1 984052 1 984052 135.03 0.0001
X1 X2 132496 1 132496 18.18 0.008
X1 X3 14762.3 1 14762.3 2.03 0.2139
X2 X2 2.02×10⁶ 1 2.02×10⁶ 276.88 0.0003
X2 X3 124256 1 124256 17.05 0.0091
X3 X3 2.23×10⁷ 1 2.23×10⁶ 306.67 0.0002
Total error 36437.8 5 7287.55
Total (corr.) 1.07×10⁷ 14
Three dimensional plots were constructed to investigate the interactions between
different variables, and to determine the optimal level of each parameter for maximum
response. Response surface plots were generated as a combination of two parameters,
while keeping the third parameter constant. Three-dimensional response surfaces
generated further gave insights into the interaction between the three factors tested.
The 3-D plots related to this optimisation study have been provided in Fig 8.2. The
highest point on each plot reveals the optimum value for each variable that facilitated
a higher xylanase activity. The model predicted that the best conditions for xylanase
production would be maintaining a temperature of 30°C, an initial moisture content of
70% (w/w) and an inoculum size of 6.5×10⁶ (log no. of spores/ml). On performing the
validation experiment, a high xylanase activity of 5,780 ± 0.2 U/g of dry SCW was
200
recorded. The model predicted a xylanase activity of 6068 U/g of SCW, which
suggested minimum disparity (<5%) between predicted and observed values. This also
indicated that the model was adequate to predict the optimum values for variables
considered for xylanase production when adopting a SSF mode. Similar observations
were reported in other studies investigating lignocellulosic residues for xylanase
production via SSF. For example, Pal and Khanum (2010) were able to achieve a 4.5-
fold increase in xylanase activity using various lignocellulosic substrates and by
moistening the media to 70%.
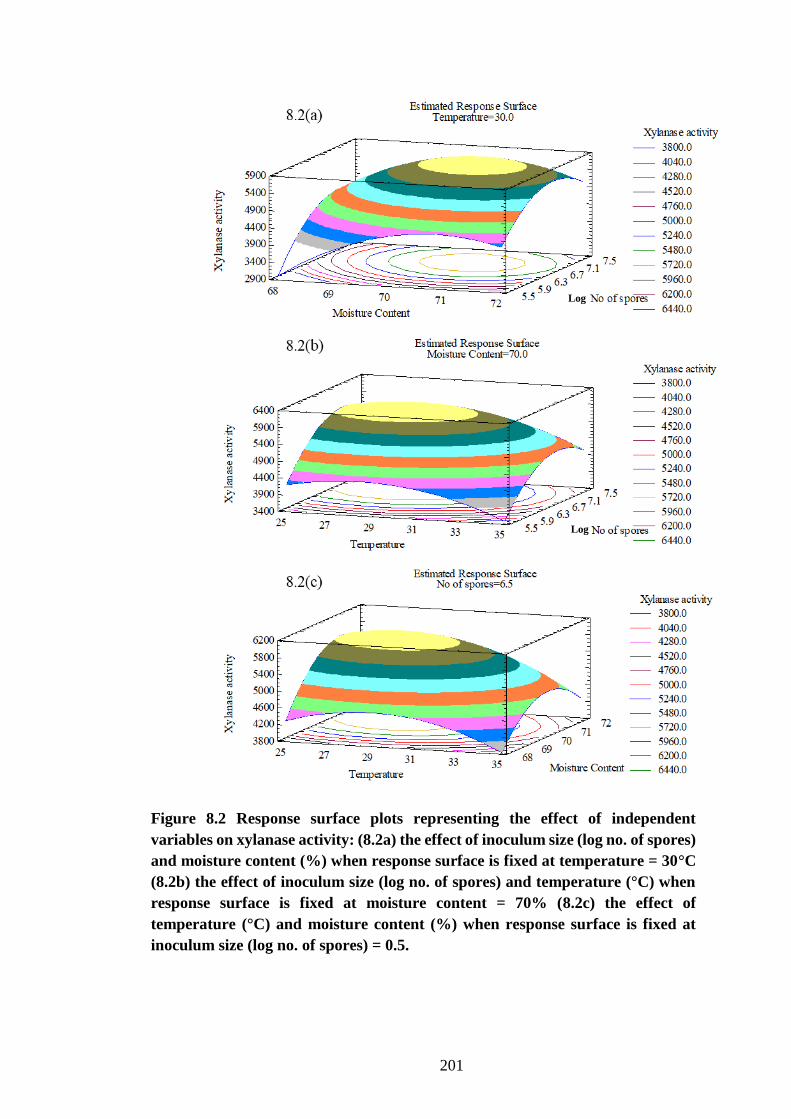
201
Figure 8.2 Response surface plots representing the effect of independent
variables on xylanase activity: (8.2a) the effect of inoculum size (log no. of spores)
and moisture content (%) when response surface is fixed at temperature = 30°C
(8.2b) the effect of inoculum size (log no. of spores) and temperature (°C) when
response surface is fixed at moisture content = 70% (8.2c) the effect of
temperature (°C) and moisture content (%) when response surface is fixed at
inoculum size (log no. of spores) = 0.5.
Log
Log
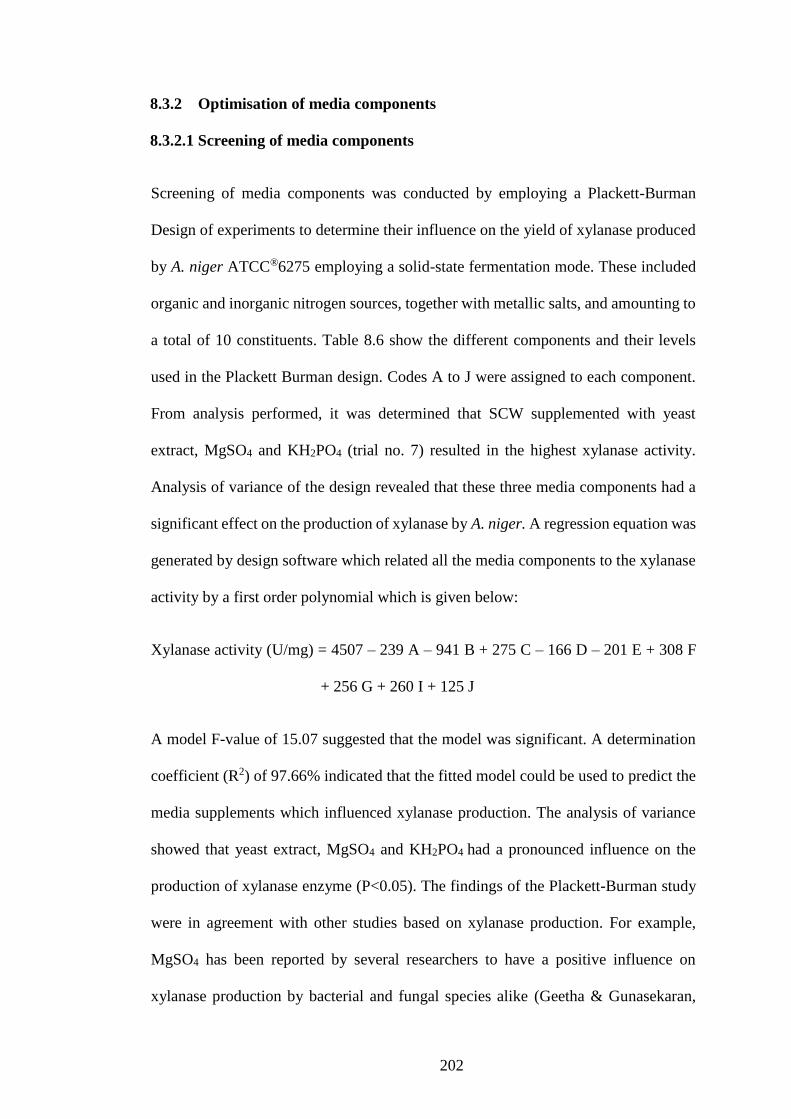
202
8.3.2 Optimisation of media components
8.3.2.1 Screening of media components
Screening of media components was conducted by employing a Plackett-Burman
Design of experiments to determine their influence on the yield of xylanase produced
by A. niger ATCC®6275 employing a solid-state fermentation mode. These included
organic and inorganic nitrogen sources, together with metallic salts, and amounting to
a total of 10 constituents. Table 8.6 show the different components and their levels
used in the Plackett Burman design. Codes A to J were assigned to each component.
From analysis performed, it was determined that SCW supplemented with yeast
extract, MgSO4 and KH2PO4 (trial no. 7) resulted in the highest xylanase activity.
Analysis of variance of the design revealed that these three media components had a
significant effect on the production of xylanase by A. niger. A regression equation was
generated by design software which related all the media components to the xylanase
activity by a first order polynomial which is given below:
Xylanase activity (U/mg) = 4507 – 239 A – 941 B + 275 C – 166 D – 201 E + 308 F
+ 256 G + 260 I + 125 J
A model F-value of 15.07 suggested that the model was significant. A determination
coefficient (R2) of 97.66% indicated that the fitted model could be used to predict the
media supplements which influenced xylanase production. The analysis of variance
showed that yeast extract, MgSO4 and KH2PO4 had a pronounced influence on the
production of xylanase enzyme (P<0.05). The findings of the Plackett-Burman study
were in agreement with other studies based on xylanase production. For example,
MgSO4 has been reported by several researchers to have a positive influence on
xylanase production by bacterial and fungal species alike (Geetha & Gunasekaran,
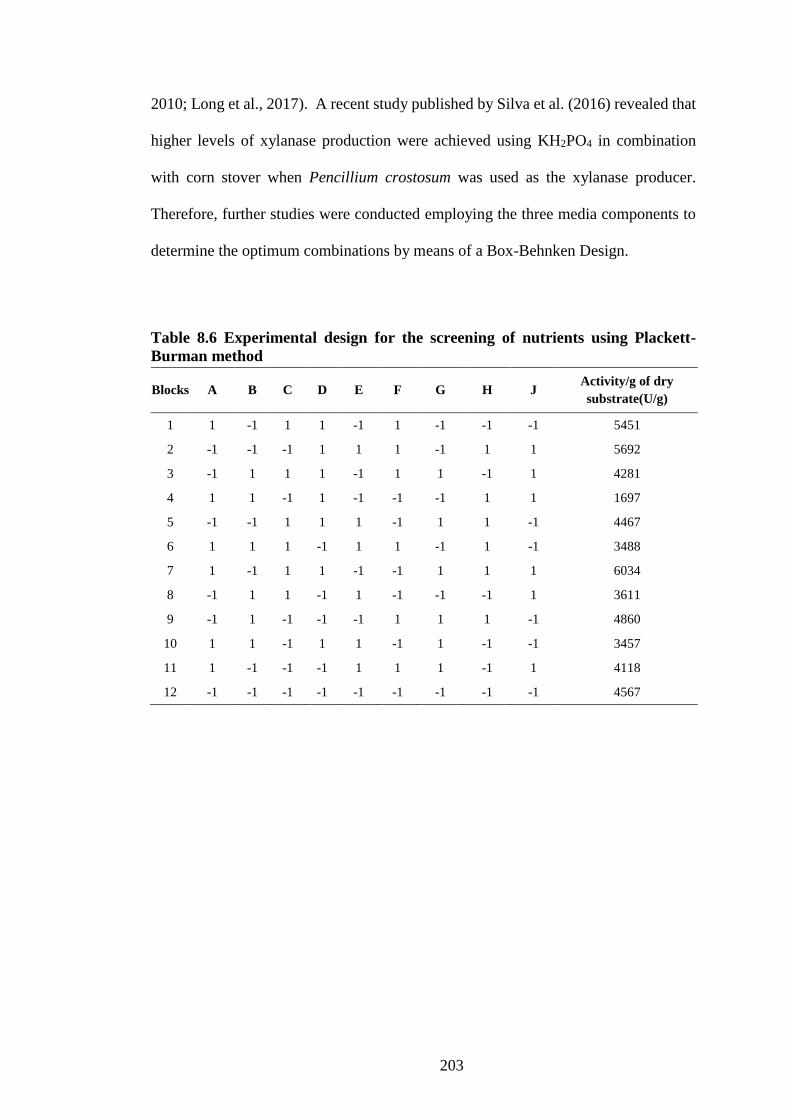
203
2010; Long et al., 2017). A recent study published by Silva et al. (2016) revealed that
higher levels of xylanase production were achieved using KH2PO4 in combination
with corn stover when Pencillium crostosum was used as the xylanase producer.
Therefore, further studies were conducted employing the three media components to
determine the optimum combinations by means of a Box-Behnken Design.
Table 8.6 Experimental design for the screening of nutrients using Plackett-
Burman method
Blocks A B C D E F G H J Activity/g of dry
substrate(U/g)
1 1 -1 1 1 -1 1 -1 -1 -1 5451
2 -1 -1 -1 1 1 1 -1 1 1 5692
3 -1 1 1 1 -1 1 1 -1 1 4281
4 1 1 -1 1 -1 -1 -1 1 1 1697
5 -1 -1 1 1 1 -1 1 1 -1 4467
6 1 1 1 -1 1 1 -1 1 -1 3488
7 1 -1 1 1 -1 -1 1 1 1 6034
8 -1 1 1 -1 1 -1 -1 -1 1 3611
9 -1 1 -1 -1 -1 1 1 1 -1 4860
10 1 1 -1 1 1 -1 1 -1 -1 3457
11 1 -1 -1 -1 1 1 1 -1 1 4118
12 -1 -1 -1 -1 -1 -1 -1 -1 -1 4567
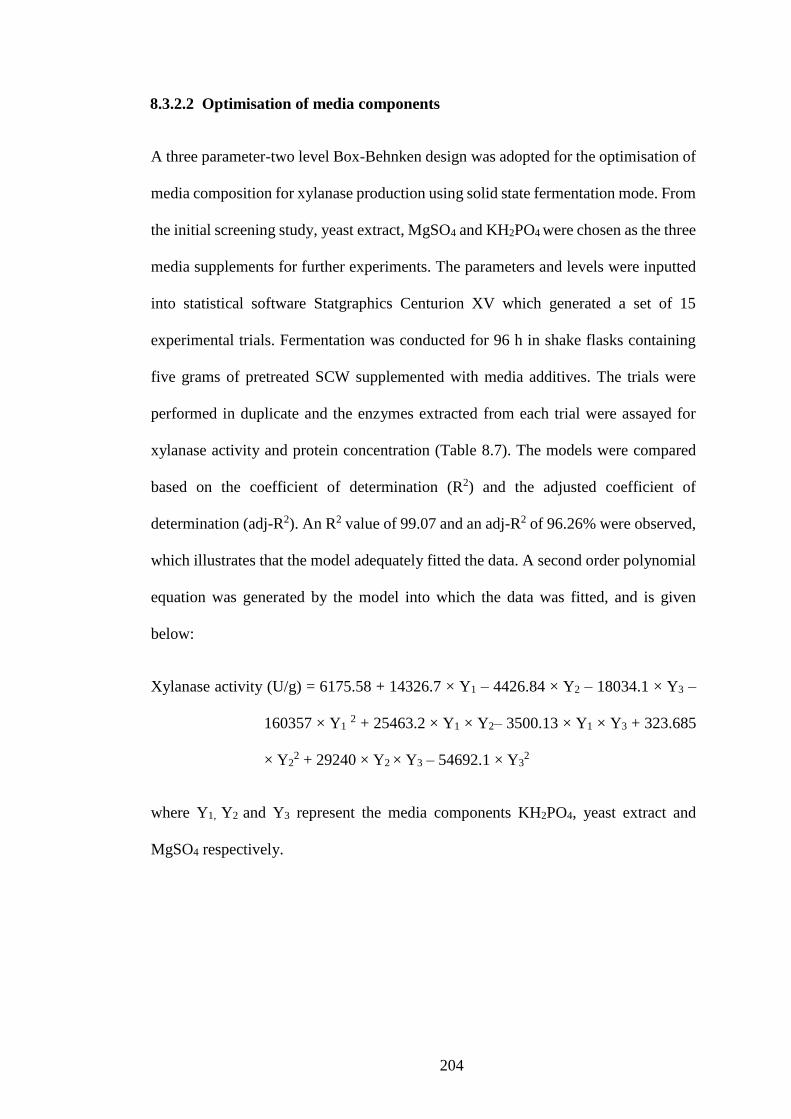
204
8.3.2.2 Optimisation of media components
A three parameter-two level Box-Behnken design was adopted for the optimisation of
media composition for xylanase production using solid state fermentation mode. From
the initial screening study, yeast extract, MgSO4 and KH2PO4 were chosen as the three
media supplements for further experiments. The parameters and levels were inputted
into statistical software Statgraphics Centurion XV which generated a set of 15
experimental trials. Fermentation was conducted for 96 h in shake flasks containing
five grams of pretreated SCW supplemented with media additives. The trials were
performed in duplicate and the enzymes extracted from each trial were assayed for
xylanase activity and protein concentration (Table 8.7). The models were compared
based on the coefficient of determination (R2) and the adjusted coefficient of
determination (adj-R2). An R2 value of 99.07 and an adj-R2 of 96.26% were observed,
which illustrates that the model adequately fitted the data. A second order polynomial
equation was generated by the model into which the data was fitted, and is given
below:
Xylanase activity (U/g) = 6175.58 + 14326.7 × Y1 – 4426.84 × Y2 – 18034.1 × Y3 –
160357 × Y1 2 + 25463.2 × Y1 × Y2– 3500.13 × Y1 × Y3 + 323.685
× Y22 + 29240 × Y2 × Y3 – 54692.1 × Y3
2
where Y1, Y2 and Y3 represent the media components KH2PO4, yeast extract and
MgSO4 respectively.
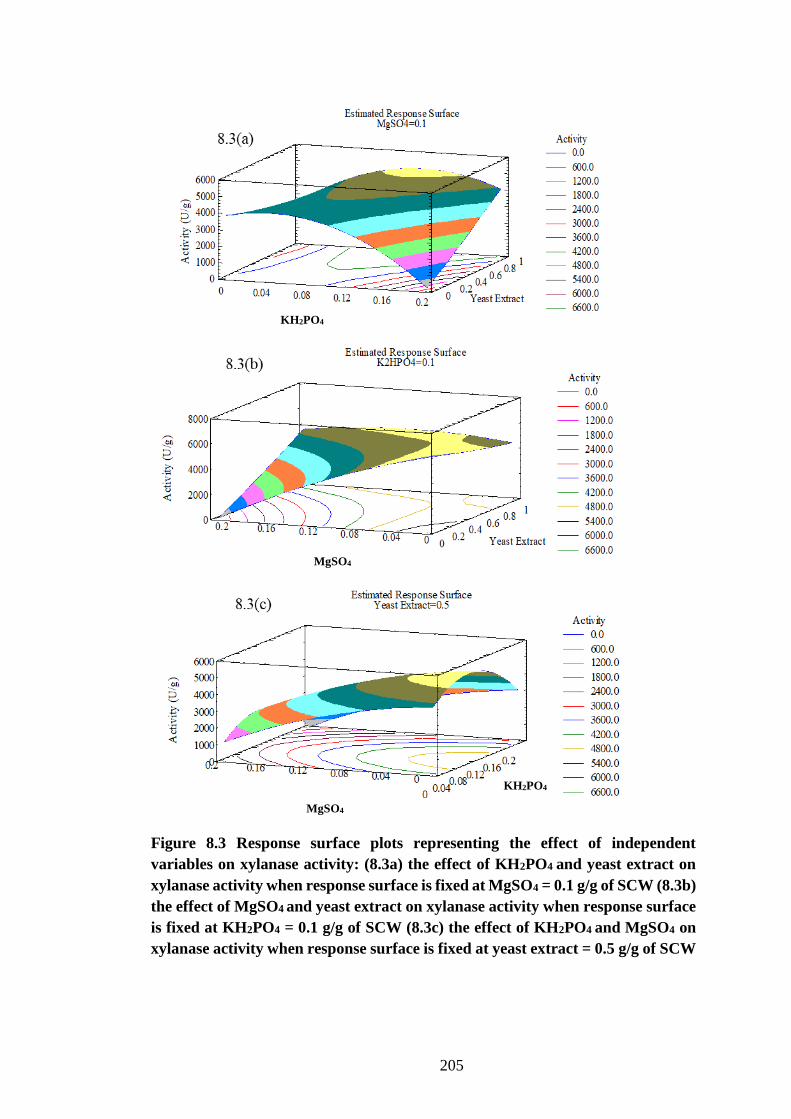
205
Figure 8.3 Response surface plots representing the effect of independent
variables on xylanase activity: (8.3a) the effect of KH2PO4 and yeast extract on
xylanase activity when response surface is fixed at MgSO4 = 0.1 g/g of SCW (8.3b)
the effect of MgSO4 and yeast extract on xylanase activity when response surface
is fixed at KH2PO4 = 0.1 g/g of SCW (8.3c) the effect of KH2PO4 and MgSO4 on
xylanase activity when response surface is fixed at yeast extract = 0.5 g/g of SCW
MgSO4
KH2PO4
MgSO4
KH2PO4
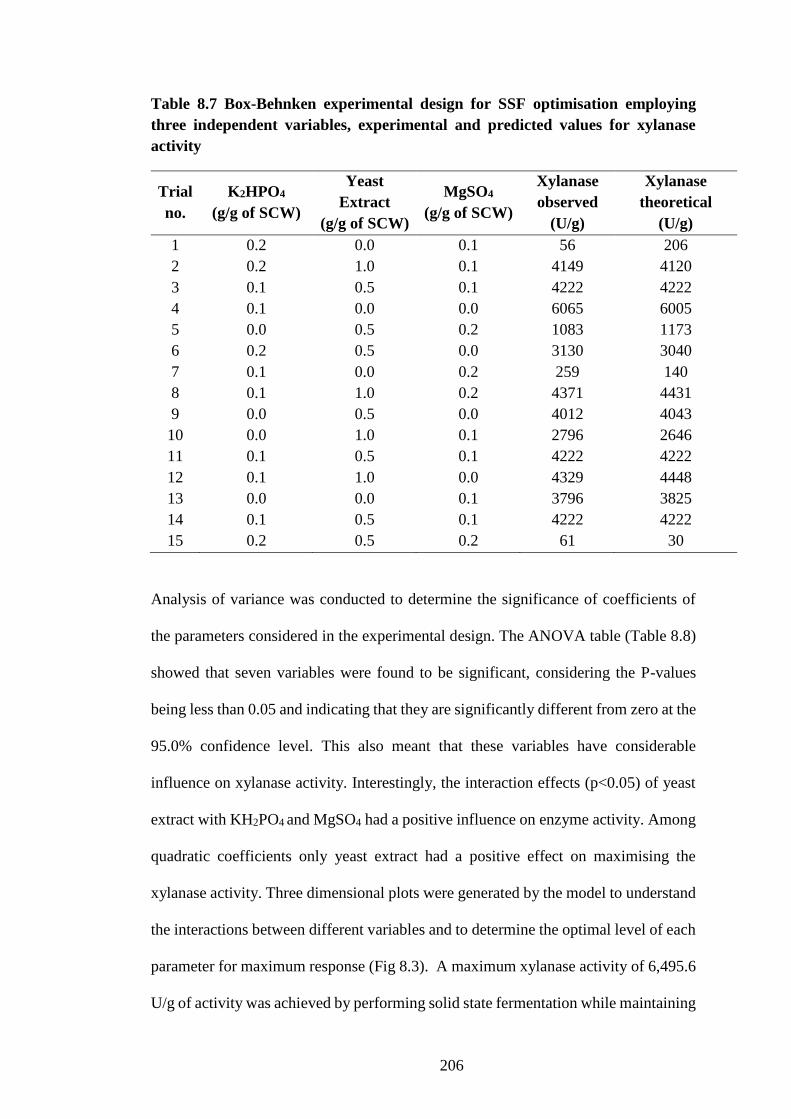
206
Table 8.7 Box-Behnken experimental design for SSF optimisation employing
three independent variables, experimental and predicted values for xylanase
activity
Trial
no.
K2HPO4
(g/g of SCW)
Yeast
Extract
(g/g of SCW)
MgSO4
(g/g of SCW)
Xylanase
observed
(U/g)
Xylanase
theoretical
(U/g)
1 0.2 0.0 0.1 56 206
2 0.2 1.0 0.1 4149 4120
3 0.1 0.5 0.1 4222 4222
4 0.1 0.0 0.0 6065 6005
5 0.0 0.5 0.2 1083 1173
6 0.2 0.5 0.0 3130 3040
7 0.1 0.0 0.2 259 140
8 0.1 1.0 0.2 4371 4431
9 0.0 0.5 0.0 4012 4043
10 0.0 1.0 0.1 2796 2646
11 0.1 0.5 0.1 4222 4222
12 0.1 1.0 0.0 4329 4448
13 0.0 0.0 0.1 3796 3825
14 0.1 0.5 0.1 4222 4222
15 0.2 0.5 0.2 61 30
Analysis of variance was conducted to determine the significance of coefficients of
the parameters considered in the experimental design. The ANOVA table (Table 8.8)
showed that seven variables were found to be significant, considering the P-values
being less than 0.05 and indicating that they are significantly different from zero at the
95.0% confidence level. This also meant that these variables have considerable
influence on xylanase activity. Interestingly, the interaction effects (p<0.05) of yeast
extract with KH2PO4 and MgSO4 had a positive influence on enzyme activity. Among
quadratic coefficients only yeast extract had a positive effect on maximising the
xylanase activity. Three dimensional plots were generated by the model to understand
the interactions between different variables and to determine the optimal level of each
parameter for maximum response (Fig 8.3). A maximum xylanase activity of 6,495.6
U/g of activity was achieved by performing solid state fermentation while maintaining
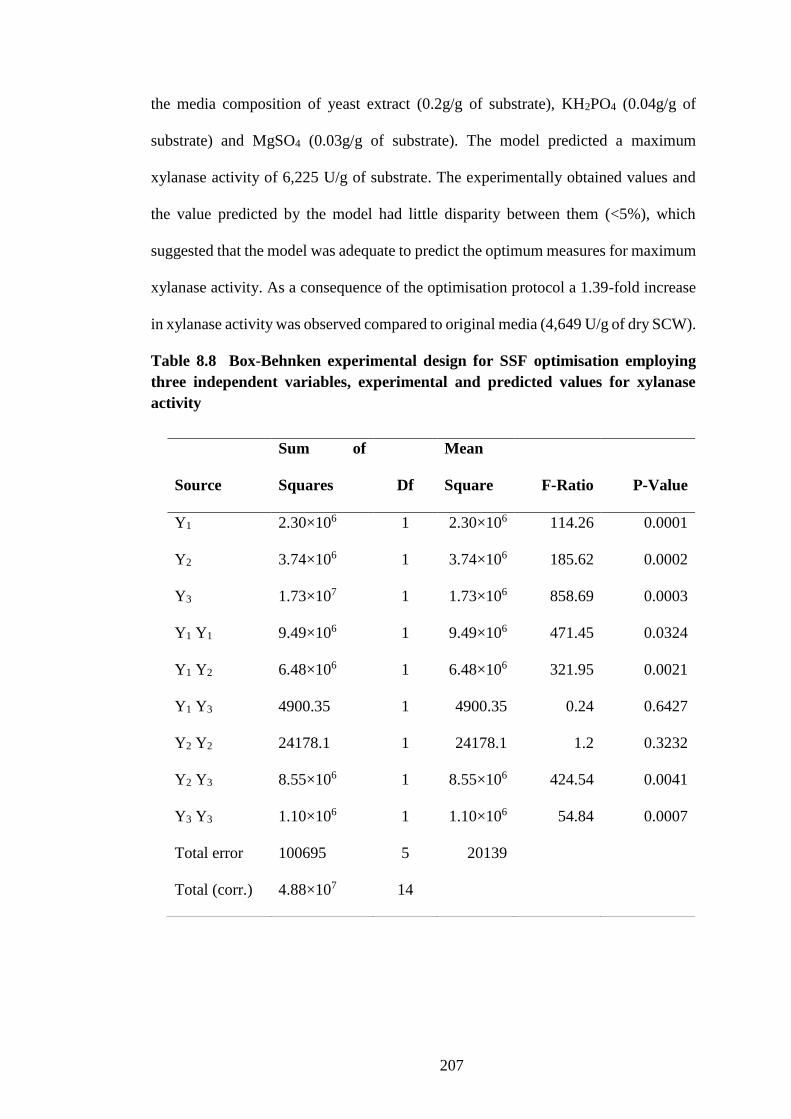
207
the media composition of yeast extract (0.2g/g of substrate), KH2PO4 (0.04g/g of
substrate) and MgSO4 (0.03g/g of substrate). The model predicted a maximum
xylanase activity of 6,225 U/g of substrate. The experimentally obtained values and
the value predicted by the model had little disparity between them (<5%), which
suggested that the model was adequate to predict the optimum measures for maximum
xylanase activity. As a consequence of the optimisation protocol a 1.39-fold increase
in xylanase activity was observed compared to original media (4,649 U/g of dry SCW).
Table 8.8 Box-Behnken experimental design for SSF optimisation employing
three independent variables, experimental and predicted values for xylanase
activity
Source
Sum of
Squares Df
Mean
Square F-Ratio P-Value
Y1 2.30×10⁶ 1 2.30×10⁶ 114.26 0.0001
Y2 3.74×10⁶ 1 3.74×10⁶ 185.62 0.0002
Y3 1.73×10⁷ 1 1.73×10⁶ 858.69 0.0003
Y1 Y1 9.49×10⁶ 1 9.49×10⁶ 471.45 0.0324
Y1 Y2 6.48×10⁶ 1 6.48×10⁶ 321.95 0.0021
Y1 Y3 4900.35 1 4900.35 0.24 0.6427
Y2 Y2 24178.1 1 24178.1 1.2 0.3232
Y2 Y3 8.55×10⁶ 1 8.55×10⁶ 424.54 0.0041
Y3 Y3 1.10×10⁶ 1 1.10×10⁶ 54.84 0.0007
Total error 100695 5 20139
Total (corr.) 4.88×10⁷ 14
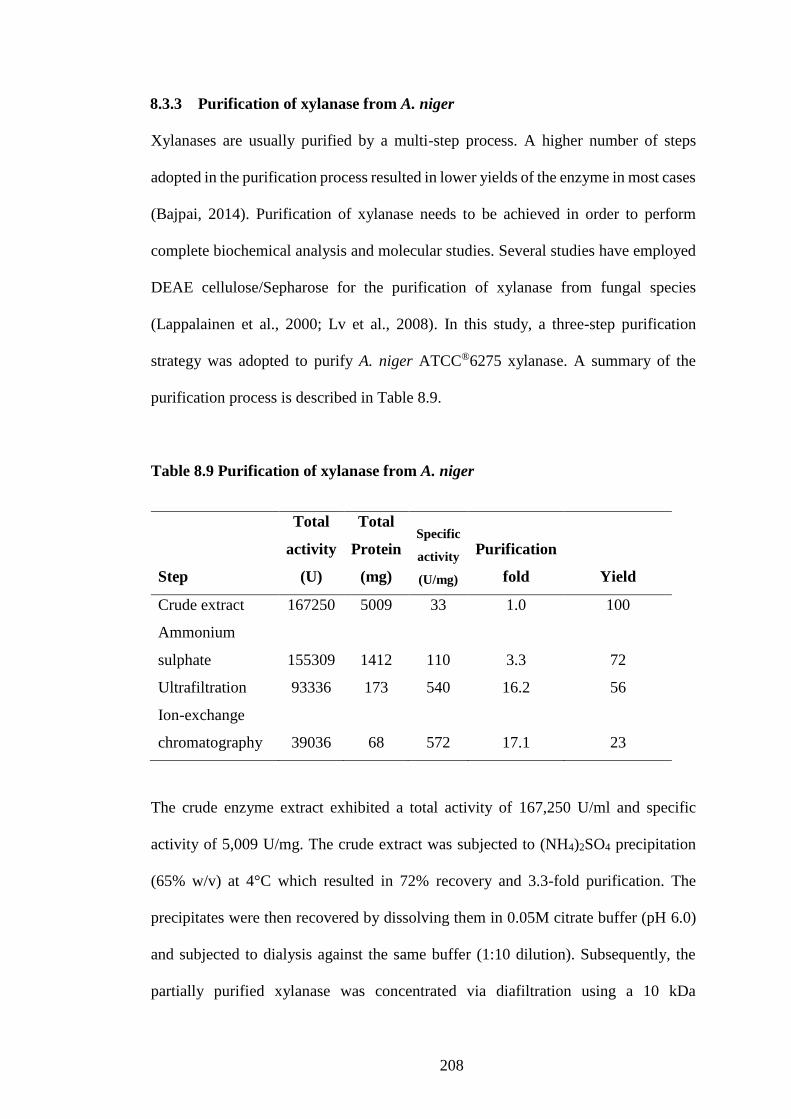
208
8.3.3 Purification of xylanase from A. niger
Xylanases are usually purified by a multi-step process. A higher number of steps
adopted in the purification process resulted in lower yields of the enzyme in most cases
(Bajpai, 2014). Purification of xylanase needs to be achieved in order to perform
complete biochemical analysis and molecular studies. Several studies have employed
DEAE cellulose/Sepharose for the purification of xylanase from fungal species
(Lappalainen et al., 2000; Lv et al., 2008). In this study, a three-step purification
strategy was adopted to purify A. niger ATCC®6275 xylanase. A summary of the
purification process is described in Table 8.9.
Table 8.9 Purification of xylanase from A. niger
Step
Total
activity
(U)
Total
Protein
(mg)
Specific
activity
(U/mg)
Purification
fold Yield
Crude extract 167250 5009 33 1.0 100
Ammonium
sulphate 155309 1412 110 3.3 72
Ultrafiltration 93336 173 540 16.2 56
Ion-exchange
chromatography 39036 68 572 17.1 23
The crude enzyme extract exhibited a total activity of 167,250 U/ml and specific
activity of 5,009 U/mg. The crude extract was subjected to (NH4)2SO4 precipitation
(65% w/v) at 4°C which resulted in 72% recovery and 3.3-fold purification. The
precipitates were then recovered by dissolving them in 0.05M citrate buffer (pH 6.0)
and subjected to dialysis against the same buffer (1:10 dilution). Subsequently, the
partially purified xylanase was concentrated via diafiltration using a 10 kDa
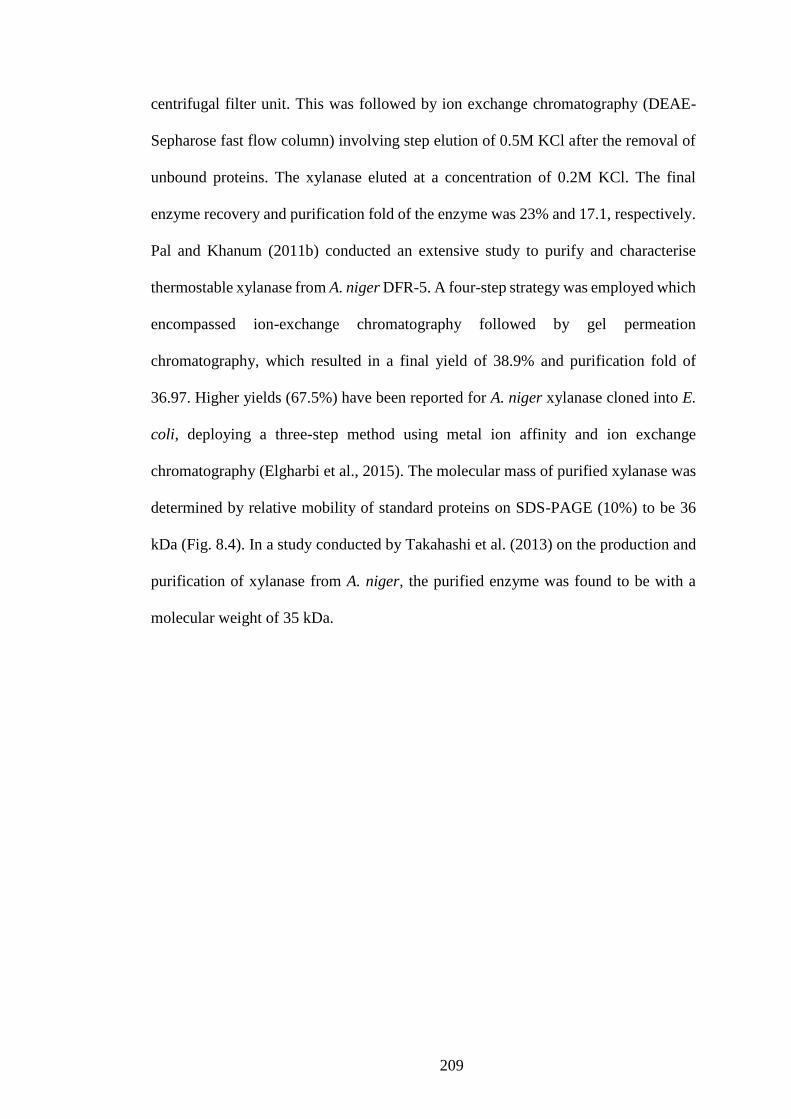
209
centrifugal filter unit. This was followed by ion exchange chromatography (DEAE-
Sepharose fast flow column) involving step elution of 0.5M KCl after the removal of
unbound proteins. The xylanase eluted at a concentration of 0.2M KCl. The final
enzyme recovery and purification fold of the enzyme was 23% and 17.1, respectively.
Pal and Khanum (2011b) conducted an extensive study to purify and characterise
thermostable xylanase from A. niger DFR-5. A four-step strategy was employed which
encompassed ion-exchange chromatography followed by gel permeation
chromatography, which resulted in a final yield of 38.9% and purification fold of
36.97. Higher yields (67.5%) have been reported for A. niger xylanase cloned into E.
coli, deploying a three-step method using metal ion affinity and ion exchange
chromatography (Elgharbi et al., 2015). The molecular mass of purified xylanase was
determined by relative mobility of standard proteins on SDS-PAGE (10%) to be 36
kDa (Fig. 8.4). In a study conducted by Takahashi et al. (2013) on the production and
purification of xylanase from A. niger, the purified enzyme was found to be with a
molecular weight of 35 kDa.
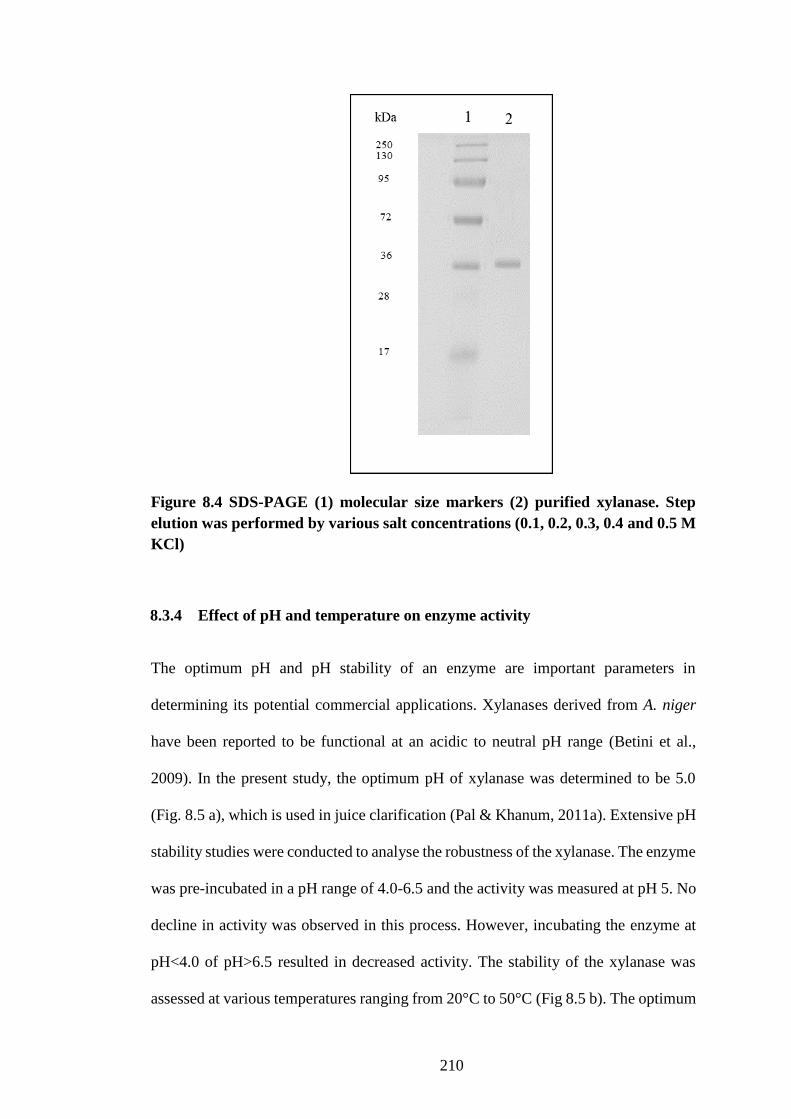
210
Figure 8.4 SDS-PAGE (1) molecular size markers (2) purified xylanase. Step
elution was performed by various salt concentrations (0.1, 0.2, 0.3, 0.4 and 0.5 M
KCl)
8.3.4 Effect of pH and temperature on enzyme activity
The optimum pH and pH stability of an enzyme are important parameters in
determining its potential commercial applications. Xylanases derived from A. niger
have been reported to be functional at an acidic to neutral pH range (Betini et al.,
2009). In the present study, the optimum pH of xylanase was determined to be 5.0
(Fig. 8.5 a), which is used in juice clarification (Pal & Khanum, 2011a). Extensive pH
stability studies were conducted to analyse the robustness of the xylanase. The enzyme
was pre-incubated in a pH range of 4.0-6.5 and the activity was measured at pH 5. No
decline in activity was observed in this process. However, incubating the enzyme at
pH<4.0 of pH>6.5 resulted in decreased activity. The stability of the xylanase was
assessed at various temperatures ranging from 20°C to 50°C (Fig 8.5 b). The optimum
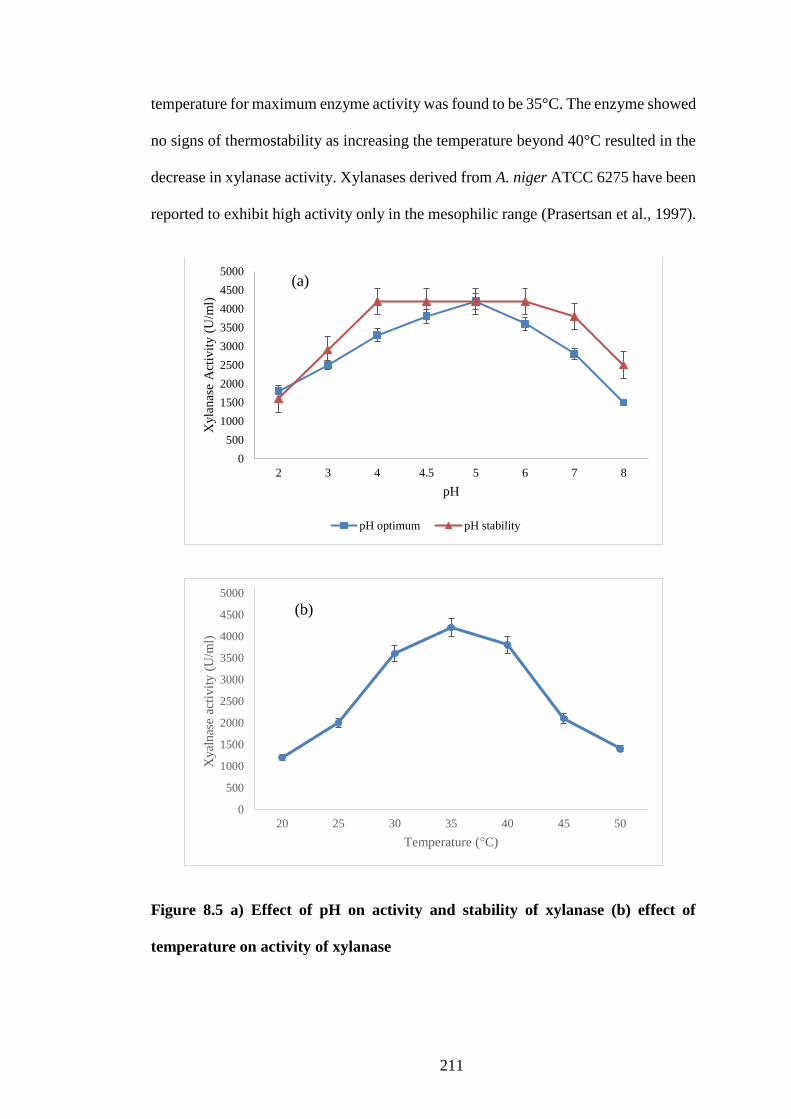
211
temperature for maximum enzyme activity was found to be 35°C. The enzyme showed
no signs of thermostability as increasing the temperature beyond 40°C resulted in the
decrease in xylanase activity. Xylanases derived from A. niger ATCC 6275 have been
reported to exhibit high activity only in the mesophilic range (Prasertsan et al., 1997).
Figure 8.5 a) Effect of pH on activity and stability of xylanase (b) effect of
temperature on activity of xylanase
0
500
1000
1500
2000
2500
3000
3500
4000
4500
5000
2 3 4 4.5 5 6 7 8
Xyla
nas
e A
ctiv
ity (
U/m
l)
pH
pH optimum pH stability
0
500
1000
1500
2000
2500
3000
3500
4000
4500
5000
20 25 30 35 40 45 50
Xyal
nas
e ac
tivit
y (
U/m
l)
Temperature (°C)
(a)
(b)
212
8.3.5 Application of xylanase in fruit juice enrichment
The potential application of purified A. niger xylanase was investigated for the
enrichment of strawberry, blueberry and raspberry pulps. Enzyme activity decreases
its water holding capacity of the fruit pulp by digesting the cell wall materials which
increases the yield and clarity of the fruit pulp. Therefore, three variables viz. enzyme
dosage, incubation time and incubation temperature were included in this study. The
efficacy of the enzyme as an enhancement measure was examined by estimating the
variations in juice yield (%), clarity (%) and reducing sugars (%).
8.3.6 Effect of enzyme dosage
The optimum enzyme dosage for clarification of the different fruit pulp juices was
determined. A range of concentrations varying from 5 to 25 U/gram fruit pulp were
investigated at room temperature (25°C) for 60 min. Fruit pulp treated with heat
inactivated xylanase was taken as100% for each experiment. The optimum enzyme
dosage with respect to reducing sugar content, clarity and juice yield differed with
respect to each variety of fruit pulp (Fig 8.6). For example, the reducing sugar content,
clarity and yield increased as the dosage was increased up to 10~15 U/gfp. While a
dosage of 10 U/gfp was found to be ideal for strawberry, 15 U/gfp was found to be the
optimum for blueberry and raspberry with respect to achieving higher reducing sugar
content, yield and clarity. Fruits commonly consist of a primary cell wall which is
composed of cellulose, hemicellulose and embedded lignin, and in certain cases,
pectin. The middle lamella functions as the connecting agent that holds the cells
together (Goulao & Oliveira, 2008). Enzymatic treatment of fruit pulp results in the
hydrolysis of the cell wall making juice recovery easier. Increasing the enzyme dosage
results in clarification of fruit juice due to the exposure of internal charged moieties in
213
pulp proteins which occurs as the hemicellulose is digested. However, this also
promotes electrostatic interactions, subsequent flocculation and settling resulting in
decrease in clarity (Kim & Bunz, 2006). This might be the reason why high enzyme
dosage is detrimental to the clarification of fruit pulp (Nagar et al., 2012).
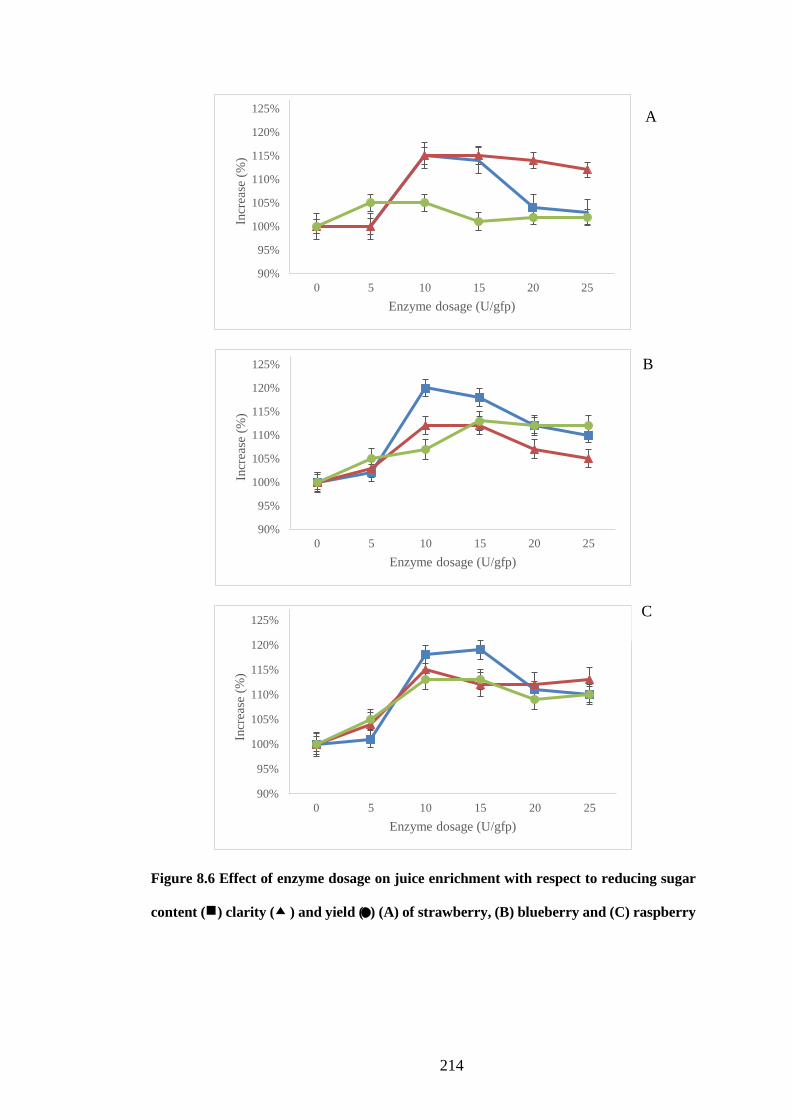
214
Figure 8.6 Effect of enzyme dosage on juice enrichment with respect to reducing sugar
content ( ) clarity ( ) and yield ( ) (A) of strawberry, (B) blueberry and (C) raspberry
90%
95%
100%
105%
110%
115%
120%
125%
0 5 10 15 20 25
Incr
ease
(%
)
Enzyme dosage (U/gfp)
90%
95%
100%
105%
110%
115%
120%
125%
0 5 10 15 20 25
Incr
ease
(%
)
Enzyme dosage (U/gfp)
90%
95%
100%
105%
110%
115%
120%
125%
0 5 10 15 20 25
Incr
ease
(%
)
Enzyme dosage (U/gfp)
A
B
C
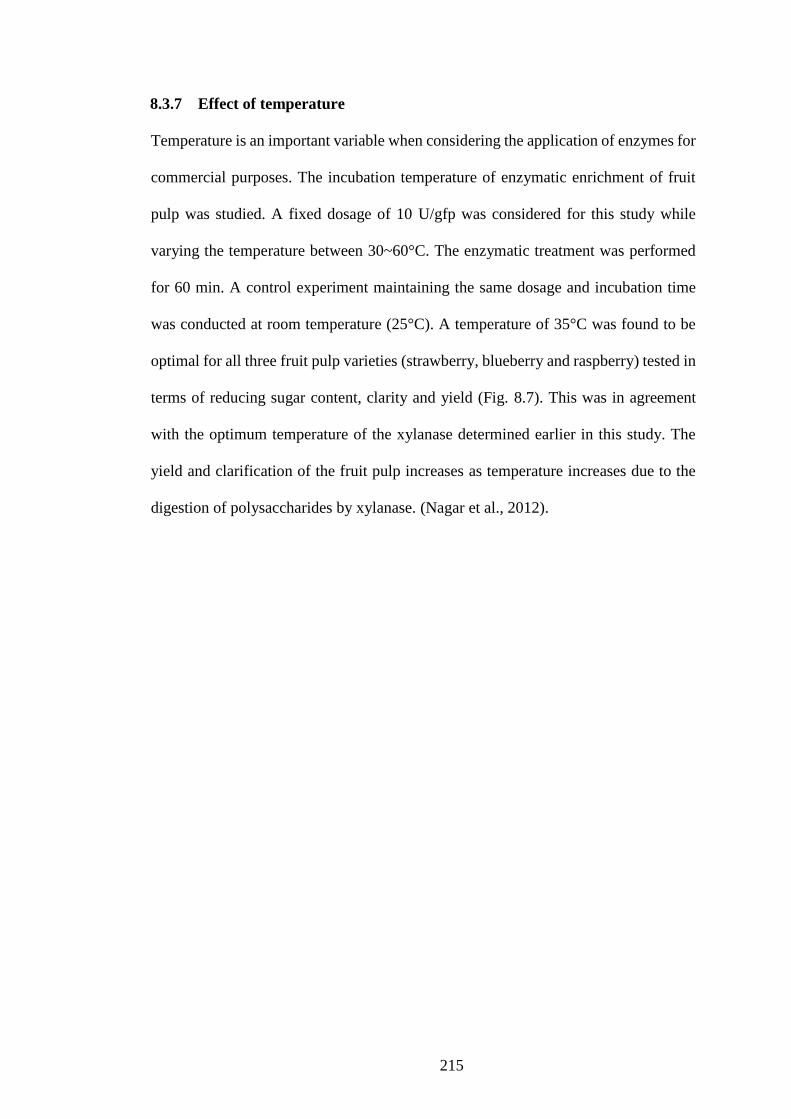
215
8.3.7 Effect of temperature
Temperature is an important variable when considering the application of enzymes for
commercial purposes. The incubation temperature of enzymatic enrichment of fruit
pulp was studied. A fixed dosage of 10 U/gfp was considered for this study while
varying the temperature between 30~60°C. The enzymatic treatment was performed
for 60 min. A control experiment maintaining the same dosage and incubation time
was conducted at room temperature (25°C). A temperature of 35°C was found to be
optimal for all three fruit pulp varieties (strawberry, blueberry and raspberry) tested in
terms of reducing sugar content, clarity and yield (Fig. 8.7). This was in agreement
with the optimum temperature of the xylanase determined earlier in this study. The
yield and clarification of the fruit pulp increases as temperature increases due to the
digestion of polysaccharides by xylanase. (Nagar et al., 2012).
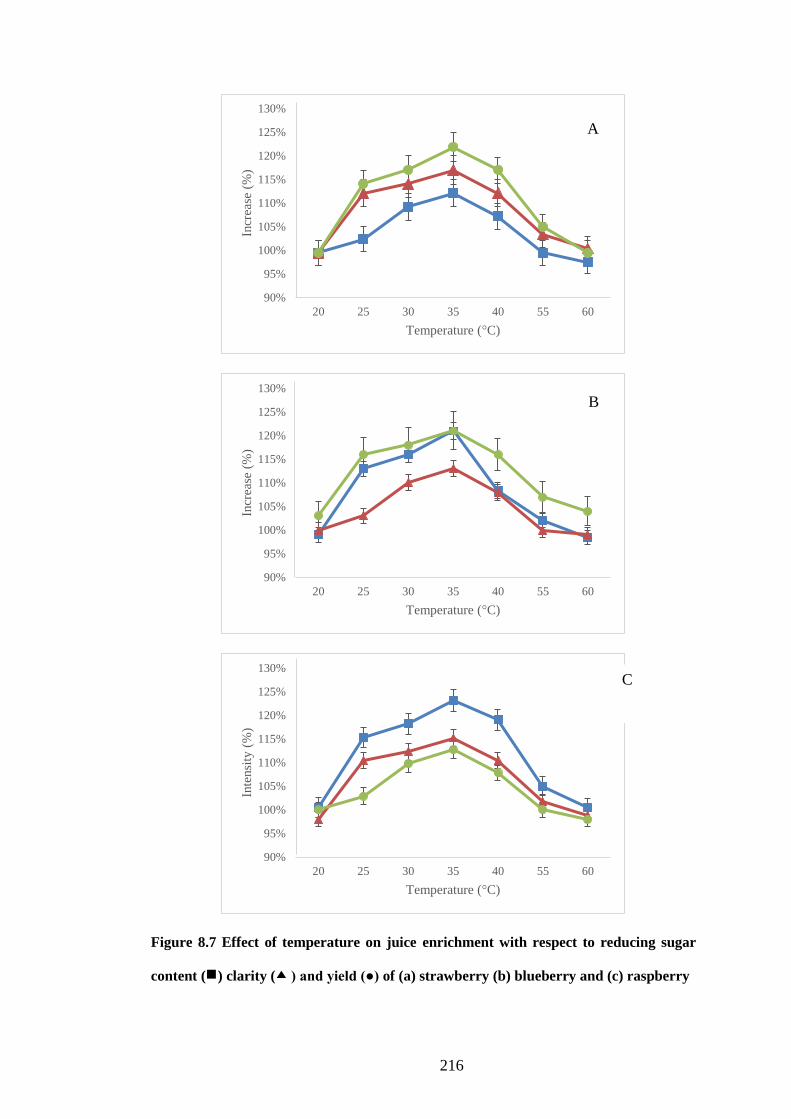
216
Figure 8.7 Effect of temperature on juice enrichment with respect to reducing sugar
content ( ) clarity ( ) and yield (●) of (a) strawberry (b) blueberry and (c) raspberry
90%
95%
100%
105%
110%
115%
120%
125%
130%
20 25 30 35 40 55 60
Incr
ease
(%
)
Temperature (°C)
90%
95%
100%
105%
110%
115%
120%
125%
130%
20 25 30 35 40 55 60
Incr
ease
(%
)
Temperature (°C)
90%
95%
100%
105%
110%
115%
120%
125%
130%
20 25 30 35 40 55 60
Inte
nsi
ty (
%)
Temperature (°C)
A
B
C
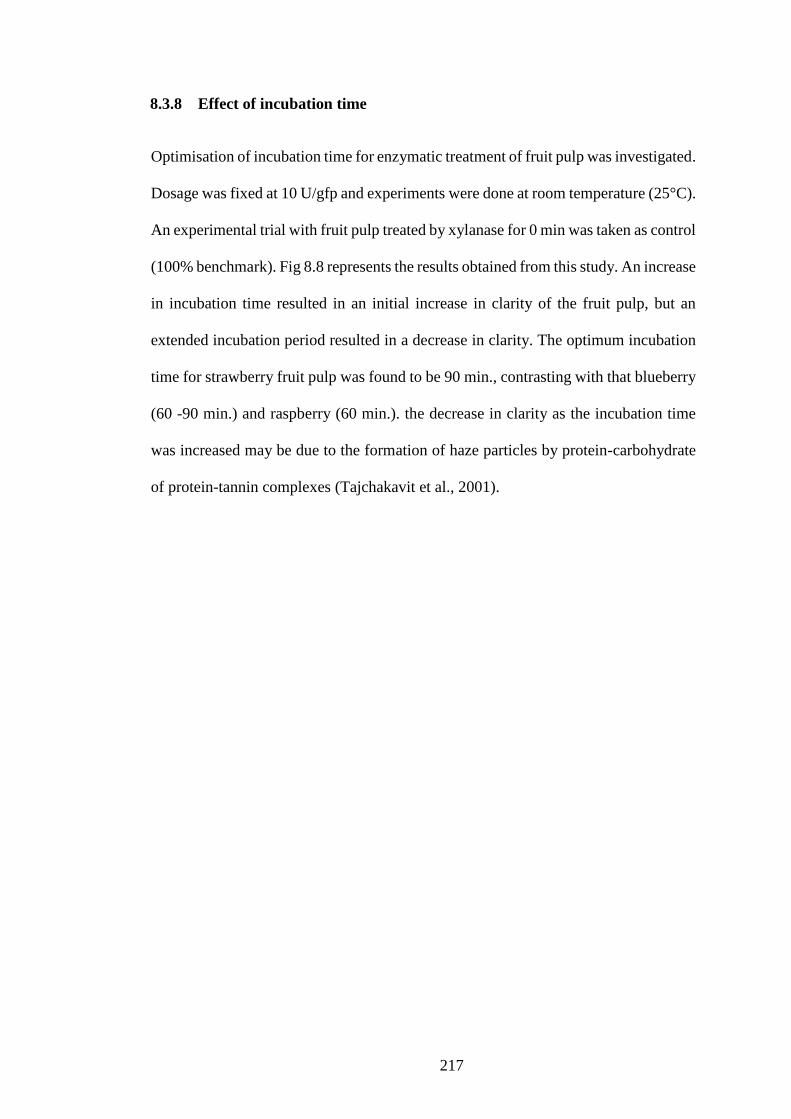
217
8.3.8 Effect of incubation time
Optimisation of incubation time for enzymatic treatment of fruit pulp was investigated.
Dosage was fixed at 10 U/gfp and experiments were done at room temperature (25°C).
An experimental trial with fruit pulp treated by xylanase for 0 min was taken as control
(100% benchmark). Fig 8.8 represents the results obtained from this study. An increase
in incubation time resulted in an initial increase in clarity of the fruit pulp, but an
extended incubation period resulted in a decrease in clarity. The optimum incubation
time for strawberry fruit pulp was found to be 90 min., contrasting with that blueberry
(60 -90 min.) and raspberry (60 min.). the decrease in clarity as the incubation time
was increased may be due to the formation of haze particles by protein-carbohydrate
of protein-tannin complexes (Tajchakavit et al., 2001).
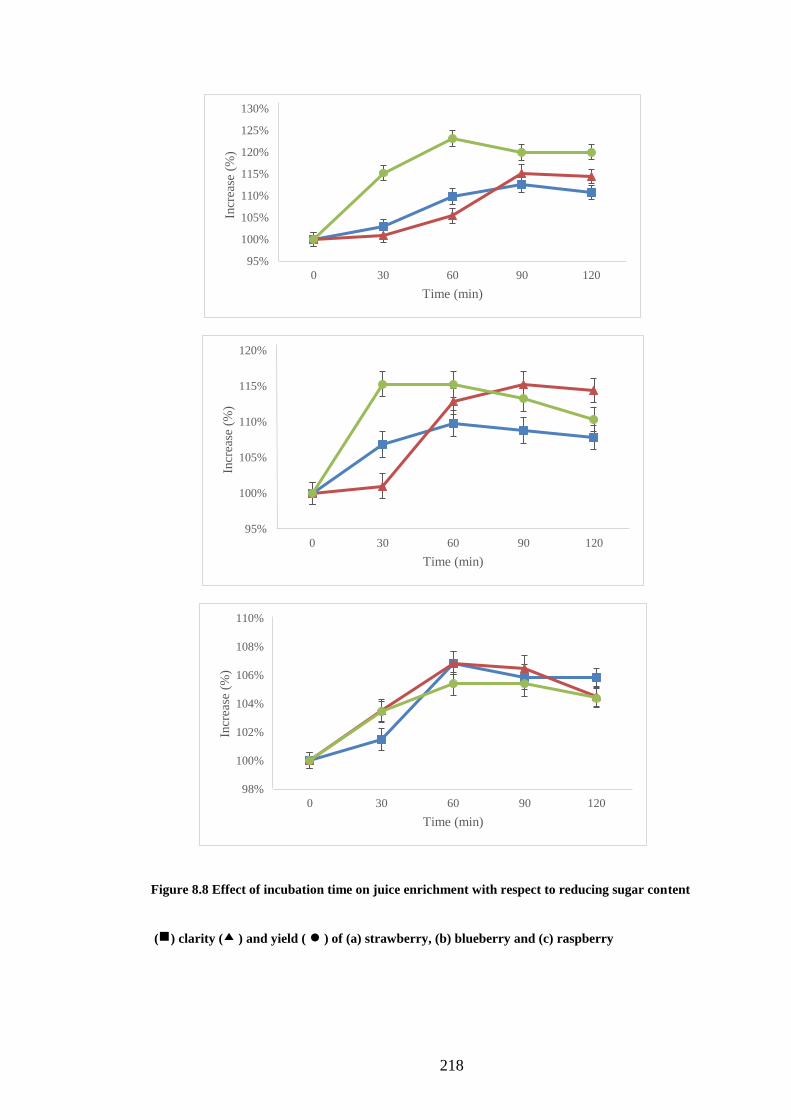
218
Figure 8.8 Effect of incubation time on juice enrichment with respect to reducing sugar content
( ) clarity ( ) and yield ( ● ) of (a) strawberry, (b) blueberry and (c) raspberry
95%
100%
105%
110%
115%
120%
125%
130%
0 30 60 90 120
Incr
ease
(%
)
Time (min)
95%
100%
105%
110%
115%
120%
0 30 60 90 120
Incr
ease
(%
)
Time (min)
98%
100%
102%
104%
106%
108%
110%
0 30 60 90 120
Incr
ease
(%
)
Time (min)
219
8.4 Conclusion
In this study, we studied the production of xylanase using SCW as the substrate in
solid state fermentation mode. From our observations, conducing SSF at a temperature
of 30°C, an initial moisture content of 70% (w/w) and an inoculum size of 6.5×10⁶
(log no. of spores/ml) resulted in high xylanase activity. Additionally, supplementing
the fermentation medium with yeast extract, MgSO4 and KH2PO4 further increases
xylanase yield. A maximum activity of 6495.6 U/g of dry SCW was achieved
following optimised SSF protocol. Furthermore, the xylanase produced by A. niger
ATCC® was found to be an excellent fruit juice clarification agent. Process scale-up
and further recovery techniques need to be investigated to attain commercial
feasibility.
220
General Conclusions
Future Recommendation
This chapter includes conclusions of present work and discusses recommendations of
future work.
221
9. General Conclusion and Future Recommendation
9.1 General Conclusion
Agricultural residues such a brewer’s spent grain and spent coffee waste are a rich
source of carbon and are produced in abundance in Ireland. These cheap carbon
sources can be put to good use by replacing traditional carbon sources in fermentation
operations. This project focused on the efficient incorporation of SCW and BSG into
the upstream processes of enzyme production. This was achieved by developing
innovative methods for efficient removal of recalcitrance by studying the effect of
existing technologies on the aforementioned food industry wastes.
The aims of the project were achieved in four stages. The first stage involved an
extensive exploration into the existing and established pretreatment technologies
employed commercially to determine the efficacy of each method with respect to each
food industry waste. Furthermore, new methods were developed based on the newly
emerging technologies such as atmospheric air pressure plasma and ultrasonication.
The second step involved screening of bacterial and fungal species for their enzyme
producing capacity. This was followed by the third step, which the optimisation and
application of the two fermentation modes: submerged and solid-state fermentation
strategies for the production of amylase and xylanase enzymes, respectively. The final
stage investigated the potential of the enzymes in commercial applications.
As a part of the pretreatment study, SCW and BSG were characterised to determine
the fraction of cellulose, hemicellulose and lignin that contribute to the total weight.
Additionally, the changes imparted by each pretreatment on the composition of SCW
was determined. The extensive pretreatment study revealed that organosolv
pretreatment conserved the hemicellulose fraction of SCW. Hence, organosolv
pretreated SCW was chosen as the appropriate carbon source for supplementing
222
xylanase production media owing to its high hemicellulose content. Furthermore,
optimised hydrolysis protocols for SCW and BSG were developed to determine the
efficiency of each pretreatment with respect to the release of reducing sugars.
Meanwhile, microwave-assisted alkali pretreatment was highly successful in the
removal of recalcitrance from BSG. Employing this pretreatment, 228.78 mg of
reducing sugar /g of BSG was obtained, which was 2.86-fold higher than its native
counterpart.
Four Bacillus sp., viz. Bacillus subtilis, Bacillus megaterium, Bacillus cereus and
Bacillus stearothermophilus were screened for their amylase producing capabilities.
All of the four strains screened were found to produce α- amylase. B.
stearothermophilus was selected as the primary enzyme producer, due to its ability to
produce thermostable amylase. Submerged fermentation mode was adopted for the
production of thermostable α-amylase. Fermentation media with BSG hydrolysate as
the media component was optimised by employing response surface methodology.
The novel media composition resulted in an increased enzyme yield of 198.09 U/ml,
which was 1.3-fold higher than control fermentation (152.3 U/ml). The thermostable
amylase was subjected to a three-stage purification strategy to obtain a purified
enzyme, achieving a yield of 25.1% and 13.09 purification fold.
Meanwhile, four fungal strains viz. Aspergillus fumigatus, Paecilomyces variotii,
Penicillium roqueforti and Aspergillus niger were subjected to screening studies to
determine the xylanase producing capacity. The zones of clearance formed by each
strain were used as measure xylanase production capacity. Consequently, A. niger was
selected as the enzyme producing microbe for the later section of this study.
Organosolv pretreated SCW was subjected to solid state fermentation mode for the
production of xylanase. Before this could be achieved, fermentation conditions as well
223
as media composition needed to be optimised. The fermentation condition for SSF
utilising SCW was optimised by the application of a Box-Behnken design. Meanwhile,
a Plackett-Burman screening study was performed to identify the media components
that enhanced xylanase production by A. niger in SSF mode. Yeast extract, MgSO4
and KH2PO4 were found to significantly support xylanase production. The
concentrations of these three components with respect to the SCW content were
further optimised to achieve a final xylanase activity of 6495.6 U/g of dry SCW, which
was 1.4-fold higher than control (4649 U/g of dry SCW). The xylanase was purified
via a three-step strategy to attain a final specific activity of 572 U/mg. The purified
enzyme was characterised and found to be most active at an acidic pH and mesophilic
temperature range.
The enzymes obtained after fermentation of the lignocellulosic food industry wastes
considered in this study were tested for potential applications. The increase in biofilm-
related infections, as well as incidence of the same in process plant equipment, has
prompted researchers to devise novel and effective measures to control surface
attached bacteria. Therefore, the thermostable amylase obtained from B.
stearothermophilus was tested as a potential anti-biofilm forming agent against three
pathogenic bacterial strains. The crude amylase was found to effectively prevent the
growth and biofilm formation of all the three strains tested. On the other hand, the
xylanase enzyme obtained from A. niger was used in a food industry application as a
fruit pulp enrichment agent. The purified xylanase was successful in increasing the
reducing sugar content, clarity and yield of the fruit juices processed from
strawberries, blueberries and raspberries. The findings of this study conclusively
demonstrate the applicability of lignocellulosic food industry wastes.
224
Although the aims of this project were successfully achieved, more studies can be
conducted in this area to further the possibilities of this work. A few of the
recommendations have been mentioned below.
9.2 Future recommendations
Although the aims of this project were successfully achieved, more studies can be
conducted in this area to further the possibilities of this work. A few of the
recommendations have been mentioned below.
9.2.1 Screening and isolation of novel microbial strains for enzyme production
The enzyme producers employed in this study were obtained from the microbiology
repository maintained in the School of Food Science and Environmental Health.
Superior strains that naturally degrade lignocellulosic food waste can be isolated,
characterised and screened for the production of lignolytic enzymes. Another aspect
that was not considered in this study was the utilisation of recombinant strains, as well
as catabolite-repressed mutants for the production of enzymes. In general,
lignocellulose hydrolysates are high in reducing sugars, mainly glucose. The kinetics
of enzyme production do not necessarily go hand-in-hand with biomass production.
The ability of naturally occurring microbial strains to produce lignolytic enzymes are
hindered by the presence of glucose in the media. This calls for the need for catabolite
repressed or recombinant strains. Furthermore, the objectives of this project can be
extended to include non-lignolytic enzymes, such as proteases.
225
9.2.2 In-depth analysis of substrate utilisation and scale up of fermentation
process
This study has not investigated the nature of uptake of nutrients by the microorganism
for enzyme production. A comprehensive mass balance analysis based on the
assimilation of lignocellulosic component by the enzyme producer and its effect of
biomass production and enzyme production kinetics can be analysed to obtain an all-
inclusive picture on the final enzyme yield. Furthermore, all the fermentation
experiments conducted in this study were performed at shake flask level. The media
components and process parameters having been optimised, the next stage calls for
scale-up of the for fermentation to bench top and subsequently pilot scale.
9.2.3 Innovation in enzyme application by immobilisation
Enzymes once suspended in an aqueous reaction medium are almost impossible to
retrieve or recycle. Additionally, due to their proteinaceous nature enzymes are highly
instable and require an aqueous environment to catalyse reactions. Enzymes can
catalyse reactions in different physical states: as individual molecules, in collection
with other moieties, and fastened to surfaces. This unique property of enzymes is made
use of while ‘immobilising enzymes’. Enzyme immobilisation is the process of
attaching an enzyme molecule to a solid support with intentions of its reuse,
production and purification without loss in their catalytic activity thereby dramatically
improving process economy. It also enables the use of insoluble enzymes suspended
in hydrophobic organic media by optimising the enzyme dispersion and improving
accessibility towards the substrate without the aggregation of hydrophilic protein
particles. Although theoretically promising, practical experiences of enzyme
immobilisation have not always been fruitful as per expectations. Substantial design
226
approaches and parameters need to be considered while selecting the mode of
immobilisation. Innovation in enzyme immobilisation has resulted in interesting and
efficient strategies to purify enzymes. Enzymes can be specifically immobilised on to
a matrix by a range of covalent or non-covalent interactions. In certain cases, the
purification step as a whole can be avoided by adopting to form cross linked enzyme
aggregates (CLEA).
In conclusion, it has been comprehensively determined that lignocellulosic food
industry waste such as spent coffee waste and brewer’s spent grain can be used as
potential raw materials for the production of commercially important enzymes.
Commercialisation of this technology can be achieved by studying the economic
feasibility and scale up options which in itself comprise as a topic that will require
extensive research.
227
References
228
10. References Abdel-Rahman, M.A., Xiao, Y., Tashiro, Y., Wang, Y., Zendo, T., Sakai, K., Sonomoto, K. 2015. Fed-
batch fermentation for enhanced lactic acid production from glucose/xylose mixture without
carbon catabolite repression. J. Biosci. Bioeng. 119(2), 153-158.
Acharjee, T.C., Coronella, C.J., Vasquez, V.R., 2011. Effect of thermal pretreatment on equilibrium
moisture content of lignocellulosic biomass. Bioresour. Technol. 102(7), 4849-4854.
Adney, B., Baker, J. 1996. Measurement of cellulase activities. Laboratory Analytical Procedure, 6,
1996.
Agrimi, G.; Pisano, I.; Palmieri, L., 2012 Process development and metabolic engineering for
bioethanol production from lignocellulosic biomass. In Biorefinery: From Biomass to Chemicals
and Fuels; Michele Aresta, Angela Dibenedetto, Franck Dumeignil, Eds.; Walter de Gruyter:
Berlin, Germany.
Ahangari, B., Sargolzaei, J., 2013. Extraction of lipids from spent coffee grounds using organic solvents
and supercritical carbon dioxide. J. Food Process. Pres. 37, 1014-1021.
Ajijolakewu, A.K., Leh, C.P., Wan Abdullah, W.N., Lee, C.K., 2017. Optimization of production
conditions for xylanase production by newly isolated strain Aspergillus niger through solid
state fermentation of oil palm empty fruit bunches. Biocatal. Agricul. Biotechnol. 11, 239-
247.
Akolkar, S.K., Sajgure, A., Lele, S.S. 2005. Lactase Production from Lactobacillus acidophilus. World
J Microbiol. Biotechnol., 21(6-7), 1119-1122.
Alariya, S. S., S. Sethi, S. Gupta and B. L. Gupta. 2013. Amylase activity of a starch degrading bacteria
isolated from soil. Arch. Appl. Sci. Res. 5(1), 15-24.
Alegre, A.C.P., Polizeli, M.d.L.T.d.M., Terenzi, H.F., Jorge, J.A., Guimarães, L.H.S. 2009. Production
of thermostable invertases by Aspergillus caespitosus under submerged or solid-state
fermentation using agroindustrial residues as carbon source. Brazilian J Microbiol., 40, 612-
622.
Ali, S., Mahmood, S., Alam, R., Hossain, Z. 1989. Culture condition for production of glucoamylase
from rice bran by Aspergillus terreus. MIRCEN J Appl. Microbiol. Biotechnol., 5(4), 525-532.
Alkawas, M.A., Soothill, J.S., Schiller, N.L., 2006. Alginate lyase enhances antibiotic killing of mucoid
Pseudomonas aeruginosa in biofilms. APMIS, 114, 131-138.
Almeida, C., Brányik, T., Moradas-Ferreira, P., Teixeira, J. 2003. Continuous production of pectinase
by immobilized yeast cells on spent grains. J Biosci. Bioeng., 96(6), 513-518
Almeida, J.M., Lima, V.A., Giloni-Lima, P.C., Knob, A. 2015. Passion fruit peel as novel substrate for
enhanced β-glucosidases production by Penicillium verruculosum: Potential of the crude
extract for biomass hydrolysis. Biomass Bioenergy, 72(0), 216-226.
Al-Qodah, Z., 2006. Production and characterization of thermostable α-amylase by thermophilic
Geobacillus stearothermophilus. Biotechnol. J. 1, 850-857.
Alriols, M.G., Tejado, A., Blanco, M., Mondragon, I., Labidi, J. 2009. Agricultural palm oil tree
residues as raw material for cellulose, lignin and hemicelluloses production by ethylene glycol
pulping process. Chem. Eng. J., 148(1), 106-114.
Ang, S.K., E.M, S., Y, A., A.A, S., M.S, M., 2013. Production of cellulases and xylanase by Aspergillus
fumigatus SK1 using untreated oil palm trunk through solid state fermentation. Process
Biochem., 48, 1293-1302.
229
Anto, H., U. Trivedi and K. Patel 2006. α-Amylase production by Bacillus cereus MTCC 1305 using
solid-state fermentation. Food Technol. Biotechnol. 44(2), 241-245.
Anwar, Z., Gulfraz, M., Irshad, M., 2014. Agro-industrial lignocellulosic biomass a key to unlock the
future bio-energy: A brief review. J Radiat. Res. Appl. Sci., 7, 163-173.
Arslan, S., Eyi, A., Küçüksarı, R. 2014. Toxigenic genes, spoilage potential, and antimicrobial
resistance of Bacillus cereus group strains from ice cream, Anaerobe. 25, 42-46.
Association, I.B., 2016. Beer Industry in Ireland.
Azadi, P., Inderwildi, O. R., Farnood, R., & King, D. A. 2013. Liquid fuels, hydrogen and chemicals
from lignin: A critical review. Renew. and Sustain. Energy Rev. 21, 506-523.
Bajpai, P. 2014. Chapter 6 - Purification of Xylanases. in: Xylanolytic Enzymes, (Ed.) P. Bajpai,
Academic Press. Amsterdam, pp. 53-61.
Bajpai, P., 2014. Chapter 6 - Purification of Xylanases. in: Xylanolytic Enzymes, (Ed.) P. Bajpai,
Academic Press. Amsterdam, pp. 53-61.
Ballesteros, L.F., Cerqueira, M.A., Teixeira, J.A., Mussatto, S.I. 2015. Characterization of
polysaccharides extracted from spent coffee waste by alkali pretreatment. Carbohydr. Polym.
127, 347-354.
Ballesteros, L.F., Teixeira, J.A., Mussatto, S.I. 2014. Chemical, Functional, and Structural Properties
of Spent Coffee Grounds and Coffee Silverskin. Food Bioprocess. Technol., 7(12), 3493-3503.
Bansal, P.; Hall, M.; Realff, M.J.; Lee, J.H.; Bommarius, A.S. 2010 Multivariate statistical analysis of
X-ray data from cellulose: A new method to determine degree of crystallinity and predict
hydrolysis rates. Bioresour. Technol. 101, 4461–4471.
Barrios-González., 2012 J. Solid-state fermentation: Physiology of solid medium, its molecular basis
and applications. Process Biochem. 47, 175–185.
Batche, H.; Valenzuela-Solano, C.; Hernandez-Martinez, R., 2014. Production of Conidiospores in
Solid-State Fermentation of Trichoderma Harzianum and T. asperellum Isolated from
Grapevine in Baja California; Phytopathology: St. Paul, MN, USA. p. 179.
BCC Research. 2014 Global Market for Industrial Enzymes to Reach Nearly $7.1 Billion by 2018;
Detergent Enzyme Market to Record Maximum Growth; BCC Research: Wellesley, MA, USA.
Behera, S., Arora, R., Nandhagopal, N., Kumar, S., 2014. Importance of chemical pretreatment for
bioconversion of lignocellulosic biomass. Renew. Sust. Energ. Rev. 36(0), 91-106.
Bellido, C.; Bolado, S.; Coca, M.; Lucas, S.; González-Benito, G.; García-Cubero, M.T., 2011 Effect
of inhibitors formed during wheat straw pretreatment on ethanol fermentation by Pichia stipitis.
Bioresour. Technol. 102, 10868–10874.
Betini, J.H.A., Michelin, M., Peixoto-Nogueira, S.C., Jorge, J.A., Terenzi, H.F., Polizeli, M.L.T.M.,
2009. Xylanases from Aspergillus niger, Aspergillus niveus and Aspergillus ochraceus
produced under solid-state fermentation and their application in cellulose pulp bleaching.
Bioprocess Biosyst. Eng. 32, 819-824.
Binod, P., Satyanagalakshmi, K., Sindhu, R., Janu, K.U., Sukumaran, R.K., Pandey, A. 2012. Short
duration microwave assisted pretreatment enhances the enzymatic saccharification and
fermentable sugar yield from sugarcane bagasse. Renew. Energ., 37(1), 109-116.
Bonekamp, F., Oosterom, J. 1994. On the safety of Kluyveromyces lactis — a review. Appl. Microbiol.
Biotechnol., 41(1), 1-3.
230
Bose, S. K., Wilson Kate, L., Francis Raymond, C., Aoyama, M. 1998. Lignin Analysis by
Permanganate Oxidation. I. Native Spruce Lignin. in: Holzforschung - Int. J. Biol. Chem.
Phys. Technol. Wood, 52, 297.
Botella, C., Diaz, A., de Ory, I., Webb, C., Blandino, A. 2007. Xylanase and pectinase production by
Aspergillus awamori on grape pomace in solid state fermentation. Process Biochem., 42(1),
98-101.
Botella, C., Diaz, A., de Ory, I., Webb, C., Blandino, A. 2007. Xylanase and pectinase production by
Aspergillus awamori on grape pomace in solid state fermentation. Process Biochem., 42(1),
98-101.
Bradford, M.M., 1976. A rapid and sensitive method for the quantitation of microgram quantities of
protein utilizing the principle of protein-dye binding. Anal. Biochem. 72, 248-254.
Brown, M. E., & Chang, M. C., 2014. Exploring bacterial lignin degradation. Curr. opin. in chem. biol.,
19, 1-7.
Buschke, N.; Schäfer, R.; Becker, J.; Wittmann, C., 2013. Metabolic engineering of industrial platform
microorganisms for biorefinery applications–optimization of substrate spectrum and process
robustness by rational and evolutive strategies. Bioresour. Technol. 133, 544–554.
Bussemaker, M.J., Zhang, D. 2013. Effect of Ultrasound on Lignocellulosic Biomass as a Pretreatment
for Biorefinery and Biofuel Applications. Ind. Eng. Chem. Res. 52(10), 3563-3580.
Campden, R.; Pétrin, D.; Robitaille, M.; Audet, N.; Gora, S.; Angers, S.; Hébert, T.E., 2015. Tandem
Affinity Purification to Identify Cytosolic and Nuclear Gβγ-Interacting Proteins. In Nuclear G-
Protein Coupled Receptors; Springer: New York, NY, USA. 161–184.
Campos-Vega, R., Loarca-Piña, G., Vergara-Castañeda, H.A., Oomah, B.D. 2015. Spent coffee
grounds: A review on current research and future prospects. Trends. Food Sci. Technol., 45(1),
24-36.
Celestino, K., Cunha, R., Felix, C. 2006. Characterization of a beta-glucanase produced by Rhizopus
microsporus var. microsporus, and its potential for application in the brewing industry. BMC
Biochem., 7(1), 23.
Chakraborty, K., Bhattacharyya, B., Sen, S., 2000. Purification and characterization of a thermostable
α-amylase from Bacillus stearothermophilus. Folia Microbiol. 45, 207-210.
Chang, V.; Holtzapple, M. 2000 Fundamental factors affecting biomass enzymatic reactivity. In
Twenty-First Symposium on Biotechnology for Fuels and Chemicals; Finkelstein, M., Davison,
B., Eds.; Humana Press: Totowa, NJ, USA, pp. 5–37.
Chauhan, P.S., Puri, N., Sharma, P., Gupta, N. 2012. Mannanases: microbial sources, production,
properties and potential biotechnological applications. Appl. Microbiol. Biotechnol., 93(5),
1817-1830.
Chen, C., Boldor, D., Aita, G., Walker, M., 2012. Ethanol production from sorghum by a microwave-
assisted dilute ammonia pretreatment. Bioresour. Technol. 110(0), 190-197.
Chen, J., Gai, Y., Fu, G., Zhou, W., Zhang, D., Wen, J., 2015. Enhanced extracellular production of α-
amylase in Bacillus subtilis by optimization of regulatory elements and over-expression of
PrsA lipoprotein. Biotechnol. Lett. 37, 899-906.
Chen, L., Chen, R., Fu, S. 2015. FeCl3 Pretreatment of Three Lignocellulosic Biomass for Ethanol
Production. ACS Sus. Chem. Eng., 3(8), 1794-1800.
231
Chen, Y., Sharma-Shivappa, R., Chen, C., 2007. Ensiling Agricultural Residues for Bioethanol
Production. Appl. Biochem. Biotechnol.143(1), 80-92.
Chesini, M., Neila, L.P., Parra, D.F.d.l., Rojas, N.L., Esquivel, J.C.C., Cavalitto, S.F., Ghiringhelli,
P.D., Hours, R.A. 2013. Aspergillus kawachii produces an inulinase in cultures with yacon
(Smallanthus sonchifolius) as substrate.
Chi, Z., Chi, Z., Zhang, T., Liu, G., Yue, L. 2009. Inulinase-expressing microorganisms and
applications of inulinases. Appl. Microbiol. Biotechnol., 82(2), 211-220.
Chiyanzy, I., Brienzo, M., García-Aparicio, M., Agudelo, R., Görgens, J. 2015. Spent coffee ground
mass solubilisation by steam explosion and enzymatic hydrolysis. J. Chem. Technol.
Biotechnol, 90(3), 449-458.
Christakopoulos, P., Kekos, D., Kolisis, F.N., Macris, B.J. 1995. Controlling simultaneous production
of endoglucanase and beta-glucosidase by Fusarium oxysporum in submerged culture.
Biotechnol. Lett., 17(8), 883-888.
Christgau, S., Andersen, L., Kauppinen, S., Heldt-Hansen, H., Dalboege, H. 1994. Purified enzyme
exhibiting mannanase activity; application in oil, paper, pulp, fruit and vegetable juice industry
and in carrageenan extraction. Patent Novo-Nordisk, 9425576(10).
Clarke, J., Davidson, K., Rixon, J., Halstead, J., Fransen, M., Gilbert, H., Hazlewood, G. 2000. A
comparison of enzyme-aided bleaching of softwood paper pulp using combinations of
xylanase, mannanase and α-galactosidase. Appl. Microbiol. Biotechnol., 53(6), 661-667.
Commission, E. 2009. What is the Bioeconomy? Vol. 2015.
Conde, T., Mussatto, S.I. 2015. Isolation of polyphenols from spent coffee grounds and silverskin by
mild hydrothermal pretreatment. Prep. Biochem. Biotechnol. 46, 406-409.
Costerton, J.W., Stewart, P.S., Greenberg, E.P., 1999. Bacterial biofilms: a common cause of persistent
infections. Sci. 284, 1318-1322.
Craigen, B., Dashiff, A., Kadouri, D.E., 2011. The Use of Commercially Available Alpha-Amylase
Compounds to Inhibit and Remove Staphylococcus aureus Biofilms. Open Microbiol J. 5,
21-31.
Cunha, F.M., M.N. Esperança, T.C. Zangirolami, A.C. Badino, C.S. Farinas. 2012. Sequential solid-
state and submerged cultivation of Aspergillus niger on sugarcane bagasse for the production of
cellulase. Bioresour. Technol. 112, 270-274
Cuperus, R.A., Herweijer, M.A., Van Ooijen, A.J., Van Schouwen, D.J. 2003. For removing stains of
vegetable origin, especially from textiles, Google Patents.
Czaczyk, K., Myszka, K. 2007. Biosynthesis of extracellular polymeric substances (EPS) and its role
in microbial biofilm formation. Pol J Environ Stud. 16.
Das, A., Ray, L., 2016. Production of crude xylanase using a isolated fungal strain Aspergillus sp.S6by
solid state fermentation. Mater Today. (10, Part A), 3343-3360.
Das, S. P., Ravindran, R., Ahmed, S., Das, D., Goyal, D., Fontes, C. M., & Goyal, A. 2012. Bioethanol
production involving recombinant C. thermocellum hydrolytic hemicellulase and fermentative
microbes. Appl. Biochem. Biotech, 167(6), 1475-1488.
Das, S.P., Ravindran, R., Ahmed, S., Das, D., Goyal, D., Fontes, C.M., Goyal, A. 2012. Bioethanol
production involving recombinant C. thermocellum hydrolytic hemicellulase and fermentative
microbes. Appl. Microbiol. Biotechnol., 167(6), 1475-1488.
232
de Bales, S.A., Castillo, F.J. 1979. Production of Lactase by Candida pseudotropicalis Grown in Whey.
Appl. Environ. Microbiol., 37(6), 1201-1205.
de Boer, A. S., F. Priest and B. Diderichsen. 1994. On the industrial use of Bacillus licheniformis: a
review. Appl. Microbiol. Biotechnol. 40(5), 595-598.
Demirkan, E. 2011. Production, purification, and characterization of\ alpha-amylase by Bacillus subtilis
and its mutant derivates. Tyrk. J. Biol. 35(6), 705-712.
Dhawan, S., Kaur, J. 2007. Microbial Mannanases: An Overview of Production and Applications. Crit.
Rev. Biotechnol., 27(4), 197-216.
Dhillon, G.S., Kaur, S., Brar, S.K., Verma, M. 2012. Potential of apple pomace as a solid substrate for
fungal cellulase and hemicellulase bioproduction through solid-state fermentation. Ind. Crop.
Prod., 38(0), 6-13.
Diler, G., Chevallier, S., Pöhlmann, I., Guyon, C., Guilloux, M., Le-Bail, A. 2015. Assessment of
amyloglucosidase activity during production and storage of laminated pie dough. Impact on
raw dough properties and sweetness after baking. J Cereal Sci. 61, 63-70
Dilipkumar, M., Rajasimman, M., Rajamohan, N. 2014. Utilization of copra waste for the solid state
fermentatative production of inulinase in batch and packed bed reactors. Carbohydrate
Polymers, 102(0), 662-668.
Djioleu, A., Carrier, D.J. 2016. Effects of Dilute Acid Pretreatment Parameters on Sugar Production
during Biochemical Conversion of Switchgrass Using a Full Factorial Design. ACS Sus.
Chem. Eng., 4(8), 4124-4130.
Doi, R.H., Kosugi, A. 2004. Cellulosomes: plant-cell-wall-degrading enzyme complexes. Nat Rev
Micro, 2(7), 541-551.
Duan, X., Sun, X., Wu, J. 2014. Optimization of fermentation conditions of recombinant Pichia pastoris
that can produce β-galactosidase. Genomics Appl. Biol., 33(6), 1288-1293.
Duval, A., Lawoko, M., 2014. A review on lignin-based polymeric, micro- and nano-structured
materials. React. Funct. Polym. 85(0), 78-96.
Elgharbi, F., Hlima, H.B., Farhat-Khemakhem, A., Ayadi-Zouari, D., Bejar, S., Hmida-Sayari, A.,
2015. Expression of A. niger US368 xylanase in E. coli: Purification, characterization and
copper activation. Int. J. Biol. Macromol.74, 263-270.
Espinosa-Ramírez, J., Pérez-Carrillo, E., Serna-Saldívar, S.O. 2014. Maltose and glucose utilization
during fermentation of barley and sorghum lager beers as affected by β-amylase or
amyloglucosidase addition. J Cereal Sci. 60, 602-609.
Fakruddin, M.; Mohammad Mazumdar, R.; Bin Mannan, K.S.; Chowdhury, A.; Hossain, M.N., 2013.
Critical Factors Affecting the Success of Cloning, Expression, and Mass Production of Enzymes
by Recombinant E. coli. ISRN Biotechnol. 590587.
Farid, M.A., El-Shahed, K.Y. 1993. Cellulase production on high levels of cellulose and corn steep
liquor. Zentralblatt für Mikrobiologie, 148(4), 277-283.
Ferraz, E., Coroado, J., Gamelas, J., Silva, J., Rocha, F., Velosa, A. 2013. Spent Brewery Grains for
Improvement of Thermal Insulation of Ceramic Bricks. J. Mater. Civ. Eng., 25(11), 1638-
1646.
Ferreira, N.L., Margeot, A., Blanquet, S., Berrin, J.-G. 2014. Chapter 17 - Use of Cellulases from
Trichoderma reesei in the Twenty-First Century—Part I: Current Industrial Uses and Future
Applications in the Production of Second Ethanol Generation. in: Biotechnology and Biology
233
of Trichoderma, (Eds.) V.K. Gupta, M.S. Herrera-Estrella, R.S.U. Druzhinina, M.G. Tuohy,
Elsevier. Amsterdam, pp. 245-261.
Fincan, S.A., Enez, B., 2014. Production, purification, and characterization of thermostable α-amylase
from thermophilic Geobacillus stearothermophilus. Starke. 66, 182-189.
Forssell, P., Kontkanen, H., Schols, H.A., Hinz, S., Eijsink, V.G.H., Treimo, J., Robertson, J.A.,
Waldron, K.W., Faulds, C.B., Buchert, J. 2008. Hydrolysis of Brewers' Spent Grain by
Carbohydrate Degrading Enzymes. J. Inst. Brew., 114(4), 306-314.
Gabhane, J., William, S., Vaidya, A., Anand, D., Wate, S. 2014. Pretreatment of garden biomass by
alkali-assisted ultrasonication: effects on enzymatic hydrolysis and ultrastructural changes. J.
Environ. Health Sci. Engineer. 12(1), 1-6.
Gangadharan, D., Sivaramakrishnan, S., Nampoothiri, K.M., Sukumaran, R.K., Pandey, A., 2008.
Response surface methodology for the optimization of alpha amylase production by Bacillus
amyloliquefaciens. Bioresour. Technol. 99, 4597-4602.
Gao, F., Gao, L., Zhang, D., Ye, N., Chen, S., Li, D., 2015. Enhanced hydrolysis of Macrocystis pyrifera
by integrated hydroxyl radicals and hot water pretreatment. Bioresour. Technol. 179(0), 490-
496.
García, A., Erdocia, X., González Alriols, M., Labidi, J. 2012. Effect of ultrasound treatment on the
physicochemical properties of alkaline lignin. Chem. Eng. Process.: Process Intensification, 62,
150-158.
Gawande, P.V., Kamat, M.Y. 1999. Production of Aspergillus xylanase by lignocellulosic waste
fermentation and its application. J Appl. Microbiol., 87(4), 511-519.
Geetha, K., Gunasekaran, P., 2010. Optimization of nutrient medium containing agricultural waste for
xylanase production by Bacillus pumilus B20. Biotechnol. Bioprocess Eng. 15, 882-889.
Gellerstedt, G. 1992. Chemical degradation methods: permanganate oxidation. in: Methods in Lignin
Chemistry, Springer, pp. 322-333.
George, A., Brandt, A., Tran, K., Zahari, S.M.S.N.S., Klein-Marcuschamer, D., Sun, N.,
Sathitsuksanoh, N., Shi, J., Stavila, V., Parthasarathi, R., Singh, S., Holmes, B.M., Welton, T.,
Simmons, B.A., Hallett, J.P. 2015. Design of low-cost ionic liquids for lignocellulosic biomass
pretreatment. Green Chem., 17(3), 1728-1734.
Ghaffar, S.H.; Fan, M. 2013 Structural analysis for lignin characteristics in biomass straw. Biomass
Bioenergy, 57, 264–279.
Gibbs, P.A.; Seviour, R.J.; Schmid., 2000. F. Growth of Filamentous Fungi in Submerged Culture:
Problems and Possible Solutions. Crit. Rev. Biotechnol. 20, 17–48.
Go, A.W., Conag, A.T., Cuizon, D.E.S. 2016. Recovery of Sugars and Lipids from Spent Coffee
Grounds: A New Approach. Waste Biomass Valoriz., 7(5), 1047-1053.
Gomes, J., Terler, K., Kratzer, R., Kainz, E., Steiner, W. 2007. Production of thermostable β-
mannosidase by a strain of Thermoascus aurantiacus: Isolation, partial purification and
characterization of the enzyme. Enzyme Microb. Technol., 40(4), 969-975.
Goswami, G.K., Pathak, R.R. 2013. Microbial xylanases and their biomedical applications: a review.
Int J Basic Clin Pharmacol, 2(3), 237-246.
Goulao, L.F., Oliveira, C.M., 2008. Cell wall modifications during fruit ripening: when a fruit is not
the fruit. Trends Food Sci. Technol. 19, 4-25.
234
Gregori, A., Švagelj, M., Pahor, B., Berovič, M., Pohleven, F., 2008. The use of spent brewery grains
for Pleurotus ostreatus cultivation and enzyme production. New Biotechnol., 25, 157-161.
Gupta, A.K., Kaur, N., Singh, R. 1989. Fructose and inulinase production from waste Cichorium
intybus roots. Biol. Wastes, 29(1), 73-77.
Gurgel, L.V.A.; Marabezi, K.; Ramos, L.A.; Curvelo, A.A.D. 2012 Characterization of depolymerized
residues from extremely low acid hydrolysis (ELA) of sugarcane bagasse cellulose: Effects of
degree of polymerization, crystallinity and crystallite size on thermal decomposition. Ind. Crops
Prod. 36, 560–571.
Hall-Stoodley, L., Stoodley, P., 2005. Biofilm formation and dispersal and the transmission of human
pathogens. Trends Microbiol. 13, 7-10.
Hang, Y.D., Woodams, E.E. 1995. β-Fructofuranosidase production by Aspergillus species from apple
pomace. LWT - Food Sci. Technol., 28(3), 340-342.
Hashemi, M., Razavi, S.H., Shojaosadati, S.A., Mousavi, S.M., 2011. The potential of brewer's spent
grain to improve the production of α-amylase by Bacillus sp. KR-8104 in submerged
fermentation system. N Biotechnol. 28, 165-172.
Hashemi, M., S. H. Razavi, S. A. Shojaosadati and S. M. Mousavi. 2011. The potential of brewer's
spent grain to improve the production of α-amylase by Bacillus sp. KR-8104 in submerged
fermentation system. N. Biotechnol. 28(2), 165-172.
Hölker, U.; Lenz, J. 2005. Solid-state fermentation—Are there any biotechnological advantages? Curr.
Opin. Microbiol. 8, 301–306.
Hours, R.A., Voget, C.E., Ertola, R.J. 1988. Some factors affecting pectinase production from apple
pomace in solid-state cultures. Biological Wastes, 24(2), 147-157.
Huang, Y., Wei, X., Zhou, S., Liu, M., Tu, Y., Li, A., Chen, P., Wang, Y., Zhang, X., Tai, H., Peng, L.,
Xia, T. 2015. Steam explosion distinctively enhances biomass enzymatic saccharification of
cotton stalks by largely reducing cellulose polymerization degree in G. barbadense and G.
hirsutum. Bioresour. Technol., 181, 224-230.
International Coffee Organization (ICO), 2016. The Current State of the Global Coffee Trade.
Irfan, M., Nadeem, M., Syed, Q., 2014. One-factor-at-a-time (OFAT) optimization of xylanase
production from Trichoderma viride-IR05 in solid-state fermentation. J. Radiat. Res. Appl.
Sci. 7, 317-326.Kalim, B., Ali, N.M. 2016. Optimization of fermentation media and growth
conditions for microbial xylanase production. 3 Biotech, 6(2), 122.
Irshad, M., Anwar, Z., Afroz, A. 2012. Characterization of Exo 1, 4-β glucanase produced from
Tricoderma Viridi MBL through solid-state bio-processing of orange peel waste. Adv.
Bioscience Biotechnol., 3(05), 580.
Ito, K.; Gomi, K.; Kariyama, M.; Miyake, T., 2013. Rapid enzyme production and mycelial growth in
solid-state fermentation using the non-airflow box. J. Biosci. Bioeng. 116, 585–590.
Ito, K.; Kawase, T.; Sammoto, H.; Gomi, K.; Kariyama, M.; Miyake, T., 2011. Uniform culture in solid-
state fermentation with fungi and its efficient enzyme production. J. Biosci. Bioeng. 111, 300–
305.
235
Ivanova, V. N., E. P. Dobreva and E. I. Emanuilova. 1993. Purification and characterization of a
thermostable alpha-amylase from Bacillus licheniformis. J. Biotechnol. 28(2-3), 277-289.
Jaiswal, A.K., Gupta, S., Abu‐Ghannam, N. 2012. Optimisation of lactic acid fermentation of York
cabbage for the development of potential probiotic products. Int. J. Food Sci. Technol., 47(8),
1605-1612.
Jaiswal, A.K., Gupta, S., Abu‐Ghannam, N. 2012. Optimisation of lactic acid fermentation of York
cabbage for the development of potential probiotic products. Int. J. Food Sci. Technol. 47(8),
1605-1612.
Jamal, M., Ahmad, W., Andleeb, S., Jalil, F., Imran, M., Nawaz, M.A., Hussain, T., Ali, M., Rafiq, M.,
Kamil, M.A., 2018. Bacterial biofilm and associated infections. J Chin. Med. Assoc. 81, 7-
11.
James, J.A., Lee, B.H. 1997. Glucoamylases: microbial sources, industrial applications and molecular
biology — a review. J Food Biochem. 21, 1-52.
Jegannathan, K.R.; Nielsen, P.H. 2013 Environmental assessment of enzyme use in industrial
production—A literature review. J. Clean. Prod, 42, 228–240.
Jensen, K.A., Houtman, C.J., Ryan, Z.C., Hammel, K.E., 2001. Pathways for Extracellular Fenton
Chemistry in the Brown Rot Basidiomycete Gloeophyllum trabeum. Appl. Environ. Microbiol.
67(6), 2705-2711.
Jiang, W., Chang, S., Li, H., Oleskowicz-Popiel, P., Xu, J., 2015. Liquid hot water pretreatment on
different parts of cotton stalk to facilitate ethanol production. Bioresour. Technol. 176(0), 175-
180.
Jonsson, L., Alriksson, B., Nilvebrant, N.-O., 2013. Bioconversion of lignocellulose: inhibitors and
detoxification. Biotechnol. Biofuels. 6(1), 16.
Jönsson, L.J., Martín, C. 2016. Pretreatment of lignocellulose: Formation of inhibitory by-products and
strategies for minimizing their effects. Bioresour. Technol., 199, 103-112.
Jooste, T., García-Aparicio, M., Brienzo, M., Van Zyl, W., Görgens, J. 2013. Enzymatic hydrolysis of
spent coffee ground. Appl. biochem. biotechnol., 169(8), 2248-2262.
Juturu, V., Wu, J.C. 2014. Microbial cellulases: Engineering, production and applications. Renew.
Sustain. Energy Rev. 33, 188-203.
Kalpana, B.J., Aarthy, S., Pandian, S.K., 2012. Antibiofilm activity of α-amylase from Bacillus subtilis
S8-18 against biofilm forming human bacterial pathogens. Appl. Biochem. Biotechnol. 167,
1778-1794.
Kanada, K.N.; Nakatsuji, T.; Gallo, R.L., 2012. Doxycycline indirectly inhibits proteolytic activation
of tryptic kallikrein-related peptidases and activation of cathelicidin. J. Investig. Dermatol. 132,
1435–1442.
Karataş, H., F. Uyar, V. Tolan and Z. Baysal. 2013. Optimization and enhanced production of α-
amylase and protease by a newly isolated Bacillus licheniformis ZB-05 under solid-state
fermentation. Ann. Microbiol. 63(1), 45-52.
Keasling, J.D., 2012. Synthetic biology and the development of tools for metabolic engineering. Metab.
Eng. 14, 189–195.
Kies, A.K. 2014. 9 - Authorised EU health claims related to the management of lactose intolerance:
reduced lactose content, dietary lactase supplements and live yoghurt cultures. in: Foods,
236
Nutrients and Food Ingredients with Authorised Eu Health Claims, (Ed.) M.J. Sadler,
Woodhead Publishing, pp. 177-211.
Kim, I.-B., Bunz, U.H., 2006. Modulating the sensory response of a conjugated polymer by proteins:
an agglutination assay for mercury ions in water. J. Am. Chem. Soc. 128, 2818-2819.
Klein‐Marcuschamer, D., Oleskowicz‐Popiel, P., Simmons, B.A., Blanch, H.W. 2012. The challenge
of enzyme cost in the production of lignocellulosic biofuels. Biotechnol. Bioeng. 109(4), 1083-
1087.
Knob, A., Beitel, S.M., Fortkamp, D., Terrasan, C., #xe9, Fanchini, s.R., Almeida, A.F.d. 2013.
Production, Purification, and Characterization of a Major Penicillium glabrum Xylanase Using
Brewer's Spent Grain as Substrate. BioMed Res. Int., 2013, 8.
Krishna, C., & Chandrasekaran, M. 1996. Banana waste as substrate for α-amylase production by
Bacillus subtilis (CBTK 106) under solid-state fermentation. Applied Microbiology and
Biotechnology, 46(2), 106-111.
Kulasinski, K., Keten, S., Churakov, S. V., Derome, D., & Carmeliet, J., 2014. A comparative molecular
dynamics study of crystalline, paracrystalline and amorphous states of cellulose. Cellulose,
21(3), 1103-1116.
Kulshrestha, S., Tyagi, P., Sindhi, V., Yadavilli, K.S. 2013. Invertase and its applications – A brief
review. J Pharm. Res., 7(9), 792-797.
Kumar, R., Hu, F., Hubbell, C.A., Ragauskas, A.J., Wyman, C.E., 2013. Comparison of laboratory
delignification methods, their selectivity, and impacts on physiochemical characteristics of
cellulosic biomass. Bioresour. Technol. 130(0), 372-381.
Kwon, E.E., Yi, H., Jeon, Y.J. 2013. Sequential co-production of biodiesel and bioethanol with spent
coffee grounds. Bioresour. Technol. 136, 475-480.
Łaba, W., Piegza, M., Kawa-Rygielska, J., 2017. Evaluation of brewer's spent grain as a substrate for
production of hydrolytic enzymes by keratinolytic bacteria. J Chem. Technol. Biotechnol.
92, 1389-1396.
Laboratory NRE. 2010 Reducing Enzyme Cost Increases Market Potential of Biofuels; Laboratory
NRE: Golden, CO, USA,
Lal, N., Jyoti, J., Sachan, P. 2017. Optimization of Carbon Sources for the Amylase Production and
Growth of Bacillus licheniformis JAR-26 under Submerged Fermentation. Indian J Biol. 4.
Lappalainen, A., Siika-Aho, M., Kalkkinen, N., Fagerström, R., Tenkanen, M., 2000. Endoxylanase II
from Trichoderma reesei has several isoforms with different isoelectric points. Biotechnol.
Appl. Biochem. 31, 61-68.
Lau, M.W., Dale, B.E., Balan, V. 2008. Ethanolic fermentation of hydrolysates from ammonia fiber
expansion (AFEX) treated corn stover and distillers grain without detoxification and external
nutrient supplementation. Biotechnol. Bioeng. 99(3), 529-539.
Lee, J.M., Jameel, H., Venditti, R.A. 2010. A comparison of the autohydrolysis and ammonia fiber
explosion (AFEX) pretreatments on the subsequent enzymatic hydrolysis of coastal Bermuda
grass. Bioresour. Technol., 101(14), 5449-5458.
Lee, J.-S., Bae, Y.-M., Han, A., Lee, S.-Y., 2016. Development of Congo red broth method for the
detection of biofilm-forming or slime-producing Staphylococcus sp. LWT, 73, 707-714.
237
Li, H., Kim, N.-J., Jiang, M., Kang, J.W., Chang, H.N. 2009. Simultaneous saccharification and
fermentation of lignocellulosic residues pretreated with phosphoric acid–acetone for
bioethanol production. Bioresour. Technol., 100(13), 3245-3251.
Li, H.-Q., Jiang, W., Jia, J.-X., Xu, J., 2014. pH pre-corrected liquid hot water pretreatment on corn
stover with high hemicellulose recovery and low inhibitors formation. Bioresour. Technol.
153(0), 292-299.
Li, Z., Duan, X., Wu, J. 2016. Improving the thermostability and enhancing the Ca2+ binding of the
maltohexaose-forming α-amylase from Bacillus stearothermophilus. J Biotechnol. 222, 65-
72.
Liguori, R., Soccol, C. R., Porto de Souza Vandenberghe, L., Woiciechowski, A. L., & Faraco, V.
(2015). Second generation ethanol production from brewers’ spent grain. Energies, 8(4), 2575-
2586.
Liguori, R., Soccol, C., Porto de Souza Vandenberghe, L., Woiciechowski, A., Faraco, V. 2015. Second
Generation Ethanol Production from Brewers’ Spent Grain. Energ., 8(4), 2575.
Liu, F.; Ye, M.; Pan, Y.; Zhang, Y.; Bian, Y.; Sun, Z., 2015. Integration of Cell Lysis, Protein
Extraction, and Digestion into One Step for Ultrafast Sample Preparation for Phosphoproteome
Analysis. Anal. Chem. 86, 6786–6791.
Liyakathali, M. N.A., Muley, P.D., Aita, G., Boldor, D. 2016. Effect of frequency and reaction time in
focused ultrasonic pretreatment of energy cane bagasse for bioethanol production. Bioresour.
Technol. 200, 262-271.
Long, C., Liu, J., Gan, L., Zeng, B., Long, M., 2017. Optimization of Xylanase Production by
Trichoderma orientalis Using Corn Cobs and Wheat Bran via Statistical Strategy. Waste
Biomass Valorization. 1-8.
Lowe, S.E., Theodorou, M.K., Trinci, A.P. 1987. Cellulases and xylanase of an anaerobic rumen fungus
grown on wheat straw, wheat straw holocellulose, cellulose, and xylan. Appl. Environ.
Microbiol., 53(6), 1216-1223.
Lu, Z., Wang, Q., Jiang, S., Zhang, G., Ma, Y., 2016. Truncation of the unique N-terminal domain
improved the thermostability and specific activity of alkaline α-amylase Amy703. Sci. Rep.
6, 22465.
Lv, Z., Yang, J., Yuan, H., 2008. Production, purification and characterization of an alkaliphilic endo-
β-1,4-xylanase from a microbial community EMSD5. Enzyme Microb. Technol. 43, 343-
348.
Ma, L., Cui, Y., Cai, R., Liu, X., Zhang, C., Xiao, D. 2015. Optimization and evaluation of alkaline
potassium permanganate pretreatment of corncob. Bioresour. Technol. 180, 1-6.
Macheiner, D., Adamitsch, B.F., Karner, F., Hampel, W.A. 2003. Pretreatment and Hydrolysis of
Brewer's Spent Grains. Eng. Life Sci., 3(10), 401-405.
Macris, B. 1981. Production of extracellular lactase from Fusarium moniliforme. European J Appl.
Microbiol. Biotechnol., 13(3), 161-164.
Mai, N.L.; Ha, S.H.; Koo, Y.M., 2014 Efficient pretreatment of lignocellulose in ionic liquids/co-
solvent for enzymatic hydrolysis enhancement into fermentable sugars. Process Biochem. 49,
1144–1151.
Malinsky, J.; Opekarová, M.; Grossmann, G.; Tanner, W., 2013. Membrane microdomains, rafts, and
detergent-resistant membranes in plants and fungi. Annu. Rev. Plant Biol. 64, 501–529.
238
Mamma, D., Hatzinikolaou, D.G., Christakopoulos, P. 2004. Biochemical and catalytic properties of
two intracellular β-glucosidases from the fungus Penicillium decumbens active on flavonoid
glucosides. J Mol. Catal. B: Enzymatic, 27(4–6), 183-190.
Martín, C., Thomsen, M.H., Hauggaard-Nielsen, H., BelindaThomsen, A., 2008. Wet oxidation
pretreatment, enzymatic hydrolysis and simultaneous saccharification and fermentation of
clover–ryegrass mixtures. Bioresour. Technol. 99(18), 8777-8782.
Mathieson, W.; Thomas, G.A., 2013. Simultaneously extracting DNA, RNA, and protein using kits: Is
sample quantity or quality prejudiced? Anal. Biochem. 433, 10–18.
Maulini-Duran, C.; Abraham, J.; Rodríguez-Pérez, S.; Cerda, A.; Jiménez-Peñalver, P.; Gea, T., 2015.
Gaseous emissions during the solid state fermentation of different wastes for enzyme production
at pilot scale. Bioresour. Technol. 179, 211–218.
Mazutti, M., Bender, J.P., Treichel, H., Luccio, M.D. 2006. Optimization of inulinase production by
solid-state fermentation using sugarcane bagasse as substrate. Enz. Microbial Technol., 39(1),
56-59.
McCleary, B.V., Matheson, N.K. 1983. Action patterns and substrate-binding requirements of β-d-
mannanase with mannosaccharides and mannan-type polysaccharides. Carbohydr. Res.,
119(0), 191-219.
Mihailescu, R., Tafin, U.F., Corvec, S., Oliva, A., Betrisey, B., Borens, O., Trampuz, A., 2014. High
activity of fosfomycin and rifampin against methicillin-resistant Staphylococcus aureus
(MRSA) biofilm in vitro and in experimental foreign-body infection model. Antimicrob.
Agents Chemother. 02420-12.
Miller, G.L. 1959. Use of dinitrosalicylic acid reagent for determination of reducing sugar. Anal.
Chem., 31(3), 426-428.
Miller, G.L., 1959. Use of dinitrosalicylic acid reagent for determination of reducing sugar. Anal.
Chem. 31, 426-428.
Miller, G.L., 1959. Use of dinitrosalicylic acid reagent for determination of reducing sugar. Anal.
Chem. 31, 426-428.
Mirsada, H., Dzenita, S., Amra, R., Avdić, I.M., Serkan, D., Jasna, H., Feric, B.E., 2018. The Effect of
Lysozyme on Reducing Biofilms by Staphylococcus aureus, Pseudomonas aeruginosa, and
Gardnerella vaginalis: An In Vitro Examination. Microb. Drug Resist. 24, 353-358.
Mitrofanova, O., Mardanova, A., Evtugyn, V., Bogomolnaya, L., Sharipova, M., 2017. Effects of
Bacillus Serine Proteases on the Bacterial Biofilms. Biomed. Res. Int. 8525912.
Molobela, I.P., Cloete, T.E., Beukes, M., 2010. Protease and amylase enzymes for biofilm removal and
degradation of extracellular polymeric substances (EPS) produced by Pseudomonas
fluorescens bacteria. Afr. J Microbiol. Res. 4, 1515-1524.
Mottram, D.S., Wedzicha, B.L., Dodson, A.T., 2002. Food chemistry: acrylamide is formed in the
Maillard reaction. Nature. 419, 448.
Murthy, P.S., Naidu, M.M. 2012. Production and Application of Xylanase from Penicillium sp.
Utilizing Coffee By-products. Food Bioprocess Technol., 5(2), 657-664.
Murthy, P.S., Naidu, M.M., 2012. Production and Application of Xylanase from Penicillium sp.
Utilizing Coffee By-products. Food Bioprocess Technol. 5, 657-664.
239
Mussatto, S.I., Carneiro, L.M., Silva, J.P., Roberto, I.C., Teixeira, J.A. 2011. A study on chemical
constituents and sugars extraction from spent coffee grounds. Carbohydr. Polym., 83(2), 368-
374.
Mussatto, S.I., Dragone, G., Roberto, I.C. 2006. Brewers' spent grain: generation, characteristics and
potential applications. J. Cer. Sci., 43(1), 1-14.
Mustranta, A., Karvonen, E., Ojamo, H., Linko, M. 1981. Production of mold lactase. Biotechnol. Lett.,
3(7), 333-338.
Naganagouda, K., Salimath, P., Mulimani, V. 2009. Purification and characterization of endo-beta-1, 4
mannanase from Aspergillus niger gr for application in food processing industry. J Microbiol.
Biotechnol., 19(10), 1184-1190.
Nagar, S., Mittal, A., Gupta, V.K., 2012. Enzymatic clarification of fruit juices (Apple, Pineapple, and
Tomato) using purified Bacillus pumilus SV-85S xylanase. Biotechnol. Bioprocess Eng. 17,
1165-1175.
Nakkharat, P., Haltrich, D. 2006. Purification and characterisation of an intracellular enzyme with β-
glucosidase and β-galactosidase activity from the thermophilic fungus Talaromyces
thermophilus CBS 236.58. J Biotechnol., 123(3), 304-313.
Narayanaswamy, N., Faik, A., Goetz, D.J., Gu, T., 2011. Supercritical carbon dioxide pretreatment of
corn stover and switchgrass for lignocellulosic ethanol production. Bioresour. Technol. 102(13),
6995-7000.
Neumann, N.P., Lampen, J.O. 1967. Purification and Properties of Yeast Invertase*. Biochem., 6(2),
468-475.
Nevoigt, E., 2008. Progress in Metabolic Engineering of Saccharomyces cerevisiae. Microbiol. Mol.
Biol. Rev. 73, 379–412.
Niemi, P., Tamminen, T., Smeds, A., Viljanen, K., Ohra-aho, T., Holopainen-Mantila, U., Faulds, C.B.,
Poutanen, K., Buchert, J., 2012. Characterization of Lipids and Lignans in Brewer’s Spent
Grain and Its Enzymatically Extracted Fraction. J Agric. Food Chem. 60, 9910-9917.
Olaniyi, O.O., Osunla, C.A., Olaleye, O.O. Exploration of different species of orange peels for
mannanase production.
Olempska-Beer, Z.S.; Merker, R.I.; Ditto, M.D.; DiNovi, M.J., 2006. Food-processing enzymes from
recombinant microorganisms—A review. Regul. Toxicol. Pharm. 45, 144–58.
Oliva-Taravilla, A., Moreno, A.D., Demuez, M., Ibarra, D., Tomás-Pejó, E., González-Fernández, C.,
Ballesteros, M., 2015. Unraveling the effects of laccase treatment on enzymatic hydrolysis of
steam-exploded wheat straw. Bioresour. Technol. 175(0), 209-215.
Onilude, A., Fadaunsi, I., Garuba, E. 2012. Inulinase production by Saccharomyces sp. in solid state
fermentation using wheat bran as substrate. Ann. Microbiol., 62(2), 843-848.
Ostovareh, S., Karimi, K., Zamani, A. 2015. Efficient conversion of sweet sorghum stalks to biogas
and ethanol using organosolv pretreatment. Ind. Crop. Prod., 66, 170-177.
Ouattara, H.G., Reverchon, S., Niamke, S.L., Nasser, W., 2017. Regulation of the synthesis of pulp
degrading enzymes in Bacillus isolated from cocoa fermentation. Food Microbiol. 63, 255-
262.
Oyeleke, S., S. Auta and E. Egwim. 2010. Production and characterization of amylase produced by
Bacillus megaterium isolated from a local yam peel dumpsite in Minna, Niger State. J.
Microbiol. Antimicrobiol. 2(7), 88-92.
240
Pal, A., Khanum, F. 2010. Production and extraction optimization of xylanase from Aspergillus niger
DFR-5 through solid-state-fermentation. Bioresour. Technol. 101(19), 7563-7569.
Pal, A., Khanum, F. 2011b., Purification of xylanase from Aspergillus niger DFR-5: Individual and
interactive effect of temperature and pH on its stability. Process Biochem., 46(4), 879-887.
Pal, A., Khanum, F., 2011a. Efficacy of xylanase purified from Aspergillus niger DFR-5 alone and in
combination with pectinase and cellulase to improve yield and clarity of pineapple juice. J.
Food Sci. Technol. 48, 560-568.
Pandey, A. 1990. Improvements in solid-state fermentation for glucoamylase production. Biol. Wastes
34, 11-19.
Pandey, A., Selvakumar, P., Ashakumary, L. 1994. Glucoamylase production by Aspergillus niger on
rice bran is improved by adding nitrogen sources. World J Microbiol. Biotechnol. 10, 348-349
Pariza, M.W., Johnson, E.A. 2001. Evaluating the Safety of Microbial Enzyme Preparations Used in
Food Processing: Update for a New Century. Regul. Toxicol. Pharm., 33, 173-86
Pariza, M.W.; Johnson, E.A., 2001. Evaluating the Safety of Microbial Enzyme Preparations Used in
Food Processing: Update for a New Century. Regul. Toxicol. Pharm. 33, 173–86.
Park, Y., Kang, S., Lee, J., Hong, S., Kim, S., 2002. Xylanase production in solid state fermentation by
Aspergillus niger mutant using statistical experimental designs. Appl. Microbiol. Biotechnol.
58(6), 761-766.
Parmar, I. and Rupasinghe, H.V. 2013 Bio-conversion of apple pomace into ethanol and acetic acid:
Enzymatic hydrolysis and fermentation. Bioresour. Technol. 130, 613-620.
Patil, S.R., Dayanand, A. 2006. Production of pectinase from deseeded sunflower head by Aspergillus
niger in submerged and solid-state conditions. Bioresour. Technol., 97(16), 2054-2058.
Pečová, M.; Šebela, M.; Markova, Z.; Polakova, K.; Čuda, J.; Šafářová, K., 2013. Thermostable trypsin
conjugates immobilized to biogenic magnetite show a high operational stability and remarkable
reusability for protein digestion. Nanotechnology. 24, 125102.
Pereira, P.H.F., Voorwald, H.C.J., Cioffi, M.O.H., Mullinari, D.R., Da Luz, S.M., Da Silva, M.L.C.P.
2011. Sugarcane bagasse pulping and bleaching: Thermal and chemical characterization.
BioResour., 6(3), 2471-2482.
Pereira, P.H.F., Voorwald, H.C.J., Cioffi, M.O.H., Mullinari, D.R., Da Luz, S.M., Da Silva, M.L.C.P.
2011. Sugarcane bagasse pulping and bleaching: Thermal and chemical characterization.
BioResources, 6(3), 2471-2482.
Phitsuwan, P.; Laohakunjit, N.; Kerdchoechuen, O.; Kyu, K.L.; Ratanakhanokchai, K. 2013 Present
and potential applications of cellulases in agriculture, biotechnology, and bioenergy. Folia
Microbiol, 58, 163–176.
Plackett, R.L., Burman, J.P., 1946. The design of optimum multifactorial experiments. Biometrika. 305-
325.
Polizeli, M., Rizzatti, A., Monti, R., Terenzi, H., Jorge, J., Amorim, D. 2005. Xylanases from fungi:
properties and industrial applications. Appl. Microbiol. Biotechnol., 67(5), 577-591.
Prajapati, V.S., Trivedi, U.B., Patel, K.C., 2015. A statistical approach for the production of
thermostable and alklophilic alpha-amylase from Bacillus amyloliquefaciens KCP2 under
solid-state fermentation. 3 Biotech. 5, 211-220.
241
Prakash, B., Vidyasagar, M., Madhukumar, M. S., Muralikrishna, G., & Sreeramulu, K. (2009).
Production, purification, and characterization of two extremely halotolerant, thermostable, and
alkali-stable α-amylases from Chromohalobacter sp. TVSP 101. Process Biochem. 44(2), 210-
215.
Prasertsan, P., Kunghae, A., Maneesri, J., Oi, S., 1997. Optimization for xylanase and cellulase
production from Aspergillus niger ATTC 6275 in palm oil mill wastes and its application.
World J Microbiol. Biotechnol. 13, 555-559.
Pujol, D., Liu, C., Gominho, J., Olivella, M.À., Fiol, N., Villaescusa, I. and Pereira, H., 2013. The
chemical composition of exhausted coffee waste. Ind. Crops. Prod. , 50,.423-429.
Ragauskas, A.J.; Beckham, G.T.; Biddy, M.J.; Chandra, R.; Chen, F.; Davis, M.F. 2014 Lignin
valorization: Improving lignin processing in the biorefinery. Science, 344, 1246843.
Raghavi, S., Sindhu, R., Binod, P., Gnansounou, E., Pandey, A. 2016. Development of a novel
sequential pretreatment strategy for the production of bioethanol from sugarcane trash.
Bioresour. Technol., 199, 202-210.
Rahmati, P., Sajedi, R.H., Zamani, P., Rahmani, H., Khajeh, K., 2017. Allosteric properties of
Geobacillus maltogenic amylase. Enzyme Microb. Technol., 96, 36-41.
Raj Kashyap, D., Kumar Soni, S., Tewari, R. 2003. Enhanced production of pectinase by Bacillus sp.
DT7 using solid state fermentation. Bioresour. Technol., 88(3), 251-254.
Rajagopalan, G. and C. Krishnan. 2008. α-Amylase production from catabolite derepressed Bacillus
subtilis KCC103 utilizing sugarcane bagasse hydrolysate. Bioresour. Technol. 99(8), 3044-
3050.
Rajagopalan, G., Krishnan, C., 2008. α-Amylase production from catabolite derepressed Bacillus
subtilis KCC103 utilizing sugarcane bagasse hydrolysate. Bioresour. Technol. 99, 3044-
3050.
Ramalingam, C., Harris, A.D. 2010. Xylanases and its application in food industry: A Review. J Exp.
Sci., 1(7).
Rashad, M.M., Nooman, M.U. 2009. Production, purification and characterization of extracellular
invertase from Saccharomyses cerevisiae NRRL Y-12632 by solid state fermentation of red
carrot residue. Aust J Basic Appl Sci, 3(3), 1910-1919.
Ravindran, R., Desmond, C., Jaiswal, S., Jaiswal, A.K., 2018. Optimisation of organosolv pretreatment
for the extraction of polyphenols from spent coffee waste and subsequent recovery of
fermentable sugars. Bioresour. Technol. Report. 3, 7-14.
Ravindran, R., Jaiswal, A.K. 2016. A comprehensive review on pre-treatment strategy for
lignocellulosic food industry waste: Challenges and opportunities. Bioresour. Technol. 199,
92-102.
Ravindran, R., Jaiswal, A.K. 2016. Exploitation of food industry waste for high-value products. Trends
Biotechnol. 34, 58-69.
Ravindran, R., Jaiswal, A.K. 2016b. Exploitation of Food Industry Waste for High-Value Products.
Trends Biotechnol., 34(1), 58-69.
Ravindran, R., Jaiswal, S., Abu-Ghannam, N., Jaiswal, A.K., 2017. Two-step sequential pretreatment
for the enhanced enzymatic hydrolysis of coffee spent waste. Bioresour. Technol. 239, 276-
284.
242
Ravindran, R., Jaiswal, S., Abu-Ghannam, N., Jaiswal, A.K., 2018. A comparative analysis of
pretreatment strategies on the properties and hydrolysis of brewers’ spent grain. Bioresour.
Technol. 248, 272-279.
Ravindran, R.; Jaiswal, A.K., 2016 A comprehensive review on pre-treatment strategy for
lignocellulosic food industry waste: Challenges and opportunities. Bioresour. Technol. 199, 92–
102.
Rickard, P., Laughlin, T. 1980. Detection and assay of xylanolytic enzymes in a Cellulomonas isolate.
Biotechnol. Lett., 2(8), 363-368.
Rickard, P., Laughlin, T. 1980. Detection and assay of xylanolytic enzymes in a Cellulomonas isolate.
Biotechnol. Lett., 2(8), 363-368.
Robertson, J.A., I'Anson, K.J.A., Treimo, J., Faulds, C.B., Brocklehurst, T.F., Eijsink, V.G.H.,
Waldron, K.W. 2010. Profiling brewers' spent grain for composition and microbial ecology at
the site of production. LWT - Food Sci. Technol., 43(6), 890-896.
Rocha, M.V.P., de Matos, L.J.B.L., Lima, L.P.d., Figueiredo, P.M.d.S., Lucena, I.L., Fernandes,
F.A.N., Gonçalves, L.R.B. 2014. Ultrasound-assisted production of biodiesel and ethanol from
spent coffee grounds. Bioresour. Technol., 167, 343-348.
Roohi, & Kuddus, M. 2014. Bio-statistical approach for optimization of cold-active α-amylase
production by novel psychrotolerant M. foliorum GA2 in solid state fermentation. Biocatal.
Agricultural Biotechnol.. 3(2), 175-181.
Roukas., 2016 T. The role of oxidative stress on carotene production by Blakeslea trispora in
submerged fermentation. Crit. Rev. Biotechnol. 36, 424–433.
Ruiz, H.A., Cerqueira, M.A., Silva, H.D., Rodríguez-Jasso, R.M., Vicente, A.A., Teixeira, J.A. 2013.
Biorefinery valorization of autohydrolysis wheat straw hemicellulose to be applied in a
polymer-blend film. Carbohydr. Polymer. 92(2), 2154-2162.
Sachslehner, A., Nidetzky, B., Kulbe, K.D., Haltrich, D. 1998. Induction of Mannanase, Xylanase, and
Endoglucanase Activities in Sclerotium rolfsii. Appl. Env. Microbiol., 64(2), 594-600.
Sadekuzzaman, M., Yang, S., Mizan, M.F.R., Ha, S.D., 2015. Current and Recent Advanced Strategies
for Combating Biofilms. Compr. Rev. Food Sci. Food Saf. 14, 491-509.
Sahnoun, M., Kriaa, M., Elgharbi, F., Ayadi, D.-Z., Bejar, S., & Kammoun, R. (2015). Aspergillus
oryzae S2 alpha-amylase production under solid state fermentation: Optimization of culture
conditions. Int. J Biol. Macromol. 75(0), 73-80.
Sakai, T., Sakamoto, T., Hallaert, J., Vandamme, E.J. 1993. ⌈Pectin, Pectinase, and Protopectinase:
Production, Properties, and Applications. in: Adv. Appl. Microbiol., (Eds.) N. Saul, I.L. Allen,
Vol. Volume 39, Academic Press, pp. 213-234.
Sánchez, C. 2009. Lignocellulosic residues: biodegradation and bioconversion by fungi. Biotechnol.
Adv. 27(2), 185-194.
Santos, D.M.d., Bukzem, A.d.L., Ascheri, D.P.R., Signini, R., Aquino, G.L.B.d. 2015. Microwave-
assisted carboxymethylation of cellulose extracted from brewer's spent grain. Carbohydr.
Polym., 131, 125-133.
Saravanan, P., Muthuvelayudham, R., Viruthagiri, T. 2012. Application of Statistical Design for the
Production of Cellulase by Trichoderma reesei Using Mango Peel. Enzyme Res., 2012, 7.
243
Schilling, J., Tewalt, J., Duncan, S., 2009. Synergy between pretreatment lignocellulose modifications
and saccharification efficiency in two brown rot fungal systems. Appl. Microbiol. Biotechnol.
84(3), 465-475.
Schilling, J.S., Ai, J., Blanchette, R.A., Duncan, S.M., Filley, T.R., Tschirner, U.W., 2012.
Lignocellulose modifications by brown rot fungi and their effects, as pretreatments, on
cellulolysis. Bioresour. Technol. 116(0), 147-154.
Scully, D. S., Abu-Ghannam, N., Jaiswal, A. K. 2016. An investigation into spent coffee waste as a
renewable source of bioactive compounds and industrially important sugars. Bioengineering,
Sen, S. K., Dora, T. K., Bandyopadhyay, B., Mohapatra, P. K. D., & Raut, S. 2014. Thermostable alpha-
amylase enzyme production from hot spring isolates Alcaligenes faecalis SSB17 – Statistical
optimization. Biocatalysis and Agricultural Biotechnology, 3(4), 218-226
Servili, M., Begliomini, A.L., Montedoro, G., Petruccioli, M., Federici, F. 1992. Utilisation of a yeast
pectinase in olive oil extraction and red wine making processes. J. Sci. Food Agric., 58(2),
253-260.
Seyis, I., Aksoz, N. 2004. Production of Lactase by Trichoderma sp. Food Technol. Biotechnol., 42(2),
121-124.
Seyis, I., Aksoz, N. 2005. Xylanase Production from Trichoderma harzianum 1073 D 3 with Alternative
Carbon and Nitrogen Sources. Food Technol. Biotechnol., 43(1), 37-40.
Shao, Q., Cheng, C., Ong, R.G., Zhu, L., Zhao, C. 2013. Hydrogen peroxide presoaking of bamboo
prior to AFEX pretreatment and impact on enzymatic conversion to fermentable sugars.
Bioresour. Technol., 142(0), 26-31.
Shin, H., Kong, J., Lee, J., Lee, T. 2000. Syntheses of hydroxybenzyl-α-glucosides by
amyloglucosidase-catalyzed transglycosylation. Biotechnol. Lett. 22, 321-325.
Shukla, S.K., Rao, T.S., 2013. Dispersal of Bap-mediated Staphylococcus aureus biofilm by proteinase
K. J Antibiot. 66, 55.
Sills, D.L., Gossett, J.M. 2012. Using FTIR to predict saccharification from enzymatic hydrolysis of
alkali-pretreated biomasses. Biotechnol. Bioeng. 109(2), 353-362.
Silva, D., Tokuioshi, K., da Silva Martins, E., Da Silva, R., Gomes, E. 2005. Production of pectinase
by solid-state fermentation with Penicillium viridicatum RFC3. Process Biochem., 40(8),
2885-2889.
Silva, N.F.D.S., Simões, M.R., Knob, A., De Moraes, S.S., Henn, C., Da ConceiçãO Silva, J.L., Simão,
R.D.C.G., Maller, A., Kadowaki, M.K., 2016. Improvement in the bleaching of kraft pulp
with xylanase from Penicillium crustosum FP 11 isolated from the Atlantic forest. Biocatal.
Biotransformation. 34, 119-127.
Sim, T.S., Oh, J.C.S. 1990. Spent brewery grains as substrate for the production of cellulases by
Trichoderma reesei QM9414. J Ind. Microbiol., 5(2-3), 153-158.
Simair, A.A., Qureshi, A.S., Khushk, I., Ali, C.H., Lashari, S., Bhutto, M.A., Mangrio, G.S., Lu, C.,
2017. Production and Partial Characterization of α-Amylase Enzyme from Bacillus sp. BCC
01-50 and Potential Applications. BioMed Res. Int. 2017, 9173040-9173040.
Singh, H., Soni, S.K. 2001. Production of starch-gel digesting amyloglucosidase by Aspergillus oryzae
HS-3 in solid state fermentation. Process Biochem. 37, 453-459.
Singh, J., Suhag, M., Dhaka, A., 2015. Augmented digestion of lignocellulose by steam explosion, acid
and alkaline pretreatment methods: A review. Carbohydr. Polym. 117(0), 624-631.
244
Singhania, R.R., Saini, J.K., Saini, R., Adsul, M., Mathur, A., Gupta, R., Tuli, D.K. 2014. Bioethanol
production from wheat straw via enzymatic route employing Penicillium janthinellum
cellulases. Bioresour. Technol. 169, 490-495.
Singhania, R.R.; Sukumaran, R.K.; Patel, A.K.; Larroche, C.; Pandey, A., 2010. Advancement and
comparative profiles in the production technologies using solid-state and submerged
fermentation for microbial cellulases. Enzyme Microb. Technol. 46, 541–549.
Siripong, P., Duangporn, P., Takata, E., Tsutsumi, Y. 2016. Phosphoric acid pretreatment of
Achyranthes aspera and Sida acuta weed biomass to improve enzymatic hydrolysis. Bioresour.
Technol., 203, 303-308.
Sluiter, A., Hames, B., Ruiz, R., Scarlata, C., Sluiter, J., Templeton, D., Crocker, D. 2008.
Determination of structural carbohydrates and lignin in biomass. Laboratory Analytical
Procedure, 1617.
Sluiter, A., Ruiz, R., Scarlata, C., Sluiter, J., Templeton, D., 2005. Determination of extractives in
biomass. Laboratory Analytical Procedure (LAP), 1617.
Song, J.-M. and D.-Z. Wei. 2010. Production and characterization of cellulases and xylanases of
Cellulosimicrobium cellulans grown in pretreated and extracted bagasse and minimal nutrient
medium M9. Biomass Bioenergy 34(12): 1930-1934.
Soni, S. K., N. Goyal, J. K. Gupta and R. Soni. 2012. Enhanced production of α-amylase from Bacillus
subtilis subsp. spizizenii in solid state fermentation by response surface methodology and its
evaluation in the hydrolysis of raw potato starch. Starch - Stärke 64(1), 64-77.
Souza, P.M.D., 2010. Application of microbial α-amylase in industry-A review. Braz. J Microbiol. 41,
850-861.
Srivastava, R., Baruah, J., 1986. Culture conditions for production of thermostable amylase by Bacillus
stearothermophilus. Appl. Environ. Microbiol., 52, 179-184.
Subhedar, P.B., Gogate, P.R. 2014. Alkaline and ultrasound assisted alkaline pretreatment for
intensification of delignification process from sustainable raw-material. Ultrason. Sonochem.
21(1), 216-225.
Sun, H.-Y., Li, J., Zhao, P., Peng, M. 2013. Banana peel: A novel substrate for cellulase production
under solid-state fermentation. Afr. J Biotechnol., 10(77), 17887-17890.
Sun, R., Lu, Q., Sun, X.F. 2001. Physico-chemical and thermal characterization of lignins from
Caligonum monogoliacum and Tamarix spp. Polym. Degrad. Stab., 72(2), 229-238.
Sun, S.-N., Cao, X.-F., Xu, F., Sun, R.-C., Jones, G.L., Baird, M., 2014. Structure and thermal property
of alkaline hemicelluloses from steam exploded Phyllostachys pubescens. Carbohydr. Polym.
101(0), 1191-1197.
Sun, Y., Cheng, J. 2002. Hydrolysis of lignocellulosic materials for ethanol production: a review.
Bioresour. Technol. 83(1), 1-11.
Sundarram, A., & Murthy, T. P. K. (2014). ¦Á-Amylase Production and Applications: A Review.
Journal of Applied & Environmental Microbiology, 2(4), 166-175.
Taherzadeh, M.J., Niklasson, C., Lidén, G., 1997. Acetic acid—friend or foe in anaerobic batch
conversion of glucose to ethanol by Saccharomyces cerevisiae? Chem. Eng. Sci. 52(15), 2653-
2659.
Tajchakavit, S., Boye, J., Bélanger, D., Couture, R., 2001. Kinetics of haze formation and factors
influencing the development of haze in clarified apple juice. Food Res. Int., 34, 431-440.
245
Takahashi, Y., Kawabata, H., Murakami, S., 2013. Analysis of functional xylanases in xylan
degradation by Aspergillus niger E-1 and characterization of the GH family 10 xylanase
XynVII. SpringerPlus. 2, 447-447.
Tamaki, Y., Mazza, G. 2011. Rapid Determination of Carbohydrates, Ash, and Extractives Contents of
Straw Using Attenuated Total Reflectance Fourier Transform Mid-Infrared Spectroscopy. J.
Agric. Food Chem. 59(12), 6346-6352.
Tang, X.-J., He, G.-Q., Chen, Q.-H., Zhang, X.-Y., Ali, M.A.M. 2004. Medium optimization for the
production of thermal stable β-glucanase by Bacillus subtilis ZJF-1A5 using response surface
methodology. Bioresour. Technol., 93(2), 175-181.
Thippeswamy, S., K. Girigowda and V. Mulimani. 2006. Isolation and identification of α-amylase
producing Bacillus sp. from dhal industry waste. Ind. J. Biochem. Biophys. 43, 295-298.
Trajano, H., Engle, N., Foston, M., Ragauskas, A., Tschaplinski, T., Wyman, C., 2013. The fate of
lignin during hydrothermal pretreatment. Biotechnol. Biofuels. 6(1), 110.
Tuck, C. O., Pérez, E., Horváth, I. T., Sheldon, R. A., & Poliakoff, M. 2012. Valorization of biomass:
deriving more value from waste. Science, 337(6095), 695-699.
Uçkun Kiran, E., Trzcinski, A.P., Ng, W.J., Liu, Y. 2014. Bioconversion of food waste to energy: A
review. Fuel, 134(0), 389-399.
Ulbricht, R.J., Northup, S.J., Thomas, J.A., 1984. A review of 5-hydroxymethylfurfural (HMF) in
parenteral solutions. Fund. Appl. Toxicol. 4(5), 843-853.
Uma, C., Gomathi, D., Muthulakshmi, C., Gopalakrishnan, V. 2010. Production, purification and
characterization of invertase by Aspergillus flavus using fruit peel waste as substrate. Adv Biol
Res, 4(1), 31-36.
Uma, C., Gomathi, D., Ravikumar, G., Kalaiselvi, M., Palaniswamy, M. 2012. Production and
properties of invertase from a Cladosporium cladosporioides in SmF using pomegranate peel
waste as substrate. Asian Pacific Journal of Tropical Biomedicine, 2(2, Supplement), S605-
S611.
Uppugundla, N., da Costa Sousa, L., Chundawat, S.P., Yu, X., Simmons, B., Singh, S., Gao, X., Kumar,
R., Wyman, C.E., Dale, B.E., Balan, V. 2014. A comparative study of ethanol production using
dilute acid, ionic liquid and AFEX™ pretreated corn stover. Biotechnol. Biofuels., 7(1), 1-14.
Utomo, H.D., Hunter, K. 2006. Adsorption of divalent copper, zinc, cadmium and lead ions from
aqueous solution by waste tea and coffee adsorbents. Environ. Technol., 27(1), 25-32.
Vaikundamoorthy, R., Rajendran, R., Selvaraju, A., Moorthy, K., Perumal, S., 2018. Development of
thermostable amylase enzyme from Bacillus cereus for potential antibiofilm activity. Bioorg.
Chem. 77, 494-506.
Vandamme, E.J., Derycke, D.G. 1983. Microbial inulinases: fermentation process, properties, and
applications. Adv. Appl. Microbiol, 29(1), 983.
Vandenberghe, L.P.; Carvalho, J.C.; Libardi, N.; Rodrigues, C.; Soccol, C.R., 2016. Chapter 1—
Microbial Enzyme Factories: Current Trends in Production Processes and Commercial Aspects.
In Agro-Industrial Wastes as Feedstock for Enzyme Production; Dhillon, G.S., Kaur, S., Eds.;
Academic Press: San Diego, CA, USA; pp. 1–22.
Várnai, A., Mäkelä, M.R., Djajadi, D.T., Rahikainen, J., Hatakka, A., Viikari, L. 2014. Chapter Four -
Carbohydrate-Binding Modules of Fungal Cellulases: Occurrence in Nature, Function, and
Relevance in Industrial Biomass Conversion. in: Adv. Appl. Microbiol., (Eds.) S. Sima, G.
Geoffrey Michael, Vol. Volume 88, Academic Press, pp. 103-165.
246
Veana, F., Martínez-Hernández, J.L., Aguilar, C.N., Rodríguez-Herrera, R., Michelena, G. 2014.
Utilization of molasses and sugar cane bagasse for production of fungal invertase in solid state
fermentation using Aspergillus niger GH1. Brazilian J Microbiol., 45, 373-377.
Velmurugan, R., Muthukumar, K. 2012a. Sono-assisted enzymatic saccharification of sugarcane
bagasse for bioethanol production. Biochem. Eng. J. 63, 1-9.
Velmurugan, R., Muthukumar, K. 2012b. Ultrasound-assisted alkaline pretreatment of sugarcane
bagasse for fermentable sugar production: Optimization through response surface
methodology. Bioresour. Technol. 112, 293-299.
Vijayaraghavan, K., Yamini, D., Ambika, V., Sravya Sowdamini, N. 2009. Trends in inulinase
production – a review. Crit. Rev. Biotechnol., 29(1), 67-77.
Villettaz, J.-C., Steiner, D., Trogus, H. 1984. The Use of a Beta Glucanase as an Enzyme in Wine
Clarification and Filtration. American J Enol. Vitic., 35(4), 253-256.
Wolters, N., Schabronath, C., Schembecker, G., Merz, J. 2016. Efficient conversion of pretreated
brewer’s spent grain and wheat bran by submerged cultivation of Hericium erinaceus.
Bioresour. Technol., 222, 123-129.
Xiao, C.; Anderson. 2013 C.T. Roles of pectin in biomass yield and processing for biofuels. Front. Plant
Sci. 4, 67.
Xiros, C., Christakopoulos, P. 2012. Biotechnological Potential of Brewers Spent Grain and its Recent
Applications. Waste and Biomass Valorization, 3(2), 213-232.
Xu, F., Yu, J., Tesso, T., Dowell, F., Wang, D. 2013. Qualitative and quantitative analysis of
lignocellulosic biomass using infrared techniques: A mini-review. Appl. Energ. 104, 801-809.
Xu, H., L. Sun, D. Zhao, B. Zhang, Y. Shi and Y. Wu. 2008. Production of α‐amylase by Aspergillus
oryzae As 3951 in solid state fermentation using spent brewing grains as substrate. J. Sci. Food
Agr. 88(3), 529-535.
Yang, S.; Hai, F.I.; Nghiem, L.D.; Roddick, F.; Price, W.E., 2012. Removal of trace organic
contaminants by nitrifying activated sludge and whole-cell and crude enzyme extract of
Trametes versicolor. Water Sci. Technol. 67, 1216–1223.
Yang, S.Q., Xiong, H., Yang, H.Y., Yan, Q.J., Jiang, Z.Q. 2015. High-level production of β-1,3-1,4-
glucanase by Rhizomucor miehei under solid-state fermentation and its potential application
in the brewing industry. J Appl. Microbiol., 118(1), 84-91.
Yin, J., Wang, K., Yang, Y., Shen, D., Wang, M., Mo, H. 2014. Improving production of volatile fatty
acids from food waste fermentation by hydrothermal pretreatment. Bioresour. Technol. 171(0),
323-329.
Young, C.L.; Britton, Z.T.; Robinson, A.S., 2012. Recombinant protein expression and purification: A
comprehensive review of affinity tags and microbial applications. Biotechnol. J. 7, 620–634.
Youssef, N.H.; Couger, M.B.; Struchtemeyer, C.G.; Liggenstoffer, A.S.; Prade, R.A.; Najar, F.Z., 2013.
The Genome of the Anaerobic Fungus Orpinomyces sp. Strain C1A Reveals the Unique
Evolutionary History of a Remarkable Plant Biomass Degrader. Appl. Environ. Microbiol. 79,
4620–4634.
Zampieri, D., Guerra, L., Camassola, M., Dillon, A.J.P. 2013. Secretion of endoglucanases and β-
glucosidases by Penicillium echinulatum 9A02S1 in presence of different carbon sources. Ind.
Crop. Prod., 50(0), 882-886.
247
Zeng, Y.; Zhao, S.; Yang, S.; Ding, S.Y. 2014 Lignin plays a negative role in the biochemical process
for producing lignocellulosic biofuels. Curr. Opin. Biotechnol. 27, 38–45.
Zhang, B.; Weng, Y.; Xu, H.; Mao, Z., 2012. Enzyme immobilization for biodiesel production. Appl.
Microbiol. Biotechnol. 93, 61–70.
Zhang, J., Zang, L. 2016. Enhancement of biohydrogen production from brewers’ spent grain by
calcined-red mud pretreatment. Bioresour. Technol., 209, 73-79.
Zhang, Q., He, J., Tian, M., Mao, Z., Tang, L., Zhang, J., Zhang, H., 2011. Enhancement of methane
production from cassava residues by biological pretreatment using a constructed microbial
consortium. Bioresour. Technol. 102(19), 8899-8906.
Zhao, C., Ding, W., Chen, F., Cheng, C., Shao, Q., 2014. Effects of compositional changes of AFEX-
treated and H-AFEX-treated corn stover on enzymatic digestibility. Bioresour. Technol. 155(0),
34-40.
Zhao, X., Cheng, K., Liu, D. 2009. Organosolv pretreatment of lignocellulosic biomass for enzymatic
hydrolysis. Appl. Microbiol Biotechnol., 82(5), 815.
Zheng, G. and M. Slavik. 1999. Isolation, partial purification and characterization of a bacteriocin
produced by a newly isolated Bacillus subtilis strain. Lett. Appl. Microbiol. 28(5): 363-367.
Zheng, Y., Lee, C., Yu, C., Cheng, Y.-S., Zhang, R., Jenkins, B.M., VanderGheynst, J.S. 2013. Dilute
acid pretreatment and fermentation of sugar beet pulp to ethanol. Appl. Energ., 105, 1-7.
Zittan, L. 1981. Enzymatic hydrolysis of inulin—an alternative way to fructose production. Starch‐
Stärke, 33(11), 373-377.
248
11. Peer Review Publications
Peer Review Publications
1. Ravindran, R., Williams, G. A. & Jaiswal, A. K. (2018). An investigation on
spent coffee waste as a potential media component for xylanase production
employing Aspergillus niger ATCC® 6275. Biotechnology Reports (Submitted
to Journal).
2. Ravindran, R., Williams, G. A. & Jaiswal, A. K. (2018). Evaluation of brewer's
spent grain hydrolysate as a substrate for production of thermostable a-amylase
by Bacillus stearothermophilus. Bioresource Technology Reports (Reviewer
comments submitted).
3. Ravindran, R., Hassan, S. S., Williams, G. A. & Jaiswal, A. K. (2018). A review
on bioconversion of agro-industrial wastes to industrially important enzymes.
Bioengineering-MDPI, 5(4), 93; doi:10.3390/bioengineering5040093.
4. Ravindran, R., Jaiswal, S., Abu-ghannam, N. & Jaiswal, A. K. (2018). A
comparative analysis of pretreatment strategies on the properties and hydrolysis
of Brewers' spent grain. Bioresource Technology, 248, 272-279.
5. Ravindran, R., Jaiswal, S., Abu-Ghannam, N. & Jaiswal, A. K. (2017). Two-step
sequential pretreatment for the enhanced enzymatic hydrolysis of coffee spent
waste. Bioresource Technology, 239, 276–284.
6. Ravindran, R., Jaiswal, S., Abu-Ghannam, N. & Jaiswal, A. K. (2017).
Evaluation of ultrasound assisted potassium permanganate pre-treatment of
spent coffee waste. Bioresource Technology, 224, 680–687.
7. Ravindran, R. & Jaiswal, A. K. (2016). Microbial enzyme production using
lignocellulosic food industry wastes as feedstock: A Review, Bioengineering,
3(4), 30; doi:10.3390/bioengineering3040030.
8. Ravindran, R. & Jaiswal, A. K. (2016). Exploitation of food industry waste for
high value products. Trends in Biotechnology, 34(1), 58-69.
249
9. Ravindran, R. & Jaiswal, A. K. (2016). A comprehensive review on pre-
treatment strategy for lignocellulosic food industry waste: challenges and
opportunities. Bioresource Technology, 92(0), 92-102.
12. Oral/ Poster Presentations
Oral/ Poster Presentations
1. Ravindran, R., Williams, G. A. & Jaiswal, A. K. (2018). Optimisation of solid-
state fermentation using spent coffee waste as substrate for xylanase production.
2nd International Conference on Bioresource Technology for Bioenergy,
Bioproducts & Environmental Sustainability, 16 - 19 September, 2018, Melia
Sitges, Spain.
2. Ravindran, R., Williams, G. A. & Jaiswal, A. K. (2018). Thermostable α‐
amylase production by Bacillus stearothermophilus utilising brewer’s spent
grain hydrolysate. 2nd International Conference on Bioresource Technology for
Bioenergy, Bioproducts & Environmental Sustainability, 16 - 19 September,
2018, Melia Sitges, Spain.
3. Ravindran, R. & Jaiswal, A. K. (2018). Effect of various pretreatments on the
composition and hydrolysis of spent coffee waste. 2nd International Conference
on Bioresource Technology for Bioenergy, Bioproducts & Environmental
Sustainability, 16 - 19 September, 2018, Melia Sitges, Spain.
4. Ravindran, R., Jaiswal, S., & Jaiswal, A. K. (2018). Effect of different
pretreatments on the composition and sugar recovery from spent coffee waste.
LignoBiotech V Symposium, the Fifth Symposium of Biotechnology Applied to
Lignocelluloses. August 29- September 1, 2018, Helsinki, Finland.
5. Ravindran, R., & Jaiswal, A. K. (2018). Optimisation of thermostable α-amylase
production from B. stearothermophilus using Brewer’s spent grain as a carbon
source. LignoBiotech V Symposium, the Fifth Symposium of Biotechnology
Applied to Lignocelluloses. August 29- September 1, 2018, Helsinki, Finland.
6. Ravindran, R., Sarangapani C., Jaiswal, A. K. & Abu-Ghannam, N. (2018).
Novel non-thermal plasma treatment for improving enzymatic hydrolysis of
250
brewer spent grain. ECO-BIO, Challenges in Building a Sustainable Biobased
Economy, March 4-7, 2018, Dublin, Ireland.
7. Ravindran, R., Sarangapani C. & Jaiswal, A. K. (2016). Improved enzymatic
hydrolysis of lignocellulose through oxidative removal of lignin by air pressure
plasma. 1st International Conference on Bioresource Technology for Bioenergy,
Bioproducts & Environmental Sustainability, October 23-26, 2016, Barcelona,
Spain.
8. Ravindran, R., Sarangapani C. & Jaiswal, A. K. (2016). Mimicking the Fenton
reaction using atmospheric air pressure plasma for lignocellulose pre-treatment.
1st International Conference on Bioresource Technology for Bioenergy,
Bioproducts & Environmental Sustainability, October 23-26, 2016, Barcelona,
Spain.
9. Ravindran, R. & Jaiswal, A. K. (2016). Metal chloride assisted plasma pre-
treatment strategy of lignocellulose for the production of amylase. 4th
Symposium on Biotechnology applied to Lignocelluloses, June 19-22, 2016,
Madrid, Spain.
10. Ravindran, R. & Jaiswal, A. K. (2016). Ultrasound assisted alkaline potassium
permanganate pre-treatment of spent coffee waste. Presented at “International
Conference on Renewable Resources and Biorefineries (ICRRB 2016), Jan 18-
19, 2016, London, UK.
11. Ravindran, R. & Jaiswal, A. K. (2016). Sequential and combinatorial pre-
treatment strategy of lignocellulose for the enhanced enzymatic hydrolysis of
spent coffee waste. Presented at “International Conference on Renewable
Resources and Biorefineries (ICRRB 2016), Jan 18-19, 2016, London, UK.
251
13. Book Chapters
Book Chapters
1. Ravindran, R., & Jaiswal, A. K. (2018). Current advances in immobilization
techniques of enzymes. In: Inamuddin & A. M. Ansari (Eds.). Enzymatic and
Microbial Fuel Cells. Millersville, PA, USA, Materials Research Forum LLC
(in press).
2. Ravindran, R., & Jaiswal, A. K. (2018). Enzymes in bioconversion and food
processing. In: M. Kuddus (Ed.). Enzymes in Food Technology: Improvement
and Innovation. Springer Nature, Singapore (pp. 19-40).
3. Ravindran, R., & Jaiswal, A. K. (2017). Toxicological aspects of irradiated
foods. In: Ferreira, I, C. F. R., Antonio, A. L. & Verde, S. C. (Eds.). Food
Irradiation Technologies: Concepts, Applications and Outcomes. Cambridge,
UK, The Royal Society of Chemistry (pp. 337 - 351).
4. Ravindran, R., Sharma, S. & Jaiswal, A. K. (2016). Enzymes in processing of
functional foods ingredients and nutraceuticals. In: Martirosyan D. M. (Ed.).
Functional Foods for Chronic Diseases (Vol 1). Dallas, TX, USA, D&A Inc.
(pp. 360-385).
5. Ravindran, R., Sharma, S. & Jaiswal, A. K. (2016). Enzymes in food processing:
Impact on food products attributes. In: Jaiswal, A. K. (Ed.). Food Processing
Technologies: Impact on Product Attributes. Boca Raton, Florida, USA, CRC
Press. (pp. 695-722).