image copy detection and evolution visualisation using tree
TRANSCRIPT
1
Image Copy Detection and Evolution
Visualisation Using Tree GraphsMohand Said Allili, Nathalie Casemajor, Aymen Talbi,
Abstract
Image copy detection is an important problem for several applications such as detecting forgery to
enforce copyright protection and intellectual property. One of the important problems following copy
detection, however, is the assessment of the type of modifications undergone by an original image to
form its copies. In this work, we propose a method for quantifying some of these modifications when
multiple copies of the same image are available. We also propose an algorithm to estimate temporal
precedence between images (i.e., the order of creation of the copies). Using the estimated relations, a
tree graph is then built to visualise the history of evolution of the original image into its copies. Our
work is important for ensuring better interpretation of image copies after their detection. It also lays a
new ground for enhancing image indexing and search on the Web.
Index Terms
Image copy detection, image transformation, copy evolution graph, history visualisation.
2
I. INTRODUCTION
The growing popularity of Internet and social media has enabled ubiquitous and distributed
sharing of digital photos among Internet users. This is accompanied by new possibilities to copy,
alter and distribute digital content easily to a large number of recipients thanks to the availability
and accessibility of image processing software [13]. A huge challenge, therefore, arises for the
ability of tracking and monitoring the evolution of original photos in the Web, in order to
enforce intellectual property and copyright protection. Tracking image copies can also be useful
for analysing the dissemination and impact of photos in artistic/journalistic Web communities
[2], [41]. Although several methods have been proposed in the past for image copy detection [2],
[17], [13], not much research have been conducted for the purpose of tracing and/or visualising
copy image evolution in the Web.
With the advent of content based image retrieval (CBIR) systems, the possibility of browsing
and making instant searches in the Web, based on visual content, have opened new frontiers
for image-based applications such as security, tourism, journalism, Web analytics [6]. Among
important and common problems in these applications is the detection and management of image
copies. In recent years, image copy detection has received the focus of several research works
[13], [37], [41]. In opposite to general-purpose CBIR, where images exhibiting the same global
visual properties as the query image are searched (e.g., color, texture, layout, etc.), copy detection
aims at finding copies of an original image, which have undergone some kind of alteration [2].
An alteration can be of several types (e.g., photometric, geometric, editing, compression, etc.),
which modifies locally or globally the visual content of the image.
Early approaches for copy detection are based on watermarking which consists of embedding
signatures (or watermarks) for copyright protection [5]. A watermark is an invisible and embedded
identification code carrying information about the copyright owner [13]. Thus, detecting copies
amounts to identifying the watermark encoded in the image. However, these methods can be
vulnerable since watermarks can be removed or altered via postprocessing techniques [14], [20].
Recently, the concept of content-based copy detection (CBCD) has been proposed as an alternative
to watermarking for detecting illegal image copies [8], [17]. The goal of a CBCD system is to
determine, using only the image content, whether near-replicas of a given image exist in the
3
Web or through an unauthorized third party [27], [35]. Several methods have been proposed
for CBCD in recent years [2], [17]. Worth mentioning are CBCD systems available online such
as TinEye and Piximilar [27]. To detect possible copies, these systems are based on low-level
feature extraction, followed by similarity measurement between images.
Copy detection systems are generally good at finding similarities between images and detecting
identical content. However, they do not tell much about the type of transformation operated
on an image to produce its copies. This is due to the difficulty of having a unique way of
determining the variety of transformations that can be applied on an image. Indeed, there is
a large number of image manipulation possibilities, ranging from simple geometric/photometric
transforms or resizing to more complex transforms, such as image editing, cropping, stitching and
compression [21]. Moreover, even in the case of simple geometric transformations, for example,
algorithms can fail to recover the exact transformation parameters when the image is significantly
altered [25]. Therefore, having a unique algorithm to detect all types of transformation seems
an illusive pursuit. Nonetheless, one can make the problem more tractable by making some
assumptions about the generative process of copies from original images. Also, transformations
can be categorized into several types (e.g., photometric, geometric) to facilitate investigation
about the potential set of manipulations operated to produce each image copy.
In this paper, we propose a method for constructing an evolution graph for a set of image copies
having the same origin. Given a root image or a set of reference images determined by experts,
our method infers the most likely transformations used to produce the remaining image copies.
For simplicity, we focus mainly on three types of image transformations for copy production:
geometric, photometric, and image editing. Geometric transformations refer to changes due to
affine transforms and image distortions [21]. Photometric transformations refer to image color
enhancement, filtering and color-to-gray transform [10]. Finally, editing refers to basic operations
such as image cropping, zooming, seam carving and text/object insertion [9]. To detect relations
between images, our method is based on three main steps. The first step consists in detecting
simple transformations such as image cropping, resizing, rotations and color-to-gray transforms.
These transformations, although easy to detect, enable to establish strong ties between images.
Therefore, they will be used to initialize the copy evolution graph. The second step consists of
4
inferring the remaining relations between images by detecting the most likely predecessor for
each image. Thus, each image will have its lineage assessed through the constructed graph. The
final step consists of annotating the graph with the most likely transformations used to produce
the copies. Several experiments conducted to validate to proposed approach have shown its
performance to produce interpretable and meaningful graphs compared to manually constructed
ones.
The remainder of this paper is organized as follows. Section II describes the proposed approach
for identifying image transformations and evolution graph visualization of copies. Section III
presents experimental results validating our approach. We end the paper with a conclusion and
future work perspectives.
II. THE PROPOSED APPROACH
Suppose that we have a set of n images I = {I1, ..., In} representing different copies of
an original image I0. The goal is to retrace the order of creation of the copies in a form
of a tree graph depicting the history of copy creation from I0 to its descendent(s). Since an
image can undergo arbitrary transformations, some of which are irreversible in their nature
(e.g., image cropping, editing), it is hard to assess with certainty all types of transformations
between two images in I. However, an approximation of these transformations is still possible
through a reverse-engineering-like approach using similarity measures between images. This
will help understanding the generative process of the image copies and unravel the most likely
transformations used through it.
To facilitate problem formulation, and without loss of generality, we suppose that we have
the following groups of transformations: C: image cropping, E: edition, G: color to gray, L:
illumination change, R: rotation, S: scale change. Note that since we can have several types
of editions, some of which are carried out at a local level (e.g., text insertion/removal, object
insertion, face blurring, etc.) and the others at a global level (e.g. image distortion, compression,
etc.), we use a subscript to indicate the edition type: ET : text insection/removal, EB: border
insertion and EG: global manipulation (e.g., noise, compression, etc.). Finally, to express that a
copy Ij of an image Ii is generated using one of the transformations T ∈ {C,E,G,R, S, L},
we adopt the following notation: Ij = T (Ii,φ), where φ is the set of parameters used in
5
transformation T . In case of an image rotation, for example, we have φ = {θ} where θ is
the rotation angle.
Note that where there are multiple transformation candidates for explaining the creation of
a particular copy, we use the principle of least action by selecting the simplest transformation
among the candidates. For example, if we have two possible rotations to produce image IC from
images IA and IB, respectively, such that IC = R(IA, θ1) = R(IB, θ2) and θ1 < θ2, then we
will suppose that IC is produced by the rotation with smallest angle, that is IA → IC . The goal
of our approach is to infer the most likely set of transformations used to produce I1, ..., In, and
build on an evolution graph depicting the lineage of each image copy. Our algorithm starts by
forming relations with the strongest evidence among the images, and then completing the graph
by inferring the rest of the relations using image processing techniques.
A. Estimating strong relations between images
One of the strongest relations that can be estimated with high confidence among images are:
cropping (C), color to gray (G), rotations (R) and scale changes (S). Indeed, these transformations
do not produce major modifications in the image content which makes them relatively easy to be
detected through correlation analysis. More formally, we measure normalized cross-correlation
(NCC) between all pairs of images. Given two gray-scale images of equal size, IA and IB, the
NCC is given by the formula:
NCC(IA, IB) =
∑x,y IA(x, y)IB(x, y)√∑
x,y IA(x, y)2∑
x,y IB(x, y)2, (1)
where the summations are made over all the image coordinates. Note that NCC(IA, IB) ∈ [0, 1],
where NCC(IA, IB) = 1 if IA and IB are perfectly identical, and NCC(IA, IB)≪ 1, otherwise.
Given two arbitrary images IA and IB in our set I, with sizes let HA ×WA and HB ×WB,
respectively, the following relations can be asserted through NCC calculation:
• We consider IB as a cropping of IA, denoted by IB = C(IA,φ) with φ = {x, y,HB,WB},
if there exist a sub-image I ′A of size HB × WB centered at location (x, y) ∈ IA where
NCC(I ′A, IB) = 1.
• We consider IA as a rotation of IB if there exist an angle θ where NCC(R(IA, θ), IB) = 1,
where R(IA, θ) stands for a rotation of image IA with an angle θ. To simplify things, we
6
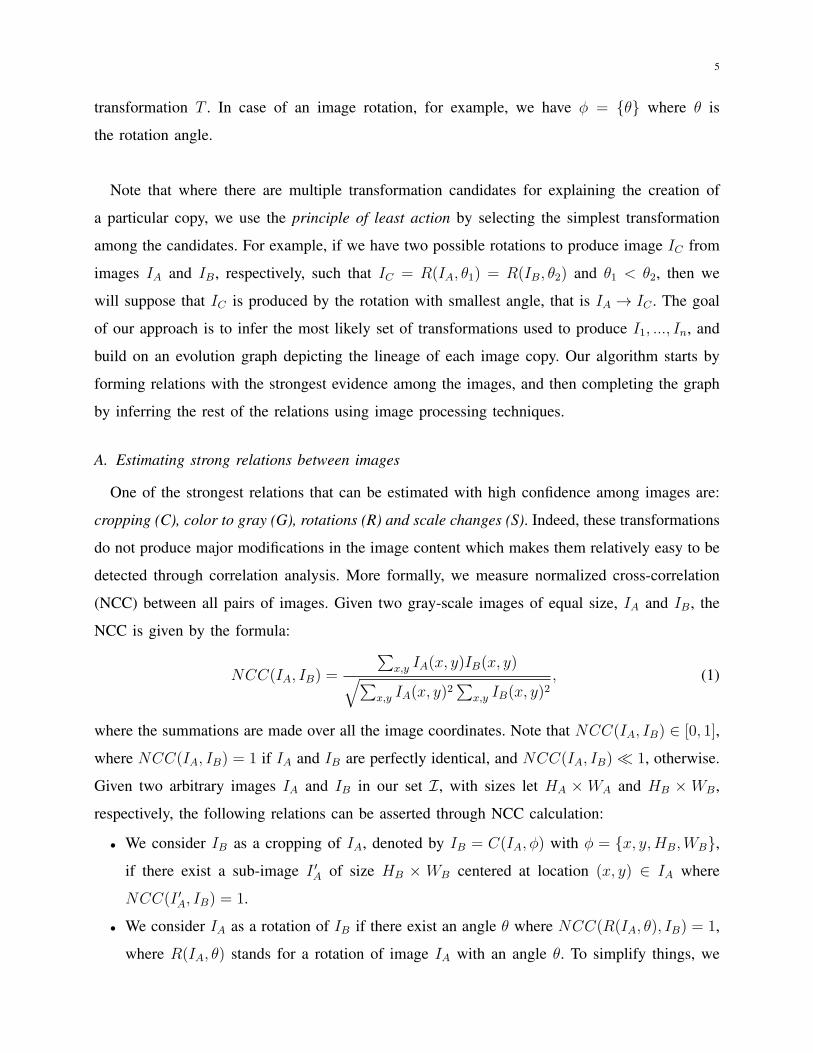
Fig. 1: Cropping detection using CNN. (a) represents the original image IA, (b) represents theresult after cropping image IA. (c) represents the value of NCC at different locations in IA and(d) represents I ′A a highlight of the location if I ′A.
take the following angle values: θ = δπ4 where δ ∈ {1, ..., 8}.
• A scale change occurs between image IA and IB if there exists a factor s ∈ N∗ with
NCC(S(IA, s), IB) ≃ 1, where S(IA, s) is a scale change of image IA with factor s.
• We consider IB as a grayscale version of IA if NCC(G(IA), IB) = 1, where G(IA) is a
grayscale transformation of image IA obtained by averaging its RGB color channels.
• We consider IB as a result of illumination change of of IA, denoted by IB = L(IA, γ) with γ
is the parameter of the Gamma transform, if NCC(IA, IB) = 1 and there exist a parameter
γ such that the histograms of L(IA, γ) and IB are identical. Note that the negative of an
image belongs also to this category of transformation.
Note that to detect the above relations, our algorithm tests the three first transformations on each
pair of images using different combinations of the transformation parameters. More specifically,
we test the occurrence of cropping at each image location using 8 values of rotations and 5
scales, making up to 40 tests at each location. For instance, as shown in Fig. 1, a cropping of
the image (a) followed by a scale change, have been used to produce the image (b). The images
in (c) and (d) show, respectively, the NCC map and the cropping location corresponding to the
highest correlation value.
7
B. Image grouping for copy lineage detection
Once the strongest relations are detected in I, we perform an agglomerative clustering on
the images in I. In this regard, two cases can arise. In the first one, no reference images are
available and a fully unsupervised grouping is then performed. In the second one, some image
references are available (that will constitute the roots of our graph), and we can perform a
supervised grouping, thereof. The reference images can either be designated by an expert or
found in official sites such as museums, archives and art galleries, for example. Each reference
image is then used as centroid on which a cluster is built to constitute one lineage.
To group images into lineage clusters, we use image similarity based on a combination of
strong relations detection and histogram comparison. Given two images IA and IB, we use the
Bhattacharyya distance to measure the similarity between their histograms. Let HjA and Hj
B be
the histograms of IA and IB at color channel j ∈ {R,G,B}, and Nbins is the number of bins in
the histograms. The histogram similarity between images IA and IB is given by:
SH(IA, IB) =∑
j∈{R,G,B}
B(HjA, H
jB)
3(2)
where B(HjA, H
jB) =
∑Nbinsi=1
√Hj
A(i) ·HjB(i). The clustering is performed according to the
following similarity measurement and the single link method to calculate distance between
intermediary groups for cluster fusion [7]. Finally, distance between two images is taken as
follows:
d(IA, IB)
⎧⎨
⎩0 if IA → IB (∃ strong relation)
1− SH(IA, IB) otherwise(3)
where IA → IB means that a strong precedence relation has been already established between
IA and IB as described in previous section. The inclusion of the first condition is intended
to prevent clustering errors related to effects of transformations such image cropping, where
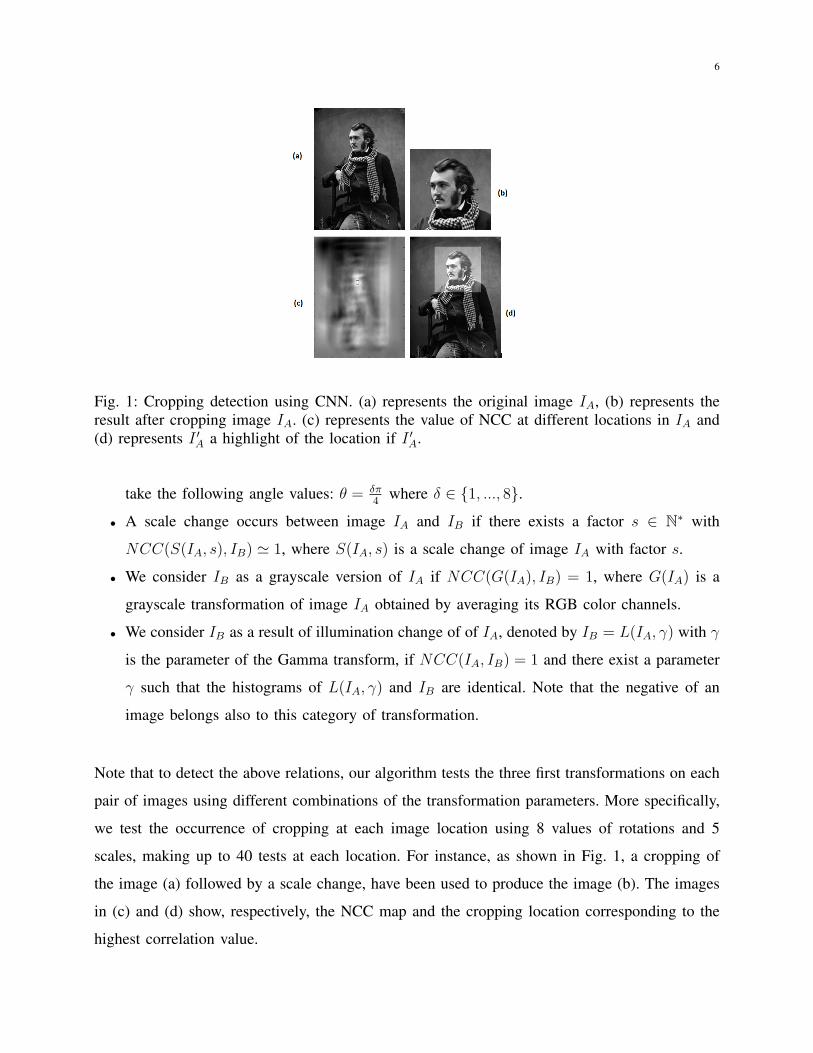
the histogram of the cropped image can be significantly different from the original image. Fig.
2 shows an example of clustering for images in our third data set using the proposed method.
Clearly, images showing similarities of their content have been grouped into homogenous clusters
that will constitute different lineages in the final graph.
8
(a) (b)
Fig. 2: Illustration of image grouping by histogram comparison: (a) copy image set, (b) obtainedcopy groups constituting lineage clusters.
C. Detecting image editions
Image editing refers to improving digital images by removing unwanted elements such as
scratches, red eye effect, etc., or inserting elements such as objects, text or image sharpening.
Image editing can be carried out at pixel or global (parametric) level. Pixel-level editing affects
the image at the pixel level (e.g., text/object insertion/removal, scrach/red eye removal, etc.).
Global-level editing refers to transformations affecting all the pixels of the image (e.g., image
distortion, compression, illumination changes, etc.). In our work, we deal with these two types
of editions by using appropriate features extracted from the image. To discriminate between the
different types of editions, we use content-based image similarity measurements upon which a
supervised classification is performed.
Let IA and IB be two images, where IB is the result of editing IA. To compare the two images
at a local level, we first align them using [25]. Then, a change map B is calculated for IA by
9
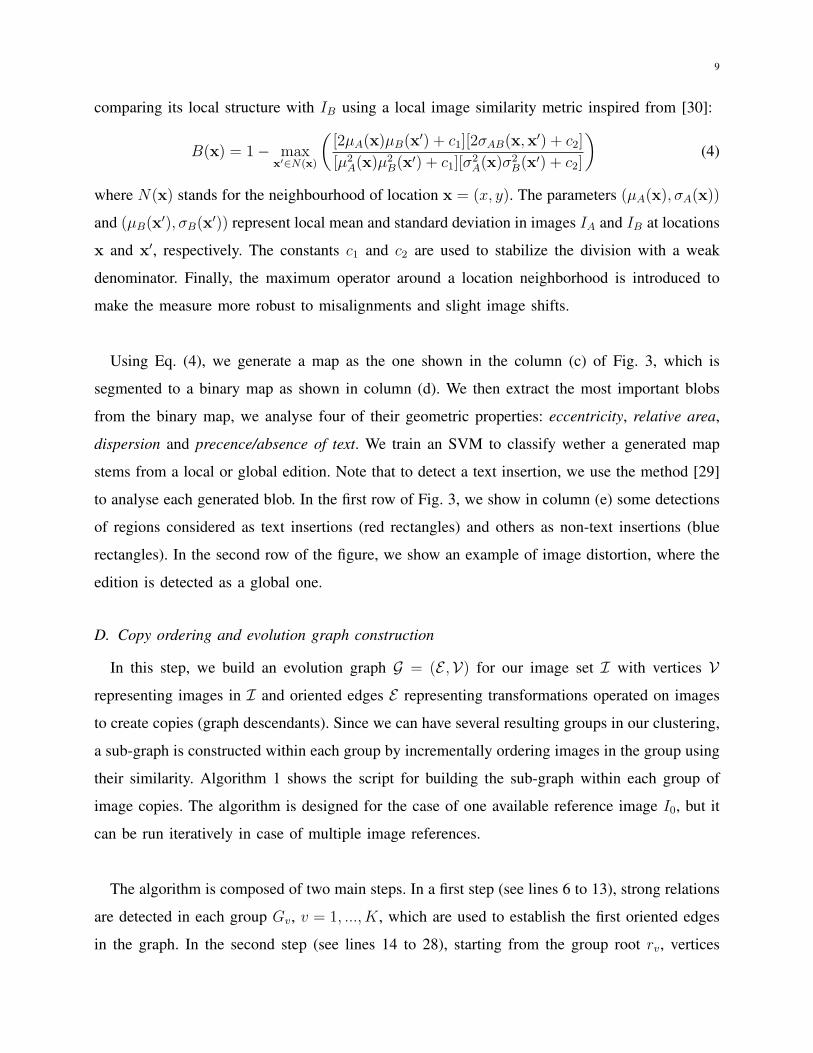
comparing its local structure with IB using a local image similarity metric inspired from [30]:
B(x) = 1− maxx′∈N(x)
([2µA(x)µB(x′) + c1][2σAB(x,x′) + c2]
[µ2A(x)µ
2B(x
′) + c1][σ2A(x)σ
2B(x
′) + c2]
)(4)
where N(x) stands for the neighbourhood of location x = (x, y). The parameters (µA(x), σA(x))
and (µB(x′), σB(x′)) represent local mean and standard deviation in images IA and IB at locations
x and x′, respectively. The constants c1 and c2 are used to stabilize the division with a weak
denominator. Finally, the maximum operator around a location neighborhood is introduced to
make the measure more robust to misalignments and slight image shifts.
Using Eq. (4), we generate a map as the one shown in the column (c) of Fig. 3, which is
segmented to a binary map as shown in column (d). We then extract the most important blobs
from the binary map, we analyse four of their geometric properties: eccentricity, relative area,
dispersion and precence/absence of text. We train an SVM to classify wether a generated map
stems from a local or global edition. Note that to detect a text insertion, we use the method [29]
to analyse each generated blob. In the first row of Fig. 3, we show in column (e) some detections
of regions considered as text insertions (red rectangles) and others as non-text insertions (blue
rectangles). In the second row of the figure, we show an example of image distortion, where the
edition is detected as a global one.
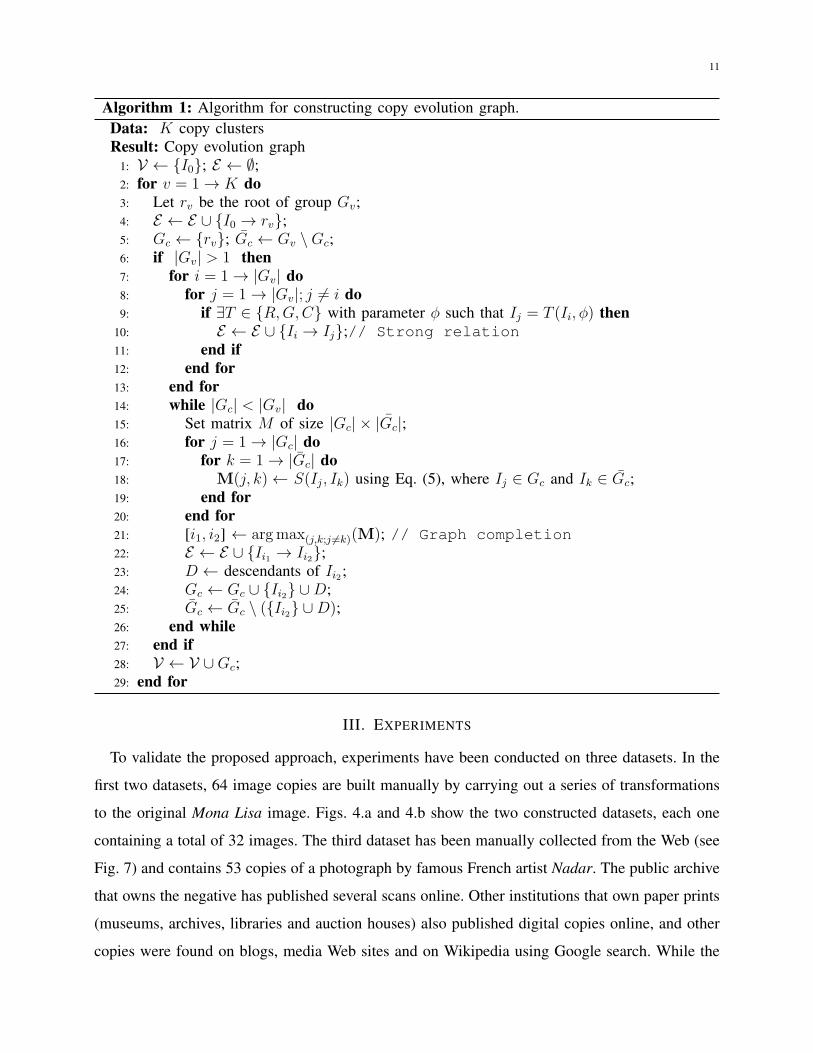
D. Copy ordering and evolution graph construction
In this step, we build an evolution graph G = (E ,V) for our image set I with vertices V
representing images in I and oriented edges E representing transformations operated on images
to create copies (graph descendants). Since we can have several resulting groups in our clustering,
a sub-graph is constructed within each group by incrementally ordering images in the group using
their similarity. Algorithm 1 shows the script for building the sub-graph within each group of
image copies. The algorithm is designed for the case of one available reference image I0, but it
can be run iteratively in case of multiple image references.
The algorithm is composed of two main steps. In a first step (see lines 6 to 13), strong relations
are detected in each group Gv, v = 1, ..., K, which are used to establish the first oriented edges
in the graph. In the second step (see lines 14 to 28), starting from the group root rv, vertices
10
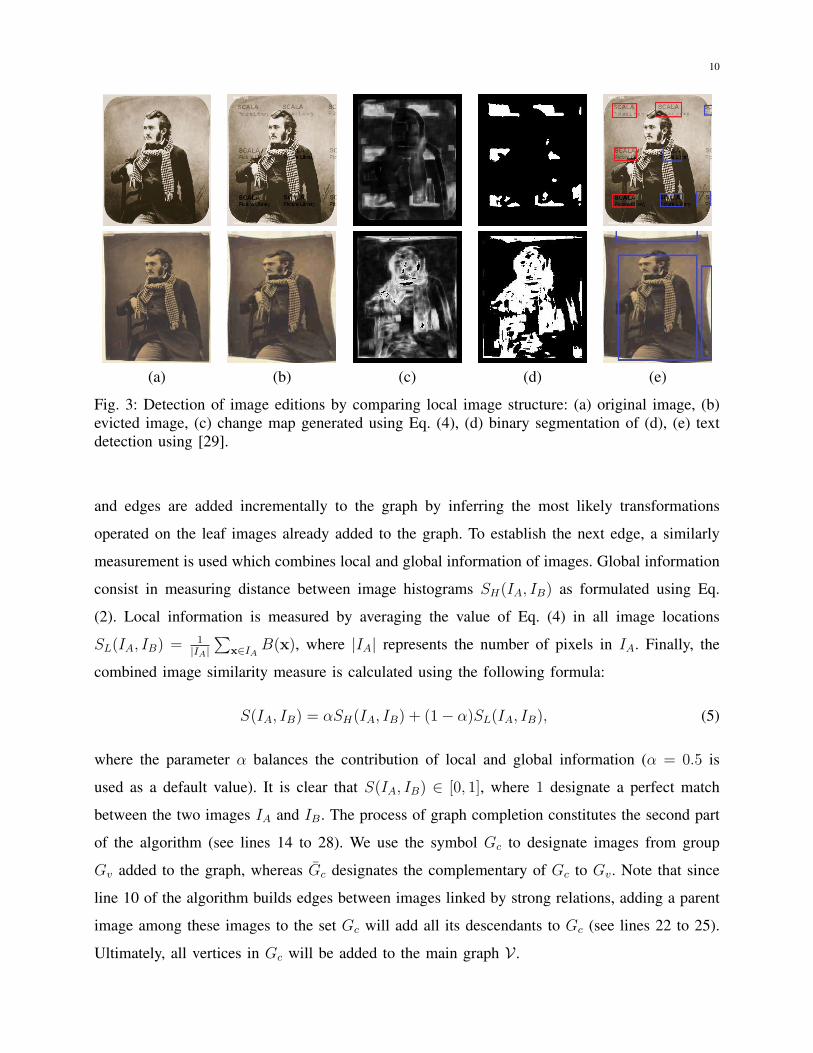
(a) (b) (c) (d) (e)
Fig. 3: Detection of image editions by comparing local image structure: (a) original image, (b)evicted image, (c) change map generated using Eq. (4), (d) binary segmentation of (d), (e) textdetection using [29].
and edges are added incrementally to the graph by inferring the most likely transformations
operated on the leaf images already added to the graph. To establish the next edge, a similarly
measurement is used which combines local and global information of images. Global information
consist in measuring distance between image histograms SH(IA, IB) as formulated using Eq.
(2). Local information is measured by averaging the value of Eq. (4) in all image locations
SL(IA, IB) = 1|IA|
∑x∈IA B(x), where |IA| represents the number of pixels in IA. Finally, the
combined image similarity measure is calculated using the following formula:
S(IA, IB) = αSH(IA, IB) + (1− α)SL(IA, IB), (5)
where the parameter α balances the contribution of local and global information (α = 0.5 is
used as a default value). It is clear that S(IA, IB) ∈ [0, 1], where 1 designate a perfect match
between the two images IA and IB. The process of graph completion constitutes the second part
of the algorithm (see lines 14 to 28). We use the symbol Gc to designate images from group
Gv added to the graph, whereas Gc designates the complementary of Gc to Gv. Note that since
line 10 of the algorithm builds edges between images linked by strong relations, adding a parent
image among these images to the set Gc will add all its descendants to Gc (see lines 22 to 25).
Ultimately, all vertices in Gc will be added to the main graph V .
11
Algorithm 1: Algorithm for constructing copy evolution graph.Data: K copy clustersResult: Copy evolution graph
1: V ← {I0}; E ← ∅;2: for v = 1→ K do3: Let rv be the root of group Gv;4: E ← E ∪ {I0 → rv};5: Gc ← {rv}; Gc ← Gv \Gc;6: if |Gv| > 1 then7: for i = 1→ |Gv| do8: for j = 1→ |Gv|; j = i do9: if ∃T ∈ {R,G,C} with parameter φ such that Ij = T (Ii,φ) then
10: E ← E ∪ {Ii → Ij};// Strong relation11: end if12: end for13: end for14: while |Gc| < |Gv| do15: Set matrix M of size |Gc|× ¯|Gc|;16: for j = 1→ |Gc| do17: for k = 1→ |Gc| do18: M(j, k)← S(Ij, Ik) using Eq. (5), where Ij ∈ Gc and Ik ∈ Gc;19: end for20: end for21: [i1, i2] ← argmax(j,k;j =k)(M); // Graph completion22: E ← E ∪ {Ii1 → Ii2};23: D ← descendants of Ii2;24: Gc ← Gc ∪ {Ii2} ∪D;25: Gc ← Gc \ ({Ii2} ∪D);26: end while27: end if28: V ← V ∪Gc;29: end for
III. EXPERIMENTS
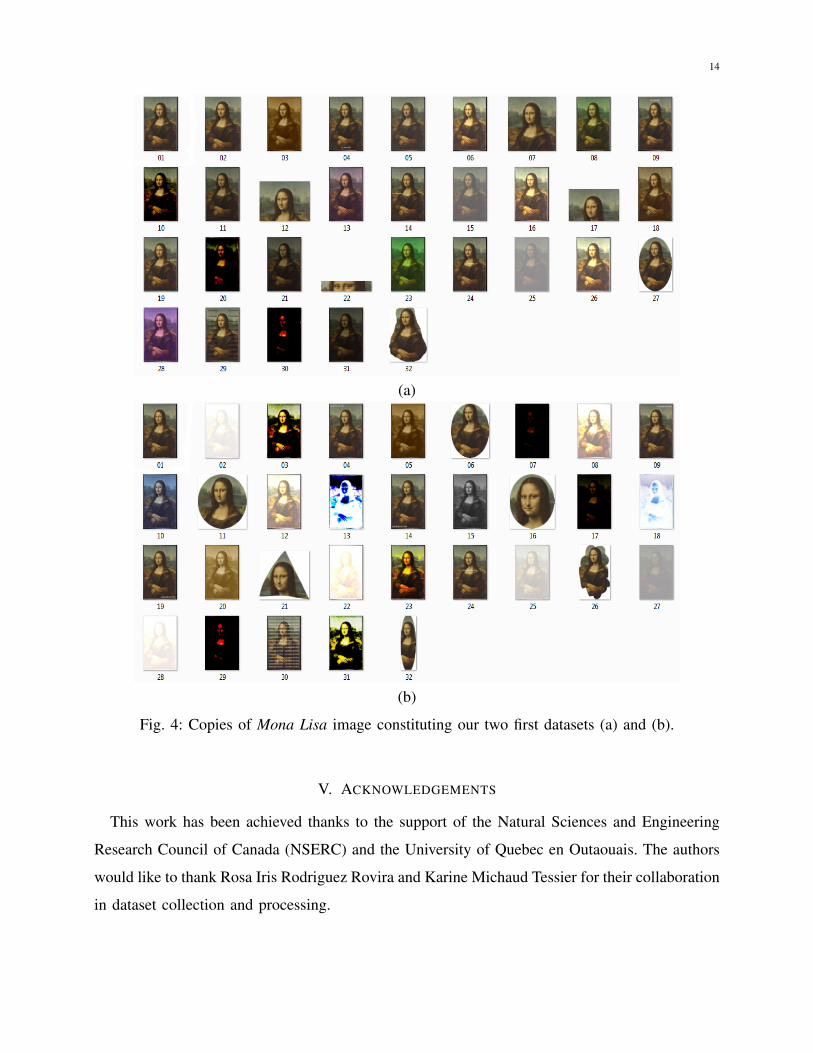
To validate the proposed approach, experiments have been conducted on three datasets. In the
first two datasets, 64 image copies are built manually by carrying out a series of transformations
to the original Mona Lisa image. Figs. 4.a and 4.b show the two constructed datasets, each one
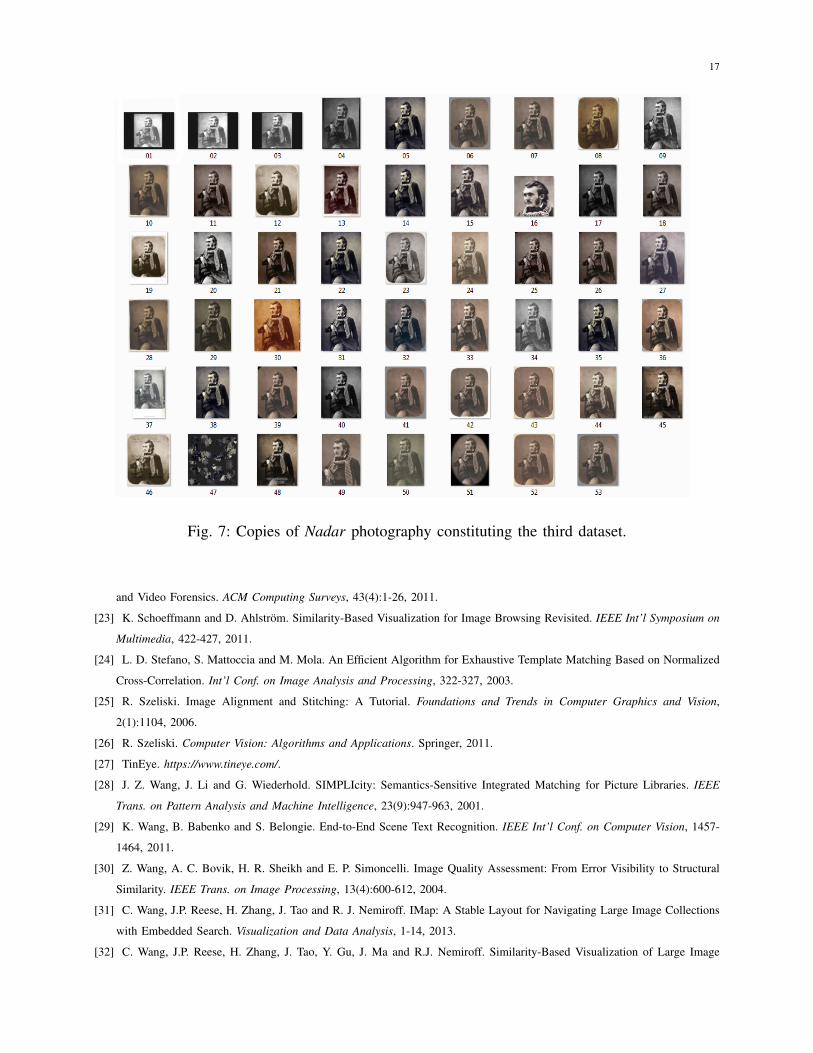
containing a total of 32 images. The third dataset has been manually collected from the Web (see
Fig. 7) and contains 53 copies of a photograph by famous French artist Nadar. The public archive
that owns the negative has published several scans online. Other institutions that own paper prints
(museums, archives, libraries and auction houses) also published digital copies online, and other
copies were found on blogs, media Web sites and on Wikipedia using Google search. While the
12
first two datasets are complete (comprising all roots and descendants in every lineage), the third
dataset has gaps: some roots and descendants may be missing, which is likely to be the case
when copies are largely collected from the Web.
To evaluate the accuracy of constructed evolution graphs, we compared them to ground truth
when available (datasets I and II) or to a graph created by an expert (dataset III) based on
qualitative analysis of the visual content of the images and analysis of the context of publication
of images on web pages (e.g., authority of the website, mention of source, presence of hyperlink).
For the first two datasets, since we have generated all the copies, a reference graph is built based
on the transformations used to create the copies. For the third dataset, a reference graph is
manually generated. To assess the performance of our method, we measure the similarity of the
obtained graphs with the ground truth. For this goal, such a similarity measurement must take into
account the following specificities for our graphs. Since we are not interested in precise creation
time of the image copies, horizontal order of vertices within the same level is not important.
However, the vertical order of vertices in each vertical path from the root is important since it
depicts the lineage of each copy that is generated from its ancestors. Therefore, we cannot use
directly existing methods for comparing tree graphs since most of them are dedicated to binary
ordered trees. [39], [38]. Instead, we designed another measure with details given as follows:
Let Ii = I0 be a vertex in the constructed graph G and Pa(Ii) its parent in the same graph.
Let Anc(Ii) be the set of ancestors of Ii different form Pa(Ii) in the graph. Let Ij be the image
from which Ii is originated. In a uni-level search, we consider that the parent of Ii is correctly
identified if Ij = Pa(Ii). We assign a score si = 1 if a parent is correctly identified, and si = 0,
otherwise. In a multi-level search, a parent of Ii is correctly identified if Ij = Pa(Ii) and partially
identified if Ij ∈ Anc(Ii). To differentiate between the two cases, we assign score si = 1 if a
parent is correctly identified, si = 1/2 if a parent is partially identified and si = 0 otherwise.
Finally, the total score s of a dataset I is given by the following formula: s =∑n
i=1 si/n. A
perfect match will obviously have a 100% score.
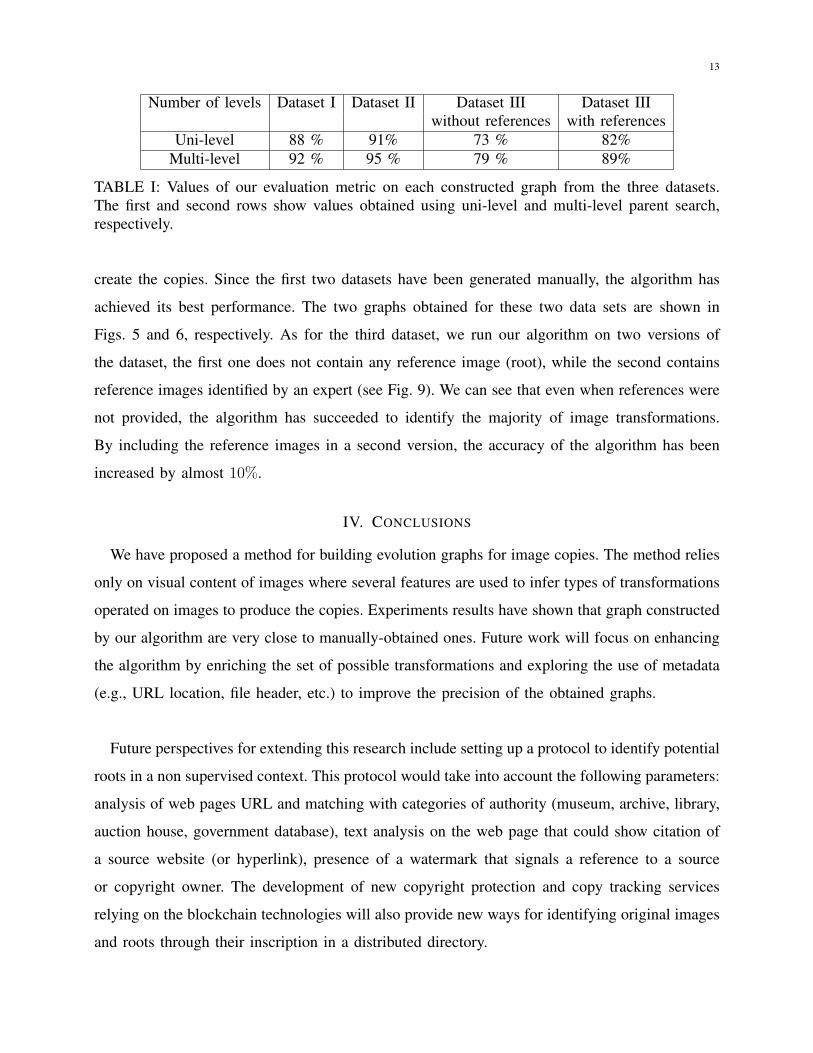
Table I shows values of our evaluation metric on each constructed graph from the three datasets.
We can see that our algorithm has succeeded in identifying most of the transformations used to
13
Number of levels Dataset I Dataset II Dataset III Dataset IIIwithout references with references
Uni-level 88 % 91% 73 % 82%Multi-level 92 % 95 % 79 % 89%
TABLE I: Values of our evaluation metric on each constructed graph from the three datasets.The first and second rows show values obtained using uni-level and multi-level parent search,respectively.
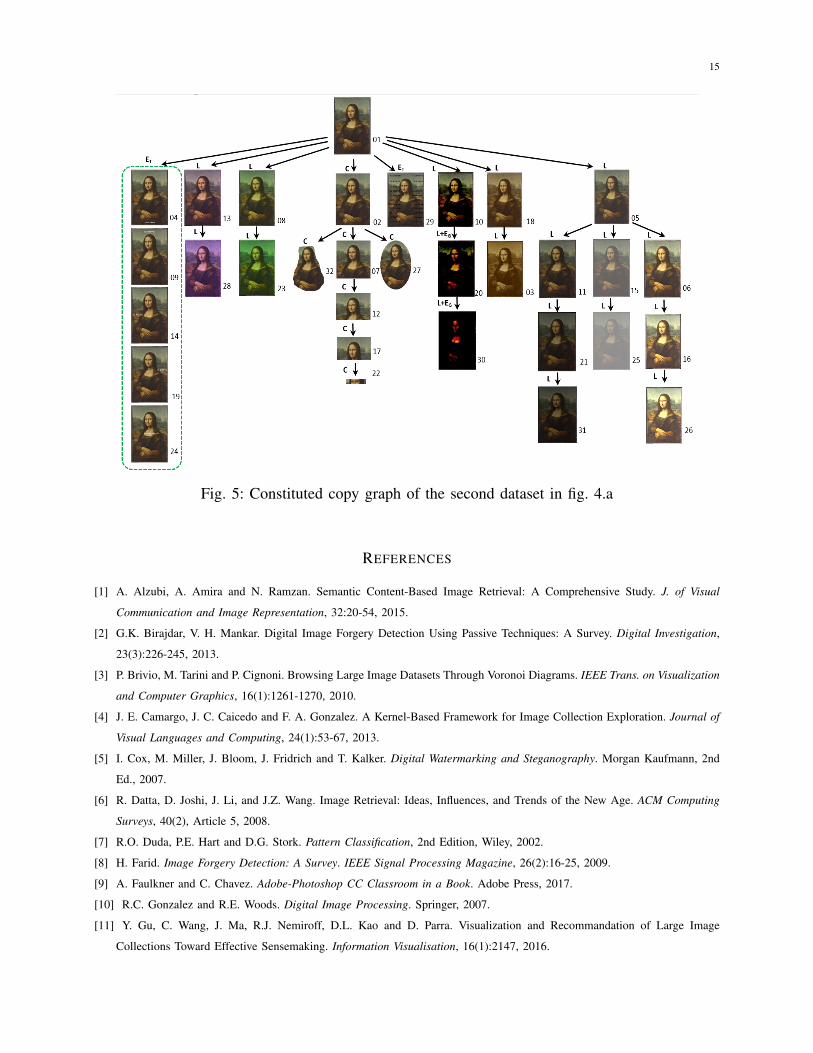
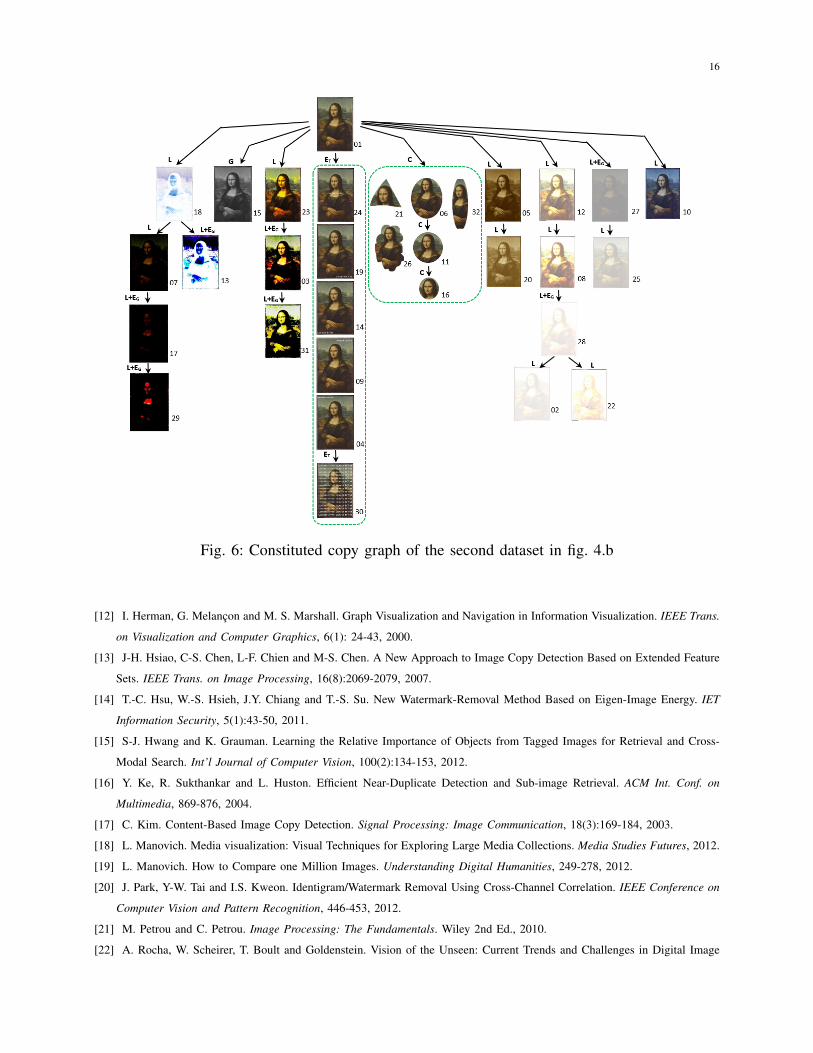
create the copies. Since the first two datasets have been generated manually, the algorithm has
achieved its best performance. The two graphs obtained for these two data sets are shown in
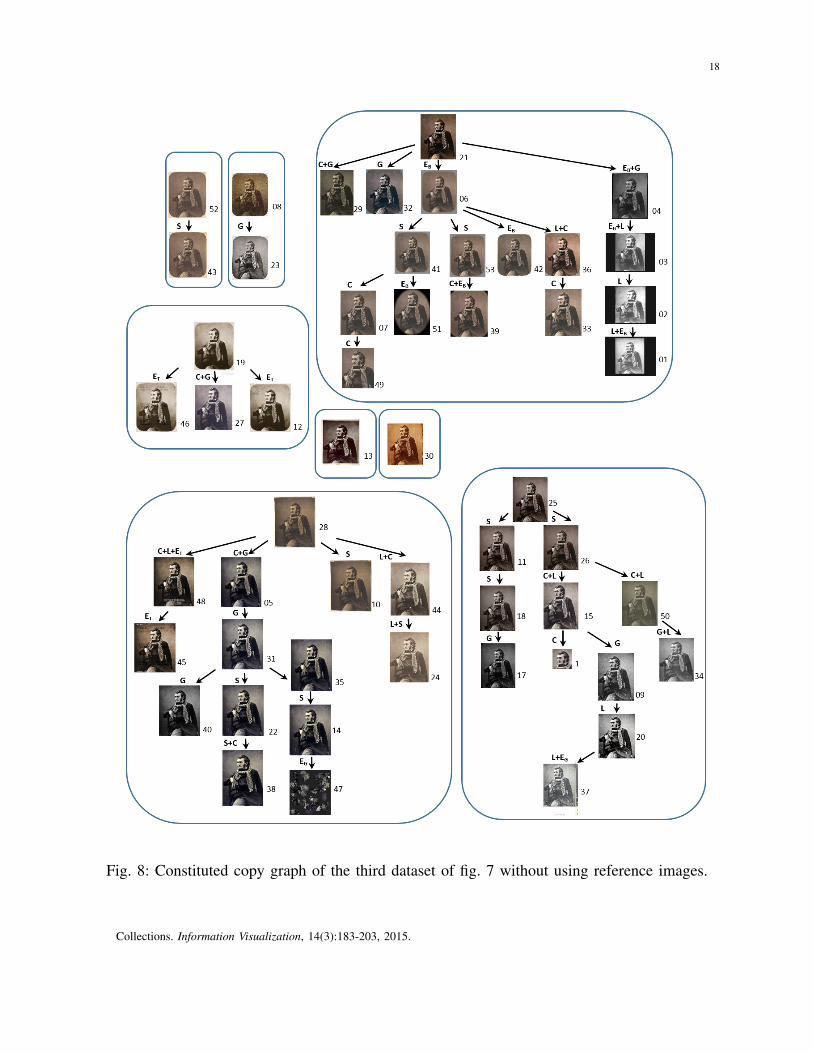
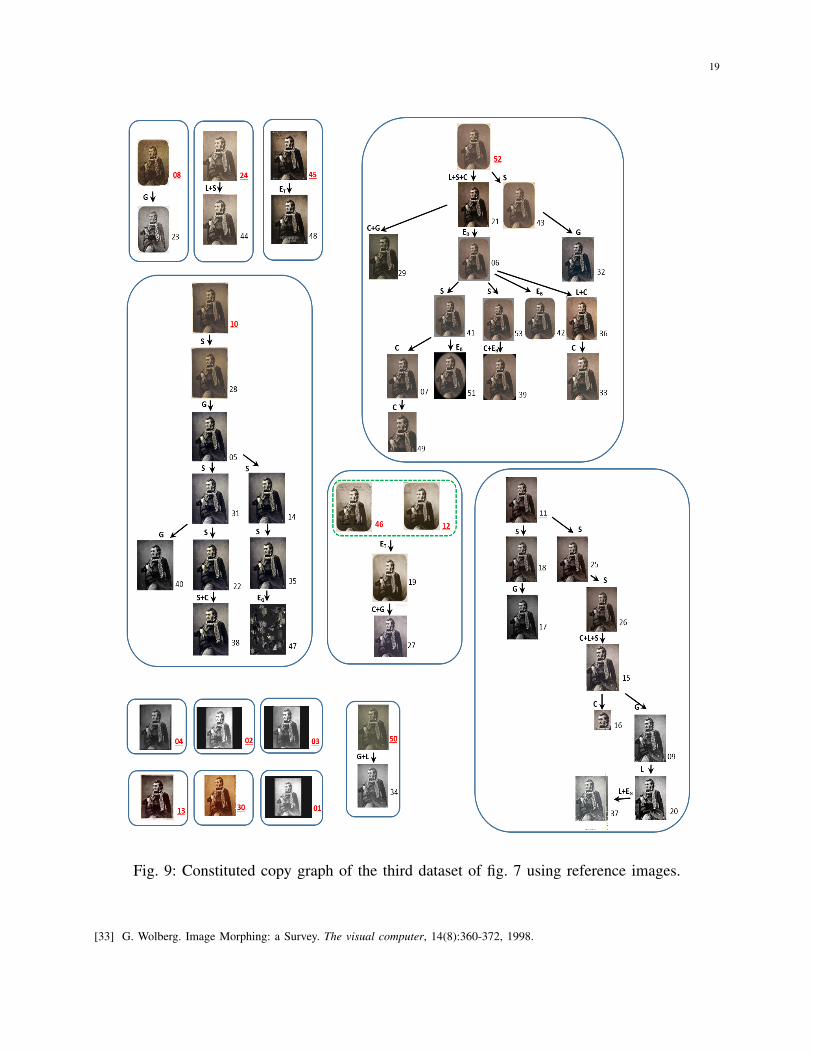
Figs. 5 and 6, respectively. As for the third dataset, we run our algorithm on two versions of
the dataset, the first one does not contain any reference image (root), while the second contains
reference images identified by an expert (see Fig. 9). We can see that even when references were
not provided, the algorithm has succeeded to identify the majority of image transformations.
By including the reference images in a second version, the accuracy of the algorithm has been
increased by almost 10%.
IV. CONCLUSIONS
We have proposed a method for building evolution graphs for image copies. The method relies
only on visual content of images where several features are used to infer types of transformations
operated on images to produce the copies. Experiments results have shown that graph constructed
by our algorithm are very close to manually-obtained ones. Future work will focus on enhancing
the algorithm by enriching the set of possible transformations and exploring the use of metadata
(e.g., URL location, file header, etc.) to improve the precision of the obtained graphs.
Future perspectives for extending this research include setting up a protocol to identify potential
roots in a non supervised context. This protocol would take into account the following parameters:
analysis of web pages URL and matching with categories of authority (museum, archive, library,
auction house, government database), text analysis on the web page that could show citation of
a source website (or hyperlink), presence of a watermark that signals a reference to a source
or copyright owner. The development of new copyright protection and copy tracking services
relying on the blockchain technologies will also provide new ways for identifying original images
and roots through their inscription in a distributed directory.
14
(a)
(b)
Fig. 4: Copies of Mona Lisa image constituting our two first datasets (a) and (b).
V. ACKNOWLEDGEMENTS
This work has been achieved thanks to the support of the Natural Sciences and Engineering
Research Council of Canada (NSERC) and the University of Quebec en Outaouais. The authors
would like to thank Rosa Iris Rodriguez Rovira and Karine Michaud Tessier for their collaboration
in dataset collection and processing.
15
Fig. 5: Constituted copy graph of the second dataset in fig. 4.a
REFERENCES
[1] A. Alzubi, A. Amira and N. Ramzan. Semantic Content-Based Image Retrieval: A Comprehensive Study. J. of Visual
Communication and Image Representation, 32:20-54, 2015.
[2] G.K. Birajdar, V. H. Mankar. Digital Image Forgery Detection Using Passive Techniques: A Survey. Digital Investigation,
23(3):226-245, 2013.
[3] P. Brivio, M. Tarini and P. Cignoni. Browsing Large Image Datasets Through Voronoi Diagrams. IEEE Trans. on Visualization
and Computer Graphics, 16(1):1261-1270, 2010.
[4] J. E. Camargo, J. C. Caicedo and F. A. Gonzalez. A Kernel-Based Framework for Image Collection Exploration. Journal of
Visual Languages and Computing, 24(1):53-67, 2013.
[5] I. Cox, M. Miller, J. Bloom, J. Fridrich and T. Kalker. Digital Watermarking and Steganography. Morgan Kaufmann, 2nd
Ed., 2007.
[6] R. Datta, D. Joshi, J. Li, and J.Z. Wang. Image Retrieval: Ideas, Influences, and Trends of the New Age. ACM Computing
Surveys, 40(2), Article 5, 2008.
[7] R.O. Duda, P.E. Hart and D.G. Stork. Pattern Classification, 2nd Edition, Wiley, 2002.
[8] H. Farid. Image Forgery Detection: A Survey. IEEE Signal Processing Magazine, 26(2):16-25, 2009.
[9] A. Faulkner and C. Chavez. Adobe-Photoshop CC Classroom in a Book. Adobe Press, 2017.
[10] R.C. Gonzalez and R.E. Woods. Digital Image Processing. Springer, 2007.
[11] Y. Gu, C. Wang, J. Ma, R.J. Nemiroff, D.L. Kao and D. Parra. Visualization and Recommandation of Large Image
Collections Toward Effective Sensemaking. Information Visualisation, 16(1):2147, 2016.
16
Fig. 6: Constituted copy graph of the second dataset in fig. 4.b
[12] I. Herman, G. Melancon and M. S. Marshall. Graph Visualization and Navigation in Information Visualization. IEEE Trans.
on Visualization and Computer Graphics, 6(1): 24-43, 2000.
[13] J-H. Hsiao, C-S. Chen, L-F. Chien and M-S. Chen. A New Approach to Image Copy Detection Based on Extended Feature
Sets. IEEE Trans. on Image Processing, 16(8):2069-2079, 2007.
[14] T.-C. Hsu, W.-S. Hsieh, J.Y. Chiang and T.-S. Su. New Watermark-Removal Method Based on Eigen-Image Energy. IET
Information Security, 5(1):43-50, 2011.
[15] S-J. Hwang and K. Grauman. Learning the Relative Importance of Objects from Tagged Images for Retrieval and Cross-
Modal Search. Int’l Journal of Computer Vision, 100(2):134-153, 2012.
[16] Y. Ke, R. Sukthankar and L. Huston. Efficient Near-Duplicate Detection and Sub-image Retrieval. ACM Int. Conf. on
Multimedia, 869-876, 2004.
[17] C. Kim. Content-Based Image Copy Detection. Signal Processing: Image Communication, 18(3):169-184, 2003.
[18] L. Manovich. Media visualization: Visual Techniques for Exploring Large Media Collections. Media Studies Futures, 2012.
[19] L. Manovich. How to Compare one Million Images. Understanding Digital Humanities, 249-278, 2012.
[20] J. Park, Y-W. Tai and I.S. Kweon. Identigram/Watermark Removal Using Cross-Channel Correlation. IEEE Conference on
Computer Vision and Pattern Recognition, 446-453, 2012.
[21] M. Petrou and C. Petrou. Image Processing: The Fundamentals. Wiley 2nd Ed., 2010.
[22] A. Rocha, W. Scheirer, T. Boult and Goldenstein. Vision of the Unseen: Current Trends and Challenges in Digital Image
17
Fig. 7: Copies of Nadar photography constituting the third dataset.
and Video Forensics. ACM Computing Surveys, 43(4):1-26, 2011.
[23] K. Schoeffmann and D. Ahlstrom. Similarity-Based Visualization for Image Browsing Revisited. IEEE Int’l Symposium on
Multimedia, 422-427, 2011.
[24] L. D. Stefano, S. Mattoccia and M. Mola. An Efficient Algorithm for Exhaustive Template Matching Based on Normalized
Cross-Correlation. Int’l Conf. on Image Analysis and Processing, 322-327, 2003.
[25] R. Szeliski. Image Alignment and Stitching: A Tutorial. Foundations and Trends in Computer Graphics and Vision,
2(1):1104, 2006.
[26] R. Szeliski. Computer Vision: Algorithms and Applications. Springer, 2011.
[27] TinEye. https://www.tineye.com/.
[28] J. Z. Wang, J. Li and G. Wiederhold. SIMPLIcity: Semantics-Sensitive Integrated Matching for Picture Libraries. IEEE
Trans. on Pattern Analysis and Machine Intelligence, 23(9):947-963, 2001.
[29] K. Wang, B. Babenko and S. Belongie. End-to-End Scene Text Recognition. IEEE Int’l Conf. on Computer Vision, 1457-
1464, 2011.
[30] Z. Wang, A. C. Bovik, H. R. Sheikh and E. P. Simoncelli. Image Quality Assessment: From Error Visibility to Structural
Similarity. IEEE Trans. on Image Processing, 13(4):600-612, 2004.
[31] C. Wang, J.P. Reese, H. Zhang, J. Tao and R. J. Nemiroff. IMap: A Stable Layout for Navigating Large Image Collections
with Embedded Search. Visualization and Data Analysis, 1-14, 2013.
[32] C. Wang, J.P. Reese, H. Zhang, J. Tao, Y. Gu, J. Ma and R.J. Nemiroff. Similarity-Based Visualization of Large Image
18
Fig. 8: Constituted copy graph of the third dataset of fig. 7 without using reference images.
Collections. Information Visualization, 14(3):183-203, 2015.
19
Fig. 9: Constituted copy graph of the third dataset of fig. 7 using reference images.
[33] G. Wolberg. Image Morphing: a Survey. The visual computer, 14(8):360-372, 1998.
20
[34] H. Xie, K. Gao, Y. Zhang, J. Li, Y. Liu and H. Ren. Effective and Efficient Image Copy Detection Based on GPU. ECCV
Workshops, Part II, LNCS 6554, 338349, 2012.
[35] L. Yan, F. Zou, R. Guo, L. Gao, K. Zhou and C. Wang. Feature Aggregating Hashing for Image Copy Detection. World
Wide Web, 19(2):217-229, 2016.
[36] J. Yang, J. Fan, D. Hubball, Y. Gao, H. Luo, W. Ribarsky and M. Ward. Semantic Image Browser: Bridging Information
Visualization with Automated Intelligent Image Analysis. IEEE Symposium on Visual Analytics Science And Technology,
191-198, 2006.
[37] X. Yang, Q. Zhu and K-T. Cheng. Near-Duplicate Detection for Images and Videos. ACM workshop on Large-scale
Multimedia Retrieval and Mining, 73-80, 2009.
[38] R. Yang, P. Kalnis and A.K.H. Tung. Similarity Evaluation on Tree-Structured Data. ACM SIGMOD Int’l Conf. on
Management of data, 754-765, 2005.
[39] K. Zhang and D. Shasha. Simple Fast Algorithms for the Editing Distance Between Trees and Related Problems. SIAM
Journal on Computing, 18:12451262, 1989.
[40] D-Q. Zhang and S-F. Chang. Detecting Image Near-Duplicate by Stochastic Attributed Relational Graph Matching with
Learning. ACM Int’l Conf. on Multimedia, 877-884, 2004.
[41] D-Q. Zhang and S-F. Chang. Detecting Image Near-Duplicate by Stochastic Attributed Relational Graph Matching with
Learning. ACM Int’l Conf. on Multimedia, 877-884, 2004.

Biography of Mohand Said Allili:
Received the M.Sc. and Ph.D. degrees in computer science from the University of Sherbrooke, Sherbrooke, QC, Canada, in 2004 and 2008, respectively. Since June 2008, he has been an Assistant Professor of computer science with the Department of Computer Science and Engineering, Université du Québec en Outaouais, Canada. His main research interests include computer vision and graphics, image processing, pattern recognition, and machine learning. Dr. Allili was a recipient of the Best Ph.D. Thesis Award in engineering and natural sciences from the University of Sherbrooke for 2008 and the Best Student Paper and Best Vision Paper awards for two of his papers at the Canadian Conference on Computer and Robot Vision 2007 and 2010, respectively.
Biography of Nathalie Casemajor:
Nathalie Casemajor is an Assistant Professor in the Urbanisation Culture Société Research Centre at INRS (Institut national de la recherche scientifique, Montreal). Her work focuses on cultural development and digital culture. She is the coordinator of the Groupe de recherche sur la mediation culturelle and coedited the book Expériences critiques de la médiation culturelle (PUL, 2017). She also conducted research projects on cultural institutions and Wikipedia, arts and public space and the circulation of news and artworks on the Web.
Biography of Aymen Talbi:
Aymen Talbi obtained is license degree in computer science in Tunisia in 2012. He then earned his Master Degree in computer science at the University du Quebec in Outaouais in 2016. He has worked under the supervision of professors Mohand Said Allili and Nathalie Casemajor.
Author Biographies Click here to download Author Biographies biography.pdf