principles and tools for instructional visualisation
TRANSCRIPT
ED 367 305
AUTHORTITLE
INZTITUTION
PUB DATENOTEAVAILABLE FROM
PUB TYPE
EDRS PRICEDESCRIPTORS
IDENTIFIERS
ABSTRACT
DOCUMENT RESUME
IR 016 579
Schoenmaker, Jan, Ed.; Stanchev, Ivan, Ed.Principles and Tools for InstructionalVisualisation.Twente Univ., Enschede (Netherlands). Faculty ofEducational Science and Technology.94
152p.Faculty of Educational Science and Technology,University of Twente, P.O. Box 217, 7500 AE Enschede,The Netherlands.Collected Works General (020) Books (010)
MF01/PC07 Plus Postage.*Computer Assisted Instruction; Computer Simulation;*Educational Research; Foreign Countries; Hypermedia;*Instructional Development; InstructionalEffectiveness; *Multimedia Instruction; *Research andDevelopment; *Visualization; Visual Learning*Multimedia Materials; Twente University ofTechnology (Netherlands)
This report reflects research and development onvisualization and the use of multimedia carried out at the Departmentof Applied Education, Division of Instrumental Science and Technologyof the University of Twente (Netherlands) and the Andersen ConsultingEducational Computing Consortium, also at the University of Twente.The report contains 11 papers organized into three main sections: (1)
"Concepts in Instructional Visualisation" includes "Visualisation andEffective Instruction" (Jef Moonen), "Principles and R&D Aspects inInstructional Visualisation" (Ivan Stanchev), "Human Factors andMulti Media Design" (Lex Bergers), "Conceptual Metaphors for theVisualisation ir Interactive Learning" (Piet Kommers), and "Functionsand Design of Video Components in Multi-Media Applications: A Review"(Plon W. Verhagen); (2) "Design and Development of Multi MediaApplications" includes "Designing Multimedia Applications" (Maud vanden Meiracker), "Multimedia Development Tools" (Jan Schoenmaker andErik Nienhuis), "Putting Multimedia into Practice" (Mark Vegting),and "Adaptable Educational Computer Simulations" (Willem Jaap Zwart,Albert F. J. Rhemrev, and Andre M. Berloth); and (3) "Multi MediaTechnology" includes "A Look at Multimedia" (Jan Evers) and"QuickTime" (Jacob Sikken). Conclusions are drawn by Ivan Stanchevand Jan Schoenmaker. Most of the papers contain references. (TMK)
***********************************************************************
Reproductions supplied by EDRS are the best that can be madefrom the original document. *
***********************************************************************
9
Principles and tools forinstructional visualisation
A
Jan SchoenmakerIvan Stanchev (eds)
U S DEPARTMENT Of EDUCATIONOrke of Edvconoc41RoSetrCh and Improrenwn1
EDUCATIONAL RESOURCES INFORMATIONCENTER (ERIC)
Cl This dOCument nas boon ropfoclucod 1111received Iron+ fne (Arson or oroonizaboo
flQef
0 Menor changes have been made 10 ...breve'ergot:100,On qualety
Poffits of view Or OpeneOns Slated in this CIOCIJmen! do not nett/nerdy representOERI posnan Or pOleCy
BEST COPY AVAILABLE
faculty ofEDUCATIONAL SCIENCEAND TECHNOLOGYAndersen Consulting ECCThe Netherlands
"PERMISSION TO REPRODUCE THISMATERIAL HAS BEEN GRANTED BY
J. Nelissen
TO THE EDUCATIONAL RESOURCESINFORMATION CENTER (ERIC)."
Univers4ofTwente
ANDERSENCONSULT!
ARM( It %%DI HSI \ &C()
T
Principles and tools for instructional visualisation
3
Colophon
Editors: Jan SchoenrnakerIvan Stanchev
Design: Hanna SnijderPrinting: Reproduction department
University of Twente
A publication by:The Faculty of Educational Science and TechnologyUniversity of TwenteP.0 Box 2177500 AE EnschedeThe Nethe,lands
C 1994 Faculty of Educational Science and Technology, Andersen Consulting - ECC
4
Content
Editorial 1
Concepts in instructional visualisation 3
Visualisation and effective instruction - Jef Moonen 5
Principles and R&D aspects in instructional visualisation - 11Ivan Stanchev
Human factors and multi media design - Lex Bergers 31
Conceptual metaphors for the visualisation in 41interactive learning - Piet Kommers
Functions and design of video components in multi-media 61applications: a review - Plon Verhagen
Design and development of multi media applications 89
Designing multimedia applications - 91Maud van den Meiracker
Multimedia development tools - Jan Schoenmaker, 101Erik Nienhuis
Putting multimedia into practica - Mark Vegting 113
Adaptable educational computer simulations - 123Willem Jaap Zwart, Albert Rhemrev, Andre Berloth
Multi media technology 135
A look at multimedia - Jan Evers 137
Quick Time - Jacob Sikken 143
--Conclusions 151
Appendix - List of authors and addresses 155
Editorial
This report reflects research and development of the Department of Applied Education,Division of Instrumental Science and Technology of the University of Twente in theNetherlands and Andersen Consulting - ECC, also located at the campus of the University ofTwente, and part of the world wide consultancy firm Andersen Consulting.Both groups carry out work on instructional technology and are exploring concepts ofvisualisation and the use of multi media.This report addresses three aspects of instructional visualisation:
- concepts in instructional visualisation- design and development of multi media applications- multi media technology
Ivan Stanchev, Associate Professor ,Faculty of Educational Science and Technology,University of Twente.Jan Schoenrnaker, Associate Partner, Andersen Consulting - ECC.
Enschede, January 1994
1 6

Concepts in instructional visualisation
110
Visualisation and Effective Instruction
Jef Moonen
Abstract
In this paper the potential relationship between visualisation and effective instruction isbeing reviewed. Reference is made to the AIME concept introduced by Salomon. It isconcluded that research in this area should taken into account aspects of costs, cost-effectiveness and motivation of the learner.
Introduction
Improving the quality of learning and instruction is a continuing objective of educationand training. 'Quality' however, can be described in many respects. One perspective is tofocus on the effectiveness of the learning material to support the instruction.
As the traditional classroom and training situation is being expanded with technologicalfeatures, such as video, computer and multimedia there is considerable interest nowadaysrelative to the possibilities of graphical user inter`aces of electronic learning material inrelation to visual communication. Presenting, transmitting and processing information invisual, non-textual form is what is meant when we speak of visual communication. Non-textual symbols, pictures, graphs, images and so on that convey information are calledvisuals.
The importance of visualisation in electronic learning material is reflected in manyauthoring systems as they offer more and more-varied possibilities to include visuals intothe courseware they produce. However, it remains difficult to derive guidelines withrespect to the integration of visual communication in courseware design. Improvement ofcourseware design methodology is therefore necessary; in particular, by investigating therelationships between type of courseware and the functions of visualisation.
In that context there is a need for further development of theoretical principles of thevisual communication, especially with respect to the following questions:
In what circumstances does the mind prefer the more complex, dynamic, lifelike imageto the seemingly simpler verbal one?How do non-textual symbols, graphics, still pictures and moving pictures contribute tovisual communication?If visual literacy is the ability to understand, think, and create non-verbally, how shouldvisual literacy be learned and trained?In what way will visual learning be of value in determining the (cost)-effectiveness ofthe learning process?
5
A special aspect is the inclusion of visual techniques in tools to handle non-verbalcommunication, and in tools supporting the courseware design process. The latter is alogical consequence of what is going on in computer science itself, whereby two newstyles of human-computer interaction have become popular: 'programming through visualenvironments in which graphical elements play prominent roles alonside text, and iconicenvironments, in which users interact with the machine primarily by defining, pointing at,juxtaposing, overlapping and otherwise manipulating postage-stamp size images commonlyreferred to as icons' (Glinert, 1990, P. 1).
Answers to the above about visual communication should help to better identify theadvantages and disadvantages for visualisation of information in courseware andcourseware design, leading to a new set of questions:
What kind of tools improve the process of visual commuidcation in teaching andtraining?What kind of tools improve the process of courseware design?What are the aspects and the factors that determine the break-even-point of usingvisualisation in terms of cost-effectiveness of courseware design, development andimplementation?How does visualisation improve the cultural portability of electronic learning material?
In addition, the evolution of human-computer interface technology will significantlychange in the next decade, given the growing international research interest in virtualreality (Earnshaw, Gigante, Jones, 1993; Kalawsky, 1993). As with any new technology,there are pedagogical questions to be addressed as methods of instruction are extendedfrom being dominantly text-based to multi-sensory based. Additional questions such as thefollowing are also important:
How is learning in a "virtual reality" different from that of a traditional educationalenvironment?How are learning styles enhanced or changed by virtual reality?What kinds of research will be needed to assist instructional designers in developingeffective virtual-reality learning environments?
Results from Research
Because of the evolving technology, visual messages in different forms can now be mucheasier presented than in the past. However, there are no consistent research results tosupport the hypothesis that by using visuals the effectiveness of what is being delivered isincreased.
Print material and visualsIn relation to print material Fleming and Levie (1993) indicate for instance that 'althoughthe results of research on the effects of using graphics are neither consistent norcompelling, most authorities and professionals are convinced that in many circumstancesgraphics help readers (especially poor readers) to use and understand instructional text' (p.41), and 'although research has failed to demonstrate conclusively that using pictures incourseware (in this context text-based material) is related to motivation, their instincts tellmany designers that good pictures really do motivate learners' (p. 46). In the context of
6
9
message oesistr, variables and with respect to the perception of pictures, Fleming and Leviepresent eight design guidelines. Their first and main guideline is that 'pictures are usuallymore memorable than words, and are thus useful when information has to be remembered'(p. 86). However, their second guideline is that 'pictures play many roles in instruction. Itis therefore necessary to know precisely what a picture's function is intended to be beforeit is designed' (p. 86).
Graphic design principels and interactive systemsIn their discussion of the design of effective visual presentation Baecker and Buxton(198'7) report that the application of graphic design principles to the medium of computerdisplays and interactive systems is not a trivial process. They suggest that 'given thedifficulty of the problem, good progress will probably be achieved through the multi-disciplinary collaboration of the technologist "telling us what is possible", the psychologist"telling us what not to do", and the designer "suggesting what to do" (p. 300-301)'.
Cognitive psychology and user-interface designGardiner & Christie (1987) investigate relevant areas of cognitive psychology in relationto user-interface design, and summarize their findings in 162 design guidelines. Theydiscuss the relationship of the use of visual material and its impact on memory andconclude, based upon the dual-coding theory of Paivio, that 'our ability to remember theappearance of novel, unorganized visual patterns over the short-term is extremely limited.On the other hand, our ability to remember the identity of a concrete item is better when itis presented as a picture than as a printed word' (p. 128). And they further conclude that'ideally interfaces should be designed to be flexible enough to allow the user to vary theamount of information they have to deal with at any time, and, conversely, should notallow users to "get away" with inadequate amounts of processing where the consequencesof poor recall will be dire' (p. 157). More generally Gardner and Christie summarizeresearch findings into two principles:
(a) 'The probability of recalling an item increases as a direct function of the depthof processing at which the item was encoded when punt into memory. Depth ofprocessing increases with the requirement to consider the meaning of an item andits relation to other items';(b) 'The probability of recalling an item increases as a direct function of theelaborateness of processing associated with its encoding into memory.Elaborateness of processing increases with the richness of the context informationpresent at the time of the storage' (p. 159).
These principles lead to the following design guideline: 'Items which must be recalledfrom memory some time after being removed from the screen should be surrounded withsupporting information to which they are related, and should be immersed in a visuallyrich environment' (Design Guideline 125, p. 268).
Guidelines for the design of visuals for informationPetterson (1989) presents practical guidelines for the design of visuals for information. Hestresses that image variables should be considered in relation to content, graphic execution,context and format. In the design and production of visuals for instruction, pictures mustobviously contain the information they are intented to convey and must be relevant to thesituation. However, Petterson reminds us of the fact that understanding a message in avisual are different in various cultures as well as in different socia-economic groups.
7
1 0
1=w
Lanzing (1993) has also done research into this area.
Relationship between verbal and visual messagesIn addition, effective human-machine interaction requires an understanding of therelationships between verbal and visual messages, between characteristics of the learningmaterial and the instructional process, the instructional approach and learning styles.Verleur (1993) presents an interesting summary of research results in this context.Generally speaking, research results indicate that when audio and visuals are presentedsimultaneously, the visually presented information will be dominant (Jaspers, 1991).Another conclusion is that presentations which are focussing on two senses or using twochannels including an iconic presentation and a linguistic approach (text or audio) aresuperior to a presentation using only one channel. The most powerful result of usingmulti-channel presentation forms are their positive impact on the motivation of the learner.
Empirical researchAlthough many guidelines appear in the literature about how to incorporate visuals intolearning materials, most of such guidelines are based upon theoretically driven research.Such research tends to seek out simple paradigms which appear to focus succesfully on asingle psychological process. It should be underlined that empirical research is necessary,as factors such as individual skills and knowledge and the use of multi-sensory channeiscan make significant differences to performance and motivation. In other words, generalconclusions about the impact of visualisation on the effectiveness of learning materialremain to be supported.In particular a main focus for research are the circumstances under which visualisationrealises a positive contribution to the quality of the instruction/learning process.
AIME: The Amount of Invested Mental Effort
An interesting approach with respect to the impact of television on learning was developedby Salomon (1984).When the structure of a communication is more or less congruent with one's pastexperience, that information is processed rather mindlessly. When on the contrary',nonautomatic and effortful mental elaborations are necessary to capture the information,these lead to both depth and mindfulness. A measure to capture such efforts is called bySalomon "the amount of invested mental effort" (AIME).
Two other concepts affect the AIME executed by a person. The first is the learners'perceived task characteristics (PDC) of the task. The more demanding a PDC is, the moreAIME will be expended. The second is the learners' perceived self-efficacy (PSE).According to Salomon: 'The more efficacious learners perceived themselves to be, themore they are likely to invest sustained effort in a task and persist in doing so' (p. 649) .Assuming that thorough and mindful coverage of information are characteristics of betterquality of the instruction/learning process, Salomon argues that such characteristics will beobtained when the instructional process stimulates an increase of AIME.
Tile main issue with respect to visualisation therefore is not to investigate technicalpossibilities of new media in order to 'maximise' the portion of visualisation within an
8
1 1
instructional program. The main issue is to match the visualisation possibilities of newmedia with the characteristics of the learners, in order to maximize their amount ofinvested mental effort.
Do Media Influence Learning?
As we talk about visualisation, it is not the medium but its presentation formats that are ofimportance.In order to better distinguish different aspects of media, Kozma (1991) defines the mediain terms of their technology, their symbol system, and their processing capabilities.Most common is to talk about media in terms of their technology: the mechanical andelectronic aspects that determine their functioning and physical features. There are TVs,VCRs, CD-ROM players, slide projectors, etc.The most interesting features of a medium however are its possibilities to present a rangeof symbols (for instance text, audio, visual), and its processing capabilities (for instanceinteractivity, search capabilities).Questioning if media through visualisation will contribute to maximizing AIME clearlyrelates to the range of symbol systems the medium can present, and to its processingcapabilities.
In Paragraph 2 it was emphasided that empirical research should be done in order todetermine in practice the impact of visualisation on the effectiveness of theteaching/learning process. Given the different characteristics of media, this emphasisshould not concentrate on the technical possibilities of new and future media, or on thecomparison of one technical facility versus another. On the contrary, research should beplanned in relation to new symbol systems and/ or new processing capabilities representedin new and future media. Unless a new medium creates such a new symbol system or anew processing capability, a new medium has to be considered as belonging to a specificclass of media capable of a certain kind of presentation and information transfer.
In that respect, for instance, a product presented through CD-I is not essentially differentfrom a product presented through a combination of a computer program controlling ainteractive videodisc. In terms of instructional effectiveness there seems to be no reasonwhy there should be a difference between these two media. However, there could be asignificant different in terms of their cost-effectiveness.
Costs, Cost-Effectiveness and Motivation
Different media are not alike in terms of costs involved: costs with respect toprocurement, and costs with respect to the development of learning materials. Neither arethey alike in terms of their potential to motivate the learner, or put it in a broader context,to stimulate the AIME of the learner.
When the expected instructional effect for two media arc more or less comparable, thenthe cheapest medium is the most cost-effective.
9
Given the wealth of traditional and electronic media that are now available, and given thefact that many of these media have comparable features with respect to the symbolsystems they can represent, and comparable power in terms of their processingcapabilitits, the question of the cost-effectiveness of a medium is becoming most relevant.Analysis of data in the context of cost-effectiveness very often leadF to the understandingthat potential effects such as the instructional impact of a raise in motivation or change inattitude of the learners are not (well) represented in the measurement o the performance,while enlarged motivation of the learners seems to be the most apparent effect.
Conclusion
Research with respect to visualisation and media should be concentrated on investigaungrelationships between symbol systemsin particular visualisationand processing features,learners characteristics and learning styles. In addition researchin6 the instructional valueof visualisation, both aspects--cost-effectiveness and motivation--should be taken intoaccount.
References
Baecker, R.M., & Buxton, W.A.S. (1987). Readings in human-computer interaction.San Mateo, CA: Morgan Kaufmann Publishers.
Earnshaw, R.A., Gigante, M.A., & Jones H. (1993'. Virtual reality systems.London: Academic Press.
Fleming, M., & Levie, W.H. (1993). Instructional message design: Principle.. fromthe behavioral and cognitive sciences. Englewood Cliff, NJ: EducationalTechnology Publications.
Gardiner, M.M., & Christie, B. (1987). Applying cognitive psychology to user-interfacedesign. Chichester: John Wiley * sons.
Glinert, E. (ed.) (1990). Visual programming environments: Applications and issues.Los Alamitos, CA: IEEE Computer Society Press.
Jaspers, F. (1991). The relationship sound-image. International Journal of InstructionalMedia, 18 (2), pp. 161-174.
Kalawsky, R.S. (1993). The science of virtual reality and virtual environments.Wokingham, England: Addison-Wesley.
Kozma, R.B. (1991). Learning with media. Review of Educational Research, 61 (2),179-211.
Lanzing, J.W.A. (1993). Visual aspects of the cultural portability of educational software:a literature analysis. Unpublished report. Enschede, The Netherlands: University ofTwente, Faculty of Educational Science and Technology.
Petterson, R. (1989). Visuals for information: Research and practice.Englewood Cliffs, NJ: Educational Technology Publications.
Salomon, G. (1984). Television is 'easy' and print is 'tough': the differential investmentof mental effort in learning as a function of perceptions and attributions. Journal ofEducational Psychology, 76 (4), 647-658.
Verleur, R. (1993). The application of audiovisual material as a complement to printedinstruction. Unpublished report. Enschede: University of Twente, Faculty ofEducational Science and Technology.
10
1 3
Principles and R&D Aspects in Instructional Visualisation
Ivan Stanchev
Communication - a model of the process
How can we be clear and comprehensive in summarising the communication process in asingle model ? We can't. So many complexities apply to human communication that wemust settle for something less than completeness and clarity. But we can summarise someof the most significant aspects of the process, and we can sharpen our awareness of whatgoes on when we attempt to send and receive messages.Contemporary scholars have offered dozens of definitions of communication, and it wouldbe arrogant and unprofessional to come up with "a definition to end all definitions";however, we offer this working definition of effective communication:
Effective communication occurs when a sender transmits a message and a receiverresponds to the message in a manner which satisfies the sender.
Note a few implication of this definition:It focuses on applied communication. This brief definition deals with getting results
through communicating effectively in social organisations; it does not deal with theories,experiments or philosophies which go beyond that goal.
It accepts the satisfyinR concept. In social organisations, as in almost all humansituations, we often accept what is less than perfect. As long as a situation becomesproductive or meets our basic goals, we usually settle for it. 'Teachers and instructors tendto settle for a productive understanding, rather than pressing for clarification of everyhistorical, linguistic, philosophical, or technical aspect of a communication. The time andenergy involved in reaching a "perfect" understanding (assuming for the moment that it ispossible) would be too costly.
It assumes a feedback loop. In order to realise satisfaction, parties must get some sort ofconfirming response. This can be verbal or non verbal, written or oral. It can occurthrough observation, evaluation systems, dialogue, and so on, but somehow the sendermust experience verification of an adequate understanding of the intent of the message.Of course, in the process of giving feedback, the receiver becomes a sender and theoriginal sender becomes a receiver. In addition, the original sender may modify amessage in the light of feedback. But at each stage, our definition assumes sufficientresponse to confirm adequate understanding.
The key word in the definition is the term "message". A "message" is a pattern of signs(words and pictures) produced for the purpose of modifying the cognitive, affective, orpsycho-motor behaviour of one or more persons. The term does not imply any particularmedium or vehicle of communication.
1 l
1 4
When we pay attention to a stimulus, we tend to give it an interpretation, whether thestimulus is verbal or non verbal. We base our interpretation on such factors as ourgeneral backgrounds, our loyalties, our vocabularies, our education, our expectations. ourpersonal interests, our values and our prejudices. Because of such factors, distortionsoften occur as messages filter through channels. But by being aware of such factors, wecan work toward encoding and decoding more effectively, and toward reducing "noise" inthe communication process.
Visualisation and perception
In a letter to Jacques Hadamard, a friend of him, Albert Einstein speakine about himselfwrote that words in their written or oral form did not play a significant role in his way ofthinking and that to him the basic elements of thought were definite signs andsymbols(Einstein, 1953).Mastering of techniques for information visualisation and the ability to present this
information as an explicit and simple drawing have great importance in many spheres ofhuman activity research, design and construction activities, books and printed matterlayout, etc. Visualisation of information takes a particularly important place in educationalsystems since psychologists have proved that visual perceptions play a most prominentpart in information memorising and reproduction and that memory is the result of thereceived perceptions which according to some theorists czo, apportioned in thefollowing way:
- 75 % visual perceptions;15 % aural impressions;
- 6 % tactile perceptions;- 3 % sense of smell, and
3 % taste.All that is of great importance when interactive courseware is being thought out anddesigned since the computer screen is the main source of informatioa in the user'scommunication with a program. If the program's creators have not made it visual enoughit could be difficult for the trainee to interact with it without using additional informationfrom other sources (for example, from the teacher or a guide for work with the program).In contrast, the design of visual objects demonstrating the program's potential and contentcan improve the ease of comprehension and sound memorisation of the informationcontained in the program.The process of artistic designing (visual design) is very close to the theory and practice offine arts - it is subjected to the same principlec with regard to the means of thecomposition (symmetry and asymmetry, metrics and rhythm, contrast and nuances,proportions, scale, colour, texture, etc.). The observation of these principles increases thestrength of the impact of the information apprehended - a fact well known and used in thefields of ergonomy, aesthetics and design. On the basis of these principles a number ofimportant and fundamental principles in the visualisation of information can beformulated:
12
15
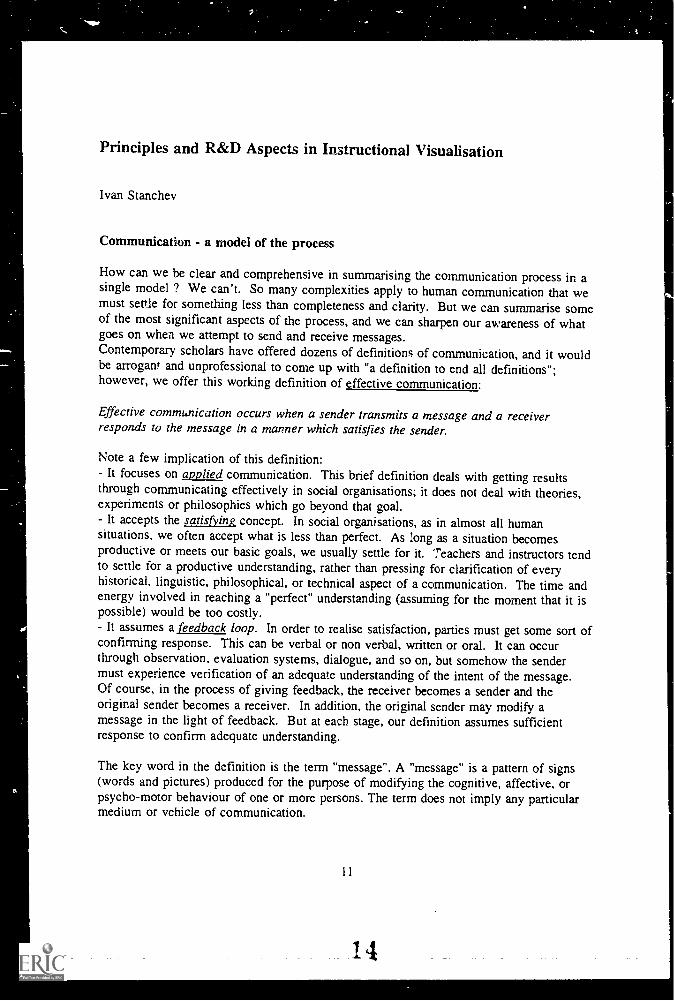
The principle of conciseness. The graphic means for information presentationshould contain only such elements which are indispensable for conveying essentialinformation to the viewer and this information must be comprehensible for it representsthe visual accent of the basic composition elements. It is useless to try to draw attentionto the most important characteristic features of a situation if they are surrounded bysuperfluous visual distracters having no bearing to them and hindering the apprehension ofthe essential (see Fig. 1).
CORNEA
LENS
IRIS
Figure 1
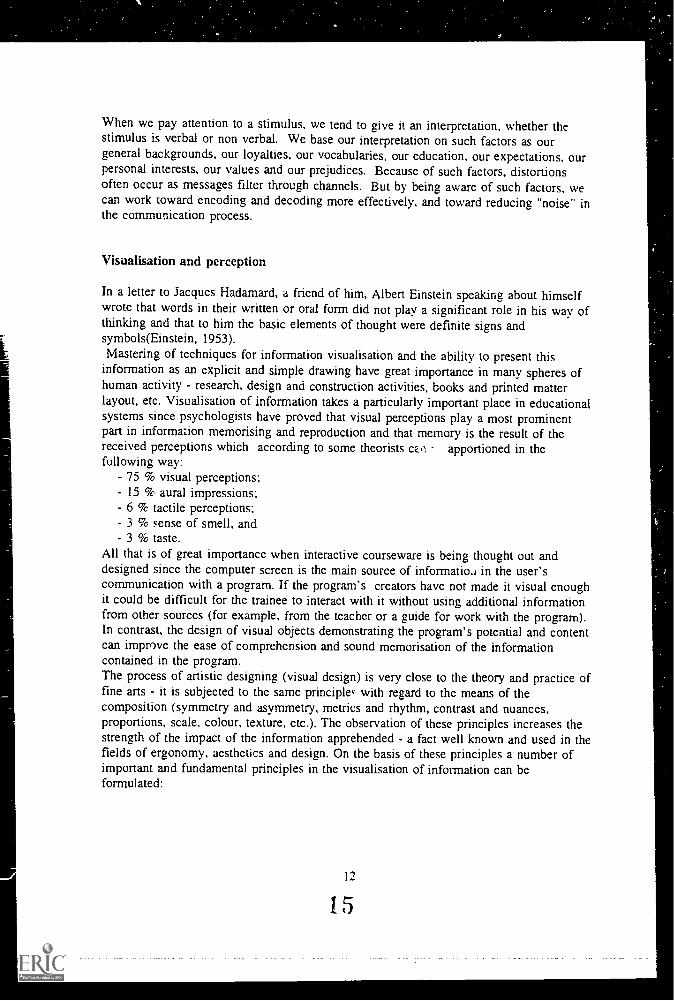
The principle of 2eneralisation and unification. The basic forms for graphicpresentation of information must not be needlessly broken to pieces or include elementsdesignating superfluous details from the standpoint of the presented information. This formmust be rationally generalised and the symbols denoting the same objects and phenomenamust be unified, i.e., they must have a unified graphic solution (see Fig. 2).
Figure 2
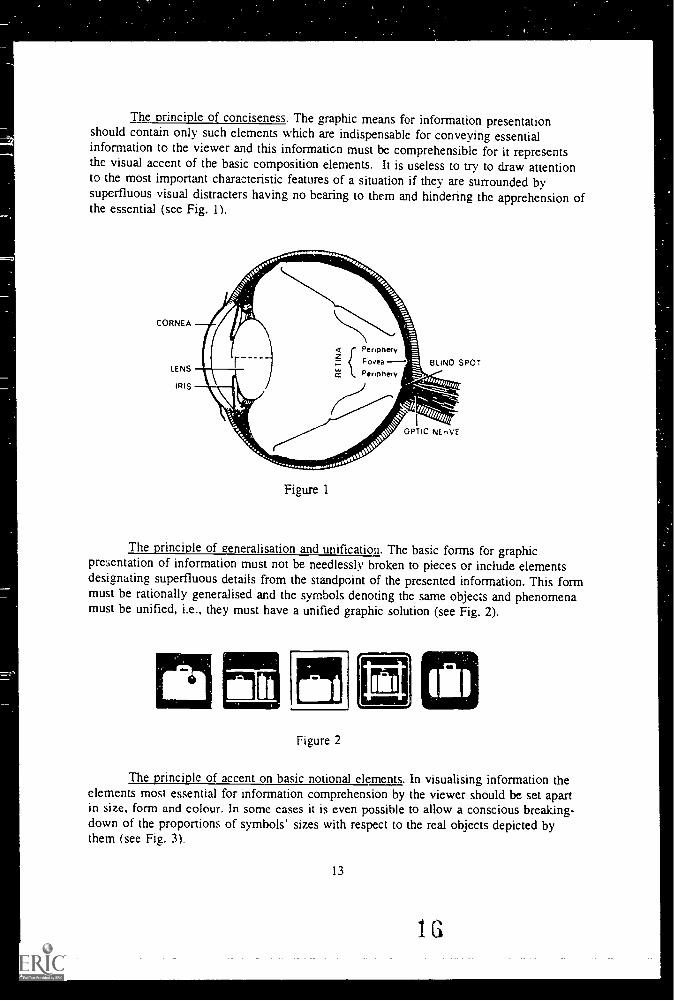
The principle of accent on basic notional elements. In visualising information theelements most essential for information comprehension by the viewer should be set apartin size, form and colour. In some cases it is even possible to allow a conscious breaking-down of the proportions of symbols' sizes with respect to the real objects depicted bythem (see Fig. 3).
13
1G
Offer your customers the easiest possibleway to place an order . .
A 1-800 TOLL-FREE TELEPHONENUMBER NATIONWIDE!!
... WILL DO THE REST!F.4.F. ,so
Network Express serves you the direct response adve,tise Weore committed to providing our clients with the best quo'it sen:ice inPrOauct marketing, lead generation and market researi t!0..0.1motorere rnmsI and madv to receive calls ler 3 a-- .1. ,T4 nr goeliR.14.4 spor..4.1 o4 sor441.......t..
Call 1-800441-0900 or 1-800-334-3030 in California andstart using and benefitting f rom OUT TOLL FREE service NOW'
NETWORK EXPRESS093 SOL TH sAVIA F F ALF SUTTI C
IS,A CALIFORNM 9204314144414MM1410113 .144130
Figure 3
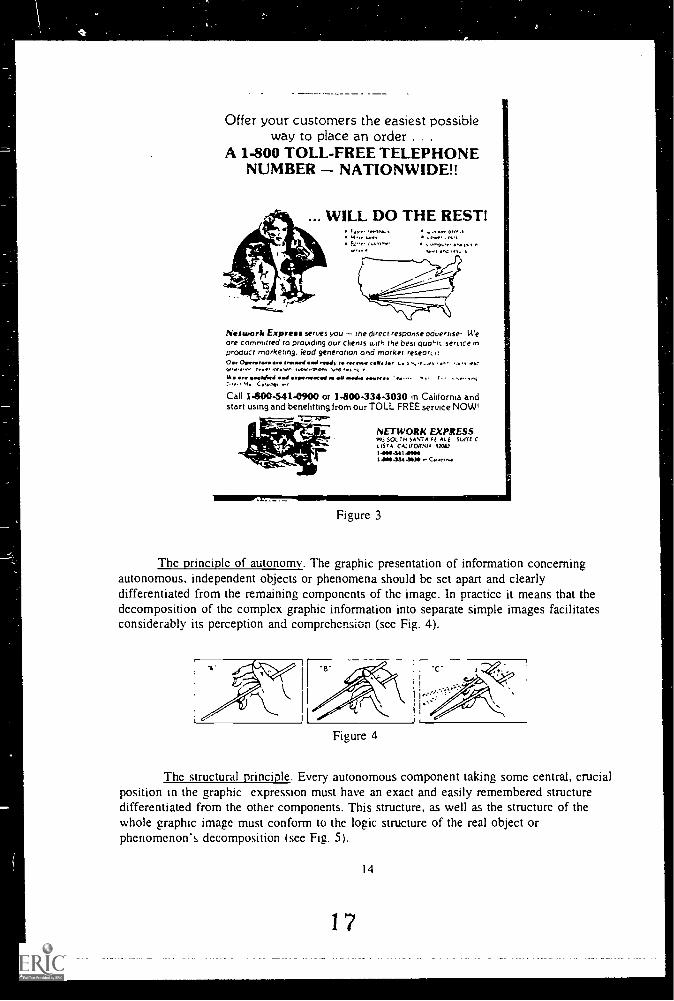
The principle of autonomy. The graphic presentation of information concerningautonomous, independent objects or phenomena should be set apart and clearlydifferentiated from the remaining components of the image. In practice it means that thedecomposition of the complex graphic information into separate simple images facilitatesconsiderably its perception and comprehension (see Fig. 4).
Figure 4
The structural principle. Every autonomous component taking some central, crucialposition in the graphic expression must have an exact and easily remembered structuredifferentiated from the other components. This structure, as well as the structure of thewhole graphic image must conform to the logic structure of the real object orphenomenon's decomposition (see Fig. 5).
1 7
14
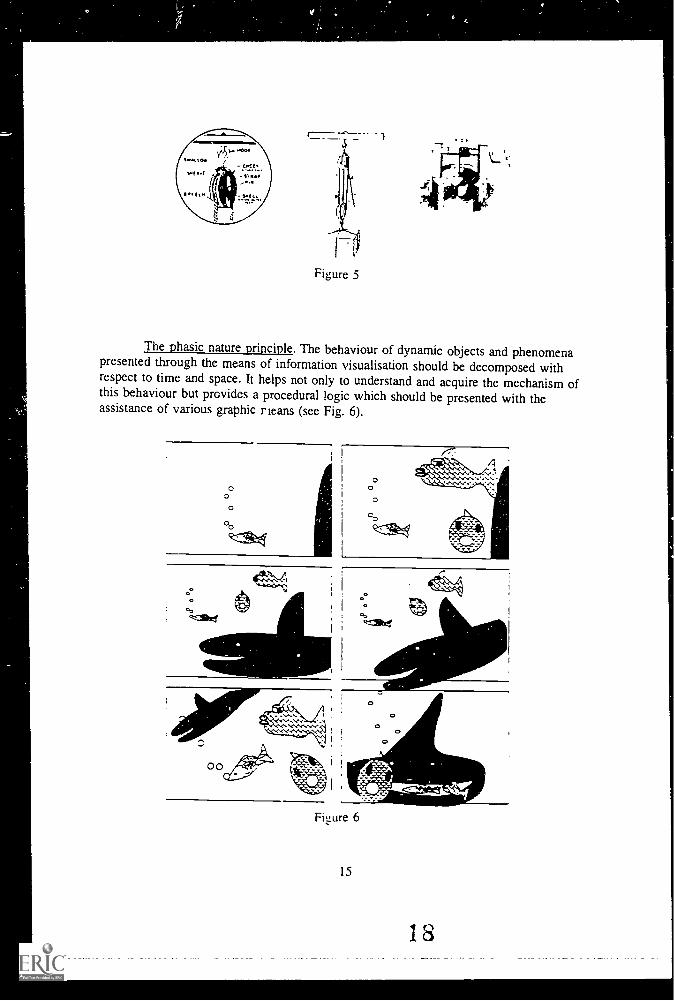
Figure 5
The phasic nature principle. The behaviour of dynamic objects and phenomenapresented through the means of information visualisation should be decomposed withrespect to time and space. It helps not only to understand and acquire the mechanism ofthis behaviour but provides a procedural logic which should be presented with theassistance of various graphic means (see Fig. 6).
°o
/I
Figure 6
15
18
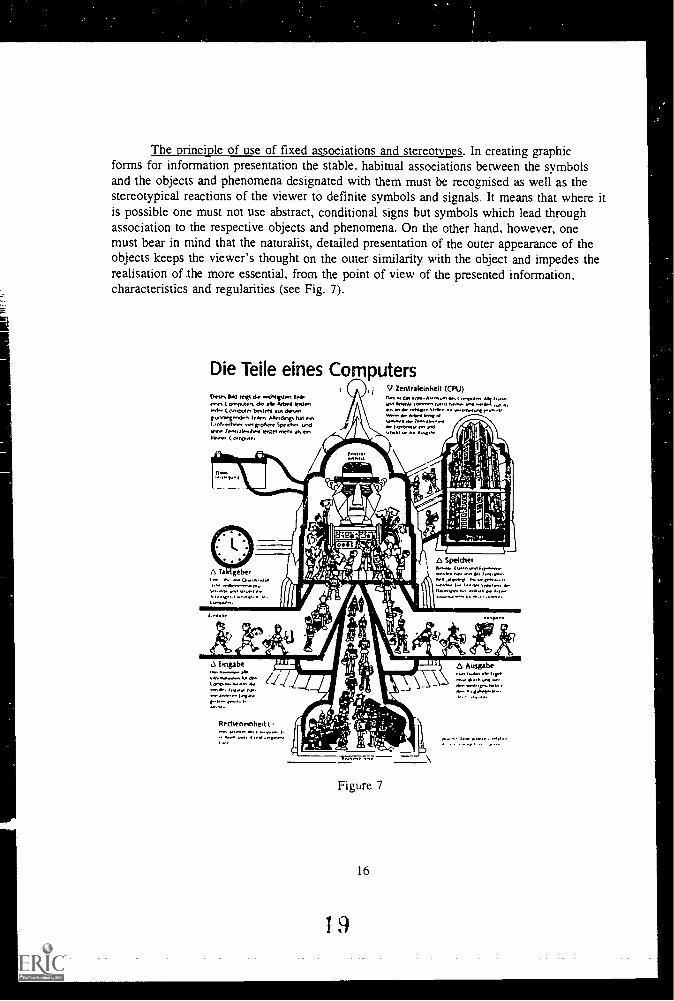
The principle of use of fixed associations and stereotypes. In creating graphicforms for information presentation the stable, habitual associations between the symbolsand the objects and phenomena designated with them must be recognised as well as thestereotypical reactions of the viewer to definite symbols and signals. It means that where itis possible one must not use abstract, conditional signs but symbols which lead throughassociation to the respective objects and phenomena. On the other hand, however, onemust bear in mind that the naturalist, detailed presentation of the outer appearance of theobjects keeps the viewer's thought on the outer similarity with the object and impedes therealisation of The more essential, from the point of view of the presented information,characteristics and regularities (see Fig. 7).
Die Teile eines ComputersChnes 114d mei d. wcbtrIrn TrAre, C onemlen, de de .ebt41,rd ( Onnner, betteta desenrvInere.dpn T. Merthngs hal enGnek.echnn nei groAne
hynnenhe 'eye rne4.1 ahlanne. onvnIn
de, nmpar,AA.
111. nft/
...a.romot
ten,
A Speicher14
Pee
6 Ausgabe
Figure 7
How can abstract principles be applied to concrete instructional problems? One means offacilitating this transfer is to state both propositions (both the principle and the problem) inparallel forms. This form can be generalised as: "What conditions lead to what results?".In (Fleming and Levie, 1978, pp.15-18) is given a excellent example for applying thisapproach using the basic principles of perception for some general guidelines for theinstructional designer.
Basics of visual communication
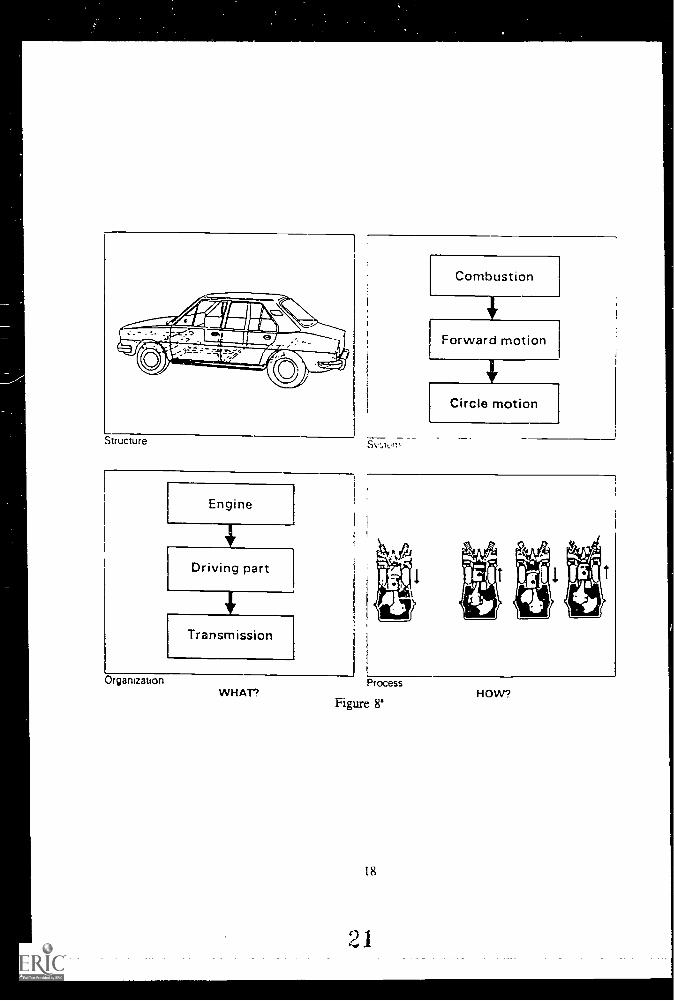
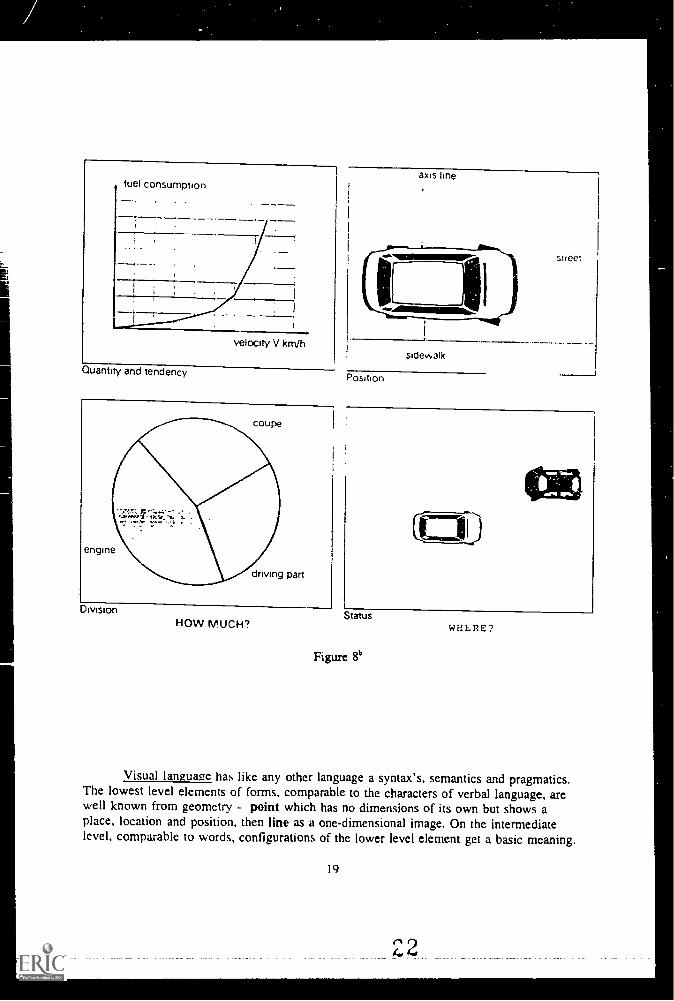
Specialists in the field of visual communication maintain that a drawing is worththousands of words and this is really so provided the drawing is good. The differencebetween words and a drawing is that with the assistance of words we narrate while adrawing shows. However, in order to achieve the desired result the possibilities of thegraphic language must be mastered. If the meaning of a text is revealed through words,the illustration "speaks" in the language of forms. The communicative possibilities of thegraphic language can be understood if we analyse the goals of visual communication, i.e.,if we try to answer the questions What? How? How much? and Where? with the help ofgraphic expression (Fig. 8):
- What does the object represent? What is it? - it is a question which refers aboveall to the outer appearance of the object, its physical structure or the logical relation of itsparts to the whole. Most often questions refer to the visual perception of the object'sproperties. but they can also refer to such properties which are invisible under ordinarycircumstances and also to definite abstract notions connected with the organisation of theobject itself.
- How does one or another object operate? This is a question which concerns itsphysical movement, the logic's of functioning of its separate parts within the frames of thewhole as well as the process of functioning of the whole object as a sequence ofinterrelated conditions. In these cases the demonstration of actions in static imagesrequires the use of symbolic forms displaying movement. It applies with equal force bothto real physical objects and phenomena and to ideal models presenting an abstraction ofreality.
- How much refers to the quantitative characteristics of the object, i.e. to thephysical dimensions of the object, the quantitative relationships between its componentsand elements as well as to their correlation to the whole, the tendency of alteration of thephysical characteristics, etc. The quantitative analysis of the object and its image involvecompulsory a process of abstraction.
- Where is a given object located or a given phenomenon take place? This is aquestion which refers to the place of the object, its location in space, its position withrespect to other objects. Very often the differ( ces between these three characteristics aredifficult to detect but the basic questions relevant to them can in differentiated accordingto their functional meaning.
17
20
Structure
Engine
Driving part
Transmission
Combustion
Forward motion
Circle motion
5%,-.Avm
OrganizationWHAT?
Process
Figure 8'
18
HOW?
axis linefuel consumption
velocity V km/hsideo.alk
POSitiOn
engine
driving part
DivisionStatus
HOW MUCH? WHLRE?
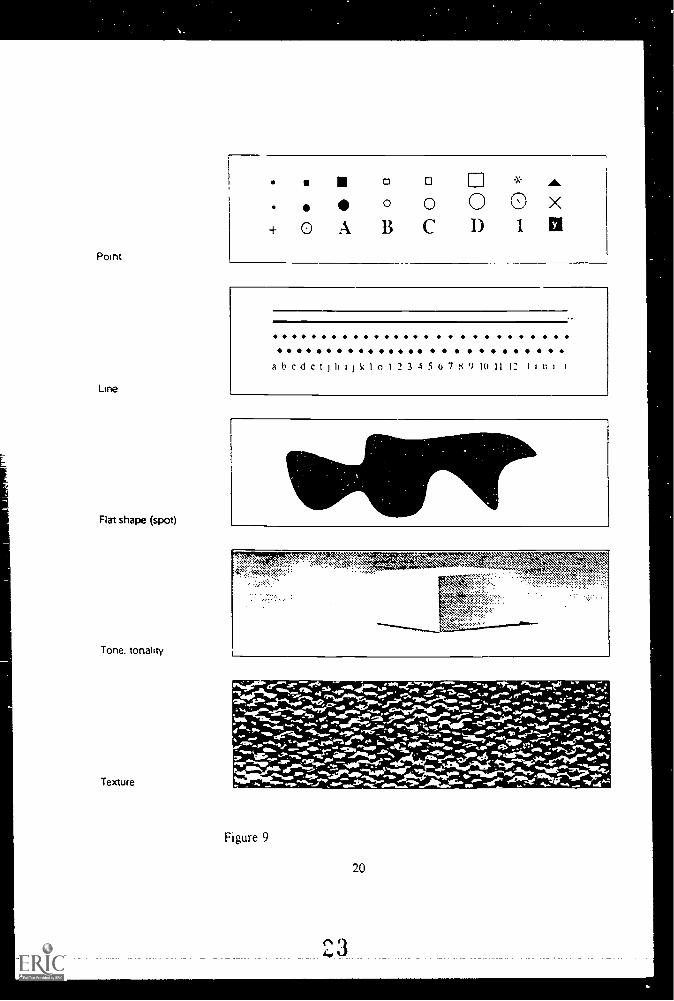
Visual language has like any other language a syntax's, semantics and pragmatics.The lowest level elements of forms, comparable to the characters of verbal language, arewell known from geometry - point which has no dimensions of its own but shows aplace, location and position, then line as a one-dimensional image. On the intermediatelevel, comparable to words, configurations of the lower level element get a basic meaning.
...,;;.".46A,-.w;:w delft -4.. .. : .'' -II. 'aisis 'MK., ........: ..' .... '4,....,,40n.s.,"Nose., '',6,,!2."6.** ..' .... ..7ft v,4. .4 -.....1,-" ....."_, i,.,;1.1":11:1,-"q '.....77.._.' ..rt"., ..e.t.'''hilert...%42:4; 1e
"..w.sg'2._ ,L,.--P'''''__..,* ..,,,. -.'les °:f....,.....`" s." .0.....bn'ilIP ''''.7.11 " ..1410 '''vr.4.1..,-,.VI
....-1:4414;1/4727.e......., sas. e="illib 7%-..'2116:-e1;411t".41;."
,..ilor .04,7" -.111....5.m. 'V.:6 gr ....t%mb
On the high level the ''words" of visual language combine to form expressions. Throughline we most often show direction, stretch or movement. As an element of the word stockline can be used also to depict trajectories and routes, to designate boundaries anddivisions. The regular and irregular geometric figures as well as the plane forms are atwo-dimensional image of some type. Space occupied by them coincides with a definitearea of the drawing. In this sense the figure as an element from the dictionary of thegraphic language is used to designate contours, area, outline, frame, etc.(see Fig. 9).
The definite hue, i.e. a relationship between the degrees of black and white as well as thecolours, affords us a possibility to distinguish between separate elements of the object orto accentuate on the basis of contrast. Smooth transition and use of light shades allow usto describe volumetric forms and perspective changes (see Fig.10).
The texture of the graphic image is in fact the surface structure of the drawing and herewe can use both abstract and symbolic and descriptive textures. In practice, they denoteproperties of the physical surfaces of the object and are usually used with other elementsof the form most often they are combined with colours.
21
2 4
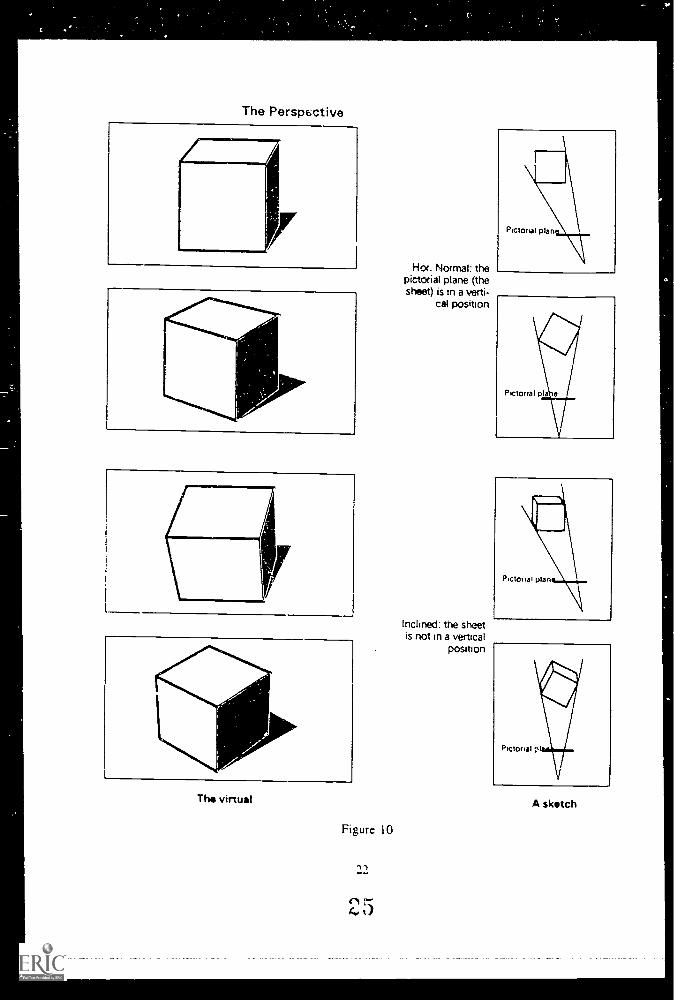
The Persp6ctive
The virtual
Figure 10
21
ri
Hor. Normal: thepictorial plane (thesheet) is in a verti-
cal position
Inclined: the sheetis not in a vertical
position
NCtorialVpi
A sketch
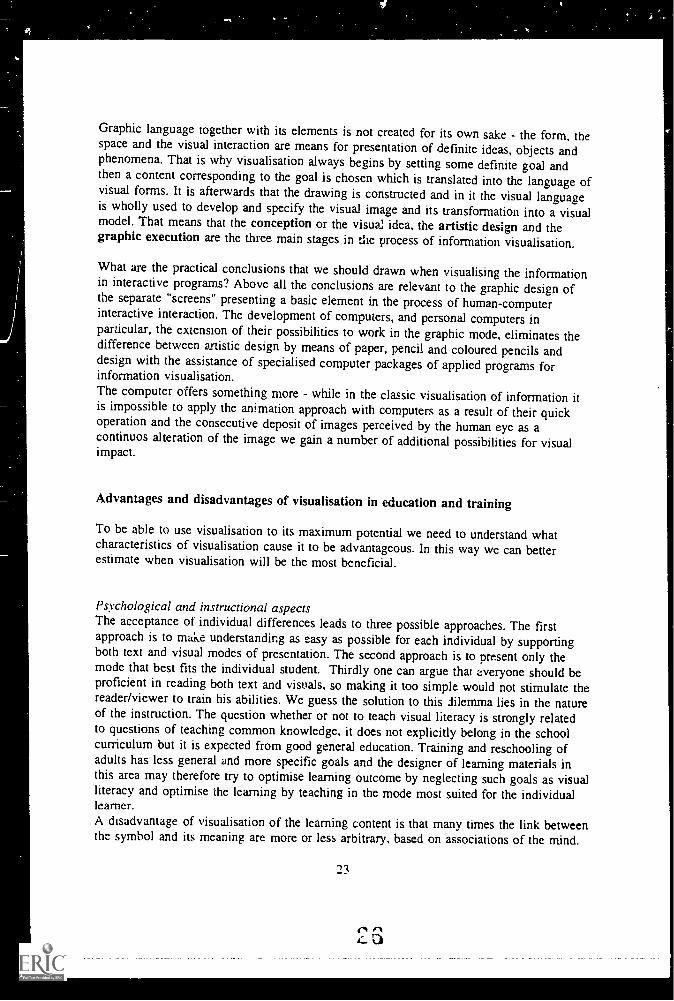
Graphic language together with its elements is not created for its own sake - the form, thespace and the visual interaction are means for presentation of definite ideas, objects andphenomena. That is why visualisation always begins by setting some definite goal andthen a content corresponding to the goal is chosen which is translated into the language ofvisual forms. It is afterwards that the drawing is constructed and in it the visual languageis wholly used to develop and specify the visual image and its transformation into a visualmodel. That means that the conception or the visual idea, the artistic design and thegraphic execution are the three main stages in the process of information visualisation.
What are the practical conclusions that we should drawn when visualising the informationin interactive programs? Above all the conclusions are relevant to the graphic design ofthe separate "screens" presenting a basic element in the process of human-computerinteractive interaction. The development of computers, and personal computers inparticular, the extension of their possibilities to work in the graphic mode, eliminates thedifference between anistic design by means of paper, pencil and coloured pencils anddesign with the assistance of specialised computer packages of applied programs forinformation visualisation.The computer offers something more while in the classic visualisation of information itis impossible to apply the animation approach with computers as a result of their quickoperation and the consecutive deposit of images perceived by the human eye as acontinuos alteration of the image we gain a number of additional possibilities for visualimpact.
Advantages and disadvantages of visualisation in education and training
To be able to use visualisation to its maximum potential we need to understand whatcharacteristics of visualisation cause it to be advantageous. In this way we can betterestimate when visualisation will be the most beneficial.
Psychological and instructional aspectsThe acceptance of individual differences leads to three possible approaches. The firstapproach is to make understanding as easy as possible for each individual by supportingboth text and visual modes of presentation. The second approach is to present only themode that best fits the individual student. Thirdly one can argue that everyone should beproficient in reading both text and visuals, so making it too simple would not stimulate thereader/viewer to train his abilities. We guess the solution to this 1 lemma lies in the natureof the instruction. The question whether or not to teach visual literacy is strongly relatedto questions of teaching common knowledge, it does not explicitly belong in the schoolcurriculum but it is expected from good general education. Training and reschooling ofadults has less general and more specific goals and the designer of learning materials inthis area may therefore try to optimise learning outcome by neglecting such goals as visualliteracy and optimise the learning by teaching in the mode most suited for the individuallearner.A disadvantage of visualisation of the learning content is that many times the link betweenthe symbol and its meaning are more or less arbitrary, based on associations of the mind.
23
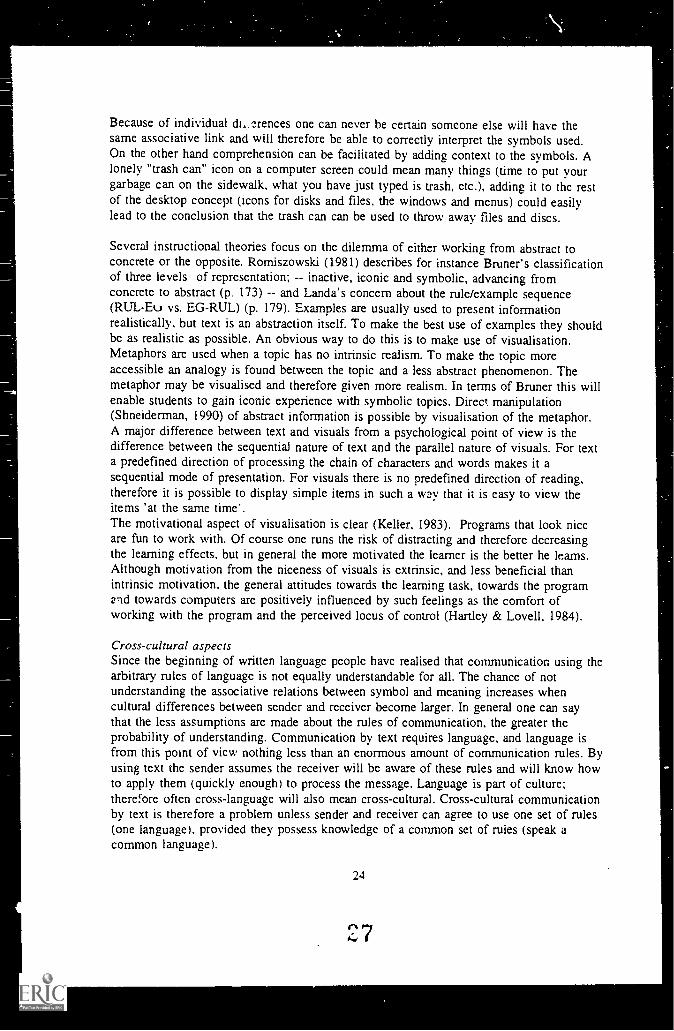
Because of individual di...rences one can never be certain someone else will have thesame associative link and will therefore be able to correctly interpret the symbols used.On the other hand comprehension can be facilitated by adding context to the symbols. Alonely "u-ash can" icon on a computer screen could mean many things (time to put yourgarbage can on the sidewalk, what you have just typed is trash, etc.), adding it to the restof the desktop concept (icons for disks and files, the windows and menus) could easilylead to the conclusion that the trash can can be used to throw away files and discs.
Several instructional theories focus on the dilemma of either working from abstract toconcrete or the opposite. Romiszowski (1981) describes for instance Bruner's classificationof three levels of representation; -- inactive, iconic and symbolic, advancing fromconcrete to abstract (p. 173) and Landa's concern about the rule/example sequence(RUL-Eu vs. EG-RUL) (p. 179). Examples are usually used to present informationrealistically, but text is an abstraction itself. To make the best use of examples they shouldbe as realistic as possible. An obvious way to do this is to make use of visualisation.Metaphors are used when a topic has no intrinsic realism. To make the topic moreaccessible an analogy is found between the topic and a less abstract phenomenon. Themetaphor may be visualised and therefore given more realism. In terms of Bruner this willenable students to gain iconic experience with symbolic topics. Direct manipulation(Shneiderman, 1990) of abstract information is possible by visualisation of the metaphor.A major difference between text and visuals from a psychological point of view is thedifference between the sequential nature of text and the parallel nature of visuals. For texta predefined direction of processing the chain of characters and words makes it asequential mode of presentation. For visuals there is no predefined direction of reading,therefore it is possible to display simple items in such a way that it is easy to view theitems 'at the same time'.The motivational aspect of visualisation is clear (Keller, 1983). Programs that look niceare fun to work with. Of course one runs the risk of distracting and therefore decreasingthe learning effects, but in general the more motivated the learner is the better he learns.Although motivation from the niceness of visuals is extrinsic, and less beneficial thanintrinsic motivation, the general attitudes towards the learning task, towards the programand towards computers are positively influenced by such feelings as the comfort ofworking with the program and the perceived locus of control (Hartley 8c Lovell, 1984).
Cross-cultural aspectsSince the beginning of written language people have realised that communication using thearbitrary rules of language is not equally understandable for all. The chance of notunderstanding the associative relations between symbol and meaning increases whencultural differences between sender and receiver become larger. In general one can saythat the less assumptions are made about the rules of communication, the greater theprobability of understanding. Communication by text requires language, and language isfrom this point of view nothing less than an enormous amount of communication rules. Byusing text the sender assumes the receiver will be aware of these rules and will know howto apply them (quickly enough) to process the message. Language is part of culture;therefore often cross-language will also mean cross-cultural. Cross-cultural communicationby text is therefore a problem unless sender and receiver can agree to use one set of rules(one language). provided they possess knowledge of a common set of rules (speak acommon language).
24
4n 7
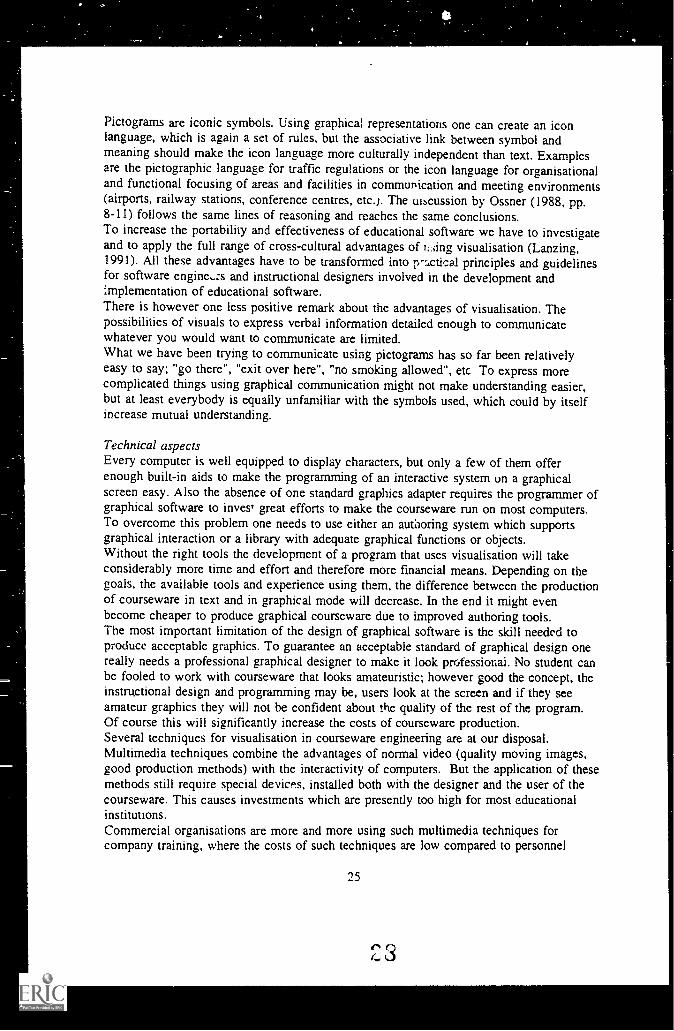
Pictograms are iconic symbols. Using graphical representations one can create an iconlanguage, which is again a set of rules, but the associative link between symbol andmeaning should make the icon language more culturally independent than text. Examplesare the pictographic language for traffic regulations or the icon language for organisationaland functional focusing of areas and facilities in communication and meeting environments(airports, railway stations, conference centres, etc.). The uiscussion by Ossner (1988, pp.8-11) follows the same lines of reasoning and reaches the same conclusions.To increase the portability and effectiveness of educational software we have to investigateand to apply the full range of cross-cultural advantages of 1..iing visualisation (Lanzing,1991). All these advantages have to be transformed into r.--.,ctical principles and guidelinesfor software engines and instructional designers involved in the development and:mplementation of educational software.There is however one less positive remark about the advantages of visualisation. Thepossibilities of visuals to express verbal information detailed enough to communicatewhatever you would want to communicate are limited.What we have been trying to communicate using pictograms has so far been relativelyeasy to say; "go there", "exit over here", "no smoking allowed", etc To express morecomplicated things using graphical communication might not make understanding easier,but at least everybody is equally unfamiliar with the symbols used, which could by itselfincrease mutual understanding.
Technical aspectsEvery computer is well equipped to display characters, but only a few of them offerenough built-in aids to make the programming of an interactive system un a graphicalscreen easy. Also the absence of one standard graphics adapter requires the programmer ofgraphical software to invest great efforts to make the courseware run on most computers.To overcome this problem one needs to use either an authoring system which supportsgraphical interaction or a library with adequate graphical functions or objects.Without the right tools the development of a prograni that uses visualisation will takeconsiderably more time and effort and therefore more financial means. Depending on thegoals, the available tools and experience using them, the difference between the productionof courseware in text and in graphical mode will decrease. In the end it might evenbecome cheaper to produce graphical courseware due to improved authoring tools.The most important limitation of the design of graphical software is the skill needed toproduce acceptable graphics. To guarantee an acceptable standard of graphical design onereally needs a professional graphical designer to make it look professional. No student canbe fooled to work with courseware that looks amateuristic; however good the concept, theinstructional design and programming may be, users look at the screen and if they seeamateur graphics they will not be confident about the quality of the rest of the program.Of course this will significantly increase the costs of courseware production.Several techniques for visualisation in courseware engineering are at our disposal.Multimedia techniques combine the advantages of normal video (quality moving images,good production methods) with the interactivity of computers. But the application of thesemethods still require special devices, installed both with the designer and the user of thecourseware. This causes investments which are presently too high for most educationalinstitutions.Commercial organisations are more and more using such multimedia techniques forcompany training, where the costs of such techniques are low compared to personnel
25
costs. This increased usage will probaV. iue the prices of technical support forvisualisation to decrease a little, but wt still not very optimistic of the chances of thetechnology for handling these techniques being afforded in schools in the near future.
Graphical techniques use the computer to display either prepared images stored on acomputer-readable external medium or images instantly generated by the computer.Because it requires no extra equipment, these digital approaches are usually the cheapertechniques. Therefore these techniques will be used more often. But apart from theseeconomical aspects, digital graphical methods for visualisation are also superior inversatility. Since the image is fully digital the computer can do all sorts of things with it,ranging from adding arrows and marks to image processing.For a long time the quality of computer graphics has been rather poor and with a lowdegree of realism, due to both display technology and to the difficulty and labourintensiveness of entering pictures into the computer. The use of scanning technique- hasincreased the quality of the visuals. The only remaining limitations are the amount ofmemory necessary for the storage of the images and the speed with which the hugeamounts of image data can be processed to produce realistic moving images.Digitalisation of video, compression techniques and increased graphical resolution andcolour will make the gap between the appearance and presumably the effect of bothmethods smaller. It now seems obvious that the trend towards digitisation of all kinds ofinformation will also progress towards the digitisation of video. Several attempts in thisdirection, such as DVI and Apple's Quick Time, have been undertaken and may prove tobe practical enough to become popular.
Economical aspectsVisualisation always increases the costs for the courseware development. A reasonableproblem, not solved until now, is to find the cost-effectiveness point of satisfaction takingthe important advantages and disadvantages, described above, into consideration. Thesolution of this problem is difficult not only because, one cannot estimate exactly thedirect and the indirect costs of courseware visualisation at the beginning of thedevelopment process, but mainly because till now there is no reliable model to convert thequalitative measured effect from interactive visual-supported courseware into quantitative(and special monetary) figures, for comparison with the rough estimated costs.The economic aspect is connected with the aspects mentioned above, especially with thecross-cultural one through the portability problem which influences implementation. Fromthe other side, the technical aspects are connected with the costs of software developmentand therefore indirectly with the level of visualisation.All the aspects therefore are related and so to study the main research problems a systemsapproach should be used.
Application of visualisation in courseware engineering
Two directions of visualisation in courseware engineering can be distinguished. The firstand most obvious is the visualisation in courseware itself, to improve the learning process.The second is the usage of graphical representation, for instance in authoring tools, toimprove the courseware engineering process.
40
26
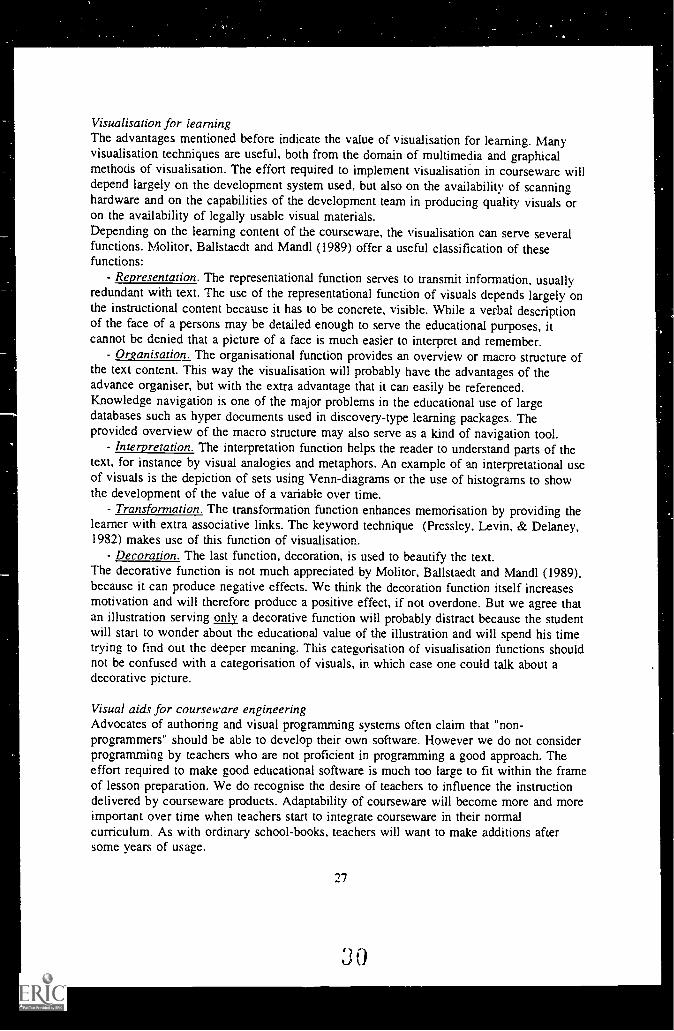
Visualisation for learningThe advantages mentioned before indicate the value of visualisation for learning. Manyvisualisation techniques are useful, both from the domain of multimedia and graphicalmethods of visualisation. The effort required to implement visualisatiOn in courseware willdepend largely on the development system used, but also on the availability of scanninghardware and on the capabilities of the development team in producing quality visuals oron the availability of legally usable visual materials.Depending on the learning content of the courseware, the visualisation can serve severalfunctions. Molitor, Ballstaedt and Mandl (1989) offer a useful classification of thesefunctions:
- Representation. The representational function serves to transmit information, usuallyredundant with text. The use of the representational function of visuals depends largely onthe instructional content because it has to be concrete, visible. While a verbal descriptionof the face of a persons may be detailed enough to serve the educational purposes, itcannot be denied that a picture of a face is much easier to interpret and remember.
- Organisation. The organisational function provides an overview or macro structure ofthe text content. This way the visualisation will probably have the advantages of theadvance organiser, but with the extra advantage that it can easily be referenced.Knowledge navigation is one of the major problems in the educational use of largedatabases such as hyper documents used in discovery-type learning packages. Theprovided overview of the macro structure may also serve as a kind of navigation tool.
- Interpretation. The interpretation function helps the reader to understand parts of thetext, for instance by visual analogies and metaphors. An example of an interpretational useof visuals is the depiction of sets using Venn-diagrams or the use of histograms to showthe development of the value of a variable over time.
- Transformation. The transformation function enhances memorisation by providing thelearner with extra associative links. The keyword technique (Pressley, Levin, & Delaney,1982) makes use of this function of visualisation.
- Decoration. The last function, decoration, is used to beautify the text.The decorative function is not much appreciated by Molitor, Ballstaedt and Mandl (1989),because it can produce negative effects. We think the decoration function itself increasesmotivation and will therefore produce a positive effect, if not overdone. But we agree thatan illustration serving only a decorative function will probably distract because the studentwill start to wonder about the educational value of the illustration and will spend his timetrying to find out the deeper meaning. This categorisation of visualisation functions shouldnot be confused with a categorisation of visuals, in which case one could talk about adecorative picture.
Visual aids for courseware engineeringAdvocates of authoring and visual programming systems often claim that "non-programmers" should be able to develop their own software. However we do not considerprogramming by teachers who are not proficient in programming a good approach. Theeffort required to make good educational software is much too large to fit within the frameof lesson preparation. We do recognise the desire of teachers to influence the instructiondelivered by courseware products. Adaptability of courseware will become more and moreimportant over time when teachers start to integrate courseware in their normalcurriculum. As with ordinary school-books, teachers will want to make additions aftersome years of usage.
27
0
_
Visualisation techniques may help to build systems, that enable teachers to make minorchanges to existing courseware. such as removing a paragraph or adding one, replacing apicture, etc.Other types of courseware, like simulation, modelling and gaming require differentcharacteristics from the authoring system. Modelling systems for instance are programsthat allow the user to enter, change and calculate mathematical models. Such programsusually use some kind of visual representation to indicate the transfer of data from onefunction or block to the next, such as an electrical circuit where the electrical currentpasses through different components which transform the signal.Rapid prototyping tools have become increasingly popular in recent years. Rapidprototyping tools are systems that allow experienced programmers to make a mock-upversion of software to be developed to discuss about and test the program before it'sactually being programmed, usually in some higher programming language. The role ofvisualisation for rapid prototyping tools is obvious, because the major function of suchtools is to produce programs that look like how the final version of the courseware underdevelopment should look like. It should give all the people involved in the coursewaredevelopment process an idea of the functioning of the graphical user interface and theeducational interaction.
References
Alesandrini, K.L. (1987). Computer graphics in learning and instruction. In HA. Houghton& D.M. Willows (EDs.) The Psychology of Illustration, 2 (Instructional Issues), pp.159-188. New York: Springer
Cole, M. & Scribner, S. (1974). Culture and thought: a psychological introduction.New York: Wiley.
Dwyer, F.M. (1971). A study of the relative effectiveness of varied visual illustrations.Educational Technology Publications.
Einstein, Albert.(1952) "Letter to Jacques Hadamard." In "The creative Process.New York, New American Library, pp. 43-44.
Fleming, Malcolm and Levie, Howard.( 1978) Instructional message design. EducationalTechnoloey Publications, Inc., Englewood Cliffs, New Jersey.
Hartley, J.R., & Lovell, K. (1984). The psychological principles uaderlying the design ofcomputer-based instructional systems. In D.F. Walker & R.D. Hess (Eds.),Instructional Software: Principles and perspectives for design and use (pp. 38-56).Belmont, CA: Wadsworth.
Keller, J.M., Development and use of the ARCS model of motivational design 49832.University of Twente, Enschede.
Koenig, J., Blyant, R., c.a. (1991). HyperCASE: The visual application developmentsystem [computer program manual]. Toronto: Interactive Image Technologies.
Lanzing, J.W.A. (1991). Visual aspects of the cultural portability of educational software(unpublished doctoral literature survey). Enschede: University of Twente.
Molitor. S., Ballstaedt, S.P., & Mandl, H. (1989). Problems in knowledge acquisition fromtext and pictures In H. Mandl & J.R. Levin (Eds.), Advances in psychology:Vol. 58. Knowledge acquisition from text and pictures (pp. 3-36). Amsterdam:North-Holland.
31
28
Ossner, J. (1988). Transnational symbols: The role of pictograms and models in thelearning process. Pre-DELTA Project TF III task e (paper 5).
Pressley, M., Levin, J.R., & Delaney, H.D. (1982). The mnemonic keyword method.Review of Educational Research, 52(1), 61-91.
Romiszowski, A.J. (1981). Designing instructional systems: Decision making in courseplanning and curriculum design. New York: Kogan Page.
Rivlin, Ch., Lewis, R. & Cooper, R.D. (Eds.) (1990). Guidelines for screen design.Blackwell Scientific Publications. Cambridge: The University Press.
Shu, N.C. (1988). Visual programming. New York: Van Nostrand Reinhold.Sirnonson, M.R. & Hargrave, C. (Eds.) (1991). Proceedings of the 13 annual AECT
conference. (IA): Iowa State University.Stanchev, I. (1990). Software engineering for portability. Journal of Research on
Computing in Education, 23(2), pp. 204-224.Stanchev, I. (1991). Visual presentation of information and design of interactive screens,
proceedings of the IV East-West seminar on education technology, Prague, 1991.Stillings, N.A., Feinstein, M.H., Garfield, L.J., Rissland, E.L., Rosenbaum, D.A., Weis ler,
S.A. & Baker-Ward, L. (1987). Cognitive science: an introduction. Cambridge(MA): MIT.
Tyre, T. (October, 1989). Authoring packages continue to mature. Technological Horizonsin Education Journal, 17(3), 10-18.
19
9
Human Factors and multi media design
Lex Bergers
Abstract-ome human factors in relation to multimedia design will be discussed in this article. In the
first part theory and design gaidelines about human communication is applied to 'man-machinecommunication. In the second part of the article some cognitive processes -perception andstorage and retrieval of information- that affect multimedia design are described.
Introduction
Multimedia is all about communication. So, let' s spend a minute on a simple definition ofhuman communication: sending and receiving messages between two or more people.Someone is sending the message and another person is receiving it. The sender can thenbecome the receiver and vice versa.This communication process comprises different subprocesses e.g. motivational and cognitiveprocesses.The communication between a human being and a (multimedia) system basically follows thesame process. There is a sender (the system), there are messages (the content), there arereceivers (the users of the system) and there is feedback (the system reacts at the input of thesystem user).The major difference between 'man-machine' communication and communication betweenpeople is the lack of flexibility in the communication process. There are no side paths possible,there is always a kind of (more or less) rigid communication. It is impossible for a system toact or react as a human being, to understand what troubles the user has or why the user is notable to proceed.
However, designers of multimedia systems can take into account 'human factors' as much aspossible to let the communication process be as optimal as possible. By 'human factors' I meanthe psychological attributes that are involved in communication processes, includingmotivational processes and cognitive processes like perception, attention, memory, learningand thinking.In this article I will concentrate on some important notions about communication and on twocognitive attributes: perception and memorisation (storage and retrieval of information).
Although psychology is a very young science, designers of multimedia systems can benefitfrom it. To become a good designer, especially a user interface designer, it is most needed tohave at least some knowledge about human factors.So, the discussion is about what human factors can bring in order to develop guidelines formulti media design.
3 I
Sending messages in communication
You probably know what coins are used in the United States of America. So you should beable to solve the next problem. 'I have two coins that total 30 cents. One of them is not a five-cent piece. What are these coins?Do not read further now. Think first about this problem before you read the solution.Of course, there is a trick. The solution is a five-cent piece and a quarter. Why? One of thetwo coins (the quarter!) is not a five-cent piece!Most people cannot easily solve this problem, because they trust communication conventionstoo much, like the one that people trust that when there is some special condition, it will bedescribed. If special conditions are not mentioned, then the 'receiver' can assume there arenone.
In designing multimedia systems this means that the system has to always inform the usersabout special features that are not visible at first glance. The user interface must reveal thespecial features. The user should be able to perceive the message in its context. If the contextis absent or unclear then understanding becomes more difficult.
Another communication convention is that people normally do not mention obvious,unimportant, or unlikely things. When people do mention them, it conveys a special signalabout their importance.Here is a danger, because the sender (the designer) determines what will be obvious to theuser and what will not. The only way to avoid problems is to do several user tests and ftnd outif it really is obvious to the users.Communication is not always very effective because of inconsistencies and ambiguities in theprocess. This does not mean it is not possible to have effective communication. What is thebest way to send messages to a computer user with whom you are trying to clarify yourintentions? There are some rules to be aware of:
Consider the knowledge of the userAlways consider the knowledge and understanding of the system users. The users often do nothave the same background you as a designer have, they may have an entirely different conceptof what you are speaking about. Do not use terms the system users do not understand. Try toavoid difficult and ambiguous terms, if this is not possible define them. As much as possible,let the system speak the language of the users.Of course users differ in capability and experience, try to design with these differences inmind.
Present complete messagesEnsure that the messages in the system are as complete as possible. Give explanations whereneeded.
Do not use negativesNegatives in a sentence will be read slower and less accurately than comparable sentencesphrased in affirmative terms.
Provide messages and orientation possibilitiesProvide messages informing users which part of the system they are in. In large systems usersmay forget which facility they are using, beacuse they have navigated through many functions.A support function showing them where they came form and where one can go to, might bevery helpful.
Saw user's effortTry to save user's effort when operating the interface. This can be realised by using theminimal number of dialogue steps necessary. For example, do not use two question andanswer steps where one will be sufficient.
Reduce the wnount of opingReduce the amount of typing and the use of abbreviations and codes. Long winded dialoguesmay be supportive at first but users quickly learn dialogue steps. Slow and multi-stepdialogues soon become frustrating.
Use defaults.Set default replies where there is a predictable answer, this saves the user work.
HelpProvide on-line help whenever possible. Help has two functions, first as a learning aid forusers who are reluctant to read manuals, second, as a memory support for experienced userswho need confirmation of some detailed aspect of an operation.
UndoMstakes will be made and users will want to backtrack in a dialogue the sequence they havegone through and start again. The interface should provide the ability to go back (or go `up' ina hierarchical system) and recover a previous state.
ConsistencyThe format and the execution of commands should be consistent throughout the interface.Consistency reduces the amount users have to learn about an interface.
Presenting feedback in communication
In multimedia systems, feedback is the user's key source of how to complete a task. Feedbacktakes away the fear from the user, it helps the user to feel at ease because it confirms that thesystem did understand him (and visa versa). Feedback makes it possible for the user tocorrect words or actions and it gives the user new incentives.If feedback messages are not well expressed, it will disturb the communication process. If yougive feedback that is not useful at that moment or if the feedback does not tell what to doinstead, it does not help at all. For example:If one receives the feedback message "You have to select another function," you do not knowwhat to do, or which function you should select. Feedback has to be constructive, it must helpthe user to proceed. A good example is: "You have to select the delete function."
If a user receives negative feedback, he will not feel at ease and this can be demotivating. Itwill be more motivating for the user to receive positive, constructive feedback. For example:
33 tj a,c)
Instead of stating that a chosen option is not available, state that the chosen option is availableafter certain required work. This will help the user establish a positive attitude towards thesystem.Effective feedback needs to be presented at the proper pace and should be tailored to thespecific user situation.
Cognitive Processes
The world around us communicates to us by sound, colors, shapes, signs, symbols, etc. Thisongoing communication between the 'world' and humans facilitates cognitive processes likeperception and the storage of information in our memoryand the retrieval of it.In the next sections will be discussed this particular cognitive processes with relation to thedesign of multimedia systems.
Perception and pattern recognition
How many times have you recognised telephone callers from their very first words? We canoften recognise a musical piece from the first few notes. Sometimes we can identify a friendor relative from a cough or a footstep. And from one quick look at a computer screen youknow someone is working with Wmdows. In other words: people are very good inrecognising patterns.People are capable of recognising familiar patterns almost instantaneously. At least two thingsabout the examples above are striking.First, recognition occurs almost instantly. Second, we seldom make mistakes.Patterns do not have to be analysed to be interpreted. We do not analyse a face in detail butrecognise it at once. The face is perceived as a whole and instantly interpreted.When designing a multimedia system you will benefit from using the principles of patternrecognition. Designers already benefit from the fact that humans are good pattern recognition'machines'. The use of icons is an example (the pictogram will be understood as a patterncomputer users recognise immediately) , and also the use of multiple windows (each windowrepresents a pattern).In many more design situations you can make meaningful patterns. For example:
Organize data to be shown in easily perceivable patterns.For example, use a bar-graph to present data instead of a pie-graph. The bar graph
gives a better 'pattern' , because the differences between the data will be perceived atonce, while a
pie graph needs more mental activity to interpret.It will also help people to perceive information when you present lists in an orderlyway. Make distinctions between the columns in a list by using white spaces. Eachcolumn will be perceived as a pattern and will be recognised immediately.When you have to present long text on the screen, divide the text into paragraphsusing white space between them. Avoid too much text on one screen page, becausethis will hinder the recognition of a pattern.
- And when you design several windows, each with different functions, make sure thatthe patterns of information and fields are different between these windows. This helpsthe user recognise immediately the right function in these windows.
,-, ,-, 340 0
Finally, be consistent in presenting information. The more consistent something is, the easierit is to see patterns within it and hence its structure and characteristics.
Mistakes in perception
Most interaction with a computer system starts with visual perception: the computer userlocates a menu selection, an entity to be deleted, the cursor or he recognises a form or shape.Unfortunately, people can be wrong in interpreting what they see. Most famous in everydaylife, are the witness statements of how a traffic accident happened. Often, different witnesseshave their own story about the accident, confusing the police. The explanation of this is thatpeople tend to see what they would like to see or expect to see.What we can learn from this is that people make mistakes in perceiving an user interface.Maybe they do not notice status-information, or they interpret messages, pictures, orprocesses wrongly. They will have problems in reading codes and unfamiliar abbreviations.So for users to perceive the system well, informationmust be:
As familiar to the user as possible,Legible: the text does not flicker and is easy to read at a glance,Distinguishable: the figure is clearly separated from the background,Comprehensible,Uncluttered, andMeaningfully structured.
Furthermore, to minimise the use of unfamiliar codes and abbreviations, one should makeschematics and pictures as clear as possible to allow the user to recognise and understandthem at once.
Perception and colour
Colour PerceptionThe challenge for the artist is to capture colour in a form that creates mood and atmosphere.For the interface designer the challenge is to use colours as a form of coding to displayinformation in the most efficient way. Unfortunately, many designers new to colour graphicshave tried to become artists. The result has often been disastrous: a mismatchof colours whichconstitutes neither a masterpiece nor an effective interface.There has been a tendency to use as many of the available colours as possible in userinterfaces. Moreover, there has been a preference to use highly saturated colours based on theunderlying assumption that the brighter the better'. But if you ever looked at some of theoriginal videotex pages on television you will know how garish such a display can be.Sometimes it is almost impossible to extract the information required.
Colour functionsColour is most powerful for search tasks and of little use in tasks requiring identification,categorisation and memorisation of objects. In comparison with achromatic coding (black andwhite), colour has been shown to be of more use in search tasks for inexperienced users thanfor the experienced.Colour is a very powerful way to divide a display into separate regions. Hence segmentationof a display for detection and search tasks is very useful. Areas that need to be seen as
35
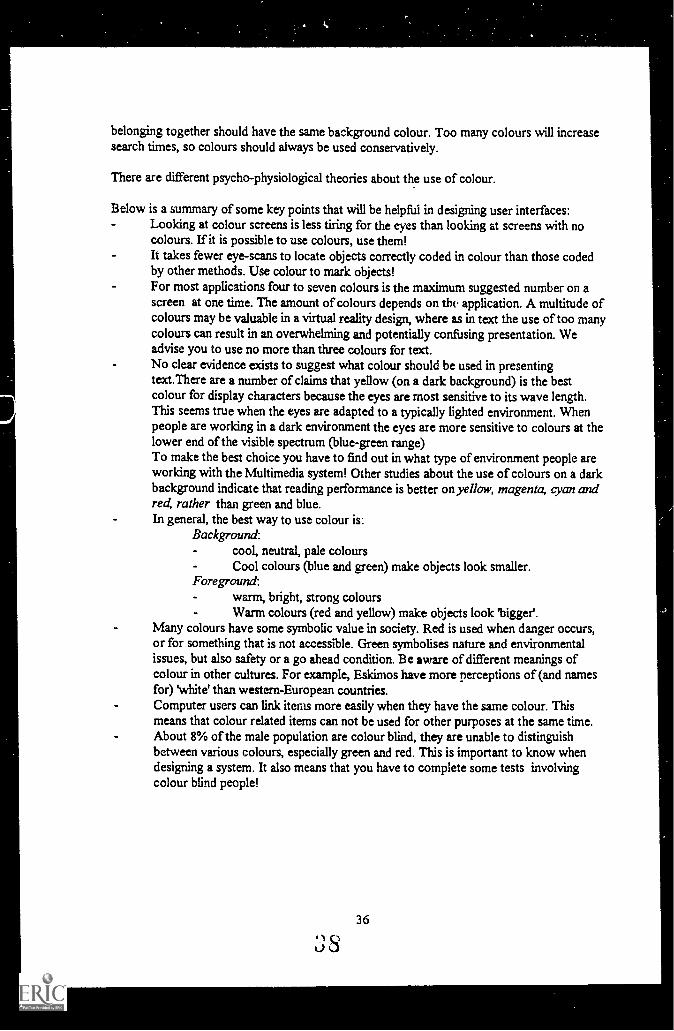
belonging together should have the same background colour. Too many colours will increasesearch times, so colours should always be used conservatively.
There are different psycho-physiological theories about the use of colour.
Below is a summary of some key points that will be helpful in designing user interfaces:Looking at colour screens is less tiring for the eyes than looking at screens with nocolours. If it is possible to use colours, use them!It takes fewer eye-scans to locate objects correctly coded in colour than those codedby other methods. Use colour to mark objects!For most applications four to seven colours is the maximum suggested number on ascreen at one time. The amount of colours depends on the application. A multitude ofcolours may be valuable in a virtual reality design, where as in text the use of too manycolours can result in an overwhelming and potentially confusing presentation. Weadvise you to use no more than three colours for text.No clear evidence exists to sugsest what colour should be used in presentingtext.There are a number of claims that yellow (on a dark background) is the bestcolour for display characters because the eyes are most sensitive to its wave length.This seems true when the eyes are adapted to a typically lighted environment. Whenpeople are working in a dark environment the eyes are more sensitive to colours at thelower end of the visible spectrum (blue-green range)To make the best choice you have to find out in what type of environment people areworking with the Multimedia system! Other studies about the use of colours on a darkbackground indicate that reading performance is better on yellow, magenta, cyan andred, rather than green and blue.In general, the best way to use colour is:
Background:cool, neutral, pale coloursCool colours (blue and green) make objects look smaller.
Foreground:warm, bright, strong coloursWarm colours (red and yellow) make objects look 'bigger'.
Many colours have some symbolic value in society. Red is used when danger occurs,or for something that is not accessible. Green symbolises nature and environmentalissues, but also safety or a go ahead condition. Be aware of different meanings ofcolour in other cultures. For example, Eskimos have more perceptions of (and namesfor) 'white' than western-European countries.Computer users can link items more easily when they have the same colour. Thismeans that colour related items can not be used for other purposes at the same time.About 8% of the male population are colour blind, they are unable to distinguishbetween various colours, especially green and red. This is important to know whendesigning a system. It also means that you have to complete some tests involvingcolour blind people!
:3S
36
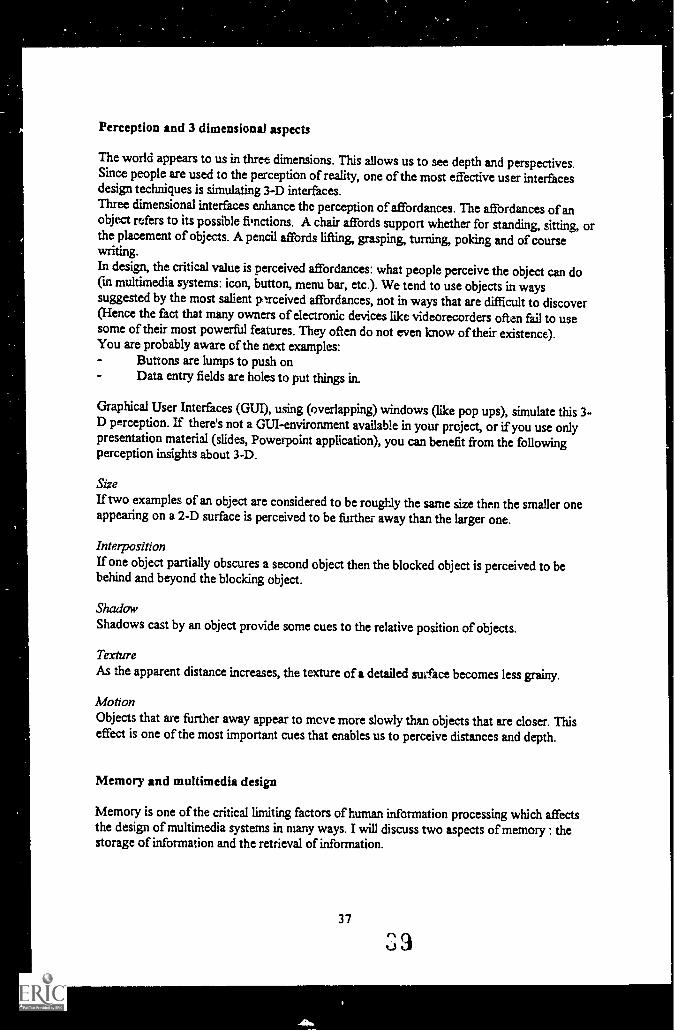
Perception and 3 dimensional aspects
The world appears to us in three dimensions. This allows us to see depth and perspectives.Since people are used to the perception of reality, one of the most effective user interfacesdesign techniques is simulating 3-D interfaces.Three dimensional interfaces enhance the perception of affordances. The affordances of anobject refers to its possible fietctions. A chair affords support whether for standing, sitting, orthe placement of objects. A pencil affords lifting, grasping, turning, poking and of coursewriting.In design, the critical value is perceived affordances: what people perceive the object can do(in multimedia systems: icon, button, menu bar, etc.). We tend to use objects in wayssuggested by the most salient p.Irceived affordances, not in ways that are difficult to discover(Hence the fact that many owners of electronic devices likevideorecorders often fail to usesome of their most powerful features. They often do not even know of their existence).You are probably aware of the next examples:
Buttons are lumps to push onData entry fields are holes to put things in.
Graphical User Interfaces (GUI), using (overlapping) windows (like pop ups), simulate this 3-D perception. If there's not a GUI-environment available inyour project, or if you use onlypresentation material (slides, Powerpoint application), you can benefit from the followingperception insights about 3-D.
SizeIf two examples of an object are considered to be roughly the same size then the smaller oneappearing on a 2-D surface is perceived to be further away than the larger one.
InterpositionIf one object partially obscures a second object then the blocked object is perceived to bebehind and beyond the blocking object.
ShadawShadows cast by an object provide some cues to the relative position ofobjects.
Texture
As the apparent distance increases, the texture of a detailed surface becomes less grainy.
MotionObjects that are further away appear to move more slowly than objects that are closer. Thiseffect is one of the most important cues that enables us to perceive distances and depth.
Memory and multimedia design
Memory is one of the critical limiting factors of human information processing which affectsthe design of multimedia systems in many ways. I will discuss two aspects of memory : thestorage of information and the retrieval of information.
37
StorageThe concept of human memory consisting of a short term and a long term memory is of coursewell known, since computers also have a RAM memory (short term) and a hard disc (longterm).From the theory about short term memory we know that it has a limited capacity.Psychologists found in experiments that the limit is 7 items plus or minus 2. Items are not'bytes' but 'chunks' of information. Chunks can vary from simple characters and figures tocomplex abstract colicepts or images.This means that in a multimedia system the amount of information that has to be rememberedby the user has to be minimised (minimum of the number of actions, commands, objects,properties, rules, etc.). If users have to remember information for some time, make sure thetotal amount of items to be held in memory does not exceedfive.
OrganisationBecause our long term memory (LTM) is structured in a certain way, we are able to retrievefacts, procedures, principles, experiences, etc. relatively fast. This orgrnisation is certainly notstructured like the hard disk of a computer. Humans are able to make flexible connectionsacross 'directories', 'sub-directories' and 'files'. The associative power of the brain exceeds farthe power of computers.Our long term memory is organised in several overlapping ways. The basic organisation ofLTM is thought to be semantic. Data are stored in terms of linguistically based conceptslinked together in a highly developed network of meaningful categories. For example, if youare mentally checking your vacation outfit and start with your passport, you will continue withother paper work like your driving licence, insurance papers, money, address book, flighttickets, etc. In some way you have made a category of all the paper work. Fortunately eachpiece of paperwork is related to other categories. For example, the flight tickets are alsorelated to: the airport, the airline, the pilot, tax free shopping, the flight reservation, etc. Thismeans that our memory is not organised into discrete, non overlapping categories, but isorganised in a flexible way.We can learn from this when we design multimedia systems. In your multimedia design youhave to categorise as many tasks, items, options, and functions as possible in a non-overlapping way. If you design a Graphical User Interface the use of windows directs youmore or less automatically in categorisation of tasks, items, information, etc. You should notonly categorise menu bar items, but also lists, icons, buttons, data entry fields, etc. You shouldmake it clear to the computer user what relations exist between those categories, allowingthem to retrieve information in a flexible way. Also, with your design, encourage users tocategorise information which must be retrieved later. Provide prompts, labels or (menu) nameswhich are relevant to those categories.
Memory is also organised in episodic memory. In episodic memory we relate a word, anexperience, an 'odour', etc. to some _vent. For example, when you try to retrieve the name ofthe author of a novel, you recall one evening when you spoke about a book by this author. Inyour mind you see the table with a glass of wine and the book next to it. You remember theatmosphere of that evening and other features, that brings you to the name of the author.It takes less effort to remember items from this episodic memory. This explains whymetaphors are used in graphical user interfaces, because they relate activities to humanexperiences and events.
4 0
38
Retrieval of information
Psychological research has revealed that the retrieval of information from our memory is farbetter when we can recognise stored material rather than recalling material from memory.This is why the 'multiple choice' questions in tests are so popular. It is also one of the reasonspeople like multimedia, including running video, pictures and windowing techniques.Our ability to recognise information is particularly remarkable for pictorial information.Several studies have shown that our capacity for recognising pictures may be almost unlimitedand is extremely accurate.Psychologists found that wrong interpretations of commands occurred far more often whenusing command names (text) than icons (pictures). The obvious implications for interfacedesign is that you have to use recognisable, pictorial items instead of textual items that a userhas to recall from memory.
Computer systems are very valuable in helping people retrieve information. In fact the memoryburden of computer users can be drastically decreased (especially, as we have seen, when theyare using systems with a Graphical User Interface), since they only have to recognise icons,menu options, and pictorial information.Graphical User Interfaces however do not completely decrease the memory burden. Peoplewill always have problems retrieving information, even when they are using a supportingcomputer system. This is related to:
DistractionWhen people are distracted during their task performance, they will forget recently learned orstored material. Even a small number of simple 'chunks' of information are lost within 20seconds if there is distraction during input.In your interface design you can help people if they are distracted. Users must be able to stopan ongoing process temporarily and users must be informed about the status of the task(status information that answers user questions like 'Where am I?).If the distraction means that the user has to leave the current task or module, and has toswitch temporarily to another task, the user must always be able to go back where he camefrom.
InteiferenceOther inputs which impair retrieval are called interference. When you are trying putting somematerial in your short term memory (for example: some names of clients), and there is at thatmoment other input you have to attend to, you will have trouble retrieving the formermaterial.Supplying irrelevant material during input to short term memory makes retrieval moredifficult.This means you have to present one task at the time in the Multimedia system. If you canavoid it, do not confront computer users with other inputs at the same time!
Primacy and Recency EffectPsychological experiments show that when people have to remember information, the lastitems of the received information are best remembered (recency effect).The middle items are poorly recalled, and are even not recalled when there is a lot ofinformation. The remembering of the first items, however, is also very good )i-imacy effect).
39
41

This means that in presenting information to the computer user (e.g. text) the most importantinformation has to be presented at tin end (or at the beginning). For example presentexplanations of how something is working in the middle, but present the concrete 'how to do'things at the end.
40
4 2
Conceptual Metaphors for the Visualisation in Interactive Learning
Piet Kommers
Abstract
With the arrival of the full spectrum of presentation modes in computer-based learningresources, it becomes urgent to review already existing theories about visualisation andanimation as defined for paper-based publication, movie and video.One of the differences between traditional media and hypermedia is that the first onestake the user along in a consistent sequence of episodes that refers to a lay-out, storyor scenario that can be understood and in some way or another 'be predicted fromcultural experience and prior knowledge. Hypermedia in contrary allows the user tojump away from a current piece of information to a certain aspect which is only anarbitrary detail of the previous scope. Text-based hypermedia (called hypertext) allowsthe user to browse via concept identity. This means that a term in an explanation canbe exploded by clicking the location of this term (called hot spot). The same term willappear at the top of the exploded view, and will also be the key issue its content. Theconcept identity is the fact that the term in the clicked hot spot is identical to thesubject of the exposition in the exploded view. Browsing through pictures, video andsound elements allows the user to zoom in on details. However it is quite complicatedto guarantee some kind of concept idEntity in the transition from one picture elementto another. The reason is that picture elements are less self-contained than words in atext. The context dependency of visual elements causes surprise and confusion in theuser. One way to solve this problem is to enclose meta-information with the visualrepresentation which links different views with concepts that are present at both sidesof the link.Hypertext links can be visualised in a concept network, where the nodes stand forconcepts. The concept node represents the 'dentity between hot spot and the key issuein the subsequent exploded view. Generalising the concept network to picturetransitions can be done by prompting clusters of elements and labelling them with aconcept term. The choice of clusters and the term will orient the user to the type ofdigression he/she may expect after clicking a certain hot spot.Conceptual overlays in audio and video segments presuppose a moderate level ofgranularity; The overlay should remain valid for a minimum time span so that the usercan anticipate his browsing direction while seeing the next fragment. This can be doneby having the hot spot elements at static positions in the screen, while the movingelements settle the context situation in which critical concepts arise The conceptualmetaphor for effective use of hypermedia constitutes schematic representations whichis an accentuation of the meaningful elements the user should be aware of whilebrowsing through unknown information. At the same time it might function as anepisternic analysis for the hypermedia designer who needs an explicit contentdescription in the design phase
41
Introduction
Computer-based learning programs have triggered again the basic discussion ondidactic strategies, styles in learning dialogues and the design of information elementslike text visual images and sound. The key element in this revived debate is the notionof 'self-control for the student versus the attempts to facilitate learning by regulatingthe learning process by pacing and sequencing information elements and systematicremediation of evolved misconceptions in the student's mind. Hypermedia and multi-media were quite welcome after twenty years of high expectations of 'advancedprogrammed instruction', 'intelligent tutoring' and 'student model-driven dialogues'Rather than stimulating the traditional opposition between student- versus systemcontrol its seems more productive now to unify them by asserting that hypermediaexplorations might serve complementary stages in learning and instruction. Initialstages of learning in which pre-cognitive levels of expertise and intuition in the studentare mobilized, versus the need for a more controlled instruction facilitating a later,more operational stage of learning in which correct task performance plays animportant role. This chapter presents the merits of recent visualisation techniques inpre cognitive learning stages while using hypermedia. Essential for the cognitivebenefits in this stage are the so-called metacognitive effects; Balajthy, E., 1990 andCates, W., 1992.The availability of pictures, sounds and video in electronic learning material brings theopportunity to confront the student with flexible realistic views in a certain domain.Especially as competing media programs like television commercials with astonishingvideo clips, animations and highly suggestive and condensed social episodes penetrate,it is quite urgent to make interactive learning programs as expressive as possible toelicit emotions and keep the attention of the user.The user flexibility of hypermedia gives full control on sequence, focus and perspectiveto the learner. While hypertext browsing has become popular quite quickly,hypermedia browsing is still rare. One reason for it is the amount of effort to preparethe numerous transitions and necessary visual consequences that should be anticipated.Another important complexity is in the inconsistencies that may arise when allowingthe user to browse between visuals, sounds and video fragments. The chosen solutionto overcome ambiguous transitions between pictorial elements is to superponeconceptual structures on the candidate hot spots. Before going into the techniques ofconcept representation, - metaphors and interaction procedures, let's review alreadyexisting theories about visualisation and animation as defined for paper-basedpublication, movie and video.
Words, Images and the Level of Abstraction.
'Words and images cannot be derived from each other, ' Foucault, 1966. It stressesthe uniqueness of human senses. Qlite typical prehistoric tribes reflected their desiresand fears in pictographic images. After centuries however they moved to more abstractcryptic symbols representing objects but also feelings and reflections These symbolsdid not necessarily resemble the objects they referred to: A separation between realityand mental representation Words like symbols do not necessarily refer to one concreteobject or situation, it may r'so point to a more general unity of things Words like
42
4 4
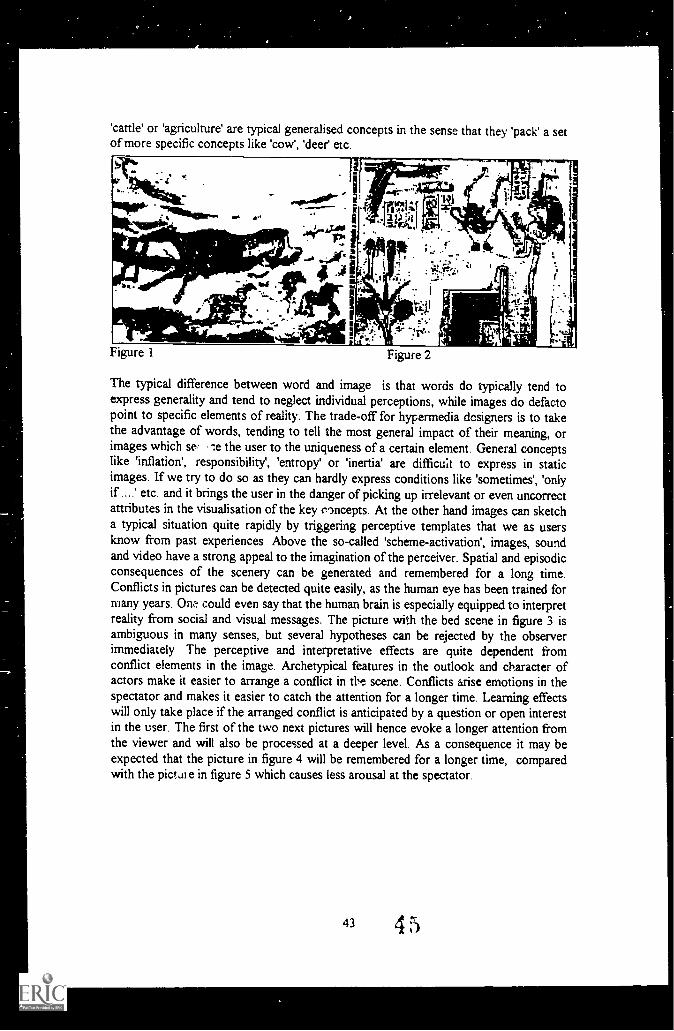
'cattle or 'agriculture are typical generalised concepts in the sense that they 'pack' a setof more specific concepts like 'cow', 'deer' etc.
Figure 1 Figure 2
The typical difference between word and image is that words do typically tend toexpress generality and tend to neglect individual perceptions, while images do defactopoint to specific elements of reality. The trade-off for hypermedia designers is to takethe advantage of words, tending to tell the most general impact of their meaning, orimages which se, -:e the user to the uniqueness of a certain element. General conceptslike 'inflation', responsibility', 'entropy' or 'inertia' are difficua to express in staticimages. If we try to do so as they can hardly express conditions like 'sometimes', 'onlyif ....' etc. and it brings the user in the danger of picking up irrelevant or even uncorrectattributes in the visualisation of the key concepts. At the other hand images can sketcha typical situation quite rapidly by triggering perceptive templates that we as usersknow from past experiences Above the so-called 'scheme-activation', images, soundand video have a strong appeal to the imagination of the perceiver. Spatial and episodicconsequences of the scenery can be generated and remembereri for a long time.Conflicts in pictures can be detected quite easily, as the human eye has been trained formany years. Om could even say that the human brain is especially equipped to interpretreality from social and visual messages. The picture with the bed scene in figure 3 isambiguous in many senses, but several hypotheses can be rejected by the observerimmediately The perceptive and interpretative effects are quite dependent fromconflict elements in the image. Archetypical features in the outlook and character ofactors make it easier to arrange a conflict in the scene. Conflicts arise emotions in thespectator and makes it easier to catch the attention for a longer time. Learning effectswill only take place if the arranged conflict is anticipated by a question or open interestin the user. The first of the two next pictures will hence evoke a longer attention fromthe viewer and will also be processed at a deeper level. As a consequence it may beexpected that the picture in figure 4 will be remembered for a longer time, comparedwith the pictal e in figure 5 which causes less arousal at the spectator.
43 4,:r
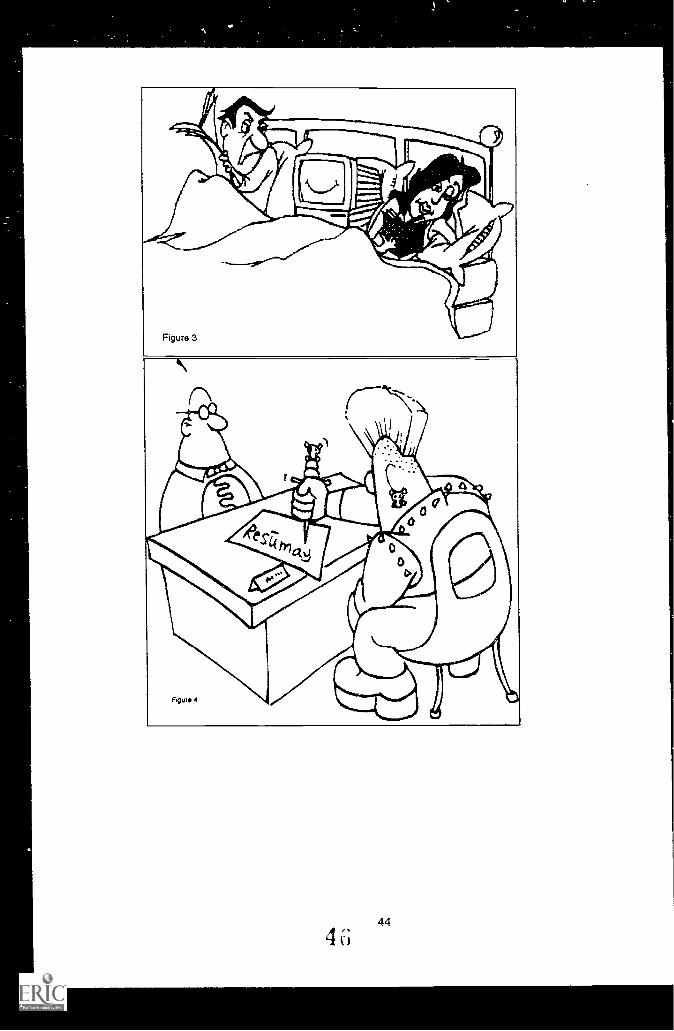
As one tries to explain the difference in examining figures 4 and 5 it makes sense todistinguish between 'understanding' (coping with the meaning of a certain impression)and 'remembering'. It is generally assumed that meaningful processing facilitatesremembering. Semantic processing for instance is assumed to be more effective thanformal processing; (Jenkins, 1974). Increasing the 'depth' of processing will producebetter memory (Craik and Lockhart, 1972; Craik and Tulving, 1975). The key issue isto arrange the images so that they actually trigger emotions, imagination and personalexperiences from the past. As culture changes quickly, and persons differ quite a lot, itis hard to find overall guidelines. The urgence to chose the right elements in visuals isclearly demonstrated in the effort given to commercials.
Trade off Between Abstraction and Concreteness in Presentation.
So far the global distinction betv,een visuals and audio (perceptual) at one side andverbal or written information (conceptual) at the other side has been made. Whilehypermedia designers are steadily improving the flexibility and expressiveness ofbrowsing, the more fundamental question arises to what extend we might expectbeneficial cognitive effects for the user. A dominant criterion so far is the level ofexcitement and entertainment: The more exuberant presentations, inclusively three-dimensional impressions and direct manipulation in space, the more is the appeal to theuser.Besides the alertness on cost-effectiveness it becomes important to find a rationale forthe learning criterion that might decide upon presentation richness. Edgar Dale took upthe concept of 'realism' of Hoban and Zissman (1937), and laid it down in his 'Cone of
45
4 7
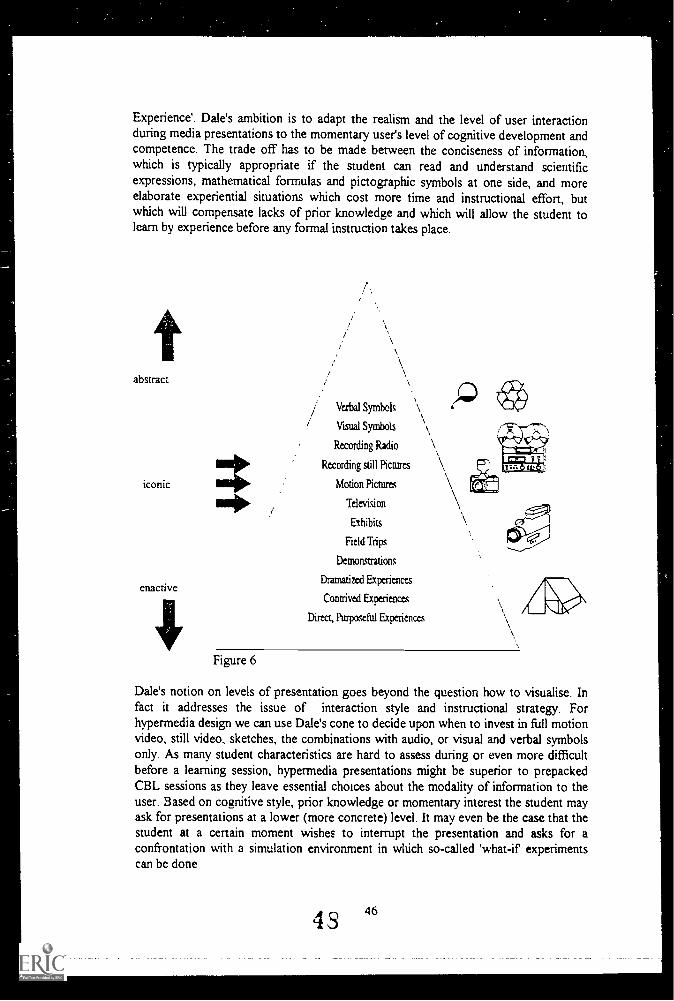
Experience Dales ambition is to adapt the realism and the level of user interactionduring media presentations to the momentary user's level of cognitive development andcompetence. The trade off has to be made between the conciseness of information,which is typically appropriate if the student can read and understand scientificexpressions, mathematical formulas and pictographic symbols at one side, and moreelaborate experiential situations which cost more time and instructional effort, butwhich will compensate lacks of prior knowledge and which will allow the student tolearn by experience before any formal instruction takes place.
abstract
iconic
Figure 6
Verbal Symbols
Visual Symbols
Recording Radio
Recording still Pictures
Motion Pictures
Television
Exhibits
Field Trips
Demonstrations
Dramatized Experiences
Contrived Experiencesennui ve
Direct, Purposeful Experiences
Dale's notion on levels of presentation goes beyond the question how to visualise. Infact it addresses the issue of interaction style and instructional strategy. Forhypermedia design we can use Dale's cone to decide upon when to invest in full motionvideo, still video, sketches, the combinations with audio, or visual and verbal symbolsonly. M many student characteristics are hard to assess during or even more difficultbefore a learning session, hypermedia presentations might be superior to prepackedCBL sessions as they leave essential choices about the modality of information to theuser. Based on cognitive style, prior knowledge or momentary interest the student mayask for presentations at a lower (more concrete) level. It may even be the case that thestudent at a certain moment wishes to interrupt the presentation and asks for aconfrontation with a simulation environment in which so-called 'what-if experimentscan be done
43 46
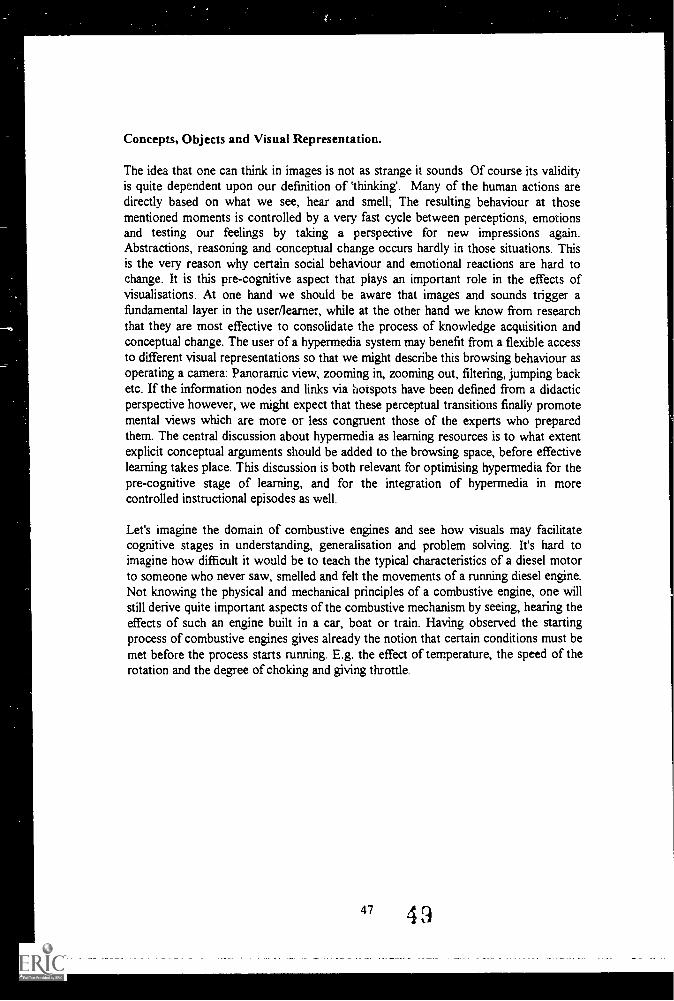
Concepts, Objects and Visual Representation.
The idea that one can think in images is not as strange it sounds Of course its validityis quite dependent upon our definition of 'thinking'. Many of the human actions aredirectly based on what we see, hear and smell; The resulting behaviour at thosementioned moments is controlled by a very fast cycle between perceptions, emotionsand testing our feelings by taking a perspective for new impressions again.Abstractions, reasoning and conceptual change occurs hardly in those situations Thisis the very reason why certain social behaviour and emotional reactions are hard tochange. It is this pre-cognitive aspect that plays an important role in the effects ofvisualisations. At one hand we should be aware that images and sounds trigger afiindamental layer in the user/learner, while at the other hand we know from researchthat they are most effective to consolidate the process of knowledge acquisition andconceptual change. The user of a hypermedia system may benefit from a flexible accessto different visual representations so that we might describe this browsing behaviour asoperating a camera: Panoramic view, zooming in, zooming out, filtering, jumping backetc. If the information nodes and links via hotspots have been defined from a didacticperspective however, we might expect that these perceptual transitions finally promotemental views which are more or less congruent those of the experts who preparedthem. The central discussion about hypermedia as learning resources is to what extentexplicit conceptual arguments should be added to the browsing space, before effectivelearning takes place. This discussion is both relevant for optimising hypermedia for thepre-cognitive stage of learning, and for the integration of hypermedia in morecontrolled instructional episodes as well.
Let's imagine the domain of combustive engines and see how visuals may facilitatecognitive stages in understanding, generalisation and problem solving. It's hard toimagine how difficult it would be to teach the typical characteristics of a diesel motorto someone who never saw, smelled and felt the movements of a running diesel engine.Not knowing the physical and mechanical principles of a combustive engine, one willstill derive quite important aspects of the combustive mechanism by seeing, hearing theeffects of such an engine built in a car, boat or train. Having observed the startingprocess of combustive engines gives already the notion that certain conditions must bemet before the process starts running. E.g. the effect of temperature, the speed of therotation and the degree of choking and giving throttle.
47 4 9
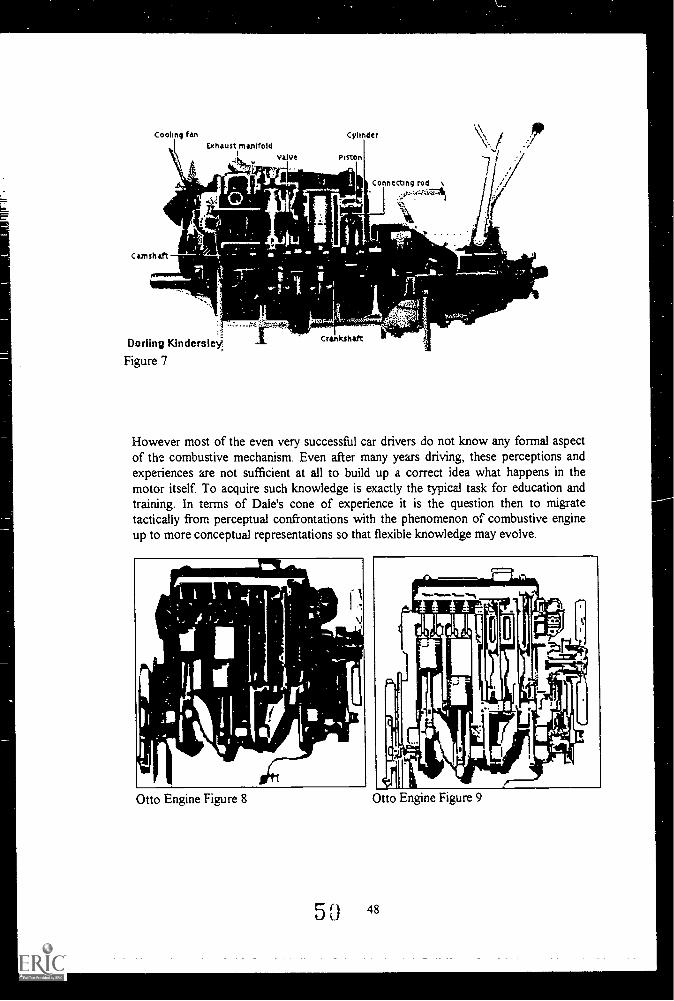
Cooling fanExhaust manifold
vaive
;
Dorling Kindersley1
Figure 7
However most of the even very successful car drivers do not know any formal aspectof the combustive mechanism. Even after many years driving, these perceptions andexperiences are not sufficient at all to build up a correct idea what happens in themotor itself. To acquire such knowledge is exactly the typical task for education andtraining. In terms of Dale's cone of experience it is the question then to migratetactically from perceptual confrontations with the phenomenon of combustive engineup to more conceptual representations so that flexible knowledge may evolve.
Otto Engine Figure 8 Otto Engine Figure 9
50 48
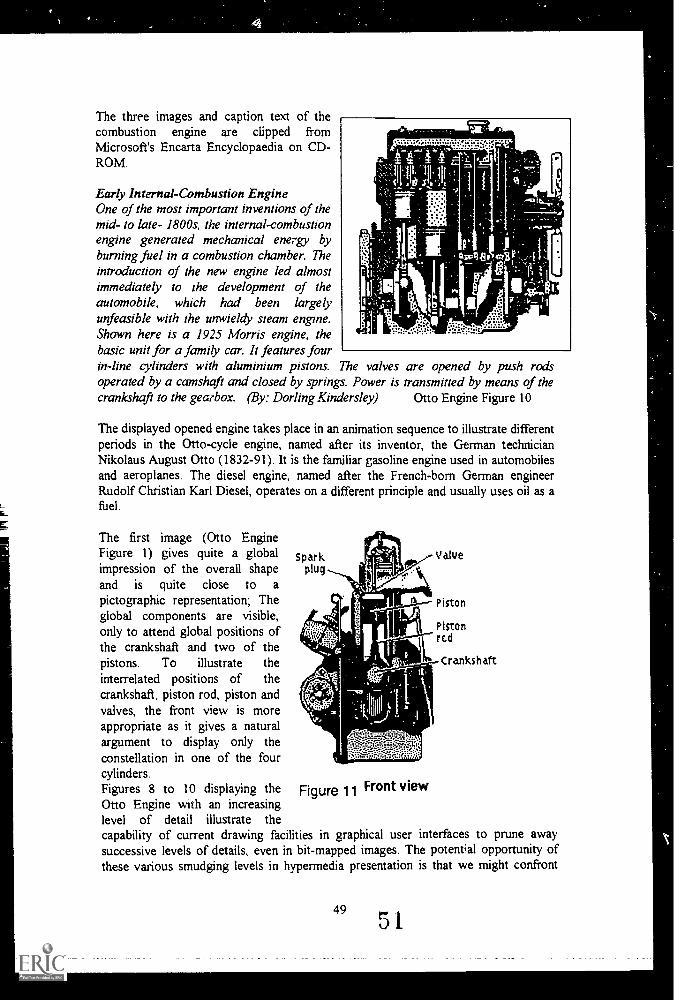
The three images and caption text of thecombustion engine are clipped fromMicrosoft's Encarta Encyclopaedia on CD-ROM.
Early Internal-Combustion EngineOne of the most important inventions of themid- to late- 1800s, the internal-combustionengine generated mechanical energy byburning fuel in a combustion chamber. Theintroduction of the new engine led almostimmediately to the development of theautomobile, which had been largelyunfeasible with the unwieldy steam engine.Shown here is a 1925 Morris engine, thebasic unit for a family car. It features fourin-line cylinders with aluminium pistons. The valves are opened by push rodsoperated by a camshaft and closed by springs. Power is transmitted by means of thecrankshaft to the gearbox. (By: Dorling Kindersley) Otto Engine Figure 10
The displayed opened engine takes place in an animation sequence to illustrate differentperiods in the Otto-cycle engine, named after its inventor, the German technicianNikolaus August Otto (1832-91). It is the familiar gasoline engine used in automobilesand aeroplanes. The diesel engine, named after the French-born German engineerRudolf Christian Karl Diesel, operates on a different principle and usually uses oil as afuel.
The first image (Otto EngineFigure 1) gives quite a global Spark valveimpression of the overall shape plug
and is quite close to apictographic representation; The Pistonglobal components are visible,
Pistononly to attend global positions ofr c d
the crankshaft and two of thepistons. To illustrate the Crankshaft
interrelated positions of thecrankshaft, piston rod, piston andvalves, the front view is moreappropriate as it gives a naturalargument to display only theconstellation in one of the fourcylinders.Figures 8 to 10 displaying theOtto Engine with an increasinglevel of detail illustrate thecapability of current drawing facilities in graphical user interfaces to prune awaysuccessive levels of details, even in bit-mapped images. The potential opportunity ofthese various smudging levels in hypermedia presentation is that we might confront
Figure 11 Front view
49
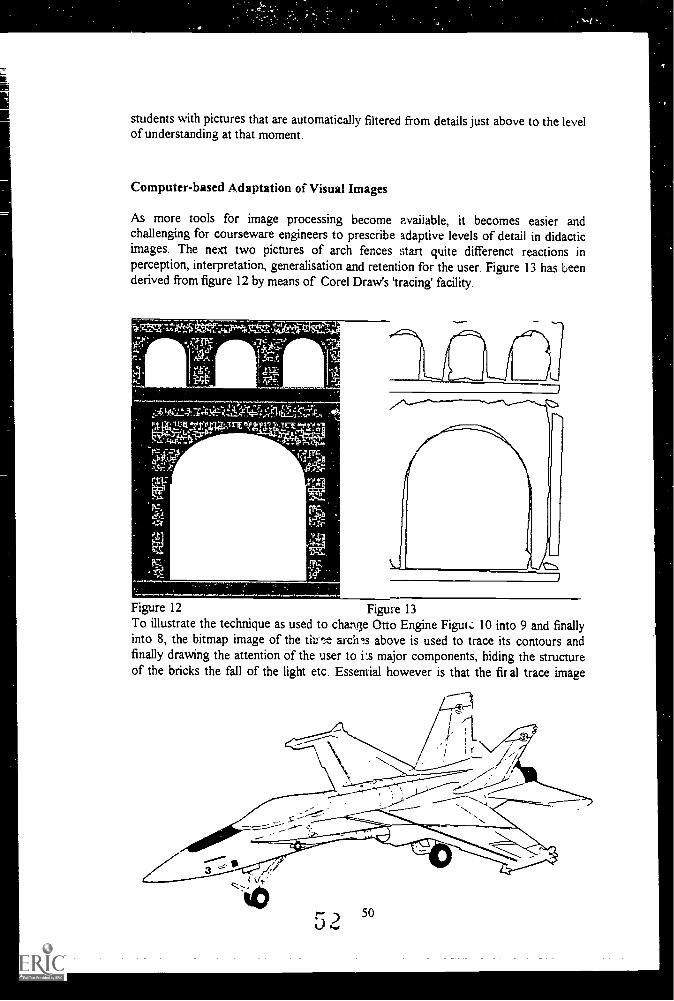
students with pictures that are automatically filtered from details just above to the levelof understanding at that moment
Computer-based Adaptation of Visual Images
As more tools for image processing become available, it becomes easier andchallenging for courseware engineers to prescribe adaptive levels of detail in didacticimages. The next two pictures of arch fences start quite differenct reactions inperception, interpretation, generalisation and retention for the user. Figure 13 has Leenderived from figure 12 by means of Corel Draw's 'tracing' facility.
Figure 12 Figure 13To illustrate the technique as used to change Otto Engine Figur,: 10 into 9 and finallyinto 8, the bitmap image of the tine archn above is used to trace its contours andfinally drawing the attention of the user to i s major components, hiding the structureof the bricks the fall of the light etc. Essential however is that the fir al trace image
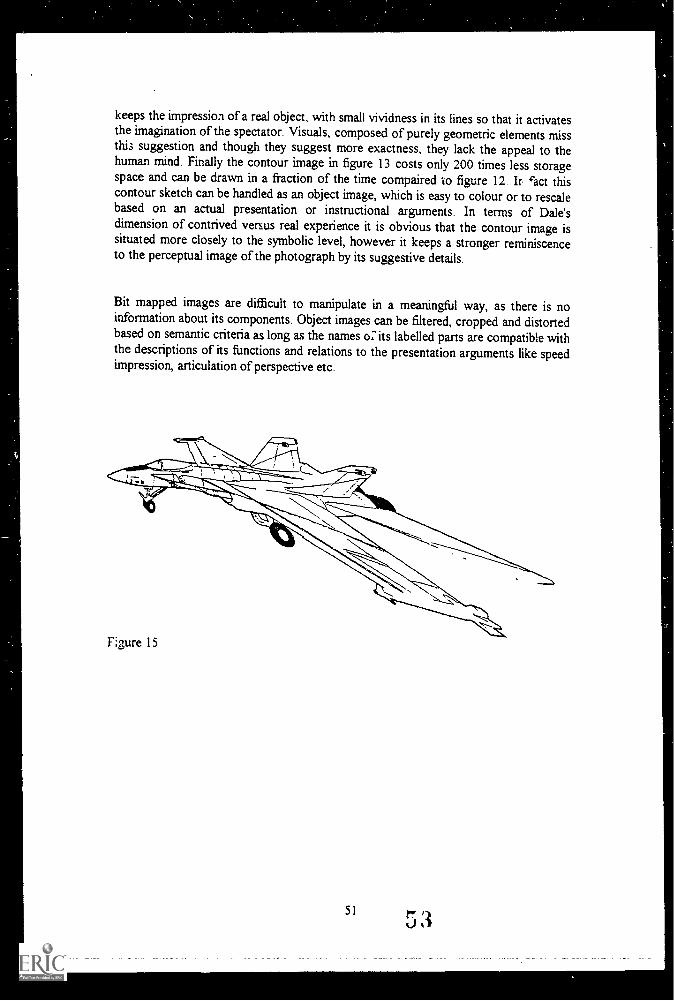
keeps the impression of a real object, with small vividness in its lines so that it activatesthe imagination of the spectator. Visuals, composed of purely geometric elements missthis suggestion and though they suggest more exactness, they lack the appeal to thehuman mind. Finally the contour image in figure 13 costs only 200 times less storagespace and can be drawn in a fraction of the time compaired to figure 12 Jr cact thiscontour sketch can be handled as an object image, which is easy to colour or to rescalebased on an actual presentation or instructional arguments. In terms of Dale'sdimension of contrived versus real experience it is obvious that the contour image issituated more closely to the symbolic level, however it keeps a stronger reminiscenceto the perceptual image of the photograph by its suggestive details.
Bit mapped images are difficult to manipulate in a meaningful way, as there is noinformation about its components. Object images can be filtered, cropped and distortedbased on semantic criteria as long as the names or its labelled parts are compatible withthe descriptions of its functions and relations to the presentation arguments like speedimpression, articulation of perspective etc.
F:gure 15
51
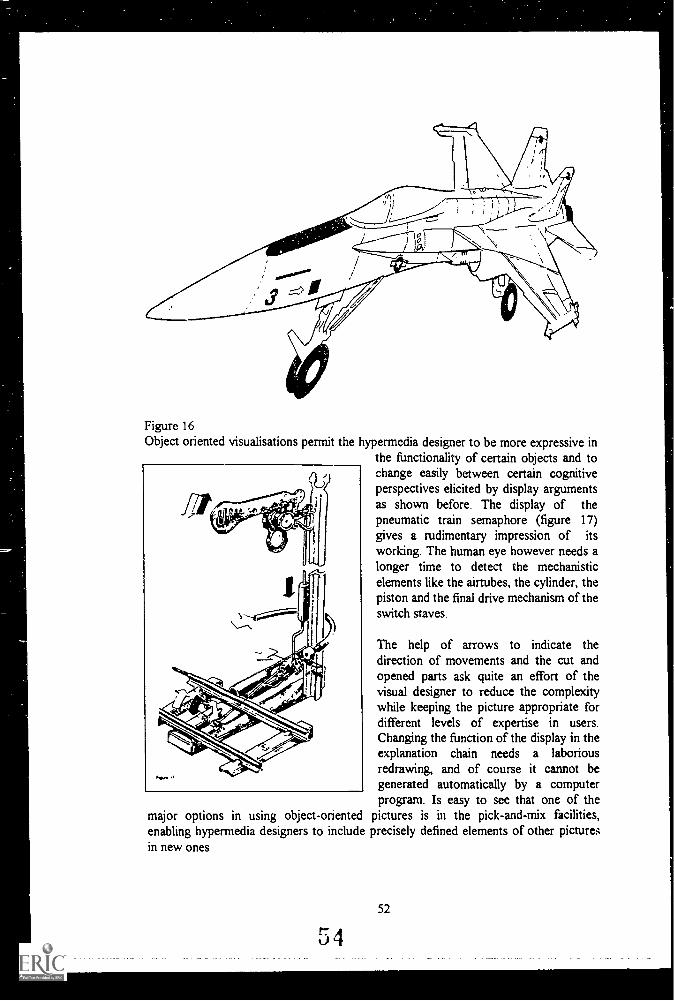
Figure 16Object oriented visualisations permit the hypermedia designer to be more expressive in
the functionality of certain objects and tochange easily between certain cognitiveperspectives elicited by display argumentsas shown before. The display of thepneumatic train semaphore (figure 17)gives a rudimentary impression of itsworking. The human eye however needs alonger time to detect the mechanisticelements like the airtubes, the cylinder, thepiston and the final drive mechanism of theswitch staves.
The help of arrows to indicate thedirection of movements and the cut andopened parts ask quite an effort of thevisual designer to reduce the complexitywhile keeping the picture appropriate fordifferent levels of expertise in users.Changing the function of the display in theexplanation chain needs a laboriousredrawing, and of course it cannot begenerated automatically by a computerprogram. Is easy to see that one of the
major options in using object-onented pictures is in the pick-and-mix facilities,enabling hypermedia designers to include precisely defined elements of other picturesin new ones
r 4
52
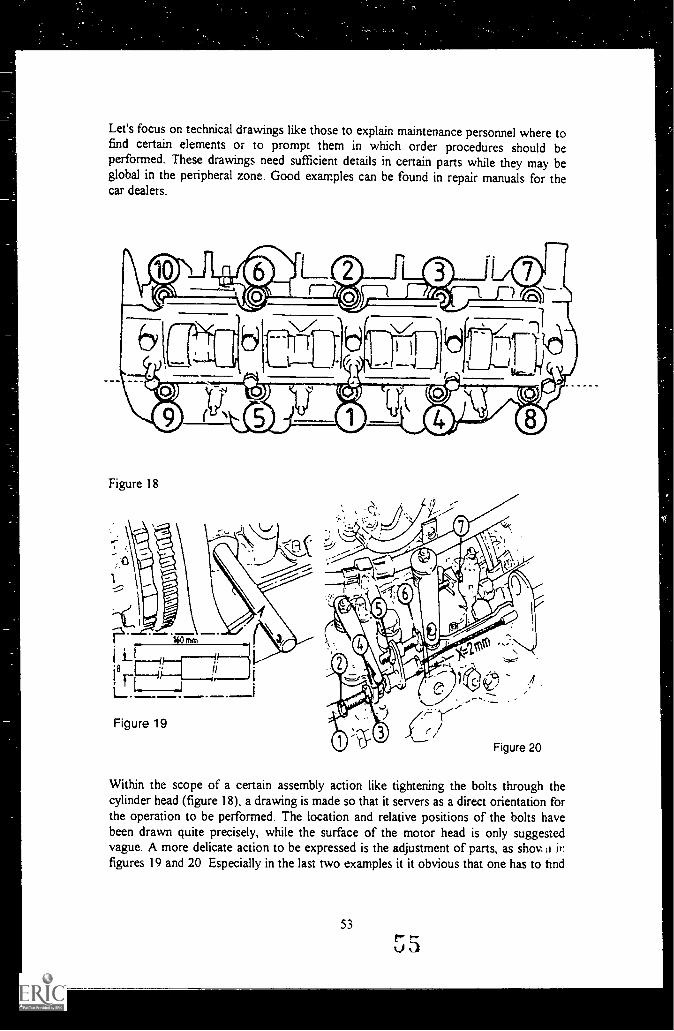
Let's focus on technical drawings like those to explain maintenance personnel where tofind certain elements or to prompt them in which order procedures should beperformed. These drawings need sufficient details in certain parts while they may beglobal in the peripheral zone. Good examples can be found in repair manuals for thecar dealers.
Figure 18
Figure 19
Within the scope of a certain assembly action like tightening the bolts through thecylinder head (figure 18), a drawing is made so that it servers as a direct orientation forthe operation to be performed. The location and relative positions of the bolts havebeen drawn quite precisely, while the surface of the motor head is only suggestedvague A more delicate action to be expressed is the adjustment of parts, as shovfigures 19 and 20 Especially in the last two examples it it obvious that one has to hnd
53
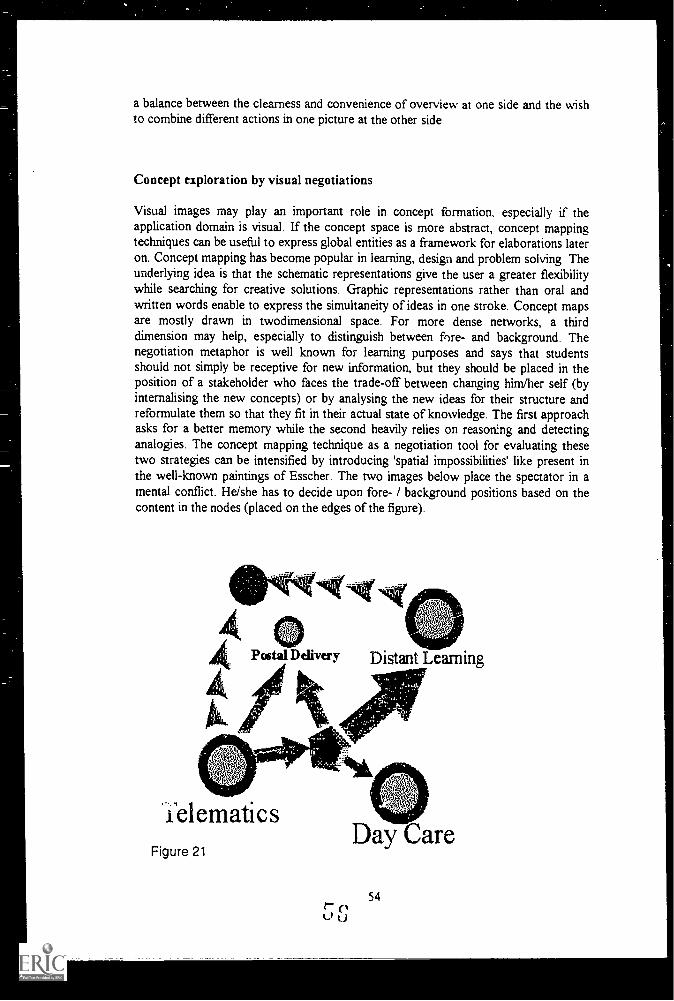
a balance between the clearness and convenience of overview at one side and the wishto combine different actions in one picture at the other side
Concept exploration by visual negotiations
Visual images may play an important role in concept formation, especially if theapplication domain is visual. If the concept space is more abstract, concept mappinetechniques can be useful to express global entities as a framework for elaborations lateron. Concept mapping has become popular in learning, design and problem solving Theunderlying idea is that the schematic representations give the user a greater flexibilitywhile searching for creative solutions. Graphic representations rather than oral andwritten words enable to express the simultaneity of ideas in one stroke. Concept mapsare mostly drawn in twodimensional space. For more dense networks, a thirddimension may help, especially to distinguish between fore- and background. Thenegotiation metaphor is well known for learning purposes and says that studentsshould not simply be receptive for new information, but they should be placed in theposition of a stakeholder who faces the trade-off between changing him/her self (byinternalising the new concepts) or by analysing the new ideas for their structure andreformulate them so that they fit in their actual state of knowledge. The first approachasks for a better memory while the second heavily relies on reasonng and detectinganalogies. The concept mapping technique as a negotiation tool for evaluating thesetwo strategies can be intensified by introducing 'spatial impossibilities' like present inthe well-known paintings of Esscher. The two images below place the spectator in amental conflict. He/she has to decide upon fore- / background positions based on thecontent in the nodes (placed on the edges of the figure).
Postal Delivery Distant Learning
felematicsFigure 21
Day Care
54
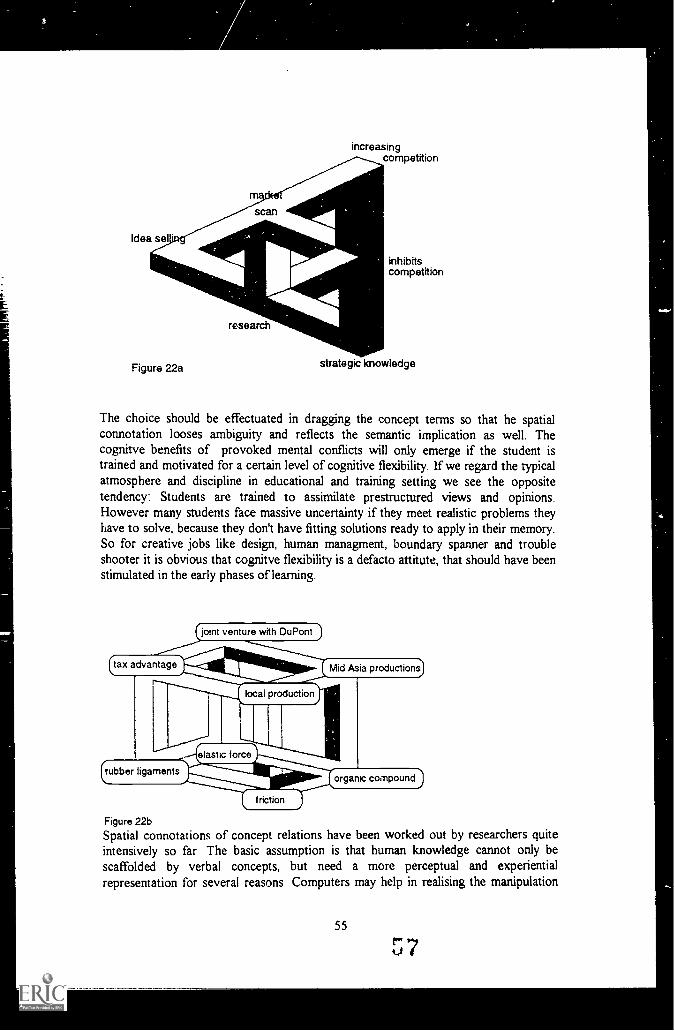
scan
increasingcompetition
inhibitscompetition
strategic knowledge
The choice should be effectuated in dragging the concept terms so that he spatialconnotation looses ambiguity and reflects the semantic implication as well. Thecognitve benefits of provoked mental conflicts will only emerge if the student istrained and motivated for a certain level of cognitive flexibility. If we regard the typicalatmosphere and discipline in educational and training setting we see the oppositetendency: Students are trained to assimilate prestructured views and opinions.However many students face massive uncertainty if they meet realistic problems theyhave to solve, because they don't have fitting solutions ready to apply in their memory.So for creative jobs like design, human managment, boundary spanner and troubleshooter it is obvious that cognitve flexibility is a defacto attitute, that should have beenstimulated in the early phases of learning.
Figure 22b
Spatial connotations of concept relations have been worked out by researchers quiteintensively so far The basic assumption is that human knowledge cannot only bescaffolded by verbal concepts, but need a more perceptual and experientialrepresentation for several reasons Computers may help in realising the manipulation
55 r
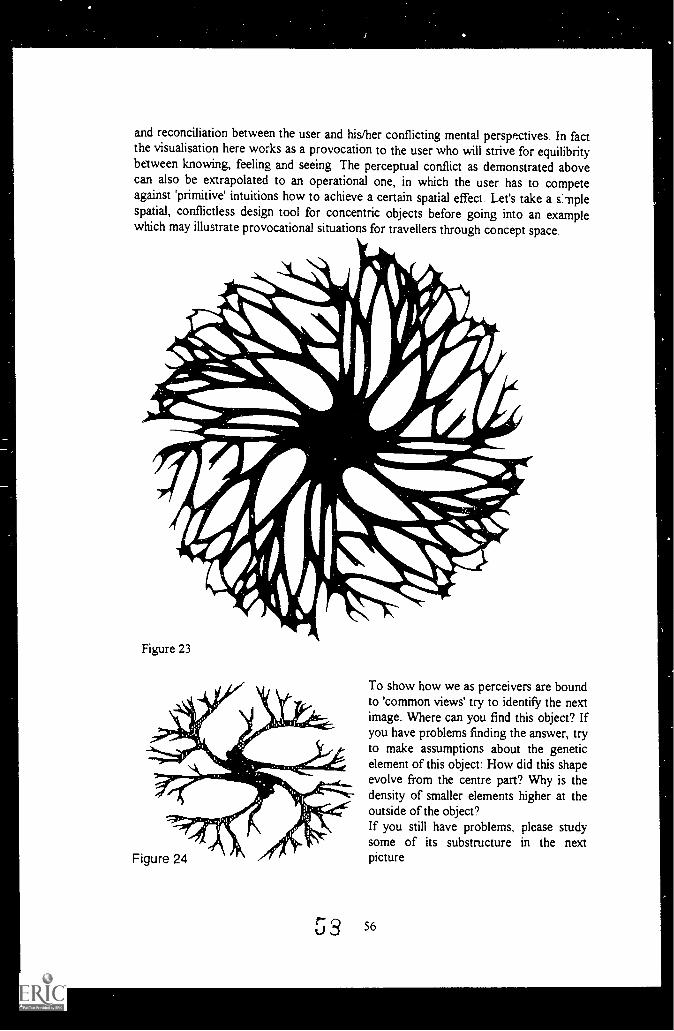
and reconciliation between the user and his/her conflicting mental perspF:ctives. In factthe visualisation here works as a provocation to the user who will strive for equilibritybetween knowing, feeling and seeing The perceptual conflict as demonstrated abovecan also be extrapolated to an operational one, in which the user has to competeagainst 'primitive intuitions how to achieve a certain spatial effect Let's take a s:mplespatial, conflictless design tool for concentric objects before going into an examplewhich may illustrate provocational situations for travellers through concept space.
Figure 23
To show how we as perceivers are boundto 'common views' try to identify the nextimage. Where can you find this object? Ifyou have problems finding the answer, tryto make assumptions about the geneticelement of this object: How did this shapeevolve from the centre part? Why is thedensity of smaller elements higher at theoutside of the object?If you still have problems, please studysome of its substructure in the nextpicture
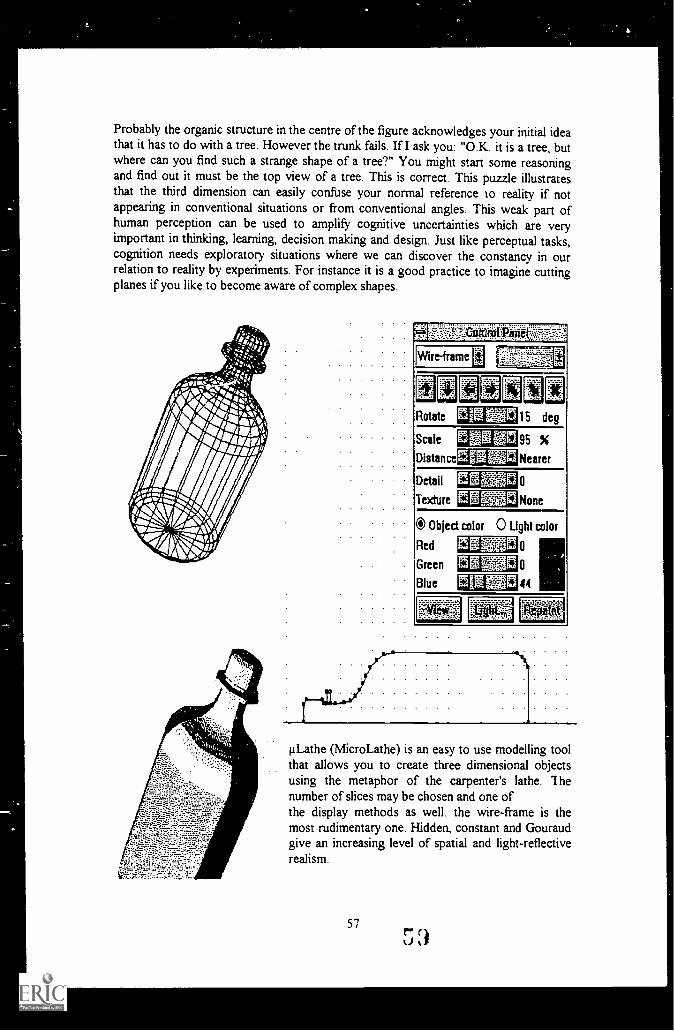
Probably the organic structure in the centre of the figure acknowledges your initial ideathat it has to do with a tree. However the trunk fails. If I ask you: "O.K. it is a tree, butwhere can you find such a strange shape of a tree?" You might start some reasoningand find out it must be the top view of a tree. This is correct. This puzzle illustratesthat the third dimension can easily confuse your normal reference to reality if notappearing in conventional situations or from conventional angles. This weak part ofhuman perception can be used to amplify cognitive uncertainties which are veryimportant in thinking, learning, decision making and design. Just like perceptual tasks,cognition needs exploratory situations where we can discover the constancy in ourrelation to reality by experiments. For instance it is a good practice to imagine cuttingplanes if you like to become aware of complex shapes.
,4-
Wire-frame
Rotate E MEP 15 deg
Scale EMEE0 95 %Distance EINEE5 Nearer
Detail ES"ri 0Texture 5W-2.0.: None
® Object color 0 Light color
Red EIRME3 0Green MIME 0Blue 5lig MI5 4 4z... ' it
gLathe (MicroLathe) is an easy to use modelling toolthat allows you to create three dimensional objectsusing the metaphor of the carpenter's lathe. I henumber of slices may be chosen and one ofthe display methods as well, the wire-frame is themost rudimentary one. Hidden, constant and Gouraudgive an increasing level of spatial and light-reflectiverealism.
57
5 3
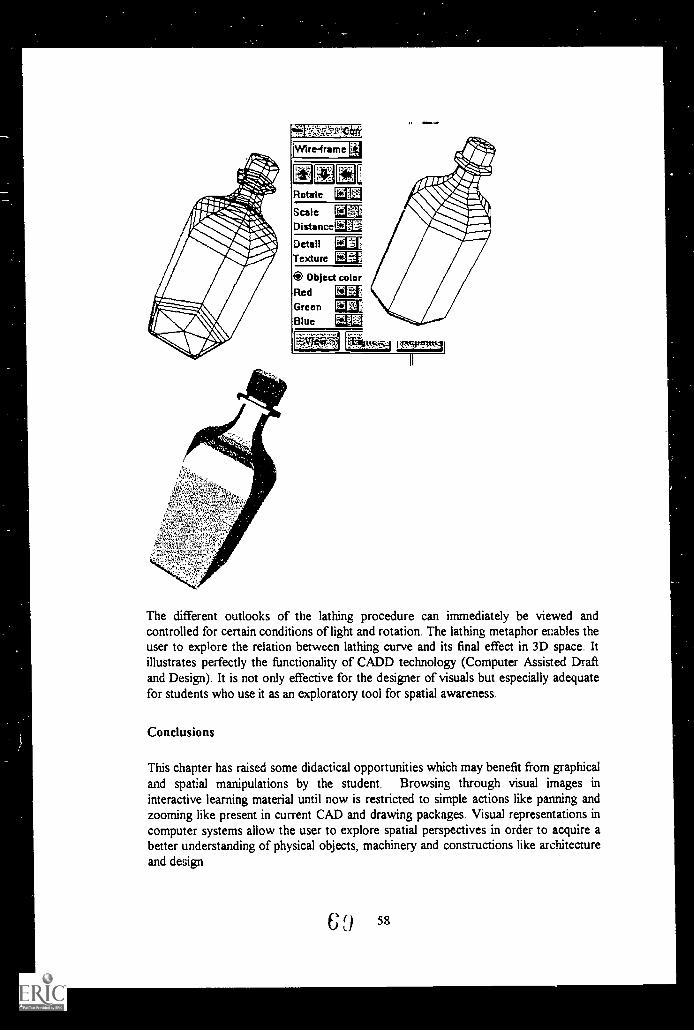
Wire-frame W
.ragERotate
Detail alTexture EU
Object colorRedGreenBlue
1:211Z. çmtt
The different outlooks of the lathing procedure can immediately be viewed andcontrolled for certain conditions of light and rotation. The lathing metaphor enables theuser to explore the relation between lathing curve and its final effect in 3D space. Itillustrates perfectly the functionality of CADD technology (Computer Assisted Draftand Design). It is not only effective for the designer of visuals but especially adequatefor students who use it as an exploratory tool for spatial awareness.
Conclusions
This chapter has raised some didactical opportunities which may benefit from graphicaland spatial manipulations by the student. Browsing through visual images ininteractive learning material until now is restricted to simple actions like panning andzooming like present in current CAD and drawing packages. Visual representations incomputer systems allow the user to explore spatial perspectives in order to acquire abetter understanding of physical objects, machinery and constructions like architectureand design
58
Before flexible and meaningful visual transformations become possible it is importantthat pictures are vectorized along at least three dimensions The fourth dimension (timeaxis) becomes important if it concerns an animated process, like important inexplaining the four strokes of a combustive engine.Adding semantic relations between the components in a visualized constellation like anengine, electronic device, or an organic body can will even allow the student to exploreits functionality as he/she changes the position, the size or even the shape of elements,after which the consequences in functionality will be displayed, like e.g. thetemperature, current, concentration, speed, friction etc.The ultimate benefit from interactive visuals might even go beyond the spatial andmechanistic orientation. The given examples of 'impossible figures' as carriers forconcept maps sizow that spatial conflicts in pictures can be used to elicit pre cognitiveideas and hypotheses from the student at the beginning of learning sessions in order toprovoke an optimal receptive mind for new ideas. Crucial issue in visualisation forlearning purposes is the possibility to manipulate, change, combine by the student whilethe consequences can be seen immediately from the same picture.
References
Balajthy, Ernest: Hypertext, Hyperrnedia, and Metacognition: Research andInstructional Implications for Disabled Readers. In: Journal of Reading,Writing, and Learning Disabilities International, v6 n2, p183-202 Apr-Jun1990
Cates, Ward Mitchell: Considerations in Evaluating Metacognition in InteractiveHypermedia/Multimedia Instruction. 20 Apr 1992.
Craik, F.I.M., & Lockhart, R.S.: Levels of Processing: Framework for MemoryResearch Journal of Verbal Learning and Verbal Behaviour. 1972, 11, 671-684
Dale, E. Audio-Visual Methods in Teaching. Rinehart and Winston, New York, 1946.
Foucault, M: Les Mots et les Choses. Paris, Gallimard, 1966.
Hoban, C.F. & Zissman, S.B Visualizing the Curriculum. Dryden, New York, 1937.
Jenkins, J.J., Can we have a Theory of Meaningful Memory" In R.L. Solso (ed.),Theories in cognitive Psychology: The Loyola Symposium. Hillsdale N.J..Lawrence Erlbaum Associates, 1974.
Microsoft Corporation "Internal-Combustion Engine" Microsoft (R) EncartaCopyright (c) 1993 Microsoft Corporation. Copyright (c) 1993 Funk &Wagnall's Corporation
CIL59
Functions and Design of Video Components in Multi-Media Applications: a Review
Pion W. Verhagen
Introduction
Dcsigners of interactive multi-media applications face the decision when and how to bepresented information has to take the form of text, graphics, animation, video stills,moving video, sound, or any combination of the former. This contribution focusses ondesign decisions with respect to the use of live or animated video segments with orwithout sound. First, functions and utilization patterns of video as a component ofmultimedia systems are presented. Next, research on audiovisual design is reviewed withrespect to camera factors, audio factors, optical effect and special effects, pacing andrhythm, animation, picture complexity, and using two channels (visual and audio).
Video functions
Video functions may be classified according to content-driven or logistic criteria whichmay both be used to support decisions to select video as a component of an instructionalapplication. Figure 1 provides a list that is based on Verhagen (1992, 1993). Thefunctions are:
Content-related use of photographic pictures or moving video (showing people andobjects). This function concerns the message-specific need for a certain mode ofpresentation (if I require a visual, audio will not do; and if I have to show motion,video has to be preferred over still pictures). In certain fields, such as medicin, biology,and geography, there are many content elements for which it is self-evident that theyneed these kinds of visuals. It has to be noted, however, that in many cases messagecharacteristics are not unequivocally prescriptive with respect to communication mode.Visual referents in memory may for instance inhibit the need for pictures, if theysufficiently support mental imagery in the context of verbal messages. Figure 1 showsthat content relatedness plays a role in several of the other listed video functions.
Depicting the invisible or the non-accessible. This concerns presentation options thatcannot exist without certain media techniques. Examples are: slow motion, time- lapsephotography, photography with invisible beams (like Röntgen or infrared photography),use of telescopes and microscopes, and animation. Here the "human size" with respectto perception in space and time is an important factor. Some experiences cannothappen if events could not be speeded up, slowed down, scaled up or scaled down tomanageable proportions by use of media.
Logistic use. Straightforward applications concern uses of media to solve problems ofplace. time, and identical repetition of messages. (In most cases, it is more feasible toshow a slide of the Vesuvius than to visit this volcano). And, substantial effort to
6 I
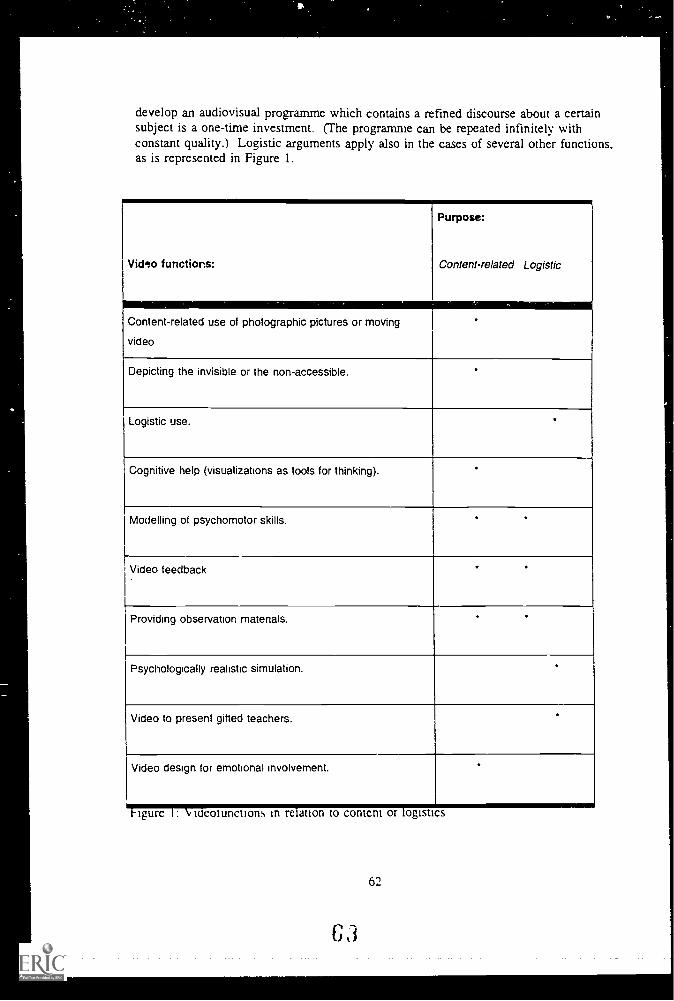
develop an audiovisual programme which contains a refined discourse about a cenainsubject is a one-time investment. (The programme can be repeated infinitely withconstant quality.) Logistic arguments apply also in the cases of several other functions,as is represented in Figure 1.
Video functions:
Purpose:
Content-related Logistic
Content-related use of photographic pictures or moving
video
'
Depicting the invisible or the non-accessible. '
Logistic use.
Cognitive help (visualizations as tools for thinking).
Modelling of psychomotor skills.
Video feedback '
Providing observation matenals. -
Psychologically realistic simulation. .
Video to present gifted teachers. .
Video design for emotional involvement.
igure : v ideolunctions in re anon to content or logistics
63
62
Cognitive help (visualizations as tools for thinking). Visualizations may offer newperspectives on knowledge or extend existing knowledge in the way that Bohr's AtomModel shaped thinking about how an atom is conceived. Bohr's model provided a wayfor insightful communication about the elementary decomposition of matter: a messagefor which visual media characteristics could be exploited succesfully. Similar reasoningapplies, for instance, to the insightful animations (with narration) that demonstrate theessence of the Lorenz transformation o7 Einstein's Special Theory of Relativity. Ingeneral, schematizing is the keyword here.
Modelling of psychomotor skills. Video is in many cases an appropriate means todemonstrate motor behavior.
Video feedback. Video may be used to record student behaviour for feedback purposes.This may support the evaluation of psychomotor performances, feedback duringmicroteaching sessions or interview training, and other.
Providing observation materials. Video registrations (of group discussions, of childrenplaying, of animal behaviour, etc.) may provide opportunities to train observation skillsand to learn to analyse behavioural patterns.
Psychologically realistic simulation. Social interaction may be simulated by havinghuman models on -- for instance -- videodisc who react to decisions of students bytalking directly to the students from the video screen. Well-known examples are video-based management games.
Video to present gifted teachers In fact a variant of logistic use, this video functionprovides the possibility to repeatedly enjoy the presentation of outstanding teachers whodemonstrate their skill in handling subject matter.
Video design for emotional involvement. In this case, aesthetic value, emotional value,and use of drama are at stake. Factors regarding pleasure, goodness, beauty, interest,and complexity can be identified as components of aesthetic value. These factors playa role in determining the attention of learners and their perception of the relevance of alearning task which is a component of their motivation. The depicted objects may haveemotional qualities of their own. Wounded victims of war or hungry people of Africamay evoke emotional responses that may have an impact for certain types of learning.Responses of anger, joy, curiousity, desire for justice, and othe:, may also be stimulatedby appropriate use of drama. The filmic form of video offers excellent opportunities toexploit these possibilities. Recorded material has thereby the advantage of the carefullyplanned impact that results from skillful design and production.
Basic approaches for utilization
The above-mentioned video functions represent one set of variables to consider whendesigning practical application. Next to this. several basic utilization patterns may guidethe designers:
63
Gel
Text primacy (symbolic first). Here, the basic question is: "Can printed material (textand pictures) do the job?" This starting point leads in many cases to cost-effectivesolutions. In cases where moving video is indispensible, this approach may bemaintained by using barcode-controlled videodiscs as an adjunct to the written material.The approach is feasible for good readers with sufficient learning skills concerning thesubject matter involved.
Visualization as starting point (iconic first). Here, the basic question is: "Can we showwhat we mean?" This starting point leads in many cases to a look-and-tell format onthe basis of video presentations. It results in concrete presentations that may very wellsuit rather concrete subject matter (or it may enlighten abstract subject matter byvisualization). It is feasible for group instruction as well as for individual study, mayhelp poor readers, and may involve students that are not very motivated to read.
Between-channel redundancy as reinforcement strategy. Using two sensory channelsincreases the likelihood that messages arrive. This phenomenon may be used bydeveloping educational materials in such a way that sight and sound are simultaneouslyused to present semantically overlapping information. The simplest (and mostredundant) form is that a voice presents texts that can be read from paper or from acomputer screen at the same time. Striving for semantically overlapping informationleads often to audiovisual presentations in which schematizing is frequently used tosupport abstract subject matter with appropriate images. Between-channel redundancyas reinforcement strategy is appropriate for complex subject matter and/or poor learnersas long as the total amount of information does not exceed the information processingcapacities of the learners.
Orchestration for learning (theater of life). This concerns the use of the video functionfor emotional involvement. Creative communication solutions may attract and maintainattention, establishing learning situations that are entertaining, challenging, or have anemotional impact for other reasons. This technique is appropriate if motivation to learnis considered a problem, for instance in distant learning situations where the delivery ofinstruction takes place by means of television and has to compete with other televisionchannels.
Audiovisual archive as a starting point (providing a computerized informationenvironment). In this case the database capabilities of multimedia are exploited. Thismay be done for the purpose of knowledge acquisition in an eductional setting, wherepersonal development is paramount. Free navigation through the information space ishere the starting point albeit that the space available may be limited for didacticalreasons to prevent novice learners from being overwhelmed by the difficulty level ofencountered information or from getting lost in the possibly vast amount of informationcontained in the system. In all cases. adequate help functions should be available. Forexperienced users, playing around in the information environment offers ways to extentand deepen knowledge by enriching existing schemata with new facts or newcombinations of facts.
64
(3 5
An other application concerns problem solving on an individual basis with the multi-media system as the main source of information. In that case two more options arethere: (a) the problem-solving activity is guided by the system (it is incorporated into adetailed planned teachin g method), or (b) the system is an open informationenvironment in which the user has to find his or her own way. The level of support bythe system may be adjusted to the needs of the user, either automatically (with an on-line help system that detects ineffective conduct of the user), or on request (when theuser decides to switch from the browse mode to "challange me", "teach me", or"question me"). Applications may further take the form of interactive encyclopedia,interactive maintenance manuals, etc.
Interactivity as the starting point. This is the case when learning outcomes are desiredfor which it is considered to be necessary that practice, testing, and feedback areorganized in interaction with the computer system. The main instruction functions are:orienting on the learning task (presenting subject matter, presenting content-specificways of thinking, presenting new methods and techniques to operate on the subjectmatter, demonstrating working methods and problem-solving approaches), practice(providing opportunities to practice, providing feedback), testing and general feedback.For the organization of multimedia applications to serve these instruction functions,common computer-based instruction formats may be used, such as drill-and-practice,tutorial, and simulation, extended with the presentation richness of multimedia.
The video functions and the basic utilization patterns are not independent of each other.Figure 2 shows how the different functions relate.
65
CG
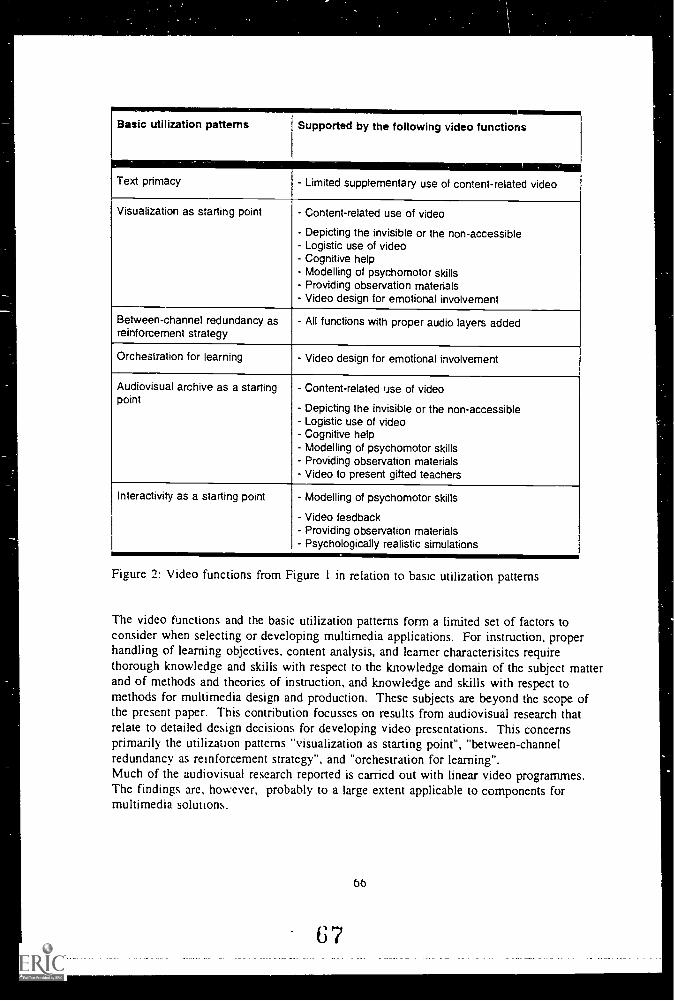
Basic utilization patterns Supported by the following video functions
Text primacy - Limited supplementary use of content-related video
Visualization as starting point - Content-related use of video
- Depicting the invisible or the non-accessibleLogistic use of videoCognitive help
- Modelling of psychomotor skills- Providing observation materials- Video design for emotional involvement
Between-channel redundancy asreinforcement strategy
- All functions with proper audio layers added
Orchestration for learning - Video design for emotional involvement
Audiovisual archive as a startingpoint
Content-related use of video
- Depicting the invisible or the non-accessibleLogistic use of videoCognitive help
- Modelling of psychomotor skills- Providing observation materials- Video to present gifted teachers
Interactivity as a starting point - Modelling of psychomotor skills
Video feedback- Providing observation materials- Psychologically realistic simulations
Figure 2: Video functions from Figure 1 in relation to basic utilization patterns
The video functions and the basic utilization patterns form a limited set of factors toconsider when selecting or developing multimedia applications. For instruction, properhandling of learning objectives, content analysis, and learner characterisitcs requirethorough knowledge and skills with respect to the knowledge domain of the subject matterand of methods and theories of instruction, and knowledge and skills with respect tomethods for multimedia design and production. These subjects are beyond the scope ofthe present paper. This contribution focusses on results from audiovisual research thatrelate to detailed design decisions for developing video presentations. This concernsprimarily the utilization patterns "visualization as starting point'', "between-channelredundancy as reinforcement strategy", and "orchestration for learning".Much of the audiovisual research reported is carried out with linear video programmes.The findings are, however, probably to a large extent applicable to components formultimedia solutions.
(3 7
66
/
Results of audiovisual research on presentation variables
Presentation variables are actually production variables that obtain their values during theproduction of video material. Below the following variables are discussed (derived from alist by Coldevin, 1981, p. 87):(a)camera factors (angle & shot);(b)setting;(c)audio factors;'(d)special effects;(e)pacing and rhythm.In addition, a brief passage is devoted to animation. The variables are listed in Figure 3in which they are positioned relative to the production phase in which the pertinent designdecisions are taken.
Camera FactorsAs far as research is concerned, the effects of camera factors on learning seem to belimited and results are often conflicting. Dwyer (1978, p. 168), for instance, refers toRoshal (1949) and McCoy (1955) to conclude that it is advisable to show a performanceon the screen the way the learner would see it if he were doing the job himself. Coldevin(1981, p. 88), however, describes an experiment by Grant and Merrill (1963) that showsfor relatively complex skills (and perhaps for most task-oriented productions) that theviewing angle of the demonstrator should not be used rather than the perspective of thestudent viewer who is watching the demonstration.
Research by Salomon (1974) seemed to show that certain camera factors -- such aszooming in -- can positively supplant visual information that young viewers must fill induring cuts between shots. It has, however, been shown that this supplanting effect can bedemonstrated by other means (Bovy, 1983).
This effect is consistent with the fact that different authors often present different solutionsto serve certain communication function by camera factors. Zooming-in for instance, isclassified by Morrison (1979, p. 29) as a device for: focusing attention, relating parts to awhole, emphasizing one aspect, and showing spatial relationships. All these function canbe accomplished by other means. Morrison himself says that the cut can be used to (re-)focus attention and to relate parts to the whole.
But there seems no reason to exclude the use of cuts for emphasizing and for showingspatial relationships. Moreover, for all these functions, the superimposition of opticalmarkers can also be used (such as arrows, animation, encircling; see for instance Dwyer,1978, p. 160). Lumsdaine and Sulzer (1951) had earlier shown the effectiveness ofdevices of this kind for directing perception in films. Boeckmann, Nessmann, an"!Peterrnandl (1988) confirmed this effect as part of an experiment in which subjects had towatch a video programme with the task to notice objects and procedures that are forbiddenin a professional kitchen for hygienic reasons. In the experimental version of theprogramme, three things were made to stand out in a long shot by means of
67
63
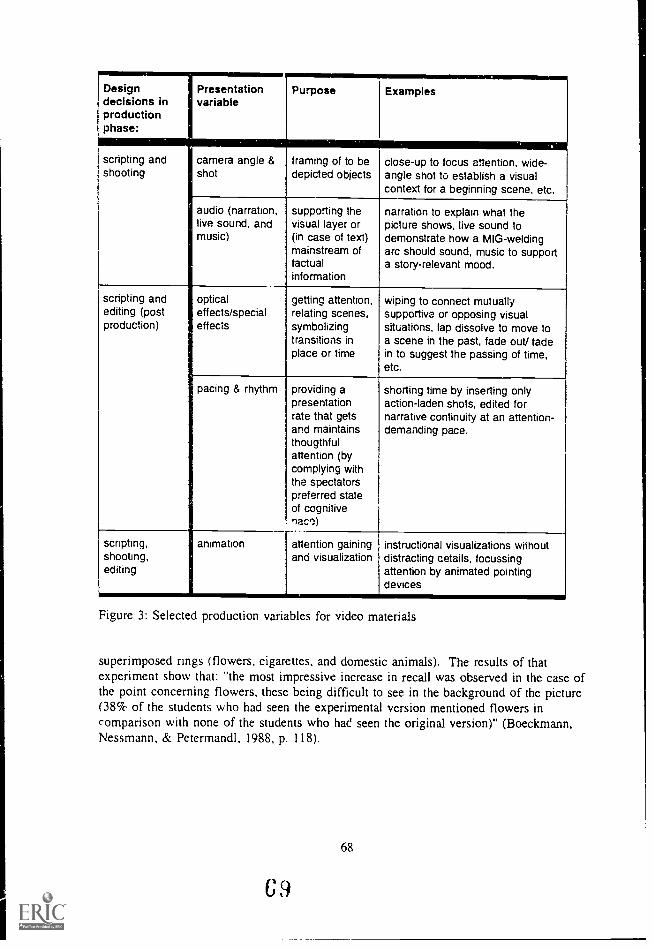
Design Presentationdecisions in variableproductionphase:
Purpose Examples
scripting and camera angle &shooting shot
framing of to bedepicted objects
close-up to focus attention, wide-angle shot to establish a visualcontext for a beginning scene, etc.
audio (narration,live sound, andmusic)
supporting thevisual layer or(in case of text)mainstream offactualinformation
narration to explain what thepicture shows, live sound todemonstrate how a MIG-weldingarc should sound, music to supporta story-relevant mood.
scripting andediting (postproduction)
opticaleffects/specialeffects
getting attention,relating scenes,symbolizingtransitions inplace or time
wiping to connect mutuallysupportive or opposing visualsituations, lap dissolve to move toa scene in the past, fade out/ fadein to suggest the passing of time,etc.
pacing & rhythm providing apresentationrate that getsand maintainsthougthfulattention (bycomplying withthe spectatorspreferred stateof cognitivenaco)
scripting,shooting,editing
animation
shorting time by inserting onlyaction-laden shots, edited fornarrative continuity at an attention-demanding pace.
attention gainingand visualization
instructional visualizations withoutdistracting cetails, focussingattention by animated pointingdevices
Figure 3: Selected production variables for video materials
superimposed rings (flowers, cigarettes, and domestic animals). The results of thatexperiment show that: "the most impressive increase in recall was observed in the case ofthe point concerning flowers, these being difficult to see in the background of the picture(38% of the students who had seen the experimental version mentioned flowers incomparison with none of the students who had seen the original version)" (Boeckmann,Nessmann, & Petermandl, 1988, p. 118).
69
68
This supports the notion that camera factors do not have definite meanings that can beused as invariable building blocks in message design. Just like the ideas about editing thatare put forward by Reisz and Millar (1981), the use of camera factors should be guided bythe nature and order of the message components that are to be conveyed. Studying theeffects of single shots seems not to be very useful in that respect. It is more thatsequences of shots should establish adequate patterns to cover the scenes to be depicted.This is exactly what media handbooks offer to support the development of solutions forparticular design problems. Arijon (1976) for instance presents hundreds of modelsolutions for a wide range of camera problems, varying from staging straightforward two-person dialogues to staging complicated mass scenes or finding solutions in confined areassuch as the interior of an aeroplane. It seems thus warranted to approach the treatment ofthe camera from the perspective of staging a message as a coherent series of shots.Consistent authorship may thereby lead to a style that establishes clarity and appeals theaudience. The following research results are consistent with this view:Low angle shots can increase the perceived potency .` a presenter, but the framing ofthese shots in the narrative structure has then to support this intention (Coldevin, 1981, p.88).In video programmes, interest levels can be increased with medium close-um or withclose-up shots (p. 88). Boeckmann, Nessmann, and Petermandl (1988, p. 110), however,concluded on the basis of their research that recall was not related to type cf shot (close-ups, long shots, or intermediate shots).
These results illustrate that the function of shot type is dependent on the circumstancesunder which it is used. The camera treatment has thus to be regarded as a flexiblecomponent of audiovisual message design, whereby research-based rules to predict goodresults are weak or absent. Good results are dependent on the professionalism ofresponsible team members in a media project. Rules from practice such as can be foundin media handbooks are useful to support design decisions (see, for instance, Arijon, 1976,or Millerson, 1985).
Audio factorsAudio factors are narration or dialogue (in the case of speaking characters), effects (the'natural' sounds of the setting that is depicted on the screen (effects may be recorded liveor be produced artificially), and music.For instruction, off-screen commentary is often used. According to Dwyer (1978, p. 169),the number of words per minute of film in the commentary has a definite effect onlearning. He refers to Zuckermann (1949a) and Jaspen (1950a, 1950b) to conclude thatcare should be taken not to "pack" the sound track. Schmidt (1974, p. 332) found in hisanalysis of the design of 20 outstanding instructional films that the majority of these filmshad an average narration rate of 140 or fewer words per minute. Dwyer (1978) advisesthat:
"Too much or too little talking in words per minute of film has been found to detract from theteaching effectiveness of a film. The optimum word rate is about 100 words for each minute offilm." (p. 172.)
The normal rate of speech ranges from 150 to 200 words per minute (Rossiter, 1971).This leads to a rule of thumb that it is a normal value for narration to take about two-thirds of the total presentation time of an instructional film.
69
7 0
Schmidt (1974, p. 332) also found that the majority of the outstanding instructional filmshe analysed: (a) did not use a style of narration that talked down or lectured to theaudience; (b) did simplify the message as much as possible; and (c) used the active formof sentence structure. That 'simplification of the message' was a factor most probablyrelated to the fact that the analysed films were not designed for specific audiences. Still,the message of Schmidt's observations is that narration should take the audience seriously,present in a clear, concise, and unambigious way, and talk directly to the audience if thesubject allows it.
About the other factors effects and music -- research results are very limited. Flemingand Levie derived one principle with respect to concept learning; that if a concept isbasically temporal -- such as rhythm or time or sequence or frequency, or like poetry ormusic or speech -- then audition is appropriate (Fleming & Levie, 1978, p. 48). Researchabout sound effects was not mentioned further by the authors reviewed. The informationaland emotional nature of this kind of sound seems to be considered as self-evident.Research about music in instructional audiovisual programmes is scarce. When Coldevin(1981) prepared his review, he could refer to only one study (by Baggaley, Ferguson &Brooks, 1980). In that study different types of music for opening or closing a programmewere subject to experimentation with unconclusive results due to methodological problems(Coldevin, 1981, p. 89). With respect to music, Jaspers (1991a) reinforced the conclusionsmade by Zuckermann (1949b) that music has informational, emotional, andconceptual/integrative functions. Leit-motivs and other musical effects may help tostructure a presentation and inform the listeners about what is going to happen. Tempo,modality, and rhythm may be used to evoke emotional responses. According to Jaspers,proper use of music may support instructional messages but -- unless the topic is aboutmusic -- there is no need to use it "when the purpose is transmission of referentialinformation and cognitive information processing" (Jaspers, 1991a, p. 50). Music may,however, facilitate learning by giving students occasions for identifications and empathy.However, as Jaspers puts it: "well-chosen music does not guarantee to create the supposedeffect, but it is highly probable that ill-chosen music will do much harm to the learningprocess" (Jaspers, 1991a, p. 50).
Given the limited results from research, the main conclusion has to be that the treatmentof sound effects and music has to lean on rules from practice. Inst 'ring ideas can, forinstance, be found in Millerson (1985, p. 353-362).
Optical effects/special effectsThe review by Dwyer t1978) as well as more recent research by Boeckmann, Nessmann,and Petermandl (1988) show that optical effects such as fades, wipes, and dissolves do notincrease the instructional effectivity of films or video programmes compared to straightcuts to connect subsequent shots. Ginsburg, Bartels, Kleingunther, and Droege (1988)found that with special effects, the situation may even be worse. They carried outexperiments with a programme that contained highly abstract visual effects and found thatthese effects diminish recall. Most probably, the observation of Boeckmann, Nessmarm,and Petermandl (1988) applies that formal elements -- such as a fades or wipes -- that donot relate to the programme content have no influence on recall (which according toGinsburg et. al. may even be negative in the case of special effects). Boeckmann et. al.demonstrated that formal elements that played an explicit role to define a message provedto influence recall. The conclusion seems to be that deliberate content-related use of
70
71
4,
optical effects or special effects can be feasible, depending on their functionality thataffects the quality of a message. As with the use of the other presentation variables, themessage design has to be content driven. This is, however, not to deny that forminfluences content. The eventual meaning of a message is determined by the combinationof the depicted and the manner of depiction. It may be stressed that for instructionalpurposes, form and content should be balanced with the intention to reinforce thesubstance of the instructional message.
Pacing & rhythmA question is, in what way does the pace of presentation in films or video programmeshave to be controlled to account for cognitive pace (the rate of mental processing ofincoming data)? One principle is that: "the rate of development of a film should be slowenough to permit learners to grasp the material as it is shown (Jaspen, 1950a; Ash &laspen, 1953)" (Dwyer, 1978, p. 168).
According to Dwyer this means that the rate must be slow rather than fast. Theoutstanding instructional films that were analysed by Schmidt (1974):
"... had a rate of development that was slow enough for the viewer to grasp the material as itwas shown" (p. 332). "... had a slowing of the rate of development at points at which it isnecessary for the viewer to change attention from one source of information to another" (p.332). "... had an average shot length of about 10 seconds" (p. 334).
The 10 seconds are of the order of magnitude of the time that Simon (1974) has putforward as the time it takes to fix a chunk of information in long-term memory. Thesame 10 seconds seem also to be candidate for a characteristic parameter in a study byLeahy (1983). Leahy studied the relationship between visual realism and informationprocessing time in viewing projected visuals. His results, with respect to manipulatingprojection time to promote more efficient visual comprehension, did not yield clear advice.He got, however, the impression that the fact that he did find significant differencesbetween projection times of 5 and 10 seconds and between 5 and 15 seconds, but notbetween 10 and 15 seconds, that after 10 seconds a ceiling affect might have occurred.Whether this means in general that a mean cutting rate of six shots per minute yields anadequate pace of an instructional film can, however, not be concluded.Coldevin (1981) referred to a study by Schlater (1970) that showed that cutting rate shouldnot be too slow:
"Schlater (1970) produced five videotapes in which the visual changed ranged from oneevery 30 seconds in the first treatment to nine per 30-second interval in treatment five.Three types of learning tests were administered: pictorial video (visual sketches), verbalvideo (verbal descriptions of pictorial information) and audio channel information.Testing results showed that verbal video comprehension increased directly with theincrease in the rate of visual changes (levelling off at seven visuals per 30-secondinterval), but the opposite effect was noted in pictorial video recall. As might beexpected, no significant differences were found between the treatments on recall ofaudio channel information." (Coldevin, 1981, p. 91)
It thus seems that under most circumstances a cutting rate that corresponds with a meanshot length of about 4.5 seconds may be feasable.A further study by Vincent, Ash, and Greenhill (1949) studied the relationship of lengthand fact frequency to effectiveness of instructional films. "Fact frequency" may therebybe conceived as a factor that is directly related to the cognitive pace mentioned earlier.The procedure in the study was as follows:
71
"Four experimental film versions dealing with the causes and manifestations of the weather weremade up from a senes of Navy training films on aerology. The Long Heavy version ran 29minutes and contained 224 facts: the Long Light version also ran 29 minutes but contained 112facts. The Short Heavy version ran 14 minutes and contained 112 facts: the Short Light versionran 14 minutes but contained 56 facts. The total number of words in each pair of equal lengthkept constant by the use of repetitions, prefatory statements, and other 'filler' material which didnot add new facts. The four experimental versions were shown to four groups in each of threedifferent populations, High School students (12th grade). Air Force basic trainees, and Collegestudents. In each population a fifth control group did not see the film. All groups took thesame 136 item multiple-choice test. The High School and Air Force groups took the test againafter delays of four weeks and seven weeks respectively." (Vincent, et al., 1949, p. 1.)
The pace in the heavy versions was thus about one retainable fact per 7.5 seconds. In thelight versions about one retainable fact per 15 seconds was presented. The reportednarration rate was about 124 syllables per minute. The results showed that significantlearning occured:
"Every group that saw experimental film earned a substantially higher score than the controlgroup which did not see a film. ... For the High School sample the Short Heavy versionseemed to be most effective, for the Air Force and College samples the Long Light versionseemed to be most effective. At the end of the delayed recall period all differences among theversions were much smaller than they had been on the immediate retention test, and most ofthem were not significant." (Vincent, et al., 1949, p. 1)
Test.scores on immediate recall ranged from slightly more than 40% to about 50%, in theexperimental groups; delayed test scores were roughly speaking 20% lower. Differencesbetween groups were of the order of magnitude of 0 to 5%. Vincent, et al. point at thefact that the films were rather difficult for the populations used. Their overall conclusionis that:
"It seems clear from the data that packing more and more information into a film yields onlyvery slight increments in total measured learning (underlining omitted, pwv). In no case did theLong Heavy film group learn anything approaching twice as much as the Short Heavy or LongLight groups, nor did the latter learn twice as much as the Short Light group." (Vincent, et al..1949, p. 2)
With respect to the audio channel, the narration rate that was discussed under "audiofactors" also plays a role in pacing a programme. The narration may "drive" theprocessing of visuals more when the two information channels are sufficientlycorrespondent (Grimes. 1990, see also the passage about two channels below). Clearresearch-based rules on how to proceed when deciding on cutting rate and narration-related pacing, however, do not exist.
AnimationAnimation is traditionally a representation technique from the film and video world. It
varies from simple stop-motion formats in which message components are stepwisedeveloped (in instructional situations usually synchronous to narration) to detailed cartoonsin full motion. The technical developments of computers have led to beginningpossibilities to integrate animation into computer-based instruction.
Rieber (1990) posits that in computer-based instruction animation has been used to fulfillor assist one of three functions: attention-gaining, presentation, and practice. Rieber seesreason to advise that animation should be incorporated only when its attributes arecongruent to the learning task. These attributes are: visualization, motion, and trajectory(= the path of travel of an animated object).
72
73
In the audiovisual world, the situation is not much better as far as research is concerned.The usefulness of animation techniques seems, however, to be accepted as rather self-evident. Animation is considered to be a common presentation option that can be put intooperation whenever its application seems feasable. The functions mentioned by Rieber arethen also at stake, as are even simpler applications such as providing cueing devices likesuperimposed boxes and arrows.
An important feature of animation is that animated visualizations can be strictly to thepoint, without any distracting detail. Wember (1976), for instance, did an experiment witha video report about the political and societal conflict; in Northern Ireland. In this reportone sequence was about the historical causes of these conflicts. The images thataccompanied this sequence were originally scenes of a town (street scenes, graffity onwalls, etc.). Wember replaced these images by an animated scheme of the historicaldevelopment (on the basis of a highly stylized map of the British isles) that proceededsynchronous to the narration. In this way he was able to demonstrate a dramatic gain inrecall and comprehension scores with respect to the intended message (from an initialscore of 30% correct with the original version to a score of 80% correct with the versionin which the live scenes were replaced by the animation). Wember suggested that theeffect of the animation was especially convincing because of the fact that the supportedmessage was abstract. It is generally difficult to find realistic images that support abstractmessages that are contained in the commentary. Animated schematic drawings may inthat case offer the solution and add to the impact of the presentation.
Aspects of information load
Next to presentation variables, the communicative features of video presentations dependon the cognitive load they cause in the mind of the viewers. Picture complexity shouldnot be beyond what a learner is able to understand and the audio and video channel shouldnot be thus information loaded that they compete for the attention of their audience. Inthis section, relevant research is reviewed leading to a list of considerations that designersshould keep in mind when working on video segments (Figure 4).
Picture complexity"Picture complexity" refers to the syntactic, semantic and pragmatic difficulty ofcomprehending a picture. Other factors also can determine complexity:
Density of information in the sense of both the number of picture elements or objectsand of the degree of detail with which each element is depicted (Peeck, 1987, p. 137).- Syntactic cues such as overlap of objects to augment the depiction of depth.- Semantic clarity, which refers to the a se with which picture elements can be calledby name.- Pragmatic clarity, which concerns the kind and amount of existing knowledge that isneeded to interpret the picture.
Each of these factors have been subject to research with respect to a diversity of variablesthat can be identified to play a role. Overviews can be found by Goldsmith (1984, 1987),Peeck (1987) and Leahy (1983). Here, only some general issues are discussed withrespect to the use of realistic video images as well as the use of schematic representations.
73
7 4
The effectiveness of realistic pictures for learning has been a matter of debate for a longtime:
"An ongoing controversy exists in the literature regarding the role of realism invisualized instructional materials. A number of theorists, writing during the 1940s andearly 1950s. suggested the existence of a realism continuum along which all materialscould be scaled in reiation to their instructional effectiveness. ...
However, more recent researchers ... have disagreed with these theories on the groundsthat mole realistic materials will tend to present too many irrelevant cues which willinterfere with learning. Miller (1957) suggests that too many irrelevant cues mayactually compete with one another for attention and subsequent information storage. ...for some educational objectives, simplified or less realistic visual instructional materialsare more effective in falicitating student achievement than more complex photographicor detailed drawings of the same object. Dwyer found strong evidence to indicate thatthe most realistic visual illustrations were not necessarily the most effectiveinstructionally." (Parkhurst, 1975, p. 175-176)
Heuvelman (1989, p. 38-40) discussed the results of several studies that suggest that forinstruction, schematic visualizations yield better learning results and are thus preferred.Dwyer (1972) provided arguments why realistic images may hinder learning in the case ofexternally paced presentations (as in video programmes):
"The initial impact of the excessive realistic detail may be sufficiently strong to detract attentionfrom relevant and important learning cues. ... The process of indentification and discriminationis time consuming; the more intricate the visual stimuli, the longer it takes for the student toidentify and absorb the intended information." (Dwyer, 1972, p. 90-91.)
The research of Dwyer and others focused on the dimension of realism-schematism. Thisfocus may, however, distract from the real instructional issue. The question is whether theinstructional goals need the presentation of concrete referents (to teach concrete concepts,to demonstrate psychomotor procedures, to embed instruction in a familiar context; or anyother application for which it is necessary to provide real-world schemata that require"gestalts" with proper fidelity) or whether schematic visualizations are better to articulatethe instructionally relevant features (visualizing structures, relations, and principles).
In the case that real-world schemata are indicated, results other than those in favour ofschematic visuals may be found. Indeed, Leahy, in his research with fixed-pacepresentation of visuals, found that complex high-realism visuals promoted a significantIncrease in visual comprehension over low-realism visuals Leahy used colored visuals ofhigh complexity on two levels of realism that were of relevant instructional content tosocial studies, with emphasis on object-interrelationships and conceptual content, ratherthan mere object depiction. Subjects were public high school sophomores. The propertiesof the high-realism visuals that seem to be responsible for his results may, according toLeahy. be "a more meaningful, coherent, or experientially recognizable pattern of object-interrelationships" in these pictures (Leahy, 1983, p. 107).With respect to picture complexity, Leahy (1983, p. 111) listed as one of the implicationsof his study that high-realism visuals are apparently more efficient with respect to therecall and comprehension of presence and appearance of information and of theinterrelationship of objects.Next to this, another argument for some degree of complexity is that complexity invokesinterest, as is apparent from one of the research-ba.sed principles of Fleming and Levie:'attention is drawn and held by complexity, providing the complexity does not exceed theperceivers' cognitive capacities" (Fleming & Levie, 1978, p. 22).
74
I t)
A last point is that picture quality has to be such that the images can be appreciatedwithout technical imperfections. Fleming and Levie formulated one of their principles forinstructional message design: "the better an object or event is perceived, ... , the morefeasible and reliable will be further cognitive processes, e.g., memory, concept formation,problem solving, creativity, and attitude change" (Fleming & Levie, 1978, p. 88).The use of professional video formats and professional camera treament and editingfacilities seem thus to be indicated in order to produce effective video materials.
Using two channelsIn audiovisual presentations, the visual channel and the audio channel are usedsimultaneously to convey messages. Several researchers have tried to find how these twochannels interact. Jaspers (1991b) reviewed research regarding the relationship betweensound and image. His findings, supplemented with findings of Dwyer (1978) and Kozma(1991), are that:"Visual images are reflections of physical presence' (Arnheirn, 1986), presenting"concreteness" (Mast, 1977) that is represented by the surface of the depicted objects andevents. Sounds are, in most cases, attributes of visual objects (Metz, 1975), with theexception of sound objects such as a hiss, thunder, music (Jaspers, 1991b, p. 164). But,according to Metz, voices may also be aural objects as far as they have meaning of theirown, apart from 'die words spoken (recognizing an off-screen voice may be important tovalue the meaning of its speech). For instructional applications this is, however, a minorpoint in most cases or even not relevant.Language communicates thoughts (Arnheim, 1986); it presents abstractions (Mast, 1977).This counts whether or not language is presented visually (in print or on a video screen)or as an audible sound.When used in combination, most researchers conclude that an audio-visual combinationcan be more effective than audio alone or video alone (Hoban & Van Ormer, 1950,reprinted in 1970; Coldevin, 1981; Nugent, 1982). Kozma (1991, p. 191) reviewed morethan ten studies in which separate audio and visual presentations of a video programmewere compared and found that: "in none of these studies did the combination of audio andvisual information result in lower recall than recall from either source alone. In most ofthese studies, the combined use of visual and auditory symbol systems resulted in morerecall than visual-only and audio-only presentations." Although it is thus often the case, itnot always evident, that audio plus vision is better (Hsia, 1968). The effects of thecombination appears to be relative to factors of learner and material (Hoban & VanOrmer, 1950; Johnston, 1987; Barton, & Dwyer, 1987).Often, dominance of vision over audio is reported. "The overall influence of the motionpicture is thought to be primarily in the picture and secondarily in the accompanyinglanguage" (Dwyer, 1978, p. 172). Visually presented information would be retained betterthan aural information. But, for instance, Hsia (1968) concluded that "the question ofsupremacy of the auditory or visual channel is controversal. Some studies indicate thatseeing is better than hearing, others show the reverse" (Jaspers, 1991b, p. 164-165).These results seem to support one of the principles for improving visual learning that wasproposed by Dwyer:
''Both audio and visual elements of films are effective channels of communication.Neither channel is consistently better than the other. Each channel is uniquely capableof conveying certain types of information and the two should be properly integrated."(Dwyer, 1978, p. 172.)
75
The results also agree with one of the research-based principles of Fleming and Levie:"More learning can occur where information is received concurrently in two modalities, e.g.,vision and audition or vision and touch, than where received in only one modality." (Fleming &Levie, 1978, p. 107)
In instructional audiovisual programmes, sounds other than language or music are in mostcases attributes of visual objects in the sense of Metz' (1975) assertion. (Instructionallyrelevant sound objects other than music do, however, exist. Examples are ticks thatincrease in speed to inform learners about the approach of the end of a period for a timedanswer, and the different warning signals and other tones that are often used to givefeedback on learner actions during learner-computer interaction. For audiovisualpresentations, sound applications of these types are not very often used.)
With sounds as attributes of visual images, the relationship between the visual images andlanguage becomes the central issue for instructional audio-visual message design, inparticular if the language consists mainly of off-screen narration, which is the case withthe often used look-and-tell format. It has, however, to be noted that Boeckmann et. al.(1988, p. 110) found that in their experiments no influence on recall could be establishedin connection with the fact "whether the main source of sound was shown or not (e.g.whether the commentator was visible or a voice-over was used)". This suggests thatconclusions with respect to off-screen narration may apply to presentations by a studiopresenter as well.
With respect to off-screen narration two variables are at stake: (a) the correspondence ofthe visually presented information and the commentary; and (b) the use of narration-supporting superimposed text on screen. Both are treated below.
Correspondance of video images and audio narrationThe relationship between the information in the two channels determines whether theproper integration occurs as Dwyer has suggested. Some researchers have put forward theidea that "redundancy" and in particular "between-channel redundancy" plays a role.Jaspers (1991b, p. 168) describes that redundancy is formally defined as one minus theratio of actual-to-maximum information transmission, but that the common use of the termis much more informal and refers to superfluous, extra, or repetitive information. Hsia(1971; 1977) has opted for optimal between-channel redundancy which he sees as the keyto better communication. Between-channel redundancy in audiovisual communicationoccurs if information that is presented in in the visual channel matches the informationthat is at the same time presented in the audio channel. A methodological problemappears to be that it is not an easy matter to decide on the extent to which certaininformation can be conceived to be redundant. Pictures have, for instance, many cues thatmay be used by learners to connect new information to elements of their existing cognitivestructure, while with audible text it is assumed that to be redundant to the picture only oneperspective with respect to that picture is offered. This concerns the problem of thelimited possibilities of translating information that is represented in one communicationmode (for instance text) into a representation in another mode (for instance avisualization). In the past decades, a body of research and theory has developed withrespect to sign systems (often also referred as symbol systems, where the term "symbol" isthen used as a synonym of "sign"). Gross (1974, p. 60) speaks of primary modes ofsymbolic behaviour and distinguishes: (a) the linguistic, in which oral or written languageis carrying the messages, (b) the social-gestural. in which facial expressions and body
p7
76
language communicate messages between people; (c) the iconic, in which communicationtakes the form of visualizations; (d) the logico-mathematical, in which the symboliclanguage of mathematics constitutes an independent way of communication; and (e) themusical, in which people express themselves with musical sounds. They are: "identifiedwith (a) a range of objects and events or field of reference, (b) a distinctive memory-storage capacity, (c) a set of operations and transformations, and (d) specific principles ofordering which govern the formulation and communication of meaning, and (e)nontranslatability into other modes" (Gross, 1974, p. 61). With the last point, Grossmeans that information which is cdded within one mode will not be capable of being fullyrecoded in terms of another. Nontranslatibility is thus a characteristic of a communicationmode which indeed limits the possibilities for between-channel redundancy. It istherefore better to speak of more or less correspondence between pictures and sound,whereby strong correspondence resembles redundancy but is, in fact, not the same. This ishere thought to be one of the reasons why results of experimental research fail todemonstrate that striving for redundancy yields results that contradict predictions on thebasis of cue-summation theory (see fcr instance Severin, 1967). Cue-summation theorysays that adding non-redundant cues in different channels enriches a messa5!,e, thusoffering more opportunities for learning (as long as the information processing system ofthe learner will not be overloaded), and redundant cues do not (because they add no newinformation). If after all alleged redundant information appears not to be as redundant aswas assumed, improvement of learning that is reported on the basis of redundancy mayvery well be the consequence of cue-summation. A second reason why redundant cuesmay support learning despite of the predictions of cue-summation theory is, that in thistheory the didactically beneficial effects of repetition are not taken into account. Inpractice, most probably, both reasons play a combined role.
Grimes (1990) used a study of Drew and Grimes (1987) as starting point to study theinfluence of channel correspondence on recall of auditory or visually presentedinformation.
"Drew and Grimes found that in the optimum viewing condition -- high channel correspondence-- audio recall and story understanding were the highest, and video recall was the lowest. In theleast optimum viewing condition -- no channel correspondence -- video recall was the highest,audio recall was the lowest, and story understanding was the worst." (Grimes, 1990, p. 16)
It has to be noted that Grimes' research concerned television news, a format in which the mainstream of information is traditionnally contained in the audio channel. Grimes reasoned that theresults of Drew and Grimes are a consequence of limited memory and/or attentional capacities:
"Channel correspondence probably affects the way in which attention is divided between theauditory and visual channels. Because attention is a limited commodity (Kahneman, 1973),more attentional capacity is probably required to encode and integrate in memory the twoinformation channels when those two channels convey slightly to moderately different messages.With enough difference in messages (e.g., a medium-correspondence condition), attention'scapacity threshold will probably be approached, maybe even exceeded, and viewers may try toconcentrate on the auditor> channel -- the who, what, when, where, why channel -- at theexpense of the less specific, and less useful, visual channel. ... ...high channel correspondenceshould allow the viewer to monitor the auditory channel for the who, what, when, and where ofthe story and to shadow the visual channel for information that suppiements the narration andcan be integrated Into the information supplied by it. Thus, attention to, and memory for, thevisual channel should be greater in this condition than in the medium-correspondence conditioc.
77
However, if the conflict between the two information channels is great enough (e.g., the no-correspondence condition), attention to the visual channel will oven-ide attention to the auditor.channel." (Grimes, 1990, p. 16)
This last idea is, according to Grimes, not only supported by the non-correspondence datafrom the Drew and Grimes study, but also by the work of Colavita (1974) and Posner.Nissen, and Klein (1976) who report that visual stimuli dominate auditory stimuli whenpictures and words have no relationship to one another (Grimes, 1990, p. 17). Grimescarried out an experiment in which he focussed on the locus of attention as it was splitbetween the auditory and the visual information channels. "The purpose was to discoverwhich channel, if either, received less attention due to diminishing channelcoi-respondence" (p.17). He used three versions of four television news stories as stimuli.Grimes operationalized "High Corret,pondence" by a "tight" picture-word match in theexperimental material. When, for instance, the narration talked about a needle with thesize of a screwdriver that is inserted into a herniated disk in the spine, the picture showeda needle, the size and shape of a screwdriver, about to be inserted into the spine of apatient. "Medium Correspondence" was operationalized by relating the two informationchannels thematically but with no further correspondence. The narrated sentencementioned above (about the needle) was then accompanied by a video scene of a patientbeing wheeled into surgery.In the "Non-Correspondence" condition, the visual track consisted of a visual potpourrithat did not match the audio. "For instance, as the narrator described how herniated disksare repaired, the viewer saw a barge loaded with garbage anchored in New York Harbor.When the shot changed, it showed celebrants of the most recent Chinese New Year, whilethe narration continued to discuss surgery" (p. 18). Story narrations were the same acrossall conditions. Attention to the visual or the auditory channel was measured with areaction-time technique based on visual or tone probes. Half of the subjects were exposedto seven visual probes (NTSC colour bars during 33 milliseconds) nested within eachstory, and the other half were exposed to analogous tone probes (with a frequency of 10kiloHertz). In the technique subjects have to react to the visual or auditory signal eachtime that it appears by pushing a key as soon as possible. The reaction time is a measureof attention. The longer it takes, the more attention is assumed to be devoted to thechannel within which the signal appears (due to the channel capacity that is occupied bythe attention). Two recognition posttests were used: (a) a factual memory test with 53multiple-choice questions; and (b) a 36-item visual memory test on the basis of freezeframes from video material that was used in the stories as well as from "outtakes" (shotsnot included in the stimulus material). Subjects were 202 undergraduate communicationmajors who worked individually through the experiment.The results showed no statistically significant differences between factual memory scoresin the high- and medium-correspondence conditions (the scores were 56% and 54%respectively). In the no-correspondence condition, factual scores were much lower (35%),but the auditory probe reaction times were not significantly different from these times inthe other conditions. "This suggests that subjects were paying attention to the auditorychannel, but that they did not remember much of the factual information containeo within"(p. 23). Grimes discusses that this is consistent with the earlier mentioned observations ofColavita (1974) and Posner, et al. (1976) and also of Cohen (1973) who described thatvisual signals appear to go through fewer extrapolations than auditory signals before theyresult in memory codes. "Visual messages do not need as much attention to be efficientlyencoded, and therefore get priority entry, .... into the human information-processingsystem" (Grimes, l990. p 23). If unrelated auditory and visual stimuli are competing for
78
simultaneous processing, visual encodine primacy then keeps the factual information frombeing properly processed.Visual recognition scores for the high-, medium-, and non-correspondence conditions were66%, 55% and 64% respectively. The high visual recognition scores for the non-correspondence condition can partly be explained on the basis of the visual encodingprimacy, that also caused the low factual memory scores in case of extreme audio-videoconflict. In this condition, reaction times to the visual probes were relatively short,suggesting that the visuals were processed only to the point of recognition. The differencebetween visual recognition scores for the high-, and medium-correspondence conditions isstatistically significant. It shows that audio-video correspondence influences the totalamount of information that can be processed mentally per unit of time. In the high-correspondence condition longer reaction times to tone probes were positively correlated tovisual recognition scores (r = .387, r2 = .150, p < .025):
"This suggests that as subjects paid more attention to the narration, they were able to processthe video better, and so they produced better visual recognition scores. In other words, assubjects paid more attention to what was said, they used their remaining attentionai capacity tointegrate what they saw with what they heard. This result suggests that when the twoinformation channels are correspondent, the narration 'drives' the processing of the visuals."(Grimes, 1990, p. 24.)
This is seemingly in contradiction to the view of Kozma (1991, p. 192), who tends toconclude that comprehension of video appears to be driven by the processing of visualinformation:
"This is apparent from a study by Baggett (1984), who varied the temporal order of audio andvisual information within a video presentation on the names and functions of pieces of anassembly kit. In this study, the narration was presented in synchrony or 7, 14, and 21 secondsahead of or behind the visual presentation. College students performed best on immediate and7-day delayed tests of recall of the synchronous and ',second, visual-then-audio presentations.The worst performance was by groups with the audio presented first. This suggests that, in avideo presentation. the visual symbol system serves as the primary source of information andthat the audio symbol system is used to elaborate it."
The two studies combined, however, need not yield a conflicting perspective. It may verywell be that learners take the first few moments after switching to a new shot to processthe new visual image to a level of recognition that is sufficient to be open to subsequentelaboration which is then guided by narration. In that case, Kozma's conclusion thatcomprehension of video appears to be driven by the processing of visual information, hasat least partly to be rejected.
The question of excessive information load due to lack of audio-video correspondenceappeared also in a study by Wember (1976). Wember analysed the informational structureof filmed background reports about the difficult political situation in Northern Ireland. Hefound that the filmmakers edited the visual layer of these films in such a way that they aredynamically paced and have an attractive rhythm. This had, for instance, the consequencethat static shots were held relatively short (mean projection time: 2 seconds), while at theother end of the scale shots with movement of the camera and movement in front of thecamera at the same time ran uninterrupted relatively long (mean projection time: 5.9seconds). The content of the films did, however, often not motive this editing style.Despite the fact that the filmmakers denied this, it seems that their professional consentthat "film is movement" played them tricks.This is an occasion to stipulate that the media profession is differentiated. Mediaprofessionals who are schooled to work in the entertainment industry have, for instance, a
79
E 0
quite different view of their field than media professionals who are educated to serveeducational communication. The need for differentiated schooling is, however, stillrecognized by scanty measure. The cooperation between filmschools or schools ofcummunication and departments of educational technology is still very limited. This is themore problematic, now that multimedia technologies open a market where the combinedskills of both worlds are inevitably needed.
Wember perceived that the main effect of the dynamic pacing is that it attracts attentionand prevents viewers from switching to another channel when these films are broadcast ontelevision. But he was also able to demonstrate that the superfluous "Augenkitzel"(tickling the eyes), as he called it, demanded so much from the visual processing capacityof the viewers, that the intended, mostly rather abstract messages in the audio channelwere not understood or at least not stored into memory although the viewers reported thatthey thought that they did. He concluded that the gap between pictures and commentaryin the films he analysed in many cases forced the viewers to divide their attention betweencompeting channels, with a consequence that they failed to really take in anythingsubstantial of the presented information. Wember's study confirms that lack ofcorrespondence between the visual channel and the audio channel is detrimental forlearning. Unlike the findings of Grimes, in Wember's case the recall of the picturesdropped to a very low level.
Wember's results pertain to attention processes in the visual channel that hindered theappreciation of the information in the audio channel. Another mechanism also exists.Boeckmann et al. (1988) assert that picture continuity takes precedence over a change ofsubject in the commentary:
'When there is a change of subject in the commentary, even if this should amount to no morethan taking up a new aspect of the same subject (such a change as is indicated in a written zextby a new paragraph) and there is no corresponding structural marker (e.g. a cut, a graphic,flashing) the continuity of the information carried by the picture conceals the jump from oneidea to the next and leads to reduced recall of the point in the commentary. Take, for example,the commentary that moved from 'the optional school subject' to 'the compulsory subject',while throughout moving pictures of a school class were shown. The analysis of the poor recallrevealed that the experimental subjects had largely failed to perceive the transition."(Boeckmann et al., 1988. p. 112)
Heuvelman (1989) carried out several experiments with respect to between-channelcorrespondence and also came to the conclusion that ''the relationship between the audiotrack and the visuals is of paramount importance to information processing by viewers" (p.167). One of the factors he studied concerned the effects of studio presentation on camerain comparison to realistic or schematic visualizations of abstract subject matter. Hisresults led him to conclude that:
"With abstract subject matter It is very difficult to match pictures with sound when usingrealistic visualizations. In that case, studio presentation on camera will lead to better results. ...With an increasing level of abstraction of the text, realistic pictures can only show a limitednumber of aspects or elements of what a certain idea or concept fully means. At the same time.In the eyes of the beholder, realistic pictures can have many potentional meanings. Selection ofthe intended meaning, i.e. that Intended by the maker of the programme, is not imperative. ...
In schematic visualizations, a selection, or abstraction, from reality has already taken place: onlyelements of interest arc represented In that case picture and sound will show a better matchand. consequentls. processing and subsequent ruention of the information will be better."tkleuvelman. 1989, p 167
80
The view of Heuvelman implies that lack of between-channel correspondence does notonly result in less learning if the information processing capacity of the learners isoverloaded, but also if it leaves room for learners to invest their mental effort to derivenon-intended meaning. That the use of schematization may heip to solve this problem wasalso demonstrated by Wember (1976), when he used animation instead of live images tosupport abstract content that was presented through the audio channel.In all, enough support exists to believe that proper between-channel correspondencepromotes learning and that the amount of between-channel correspondence affects theinformation load of audiovisual presentations. How to control between-channelcorrespondence is, however, a complex matter. Factors involved are: (a) the concretenessor "visualizationess" of subject matter; (b) the matter of enrichment versus overload; (c)avoidance of distracting information; (d) amount of cueing of auditory content elements byoptical markers or changes of shots; and (e) the mutual tuning of audio and pictures ingeneral, inclusive of the wording and timing of commentary relative to the pictures. Forevery new product, the designers have to make content-driven local decisions to optimizebetween-channel correspondence with respect to these factors. It goes beyond the scope ofthis review, to elaborate design procedures to cope with these factors. A few generalelements are incorporated in Figure 4 that serves as a conlusion of this section.
Superimposed textA particular form of between-channel correspondence is formed by superimposed textsthat support narration. Heuvelman (1989) reviewed studies of Coldevin (1975), Nasserand Mc Ewen (1976) and Nugent (1982) that show that the presentation of verbalinformation through two channels (visual and audio) yields information gain compared toaudio only, but that no difference was found relative to the presentation of verbalinformation through the visual channel only (text on screen). This latter form is, however,rather artificial when the use of television is concerned. Heuvelman (1989) himselfcarried out a few experiments to find out whether short superimposed texts that supportnarration help recall of presented information. His earlier mentioned conclusion that withabstract subject matter, studio presentation on camera will lead to better results than theuse of realistic visualizations was extended with the conclusion that "adding redundantsuperimposed titles can also lead to better results, but is of less importance and should beapplied with care, taking into account the information density of the 'background' picture"(p. 167).
Van der Heijden (1987) carried out an experiment with three conditions: (a) audiosupported by short texts on screen against a neutral (blue) background; (b) audio plus live-action images; (c) audio plus live-action images and supporting captions. In this lastcondition only main points were supported by individual words or short statements nearthe bottom of the screen. The audio track was the same in all conditions. Theprogranmie took about ten minutes to present and contained information about a certainsocial service. This subject was rather abstract, the reason why the images in the last twoconditions were, in many cases, not a 100% substitute for the screen texts from the firstcondition (which supported the narrated text in a way that resembles the use of theoverhead projecter to present information point by point). Subjects were 61 students fromthc last year of a lower technical school and 62 students from the last year of a lowerlevel high school. Conditions were about equally distributed over school types andlearners. A pretest-treatment-posttest design was used. All tests were multiple choice.The results showed that the second condition (audio plus live-action images) did worse
8 I
r 2
than the other two conditions (audio plus text only and audio with live-action images plustext). The reason for this might have been that the imperfect match of the images withthe narration appeared a burden to the information processing abilities of the subjects,yielding a less effective use of the two channels than in the case where text on screen wasavailable.
The work of Heuvelman and of Van der Heijden give reason to expect that superimposedtexts that support narration may be beneficial for learning.
Conlusions with respect to information loadResearch is not very conclusive with respect to picture complexity. A differentiated viewemerges in which complexity seems desirable to invoke interest, indicated if a need forconcrete (real-life) referents exist, and to be avoided if the presentation of structures,relations, and principles is the central focus of the intended communication. Theseconclusions are summarized in Figure 4.The effects of using two channels and superimposed text appear to be dependent of thecommunicative intention which controls the kind of visuals used, and the relativeimportance of (oral) text. A few general conclusions are summarized in Figure 4.
Summary
The video components of multimedia applications may serve many different functions,such as providing content-motivated moving images, supporting mental imagery byvisualizations, and stimulating personal (emotional) involvement with objects of study.The role of video will further be determined by the way in which video is positioned inrelation to the non-video components of the system. In that respect, video may be chosenas the primary form of presentation around which all the other components are organized.But the use of video components may also be limited to support text-based materialswhere the use of video seems inevitable. Or as just one of the resources that users mayencounter when browsing through a multimedia database. In all these cases, the videocomponents should be designed with suffcient clarity to fulfill their roles in thecommunication process. In this contribution, research was reviewed with respect toproduction variables that should be properly controlled to accomplish video segments ofsufficient impact. In sum, the results are as follows:
Camera facorsResearch with respect to camera factors illustrates that the function of shot type isdependent on the circumstances under which it is used. The camera treatment has thus tobe regarded as a flexible component.Research-based rules with respect to camera factors are very limited. A firm rule frompractice is that for instruction the camera treatment should be content driven. Eachcamera angle ought to be motivated by its function in the presentation.
82
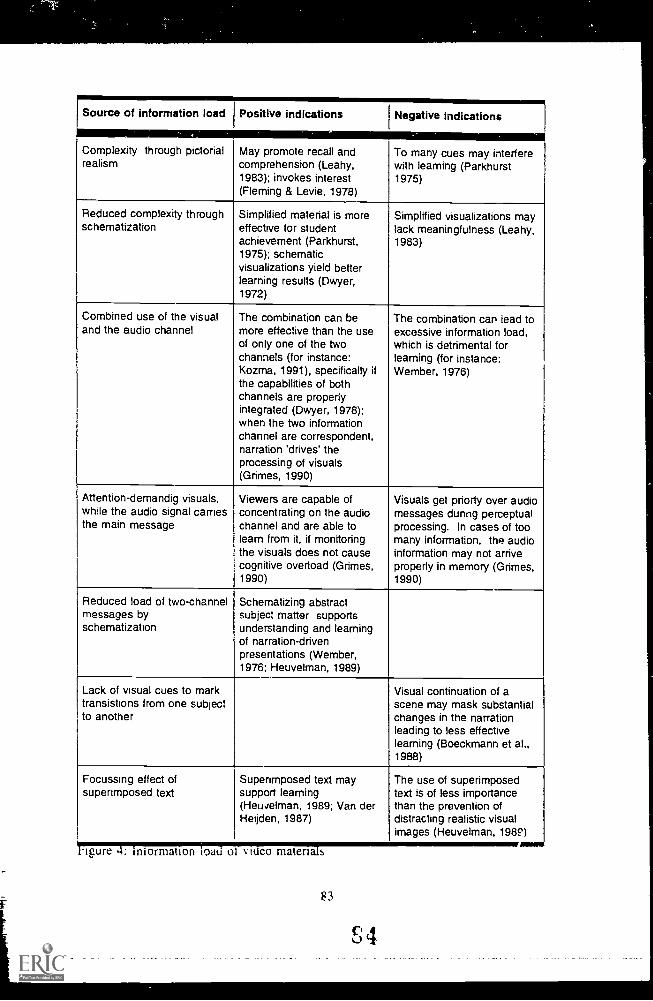
Source of information load Positive indications Negative indications
Complexity through pictorialrealism
May promote recall andcomprehension (Leahy,1983); invokes interest(Fleming & Levie, 1978)
To many cues may interferewith learning (Parkhurst1975)
Reduced complexity throughschematization
Simplified material is moreeffective for studentachievement (Parkhurst,1975); schematicvisualizations yield betterlearning results (Dwyer,1972)
Simplified visualizations maylack meaningfulness (Leahy,1983)
Combined use of the visualand the audio channel
The combination can bemore effective than the useof only one of the twochannels (for instance:Kozma, 1991), specifically ifthe capabilities of bothchannels are properlyintegrated (Dwyer, 1978):when the two informationchannel are correspondent,narration 'drives' theprocessing of visuals(Grimes, 1990)
The combination can lead toexcessive information load,which is detrimental forlearning (for instance:Wember, 1976)
Attention-demandig visuals.while the audio signal carriesthe main message
Viewers are capable ofconcentrating on the audiochannel and are able tolearn from it, if monitoringthe visuals does not causecognitive overload (Grimes,1990)
Visuals get priorty over audiomessages dunng perceptualprocessing. In cases of toomany information, the audioinformation may not arriveproperly in memory (Grimes,1990)
Reduced load of two-channelmessages byschematization
Schematizing abstractsubject matter supportsunderstanding and learningof narration-drivenpresentations (Wember,1976; Heuvelman, 1989)
Lack of visual cues to marktransistions from one subjectto another
Visual continuation of ascene may mask substantialchanges in the narrationleading to less effectivelearning (Boeckmann et al.,1988)
Focussing effect ofsuperimposed text
Superimposed text maysupport learning(Heuvelman, 1989; Van derHoiden, 1987)
The use of superimposedtext is of less importancethan the prevention ofdistracting realistic visualimages (Heuvelman, 198)
IMMO.igure n ormation load ol vi eo maten s
83
E; 4
NarrationVideo commentary should take the audience seriously, be presented in a clear, concise,and unambigious way, and talk directly to the audience if the subject allows it.
Sound effects and musicFindings from research with respect to the use of sound effects and music is very scarce.Here too, the main conclusion has to be that the treatment of these variables has to leanon rules from practice.
Optical effects and special effectsFindings from research with respect to the use of optical effects or special effects seems toshow that deliberate content-related use of these effects may augment the quality of amessage.
PacingClear research-based rules about how to proceed when deciding on cutting rate andnarration-related pacing appear not to exist. As with the other audiovisual designvariables, in this case the design decisions are also subjected to professional judgement ineach specific case.
Technical qualitiesPicture quality has to be such that the images can be appreciated without technicalimperfections. These requirement can be met by using professional video formats andprofessional camera treatment and editing facilities to produce video materials.
Correspondance of video images and audio narrationEnough support exists to believe that proper between-channel correspondence promoteslearning and that the amount of between-channel correspondence affects the informationload of audiovisual presentations. How to control between-channel correspondence is,however, a complex matter. Factors involved are: (a) the concieteness or"visualizationess" of subject matter; (b) the matter of enrichment versus overload; (c)avoidance of distracting information; (d) amount of cueing of auditory content elements byoptical markers or changes of shots; and (e) the mutual tuning of audio and pictures ingeneral, inclusive of the wording and timing of commentary relative to the pictures. In allcases, mental overload should be avoided. If the amount of information becomes morethan the learner can handle, visual primacy seems to inhibit learning from the audiochannel.
Superimposed textThere is reason to expect that superimposed texts that support narration is beneficial forlearning.
Despite the research findings and due to the limited direct applicability of these findings, aconclusion is that the judgement of an experienced producer and other experienced mediapersonnel is indispensible in meeting professional standards. This puts mediaprofessionals in an important position because of the fact that media design directs theimpact of instructional messages. The control over media variables is essential tooptimize instructional communication. This factor counts for economic advantages ofmedia, for the motivational effects of media and for media-specific didactics that extendthe options for organizing Instructional strategies in the sense of Reigeluth (1983, p. 18).It is hoped that the research reported here as well as subsequent research on (interactive)message design will lead to more systemized knowledge to support design processes.
55
84
References
Arijon, D. (1976). Grammar of the film language. London: Focal Press.Arnheirn, R. (1986). The images of pictums and words. Word & Image, 2, 306-310.Ash, P., & Jaspen, N. (1953). The effects and interactions of rate of development,
repetition, participation and room illumination on learning from a rear-projectedfilm. Technical Report, SDC-269-7-39, Port Washington, NY: Special DevicesCenter, Office of Naval Research.
Baggaley, J., Ferguson, M., & Brooks, P. (1980). Psychology of the TV image.Farnborough: Saxon House.
Baggett, P. (1984). Role of temporal overlap of visual and auditory material in formingdual media associations. Journal of Educational Psychology, 76, 408-417.
Barton, E.A., & Dwyer, F.M. (1987). The effect of audio redundancy on students' abilityto profit from printed-verbal/visualized instruction. International Journal ofInstructional Media, 14, 93-98.
Boeckmann, K., Nessmann, K., & Petermandl, M. (1988). Effects of formal features ineducational video programmes on recall. Journal of Educational Television, 14, (2),107-122.
Bovy, R.A. (1983, April). Defining the psychologically active features of instructionaltreatments designed to facilitate cue attendance. Paper presented at the annualmeeting of the American Educational Research Association, Montreal, Canada.
Cohen, G. (1973). How are pictures registered in memory? Quarterly Journal ofExperimental Psychology, 25, 557-564.
Cohen, P., Ebeling, B., & Kulik, J. (1981). A meta-analysis of outcome studies of visualbased instructi on. Educational Communication and Technology Journal, 29 (1), 26-36.
Colavita, F.B. (1974). Human sensory dominance. Perception & Psychophysics,409-412.
Coldevin, G.O. (1975). The differential effects of voice-over, superimposition andcombined review treatments as production strategies for ETV programming. In J.Baggaley, G.H. Jarnieson & H. Marchant (Eds.), Aspects of Educational TechnologyVIII (pp. 55.65). Bath: Pitman Publ.
Coldevin, G.O. (1981). Experimental research in television message design:Implications for ETV. Programmed Learning and Educational Technology, 18, 87-99.
Drew, D.G., & Grimes. T. (1937). Audio-visual redundancy and TV news recall.Communication Research, 14 (4), 452-461.
Dwyer, F.M. (1972). A guide for improving visualized instruction. University Park,PA: State College, Pennsylvania State University, Learning Services Division.
Dwyer, F.M. (1978). Strategies for improving visual learning. University Park,PA: State College, Pennsylvania State University, Learning Services Division.
Fleming, M., & Levie, W.H. (1978). Instructional message design: Principles from thebehavioral sciences. Englewood Cliffs, NJ: Educational Technology Publications.
Ginsburg, H.J., Bartels, D., Kleingunther, R., & Droege, L. (1988). Cosmos revisited:Just how effective are special effects for instructional communication? InternationalJournal of Instructional Media, 15 (4), 319-326.
Goldsmith, E. (1984). Research into illustration: An approach and a review. Cambridge,England. Cambridge University Press.
85
Goldsmith, E. (1987). The analysis of illustration in theory and practice. In H.A.Houghton & D.M. Willows (Eds.), The Psychology of Illustation: InstructionalIssues (pp. 53-85). New York: Springer-Verlag.
Grant, T.S., & Merrill, I.R. (1963). Camera placement for recognition of complexbehaviours. Television in Health Sciences Education, Chapter 6. Washington, DC:US Office of Education.
Grimes, T. (1990). Audio-video correspondence and its role in attention and memory.Educational Technology, Research & Development, 38 (3), 15-25.
Gross, L. (1974). Modes of communication and the acquisition of symbolic competence.In D.R. Olson (Ed.), Media and symbols, the forms of expression, communication,and education. The Seventy-Third Yearbook of the National Society for the Studyof Education (pp. 56-80). Chicago, IL: University of Chicago Press.
Heuvelman, A. (1989). Buiten beeld. (Off screen.) Lisse: Swets & Zeit linger.Hoban, F, & Van Ormer, E.B. (1950). Instructional film research, 1918-1950.
Fort Washington, NY: U.S. Naval Special Devices Center.Hoban, F, & Van Orrner, E.B. (1970). Instructional film research, 1918-1950.
New York: Arno Press & The New York Times.Hsia, HJ. (1968). On channel effectiveness. AV Communication Review, 16, 245-267.Hsia, H.J. (1971). The information processing capacity of modality and channel
performance. AV Communication Review, 19 (1), 51-75.Hsia, H.J. (1977). Redundancy: Is it the lost key to better communication?.
AV Communication Review, 25 (1), 63-85.laspen, N. (1950a). Effects on training of experimental film variables,
Study I: verbalization, rate of development, nomenclature, errors, "how-it-works",repetition. Technical Report, SDC-269-7-17, Port Washington, NY: Special DevicesCenter, Office of Naval Research.
Jaspen, N. (1950b). Effects on training of experimental variables, Study II:verbalization, "how-it-works", nomenclature, audience participation, and succincttreatment. Technical Report, SDC-269-7-11, Port Washington, NY: Special DevicesCenter, Office of Naval Research.
Jaspers, F. (1991a). Music in audio-visual materials. Journal of Educational Television,17 (1), 45-52.
Jaspers, F. (1991b). The relationship sound-image. International Journal of InstructionalMedia, 18 (2), 161-174.
Johnston, J. (1987). Electronic learning: From audiotape to videodisc. Hillsdale, NJ:Lawrcace Erlbaum Associates.
Kahneman, D. (1973). Attention and effort. New York: Holt, Rinehart & Winston.Kozma, R.B. (1991). Learning with media. Review of Educational Research, 61 (2),
179-211.Leahy, M.D. (1983). The relationship among field dependence/field independence, visual
realism, and information processing time in viewing projected visuals. Unpublisheddoctoral dissertation, University of Connecticut.
Lumsdaine, A.A., & Sulzer. R. (1951). The influence of simple animation techniques onthe value of a training film. Washington, DC: US Air Force Human FactorsResearch Lab.
Mast, G. (1977. ) Film/cinema/movie, a theory of experience. New York: Harper & Row.McCoy, E.P. (1955). An application of research findings to training film production.
Technical Report, SDC-269-7-44, Port Washington, NY: Special Devices Center,Office of Naval Research.
7
86
Metz, C. (1975). Aural objects. In E. Weiss & J. Belton (Eds.), Film Sound, Theory andPractice (pp. 154-162). New York: Columbia University Press.
Miller, N.E. (Ed.) (1957). Graphic communication and the crisis in education.AV Communication Review, 5 (3), 1-120.
Millerson, G. (1985). The technique of television production. London: Focal PressMorrison, G.R. (1979, April). The design of instructional television programs.
Paper presented at the Annual Meeting of the American Educational ResearchAssociation. San Francisco.
Nasser, D.L., & Mc Ewen, W.J. (1976). The impact of alternative media channels:Recall and involvement with messages. AV Communication Review, 24 (3). 263-272.
Nugent, G.C. (1982). Pictures, audio, and print: Symbolic representation and effect onlearning. Educational Communications and Technology Journal, 30 (3), 163-174.
Nugent, G.C., Tipton, Th.J., & Brooks, D.W. (1980). Use of introductory organizers intelevision instruction. Journal of Educational Psychology, 72 (4), 445-451.
Parkhurst, P.E. (1975). Generating meaningful hypotheses with aptitude-treatmentinteractions. AV Communication Review, 23 (2), 171-183.
Peeck, J. (1987). The role of illustrations in processing and remembering illustrated text.In D.M. Willows & H.A. Houghton (Eds.), The Psychology of Illustation: BasicResearch (pp. 115-151). New York: Springer-Verlag.
Posner, M.1., Nissen, M.J., & Klein, R.M. (1976). Visual dominance: An informationprocessing account of its origins and significance. Psychological Review, 83 (2),157-171.
Reigeluth, C.M. (1983). Instruction design: What is it and why is it? In C.M. Reigeluth(Ed.), Instructional-design theories and models: An overview of their current status(pp. 3-36). Hillsdale, NJ: Lawrence Erlbaum Associates.
Reisz, K., & Millar, G. (1981). The technique of film editing. London: Focal Press.Rieber, L.P. (1990). Animation in computer-based instruction. Educational Technology,
Research & Development. 38 (1), 77-86.Roshal, S.M. (1949). Effects of learner representation in film-mediated perceptual motor
learning. Technical Report, SDC-269-7-5, Port Washington, NY: Special DevicesCenter, Office of Naval Research.
Rossiter, C.M., Jr. (1971). Rate-of-presentation effects on recall of facts and of ideas andon generation of inferences. AV Communication Review, 19, 313-324.
Salomon, G. (1974). Internalization of filmic schematic operation in interaction withlearners' aptitudes. Journal of Educational Psychology, 66, 499-511.
Schlater, R. (1970). Effect of speed of presentation on recall of television messages.Journal of Broadcasting, 14, 207-214.
Schmidt, W.D. (1974). Analyzing the design of outstanding instructional films.International Journal of Instructional Media, 1 (4), 327-336.
Severin, W. (1967). Another look at cue summation. AV Communication Review,15 (3), 233-245.
Van der Heijden, M.P. (1987). Tekst en videobeeld. Een onderzoek naar de vormgevingvan het videobeeld door teksten en/of live-action videobeelden in informadevevideo-voorlichtingsprogramma's [Text images and video images. An experimentinto thc realization of the video image by texts or by live-action images ininformative video programmes]. Enschede: University of Twentc, Faculty ofEducational Science and Technology. Department of Instrumentation Technology.
87
,r+
Verhagen, P.W. (1993, April). Multi-Media: Basic Approaches for Utilization.Contribution to the COMFIT training programme Euro Media Training:Entwicklung von Fernstudienmodellen im bereich Medizin und Gesundheitswesenfiir Anwender und Multiplikatoren, Magdeburg, 27-28 April, 1993: Otto von ZernikeUniversita.
Verhagen, P.W. (1992). Length of segments in interactive video programmes.Unpublished doctoral dissertation. Enschede: Faculty of Educational Science andTechnology, University of Twente.
Vincent, W.S., Ash, P., & Greenhill, L.P. (1949). Relationship of length and factfrequency to effectiveness of instructional motion pictures. Technical Report, SDC-269-7-7, Port Washington, NY: Special Devices Center, Office of Naval Research.
Wember, B. (1976). Wie informiert das Fernsehen? (How does television inform?)Munich: List Verlag.
Zuckermann, J.V. (1949a). Commentary variations: Level of verbalization, personalreference, and phase relations in instructional films on perceptual-motor tasks.Technical Report, SDC-269-7-4, Port Washington, NY: Special Devices Center,Office of Naval Research.
Zuckermann, J.V. (1949b). Music in motion pictures: Review of literature withimplications for instructional films. Technical Report, SDC-269-7-2, PortWashington, NY: Special Devices Center, Office of Naval Research.
88
1. e
Design and development of multi media applications
89
90
Designing Multimedia Applications
Maud van den Meiracker
Abstract
The design and development process of multi media applications has to follow a structuredapproach. After a needs analysis, an educational design has to be developed. On the basis ofthis a functional design will describe the software architecture, which will be implemented inthe next phase. In multi media applications content design is most important. Therefore highlevel editors are necessary. Also new expertise is needed in multi media design. One needsgraphical designers and audio-video producers who are able to cooperate with educationaltechnologists.
Designing Multimedia Applications
IntroductionComputer based training applications have moved from character-based interfaces towardsgraphical user interfaces and from using only one data type, namely text, towards theintegration of different data types, such as text, graphics, audio and recently also stills and (fullmotion) video.This shift from character-based towards multimedia applications has had implications for thedesign process. These implications will be discussed in this paper.
The Design ProcessOver the years Andersen Consulting - ECC has developed its own educational softwareengineering methodology. This methodology contains a number of distinct phases. In each ofthe phases specific expertise is used to facilitate the process and to guarantee the quality of thefinal product.The main design phases are:
Needs analysisEducational DesignFunctional DesignTechnical ImplementationImplementation and evaluation
The main responsibility during the first two phases lies with the educational technologist. Acomputer scientist develops the functional and technical design and monitors the programmer.Implementation specialists, often people with an education degree, are responsible for theintroduction and use of the developed computer application.
For each of the 5 phascs the implications for the use of multimedia will be discussed.
91
n., 1
Needs Analysis
The main questions which need to be addressed during this phase is which needs validate theuse of a multimedia application. In order to answer this question, a short overview of types ofmultimedia based applications will be presented.
Multimedia applicationsThe following categories can use multimedia effectively:
corporate trainingsales and marketing
- entertainmenteducation/trainingbusiness desktop usesintegrated performance support
Corporate trainingThest applications are especially used for the training of new employees or the retraining ofexisting einployees when new products or procedures are introduced. Multimedia is used fordifferent purposes such as:
'personal' introduction of the CEO and or other key-persons of the organizationvisualization of the company, plant, etc.use of simulations of the 'real' work which needs to be carried outenhance motivation (training may be first introduction with new company)
Sales and marketingThe objective of sales and marketing multimedia products is to promote, sell and providecustomer service for specific products and services.Examples are electronic brochures at a travel agent to select a holiday destination; at banks tochoose between different kind of saving options; touch screen information booths at theOlympic games and other events, etc.Multimedia is being used to make an attractive presentation to the user who is used to the glitzand creative polish of the TV and movie commercials.
EntertainmentThe expectation is that multimedia entertainment will grow rapidly with the introduction of theCD-I players, which are connected to a television. The home-market is the primary targetgroup for multimedia entertainment applications. Applications consist mainly of interactivegames. Multimedia is used to make the games more attractive by providing graphics,animations (cartoons), stills and video and of course sound-effects. The entertainmentmultimedia applications can be seen as an extension to the popular computer games likeNintendo and SEGA
EducatioWtrainingIt is expected that the market for multimedia education and training will quickly expand. Withthe prices of multimedia computers falling and the hardware becoming more powerful,multimedia will (partly) replace existing CBT and add many new applications which are highlyattractive and effective The educational goal of multimedia application ip to impart knowledgein the most effective way. This can be realized for example in classes where students have
92
..4
access to information from different cultures, languages, music, etc. Multimedia may providemore realistic and complete information and when integrated with well-designed computer-based training may enhance the learning process.Multimedia applications can be used very effectively in training situations where simulationsare required. American Airlines, for example, uses interactive multimedia to cut down on theuse of expensive full-scale flight simulators.
Business desktop usesMultimedia usage for business desktop applications is not wide-spread but will certainly growin the near future. The most promising applications are video mail and teleconferencing.
Integrated Performance Support °PSIIntegrated performance support is mentioned separately because Andersen Consulting has aspecial interest in this area. The use of multimedia within integrated performance support oftenwill be a subset of combination from the above mentioned categories. The goal of IPS is tosupport the knc,wledge worker. This can be realized with different IPS 'services' includingCBT, advisory, on-line help, computer-based referencing and work flow. Multimediacan bevery effective in the CBT, advisory and computer-based referencing services.
During the needs analysis phase a good 'match' should be established between the specificneeds for a computer application and the best solution. Of course, this is not new. Only nowthe option for multimedia is quite realistic, the educational designer needs to be familiar withthe added value of multimedia and needs to know when the possibility of multimedia should befurther investigated. Also the educational technologist should have some idea about the costsfor developing a multimedia application.Even if multimedia seems to be the best fit for the specific needs, this does not necessarilymean that multimedia will be selected. Often budgetary constraints for both the developmentas well as the purchase of the delivery platform may lead to a different choice
For the remaining part of this paper, we assume that the choice for a multimedia applicationhas been made and we will discuss the implications for the different design phases followingthe needs analysis phase.
'Educational' Design
The 'educational design is an important phase in the design process. Educational is placedbetween quotes since not all categories suitable for multimedia mentioned in the previouschapter, fall in the category education.This immediately points to one of the new skills for the educational designer within AC-ECCwhich has surfaced with the introduction of multimedia development. The focus is not only onan educational context but also on entertainment, point of sales which may include marketingaspects, integrated performance support, etc. Where training and learning were the mostimportant goals for CBT applications, the different multimedia applications have differentgoals. The well-Imown and proven instructional strategies for CBT are not always applicableto other multimedia applications.
93
The educational design is of course closely linked to the outcomes of the needs analysis. Thehigh level goals and objectives for the application to be thveloped have been defined in theneeds analysis phase. During the educational design phase these goals and objectives will betranslated into:
the overall structure of the applicationthe high-level navigation
- level of user-control- instructional strategies and transactions or in case it does not concern a CBT-program the
presentation modescontent specification
Assuming that the decision has been made to develop a multimedia application, the followingissues, specifically linked to multimedia, need to be addressed in this phase:
StructureWhere, when and how will the different data types be used in the application?Decisions will more often be based on availability of existing material (e.g. video andphotographs); budget and time lines than on real design issues such as what is the mosteffective way to present information.
High level navigation and user controlHow will the user access information and find his way throughout the application?Decisions have to be made with respect to the menu structure; use of hypertext; free browsing;free or fixed entry points, etc. This is especially important when using linear presentations suchas video and audio. The user will need to stop video and audio at any point, backtrack at anypoint in time and sometimes the user should be able to skip certain presentations.
Instructional strategies/ transactionsThe availability of more data types does not necessarily result in a high quality application. Onthe contrary, more can go wrong when using different data types. The correct choice for acertain data type in relation to the (instructional) goal is not always simple and to be honest wedo not even know for cm-min the best match.If, for example, the goal is to introduce a new employee to the board of directors, justpresenting a list of names may be less effective than presenting a list of pictures. However, it isstill unclear if a short video presentation of each of the directors will be more effective thanshowing the photographs with some additional textual explanation. This will very muchdepend on the quality of the video as well as on the target population.
Content specificationThe design should include specifications of all the content being used. Since more data typesare being used, this means additional specifications in comparison with character-basedapplications where a description of font, letter size and style might have been sufficient.The actual scripting will take place in the next phase(s), but in this phase should be specifiedwhich data types will be used for which purpose. Furthermore, a description should beprovided such as 'short video fragment showing the outside and the inside of WorldHeadquarters'.
94r 4.! (#
4.
Functional Design
The choice for using multimedia in an application has also implications for the functionaldesign in which the overall architecture of the application as well as the detailed functionalitywill be specified.Andersen Consulting - ECC has successfully used the building block approach, of which theseparation of (CBT) code and data, the development of both a (CBT) runtime program as wellan authoring facility and the re-use of software building blocks are the main characteristics.Using this approach has resulted in very different design documents compared to the oftenused story-boards in multimedia design. The story-boards most often are linearly organized,describing one screen after the other. The AC-ECC approach results in a description ofdrivers, containing the way data is presented to the user on the screen with all the interactivityinvolved. The data are stored in a database which has to be designed by the computer scientist.In order for non-programmers to fill the database, an authoring program will be developed.This means that the functional design contains a description of the authoring facilities as well.
No clear protocols have been developed within AC-ECC for descaing the use of video, stills,sound and graphics within the functional design document. This is often done in a separatedocument, called detailed design or scripting document.
Detailed designThe detailed 'content' design describes in detail the different data types which are being used.This includes the following aspects for each of the different data types:
Text:font(s)letter size(s)stylesize of paragraphs (often linked to the size of the 'text-boxes')use of horizontal and/or vertical scroll barscolor
Graphics:description of pictures neededsize of graphics (often linked to the size of the 'graphics-boxes')format (PCX, BMP, etc.)metafilecolor
depends on screen (monochrome; VGS; super-VGA)use of specific paletteuse of corporate colors
co-ordinates (where to place on screen)transparancy
95
Audio:quality (11 or 22 MHz; 8 or 16 bits)voice (male; female; child)length of audio-fragmentswith/without background musicspecific effectsspecific intonation
Stills:- quality- size (often linked to the size of 'stills-box)- description of stills needed
Videodescription of video neededquality (PLV or less)length of video fragments (closely linked to costs and storage space)size (full-screen or less)combination with music or voice-over
User Intelface DesignAnother important part of the functional design is the user interface design. User interfacedesign is important for all computer applications. However, because of the differences inmultimedia applications as mentioned in the first chapter, it should be clear that someapplications will be used by inexperienced and also infrequent users (such as point of sales andpoint of information). This requires special attention with respect to the user interface.
The use of different data types may also result in rather chaotic and inconsistent applications.We often see that the philosophy Ihe more, the better' has been applied, which of course ishardly ever true. We recommend a rather 'dull' background using very quiet colors (like lightgrey) and predefmed screen areas for video and still presentation and text and/or graphicpresentation. The use of photographs, video and graphics will most likely bring enough colorto the application. Therefor, we recommend to use only a couple of colors which have acertain meaning (for example red to indicate an answer is incorrect, green to indicate ananswer is correct).
Using different input mechanisms next to the mouse and the keyboard should definitely beconsidered. Touch screens, track balls and joy sticks may be much more user friendly forcertain applications, especially if relatively little input is required.
Overall, prototyping is a nice way to gradually design the definite user interface. This maycause some problems because of lack of in-house facilities and multimedia content material.But even without specific content, the user interface may be tested. A big advantage of AC-ECC's software engineering approach is that it is rather simple to change the user interface.Because of the separation of code and data, and the driver principle, changes in the userinterface do not have to be realized all over the application, which is often the case when usingauthoring programs
96
Technical Implementation
The technical design and programming phase for a multimedia application does not differ verymuch from designing character-based applications with the exception if different technologiesand dedicated tools are being used, such as in the development of CD-I.AC-ECC uses Visual Basic 3.0 in combination with DVI-technology to develop midtimediaapplications. Also, when video is not a very important aspect of the application Video forWmdows can be used, with the advantage that no special hardware needs to be purchased.
Because of the basic building block approach, parts of the technical design and sometimeseven code is being re-used in new projects. This is of course very efficient.
Because of the large amount of data often used in multimedia applications, special attentionneeds to be paid to a DBMS. AC-ECC has used several applications such as DB-Vista, Accessand Visual Basic's database engine.
A totally new activity in this phase of the design process, specifically related to multimedia, isthe data production. The multimedia data need to be produced and be placed in the databasebefore the authoring process, actually linking all the data together within the program shell,can start
Multimedia data productionProfessional production of multimedia data requires a multidisciplinary team. Each of thedifferent data types requires different expertise. All these qualities will very seldom becombined within one person.
Text productonDepending on the type of application, different demands will be placed on the text quality. Agood point of sales, for example, requires text writers with a marketing background. Atraining application requires a clear description of the subject matter and well-stated questionsand feedback. Subject matter experts as well as educational technologists should worktogether to accomplish a quality product.
Graphics productionTo make a multimedia computer application compatible with evelything we see daily on TVand in magazines, it is imperative to involve a computer graphics expert for the graphicsproduction. It is important to realize that a graphical artist who is used to paper design, is notnecessarily suited to develop computer graphics. Best results are obtained when the graphicalexpert draws straight on the screen since drawing on paper and afterwards scanning of theimage, often reduces the quality.The graphical designer should be creative and should also be able to listen well to the subjectmatter expert and to translate ideas into graphics, with all the restrictions the computer screenimposes.The graphics will haVe to be produced in the correct format (PCX, BMP or something else,depending on the technology used.) Also special attention should be paid to the filenamesbeing used. Since all graphics will be stored in the database, it is helpful to think aboutmeaningful names in order to facilitate the filling of the program shell later on during theauthoring process. Actually, this applies to all data types used.
97
`y 7
Audio productionNext to preparing the text which will have to be spoken it is also important to select the rightvoice. Professional 'voices' can be selected from a number of voice-bureaus in the Netherlands.Depending on a global description of your wishes, you can listen to audio fragments ofdifferent voices and select the appropriate voice for the multimedia application.Once the voice is selected and the text is completed, it is important to mark the text forspecific intonation, pauses, etc. Very often the spoken text is used in combination with thepresentation of stills and/or graphics. Timing will be done afterwards in most cases, butspecific pauses should be taken into consideration when recording the text.In order to guarantee good quality, the recording should be done in a sound proof studio withgood recording equipment. The text should be sent to the narrator beforehand for practice andshould be recorded without any errors.Especially when multiple languages are being used, it is important to compare the lengths ofthe texts in the different languages. Rewriting may be necessary to match the lengths as well aspossible.When the recording is finished, the anolog audiofiles will have to be converted to digitalaudiofiles. Here, it is important to choose the quality level. lEghest quality will be obtainedusing 22 MHz and 16 bits. This of course will produce larger files than when 11 MHz and 8bits files are used.Digitizing can be easily done by using special tools such as Splice.
Video productionSpecial experts are needed to guarantee quality video in your application. You do not onlyneed a good camera, sound and light technician, but also a good scenario expert and possibly aprofessional script writer. Producing video for a computer application requires different skillsthan producing video for a TV-show or movie. Oftentimes the video-clips in computerapplications are rather short. This is because 1 minute video takes up 10 MB of disk-memoryand longer video-fragments may reduce interest in the user.Decisions will have to be made with respect to using existing material or shooting newmaterial. For new production it may be necessary to select actors, a studio, stage material,background music, narrator, etc.Just as with audio, video needs to be diietized as well. To obtain PLV quality, the video needsto be sent to special studios (e.g. Paris) where digitizing can be done on special high speed andvolume computers for a considerable amount of money (S500 for 1 minute of video).
Multimedia AuthoringAnother part of this design phase is the authoring process. As mentioned before, AC-ECCuses a software engineering approach where the code and the data are completely separated.This means that when the program shell has been coded by the programmer and the data havebeen produced and stored in the multimedia database, all the links will have to be put togetherin the authoring process.The authoring facilities are built by the programmer and are easy to use. Establishing all thelinks when usipg the authoring facilities does not require any programming skills.The author is often the educational technologist, but it can also be a subject matter expert.
98
TestingLike with any software product, testing is an important part of the technical implementationphase. The difficulty with testing multimedia applications is the need for the delivery platform,which often is a 486 computer with DVI board and very large hard-disk. Sometimes, noadditional computer is available next to the development computer.Because of the size of the application, you cannot just send a couple of diskettes to the subjectmatter expert or client to have the program tested. Installation of the application often requiresan external hard-disk or a tape-streamer. Compatibility may be a problem, so it is important tohave clear procetNres.Because of the separation of the code and the data, it is advised to develop a testing protocoladdressing the two parts separately. Graphics, audio and especially video will already havebeen tested before being digitized. This reduces the chances of having to make major changesto these parts of the data.
Implementation and evaluation
Developing a multimedia application does not guarantee proper and effective use by the targetaudience. It is important to support the implementation process and also to evaluate the use ofthe application.
Just as with testing, the delivery platform for multimedia is somewhat more complex than withregular computer applications. The multimedia applications need to be properly installed. Thisis possible by using an external hard-disk, a CD-ROM or a tape-streamer. This almost alwaysrequires assistance from a technical assistant.
Manuals are poorly read and not very much used. Furthermore, manuals are not suitable forpoint of sales and/or point of information applications and entertainment, since users should beable to access the application without any additional instruction (of course some instructionmay be placed on the screen, such as: Select your language choice).For multimedia training applications and simulations, where learning goals are important,guidance and possibly a help desk should be considered. In the next two decades we may stillexpect many inexperienced computer users in the target audience of the multimediaapplications to be developed.
Evaluation of multimedia applications (and regular applications) often does not get very muchattention. This is a pity, since much is to be learned from observing computer users and fromdiscussing their experiences. Too often designers assume ways users will react and response,without ever having tested or validated this assumed behavior. Evaluation results are alsostrong selling points for the initial high investments which have to be made when starting amultimedia production.
99
ry
Conclusion
The design of multimedia computer applications has a number of consequences which do notapply for regular software engineering.
Content plays a much more important role than in traditional applications. This means thatduring the educational design phase decisions need to be made with respect to the addedvalue of using the different data types in relation to the specific (business/ educational)needs. The (educational) designer will have to be familiar with the different possibilitiesand the added value of multimedia.
The interactivity of multimedia is not very well known. We should be careful thatmultimedia programs do not become video or slide-shows.
Multimedia development definitely requires multi-disciplinary teams. This poses anadditional burden on the project management of a multimedia production. Managing thecreative processes of graphical designers, script writers and video producers should not beunderestimated.Timelines will be under much more pressure, since there is much more interdependency inmultidisciplinary teams.
Data production will seldomly be done in-house, because expensive equipment and studiofacilities are required. This creates additional dependencies.
- 'Standardized' protocols will enhance the communication between team-members.
In order to develop maintainable applications, it is important to keep the program codeand content data separate. This is realized within AC-ECC by using a regular softwareengineering methodology for multimedia productions. Many of-the-shelf multimediaauthoring tools do not support this separation of code and data, which reduces theflexibility very much.
- Cost estimates of multimedia applications are still not very easy to make. Much dependson the preparation of the data and the desired quality of the data.
- With the prices of hardware reducing, multimedia applications will take a growing marketshare, which will only stimulate the demand for more multimedia applications since criticalcustomers will not accept anything less attractive.
Multimedia development tools
Jan Schoenmaker, Erik Nienhuis
Abstract
Wien specifying multi media tools one starts with defining the optimum betweenthe needed efficiency of development and the flexibility for an author. Given theimportance of content design in multi media applications, high level structure andcontent editing tools should be available with which an author can design anddevelop applications in an easy and cheap way. As an example a dedicatedauthoring environment for multi media development is being described.
Criteria for tools selection
Efficiency and flexibility of toolsThe discussion on the functionality of tools for developing multimedia applications is partlythe same as in the case of regular software development. Does one need high flexibility than aregular programming environment will certainly support the development. However theefficiency of the development process may be quite low. In order to increase this efficiencyone builds environments in which a number of facilities support faster development. Wheredoes this increase in efficiency come from? This is due to the definition and implementation onbeforehand of certain functionalities which may be useful in an application. The developer hasonly to put in some parameters and part of the application will be generated automatically. Inregular automation we then talk about fourth generation environments, in training aboutauthoring systems. However, one has paid a price in using such a tool: because part of thefunctionality is pre-defined, one has less flexibility. One can say that it is dependent on the typeof application and context factors like maintenance but also expertise which is necessary whichwill decide upon the selection of tools.
Expertise as a third criteria for selecting toolsM said, expertise of the developer is a major variable in using a tool. Although regularprogramming environments are very handy, programming is a highly specialised activity.This is a major issue in application domains like training, where one primarily needs expertisein instructional design, human computer interaction and learning psychology.Computer based training therefore not only demands for software engineering knowledge andskills but also content design skills.Here comes the issue with multimedia. In the past content design was restricted to writingdialogues and using simple graphics. Now, with multimedia the demand is for 'scripting'content in which as well the cogrutive, interaction oriented activities with computer basedtraining as the more affective, contextual activities of film are being combined. So, a designerhas to be as well an instructional designer with a strong focus on cognitive aspects as a filmmaker with a focus on contextual and affective aspects.So content design in multimedia computer based training has become more complex.
101
101
Developing a new ope of tool with new technologyOne can distinguish three criteria when selecting or defining authoring tools: efficiency,flexibility, expertise. One can put the well known tools like authoring systems, authoringlanguages and programming languages in relative position. Authoring systems have arestricted functionality and flexibility, but high efficiency or power of development. Withprogramming environments it is the other way around.Given nowadays technology one can take a new perspective however. Available are nowgeneric tools like user interface management and data base tools. Making using of thistechnology has brought the opportunity to develop a new kind of authoring tools, leading toas well high efficiency and flexibility in specifying all kinds of functions.With this technology an application can be seen as consisting of three distinct parts: the userinterface part, the functional part and the database part. Certain environments combine a userinterface management system and regular programming features, like for instance VisualBasic.Others combine this also with a database part, like it is in hypermedia systems. However, thestorage of data in a hypermedia system is based on the card concept. A card represents theuserinterfitce part with a fixed link to a content part. Linking cards to each other means fixedlinks, leading to maintenance problems if one wants to change links. Using regular databasetechnology,, implies that maintenance can be done in an efficient way. Therefore, in general weprefer the use of regular database technology to organize the different datatypes in multimedia.
Focus on content designWhat does the availability of these new tools mean?These hypermedia systems and programming environments are in itself already high leveltools. They have on board a user interface management system and also support a number ofrelevant functions in developing computer based training: user interface and storage of(multirnedia)contents. They lack functionalities typical for authoring systems like patternmatching for processing of answers or registration facilities. But given the high level ofsophistication of these programming environments one can built these relatively easy.Therefore we come to the statement, that making use of regular software engineeringarchitectures and tools, one can built environments which are competitive with authoringsystems in terms of efficiency. These environments will be built on the basis of specific clientneeds. So the flexibility issue is resolved on beforehand.
Maybe that the most important characteristic is that one builds these tools in such a way thatauthors just have to use structure and content editors. Because the functionality of thededicated authoring tool is defined on beforehand, the author can concentrate on coursestructure and course content. As stated before this is highly critical in multimedia designbecause of its complex relations between text, graphics, audio and video.
In the next chapter an overview will be given of the design considerations of this method andof a specific authoring environment developed by Andersen Consulting - ECC. Because it isbased on defining and implementing basic building blocks which can be combined as bricks inbuilding a house, this method is called the basic building block approach.
1 9, 4, 102
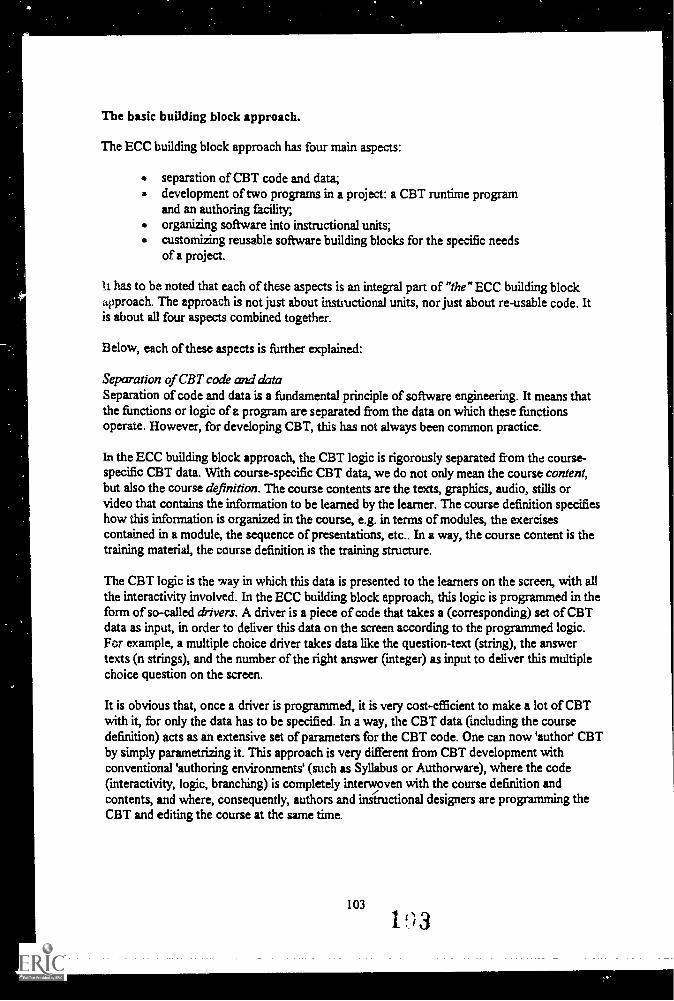
Tbe basic building block approach.
The ECC building block approach has four main aspects:
separation of CBT code and data;development of two programs in a project: a CBT runtime programand an authoring facility;organizing software into instructional units;customizing reusable software building blocks for the specific needsof a project.
It has to be noted that each of these aspects is an integral part of "the" ECC building blockapproach. The approach is not just about instructional units, nor just about re-usable code. Itis about all four aspects combined together.
Below, each of these aspects is further explained:
Sepczation of CBT code and dataSeparation of code and data is a fundamental principle of software engineering. It means thatthe functions or logic of a program are separated from the data on which these functionsoperate. However, for developing CBT, this has not always been common practice.
In the ECC building block approach, the CBT logic is rigorously separated from thd course-specific CBT data. With course-specific CBT data, we do not only mean the course content,but also the course definition. The course contents are the texts, graphics, audio, stills orvideo that contains the information to be learned by the learner. The course definition specifieshow this information is organized in the course, e.g. in terms of modules, the exercisescontained in a module, the sequence of presentations, etc.. In a way, the course content is thetraining material, the course definition is the training structure.
The CBT logic is the way in which this data is presented to the learners on the screen, with allthe interactivity involved. In the ECC building block approach, this logic is programmed in theform of so-called drivers. A driver is a piece of code that takes a (corresponding) set of CBTdata as input, in order to deliver this data on the screen according to the programmed logic.For example, a multiple choice driver takes data like the question-text (string), the answertexts (n strings), and the number of the right answer (integer) as input to deliver this multiplechoice question on the screen.
It is obvious that, once a driver is programmed, it is very cost-efficient to make a lot of CBTwith it, for only the data has to be specified. In a way, the CBT data (including the coursedefinition) acts as an extensive set of parameters for the CBT code. One can now 'author' CBTby simply parametrizing it. This approach is very different from CBT development withconventional 'authoring environments' (such as Syllabus or Authorware), where the code(interactivity, logic, branching) is completely interwoven with the course definition andcontents, and where, consequently, authors and instructional designers are programming theCBT and editing the course at the same time.
103
3
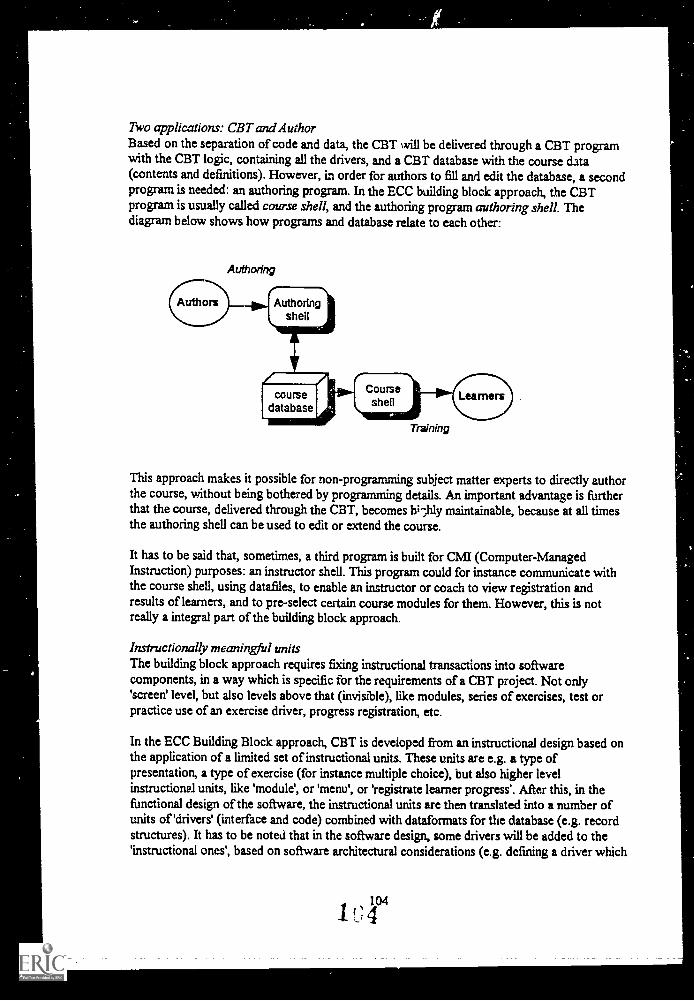
4
Two applications: CBT and AuthorBased on the separation of code and data, the CBT will be delivered through a CBT programwith the CBT logic, containing all the drivers, and a CBT database with the course data(contents and definitions). However, in order for authors to fill and edit the database, a secondprogram is needed: an authoring program. In the ECC building block approach, the CBTprogram is usually called course shell, and the authoring program authoring shell. Thediagram below shows how programs and database relate to each other:
Authoring
This approach makes it possible for non-programming subject matter experts to directly authorthe course, without being bothered by programming details. An important advantage is furtherthat the course, delivered through the CBT, becomes b;-;hly maintainable, because at all timesthe authoring shell can be used to edit or =tend the course.
It has to be said that, sometimes, a third program is built for CMI (Computer-ManagedInstruction) purposes: an instructor shell. This program could for instance communicate withthe course shell, using datafiles, to enable an instructor or coach to view registration andresults of learners, and to pre-select certain course modules for them. However, this is notreally a integral part of the building block approach.
Instructionally meaningful unitsThe building block approach requires fixing instructional transactions into softwarecomponents, in a way which is specific for the requirements of a CBT project. Not only'screen' level, but also levels above that (invisible), like modules, series of exercises, test orpractice use of an exercise driver, progress registration, etc.
In the ECC Building Block approach, CBT is developed from an instructional design based onthe application of a limited set of instructional units. These units are e.g. a type ofpresentation, a type of exercise (for instance multiple choice), but also higher levelinstructional units, like 'module', or 'menu', or 'registrate learner progress'. After this, in thefunctional design of the software, the instructional units are then translated into a number ofunits of 'drivers' (interface and code) combined with dataformats for the database (e.g. recordstructures). It has to be noted that in the software design, some drivers will be added to the'instructional ones', based on software architectural considerations (e.g. defining a driver which
104
1 [) 4
controls the running of a related set of lower level drivers), or on functional considerations(e.g. drivers that control initialization of the environment etc.).Because the author shell uses the building blocks as well, the author can only enter data in theformat which has been defined in the inrauctional transactions.
Authoring
Training
Reusable library, but customizere-using the existing library of building blocks, but still customize them for the specificinstructional needs of a project.
Over the past 2 years, a library of ready-to-use building blocks has been developed. Thesebuilding blocks have been made generic, so that they are easily reusable for new projects, bystrictly enforcing coding and documentation standards. However, because of this genericnature of the building blocks, they are quite abstract and complex. Consequently, re-use of thebuilding blocks is best done by ECC designers and programmers. Re-use by non-ECCdevelopers will prove difficult and is not recommended.
Although the building blocks can be re-used directly, without any changes, it has beencommon to customize the building u:ocks, i.e. adapt them to the specific needs of a newproject. The level of customization may be small, such as changing the place of a button, or asmall change in the logic, or changes may be large, such as changing the user interface style, orchanging the driver- and data structure. Because of the strong separation of interface,functionality and data, customization is relatively easy, and therefore always done.
The customization usually results from a sort of negotiation process between the wishes of theinstructional designers and the feasibility of the software implementation. This negotiationprocess is dene in the functional design phase, and is an important task of the functionaldesigner. Thus, a good level of both customization and re-use is ensured.
105
The ECC multimodia toolkit
The ECC multimedia toolkit is an environment for developing advanced multimediaapplications. It is a specific implementation where use has been made of the building blockmethod. A choice has been made for a certain course structure, presentation functions andinteraction functions. It is therefore a dedicated high level authoring environment.
The ECC multimedia toolkit consists of three major components:authoring shell: supporting the authoring process;instructor shell: supporting the instructors role like allocation of courses and registration;user shell the application for the learner.
Besides one needs:text, graphics, audio, video editing tools: these are tools for the author with whichcontents are being produced. These are generally available tools on the market.
licedware and software requirementsThe ECC multimedia toolkit is available for three levels of multimedia:
Supporting text, graphics, stills, animations, audio, video:
This is based on DVI (Digital Video Interactive) or Video for Windows.
When using DVI, supporting full screen video one needs a DVI Action media board.With Video for Wmdows no additional hardware is needed, except a voice card.
Furthermore the minimum hardware requirements are:a hard disk with at least 300 MB (1 minute of video takes about 10Mb, 1 minute ofaudio about 1 Mb in DVI mode)a mousea 33 MHz personal computer with 80486 processor8 Mb internal memorya VGA colour monitorVGA-board with Feature-connectorAmplifier (with normal line Input) and headphones or active speakersetWmdow version 3.1
Supporting text, graphics, animations, audio:
The same configuration as for Video for Windows
Supporting text, graphics, animations:
No voice card needed, less mass storage (i.e. 100 Mb), eventually 80386 computer with4Mb RAM.
106
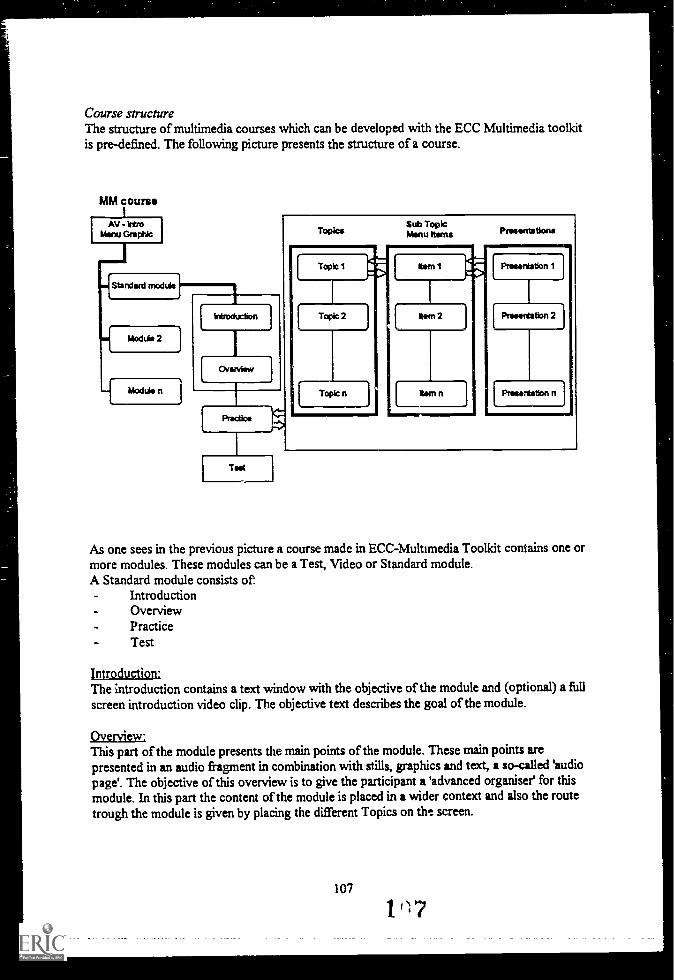
Course structureThe structure of multimedia courses which can be developed with the ECC Multimedia toolkitis pre-defined. The following picture presents the structure of a course.
MM COWS*
AV - item IMenu Grepi*
miStandard rroodde
44 Module 2 I
Module n
TopicsSub TopicMenu Items Presentations
Preece:sten 1
Pnieontabon 2
Presentabon n
As one sees in the previous picture a course made in ECC-Multimedia Toolkit contains one ormore modules. These modules can be a Test, Video or Standard module.A Standard module consists of.
IntroductionOverviewPracticeTest
Introduction:The introduction contains a text window with the objective of the module and (optional) a fiillscreen introduction video clip. The objective text describes the goal of the module.
Overview..This part of the module presents the main points of the module. These main points arepresented in an audio fragment in combination with stills, graphics and text, a so-called 'audiopage'. The objective of this overview is to give the participant a 'advanced organiser' for thismodule. In this part the content of the module is placed in a wider context and also the routetrough the module is given by placing the different Topics on the. screen.
107
Practice.In this part of the module the participant must answer questions and can get more informationby selecting presentations. These presentations are made by using the multimedia database.Hints can be provided for selecting the right presentation.
Test:The test consists of questions without feedback. After the test a study advice will be given tothe participant.
Multimedia database:Information will be presented in a 'information bank organised around the topics in theoverview. Clicking on a topic in the information retrieval can give direct presentation or a submenu with 'sub menu items'. Each item contains a presentation.
Presentations consists of audio pages, static pages or video pages and are presented in awindow on the right-hand side of the screen. Video pages consist ofan specific audio-videofragment.An audio page contains an audio fragment (mostly a narrator speaking) with a series of stills,graphics or text. A static page is also an audio page with only one still, graphic or text.
The other module types are Test and Video module. The Test module contains only questionsand no feedback. After the test the score will be presented. A video module contains a videofragment to be presented after a target text in a window.
Course definitionAfter one has started the ECC multimedia toolkit the computer presents a screen, in which onedefines the course.
Here one can:edit the title of the course;define the language, in which the texts and buttons are being presented;select the video fragment, which will be presented as the trainees start-up the course;select a menu graphic, which will be presented after the opening video fragment. Themodule names are presented over the menu graphic;edit the dictionary (book), which contains explanations of relevant words used in thecourse. During the course the trainees can look up these words.
Creating and editing a modukEach module may consist of:
introduction and overview;presentation organised in topics and items;standard tasks or exercises consisting of multiple choice, multiple select and matchingassignments;task tests consisting of multiple choice, multiple select and matching assignments.
108
Introduction of a standard moduleThe introduction of a standard module is always presented to the trainees at thestart of amodule.An introduction may consist of:
target presentation;video presentation (optional);audio presentation (overview).
The introduction starts presenting the target text, which describes the objectives of the moduleselected by the trainees. Subsequently the course may show a video, which is followed byanoverview of the module. This overview consists of an audio presentation combined with topicnames, stills, graphics or text. The function of the overview is an 'Advance Organize?.
An audio presentation can be combined with topics, stills, graphics or texts, which are shownin the list with scrollbars as filenames.
Creating presentationsThe presentations are hierarchically organised. Each module has one or more topics, whichmay includes items. An item leads directly to a presentation.
There are three types of presentations one can create:vid,..o presentations;audio presentations;static page presentations.
Audio An audio fragment combines an audio fragment with a series of graphics, stills or texts,and can thus be compared with a 'slide show'. Such a fragment usually comprises ofmore than one page.
Static This is a presentation of one page containing graphics, stills, text or a combination ofthese images.
Video A video only shows sn entire video fragment.
Editing presentations
Audio pageAn audio page shows an audio fragment combined with one or more graphics, text or stills.
'x / For each page one has to define:the filename;type of image (still, graphic or text);timing (the time of appearance of the image in the audio presentation);position on the screen (see below for type of lay-out);a visual curtain effect at the transition of pages.
109
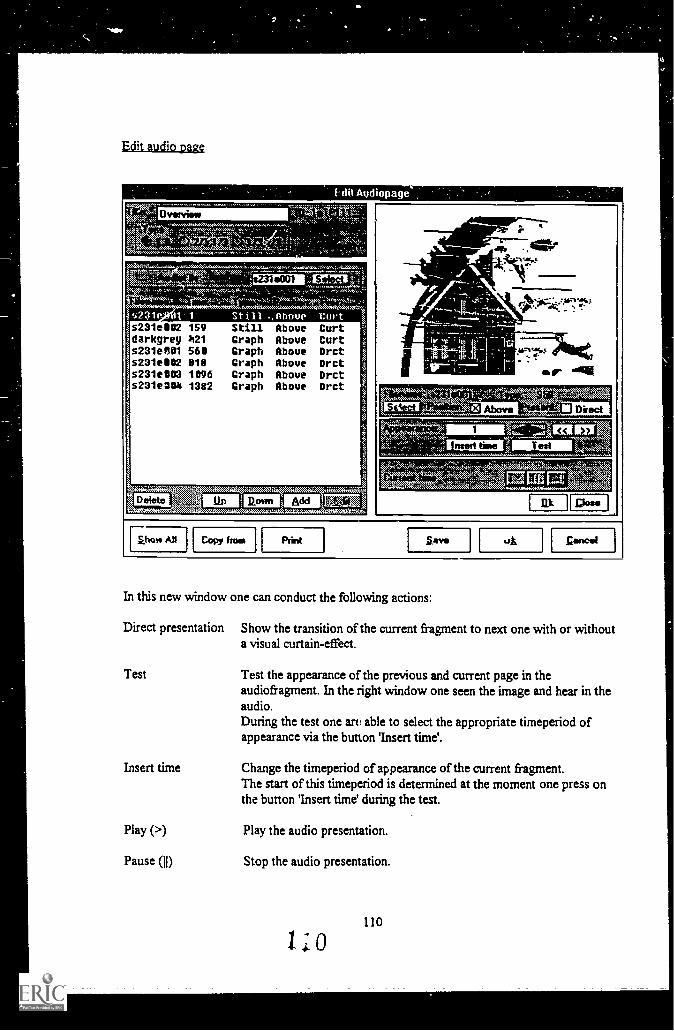
ser r
EddAuthopage
nee., e
,
- t.. rittc,- \\SOT,
4...,2315mil 1 St ill ., fthave tin t
a
N
stioset mit . 3%r4 Direct
-14-- -zqriiiiiir 71
illa-MMIL\ ,mod time
amt&out.\:1
Ppm
b,,3t 13 FT- kz.,1&a,av.,4a,v. .
S.aveMM_
I .1.1
I Mil
I I_
5 II
II
Lancet
II . 5
11 sa. r
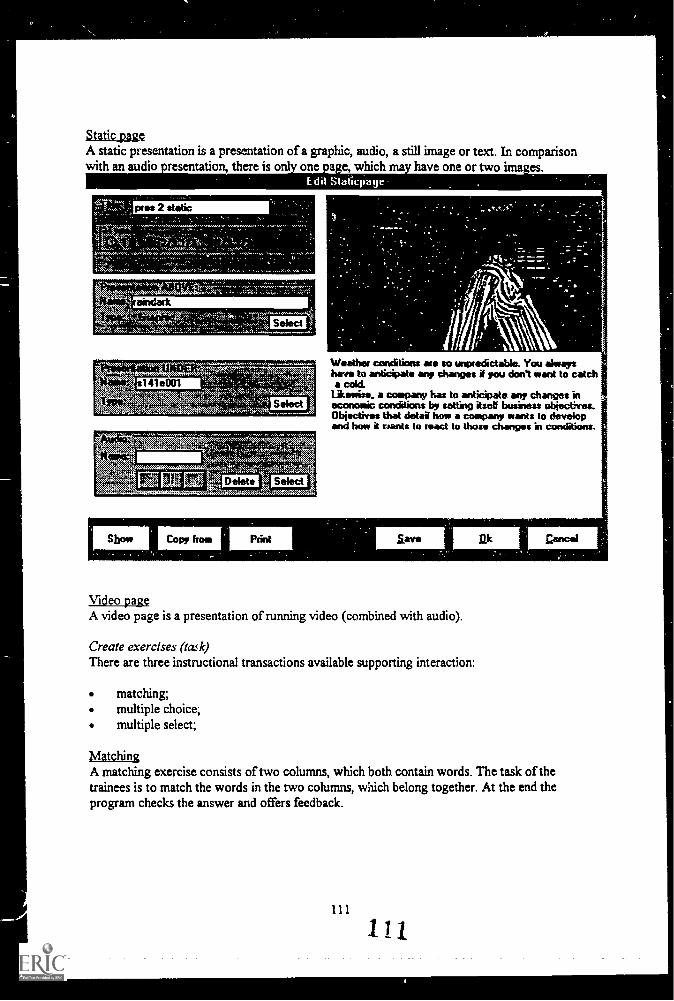
4<
ss,r ,
a .1 :. I
a s o :E tilt Statkpage
, ,,c,,
,
X"t" ' .'" Ze
141001
-`1=3:,,t4qtkat:44L
+;,' ;INA ,,s, s , "11F,' \.. ''''''''''",:"34.t:IZLe....4..v,,,,,,,..,:......1./4,,, i'44gta\ ''`0'4%V.''','.".....k:i
Delete,,,'
.
Seloct
.4
I
lave
. II
1
Multiple choiceA multiple choice exercise presents to the trainees a question text and 2 to 4 answer options.The answers can be presented as text or stills. The task of the trainees is to answer thequestion by selaling one option. The program checks the answer and offers feedback.
Multiple selectA multiple select exercise has an instruction text, a question text and two feedback texts justas the multiple choice has. The difference is that multiple select may contain more than onegood answer.After a response the program checks the answers and offers feedback.
Create testsTests make use of the same three interaction types, multiple choice, multiple select andmatching.
The instructor shellDifferent participants can be connected to a course by using the instructor shell.The instructor shell comprises of the following parts: authorisation, participants, install optionsand registration.
'Extending the authoring environment
So far the multi media toolldt has been described with its specific functionality. What if onewants new functionality? One could specify and implement for instance new presentationforms, new interactions or new support functions and integrate them into the existingenvironment. Also editors have to be adapted then. However, if there are essential changes inthe structure, one might build a new environment . Re-use will be made then of the lower leveldrivers. These drivers will often be customized to particular needs. Based on our experienceone can say that re-use is often possible to 50-80%.This approach has proven to be optimal in terms of development costs and client demands. Wethen compare this approach on one hand with making use of tools having no flexibility and onthe other hand with developing each application from scratch with a regular programmingenvironment.
Putting multimedia into practice
Mark Vegting
Abstract
In this paper, a description of how multimedia can effectively be used in practice is presented.Two applications are discussed, which were both developed for a touroperator. Oneintroduction course and one course on basic sales skills. In both courses a combination ofinstructionally relevant multimedia information retrieval and questioning was used. Evaluationshows that the goals were met and participants were satisfied with the results.
The company
SUN Interneknal is a Tour operator, based in Belgium. The company operates in fourdifferent countries: Belgium, the United Kingdom, the Netherlands and France. The companystarted in the early fifties as a small one-man company, arranging transport for Englishtravellers who came to Belgium. Later, they were transported from Belgium to theMediterranean Sea and the Alps. Adding more and more services, the company grew larger. Itbegan to organise the transport and activities itself In the seventies, the company took over animportant player in the Belgium travel industry. In the eighties many shares were sold, but themajority remains in the hands of the founder. Because of the developments in the travelindusty and in the European Community, Sun International decided that it was important tobecome a real international firm. The capital that was drawn with the selling of the shares wasinvested in the take over of other companies, e.g. in the UK. The latest merger took place in1992, also in the UK. Sun International now offers a great variety in travel industry services.From bulk travels to specialised city trips for a great deal of travellers. This is realised througha conglomerate of several separate companies. All these companies are part of SunInternational, but operate under their own name. The name Sun International is reserved forseveral general, centralised activities.
The target population
In the entire travel industry, and SUN International is no exception to this, there is a relativelyhigh turnover of personnel. This means that there is a continuous flow of new employees, whomust be introduced to the company, but who also must learn the reservation system and salesskills.There is a difference between the employees in the UK and on the continent. In the UK, theaverage level is secondary education. The target population can be typically summarised as 18year old girls. Although there are also some men and some older women in their fifties. On thecontinent, the level of education is higher: most of the workforce has attended some years ofhigher vocational education. Consequently, the average age is higher: around 20.In general, the employees only speak their own native language.
113
1 I 3
The need
Due to the rapid growth in the eighties and nineties, some reorganisations were necessary. Thenewly acquired companies and internal changes, combined with the high turnover-rate, led tothe situation where many employees did not have a good overview of the activities of thecompany. Also, did they lack a feeling of corporate identity. They also were unable to positiontheir own activities within the activities of the company.Also, many employees were not sufficiently equipped to perform their tasks 100% well.Several causes were due to this: The rapid growth of the company, different reorganisations,and the desire to implement new management styles. The latter cause meant (amongst others)empowerment of the employees. The tasks of the employees were expanded. For example: theseparate 'complaints department' was integrated in the sales-function. But also the reservationsystem that was used was going to be changed. Although the intentions of the managementwere good, the skills of the employees to perform all these tasks had not been upgradedadequately.
In general terms, the need for training can be summarised as follows:Lacking the insight in Sun International's corporate identity;Unclear organisation structure;Insufficient knowledge of tl..e activities of their own company;Insufficient sales skills;Insufficient product know.edge;Turn over of new employees.
The objectives
The needs that were identified led to corresponding objectives. But Sun International also hadadditional objectives. For example, it wanted participants to regard Sun International as acompany with a 'human face', a company that cares for its employees. To realise all this, twoapplications were developed: a 5 hours multimedia application to develop the attituderegarding the corporate identity, called SIIC (Sun International Introduction Course), and an 8hours multirredia-application focusing on the product knowledge, systems knowledge andsales-skills, called SISI (Sun International Sales Introduction).SIIC was to develop the feeling of a corporate identity and to explain the organisationalstructure, as well as the benefits of being part of a large organisation. The applicationintroduced participants also to all the companies activities.Both applications were created in two languages: English and Dutch. The French version willbe created later.
The rationale
Why was multimedia chosen as a solution for the identified needs and this target population?The main reasons are the establishment of a corporate identity and showing a human face. Acorporate identity is intangible. An important aspect of it however, has to do with the attitudeswithin a company. A positive attitude towards the company is inevitable of course. Situationsin which attitudes have to be developed can very well be supported by using realistic images
I 4 114
and role modelling. Another reason was thc motivational aspect of using audio and/or video.Above this, multi-sensory environments have a big impact on people, because it comes close toreal world situations. This leads to easy association with own experiences and consequentlybetter retention. Another goal of the application was to give the employees the feeling that thecompany cared for them. A multimedia environment, was a way to realise this.Other arguments can be found in the business the company is operating in. The travel industryis very much visually oriented. Nice pictures of holiday destinations serve as the best sellingargument. The employees are confronted with this every day. The application had to beconnected to this way of presenting information. Another practical reason was that the libraryof photographs with Sun International was very big.By making use of different media it was possible to make advantage of the medium that wasmost suitable for its purpose. Because running video (if at the right time) can have the highestimpact on people, this was reserved for the most important elements of the application like thewelcoming speeches and the presentations on the cornerstones of the company. Althoughpictures can tell more than a thousand words, it is in most cases very useful to have someadditional explanation of the pictures. That is where narrators were used. If the narrator'sinformation was really crucial for the participants, the story was supported by bullet points. Allthese media could be combined in one application on a PC. And alternation between the bestsuited medium led to an efficient, attractive application.
The application
Both SIIC and SISI are comprised of different modules. For SHC, there are some generalmodules, which are the same for all employees, and one company-specific module. Thecompany-specific modules, contain elements which only relate to the activities of that specificcompany. For example, the countries or cities they focus on, the brochures they use, the peoplewho work there, etc.. These company specific modules will only be taken by participants whowork with that specific company. After logon, the participants will be directed to those parts ofthe contents that relate to their company.
SIIC is comprised of eight modules:Pre-testIntroductionThe travel IndustryThe history of SUNSUN as a groupCompany-specific inoduleTestYou and SUN.
A pre- and post-test are included to be able to assess an increase in knowledge with theparticipants in their current knowledge about the elements that are covered in the application.These tests are comprised of 20 multiple choice questions. The first 15 questions of each testcover the general modules, where the last 5 questions are on the company-specific module.The pre-test appears only the first time the participant starts the application. After theparticipant has finished it, the participant is confronted with a main menu. Here, the participantis free to choose any module.
115
115
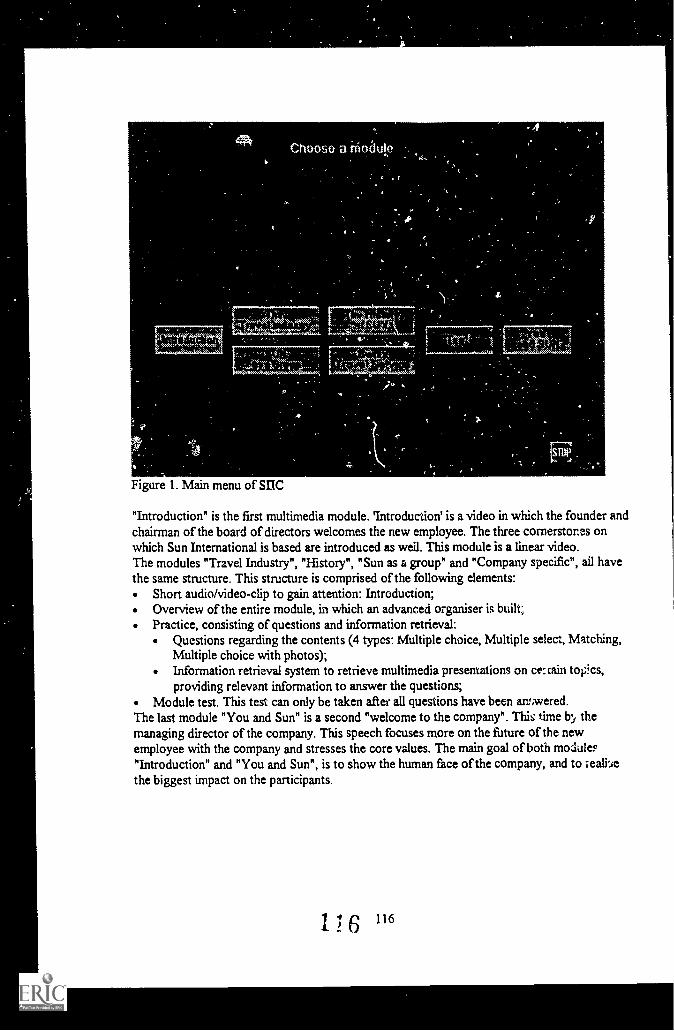
+WS,
Figure 1. Main menu of SI1C
"Introduction" is the first multimedia module 'Introduction' is a video in which the founder andchairman of the board of directors welcomes the new employee. The three cornerstones onwhich Sun International is based are introduced as well This module is a linear video.The modules "Travel Industry", "lEstory", "Sun as a group" and "Company specific", ail havethe same structure This structure is comprised of the following elements
Short audio/video-clip to gain attention Introduction;Overview of the entire module, in which an advanced organiser is built,Practice, consisting of questions and information retrieval.
Questions regarding the contents (4 types. Multiple choice, Multiple select, Matching,Multiple choice with photos);Information retrieval system to retrieve multimedia presentations on ce:rain topcs,providing relevant information to answer the questions;
Module test. This test can only be taken after all questions have been amwered.The last module "You and Sun" is a second "welcome to the company". This time Ix/ themanaging director of the company. This speech focuses more on the future of the newemployee with the company and stresses the core values. The main goal of both moduleF"Introduction" and "You and Sun", is to show the human face of the company, and to 1-ea1i..iethe biggest impact on the participants.
116 116
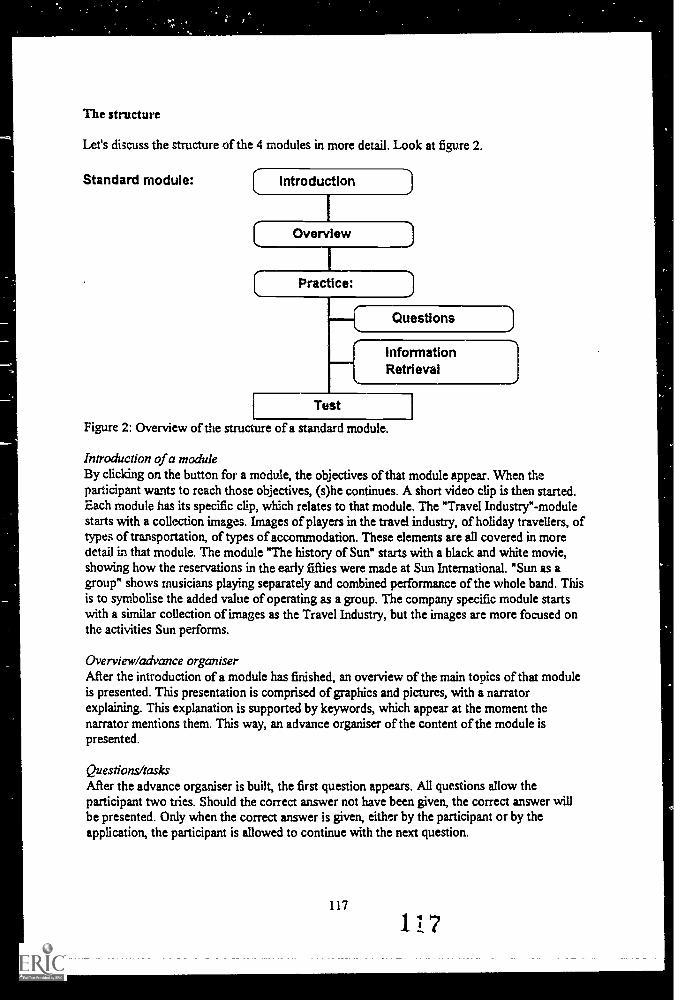
The structure
Let's discuss the structure of the 4 modules in more detail. Look at figure 2.
Standard module: Introduction
Overview
Practice:
Questions
informationRetrieval
Test
Figure 2: Overview of the structure of a standard module.
Introduction of a moduleBy clicking on the button for a module, the objectives of that module appear. When theparticipant wants to reach those objectives, (s)he continues. A short video clip is then started.Each module has its specific clip, which relates to that module. The *Travel Industry"-modulestarts with a collection images. Images of players in the travel industry, of holiday travellers, oftypes of transportation, of types of accommodation. These elements are all covered in moredetail in that module. The module "The history of Sun" starts with a black and white movie,showing how the reservations in the early fifties were made at Sun International. "Sun as agroup" shows musicians playing separately and combined performance of the whole band. Thisis to symbolise the added value of operating as a group. The company specific module startswith a similar collection of images as the Travel Industry, but the images are more focused onthe activities Sun performs.
Overview/advance organiserAfter the introduction of a module has finished, an overview of the main topics of that moduleis presented. This presentation is comprised of graphics and pictures, with a narratorexplaining. This explanation is supported by keywords, which appear at the moment thenarrator mentions them. This way, an advance organiser of the content of the module ispresented.
Questions/tasksAfter the advance organiser is built, the first question appears. All questions allow theparticipant two tries. Should the correct answer not have been given, the correct answer willbe presented. Only when the correct answer is given, either by the participant or by theapplication, the participant is allowed to continue with the next question.
117
117
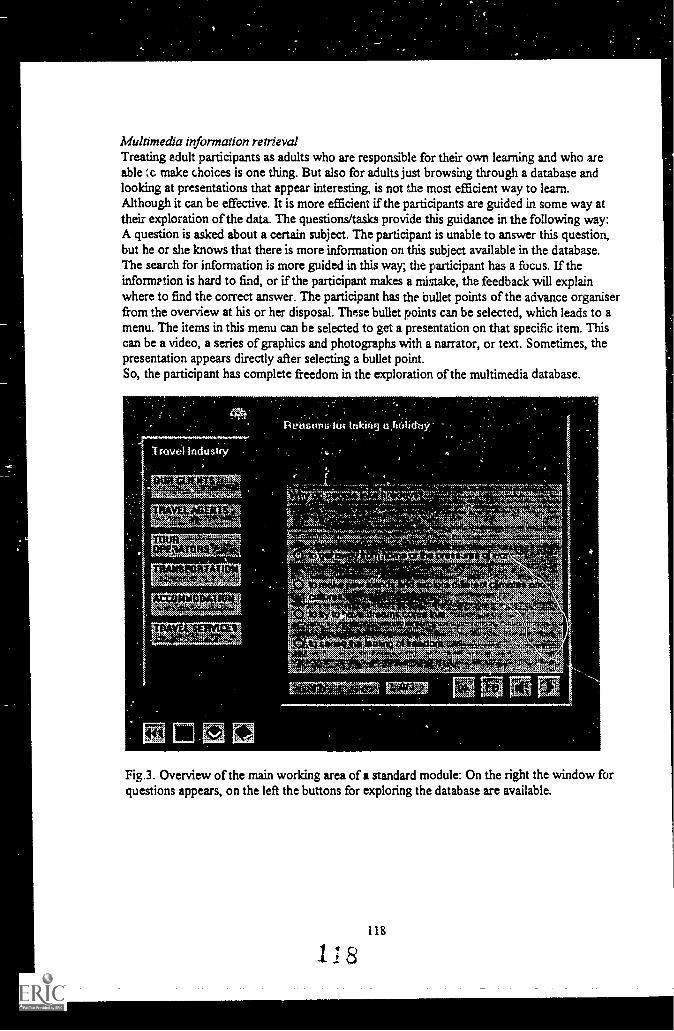
1 IP .
I I 5 11 8....
e .... : 1 0 ! I 4
11...., is
I i il a
8 11 6 8 , I I 4 11
a ...8 8 I I I 8 . a
# 11 11 . 11 0 . .
II ! a a
a a II 1 V 9 f 11 . 11
f I a I I a . 1. .
1 a . a w a a
8 11 ! I 11 IfV .1 a a 1 a !II 11
11 11
.. 8
I D I
Travel industry
.p7:7171111/4kimaalsqk(4.-caw4
4rT:juP",1
ivt*
11
Rensuns lor tnking t !solid:1y
:t.3.>-4":', <4.7`.2,6A Vot.t.I,
s-z<:;z 1,,z1,,vhli,rx.;
P.s.,A{114,1$':? "144,""4444gk4A kisS.k=
T.<44aiAkm.44A4.,,,
>=_4,i0V4k,Va,v
11-1,axd,,gmktti'
L777,E',17:r..271 r.Zrz 7:13 ,
11 1 a 8 I
as S I I 11
I
11
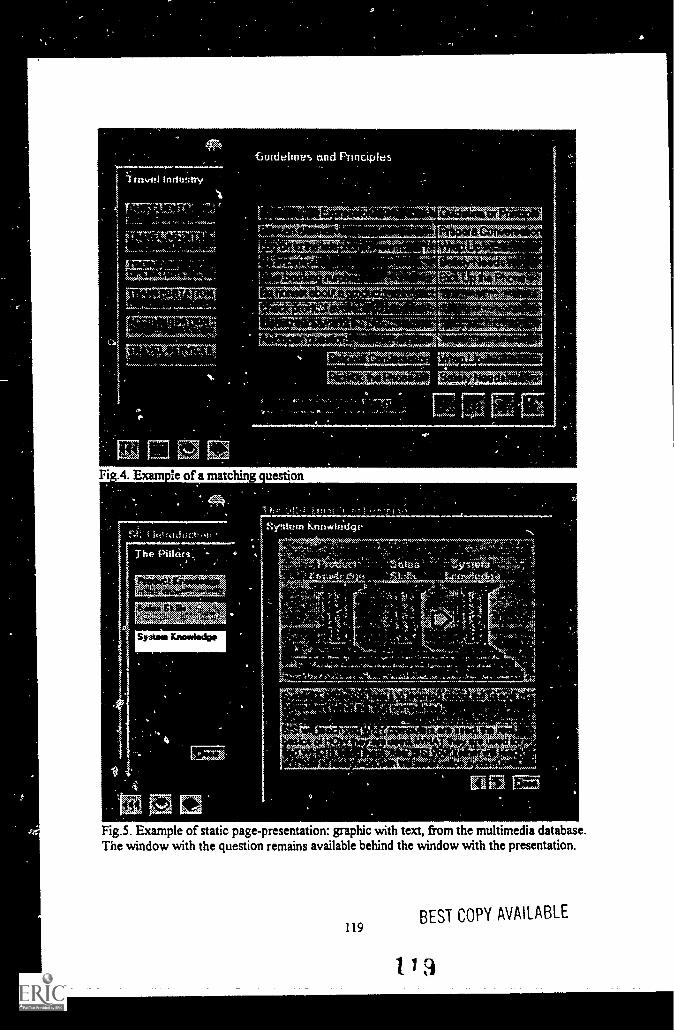
e
.....1.......,'Travel !mint:try
JE
'Guidelines and Ptinciples
F \. "\3.', -----, , -"'"-- .-1'117°`',Tr-s,r17,:f.'-':'. .1c ... ..... , r .... t.5.1 ......4,1221.4:&,,,..*., , ... N.....%.,114.2,4**C ....RI1...,scc*.K.,?1,...k.Kw" , , "" -c,.,- "."," IT7..wimmlnizz..w.,K,0<,... , i
1, c'1",,,-tv.-sq"..r. cc , ,c,55c3c.r. - 7 Ftvmccc.$14,c,,,,,- 4.,,
swfts.wftcp,..vors, ft, ss
4 5,:ct.:.A,,,c, , 5 .,-. L...,,,,,A1,,cichy, ,i ,,,,, .,c...k,,, r>,54.55,cct ..,15.,,,,,, ,, . , ,
c- , , c--:1,7cc,.,: c.5 4 t..vn-,,,,-.-.:ec;,.....,,,,-. s 1c , , ,e.....,......... t............... _ -,....L.,.4.....,...i .V..... c.,i....c .a.,..6.,,.ka.,.t..int$ .,,TV,SmtkokortsNn<%ftft,,tot wevftftfte.,,,,, , 5.5 tvl b A .,,,ftstrtprfttwft-,,,, -,,,,,,t4}5:, c..t.U.,,,,f.. 25,55°,.:4.'.,555.%,, 5, 5' :,"5.5=',,;,..!?r,..,44,,M. ,..1,.:,...,,NW' ., , - ,,,,- ,,,,,, -ft...i,.,,, , ...,,t,ra:.,c...,,XecV,stisx.,7-:,,A.ft.S.....ft:ft. x x . , . .,t,k,,,, .. ,..!: tt.,.A.C:e.',,,..:4-st,ft ,:.... :.'.
4 A1.1.,,,,,,,,,.....4.....,,,,,,,, ,s.,4,,,,:s. ,,,z,,s,..,::i t,..,.....,,1/4,,.,.4.,....,,..4't'l 47%.,-., " y,' -," " "vr ' - , s, s,
,r ,, ,s-ft.,,,ftAsczsnA`tcpcft3.1 ., , ..ft. ,.. -,...., ,,,,,,,,,, -, ?c,,,,,,-,.. s i
,a44,,,, ,,,,,,,;,,,,,,,,k,,,,,,,,,,,,,,wki ,,1,,,,ga,),,,,.),I.,),,,,,,,,A
Lkra.*:441
.4
,1,37,7Ts,k"&T Ir-41-1,7557,7
4 ., , i s i'
44,,,,to, i +q,ez.v.x 7....:,' p.m..., 'ai,
F,t 1,1t0,1, tr-The Pl1fors. -
- 1:Yra;ft. sail&
2yntem Knowledge
n'atr.,5 we I..' :2, 1,
^1 '
55555g.'
; 5.5"411 p
T I "4,
c OS
N) (.2
, t
A1
<
" S SSS5s
S A
4
''
;
wirr7147e, .4.41,cmc
AsAfrrs
cf>,(p
e
Fig.5. Example of static page-presentation: graphic with text, from the multimedia database.The window with the question remains available behind the window with the presentation.
119BEST COPY AVAILABLE
1 9
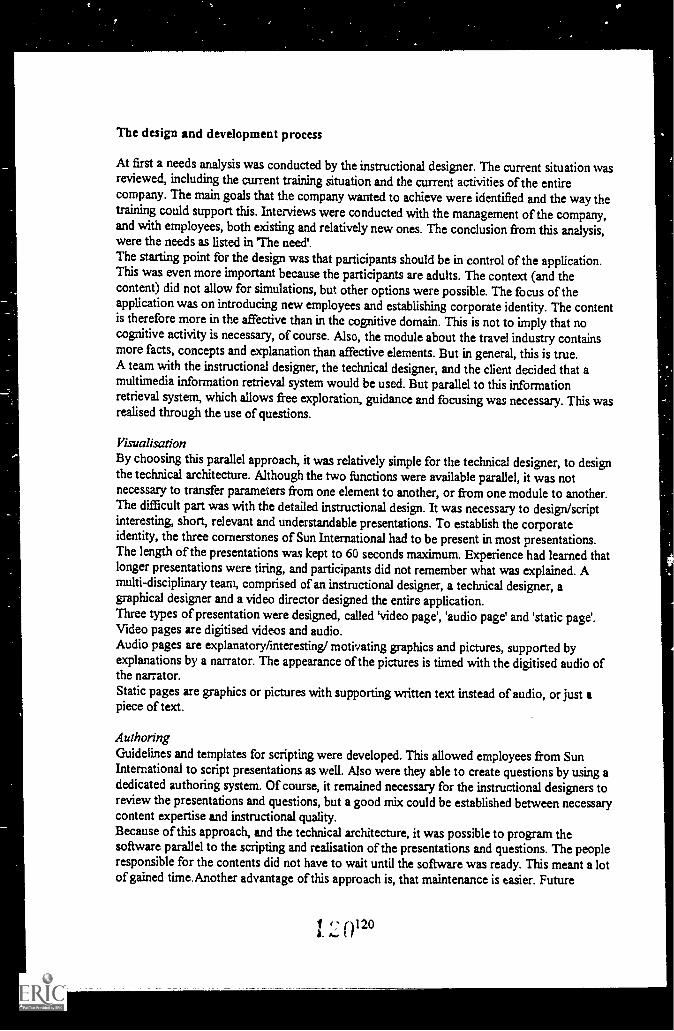
The design and development process
At first a needs analysis was conducted by the instructional designer. The current situation wasreviewed, including the current training situation and the current activities of the entirecompany. The main goals that the company wanted to achieve were identified and the way thetraining could support this. Interviews were conducted with the management of the company,and with employees, both existing and relatively new ones. The conclusion from this analysis,were the needs as listed in The need'.The starting point for the design was that participants should be in control of the application.This was even more important because the participants are adults. The context (and thecontent) did not allow for simulations, but other options were possible. The focus of theapplication was on introducing new employees and establishing corporate identity. The contentis therefore more in the affective than in the cognitive domain. This is not to imply that nocognitive activity is necessary, of course. Also, the module about the travel industry containsmore facts, concepts and explanation than affective elements. But in general, this is true.A team with the instructional designer, the technical designer, and the client decided that amultimedia information retrieval system would be used. But parallel to this informationretrieval system, which allows free exploration, guidance and focusing was necessary. This wasrealised through the use of questions.
VisualisationBy choosing this parallel approach, it was relatively simple for the technical designer, to designthe technical architecture. Although the two functions were available parallel, it was notnecessary to transfer parameters from one element to another, or from one module to another.The difficult part was with the detailed instructional design. It was necessary to design/scriptinteresting, short, relevant and understandable presentations. To establish the corporateidentity, the three cornerstones of Sun International had to be present in most presentations.The length of the presentations was kept to 60 seconds maximum. Experience had learned thatlonger presentations were tiring, and participants did not remember what was explained. Amulti-disciplinary team, comprised of an instructional designer, a technical designer, agraphical designer and a video director designed the entire application.Three types of presentation were designed, called 'video page', 'audio page' and 'static page'.Video pages are digitised videos and audio.Audio pages are explanatory/interesting/ motivating graphics and pictures, supported byexplanations by a narrator. The appearance of the pictures is timed with the digitised audio ofthe narrator.Static pages are graphics or pictures with supporting written text instead of audio, or just apiece of text.
AuthoringGuidelines and templates for scripting were developed. This allowed employees from SunInternational to script presentations as well. Also were they able to create questions by using adedicated authoring system. Of course, it remained necessary for the instructional designers toreview the presentations and questions, but a good mix could be established between necessarycontent expertise and instructional quality.Because of this approach, and the technical architecture, it was possible to program thesoftware parallel to the scripting and realisation of the presentations and questions. The peopleresponsible for the contents did not have to wait until the software was ready. This meant a lotof gained time.Another advantage of this approach is, that maintenance is easier. Future
tz. (p 20
changes, which are continuous, are anticipated, and can be implemented easily. If necessary bythe client.
The evaluation results
The scores on the pre- and post-test are registered by the application. These results give somequantitative information about the increase in knowledge. It gives no qualitative informationhowever about the application, or the perception of it by the participants. To get some moreinformation about this aspect, all participants filled out an evaluation sheet. For each module,participants can evaluate four aspects:
The length of the moduleThe relevance of the contentThe achievement of the objectives of the moduleOverall quality of the module
Each aspect could be scored on a five point scale [Excellent, Good, Fair, Marginal, Poor]
Although there are some differences between the modules, the general rating is verysatisfactory. The length of the modules is by 85% of the participants regarded as Good orExcellent.The relevance of the content of the modules is for some participants Pair' (15%), although still70% of them rated the content at Good or Excellent. Most participants (85%) thought that themodules achieved their objectives, and the overall quality was also for 85% of the participantsgood or excellent.
The same questions are asked for the course as a whole, with more or less the same result. Atthis overall level, an additional question on the quality and appropriateness of the instructionalmaterials and media is asked. The majority (55%) thought it was excellent. And 90% of theparticipants rated this question with Good or Excellent.These results are rather impressive. The objective is of course to achieve a 100% score, but theachieved percentage makes the day of the designers and developers. It is a high score intraining.
The participants had the opportunity to give their general remarks as well. Here, the generalopinion is that there are some questions in the test that are not clear. Most people think it is agood introduction for new employets, although some of the current employees think that itmay be too much information in a short time-span. Participants tend to like the module on thehistory of Sun very much. The content itself and the fact that it is explained in a multimedialway is perceived as very interesting.Some people said that the course would not influence their motivation or attitude, becausetheir interest is only with their own company. They did not want to be confronted with the factthat Sun International is a multinational company. On the other hand, some participants, e.g.from the bookkeeping department were very enthusiastic about these aspects. They were neverconfronted with these aspects, so it gave them a broader view on the company.Most participants (and this is supported by the results on the tests) mentioned that they learneda lot. This is also true for participants who have worked with Sun International for some years.
121
121

,
Conclusion
The evaluation shows that most of the needs were satisfied. The participants all know the corevalues as they state in their remarks. The structure of the organisation has become more clear.It gives participants a good perspective of the activities that the company performs.
122
Iii r )i.,,, 1.,,,
Adaptable Educational Computer Simulations
Willem Jaap Zwart, Albert F.1. Rhemrev, André M. Ber loth
Introduction
Using interactive computer simulations, learners can explore a domain by conductingexperiments and observing the effects of these interventions. In this way the learner gainsinsight into the dynamic behavior of a system. Educational computer simulations consistof a mathematical model representing the real system and an educational representation ofthe system in which the possibilities to intervene and observe are realized (van SchaickZillesen, 1990). The instructional strategy commonly used with this kind of educationalsoftware is 'discovery learning' or 'exploratory learning'.The use of this End of computer simulation is generally recognized as having greatpotential for learning and instruction (e.g. Reigeluth & Schwartz, 1989), because it isexpected to motivate, to invite the learner to actively discover the subject matter and toallow for unlimited practice in applying known concepts and in discovering relations.Essentially, computer simulation is a dynamic visualization of a system in the real world.An important design issue in the development of interactive computer simulations is theselection of visualization techniques used in the program. The seler... ted techniques shouldbe adequate representations of the shown phenomena and must be understood andinterpreted by the learner. Furthermore, the teacher, in his role as second author ofeducational software, should be able to change the visualization of the system in order toadapt the simulation to the needs of his students and to increase the correspondence withhis other educvional materials.
In the Opdcal Den Rnet project (ODB-Project, Benebreurtje & Verhagen, 1992) anattempt is math to develop methods and techniques for the design of reusable multimediadatabases. These databases should be suitable for multiple target groups and multipleinstructional strategies. Therefore, the teacher is allowed to change the content of thedatabase and the instrucdonal patterns for the learner. The databases are multimedia:text, computer graphics, video, sound and interactive computer simulations are integratedinto one system.
The simulations implemented in this project allow for multimedia visualizations as well.An example of this kind of simulations is the renneting simulation (figure i). Thepurpose of renneting is the separation of cheese material in the milk (casein-micelles)from the liquid portion (whey). This can be accomplished by the addition of a specificenzyme which causes the casein-micelles to stick together. The process is influenced byseveral factors including pH of the milk, temperature and amount of rennet and amount ofcalcium chloride added to the milk. The model is capable of calculating the changes inthe milk with time. The calculated entities involve the amount of casein left in the milk,the amount of para-casein, the amount of para-casein that is matted together and the
123
123
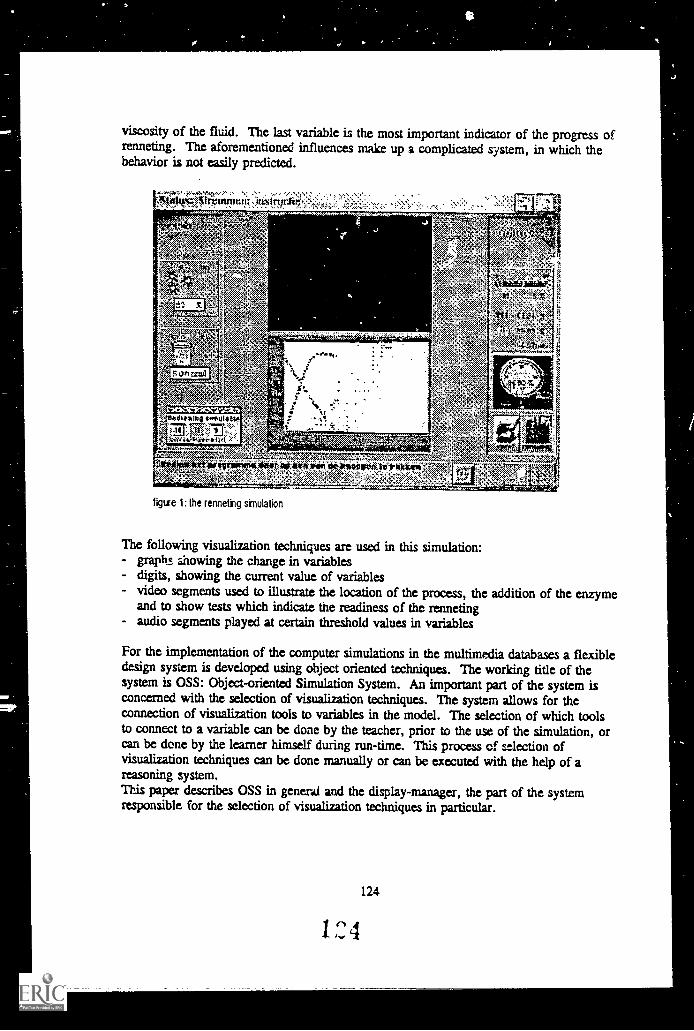
Wifr
viscosity of the fluid. The last variable is the most important indicator of the progress ofrenneting. The aforementioned influences make up a complicated system, in which thebehavior is not easily predicted.
Beatillhq 4340U141i4
"4
figure 1: the rennethg simulation
oiavicioftl.vw7%'
osift."Akfeririiiiii.ii.litlli -1... ...................
The following visualization techniques are used in this simulation:- graph.s showing the change in variables- digits, showing the current value of variables- video segments used to illustrate the location of the process, the addition of the enzyme
and to show tests which indicate the readiness of the renneting- audio segments played at certain threshold values in variables
For the implementation of the computer simulations in the multimedia databases a flexibledesign system is developed using object oriented techniques. The working title of thesystem is OSS: Object-oriented Simulation System. An important part of the system isconcened with the selection of visualization techniques. The system allows for theconnection of visualization tools to variables in the model. The selection of which toolsto connect to a variable can be done by the teacher, prior to the use of the simulation, orcan be done by the learner himself during run-time. This process of selection ofvisualization techniques can be done manually or can be executed with the help of areasoning system.This paper describes OSS in general and the display-manager, the part of the systemresponsible for the selection of visualization techniques in particular.
124
124
Instructional desige for computer simulations
Instructional design theories aim at prescriptions for the process of designing instruction.Although educational computer simulations are seen as an important instructionalapplication, instructional design theories for educational computer simulations are scarce.Especially the choice of visualization techniques is a issue that seems to be underexposed.Winer and Vizquez-Abad (1981) try to develop a theoretical framework for educationalsimulations. They state that educational simulations should 'represent the actual varietyof the system under study" (p.116). They observe that many simulations do not meet thisrequirement, thus severely constraining the range of interaction and the 'discovery' valueof the simulation. They use the levels of knowledge representation of Bruner (symbolic,iconic and enactive), to describe the levels of interaction that learners should experience.These levels provide the learner "with a rich, integrated framework of knowledge onwhich to build a complete understanding' (p.116). The prescriptions for the use ofvisualization techniques are limited to the statement that graphic or pictorialrepresentations can be easily incorporated.
The instructional design theory for educational simulations by Reigeluth and Schwartz(1989) focuses on a classification of educational simulations and the learning processeswith these simulations. They distinguish:- procedural simulations- process simulation- causal simulations.
These classes of simulations vary in learning goals and instructional strategies. The levelof interaction allowed to the learners changes accordingly. In their view proceduralsimulations need the highest level of interaction and causal simulations the lowest. Thislevel of interaction is expressed by the number of variables accessible to the learner. Noprescriptions on the way of interaction are given.In the area of learning processes Reigeluth and Schwartz distinguish acquisition,application and assessment. In the phase of application generalization, automatizationand utilization are important. All of these processes need adequate visualization, butexcept general statements on the relation between fidelity and the prior knowledge of thelearner, no prescriptions on this are given.
van Schaick Zillesen (1990) gives a general model of educational computer simulations(figure 2)
125
1 25
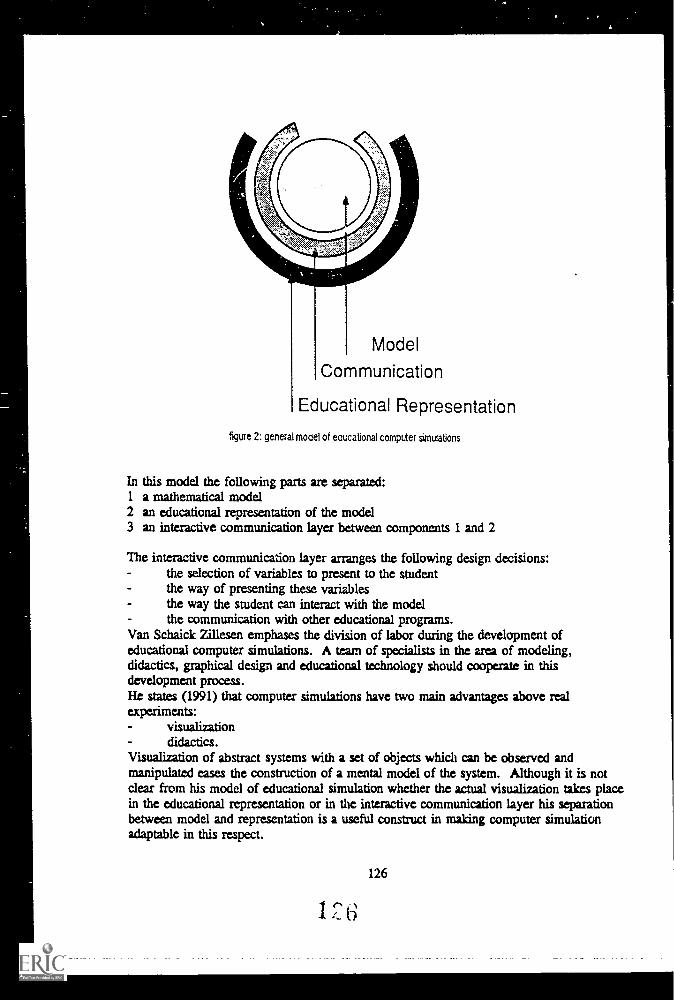
Model
Communication
Educational Representation
figure 2: general mocel of ecucational computer simulations
In this model the following parts are separated:1 a mathematical model2 an educational representation of the model3 an interactive communication layer between components 1 and 2
The interactive communication layer arranges the following design decisions:the selection of variables to present to the studentthe way of presenting these variablesthe way the student can interact with the modelthe communication with other educational programs.
Van Schaick Zillesen emphases the division of labor during the development ofeducational computer simulations. A team of specialists in the area of modeling,didactics, graphical design and educational technology should cooperate in thisdevelopment process.He states (1991) that computer simulations have two main advantages above realexperiments:
visualizationdidactics.
Visualization of abstract systems with a set of objects which can be observed andmanipulated eases the construction of a mental model of the system. Although it is notclear from his model of educational simulation whether the actual visualization takes placein the educational representation or in the interactive communication layer his separationbetween model and representation is a useful construct in malting computer simulationadaptable in this respect.
126
In the second generation instructional design model (IDa by Merrill, Li and Jones (1991)a ci man separation of domain knowledge and representation is proposed. Theinstructional transaction theory assumes that the lack of separation in current authoringtools is the main reason for the high development costs of educational software. Theypropose a library of 'transaction shells' which are reusable software components suitablefor a certain type of educational goal. Every transaction shell consists of an implementedabstract instructional algorithm. This abstract algorithm can turn in to a concreteeducational application by filling the transaction shell with:- a knowledge base, a system independent description of the subject matter
a resource database, containing system dependent representations of the subject(e.g. pictures, sounds etc.)
anda database with instructional parameters, describing for instance the sequence ofthe subject matter components and the instructional strategy used for thesecomponents.
Each database should be created by a specialist. The knowledge base by a subject matterexpert, the rrsource database by media experts and the database with instructionalparameters by an educational technologist. For the construction of the knowledge base asyntax is given (Jones, Li & Merrill, 1990) consisting of three types of frames (entities,processes and activities) with four kind of elaborations (attributes, components,hierarchies and associations). Examples of instructional parametexs are given for oneinstructional algorithm. Every transaction shells should however have its owninstructional parameters. Furthermore, it should be possible to change the parametersduring the delivery of instruction based on student model. Sample instructionalparameters in the 'portray knowledge' group are concerned with the representation of thesystem (Merrill, Li and Jones, 1992):- view (with possible values structural, physical and functional) indicates the
principal way the knowledge is representedmode (with possible values language, symbolic and literal) refers to the nature of aviewfidelity (with as possible values the range [low high]) refers to how close therepresentation resembles the real thing.
No prescriptions for the content of the resource database are given.
Applied to educational computer simulation and integrated with the model of van SchaickZillesen the following match can be made (Zwart, 1992). For educational computersimulations:
the knowledge base should contain a mathematical model of the systemthe resource database should include certain representation techniques to visualizethe behavior of the modelthe instructional database should included parametexs for the selection ofappropriate visualizition techniques.
From this it is clear in which part of a flexible educational computer simulation systemthe selection of visualization techniques should take place.
Collis and Stanchev (1992) pay attention to visualization, interactivity and intelligence astrends in computer based educational simulations. Although their paper addresses theseissues in the comext of micro-computer based laboratories (MBLs) the trends are
127
1 2 7
applicable to educational computer simulations based on mathematical models as well.With respect to the visualization in computer simulations they observe an increase inquality and quantity of vism1i7ntions. The speed of appearance and the graphics insimulation software are improving enormously. Integration of simulation with interactivevideo is used more and more. They distinguish five major types of visualization:
still and moving graphicssketches and drawingsdigitized photographsanimationsmoving video.
Collis and Stanchev sketch a cognitive-instructional grid including simple to morecomplex cognitive skills and different instructional strategies ranging from motivatinglearners to stimulation higher order thinking In the mapping of vismli7Ation techniqueson this grid they assume that "more and moving is better in terms of visualization, ... nomatter where one is on the cognitive-understanding grid* and that the more complex theinstructional task the more complex visualizations are desirable. These generalassumptions are then refined upon by the hypothesis that complex visualizations areparticular useful for orientation and motivation (simple tasks) and for higher orderthinking (complex tasks), but the more simple visualizations are suitable for enlargingknowledge and problem solving ("middle" tasks).
Min (1992) states that "a complete simulation learning environment consists of a series ofelements, the most important of which are:
highly visualized, graphical outputhighly visualized, conceptual, underlying mathematical models...." (p. 177).
He argues that different kinds of visualization and presentation should be presented to thelearner parallel. As visualization techniques he names a conceptual scheme of the model,output curves and "video-messages" as feedback. The wide range of different kinds ofvisualizations range from abstract to concrete. However, no prescription on the selectionof these techniques is given.
We can conclude that current instructional design theories give little explicit prescriptionson the selection of visualization techniques in educational computer simulations. Wedoubt if in the future general applicable prescriptions will appear. Too manycharacteristics of domain and learner are involved in this selection. The rather limitedresults of research in the area of interaction between treatment and aptitude directs ustowards more flexible learning environments in which design decisions can be made in alater phase of the life cycle of educational software. The best thing to hope for in thenear future are hypothesized guidelines, which need to be proofed by experimentalresearch.
Consequently, our system for the development of educational computer simulations isflexible in the choice of visualization techniques.
128
1"3
The system allows for adaptation, both in the preparation of a simulation by a teacher andduring the use of the simulation by the student, in:
which variable to displaywhich parameters can be changedhow parameters and variables are visualizedwhat should happen during the simulation runwhich model to use
Set-up of the system
The goal of our Object-oriented Simulation System (OSS) is to ease the development ofadaptable interactive educational computer simulations, that can be integrated withinmulti-media databases. Therefore, OSS has a strong separation of tasks over softwarecomponents, which can be configured separately. The communication between thecomponents is standardized. Components can be implemented in different programs,using multi-taslchig techniques. Although it is not the main development goal of OSS, thecombination of a strong separation of tasks and a standardized communication protocolallows for flexible configuration of components into a simulation environment as well.
Our system is divided into three main components:
the model manager, which handles calculationthe interaction manager, which handles the interaction and visualizationthe communication manager, responsible for all communication betweencomponents.
The whole system is managed by the simulation manager. Furthermore, other programscan communicate with the simulation. For example an instruction manager can change thesimulation during run-time or deliver additional domain knowledge. This allows aninstructor to interact with the model and the students.
The minimal simulation environment consists of one model manager, one communicationmanager and one interaction-manager. However, it is also possible to let more modelscommunicate with one interaction-manages, to let more interaction managers display theresults of the models or to add other managers to the envirunment. All the differentcomponents talk to each other via the communication-manager: they only need tounderstand the language the managers use. The separate components of a simulationenvironment need not to be running on one and the same computer. The communicationimplementation allows components to communicate over a network. This allows forinstance more than one student to work on the same simulation.
129
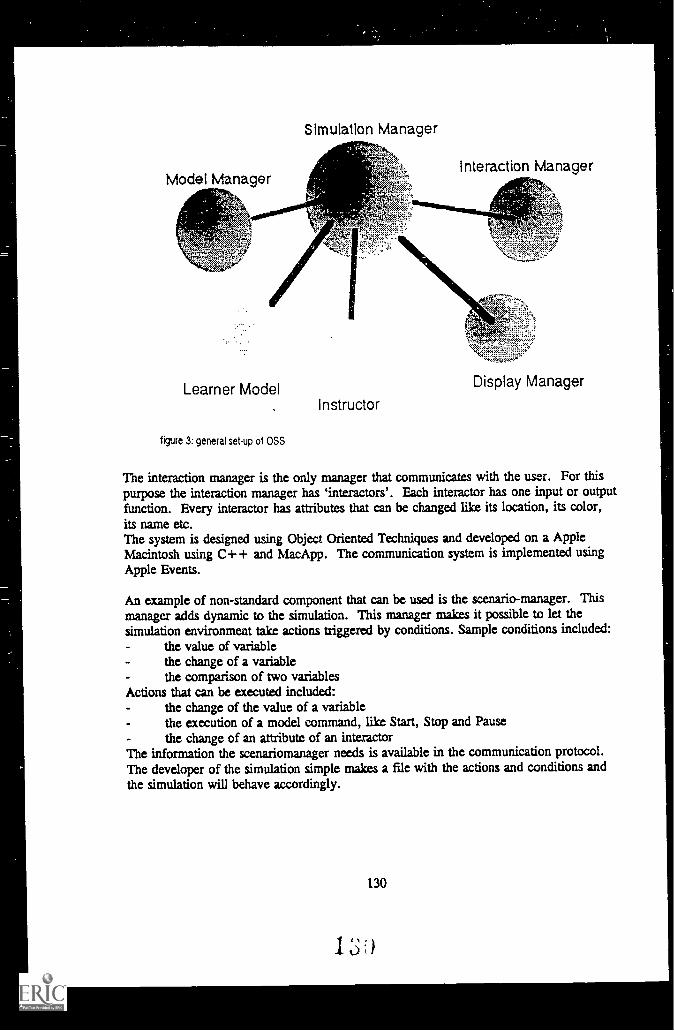
Model Manager
Simulation Manager
Interaction Manager
Learner ModelInstructor
figure 3: general set-up of OSS
Display Manager
The interaction manager is the only manager that communicates with the user. For thispurpose the interaction manager has 'interactors'. Each interactor has one input or outputfunction. Every interactor has attributes that can be changed like its location, its color,its name etc.The system is designed using Ob ject Oriental Techniques and developed on a AppleMacintosh using C+ + and MacApp. The communication system is implemented usingApple Events.
An example of non-standard component that can be used is the scenario-manager. Thismanager adds dynamic to the simulation. This manager makes it possible to let thesimulation environment take actions triggexed by conditions. Sample conditions included:
the value of variablethe change of a variablethe comparison of two variables
Actions that can be executed included:the change of the value of a variablethe execution of a model command, like Start, Stop and Pausethe change of an attribute of an intexactor
The information the scenariomanager needs is available in the communication protocol.The developer of the simulation simple makes a file with the actions and conditions andthe simulation will behave accordingly.
I
130
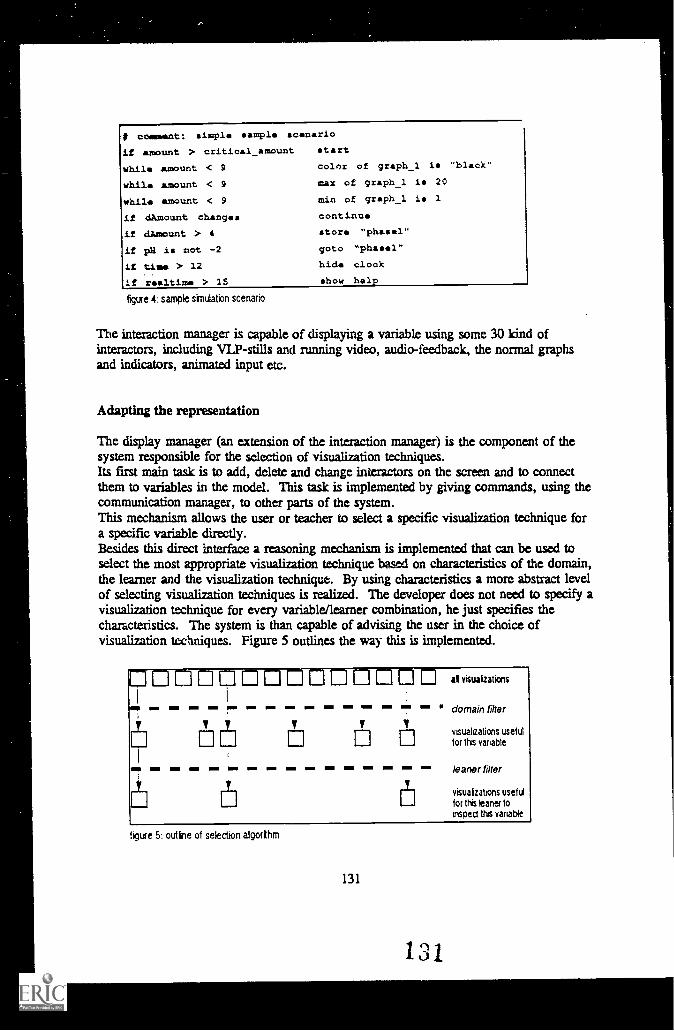
# comment: simple sample scenario
if amount > critical_amount start
while amount < 9 color of graph_l is "black"
while amount < 9 max of graph_l is 20
while amount < 9 min of graph_l is 1
if dAmount changes continue
if dAmount > 4
if pia is not -2
if time > 12
if realtimm > 15
store "phasel"
goto "phasel"
hid. clock
show help
figure 4: sample sinulation scenario
The interaction manager is capable of displaying a variable using some 30 kind ofinteractors, including VLP-stills and running video, audio-feedback, the normal graphsand indicators, animated input etc.
Adapting the representation
The display manager (an extension of the interaction manager) is the component of thesystem responsible for the selection of visualization techniques.Its first main task is to add, delete and change interactors on the screen and to connectthem to variables in the model. This task is implemented by giving commands, using thecommunication manager, to other parts of the system.This mechanism allows the user or teacher to select a specific visualization technique fora specific variable directly.Besides this direct interface a reasoning mechanism is implemented that can be used toselect the most appropriate visualization technique based on characteristics of the domain,the learner and the vismlization technique. By using characteristics a more abstract levelof selecting visualization techniques is realized. The developer does not need to specify avisualization t=hnique for every variable/learner combination, he just specifies thecharacteristics. The system is than capable of advising the user in the choice ofvisualization techniques. Figure 5 outlines the way this is implemented.
0=Elp=11:30 DEDEND i visugzations
[Li
" domain filter
visualizations usefulfor thrs vanable
leaner filler
visuakzations usefultor this leaner toinspect ths variable
.igure 5: outine of selection algorthm
131
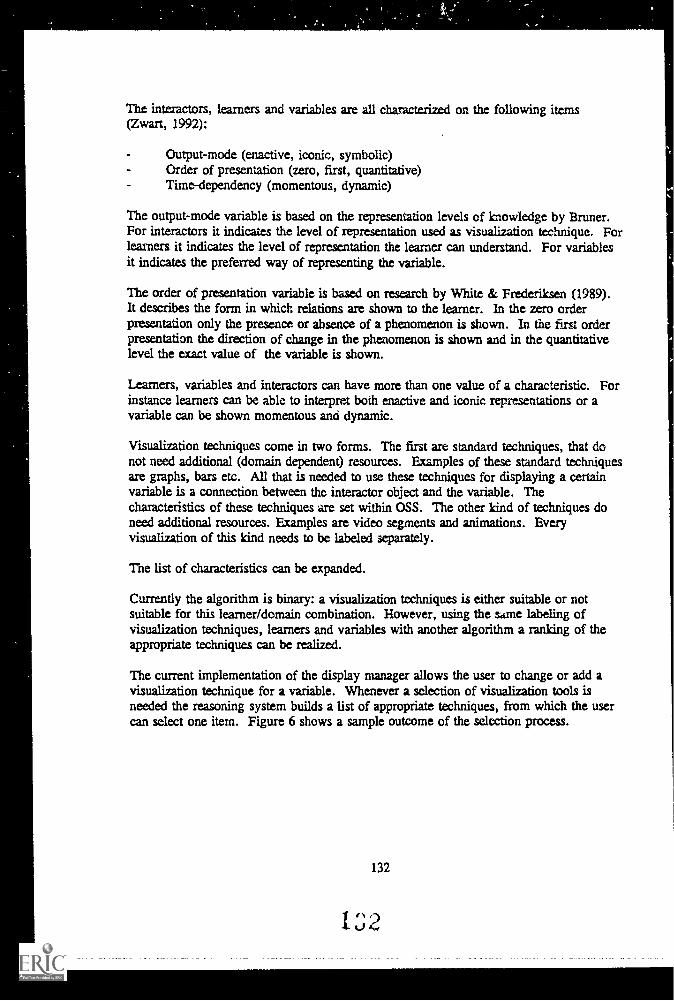
The interactors, learners and variables are all characterized on the following items(Zwart, 1992):
Output-mode (enactive, iconic, symbolic)Order of presentation (zero, first, quantitative)Time-dependency (momentous, dynamic)
The output-mode variable is based on the representation levels of knowledge by Bruner.For interactors it indicates the level of representation used as visualization technique,. Forlearners it indicates the level of representation the learner can understand. For variablesit indicates the preferred way of representing the variable.
The order of presentation variable is based on research by White & Frederiksen (1989).It describes the form in which relations are shown to the learner. In the zero orderpresentation only the presence or absence of a phenomenon is shown. In the first orderpresentation the direction of change in the phenomenon is shown and in the quantitativelevel the exact value of the variable is shown.
Learners, variables and interactors can have more than one value of a characteristic. Forinstance learners can be able to interpret both enactive and iconic representations or avariable can be shown momentous and dynamic.
Visualization techniques come in two forms. The first are standard techniques, that donot need additional (domain dependent) resources. Examples of these standard techniquesare graphs, bars etc. All that is needed to use these techniques for displaying a certainvariable is a connection between the interactor object and the variable. Thecharacteristics of these techniques are set within OSS. The other kind of techniques doneed additional resources. Examples are video segments and animations. Everyvismlization of this kind needs to be labeled separately.
The list of characteristics can be expanded.
Currently the algorithm is binary: a vistmlization techniques is either suitable or notsuitable for this learner/domain combination. However, using the same labeling ofvisnalintion techniques, learners and variables with another algorithm a ranking of theappropriate techniques can be realized.
The current implementation of the display manager allows the user to change or add avisnalintion technique for a variable. Whenever a selection of visualintion tools isneeded the reasoning system builds a list of appropriate techniques, from which the usercan select one item. Figure 6 shows a sample outcome of the selection process.
132
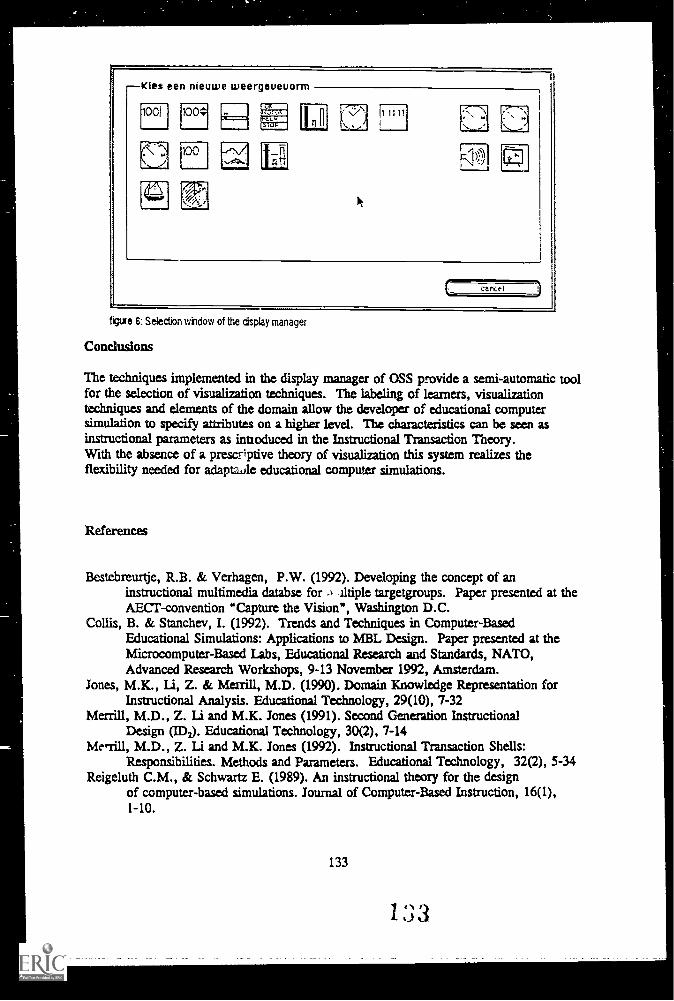
MEL
Kies een nieuwe weergeueuorrn
100-t
1004111
OF
51 OF
ig
cancrl
figure 6: Selection weidow of the &play manager
Conclusions
The techniques implemented in the display manager of OSS provide a semi-automatic toolfor the selection of visualization techniques. The labeling of learners, visualizationtechniques and elements of the domain allow the developer of educational computersimulation to specify auzibutes on a higher level. The characteristics can be seen asinstructional parameters as intioduced in the Instructional Transaction Theory.With the absence of a prescriptive theory of visualization this system realizes theflexibility needed for adaptadle educational computer simulations.
References
Bestebreurtje, R.B. & Verhagen, P.W. (1992). Developing the concept of aninstructional multimedia databse for targetgroups. Paper presented at theAECT-convention "Capture the Vision", Washington D.C.
Collis, B. & Stanchev, L (1992). Trends and Techniques in Computer-BasedEducational Simulations: Applications to MBL Design. Papa presented at theMicrocomputer-Based Labs, Educational Research and Standards, NATO,Advanced Research Workshops, 9-13 November 1992, Amsterdam.
Jones, M.K., Li, Z. & Merrill, M.D. (1990). Domain Knowledge Representation forInstructional Analysis. Educational Technology, 29(10), 7-32
Merrill, M.D., Z. Li and M.K. Jones (1991). Second Generation InstructionalDesign (ID2). Educational Technology, 30(2), 7-14
Merrill, M.D., Z. Li and M.K. Jones (1992). Instructional Transaction Shells:Responsibilities. Methods and Parameters. Educational Technology, 32(2), 5-34
Reigeluth C.M., & Schwartz E. (1989). An instructional theory for the designof computer-based simulations. Journal of Computer-Based Instruction, 16(1),1-10.
133

van Schaick Zillesen, P.G. (1990). Methods and techniques for the design ofeducational computer simulation programs and their validation by means ofempirical research. Ph.D. Thesis, University of Twente, Enschede.
van Schaick Zillesen, P.G. (1991). Ontwerpen van EducatieveComputer-simulaties. In: S. Dijkstra, H.P. Krammer & I.M. Pieters (eds.) Deonderwijskundig ontwerpex. Amsterdam: Swets &Zeit linger B.V.
White, B.Y. & Prederiksen, J.R. (1989). Causal modeLs as intelligent learningeavironments for science and engineering education Applied ArtificialIntelligence, 3, 167-190.
Winer, L.R. & Vázquez-Abad, L. (1991). Towards a theoretical frameworkfor educational simulations. Simulations and Games for Learning, 11(3). 114-119.
Zwart, WJ. (1992). Instructional Transaction Theory applied to ComputerSimulations. Paper presented at the European Conference on EducationalResearch, 22-25 june 1992, Enschede
134

A look at Multimedia
Jan Evers
Abstract
Multimedia land is not getting any clearer, lately. More and more the innocent PC-user runsinto names like Multimedia PC, Video for Wmdows, Indeo, CD-I, Quicktime and DVI. Whatdo these names mean, and what possibilities do they offer? This paper attempts to give aninsight in the world of multaJedia by describing the most significant possibilities of the use ofmultimedia.The application of multimedia requires a high capacity delivery system. Therefore, firstly thedefinition of multimedia applications and the display system requirements will be discussed.After that, a description of the most important multimedia platforms will follow: MultimediaPC (MPC) with Video for Windows and DVI, Apple Macintosh with Quicktime, Philips' CD-I. It is expected that MPC will play the largest role on the market. Therefore the final part ofthis paper will investigate the possibilities of this platform.
What is multimedia ?
A multimedia application is defined as a computer application in which more than one of thefollowing information or media types are integrated: text, graphics (animations), sound andvideo. A lot of the existing computer applications present both text and graphics. They are notcalled multimedia, however. Multimedia usually is not recognized as such until audio and/orvideo are being used.The high demand on computer hardware is a result of the application of audio and even more:of video. The amounts of data are that large (video: approximately 10 Mb per minute) that theneed for faster computers with more internal memory (RAM) and more storage capacityincreases. A PC based on a 80386 processor, 4 Mb RAM and 200 MB hard disc is notextravagant. Moreover, the presentation of acceptable quality audio and video requiresadditional hardware, existing of boards.The requirements for hardware used for development of multimedia requires even higher: withthese computers audio and video delivered in an analog way from CD or videotape have to beconverted into a digital representation on the hard disc. Acceptable development hardware isequipped with e.g. a 80486 processor, 8 Mb RAM and 1 Gigabyte hard disc. Quite often thedigitising of sound and video requires also additional hardware (boards).
Different platforms
A large number of platforms for displaying multimedia applications is available on the market.The most important multimedia platforms will be discussed here, after that the PC-platformwill be described in more detail. At the moment the most important platforms are: MultimediaPC (MPC) with Video for Windows and DVI, Apple Macintosh with QuickTime, CD-I byPhilips.
137136
The main difference between CD-I and the other platforms mentioned is the fact that CD-Iuses a very specific display device: the CD-I system. This system can also be used to play-backaudio CD's and Photo CD's (Kodak). Connecting the CD-I system to a television set isnecessary to view a CD-I application. The CD-I application is operated by using a joy stick orinfrared remote control. A keyboard is not incorporated. A CD-I application is stored on aCD, which implicates that it is not possible to update or replace e.g. a part of the video in theCD-I application. In order to do this, the entire CD has to be produced and delivered onceagain.
A multimedia application developed for MPC or QuickTime can be displayed using a standardplatform (PC respectively Macintosh) under a standard operating system (DOS/Wmdowsrespectively System 7), which means that all the other facilities offered by those systems areavailable. Examples are wordprocessing facilities, database management, etcetera. Because ofthe fact that the MPC and QuickTime both use the standard file structures of the platform, itdoes not matter if these files are stored on hard disk, CD-ROM or on a network. Putting allfiles for a multimedia application on hard disk offers the advantage that replacing those files bynew versions is easy. In this way the updating of e.g. audio or videoparts is very convenient.An other advantage of using the hard disk in stead of a CD-ROM is speed. The displaying ofsections of video can start much quicker when using a hard disc than when these fragments arestored on CD-ROM. Also, because of the higher speed of the harddisc, video played fromhard disk often can have higher quality, at the cost of more discspace. Using CD-ROM limitsthe user to a maximum of about 10 Mb of video per minute. Extracting larger amounts of dataper minute is not possible, because these amounts can not be read fast enough from CD-ROM.Recently double end quadruple speed CD-ROM players came available, which make play-backat higher data rates possible.
The advantage of CD-I is the relatively low priced display device: about f 1500.- A goodquality multimedia PC will cost approximately f 6000.- to f 10,000.- (when equipped with alarge hard disc, 80486 processor, 4 Mb RAM, perhaps a DVI-board). This PC can also beused for other purposes, however.The investments that have to be done to develop multimedia applications using CD-Itechnology are much higher than the investments needed to work with both other platforms.Software tools for CD-I cost thousands (or tens of thousands) of guilders, while the costs fortools for the other platforms are significantly lower. Designers Work Bench (DWB) by ScryptSystems Inc. is an example of a complete development system for CD-I. The system includingall required hardware and software (authoringsystem) costs f 86,850.- The authoringsystemoffers possibilities to add C-routines.The CD-I development process is complex. Digitized files have to be made using a PC, Macor Sun. After that the files have to be converted into CD-I filefonnats. Then the CD-Iapplication can be developed using a CD-I programming environment. Finally, all difeitizedfiles and the application have to be merged and tested with CD-I emulation software, disc-setup software and test software. This final step often requires expensive extra hardware. Whenthe application has been developed, a master tape has to be made to produce the actual CD-I's.Full screen, full motion (screen filling and 25 frames a second for PAL, the European tv-system; 30 frames a second for NTSC, the American tv-system) video to be used with CD-Inowadays can not be produced in house yet. The videotape has to be sent to a third party, fordigitizing.
138
:3 7
Multimedia on PC
Although Macintosh with Quick Time is this moment's most advanced platform, theMultimedia PC (MPC) market share is rising fast. Without any doubt, the MPC market will bea large, if not the largest, market for multimedia applications. For a major part this is causedby the tremendous effort Mcrosoft is putting in making a success of the MPC. At this timeMacintosh with QuickTime mainly differentiates in offering better tools to the multimediaapplication developers. Making animations and adding video still is much easier on theMacintosh compared to the MPC. However, this seems to be a matter of time.
The minimum technical specifications for the MPC have been defined by Nficrosoft, IBM andIntel, among others. The specifications are: 10 MHz 80286, 2 Mb RAM, 30 Mb hard disc,CD-ROM device, VGA video board, (16 olours), audio board, mouse, Windows withmultimedia extension (standardized in Wmdows 3.1). Note that these specifications really arethe minimum. Efficient usage of Wmdows requires a 80386 processor, combined with 4 MbRAM. The usage of video requires even more: 80486, 4 Mb RAM, 200 Mb hard disc andVGA board with 256 colours. The Wmdows multimedia extension offers very easypossibilities to create and display digitized audio.
A CD-ROM device always is incorporated in the sale of a Multimedia PC or a so called MPCupgrade kit. When you decide to upgrade your PC to be able to work with multimedia, it isstrongly recommended to buy & CD-ROM device. More and more the multimedia applicationsare delivered on CD-ROM, because of the large amount of data they consist of. Often thepossibility exists to install an application from CD-ROM instead of from floppy discs. Alsodata intensive applications, such as manuals and (multimedia) dictionaries, are often deliveredon CD.Because 10 floppy discs for one application no longer is exceptional, installing from CD-ROMis much more convenient. Installing those amounts of data on hard disc is not recommended.All in all buying a CD-ROM device is worth the while, especially taking into account thedecreasing costs. By now prices have gone down below fl 1000.-
In the beginning of 1993 Nficrosoft introduced Nficrosoft Video for Wmdows, an extension ofthe multimedia possibilities of Wmdows 3.1. Video for Windows allows the display ofdigitized video without the need for extra hardware in the PC. This is called 'software-only'video. (The play-back of the sound accompanying the video requires an audioboard,however.) The quality of the video that is being displayed, depends on the powerfulness of thedisplay device: a smaller video window and less frames per second on a less powerful displaydevice. This means that on a 80486 PC 25 frames per second can be displayed in a 160x120pixels window. In a 320x240 pixel window (4 times as big) only 10 frames per second can bedisplayed. For 'software-only' video a VGA board with 256 colours is the minimum. The 16colours of a normal VGA (board) offers no acceptable video quality.A developer of Video for Windows application.; has to buy Video for Windows (fl 500.4 Thetools for digitizing video are included in the package. The libraries required for displayingVideo for Wmdows files are distributed freely with the application developed. Therefore it isnot necessary for the user to buy extra software to display Video for Windows applications.
Video for Windows offers the possibility to install other compression/decompressionalgorithms (codecs). An example is the Indeo codec by Intel. In displaying files made with
139
Indeo Video for Wmdows 7.-ses Intel's DVI (Digital Video Interactive) delivery board, ifavailable. If this is not the case, the Indeo files are displayed by the processor (e.g. 80486).The size of the display window and the number of frames per second are being adjusted to thepower of the processor available. If the DVI delivery board can be used, the Indeo files can bedisplayed full screen , full motion (640x480 pixels, 25 frames per second). The sound isalways displayed by the special MPC audio board, regardless of the availability of the DVIboard. A disadvantage of Indeo is the fact that it is not possible to display stills (yet). Stills aredigitized pictures, slides or pictures from a video. They need a higher resolution than avideoframe, because the eye is more critical for stills than for moving video.A DVI delivery board, the Action Media II Delivery Board, costs approximately fl 2500.-.Ace Coin in Great Britain markets a compatible board, the PCTV-SLC, for approximately fl1400.- Digitizing video for both boards requires the Action Media U Capture Board. Thisboard will cost around f 1000.-.
The mrximum resolution Indeo video under Video for Wmdows can offer is 320%240 pixels.When higher video quality is demanded, it is possible to use the DVI delivery boards with theDV-MCI driver under Windows. By doing this, no use is made of Video for Wmdows and theaccompanying file formats. The video, audio and stills (possible when using DV-MCI drivers)are being saved in DVI-files (so called AVSS-files). The highest quality video that can bepresented in this way has a 512x480 pixel resolution, and is called Presentation Level Video(PLV). An advantage of using DVI with DV-MCI is that an extra audioboard no longer isrequired. Sound is being played from the DVI delivery board. A disadvantage is theimpossibility to make PLV video files by yourself. Analog video, for example on a BetacomSP videotape, has to be sent to the video production company Teletota in Paris. Teletota isIntel-licenced to make PLy. To do this, it uses a large computer, that needs about 100minutes of computing time to digitize and compress 1 minute of video
Digitizing and compressing 1 minute of video costs S 250.-. However, it is possible tocompress and digitize the video in house using the Action Media II Capture Module. Thisresults in Real Time Video (RTV). RTVs maximum resolution is 256x240 pixels. The Indeovideo quality (340x240 pixels resolution) is slightly better than RTV video quality.
Under OS/2, Presentation Manager, lBM offers a platform that is comparable to theMultimedia PC with Video for Windows platform: Ultimedia. This is a PS/2 system in which aDVI delivery board and a CD-ROM XA (eXtended Architecture; an extended version of CD-ROM) are incorporated. Here the multimedia extensions on Presentation Manager areavailable to the developer.
140
(1
Concluding remarks
The Multimedia PC with Video for Wmdows plays an important role on the currentmultimedia market. /vficrosoft puts every effort in supporting this platform and making it asuccess. Especially now that it is possible to use DVI under Windows, this platform is a goodalternative for applying multimedia, both from a user's and a developer's point of view.Applying multimedia requires powerful hardware, however. The defined minimumspecifications actually are not sufficiently powerful. Recommended is a 33 MHz 80486 PCwith 8 Mb internal memory (RAM), 200 Mb hard disc and a CD-ROM device. For adeveloper's system a 1Gb (Gigabyte) hard disc is recommended.
Quick Time
Jakob Sikken
Introduction
This paper will discuss the possibilities of Quick Time in using digital multimedia. Digitalmultimedia gives you possibilities of using multimedia, that are not available withtraditional multimedia (video and sound from an analogue source, such as laser disk playerand the video recorder). It gives you instant access to every part of your multimediamaterial and you can combine parts to create the material you need for that student at thatspecific moment.
Data amountsTo make working with digital multimedia at a reasona'ile cost possible, imagecompression is needed. One screen image (640*480 pix il's) in 24 bit colour contains about900 KB of data. Displaying one second moving video at 25 frames per second (PAL), thisgives about 23 MB of .;ta per second. One minute of moving data will need about 1318MB of data. Only ver7 expensive computer equipment can handle this amount of data persecond. Luckily moving video can be compressed very well without losing to much imagedetail.
QuickTime
QuickTime is a architectureQuickTime is a platform-independent architecture for multimedia. Because QuickTime isan architecture and not a program, it is not the question if should you use eitherQuickTime or an other program, let's say AuthorWare. But you use both,AuthorWareAC(or something else) for the instruction part and let QuickTime handle themultimedia stuff. QuickTime adds the capability of working with multimedia to the systemsoftware. This makes it easy for every program to use multimedia, not only forcommercial programs, but also for programs that you develop.
The QuickTime architecture performs four key functions:
1 synchronising a time-based data stream;
2 compressing data to minimise storage needs on the user's computers;
3 providing a standard graphical interface for creating, editing, and navigating throughmovies;
4 establishing a standard file format that accommodates dynamic information.
143
141
0
Quick Time can consistently play its multimedia files (called movies) at the highestpossible quality, keeping sounds, images and colours properly synchronised on everythingfrom low-cost personal computers to high-performance work stations.
Quick Time's modular design allows new capabilities to be added as quickly as they aredeveloped. For example, as new methods of image compression are developed, you willbe able to use them without any changes to the applications, simply by adding the newimage-compression components.
Movie has a number of channelsA QuickTime movie contains a number of channels. There are three different types ofchannels: video channels, sound channels and command channels. A movie can containany number of the three different types of channels. A movie does not need to containmoving video, it could just contain sound or only a command channel.This makes it possible to have a sound channel for each language you want to have. Youcan use separate video channels for each type of screen, such as a black and whiteversion, a Gray version and a colour version. An other possibility is different videomaterial for different experimental conditions.
In a command channel you can put commands to synchronise actions of the computer withthe video and/or sound material.
What can it do
Play, create and edit movies
Using QuickTime you can play movies, but also create and edit movies. QuickTime itselfcontains the basic stuff to create and edit movies, such as compressing and an interface fordigitisers. The QuickTime starter kit for the Macintosh contains a program called "simpleplayer", in which you can play and do some simple cut and paste editing on movies. Butif you want more control and editing possibilities, you need a specialised program forcreating and editing movies, such as Adobe Premiere or Diva VideoShop.
Still imagesMultimedia is not only about moving video, but it can also be plain non moving video(still images). Where moving video consist of very large amounts of data, a number ofstill images can also be a large amount of digital data.
A part of QuickTime are the CoDecs or the components for compression anddecompression of images. You can use these CoDecs both for compressing moving videoand for still images. This gives you the possibility to store and therefore use a largeamount of still images.
Photo-CDAn excellent example of medium containing a large amount of still images is the Photo-CD by Kodak. QuickTime makes it possible to access all the images on the Photo-CD inall the available resolutions. For the Macintosh the Photo-CD contains a lot of picture filesneatly organised in different folders for the different sizes. The icon for each picture file isa small image of every picture.
144
Hardware needed
Currently Quick Time is available on Macintosh and Window PC's. It is announced forSilicon Graphics work stations.
MacintoshQuick Time for Macintosh works with all 68020 or later Macintosh computers that have atleast 2 MB of memory and are running either System 6.0.7 or any version of System 7(with at least 4 MB of memory). This means that most Macintosh models, but not the 128and 512 KB Mac, Fat Mac (Lisa), Mac ED, Mac Plus, Mac SE, Mac Portable, the MacClassic and the Power Book 100, can use Quick Time. All these models are out ofproduction for at least a half year.
The faster the hardware is, the better the performance of Quick Time will be. But aessential part of playing a movie, the synchronisation of sound and video, will be kept onevery Mac. It will skip frames to keep the sound and video synchrone.
Most of the available hardware to accelerate display of moving video will work underQuickTime. In the worst case you will have to recompress your movie to the compresseddata format of the hardware accelerator.
The current version of QuickTime for the Macintosh is 1.6.1. This version has some bugsfixed of the 1.5 version, special decompression code for PowerBook displays (16 Grayshades) and a reduces memory usage. QuickTime for Macintosh is distributed free of anycosts.
IBM PC's and compatible'sIn our laboratory we have no experience with QuickTime for Windows yet, so thefollowing information comes from the documentation (see reference list).
QuickTime for Windows runs on any 80386-based or higher system that has at least 4MB of memory, an 80 MB hard disk, and a VGA or better graphics adaptor. Movies thatinclude sound require a sound card. System software requirements include MS-DOS 5.0and Windows 3.1 or later.
QuickTime for Windows consists of a set of Dynamic Link Libraries (DLLs) that provideall the functions necessary to play QuickTime movie files in Windows-based applications.QuickTime for Windows also provides Windows applications with the ability to displaystill images contained in Macintosh-created PICT files.
The latest version of QuickTime for windows is 1.1. This version contains the CoDec forusing the compact video compressed data format. On the Macintosh is that the best onefor normal video. It also supports OLE 1.0. QuickTime for Windows is distributed alongwith a number of QuickTime-aware applications for Windows.
145
143
By using Quick Time-compatible applications on both Macintosh and Windows system,users can interchange movies easily and enjoy a consistent user interface for workingwith multimedia. With hundreds of applications already supporting Quick Time forMacintosh, user can create and edit movies on Macintosh systems, then share them withcolleagues, clients, and f: iends who have IBM-compatible systems.
The same movie can be played on both Macintosh and Windows systems, provided that itis self contained and has been set to be playable on non-Apple computers. Movies can beset for multiple platforms when they are created, or they can be converted using theMovie Converter software in the Macintosh Quick Time Starter Kit.
Software
To use the Quick Time functionality you can use Quick Time-aware applications. These areapplications with build-in code for using Quick Time. Examples of such applications areWord Perfect, Microsoft Word, Power Point, Author Ware and Macro Mind Director.
For some other applications are external commands available to use Quick Time, such asHyperCard and Super Card.
And for Macintosh applications that can handle pictures, there is an interesting systemextension (or init) called "Wild Magic". This extension makes it possible to copy andpaste Quick Time movies, while the application thinks it's handling a picture.
All applications, which fit the above mentioned descriptions, can play a movie with thestandard graphic user interface. Some applications can do a lot more, such as controllingthe playing of the movie from the application. It is possible to play only a part of themovie at any desired speed (within the hardware limitations) and direction. An otherinteresting option is to play a number of parts of different movies directly after each other,thus giving you the possibility to compose your movie at run time.
Creating movies
There are four basic steps in creating a Quick Time movie.
I Digitise;
2 Edit;
3 Compression;
4 Adjust to storage medium.
146
144
DigitiseWith digitise I mean digitising a video signal that comes from a video-camera or video-recorder. In this case you can use existing video material on tape. Quick Time offers asoftware interface to the digitiser and the program that controls the digitising process.
It is also possible to create a movie without a digitiser and let it be generated by thecomputer. This could be a good way the create an animation or a "movie screen dump".
EditAfter you have digitised your video material or generated it, most times it must be editedto get the right movies. Using editors you can cut, copy and paste the right videofragments in the right sequence. During this process you can use a variety of differenttransitional effects and special effects on the video and sound material. Adobe Premiere issuch a Quick Time editing program.
CompressionAs I have explained in the beginning uncompressed digital video gives you a very largeamount of data to handle. This amount can be acceptable during the edit process, but inmost cases it will not be acceptable on the target machines. So the digital data has to becompressed.
Adjust to storage mediumJust compressing the digital data might not be enough. This depends on the storagemedium you intent to use. There are two aspects of this medium important for thecompression methods. First is the data transfer rate of the medium. For most CD-playersthis is 150 KB per second, you can't get the best results if your movie needs 500 KB ofdata per second. The second aspect is the total amount of data you can store on yourstorage medium and the total number of minutes of movie you whish to use. Both aspectsresults in a desired number of KB data per second.
To reach the desired transfer rate, some times the movie has to be more compressed.There are a number of ways to get a higher compression. First there is the possibility tojust compress it more by accepting a lower quality image. You can leave images al togather out of the movies, resulting in a lower frame rate. An other way is to reduce theimage size. Each of these ways have a lower quality result in common.
Expensive way of workingIn the expensive and the fast way you do the digitising and the compression real time. Todo this you need additional hardware for the compression. This hardware is expensive, butyou save some money on the needed disk space and the time needed the create the movie.Indeo Technology of Intel can do this task, but only if you accept a lower image quality.
For the best possible image quality, with Indeo Technology, you need to send the videotape to a company for digitising and compression. This will cost you a few hundreddollars per minute of video. The Indeo Technology is available for both Macintosh andIBM-PC computers.
147
145
Cheaper way of workingA cheaper way of working is to do the digitising and the compression after each other.This can be done in two ways, the first way is to grab a single frame and then compressit. After it is compressed, grab the next frame and so on. This is a good way of working ifyou video material can be computer controlled accessed on a frame by frame base. This istrue for the laser disk and for expensive video recorders (and the video tape must beprepared this operation).
The second way is to digitise the running video and transfer to data real time to the harddisk. Due to the limited transfer rate of hard disks and the channel to it, the data streammust be reduced. There a few ways of achieving this, do not use the full screen and donot use every frame. Working this way you can achieve reasonable results, for example animage size of 320*240, 16 bit colour (32000 colours) and 10 frames per second whichgives a data stream of 1.5 MB per second.
An image size of 320*240 is only a quarter of the standard VGA or Mac II screen.But in the reality this is the highest achieved image size, even the DVI boards on theIBM-PCs and the EYQ boards for the Mac (both Indeo Technologies) use this image size.To get it full screen the image is enlarged. This is due to the way most digitisers work,they only capture one of the two fields out of a frame. A PAL video signal has 25 framesper second and each frame exists out of two fields. Each field skips every other line, it hasonly half the number (312 and 313) of lines a frame (625) has. This gives an effectiverefresh frequency of 50 images per second instead of 25 images.
Experiences
Playback experiencesWe have some experience with Quick Time for Macintosh. We have found out that 16 bitcolour (32000 colours) is necessary. The colour resolution of most computer displays, 256colours to be chosen out of a pallet of 16 million colours (24 bit), is not enough for agood result. There are just not enough colours to make a good image. Therefore 16 bitcolour (32000 colours) is not a luxury but essential.
From our experiences we can say that a movie with the size of 320*240 pixel's (a quarterof the screen) can be played with frame rate of 10-15 frames per second on a Mac IIfx.This is done with software only and played from a hard disk. This means that it can alsobe done using any mid and high range Macintosh (Centris and Quadra line). We have noexperiences with a LC HI, but we think it will not achieve this performance. And ofcourse if you choose a smaller image size you can use a slower Mac or get more framesper second.
To achieve good results it is necessary to use high quality video material. High qualityvideo material has less noise in the image and therefore less unneedcd work in playingback this noise. If there is much difference between two frames, playback frame rate willdrop. So a movie where a large part of the image is changing will give a slower playbackframe rate.
148
14S
Most of the Macs (Mac Ils and Mac LCs) in our faculty are to slow to display reasonablesize movies and can't display enough colours. An image size of perhaps 200*150 pixel'swill play fast enough, but for most purposes the 256 colours the computers can display arenot enough. We suspect the are the same applies for the IBM-PCs with Quick Time forWindows or Video for Windows.
Storage mediumsThe playback performance of Quick Time depends also on the storage medium used. Thefaster the storage medium is, the better the playback performance is. It is better to use astorage medium that has a faster data transfer rate then actually needed. The highertransfer rate gives the Mac more time to decompress the movie. This means that a harddisk is better storage medium then an optical disc or a CD-ROM. Optical discs and CD-ROMs can very good be used as storage medium but you will get a lower quality moviethen could be expected based on the data transfer rate of the storage medium.
Recording experiencesDuring our work with Quick Time, we have experienced that you need a lot of disk spaceduring the creating and editing of the movies. Compressing a movie is a lot of work forthe computer, we found times of one hour or more computing time for one minute video.You need a very fast computer for making movies. Quick Time movies are, despite thecompression, large files something like 10 MB per minute video.
Recording a movie in slow motion is a possibility, but you need a video recorder capableof playing perfect slow motion. That type of video recorder is very expensive, you aretalking about professional equipment.
Examples
By using Quick Time you get a lot more possibilities than with traditional video equipment(laser disk player or video recorder). In a limited way you can compose your movieruntime, from different parts from one or more movies.
An interesting example that was showed, was a kind of simulation where you stood on topof the Golden Gate bridge (over the Bay of San Francisco). You could move the camerain every direction you wanted. The base of this example was a Quick Time moviecontaining camera shots for every possible direction. Depending on the next cameradirection, the corresponding frame number was calculated and shown. Thus giving you theillusion of looking in every direction you wanted.
149
147
Conclusions
Quick Time for Macintosh as a software only solution can be good used with certainrestrictions.
A quarter screen size;
10-15 frames per second;
Fast enough Mac capable of 16 bit colour (32000 colours) display (Centris and Quadra
line);
High quality video material;
Steady image.
And if you can not live with these restrictions, you can buy additional hardware to achievea better result. More frames per second, :all screen size video, and this all even on aslower Macintosh like the Mac II.
In the nearby future there will be Macintoshes with additional hardware for handlingmultimedia standard build in. These computers will not only have video and soundoutputs, as today's computers have, but also video and sound inputs.
References
Adobe Systems Inc. (1992), Adobe PremiereTM: User Guide, Adobe Systems Inc.,Mountain View, USA.
Apple Computer, Inc. (1992). Quick Time for Windows Programmer's Guide, AppleComputer, Inc., Cupertino, USA.
Apple Computer, Inc. (1993), 15 Steps to Better Movies, Apple Computer, Inc.,Cupertino, USA.
Apple Computer, Inc. (1993,2), Inside Macintosh: Quick Time, Adison-Wesley PublishingCompany, Amsterdam, the Netherlands.
150
143
Conclusions
Ivan Stanchev, Jan Schoemnaker
This report is deliberately built up around instructional visualisation and not upon multi media.Of course there is a close relation between the two, but in general when talking about multimedia we mean only the technology of storing , retrieving and presenting text, data, graphics,animations, audio and video. Our focus is more on concepts of visualisation , where to use itand how to design it.
We will possibly extend the scopo in the near future towards virtual reality. Virtual realityallows one not only to perceive a pseudo real world as with multi media, but also to act uponit to a far more realistic level than with the possibilities of interaction which we have availablewith our regular computer technology. They are restricted to operating different input device.,like for instance mouse and touch screen which are of course 'artificial' devices of actioncompared to direct manipulation by hands, feet or head.
Generally speaking our conclusions are twofold regarding future research anddevelopment:
Focus on conceptual aspects and types of applications, rather than on multi mediatechnologyThe focus in multi media should be on the concepts of instructional visualisation and on theprocesses of what to use it for like for instance instruction, exploratory learning or searchingfor information. Theories of educational and cognitive psychology in the area of visualisationhave to be worked out and application domains have to be explored, rather than focussing onthe more or less autonomous development of technology.
Focus on integrated and empirical approach, rather than on isolated theoretical researchResearch, development and practical application and evaluation should be closely related.Empirical oriented projects should be prioritized, in which different variables can be studied inpractice. One should go for an approach in which reference models and guidelines, derivedfrom theory and experience, form the basis of design and development and in which evaluationin practice should lead to adapting a research and design and development approach. Such anemphasis leads to taking into account economic, organisational, technical and cultural asepctsin research and development. This empirical approach might lead to faster progress in this areathan an isolated approach of studying only certain factors.
On a more detailed level we come to the followiEg conclusions regarding concepts onvisualisation, design and development and implermentation:
Broadening the spectrum of applicabilityBy using visualisation not only cognitive skills can be developed, but also - to a certain degree- more affective skills like learning how to communicate, how to negociate, how to sell.
Besides, using a rid', visualisation oriented environment also seems to motivate people. Onecould see this increased motivation as a basis for acquiring cognitive and affective skills, butone might also see the development of motivation as a goal in itself This is for instance
151
eis
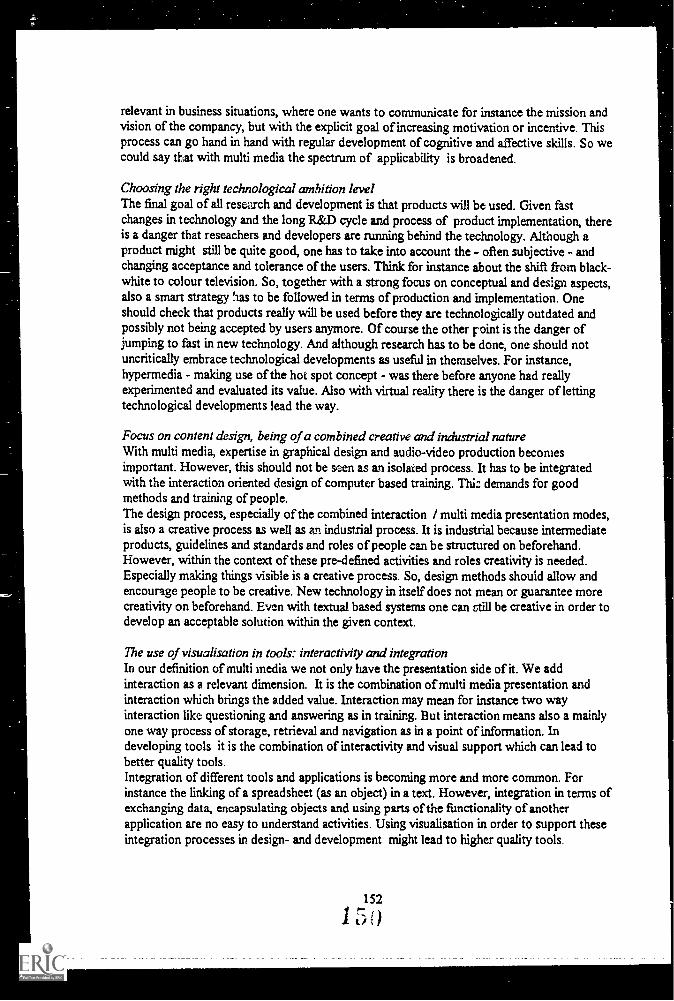
relevant in business situations, where one wants to communicate for instance the mission andvision of the compancy, but with the explicit goal of increasing motivation or incentive. Thisprocess can go hand in hand with regular development of cognitive and affective skills. So wecould say that with multi media the spectrum of applicability is broadened.
Choosing the right technological ambition levelThe final goal of all research and development is that products will be used. Given fastchanges in technology and the long R&D cycle and process of product implementation, thereis a danger that reseachers and developers are running behind the technology. Although aproduct might still be quite good, one has to take into account the - often subjective - andchanging acceptance and tolerance of the users. Think for instance about the shift from black-white to colour television. So, together with a strong focus on conceptual and design aspects,also a smart strategy has to be followed in terms of production and implementation. Oneshould check that products really will be used before they are technologically outdated andpossibly not being accepted by users anymore. Of course the other roint is the danger ofjumping to fast in new technology. And although research has to be done, one should notuncritically embrace technological developments as useful in themselves. For instance,hyperrnedia - making use of the hot spot concept - was there before anyone had reallyexperimented and evaluated its value. Also with virtual reality there is the danger of lettingtechnological developments lead the way.
Focus on content design, being of a combined creative and industrial natureWith multi media, expertise in graphical design and audio-video production becomesimportant. However, this should not be seen as an isolated process. It has to be integratedwith the interaction oriented design of computer based training. Thi: demands for goodmethods and training of people.The design process, especially of the combined interaction / multi media presentation modes,is also a creative process as well as an industrial process. It is industrial because intermediateproducts, guidelines and standards and roles of people can be structured on beforehand.However, within the context of these pre-defined activities and roles creativity is needed.Especially making things visible is a creative process. So, design methods should allow andencourage people to be creative. New technology in itself does not mean or guarantee morecreativity on beforehand. Even with textual based systems one can still be creative in order todevelop an acceptable solution within the given context.
The use of visualisation in tools: interactivity and integrationIn our definition of multi media we not only have the presentation side of it. We addinteraction as a relevant dimension. It is the combination of multi media presentation andinteraction which brings the added value. Interaction may mean for instance two wayinteraction like questioning and answering as in training. But interaction means also a mainlyone way process of storage, retrieval and navigation as in a point of information. Indeveloping tools it is the combination of interactivity and visual support which can lead tobetter quality tools.Integration of different tools and applications is becoming more and more common. Forinstance the linking of a spreadsheet (as an object) in a text. However, integration in terms ofexchanging data, encapsulating objects and using parts of the functionality of anotherapplication are no easy to understand activities. Using visualisation in order to support theseintegration processes in design- and development might lead to higher quality tools.
152
1 5
Appendix
Andersen Consulting - ECCP.O. Box 38817500 DW EnschedeThe Netherlandsphone: +31.53 333367fax: +31.53.337825
Drs. A.H. BergersIr. IL. EversMevr. Drs M.M. van den MeirackerIr. D.E. NienhuisDrs. J.M. SchoenmakerDrs. M. Vegting
University of TwenteFaculty of Educational Science and TechnologyP.O. Box 2177500 AE EnschedeThe Netherlandsphone: +31.53.893611fax +31.53.356531
AM. BerlothDr. P.A.M. KommersProf. dr. J.C.M.M. MoonenJ. Sikken, M.Sc.A.F.J. RhemrevProf. dr. I. StanchevDr. ir. P.W. VerhagenDrs. W.J. Zwart
155
151
acuity ofEDUCATIONAL SCiENCEAND TECHNOLOGYA publkotion by
The faculty of Educational Science ond Technology of the University of Twente
P 0 Box 2 ,,
7500 AE .
The Hethe 152 ',AVAILABLE
-
U.S. Dept. of Education
Office of EducationalResearch and Improvement (0ERI)
Date FilmedJuly 18, 1994
(9/92)
K
U.S. DEPARTMENT OF EDUCATIONOffice of Educational Research and improvement (OERI)
Educational Resources Information Center (ERIC)
NOTICE
REPRODUCTION BASIS
I'
ERIC
This document is covered by a signed "Reproduction Release(Blanket)" form (on file within the ERIC system), encompassing allor classes of documents from its source organization and, therefore,does not require a "Specific Document" Release form.
This document is Federally-funded, or carries its own permission toreproduce, or is otherwise in the public domain and, therefore, maybe reproduced by ERIC without a signed Reproduction Release
form (either "Specific Document" or "Blanket").