effective visualisation of workflow enactment
TRANSCRIPT
Effective Visualisation of Workflow Enactment
Yun Yang, Wei Lai, Jun Shen, Xiaodi Huang, Jun Yan, and Lukman Setiawan
CICEC – Center for Internet Computing and E-CommerceSchool of Information Technology, Swinburne University of Technology
PO Box 218, Hawthorn, Melbourne, Australia 3122{yyang, wlai, jshen, xhuang, jyan, lsetiawan}@it.swin.edu.au
Abstract. Although most existing teamwork management systems support user-friendly interface to some extent, few of them have take into consideration ofthe special requirements of workflow visualisation. This paper realises the uni-que features of visualisation for run-time workflow, i.e., workflow enactment andexecution. We present a detailed discussion of the emerging problems against thegeneral aesthetic criteria for drawing the workflow layout. In order to supportmost essential workflow enactment facilities, the following three mechanisms areprovided. Firstly, Sugiyama algorithm has been systematically incorporated intoour prototype to create well structured workflow layout initially. Secondly, whenthe workflow process dynamically changes, we can adjust workflow layout byour force-scan algorithm to retain the mental maps created earlier among teammembers. Thirdly, we have also applied the technique of the fisheye view to of-fer a context focus mechanism for workflow users and to utilise the screen sizemore effectively. With these visualisation techniques, a better atmosphere may befacilitated for teamwork.
1 Introduction
Teamwork is a key feature in any workplace organisation. In this computing era, a pro-cess/project is usually carried out by a cooperating team who may be physically dispersedby using various software tools. Systems, which are designed for computer-mediatedteamwork, such as groupware, workflow or CSCW, offer various automatic supports forteam cooperation to improve the productivity. With software support, distributed teammembers are coordinated with a system support which is normally more effective thanmanaged manually by a human being [1, 2].
Generally speaking, a process is normally composed of tasks which are partiallyordered [3]. How to manage tasks is the key issue for completion of the entire pro-cess/project. Hence, task-oriented technology is management-centred to facilitate pro-ject management focusing on coordination. In addition to the heavy attention paid tosoftware process modelling and enactment in the software process community, the mostrecent years show another trend that there is an emerging consensus that graphical userinterface would help to alleviate process modelling and execution for non-language ex-perts [4]. This is especially true when we apply web-based distributed teamwork supportsystems to not only software processes which are normally carried out by computer pro-fessionals but also teamwork in other areas which are normally used by non-computerprofessionals.
J.X. Yu, X. Lin, H. Lu, and Y. Zhang (Eds.): APWeb 2004, LNCS 3007, pp. 794–803, 2004.c© Springer-Verlag Berlin Heidelberg 2004
Effective Visualisation of Workflow Enactment 795
Given the exposure of graphical user interface oriented environments, it is increa-singly demanding and important to provide intuitive visual programming environmentsto support team members. For every team member, a practical environment should bedesigned to support not only visual mechanisms to enact the teamwork for team mana-gers without knowledge of the underlying modelling language(s) and also an easy-to-usegraphical user interface for enactment by the end users [5]. For a team member workingin a team environment, it is very useful to offer a global view of the workflow in avisualised fashion as a ‘mental map’ in order to create a better teamwork atmosphere[6]. This is important from the psychological point of view when a person works ina computer-mediated teamwork environment. Although existing workflow prototypesand systems support user-friendly interfaces, little special consideration has been takeninto account regarding some special problems. For example, as the workflow executionproceeds, new enactment status may be reached and changes of the workflow logic mayneed to be incorporated. In order to allow this dynamics without distorting the ’mentalmaps’ that have been kept by every team member, the layout of workflow graph shouldbe tuned wisely.
We organise the paper as follows. In section 2, general and special requirements forvisualisation of workflow execution are discussed in detail. We also investigate otherresearchers’ work and existing products as well as point out our motivation. Three algo-rithms that tackle the identified requirements are presented in section 3. Finally section4 concludes our contributions.
2 Requirements Analysis and Related Work
When visualising a workflow process, basic readability aspects require knowledge aboutthe semantics of specific graph (e.g., place ‘most important’ vertex on the focus), andconstraints need to be provided as additional input to a graph drawing algorithm. Ina general sense, the layout of a graph is generated according to a pre-specified set ofaesthetic criteria as follows. The layout creation should minimise the area, edge lengthsand edge crossings, normalise the aspect ratio and edge lengths, distribute vertices evenlyand maximise display of symmetries.
For layout adjustment (dynamic layout), the layout of the graph should be preservedaccording to user’s mental map of the graph after rearrangement. This is to say, usersmaintain the internal model of the graph and radical change to drawing loss of the model.The relative-coordinate scenario and no-change scenario should be dealt with while it isnecessary to preserve the orthogonal ordering, clustering (relative distances), topology(embedding) and position of all existing vertices.
Besides, there are some special requirements regarding the distinct features of work-flows. In this paper, we focus on provision of a mental map for team members whenthey are carrying on the enactment of workflow processes. As for globally interactivecoordination among dispersed team members, a suite of problems arise:
• Layout Generation: As described elsewhere, a workflow process consists of a set ofpartially-ordered tasks and the relationships among them [7]. From a user interfaceviewpoint, the representation of a process is normally a directed acyclic graph basedon the temporal order, which uses rectangles and edges to represent tasks and their
796 Y. Yang et al.
relationships, respectively. Note that workflow tasks are temporal-dependant, as theprocess is executed from the start task to the termination task step by step. Thus,how to draw the graph with such a hierarchically temporal feature neatly is a bigissue.
• Mental map preservation: In interactive environments, team members may incursome changes into the global process definition, such as a task inserted, deletedor the relationship between existing tasks altered. The effectiveness of potentiallayout tuning should be guaranteed. Moreover, the side effect of such changes,such as costly refreshment and unexpected interrupt among team members, shouldbe minimised. To reflect these minor changes but retain the overall layout, effortsshould be focused on how to adjust workflow layout slightly and avoid disrupting.
• Focus+context provision: Workflow enactment is sensitive with the context of aspecific process or a group of tasks. Therefore, the intensive local information, forexample, one’s own to-do (task) lists, should be represented nicely in a user-friendlyinterface presented to every team member. Sometimes a team member needs to focuson a certain part and fade out the remaining, while the screen size does not permita display of all activities.
Over the last decade, quite a few existing distributed process environments offersome visualisation using such as the Petri-Net for the global view of the process, e.g.,FUNSOFT Net [8] and HOON [9]. This happens in the workflow and project manage-ment environments too by using such as the well-known PERT and Gantt charts andtheir variations, for instance, in ActionPlan [10]. It was reasonable in the past for lack ofvisual workflow process support due to, for example, when understanding and experi-menting workflow processes’ logic were the major goal. However, nowadays, given thematurity of workflow process and popularity of graphical user interface, it is importantto develop and deliver more user-friendly and more productive workflow environmentswith visualised workflow execution and enactment.
In effect, according to the literature, Serendipity-II [11] and APEL [12] have at-tempted to support visual/graphical process manipulation. Moreover, prototypes such asWW-Flow [13] and MILOS [14], have used flow charts or activity diagrams as primarygraphical user interface to control and monitor the workflow execution. Our system canoffer the following features:
• Sugiyama algorithm draws directed acyclic graphs meeting the basic aesthetic cri-teria, which is very suitable to describe hierarchically temporal relationships amongworkflow entities.
• In addition, our force-scan algorithm can keep the mental map when the processdefinition or workflow status is dynamically modified during execution.
• The fisheye view provides a focus+context mechanism to allow certain parts ofworkflow activities be vigorously displayed by utilising the screen space effectively.
Furthermore, as Handl [7] and others had made efforts to define workflow-specificvisual systems, we have reached our insights concerning some different aspects in com-parison with the general visual language requirements commented in [15]:
• Visualisation is a means of communication between team members in an organisa-tion, where the coordination atmosphere is the most important issue.
Effective Visualisation of Workflow Enactment 797
• Visualisation provides a representation to observe and to control the states of exe-cution of tasks during workflow enactment, even with interactive decision needed.
• Visualisation has to express the flow of arbitrary data and control as well as typingto distinguish hierarchical entities and dependencies clearly.
• Visualisation should permit dynamic changes of the workflow through preservingmental-maps among team members, either in a physical or logical view.
• Visualisation should guarantee that every user has not only a similar ‘look and feel’but also specific focus and context wherever the work needs to be done.
Having kept these in mind, we are carrying on further design and implementation toimprove our current Web-based workflow prototype.
3 Mechanisms and Prototypes
3.1 Initial Layout Generation with Sugiyama Algorithm
Sugiyama algorithm is a method to generate a visually understandable drawing of ahierarchy automatically, and it meets the following requirements [16]: (1) ‘Hierarchical’layout of vertices (drawing), i.e., vertices are placed on horizontal lines in each level ofthe hierarchy without overlapping; (2) Minimise crossing edges; (3) Connected verticesare close together; (4) ‘Balance’ layout of edges.
Generally, it consists of the following steps: (1) Form a proper hierarchy by injec-ting nodes; (2) Permute vertices on each level to minimise crossing edges; (3) Assignhorizontal positions to achieve straight long lines, close vertices, and maximal edgebalancing; (4) Remove dummy nodes and draw on display.
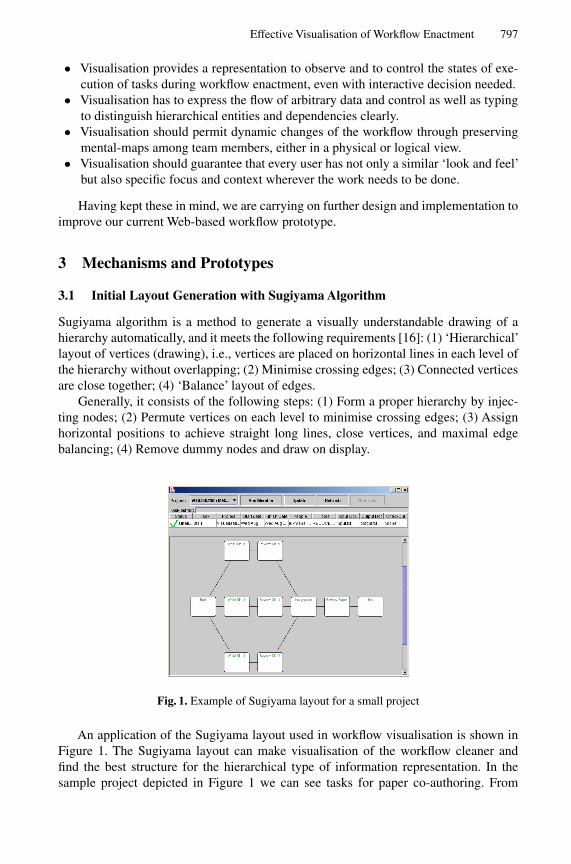
Fig. 1. Example of Sugiyama layout for a small project
An application of the Sugiyama layout used in workflow visualisation is shown inFigure 1. The Sugiyama layout can make visualisation of the workflow cleaner andfind the best structure for the hierarchical type of information representation. In thesample project depicted in Figure 1 we can see tasks for paper co-authoring. From
798 Y. Yang et al.
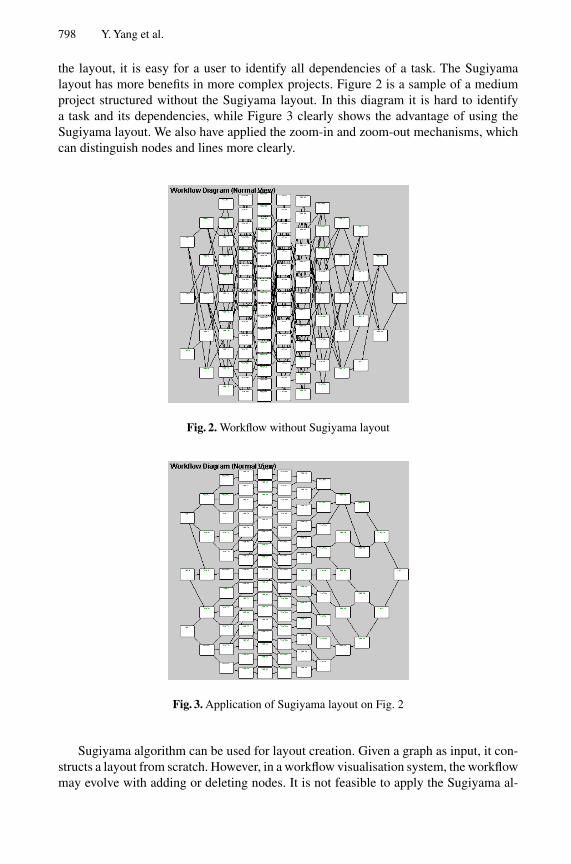
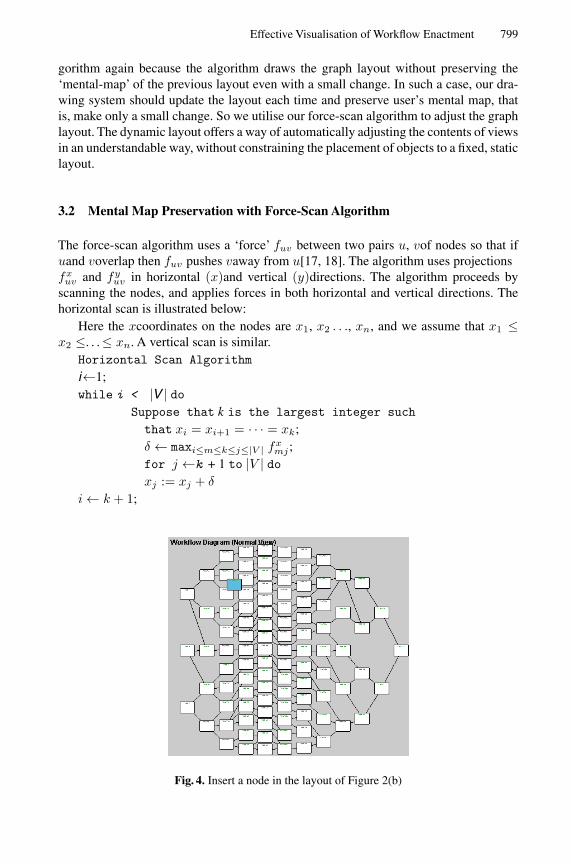
the layout, it is easy for a user to identify all dependencies of a task. The Sugiyamalayout has more benefits in more complex projects. Figure 2 is a sample of a mediumproject structured without the Sugiyama layout. In this diagram it is hard to identifya task and its dependencies, while Figure 3 clearly shows the advantage of using theSugiyama layout. We also have applied the zoom-in and zoom-out mechanisms, whichcan distinguish nodes and lines more clearly.
Fig. 2. Workflow without Sugiyama layout
Fig. 3. Application of Sugiyama layout on Fig. 2
Sugiyama algorithm can be used for layout creation. Given a graph as input, it con-structs a layout from scratch. However, in a workflow visualisation system, the workflowmay evolve with adding or deleting nodes. It is not feasible to apply the Sugiyama al-
Effective Visualisation of Workflow Enactment 799
gorithm again because the algorithm draws the graph layout without preserving the‘mental-map’ of the previous layout even with a small change. In such a case, our dra-wing system should update the layout each time and preserve user’s mental map, thatis, make only a small change. So we utilise our force-scan algorithm to adjust the graphlayout. The dynamic layout offers a way of automatically adjusting the contents of viewsin an understandable way, without constraining the placement of objects to a fixed, staticlayout.
3.2 Mental Map Preservation with Force-Scan Algorithm
The force-scan algorithm uses a ‘force’ fuv between two pairs u, vof nodes so that ifuand voverlap then fuv pushes vaway from u[17, 18]. The algorithm uses projectionsfx
uv and fyuv in horizontal (x)and vertical (y)directions. The algorithm proceeds by
scanning the nodes, and applies forces in both horizontal and vertical directions. Thehorizontal scan is illustrated below:
Here the xcoordinates on the nodes are x1, x2 . . ., xn, and we assume that x1 ≤x2 ≤. . .≤ xn. A vertical scan is similar.
Horizontal Scan Algorithm
i←1;while i < |V | do
Suppose that k is the largest integer such
that xi = xi+1 = · · · = xk;δ ← maxi≤m≤k≤j≤|V | fx
mj ;for j ←k + 1 to |V | doxj := xj + δ
i← k + 1;
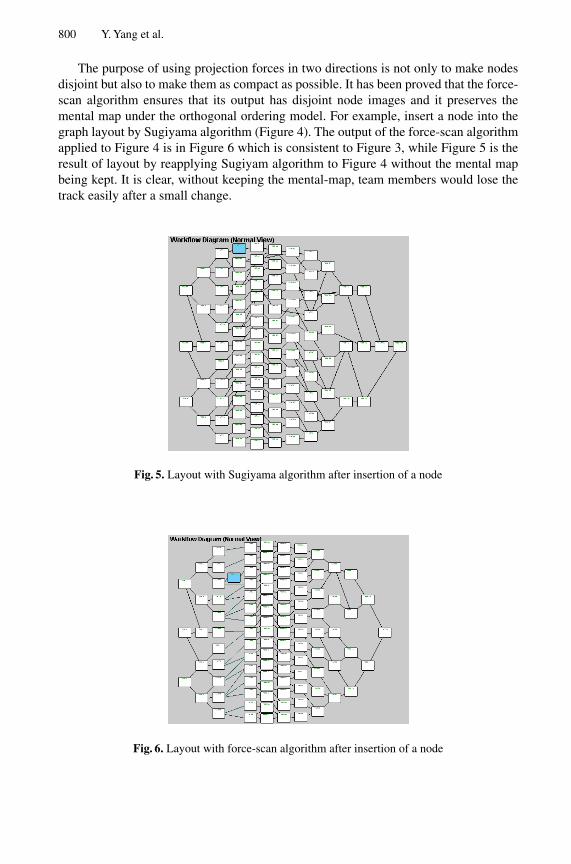
Fig. 4. Insert a node in the layout of Figure 2(b)
800 Y. Yang et al.
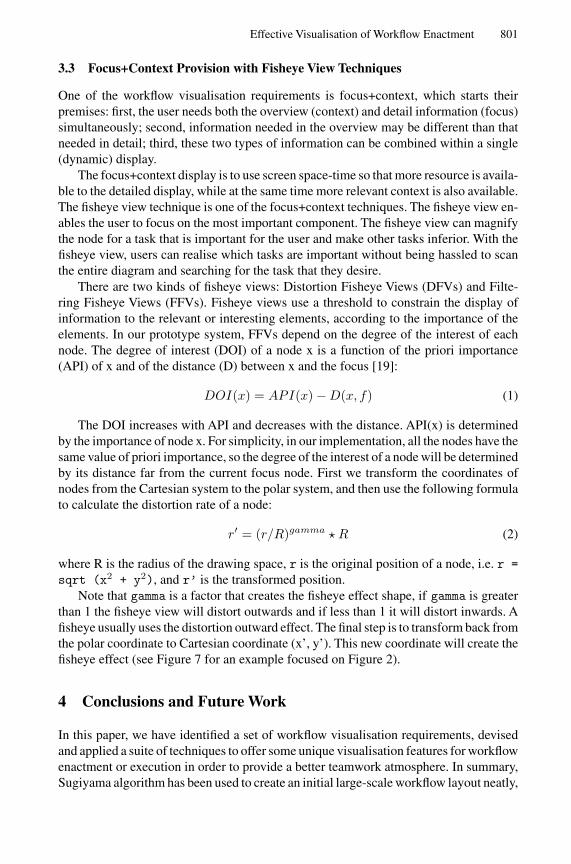
The purpose of using projection forces in two directions is not only to make nodesdisjoint but also to make them as compact as possible. It has been proved that the force-scan algorithm ensures that its output has disjoint node images and it preserves themental map under the orthogonal ordering model. For example, insert a node into thegraph layout by Sugiyama algorithm (Figure 4). The output of the force-scan algorithmapplied to Figure 4 is in Figure 6 which is consistent to Figure 3, while Figure 5 is theresult of layout by reapplying Sugiyam algorithm to Figure 4 without the mental mapbeing kept. It is clear, without keeping the mental-map, team members would lose thetrack easily after a small change.
Fig. 5. Layout with Sugiyama algorithm after insertion of a node
Fig. 6. Layout with force-scan algorithm after insertion of a node
Effective Visualisation of Workflow Enactment 801
3.3 Focus+Context Provision with Fisheye View Techniques
One of the workflow visualisation requirements is focus+context, which starts theirpremises: first, the user needs both the overview (context) and detail information (focus)simultaneously; second, information needed in the overview may be different than thatneeded in detail; third, these two types of information can be combined within a single(dynamic) display.
The focus+context display is to use screen space-time so that more resource is availa-ble to the detailed display, while at the same time more relevant context is also available.The fisheye view technique is one of the focus+context techniques. The fisheye view en-ables the user to focus on the most important component. The fisheye view can magnifythe node for a task that is important for the user and make other tasks inferior. With thefisheye view, users can realise which tasks are important without being hassled to scanthe entire diagram and searching for the task that they desire.
There are two kinds of fisheye views: Distortion Fisheye Views (DFVs) and Filte-ring Fisheye Views (FFVs). Fisheye views use a threshold to constrain the display ofinformation to the relevant or interesting elements, according to the importance of theelements. In our prototype system, FFVs depend on the degree of the interest of eachnode. The degree of interest (DOI) of a node x is a function of the priori importance(API) of x and of the distance (D) between x and the focus [19]:
DOI(x) = API(x)−D(x, f) (1)
The DOI increases with API and decreases with the distance. API(x) is determinedby the importance of node x. For simplicity, in our implementation, all the nodes have thesame value of priori importance, so the degree of the interest of a node will be determinedby its distance far from the current focus node. First we transform the coordinates ofnodes from the Cartesian system to the polar system, and then use the following formulato calculate the distortion rate of a node:
r′ = (r/R)gamma � R (2)
where R is the radius of the drawing space, r is the original position of a node, i.e. r =sqrt (x2 + y2), and r’ is the transformed position.
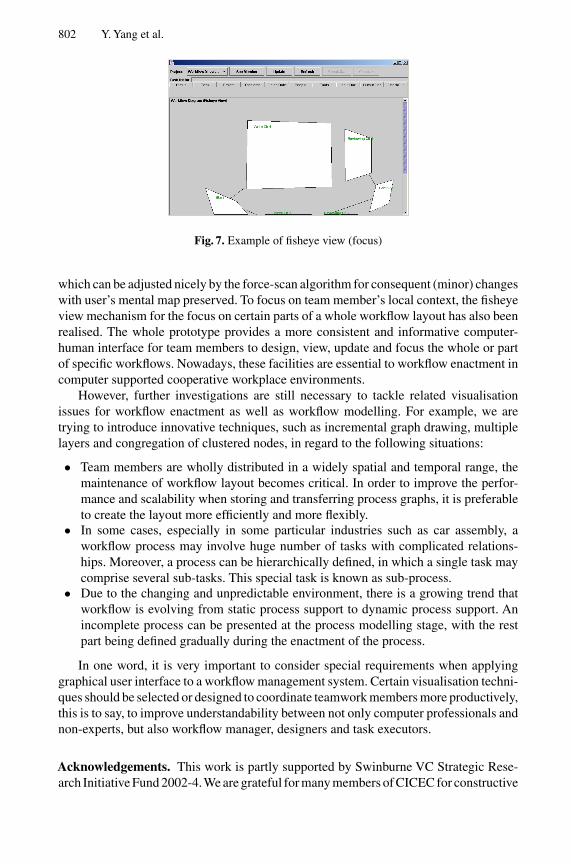
Note that gamma is a factor that creates the fisheye effect shape, if gamma is greaterthan 1 the fisheye view will distort outwards and if less than 1 it will distort inwards. Afisheye usually uses the distortion outward effect. The final step is to transform back fromthe polar coordinate to Cartesian coordinate (x’, y’). This new coordinate will create thefisheye effect (see Figure 7 for an example focused on Figure 2).
4 Conclusions and Future Work
In this paper, we have identified a set of workflow visualisation requirements, devisedand applied a suite of techniques to offer some unique visualisation features for workflowenactment or execution in order to provide a better teamwork atmosphere. In summary,Sugiyama algorithm has been used to create an initial large-scale workflow layout neatly,
802 Y. Yang et al.
Fig. 7. Example of fisheye view (focus)
which can be adjusted nicely by the force-scan algorithm for consequent (minor) changeswith user’s mental map preserved. To focus on team member’s local context, the fisheyeview mechanism for the focus on certain parts of a whole workflow layout has also beenrealised. The whole prototype provides a more consistent and informative computer-human interface for team members to design, view, update and focus the whole or partof specific workflows. Nowadays, these facilities are essential to workflow enactment incomputer supported cooperative workplace environments.
However, further investigations are still necessary to tackle related visualisationissues for workflow enactment as well as workflow modelling. For example, we aretrying to introduce innovative techniques, such as incremental graph drawing, multiplelayers and congregation of clustered nodes, in regard to the following situations:
• Team members are wholly distributed in a widely spatial and temporal range, themaintenance of workflow layout becomes critical. In order to improve the perfor-mance and scalability when storing and transferring process graphs, it is preferableto create the layout more efficiently and more flexibly.
• In some cases, especially in some particular industries such as car assembly, aworkflow process may involve huge number of tasks with complicated relations-hips. Moreover, a process can be hierarchically defined, in which a single task maycomprise several sub-tasks. This special task is known as sub-process.
• Due to the changing and unpredictable environment, there is a growing trend thatworkflow is evolving from static process support to dynamic process support. Anincomplete process can be presented at the process modelling stage, with the restpart being defined gradually during the enactment of the process.
In one word, it is very important to consider special requirements when applyinggraphical user interface to a workflow management system. Certain visualisation techni-ques should be selected or designed to coordinate teamwork members more productively,this is to say, to improve understandability between not only computer professionals andnon-experts, but also workflow manager, designers and task executors.
Acknowledgements. This work is partly supported by Swinburne VC Strategic Rese-arch Initiative Fund 2002-4.We are grateful for many members of CICEC for constructive
Effective Visualisation of Workflow Enactment 803
discussions. It is also partly supported by the National Natural Science Foundation ofChina under grant No.60273043 and grant No.60273026
References
1. Gorton, I. and Motwani, S.S.: Issues in Cooperative Software Engineering Using GloballyDistributed Teams. Information and Software Technology Journal, 38(10) (1996) 647-655.
2. Zhuge, H., Shi, X.: Communication Cost of Cognitive Co-Operation for Distributed TeamDevelopment. Journal of Systems and Software, 57(3) (2001)227-233.
3. Feiler, P.H. and Humphrey, W.S.: Software Development and Enactment: Concepts and Defi-nitions. In Proc. of the 2nd Int. Conf. on Software Processes, Berlin, Germany. (1993) 28-40.
4. Gruhn, V. and Urbainczyk, J.: Software Modeling and Enactment: an Experience ReportRelated to Problem Tracking in an Industrial Project. In: Proc. of 20th Int. Conf. on SoftwareEngineering, Kyoto, Japan, (1998) 13-21.
5. Yang, Y.: An Architecture and the Related Mechanisms for Web-Based Global CooperativeTeamwork Support. International Journal of Computing and Informatics, 24(1) (2000)13-19.
6. Eades, P., Lai, W., Misue, K. and Sugiyama, K.: Layout Adjustment and the Mental Map.Journal of Visual Languages and Computing, 6(2) (1995) 183-210.
7. Handl, D.: HotFlow-A Visual Language for Workflow Applications in E-Commerce. In: Pro-ceedings of the 1999 IEEE International Symposium on Visual Languages (VL’99), Tokyo,Japan, (1999) 185-186.
8. Deiters, W. and Gruhn, V.: The FUNSOFT Net Approach to Software Process Management.Int’l Journal of Software Engineering and Knowledge Engineering, 4(2) (1994) 229-256
9. Han, Y.: Software Infrastructure for Configurable Workflow System-A Model-Driven Ap-proach Based on Higher-Order Object Net and CORBA. Ph.D. thesis. Technical Universityof Berlin, Berlin (1997)
10. Ly, E.: Distributed Java Applets for Project Management on the Web. IEEE Internet Compu-ting. 1(3) (1997) 21-26.
11. Grundy, J.C., Apperley, M., Hosking, J.G. and Mugridge, W.B.: A Decentralised Architecturefor Software Process Modeling and Enactment. IEEE Internet Computing, 2(5) (1998)53-62.
12. Dami, S., Estublier, J. and Amiour, M.: APEL: a Graphical yet Executable Formalism forProcess Modeling. Automated Software Engineering, 5(1) (1998) 61-96.
13. Kim, Y., Kang, S-H, Kim, D., Bae, J., and Ju, K-J.: WW-Flow: Web-Based Workflow Mana-gement with Runtime Encapsulation. IEEE Internet Computing. 4(3) (2000) 55-64.
14. Maurer, F., Dellen, B., Bendeck, F., Goldmann, S., Holz, H., Kotting, B., and Schaff, M.:Merging Project Planning and Web-Enabled Dynamic Workflow Technologies. IEEE InternetComputing, 4(3) (2000) 65-74.
15. Wirtz, G.: Using a Visual Software Engineering Language for Specifying and AnalyzingWorkflows. In: Proceedings of the 2000 IEEE Int’l Symposium on Visual Languages (VL’00),Seattle, Wahington, (2000) 97-98.
16. Sugiyama, K., Tagawa, S. and Toda, M.: Methods for Visual Understanding of HierarchicalSystem Structures. IEEE Transactions on Systems, Man, and Cybernetics, 11(2) (1981) 109-125.
17. Eades, P. and Lai, W.: Algorithms for Disjoint Node Images. In: Proceedings of the 15thAustralian Computer Science Conference, Hobart, Australia, (1992) 253-265.
18. Lai,W. and Eades, P.: Removing Edge-Node Intersections in Drawings of Graphs. InformationProcessing Letters, 81 (2002) 105-110.
19. Furnas, G.W.: The FISHEYE View: A New Look at Structured Files. Bell Laboratories Tech.Report. Murray Hill, New Jersey (1981).