dynamic simulation and visualisation of coastal erosion
TRANSCRIPT
Computers, Environment and Urban Systems30 (2006) 840–860
www.elsevier.com/locate/compenvurbsys
Dynamic simulation and visualisationof coastal erosion
Iain Brown a,*, Simon Jude a, Sotiris Koukoulas d,Robert Nicholls c, Mark Dickson b, Mike Walkden e
a Tyndall Centre for Climate Change Research, University of East Anglia, Norwich NR4 7TJ, UKb National Institute of Water and Atmospheric Research, Christchurch, New Zealand
c School of Civil Engineering and the Environment and the Tyndall Centre for Climate Change Research,
University of Southampton, Southampton SO17 1BJ, UKd Department of Geography, University of the Aegean, University Hill, Mytilene 81100, Greece
e School of Civil Engineering and Geosciences and the Tyndall Centre for Climate Change Research,
University of Newcastle upon Tyne, Newcastle upon Tyne, NE1 7RU, UK
Received 19 September 2004; accepted in revised form 23 August 2005
Abstract
A key requirement for effective coastal zone management is good knowledge and prediction ofland erosion rates due to encroachment of the sea. However, in addition to demarcation of the haz-ard through modelling and mapping, a policy of risk mitigation necessitates significant attentionshould also be addressed to communicating the transient behaviour of the predictions and associateduncertainty. With climate change and sea level rise implying that historical rates of change may notbe a reliable guide for the future, enhanced visualisation of the evolving coastline has the potential toimprove awareness of this changing risk. This visual content is developed by linking scientificmodelling with the transformation of digital elevation models, and then using GIS to integrate otherspatiotemporal content. The resulting high-resolution visualisations may meet demands from deci-sion-makers for tools to communicate scientific results more effectively, due to their realism andapparent authenticity. Nevertheless they can also produces a tension with the underlying scientificcontent because of the necessary extrapolation of extra detail, and the lack of established proceduresto communicate the resulting uncertainty in the visualisation. Coastal managers also have concerns
0198-9715/$ - see front matter � 2005 Elsevier Ltd. All rights reserved.
doi:10.1016/j.compenvurbsys.2005.08.002
* Corresponding author. Tel.: +44 1603 593900; fax: +44 1603 593901.E-mail addresses: [email protected] (I. Brown), [email protected] (S. Jude), skouk@geo.
aegean.gr (S. Koukoulas), [email protected] (R. Nicholls), [email protected] (M. Dickson),[email protected] (M. Walkden).

I. Brown et al. / Comput., Environ. and Urban Systems 30 (2006) 840–860 841
about releasing the visualisations to the general public. These issues are explored through analysis offuture cliff erosion in Norfolk on the eastern coast of Great Britain.� 2005 Elsevier Ltd. All rights reserved.
Keywords: Visualisation; Simulation; Coastal management; GIS; Cliff erosion; Climate change
1. Introduction
The coast is an inherently dynamic zone, representing at any time a net balance betweenchanging processes and landforms, with complex scale-dependent interactions. Currentpolicy initiatives in the United Kingdom, such as Shoreline Management Plans (SMPs)and Coastal Habitat Management Plans (CHaMPs), recognise this dynamism and areencouraging longer planning horizons as well as improved understanding of coastal sys-tems (Cooper, Barber, Bray, & Carter, 2002; Lee, 2001). This is particularly importantfor future coastal management, because with a changing climate and accelerated sea levelrise, underlying risks may be significantly different from today (Hulme et al., 2002).
Coastal management initiatives also now seek to be more inclusive by including a widerange of stakeholders and the general public within the decision-making process throughconsultation. Nevertheless, inclusion remains a difficult task because of the dynamic com-plexity of coastal systems and the impediments involved in communicating this to a layaudience. These difficulties are especially apparent with regard to coastal evolution, asextrapolating present-day or historic patterns of change may not necessarily be the bestguide for the future, due to changes in driving forces such as those influenced by the climate.
Potentially, visualisation techniques provide the means to improve this knowledge trans-fer procedure and promote wider community inclusion within the decision-making process(Al-Kodmany, 2001; Orland, Budthimedhee, & Uusitalo, 2001). With regard to future cli-mate change, the use of visual images have been shown to assist in linking the concepts ofchange with every-day experience, rather than representing abstract theoretical concepts(Nicholson-Cole, 2005). In addition, moving from a 2D ‘flatland’ map to a 3D landscapeimage has been suggested to provide a valuable step for end-users in envisioning complexenvironmental information (Brown, 1999; Raper, 2000; Tufte, 1990). Enhancing this prin-ciple further through the creation of virtual landscapes, including the facility for users toexplore scenes by navigating through them using virtual reality (VR) software, would there-fore seem to provide significant potential in engaging non-specialists in planning or manage-ment issues (Brown et al., 2002; Jude, Jones, Andrews, & Bateman, 2003; Miller, Dunham, &Chen, 2003). This is particularly pertinent for the coastal zone because of its dynamic multi-dimensional landforms and complex management systems (Bartlett & Wright, 2000).
Nevertheless, in generating future landscape visualisations there has as yet been astrong tendency to only use rather arbitrary ‘‘what if . . .?’’ scenarios with less emphasison developing an objective scientific basis justifying those visions of the future. Hence,although a wider audience may become engaged through the visualisation process, theopportunity to use this as a basis for knowledge transfer is overlooked, and the user is pre-sented with a future landscape without also being provided with the background informa-tion as to how it has evolved in that form or how it relates to the decision-making process(Ervin, 2001; Orland et al., 2001). Notable exceptions are provided by the forest man-agement modelling work of Bishop et al. (2003) and by Dockerty, Lovett, Sunnenberg,
842 I. Brown et al. / Comput., Environ. and Urban Systems 30 (2006) 840–860
Appleton, and Parry (2005) who use an agricultural land-use allocation model to link cli-mate change scenarios with rural landscape visualisation.
The present study has aimed to assess and communicate the future risk from coastalerosion, by linking climate change with a predictive simulation model and visualisationsystem; this paper describes the model linkages and technical issues involved in meetingthis aim. The resulting virtual landscapes are distinctive in that the underlying terrain isdynamically generated and then combined with land-cover elements. Our objective there-fore is to further develop the information provided by the simulation model by contextu-alising it with topographic and land-cover data, and hence make it more realistic andaccessible to end-users. By doing so, the intention is to also begin to face up to the ‘‘daunt-ing challenge’’ described by Ervin (2001) in linking landscape visualisation with emergingand fundamental knowledge on behaviour of landscape elements.
Although previous research has described coastal landscape visualisation techniquesbased upon change in land-cover elements (Jude et al., 2003) or sedimentological units(Livingstone & Raper, 1999; Raper, 2000), the current research method is novel in thatit explores issues that arise in linking realistic landscape visualisation with a changing ter-rain. Furthermore, the method allows interpretation of future uncertainty through the useof different coastal management strategies in combination with climate change scenarios.The link between the visualisation system and the simulation model is provided by a Geo-graphical Information System (GIS), which allows querying of the model data, integrationwith other datasets using a common format, and then transfer between the modules usedfor visualisation. As with many inter-disciplinary projects, this loosely-coupled modularstructure of data exchange was primarily dictated by the distributed nature of theparticipants.
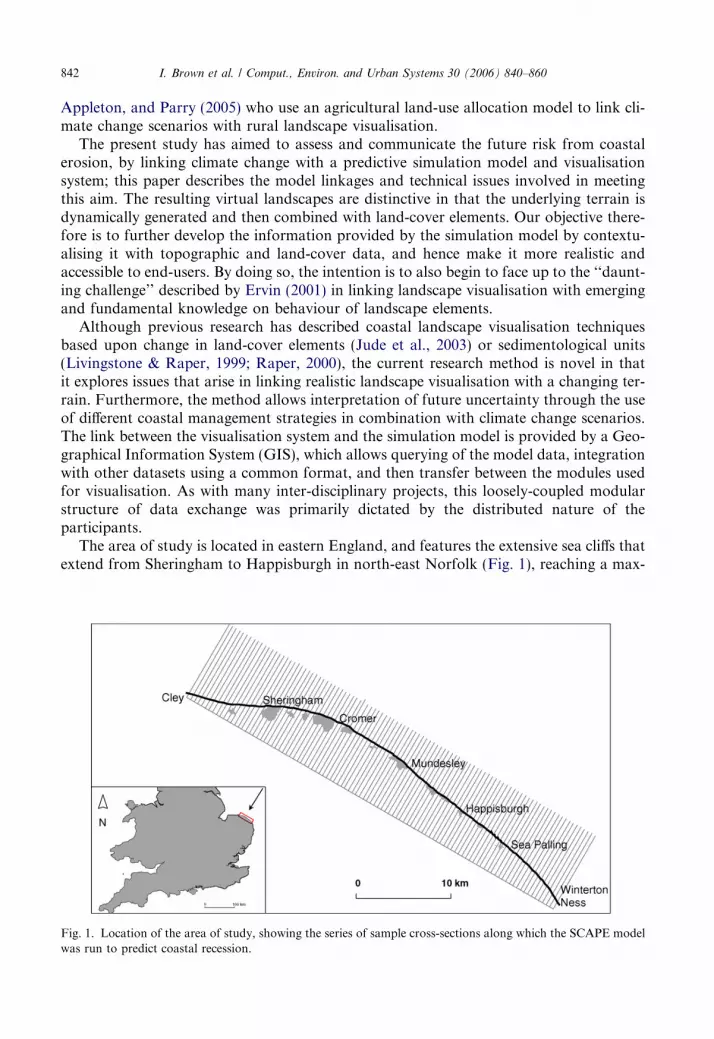
The area of study is located in eastern England, and features the extensive sea cliffs thatextend from Sheringham to Happisburgh in north-east Norfolk (Fig. 1), reaching a max-
Fig. 1. Location of the area of study, showing the series of sample cross-sections along which the SCAPE modelwas run to predict coastal recession.
I. Brown et al. / Comput., Environ. and Urban Systems 30 (2006) 840–860 843
imum height of 60 m in some locations. The cliffs are prone to rapid erosion because theyconsist of thick sequences of poorly-consolidated quaternary deposits, with typical currenterosion rates of the order of 0.5–2 m/year, posing a substantial threat to cliff-top humaninfrastructure. Cliff erosion may be sensitive to climate change (Bray & Hooke, 1997),therefore regional coastal planners have requested guidance on the demarcation of thepossible erosion hazard zone over the coming decades. The study area is also one of threepilot areas that have been initially chosen by government to be the first to develop a newgeneration of SMPs with a specific remit to identify a sustainable management strategy inthe long term (up to 100 years into the future), incorporating the processes of naturalcoastal evolution (Halcrow, 2004). This planning procedure has identified the need for astrategic shift in management policy away from the current policy of defending mostcoastal areas, towards non-maintenance of defences at some sites in future. However, thiscan only be implemented through an ongoing dialogue with coastal communities on futurecliff-top development and land use, including possible relocation of infrastructure andother assets, and has inevitably attracted considerable controversy.
2. Definitions
In order to provide context for the methodology and resulting discussion it is appropri-ate to provide our definitions of key terms:
(i) Model: a formalised abstraction of real-world entities or processes, typically devel-oped within a framework that can be implemented on a computer, and which seeksto make assumptions explicit.
(ii) Simulation: a synthetic replication of an event, or sequence of events, based upon aseries of measurements or credible predictions applied at a specific scale. Dynamic
simulation implies that a sequence of events is generated with specific reference tothe underlying processes through time.
(iii) Visualisation: a computer-generated image providing an enhanced visual representa-tion of a physical space or environment, with the intention of facilitating inter-pretation.
We will avoid here a detailed discussion of what ‘‘reality’’ is, with regard to providingthe benchmark for judging the quality of representation, except to note that it is a richmetaphysical concept (e.g. Baudrillard, 1983; Gray, 1995), and therefore includes aspectsthat are variable between individuals. However, it should be apparent that both simulationand visualisation are linked in attempting to provide a synthetic but meaningful represen-tation of reality. Following the distinctions made by Baudrillard (1983), these representa-tions therefore seek to reflect reality, rather than pervert, deny or invent it. By developingmodel-based simulations, scientific analysis can potentially provide a replicable, rationaland transparent method to explore the complex processes of the real world within a struc-tured framework (Raper, 2000). Therefore, modelling, simulation and visualisation eachinvolve, to a varying extent, the simplification of a complex environment in order toimprove understanding in a systematic manner. Hence it should be immediately apparentthat any resulting information cannot be an exact replication of the real world, and somediscrepancy or deficiency is inevitable.

844 I. Brown et al. / Comput., Environ. and Urban Systems 30 (2006) 840–860
3. Modelling of coastal erosion
The erosion of a coastline is an outcome of the coastal system’s response to its externalconditions, driven by large-scale climate and marine processes. With regard to coastalmorphology, this response may be managed through engineering interventions, such asseawall protection for a cliff or construction of groynes to enlarge beach volumes. The ben-efits of such intervention tend to be localised and temporary so the assessment of theirconsequences must be conducted at temporal scales of decades and spatial scales of20–100 km. SCAPE (Soft Cliff And Platform Erosion) is a numerical model that has beendeveloped to meet this need.
SCAPE is a process-based model that determines the reshaping and retreat of shoreprofiles along the coast (Walkden & Hall, 2002, 2005). Shore recession proceeds throughcycles of beach lowering from longshore transport, shore profile erosion, cliff toe retreatand the release of beach sediments from the cliff and platform. Erosion is driven by hydro-dynamic loads, therefore key inputs for the model are waves, tides and changes in sea level.
Wave data was acquired following a strategy developed and described in detail byKuang and Stansby (2004). The offshore wave climate was ‘hindcast’ (i.e. derived retro-spectively rather than predicted in advance as in a forecast) from wind data using standardwind-to-wave empirical relationships as encapsulated in the HINDWAVE model (Haw-kes, 1987; Swail & Cox, 2000). Wave characteristics are then tracked inshore using mod-elling routines based upon a finite element computational mesh, providing an irregulardata structure with the flexibility to handle complex bathymetry, such as sandbanks.The inshore propagation of wave energy is determined using the ray-tracing parabolicsolutions in the TOMAWAC software (Benoit, Marcos, & Becq, 1996), and the influenceof tidal currents across the mesh is determined through the use of TELEMAC-2D (Lab-oratoire National d’Hydraulique, 2002). Analysis shows that the inshore wave climate ismainly controlled by the offshore wave regime, rather than tidal currents or inshore wavegeneration by wind (Kuang & Stansby, 2004), meaning that it is possible to simplify thederivation of inshore wave heights, period and directions through transfer functions linkedto multiple scenario runs of the same offshore wave parameters (via interpolation, ifnecessary).
Tide levels were established from tide gauge data available from local stations at Low-estoft and Cromer, supplied by the British Oceanographic Data Centre. At every tide, cal-culations are made of the prevailing hydrodynamic conditions, linking water levels andwave energy. This erosive force, combined with cliff geology and defence structures, deter-mines the amount of sediment released from the cliff and platform, and then the quantityof this material supplied to the beach (i.e. beach volume), and the volume of beach mate-rial that is moved alongshore by wave action. Thus the sediment budget is quantified in farmore detail than is possible with a traditional conceptual geomorphic model. The presenceof defence structures (e.g. seawalls or groynes) is accounted for in the model by theirreduction of the hydrodynamic loading on the cliff and modification of sediment transportand beach volumes.
Model cross-sections of the coastline were aligned at 30� from north and were spaced at500 m intervals, as illustrated in Fig. 1. The evolving shore morphology that is output bythe model was reduced, for the current analysis, to provide only the developing position ofthe cliff toe (the toe represents the base of the cliff where it meets the shore platform orbeach). For the purposes of the present study, the cliff top was assumed to retreat at

I. Brown et al. / Comput., Environ. and Urban Systems 30 (2006) 840–860 845
the same rate, although further research aims to extend SCAPE with a probabilistic land-sliding module which should better represent the more sporadic nature of cliff-top retreat(large events can occur here as well as more frequent smaller events). Confidence in theSCAPE model is based on the accuracy with which it is able to represent a known periodof shore development. By examining historic maps digitised by the British Geological Sur-vey the model was shown to accurately represent 117 years of historic cliff toe evolution(Fig. 2) therefore it was considered robust enough to predict erosion between the years2000 and 2100. As the model runs in a deterministic mode, it is most suited to simulateaggregated erosion over a period of time, rather than to predict individual events dueto the stochastic behaviour of the erosion, particularly larger events.
The influence of coastal defence structures on the rate and spatial pattern of cliff erosioncan be analysed by modifying, moving or removing these structures in the model. Thisallows the impacts of different coastal management strategies to be explored. For the areaof study, although much of the coastline is presently protected, the economic justificationfor this has been questioned, and alternative management plans protecting only major set-tlements proposed (Halcrow, 2004). The modelling facilitates an evaluation of these man-agement options in the context of long-term coastal evolution and different scenarios ofclimate change.
To represent future climate change, the baseline datasets were modified based uponconclusions from the UKCIP02 climate change scenarios, which are based upon a synthe-sis of the most recent data from the UK Met Office Hadley Centre in conjunction with
Fig. 2. Validation of the SCAPE model by comparing measured and modelled cliff toe recession rates over 117years.

846 I. Brown et al. / Comput., Environ. and Urban Systems 30 (2006) 840–860
results from other international climate modelling centres (Hulme et al., 2002). These sce-narios were designed to cover the range of uncertainty prevalent in future climate projec-tions, and represent the transient changes in climate that may be expected to occur fromthe baseline year (this was assigned to 2000) out to 2100. Here we present indicative resultsbased upon two of these scenarios:
(i) a low scenario which assumes that sea level rise occurs at an average rate of 2 mm/year and the wind wave regime remains the same as present.
(ii) a high scenario in which sea level rise occurs at an average rate of 12 mm/year andwinter wind speeds and wave heights increase incrementally to reach a value 10%higher than present by 2100.
A summary of the data flows used within the analysis are shown in Fig. 3. The SCAPEmodel uses data on geological composition and strength, waves, tides and history of engi-neered interventions to calculate the influence of climate change and sea level rise on theshore profile. As described in the next section, the cliff toe positions are then imported intothe GIS, where they are georeferenced, integrated with other datasets, and used to edit abaseline digital elevation model (DEM). The modified DEM, representing future clifftopography, is then combined with other contextual data and then transferred to the visu-alisation system for specialist graphical rendering.
Modified DEM
Cliff toe positions
Climate data
Wave data
SCAPE model
Sea level change
Water levels
Coastal GIS Socio-economic data
Historic maps
3D Visualisation
Baseline DEM
Tide & surge water levels
Geological data
Initial cliff profile
Land cover
Coastal defences Managementoptions
Virtual Landscapes (Present-day and Multiple Future Scenarios )
Fig. 3. Linkages and data flows for the combined cliff erosion information system. Further details on thevisualisation process are shown in Fig. 6.

I. Brown et al. / Comput., Environ. and Urban Systems 30 (2006) 840–860 847
4. GIS development
The direct outputs from the SCAPE model are numeric predictions of the amount of cliffrecession expected to occur for a particular sample site. To an expert who can interpret theoutput in this format, then a mental connection could be made between this and the widercontext such as hazard zones and infrastructure at risk. However, for non-expert coastalmanagers, and particularly for communication to the general public, information needsto be further developed to facilitate interpretation of its spatial and temporal content, inassociation with clear visual reference points. This allows users more flexibility in derivingrelevant information based upon their own particular context and requirements.
Essentially the process requires transformation of the numerical model data from thesample locations into a more complete representation of the coastline, and its integrationwith other contextual information. The present outline of the cliff can be obtained fromtopographic map data, either directly in vector format, or by reference to a DEM. Inthe latter case, the abrupt break of slope present at both the top and base of the cliffcan be used to delineate the top and toe of the cliff in digital format.
4.1. Cliff recession in 2D
The first task was to convert the numeric cliff recession data into a standard GIS for-mat. This was done by importing and manipulating the data within ARCVIEW3.2 using aseries of Avenue scripts. Subsequently the data was imported into ARC/INFO8, in orderto take advantage of the raster-processing capability of the GRID sub-system; as withmany inter-disciplinary projects, choice of software varied between project partners,implying that this step could be streamlined further. A spatial database containing theco-ordinates of each point, attributed by the year of prediction, was produced by trigo-nometry using the simulated recession distance (D) along the profile line at 30� from north,relative to the known baseline co-ordinates of the cliff (i.e. change in x = D sin30�; changein y = Dcos30�). This resulted in a series of georeferenced points indicating future cliffpositions for the sample locations (Fig. 4). The next step to assist in the interpretationof the data was to extrapolate the 1D point data into 2D to obtain a more complete rep-resentation of the changing coastline. Initially, this was achieved by connecting together allpoints from a particular recession year and the resulting segments were then incorporatedinto polyline format (Fig. 4).
Once the 2D representations of the coastline have been generated, additional contextualinformation can be provided, and it becomes possible to visualise and calculate the area ofland lost between a particular future year and the baseline year. To facilitate this, an Ave-nue script was created to produce a polygon structure linking the two relevant polylinestogether at their end points (Fig. 4). In combination with a land-use dataset, for example,this procedure can be used to estimate the proportion of different land-use types that maybe lost in the future.
The above method links recession points into a cliff-line using straight line segments.For low-resolution analysis, this procedure is certainly adequate, but user demands forhigh-resolution visualisation implied that refinement was required in order to meet theirexpectations. Therefore the methodology was modified in order that future cliff-line posi-tions could also include additional local detail in the form of embayments and headlands

Fig. 4. Future cliff recession data derived from the SCAPE model and imported into the GIS, showing present-day 2D cliff outline, SCAPE sample points (A, B, C, D) and SCAPE profile lines (dashed). Points A2, B2, C2 andD2 represent future model predictions. Straight line segments link ABCD and A2B2C2D2 with the hatched areaindicating the polygon area of land lost.
848 I. Brown et al. / Comput., Environ. and Urban Systems 30 (2006) 840–860
between SCAPE sample points, which are otherwise excluded by straight line segments(Fig. 4).
The refinement uses the 2D representation of the present cliffline and projects this to anew position based upon linear interpolation of recession distances from the two nearestSCAPE sample points. Therefore in Fig. 5 if intermediate point S (xs,ys) is closer to one ofthe SCAPE points A (xa,ya) than the other B (xb,yb), then the interpolated recession dis-tance (Ds) is more similar to the modelled recession at A (Da) than B (Db); this can be rep-resented by the following formula:
Fig. 5. Linear interpolation of intervening points on the cliff between 2 SCAPE sample locations 500 m apart (Aand B), as indicated by intermediate point S. The hatched area represents the land lost using this method betweenthe present cliff position and its future location.

I. Brown et al. / Comput., Environ. and Urban Systems 30 (2006) 840–860 849
Ds ¼ Da þ
ffiffiffiffiffiffiffiffiffiffiffiffiffiffiffiffiffiffiffiffiffiffiffiffiffiffiffiffiffiffiffiffiffiffiffiffiffiffiffiffiffiffiffiffiðxs � xaÞ2 þ ðys � yaÞ
2q
ffiffiffiffiffiffiffiffiffiffiffiffiffiffiffiffiffiffiffiffiffiffiffiffiffiffiffiffiffiffiffiffiffiffiffiffiffiffiffiffiffiffiffiffiðxs � xaÞ2 þ ðys � yaÞ
2q
þffiffiffiffiffiffiffiffiffiffiffiffiffiffiffiffiffiffiffiffiffiffiffiffiffiffiffiffiffiffiffiffiffiffiffiffiffiffiffiffiffiffiffiffiffiðxs � xbÞ2 þ ðys � ybÞ
2q ðDb � DaÞ
Following the same trigonometric procedure outlined earlier, the intermediate points aretransformed from their current to future positions using the interpolated recession dis-tance along the 30�N profile line utilised by SCAPE. Connecting together the new seriesof points provides the new recession line (Fig. 5). It is worth noting that it is generallynot necessary to use the detailed digital representation of the present cliffline for the inter-polation. Fractalisation of the coastline means that as the scale of examination increases,then the complexity and detail of its outline increases also. Therefore it is not uncommonfor a 2 km section of digitised cliffline to contain over a thousand individual nodes. Evenfor detailed visualisation, many of these node points are superfluous and as they increasethe calculation time to interpolate future cliff positions, application of a line generalisationprocedure becomes advantageous to reduce the amount of data by removing insignificantnodes, although the interpolation method is not dependent on this. For the purposes of thepresent study the modified version of the Douglas–Peucker algorithm (Douglas & Peuc-ker, 1973) was utilised, as employed by ARC/INFO8. The degree of generalisation canbe varied by adjusting the amount of tolerance which the algorithm employs to weedout insignificant points, with the results varying from a very complex outline with manynodes to virtually a straight line segment. For current purposes, the tolerance was set to5 m as this was considered to include all the salient features of the cliff outline, and a sen-sitivity test showed that reducing the tolerance further provided no visible gain in the finalvisualisation. Typically, data reduction over a 2 km section of coastline was from �103
points to �102 points.At a local scale, it can be seen that the end result of the interpolation process is a future
cliff outline more consistent with the present cliff outline (Fig. 5). However, it should benoted that in terms of the amount of land or sediment lost, then the difference in valuebetween the straight segment method and the refined interpolation method is generallyquite small and given the other uncertainties, virtually negligible. Nevertheless, withregard to visualisation, the refined method produces a visually more realistic representa-tion, particularly where there are significant irregularities in the coastline, because a cliffedge is never a straight line.
4.2. 3D coastal recession
Extending the interpretation into 3D provides the opportunity to analyse and visualisethe results with more graphical detail. To achieve this, the georeferenced model data wasfirst integrated and compared with a DEM to establish relative accuracy. Unfortunately,conventional DEM products such as the landform PANORAMA and PROFILE datasetsfrom the Ordnance Survey could not provide an adequate baseline due to the rapid rate ofcliff recession that has occurred in recent years, since the date of survey. This was partic-ularly evident where the removal of decaying defences has triggered high cliff recessionrates as the cliff attempts to reach equilibrium with the rest of the coast. In addition, userrequirements for detailed visualisation necessitated the use of a higher spatial resolutionthan these products provide.

850 I. Brown et al. / Comput., Environ. and Urban Systems 30 (2006) 840–860
To overcome these problems, the study utilised high-resolution LiDAR altimetry datamade available by the Environment Agency. The potential for LiDAR techniques to pro-vide accurate and detailed representations of morphology has already been noted by sev-eral studies (e.g. Charlton, Large, & Fuller, 2003; French, 2003), with the standardmanufacturer-quoted vertical error of ±15 cm found to be reasonable. The data usedfor this study has been post-processed into 2 km tiles each consisting of a grid of dataat 2 m horizontal resolution, with the removal of surface anomalies representing objectssuch as houses and trees, in order to provide a genuine DEM (for further discussion ofthis process, see Brovelli, Cannata, & Longoni, 2004). Further processing was thenrequired to correct small data gaps caused by features which can absorb the LiDAR beamand return no signal, notably water bodies.
Integration of the SCAPE data and the observed position of the cliff toe in 2003 withthe LiDAR DEM generally provided a horizontal accuracy of less than 5 m, providing asound foundation on which to extrapolate future positions. Hence, based upon theSCAPE model data, the interpolated position of the cliff toe in 2100 was overlaid uponthe reference DEM. Using a series of map algebra and reclassification procedures in theARC/INFO GRID environment of ARCGIS8, the area of the DEM between the futurecliff base and the present cliff base was edited and lowered to an elevation representing theshore platform and beach. This represents erosion of the cliff in this zone down to that ele-vation. As the SCAPE model also provides data on the evolving shore profile, the new ele-vation values were set to be consistent with the model output.
The above procedure assumes the cliff top and cliff base coincide in planform, with thediscontinuity in elevation therefore representing the equivalent of a vertical cliff. As withall soft erodible cliffs, this does not reflect reality in the area of study, with the zonebetween the cliff top and cliff base being wide (up to 200 m in width), representing the rel-atively low slopes (30–50�) prevalent here. The actual detail of the cliff slope was not con-sidered important in the present study, as essentially this is the result of sporadic stochasticprocesses that cannot be predicted with any accuracy for a particular discrete time step inthe future. Therefore the current slope of the cliff was maintained by isolating it, applyingan affine transformation using present and future SCAPE reference points, and then inte-grating it with the zone between the future cliff base and cliff top using the grid stitchingprocedure MERGE in ARC/INFO GRID, which allows a vacant zone in the parent data-set (defined as ‘No-Data’) to be replaced by another secondary dataset (i.e. the slope data).
5. Visualisation
Whilst the use of maps is widespread within planning documents, the information isoften complex and the concepts require familiarity (especially with regard to temporalchange maps), therefore map-based information still acts as a barrier to interpretationto many potential users (Appleton & Lovett, 2005). For this reason, the SCAPE GIS datawas further developed to enhance its 3D visual content and to explore the potential forincreased user engagement via interactive virtual landscapes. As discussed above, the2D map data can be developed into 3D format by integrating the model recession datawith a DEM.
For scientific visualisation, transforming DEM surface data into 3D using the VirtualReality Modelling Language (VRML), or graphical rendering software found in somedesktop GIS packages, can provide valuable insights into spatial or temporal variation
I. Brown et al. / Comput., Environ. and Urban Systems 30 (2006) 840–860 851
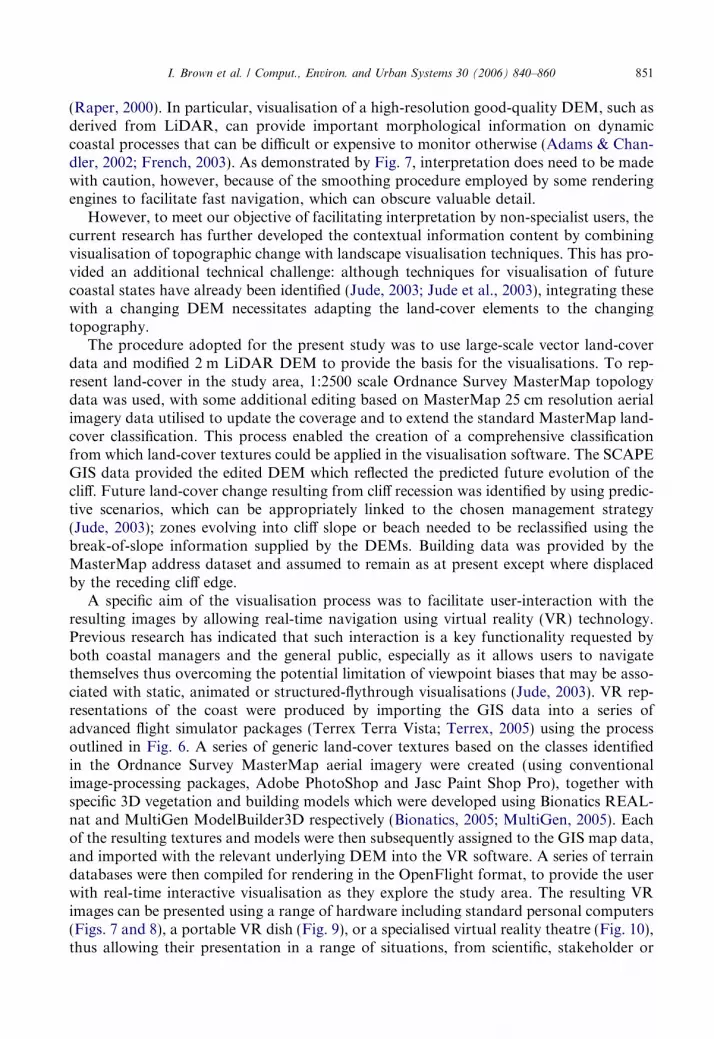
(Raper, 2000). In particular, visualisation of a high-resolution good-quality DEM, such asderived from LiDAR, can provide important morphological information on dynamiccoastal processes that can be difficult or expensive to monitor otherwise (Adams & Chan-dler, 2002; French, 2003). As demonstrated by Fig. 7, interpretation does need to be madewith caution, however, because of the smoothing procedure employed by some renderingengines to facilitate fast navigation, which can obscure valuable detail.
However, to meet our objective of facilitating interpretation by non-specialist users, thecurrent research has further developed the contextual information content by combiningvisualisation of topographic change with landscape visualisation techniques. This has pro-vided an additional technical challenge: although techniques for visualisation of futurecoastal states have already been identified (Jude, 2003; Jude et al., 2003), integrating thesewith a changing DEM necessitates adapting the land-cover elements to the changingtopography.
The procedure adopted for the present study was to use large-scale vector land-coverdata and modified 2 m LiDAR DEM to provide the basis for the visualisations. To rep-resent land-cover in the study area, 1:2500 scale Ordnance Survey MasterMap topologydata was used, with some additional editing based on MasterMap 25 cm resolution aerialimagery data utilised to update the coverage and to extend the standard MasterMap land-cover classification. This process enabled the creation of a comprehensive classificationfrom which land-cover textures could be applied in the visualisation software. The SCAPEGIS data provided the edited DEM which reflected the predicted future evolution of thecliff. Future land-cover change resulting from cliff recession was identified by using predic-tive scenarios, which can be appropriately linked to the chosen management strategy(Jude, 2003); zones evolving into cliff slope or beach needed to be reclassified using thebreak-of-slope information supplied by the DEMs. Building data was provided by theMasterMap address dataset and assumed to remain as at present except where displacedby the receding cliff edge.
A specific aim of the visualisation process was to facilitate user-interaction with theresulting images by allowing real-time navigation using virtual reality (VR) technology.Previous research has indicated that such interaction is a key functionality requested byboth coastal managers and the general public, especially as it allows users to navigatethemselves thus overcoming the potential limitation of viewpoint biases that may be asso-ciated with static, animated or structured-flythrough visualisations (Jude, 2003). VR rep-resentations of the coast were produced by importing the GIS data into a series ofadvanced flight simulator packages (Terrex Terra Vista; Terrex, 2005) using the processoutlined in Fig. 6. A series of generic land-cover textures based on the classes identifiedin the Ordnance Survey MasterMap aerial imagery were created (using conventionalimage-processing packages, Adobe PhotoShop and Jasc Paint Shop Pro), together withspecific 3D vegetation and building models which were developed using Bionatics REAL-nat and MultiGen ModelBuilder3D respectively (Bionatics, 2005; MultiGen, 2005). Eachof the resulting textures and models were then subsequently assigned to the GIS map data,and imported with the relevant underlying DEM into the VR software. A series of terraindatabases were then compiled for rendering in the OpenFlight format, to provide the userwith real-time interactive visualisation as they explore the study area. The resulting VRimages can be presented using a range of hardware including standard personal computers(Figs. 7 and 8), a portable VR dish (Fig. 9), or a specialised virtual reality theatre (Fig. 10),thus allowing their presentation in a range of situations, from scientific, stakeholder or

GIS DATA
Compile into OpenFlight database
TerraVista from Terrex
3D building modelsModels have dynamic LOD
switching and photo-textures created using MultiGen
ModelBuilder3D
Source DEM LiDAR data with 2m
grid Vegetation modelsCreated using REALnat
from BionaticsLandcover data
OS MasterMap with additional editing of the polygons and
landcover attributes based on
MasterMap aerial photography
Landcover texturesStandard textures or new
textures created using PhotoShop &Paint Shop Pro
CREATION OF INTERACTIVE VISUALISATION
VIEWING
PC/laptop/VisionStationAudition viewer with simple navigation and rendering
controls
Virtual reality lab• Quantum3D
Independence PC -based image generator & Mantis image generator software
• 5mx 2m screen with 125o
FOV & stereo projection system
Mantis features:• LOD switching• Scene control• Terrain database switch• Model control• Navigation• Environment controls
e.g. time of day, and weather conditions
Cliff recession SCAPE model
outputs linked to DEM
Fig. 6. The process used to create the interactive virtual landscapes.
Fig. 7. Close-up view of a section of the cliffs with steeper areas at the cliff toe representing areas undercut andactively eroded by the sea. Some smoothing of the raw surface data has been employed by the rendering software.
852 I. Brown et al. / Comput., Environ. and Urban Systems 30 (2006) 840–860
public meetings, to consultation with smaller local groups or individuals, in order to elicitopinions on future coastal management options.

Fig. 8. Views from the interactive visualisations of the NE Norfolk coast showing: (a) the present-day coastalenvironment; (b) the simulated cliff recession for 2100 AD at the same location using the Low climate changescenario and with all defences removed. Note the movement of the cliff edge relative to the central plantation andchurch (white building on left).
I. Brown et al. / Comput., Environ. and Urban Systems 30 (2006) 840–860 853
6. Discussion
The sequential development of the research from simulation modelling through to thevisualisation of coastal erosion occurred at a time concurrent with revision of the SMP,and therefore user feedback on the results were strongly influenced by planning procedure.

Fig. 9. Viewing the interactive visualisations on a portable hemispherical dish (Elumens VisionStation), ontowhich the VR image is projected to provide an immersive display. Users can navigate in real time using mouseinputs. The OpenFlight files are rendered using a standard desktop PC, which is visible in the left background,running the Audition VR viewer software.
854 I. Brown et al. / Comput., Environ. and Urban Systems 30 (2006) 840–860
Scientific knowledge from the modelling results has been absorbed into the revised SMPconsultation document (Halcrow, 2004), supporting the conclusion that defending largesections of this coastline is unsustainable because of the reductions in sediment supply thishas produced. Due to this sediment deficit and background coastal processes, beach levelsare lowering at critical locations, undermining defence structures and necessitating expen-sive maintenance. Furthermore, undefended locations are forming unsustainable head-lands on the coastline.
The resulting future visualisations have been shown to coastal managers with the focuson their potential role as awareness-raising tools, communicating visually the results fromthe simulation model. The intention was that interpretation of the modelling results shouldnot be predicated on specialist knowledge of coastal processes or climate change. A keyelement in the visualisation strategy was therefore user-recognition of landmarks (e.g.churches; coastguard stations) acting as reference points, through which users could notonly position themselves spatially but also detect the rate of temporal change through clifferosion when viewing future landscapes (Figs. 7 and 8). Feedback has been particularlypositive in this regard, with users commenting favourably on the high level of realism inthe visualisations, and the clear evidence of future change with respect to known land-marks; the capability to easily move to a new viewpoint is an important advantage in thisrespect. In particular, by exploring management options which imply future non-mainte-nance of defences, it could be more easily discerned that cliff recession rates would signif-icantly alter the level of risk for some areas of present-day cliff-top infrastructure. Thevisualisation process would therefore seem to offer considerable benefits in promoting haz-ard awareness and risk perception. In addition, the capability of VR images to allay sus-picions regarding viewpoint bias in visualisations apparently provides a useful asset inconveying information related to controversial plans or options, as evident in the revisedSMP.

Fig. 10. Interactive navigation of the virtual landscape in a VR theatre using a wireless joystick that is linked tothe pilot desk PC from which the OpenFlight files are rendered through a remote image generator. This canfacilitate a more immersive experience with large screen and stereographic viewing.
I. Brown et al. / Comput., Environ. and Urban Systems 30 (2006) 840–860 855
User feedback has therefore consistently suggested that the greater level of realism inthe visualisations would encourage broader user engagement in the issues of erosion riskmanagement and that the visualisations could communicate change in a more direct andaccessible format compared to maps and documents. However, this level of realism wasalso inferred to be problematic with regard to the current SMP consultation procedure,due to the sensitivity of the information. Perception of visual images is inevitably influ-enced not only by rational responses but also by emotional involvement and pragmaticinterests (Nicholson-Cole, 2005). For local people, issues relating to loss of property orlivelihood were obviously of high concern. Therefore despite the positive feedback fromcoastal managers on the value of the visualisations as an effective communication tool,they provided the caveat that transfer of this information to the general public would takethem into ‘uncharted waters’ as it could potentially undermine ongoing planning proce-dures. In effect, therefore, the awareness-raising value of the visualisations might thereforebe deemed to be counter-productive. This finding seems to be consistent with those ofAppleton and Lovett (2005) who also identified concerns amongst planners about theuse of realistic computer visualisations during consultations without a better supportingplatform, such as phased implementation and provision of auxiliary material. Dietz,

856 I. Brown et al. / Comput., Environ. and Urban Systems 30 (2006) 840–860
Tanguay, Tuler, and Webler (2004) also noted reluctance amongst officials to place modelresults explicitly in the public domain, despite their interest and support for the modellingprocess. A key issue encountered by the present case study with regard to the SMP review,is that consultation only involves communication of the preferred future managementstrategy, and some of the managers believed that wider availability of the visualisa-tions would potentially jeopardise this procedure, despite acknowledging that it haddrawbacks.
A significant finding of the research has been that the preferred level of realism in thevisualisations has varied between two groups: scientists and coastal decision-makers. Themore abstract scientific visualisation techniques generally favoured by specialists for dataexploration and hypothesis-testing do not appear to be as successful at engaging decision-makers and planners. The evidence suggests therefore that for using visualisation as acommunication tool, the preference from non-specialist users is for a high level of realism,a finding that concurs with other workers (e.g. Appleton and Lovett, 2003, 2005; Bishop,1994; Lange, 2001). Furthermore, some have argued that abstraction can actually be mis-leading with Tress and Tress (2003, p. 164) claiming that ‘‘a higher degree of abstractionleaves an empty, unknown area that is filled by people’s own imaginations, which couldeasily lead to misinterpretations and consequently complicate communication’’. Theadvent of multimedia and hypermedia technology and their diffusion into wider societyhave undoubtedly increased user expectations in this respect. Whilst the use of a real-timeapproach enables user-interaction at the expense of providing a slightly lower level ofapparent realism compared to approaches using static (or animated) photorealistic images(e.g. Appleton & Lovett, 2005), experimental research has identified that opinions divergeregarding the added interpretation benefit of highly-detailed visualisations (Jude, 2003). Akey consideration for the present study was that the Application Programme Interface(API) available for the real-time VR software facilitates an improved coupling of the visu-alisation, GIS and simulation components than could be achieved with photorealistic ren-dering packages.
There is a danger, however, that the mismatch between the ‘supply’ of credible modeldata and the user-driven ‘demand’ for realistic information can lead to a divergencebetween the processes of model-based simulation and user-visualisation. This difficultyarises because it is extremely challenging to produce data that is both scientifically crediblebut also provides detailed information at the level of realism that decision-makers believeis most suitable. The general perception amongst many planners or managers is that themore detail that exists within a visualisation, then the more accurate and believable it is(Appleton & Lovett, 2003). Nevertheless, to create the visualisations in this study, signif-icant information below the resolution of the SCAPE model has had to be added; in effect,the model data has been extrapolated from 1D to 3D. This poses a challenge for simula-tion-based visualisation because a contradiction can emerge between simulation model-ling, which essentially has to generalise the real-world in order to effectively facilitateunderstanding, and the visualisation process which is increasingly judged by its realism.One can argue that the visualisation can become potentially misleading if it suggests tothe viewer that the underlying scientific knowledge is unequivocal at this high level ofdetail (Sheppard, 2001): the challenge is to avoid this situation occurring.
Hence, although non-experts have indicated that the resulting visualisations could con-siderably improve the communication of anticipated future coastal change, potentiallythey add new information which is not as scientifically robust as the simulation model out-

I. Brown et al. / Comput., Environ. and Urban Systems 30 (2006) 840–860 857
puts, or present just one credible extrapolation from the original sample points. A large setof other equally credible visualisations can therefore be implied to exist that are not beingpresented. With regard to visualising future change, therefore, we can recognise two dis-tinct sources of uncertainty:
(i) multiple alternative landscape/landform states;(ii) multiple representations of each state.
The use of concepts such as ‘scenarios’ can partly address uncertainty of future state,particularly in the scientific world, by indicating that it represents just one plausible out-come. However, communication of both sources of uncertainty to the lay person remains asignificant impasse, because conventionally communication media have tended to avoidthis issue.
Hence although visualisation has become a valuable part of the geoinformation toolkit,recently some workers have added notes of caution and implied the need for more transpar-ency, a series of agreed common guidelines, and the development of new methods (Dock-erty et al., 2005; Lange, 2001; Sheppard, 2001). The present study underscores these issues:should we show rather abstract and artificial visualisations based directly on model outputsthat can be clearly linked to the underlying model prediction (e.g. using straight linesbetween sample points), or should we further develop visualisation techniques so that theycan engage a broader section of society but also communicate uncertainty more effectively?The latter approach clearly needs to be further evaluated and may involve techniques suchas split screens to communicate alternative multiple scenarios, or approaches such as fuzzyboundaries or overlain error contours on the landscape, perhaps even transparency orsound on a multimedia platform. As Davis and Keller (1997) have noted, risk managementdecisions provide particular visualisation issues relating to the definition and interpretationof ‘‘acceptable’’ uncertainty. Hence, in the same way that animation is now becoming astandard medium in which to communicate temporal change in 2D images (e.g. Smith,Spencer, & Moller, 2000), it is hoped that technological and cognitive research will beginnow to more fully embrace the challenge of communicating the uncertainty within 3D visu-alisation whilst not disengaging the user. In this context, it seems inevitable that a suite ofcomplimentary visualisation techniques will be required by end-users, including static, ani-mated and real-time techniques, depending on the purpose and stage of the communicationprocess (Jude et al., 2005).
7. Conclusions
By linking an erosion model with a GIS and then developing the resulting spatial infor-mation into visualisations of the evolving coastal environment, information on the chang-ing hazard from future cliff recession can be made more accessible to non-specialists. Usersgenerally seem to welcome the additional detail and realism that the visualisations provide,and acknowledge the communication and awareness-raising value of the images. The cred-ibility of the resulting virtual landscapes in the future is also enhanced by their derivationfrom scientific data provided by the simulation model. However, stakeholders also high-light issues of sensitivity and restrictions related to current planning procedures whichwould need to be addressed before such tools become more widely employed. Anotherkey issue that emerges is that the quest for realism in visualisation can lead to more

858 I. Brown et al. / Comput., Environ. and Urban Systems 30 (2006) 840–860
detailed data demands than provided by the underlying scientific model supplying therationale for the future landscape predictions. This ‘stretching’ of the model data to meetfurther requirements is a characteristic of so-called ‘Post-Normal’ science (Funtoeicz &Ravetz, 1993) as researchers increasingly strive to make their work more policy-relevant.It is particularly apparent when policy-makers require and request future predictions forstrategic planning purposes. Further research is therefore required to develop both meth-ods and conventions bridging the divide, notably by establishing acceptable techniques tocommunicate uncertainty within visualisation. The next stage of the work proposes tobegin addressing this last issue by exploring probabilistic techniques for modelling andvisualising erosion risk zones landward of the present cliff top.
Acknowledgements
This research was funded by the Tyndall Centre for Climate Change Research as part ofthe ‘‘Sustaining the Coastal Zone’’ research theme (www.tyndall.ac.uk). Wave transferfunctions were developed by Professor Peter Stansby and colleagues in the School of CivilEngineering, University of Manchester. Offshore wave data was processed using HIND-WAVE by HR Wallingford. The dedicated virtual reality facility was funded by HEFCE.Historical mapping data was provided by the British Geological Survey, LiDAR data bythe Environment Agency, and MasterMap and landform PROFILE data by the OrdnanceSurvey. All Ordnance Survey data are Ordnance Survey �Crown Copyright. All rights re-served. Helpful comments from referees on improving the original paper are also readilyacknowledged.
References
Adams, J. C., & Chandler, J. H. (2002). Evaluation of lidar and medium scale photogrammetry for detecting soft-cliff coastal change. Photogrammetric Record, 17, 405–418.
Al-Kodmany, K. (2001). Visualization tools and methods for participatory planning and design. Journal of Urban
Technology, 8, 1–37.Appleton, K., & Lovett, A. (2003). GIS-based visualisation of rural landscapes: defining ‘‘sufficient’’ realism for
environmental decision making. Landscape and Urban Planning, 65, 117–131.Appleton, K., & Lovett, A. (2005). GIS-based visualisation of development proposals: reactions from planning
and related professionals. Computers, Environment and Urban Systems, 29(3), 321–339.Bartlett, D. J., & Wright, D. J. (2000). Epilogue. In D. J. Bartlett & D. J. Wright (Eds.), Marine and coastal
geographical information systems (pp. 309–315). London, NewYork: Taylor and Francis.Baudrillard, J. (1983). Simulations. New York: Semiotext.Benoit, M., Marcos, F., & Becq, F. (1996). Development of a third generation shallow-water wave model with
unstructured spatial meshing. In Proceedings of the 25th international conference on coastal engineering
(pp. 465–478). Orlando, FL: ASCE.Bionatics (2005). Available from http://www.bionatics.com/ (REALnat).Bishop, I. (1994). The role of visual realism in communicating and understanding spatial change and process. In
H. M. Hearnshaw & D. J. Unwin (Eds.), Visualization in geographical information systems (pp. 60–64).London: Wiley.
Bishop, I., Fasken, G., Ford, R., Hickey, J., Loiterton, D., & Williams, K. (2003). Visual simulation of forestregrowth under different harvest options. In E. Buhlman & S. M. Ervin (Eds.), Trends in landscape modeling
(pp. 46–55). Heidelberg: Herbert Wichmann Verlag.Bray, M. J., & Hooke, J. M. (1997). Prediction of soft-cliff retreat with accelerating sea-level rise. Journal of
Coastal Research, 13, 453–467.Brovelli, M. A., Cannata, M., & Longoni, U. M. (2004). LIDAR data filtering and DTM interpolation within
GRASS. Transactions in GIS, 8, 155–174.

I. Brown et al. / Comput., Environ. and Urban Systems 30 (2006) 840–860 859
Brown, I. M. (1999). Developing a virtual reality user interface (VRUI) for information retrieval on the Internet.Transactions in GIS, 3, 207–220.
Brown, I., Kidner, D. B., Lovett, A., Mackaness, W., Miller, D. R., Purves, R., et al. (2002). Virtual landscapes.In P. Fisher & D. Unwin (Eds.), Virtual reality in geography (pp. 95–101). London, New York: Taylor andFrancis.
Charlton, M. E., Large, A. R. G., & Fuller, I. C. (2003). Application of airborne LiDAR in river environments:the River Coquet, Northumberland, UK. Earth Science Processes and Landforms, 28, 299–306.
Cooper, N. J., Barber, P. C., Bray, M. C., & Carter, D. J. (2002). Shoreline management plans: a national reviewand an engineering perspective. Proceedings of the Institution of Civil Engineers, Water and Maritime
Engineering, 154, 221–228.Davis, T. J., & Keller, C. P. (1997). Modelling and visualizing multiple spatial uncertainties. Computers and
Geosciences, 29, 397–408.Dietz, T., Tanguay, J., Tuler, S., & Webler, T. (2004). Making computer models useful: an exploration of
expectations by experts and local officials. Coastal Management, 32, 307–318.Dockerty, T., Lovett, A., Sunnenberg, G., Appleton, K., & Parry, M. (2005). Visualising the potential impacts of
climate change on rural landscapes. Computers, Environment and Urban Systems, 29, 297–320.Douglas, D. H., & Peucker, T. K. (1973). Algorithms for the reduction of the number of points required to
represent a digitized line or its caricature. Canadian Geographer, 10, 112–123.Ervin, S. M. (2001). Digital landscape modeling and visualization: a research agenda. Landscape and Urban
Planning, 54, 49–62.French, J. R. (2003). Airborne LiDAR in support of geomorphology and hydraulic modelling. Earth Science
Processes and Landforms, 28, 321–335.Funtoeicz, S. O., & Ravetz, J. R. (1993). Science for the Post-Normal Age. Futures, 25, 739–755.Gray, N. (1995). Seeing nature: the mathematisation of experience in virtual realities. History of European Ideas,
20(1–3), 341–348.Halcrow (2004). Kelling to Lowestoft Ness Shoreline Management Plan. Consultation Document.Hawkes, P. J. (1987). A wave hindcasting model. In Proceedings of conference on modelling the offshore
environment, Society for Underwater Technology, London.Hulme, M., Jenkins, G. J., Lu, X., Turnpenny, J. R., Mitchell, T. D., & Jones, R. G., et al. (2002). Climate change
scenarios for the United Kingdom: The UKCIP02 Scientific Report. Tyndall Centre for Climate ChangeResearch, University of East Anglia Norwich, UK.
Jude, S. R. (2003). The application of visualisation techniques for coastal zone management. Unpublished PhDthesis, University of East Anglia.
Jude, S. R., Brown, I., Koukoulas, S., Dickson, S., Dickson, S., Walkden, M., et al. (2005). Exploring futurecoastlines? Initial steps towards the development of an integrated coastal simulation and visualisation system.In E. Buhlman, P. Paar, I. J. Bishop, & E. Lange (Eds.), Trends in real-time landscape visualization and
participation (pp. 69–76). Heidelberg: Herbert Wichmann Verlag.Jude, S. R., Jones, A. P., Andrews, J. E., & Bateman, I. J. (2003). Developing techniques to visualize future
coastal landscapes. In E. Buhlman & S. M. Ervin (Eds.), Trends in landscape modelling (pp. 228–238).Heidelberg: Herbert Wichmann Verlag.
Kuang, C.-P., & Stansby, P. K. (2004). Efficient modelling for directional random wave propagation inshore. ICE
Maritime Engineering, 157, 123–132.Laboratoire National d’Hydraulique (2002). TELEMAC User Manual. Chatou, France: Fluvial Hydraulics
Group, Laboratoire National d’Hydraulique, Direction des Etudes et Recherches, Electricite de France.Lange, E. (2001). The limits of realism: perceptions of virtual landscapes. Landscape and Urban Planning, 54,
163–182.Lee, M. (2001). Coastal defence and the Habitats Directive: predictions of habitat change in England and Wales.
Geographical Journal, 167, 57–71.Livingstone, D. L., & Raper, J. F. (1999). Developing a visualization system for simulating the growth of coastal
spits. In Proceedings of the 4th international conference on geocomputation, Fredericksburg, Virginia, USA.Paper 94: CD-Rom.
Miller, D. R., Dunham, R. A., & Chen, W. (2003). The application of VR modeling in assessing potential visualimpacts of rural development. In P. Fisher & D. Unwin (Eds.), Virtual reality in geography (pp. 131–142).London: Taylor and Francis.
MultiGen (2005). Available from http://www.multigen.com/ (ModelBuilder3D).

860 I. Brown et al. / Comput., Environ. and Urban Systems 30 (2006) 840–860
Nicholson-Cole, S. A. (2005). Representing climate change futures: a critique on the use of images for visualcommunication. Computers, Environment and Urban Systems, 29, 255–273.
Orland, B., Budthimedhee, K., & Uusitalo, J. (2001). Considering virtual worlds as representations of landscaperealities and as tools for landscape planning. Landscape and Urban Planning, 54, 139–148.
Raper, J. (2000). Multidimensional geographic information science. London, New York: Taylor and Francis.Sheppard, S. R. J. (2001). Guidance for crystal ball gazers: developing a code of ethics for landscape visualization.
Landscape and Urban Planning, 54, 183–199.Smith, G. M., Spencer, T., & Moller, I. (2000). Visualization of coastal dynamics: Scolt Head Island, North
Norfolk, England. Estuarine, Coastal and Shelf Science, 50, 137–142.Swail, V. R., & Cox, A. T. (2000). On the use of NCEP/NCAR reanalysis surface marine wind fields for a long
term North Atlantic wave hindcast. Journal of Atmospheric Technology, 17, 532–545.Terrex (2005). Available from http://www.terrex.com/ (Terra Vista).Tress, B., & Tress, G. (2003). Scenario visualisation for participatory landscape planning—a study from
Denmark. Landscape and Urban Planning, 64, 161–178.Tufte, E. R. (1990). Envisioning information. Cheshire, CT, USA: Graphics Press.Walkden, M. J., & Hall, J. W. (2002). A model of soft cliff and platform erosion. In Proceedings of the 28th
international conference on coastal engineering 2002 (Vol. 3, pp. 3333–3345).Walkden, M. J., & Hall, J. W. (2005). A predictive mesoscale model of soft shore evolution. Coastal Engineering,
52, 535–563.