interactive self-adaptive clutter-aware visualisation for
TRANSCRIPT
Interactive Self-Adaptive Clutter-Aware Visualisationfor Mobile Data Mining
Mohamed Medhat Gabera, Shonali Krishnaswamyd,b, Brett Gillickb, HasnainAlTaiarb, Nicholas Nicoloudisb, Jonathan Lionob, Arkady Zaslavskyc
aUniversity of PortsmouthPortsmouth, Hampshire, England, PO1 3HE, UK
bMonash UniversityCaulfield East, Melbourne, Victoria, 3145, Australia
cCSIRO ICT CentreGPO Box 664, Canberra ACT 2601, Australia
dInstitute for Infocomm Research1 Fusionopolis Way - 21-01 Connexis (South Tower) Singapore 138632
Abstract
There is an emerging focus on real-time data stream analysis on mobiledevices. A wide range of data stream processing applications are targeted torun on mobile handheld devices with limited computational capabilities suchas patient monitoring, driver monitoring, providing real-time analysis and vi-sualisation for emergency and disaster management, real-time optimisation forcourier pick-up and delivery etc. There are many challenges in visualisationof the analysis/data stream mining results on a mobile device. These includecoping with the small screen real-estate and effective presentation of highlydynamic and real-time analysis. This paper proposes a generic theory for visu-alisation on small screens that we term Adaptive Clutter Reduction ACR. Basedon ACR, we have developed and experimentally validated a novel data streamclustering result visualisation technique that we term Clutter-Aware ClusteringVisualiser CACV and its enhancement of enabling user interactivity that weterm iCACV. Experimental results on both synthetic and real datasets using theGoogle Andriod platform are presented proving the effectiveness of the proposedtechniques.
1. Introduction
The phenomenal growth of mobile devices coupled with their ever-increasingcomputational capacity presents an exciting new opportunity for real-time, intel-ligent data analysis in pervasive/ubiquitous environments. Ubiquitous/MobileData Mining is the process of analysing data streams using mobile and/or em-bedded devices (e.g. sensors) to support critical applications such as mobilehealthcare, intelligent transportation systems, and emergency/disaster manage-ment like bushfires.
Preprint submitted to Journal of Computer and System Sciences April 17, 2012
The typical constraints that have to be addressed in performing mobile datamining are: (1) data streams are generated and sent in real-time in a stream for-mat [14] with little or no potential for persistent storage, (2) resource constraintsinclude limited computational resources such as memory, processor speed, net-work bandwidth, battery power, and screen real-estate, (3) temporal constraintsrefer to real-time information and decision-making needs that, in turn, neces-sitate the analysis to be online, incremental and continuous, (4) mobility ofusers and devices and the connectivity issues thereof, and (5) adaptation ofthe analysis process to varying/dynamically changing resource-levels and userneeds.
In the last few years, rapid strides have been made in accurately and ef-ficiently mining high speed data streams [16] in mobile devices such as Per-sonal Digital Assistants (PDAs) [10, 11, 6] and there is a growing focus on ”in-network” processing using embedded devices such as sensor nodes [7, 12, 13].Kargupta et al. [11] have developed a client/server data stream mining system:MobiMine which focuses on data stream mining applications for stock marketdata. Kargupta et al. in the Vehicle Data Stream Mining System VEDAS [10]develop algorithms that are operational on a PDA. VEDAS is a data streammining system that allows continuous monitoring and pattern extraction fromdata streams generated on-board a moving vehicle. MOLEC [13] is a mobilecardiac monitoring system that aims to analyse ECG signals to identify a rangeof anomalies and arrhythmias using decision trees that were built off-line. In [7],real-time mining of information from in-vehicle sensors to minimise driver dis-traction is proposed through adaptation of the instance-selection process basedon changes to the data distribution. Dynamic adaptation to data rates and finetuning of processing parameters can significantly enhance the longevity of con-tinuous real-time processing of data streams in mobile environments. Severalmobile data stream mining algorithms have been proposed that operate usingthe principles of adaptation for Clustering, Change Detection, Classification andFrequent Items Analysis [6, 8, 9]. In summary, these techniques leverage thebody of work that exists in mining data streams and aim to enable the operationof these algorithms in resource-constrained environments [9].
However, there are currently no general strategies for visualisation developedor available for mobile data mining. Thus, while much research has focused ondeveloping novel ways of analysing data in real-time on mobile devices, therehave not been specific techniques developed for visualisation of the analysis.We do note that visualising data streams has been the focus of recent research[28, 29, 30]. This can be primarily attributed to the fact that it is only nowthat even analysis is possible on mobile devices. visualisation of the resultsfrom analysis in real-time is therefore an emerging challenge - but one that isvital in order to effectively leverage the benefits of mobile data mining to enablereal-time decision making by mobile users. The key challenges to visualisationof mobile data mining are:
1. The small screen real-estate of mobile phones/PDAs and therefore theneed to effectively use this limited screen space to present useful and easy-
2
to-understand information;
2. The need to dynamically perform computations relating to visualisation;and
3. The need to rapidly change the visualisation so that they capture andreflect accurately the current state of the underlying analysis process.
In this paper, we present a generic approach for real-time visualisation formobile data mining - Adaptive Clutter Reduction ACR. This approach is basedon the principles of clutter-reduction [18]. In general, visualisation theory stud-ies have established that reducing the clutter on the screen is a key to improvingperception and understanding of information that is presented. An evaluationof clutter levels of traditional visualisation techniques has been discussed in[18]. The issue of on-screen clutter becomes significant in the context of mobiledevices which have much smaller screens than traditional desktops (on whichthe aforementioned studies have been conducted). In addition, it becomes muchmore acute when visualisation is for a continuous, rapid and dynamically chang-ing situation as is typical for mobile data mining applications such as monitoringheart-patient ECGs or analysing mobile police personnel locations in real-time.
Based on our ACR approach, we have developed the first clutter-aware datastream clustering visualiser for mobile data mining that automatically considersthe amount of information presented on a screen and dynamically adjusts theway this information is presented to reduce clutter and therefore increase com-prehension/ease of understanding. The technique is further sophisticated by theinclusion of elements that allow this adaptive visualisation to be personalised tothe user and the ability of the visualiser to adapt the process in relation to theavailable energy/battery levels on the device. There are three main variablesthat need to be factored. First, there are a large number of mobile deviceseach with varying screen sizes and computational capability. Second, the rangeof applications for which mobile data mining can be used and the consequentapplication specific needs for visualisation is also highly variant. Thirdly, thereis the variation in different users’ ability to process information present on thescreen. Given these variables, our clutter-aware visualisation algorithm allowschanging at anytime the key thresholds that control the visualisation process,such as how much of clutter is tolerable for a user and what frequency of infor-mation update is required by a user. Thus, the technique is not merely adaptiveto clutter-levels on the screen, but is also flexible enough to be tailored to eachuser’s personal preferences. Furthermore, these preferences can be changed atanytime while the analysis and visualisation is occurring, thereby enabling it tobe dynamically instrumented for changing situations.
The rest of this paper is organised as follows: Section 2 presents relatedwork in the area of clutter reduction techniques. Section 3 presents our Adap-tive Clutter Reduction ACR theory. Section 4 details our Clutter-Aware Clus-tering Visualiser CACV technique based on the theory of ACR. An importantenhancement to CACV that enables user interaction is given in Section 5. Sec-tion 6 shows detailed experimental study. Finally the paper is concluded inSection 7.
3
2. Related Work
Our review of related work is discussed in the context of two areas: 1. thebroad area of visual clutter reduction techniques, and 2. the existing techniquesfor UDM visualisation, which is in its nascent stage of growth and evolution.The problem of cluttered screens for information visualisation has long beingstudied [18] and a comprehensive review and taxonomy of such techniques ispresented in [18]. Many clutter reduction techniques has been proposed in theliterature and have been shown to improve the understanding of the underlyinginformation visualised on the screen. These techniques have been categorisedinto three broad categories pertaining to the appearance, spatial distortion ortemporal aspects of the information [18]. The first category of clutter reductiontechniques focuses on changing how each data item is represented on the screen.Techniques under this category include: sampling, filtering, changing point size,changing opacity and clustering. Each of these techniques decreases the screenclutter in one of the following ways: displaying only subset of the data points,displaying a summary of these points, and changing the size of each displayedpoint. The second category of clutter reduction techniques changes the dis-tances among the points. Techniques under this category include: point/linedisplacement, topological distortion, space-filling, pixel plotting, or dimensionalreordering. The third of category of clutter reduction techniques represents datathat could be displayed with a temporal dimension. Thus, animation is the onlytechnique used under this category. These techniques are typically characterisedby features such as avoiding overlap as well as displaying overlap density, keep-ing spatial information (for geo-coding applications), providing localised views(e.g. by allowing zooming into details), being scalable and coping with largedatasets, and allowing interaction and adjustability.
Research conducted by Cuzzocrea et al [1, 2] on the efficient visualisation ofmultidimensional data cubes is also related to our work. It has been proposedto use the OLAP dimension flattening process to result in two dimensionalOLAP views of the data cube. This is specially important for visualisation onsmall devices like smartphones and tablet computers. Moreover, a system fordelivering OLAP services to mobile devices has been proposed and developed asreported in [3]. A compressed quad-tree representation of data cubes has beenused with the number of splits adapted to the available storage space. Thisallows the structure to be used efficiently on small devices with limited storagecapacity.
While the range of available visualisation techniques to operate on bothsmall and large screens can reduce the clutter in different ways, to the best ofour knowledge, none of these techniques operate in a manner whereby they areaware of the extent of cluttering.
3. Adaptive Clutter Reduction Theory
Our CACV is based on a theoretical framework that brings together theinformative, perception and screen clutter levels. The notion of clutter has
4
been discussed in depth in [18]. More formally, we define clutter as havingthe number of visualised units (e.g., clusters, nodes in a decision tree, etc.)exceeding a pre-set threshold by the user, and/or the amount of screen spaceoccupied as a percentage of the total screen area exceeding a pre-set thresholdby the user.
A definition of clutter using mathematical notation could be defined as fol-lows. Let u a unit of display on the display and s(u) be the screen space occupiedby the unit u at a given time t. Let there be n units on the screen. Two userthresholds are pre-set: (1) utn: a user threshold for the number of units, and(2) uts: a user threshold for screen occupancy. As such a screen clutter occurswhen (n > utn) ∨ (s(u)× n > uts).
Our CACV is based on a theoretical framework that brings together theinformative, perception and screen clutter levels. It is based on the followingtwo corollaries.
Corollary 3.1. Let i(v) be the informative level of the visualizer v, and c(v) bethe level of clutter on the screen. It is established that i(v) α c(v).
Corollary 3.1 states that the more information visualised on the screen, themore cluttered the screen is. For example, if the user initiates simultaneousapplications, each running on a different window, then the clutter on the screenincreases. Because the number of items presented on the screen has been multi-plied by the number of running applications. In the context of the data miningapplications, examples that show clearly the relationship i(v) α c(v) include:
• The number of clusters on the screen represents i(v). This implies thatthe more clusters the user can see on the screen, the more informationabout the underlying data is simultaneously presented. However, it isclear also that the higher number of clusters presented on the screen, themore clutter the screen is (higher c(v)).
• Having a higher number of nodes in a decision tree implies higher i(v) andconsequently higher c(v).
• When using histograms to represent frequent items, the more items pre-sented simultaneously on the screen, the higher both i(v) and c(v) are.
Corollary 3.2. Let p(v) be the level of perception of the visualised results. Itis established that p(v) α 1
c(v) .
Corollary 3.2 refers that although the screen is more informative by increas-ing the level of clutter, it is actually less understandable when perceived by theuser. For example, if the number of simultaneously displayed windows on thescreen is greater than five, the user can hardly benefit from the five openedwindows at the same time. This is especially true when the size of the screen islimited as in the case of PDAs and smart mobile phones. In this case, the usercan hardly see the items on each window. Having the same analogy with datamining applications, we can identify the following examples:
5
• The higher the number of clusters presented simultaneously on the screen(higher c(v)), the less understandable the underlying data is (lower p(v)).
• The greater the number of nodes and branches presented on the screenfor a decision tree (higher c(v)) results in difficulty of using the tree dueto the difficulty of perception (lower p(v)).
• The greater the number of frequent items presented simultaneously using ahistogram (higher c(v), the less understandable the presented graph (lowerp(v)).
Theorem 3.3. At any point in time t, ACR based technique minimize(c(v))while maximize(i(v), p(v))
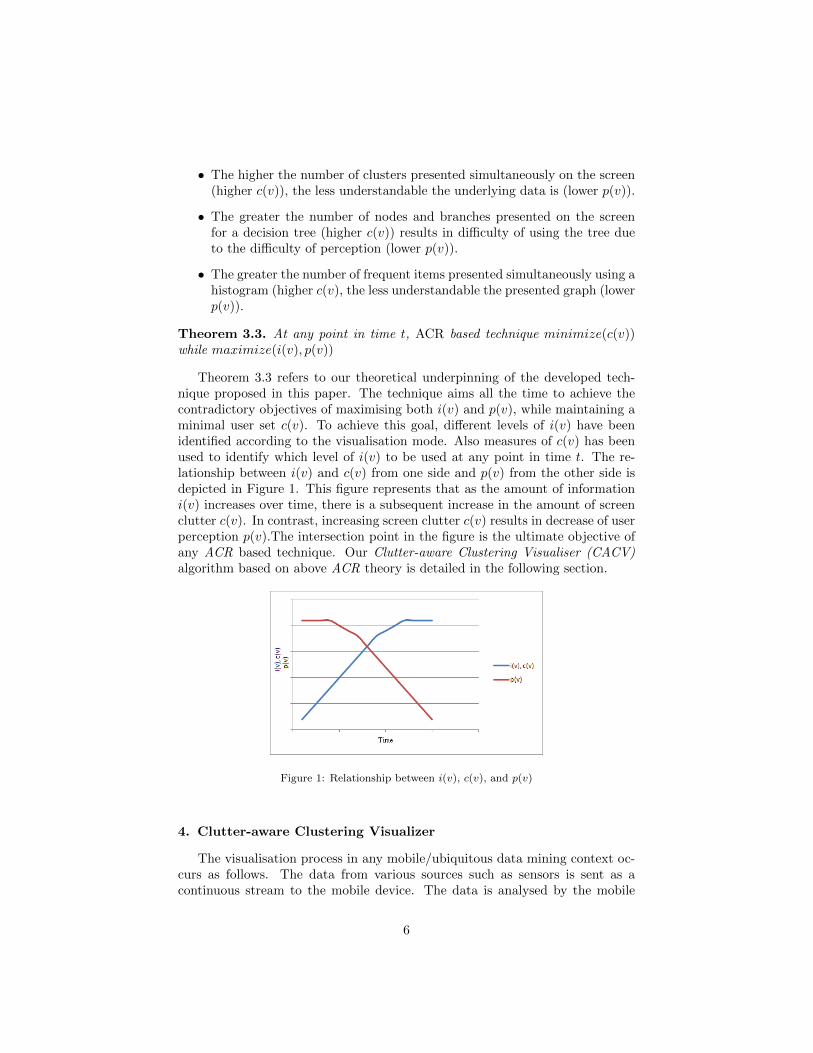
Theorem 3.3 refers to our theoretical underpinning of the developed tech-nique proposed in this paper. The technique aims all the time to achieve thecontradictory objectives of maximising both i(v) and p(v), while maintaining aminimal user set c(v). To achieve this goal, different levels of i(v) have beenidentified according to the visualisation mode. Also measures of c(v) has beenused to identify which level of i(v) to be used at any point in time t. The re-lationship between i(v) and c(v) from one side and p(v) from the other side isdepicted in Figure 1. This figure represents that as the amount of informationi(v) increases over time, there is a subsequent increase in the amount of screenclutter c(v). In contrast, increasing screen clutter c(v) results in decrease of userperception p(v).The intersection point in the figure is the ultimate objective ofany ACR based technique. Our Clutter-aware Clustering Visualiser (CACV)algorithm based on above ACR theory is detailed in the following section.
Figure 1: Relationship between i(v), c(v), and p(v)
4. Clutter-aware Clustering Visualizer
The visualisation process in any mobile/ubiquitous data mining context oc-curs as follows. The data from various sources such as sensors is sent as acontinuous stream to the mobile device. The data is analysed by the mobile
6
data mining algorithm on the phone. The results from the analysis process aresent to the visualisation component which processes this incoming knowledgeand presents the results on the mobile device’s screen. Clearly, the visualisationprocess is closely linked with the analysis process as it has to display the outputof the analysis process. Furthermore, there is a clear implication that the visual-isation strategy would also vary depending on the underlying analysis technique.Thus, while our proposed visualisation technique in principle is general enoughto support a range of mobile data analysis techniques, the algorithm presentedhere and its implementation are for a specific subclass of analysis techniques.In particular, we have focused on point-based clustering techniques. Typicalanalysis algorithms in this category include Light-weight Clustering (LWC) [5],RA-Cluster [20] and Very-Fast K-Means (VFKM) [4].
Point-based clustering techniques, in the context of mobile data mining, pro-cess incoming data streams and assign data items/records in real-time to existingclusters or create new clusters based on distance measures. The incoming dataitems are processed in a one-pass mechanism and are not persistently stored.The resource-aware techniques for point-based clustering that we have developednamely LWC, RA-Cluster and RA-VFKM [5, 16, 20] also perform adaptation ofthe clustering process according to available resource-levels, incoming data ratesand rate of generating new clusters. These clustering techniques in general areuseful for mobile data analysis applications such as analysing incoming calls tomobile field personnel during an emergency, analysing taxi requests with respectto the context of the driver such as current drop-off location, analysing heartrates to detect when the rates are outside the normal range etc. While manyclustering techniques only focus on clusters that grow, we have also extendedthis process to allow for shrinking of clusters which is relevant in applicationssuch as emergency calls, taxi requests to represent the current tasks that needto be processed. An updated version of LWC to support both growing andshrinking clusters has been developed.
We measure clutter (c(v)) as in terms of two diverse attributes. One per-tains to the percentage of the screen occupied by the clusters generated andshown on the screen. The second pertains to the percentage of clusters thatoverlap/intersect with one another on the screen. This approach to looking atclutter is consistent with how clutter is defined in the literature in terms of theamount of information presented on the screen. If this amount or some aspectsof the information (i(v)) that is presented has the ability to reduce the under-standing/comprehension of the information that is presented (p(v)), then thiscan be treated as clutter. In the context of clustering, if two or more clustersintersect/overlap then it becomes unclear and indistinguishable. Thus, our ap-proach to clutter-awareness is through allowing users to determine what level ofscreen occupancy and cluster overlap is tolerable for them given their contextand dynamically adapt the visualisation in real-time according to these prefer-ences. We also allow these levels to be changed at any point of time while theanalysis and visualisation is happening. Our clutter-aware clustering visualisa-tion algorithm starts by accepting four settings from the user. The first is theacceptable level of coverage on the screen (CT ). The second parameter is the al-
7
lowable percentage of overlapping between clusters (OT ). The third parameteris the duration between each two consecutive screen refresh events (RefSc). Itis worth mentioning that such parameters are essential due to differences amongapplications, users, varying screen sizes of mobile phones which in turn resultsin differences in what is an appropriate amount of information presented on thescreen. The last parameter is the maximum number of clusters to be presentedon the screen (NocThreshold).
The actual process starts with drawing the clusters on the screen havingeach cluster size reflecting the number of points/data items in this cluster. Thisprocess is followed by the periodic assessment of the percentage of coverage(ScCov) and cluster overlapping (OvClu) against the preset thresholds (CT )and (OT ) for coverage and overlap percentages respectively. ScCov and OvCluare the two measurements of c(v) in the ACR theory. This is done over fixedintervals of refreshing the screen (RefSc). If one of these measurements exceedsthe user set parameter, the visualisation scheme changes dynamically to thefirst level of adaptation, scaling. Scaling is done such that all the clusters onthe screen have their sizes reduced by a scaling factor (ScaleFactor) under thecondition that the smallest cluster size is not less than a cluster with only onepoint in the normal mode. If after the first level of clutter-aware adaptation,the screen is still cluttered with the current occupancy being greater than thespecified threshold, the percentage of overlapping clusters exceeds the acceptableoverlap threshold, or the smallest cluster is underscaled (min(w′
i) < 1), ourvisualiser switches to the next level of adaptation, shading. w′
i is the number ofpoints in cluster ci multiplied by the scaling factor (ScaleFactor). The shadingis done by setting all the clusters to the same default size. Each cluster is drawnwith different intensity of colour/shade. The darkest cluster represents thestronger ones with highest number of points, while the white clusters representsthe ones with lowest number of points. If one of the two conditions of clutteringor cluster overlapping still holds, or the number of clusters (NumOfClusters)on the screen is greater than a preset threshold(NocThreshold), the visualiserswitches to its highest level of adaptation, cluster selection. This is done byselecting only active clusters to be represented on the screen. We define activeclusters as the ones that have attracted new data points in the most recenttime intervals. The clutter-aware adaptive cluster visualisation is shown belowin Algorithm 1. The notation used in the algorithm is defined in Table 1.The SET (V IS) in the algorithm defines the level of adaptation. The level ofadaptation affects p(v) in the ACR theory.
In the context of mining data streams on mobile devices, energy consump-tion and management is a critical aspect [21, 20]. According to [21], the totalenergy consumption of data mining applications on mobile devices consists ofenergy consumption during data transmission and energy consumption of localcomputation. In other words, they mathematically defined the total energy con-sumption E = Ec+Et whereas Ec is energy consumption by local computationsand Et is energy consumption due to data transmission. It has been found thatthe energy consumption of data transmission is approximately ten to hundredtimes the energy consumption due to local computations. Based on this study,
8
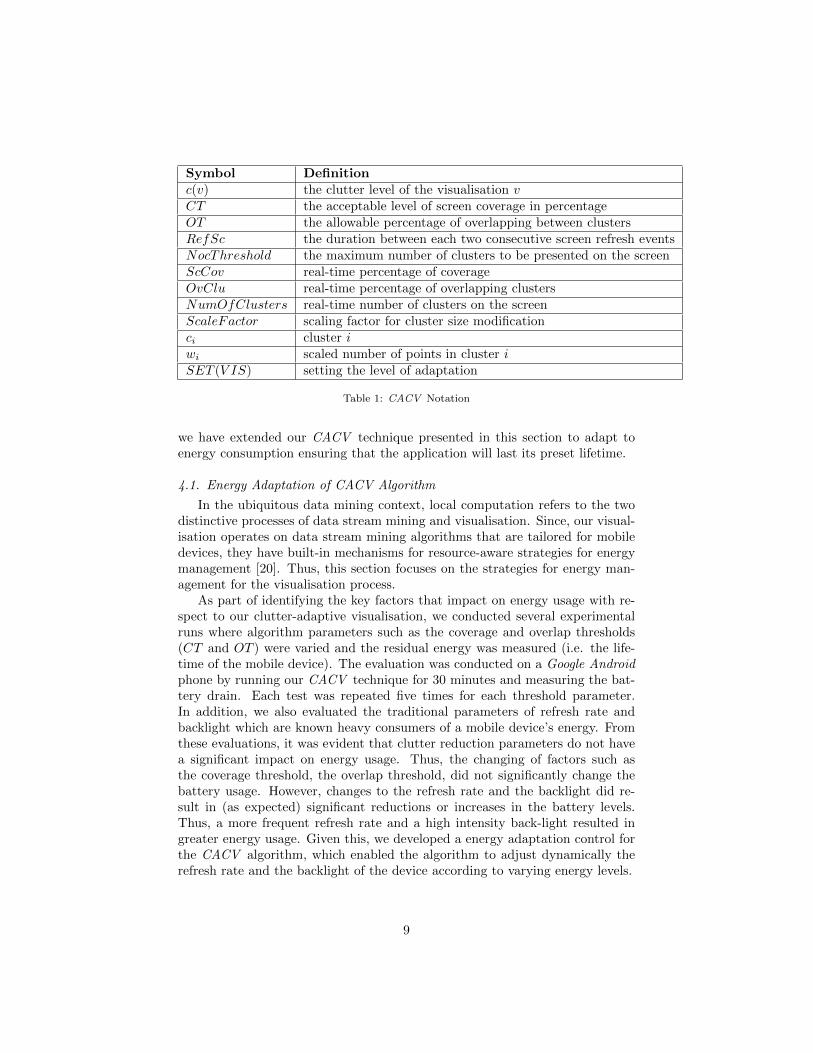
Symbol Definitionc(v) the clutter level of the visualisation vCT the acceptable level of screen coverage in percentageOT the allowable percentage of overlapping between clustersRefSc the duration between each two consecutive screen refresh eventsNocThreshold the maximum number of clusters to be presented on the screenScCov real-time percentage of coverageOvClu real-time percentage of overlapping clustersNumOfClusters real-time number of clusters on the screenScaleFactor scaling factor for cluster size modificationci cluster iwi scaled number of points in cluster iSET (V IS) setting the level of adaptation
Table 1: CACV Notation
we have extended our CACV technique presented in this section to adapt toenergy consumption ensuring that the application will last its preset lifetime.
4.1. Energy Adaptation of CACV Algorithm
In the ubiquitous data mining context, local computation refers to the twodistinctive processes of data stream mining and visualisation. Since, our visual-isation operates on data stream mining algorithms that are tailored for mobiledevices, they have built-in mechanisms for resource-aware strategies for energymanagement [20]. Thus, this section focuses on the strategies for energy man-agement for the visualisation process.
As part of identifying the key factors that impact on energy usage with re-spect to our clutter-adaptive visualisation, we conducted several experimentalruns where algorithm parameters such as the coverage and overlap thresholds(CT and OT ) were varied and the residual energy was measured (i.e. the life-time of the mobile device). The evaluation was conducted on a Google Androidphone by running our CACV technique for 30 minutes and measuring the bat-tery drain. Each test was repeated five times for each threshold parameter.In addition, we also evaluated the traditional parameters of refresh rate andbacklight which are known heavy consumers of a mobile device’s energy. Fromthese evaluations, it was evident that clutter reduction parameters do not havea significant impact on energy usage. Thus, the changing of factors such asthe coverage threshold, the overlap threshold, did not significantly change thebattery usage. However, changes to the refresh rate and the backlight did re-sult in (as expected) significant reductions or increases in the battery levels.Thus, a more frequent refresh rate and a high intensity back-light resulted ingreater energy usage. Given this, we developed a energy adaptation control forthe CACV algorithm, which enabled the algorithm to adjust dynamically therefresh rate and the backlight of the device according to varying energy levels.
9
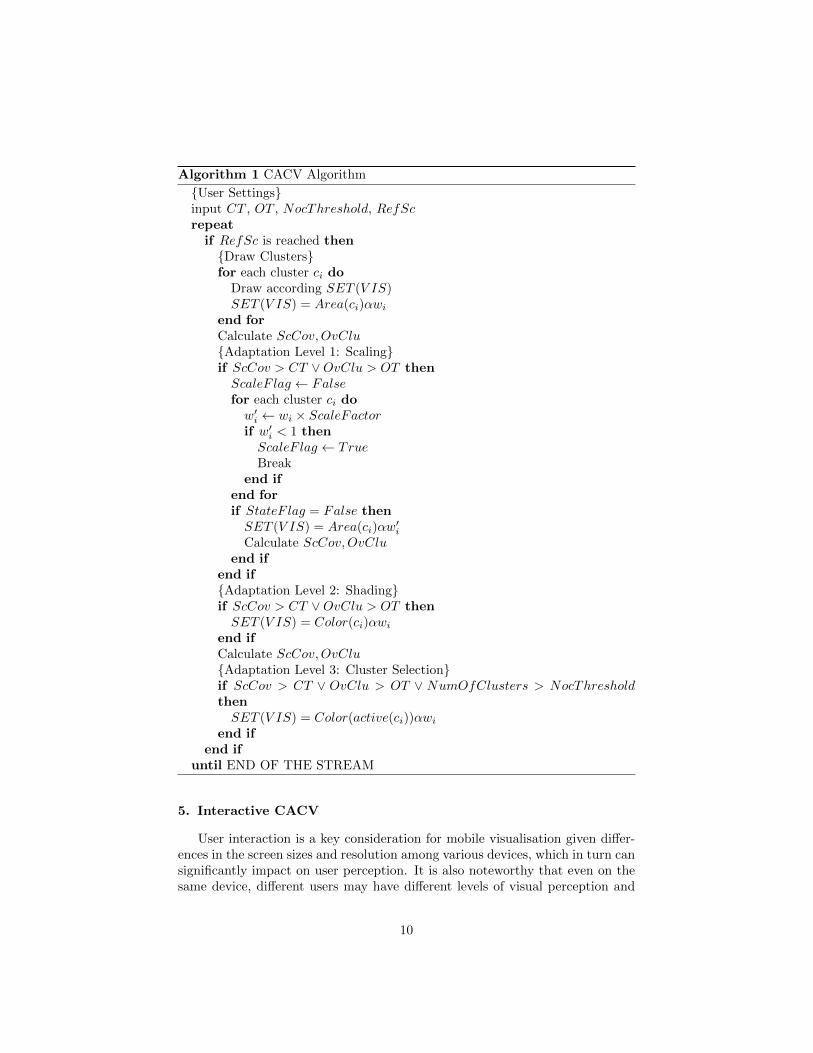
Algorithm 1 CACV Algorithm
{User Settings}input CT , OT , NocThreshold, RefScrepeat
if RefSc is reached then{Draw Clusters}for each cluster ci do
Draw according SET (V IS)SET (V IS) = Area(ci)αwi
end forCalculate ScCov,OvClu{Adaptation Level 1: Scaling}if ScCov > CT ∨OvClu > OT thenScaleF lag ← Falsefor each cluster ci dow′
i ← wi × ScaleFactorif w′
i < 1 thenScaleF lag ← TrueBreak
end ifend forif StateF lag = False thenSET (V IS) = Area(ci)αw
′i
Calculate ScCov,OvCluend if
end if{Adaptation Level 2: Shading}if ScCov > CT ∨OvClu > OT thenSET (V IS) = Color(ci)αwi
end ifCalculate ScCov,OvClu{Adaptation Level 3: Cluster Selection}if ScCov > CT ∨ OvClu > OT ∨ NumOfClusters > NocThresholdthenSET (V IS) = Color(active(ci))αwi
end ifend if
until END OF THE STREAM
5. Interactive CACV
User interaction is a key consideration for mobile visualisation given differ-ences in the screen sizes and resolution among various devices, which in turn cansignificantly impact on user perception. It is also noteworthy that even on thesame device, different users may have different levels of visual perception and
10
clutter tolerance. From the Human Computer Interaction (HCI) perspective, ithas been shown that interactivity is a key feature for mobile visualisation sys-tems. That is because interactivity enables dynamic adaptation to the deviceresolution, screen space as well as the user’s level of data perceptions [23, 24].In fact, Bertin [22] mentioned that a graphic is ”no longer ’drawn’ once and forall”, but is ’constructed’, ’reconstructed’ (manipulated), and ’reconstructed’,until the relationships which lie within it have been perceived. Bertin alsoadded that a graphic is never an end in itself, and that it is a moment in theprocess of decision-making. This concept is especially correct when visualis-ing a rapidly changing analysis of a data stream. Additionally, Chittaro [24]also pointed out that visualisation applications that have been designed with-out considering the special requirements of the mobile environment might failin providing meaningful and understandable graphics and figures. Therefore,on the basis of mobile HCI considerations [23, 24, 25], we further propose incor-porating different features of interactivity to the CACV algorithm to enhancethe data visualisation.
The following are the enhancements made to the CACV to enable userinteraction. We refer to the enhanced version of CACV as iCACV.
• Dynamic setting of visualisation thresholds
According to Spence [26], mobile users must be in continuous control overthe data visualisation process to perceive and understand the visualiseddata. This is because different portable devices have different screen sizeand different resolution. Also, the users themselves have different level ofdata perception. Therefore, we propose enabling the user to control whatis displayed on screen. This means that users can dynamically personalisethe visualisation parameters of the analysis algorithm based on their pref-erences. There is a clear limitation in static and fixed setting of clutterthresholds. To address this, we have provided visual controls for the userto change various algorithm parameters such as coverage and overlappingthresholds at run-time. This way, the algorithm can be personalised toindividual user/device/analysis needs.
• Selective Focusing
In some cases, clusters can be totally overlapped. Some of them may layover the others. This arises issues of data visualisation accuracy and clar-ity since the main aim of data visualisation is to help users in makingdecision. For instance, the user would not know which cluster in whicharea, neither what is the weight of each cluster. Therefore, we proposeusing a key character of data visualisation systems, namely selective fo-cusing. Selective focusing refers to the process of enabling interaction(touching/tabbing) to provide detailed information about clusters. Wehave also implemented audio feedback to provide the user with detailedinformation without increasing the level of clutter on the screen.
• Controlling the Clusters Growth
11
Usually, clustering and visualising datasets result in a number of clustersthat vary in sizes. While few of those clusters grow at a rapid rate, fewothers stay at a very small size. It is also possible that many clustersgrow to medium certain size and stay at that size for a long time. Intypical mobile data mining applications, the large clusters are the sig-nificant ones to the user since they give an alert that something needsattention in that area. In order to more optimally control the screen clut-ter levels, we propose to dynamically decide when clusters should startgrowing by specifying a cluster growth threshold. This eliminates theclutter that is generated by the delta changes of clusters. We also indi-cate the weight of each cluster while they are less than the cluster growththreshold. We have also provided a demonstration that can be viewed at:http://www.youtube.com/watch?v=g7rlgqEIi7o
• Audio Feedback for Off-screen objects
There have been many studies about visualising the off-screen objects togive an accurate feedback to the user while maintaining the least levelof clutter on screen [27, 25]. Some of these studies propose placing asign [27], some others propose having halo arcs to inform the user of theoff-screen objects [8], and many other techniques. However, it can benoticed that such addition of information results in additional clutter onthe screen itself by adding more signs or pointers. In our iCACV, weuse text-to-speech technology in the smart phones to enable users to gainfeedback and insight of the off-screen clusters without increasing the clut-ter on screen. We argue that implementing the interactivity via audiofeedback is not only an effective manner of communicating with the user,but it can also be especially useful for mobile users where they cannotkeep looking at the screen at all times and may need a hands-free typeof visualisation. Likewise, when the battery level goes down, users can-not keep the screen on for a long period of time. In this context, audiofeedback plays in a critically important role to enable users to gain feed-back without a need to switch their mobile screen ON. Turning the audiofeedback on will provide audio alarms whenever clusters grow to a certainthreshold (Audio Threshold). We have made the demonstration availableat: http://www.youtube.com/watch?v=g7rlgqEIi7o.
• Screen Fencing of Clusters
While the CACV offers an innovative adaptation of clusters for clutter-reduction purposes, it does the adaptation for all the clusters, regardless ofwhether they are on or off-screen. This consumes additional computationaland energy resources. Therefore, we propose making the system aware ofthe dimensions of the on-screen (visible) coordinates. Thereby, beforeany adaptation or visualisation is done, the new incoming data item ischecked, if it lies within the on-screen map dimensions, the object will beclustered and visualised. Otherwise, the new object will only be clustered
12
in the backend without visualisation. This feature improves the overallcomputational elegance and effectiveness of iCACV.
6. Experimental Evaluation
We have implemented our CACV algorithm with its energy adaptive strate-gies on a Google Android mobile phone. The implementation is a UDM appli-cation which can support a range of scenarios discussed as follows. Considera scenario where a taxi driver picks up a person at the airport and is drivingtowards a particular suburb. By analysing the data from GPS sensors of othertaxis in that part of the city, the driver will be able to see where there is a cur-rent concentration of taxis and determine the location that he should be headingto. This can easily be mapped to identifying and analysing the location of mo-bile police personnel or emergency personnel managing calls when a storm hits acity. Another potential is for viewing growing stress levels from fire-fighting per-sonnel deployed to different areas. The mobile device receives a stream of GPSlocations which are analysed by the LWC data stream clustering algorithm. Weuse Google Maps to obtain the relevant underlay of the area maps for the GPSclusters. The cluster results are passed to the CACV visualiser which in turndisplays in a clutter-adaptive and energy-aware manner the emergent analysisresults. Our experimental analysis is aimed to demonstrate the visual effec-tiveness of the CACV approach in terms of being adaptive to screen clutter aswell as cluster overlap. We also demonstrate the prolonged application lifetimethat we achieve through energy adaptation. A live demonstration of our CACVcould be found at http://www.mobilemining.monash.edu/demo-location.html.
We have used both synthetic and real datasets to evaluate our techniques.Synthetic data has been used by randomly generating the latitude and thelongitude of a location on the map within the range of suburbs in MelbourneSouth East in Victoria state of Australia. Real-estate datasets have been used bycalling an API that retrieves information about properties available to let fromthe website ”domain.com.au”. The retrieval of property records is done one byone emulating the streaming data. We use the address of the property to locateits location on the map. Then we apply our CACV technique over the outcomedata streams clustering done by our LWC [5]. One important implementationfeature we have added to the system when testing it using the real-estate datasetis to visually allow the user to change the algorithm parameters in real-time.This is an important feature to maximise the perception (p(v)) according tothe user’s needs. Results from these experiments are detailed in the followingsubsections.
6.1. Visualisation of Clustering Results WITHOUT CACV
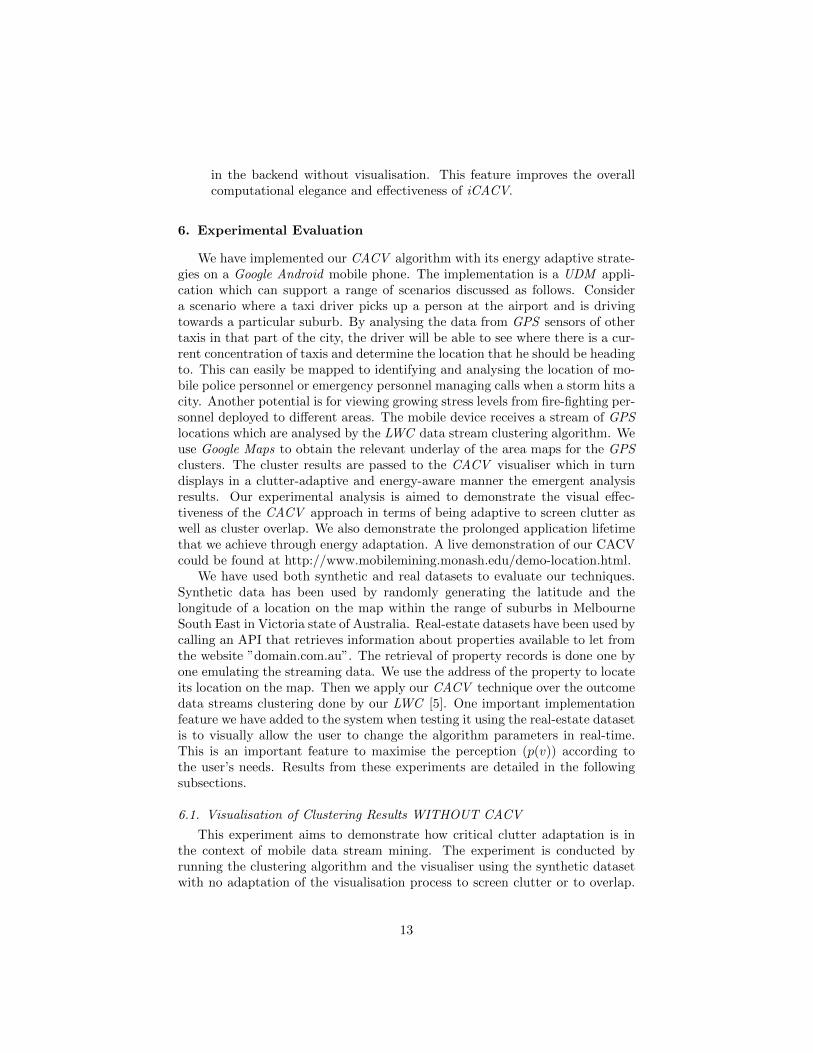
This experiment aims to demonstrate how critical clutter adaptation is inthe context of mobile data stream mining. The experiment is conducted byrunning the clustering algorithm and the visualiser using the synthetic datasetwith no adaptation of the visualisation process to screen clutter or to overlap.
13
As shown in Figure 2, it becomes very evident that in a short span of a mat-ter of minutes, the screen of a mobile device becomes completely overwhelmedand incomprehensible. This shows the importance of clutter awareness in theperception (p(v)) of the visualised results.
Figure 2: Cluster visualisation without Clutter/Overlap Reduction
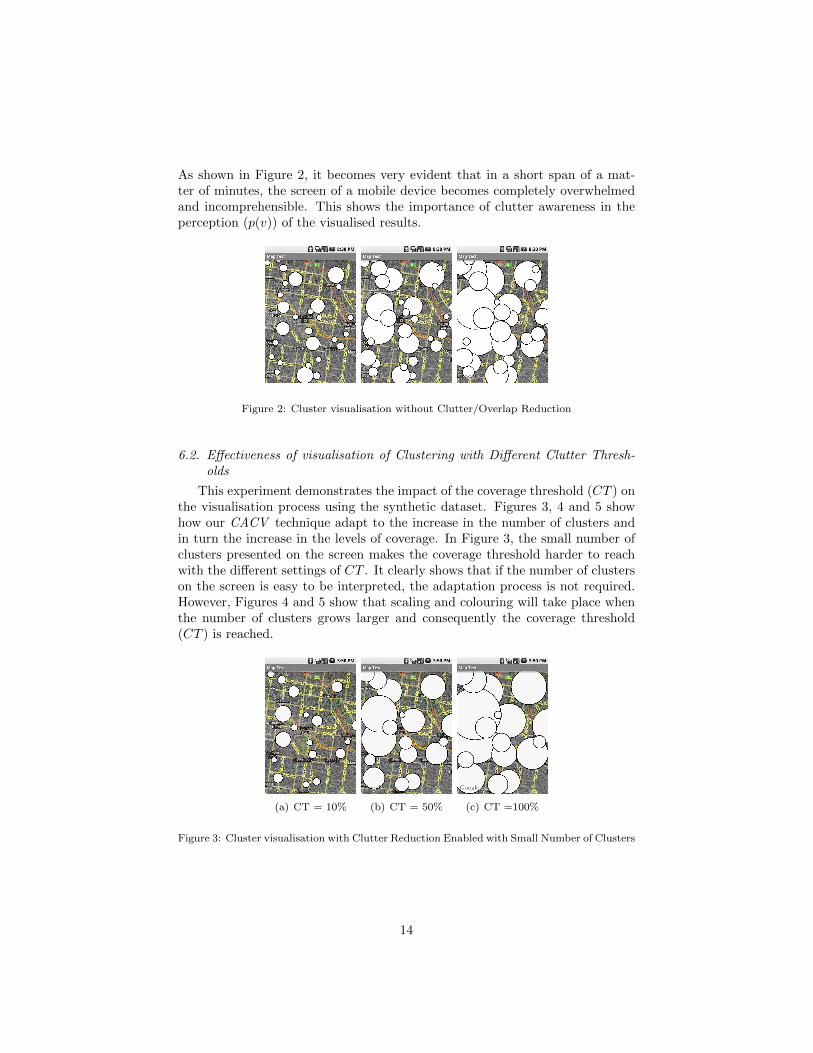
6.2. Effectiveness of visualisation of Clustering with Different Clutter Thresh-olds
This experiment demonstrates the impact of the coverage threshold (CT ) onthe visualisation process using the synthetic dataset. Figures 3, 4 and 5 showhow our CACV technique adapt to the increase in the number of clusters andin turn the increase in the levels of coverage. In Figure 3, the small number ofclusters presented on the screen makes the coverage threshold harder to reachwith the different settings of CT . It clearly shows that if the number of clusterson the screen is easy to be interpreted, the adaptation process is not required.However, Figures 4 and 5 show that scaling and colouring will take place whenthe number of clusters grows larger and consequently the coverage threshold(CT ) is reached.
(a) CT = 10% (b) CT = 50% (c) CT =100%
Figure 3: Cluster visualisation with Clutter Reduction Enabled with Small Number of Clusters
14
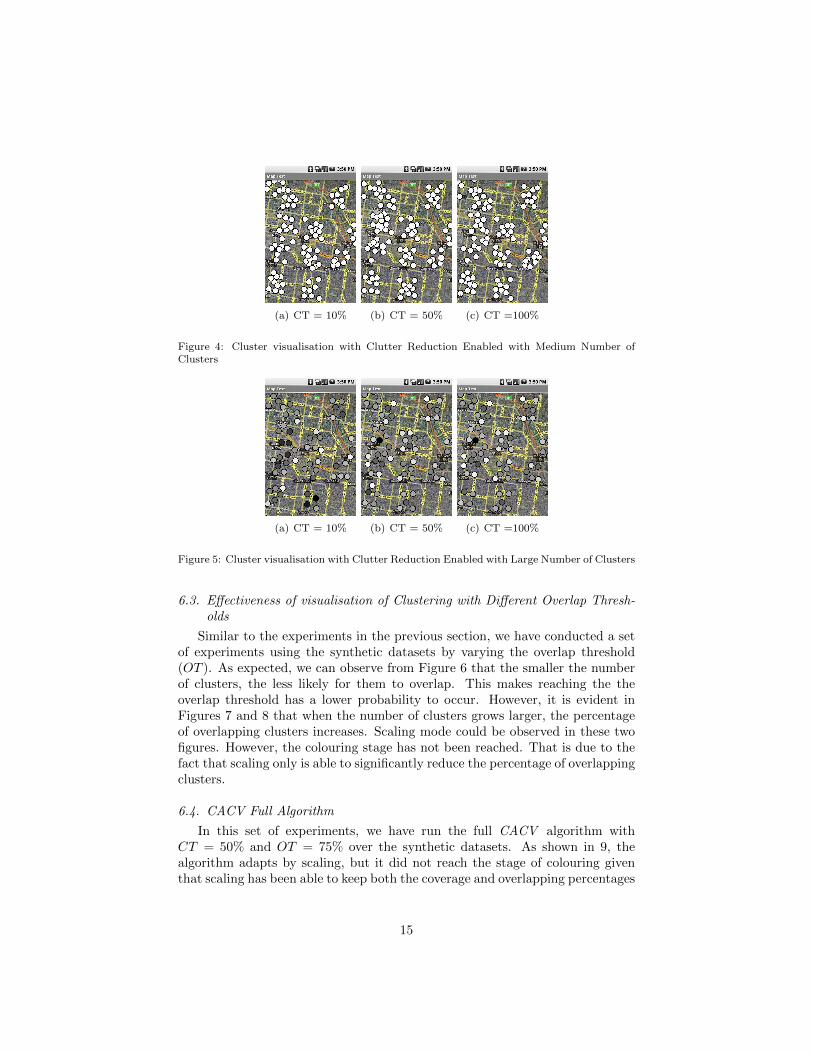
(a) CT = 10% (b) CT = 50% (c) CT =100%
Figure 4: Cluster visualisation with Clutter Reduction Enabled with Medium Number ofClusters
(a) CT = 10% (b) CT = 50% (c) CT =100%
Figure 5: Cluster visualisation with Clutter Reduction Enabled with Large Number of Clusters
6.3. Effectiveness of visualisation of Clustering with Different Overlap Thresh-olds
Similar to the experiments in the previous section, we have conducted a setof experiments using the synthetic datasets by varying the overlap threshold(OT ). As expected, we can observe from Figure 6 that the smaller the numberof clusters, the less likely for them to overlap. This makes reaching the theoverlap threshold has a lower probability to occur. However, it is evident inFigures 7 and 8 that when the number of clusters grows larger, the percentageof overlapping clusters increases. Scaling mode could be observed in these twofigures. However, the colouring stage has not been reached. That is due to thefact that scaling only is able to significantly reduce the percentage of overlappingclusters.
6.4. CACV Full Algorithm
In this set of experiments, we have run the full CACV algorithm withCT = 50% and OT = 75% over the synthetic datasets. As shown in 9, thealgorithm adapts by scaling, but it did not reach the stage of colouring giventhat scaling has been able to keep both the coverage and overlapping percentages
15
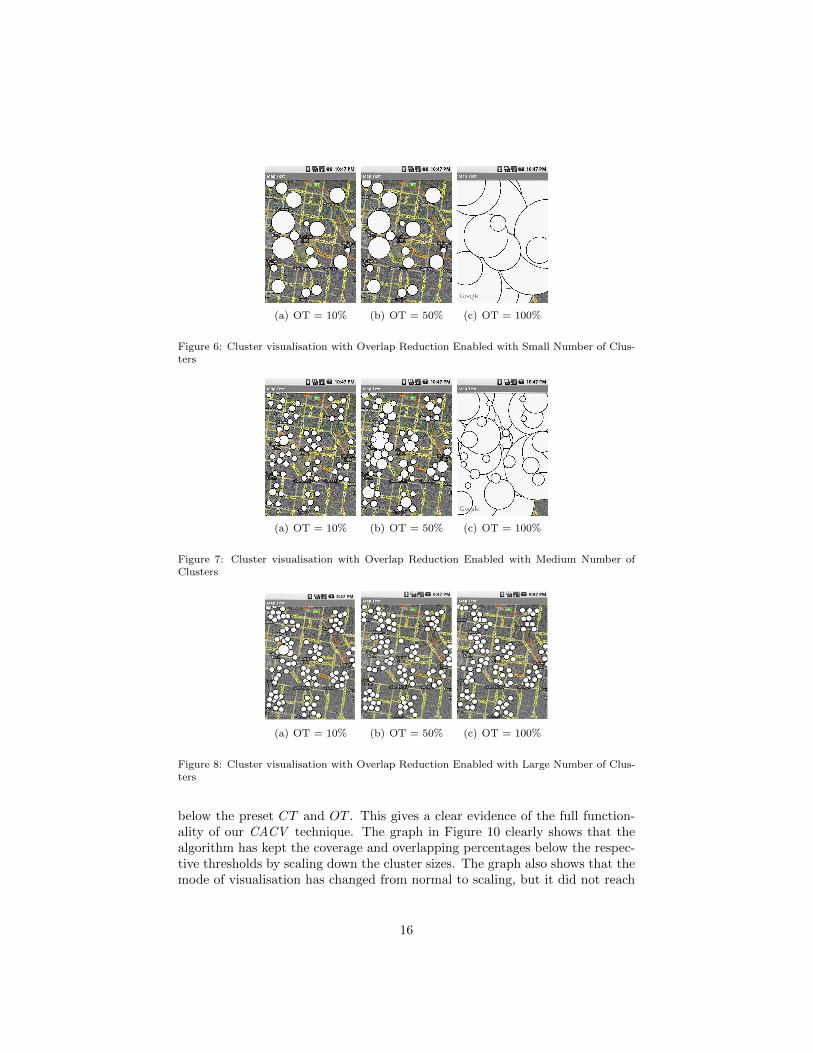
(a) OT = 10% (b) OT = 50% (c) OT = 100%
Figure 6: Cluster visualisation with Overlap Reduction Enabled with Small Number of Clus-ters
(a) OT = 10% (b) OT = 50% (c) OT = 100%
Figure 7: Cluster visualisation with Overlap Reduction Enabled with Medium Number ofClusters
(a) OT = 10% (b) OT = 50% (c) OT = 100%
Figure 8: Cluster visualisation with Overlap Reduction Enabled with Large Number of Clus-ters
below the preset CT and OT . This gives a clear evidence of the full function-ality of our CACV technique. The graph in Figure 10 clearly shows that thealgorithm has kept the coverage and overlapping percentages below the respec-tive thresholds by scaling down the cluster sizes. The graph also shows that themode of visualisation has changed from normal to scaling, but it did not reach
16
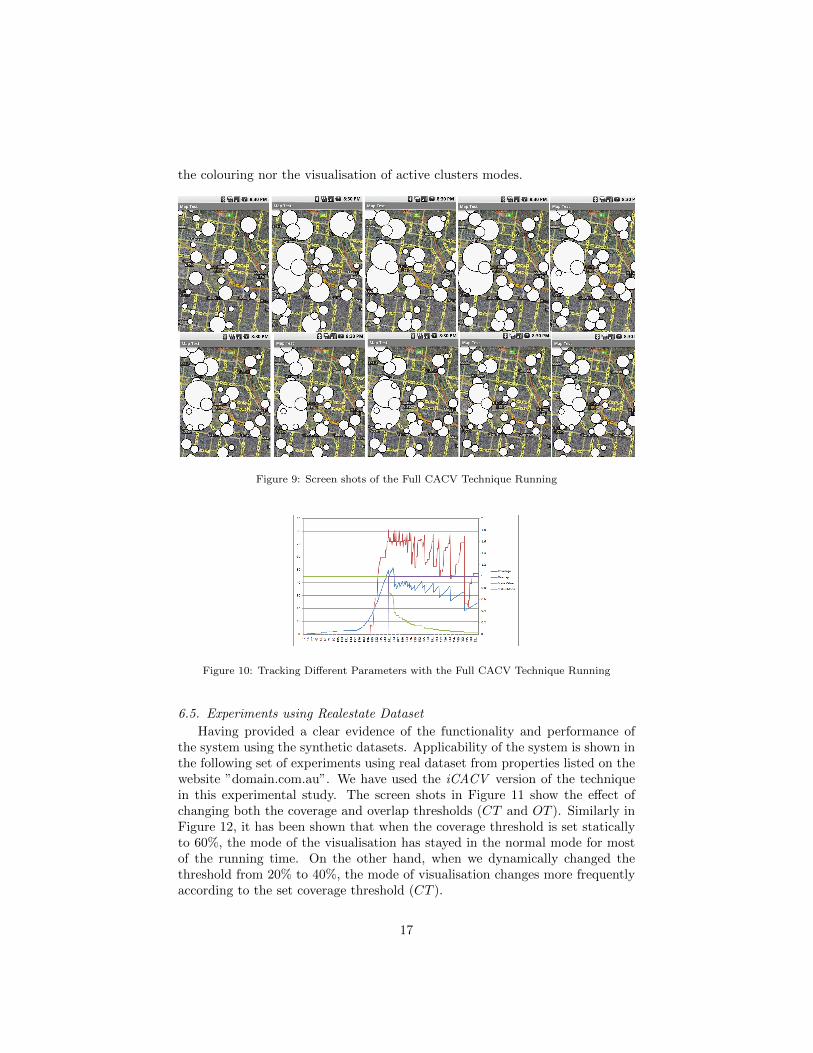
the colouring nor the visualisation of active clusters modes.
Figure 9: Screen shots of the Full CACV Technique Running
Figure 10: Tracking Different Parameters with the Full CACV Technique Running
6.5. Experiments using Realestate Dataset
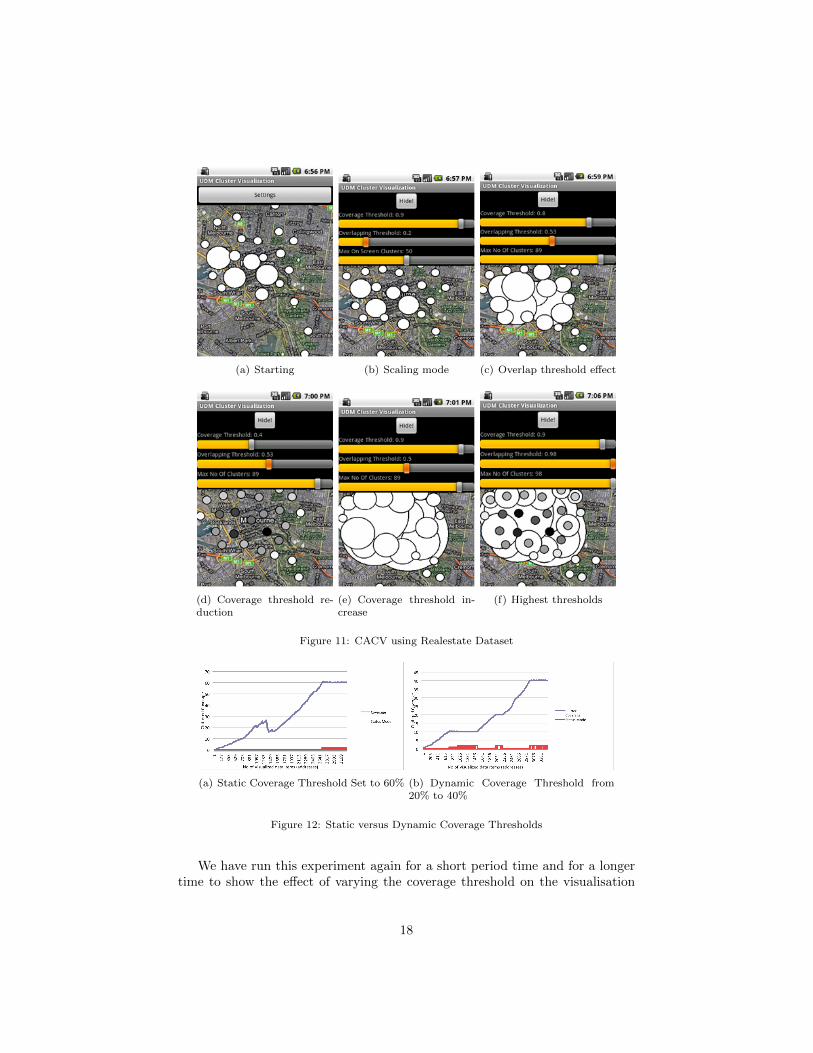
Having provided a clear evidence of the functionality and performance ofthe system using the synthetic datasets. Applicability of the system is shown inthe following set of experiments using real dataset from properties listed on thewebsite ”domain.com.au”. We have used the iCACV version of the techniquein this experimental study. The screen shots in Figure 11 show the effect ofchanging both the coverage and overlap thresholds (CT and OT ). Similarly inFigure 12, it has been shown that when the coverage threshold is set staticallyto 60%, the mode of the visualisation has stayed in the normal mode for mostof the running time. On the other hand, when we dynamically changed thethreshold from 20% to 40%, the mode of visualisation changes more frequentlyaccording to the set coverage threshold (CT ).
17
(a) Starting (b) Scaling mode (c) Overlap threshold effect
(d) Coverage threshold re-duction
(e) Coverage threshold in-crease
(f) Highest thresholds
Figure 11: CACV using Realestate Dataset
(a) Static Coverage Threshold Set to 60% (b) Dynamic Coverage Threshold from20% to 40%
Figure 12: Static versus Dynamic Coverage Thresholds
We have run this experiment again for a short period time and for a longertime to show the effect of varying the coverage threshold on the visualisation
18
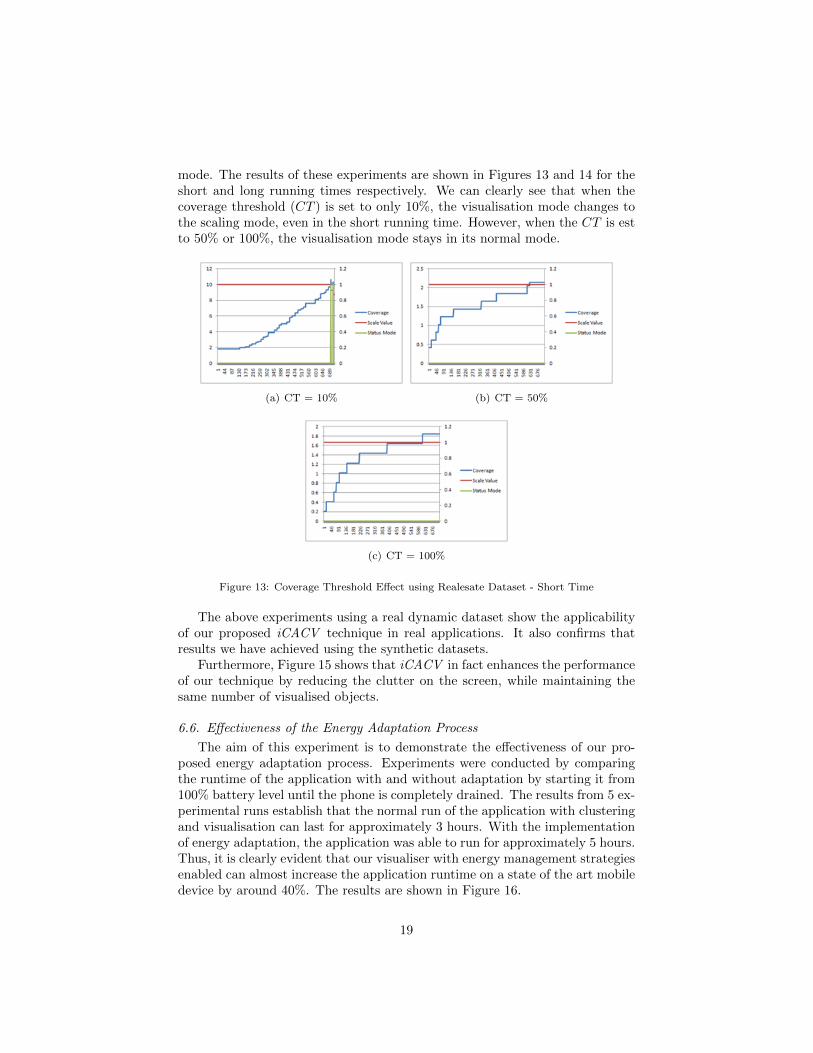
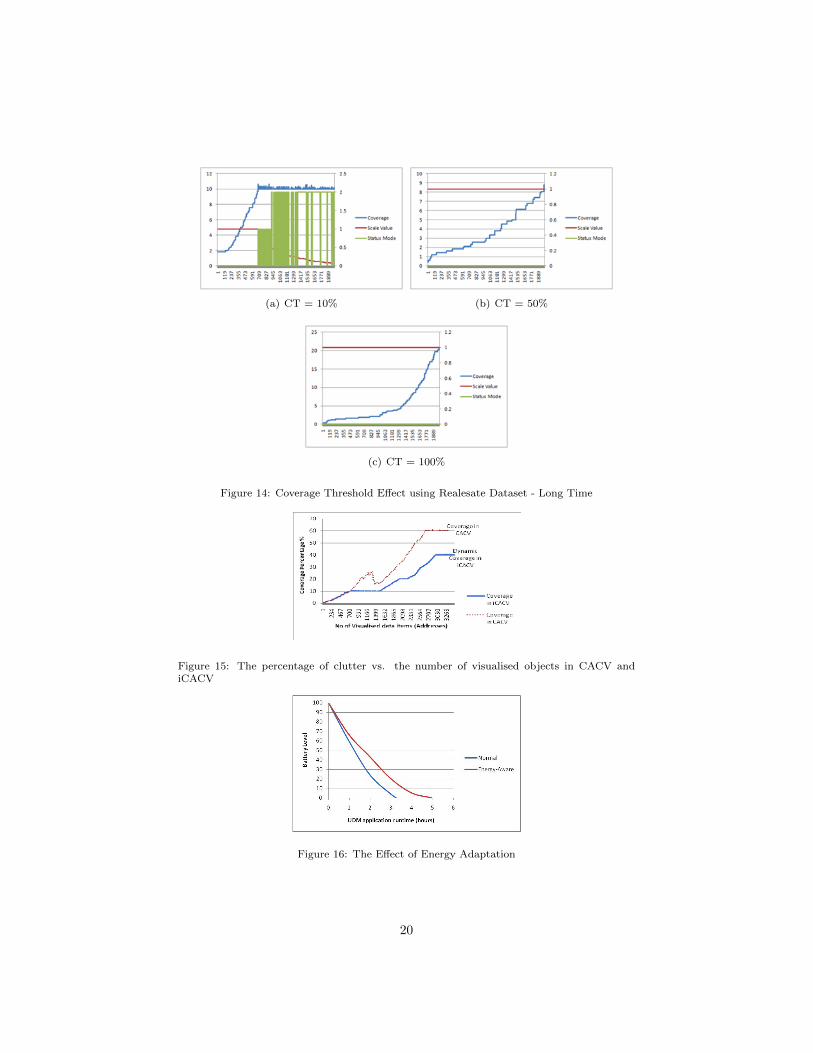
mode. The results of these experiments are shown in Figures 13 and 14 for theshort and long running times respectively. We can clearly see that when thecoverage threshold (CT ) is set to only 10%, the visualisation mode changes tothe scaling mode, even in the short running time. However, when the CT is estto 50% or 100%, the visualisation mode stays in its normal mode.
(a) CT = 10% (b) CT = 50%
(c) CT = 100%
Figure 13: Coverage Threshold Effect using Realesate Dataset - Short Time
The above experiments using a real dynamic dataset show the applicabilityof our proposed iCACV technique in real applications. It also confirms thatresults we have achieved using the synthetic datasets.
Furthermore, Figure 15 shows that iCACV in fact enhances the performanceof our technique by reducing the clutter on the screen, while maintaining thesame number of visualised objects.
6.6. Effectiveness of the Energy Adaptation Process
The aim of this experiment is to demonstrate the effectiveness of our pro-posed energy adaptation process. Experiments were conducted by comparingthe runtime of the application with and without adaptation by starting it from100% battery level until the phone is completely drained. The results from 5 ex-perimental runs establish that the normal run of the application with clusteringand visualisation can last for approximately 3 hours. With the implementationof energy adaptation, the application was able to run for approximately 5 hours.Thus, it is clearly evident that our visualiser with energy management strategiesenabled can almost increase the application runtime on a state of the art mobiledevice by around 40%. The results are shown in Figure 16.
19
(a) CT = 10% (b) CT = 50%
(c) CT = 100%
Figure 14: Coverage Threshold Effect using Realesate Dataset - Long Time
Figure 15: The percentage of clutter vs. the number of visualised objects in CACV andiCACV
Figure 16: The Effect of Energy Adaptation
20
7. Conclusion and Future Work
We have presented a novel approach for the area of visualisation for mobileand ubiquitous data mining. The proposed technique that we termed CACVis based on the theoretical framework of ACR based techniques detailed in thispaper. This technology has the potential to enable an entire new class of in-telligent analysis applications for supporting mobile users. The implicationsare significant for several mobile applications. This is the first attempt in theubiquitous/mobile data mining literature to present a systematic and genericapproach to visualisation. Furthermore, given the maturity of various mobiledata mining algorithms, the development of visualisation techniques is the nat-ural next step to enable large scale deployment of mobile real-time analysis.Our approach is scalable to growing and changing analysis/data rates, avoidsoverlap, maintains spatial information, and allows adjusting and adapting ofthreshold parameters.
Additionally, we have proposed our interactive improvised version - iCACV.We have shown through implementation and evaluation that incorporating in-teractivity to the mobile data stream mining visualisation systems can enhancethe data visualisation process and experience. This in return improves the user’schances in making better and easier decisions in real-time.
Future work includes developing visualisation techniques that are based onclutter-awareness and adaptation for other mobile data analysis techniques (i.e.beyond clustering) such as classification, change detection and frequent itemsanalysis.
References
[1] Alfredo Cuzzocrea, Domenico Sacc, Paolo Serafino: Semantics-Aware Ad-vanced OLAP Visualization of Multidimensional Data Cubes. IJDWM 3(4):1-30 (2007).
[2] Alfredo Cuzzocrea, Domenico Sacc, Paolo Serafino: A Hierarchy-DrivenCompression Technique for Advanced OLAP Visualization of Multidimen-sional Data Cubes. DaWaK 2006: 106-119.
[3] Alfredo Cuzzocrea, Filippo Furfaro, Domenico Sacc: Hand-OLAP: A Sys-tem for Delivering OLAP Services on Handheld Devices. ISADS 2003: 80-87.
[4] Domingos, P. and Hulten, G. 2001. A General Method for Scaling Up Ma-chine Learning Algorithms and Its Applications to Clustering. Proceedingsof the 18th Int. Conf. on Machine Learning.
[5] Gaber, M, M., Krishnaswamy, S., and Zaslavsky, A. 2005. On-board Miningof Data Streams in Sensor Networks, A Chapter in Advanced Methods ofKnowledge Discovery from Complex Data, (Eds.) S. Badhyopadhyay, U.Maulik, L. Holder and D. Cook, Springer.
21
[6] Gillick B., Krishnaswamy S., Gaber M. M. and Zaslavsky A. 2006. Visuali-sation of Fuzzy Classification of Data Elements in Ubiquitous Data StreamMining. IWUC 2006, 29-38.
[7] Galan, M., Liu, H. and Torkkola, K. 2005. Intelligent Instance Selectionof Data Streams for Smart Sensor Applications, Intelligent Computing:Theory and Applications III, Orlando, 5803 (March 28-29), 108 - 119.
[8] M. M.Gaber, P. S. Yu, Detection and Classification of Changes in EvolvingData Streams, International Journal of Information Technology & DecisionMaking, Vol. 5, No. 4, World Scientific Publishing Company, 2006.
[9] M. M. Gaber, A. Zaslavsky, S. Krishnaswamy, ”Mining Data Streams: AReview”, ACM SIGMOD Record, 34, 1 (June 2005).
[10] Kargupta, H., Bhargava, R., Liu, K., Powers, M., Blair, P., Bushra, S.,Dull, J., Sarkar, K., Klein, M., Vasa, M. and Handy, D. 2004. VEDAS: AMobile and Distributed Data Stream Mining System for Real-Time VehicleMonitoring. Proc. of the SIAM DM Conference.
[11] H. Kargupta, B. Park, S. Pittie, L. Liu, D. Kushraj, K. Sarkar, ”MobiMine:Monitoring the Stock Market from a PDA”, SIGKDD Explorations, Jan-uary, 2002, Vol. 3, No. 2.
[12] McConell, S. M. and Skillicorn, D. B. 2005. A Distributed Approach forPrediction in Sensor Networks. Workshop in Data Mining in Sensor Net-works in Conj. with SIAM SDM Conference, USA.
[13] J. Rodriguez, A. Goni, A. Illarramendi, Real-Time Classification of ECGson a PDA, IEEE T. on I T in Biomedicine, 9, 1 (2005), 23-34.
[14] Radivojac, P., Korad, U., Sivalingam, K. M. and Obradovic, Z. 2003. Learn-ing from class-imbalanced data in wireless sensor networks. IEEE Semian-nual Vehicular Technology Conference, VTC-Fall 2003, 5 (October 2004),3030-3034, Orlando, Florida, U.S.A.
[15] M. Stonebraker, U. Cetintemel, S. Zdonik, ”The 8 Requirements of Real-Time Stream Processing”, In SIGMOD Record, 2005.
[16] Shah R., Krishnaswamy S., and Gaber M. M. 2005. Resource-Aware VeryFast K-Means for Ubiquitous Data Stream Mining. Proceedings of 2nd Int.Wshop on KD in Data Streams, ECML/PKDD 2005.
[17] Sun, X, Z.,, Orlowska, M., and Li, X. 2006. Finding Frequent Itemsets inData Streams. Sixth SIAM Data Mining Conf. - 9th HPDM Wshop.
[18] Ellis, G. and Dix, Alan (2007), A Taxonomy of Clutter Reduction for In-formation Visualisation, IEEE Transactions on visualisation and ComputerGraphics, 13 (6), pp. 1216-1223, ISSN 1077-2626
22
[19] Gillick B., Gaber M. M., Krishnaswamy S., and Zaslavsky A., visualisationof Cluster Dynamics and Change Detection in Ubiquitous Data StreamMining, Proceedings the third International Workshop on Knowledge Dis-covery in Data Streams June 29, 2006, Pittsburgh PA, USA.
[20] Gaber M. M., and Yu P. S., A Holistic Approach for Resource-aware Adap-tive Data Stream Mining, Journal of New Generation Computing, ISSN0288-3635 (Print) 1882-7055 (Online), Volume 25, Number 1, November,2006, pp. 95-115, Ohmsha, Ltd., and Springer Verlag.
[21] R. Bhargava, H. Kargupta, and M. Powers. (2003). Energy Consumption inData Analysis for On-board and Distributed Applications. Proceedings ofthe ICML’03 workshop on Machine Learning Technologies for AutonomousSpace Applications.
[22] Bertin, J. Graphics and Graphic Information-Processing. New York, 1981.
[23] Burigat, S. and L. Chittaro. Visualizing the results of interactive queriesfor geographic data on mobile devices, ACM, 2005.
[24] Chittaro, L. ”Visualizing information on mobile devices.” Computer 39(3):40-45, 2006.
[25] Gustafson, S., P. Baudisch, et al. Wedge: clutter-free visualisation of off-screen locations, ACM, 2008.
[26] Spence, R. Information visualisation, Addison-Wesley Reading, MA, 2001.
[27] S. Burigat, et al., Visualizing locations of off-screen objects on mobile de-vices: a comparative evaluation of three approaches, Proceedings of the8th conference on Human-computer interaction with mobile devices andservices, ACM Vol. 159, 2006, p. 246.
[28] Dimitris K. Tasoulis, Gordon Ross, and Niall M. Adams, Visualising thecluster structure of data streams. In Proceedings of the 7th internationalconference on Intelligent data analysis (IDA’07), Michael R. Berthold, JohnShawe-Taylor, and Nada Lavra (Eds.). Springer-Verlag, Berlin, Heidelberg,pp. 81-92, 2007.
[29] Mohamed H. Ali, Badrish Chandramouli, Jonathan Fay, Curtis Wong,Steven M. Drucker, Balan Sethu Raman: Online Visualization of Geospa-tial Stream Data using the WorldWide Telescope, Proceedings of the VLDBEndowment, PVLDB 4(12), pp. 1379-1382, 2011.
[30] Ove Daae Lampe, Helwig Hauser: Interactive visualization of streamingdata with Kernel Density Estimation, Proceedings of the 2011 IEEE PacificVisualization Symposium, PacificVis, pp. 171-178, 2011.
23