eye light flashes on the mir space station
TRANSCRIPT

Acta Astronautica Vol. 50, No. 81, pp. 511–525, 2002? 2002 Elsevier Science Ltd. All rights reserved
Printed in Great Britainwww.elsevier.com/locate/actaastro PII: S0094-5765(01)00190-4 0094-5765/02/$ - see front matter
EYE LIGHT FLASHES ON THE MIR SPACE STATION
S. AVDEEVRussian Space Corporation “Energia” Korolev, Korolev, Moscow, Russia
V. BIDOLI, M. CASOLINO, E. DE GRANDIS, G. FURANO, A. MORSELLI,L. NARICI, M.P. DE PASCALE, P. PICOZZA, E. REALI and R. SPARVOLIDepartment of Physics, University of Rome “Tor Vergata”, INFN, Sez. Rome 2, Italy
M. BOEZIO and P. CARLSONRoyal Institute of Technology, Stockholm, Sweden
W. BONVICINI, A. VACCHI AND N. ZAMPADepartment of Physics, University of Trieste and INFN, Italy
G. CASTELLINIIROE of CNR, Florence, Italy
C. FUGLESANG†; ‡European Astronaut Centre, ESA, Cologne, Germany
A. GALPER, A. KHODAROVICH, YU. OZEROVX, A. POPOV and N. VAVILOVMoscow State Engineering Physics Institute, Moscow, Russia
G. MAZZENGA and M. RICCIL.N.F.-INFN, Frascati, Rome, Italy
W.G. SANNITADISM, University of Genova, Genova, Italy
Department of Psychiatry, SUNY, Stoony Brook, NY, USA
and
P. SPILLANTINIDepartment of Physics of Univ. and Sez. INFN, Florence, Italy
(Received 2 May 2001)
Abstract—The phenomenon of light @ashes (LF) in eyes for people in space has been investigatedonboard Mir. Data on particles hitting the eye have been collected with the SilEye detectors, andcorrelated with human observations. It is found that a nucleus in the radiation environment ofMir has roughly a 1% probability to cause an LF, whereas the proton probability is almost threeorders of magnitude less. As a function of LET, the LF probability increases above 10 keV=�m,reaching about 5% at around 50 keV=�m. ? 2002 Elsevier Science Ltd. All rights reserved
†Corresponding author. Mail Code OT, NASA Johnson Space Center, Houston, TX 77058, USA. Tel.: +1-281-244-7769;fax: +1-281-7822.
E-mail address: [email protected] (C. Fuglesang).‡Also visiting Royal Institute of Technology.X Deceased.
511

512 S. Avdeev et al.
1. INTRODUCTION
Unexpected visual sensations during space @ightswere Mrst reported after the Apollo-11 @ight tothe moon in 1969 [1]. These phenomena, whichbecame known as light @ashes (LF), were subse-quently also reported by astronauts on Apollo-12and Apollo-13. They appeared as faint spots or@ashes of light after some dark adaptation andoccurred spontaneously and randomly. It is inter-esting to note that already in 1952, it had beenhypothesized that people outside the shieldingprovided by Earth’s magnetic Meld were likelyto see @ashes of light from cosmic particles [2].During the remaining Apollo @ights, a total of 12astronauts carried out about 20 h of LF observa-tions. It was found that on average, after about15–20 min of dark adaptation, about one LF per3 min was seen [1]. Three basic types of @asheswere reported at the time: “spots” or “star-like”@ashes, “streaks” and “clouds”.At the same time, several studies were performed
with accelerator beams, exposing the human eyeand brain to well-deMned particle @uxes. It wasfound that neutrons, with energy of more than about5 MeV, could cause LF sensations [3–6], but abeam of �+ mesons with momentum 1:5 GeV=cdid not create any eSect [5]. Studies using muons(cosmic [7,8] and a 6 GeV=c beam [9]) also re-ported LF eSects. During dedicated observations inhigh-altitude (9–16 km) aircrafts LFs were seen,but they were considered to be partly of a diSer-ent nature than those in space, possibly due to adiSerent particle composition in the radiation envi-ronment [10].Several possible explanations were put for-
ward to explain this phenomenon. They includedCherenkov light in the vitreous [11], a direct exci-tation of the retina by ionization [11,1], an indirecteSect from protons knocked out by neutrons [3]or from alpha-particles from reactions with C, Oor N atoms [6]. It was also suggested that scin-tillation in the eye lens could cause the observedLFs [12]. Experiments with helium and nitrogenbeams, however, seemed to pinpoint the eSect tothe retina as well as indicating that the dominatingeSect is due to local energy deposition, possiblyin the outer segments of rods and cones since darkadaptation is necessary to observe LFs [13,14].It is also worth noting that these experiments didnot note any light sensations when beams passedthrough the optical nerve or the visual cortex ofthe brain.Still many questions remained to be answered.
Among them is the question as to which particlesin space cause the LFs in astronauts and their fre-
quency in Earth orbits. Furthermore, it was notcompletely ruled out that the Cherenkov eSect, orsome other eSect could play a role during space@ights. Therefore, experiments were performedon Skylab in 1974 [15] and on Apollo during theApollo–Soyuz project in 1975 [16]. Correlationwith particle @uxes was done, suggesting a rela-tion with ions having linear energy transfer (LET)greater than 5 keV=�m in tissue [16]. However, noconclusive results were obtained and some resultseven seem contradictory. For instance, on Skylaba big increase in the LF rate was seen in the SouthAtlantic Anomaly (SAA), whereas in Apollo nosuch increase was observed. A recent discussionon the biological aspects of LFs can be found inRef. [10].The aim of the SilEye (from Silicon Eye) project,
presented here, is to conduct a systematic study ofthe LF phenomenon over several space missionsand subjects (astronauts). Two active particle de-tectors have been built, based on silicon technol-ogy, and sent to the Russian Mir space station.A real-time particle-tracking detector was placedclose to the subject’s eye and detector data as wellas the subject’s reaction to LFs were recorded oncomputer disks. Between 1995 and 1999, in total,10 astronauts participated in the SilEye project, buttwo of them reported not seeing light @ashes at alland two others only saw two @ashes each duringseveral sessions. During the Apollo @ights, therewas also one subject who did not notice any LFs,although briefed about it in advance [1]. The Sil-Eye computer disks with data were brought backto Earth for analysis. In this way, particles passingthrough the eye could be identiMed and correlatedin time with LFs. It should be mentioned that dur-ing Apollo-16 and Apollo-17, an emulsion experi-ment (ALFMED) made a similar attempt and twoevents were found coinciding with LFs [1].The SilEye project is a part of the Russian— Ital-
ian mission (RIM) program [17] which conductsa general study of cosmic rays using space-borneapparatuses equipped with silicon particle-trackingdetectors. The other projects are the experimentsNina [18] and Nina2 [19] on the “Resurs01” No. 4andMITA0 satellites, respectively, and the plannedPamela detector [20] for a future satellite. The Sil-Eye project has built and sent two apparatuses,SilEye-1 and SilEye-2 to Mir.This paper presents results from the LF observa-
tions on Mir with the SilEye apparatuses between1995 and 1999. It is the most extensive study ofthe LF phenomenon in space ever. In particular,we wanted to investigate the hypothesis that heavyions are the dominant source for LFs. For the Mrst
Eye Light Flashes 513
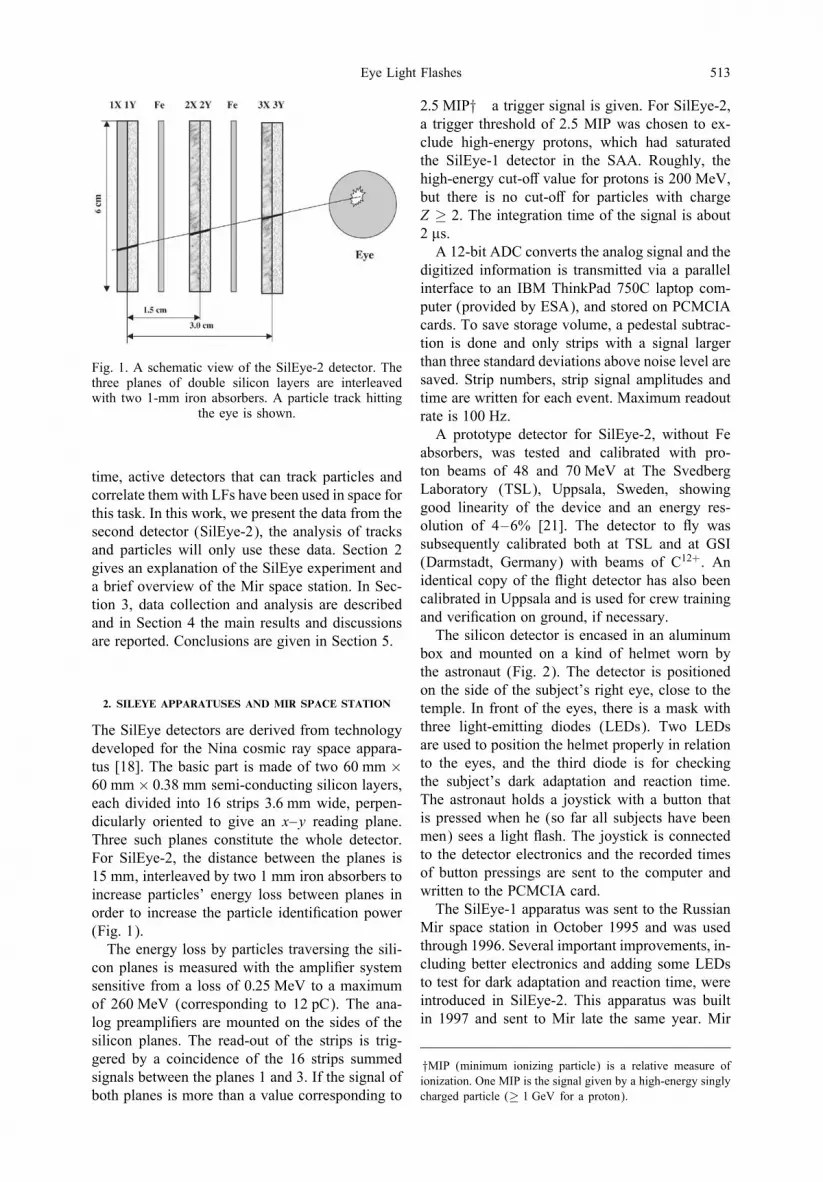
Fig. 1. A schematic view of the SilEye-2 detector. Thethree planes of double silicon layers are interleavedwith two 1-mm iron absorbers. A particle track hitting
the eye is shown.
time, active detectors that can track particles andcorrelate them with LFs have been used in space forthis task. In this work, we present the data from thesecond detector (SilEye-2), the analysis of tracksand particles will only use these data. Section 2gives an explanation of the SilEye experiment anda brief overview of the Mir space station. In Sec-tion 3, data collection and analysis are describedand in Section 4 the main results and discussionsare reported. Conclusions are given in Section 5.
2. SILEYE APPARATUSES AND MIR SPACE STATION
The SilEye detectors are derived from technologydeveloped for the Nina cosmic ray space appara-tus [18]. The basic part is made of two 60 mm ×60 mm× 0:38 mm semi-conducting silicon layers,each divided into 16 strips 3:6 mm wide, perpen-dicularly oriented to give an x–y reading plane.Three such planes constitute the whole detector.For SilEye-2, the distance between the planes is15 mm, interleaved by two 1 mm iron absorbers toincrease particles’ energy loss between planes inorder to increase the particle identiMcation power(Fig. 1).The energy loss by particles traversing the sili-
con planes is measured with the ampliMer systemsensitive from a loss of 0:25 MeV to a maximumof 260 MeV (corresponding to 12 pC). The ana-log preampliMers are mounted on the sides of thesilicon planes. The read-out of the strips is trig-gered by a coincidence of the 16 strips summedsignals between the planes 1 and 3. If the signal ofboth planes is more than a value corresponding to
2:5 MIP† a trigger signal is given. For SilEye-2,a trigger threshold of 2.5 MIP was chosen to ex-clude high-energy protons, which had saturatedthe SilEye-1 detector in the SAA. Roughly, thehigh-energy cut-oS value for protons is 200 MeV,but there is no cut-oS for particles with chargeZ ≥ 2. The integration time of the signal is about2 �s.A 12-bit ADC converts the analog signal and the
digitized information is transmitted via a parallelinterface to an IBM ThinkPad 750C laptop com-puter (provided by ESA), and stored on PCMCIAcards. To save storage volume, a pedestal subtrac-tion is done and only strips with a signal largerthan three standard deviations above noise level aresaved. Strip numbers, strip signal amplitudes andtime are written for each event. Maximum readoutrate is 100 Hz.A prototype detector for SilEye-2, without Fe
absorbers, was tested and calibrated with pro-ton beams of 48 and 70 MeV at The SvedbergLaboratory (TSL), Uppsala, Sweden, showinggood linearity of the device and an energy res-olution of 4–6% [21]. The detector to @y wassubsequently calibrated both at TSL and at GSI(Darmstadt, Germany) with beams of C12+. Anidentical copy of the @ight detector has also beencalibrated in Uppsala and is used for crew trainingand veriMcation on ground, if necessary.The silicon detector is encased in an aluminum
box and mounted on a kind of helmet worn bythe astronaut (Fig. 2). The detector is positionedon the side of the subject’s right eye, close to thetemple. In front of the eyes, there is a mask withthree light-emitting diodes (LEDs). Two LEDsare used to position the helmet properly in relationto the eyes, and the third diode is for checkingthe subject’s dark adaptation and reaction time.The astronaut holds a joystick with a button thatis pressed when he (so far all subjects have beenmen) sees a light @ash. The joystick is connectedto the detector electronics and the recorded timesof button pressings are sent to the computer andwritten to the PCMCIA card.The SilEye-1 apparatus was sent to the Russian
Mir space station in October 1995 and was usedthrough 1996. Several important improvements, in-cluding better electronics and adding some LEDsto test for dark adaptation and reaction time, wereintroduced in SilEye-2. This apparatus was builtin 1997 and sent to Mir late the same year. Mir
†MIP (minimum ionizing particle) is a relative measure ofionization. One MIP is the signal given by a high-energy singlycharged particle (≥ 1 GeV for a proton).

514 S. Avdeev et al.
Fig. 2. An astronaut on Mir with the SilEye-2 detector mounted on the side of his head and the mask withLEDs in front of his eyes.
(“World” or “Peace” in Russian) itself has beenin space since February 1986, when the core mod-ule was launched. Over time, Mve more moduleshave been added, the last being Priroda (“Nature”in Russian) in 1996 (Fig. 3). The modules are moreor less cylindrically formed, with diameters of 3–4 m and lengths of 13 m and a mass of 20 ton(except the Kvant module, which is about half aslong and heavy). In addition, normally one Soyuzcrew vehicle and a Progress transport vehicle aredocked to the station. They are each about 7 m long,2–3 m wide and have a mass of 7 tons. In 1995=96,the LF observation sessions were done in the crewcabins of the core module, while the sessions withSilEye-2 in 1998=99 took place in the modulesKristall and Priroda. There is a considerable amountof passive material of the spacecraft surroundingthe subject, in which primary cosmic particles caninteract and produce showers of secondaries. Theamount of material varies from place to place andaccording to the trajectory of the particles.Mir is orbiting at altitudes around 350–400 km
with an inclination of 51:6 deg. From November1995 to January 1996, the LFs were detected ataltitudes between 400 and 415 km. During the Mrst
observations in August 1998, the station altitudewas around 400 km but slowly decreased to 355–360 km for the last sessions in June 1999.
3. DATA COLLECTION AND ANALYSIS
The data used for this paper were collected dur-ing two periods. The Mrst was from 24=11=95 to19=1=96 involving the three astronauts (subjects)of Mir expedition-20 and the second period wasfrom 18=8=98 to 29=6=99 during expedition-26and expedition-27. Four astronauts participatedin the second period, one of them also @ew onexpedition-20. In the 1995=96 period, a total of 87LFs was noted during nine sessions, with a totalobservation time of 492 min. In the second period1998=99, we have 17 sessions with simultaneousSilEye-2 detector and LF observation data. Duringabout 800 min of observation 116 LFs were seen.An additional 30 LFs were noted during three ob-servation sessions amounting to 250 min withoutsilicon detector. Overall, the average time betweenLFs was about 7 min. For particle and radiationstudies, the SilEye-2 apparatus has also taken largeamounts of data in an autonomous mode, close to

Eye Light Flashes 515
Fig. 3. Mir space station.
1000 h of registration. Analysis of these data isin progress and will be published later. However,some preliminary results can be found in Ref. [22].Each observation session begins with 15 min of
dark adaptation, checked in SilEye-2 with LEDpulses. The LED @ashed every minute, startingwith a very short pulse of 8 �s. If there is no reac-tion from the subject, i.e. the joystick button is notpressed, then after 2 s there is a new pulse, twice aslong. The light pulse is doubled every 2 s until thebutton is pressed by the subject noting the light. Thereaction time and Mnal pulse length are recorded bythe computer. It was found that already after 5 minthe subject’s” sensitivity did not increase signif-icantly more, typically staying around 2 or 4 mspulses, but with some @uctuations as well as varia-tions between subjects. The same was found duringground data collection, but with less @uctuationsafter the high sensitivity limit was reached.At the start and end of each data collection ses-
sion, the detector performs a self-calibration. Noiselevel, pedestal position and detector linearity arechecked and calibration coeTcients are calculated.No drift over time was noted and, indeed, the de-tector noise turned out to be lower on Mir than onthe ground.
Table 1. Data summary
Event type Number Average frequency (Hz)
Triggers 241,742 4:95± 0:01Tracks 116,366 2:38± 0:01Protons 115,508 2:36± 0:01Nuclei 858 0:018± 0:001Showers 4434 0:908± 0:014
Note. The frequency is a total average and shows a consider-able variation with location.
After each observation session, the subject writescomments on the PCMCIA card. The comments aretypically on the nature of @ashes seen or if some-thing particular happened. Thus for each observa-tion session, we obtain three Mles: detector data onparticle tracks, LF-times and astronaut comments.The detector automatically starts to record
particle data at the end of the 15 min dark adap-tation. In total, during 17 sessions the detectorregistered 116,366 clean events, which wererecorded in 48; 850 s. This corresponds to an av-erage trigger rate of 4:9 Hz. About half of theevents could be identiMed as tracks, and we wereable to distinguish between protons and nuclei, ora “shower” (see below). Table 1 summarizes thedata.
516 S. Avdeev et al.
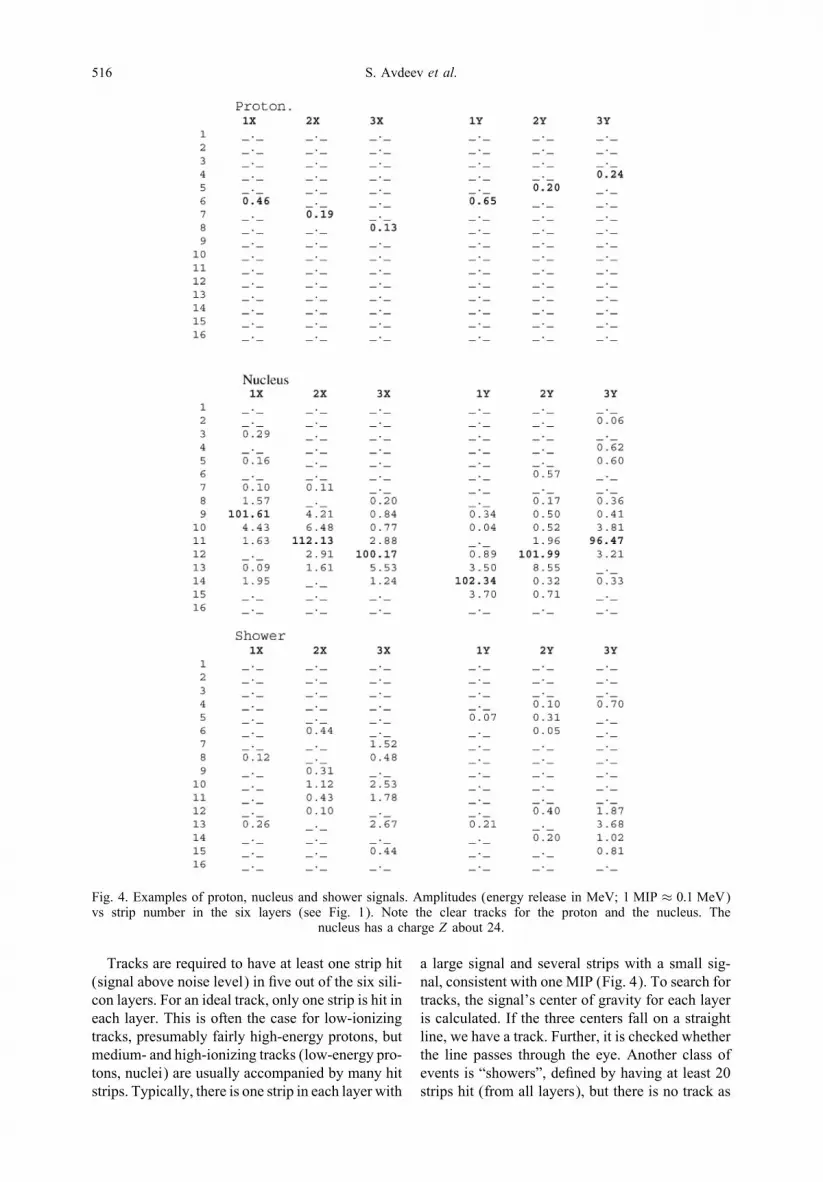
Fig. 4. Examples of proton, nucleus and shower signals. Amplitudes (energy release in MeV; 1 MIP ≈ 0:1 MeV)vs strip number in the six layers (see Fig. 1). Note the clear tracks for the proton and the nucleus. The
nucleus has a charge Z about 24.
Tracks are required to have at least one strip hit(signal above noise level) in Mve out of the six sili-con layers. For an ideal track, only one strip is hit ineach layer. This is often the case for low-ionizingtracks, presumably fairly high-energy protons, butmedium- and high-ionizing tracks (low-energy pro-tons, nuclei) are usually accompanied by many hitstrips. Typically, there is one strip in each layer with
a large signal and several strips with a small sig-nal, consistent with one MIP (Fig. 4). To search fortracks, the signal’s center of gravity for each layeris calculated. If the three centers fall on a straightline, we have a track. Further, it is checked whetherthe line passes through the eye. Another class ofevents is “showers”, deMned by having at least 20strips hit (from all layers), but there is no track as

Eye Light Flashes 517
Fig. 5. UE vs VE scatter plot for the SilEye-2 detec-tor simulation. All the smaller points show the simu-lated values for various nuclei, whereas the larger blackcircles are real data from one small data sample. Theright end of each nuclei scatter, corresponds to thelowest energy for the nucleus to traverse the detector.The continuous line shows the cut used to distinguish
between protons and nuclei.
deMned above. Presumably, these events are sev-eral low-ionizing particles, probably protons, pass-ing through the detector at the same time (within2 �s). By inspection, though, one can sometimessee a nucleus track among the other signals. All nu-clei and shower events which were candidates forLFs were visually inspected.The signal amplitudes from the strips are propor-
tional to the energy losses in the semi-conductormaterial, and proportional to the square of thecharge of a passing particle (Z2). The energyloss also depends on the energy of the particle,according to the Bethe-Block formula. By com-bining the amplitude information from the threeplanes, it is possible to distinguish between var-ious nuclear species in the approximate energyrange 40–200 MeV=n, somewhat depending onthe nuclear charge. Denote the energy depositedin plane i as Ei, the sum of the energies depositedas
∑E=E1 +E2 +E3 and the diSerence between
energy deposited in the Mrst and third layers asVE= |E1 − E3|. In a
∑E versus VE scatter dia-
gram they fall in bands, each band correspondingto a diSerent nucleus (Fig. 5). For Mxed VE;
∑E
increases with the charge. For low-energy parti-cles, the stopping power of the detector is largeso that also the diSerence between the energiesdeposited in the Mrst and third layers is large. Verylow-energy particles, however, will not go throughthe detector, while at high energies, all events tend
Table 2. Energy ranges for which some nuclei are identiMedand the energy can be estimated
Nuclei Charge (Z) Energy range (MeV=n)56Fe 26 161–59328Si 14 118–38620Ne 10 97–35616O 8 85–34511B 5 62–2587Li 3 45–1924He 2 39–1681H (proton) 1 38–167
to cluster together at small VE values with largetails in the
∑E distribution for individual species,
thus considerably decreasing the separation power.Table 2 gives examples of energy ranges for
identiMed nuclei. Note that this method of identify-ing charge and energy is diSerent from what is nor-mally used, e.g. when the full energy versus dE=dxis plotted, and, as far as we know, our experimentis the Mrst in which this method has been used inpractice.For higher energies, nuclear discrimination can
be obtained for heavier nuclei (Z ¿ 4) by requir-ing a single track and imposing that the energy de-posited in the Mrst and third planes diSer by lessthan 20%, and then looking at the total energy loss,∑E. The distribution of
∑E thus obtained, from
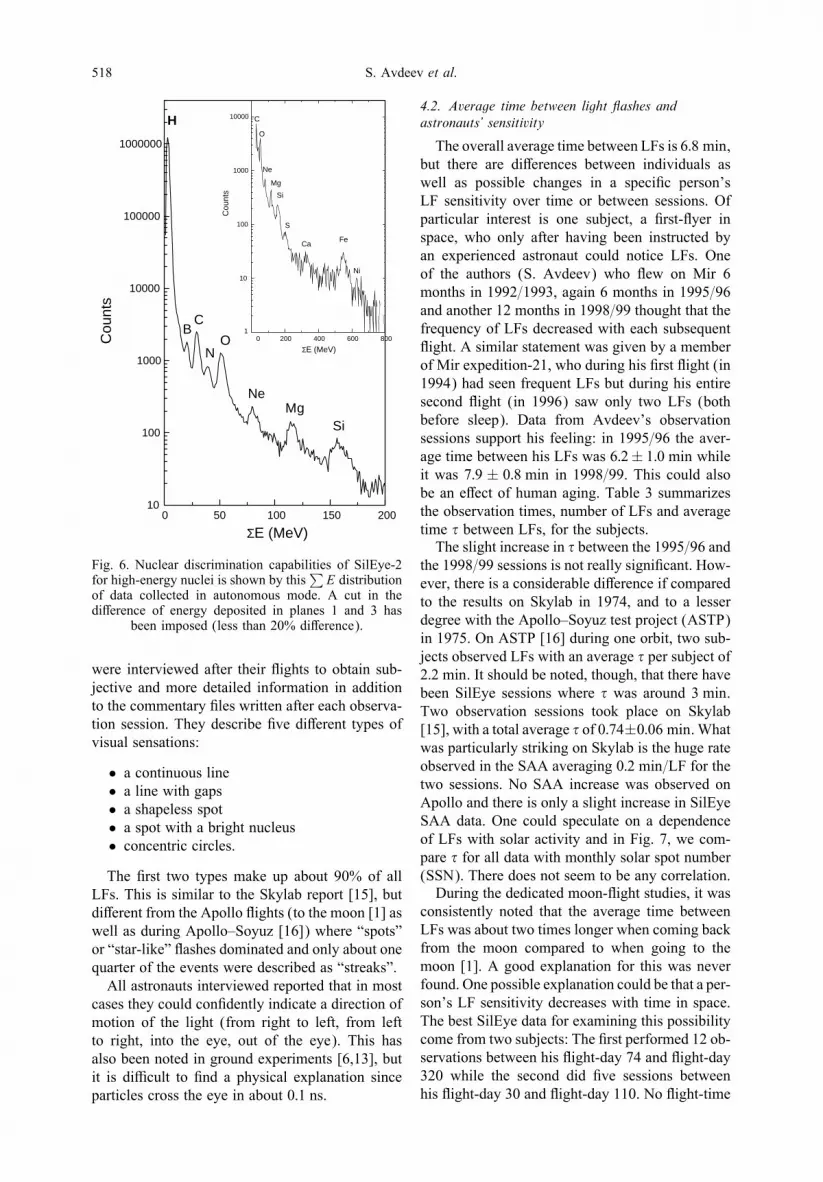
our large sample of data of SilEye-2 operating inautonomous mode, is shown in Fig. 6. It is pos-sible to observe how the elemental peaks of themost abundant species up to nickel are easily dis-tinguished, allowing for detailed studies of the ra-diation environment onboard Mir in conditions ofsolar quiet and active periods.In this work, however, we are mostly concerned
with the discrimination between protons and heav-ier particles in order to assess the diSerent contri-butions to the LF phenomena.In our analysis presented here, we distinguish
between “protons” and “nuclei”, as deMned by thecut shown in Fig. 5. The cut is drawn in the mid-dle between the theoretical average proton curveand the curve for 3He. We Mnd that of the morethan 116,000 tracks, only 858 are clean nuclei (seeTable 1), i.e. 0.74% of all tracks. As a comparison,cosmic rays outside the SAA contain 90% protons,9% He and 1% heavier nuclei. Inside SAA, theproton dominance is much larger.
4. RESULTS AND DISCUSSION
4.1. Appearance and types of light "ashes
A total of 233 LFs reported by six diSerent astro-nauts is used in the analysis. Four of the astronauts
518 S. Avdeev et al.
0 50 100 150 20010
100
1000
10000
100000
1000000
SiMg
Ne
ON
CB
HC
ount
s
ΣE (MeV)
0 200 400 600 8001
10
100
1000
10000
Mg
Si
S
Ca
Ni
Fe
Ne
O
C
ΣE (MeV)
Cou
nts
Fig. 6. Nuclear discrimination capabilities of SilEye-2for high-energy nuclei is shown by this
∑E distribution
of data collected in autonomous mode. A cut in thediSerence of energy deposited in planes 1 and 3 has
been imposed (less than 20% diSerence).
were interviewed after their @ights to obtain sub-jective and more detailed information in additionto the commentary Mles written after each observa-tion session. They describe Mve diSerent types ofvisual sensations:
• a continuous line• a line with gaps• a shapeless spot• a spot with a bright nucleus• concentric circles.
The Mrst two types make up about 90% of allLFs. This is similar to the Skylab report [15], butdiSerent from the Apollo @ights (to the moon [1] aswell as during Apollo–Soyuz [16]) where “spots”or “star-like” @ashes dominated and only about onequarter of the events were described as “streaks”.All astronauts interviewed reported that in most
cases they could conMdently indicate a direction ofmotion of the light (from right to left, from leftto right, into the eye, out of the eye). This hasalso been noted in ground experiments [6,13], butit is diTcult to Mnd a physical explanation sinceparticles cross the eye in about 0:1 ns.
4.2. Average time between light "ashes andastronauts’ sensitivity
The overall average time between LFs is 6:8 min,but there are diSerences between individuals aswell as possible changes in a speciMc person’sLF sensitivity over time or between sessions. Ofparticular interest is one subject, a Mrst-@yer inspace, who only after having been instructed byan experienced astronaut could notice LFs. Oneof the authors (S. Avdeev) who @ew on Mir 6months in 1992=1993, again 6 months in 1995=96and another 12 months in 1998=99 thought that thefrequency of LFs decreased with each subsequent@ight. A similar statement was given by a memberof Mir expedition-21, who during his Mrst @ight (in1994) had seen frequent LFs but during his entiresecond @ight (in 1996) saw only two LFs (bothbefore sleep). Data from Avdeev’s observationsessions support his feeling: in 1995=96 the aver-age time between his LFs was 6:2± 1:0 min whileit was 7:9 ± 0:8 min in 1998=99. This could alsobe an eSect of human aging. Table 3 summarizesthe observation times, number of LFs and averagetime � between LFs, for the subjects.The slight increase in � between the 1995=96 and
the 1998=99 sessions is not really signiMcant. How-ever, there is a considerable diSerence if comparedto the results on Skylab in 1974, and to a lesserdegree with the Apollo–Soyuz test project (ASTP)in 1975. On ASTP [16] during one orbit, two sub-jects observed LFs with an average � per subject of2:2 min. It should be noted, though, that there havebeen SilEye sessions where � was around 3 min.Two observation sessions took place on Skylab[15], with a total average � of 0:74±0:06 min. Whatwas particularly striking on Skylab is the huge rateobserved in the SAA averaging 0:2 min=LF for thetwo sessions. No SAA increase was observed onApollo and there is only a slight increase in SilEyeSAA data. One could speculate on a dependenceof LFs with solar activity and in Fig. 7, we com-pare � for all data with monthly solar spot number(SSN). There does not seem to be any correlation.During the dedicated moon-@ight studies, it was
consistently noted that the average time betweenLFs was about two times longer when coming backfrom the moon compared to when going to themoon [1]. A good explanation for this was neverfound. One possible explanation could be that a per-son’s LF sensitivity decreases with time in space.The best SilEye data for examining this possibilitycome from two subjects: The Mrst performed 12 ob-servations between his @ight-day 74 and @ight-day320 while the second did Mve sessions betweenhis @ight-day 30 and @ight-day 110. No @ight-time

Eye Light Flashes 519
Table 3. Observation time, number of LFs and average minutes per LF for the three subjects in the 1995=96 period andfor the four subjects of the 1998=99 one. Errors are only statistical. Not included are errors from time estimates and factors
due to the fact that diSerent subjects might have diSerent LF sensitivity
N1- N2- N3- Total N1- N4- N5- N6- Total All1995=96 1995=96 1995=96 1995=96 1998=99 1998=99 1998=99 1998=99 1998=99
Time (min) 260 171 61 492 642 117 27 301 1087 1579LF 42 37 8 87 81 32 9 24 146 233�=min=LF 6.2 4.6 8 5:7± 0:6 7.9 3.7 3 13 7:4± 0:6 6:8± 0:5
0
20
40
60
80
100
120
140
160
180
200
01/1
974
03/1
974
05/1
974
05/1
975
07/1
975
08/1
975
08/1
995
10/1
995
12/1
995
02/1
996
04/1
996
06/1
998
08/1
998
10/1
998
12/1
998
02/1
999
04/1
999
06/1
999
08/1
999
10/1
999
Month
Sun Spot Number and LF
Eve
nts
per
mon
th
N SSNLF *10
Fig. 7. Average time � between LF in diSerent months compared to the monthly variation of the sun spot number(SSN). Skylab, Apollo–Soyuz and all SilEye data.
dependence at all was found in those data. How-ever, data from a third subject, who made twosessions on his @ight-days 5 and 8, show a possibleeSect. On @ight-day 5, � outside SAA is 3:6 ±0:7 min versus 8:1±3:7 min on day 8, and the cor-responding � in SAA are 1:7±0:8 and 2:0±0:9 min,respectively. Unfortunately, we do not have moredata from early @ight-days, but this should belooked into for more details during future @ights.Our results, and the moon-@ights data, are fullyconsistent with the assumption that a person’s LFsensitivity decreases signiMcantly during the Mrstone or two weeks in space, but then remains con-stant. Considering that many other physiologicalparameters are modiMed considerably during theMrst weeks in space, this is not implausible. At thebeginning of each session, the subject was testedfor his dark adaptation and light sensitivity, butthere is no noticeable diSerence between the twosessions.
4.3. Geomagnetic dependence
The geographical distribution of all the SilEyeLFs is shown in Fig. 8. It must be noted that thesedata are not normalized to time spent observing in
a certain region, and in particular during 1995=96most sessions were done during orbits passingthrough the SAA. An example of such an orbit isshown in the Mgure.In Fig. 9, we compare rates of LFs with diSerent
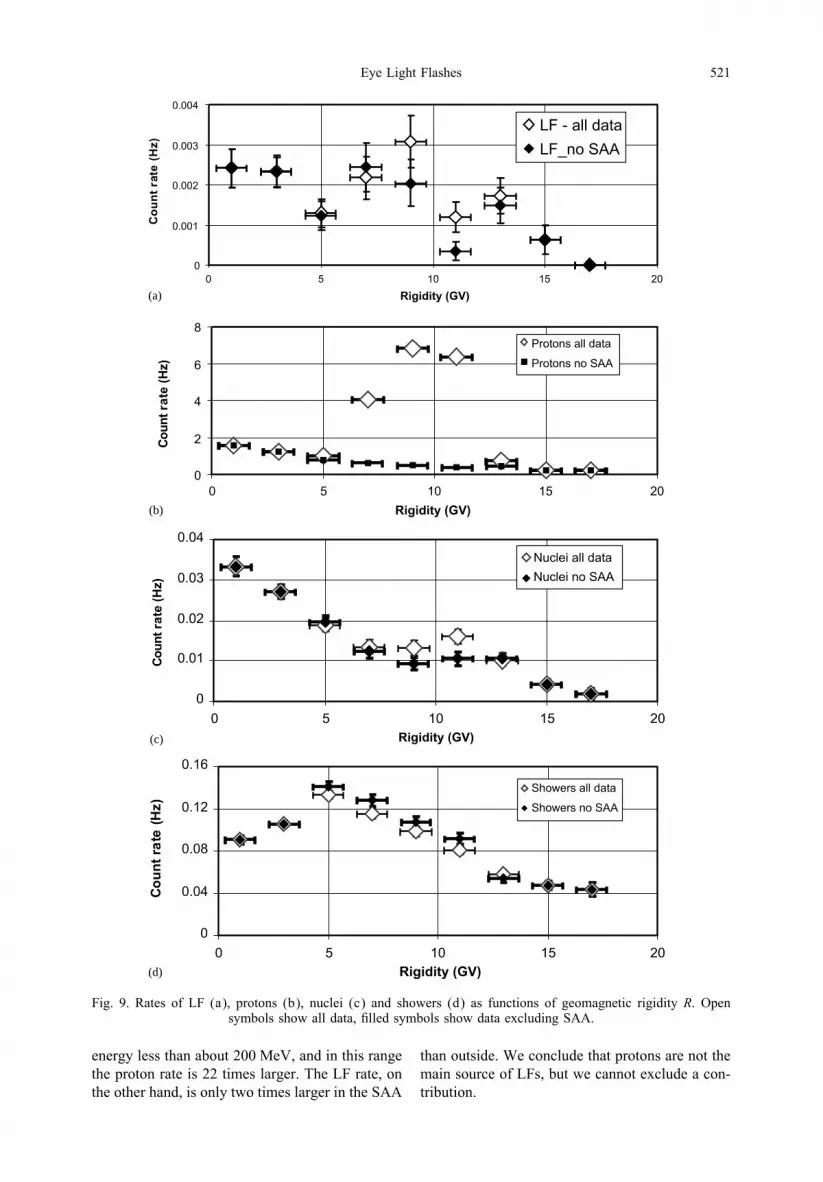
types of events (protons, nuclei, showers), includ-ing and excluding SAA data, as a function of ge-omagnetic rigidity. The geomagnetic rigidity R fora point in the geomagnetic Meld is deMned by theminimum rigidity that a particle coming from in-Mnity must have to reach that point. The rigidity ofa particle is given by the quantity pc=Ze, where pis the momentum and Z the charge of the particle.For each LF we have the latitude, longitude and al-titude of Mir at that moment and can calculate Rfrom a model of the geomagnetic Meld. High lati-tudes correspond to small R-values. At the equatorR is around 17 GV and at the SAA has values of8-12 GV. There is no diSerence between 1995=96data and 1998=99 data; therefore, all data have beencombined (Fig. 9a).Figure 9b shows the proton rates, all data and
data outside SAA only, obtained by SilEye-2 duringthe 17 observation sessions in 1998=99. Althoughthe trigger threshold is 2.5 MIP, there is still a largeincrease of the rate in SAA. SilEye-1 has a trigger

520 S. Avdeev et al.
Fig. 8. Geographical distribution of all 233 LFs. An example of a typical measurement session (part of anorbit) going through the SAA is shown by the curve. The indicated area corresponds to the South Atlantic
Anomaly (SAA).
threshold of 0.5 MIP, and its trigger rate saturatedin SAA at 25 Hz [23,24]. There is a much smallerdiSerence between nuclear spectra (Z ≥ 2), for alldata and for those outside SAA, as seen in Fig.9c. This is expected, since most trapped particlesin the radiation belts are protons. There are sometrapped alpha-particles (4He) in the SAA, whichcause the small bump in the all-data nuclei spectra.The shower rate distribution is shown in Fig. 9d.While the proton and nuclear distributions are verysimilar in shape when excluding SAA, althoughsome 50 times higher for protons, the shower dis-tribution is quite diSerent and we also note thatthere is no diSerence inside and outside the SAA.On the other hand, the shower rate drops belowsome 5 GV rigidity. This shows that showers arecaused by high-energy (galactic) protons, with en-ergy above 5 GeV, most likely interacting with ma-terial of the space station.The general trends of the LF-distribution are sim-
ilar to those of protons and nuclei but, due to thelimited statistics of the LF distribution, it is not pos-sible to make direct comparisons with either parti-cle distribution. However, since the rate of LF inSAA is only slightly higher than the rate outsidefor the same geomagnetic rigidity, we can concludethat high-energy protons cannot be the main reasonfor LFs. It is to be noted, that the proton rate in SAAis much higher than that measured due to the lim-ited energy ranges of our detectors (40–200 MeVfor SilEye-2 and ¿ 25 MeV for SilEye-1).
4.4. Light "ashes correlated with particles
In order to search for individual candidate eventscausing LFs, we look for particles with a track go-
ing through an eye. The detector covers a geometri-cal solid angle of only some 4% of the two eyes, butsince the detector registers particles in any direc-tion, the acceptance is eSectively twice this value.On the other hand, there is some loss due to parti-cles stopping in the head between an eye and thedetector, so a rough estimate of the overall accep-tance is 6–7%. For showers, we make the assump-tion that there is always at least one particle goingthrough the eye.Next we look into a reaction time window pre-
ceding the recorded LF time. The dark adaptationdata give good statistics on each individual’s re-action time to stimulus and any possible changeover time spent in space. We found that there is nochange during the period of the @ight and no diSer-ence between ground and @ight data. All subjectshave similar reaction times and therefore we havecombined all data, shown in Fig. 10.From the reaction time distribution, we chose a
window between 1.2 and 0:2 s before the joysticksignal notifying an LF by the subject. Any particleregistered by the detector in that time frame is acandidate for causing the LF. If a particle is outsidethis time window, then it is excluded. Tables 4–6summarize the data. The particle rates in the tableshave been corrected for the detector dead time of0:01 s which particularly in the SAA is signiMcantdue to the high trigger rate of 24 Hz.Both proton and nuclei rates increase signiM-
cantly in the LF windows. The nuclei @ux does notdiSer very much inside and outside SAA, while theproton @ux is orders of magnitude larger inside.Although the total time of SAA data is 5768 s or12% of all data time, 70% of the protons are there.The SilEye-2 detector only triggers on protons with
Eye Light Flashes 521
(a)
(b)
(c)
(d)
Fig. 9. Rates of LF (a), protons (b), nuclei (c) and showers (d) as functions of geomagnetic rigidity R. Opensymbols show all data, Mlled symbols show data excluding SAA.
energy less than about 200 MeV, and in this rangethe proton rate is 22 times larger. The LF rate, onthe other hand, is only two times larger in the SAA
than outside. We conclude that protons are not themain source of LFs, but we cannot exclude a con-tribution.

522 S. Avdeev et al.
Fig. 10. Reaction time of four subjects to darkadaptation signals.
The strongest evidence for nuclei as the mainsource of LFs comes from comparing the protonand nucleus rates, between the “All time” columnand the “In LF time window” column. The protonrate increases with about a factor of 2, while thenucleus rate is 6–7 times larger (Table 4).We have eight very strong candidates of nuclei
as initiators of LFs. These are from the tracks that
Table 4. Events in LF time windows and tracks through an eye (all data)
Time-cut All time (48 850 s) In LF time window (total: 116 s)
Eye-cut All data Track through eye All data Track through eye
Event Number Rate (Hz) Number Rate (Hz) Number Rate (Hz) Number Rate (Hz)
Protons (p) 115,508 2:50± 0:01 59 414 1:29± 0:005 557 5:1± 0:2 302 2:8± 0:2Nuclei (N) 858 0:0186± 0:0006 479 0:0104± 0:0005 11 0:10± 0:03 8 0:074± 0:026Showers 4434 0:0960± 0:014 — — 10 0:091± 0:029 — —LF 116 0:0024± 0:0002 — — 116 1 — —N=p 0:0074± 0:0002 0:0081± 0:0004 0:020± 0:006 0:026± 0:009Showers=p 0:0384± 0:0006 — 0:018± 0:006 —
Table 5. Events in LF time windows and tracks through an eye (SAA data excluded)
Time-cut All time (43 082 s) In LF time window (total: 90 s)
Eye-cut All data Track through eye All data Track through eye
Event Number Rate (Hz) Number Rate (Hz) Number Rate (Hz) Number Rate (Hz)
Protons (p) 34,564 0:822± 0:004 18 901 0:450± 0:003 116 1:3± 0:1 67 0:76± 0:09Nuclei (N) 756 0:0180± 0:0007 428 0:0102± 0:0005 10 0:11± 0:04 7 0:081± 0:040Showers 4422 0:105± 0:002 — — 10 0:11± 0:04 — —LF 90 0:0021± 0:0002 — — 90 1 — —N=p 0:022± 0:001 0:023± 0:001 0:09± 0:04 0:10± 0:05Showers=p 0:128± 0:003 — 0:09± 0:04 —
Table 6. Events in LF time windows and tracks through an eye (only SAA data)
Time-cut All time (9768 s) In LF time window (total: 26 s)
Eye-cut All data Track through eye All data Track through eye
Event Number Rate (Hz) Number Rate (Hz) Number Rate (Hz) Number Rate (Hz)
Protons (p) 80,844 17:80± 0:06 40 513 8:92± 0:04 441 21:5± 1:0 235 11:5± 0:7Nuclei (N) 102 0:0225± 0:0022 51 0:0112± 0:0016 1 0:05± 0:05 1 0:05± 0:05Showers 12 0:0026± 0:0008 — — — — — —LF 26 0:0045± 0:0009 — — 26 1 — —N=p 0:0013± 0:0001 0:0013± 0:0002 0:002± 0:002 0:004± 0:004Showers=p 0:00015± 0:00004 — 0 —
went through the eye in the LF time window. Thecharges of these eight candidates were estimatedby the
∑E versus VE scatter diagram (Fig. 5), as
described in Section 3. Three particles have chargeZ =2 (He), two are estimated to have Z =2–3 (Heor Li), two candidates fall around Z =8 (O) andone is about Z =24 (Cr).The probability that there is more than one nu-
cleus in 1-s time interval is very small, since theoverall rate of nuclei going through the eye is onlyabout 1=100 s (see Table 4). So over the 116 LFs,we can expect one chance of simultaneous occur-rence. Also showers that to a large fraction containnuclei, will add to the probability of a chance cor-relation, and in about the same amount. Out of theeight strong candidates, two are therefore probablychance events.If the source of LFs is mainly nuclei in our de-
tector’s energy and charge range, and since the ac-ceptance of the detector is only about 6–7%, fromthe 116 LFs observed, we would expect 7–8

Eye Light Flashes 523
candidates. This is perfectly consistent with nucleias the main source of LFs in space, but with somecontribution from protons. The protons are likelyto be of lower energy and therefore, more ionizingthan high-energy protons.
4.5. Particle - light "ash probability
Assume that all LFs are caused by either nu-clei or protons and that the detector eTciencies forthese particle species are the same. Then, from thediSerent rates in and out of SAA, we can calcu-late the probabilities for nuclei and protons, respec-tively, to cause an LF. Let Rp and RN denote theevent rates of protons and nuclei through the eyesoutside SAA, RLF the LF rate outside SAA, whileSp; SN and SLF are the corresponding rates in theSAA. Further, �p and �N are the probabilities thata proton and a nucleus will cause an LF, respec-tively, while the detector-eye geometrical factor G,being the inverse of the acceptance, is about 6–7%.Then the following expressions are valid:
RLF =RpG�p + RNG�N;
SLF = SpG�p + SNG�N; (1)
from which one gets
�p =SNRLF − RNSLFG(SNRp − SpRN) ;
�N =SpRLF − RpSLFG(SpRN − SNRp) ; (2)
and in particular
�N�p=SpRLF − RpSLFRNSLF − SNRLF : (3)
On inserting the numbers from Tables 5 and 6,one gets �N=�p = (7:5± 3:5)× 102. Taking G=15(≈ 1=0:065), the individual probabilities become�N = (1:3±0:2)×10−2 and �p = (1:7±0:8)×10−5.As a consistency check, we can insert these valuesinto the reverse formulae of expected number oflight @ashes (i=N or p):
Ni= �iG(SitSAA + RitnoSAA); (4)
where tSAA and tnoSAA are the observation times inSAA and outside, respectively. We then obtain 98LFs from nuclei and 18 LFs from protons, addingup to 116, which is precisely the observed number.Thus, nuclei overwhelmingly dominate as initiatorsof LFs, which is consistent with what was foundabove.Several error sources contribute to fairly large
uncertainties in these numbers. The statistical errorin �N is 13% while it is around 45% in �p and in
the ratio, dominated by SLF(20%), RLF(11%) andSN(14%). The geometrical factor G is estimatedwith an error of about 25%, but it cancels in theratio �N=�p. The probabilities are also an averageover six diSerent people, whereas some others didnot see any, or very few LFs. There is a limited en-ergy range of the detected particles; in particular,protons above 200 MeV are missing, and in gen-eral there might be diSerent detector eTcienciesfor protons and nuclei. Actually, the ratio �N=�p isdirectly proportional to any correction due to dif-ferences in these detector eTciencies. Finally, anyother source for LF is ignored.Another possibility is that LFs caused by pro-
tons are from events with more than one protonhitting the eye at more or less the same time. Theintegration time of the eye, Teye, is about 50 msand during this time in the SAA, we get on an av-erage 0:050GSp = 6:7 protons through the eyes. Ifthe LF sensation is caused by a local eSect in theretina, an added eSect of several protons would re-quire that the protons hit the same little area inthe retina, which we call As. If we make the sim-pliMed assumption that outside SAA, all LFs arecaused by nuclei, and the additional LF rate insideSAA is due to two protons hitting the same sensi-tive area within Teye, we can get an estimate of thesize of this area. Assuming all LFs outside SAAcome from nuclei gives �N =1:4× 10⁻², which isnot much diSerent from what we had above, butwhich would give a rate of LFs inside SAA fromnuclei only of 0:0023 Hz. If the single hit rate inAs is small (�1), one can approximate the doublehit rate‡ with
S2p ≈ (GSpAs=Aeye)2Teye; (5)
where Aeye is the area of the whole eye. On in-troducing the “probability of a double proton hitto give an LF”, �2p, and with S2LF being the LFrate in SAA due to double proton hits (0:0045 −0:0023=0:0022 Hz), one gets
�2p(As=Aeye)2 = S2LF=(G2S2pTeye)= 2:5× 10⁻⁶:(6)
It is not reasonable that �2p would be larger that �N,which leads to As ≥ 0:013Aeye. However, even 1%of the area of the eye is likely to be too large “a sin-gle unit” in these circumstances. Even though therate of all protons are much larger than the cut-oSspectra of the SilEye detector measures, it seems
‡If the single rate is � and Poissonian, then the double hitrate in time windows T is given by �2 = �(1− e−�T ), whichin case �T�1 is approximately equal to �2T .

524 S. Avdeev et al.
Fig. 11. Fraction of tracks through the eye, inLF-window (�), and in “anti-LF” window ( ), as
a function of LET.
doubtful that double hits can give a signiMcant con-tribution to LFs.To conclude this part, it is estimated that about
one nucleus in 100 passing through the eye wouldgive rise to an LF, while only one proton in about100,000 does the same.
4.6. Linear energy transfer
We have studied the likelihood of a particle caus-ing an LF as a function of its ionization, expressedin linear energy transfer (LET) in water as usu-ally used in biological contexts. The LET for alltracks that passed through an eye was calculated.The fraction of tracks that occurred in the 116LF-window (1.2–0:2 s before a registered LF sig-nal, as used above) as a function of LET is shownin Fig. 11. For comparison, an “anti-LF” windowwas deMned, being 0.2–1:2 s after the LFs. The cor-responding fraction of tracks in the “anti-window”is also shown in Fig. 11. In the Mrst sample (tracksfalling in the LF-windows), we expect to Mnd parti-cles which could have made an LF, whereas no par-ticle from the second sample (the “anti-windows”)could have caused an LF.The fraction of tracks in the LF-window
increases for LET-values larger than about10 keV=�m, whereas the “anti-window” distri-bution is more or less @at. Actually, we do notMnd any particle with LET¿ 10 keV=�m in the“anti-window” distribution. The statistics is ad-mittedly not large at high LET values, with onlyMve events in the LF-window sample above30 keV=�m, but it shows an increasing probabilityof creating LFs with increasing LET. This prob-ability is about 5% at around 50 keV=�m. Notsurprisingly, all the Mve highest LET events arefound among the eight “strong candidates” forcausing an LF, as described in Section 4.4.
5. CONCLUSIONS
Data on light @ashes (LFs) in human eyes havebeen collected onboard the Russian space stationMir between 1995 and 1999 for the SilEye exper-iment. Six astronauts together spent over 26 h ob-serving and noted 233 LFs during this time. Particledata, taken by the SilEye-2 detector and concurrentwith the observations, have been used to correlateLFs with particles passing through the eyes.Eight events with identiMed particles which most
likely had caused an LF were found. Five of thesewere helium or lithium nuclei, two were oxygennuclei and one was a heavy nucleus with charge Zaround 24.The rate of LFs inside the South Atlantic
Anomaly (SAA) was found to be about twice aslarge as outside; however, the proton rate is manytimes higher inside than outside. On comparingrates of LFs, protons and nuclei inside and outsidethe SAA, we deduced that the probability of anucleus passing through an eye to cause an LF isabout 1%. The same probability for a proton withenergy less than around 200 MeV, is roughly 750times smaller than the nuclei probability. Higherenergy protons are even less likely to make an LF.As a function of ionization, expressed as linear
energy transfer (LET) in water, there is a clearincrease in probability that particles give rise to LFsfor LET above 10 keV=�m, reaching about 5% ataround 50 keV=�m.The average observation time between LFs was
6:8 min, but this value depends on particle @uxesoutside Mir — in particular inside or outside SAA,on diSerent astronauts and possibly individuals’sensitivity to LFs changes over time. No long-termspace @ight eSect during one mission was found;however, there are indications that LF sensitivitydecreases for subsequent @ights, or with age. Apossible eSect of space adaptation, which wouldmake people more sensitive to LFs during the Mrst1 or 2 weeks in space, could explain as to how dur-ing the Apollo program, it was consistently foundthat LF rates were much higher when going to themoon than when coming back. One SilEye subjectmade observations on his @ight-days 5 and 8, andthe results are consistent with this hypothesis, butcertainly not conclusive. More @ight data should becollected in the future.The average LF rate during two observation ses-
sions on Skylab in 1974 was about 10 times higherthan what we found, and also during the Apollo–Soyuz test project in 1975, a signiMcantly higherrate was measured. It is not clear as to where thewidely diSerent LF rates stem from, but it shouldbe noted that the three space vehicles had diSerent
Eye Light Flashes 525
material compositions and structures. No correla-tion with solar activity, as measured by the numberof sun spots, was found.About 90% of the LFs were described as ap-
pearing like a continuous line or a line with gaps.This is similar to results from Skylab, whereas fromApollo @ights “spots” or “star-like” shapes werereported to dominate.Dark adaptation and reaction time were mea-
sured at the start of each observation session,for control purposes. However, no diSerence wasfound for these physiological functions betweenground and space, nor was any change over timein space noticed.It has been shown that nuclei and largely ion-
izing particles are the dominant sources of light@ashes in space (at least in a space station orbitingthe Earth). From this, the Cherenkov eSect can beexcluded as one of the candidates for creating thelight in the eye. Local energy deposition by ioniza-tion seems the most likely candidate. It still needsto be explained, though, as to how the energy getstransformed into a light signal to the brain. Is thereany light involved, or is it perhaps direct stimula-tion of rods and cones by the penetrating particle?Other questions also remain, and particularly it isdesirable to have measurements as independent aspossible of subjective eSects. Therefore, a contin-uation of the SilEye studies, under the name AL-TEA, is planned for the International Space Station[25]. Among other features, ALTEA foresees theinclusion of EEG measurements simultaneous withLF observations and particle tracking detector data.
Acknowledgements—We would like to thank all astro-nauts who participated in the data collection onboardthe Mir space station. ESA is acknowledged for provid-ing a laptop for read-out and giving support. Financialsupport has been received from RFBR (Russian Foun-dation for Basic Research). The Swedish group thanksthe Gustafsson foundation for support.
REFERENCES
1. Pinsky, L. S., et al., Science, 1974, 183, 957;Osborne, W. Z., Pinsky, L. S., Baily, J. V., Apollolight @ash investigations. Biomedical results ofApollo, NASA SP-386, 1975, p. 355.
2. Tobias, C. A., Journal for Aviation Medicine, 1952,23, 345.
3. Fremlin, J. H., New Scientist, 1970, 47, 42.4. Charman, W. H., Dennis, J. A., Fazio, G. G. andJelley, J. V., Nature, 1971, 230, 522.
5. Tobias, C. A., Budinger, T. F. and Lyman, J. T.,Nature, 1971, 230, 596.
6. Budinger, T. F., Bichsel, H. and Tobias, C. A.,Science, 1971, 172, 868.
7. Charman, W. N. and Rowlands, C. M., Nature,1971, 232, 574.
8. D’Arcy, F. J. and Porter, N. A., Nature, 1962, 196,1013.
9. McNulty, J., Nature, 1971, 234, 110.10. Akatov, Yu., et al., Proceedings of the 6th European
Symposium on Life Sciences Research in Space,Trondheim, Norway, 1996, p. 153.
11. Fazio, G. G., Jelley, J. V. and Charman, W. N.,Nature, 1970, 228, 260.
12. McAulay, I. R., Nature, 1971, 232, 421.13. Budinger, T. F., Lyman, J. T. and Tobias, C. A.,
Nature, 1972, 239, 209.14. Budinger, T. F., et al., Proceedings of the Colloqium
Space Biology Related to Post-Apollo Programme,ESRO, Paris, 1971, p. 235.
15. Pinsky, L. S., Osborne, W. Z., HoSman, R. A. andBaily, J. V., Science, 1975, 188, 928; HoSman,R. A., Pinsky, L. S., Osborne, W. Z. and Baily,J. V., Visual light @ash observation on Skylab 4,Biomedical results from Skylab, NASA SP-377,1977, p. 127.
16. Budinger, T. F., et al., Light "ash observations.Experiment MA-106. Apollo–Soyuz Test ProjectSummary Science Report, NASA SP-412, 1977, p.193.
17. Bidoli, V., et al., Nuclear Instruments and MethodsA, 1999, 424, 414.
18. Bakaldin, A., et al., Astroparticle Physics, 1997, 8,109.
19. Casolino, M., et al., Proceedings of the 26th ICRC,OG 4.2.17, Salt Lake City, USA, 1999.
20. Adriani, O., et al., Proceedings of the 26th ICRC,Vol. 5, OG 4.2.04, Salt Lake City, USA, 1999, p.96.
21. Bidoli, V., et al., Nuclear Instruments and MethodsA, 1997, 399, 477.
22. Furano, G., et al., Proceedings of the 26th ICRC,Vol. 5, OG 4.2.13, Salt Lake City, 1999, p. 128;Bidoli, V., et al.,Advances in Space Research, 2000,25, 2075.
23. Galper, A. M., et al., Proceedings of the 6thEuropean Symposium on Life Sciences Researchin Space, Trondheim, Norway, 1996, p. 159.
24. Morselli, A., On behalf of the SilEye collaboration,Proceedings of the 25th ICRC, Vol. 5, OG 10.2.8,Durban, South Africa, 1997, p. 45.
25. Narici, L., et al., presented at the “Life Sciences inSpace” Conference, May 2000, Santorini, Italy.