transcription factor nrf2 regulates mir-1 and mir-206 to drive tumorigenesis
TRANSCRIPT

Research article
The Journal of Clinical Investigation http://www.jci.org Volume 123 Number 7 July 2013 2921
Transcription factor NRF2 regulates miR-1 and miR-206 to drive tumorigenesis
Anju Singh,1 Christine Happel,1 Soumen K. Manna,2 George Acquaah-Mensah,3 Julian Carrerero,4 Sarvesh Kumar,1 Poonam Nasipuri,1 Kristopher W. Krausz,2 Nobunao Wakabayashi,5
Ruby Dewi,6 Laszlo G. Boros,7,8 Frank J. Gonzalez,2 Edward Gabrielson,9 Kwok K. Wong,4,10 Geoffrey Girnun,6 and Shyam Biswal1,9
1Department of Environmental Health Sciences, Bloomberg School of Public Health, Johns Hopkins University, Baltimore, Maryland, USA. 2Laboratory of Metabolism, Center for Cancer Research, National Cancer Institute, Bethesda, Maryland, USA. 3Department of Pharmaceutical Sciences,
Massachusetts College of Pharmacy and Health Sciences, Worcester, Massachusetts, USA. 4Department of Physiology, University of Valencia, Valencia, Spain. 5Department of Pharmacology and Chemical Biology, University of Pittsburgh School of Medicine, Pittsburgh, Pennsylvania, USA.
6Department of Biochemistry and Molecular Biology, University of Maryland School of Medicine, Baltimore, Maryland, USA. 7SIDMAP, LLC, Los Angeles, California, USA. 8Department of Pediatrics, Los Angeles Biomedical Research Institute, Harbor-UCLA Medical Center, Torrance, California, USA. 9Department of Oncology, Sidney Kimmel Comprehensive Cancer Center, School of Medicine, Johns Hopkins University,
Baltimore, Maryland, USA. 10Department of Medical Oncology, Dana-Farber Cancer Institute, Boston, Massachusetts, USA.
The mechanisms by which deregulated nuclear factor erythroid-2–related factor 2 (NRF2) and kelch-like ECH-associated protein 1 (KEAP1) signaling promote cellular proliferation and tumorigenesis are poorly under-stood. Using an integrated genomics and 13C-based targeted tracer fate association (TTFA) study, we found that NRF2 regulates miR-1 and miR-206 to direct carbon flux toward the pentose phosphate pathway (PPP) and the tricarboxylic acid (TCA) cycle, reprogramming glucose metabolism. Sustained activation of NRF2 sig-naling in cancer cells attenuated miR-1 and miR-206 expression, leading to enhanced expression of PPP genes. Conversely, overexpression of miR-1 and miR-206 decreased the expression of metabolic genes and dramatical-ly impaired NADPH production, ribose synthesis, and in vivo tumor growth in mice. Loss of NRF2 decreased the expression of the redox-sensitive histone deacetylase, HDAC4, resulting in increased expression of miR-1 and miR-206, and not only inhibiting PPP expression and activity but functioning as a regulatory feedback loop that repressed HDAC4 expression. In primary tumor samples, the expression of miR-1 and miR-206 was inversely correlated with PPP gene expression, and increased expression of NRF2-dependent genes was associ-ated with poor prognosis. Our results demonstrate that microRNA-dependent (miRNA-dependent) regulation of the PPP via NRF2 and HDAC4 represents a novel link between miRNA regulation, glucose metabolism, and ROS homeostasis in cancer cells.
IntroductionNuclear factor erythroid-2–related factor 2 (NRF2) is a redox-sen-sitive basic leucine zipper family transcription factor that trans-activates cytoprotective pathways in response to oxidative stress, inflammation, and apoptosis through the transcriptional induc-tion of a broad spectrum of genes that includes antioxidants and phase II detoxification enzymes (1–3). Under normal conditions, Kelch-like ECH-associated protein 1 (KEAP1) negatively regulates NRF2 activity by directly binding to it and leading to its protea-somal degradation via conjugation with CUL3-dependent E3 ubiquitin ligase complex (1, 4). However, in the presence of oxida-tive stress, KEAP1 is dissociated from the complex and NRF2 is stabilized and activated. Cancer cells hijack this function to their benefit. Gain of NRF2 function by means of various mechanisms has been reported in lung, breast, skin, esophageal, gallbladder, renal, pancreatic, and endometrial cancer (5–13). Constitutive acti-vation of NRF2 results in the induction of genes involved in pro-
tection against oxidative stress, drug detoxification, promotion of tumorigenicity, and chemo- and radioresistance (7, 14–16). Con-versely, RNAi-mediated reduction in NRF2 expression in lung and prostate cancer cells leads to the generation of ROS and the sup-pression of tumor growth in vivo (15, 16). Attenuation of NRF2 activity increases sensitivity to chemotherapeutic drugs both in vitro and in vivo (14–17). In addition, increased NRF2 expression in lung and ovarian tumors is associated with resistance to plati-num-based drug treatment and poor outcome (18, 19).
The mechanism by which gain of NRF2 function promotes tumor-igenesis is unclear. Using gene expression profiling coupled with a targeted tracer (13C) fate association (TTFA) study and steady-state metabolomic analysis, we have deciphered that NRF2 coordinates the regulation of key genes involved in various pathways of glucose metabolism, including the pentose phosphate pathway (PPP), the tricarboxylic acid (TCA) cycle, and fatty acid synthesis via miR-1 and miR-206. Cancer cells are under constant metabolic stress, and here, we show that gain of NRF2 signaling promotes tumorigenesis through an autoregulatory feedback loop involving microRNA-dependent (miRNA-dependent) regulation of the PPP and HDAC4.
ResultsSustained activation of NRF2 is critical for tumor growth. A549 cells with point mutation in the Keap1 gene(G333C) and loss of heterozy-gosity at 19p13.2 have complete loss of KEAP1 activity and there-
Authorship note: Anju Singh and Christine Happel contributed equally to this work.
Conflict of interest: Shyam Biswal, Anju Singh, and the Johns Hopkins University hold intellectual property on the development of Nrf2 inhibitors for cancer therapy. The terms of this arrangement are being managed by the Johns Hopkins University in accordance with its conflict-of-interest policies. Kwok K. Wong has equity ownership and income from G1 Therapeutics and receives research support from Millennium and AstraZeneca Pharmaceuticals.
Citation for this article: J Clin Invest. 2013;123(7):2921–2934. doi:10.1172/JCI66353.
Downloaded on September 16, 2013. The Journal of Clinical Investigation. More information at www.jci.org/articles/view/66353

research article
2922 The Journal of Clinical Investigation http://www.jci.org Volume 123 Number 7 July 2013
fore have a gain of NRF2 function (5). To determine whether gain of NRF2 function in A549 cells is critical for the maintenance of tumor phenotype, we used A549 cells stably expressing dox-ycycline-inducible shRNA targeting Nrf2. Cells were implanted into nude mice, and once tumor volume exceeded 50–60 mm3, doxycycline or vehicle was administered to tumor-bearing ani-mals. Doxycycline treatment resulted in significant inhibition of tumor growth in A549 cells expressing inducible Nrf2 shRNA relative to A549 tumors expressing empty vector (Figure 1A and Supplemental Figure 1; supplemental material available online with this article; doi:10.1172/JCI66353DS1). These data show that inactivation of Nrf2 in established tumors leads to the inhi-bition of tumor growth, and thus tumors harboring the Keap1 mutation depend on NRF2 for the maintenance of their trans-formed phenotype.
To determine whether NRF2 regulates the aberrant metabolic phenotype typical of cancer cells, we analyzed the glucose flux surrogate isotopomer profile for the PPP and TCA cycle using a [1,2-13C2]-D-glucose tracer (20). We incubated A549 control cells and NRF2-depleted cells (A549-Nrf2 shRNA) with 50% [1,2-13C2]-D-glucose–containing medium and then analyzed for glucose oxi-dation and metabolism as previously described (21–23). Figure 1B shows possible 13C labeling in intermediates of the PPP, lactate, and glutamate using [1,2-13C2] glucose as the single tracer. Glucose oxidation was determined by using the ratio of 13C/12C released as CO2 in the medium. Glucose is oxidized to CO2 via both the TCA cycle and the oxidative branch of the PPP. 13C-labeled CO2 in the medium decreased by 55% in A549-Nrf2 shRNA cells com-pared with the control cells, suggesting that glucose oxidation is dramatically enhanced after gain of NRF2 activity in cancer cells (Figure 1C and Supplemental Table 1).
Lactate, produced primarily via glycolysis, represents one by-product of glucose metabolism in metabolically active cancer cells (24). Direct [1,2-13C2]-D-glucose catabolism through anaerobic glycolysis results in labeling of lactate on 2 carbons, whereas pas-sage through the PPP (oxidative and then nonoxidative branch-es) results in lactate being labeled on a single carbon (Figure 1B and refs. 25–27). In our experiments, NRF2 knockdown in A549 cells led to a decrease of approximately 13% in total extracellular 13C-labeled lactate (Figure 1D). The majority of lactate in A549 control cells is derived directly via glycolysis (~87% of labeled lac-tate), and it did not vary between the control cells and A549-Nrf2 shRNA cells (data not shown). Although we expect a 25% theo-retical maximum of 13C labeling in media lactate from the 50% glucose tracer, we found greater than 35% of the lactates to be 13C labeled. The rapid conversion of the glucose tracer to unlabeled glyceraldehyde-3P by transketolase, before complete equilibra-tion of the glyceraldehyde-3P and dihydroxyacetone phosphate (DHAP) pools via triose phosphate isomerase, may increase the 13C-labeled lactate fraction over the 25% theoretical maximum, which may be an important marker of glyceraldehyde removal and rapid ribose synthesis via the nonoxidative branch of the pentose cycle. The levels of PPP-derived lactate were reduced by approxi-mately 45% in A549-Nrf2 shRNA cells as compared with those in the controls (Figure 1E). The reduction in PPP-derived lactate in the A549-Nrf2 shRNA cells is a strong indicator that glucose-6-de-hydrogenase (G6PD) flux is reduced (26).
Next, we examined 13C labeling of glutamate to determine the effect on carbon flux through the TCA cycle (28). Pyruvate enters the TCA cycle either as oxaloacetate (OAA), or more commonly
as acetyl coenzyme A (CoA), in reactions catalyzed by pyruvate carboxylase (PC) or the pyruvate dehydrogenase (PDH) com-plex, respectively. The relative contribution of these 2 pathways to labeled glutamate can be distinguished by using [1,2-13C2]-D-glucose and mass fragmentography as previously described (25, 29). The entry of OAA via PC will label the C2 and C3 positions of glutamate, and entry of acetyl CoA via PDH will label the C4 and C5 positions of glutamate (Figure 1B). NRF2 knockdown cells displayed a dramatic reduction (75%) in substrate entry (OAA and acetyl CoA) into the TCA cycle and in glutamate production (Fig-ure 1F and Supplemental Figure 2). The relative fluxes through the PDH and PC pathways were estimated from levels of m2 iso-topomers of the C2 to C4 and C2 to C5 fragments and 13C-label enrichment in the C2 to C5 fragment. Results show a decrease in TCA cycle flux and the anabolic use of acetate via citrate and α-ketoglutarate formation in A549-Nrf2 shRNA cells (Figure 1G, Supplemental Table 1, and ref. 30). The reduction in G6PD flux and TCA cycle flux suggests a decrease in glucose oxidation in NRF2 knockdown cells.
Incorporation of the 13C-labeled first carbon of glucose in cel-lular RNA allows an estimation of the relative contribution of the PPP’s oxidative steps to nucleic acid ribose synthesis (21). 13C-labeled RNA ribose incorporation from the glucose tracer was approximately 52% and 49.8% of the total pool in the A549 control cells and A549-Nrf2 shRNA cells, respectively (not signifi-cantly different) (Supplemental Figure 3). Approximately 50% of the ribose pool in the A549 cells was 13C labeled at 16 hours, imply-ing that the system had reached saturation, and newly synthesized ribose was converted rapidly into deoxyribose for DNA synthesis (21, 24, 27). In an effort to examine de novo ribose synthesis, we performed a short-term experiment in order to avoid saturation of newly synthesized labeled ribose. We cultured control and NRF2-depleted A549 cells in the presence of 14C glucose (0.3 μCi) and examined the incorporation of 14C glucose into the RNA ribose fraction. We found that 14C glucose incorporation into ribose was significantly reduced in NRF2-depleted A549 cells (Figure 1H). We confirmed a decrease in de novo ribose synthesis from glucose in DU145 cells with NRF2 knockdown, where knockdown of NRF2 led to a 30% decrease in 14C incorporation into ribose (Supplemen-tal Figure 4). Thus, gain of NRF2 function in cancer cells upregu-lates ribose synthesis to facilitate cell proliferation.
To determine whether NRF2-dependent glucose flux in cancer cells is modulated similarly in nontumorigenic mouse embry-onic fibroblast (MEF) cells, we analyzed metabolic flux by using [1,2-13C2] glucose–containing medium in WT, Nrf2–/–, and Keap1–/– (high Nrf2) MEFs. Glucose oxidation was significantly reduced in Nrf2–/– MEFs (Figure 1I). Keap1–/– MEF cells displayed a significant increase in substrate entry (OAA and acetyl CoA) into the TCA cycle. In contrast, substrate entry into the TCA cycle was reduced significantly in Nrf2–/– MEFs (Supplemen-tal Figure 5, A and B, and Supplemental Table 2). These data indicate that NRF2 regulates the flow of carbon through the TCA cycle. Analysis of carbon flux through the PPP revealed a 30% increase in 13C labeling of RNA ribose in Keap1–/– cells as compared with that in WT cells (Figure 1J). Unlike rapidly proliferating A549 cancer cells, 13C-labeled RNA ribose from the glucose tracer was approximately 24% of the total pool in non-tumorigenic WT MEF cells (data not shown), further implying a relatively slower rate of glucose metabolism and conversion into RNA ribose and nucleic acids in nontumorigenic cells.
Downloaded on September 16, 2013. The Journal of Clinical Investigation. More information at www.jci.org/articles/view/66353

research article
The Journal of Clinical Investigation http://www.jci.org Volume 123 Number 7 July 2013 2923
These study results highlight the ability of NRF2 to coordinately regulate metabolic flux leading to alterations in anabolic pathways that regulate cell growth.
Global gene expression profiling identifies a novel set of NRF2-dependent sig-nature genes involved in central glucose metabolism. To elucidate the mech-anisms by which NRF2 regulates glucose metabolism and tumori-genesis, we performed global gene expression profiling of A549 lung cancer cells with knockdown of NRF2. Gene networks associated with carbohydrate metabolism and drug metabolism were signifi-cantly downregulated in NRF2-depleted A549 cells (Supplemental Table 3). Gene set enrichment analysis revealed significant enrich-ment of genes associated with carbohydrate catabolic processes, posi-tive regulation of metabolic processes, the PPP, and arachidonic acid metabolism. In summary, this analysis revealed that NRF2 positive-
ly regulates the transcription of genes that play key roles in central carbon metabolism. Specifically, knockdown of NRF2 resulted in a coordinated decrease in the expression of several genes encoding key enzymes of the PPP, including glucose-6-phosphate dehydrogenase (G6PD), 6-phosphogluconate dehydrogenase (6PGD), transketolase (TKT), and transaldolase (TALDO1) (Figure 2A). In addition, the expression of important genes controlling carbon flux into the TCA cycle, fatty acid metabolism, and synthesis of nucleotides was also downregulated in the NRF2 knockdown cells (Figure 2A).
Using RT-PCR and immunoblotting, we confirmed that the expression of NRF2 and key PPP genes (G6PD, TKT, PGD, and TALDO1 mRNA) was reduced in A549 cells constitutively expressing Nrf2 shRNA compared with those expressing Luc shRNA (Figure 2, B and C). We further confirmed that NRF2 was regulating genes
Figure 1NRF2 reprograms glucose metabolism to promote tumor growth. (A) NRF2 activity is essential for the growth of KEAP1-deficient cancer cells. A549 (KEAP1G333C) cells stably transduced with doxycycline-inducible Nrf2 shRNA were implanted into nude mice. Two weeks after tumor implantation, mice were randomly allocated to 2 groups (n = 13–15 per group) and administered vehicle or doxycycline in the drinking water. Tumor volume was recorded. Data are presented as the mean tumor volume ± SEM. *P < 0.05 relative to the vehicle-treated group. (B) Possible 13C (red circles) labeling in the intermediates of the pentose cycle, lactate, and glutamate using [1,2-13C2] glucose as the single tracer. (C) Comparison of 13CO2 production by A549-Luc shRNA and A549-Nrf2 shRNA cultures. *P < 0.0000. (D) Decrease in 13C-labeled extracellular lactate in the culture medium from A549-Nrf2 shRNA cells. *P < 0.004. (E) Pentose cycle activity relative to glycolysis measured by m1/m2 ratios in lactate in the media. (F) Determination of C2-labeled through C5-labeled glutamate levels indicating substrate (OAA and acetyl CoA) entry into the TCA cycle. *P = 0.006 relative to the cells expressing Luc shRNA. (G) Reduced PDH flux in A549-Nrf2 shRNA cells indicating a significant decrease in the TCA cycle flux. *P < 0.0001 relative to cells expressing Luc shRNA. (H) Comparison of 14C-labeled RNA ribose fraction in Luc shRNA and Nrf2 shRNA cells. *P < 0.05. (I) Relative 13CO2 production by MEF cells. Keap1–/– cells demonstrated a significantly higher glucose oxidation rate. *P < 0.00 relative to WT. (J) Relative RNA ribose synthesis (mRNA and rRNA) through direct glucose oxidation and the nonoxidative steps of the pentose cycle in MEF cells. *P < 0.01 relative to WT.
Downloaded on September 16, 2013. The Journal of Clinical Investigation. More information at www.jci.org/articles/view/66353

research article
2924 The Journal of Clinical Investigation http://www.jci.org Volume 123 Number 7 July 2013
that control glucose metabolism in additional cancer cell lines. NRF2 activity is increased in the H1437 lung adenocarcinoma cell line due to microdeletion of the Keap1 genomic locus. The DU145 prostate cancer cell line has NRF2 gain of function owing to meth-ylation of the KEAP1 promoter (31). Similar to findings in the A549 cells, the expression of all 4 PPP genes was reduced in response to NRF2 depletion in H1437 and DU145 cells (Figure 2D and Supple-mental Figures 6 and 7). To confirm that the effect of gain of NRF2 on metabolic pathways was due to the loss of KEAP1, we knocked down KEAP1 or overexpressed NRF2 in the BEAS2B nontumori-genic lung epithelial cell line (Supplemental Figure 8). Knockdown of KEAP1 or ectopic expression of NRF2 in the nonmalignant lung epithelial cell line, BEAS2B, led to a significant increase in the expression of PPP genes (Supplemental Figure 8).
Similarly, NRF2-dependent expression of PPP genes was observed in A549 cells expressing doxycycline-inducible Nrf2 shRNA (Figure 2E). The oxidative branch of the PPP pathway generates NADPH, a crucial source of reducing equivalents for the synthesis of nucleic acid, fatty acid, and maintenance of cel-lular redox balance. Therefore, we wanted to determine whether an NRF2-mediated reduction in PPP genes affects NADPH produc-tion. We measured the levels of reduced NADPH and the NADPH/NADP+ ratio. The NRF2-dependent decreases in PPP gene expres-sion led to a dramatic reduction in NADPH levels as well as a reduction in the NADPH/NADP+ ratio (Figure 2, F and G). These data support the role of gain of NRF2 function in regulating the expression of genes involved in the PPP in different cell types and its potential effect on metabolic activity.
Figure 2Novel set of NRF2-dependent signature genes involved in central glucose metabolism. (A) Heat map showing metabolic genes significantly altered in response to NRF2 depletion or activation in A549 (KEAP1G333C) cells. Gene expression signatures were obtained from microarray analysis of A549 cells. Cells transfected with nontargeting siRNA (NS siRNA) and vehicle-treated samples (mock) were used as controls. (B) Real-time RT-PCR analysis of PPP genes in A549-Luc shRNA and A549-Nrf2 shRNA cells. *P < 0.05 relative to Luc shRNA. (C) Immunoblot showing relative levels of PPP enzymes in A549-Luc shRNA and A549-Nrf2 shRNA cells. (D) Real-time RT-PCR analysis of PPP genes in DU145-Luc shRNA and DU145-Nrf2 shRNA cells. *P < 0.05 relative to Luc shRNA. (E) Real-time RT-PCR analysis of NRF2 and PPP genes in vehicle- or doxycycline-treated inducible Nrf2 shRNA–expressing A549 cells. (F and G) Reduced levels of NADPH and a lower NADPH/NADP ratio in doxycycline-treated inducible Nrf2 shRNA–expressing A549 cells. Gene expression data are presented as the fold reduction in gene expression relative to the vehicle-treated group (set arbitrarily to 1). *P < 0.01 relative to the vehicle-treated group. (H) Lentiviral-mediated overexpression of G6PD or TKT in NRF2-depleted A549 cells dramatically increased the proliferation of A549-Nrf2 shRNA cells. *P < 0.01 relative to the GFP group.
Downloaded on September 16, 2013. The Journal of Clinical Investigation. More information at www.jci.org/articles/view/66353

research article
The Journal of Clinical Investigation http://www.jci.org Volume 123 Number 7 July 2013 2925
Finally, to demonstrate that reduced proliferation of NRF2-defi-cient cells is primarily due to the decreased expression of PPP genes, we overexpressed G6PD and TKT in A549-Nrf2 shRNA cells and mea-sured cell proliferation. Ectopic expression of G6PD or TKT expres-sion in NRF2-depleted cells (A549-Nrf2 shRNA) enhanced prolif-eration of these cells as compared with proliferation of the empty vector A549-Nrf2 shRNA cells (Figure 2H). Conversely, RNAi-based knockdown of G6PD and TKT expression in A549 cells significantly inhibited the growth of A549 parent cells (Supplemental Figure 9).
In MEF cells, high NRF2 activity led to increased expression of key PPP enzymes such as G6PD, TKT, PGD, and TALDO1, as well as NADPH levels (Supplemental Figures 10 And 11). In con-trast, G6pd and Pgd mRNA expression was significantly reduced in Nrf2–/– MEFs. Steady-state distribution of mononucleotides and glutathione (GSH) measured using mass spectrometry–based
metabolomics revealed higher concentrations of mononucleotides (adenosine monophosphate, cytidine monophosphate, and uridine monophosphate) and GSH levels as well as a higher GSH/GSSG (glutathione disulfide) ratio in the Keap1–/– cells than were found in the WT cells (Supplemental Figures 12 and 13). Finally, attenuation of NRF2 expression in Keap1–/– MEF cells led to a dramatic reduction in the expression of PPP genes, confirming that metabolic changes in Keap1–/– MEF cells are NRF2 dependent (Supplemental Figure 14). In summary, the study results highlight the ability of NRF2 to coordinately regulate the expression of metabolic genes, thus directly modulating carbon flux through key metabolic pathways.
miRNAs, miR-1, and miR-206 regulate the expression of meta-bolic genes. Global mapping of NRF2 binding sites using ChIP sequencing technology identified greater than 500 basal and inducible direct transcriptional targets of NRF2 in Keap1–/– MEF
Figure 3miR-1 and miR-206 miRNA target G6PD, PGD, TKT, and GPD2 in cancer cells and non-neoplastic fibroblast cells. (A) Sequence alignment showing the relative position of the miRNA binding site in the 3′UTR of each gene. (B) Expression of miR-1 and miR-206 decreases luciferase reporter gene activity in A549 cells when linked to the targeted segment of the 3′UTR of G6PD, PGD, TKT, and GPD2. Nonspecific control miR (NS miR) is a nontargeting control miRNA mimic. (C) Relative mRNA levels of G6PD, TKT, PGD, and GPD2 in A549 cells during expression of miR-1 and miR-206 as compared with those in cells expressing control miRNA. (D) Immunoblot analysis and (E) densitometric quantification showing relative protein levels of G6PD, TKT, PGD, and GPD2 in A549 cells during expression of miR-1 and miR-206 or control miRNA. (F) Relative levels of G6PD, TKT, PGD, and GPD2 in H1437 cells during expression of miR-1 and miR-206 as compared with those in the cells expressing nontargeting NS miRNA. Cotransfection of corresponding AMO along with precursor miRNA significantly blocks the action of miR-1 and miR-206. *P < 0.05 relative to the NS miR group.
Downloaded on September 16, 2013. The Journal of Clinical Investigation. More information at www.jci.org/articles/view/66353

research article
2926 The Journal of Clinical Investigation http://www.jci.org Volume 123 Number 7 July 2013
cells (2). In addition to classic targets like Nqo1, we detected NRF2 binding adjacent to the G6pd, Tkt, Pdg, and Taldo1 loci (Supplemental Table 4). However, with the exception of Taldo1, NRF2 binding sites on the other metabolic genes are located at greater than 3 kb from the transcription start site (TSS). We also analyzed the promoters of human homologs of these metabolic genes, since the human genome is well annotated. Detailed in silico analysis of the G6PD genomic locus revealed 4 potential NRF2 binding sites (antioxidant response elements, ARE) (32) within approximately 3 kb of the 5′ upstream promoter region. Targeted promoter deletion assays revealed that ARE sequences located in the G6PD promoter are not functional (Supplemental Figure 15, A and B), and thus G6PD does not seem to be a direct transcriptional target of NRF2. Similarly, the 2 putative NRF2 binding sites at the TKT locus do not appear to be strong candi-dates, as one of the ARE is located in an intron and the second one is at greater than 10 kb upstream of the TSS (Supplemental Table 4). Unlike G6PD, TKT, and PGD, the NRF2 binding site (ARE) at the TALDO1 locus appears to be functional, since it is located at less than 1 kb from the TSS within an intron (2). Simi-lar to our findings with MEF cells (2), a recent study focused on identifying NRF2-regulated genes in human lymphoblastoid cells observed direct binding of NRF2 to the ARE sequence at the TALDO1 locus (994 bp from the TSS) (33). Thus, TALDO1 appears to be a direct transcriptional target of NRF2. Since all of the classical NRF2 target genes are similarly regulated in human
and murine model systems, and binding sites are located close to the TSS (1), it appears that although G6PD, PGD, and TKT are expressed in an NRF2-dependent manner, they are not direct transcriptional targets of NRF2.
There is increasing realization that miRNAs are important reg-ulators of tumorigenesis. Since miRNAs primarily mediate their biological function by impeding the expression of target genes, we searched 3 databases (TargetScan, miRBase, and PicTar) for miRNAs that may bind to the 3’ untranslated region (UTR) of NRF2 target genes associated with carbohydrate metabolism. We found that miR-1 and miR-206 miRNAs target 3 key genes of the PPP and 1 gene associated with carbohydrate/lipid metabo-lism — glycerol-3-phosphate dehydrogenase (GPD2) (Figure 3A). GPD2 serves as a major link between carbohydrate metabolism and lipid metabolism and catalyzes the reversible oxidation of glycerol-3-phosphate to dihydroxyacetone phosphate. miR-1 and its identical paralog, miR-206, differ from each other by only 3 nucleotides, all outside the seed sequence, meaning that they bind to the same seed sequence. G6PD, which harbors 2 con-served miR-1 and miR-206 sites, was recently shown to be a target of miR-1 in muscle cells (34). Two miRNA binding sites in the 3′UTR of G6PD and a single miRNA binding site in TKDT, PGD, and GPD2 are predicted to be recognized by miR-1 and miR-206, and these binding sites are conserved across mammalian species (Supplemental Figure 16).
To validate G6PD, TKT, PGD, and GPD2 as bonafide targets of miR-1 and miR-206, we cloned the predicted target region (includ-ing the seed sequence) within each gene’s 3′UTR downstream of a firefly luciferase gene and analyzed the reporter activity. Trans-fection of miR-1 and miR-206 precursors repressed the luciferase activity of all 4 predicted targets (Figure 3B). Ectopic expression of miR-1 or miR-206 decreased the relative mRNA and protein levels of PPP genes and GPD2 (Figure 3, C–E). To verify the specificity of interaction between miR-1 and miR-206 and their targets, we used an miRNA inhibitor (anti-miR oligo [AMO]) to block miR-1 and miR-206 action specifically. The reduction in endogenous tran-script levels of G6PD, TKT, PGD, and GPD2 in response to miR-1 and miR-206 transfection is rescued when the specific miR inhibi-tor is cotransfected along with the miR-1 or miR-206 precursor miR (Supplemental Figure 17). These findings were validated in additional human cancer cells, H1437, DU145, and nonmalig-
Figure 4Gain of NRF2 function in lung cancer upregulates the expression of PPP genes by suppressing the expression of miR-1 and miR-206. (A and B) Increased expression of miR-1 in NRF2-deficient A549-Nrf2 shRNA and DU145-Nrf2 shRNA cells compared with that in the Luc shRNA control group. *P < 0.05 relative to Luc shRNA. (C and D) Increased expression of PPP genes in A549-Nrf2 shRNA and DU145-Nrf2 shRNA cells expressing anti–miR-1. Cells stably expressing empty vector were used as the baseline control to calculate the fold change. *P ≤ 0.01 relative to the cells expressing empty vector. (E) Increased expression of miR-1 decreases luciferase reporter gene activity asso-ciated with the 3′UTR of G6PD, PGD, TKT, and GPD2 in DU145-Nrf2 shRNA cells. The 3′UTR-containing reporter plasmids and pGLO empty vector were transfected into DU145 parent and Nrf2 shRNA cells, and the extracts were analyzed for luciferase activity. Firefly lucif-erase activity was normalized to Renilla luciferase activity. *P ≤ 0.01 relative to the parent cell line. (F) Increased expression of miR-206 in Nrf2–/– MEF cells and reduced expression of miR-206 in Keap1–/– MEF cells. *P ≤ 0.01 relative to WT cells.
Downloaded on September 16, 2013. The Journal of Clinical Investigation. More information at www.jci.org/articles/view/66353

research article
The Journal of Clinical Investigation http://www.jci.org Volume 123 Number 7 July 2013 2927
nant MEFs (Figure 3F and Supplemental Figure 17). In summary, these results suggest that G6PD, TKT, PGD, and GPD2 are genuine endogenous targets of miR-1 and miR-206 in both malignant and nonmalignant epithelial cells.
Gain of NRF2 function upregulates the expression of metabolic genes by attenuating the expression of miR-1 and miR-206 miRNA. To determine whether NRF2 regulates the expression of miR-1 and miR-206, we measured the relative expression of mature miR-1 and miR-206 in A549-Luc shRNA and A549-Nrf2 shRNA cells by using real-time RT-PCR. A549-Nrf2 shRNA cells, which expressed reduced levels of PPP genes (Figure 2B), expressed significantly higher levels of mature miR-1 (Figure 2, B and C, and Figure 4A). Similarly to lung cancer cells, DU145 prostate cancer cells with knockdown of NRF2 expressed higher levels of miR-1 (Figure 4B). Most cell lines expressed either miR-1 or miR-206, suggesting cell-type
specificity, with miR-1 being expressed predominantly in epi-thelial cells. To demonstrate the specificity of miR-1 in regulat-ing the expression of PPP genes, we overexpressed anti-miR-1 in A549-Nrf2 shRNA and DU145-Nrf2 shRNA cells and measured gene expression (Figure 4, C and D). Expression of anti-miR-1 significantly attenuated the activity of miR-1 and upregulated the mRNA expression of miR-1 target genes in A549-Nrf2 shRNA and DU145-Nrf2 shRNA cells. To demonstrate that decreased expression of PPP genes in NRF2-depleted cells is due to increased expression of miR-1, we transfected the 3′UTR reporter plasmids for G6PD, TKT, PGD, and GPD2 (containing the seed sequence for miR-1 and miR-206) into DU145 cells (parent and Nrf2 shRNA) and analyzed cell extracts for luciferase activity. Elevated expres-sion of miR-1 in DU145-Nrf2 shRNA cells repressed the luciferase activity of all 4 predicted targets (Figure 4E).
Figure 5Ectopic expression of miR-1 and miR-206 miRNAs inhibits PPP activity and reduces cell proliferation. (A–D) Total NADPH and the NADPH/NADP ratio in A549 cells and H1437 cells transfected with nonspecific miRNA miR-1 and miR-206. Relative levels of NADPH and the NADPH/NADP ratio were measured 72 hours after transfection. (E and F) Incorporation of 14C glucose into RNA ribose in A549 and H1437 cells. Cells were incubated with 14C glucose for 14 to 16 hours and lysed, and total 14C glucose incorporation into ribose was quantified. (G and H) Effect of miR-1 and miR-206 on proliferation of A549 and H1437 cells. Seventy-two hours after transfection, the cells were replated and exposed to BrdU for 4 hours, and incorporation was quantified calorimetrically. (I) Average change in tumor volume (n = 6; mean ± SEM) with time in nude mice injected with NS-miR, miR-1, and miR-206–transfected H1437 cells. *P < 0.05 relative to the NS miR group.
Downloaded on September 16, 2013. The Journal of Clinical Investigation. More information at www.jci.org/articles/view/66353
research article
2928 The Journal of Clinical Investigation http://www.jci.org Volume 123 Number 7 July 2013
We also examined the expression of the miRs in the gain- and loss-of-function MEFs. miR-1 expression was not detected in the MEF cells (data not shown). However, miR-206 was expressed in the WT MEFs. miR-206 expression was induced 3-fold in the Nrf2–/– MEFs as compared with the WT cells (Figure 4F). In contrast, in Keap1–/– MEFs, miR-206 expression was significantly reduced. We also examined the effect of increased NRF2 in BEAS2B cells, a non-malignant lung epithelial cell line, and found that ectopic expres-sion of NRF2 or knockdown of KEAP1 significantly reduced the expression of miR-1 in these cells (Supplemental Figure 18).
Next, we measured the primary transcript levels of miR-1 and miR-206 to determine whether NRF2 affects the transcription of miR-1 and miR- 206. Studies by Liu et al. revealed that miR-1-1 and miR-1-2 loci (at 18q11 and 20q13) share a common architecture of regulatory elements and generate identical mature miR sequences for miR-1 (35). A549 and DU145 cells expressing Nrf2 shRNA exhibited elevated levels of miR-1-2 primary transcripts (Supple-mental Figure 19, A and B). Similarly, miR-206 primary transcripts were significantly upregulated in Nrf2–/– MEF cells (Supplemental Figure 19, C and D). Collectively, these results suggest that gain of NRF2 function directly or indirectly suppresses miR-1 and miR-206 transcription in both neoplastic and non-neoplastic cells.
miR-1 and miR-206 miRNAs attenuate PPP-dependent NADPH produc-tion and ribose synthesis and inhibit tumor cell growth. One key role of the oxidative branch of the PPP is to produce NADPH for macromolecule biosynthesis. Therefore, we examined NADPH levels in non–small cell
lung cancer (NSCLC) cells after overexpression of miR-1 and miR-206. Ectopic expression of miR-1 or miR-206 led to a significant reduction in NADPH levels, as well as a decrease in the NADPH/NADP+ ratio in A549 and H1437 cells (Figure 5, A–D). To determine whether these miRNAs are affecting nucleic acid synthesis, we incubated NSCLC cells ectopically expressing miR-1 or miR-206 with 14C glucose. We observed a significant decrease in the amount of 14C glucose incorpo-rated into RNA in cells expressing miR-1 and miR-206 as compared with findings in the control NS miR group in KEAP1-deficient A549 and H1437 cells (Figure 5, E and F). Along with the data from Figure 3, these data show that miR-1 and miR-206 inhibit the production of nucleotide precursors by inhibiting the expression of PPP genes.
We next wanted to determine the effect of miR-1 and miR-206 overexpression on cell proliferation by using a 5-bromo-2′-deoxyuridine (BrdU) proliferation assay. Ectopic expression of miR-1 and miR-206 significantly reduced the proliferation of A549 and H1437 cells, as demonstrated by reduced BrdU label-ing (Figure 5, G and H). Expression of miR-1 also dramatically reduced cell proliferation in DU145 cells (Supplemental Figure 20). To demonstrate the specificity of miR-1, we cotransfected miR-1 alone or in the presence of an miR-1 inhibitor (anti–miR-1 oligonucleotide). The AMO against miR1 significantly rescued the effect of miR-1 on proliferation in A549, H1437, and DU145 cells (Supplemental Figure 20). Finally, to delineate the role of miR-1 and miR-206 in tumor growth in vivo, we per-formed xenograft experiments in which H1437 cells transfected
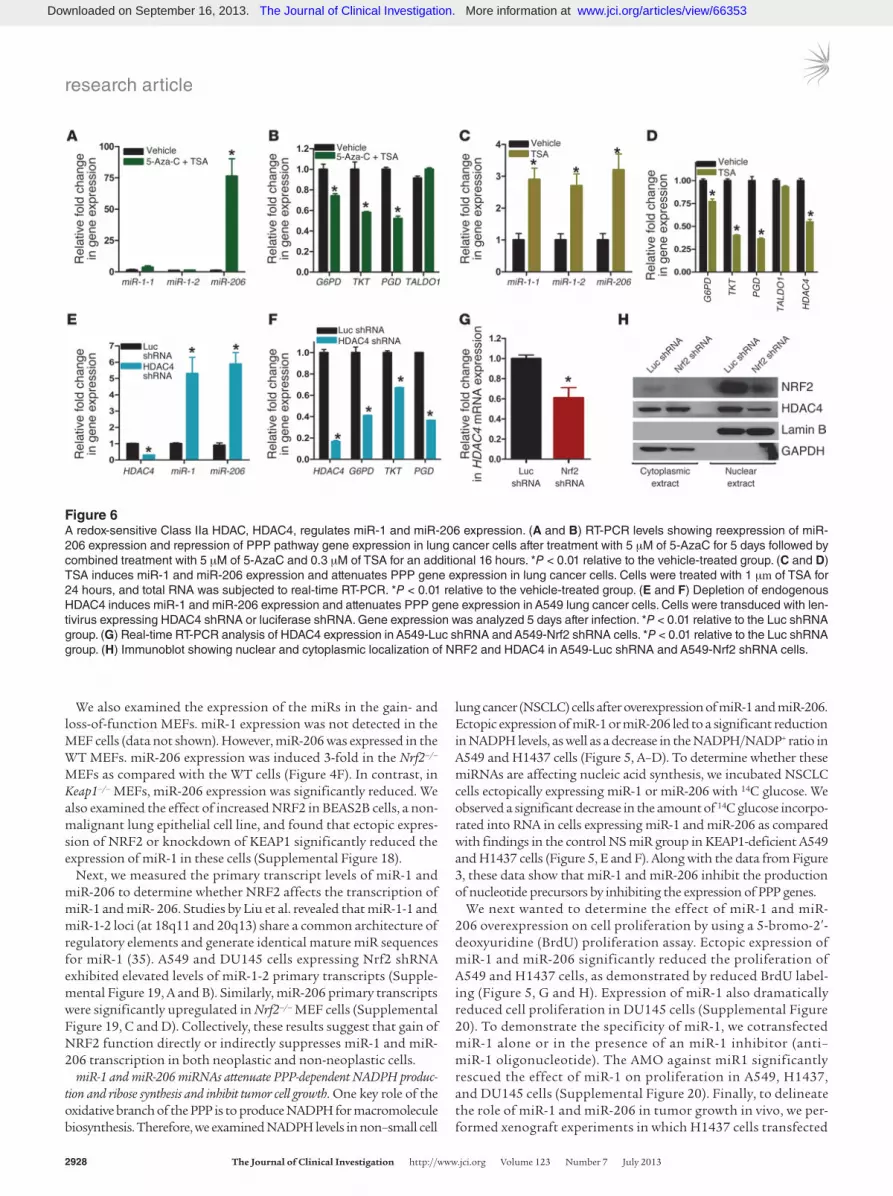
Figure 6A redox-sensitive Class IIa HDAC, HDAC4, regulates miR-1 and miR-206 expression. (A and B) RT-PCR levels showing reexpression of miR-206 expression and repression of PPP pathway gene expression in lung cancer cells after treatment with 5 μM of 5-AzaC for 5 days followed by combined treatment with 5 μM of 5-AzaC and 0.3 μM of TSA for an additional 16 hours. *P < 0.01 relative to the vehicle-treated group. (C and D) TSA induces miR-1 and miR-206 expression and attenuates PPP gene expression in lung cancer cells. Cells were treated with 1 μm of TSA for 24 hours, and total RNA was subjected to real-time RT-PCR. *P < 0.01 relative to the vehicle-treated group. (E and F) Depletion of endogenous HDAC4 induces miR-1 and miR-206 expression and attenuates PPP gene expression in A549 lung cancer cells. Cells were transduced with len-tivirus expressing HDAC4 shRNA or luciferase shRNA. Gene expression was analyzed 5 days after infection. *P < 0.01 relative to the Luc shRNA group. (G) Real-time RT-PCR analysis of HDAC4 expression in A549-Luc shRNA and A549-Nrf2 shRNA cells. *P < 0.01 relative to the Luc shRNA group. (H) Immunoblot showing nuclear and cytoplasmic localization of NRF2 and HDAC4 in A549-Luc shRNA and A549-Nrf2 shRNA cells.
Downloaded on September 16, 2013. The Journal of Clinical Investigation. More information at www.jci.org/articles/view/66353

research article
The Journal of Clinical Investigation http://www.jci.org Volume 123 Number 7 July 2013 2929
with control NS miR, miR-1, or miR-206 were implanted sub-cutaneously into nude mice. Overexpression of miR-1 or miR-206 in lung cancer cells significantly inhibited tumor growth (Figure 5I). Overall, these data support a central role for miR-1 and miR-206 in regulating the activity of the PPP and tumor suppression in vivo.
A regulatory feedback loop involving NRF2, miR-1, miR-206, and HDAC4 controls metabolic gene expression. Next, we examined the mechanism underlying NRF2-dependent expression of miR-1 and miR-206. Recent studies have demonstrated that the miR-1 and miR-206 promoter is regulated by methylation and acety-lation in cancer (36, 37). In the course of investigating the epi-genetic regulation of miR-1 and miR-206 promoter silencing, we observed that the combined treatment with demethylating agent (5-Azacytidine, 5-Aza-C) and inhibitors of HDAC (tricho-statin [TSA]) synergistically and robustly activate the miR-206 promoter in A549 cells, but had a modest effect on miR-1-1 and
miR-1-2 expression (Figure 6A). We detected a significant reduc-tion in mRNA expression of the PPP genes (G6PD, PGD, TKT), but no change in TALDO1 mRNA in 5-AzaC plus TSA-treated lung cancer cells (Figure 6B). TSA alone significantly upregulated the expression of miR-1 and miR-206, although the induction of miR-206 was more dramatic in response to 5-AzaC plus TSA (Fig-ure 6, C and D). These results suggest that DNA methylation of CpG islands and hypoacetylation of the miR-206 promoter play a causal role in the suppression of miR-206 expression in lung cancer cells. On the contrary, expression of the miR-1 promoter is primarily regulated by hypoacetylation in lung cancer cells. In prostate cancer cells, combined treatment with 5-AzaC plus TSA reactivated the expression of miR-206 and miR-1, although treat-ment with TSA alone had a reduced effect, suggesting that cyto-sine methylation and hypoacetylation of the miR promoter are associated with the observed transcriptional repression of miR-1 and miR-206 (Supplemental Figure 21).
Figure 7NRF2-dependent signaling predicts survival in human NSCLC. (A and B) miR-1 and miR-206 levels are reduced in primary lung tumors. Real-time RT-PCR–based analysis of mature miR-1 and miR-206 in primary lung adenocarcinoma tumors and pair-matched nonmalignant lung tissues. (C–E) Expression of miR-1 and miR-206 targets G6PD, TKT, and GPD2 is elevated in the primary lung adenocarcinoma tumors as compared with that in the pair-matched control tissues. (F–L) Kaplan-Meier analysis of the Director’s Challenge Consortium dataset of human lung tumors showing upregulation of (F–H) NRF2 signaling and (I–L) metabolic genes and its association with overall survival. RFC, relative fold change.
Downloaded on September 16, 2013. The Journal of Clinical Investigation. More information at www.jci.org/articles/view/66353

research article
2930 The Journal of Clinical Investigation http://www.jci.org Volume 123 Number 7 July 2013
miR-1 and miR-206 specifically target histone deacetylase 4 (HDAC4), a Class IIa HDAC, leading to a reduced expression of this deacetylase (38). To determine whether the HDAC4 repressor complex controls the activity of the miR-1 and miR-206 promot-ers (39, 40) and whether selective inhibition of HDAC4 can alter the expression of miR and the downstream metabolic genes, we inhibited HDAC4 expression using an RNAi approach and ana-lyzed gene expression. Short hairpin–mediated HDAC4 knock-down led to a significant increase in miR-1 and miR-206 expres-sion that correlated with a reduction in PPP gene expression
(Figure 6, E and F). In support of our hypothesis, we found that HDAC4 mRNA and HDAC4 protein are significantly downregu-lated in NRF2-deficient A549 cells (Figure 6G and Supplemental Figures 21 and 22). Furthermore, reduced nuclear localization of HDAC4 in the absence of NRF2 (Nrf2 shRNA cells) (15) suggests an increased HDAC4 protein oxidation and nuclear export (41), thus leading to enhanced miR-1 and miR-206 expression (Figure 6H and Supplemental Figure 22). Taken together, our data sug-gest that a regulatory feedback loop involving miR-1/miR-206 and HDAC4 regulates PPP activity.
Figure 8An autoregulatory loop involving NRF2, HDAC4, and miR-1/206 regulates glucose metabolism. (A) A genetic model showing NRF2-dependent regulation of meta-bolic gene expression. The effect of NRF2 on glucose metabolism is partly mediated via miR-1 and miR-206. A redox-sensitive HDAC, HDAC4, regulates the transcription of miR-1 and miR-206. HDAC4, with cysteines in a reduced state, accumulates in the nucleus and suppresses miR-1 and miR-206 gene expression. Oxidation of cys-teines in HDAC4 results in nuclear export and induces the expression of miR-1 and miR-206. (B) A549 cells harboring a KEAP1 mutation show increased glucose oxidation in the pentose cycle, with increased nucleic acid synthesis, high TCA cycle flux, and de novo fatty acid synthesis. Inhibition of NRF2 activ-ity in KEAP1-deficient A549 cells decreases glucose oxidation in the pentose cycle, with low TCA cycle flux and de novo fatty acid synthe-sis. Solid arrows indicate activa-tion, and hollow allows indicate inhibition. G6P, glucose-6-P; 3PG, 3-phosphoglyceric acid; Pyr, pyru-vate; Lac, lactate.
Downloaded on September 16, 2013. The Journal of Clinical Investigation. More information at www.jci.org/articles/view/66353

research article
The Journal of Clinical Investigation http://www.jci.org Volume 123 Number 7 July 2013 2931
Association between NRF2 classic and metabolic target gene expression and survival in lung adenocarcinoma. We next investigated whether there is a relationship between the expression of classic NRF2 tar-get genes, NQO1 and GCLM, and PPP target genes and the levels of miR-1 and miR-206 in NSCLC. Since NRF2 and KEAP1 activity are regulated posttranscriptionally, we did not analyze the expres-sion of NRF2 and KEAP1. We used RT-PCR to measure mature miR-1 and miR-206 levels and mRNA expression of NQO1, GCLM, G6PD, TKT, PGD, and GPD2 in 9 pairs of primary lung adenocarci-noma tumors and adjacent normal tissues. Gene expression anal-yses showed that miR-1 and miR-206 expression is significantly downregulated in lung adenocarcinoma tumors relative to that in matched adjacent nonmalignant lung tissues (Figure 7, A and B). Transcript levels of classic NRF2-dependent antioxidant genes NQO1 and GCLM (Supplemental Figure 23), as well as metabolic genes G6PD (P = 0.04), TKT (P = 0.04), and GPD2 (P = 0.005) were significantly higher in primary tumor tissues than in the corre-sponding normal bronchi (Figure 7, C–E). Although the expres-sion of PGD was higher in adenocarcinoma tissues, this difference did not reach statistical significance (P = 0.32). Representative data clearly demonstrate a substantial increase in the expression of PPP genes in lung adenocarcinoma. Thus, downregulation of miR-1 and miR-206 is probably one mechanism by which metabolic tar-gets of miR-1 and miR-206 are upregulated in lung cancer.
Results from recent studies have shown an inverse relation-ship between NRF2 and survival (18, 19). Considering the role of G6PD and TKT in mediating the effects of NRF2 on cell growth, we examined several datasets for mRNA expression of classic NRF2-dependent genes (as indicators of NRF2 activity), the metabolic PPP genes regulated by NRF2, and overall sur-vival associated with increased NRF2 signaling. Patients with higher expression of NRF2-dependent GSH biosynthesis, recy-cling enzymes (GCLM and GSR), and NQO1 demonstrated a significant reduction in survival compared with that in patients with low expression of the NRF2 targets (Figure 7, F–H, and Supplemental Table 5). Coupled with our recent data showing that NRF2 signaling in NSCLC is elevated, these study results highlight the association between increased NRF2 activity and reduced survival. Along with elevated expression of classic NRF2 target genes, greater expression of PPP genes was associated with the worst survival outcome (Figure 7, I–L). The branch point gene encoding the enzyme in glycolysis was also associated with poor outcome. Therefore, the ability of NRF2 to regulate not only its classic target genes, but these metabolic genes as well, is a critical node in patient survival.
DiscussionMetabolic reprogramming in cancer cells is extensive and, in addi-tion to the aerobic glycolysis noted by Warburg, includes altera-tions in the PPP and fatty acid synthesis pathways (28, 42, 43). In just the past decade, investigators have begun to understand the molecular and transcriptional mechanisms responsible for this reprogramming. Our study results now demonstrate an important and previously unrecognized role for the NRF2 transcription factor in regulating the metabolic flux of cancer cells through the control of key genes associated with the PPP, the TCA cycle, and fatty acid synthesis through its action on specific miRNA expression. Gain of NRF2 function in cancer cells causes an attenuated expression of the miRNAs, miR-1 and miR-206, which in turn target a number of metabolic genes involved in tumor growth. Our findings dem-
onstrate what we believe to be a novel link between redox-sensi-tive transcription and the posttranscriptional regulators, NRF2, HDAC4, and miR-1/miR-206 and identify NRF2 as a key regula-tor of multiple metabolic pathways responsible for aberrant cell growth and tumorigenesis.
In addition to this novel role in regulating miR-dependent cellu-lar metabolism to promote tumor growth, NRF2 is well recognized to regulate genes involved in cellular antioxidant defense systems, thus protecting cells from excessive ROS damage to macromol-ecules and their consequent senescence and apoptosis. Specifically, NRF2 regulates genes involved in 2 major redox systems: the GSH and the thioredoxin (TRX) systems. Enzymes involved in GSH syn-thesis (GCLC, GCLM, and GSS), members of the GSH reductase and peroxidase family (GSR, GPX2, and GPX3), and genes that constitute the TXN systems (TRXR1 and PRX1) are all established NRF2-dependent genes. Furthermore, the NRF2-dependent PPP enzymes, G6PD and PGD, play important roles in maintaining the cellular redox balance by replenishing the NADPH required by GSR and TRXR1 for maintenance of the pool of GSH and TRX. The net effect of NRF2-regulated production of NADPH via this pathway was confirmed by our observed NRF2-dependent changes in GSH/GSSG ratios in cancer cells and MEFs.
Beyond redox homeostasis, NRF2 regulates the generation of precursors for nucleic acid and amino acid biosynthesis, as well as the production of NADPH, which is also essential for the bio-synthesis of nucleic acids and lipids required for cell growth and proliferation. Results of a recent study demonstrated that activa-tion of G6PD causes increased PPP activity, resulting in a parallel increase in the deoxyribonucleotide triphosphate (dNTP) pool (44), subject to regulation by the activity of ribonucleotide reductase, an enzyme dependent on NADPH for its activity. When ribose synthe-sis was measured as a function of PPP activity in the present study, we observed reduced 13C-labeled RNA ribose, 14C-labeled ribose, mononucleotides, and NADPH in NRF2-depleted cells, all in con-sonance with reduced in vivo proliferation of NRF2-knockdown cells (15, 45). Furthermore, lactate derived via the PPP showed a substantial decrease in NRF2 knockdown A549 cells, suggesting a direct link between NRF2 and PPP activity. Additional evidence that NRF2 regulates the PPP came from transcriptional profiling data, which showed that NRF2 knockdown in cancer cells led to a significant decrease in the expression of several genes associated with the PPP, including G6PD, PGD, TKT, and TALDO1. We con-clude, therefore, that an NRF2-mediated metabolic shift provides cancer cells with building blocks for RNA and DNA synthesis, as well as NADPH, all of which are necessary to maintain a high rate of proliferation (1, 3, 46, 47).
The TCA cycle functions as a node for the biosynthesis of lipids and proteins (28, 42, 43), and in proliferating cells, most carbon entering the TCA cycle is used for biosynthetic pathways, result-ing in the continuous efflux of intermediates from the TCA cycle (cataplerosis) and the synthesis of lipids (48). Decreasing NADPH production via the PPP results in fewer reducing equivalents for fatty acid synthesis, as well as dramatically decreased levels of ace-tyl CoA, the building block of fatty acids. Therefore, it appears that increased NRF2 activity in cancer cells results in enhanced glucose flux through the TCA cycle, leading to acetyl CoA production, which, along with NADPH, contributes to increased macromole-cule biosynthesis (Figure 8). Taken together, our data demonstrate that NRF2 can regulate the expression of several metabolic genes that play an important role in cancer metabolism.
Downloaded on September 16, 2013. The Journal of Clinical Investigation. More information at www.jci.org/articles/view/66353

research article
2932 The Journal of Clinical Investigation http://www.jci.org Volume 123 Number 7 July 2013
The role of NRF2 in cancer is now well established, based large-ly on findings by us and others that KEAP1 is frequently inac-tivated by mutation in lung cancers, leading to corresponding increases in NRF2 signaling. Activating mutations in NRF2 have also been reported in some cancers (6, 53). The importance of NRF2 activation in tumor cells was demonstrated by knockdown of NRF2, which leads to growth inhibition and increased sensi-tivity to a number of chemotherapeutic drugs (15, 16), explain-ing why increased NRF2 expression in lung and ovarian tumors is associated with resistance to platinum-based drug treatment and poor outcome (18, 19). Extending our present findings to determine how NRF2 and miR-1 and miR-206 expression are related in lung tumors, we measured the expression of NRF2-dependent genes, PPP genes, and miRNA in lung adenocarci-noma tumors and adjacent non-neoplastic tissues. We detected significant upregulation of NRF2-dependent antioxidant genes and metabolic genes and a significant reduction in miR-1 and miR-206 expression in lung tumors compared with those in the nonmalignant lung tissues, and high expression of NRF2-depen-dent antioxidant and metabolic genes is associated with reduced survival in patients with lung adenocarcinoma. Future studies will help to clarify whether an NRF2-dependent increase in PPP activity and corresponding metabolic shifts in lung tumors pro-mote cancer growth and therapeutic resistance.
Together, our findings point to NRF2 as a key regulator of meta-bolic reprogramming in cancer cells, with an overarching effect on glutathione biosynthesis and recycling, NADP and NADPH cycling, and PPP activation (to generate metabolites for nucleic acid and amino acid synthesis). All of these metabolic pathways regulated by NRF2 are essential for maintaining cellular redox and promoting tumor growth. Future studies directed toward under-standing the crosstalk of NRF2-KEAP1 signaling with other onco-genic pathways known to modulate glucose metabolism will help to determine whether NRF2-KEAP1 signaling should be consid-ered a new Achilles’ heel of cancer and can be targeted to improve therapeutic outcome in patients with cancer.
MethodsCell culture. A549, H1437, BEAS2B, and DU145 cells were purchased from ATCC and were cultured under the recommended conditions. A549 and DU145 cells stably expressing luciferase shRNA and Nrf2 shRNA were generated as described previously (15). WT, Keap1–/–, and Nrf2–/– knockout MEF cell lines were generated as described previously (54). MEF cells were cultured in Iscove’s modified Dulbecco medium (Invitrogen) containing 10% FBS and 1% penicillin-streptomycin. For all experiments, frozen stocks of cells were revived and cultured for 3 generations before use. Only low-passage cells were used for the assays.
Transcriptional profiling using oligonucleotide microarrays and data analysis. We identified an siRNA sequence that permitted potent and selective silencing of the human NRF2 coding sequence (5). We downregulated NRF2 expres-sion in A549 cells using siRNA (Dharmacon, Thermo Fisher Scientific) and performed global gene expression profiling with Affymetrix GeneChips U133 Plus 2.0 Human arrays. A nontargeting siRNA (luciferase siRNA) and vehicle-treated samples were used as controls. The RNA from A549 cells was used for gene expression profiling with Human Genome U133 Plus 2.0 arrays (Affymetrix) according to procedures described previously (3, 55). Background correction and data normalization were performed using the Robust Multiarray Analysis method (56). We used the affy soft-ware package within Bioconductor (www. bioconductor.org). The pathway was analyzed with Ingenuity Systems tools (www.ingenuity.com). Gene set
We also investigated how NRF2 coordinates the regulation of these key metabolic pathways. Global mapping of NRF2 bind-ing sites in Keap1–/– MEFs and human lymphoblastoid cell lines identified a strong NRF2 binding site at the TALDO1 locus (<1 kb from the TSS), within an intron (2, 49). However, NRF2 binding to the G6PD and PGD loci was not validated in the human lymphoblastoid cell line (49). Last, the NRF2 binding site in the human and murine TKT loci was located at greater than 14 kb upstream of the TSS, suggesting that PPP genes (G6PD, TKT, and PGD) are not direct transcriptional targets of NRF2 (2, 49). Remarkably, we found that PPP activity is regu-lated by miRNAs miR-1 and miR-206, and that NRF2 upregu-lates the expression of PPP enzymes by attenuating the expres-sion of these 2 miRNA species. Investigators in previous studies identified several mechanisms for the cellular regulation of these miRNA species, including epigenetic regulation of miR-1 in lung, prostate, and hepatocellular carcinoma and regulation of miR-206 by nuclear transcription factors, including nuclear receptor subfamily 0, group B member 2, estrogen-related recep-tor γ, yin-yang 1, and activator protein 1 (37, 50). It has been reported that miR-1 expression is downregulated in different types of cancers, including lung, prostate, colon, and hepatocel-lular carcinoma, highlighting its oncosuppressive function. The expression of miR-206 is downregulated in breast cancer (51, 52). In this study, we show that NRF2-dependent miRs, miR-1, and miR-206 play important roles in glucose metabolism by modulating the expression of key rate-limiting enzymes of the PPP, and ectopic expression of miR-1 and miR-206 precursor miRNAs in cancer cells result in reprogramming toward a less malignant phenotype. Since miR-1 and miR-206 affect PPP activity in the opposite manner, it is evident that miR-1 and miR-206 and NRF2 function are reciprocally regulated.
Redox processes are central to the functionality of all known metabolic pathways, and any perturbation in redox can have a major impact on epigenetic enzyme functionality in vivo. In fact, HDAC4 is a validated target of miR-1 (38), and a positive feedback loop involving miR-1 and HDAC4 expression has been reported in muscle cells (39, 40). Supporting the previ-ous studies, we observed that miR-1 and miR-206 expression is regulated by DNA methylation and acetylation. Treatment with 5-Aza-C plus TSA or specific inhibition of HDAC4 significantly upregulated the transcript levels of miR-1 and miR-206 in cancer cells and downregulated the expression of PPP genes (G6PD, TKT, and PGD) and HDAC4. As expected, NRF2-deficient cancer cells expressing elevated levels of miR-1 and miR-206 showed reduced HDAC4 mRNA expression. A recent study by Ago et al. (2008) (41) demonstrated that redox-mediated regulation of HDAC4 determines its function and subcellular localization. Specifically, ROS-induced thiol oxidation of Cys-667 and Cys-669 in HDAC4 results in nuclear export of HDAC4, which can be reversed by TRX1 overexpression (41). Decreased total antioxidant capacity, lower TRX1 expression, and excessive ROS in NRF2-deficient lung and prostate cancer cells disturb the intracellular redox milieu and possibly favor cysteine oxidation in HDAC4, leading to nuclear export and loss of HDAC4-mediated transcriptional repression. Thus, it appears that a positive feedback loop involv-ing miR-1/miR-206 and HDAC4 induces miR-1 and miR-206 expression (Figure 8). In summary, NRF2-dependent epigenetic regulation of miR-1 and miR-206 reprograms glucose metabo-lism to promote cell proliferation and tumorigenesis.
Downloaded on September 16, 2013. The Journal of Clinical Investigation. More information at www.jci.org/articles/view/66353

research article
The Journal of Clinical Investigation http://www.jci.org Volume 123 Number 7 July 2013 2933
14C glucose incorporation into ribose. For incorporation of 14C glucose into ribose, the cells were plated in 6-well plates and allowed to adhere over-night. The following day, the cells were glucose starved for approximately 8 hours and then refed with DMEM (low-glucose) medium with 10% FBS containing 0.3 μCi 14C-glucose (ribose) per well for 15 to 17 hours. On day 3, RNeasy RNA isolation (QIAGEN) was used to collect total RNA from the cells. An aliquot of the medium or RNA was added to the liquid scintilla-tion cocktail and then the activity was read.
Cell viability and proliferation assays. A total of 100,000 cells per well were placed in a 6-well plate and allowed to recover for 12 hours. Viable cells were determined by using the manual trypan blue–stained cell-counting method. Each data point represents a mean plus or minus SD and was normalized to the value of the corresponding control cells. For BrdU-based cell proliferation assays, BrdU was incorporated into cellular DNA during cell proliferation and measured using a Cell Signaling Technology kit.
Tumor xenografts. Five million (A549) or 1 million (H1437) cells resus-pended in 100 μl of Opti-MEM (Invitrogen) were implanted subcuta-neously in the flanks of athymic nude mice (National Cancer Institute, Frederick, Maryland, USA). Tumor volumes were calculated by using the following formula: (length [mm] × width [mm] × width [mm] × 0.5). To study the effect of miR-1 and miR-206 on H1437 cell proliferation, cells were transfected with NS miR, miR-1, or miR-206. Seventy-two hours after transfection, the cells were implanted into nude mice.
Statistics. All in vitro experiments were performed using 3 cultures for each group and then repeated twice. Mass spectral analyses were performed with 3 independent automatic injections of 1 μl of each sample by the automatic sampler, and the resulting data were accepted only if the sample SD was less than 1% of the normalized peak intensity. Six cell culture samples per group were used for MEF steady-state metabolomic analysis. Statistical analyses were performed using the parametric unpaired, 1- or 2-tailed independent sample t test with 95% confidence intervals, and the level of significance was P < 0.05 to indicate differences in glucose carbon metabolism.
Study approval. All animal experiments were performed under a protocol approved by the Johns Hopkins University Animal Care and Use Committee.
AcknowledgmentsThis work was supported by NIH grant RO1 CA140492 (to S. Biswal); National Cancer Institute SPORE grants P50 CA058184 (to S. Biswal), P30ES03819, and P30CA006973; a research grant from the Maryland Cigarette Restitution Fund (to S. Biswal and G. Girnun); a National Research Service Award (NRSA-F32) from the National Cancer Institute (to C. Happel); a Young Clinical Inno-vator Award (to S. Biswal); and a Young Clinical Scientist Award (to A. Singh) from the Flight Attendant Medical Research Insti-tute. K.K. Wong is supported by National Cancer Institute grants 122794, 166480, 163896,140594, and 141576.
Received for publication August 16, 2012, and accepted in revised form April 4, 2013.
Address correspondence to: Shyam Biswal or Anju Singh, Depart-ment of Environmental Health Sciences, Bloomberg School of Pub-lic Health, Johns Hopkins University, E7624, Hygiene, 615 North Street, Baltimore, Maryland 21205, USA. Phone: 410.502.5633; Fax: 410.955.0116; E-mail: [email protected] (S. Biswal); [email protected] (A. Singh). Or to: Geoffrey Girnun, Department of Biochemistry and Molecular Biology, University of Maryland Greenebaum Cancer Center, BRB, 10-039, 655 W. Baltimore Street, Baltimore, Maryland 21201, USA. Phone: 410.706.3331; Fax: 410.706.3278; E-mail: [email protected].
enrichment analysis (57) was also performed on the dataset to rank the genes using the signal-to-noise metric and 1,000 permutations per run. All microarray data are available in the NCBI’s Gene Expression Omnibus (GEO accession number GSE38332).
Real-time RT-PCR. Total RNA was extracted from cells by using the RNeasy kit (QIAGEN). The reverse transcription reaction was performed using the high-capacity cDNA synthesis kit (Applied Biosystems). An aliquot of diluted cDNA was used to measure human NQO1 (Hs00168547_m1), GCLM (Hs00157694_m1), G6PD (Hs00166169_m1), TKT (Hs01115545_m1), PGD (Hs00427230_m1), GPD2 (Hs01090711_m1), and HDAC4 (Hs01041638_m1) gene expression with the TaqMan primer and probe mixes from Applied Biosystems. β-Actin (Hs99999903_m1) was used for normalization. TaqMan primer and probe sets (Applied Biosystems) were also used to detect mature hsa-miR-1 and hsa-miR-206 miRNAs. The assays were performed using the ABI 7000 TaqMan system (Applied Bio-systems). RNU48 (001006) was used for a normalization control.
Plasmids, DNA transfection, and dual-luciferase assays. cDNA constructs for human G6PD (MHS1010-9205575), human PGD (MHS1010-73507), human GPD2 (MHS4768-99609559; Open Biosystems), and human TKT (SC319310; OriGene) were used for amplification of the UTR regions. The entire 3′UTR region of human G6PD, TKT, PGD, and GDP2 was PCR amplified from cDNA clones using Pfu Ultra HF polymerase (Agilent) and was cloned downstream (3′) of the firefly luciferase gene in the miRNA target expression vector, pmiRGLO (Promega). Renilla luciferase acted as a control reporter for normalization and selection. Cells were reverse transfected into 96-well plates with 200 ng of plasmid DNA, and 48 hours later, cells were lysed and assayed using the Promega dual-luciferase assay. Firefly luciferase activity was normalized to Renilla luciferase activity to calculate the relative luciferase reporter activity for each construct. Results were plotted from 3 independent experiments (n = 6–10 for each assay).
To overexpress miRNAs, we reverse transfected 25 nM of Ambion Pre-miR miRNA precursor molecules for hsa-miR-1 (PM10617) and hsa-miR-206 (PM10409) into cells by using Lipofectamine 2000 (Invitrogen). miRNA inhibitors for hsa-miR-1 (AM10617) and hsa-miR-206 (AM10409) were transfected at a concentration of 50 to 75 nM. Pre-miR miRNA pre-cursor molecule negative control 1 and anti-miR miRNA inhibitor negative control 1 were used as normalization controls. A combination of precursor and inhibitor was used at 25 nM and 75 nM, respectively, resulting in a 1:3 precursor-to-inhibitor ratio. After 48 hours, RNA was isolated.
Western blot analysis. Immunoblotting was performed according to the protocol described previously (15). The following antibodies were used for immunoblotting: NRF2 (1:1,000), TKT (1:1,000), TALDO1 (1:1,000), GAPDH (1:2,000), GPD2 (1:500) (all from Santa Cruz Biotechnology), G6PD (1:2,500; ABD Serotech), and HDAC4 (1:1,000; Cell Signaling Technologies).
Metabolic profiling of cells with [1,2-13C2] glucose tracer. To compare glucose use rates, ribose synthesis, lactate production, and fatty acid synthesis, we incubated cells with 50% [1,2-13C2] glucose dissolved in otherwise glucose-free, sodium pyruvate-free DMEM with 10% serum. The final glucose concentration was adjusted to 180 mg/100 ml. Cells were incubated with tracer glucose for 16 hours, and the culture medium and cell pellet were col-lected. Glucose oxidation was determined by calculating the ratio of 13C/12C released as CO2 in the medium and using this as the direct measure of glu-cose carbon use through complete oxidation by the cell lines (21–23, 26, 30). Lactate and glutamate levels were determined in the medium. Ribose and fatty acid levels were analyzed in the cell pellet. Details of the methods used for estimating lactate, glutamate, ribose, and fatty acids are described in the Supplemental Methods. Mass spectral data were obtained on the HP5973 mass selective detector connected to an HP6890 gas chromatograph.
NADP and NADPH assay. Intracellular nucleotides NADP and NADPH were measured using the NADP and NADPH assay kit from Abcam (ab65349).
Downloaded on September 16, 2013. The Journal of Clinical Investigation. More information at www.jci.org/articles/view/66353

research article
2934 The Journal of Clinical Investigation http://www.jci.org Volume 123 Number 7 July 2013
1. Kensler TW, Wakabayashi N, Biswal S. Cell survival responses to environmental stresses via the Keap1-Nrf2-ARE pathway. Annu Rev Pharmacol Toxicol. 2007;47:89–116.
2. Malhotra D, et al. Global mapping of binding sites for Nrf2 identifies novel targets in cell survival response through ChIP-Seq profiling and network analysis. Nucleic Acids Res. 2010;38(17):5718–5734.
3. Thimmulappa RK, Mai KH, Srisuma S, Kensler TW, Yamamoto M, Biswal S. Identification of Nrf2-regulated genes induced by the chemopreventive agent sulforaphane by oligonucleotide microarray. Cancer Res. 2002;62(18):5196–5203.
4. Cullinan SB, Gordan JD, Jin J, Harper JW, Diehl JA. The Keap1-BTB protein is an adaptor that bridges Nrf2 to a Cul3-based E3 ligase: oxidative stress sensing by a Cul3-Keap1 ligase. Mol Cell Biol. 2004;24(19):8477–8486.
5. Singh A, et al. Dysfunctional KEAP1-NRF2 inter-action in non-small-cell lung cancer. PLoS Med. 2006;3(10):e420.
6. Shibata T, et al. Cancer related mutations in NRF2 impair its recognition by Keap1-Cul3 E3 ligase and promote malignancy. Proc Natl Acad Sci U S A. 2008;105(36):13568–13573.
7. Shibata T, et al. Genetic alteration of Keap1 confers constitutive Nrf2 activation and resistance to che-motherapy in gallbladder cancer. Gastroenterology. 2008;135(4):1358–1368, 1368 e1351–1354.
8. DeNicola GM, et al. Oncogene-induced Nrf2 tran-scription promotes ROS detoxification and tumor-igenesis. Nature. 2011;475(7354):106–109.
9. Sjöblom T, et al. The consensus coding sequences of human breast and colorectal cancers. Science. 2006;314(5797):268–274.
10. Jiang T, et al. High levels of Nrf2 determine chemo-resistance in type II endometrial cancer. Cancer Res. 2010;70(13):5486–5496.
11. Ooi A, et al. An antioxidant response pheno-type shared between hereditary and sporadic type 2 papillary renal cell carcinoma. Cancer Cell. 2011;20(4):511–523.
12. Imielinski M, et al. Mapping the hallmarks of lung adenocarcinoma with massively parallel sequenc-ing. Cell. 2012;150(6):1107–1120.
13. Hammerman PS, et al. Comprehensive genomic characterization of squamous cell lung cancers. Nature. 2012;489(7417):519–525.
14. Ohta T, et al. Loss of Keap1 function activates Nrf2 and provides advantages for lung cancer cell growth. Cancer Res. 2008;68(5):1303–1309.
15. Singh A, et al. RNAi-mediated silencing of nuclear factor erythroid-2-related factor 2 gene expres-sion in non-small cell lung cancer inhibits tumor growth and increases efficacy of chemotherapy. Cancer Res. 2008;68(19):7975–7984.
16. Zhang P, et al. Loss of Kelch-like ECH-associated protein 1 function in prostate cancer cells causes chemoresistance and radioresistance and promotes tumor growth. Mol Cancer Ther. 2010;9(2):336–346.
17. Wang XJ, et al. Nrf2 enhances resistance of cancer cells to chemotherapeutic drugs, the dark side of Nrf2. Carcinogenesis. 2008;29(6):1235–1243.
18. Solis LM, et al. Nrf2 and Keap1 abnormalities in non-small cell lung carcinoma and association with clinicopathologic features. Clin Cancer Res. 2010;16(14):3743–3753.
19. Konstantinopoulos PA, et al. Keap1 mutations and Nrf2 pathway activation in epithelial ovarian can-cer. Cancer Res. 2011;71(15):5081–5089.
20. Metallo CM, Walther JL, Stephanopoulos G.
Evaluation of 13C isotopic tracers for metabolic flux analysis in mammalian cells. J Biotechnol. 2009;144(3):167–174.
21. Boren J, et al. Gleevec (STI571) influences metabolic enzyme activities and glucose carbon flow toward nucleic acid and fatty acid synthesis in myeloid tumor cells. J Biol Chem. 2001;276(41):37747–37753.
22. Boros LG, Torday JS, Lim S, Bassilian S, Cascante M, Lee WN. Transforming growth factor beta2 pro-motes glucose carbon incorporation into nucleic acid ribose through the nonoxidative pentose cycle in lung epithelial carcinoma cells. Cancer Res. 2000;60(5):1183–1185.
23. Boros LG, et al. Oxythiamine and dehydroepian-drosterone inhibit the nonoxidative synthesis of ribose and tumor cell proliferation. Cancer Res. 1997;57(19):4242–4248.
24. Tennant DA, Duran RV, Gottlieb E. Targeting met-abolic transformation for cancer therapy. Nat Rev Cancer. 2010;10:267–277.
25. Lee WN, Edmond J, Bassilian S, Morrow JW. Mass isotopomer study of glutamine oxidation and syn-thesis in primary culture of astrocytes. Dev Neurosci. 1996;18(5–6):469–477.
26. Lee WN, Boros LG, Puigjaner J, Bassilian S, Lim S, Cascante M. Mass isotopomer study of the nonoxi-dative pathways of the pentose cycle with [1,2-13C2]glucose. Am J Physiol. 1998;274(5 pt 1):E843–E851.
27. Lemons JM, et al. Quiescent fibroblasts exhibit high metabolic activity. PLoS Biol. 2010;8(10):e1000514.
28. DeBerardinis RJ, Lum JJ, Hatzivassiliou G, Thomp-son CB. The biology of cancer: metabolic repro-gramming fuels cell growth and proliferation. Cell Metab. 2008;7(1):11–20.
29. Katz J, Wals P, Lee WN. Isotopomer studies of glu-coneogenesis and the Krebs cycle with 13C-labeled lactate. J Biol Chem. 1993;268(34):25509–25521.
30. Vizan P, et al. K-ras codon-specific mutations produce distinctive metabolic phenotypes in NIH3T3 mice [corrected] fibroblasts. Cancer Res. 2005;65(13):5512–5515.
31. Zhang Y, Lin GS, Bao MW, Wu XY, Wang C, Yang B. [Effects of curcumin on sarcoplasmic reticulum Ca2+-ATPase in rabbits with heart failure]. Zhong-hua Xin Xue Guan Bing Za Zhi. 2010;38(4):369–373.
32. Kumaresan K, Kakkar N, Verma A, Mandal AK, Singh SK, Joshi K. Diagnostic utility of alpha-methylacyl CoA racemase (P504S) & HMWCK in morphologically difficult prostate cancer. Diagn Pathol. 2010;5:83.
33. Chorley BN, et al. Identification of novel NRF2-regulated genes by ChIP-Seq: influence on reti-noid X receptor alpha. Nucleic Acids Res. 2012; 40(15):7416–7429.
34. Cacchiarelli D, et al. MicroRNAs involved in molecular circuitries relevant for the Duchenne muscular dystrophy pathogenesis are controlled by the dystrophin/nNOS pathway. Cell Metab. 2010;12(4):341–351.
35. Liu N, et al. An intragenic MEF2-dependent enhancer directs muscle-specific expression of microRNAs 1 and 133. Proc Natl Acad Sci U S A. 2007; 104(52):20844–20849.
36. Hudson RS, et al. MicroRNA-1 is a candidate tumor suppressor and prognostic marker in human pros-tate cancer. Nucleic Acids Res. 2012;40(8):3689–3703.
37. Datta J, et al. Methylation mediated silencing of MicroRNA-1 gene and its role in hepatocellular carcinogenesis. Cancer Res. 2008;68(13):5049–5058.
38. Chen JF, et al. The role of microRNA-1 and microR-NA-133 in skeletal muscle proliferation and differ-
entiation. Nat Genet. 2006;38(2):228–233. 39. Potthoff MJ, Olson EN. MEF2: a central regulator
of diverse developmental programs. Development. 2007;134(23):4131–4140.
40. Potthoff MJ, et al. Histone deacetylase degra-dation and MEF2 activation promote the for-mation of slow-twitch myofibers. J Clin Invest. 2007;117(9):2459–2467.
41. Ago T, et al. A redox-dependent pathway for regu-lating class II HDACs and cardiac hypertrophy. Cell. 2008;133(6):978–993.
42. Vander Heiden MG, Cantley LC, Thompson CB. Understanding the Warburg effect: the meta-bolic requirements of cell proliferation. Science. 2009;324(5930):1029–1033.
43. Deberardinis RJ, Sayed N, Ditsworth D, Thomp-son CB. Brick by brick: metabolism and tumor cell growth. Curr Opin Genet Dev. 2008;18(1):54–61.
44. Cosentino C, Grieco D, Costanzo V. ATM acti-vates the pentose phosphate pathway promoting anti-oxidant defence and DNA repair. EMBO J. 2011;30(3):546–555.
45. Singh A, Bodas M, Wakabayashi N, Bunz F, Biswal S. Gain of Nrf2 function in non-small-cell lung cancer cells confers radioresistance. Antioxid Redox Signal. 2010;13(11):1627–1637.
46. Singh A, et al. Glutathione peroxidase 2, the major cigarette smoke-inducible isoform of GPX in lungs, is regulated by Nrf2. Am J Respir Cell Mol Biol. 2006;35(6):639–650.
47. Mitsuishi Y, et al. Nrf2 redirects glucose and glu-tamine into anabolic pathways in metabolic repro-gramming. Cancer Cell. 2012;22(1):66–79.
48. DeBerardinis RJ, et al. Beyond aerobic glycolysis: transformed cells can engage in glutamine metab-olism that exceeds the requirement for protein and nucleotide synthesis. Proc Natl Acad Sci U S A. 2007;104(49):19345–19350.
49. Marczak ED, et al. Polymorphisms in the tran-scription factor NRF2 and forearm vasodilator responses in humans. Pharmacogenet Genomics. 2012;22(8):620–628.
50. Nasser MW, et al. Down-regulation of micro-RNA-1 (miR-1) in lung cancer. Suppression of tumorigenic property of lung cancer cells and their sensitization to doxorubicin-induced apoptosis by miR-1. J Biol Chem. 2008;283(48):33394–33405.
51. Song G, Wang L. Nuclear receptor SHP activates miR-206 expression via a cascade dual inhibitory mechanism. PLoS One. 2009;4(9):e6880.
52. Kondo N, Toyama T, Sugiura H, Fujii Y, Yamashita H. miR-206 Expression is down-regulated in estro-gen receptor alpha-positive human breast cancer. Cancer Res. 2008;68(13):5004–5008.
53. Shibata T, et al. NRF2 mutation confers malignant potential and resistance to chemoradiation therapy in advanced esophageal squamous cancer. Neopla-sia. 2011;13(9):864–873.
54. Wakabayashi N, et al. Keap1-null mutation leads to postnatal lethality due to constitutive Nrf2 activa-tion. Nat Genet. 2003;35(3):238–245.
55. Rangasamy T, et al. Genetic ablation of Nrf2 enhanc-es susceptibility to cigarette smoke-induced emphy-sema in mice. J Clin Invest. 2004;114(9):1248–1259.
56. Irizarry RA, et al. Exploration, normalization, and summaries of high density oligonucleotide array probe level data. Biostatistics. 2003;4(2):249–264.
57. Subramanian A, et al. Gene set enrichment analy-sis: a knowledge-based approach for interpreting genome-wide expression profiles. Proc Natl Acad Sci U S A. 2005;102(43):15545–15550.
Downloaded on September 16, 2013. The Journal of Clinical Investigation. More information at www.jci.org/articles/view/66353