air conditioners and comfort fans, review of regulation 206
TRANSCRIPT
HAL Id: hal-01796759https://hal-mines-paristech.archives-ouvertes.fr/hal-01796759
Submitted on 12 Jun 2018
HAL is a multi-disciplinary open accessarchive for the deposit and dissemination of sci-entific research documents, whether they are pub-lished or not. The documents may come fromteaching and research institutions in France orabroad, or from public or private research centers.
L’archive ouverte pluridisciplinaire HAL, estdestinée au dépôt et à la diffusion de documentsscientifiques de niveau recherche, publiés ou non,émanant des établissements d’enseignement et derecherche français ou étrangers, des laboratoirespublics ou privés.
Air conditioners and comfort fans, Review of Regulation206/2012 and 626/2011 Final report
Baijia Huang, Peter Martin Skov Hansen, Jan Viegand, Philippe Riviere,Hassane Asloune, Florian Dittmann
To cite this version:Baijia Huang, Peter Martin Skov Hansen, Jan Viegand, Philippe Riviere, Hassane Asloune, et al.. Airconditioners and comfort fans, Review of Regulation 206/2012 and 626/2011 Final report. [ResearchReport] European Commission, DG Energy. 2018. �hal-01796759�
1
Review of Regulation 206/2012 and 626/2011
Air conditioners and comfort fans
Final report
Date: May 2018
Viegand Maagøe A/S Nr. Farimagsgade 37 1364 Copenhagen K Denmark viegandmaagoe.dk
2
Prepared by: Viegand Maagøe (1) and ARMINES (2) Study team: Baijia Huang1, Peter Martin Skov Hansen1, Jan Viegand1, Philippe Riviere2, Hassane Asloune2, Florian Dittmann2 Quality manager: Jan Viegand Website design and management: Viegand Maagøe A/S Contract manager: Viegand Maagøe A/S
Prepared for: European Commission DG ENER C.3 Office: DM24 04/048 B-1049 Brussels, Belgium Contact person: Veerle Beelaerts E-mail: [email protected] Project website: www.eco-airconditioners.eu
Specific contract no.: No. ENER/C3/FV 2016-537/03/FWC 2015-619 LOT2/01/SI2.749247 Implements Framework Contract: № ENER/C3/2015-619 LOT 2
This study was ordered and paid for by the European Commission, Directorate-General for Energy.
As agreed with Policy Officer Veerle Beelaerts, some of the budget for data purchase was reallocated for project work.
The information and views set out in this study are those of the author(s) and do not necessarily reflect the official opinion of the Commission. The Commission does not guarantee the accuracy of the data included in this study. Neither the Commission nor any person acting on the Commission’s behalf may be held responsible for the use which may be made of the information contained therein. This report has been prepared by the authors to the best of their ability and knowledge. The authors do not assume liability for any damage, material or immaterial, that may arise from the use of the report or the information contained therein. © European Union, May 2018. Reproduction is authorised provided the source is acknowledged. More information on the European Union is available on the internet (http://europa.eu). To be cited as: Baijia Huang, Philippe Riviere, Peter Martin Skov Hansen, Jan Viegand, Hassane Asloune, Florian Dittmann,. Air conditioners and comfort fans, Review of Regulation 206/2012 and 626/2011 Final report. [Research Report] European Commission, DG Energy. 2018.
3
Table of contents of this report Pages in this table refer to pdf page number, bottom page number refer to page number per task.
Task 1...........................................................................................................4
Task 2...........................................................................................................94
Task 3...........................................................................................................156
Task 4...........................................................................................................233
Task 5...........................................................................................................294
Task 6...........................................................................................................326
Task 7...........................................................................................................386
1
Review of Regulation 206/2012 and
626/2011
Air conditioners and comfort fans
Task 1 report
Final version
Date: May 2018
2
Prepared by:
Viegand Maagøe and ARMINES
Study team: Baijia Huang, Jan Viegand, Peter Martin Skov Hansen, Philippe Riviere,
Florian Dittmann
Quality manager: Jan Viegand
Website design and management: Viegand Maagøe A/S
Contract manager: Viegand Maagøe A/S
Prepared for:
European Commission
DG ENER C.3
Office: DM24 04/048
B-1049 Brussels, Belgium
Contact person: Veerle Beelaerts
E-mail: [email protected]
Project website: www.eco-airconditioners.eu
Specific contract no.: No. ENER/C3/FV 2016-537/03/FWC 2015-619
LOT2/01/SI2.749247
Implements Framework Contract: № ENER/C3/2015-619 LOT 2
This study was ordered and paid for by the European Commission, Directorate-General
for Energy.
As agreed with Policy Officer Veerle Beelaerts, some of the budget for data purchase was
reallocated for project work.
The information and views set out in this study are those of the author(s) and do not
necessarily reflect the official opinion of the Commission. The Commission does not
guarantee the accuracy of the data included in this study. Neither the Commission nor any
person acting on the Commission’s behalf may be held responsible for the use which may
be made of the information contained therein.
This report has been prepared by the authors to the best of their ability and knowledge.
The authors do not assume liability for any damage, material or immaterial, that may arise
from the use of the report or the information contained therein.
© European Union, May 2018.
Reproduction is authorised provided the source is acknowledged.
More information on the European Union is available on the internet (http://europa.eu).
Viegand Maagøe A/S
Nr. Farimagsgade 37
1364 Copenhagen K
Denmark
viegandmaagoe.dk
3
Table of contents List of tables ......................................................................................................... 4
List of figures ........................................................................................................ 6
Abbreviations ........................................................................................................ 7
Introduction to the task reports ............................................................................... 8
1 Task 1...........................................................................................................10
1.1 Product scope ...........................................................................................10
1.1.1 Existing definitions and categories .........................................................10
1.1.2 Product scope alignment .......................................................................17
1.1.3 Assessment of extending product scope ..................................................20
1.1.4 Recommended product scope ................................................................24
1.2 Test standards (EU, Member State and third country level).............................26
1.2.1 Energy performance for primary functions ..............................................26
1.2.2 Energy performance for secondary functions of air conditioners .................53
1.2.3 Noise standards ...................................................................................53
1.2.4 Refrigerant standards ...........................................................................55
1.2.5 WEEE and RoHS standards ....................................................................57
1.2.6 Mandates issued by the EC to the European Standardization Organizations .58
1.3 Legislation ................................................................................................60
1.3.1 EU legislation ......................................................................................60
1.3.2 Member State legislation ......................................................................77
1.3.3 Third country legislation .......................................................................79
1.4 Conclusions and recommendations ..............................................................88
4
List of tables Table 1. Products in scope, categorisation and definitions. .........................................11
Table 2. Prodcom categories covering products relevant for this study. .......................17
Table 3: Synthesis of the different air conditioner and cooling generator types and of
their inclusion in existing Ecodesign and labelling regulations .....................................21
Table 4: Synthesis of the different fan types and of their inclusion in existing Ecodesign
and labelling regulations ........................................................................................23
Table 5: Recommended product scope. ...................................................................25
Table 6: Air to air, testing conditions in the heating mode (EN14511-2:2013) ..............27
Table 7: Air to air, testing conditions in the cooling mode (EN14511-2:2013) ..............28
Table 8: Air to air, testing conditions in cooling mode (EN14511-3:2013) ....................30
Table 9: bin number j, outdoor temperature Tj in oC and number of hours per bin hj
corresponding to the reference cooling season .........................................................33
Table 10: Part load conditions for reference SEER and reference SEERon: air to air units
..........................................................................................................................34
Table 11: bin number j, outdoor temperature Tj in °C and number of hours per bin hj
corresponding to the reference heating seasons ―warmer, ―average, ―colder ............37
Table 12: The weighting coefficients by temperature bins ..........................................42
Table 13: Hours to be used to compute the TCSPF ....................................................43
Table 14: Distribution of temperature occurrences over the season ............................44
Table 15: Baseline test results ...............................................................................48
Table 16: Investigation test results, impact of air infiltration on unit performance ........48
Table 17: Investigation test results, impact of varying outdoor conditions of air infiltration
on unit performance .............................................................................................49
Table 18: Investigation test results, impact of insulating ducts on unit performance
(comparison with calorimeter test results, outdoor conditions temperatures 35/24 (dry
bulb/wet bulb) .....................................................................................................49
Table 19: USA portable air conditioners final test method: standard test conditions ......49
Table 20: USA portable air conditioners: hours to compute energy consumption ..........52
Table 21: Regulation 206/2012 - minimum efficiency requirements ............................61
Table 22: Regulation 206/2012- The requirements for maximum power consumption in
off-mode and standby ...........................................................................................61
Table 23: Requirements for maximum sound power level of air conditioners ................62
Table 24: Information requirements for air conditioners, except double duct and single
duct air conditioners .............................................................................................62
Table 25: Information requirements for single duct and double duct air conditioners. ....64
Table 26:Information requirements for comfort fans .................................................65
Table 27: Regulation 626/2011 – Energy efficiency classes for air conditioners, except
double ducts and single .........................................................................................67
Table 28: Regulation 626/2011 – Energy efficiency classes for double ducts and single
ducts are .............................................................................................................68
Table 29: Impact of maximum uncertainty level according to EN14825:2016 standard on
SEER and SCOP declared values .............................................................................70
Table 30: Prohibition of high GWP refrigerants .........................................................76
Table 31: Quotas for hydrofluorocarbons .................................................................76
Table 32: Ecolabel minimum requirements of the coefficient of performance (COP).......77
Table 33: Ecolabel minimum requirements of the energy efficiency ratio (EER) ............77
Table 34: Blue Angel requirements for the sound power level at rated capacity ............78
5
Table 35: MEPS: MINIMUM EER FOR AIR COOLED CONDENSER AIRCONDITIONERS (from
AS/NZS 3823.2‐2009) .........................................................................................79
Table 36: Japan full load MEPS for air conditioners ...................................................81
Table 37: Japan APF Top Runner efficiency target - Air conditioners for home use - Non-
duct and wall-hung type: Fiscal year 2010 ...............................................................82
Table 38: Japan APF Top Runner efficiency target - Air conditioners for home use -
Others: Fiscal year 2012 .......................................................................................82
Table 39: Japan APF Top Runner efficiency target - Air conditioners for business use:
Fiscal year 2015 ...................................................................................................82
Table 40 Minimum requirement and energy label allowable limits ...............................84
Table 41 APF requirement and energy label allowable limits for variable speed air
conditioners according to MEPS GB 21455 -2013 ......................................................84
Table 42: SEER requirement and energy label allowable limits for variable speed air
conditioners according to MEPS GB 21455 – 2008 and GB 21455 – 2013 .....................85
Table 43: Minimum performance thresholds based on CEER (USA) .............................86
Table 44: Seasonal Energy Efficiency Ratio and Heating Seasonal Performance minimum
requirements for central air conditioners .................................................................87
Table 45: Energy Efficiency Ratio for central air conditioners in selected states ............87
Table 46: Minimum requirements for average off mode electrical of central air
conditioners .........................................................................................................87
Table 47: Energy Conservation Standards for Portable Air Conditioners .......................88
Table 48: Recommended product scope. .................................................................89
6
List of figures Figure 1: Division of the different products for space heating into sub-categories. ........18
Figure 2: Schematic overview of the SCOPon calculation points (for a on-off cycling air to
water unit, in EN14825:2016, Annex E, p 74) ..........................................................36
Figure 3: Impact of using lock-in mode versus compensation method on the energy
efficiency of an inverter air conditioning unit ............................................................40
Figure 4: Example of an energy label for a reversible air conditioner ...........................67
Figure 5: Proposed label designs for single duct air conditioners in Australia in 2009. Text
on the label: "This product has a cooling function when ducted to the outside, but during
hot weather hot air is drawn into the building to replace the exhausted hot air. Over
time this may result in an increase in indoor temperatures in other parts of the building.
Please ask your retailer about alternatives." ............................................................80
Figure 6 China Energy Label for air conditioners 2004 version that is out of use (left) and
the currently in use 2010 version (right) .................................................................83
Figure 7 China Energy Label for variable speed air conditioners according to MEPS GB
21455 -2013 ........................................................................................................84

7
Abbreviations Cdc,
Cdh
The cycling degradation coefficient for air
conditioners in cooling (heating) mode
COP Coefficient of Performance for air conditioners
in heating mode
CDD Cooling Degree Day
EER Energy Efficiency Ratio for air conditioners in
cooling mode
EPS External Static Pressure for air conditioners
GNI Gross national income
GWP Global warming potential
HTO The number of hours the unit is considered to
work in thermostat off mode for air conditioners
HSB The number of hours the unit is considered to
work in standby mode for air conditioners
HCK
The number of hours the unit is considered to
work in crankcase heater mode for air
conditioners
HOFF The number of hours the unit is considered to
work in off mode for air conditioners
PTO The electricity consumption during thermostat
off mode for air conditioners
PSB The electricity consumption during standby
mode for air conditioners
PCK The electricity consumption during crankcase
heater mode for air conditioners
POFF The electricity consumption during off mode.
QCE
The reference annual cooling demand for air
conditioners in cooling mode
QHE
The reference annual heating demand for air
conditioners in heating mode
SHR Sensible Heat Ratio for air conditioners
SEER
Seasonal Energy Efficiency Ratio for air
conditioners, cooling mode
SCOP
Seasonal Coefficient of Performance for air
conditioners, heating mode
VRF Variable Refrigerant Flow

8
Introduction to the task reports This is the introduction to the interim report of the preparatory study on the Review of
Regulation 206/2012 and 626/2011 for air conditioners and comfort fans. The interim
report has been split into five tasks, following the structure of the MEErP methodology.
Each task report has been uploaded individually in the project’s website. These task
reports present the technical basis to define future ecodesign and energy labelling
requirements based on the existing Regulation (EU) 206/2012 and 626/2011.
The task reports start with the definition of the scope for this review study (i.e. task 1),
which assesses the current scope of the existing regulation in light of recent
developments with relevant legislation, standardisation and voluntary agreements in the
EU and abroad. Furthermore, assessing the possibility of merging implementing
measures that cover the similar groups of products or extend the scope to include new
product groups. The assessment results in a refined scope for this review study.
Following it is task 2, which updates the annual sales and stock of the products in scope
according to recent and future market trends and estimates future stocks. Furthermore,
it provides an update on the current development of low-GWP alternatives and sound
pressure level.
Next task is task 3, which presents a detailed overview of use patterns of products in scope
according to consumer use and technological developments. It also provides an analysis of
other aspects that affect the energy consumption during the use of these products, such
as component technologies. Furthermore, it also touches on aspects that are important for
material and resource efficiency such as repair and maintenance, and it gives an overview
of what happens to these products at their end of life.
Task 4 presents an analysis of current average technologies at product and component
level, and it identifies the Best Available Technologies both at product and component level.
An overview of the technical specifications as well as their overall energy consumption is
provided when data is available. Finally, the chapter discusses possible design options to
improve the resource efficiency.
Simplified tasks 5 & 6 report presents the base cases, which will be later used to define
the current and future impact of the current air condition regulation if no action is taken.
The report shows the base cases energy consumption at product category level and their
life cycle costs. It also provides a high-level overview of the life cycle global warming
potential of air conditioners and comfort fans giving an idea of the contribution of each
life cycle stage to the overall environmental impact. Finally, it presents some identified
design options which will be used to define reviewed ecodesign and energy labelling
requirements.
Task 7 report presents the policy options for an amended ecodesign regulation on air
conditioners and comfort fans. The options have been developed based on the work
throughout this review study, dialogue with stakeholders and with the European
Commission. The report presents an overview of the barriers and opportunities for the
reviewed energy efficiency policy options, and the rationale for the new
material/refrigerant efficiency policy options. This report will be the basis to calculate the
estimated energy and material savings potentials by implementing these policy options,
in comparison to no action (i.e. Business as Usual – BAU).

9
The task reports follow the MEErP methodology, with some adaptations which suit the
study goals.
10
1 Task 1 Task 1 follows the MEErP methodology and includes the following:
• Product scope: Identification and assessment of relevant categories based on the
existing ecodesign regulation, standardisation and measurement method activities
and other relevant schemes and activities outside EU. Defining preliminary product
scope, definitions and categorisations.
• Test standards: EU, Member State and third country level.
• Legislation: EU, Member State and third country level.
1.1 Product scope
The current scope of Commission Regulation (EU) No 206/2012 covers electric mains-
operated air conditioners with a rated capacity of ≤ 12 kW for cooling, or heating if the
product has no cooling function, and comfort fans with an electric fan power input ≤ 125W.
The current scope of Commission Delegated Regulation (EU) No 626/2011 covers electric
mains-operated air conditioners with a rated capacity of ≤ 12 kW for cooling, or heating if
the product has no cooling function.
The definition of air conditioners is presented and discussed in the next sub-section.
1.1.1 Existing definitions and categories
1.1.1.1 Existing definitions and categories in Ecodesign Regulation (EU) No
206/2012
Commission Regulation (EU) No 206/2012 establishes ecodesign requirements for air
conditioners and comfort fans. The product definitions employed in the regulation are listed
below.
Products and components that are within the scope of the Regulation are defined as:
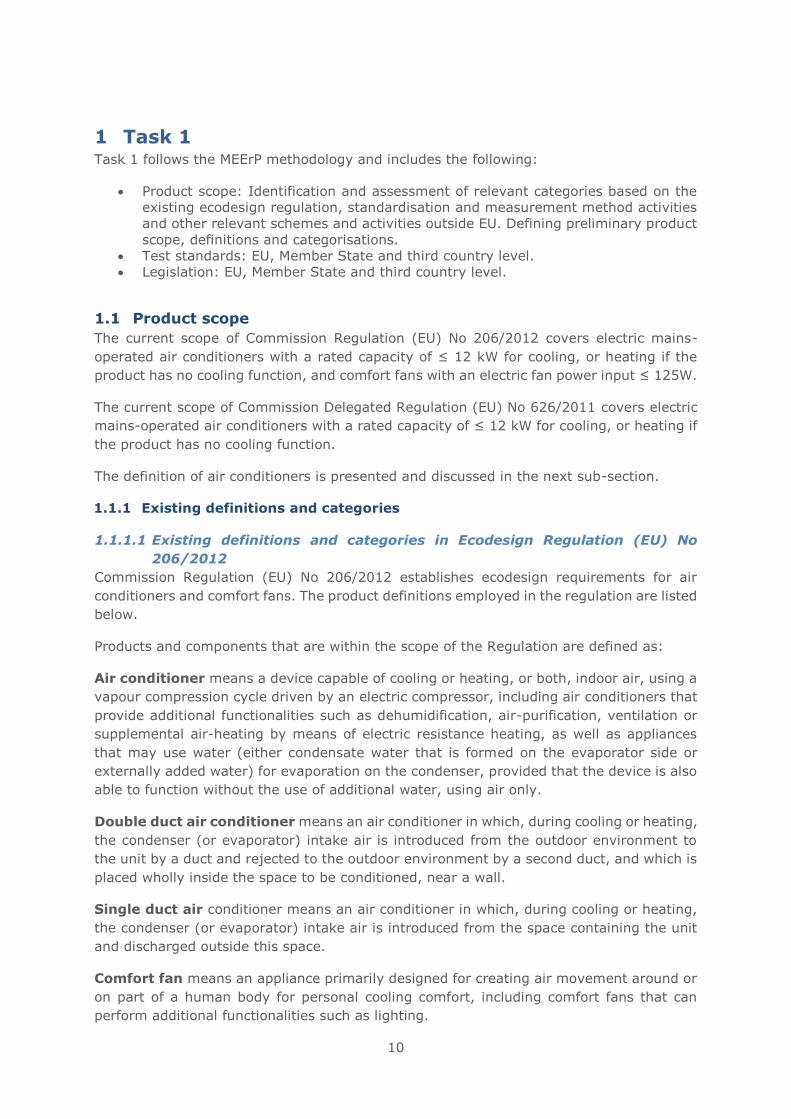
Air conditioner means a device capable of cooling or heating, or both, indoor air, using a
vapour compression cycle driven by an electric compressor, including air conditioners that
provide additional functionalities such as dehumidification, air-purification, ventilation or
supplemental air-heating by means of electric resistance heating, as well as appliances
that may use water (either condensate water that is formed on the evaporator side or
externally added water) for evaporation on the condenser, provided that the device is also
able to function without the use of additional water, using air only.
Double duct air conditioner means an air conditioner in which, during cooling or heating,
the condenser (or evaporator) intake air is introduced from the outdoor environment to
the unit by a duct and rejected to the outdoor environment by a second duct, and which is
placed wholly inside the space to be conditioned, near a wall.
Single duct air conditioner means an air conditioner in which, during cooling or heating,
the condenser (or evaporator) intake air is introduced from the space containing the unit
and discharged outside this space.
Comfort fan means an appliance primarily designed for creating air movement around or
on part of a human body for personal cooling comfort, including comfort fans that can
perform additional functionalities such as lighting.
11
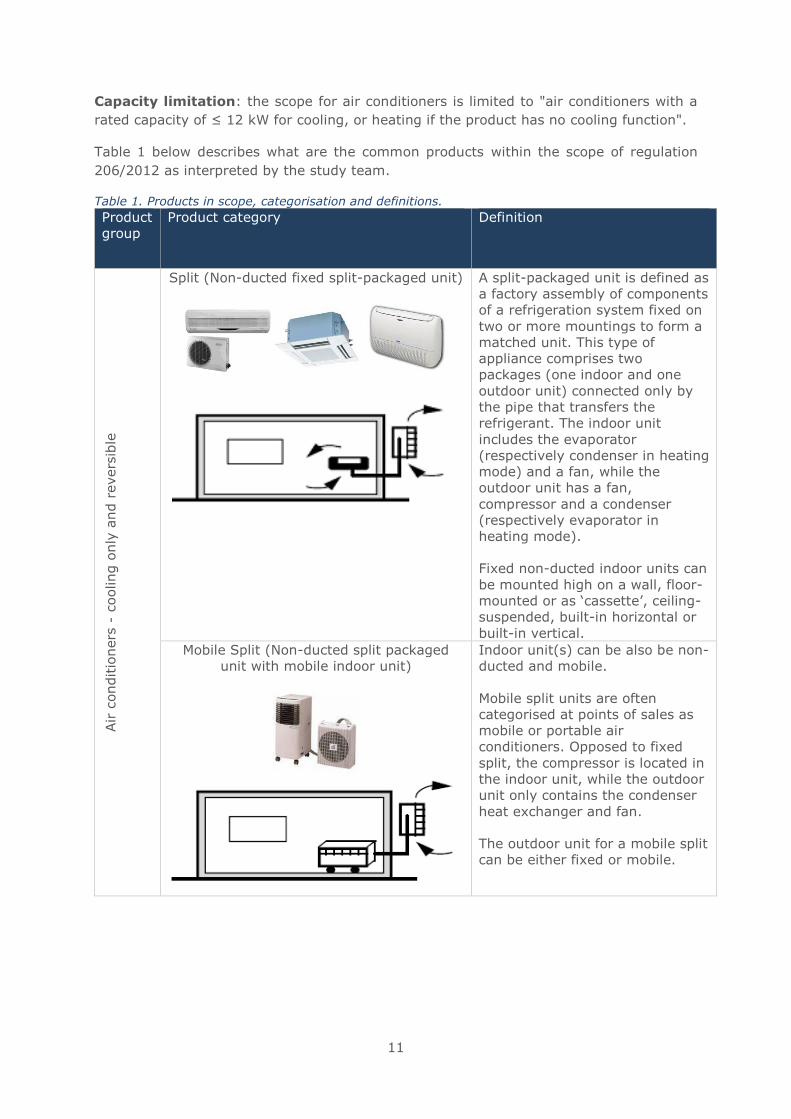
Capacity limitation: the scope for air conditioners is limited to "air conditioners with a
rated capacity of ≤ 12 kW for cooling, or heating if the product has no cooling function".
Table 1 below describes what are the common products within the scope of regulation
206/2012 as interpreted by the study team.
Table 1. Products in scope, categorisation and definitions.
Product
group
Product category Definition
Air c
onditio
ners
- c
ooling o
nly
and r
evers
ible
Split (Non-ducted fixed split-packaged unit)
A split-packaged unit is defined as
a factory assembly of components
of a refrigeration system fixed on
two or more mountings to form a
matched unit. This type of
appliance comprises two
packages (one indoor and one
outdoor unit) connected only by
the pipe that transfers the
refrigerant. The indoor unit
includes the evaporator
(respectively condenser in heating
mode) and a fan, while the
outdoor unit has a fan,
compressor and a condenser
(respectively evaporator in
heating mode).
Fixed non-ducted indoor units can
be mounted high on a wall, floor-
mounted or as ‘cassette’, ceiling-
suspended, built-in horizontal or
built-in vertical.
Mobile Split (Non-ducted split packaged
unit with mobile indoor unit)
Indoor unit(s) can be also be non-
ducted and mobile.
Mobile split units are often
categorised at points of sales as
mobile or portable air
conditioners. Opposed to fixed
split, the compressor is located in
the indoor unit, while the outdoor
unit only contains the condenser
heat exchanger and fan.
The outdoor unit for a mobile split
can be either fixed or mobile.
12
Product
group
Product category Definition
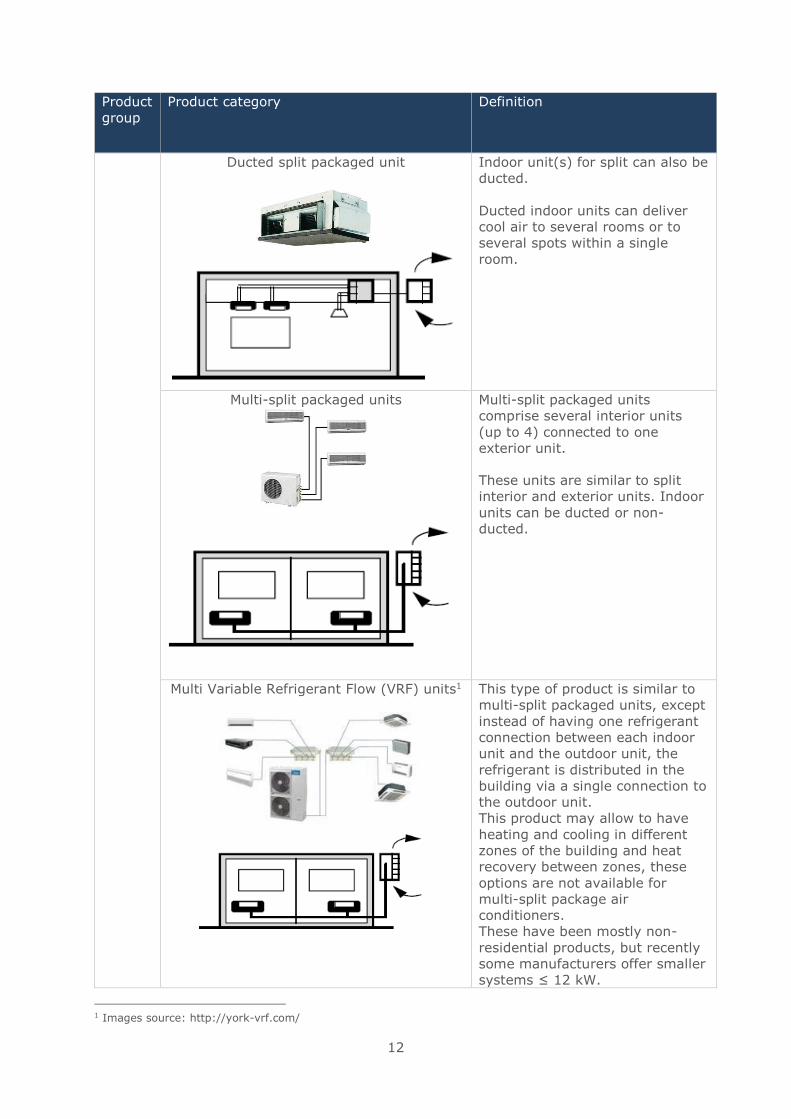
Ducted split packaged unit
Indoor unit(s) for split can also be
ducted.
Ducted indoor units can deliver
cool air to several rooms or to
several spots within a single
room.
Multi-split packaged units
Multi-split packaged units
comprise several interior units
(up to 4) connected to one
exterior unit.
These units are similar to split
interior and exterior units. Indoor
units can be ducted or non-
ducted.
Multi Variable Refrigerant Flow (VRF) units1
This type of product is similar to
multi-split packaged units, except
instead of having one refrigerant
connection between each indoor
unit and the outdoor unit, the
refrigerant is distributed in the
building via a single connection to
the outdoor unit.
This product may allow to have
heating and cooling in different
zones of the building and heat
recovery between zones, these
options are not available for
multi-split package air
conditioners.
These have been mostly non-
residential products, but recently
some manufacturers offer smaller
systems ≤ 12 kW.
1 Images source: http://york-vrf.com/
13
Product
group
Product category Definition
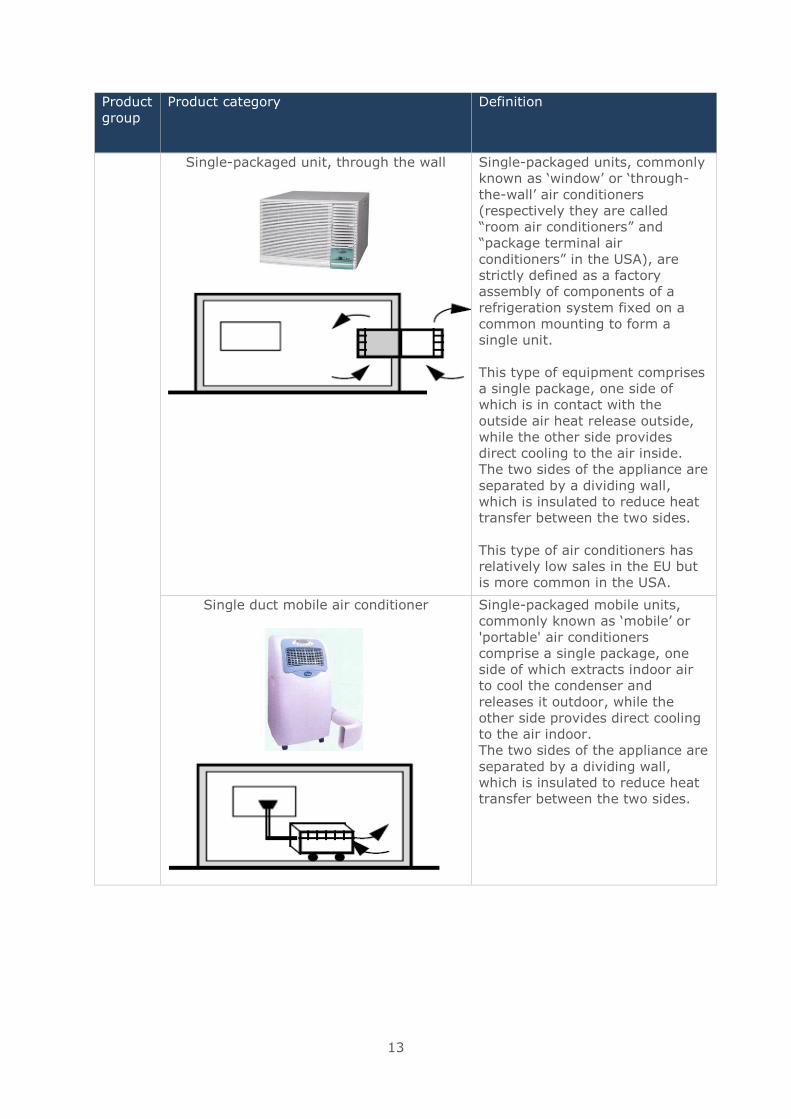
Single-packaged unit, through the wall
Single-packaged units, commonly
known as ‘window’ or ‘through-
the-wall’ air conditioners
(respectively they are called
“room air conditioners” and
“package terminal air
conditioners” in the USA), are
strictly defined as a factory
assembly of components of a
refrigeration system fixed on a
common mounting to form a
single unit.
This type of equipment comprises
a single package, one side of
which is in contact with the
outside air heat release outside,
while the other side provides
direct cooling to the air inside.
The two sides of the appliance are
separated by a dividing wall,
which is insulated to reduce heat
transfer between the two sides.
This type of air conditioners has
relatively low sales in the EU but
is more common in the USA.
Single duct mobile air conditioner
Single-packaged mobile units,
commonly known as ‘mobile’ or
'portable' air conditioners
comprise a single package, one
side of which extracts indoor air
to cool the condenser and
releases it outdoor, while the
other side provides direct cooling
to the air indoor.
The two sides of the appliance are
separated by a dividing wall,
which is insulated to reduce heat
transfer between the two sides.
14
Product
group
Product category Definition
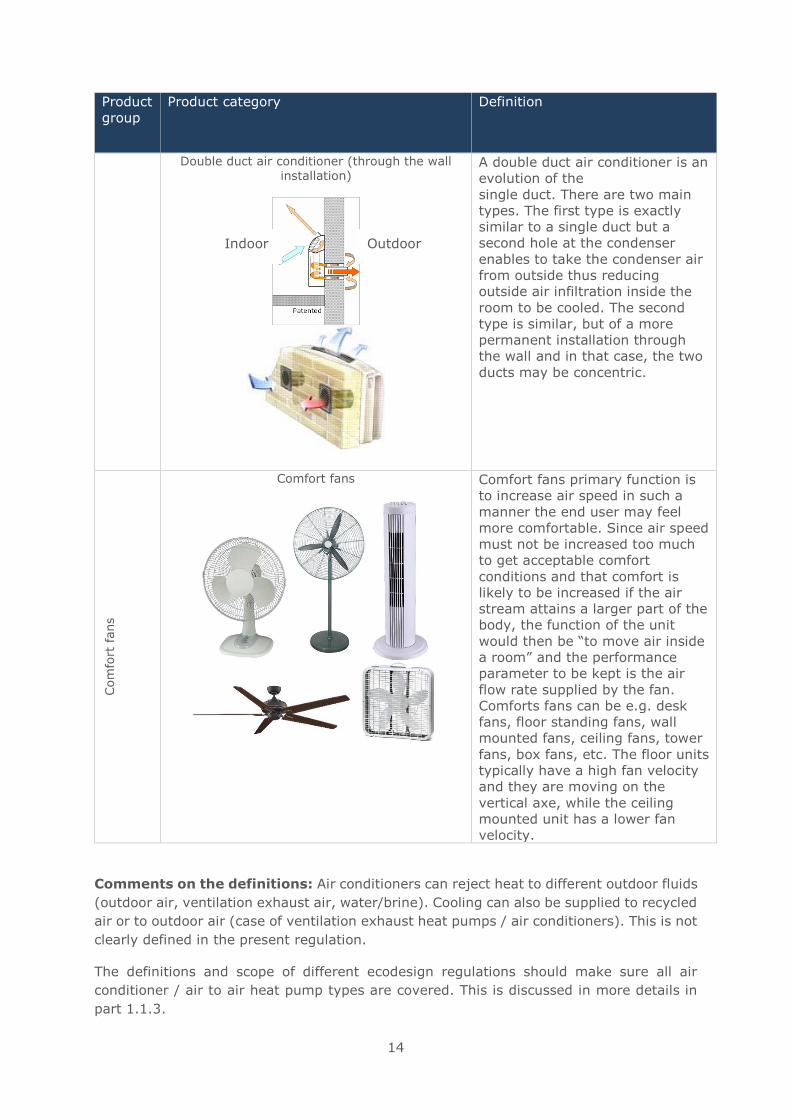
Double duct air conditioner (through the wall installation)
A double duct air conditioner is an
evolution of the
single duct. There are two main
types. The first type is exactly
similar to a single duct but a
second hole at the condenser
enables to take the condenser air
from outside thus reducing
outside air infiltration inside the
room to be cooled. The second
type is similar, but of a more
permanent installation through
the wall and in that case, the two
ducts may be concentric.
Com
fort
fans
Comfort fans
Comfort fans primary function is
to increase air speed in such a
manner the end user may feel
more comfortable. Since air speed
must not be increased too much
to get acceptable comfort
conditions and that comfort is
likely to be increased if the air
stream attains a larger part of the
body, the function of the unit
would then be “to move air inside
a room” and the performance
parameter to be kept is the air
flow rate supplied by the fan.
Comforts fans can be e.g. desk
fans, floor standing fans, wall
mounted fans, ceiling fans, tower
fans, box fans, etc. The floor units
typically have a high fan velocity
and they are moving on the
vertical axe, while the ceiling
mounted unit has a lower fan
velocity.
Comments on the definitions: Air conditioners can reject heat to different outdoor fluids
(outdoor air, ventilation exhaust air, water/brine). Cooling can also be supplied to recycled
air or to outdoor air (case of ventilation exhaust heat pumps / air conditioners). This is not
clearly defined in the present regulation.
The definitions and scope of different ecodesign regulations should make sure all air
conditioner / air to air heat pump types are covered. This is discussed in more details in
part 1.1.3.
Indoor Outdoor
15
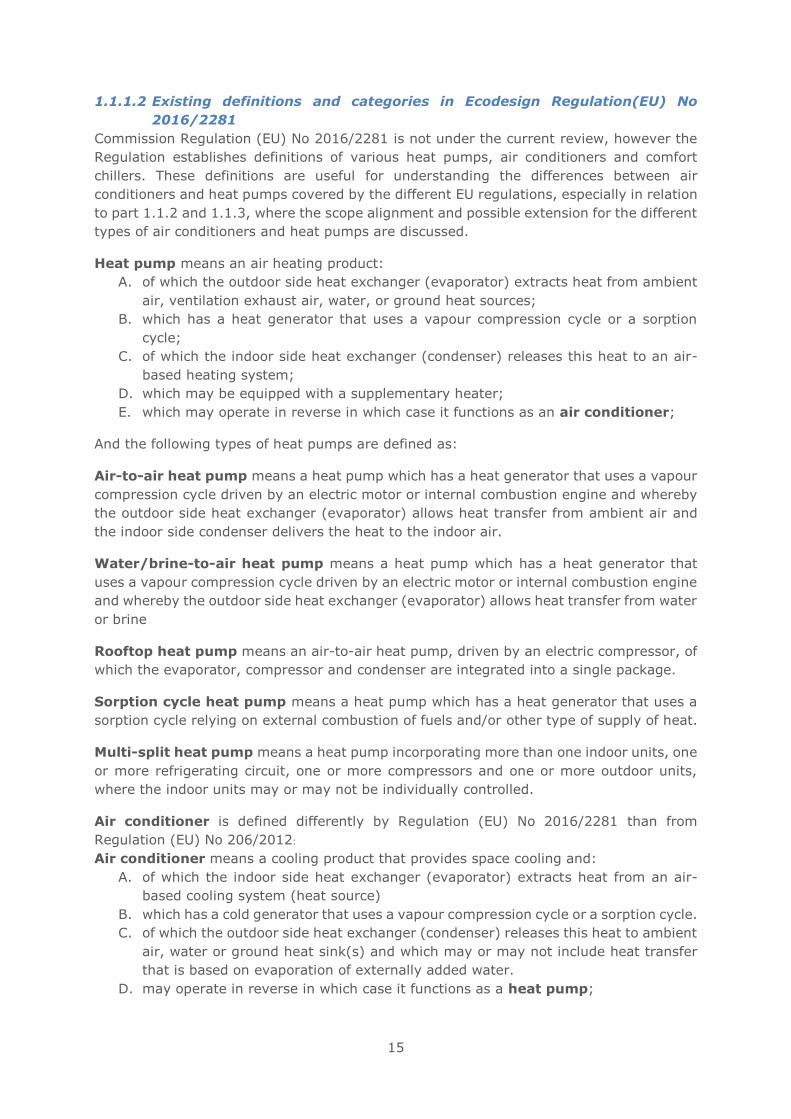
1.1.1.2 Existing definitions and categories in Ecodesign Regulation(EU) No
2016/2281
Commission Regulation (EU) No 2016/2281 is not under the current review, however the
Regulation establishes definitions of various heat pumps, air conditioners and comfort
chillers. These definitions are useful for understanding the differences between air
conditioners and heat pumps covered by the different EU regulations, especially in relation
to part 1.1.2 and 1.1.3, where the scope alignment and possible extension for the different
types of air conditioners and heat pumps are discussed.
Heat pump means an air heating product:
A. of which the outdoor side heat exchanger (evaporator) extracts heat from ambient
air, ventilation exhaust air, water, or ground heat sources;
B. which has a heat generator that uses a vapour compression cycle or a sorption
cycle;
C. of which the indoor side heat exchanger (condenser) releases this heat to an air-
based heating system;
D. which may be equipped with a supplementary heater;
E. which may operate in reverse in which case it functions as an air conditioner;
And the following types of heat pumps are defined as:
Air-to-air heat pump means a heat pump which has a heat generator that uses a vapour
compression cycle driven by an electric motor or internal combustion engine and whereby
the outdoor side heat exchanger (evaporator) allows heat transfer from ambient air and
the indoor side condenser delivers the heat to the indoor air.
Water/brine-to-air heat pump means a heat pump which has a heat generator that
uses a vapour compression cycle driven by an electric motor or internal combustion engine
and whereby the outdoor side heat exchanger (evaporator) allows heat transfer from water
or brine
Rooftop heat pump means an air-to-air heat pump, driven by an electric compressor, of
which the evaporator, compressor and condenser are integrated into a single package.
Sorption cycle heat pump means a heat pump which has a heat generator that uses a
sorption cycle relying on external combustion of fuels and/or other type of supply of heat.
Multi-split heat pump means a heat pump incorporating more than one indoor units, one
or more refrigerating circuit, one or more compressors and one or more outdoor units,
where the indoor units may or may not be individually controlled.
Air conditioner is defined differently by Regulation (EU) No 2016/2281 than from
Regulation (EU) No 206/2012:
Air conditioner means a cooling product that provides space cooling and:
A. of which the indoor side heat exchanger (evaporator) extracts heat from an air-
based cooling system (heat source)
B. which has a cold generator that uses a vapour compression cycle or a sorption cycle.
C. of which the outdoor side heat exchanger (condenser) releases this heat to ambient
air, water or ground heat sink(s) and which may or may not include heat transfer
that is based on evaporation of externally added water.
D. may operate in reverse in which case it functions as a heat pump;
16
Air-to-air air conditioner means an air conditioner which has a cold generator that uses
a vapour compression cycle driven by an electric motor or internal combustion engine and
whereby the outdoor side heat exchanger (condenser) allows heat transfer to air.
Water/brine-to-air air conditioner means an air conditioner which has a cold generator
that uses a vapour compression cycle driven by an electric motor or internal combustion
engine and whereby the outdoor side heat exchanger (condenser) allows heat transfer to
water or brine.
Rooftop air conditioner means an air-to-air air conditioner, driven by an electric
compressor, of which the evaporator, compressor and condenser are integrated into a
single package.
Multi-split air conditioner means an air conditioner incorporating more than one indoor
units, one or more refrigeration circuits, one or more compressors and one or more outdoor
units, where the indoor units may or may not be individually controlled.
Sorption cycle air conditioner means an air conditioner which has a cold generator that
uses a sorption cycle relying on external combustion of fuels and/or supply of heat.
Air-to-water comfort chiller means a comfort chiller that has a cold generator that uses
a vapour compression cycle driven by an electric motor or internal combustion engine and
whereby the outdoor side heat exchanger (condenser) allows heat transfer to air, including
heat transfer that is based on evaporation into this air of externally added water, provided
that the device is also able to function without the use of additional water, using air only.
Water/brine-to-water comfort chiller means a comfort chiller that has a cold generator
that uses a vapour compression cycle driven by an electric motor or internal combustion
engine and whereby the outdoor side heat exchanger (condenser) allows heat transfer to
water or brine, excluding heat transfer that is based on evaporation of externally added
water.
Sorption cycle comfort chiller means a comfort chiller which has a cold generator that
uses a sorption cycle relying on external combustion of fuels and/or supply of heat.
Fan coil unit means a device that provides forced circulation of indoor air, for the purpose
of one or more of heating, cooling, dehumidification and filtering of indoor air, for the
thermal comfort of human beings, but which does not include the source of heating or
cooling nor an outdoor side heat exchanger. The device may be equipped with minimal
ductwork to guide the intake and exit of air, including conditioned air. The product may be
designed to be built in or may have an enclosure allowing it be placed in the space to be
conditioned. It may include a Joule effect heat generator designed to be used as back-up
heater only.
Air heating product means a device that:
A. incorporates or provides heat to an air-based heating system;
B. is equipped with one or more heat generators; and
C. may include an air-based heating system for supplying heated air directly into the
heated space by means of an air-moving device.
A heat generator designed for an air heating product and an air heating product housing
designed to be equipped with such a heat generator shall, together, be considered as an
air heating product.
17
Cooling product means a device that:
A. incorporates, or provides chilled air or water to, an air-based cooling system or
water-based cooling system; and
B. is equipped with one or more cold generator(s).
A cold generator designed for use in a cooling product and a cooling product housing
designed to be equipped with such a cold generator shall, together, be considered as a
cooling product.
1.1.1.3 Prodcom (Eurostat) categories
There are a number of PRODCOM codes that relate to air conditioners and associated
products that may be within scope of any potential future update to the ecodesign
Regulation on air conditioners. The PRODCOM categories which are covering products
relevant for this study are listed in the table below.
Table 2. Prodcom categories covering products relevant for this study.
PRODCOM code PRODCOM Nomenclature
Air conditioners 28.25.12.20 Window or wall air conditioning systems, self-
contained or split-systems
28.25.12.50 Air conditioning machines with refrigeration unit
(excluding those used in motor vehicles, self-
contained or split-systems machines)
28.25.30.10 Parts for air conditioning machines (including
condensers, absorbers, evaporators and generators)
Comfort fans 27.51.15.30 Table, floor, wall, window, ceiling or roof fans, with a
self-contained electric motor of an output <= 125 W
1.1.1.4 Labelling categories (EU Energy Label and Eco-label)
EU Energy Label – The definitions used in the Energy Labelling Regulation 626/2011 are
identical to the definitions in the ecodesign regulation. The definitions are listed in 1.1.1.1
Existing definitions
Eco-label – The EU Eco-label2 for heat pumps has no specific definition of an air
conditioner. The Eco-label specification describes the product category as heat pumps
which also includes e.g. brine to water heat pumps and includes heat pumps driven by
electricity, gas and gas absorption. The product group is defined as:
• The product group ‘electrically driven, gas driven or gas absorption heat pumps’
shall comprise heat pumps, which can concentrate energy present in the air, ground
or water into useful heat for the supply of space heating or the opposite process for
space cooling. A ‘heat pump’ is the device or set of devices as delivered by the
manufacturer or importer to the distributor, retailer or installer. This delivery may
or may not include the delivery of circulating pumps at the sink or source side,
however for calculation of coefficient of performance (COP) values the methodology
of EN14511:2004 is refered to (which includes part of circulator consumption). For
gas absorption heat pumps the methodology shall be according to EN12309-
2:2000.
1.1.2 Product scope alignment
There are several types of equipment available on the market which all are categorised as
products for “space heating”. These space heating products and corresponding regulations
are presented in Figure 1. For simplicity, the figure categorises the different products into:
2 http://ec.europa.eu/environment/ecolabel/eu-ecolabel-products-and-services.html
18
central heating or local (non-central) heating products, hydronic systems or dry systems
products and cooling and ventilation. Local space heaters have the heat generator in the
same room as the room that needs heating such as single duct air conditioners.
Split/multisplit, double duct and multi variable refrigerant flow units are examples of
central space heating units.
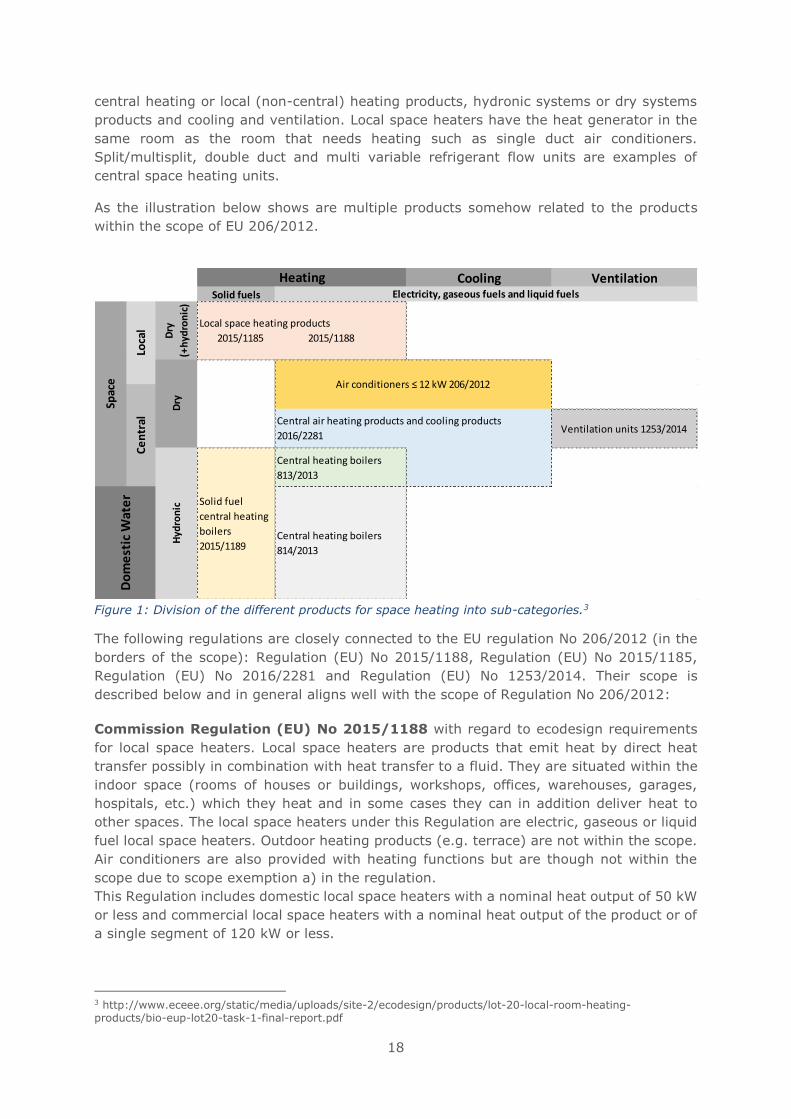
As the illustration below shows are multiple products somehow related to the products
within the scope of EU 206/2012.
Figure 1: Division of the different products for space heating into sub-categories.3
The following regulations are closely connected to the EU regulation No 206/2012 (in the
borders of the scope): Regulation (EU) No 2015/1188, Regulation (EU) No 2015/1185,
Regulation (EU) No 2016/2281 and Regulation (EU) No 1253/2014. Their scope is
described below and in general aligns well with the scope of Regulation No 206/2012:
Commission Regulation (EU) No 2015/1188 with regard to ecodesign requirements
for local space heaters. Local space heaters are products that emit heat by direct heat
transfer possibly in combination with heat transfer to a fluid. They are situated within the
indoor space (rooms of houses or buildings, workshops, offices, warehouses, garages,
hospitals, etc.) which they heat and in some cases they can in addition deliver heat to
other spaces. The local space heaters under this Regulation are electric, gaseous or liquid
fuel local space heaters. Outdoor heating products (e.g. terrace) are not within the scope.
Air conditioners are also provided with heating functions but are though not within the
scope due to scope exemption a) in the regulation.
This Regulation includes domestic local space heaters with a nominal heat output of 50 kW
or less and commercial local space heaters with a nominal heat output of the product or of
a single segment of 120 kW or less.
3 http://www.eceee.org/static/media/uploads/site-2/ecodesign/products/lot-20-local-room-heating-products/bio-eup-lot20-task-1-final-report.pdf
Cooling VentilationSolid fuels
Dry
(+h
ydro
nic
)
Ventilation units 1253/2014
Central heating boilers
813/2013
Central heating boilers
814/2013
Dry
Do
me
stic
Wat
er
Spac
e
Hyd
ron
ic
Loca
lC
en
tral Central air heating products and cooling products
2016/2281
Solid fuel
central heating
boilers
2015/1189
Electricity, gaseous fuels and liquid fuels
Heating
Local space heating products
2015/1185 2015/1188
Air conditioners ≤ 12 kW 206/2012
19
The regulation does not apply to:
a) local space heaters using a vapour compression cycle or sorption cycle for the
generation of heat driven by electric compressors or fuel;
b) local space heaters specified for purposes other than indoor space heating to reach
and maintain a certain thermal comfort of human beings by means of heat
convection or heat radiation;
c) local space heaters that are specified for outdoor use only;
d) local space heaters of which the direct heat output is less than 6 % of the combined
direct and indirect heat output at nominal heat output;
e) air heating products;
f) sauna stoves;
g) slave heaters.
Commission Regulation (EU) No 2015/1185 with regard to ecodesign requirements
for solid fuel local space heaters. Solid fuel space heaters are also local space heaters but
are fired by solid fuels with a nominal heat output of 50 kW or less. Products within this
scope are e.g. stoves and fireplaces and will not further be described here.
Commission Regulation (EU) No 2016/2281 with regard to ecodesign requirements
for air heating products, cooling products, high temperature process chillers and fan coil
units. See definitions of the products covered by this Regulation in Section 1.1.1.2. This
regulation exempts the products that are already covered by an ecodesign regulation, air
conditioners and comfort fans within the scope of Regulation (EU) No 206/2012 are clearly
out of the scope by the exemption item b), see below.
The regulation of air heating products includes:
a) air heating products with a rated heating capacity not exceeding 1 MW;
b) cooling products and high temperature process chillers with a rated cooling capacity
not exceeding 2 MW;
c) fan coil units.
The regulation has the following exemptions:
a) products covered by Commission Regulation (EU) 2015/1188 with regard to
ecodesign requirements for local space heaters;
b) products covered by Commission Regulation (EU) No 206/2012 with regard to
ecodesign requirements for air conditioners and comfort fans;
c) products covered by Commission Regulation (EU) No 813/2013 with regard to
ecodesign requirements for space heaters and combination heaters;
d) products covered by Commission Regulation (EU) 2015/1095 with regard to
ecodesign requirements for professional refrigerated storage cabinets, blast
cabinets, condensing units and process chillers;
e) comfort chillers with leaving chilled water temperatures of less than + 2 °C and
high temperature process chillers with leaving chilled water temperatures of less
than + 2 °C or more than + 12 °C;
f) products designed for using predominantly biomass fuels;
g) products using solid fuels;
h) products that supply heat or cold in combination with electric power (‘cogeneration’)
by means of a fuel combustion or conversion process;
20
i) products included in installations covered by Directive 2010/75/EU of the European
Parliament and of the Council on industrial emissions;
j) high temperature process chillers exclusively using evaporative condensing;
k) custom-made products assembled on site, made on a one-off basis;
l) high temperature process chillers in which refrigeration is effected by an absorption
process that uses heat as the energy source; and
m) air heating and/or cooling products of which the primary function is the purpose of
producing or storing perishable materials at specified temperatures by commercial,
institutional or industrial facilities and of which space heating and/or space cooling
is a secondary function and for which the energy efficiency of the space heating
and/ or space cooling function is dependent on that of the primary function.
Commission Regulation (EU) 1253/2014 with regard to ecodesign requirements for
ventilation units. This Regulation applies to ventilation units and establishes ecodesign
requirements for their placing on the market or putting into service. Some ventilation units
are equipped with a regenerative heat exchanger which means that a rotary heat
exchanger incorporating a rotating wheel for transferring thermal energy from one air
stream to another air stream. These types of products have a different function/purpose
and are therefore not further described.
In this regulation, reference is made to ventilation exhaust heat pumps for air heating
purpose because of possible additional pressure losses, but ventilation exhaust air heating
heat pumps and air cooling air conditioners are not in the scope of this regulation.
Commission Regulation (EU) 327/2011 with regard to ecodesign requirements for fans
driven by motors with an electric input power between 125 W and 500 kW. The products
that falls under the scope of this regulation are not considered as a local space heater,
though it is assessed in relation to comfort fans. The scope includes fans between 125 W
and 500 kW, which aligns well with the scope of No 206/2012 for comfort fans ≤125 W.
Regarding fans included in air conditioners with cooling power below 12 kW, there is a
limited overlap with Regulation (EU) No 206/2012; it regards parts of the fans in ducted
outdoor and indoor units, for larger static pressure difference and cooling capacity ranges
(and thus air flows).
Commission Regulation (EC) No 640/2009 with regard to ecodesign requirements for
electric motors. and its amendment Commission Regulation (EU) No 4/2014. The current
scope includes electric three-phase AC motors with output in the range 0.75-375 kW. With
the current scope, there is no overlapping of motors used for comfort fans ≤125 W. All fan
motors covered by Regulation (EU) 206/2012 have unitary power well below 0.75 kW and
motors of compressors are not included in Commission Regulation (EC) No 640/2009
because they are hermetic motors incorporated in the compressor shell (hermetic non
accessible).
1.1.3 Assessment of extending product scope
This assessment focuses on products that are not included in any regulation and whether
they should be included in the scope of this study. This assessment is made to assure
alignment of the different regulations and to avoid any loopholes.
Air Conditioners
Air conditioners – Air conditioners are covered by Regulation (EU) No 206/2012 and
626/2011 if their cooling capacity is lower than or equal to 12 kW. Table 3 proposes a
21
synthesis of the different air conditioner and cooling generator types and of their inclusion
in existing Ecodesign and labelling regulations.
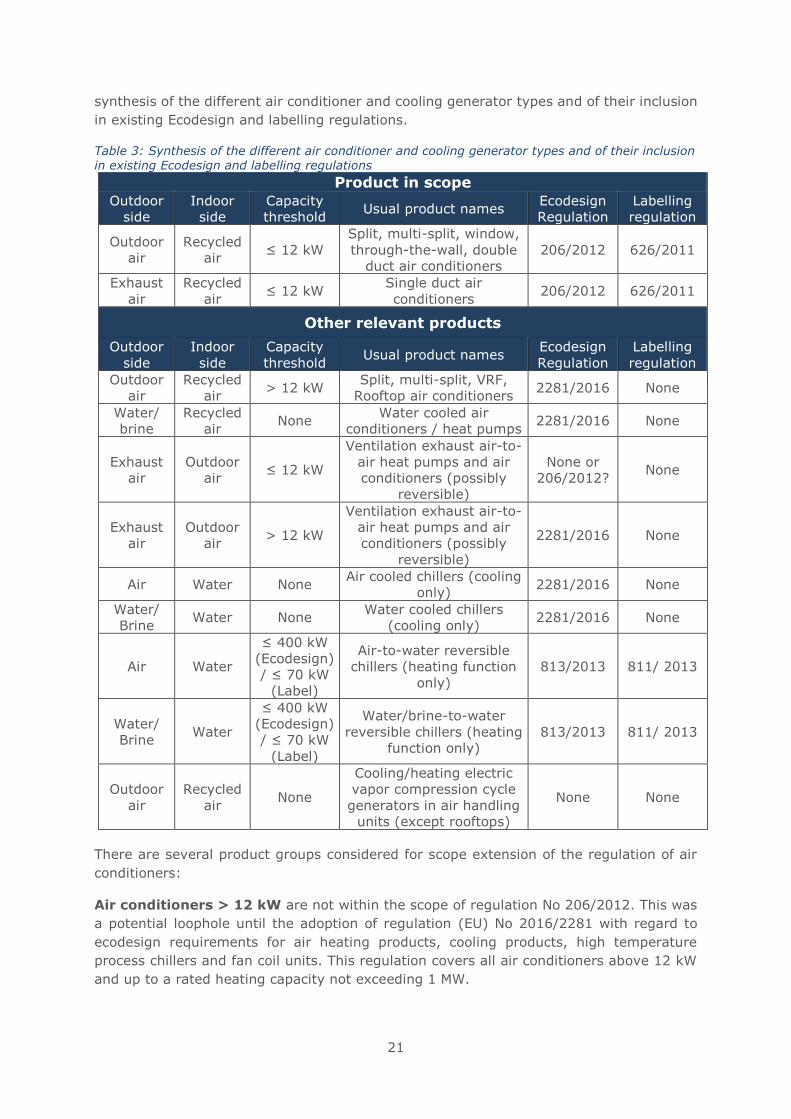
Table 3: Synthesis of the different air conditioner and cooling generator types and of their inclusion in existing Ecodesign and labelling regulations
Product in scope
Outdoor
side
Indoor
side
Capacity
threshold Usual product names
Ecodesign
Regulation
Labelling
regulation
Outdoor
air
Recycled
air ≤ 12 kW
Split, multi-split, window,
through-the-wall, double
duct air conditioners
206/2012 626/2011
Exhaust
air
Recycled
air ≤ 12 kW
Single duct air
conditioners 206/2012 626/2011
Other relevant products
Outdoor
side
Indoor
side
Capacity
threshold Usual product names
Ecodesign
Regulation
Labelling
regulation
Outdoor
air
Recycled
air > 12 kW
Split, multi-split, VRF,
Rooftop air conditioners 2281/2016 None
Water/
brine
Recycled
air None
Water cooled air
conditioners / heat pumps 2281/2016 None
Exhaust
air
Outdoor
air ≤ 12 kW
Ventilation exhaust air-to-
air heat pumps and air
conditioners (possibly
reversible)
None or
206/2012? None
Exhaust
air
Outdoor
air > 12 kW
Ventilation exhaust air-to-
air heat pumps and air
conditioners (possibly
reversible)
2281/2016 None
Air Water None Air cooled chillers (cooling
only) 2281/2016 None
Water/
Brine Water None
Water cooled chillers
(cooling only) 2281/2016 None
Air Water
≤ 400 kW
(Ecodesign)
/ ≤ 70 kW
(Label)
Air-to-water reversible
chillers (heating function
only)
813/2013 811/ 2013
Water/
Brine Water
≤ 400 kW
(Ecodesign)
/ ≤ 70 kW
(Label)
Water/brine-to-water
reversible chillers (heating
function only)
813/2013 811/ 2013
Outdoor
air
Recycled
air None
Cooling/heating electric
vapor compression cycle
generators in air handling
units (except rooftops)
None None
There are several product groups considered for scope extension of the regulation of air
conditioners:
Air conditioners > 12 kW are not within the scope of regulation No 206/2012. This was
a potential loophole until the adoption of regulation (EU) No 2016/2281 with regard to
ecodesign requirements for air heating products, cooling products, high temperature
process chillers and fan coil units. This regulation covers all air conditioners above 12 kW
and up to a rated heating capacity not exceeding 1 MW.
22
Water/brine-to-air air conditioners and heat pumps, which were not covered in
Regulation (EU) No 206/2012, are now covered by Regulation (EU) No 2016/2281: 'heat
generator' definition includes 'ambient air, ventilation exhaust air, water or ground heat
source(s)';'cold generator' definition specifies that heat extracted can be 'transferred to a
heat sink, such as ambient air, water or ground'. Ecodesign requirements regarding
water/brine-to-air air conditioners are information requirements defined in Annex II / 5 /
a / 4 of the Regulation (EU) No 2016/2281. Ecodesign requirements regarding water/brine-
to-air heat pumps are covered by information requirement in Annex II / 5 / a / 6 of
Regulation (EU) No 2016/2281.
Ventilation exhaust air-to-air heat pumps and air conditioners ≤ 12 kW are not
explicitly in the scope of regulation No 206/2012, nor are they clearly excluded, as the
type of indoor air used in the definition of air conditioners is unspecified ("a device capable
of cooling or heating, or both, indoor air"). These products with rated capacity of 12 kW
and above are quoted in regulation No 2016/2281 in the definition of 'heat pump'
Information requirements in regulation No 2016/2281 apply to them, although there is not
yet any part load conditions for these products to rate SEER and SCOP performances;
residential exhaust air-to-air heat pumps often have cooling / heating capacity ≤ 12 kW,
these are not currently included other regulations. It is advised to include these products
in the scope of Regulation (EU) No 206/2012 and 626/2011 when their thermal power is
below or equal to12 kW and to specify SEER and SCOP rating conditions. This also implies
better specification of which air is used indoor and outdoor for air conditioners and heat
pumps in Regulation (EU) No 206/2012. Test conditions for temperature and load to enable
calculation of SEER / SCOP are proposed in Annex 1 to this report.
Ventilation exhaust air-to-air heat pump and air conditioners > 12 kW appears to
be covered in Regulation (EU) No 2016/2281, 'ventilation exhaust air' is included in the
'heat generator' definition as a possible heat source; 'cold generator' definition specifies
that heat extracted can be 'transferred to a heat sink, such as ambient air, water or
ground', although it does not target explicitly 'ventilation exhaust air', it does not exclude
it. Standard rating conditions are given for these products in Regulation Annex III table
16. Information requirements table for both air-to-air air conditioners (Annex II table 11)
and air-to-air heat pumps (Annex II table 14) could be used. However, it should be noticed
that there is not yet any specific part load conditions defined for exhaust-air-to-outdoor-
air heat pump and air conditioners in EN14825:2016 nor in Regulation (EU) No 2016/2281.
Air or water cooled chillers (cooling only) are a possible air conditioner competitor in
residential or service premises. However, these are covered by regulation (EU) No
2016/2281.
Air-to-water reversible chillers are a possible air conditioner competitor in residential
or service premises. Regulation (EU) No 2016/2281 covers in general chillers, however it
should be noted that Commission Regulation (EU) No 813/2013 only covers the chiller
heating function. Thus, it is recommended also to include the cooling as the secondary
function of air-to-water reversible chillers when revising the Regulation (EU) No813/2013.
Water/brine-to-water reversible chillers are a possible air conditioner competitor in
residential or service premises. Regulation (EU) No 2016/2281 covers in general chillers,
however it should be noted that Commission Regulation (EU) No 813/2013 only cover the
chiller heating function only. Thus, it is recommended to include the cooling as the
23
secondary function of water / brine-to-water reversible chillers when revising the
Regulation (EU) No 813/2013.
Cooling generators in air handling units (except rooftops) are not sold separately
(as rooftop) but sold as a component of a specific air handling unit to pre-cool / pre-heat
fresh air. According information available to the study team, these are not included in any
EU Ecodesign or Labelling regulation. As a component of air handling units, these products
were considered in ENTR Lot 6 study for air-conditioning and ventilation systems, but they
were excluded from product scope because of low sales volumes. If cooling generators in
air handling units should be included in any regulation, it should then be in regulations
(EU) No 2016/2281 or in (EU) No 2014/1253.
Secondary functions of air conditioners
Air conditioners now commonly propose several functions in addition to heating and
cooling. This includes air purifying, dehumidification and air movement (only the indoor
fan is on). These additional functions are mentioned in Regulation (EU) No 206/2012
definition for air conditioners.
However, room air conditioning products with other primary functions than space
cooling/heating and air movement creation were excluded from the scope of preparatory
study for air conditioners based on their low market sales and consequent low EU energy
consumption. This regards in particular dehumidifiers and air purifiers. There was no
reliable data showing these markets became significant enough to justify ecodesign
measures, however it should be noted that these are growing markets. The preparatory
study to establish the Ecodesign Working Plan 2015-20174 reported a lack of data for EU-
27, and an estimated annual primary energy consumption of dehumidifiers of 0.25 TWh,
much greater consumption found for humidifiers of 23.6 TWh, especially steam humidifiers.
The dehumidification capability, measured by the sensible- heat ratio (SHR), is drastically
reduced when operating in cooling mode, according to EU test laboratories. It means that
to dehumidify, end-users would need to use the separate dehumidification mode of air
conditioners or to buy an additional equipment for dehumidifying in the cooling season.
However, there is presently no standardized operating conditions to establish the
performance of the dehumidification function of air conditioners.
Comfort fans
Comfort fans are covered by Regulation (EU) No 206/2012 and 626/2011 if their fan
power input is lower than 125 W.
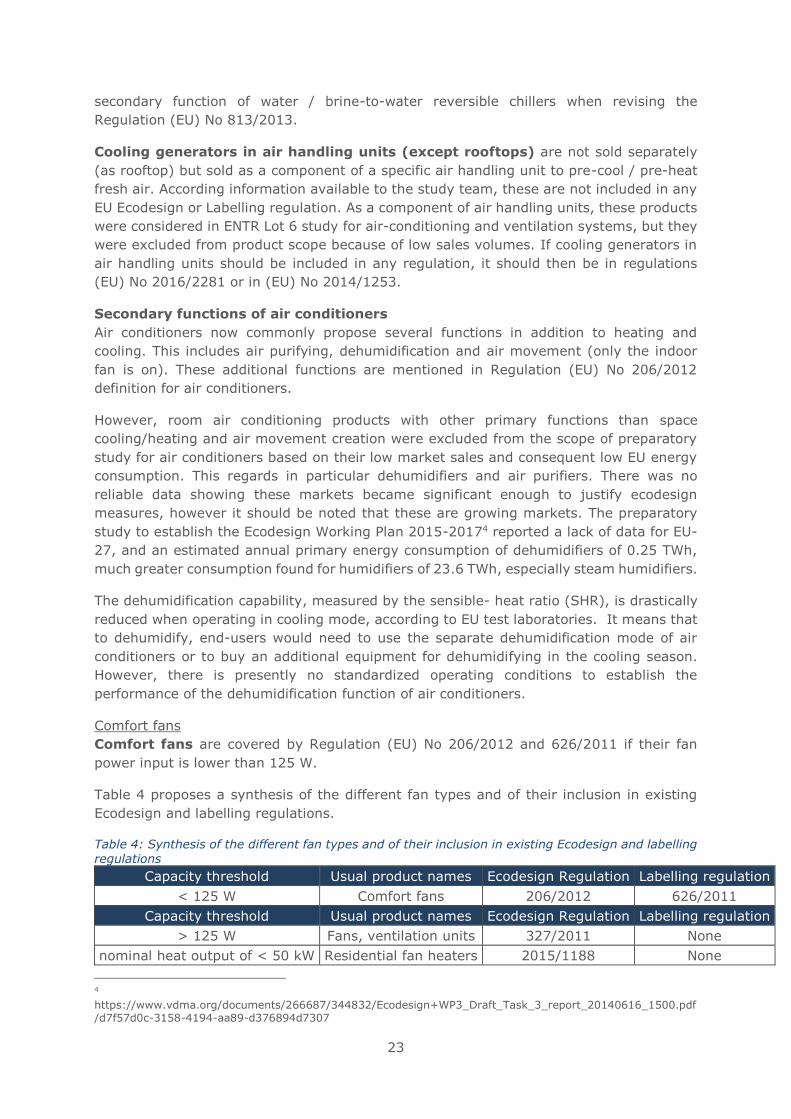
Table 4 proposes a synthesis of the different fan types and of their inclusion in existing
Ecodesign and labelling regulations.
Table 4: Synthesis of the different fan types and of their inclusion in existing Ecodesign and labelling regulations
Capacity threshold Usual product names Ecodesign Regulation Labelling regulation
< 125 W Comfort fans 206/2012 626/2011
Capacity threshold Usual product names Ecodesign Regulation Labelling regulation
> 125 W Fans, ventilation units 327/2011 None
nominal heat output of < 50 kW Residential fan heaters 2015/1188 None
4 https://www.vdma.org/documents/266687/344832/Ecodesign+WP3_Draft_Task_3_report_20140616_1500.pdf/d7f57d0c-3158-4194-aa89-d376894d7307
24
There are several product groups considered for scope extension of comfort fans however
the following assessment shows that none of the product groups requires modification of
the scope of the Regulation (EU) No 206/2012 and 626/2011. The product groups
considered are:
Comfort fans with ≥ 125 W input power are not within the scope of the regulation No
206/2012. Instead these products are included in the regulation (EU) No 327/2011 with
regard to ecodesign requirements for fans driven by motors with an electric input power
between 125 W and 500 kW. The current assessment shows that there is no loophole for
comfort fans with an input power of 125 W or above, and not necessary to extend the
scope of No 206/2012.
Residential fan heaters are not within the scope of the regulation No 206/2012 though
part of them are able to provide the same service as comfort fans when heating is turned
off; comfort fans are defined in Regulation No 206/2012 as ' appliance[s] primarily
designed for creating air movement around or on part of a human body for personal cooling
comfort', whereas the primary function of fan heaters is likely to be heating. Residential
fan heaters are included in the regulation (EU) No 2015/1188 for local space heaters and
are specified as a portable local room heater in the explanatory notes5.Hence their primary
function is already covered in Regulation (EU) No 2015/1188. With much higher energy
consumption for heating as compared to the comfort fan function only, ecodesign should
stay focused on the primary function. However, as they are able to compete with comfort
fans, it would have an added value for end-users to have comparable information for the
secondary function as is required for comfort fans. Thus, it is recommended to include
information requirement on the "air movement" function of residential fan heaters in
Regulation (EU) No 2015/1188 (similar to the information requirement for comfort fans in
Regulation 206/2012).
Evaporative coolers such as “misting fans” are not within the scope of Regulation No
206/2012, as the main principle for cooling is the evaporation of water, not air movement
created by a fan.
1.1.4 Recommended product scope
In conclusion, the scope of ecodesign regulations of different air cooling and heating
product are well aligned, however there are two concerns.
First of all, there is a possibility that ventilation exhaust air-to-air heat pumps and air
conditioners ≤ 12 kW are not clearly covered by any regulation. They are not especially
excluded from Regulation No 206/2012, hence it is recommended to include ventilation
exhaust air-to-air heat pumps and air conditioners with heating or cooling capacity ≤ 12
kW in the revised scope. The draft definitions of exhaust air-to-air heat pumps and air
conditioners are:
• ‘Ventilation exhaust air to outdoor air heat pump” means a heat pump that extracts
heat from the exhaust air of a building to supply it to the ventilation supply air for
the thermal comfort of human beings by a compression cycle or a sorption cycle.
The ventilation outdoor air passes through the condenser of the heat pump before
entering the building. The exhaust air passes through the evaporator of the heat
5 http://edit.eceee.org/ecodesign/products/solid_fuel_small_combustion_installations/LRHS-20120716ExplanatoryNotesFINAL.PDF
25
pump before being rejected outdoors. The unit can also be equipped with a heat
recovery heat exchanger.
• ‘Ventilation exhaust air to outdoor air conditioner” means an air conditioner that
extracts heat from the ventilation inlet air of a building to supply it to the ventilation
exhaust air for the thermal comfort of human beings by a compression cycle or a
sorption cycle. The ventilation outdoor air passes through the evaporator of the air
conditioner before entering the building. The exhaust air passes through the
condenser of the air conditioner before being rejected outdoors. The unit can also
be equipped with a heat recovery heat exchanger.
The definition of a heat pump and air-to-air heat pump will also be added to the regulation.
The definitions will be adapted from Regulation (EU) No 2016/2281 and are described
above in section 1.1.1.2. Secondly, an additional function of residential fan heaters,
currently covered by Regulation (EU) No 2015/1188, could be “creating air movement
around or on part of a human body for personal cooling comfort”. This means it could be
a competitor for comfort fans, information requirements on the “air movement” function
of residential fan heaters could give end-users valuable comparable information. It is
recommended that during the revision of Regulation (EU) No 2015/1188, similar
information requirements for comfort fans are proposed for residential fan heaters
targeting this secondary function. However, these are not proposed to be included in
Regulation No 206/2012.
Regarding cooling and heating, the regulation (EU) No 2012/206 did not include non-
electric energy sources. In fact, there is presently no product using gas or other energy
sources besides electricity for air conditioners. Extending the scope of Regulation (EU) No
206/2012 to non-electric energy sources would make it difficult for manufacturers to design
products using non-electric energy sources, as they may not be able to reach the efficiency
limit, at the same time it may also hinder innovation for air conditioners using renewable
energy sources, such as biogas. Consequently, it is advised to keep non-electric energy
sources outside of the scope.
The exemptions to the product scope are still as follows:
a. appliances that use non-electric energy sources;
b. air conditioners of which the condenser side or evaporator side, or both, do
not use air for heat transfer medium.
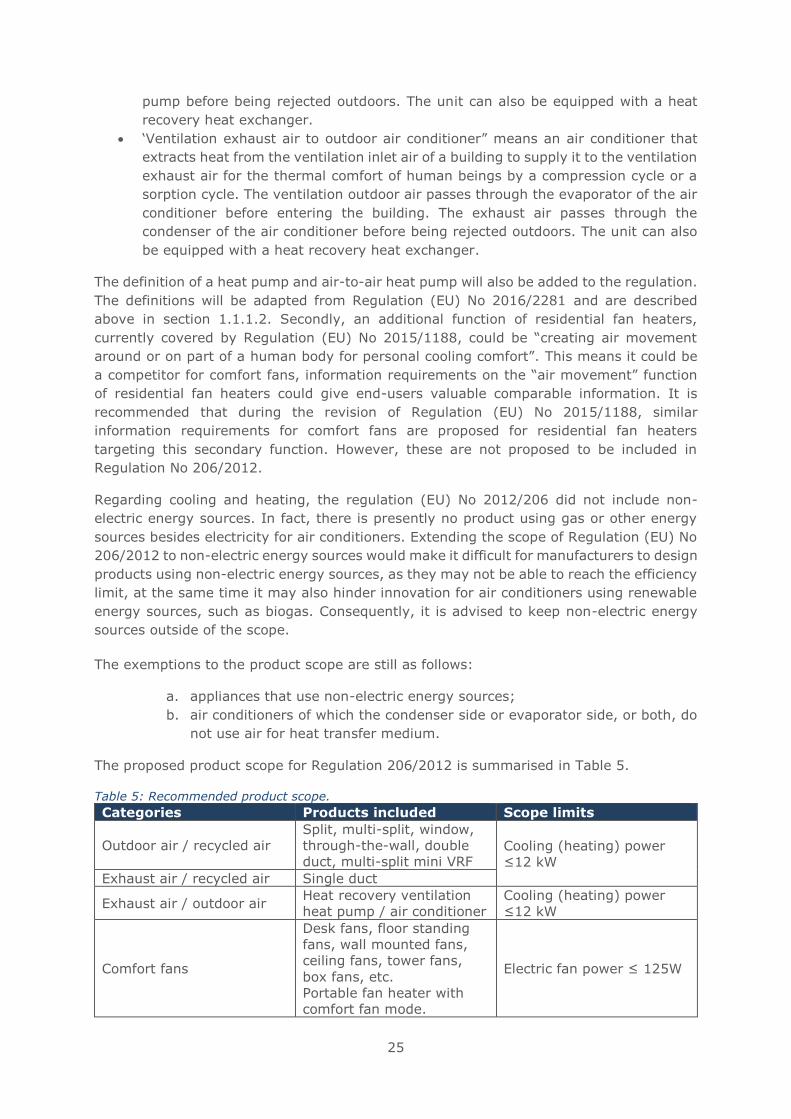
The proposed product scope for Regulation 206/2012 is summarised in Table 5.
Table 5: Recommended product scope.
Categories Products included Scope limits
Outdoor air / recycled air
Split, multi-split, window,
through-the-wall, double
duct, multi-split mini VRF Cooling (heating) power
≤12 kW
Exhaust air / recycled air Single duct
Exhaust air / outdoor air Heat recovery ventilation
heat pump / air conditioner
Cooling (heating) power
≤12 kW
Comfort fans
Desk fans, floor standing
fans, wall mounted fans,
ceiling fans, tower fans,
box fans, etc.
Portable fan heater with
comfort fan mode.
Electric fan power ≤ 125W
26
1.2 Test standards (EU, Member State and third country level)
There is a significant number of EN standards either published, or under development, to
support European Union environmental legislation. To a certain extent, they cover air
conditioners. This relevant EU environmental legislation includes:
• Ecodesign Directive6
• Machinery Directive7
• Waste Electrical and Electronic Equipment Directive (WEEE)8
• Restriction of Hazardous Substances Directive (RoHS)9
• Electromagnetic Compatibility Directive (EMC)10
• Low Voltage Directive (LVD)11
• Registration, Evaluation, Authorisation, and Restriction of Chemicals (REACH)
Regulation12
• Regulation EU 517/2014 regarding fluorinated greenhouse gases
We focus hereafter on main standards as regards air conditioners and comfort fans, which
are described by main domain:
• Energy performance for primary function
• Energy performance for secondary functions of air conditioners
• Noise
• Safety (including refrigerant and electricity)
• WEEE and RoHS standards
1.2.1 Energy performance for primary functions
According to the preparatory study13, the main environmental impact of products in the
scope of Regulation 206/2012 and 626/2011 is due to energy consumption in the use
phase. Standards related to rating the energy performance of air conditioning and comfort
fans are described below.
1.2.1.1 European standards
Standards regarding energy performance of EU Regulation 206/2012/EU and EU Regulation
– 626/2011 are:
• EN14511 which defines the rated performance and measurement methods to be
used for all air conditioners in cooling and in heating mode, with the exception of
air conditioners with evaporatively-cooled condensers whose ratings are defined in
EN15218 standard.
• For other than single duct, double duct and evaporatively cooled air conditioners,
the standard EN14825 defines the calculation and testing points to calculate the
seasonal energy efficiency (SEER) and seasonal coefficient of performance (SCOP)
and completes where required measurement methods defined in standard
EN14511.
6 http://eur-lex.europa.eu/legal-content/EN/TXT/?uri=CELEX:32009L0125 7 http://eur-lex.europa.eu/legal-content/EN/TXT/HTML/?uri=CELEX:32006L0042&from=FR 8 http://eur-lex.europa.eu/legal-content/EN/TXT/?uri=CELEX:32012L0019 9 http://eur-lex.europa.eu/legal-content/EN/TXT/?uri=CELEX:32011L0065 10 http://eur-lex.europa.eu/legal-content/EN/TXT/?uri=CELEX:32004L0108 11 http://eur-lex.europa.eu/legal-content/EN/TXT/?uri=CELEX:32014L0035 12 http://eur-lex.europa.eu/legal-content/EN/TXT/?uri=CELEX:32006R1907 13 Preparatory study on the environmental performance of residential room conditioning appliances (airco and ventilation), Contract TREN/D1/40-2005/LOT10/S07.56606. CO-ORDINATOR: Philippe RIVIERE, ARMINES, France. Air conditioners, final report. December 2008. This report can be downloaded from DG ENERGY website: https://ec.europa.eu/energy/en/topics/energy-efficiency/energy-efficient-products.
27
• Standby and off mode power consumption measurement method is specified in
EN14511-3 for single duct and double duct air conditioners, in EN15218 for
evaporatively cooled single duct or double duct air conditioners and in the EN14825
standard for other air conditioners. For comfort fans, the horizontal standard for
measurement of standby and off mode consumption indicated in the transitional
methods14 is EN60321:2005, now replaced with EN50564:2011.
• Regarding the energy efficiency of comfort fan, measured through their service
value (SV) (m3.min-1.W-1), there is no harmonized standard and transitional
methods refer to standard IEC 60879:1986/COR1:1992, which is described in the
International standards section.
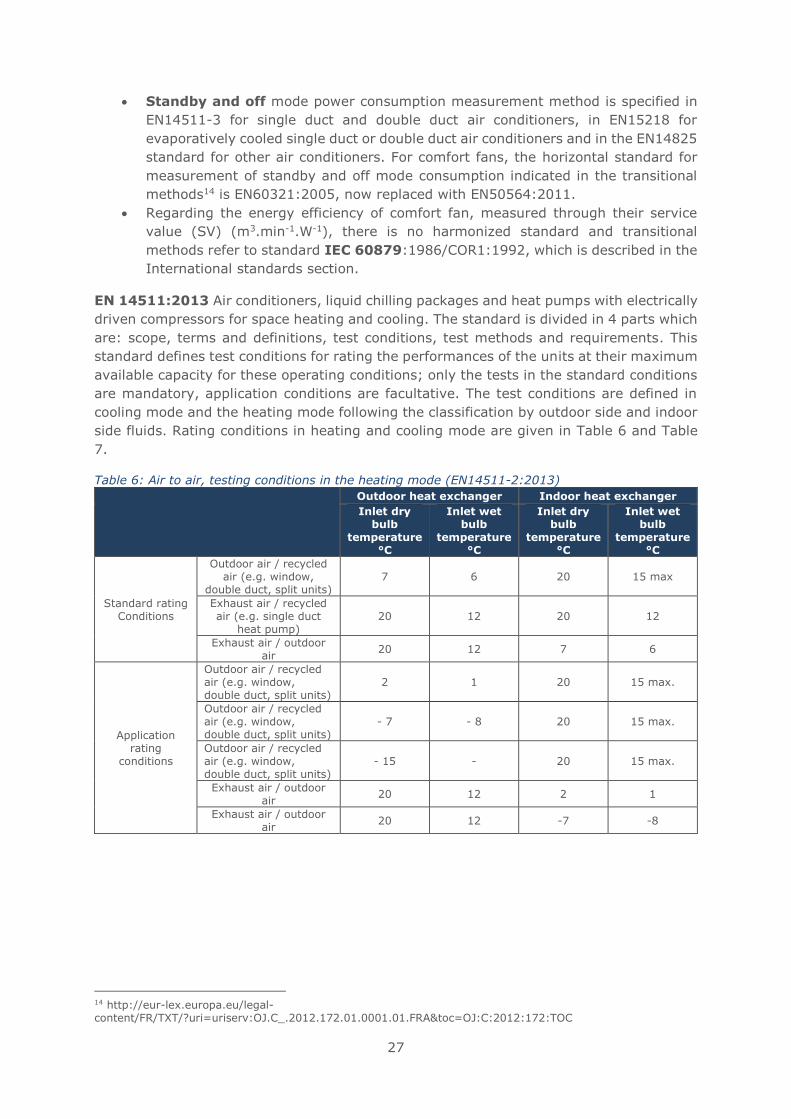
EN 14511:2013 Air conditioners, liquid chilling packages and heat pumps with electrically
driven compressors for space heating and cooling. The standard is divided in 4 parts which
are: scope, terms and definitions, test conditions, test methods and requirements. This
standard defines test conditions for rating the performances of the units at their maximum
available capacity for these operating conditions; only the tests in the standard conditions
are mandatory, application conditions are facultative. The test conditions are defined in
cooling mode and the heating mode following the classification by outdoor side and indoor
side fluids. Rating conditions in heating and cooling mode are given in Table 6 and Table
7.
Table 6: Air to air, testing conditions in the heating mode (EN14511-2:2013)
Outdoor heat exchanger Indoor heat exchanger
Inlet dry bulb
temperature °C
Inlet wet bulb
temperature °C
Inlet dry bulb
temperature °C
Inlet wet bulb
temperature °C
Standard rating Conditions
Outdoor air / recycled air (e.g. window,
double duct, split units) 7 6 20 15 max
Exhaust air / recycled air (e.g. single duct
heat pump) 20 12 20 12
Exhaust air / outdoor air
20 12 7 6
Application rating
conditions
Outdoor air / recycled air (e.g. window, double duct, split units)
2 1 20 15 max.
Outdoor air / recycled air (e.g. window, double duct, split units)
- 7 - 8 20 15 max.
Outdoor air / recycled air (e.g. window, double duct, split units)
- 15 - 20 15 max.
Exhaust air / outdoor air
20 12 2 1
Exhaust air / outdoor air
20 12 -7 -8
14 http://eur-lex.europa.eu/legal-content/FR/TXT/?uri=uriserv:OJ.C_.2012.172.01.0001.01.FRA&toc=OJ:C:2012:172:TOC
28
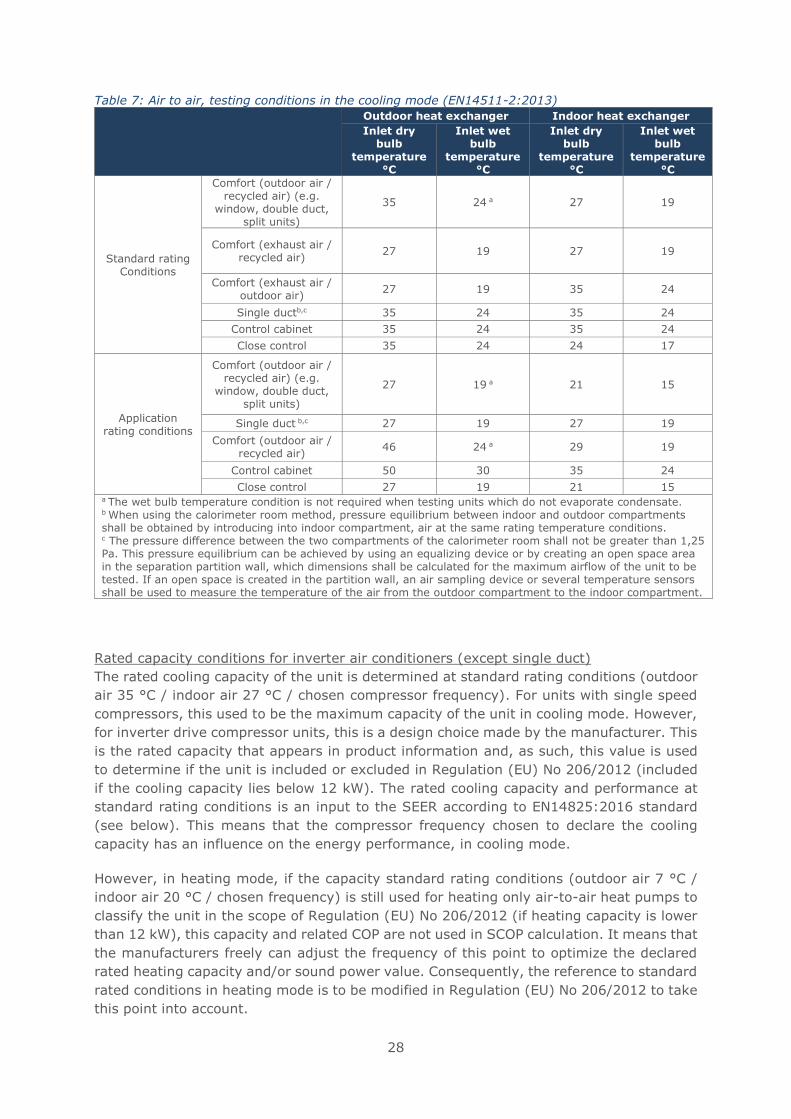
Table 7: Air to air, testing conditions in the cooling mode (EN14511-2:2013)
Outdoor heat exchanger Indoor heat exchanger
Inlet dry bulb
temperature °C
Inlet wet bulb
temperature °C
Inlet dry bulb
temperature °C
Inlet wet bulb
temperature °C
Standard rating Conditions
Comfort (outdoor air / recycled air) (e.g.
window, double duct, split units)
35 24 a 27 19
Comfort (exhaust air / recycled air)
27 19 27 19
Comfort (exhaust air / outdoor air)
27 19 35 24
Single ductb,c 35 24 35 24
Control cabinet 35 24 35 24
Close control 35 24 24 17
Application rating conditions
Comfort (outdoor air / recycled air) (e.g.
window, double duct, split units)
27 19 a 21 15
Single duct b,c 27 19 27 19
Comfort (outdoor air / recycled air)
46 24 a 29 19
Control cabinet 50 30 35 24
Close control 27 19 21 15 a The wet bulb temperature condition is not required when testing units which do not evaporate condensate. b When using the calorimeter room method, pressure equilibrium between indoor and outdoor compartments shall be obtained by introducing into indoor compartment, air at the same rating temperature conditions. c The pressure difference between the two compartments of the calorimeter room shall not be greater than 1,25 Pa. This pressure equilibrium can be achieved by using an equalizing device or by creating an open space area in the separation partition wall, which dimensions shall be calculated for the maximum airflow of the unit to be tested. If an open space is created in the partition wall, an air sampling device or several temperature sensors shall be used to measure the temperature of the air from the outdoor compartment to the indoor compartment.
Rated capacity conditions for inverter air conditioners (except single duct)
The rated cooling capacity of the unit is determined at standard rating conditions (outdoor
air 35 °C / indoor air 27 °C / chosen compressor frequency). For units with single speed
compressors, this used to be the maximum capacity of the unit in cooling mode. However,
for inverter drive compressor units, this is a design choice made by the manufacturer. This
is the rated capacity that appears in product information and, as such, this value is used
to determine if the unit is included or excluded in Regulation (EU) No 206/2012 (included
if the cooling capacity lies below 12 kW). The rated cooling capacity and performance at
standard rating conditions is an input to the SEER according to EN14825:2016 standard
(see below). This means that the compressor frequency chosen to declare the cooling
capacity has an influence on the energy performance, in cooling mode.
However, in heating mode, if the capacity standard rating conditions (outdoor air 7 °C /
indoor air 20 °C / chosen frequency) is still used for heating only air-to-air heat pumps to
classify the unit in the scope of Regulation (EU) No 206/2012 (if heating capacity is lower
than 12 kW), this capacity and related COP are not used in SCOP calculation. It means that
the manufacturers freely can adjust the frequency of this point to optimize the declared
rated heating capacity and/or sound power value. Consequently, the reference to standard
rated conditions in heating mode is to be modified in Regulation (EU) No 206/2012 to take
this point into account.
29
Testing method, measurement uncertainty
Two testing methods are defined, namely the enthalpy method, which consists in the direct
measurement of the thermal (heating or cooling) capacity by measurement of air flow rates
and inlet and outlet enthalpies. The other method is the indirect “calorimeter room” method
that measures the heat (and water for the cooling mode) that have been removed from
the ambiance by the indoor heat exchanger. This latter method is reputed less uncertain
than the direct measurement method. It is explicitly mentioned that "the cooling capacity
of air conditioners and of air-to-air heat pumps having a cooling capacity below or equal
to 12 kW shall be determined by measurements in a calorimeter room". There is a problem
to test multisplit units with too many indoor units for all EU test laboratories (the precise
number varies depending on the indoor unit type and the test cell size, but for instance it
is not possible to test more than 4 indoor wall units).
The same test method is to be used at standard rating conditions and at part load as
EN14825 standard refers to EN14511-3 as regards steady state test methods.
Maximum values regarding uncertainty of measurement are defined:
• 5 %, for steady state heating or cooling capacities, using the calorimeter room,
except for single duct because of the air exchange between the indoor and outdoor
compartments for which 10% is required,
• 10 % for transient tests (defrost cycles) and when using the direct measurement
on the air side.
For single duct air conditioners and double duct air conditioners, the cooling capacity
delivered to the indoor side heat exchanger is decreased in real life conditions because of
unbalanced air flows at condenser side. For single duct air conditioners, the air flow
entering the condenser and leaving the building must be balanced by hot air entering the
building. If the outdoor air temperature is higher than the indoor air set point (27 °C), hot
air is introduced into the building and this decreases the real-life capacity of the unit. This
infiltration effect is not taken into account for single duct air conditioners because both
indoor and outdoor air set points are 27 °C so that the effect of infiltration of outdoor air
is null. For double duct units, infiltration occurs in case of condenser air flow leakage into
the building. This is however already considered in the present EN14511-3 test standard.
A second effect is that with hot air circulating in ducts inside the building there are heat
leaks to the conditioned space (in the case of double duct to be installed directly on the
wall, this is probably minimal). This heat is considered in the calorimeter room method but
the conditions of tests consider a shorter duct connection(s) for testing constraints than
supplied by manufacturers. This effect is then minimized. In addition, the effect is not
quantified.
Fan correction
For ducted units, with available static pressure, a correction is made to account only for a
portion of the fan electric consumption. For indoor units, the cooling / heating capacity is
also corrected.
The standard specifies that: "If a fan is an integral part of the unit (this is the normal
situation for products in scope of this study and mainly regards ducted split and multi-split
air conditioners), only a fraction of the input of the fan motor shall be included in the
effective power absorbed by the unit. The fraction that is to be excluded from the total
power absorbed by the unit shall be calculated using the following formula":
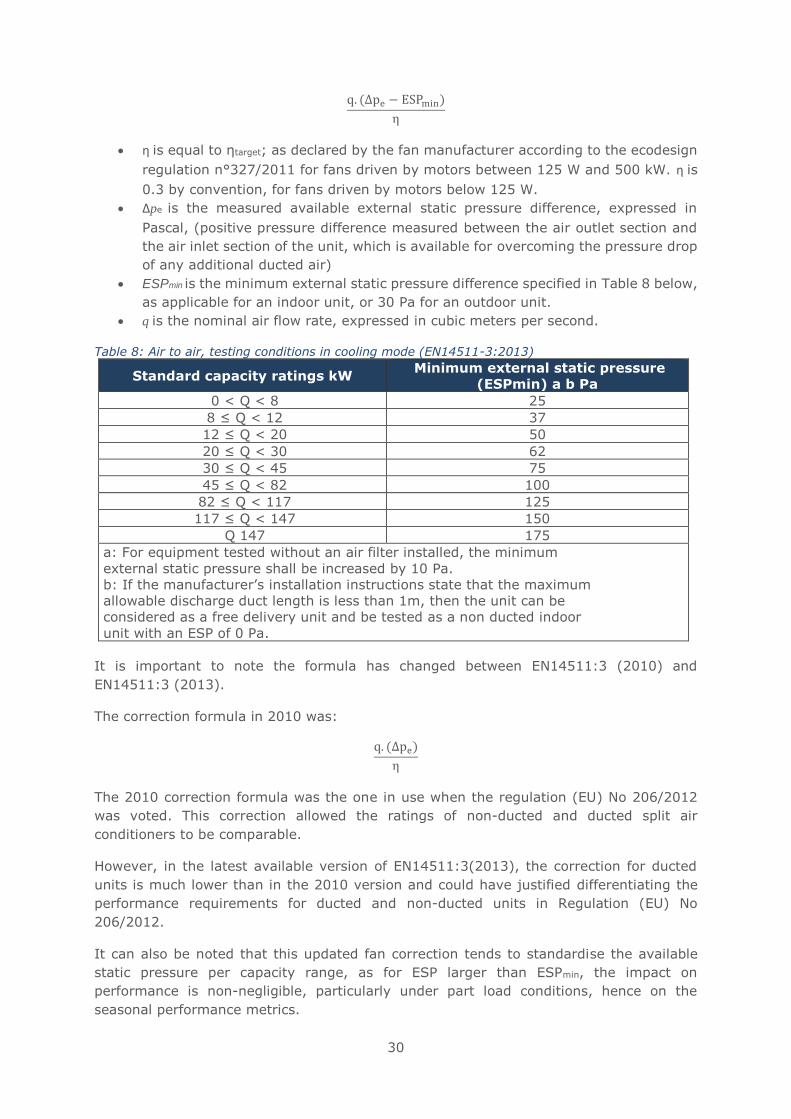
30
q. (∆pe − ESPmin)
η
• η is equal to ηtarget; as declared by the fan manufacturer according to the ecodesign
regulation n°327/2011 for fans driven by motors between 125 W and 500 kW. η is
0.3 by convention, for fans driven by motors below 125 W.
• Δpe is the measured available external static pressure difference, expressed in
Pascal, (positive pressure difference measured between the air outlet section and
the air inlet section of the unit, which is available for overcoming the pressure drop
of any additional ducted air)
• ESPmin is the minimum external static pressure difference specified in Table 8 below,
as applicable for an indoor unit, or 30 Pa for an outdoor unit.
• q is the nominal air flow rate, expressed in cubic meters per second.
Table 8: Air to air, testing conditions in cooling mode (EN14511-3:2013)
Standard capacity ratings kW Minimum external static pressure
(ESPmin) a b Pa
0 < Q < 8 25
8 ≤ Q < 12 37
12 ≤ Q < 20 50
20 ≤ Q < 30 62
30 ≤ Q < 45 75
45 ≤ Q < 82 100
82 ≤ Q < 117 125
117 ≤ Q < 147 150
Q 147 175
a: For equipment tested without an air filter installed, the minimum
external static pressure shall be increased by 10 Pa.
b: If the manufacturer’s installation instructions state that the maximum
allowable discharge duct length is less than 1m, then the unit can be
considered as a free delivery unit and be tested as a non ducted indoor
unit with an ESP of 0 Pa.
It is important to note the formula has changed between EN14511:3 (2010) and
EN14511:3 (2013).
The correction formula in 2010 was:
q. (∆pe)
η
The 2010 correction formula was the one in use when the regulation (EU) No 206/2012
was voted. This correction allowed the ratings of non-ducted and ducted split air
conditioners to be comparable.
However, in the latest available version of EN14511:3(2013), the correction for ducted
units is much lower than in the 2010 version and could have justified differentiating the
performance requirements for ducted and non-ducted units in Regulation (EU) No
206/2012.
It can also be noted that this updated fan correction tends to standardise the available
static pressure per capacity range, as for ESP larger than ESPmin, the impact on
performance is non-negligible, particularly under part load conditions, hence on the
seasonal performance metrics.
31
There is a revision of EN14511:3 standard in progress (prEN14511-3:2017), which
reinstates the 2010 formula in the future. This is a point to be followed for setting specific
requirements of future regulations. Indeed, present published values for ducted fix air
conditioners and heat pumps have lower performances that after this standard is enforced.
Standby and off for single duct and double duct air conditioners
After the cooling (heating) rating test, in cooling (heating) mode for cooling only and
reversible units (for heating only units), the unit is switched in standby mode with the
control device if available. After 10 minutes, the residual energy consumption is measured
and assumed to be the standby consumption. It is not stated if network standby
consumption is included in the value measured.
Rating of multisplit air conditioners and heat pumps
An informative annex (I), indicates that to rate multisplit units, the power of the indoor
unit is to be included in the ratings. The capacity ratio (ratio of the capacity for outdoor
unit to the sum of the capacities of indoor units) is set to 100 % +/- 5 %. The Regulation
(EU) No 206/2012 specifies a ratio of 1 should be used. Note the ratio in EN14511:3 is
supposed to apply to thermal capacities before potential fan corrections (for ducted units).
Operating requirements, marking and instructions
Supplementary requirements are defined in this part:
• a starting test,
• a test at maximum operating conditions (cooling mode),
• a freeze-up test,
• a test outside the operating range,
• a safety test consisting in shutting off the heat transfer medium flows,
• a complete power supply failure test,
• a condensate draining and enclosure sweat test,
• ability to defrost for air-to-air and air-to-water heat pumps.
Instruction is given for the information that should be marked on the plate of the unit
(manufacturer and model designation and rated performances).
The information that should be published in the technical documentation of the unit is also
described. This information is available to installers or design engineers. It entails:
• a general description (trademark, model designation; power supply (voltage,
frequency); denomination of the unit (e.g.: air-to-water); intended use of the unit
(e.g.: control cabinet air conditioner); number of separate component units; type
and mass of refrigerant charge; overall dimensions and weight of each separate
component unit;
• Rating characteristics: the cooling capacity, the effective power input, the EER
(EER: Energy Efficiency Ratio) and the SHR (where applicable - the SHR stands for
Sensible Heat Ratio); the heating capacity, the effective power input and the COP
(Coefficient of Performance) (where applicable); the heat recovery capacity and the
type of liquid (where applicable);
• Additional characteristics: flow rates, the rotational speed of fans and external static
pressure for ducted units.
• The sound power level and the corresponding test method according to EN 12102.
• Electrical characteristics according to with EN 60335-2-40 (domestic air
conditioners and heat pumps) or EN 60204-1 (non domestic)
32
• The operating range
• A physical description of the unit (fluids including oil type, additional heating
devices, control and safety information)
• Instructions for installation
• Instructions for maintenance
• instruction for test house (how to set the required frequencies to reach specified
ratings).
As SHR is not commonly communicated in general product documentation (only in the
technical documentation), there is no information on the capacity of the unit to dehumidify
when working in cooling mode.
Also, despite most air conditioners now propose a dehumidification mode, there is no
information required on these alternate modes.
Hence, information to the end-users on dehumidification is absent. This may be a problem
in hot and humid parts of Europe (mainly the Mediterranean area), especially since the
dehumidification capacity of modern inverter air conditioning units in cooling mode is low.
It prevents the end-user to compare the dehumidification capability of the unit with
alternatives (dedicated dehumidifiers).
The same is true for ventilation mode, also the impact for the end-user is probably much
lower.
EN 15218:2013 Air conditioners and liquid chilling packages with evaporatively cooled
condenser and with electrically driven compressors for space cooling — Terms, definitions,
test conditions, test methods and requirements
This standard is dedicated to evaporatively cooled air conditioners for space cooling having
their condenser cooled by air and by the evaporation of external additional water. Air
conditioners evaporating the indoor condensates at their condenser are excluded (included
in the EN 14511 standard) since the water must be “external”, except if they have a water
tank that can be filled in also with external water. Inside dry and humid bulb temperatures
of rating conditions are compatible with the EN14511 standard.
This standard defines the water temperature to be used for those tests:
• for evaporatively cooled condenser air conditioner with continuous water supply
circuit, a single water temperature of 15 °C is used,
• for evaporatively cooled condenser air conditioner with a water tank, water
temperature is set to 35 °C for air-to-air air conditioners.
As compared to 2006 version, the standard has been complemented to satisfy information
requirement and standby and off mode measurement for evaporatively cooled single duct
and double duct air conditioners, as requested by European regulations 206/2012 and
626/2011. For standby and off mode measurement, it is not stated if network standby
consumption is included in the value measured.
EN 14825:2016 Air conditioners, liquid chilling packages and heat pumps, with electrically
driven compressors, for space heating and cooling — Testing and rating at part load
conditions and calculation of seasonal performance.
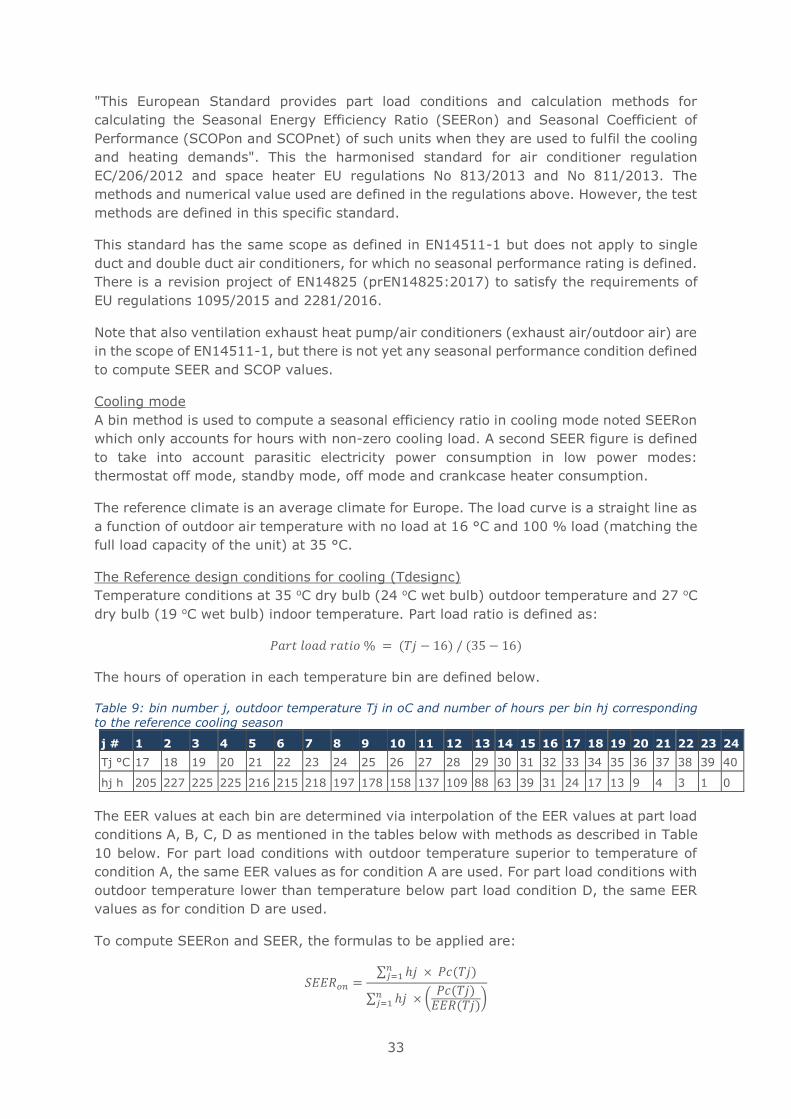
33
"This European Standard provides part load conditions and calculation methods for
calculating the Seasonal Energy Efficiency Ratio (SEERon) and Seasonal Coefficient of
Performance (SCOPon and SCOPnet) of such units when they are used to fulfil the cooling
and heating demands". This the harmonised standard for air conditioner regulation
EC/206/2012 and space heater EU regulations No 813/2013 and No 811/2013. The
methods and numerical value used are defined in the regulations above. However, the test
methods are defined in this specific standard.
This standard has the same scope as defined in EN14511-1 but does not apply to single
duct and double duct air conditioners, for which no seasonal performance rating is defined.
There is a revision project of EN14825 (prEN14825:2017) to satisfy the requirements of
EU regulations 1095/2015 and 2281/2016.
Note that also ventilation exhaust heat pump/air conditioners (exhaust air/outdoor air) are
in the scope of EN14511-1, but there is not yet any seasonal performance condition defined
to compute SEER and SCOP values.
Cooling mode
A bin method is used to compute a seasonal efficiency ratio in cooling mode noted SEERon
which only accounts for hours with non-zero cooling load. A second SEER figure is defined
to take into account parasitic electricity power consumption in low power modes:
thermostat off mode, standby mode, off mode and crankcase heater consumption.
The reference climate is an average climate for Europe. The load curve is a straight line as
a function of outdoor air temperature with no load at 16 °C and 100 % load (matching the
full load capacity of the unit) at 35 °C.
The Reference design conditions for cooling (Tdesignc)
Temperature conditions at 35 oC dry bulb (24 oC wet bulb) outdoor temperature and 27 oC
dry bulb (19 oC wet bulb) indoor temperature. Part load ratio is defined as:
𝑃𝑎𝑟𝑡 𝑙𝑜𝑎𝑑 𝑟𝑎𝑡𝑖𝑜 % = (𝑇𝑗 − 16) / (35 − 16)
The hours of operation in each temperature bin are defined below.
Table 9: bin number j, outdoor temperature Tj in oC and number of hours per bin hj corresponding to the reference cooling season
j # 1 2 3 4 5 6 7 8 9 10 11 12 13 14 15 16 17 18 19 20 21 22 23 24
Tj °C 17 18 19 20 21 22 23 24 25 26 27 28 29 30 31 32 33 34 35 36 37 38 39 40
hj h 205 227 225 225 216 215 218 197 178 158 137 109 88 63 39 31 24 17 13 9 4 3 1 0
The EER values at each bin are determined via interpolation of the EER values at part load
conditions A, B, C, D as mentioned in the tables below with methods as described in Table
10 below. For part load conditions with outdoor temperature superior to temperature of
condition A, the same EER values as for condition A are used. For part load conditions with
outdoor temperature lower than temperature below part load condition D, the same EER
values as for condition D are used.
To compute SEERon and SEER, the formulas to be applied are:
𝑆𝐸𝐸𝑅𝑜𝑛 =∑ ℎ𝑗 × 𝑃𝑐(𝑇𝑗)𝑛
𝑗=1
∑ ℎ𝑗 × (𝑃𝑐(𝑇𝑗)
𝐸𝐸𝑅(𝑇𝑗))𝑛
𝑗=1
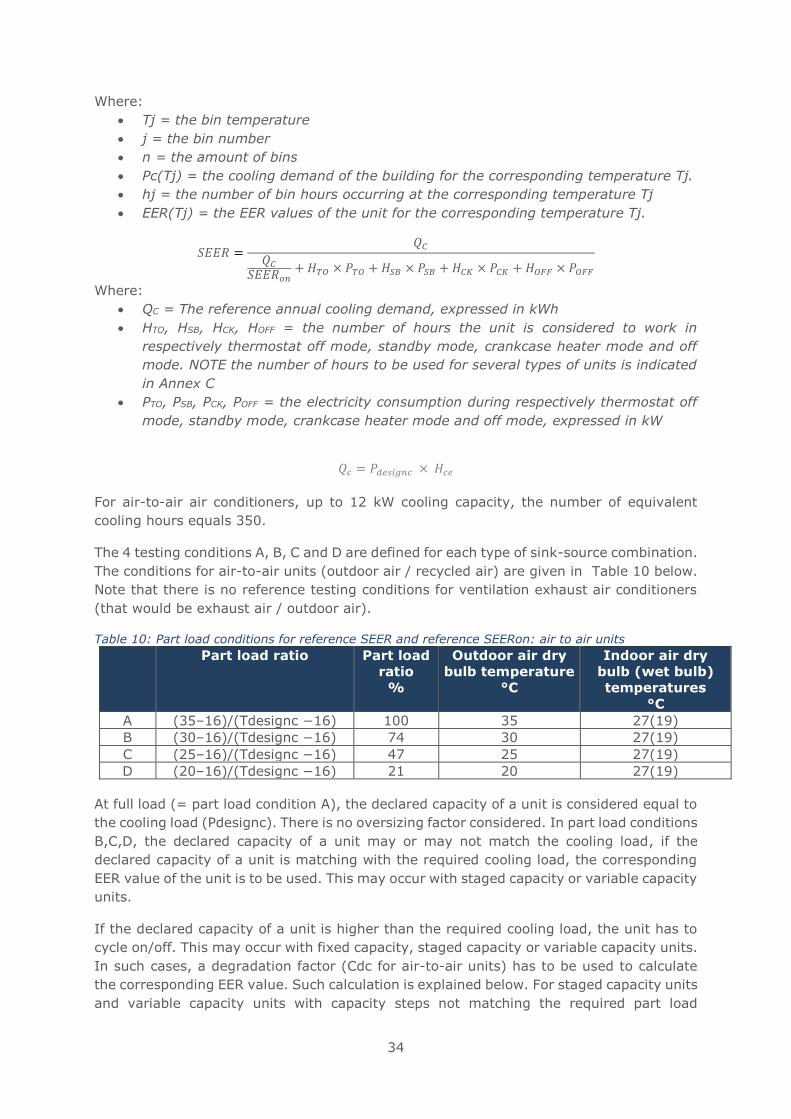
34
Where:
• Tj = the bin temperature
• j = the bin number
• n = the amount of bins
• Pc(Tj) = the cooling demand of the building for the corresponding temperature Tj.
• hj = the number of bin hours occurring at the corresponding temperature Tj
• EER(Tj) = the EER values of the unit for the corresponding temperature Tj.
𝑆𝐸𝐸𝑅 =𝑄𝐶
𝑄𝐶
𝑆𝐸𝐸𝑅𝑜𝑛+ 𝐻𝑇𝑂 × 𝑃𝑇𝑂 + 𝐻𝑆𝐵 × 𝑃𝑆𝐵 + 𝐻𝐶𝐾 × 𝑃𝐶𝐾 + 𝐻𝑂𝐹𝐹 × 𝑃𝑂𝐹𝐹
Where:
• QC = The reference annual cooling demand, expressed in kWh
• HTO, HSB, HCK, HOFF = the number of hours the unit is considered to work in
respectively thermostat off mode, standby mode, crankcase heater mode and off
mode. NOTE the number of hours to be used for several types of units is indicated
in Annex C
• PTO, PSB, PCK, POFF = the electricity consumption during respectively thermostat off
mode, standby mode, crankcase heater mode and off mode, expressed in kW
𝑄𝑐 = 𝑃𝑑𝑒𝑠𝑖𝑔𝑛𝑐 × 𝐻𝑐𝑒
For air-to-air air conditioners, up to 12 kW cooling capacity, the number of equivalent
cooling hours equals 350.
The 4 testing conditions A, B, C and D are defined for each type of sink-source combination.
The conditions for air-to-air units (outdoor air / recycled air) are given in Table 10 below.
Note that there is no reference testing conditions for ventilation exhaust air conditioners
(that would be exhaust air / outdoor air).
Table 10: Part load conditions for reference SEER and reference SEERon: air to air units Part load ratio Part load
ratio
%
Outdoor air dry
bulb temperature
°C
Indoor air dry
bulb (wet bulb)
temperatures
°C
A (35–16)/(Tdesignc −16) 100 35 27(19)
B (30–16)/(Tdesignc −16) 74 30 27(19)
C (25–16)/(Tdesignc −16) 47 25 27(19)
D (20–16)/(Tdesignc −16) 21 20 27(19)
At full load (= part load condition A), the declared capacity of a unit is considered equal to
the cooling load (Pdesignc). There is no oversizing factor considered. In part load conditions
B,C,D, the declared capacity of a unit may or may not match the cooling load, if the
declared capacity of a unit is matching with the required cooling load, the corresponding
EER value of the unit is to be used. This may occur with staged capacity or variable capacity
units.
If the declared capacity of a unit is higher than the required cooling load, the unit has to
cycle on/off. This may occur with fixed capacity, staged capacity or variable capacity units.
In such cases, a degradation factor (Cdc for air-to-air units) has to be used to calculate
the corresponding EER value. Such calculation is explained below. For staged capacity units
and variable capacity units with capacity steps not matching the required part load
35
conditions (+/- 10 % of DC for capacity staged and variable capacity units), EERx (with
x=B, C or D) should be computed by linear interpolation of the cooling capacity and of the
power input between the capacity stages the closest to the part load required for the same
temperature conditions or alternatively using the cycling formula below.
Cdc correction for air to air air conditioners
𝐸𝐸𝑅𝑏𝑖𝑛 = 𝐸𝐸𝑅𝑑 × (1 − 𝐶𝑑𝑐 × (1 − 𝐶𝑅))
Where:
• EERd = the EER corresponding to the declared capacity (DC) of the unit at the
same temperature conditions as for part load conditions B, C, D
• Cdc = the degradation coefficient
• CR = is the capacity ratio, the ratio of the cooling demand (Pc) over the declared
capacity (DC) of the unit at the same temperature conditions
The Cdc value can be determined or by default be 0.25. It takes into account both the
power consumption of the unit when the compressor is off and the pressure equalisation
that reduces the cooling/heating capacity when the unit is restarted. Test is made at 20 %
load over a cycle of 30 min. In practice however, this test is not used for air-to-air air
conditioners and the default coefficient of 0.25 is used.
Heating mode
The same procedure is applied in heating mode as in cooling mode. For the purpose of
reference SCOP and reference SCOPon, there are 3 reference conditions: average (A),
warmer (W) and colder (C). A supplementary SCOPnet, without backup nor consumption
of the low power modes, is defined in view of the renewable energy directive (Commission
decision 2013/114/EU)15.
For air-to-water heat pumps, the seasonal space heating efficiency in primary energy ηs
[%], defined in regulations (EU) No 811/2013 and (EU) 813/2013 is also included, but
does not apply for air-to-air heat pumps as it was not defined in Regulation (EU) 206/2012.
The Reference design conditions for heating (Tdesignh)
• Temperature conditions for average, colder and warmer climates.
• Average: -10 oC dry bulb outdoor temperature and 20 oC dry bulb indoor
temperature
• Cold: -22 °C dry bulb outdoor temperature and 20 °C dry bulb indoor temperature
• Warm: +2 °C dry bulb outdoor temperature and 20 °C dry bulb indoor temperature
Bivalent temperature (Tbivalent)
It is the lowest outdoor temperature point at which the heat pump is declared to be able
to meet 100% of the heating demand without additional backup.
NOTE: Below this point, the unit may still deliver capacity, but additional back up heating
is necessary to fulfill the heating demand.
The declared bivalent temperature can be any outdoor temperature within following limits
(this is defined in Regulation (EU) 206/2012:
• for the average heating season, the bivalent temperature is +2°CDB or lower
15 http://eur-lex.europa.eu/legal-content/EN/TXT/?uri=CELEX%3A32013D0114
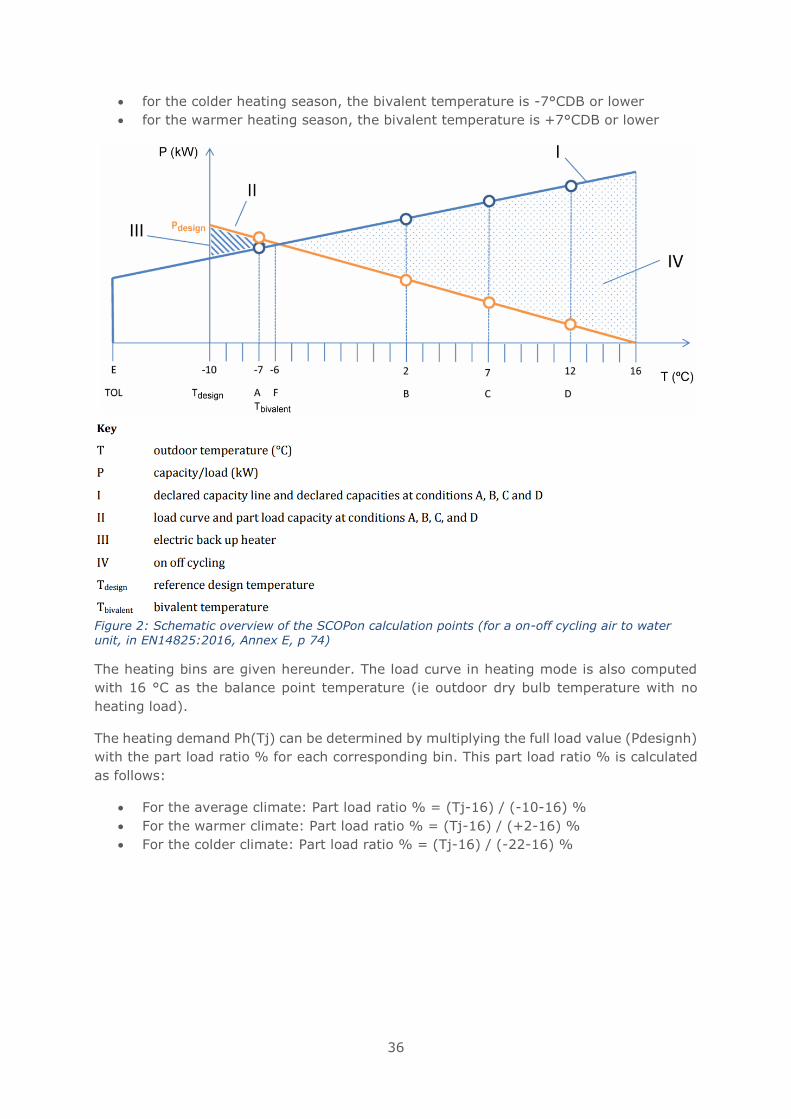
36
• for the colder heating season, the bivalent temperature is -7°CDB or lower
• for the warmer heating season, the bivalent temperature is +7°CDB or lower
Figure 2: Schematic overview of the SCOPon calculation points (for a on-off cycling air to water unit, in EN14825:2016, Annex E, p 74)
The heating bins are given hereunder. The load curve in heating mode is also computed
with 16 °C as the balance point temperature (ie outdoor dry bulb temperature with no
heating load).
The heating demand Ph(Tj) can be determined by multiplying the full load value (Pdesignh)
with the part load ratio % for each corresponding bin. This part load ratio % is calculated
as follows:
• For the average climate: Part load ratio % = (Tj-16) / (-10-16) %
• For the warmer climate: Part load ratio % = (Tj-16) / (+2-16) %
• For the colder climate: Part load ratio % = (Tj-16) / (-22-16) %
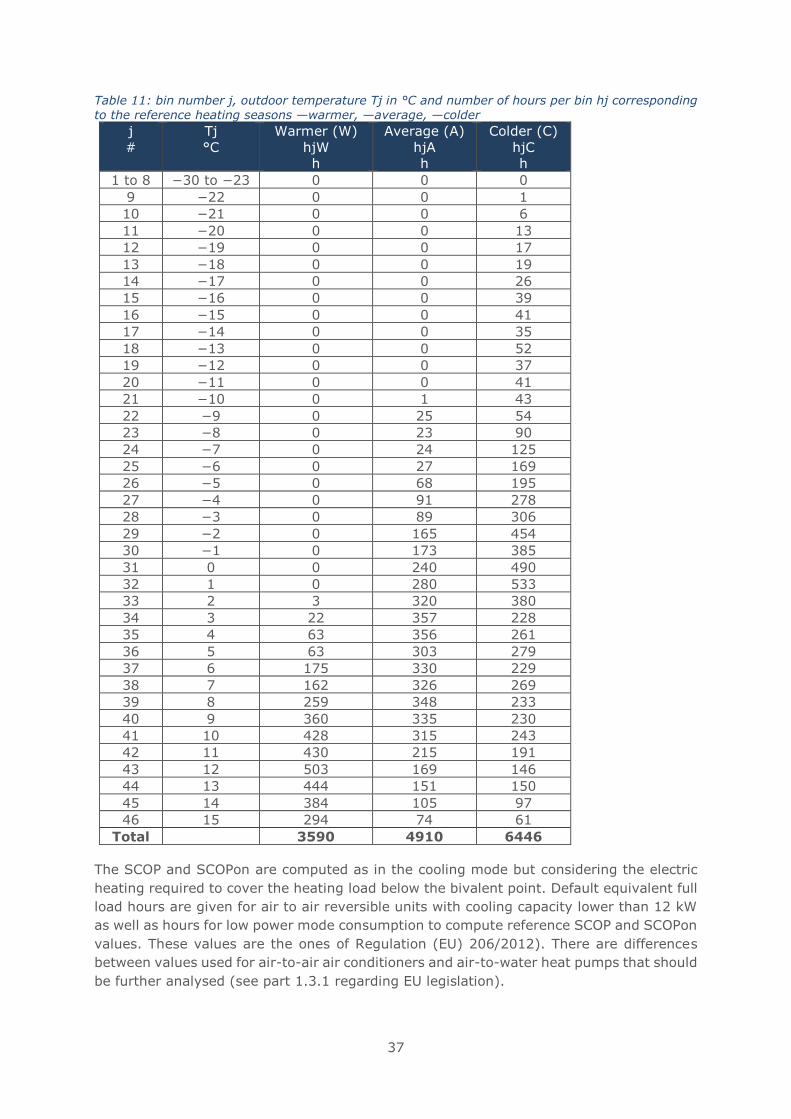
37
Table 11: bin number j, outdoor temperature Tj in °C and number of hours per bin hj corresponding
to the reference heating seasons ―warmer, ―average, ―colder
j
#
Tj
°C
Warmer (W)
hjW
h
Average (A)
hjA
h
Colder (C)
hjC
h
1 to 8 −30 to −23 0 0 0
9 −22 0 0 1
10 −21 0 0 6
11 −20 0 0 13
12 −19 0 0 17
13 −18 0 0 19
14 −17 0 0 26
15 −16 0 0 39
16 −15 0 0 41
17 −14 0 0 35
18 −13 0 0 52
19 −12 0 0 37
20 −11 0 0 41
21 −10 0 1 43
22 −9 0 25 54
23 −8 0 23 90
24 −7 0 24 125
25 −6 0 27 169
26 −5 0 68 195
27 −4 0 91 278
28 −3 0 89 306
29 −2 0 165 454
30 −1 0 173 385
31 0 0 240 490
32 1 0 280 533
33 2 3 320 380
34 3 22 357 228
35 4 63 356 261
36 5 63 303 279
37 6 175 330 229
38 7 162 326 269
39 8 259 348 233
40 9 360 335 230
41 10 428 315 243
42 11 430 215 191
43 12 503 169 146
44 13 444 151 150
45 14 384 105 97
46 15 294 74 61
Total 3590 4910 6446
The SCOP and SCOPon are computed as in the cooling mode but considering the electric
heating required to cover the heating load below the bivalent point. Default equivalent full
load hours are given for air to air reversible units with cooling capacity lower than 12 kW
as well as hours for low power mode consumption to compute reference SCOP and SCOPon
values. These values are the ones of Regulation (EU) 206/2012). There are differences
between values used for air-to-air air conditioners and air-to-water heat pumps that should
be further analysed (see part 1.3.1 regarding EU legislation).
38
Testing methods for active modes
Test methods at reduced capacity of variable speed and staged capacity units are the same
as specified in EN14511:3, except when the unit cannot reach a specific rating point B, C
or D or when it has to cycle to supply the required cooling load (two points already
discussed in the cooling mode section of this standard above). Also, uncertainties of
measurement are specified and reported below (only the part useful for air-to-air
conditioners). Note that in EN14511:3, air-to-air conditioners have to be rated using the
calorimeter method, which allows a better precision of part load performances, as shown
below.
"The steady-state heating and cooling capacities determined using the calorimeter method
shall be determined with a maximum uncertainty of:
• 5 % when the capacity measured is greater than 2,0 kW;
• 10 % when the capacity measured is between 1,0 kW and 2,0 kW;
• 15 % if it is lower than 1,0 kW.
The heating capacities determined during transient operation (defrost cycles) using the
calorimeter method shall be determined with a maximum uncertainty of 10 %. The heating
and cooling capacities measured on the air side using the air enthalpy method shall be
determined with a maximum uncertainty of (4 + 6/part load ratio) %.
All uncertainties of measurement are independent of the individual uncertainties of
measurement including the uncertainties on the properties of fluids. The maximum
uncertainty of the measurement of the power input for off, thermostat off, standby and
crankcase heater modes shall be ± 0,1 W up to 10 W; ± 1 % for powers greater than 10
W."
Regarding cycling tests, test laboratories are reluctant to use the test method proposed:
• this test was developed for on/off units; for inverter driven units, there is a delay
after startup which means that to make such a test, the laboratory should require
the manufacturer to modify the software of the unit to enable a 6min on and 24
min off cycle;
• it is a highly consuming test;
• it is a test of unknown precision (probably low) because of very load to be measured
(1 kW cooling capacity when on, so only 200 W in average).
Thus, it is advisable at the moment, to use the default Cdc and Cdh values, which anyway
has limited impact on the seasonal indices of inverter driven units. It means Regulation
(EU) No 206/2012 should be amended not to allow a cycling test until the EN14825
standard be developed to allow these tests to be done.
Standby mode: For cooling only and reversible air conditioners, the standby mode power
is measured after the unit has been running for 30 min in "A" test condition (outdoor
temperature 35 °C, indoor temperature 27°C). The unit is stopped with the control device
and after 10 min, the residual energy consumption is measured. For heating only units,
the "D" test is used (outdoor temperature 12 °C, part load ratio 25 %, indoor temperature
20 °C).
Off mode: This test is measured 10 min after the standby mode test.
39
Thermostat-off: This is measured 30 min after the unit has been running for 30 min in "D"
test condition in cooling mode for cooling only and reversible units and in heating mode
for heating only units (Cooling mode: outdoor temperature 20 °C, part load ratio 25 %,
indoor temperature 27 °C // Heating mode: outdoor temperature 12 °C, part load ratio 25
%, indoor temperature 20 °C). The thermostat set point related to the indoor temperature
sensor is increased (decreased in heating mode) until the compressor stops. The time
period for measurement is of 60 min.
In cooling mode, standby power consumption is deducted from consumption measured to
calculate thermostat-off, but not in heating mode. This deduction in cooling mode is not
logical (thermostat-off hours and standby hours are two distinct types of hours with no
overlap) and should be corrected.
In EN14825:2016, it is written: " After the unit has been running for 30 min in “D” test
condition in cooling mode (for cooling only or reversible units) [...]". Hence, for reversible
units, thermostat-off power is measured in cooling mode test condition D.
Crankcase heater: It is included in standby power consumption if the crankcase is activated
during the standby test. If not, the following test is performed: after the unit has been
operating 30 min in "D" test condition in heating mode, the unit is stopped with the control
device, and the consumption is measured for 8 hours starting 10 min after.
Regarding this method, it should be commented that power measurements are made at a
certain temperature in each mode and then weighted by a number of hours to represent
when the consumption is likely to occur. The impact of outdoor temperature variation is
not taken into account here, and this probably makes a difference at least for crankcase
heater consumption. Also, there may be for the same unit two distinct thermostat off
values, which is not foreseen in Regulation (EU) No 206/2012 (adaptation to be done).
In addition, it is not stated if network standby consumption is included in the value
measured, although many units already include network communication capability.
Case of multisplit
For multisplit appliances, the only indication in EN14825:2016 is that data in the test report
shall be provided at a capacity ratio of 1 (same capacity for outdoor unit and the sum of
the capacity of indoor units), as requested in Regulation (EU) 206/2012.
In prEN14825:2017 however, there is a dedicated annex (planned annex N, normative)
for multisplit larger than 12 kW (for the purpose of Regulation (EU) No 2281/2016). This
annex defines the SEER and SCOP of the outdoor unit only (not in line with present
Regulation 206/2012 and 626/2011, which, in the ratings of multisplit air conditioners,
also includes the fan power consumption). This annex specifies the number of indoor units
to be connected depending on the standard-rated capacity of the multisplit unit. Currently,
this is not defined for air conditioners with a capacity less than 12 kW, because all
combinations (regardless the indoor unit type) must comply with requirements of
Regulation 206/2012.
In annex N, are also given practical indications regarding the number of units to be
considered for tests and tolerance on the capacity ratio (100 % more or less 5 %).
EN50564:2011 - Household electrical appliances - Measurement of standby power
This standard defines low power modes (standby and off mode) and measurement methods
to be used. Network standby is not explicitly defined in the standard (see mandate M/544
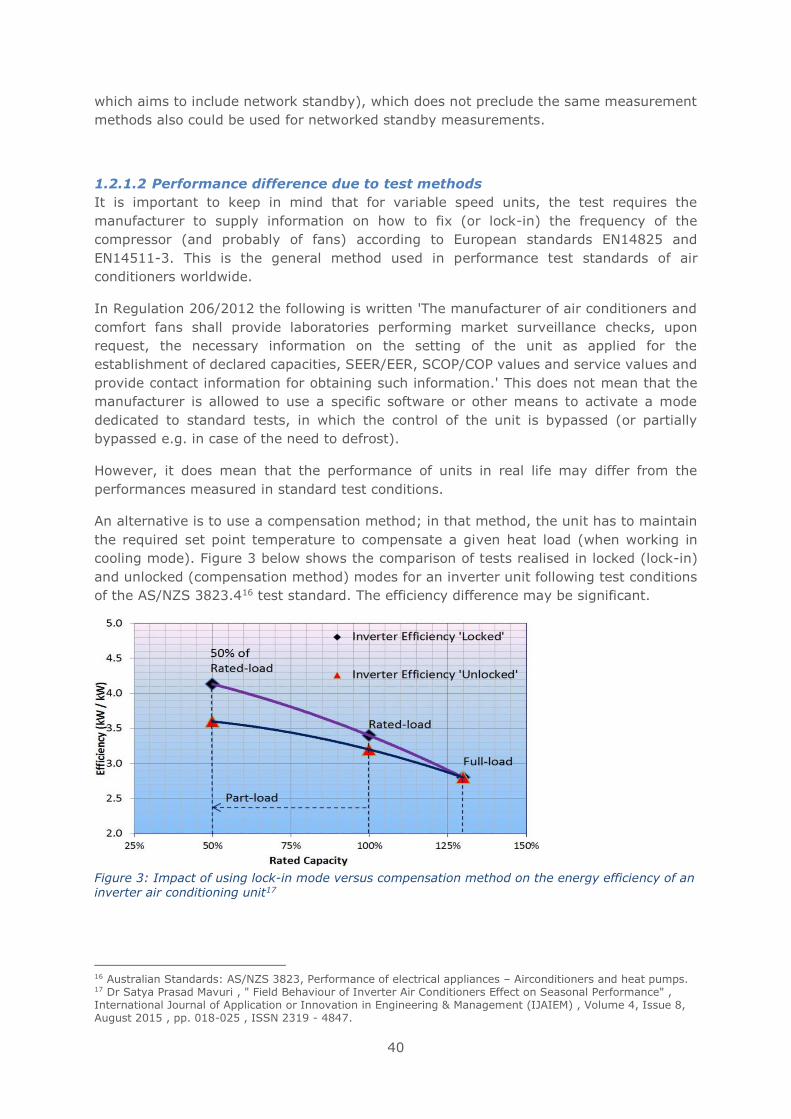
40
which aims to include network standby), which does not preclude the same measurement
methods also could be used for networked standby measurements.
1.2.1.2 Performance difference due to test methods
It is important to keep in mind that for variable speed units, the test requires the
manufacturer to supply information on how to fix (or lock-in) the frequency of the
compressor (and probably of fans) according to European standards EN14825 and
EN14511-3. This is the general method used in performance test standards of air
conditioners worldwide.
In Regulation 206/2012 the following is written 'The manufacturer of air conditioners and
comfort fans shall provide laboratories performing market surveillance checks, upon
request, the necessary information on the setting of the unit as applied for the
establishment of declared capacities, SEER/EER, SCOP/COP values and service values and
provide contact information for obtaining such information.' This does not mean that the
manufacturer is allowed to use a specific software or other means to activate a mode
dedicated to standard tests, in which the control of the unit is bypassed (or partially
bypassed e.g. in case of the need to defrost).
However, it does mean that the performance of units in real life may differ from the
performances measured in standard test conditions.
An alternative is to use a compensation method; in that method, the unit has to maintain
the required set point temperature to compensate a given heat load (when working in
cooling mode). Figure 3 below shows the comparison of tests realised in locked (lock-in)
and unlocked (compensation method) modes for an inverter unit following test conditions
of the AS/NZS 3823.416 test standard. The efficiency difference may be significant.
Figure 3: Impact of using lock-in mode versus compensation method on the energy efficiency of an inverter air conditioning unit17
16 Australian Standards: AS/NZS 3823, Performance of electrical appliances – Airconditioners and heat pumps. 17 Dr Satya Prasad Mavuri , " Field Behaviour of Inverter Air Conditioners Effect on Seasonal Performance" , International Journal of Application or Innovation in Engineering & Management (IJAIEM) , Volume 4, Issue 8, August 2015 , pp. 018-025 , ISSN 2319 - 4847.
41
Although test laboratories in Europe are aware of this method and the potential differences
in results, there are issues for practical application that remain to be solved:
• there is no such method for ducted units,
• there are repeatability issues because the results obtained are dependent on the
control of the unit and then in turn on the air inertia of the cell (and then on its
size) and possibly on the control used to maintain the heat load (in cooling mode),
• test results are dependent on the temperature sensor of the unit being tested and
on the setting of the indoor temperature (in general with 1 K precision), which may
make it difficult to respect the deviation tolerances of the standard or/and may
require ad-hoc corrections.
• time for testing increases significantly
Nevertheless, it is important to continue the development of compensation method as it
could ultimately lead to seasonal figures closer to real life performances. Such a method is
reintroduced for air-to-air air conditioners and heat pumps in case it is not possible to
obtain information on how to set lock-in mode from manufacturers in prEN14825:2017.
This method is not ready to be considered for this revision, but it might be included in the
next revision.
1.2.1.3 International standards
Air conditioners
The main ISO standards relating to air conditioners (ISO 5151:2010 - 'Non-ducted air
conditioners and heat pumps – Testing and rating for performance', ISO 13253:2011 –
'Ducted air conditioners and heat pumps – Testing and rating for performance', and ISO
15042:2011 Multiple split-system air-conditioners and air-to-air heat pumps – Testing and
rating for performance) are not described here as main information is thought to be similar
to EN14511 standard content (see description above) and that if there are differences, the
EN14511 standard prevails.
Two ISO standards of specific interest for this study are being prepared; they are briefly
described and discussed hereafter.
ISO/FDIS 16358-1:2013 Air-cooled air conditioners and air-to-air heat pumps —
Testing and calculating methods for seasonal performance factors
This standard is made of 3 parts:
• Part 1: Cooling seasonal performance factor
• Part 2: Heating seasonal performance factor
• Part 3: Annual performance factor
Part 1 specifies the testing and calculating methods for seasonal performance factor of
equipment covered by ISO 5151, ISO 13253 and ISO 15042 standards (split and multisplit
non ducted and ducted units).
The general outline of the testing and calculating method is similar to standards being used
in Asia (in Japan, China and South Korea specifically)18. The method was also completed
to account for low power modes, as in the EN14825 standard.
18 Sustainable Industrial Policy – Building on the Ecodesign Directive – Energy-Using Product Group Analysis/2, Lot 6: Air-conditioning and ventilation systems, Contract No. ENTR/B1/35-2009/LOT6/ SI2.549494, CO-ORDINATOR: Philippe RIVIERE, ARMINES, France, Final report - Air-conditioning products, July 2012
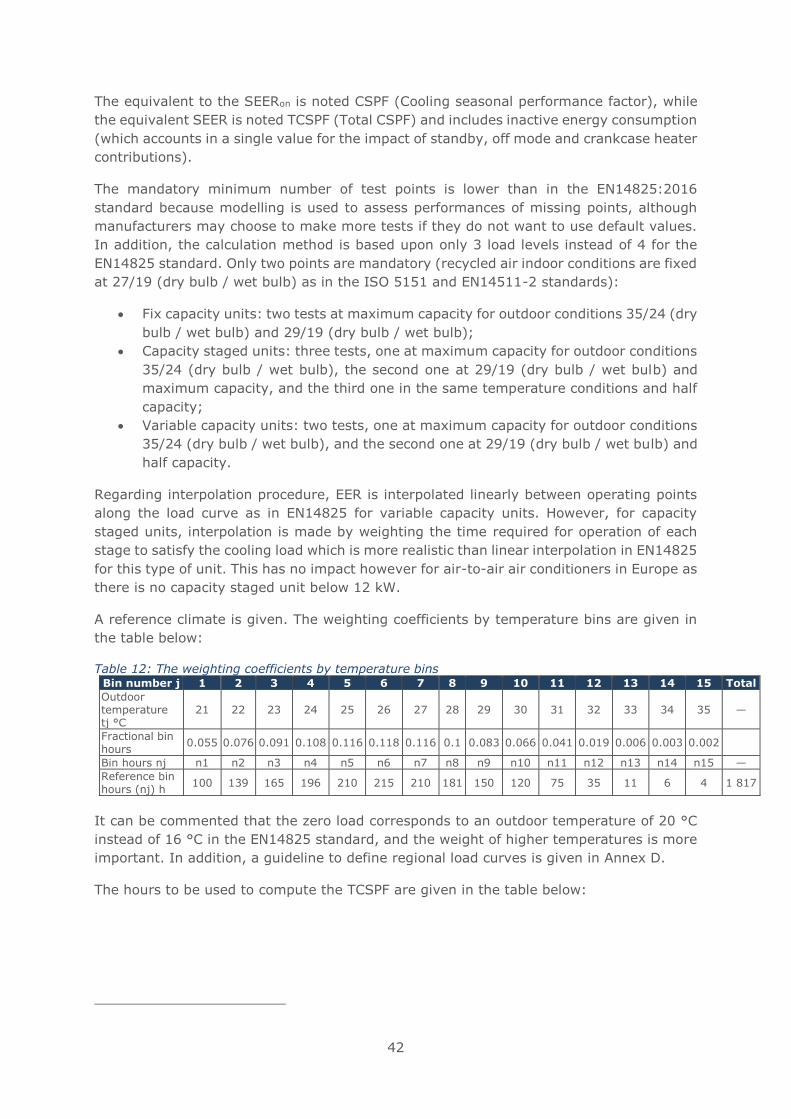
42
The equivalent to the SEERon is noted CSPF (Cooling seasonal performance factor), while
the equivalent SEER is noted TCSPF (Total CSPF) and includes inactive energy consumption
(which accounts in a single value for the impact of standby, off mode and crankcase heater
contributions).
The mandatory minimum number of test points is lower than in the EN14825:2016
standard because modelling is used to assess performances of missing points, although
manufacturers may choose to make more tests if they do not want to use default values.
In addition, the calculation method is based upon only 3 load levels instead of 4 for the
EN14825 standard. Only two points are mandatory (recycled air indoor conditions are fixed
at 27/19 (dry bulb / wet bulb) as in the ISO 5151 and EN14511-2 standards):
• Fix capacity units: two tests at maximum capacity for outdoor conditions 35/24 (dry
bulb / wet bulb) and 29/19 (dry bulb / wet bulb);
• Capacity staged units: three tests, one at maximum capacity for outdoor conditions
35/24 (dry bulb / wet bulb), the second one at 29/19 (dry bulb / wet bulb) and
maximum capacity, and the third one in the same temperature conditions and half
capacity;
• Variable capacity units: two tests, one at maximum capacity for outdoor conditions
35/24 (dry bulb / wet bulb), and the second one at 29/19 (dry bulb / wet bulb) and
half capacity.
Regarding interpolation procedure, EER is interpolated linearly between operating points
along the load curve as in EN14825 for variable capacity units. However, for capacity
staged units, interpolation is made by weighting the time required for operation of each
stage to satisfy the cooling load which is more realistic than linear interpolation in EN14825
for this type of unit. This has no impact however for air-to-air air conditioners in Europe as
there is no capacity staged unit below 12 kW.
A reference climate is given. The weighting coefficients by temperature bins are given in
the table below:
Table 12: The weighting coefficients by temperature bins Bin number j 1 2 3 4 5 6 7 8 9 10 11 12 13 14 15 Total
Outdoor temperature tj °C
21 22 23 24 25 26 27 28 29 30 31 32 33 34 35 —
Fractional bin hours
0.055 0.076 0.091 0.108 0.116 0.118 0.116 0.1 0.083 0.066 0.041 0.019 0.006 0.003 0.002
Bin hours nj n1 n2 n3 n4 n5 n6 n7 n8 n9 n10 n11 n12 n13 n14 n15 —
Reference bin hours (nj) h
100 139 165 196 210 215 210 181 150 120 75 35 11 6 4 1 817
It can be commented that the zero load corresponds to an outdoor temperature of 20 °C
instead of 16 °C in the EN14825 standard, and the weight of higher temperatures is more
important. In addition, a guideline to define regional load curves is given in Annex D.
The hours to be used to compute the TCSPF are given in the table below:
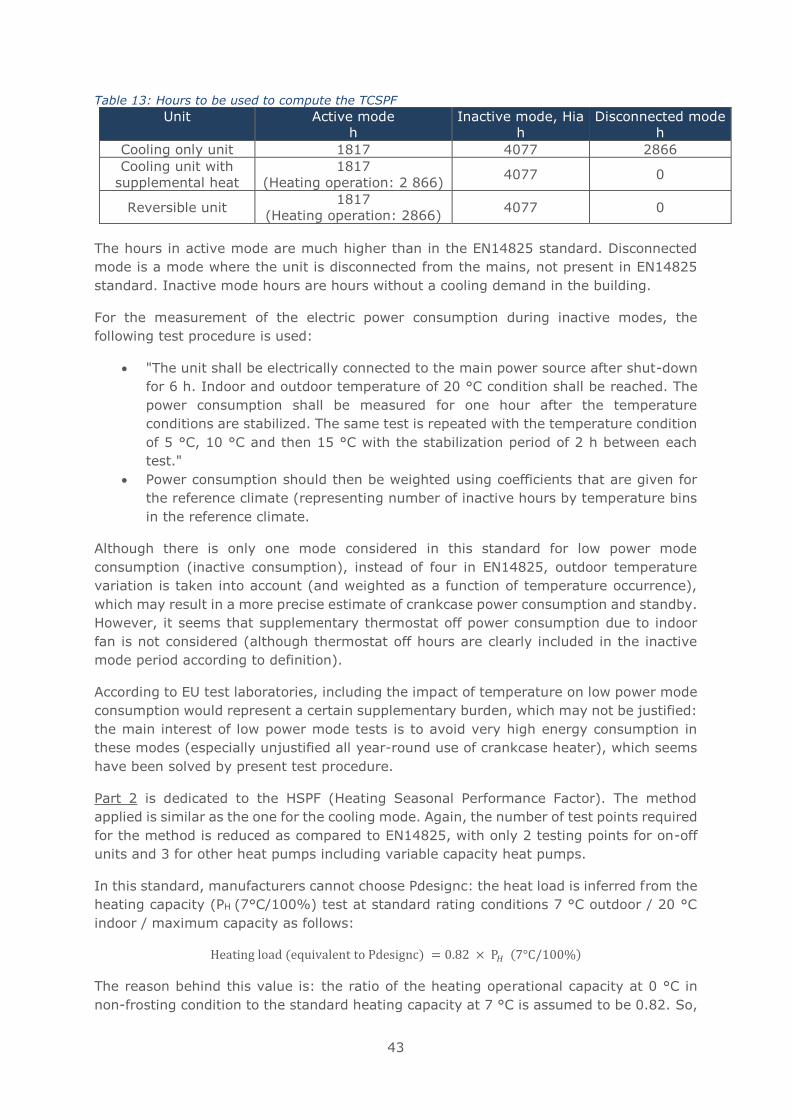
43
Table 13: Hours to be used to compute the TCSPF
Unit Active mode
h
Inactive mode, Hia
h
Disconnected mode
h
Cooling only unit 1817 4077 2866
Cooling unit with
supplemental heat
1817
(Heating operation: 2 866) 4077 0
Reversible unit 1817
(Heating operation: 2866) 4077 0
The hours in active mode are much higher than in the EN14825 standard. Disconnected
mode is a mode where the unit is disconnected from the mains, not present in EN14825
standard. Inactive mode hours are hours without a cooling demand in the building.
For the measurement of the electric power consumption during inactive modes, the
following test procedure is used:
• "The unit shall be electrically connected to the main power source after shut-down
for 6 h. Indoor and outdoor temperature of 20 °C condition shall be reached. The
power consumption shall be measured for one hour after the temperature
conditions are stabilized. The same test is repeated with the temperature condition
of 5 °C, 10 °C and then 15 °C with the stabilization period of 2 h between each
test."
• Power consumption should then be weighted using coefficients that are given for
the reference climate (representing number of inactive hours by temperature bins
in the reference climate.
Although there is only one mode considered in this standard for low power mode
consumption (inactive consumption), instead of four in EN14825, outdoor temperature
variation is taken into account (and weighted as a function of temperature occurrence),
which may result in a more precise estimate of crankcase power consumption and standby.
However, it seems that supplementary thermostat off power consumption due to indoor
fan is not considered (although thermostat off hours are clearly included in the inactive
mode period according to definition).
According to EU test laboratories, including the impact of temperature on low power mode
consumption would represent a certain supplementary burden, which may not be justified:
the main interest of low power mode tests is to avoid very high energy consumption in
these modes (especially unjustified all year-round use of crankcase heater), which seems
have been solved by present test procedure.
Part 2 is dedicated to the HSPF (Heating Seasonal Performance Factor). The method
applied is similar as the one for the cooling mode. Again, the number of test points required
for the method is reduced as compared to EN14825, with only 2 testing points for on-off
units and 3 for other heat pumps including variable capacity heat pumps.
In this standard, manufacturers cannot choose Pdesignc: the heat load is inferred from the
heating capacity (PH (7°C/100%) test at standard rating conditions 7 °C outdoor / 20 °C
indoor / maximum capacity as follows:
Heating load (equivalent to Pdesignc) = 0.82 × P𝐻 (7°C/100%)
The reason behind this value is: the ratio of the heating operational capacity at 0 °C in
non-frosting condition to the standard heating capacity at 7 °C is assumed to be 0.82. So,
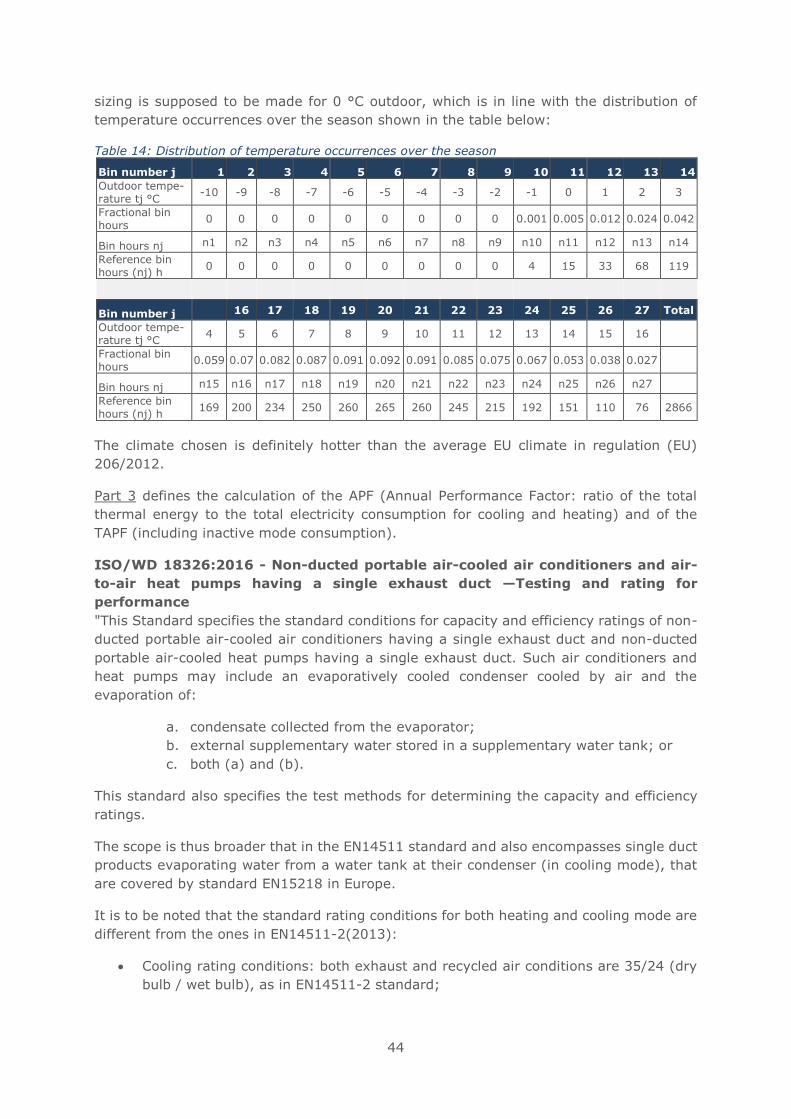
44
sizing is supposed to be made for 0 °C outdoor, which is in line with the distribution of
temperature occurrences over the season shown in the table below:
Table 14: Distribution of temperature occurrences over the season
Bin number j 1 2 3 4 5 6 7 8 9 10 11 12 13 14
Outdoor tempe-rature tj °C
-10 -9 -8 -7 -6 -5 -4 -3 -2 -1 0 1 2 3
Fractional bin hours
0 0 0 0 0 0 0 0 0 0.001 0.005 0.012 0.024 0.042
Bin hours nj n1 n2 n3 n4 n5 n6 n7 n8 n9 n10 n11 n12 n13 n14
Reference bin hours (nj) h
0 0 0 0 0 0 0 0 0 4 15 33 68 119
Bin number j 16 17 18 19 20 21 22 23 24 25 26 27 Total
Outdoor tempe-rature tj °C
4 5 6 7 8 9 10 11 12 13 14 15 16
Fractional bin hours
0.059 0.07 0.082 0.087 0.091 0.092 0.091 0.085 0.075 0.067 0.053 0.038 0.027
Bin hours nj n15 n16 n17 n18 n19 n20 n21 n22 n23 n24 n25 n26 n27
Reference bin hours (nj) h
169 200 234 250 260 265 260 245 215 192 151 110 76 2866
The climate chosen is definitely hotter than the average EU climate in regulation (EU)
206/2012.
Part 3 defines the calculation of the APF (Annual Performance Factor: ratio of the total
thermal energy to the total electricity consumption for cooling and heating) and of the
TAPF (including inactive mode consumption).
ISO/WD 18326:2016 - Non-ducted portable air-cooled air conditioners and air-
to-air heat pumps having a single exhaust duct —Testing and rating for
performance
"This Standard specifies the standard conditions for capacity and efficiency ratings of non-
ducted portable air-cooled air conditioners having a single exhaust duct and non-ducted
portable air-cooled heat pumps having a single exhaust duct. Such air conditioners and
heat pumps may include an evaporatively cooled condenser cooled by air and the
evaporation of:
a. condensate collected from the evaporator;
b. external supplementary water stored in a supplementary water tank; or
c. both (a) and (b).
This standard also specifies the test methods for determining the capacity and efficiency
ratings.
The scope is thus broader that in the EN14511 standard and also encompasses single duct
products evaporating water from a water tank at their condenser (in cooling mode), that
are covered by standard EN15218 in Europe.
It is to be noted that the standard rating conditions for both heating and cooling mode are
different from the ones in EN14511-2(2013):
• Cooling rating conditions: both exhaust and recycled air conditions are 35/24 (dry
bulb / wet bulb), as in EN14511-2 standard;
45
• Heating rating conditions: both exhaust and recycled air conditions are 20/15,
instead of 20/12 in EN14511-2 standard.
The test method is similar to the one in EN14511-3 standard and enables to take into
account the impact of duct heat losses on the unit performance (although the duct length
is only of 50 cm, while it may be much longer in real life). However, it does not include the
impact of outdoor air infiltration on cooling capacity.
Comfort fans
Regarding comfort fans, the reference used in the transitional method for Regulation (EU)
206/2012 is IEC 60879 (Commission communication 2012/C 172/01).
IEC 60879: 1986 (corr. 1992) - Performance and construction of electric
circulating fans and regulators
The following information has not changed since the preparatory study.
This standard applies to the following types of electric motor directly driven fans and their
associated regulators intended for use on single-phase a.c. and d.c. circuits not exceeding
250 V:
a) Fans for household and similar purposes:
• ceiling type fans;
• table type fans;
• pedestal fans;
b) Fans for use in ships:
• Deck-head type fans;
• Cabin type fans. Note: Wherever applicable the term “fan” used in this standard includes its associated regulator, if
any."
This standard does not apply to the following types of fans which are covered in separate
standards:
• Jet fans (see IEC Publication 535: Jet Fans and Regulators);
• Ventilating fans (see IEC Publication 665: A.C. Electric Ventilating Fans and
Regulators for Household and Similar Purposes).
This standard does not enable a priori to test tower fans but all other types.
The IEC 60879 standard defines an Energy Efficiency Index, called “service value” in
English and “indice de qualité” in French, which is of the same nature as an SFP in
ventilation: a ratio of the flow generated to the electrical power absorbed. It is an index
suitable for the purpose, since there is no pressure difference to be maintained between
upstream and downstream, as opposed to ventilation systems where pressure levels
matter. It’s measured at full speed. The standard does include the energy needed for the
oscillating mechanism in the total electricity demand. The flow is measured without the
oscillations.
The air delivery in cubic meters per minute divided by electrical power input to the fan in
watts at the voltage and frequency specified for the test is named the service value.
In the event of the fan comprising an oscillating mechanism, the electrical input in watts
is measured with the fan under normal full-speed conditions, that is with the oscillating
46
mechanism in action, whereas the air delivery is determined with the oscillating mechanism
out of action.
This service value (SV) and the “rated air delivery” (flow rate) “shall be supplied on
request”.
One aspect of the IEC 879 standard is that there are functional requirements and even
design values recommended: preferred sizes for ceiling fans, other for table fans, other for
pedestal fans, a fact that generates this uniformity of declared characteristics that can be
observed on the market.
Another interesting aspect of IEC 879 is that it includes a set of tolerances to apply when
only one piece of equipment is tested to check the declarations of a manufacturer: 10%
on air flow, which, since electrical power is very certain, means about 10% on “service
value”.
Even the oscillations are harmonized: “The number of oscillations per minute at full speed
shall not be less than four. Whether the angular movement of the mechanism is variable,
an angular movement of not less than 60° shall be available […]. A device shall be provided
to render the oscillating mechanism inoperative when desired. The method of operating
the device shall be indicated. “
It is the same for the speeds: “Regulators shall be capable of reducing the speed of the
fan by at least 50 % of the full speed at the voltage and frequency specified for the test,
except in the case of fans of the shaded pole type where the speed reduction shall be not
less than 20 %. Fans shall be capable of running continuously on any of the contacts of
the regulator at the rated voltage or voltages or within the whole rated voltage range,
whichever is applicable.”
The prescription about noise is not that clear: “The noise level of fans and regulators at all
speeds shall be within reasonable limits”.
Finally, tolerance is fixed on the rated air flow rate at full speed at 10 %. There is no explicit
tolerance on the service vale (SFP) of the product, but it can be estimated.
There is no specific test standard in Europe for testing energy use of comfort fans (that
could be easily written on the basis of IEC 879 with extension to tower fans).
1.2.1.4 Third country standards
Comfort fans: No new information on regional performance test standard of comfort fans
was identified since last EuP Lot 10 study19.
Air-to-air air conditioners but single duct / double duct and evaporatively- cooled
air conditioners
Most countries in the world still use full capacity ratings based upon ISO 5151, 13253,
15041 standards20. However, the development of the ISO/FDIS 16358-1:2013 standard
19 Preparatory study on the environmental performance of residential room conditioning appliances (airco and ventilation), Contract TREN/D1/40-2005/LOT10/S07.56606. CO-ORDINATOR: Philippe RIVIERE, ARMINES, France. Comfort fans, final report. December 2008. This report can be downloaded from DG ENERGY website: https://ec.europa.eu/energy/en/topics/energy-efficiency/energy-efficient-products. 20 www.claspinfo.org
47
accelerated the adoption of seasonal performance indicators. The first countries to have
adopted the ISO standard are Australia and New Zealand, in standard AS/NZS
3823.4.1:2014 - Performance of electrical appliances — Air conditioners and heat pumps.
Regional temperature distribution and associated hours for active, inactive and
disconnected modes have been developed, with different zones to cover the different
climates of the two countries. At least India21 has followed, in 2015, and Thailand is
planning to do so by 202022.
Before that, only a few countries had adopted seasonal performance standards or
standards including low power modes (although air conditioner standby power
consumption may be constrained in some countries, included in horizontal regulations).
The description of these standards, which are for the USA, Japan, South Korea and China
can be found in the EuP Lot 10 Study on air conditioners23.
US DOE 10 CFR Parts 429 and 430. Energy Conservation Program: Test
Procedures for Portable Air Conditioners; Final Rule24
On April 18, 2016, DOE classified portable ACs as covered consumer products under EPCA
(Energy Policy and Conservation Act of 1975). DOE proposed a final rulemaking regarding
test procedures (published in the Federal Register in June 2016) and associated energy
conservation standards for portable ACs (proposed rulemaking published in December
2016, detailed information can be found in part 1.3 of this report).
The final test standard is based on the existing industry procedures25 (direct air enthalpy
method, i.e. measurement of the cooling capacity as the product of the indoor side air flow
and enthalpy differences) and modified to account for:
• infiltration of hot air due to unbalanced flows (condenser air flow of single duct air
conditioners is compensated by hot air infiltration; difference of air flow between
condenser inlet and outlet for double duct air conditioners),
• heat losses of duct connections in the air-conditioned space.
The cooling capacity measured via the enthalpy difference and corrected of these two
effects is named ACC for adjusted cooling capacity. The standard industry test is only
slightly modified and the corrections are made via calculations.
In addition, a procedure has been designed to rate the seasonal efficiency of these units
(Combined Energy Efficiency Ratio - CEER), which account for active cooling mode,
thermostat off mode, standby or off mode operation in a single metrics.
Although the methodology used in cooling mode could be applied in heating mode (and
was proposed in the first version of the test standard), heating mode was removed from
the test procedure as it was considered that heating was not common nor commonly used
for this type of units in the USA.
21 https://www.bijlibachao.com/air-conditioners/iseer-star-labeling-inverter-air-conditioners-india.html 22 http://www.aseanshine.org/asean-shine-task-force/d/asean-regional-policy-roadmap-for-harmonization-of-energy-performance-standards-for-air-conditioners 23 Preparatory study on the environmental performance of residential room conditioning appliances (airco and ventilation), Contract TREN/D1/40-2005/LOT10/S07.56606. CO-ORDINATOR: Philippe RIVIERE, ARMINES, France. Air conditioners, final report. December 2008. This report can be downloaded from DG ENERGY website: https://ec.europa.eu/energy/en/topics/energy-efficiency/energy-efficient-products. 24 USA Federal Register, Vol 81, No. 105, Wednesday June 1, 2016. 25 ANSI/AHAM PAC-1-2016: Portable Air Conditioners and ASHRAE standard 128:2011 - Method of Rating Portable Air Conditioners
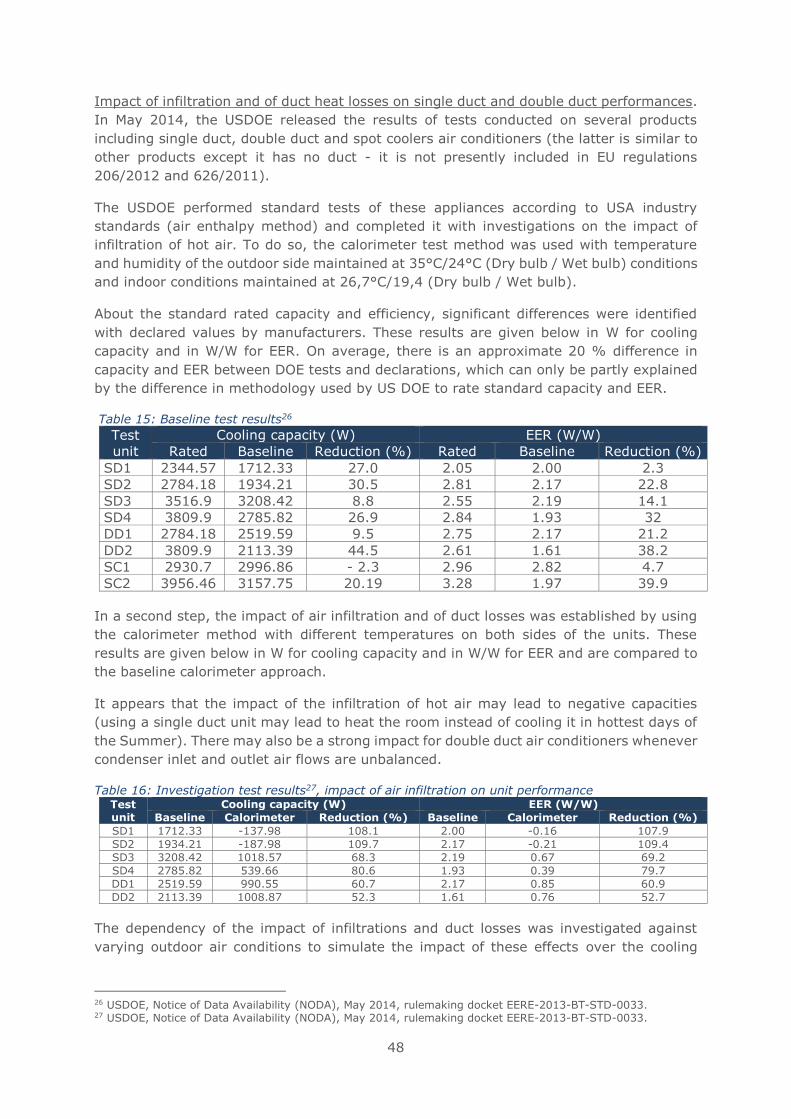
48
Impact of infiltration and of duct heat losses on single duct and double duct performances.
In May 2014, the USDOE released the results of tests conducted on several products
including single duct, double duct and spot coolers air conditioners (the latter is similar to
other products except it has no duct - it is not presently included in EU regulations
206/2012 and 626/2011).
The USDOE performed standard tests of these appliances according to USA industry
standards (air enthalpy method) and completed it with investigations on the impact of
infiltration of hot air. To do so, the calorimeter test method was used with temperature
and humidity of the outdoor side maintained at 35°C/24°C (Dry bulb / Wet bulb) conditions
and indoor conditions maintained at 26,7°C/19,4 (Dry bulb / Wet bulb).
About the standard rated capacity and efficiency, significant differences were identified
with declared values by manufacturers. These results are given below in W for cooling
capacity and in W/W for EER. On average, there is an approximate 20 % difference in
capacity and EER between DOE tests and declarations, which can only be partly explained
by the difference in methodology used by US DOE to rate standard capacity and EER.
Table 15: Baseline test results26
Test
unit
Cooling capacity (W) EER (W/W)
Rated Baseline Reduction (%) Rated Baseline Reduction (%)
SD1 2344.57 1712.33 27.0 2.05 2.00 2.3
SD2 2784.18 1934.21 30.5 2.81 2.17 22.8
SD3 3516.9 3208.42 8.8 2.55 2.19 14.1
SD4 3809.9 2785.82 26.9 2.84 1.93 32
DD1 2784.18 2519.59 9.5 2.75 2.17 21.2
DD2 3809.9 2113.39 44.5 2.61 1.61 38.2
SC1 2930.7 2996.86 - 2.3 2.96 2.82 4.7
SC2 3956.46 3157.75 20.19 3.28 1.97 39.9
In a second step, the impact of air infiltration and of duct losses was established by using
the calorimeter method with different temperatures on both sides of the units. These
results are given below in W for cooling capacity and in W/W for EER and are compared to
the baseline calorimeter approach.
It appears that the impact of the infiltration of hot air may lead to negative capacities
(using a single duct unit may lead to heat the room instead of cooling it in hottest days of
the Summer). There may also be a strong impact for double duct air conditioners whenever
condenser inlet and outlet air flows are unbalanced.
Table 16: Investigation test results27, impact of air infiltration on unit performance Test unit
Cooling capacity (W) EER (W/W)
Baseline Calorimeter Reduction (%) Baseline Calorimeter Reduction (%)
SD1 1712.33 -137.98 108.1 2.00 -0.16 107.9
SD2 1934.21 -187.98 109.7 2.17 -0.21 109.4
SD3 3208.42 1018.57 68.3 2.19 0.67 69.2
SD4 2785.82 539.66 80.6 1.93 0.39 79.7
DD1 2519.59 990.55 60.7 2.17 0.85 60.9
DD2 2113.39 1008.87 52.3 1.61 0.76 52.7
The dependency of the impact of infiltrations and duct losses was investigated against
varying outdoor air conditions to simulate the impact of these effects over the cooling
26 USDOE, Notice of Data Availability (NODA), May 2014, rulemaking docket EERE-2013-BT-STD-0033. 27 USDOE, Notice of Data Availability (NODA), May 2014, rulemaking docket EERE-2013-BT-STD-0033.
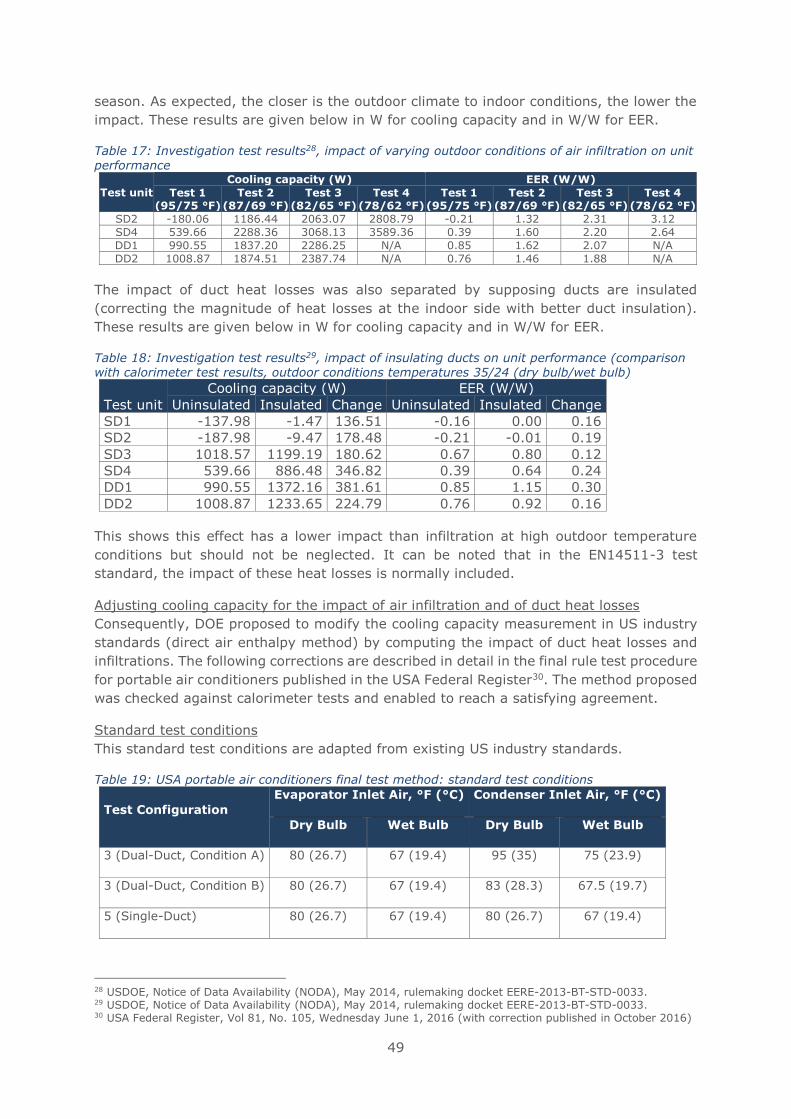
49
season. As expected, the closer is the outdoor climate to indoor conditions, the lower the
impact. These results are given below in W for cooling capacity and in W/W for EER.
Table 17: Investigation test results28, impact of varying outdoor conditions of air infiltration on unit performance
Test unit
Cooling capacity (W) EER (W/W)
Test 1 (95/75 °F)
Test 2 (87/69 °F)
Test 3 (82/65 °F)
Test 4 (78/62 °F)
Test 1 (95/75 °F)
Test 2 (87/69 °F)
Test 3 (82/65 °F)
Test 4 (78/62 °F)
SD2 -180.06 1186.44 2063.07 2808.79 -0.21 1.32 2.31 3.12
SD4 539.66 2288.36 3068.13 3589.36 0.39 1.60 2.20 2.64
DD1 990.55 1837.20 2286.25 N/A 0.85 1.62 2.07 N/A
DD2 1008.87 1874.51 2387.74 N/A 0.76 1.46 1.88 N/A
The impact of duct heat losses was also separated by supposing ducts are insulated
(correcting the magnitude of heat losses at the indoor side with better duct insulation).
These results are given below in W for cooling capacity and in W/W for EER.
Table 18: Investigation test results29, impact of insulating ducts on unit performance (comparison with calorimeter test results, outdoor conditions temperatures 35/24 (dry bulb/wet bulb)
Test unit
Cooling capacity (W) EER (W/W)
Uninsulated Insulated Change Uninsulated Insulated Change
SD1 -137.98 -1.47 136.51 -0.16 0.00 0.16
SD2 -187.98 -9.47 178.48 -0.21 -0.01 0.19
SD3 1018.57 1199.19 180.62 0.67 0.80 0.12
SD4 539.66 886.48 346.82 0.39 0.64 0.24
DD1 990.55 1372.16 381.61 0.85 1.15 0.30
DD2 1008.87 1233.65 224.79 0.76 0.92 0.16
This shows this effect has a lower impact than infiltration at high outdoor temperature
conditions but should not be neglected. It can be noted that in the EN14511-3 test
standard, the impact of these heat losses is normally included.
Adjusting cooling capacity for the impact of air infiltration and of duct heat losses
Consequently, DOE proposed to modify the cooling capacity measurement in US industry
standards (direct air enthalpy method) by computing the impact of duct heat losses and
infiltrations. The following corrections are described in detail in the final rule test procedure
for portable air conditioners published in the USA Federal Register30. The method proposed
was checked against calorimeter tests and enabled to reach a satisfying agreement.
Standard test conditions
This standard test conditions are adapted from existing US industry standards.
Table 19: USA portable air conditioners final test method: standard test conditions
Test Configuration
Evaporator Inlet Air, °F (°C) Condenser Inlet Air, °F (°C)
Dry Bulb Wet Bulb Dry Bulb Wet Bulb
3 (Dual-Duct, Condition A) 80 (26.7) 67 (19.4) 95 (35) 75 (23.9)
3 (Dual-Duct, Condition B) 80 (26.7) 67 (19.4) 83 (28.3) 67.5 (19.7)
5 (Single-Duct) 80 (26.7) 67 (19.4) 80 (26.7) 67 (19.4)
28 USDOE, Notice of Data Availability (NODA), May 2014, rulemaking docket EERE-2013-BT-STD-0033. 29 USDOE, Notice of Data Availability (NODA), May 2014, rulemaking docket EERE-2013-BT-STD-0033. 30 USA Federal Register, Vol 81, No. 105, Wednesday June 1, 2016 (with correction published in October 2016)
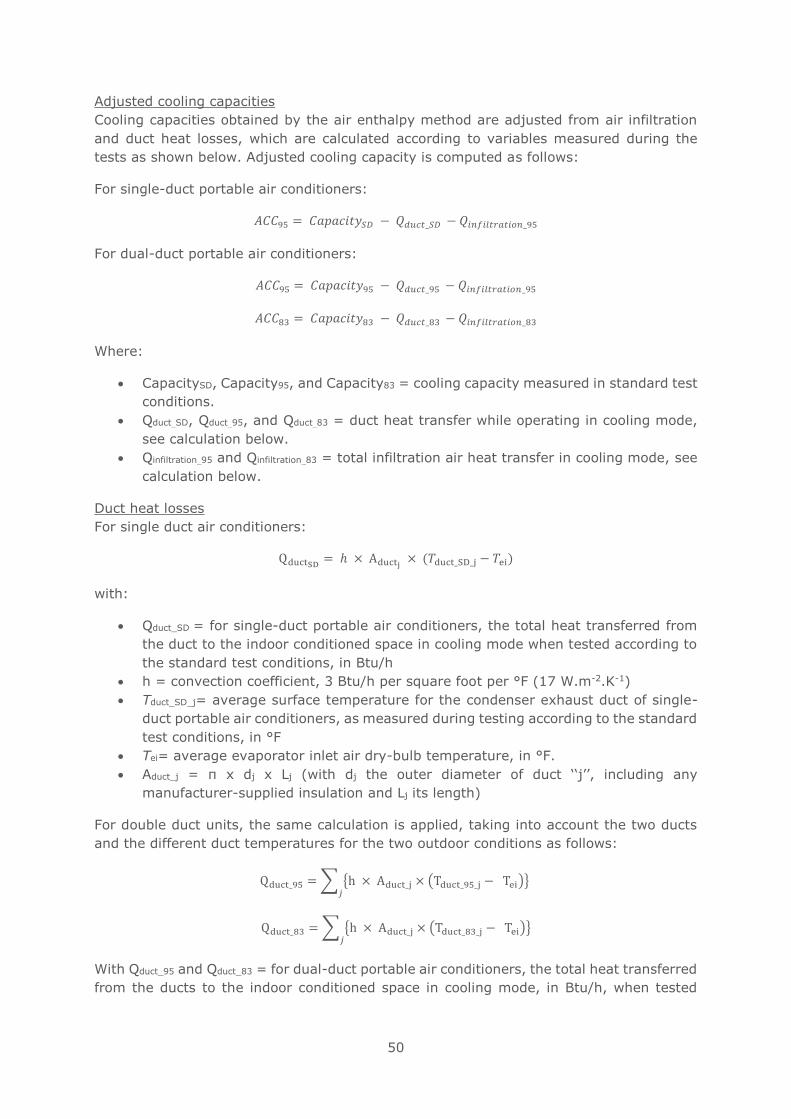
50
Adjusted cooling capacities
Cooling capacities obtained by the air enthalpy method are adjusted from air infiltration
and duct heat losses, which are calculated according to variables measured during the
tests as shown below. Adjusted cooling capacity is computed as follows:
For single-duct portable air conditioners:
𝐴𝐶𝐶95 = 𝐶𝑎𝑝𝑎𝑐𝑖𝑡𝑦𝑆𝐷 − 𝑄𝑑𝑢𝑐𝑡_𝑆𝐷 − 𝑄𝑖𝑛𝑓𝑖𝑙𝑡𝑟𝑎𝑡𝑖𝑜𝑛_95
For dual-duct portable air conditioners:
𝐴𝐶𝐶95 = 𝐶𝑎𝑝𝑎𝑐𝑖𝑡𝑦95 − 𝑄𝑑𝑢𝑐𝑡_95 − 𝑄𝑖𝑛𝑓𝑖𝑙𝑡𝑟𝑎𝑡𝑖𝑜𝑛_95
𝐴𝐶𝐶83 = 𝐶𝑎𝑝𝑎𝑐𝑖𝑡𝑦83 − 𝑄𝑑𝑢𝑐𝑡_83 − 𝑄𝑖𝑛𝑓𝑖𝑙𝑡𝑟𝑎𝑡𝑖𝑜𝑛_83
Where:
• CapacitySD, Capacity95, and Capacity83 = cooling capacity measured in standard test
conditions.
• QductSD, Qduct95, and Qduct83 = duct heat transfer while operating in cooling mode,
see calculation below.
• Qinfiltration95 and Qinfiltration83 = total infiltration air heat transfer in cooling mode, see
calculation below.
Duct heat losses
For single duct air conditioners:
QductSD= ℎ × Aductj
× (𝑇duct_SD_j − 𝑇ei)
with:
• Qduct_SD = for single-duct portable air conditioners, the total heat transferred from
the duct to the indoor conditioned space in cooling mode when tested according to
the standard test conditions, in Btu/h
• h = convection coefficient, 3 Btu/h per square foot per °F (17 W.m-2.K-1)
• Tduct_SD_j= average surface temperature for the condenser exhaust duct of single-
duct portable air conditioners, as measured during testing according to the standard
test conditions, in °F
• Tei= average evaporator inlet air dry-bulb temperature, in °F.
• Aduct_j = π x dj x Lj (with dj the outer diameter of duct ‘‘j’’, including any
manufacturer-supplied insulation and Lj its length)
For double duct units, the same calculation is applied, taking into account the two ducts
and the different duct temperatures for the two outdoor conditions as follows:
Qduct_95 = ∑ {h × Aduct_j × (Tduct_95_j − Tei)}𝑗
Qduct_83 = ∑ {h × Aduct_j × (Tduct_83_j − Tei)}𝑗
With Qduct_95 and Qduct_83 = for dual-duct portable air conditioners, the total heat transferred
from the ducts to the indoor conditioned space in cooling mode, in Btu/h, when tested
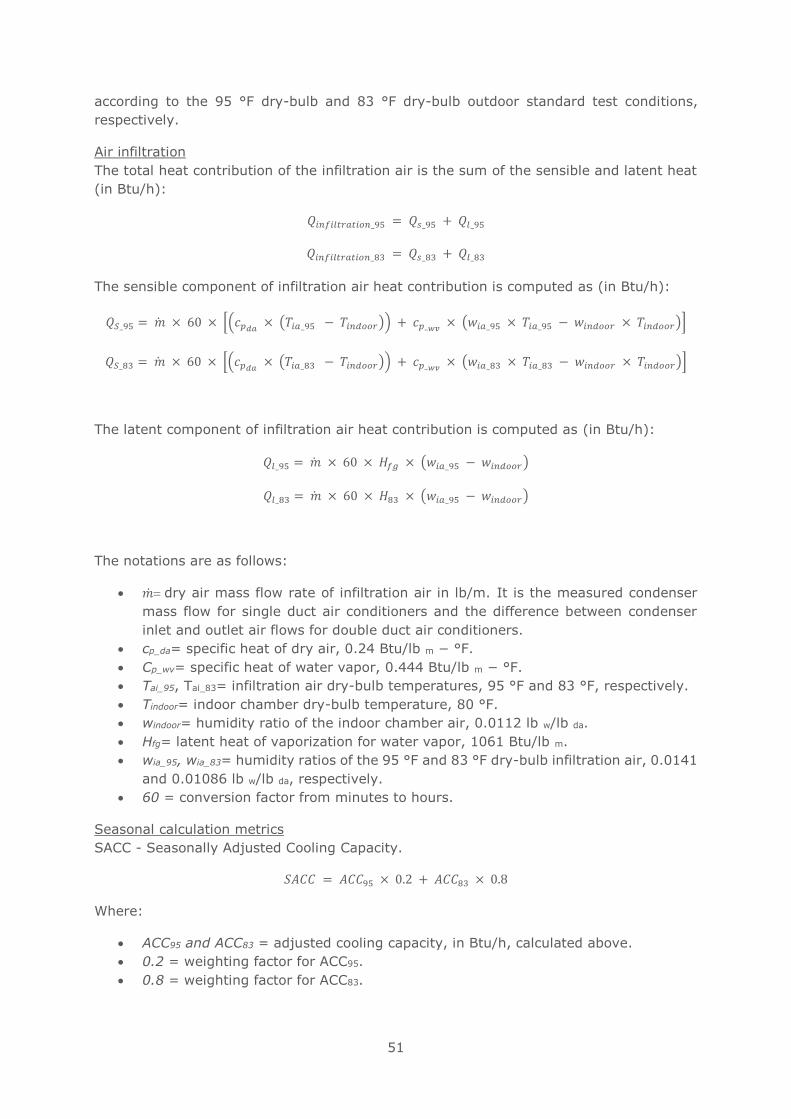
51
according to the 95 °F dry-bulb and 83 °F dry-bulb outdoor standard test conditions,
respectively.
Air infiltration
The total heat contribution of the infiltration air is the sum of the sensible and latent heat
(in Btu/h):
𝑄𝑖𝑛𝑓𝑖𝑙𝑡𝑟𝑎𝑡𝑖𝑜𝑛_95 = 𝑄𝑠_95 + 𝑄𝑙_95
𝑄𝑖𝑛𝑓𝑖𝑙𝑡𝑟𝑎𝑡𝑖𝑜𝑛_83 = 𝑄𝑠_83 + 𝑄𝑙_83
The sensible component of infiltration air heat contribution is computed as (in Btu/h):
𝑄𝑆_95 = �̇� × 60 × [(𝑐𝑝𝑑𝑎 × (𝑇𝑖𝑎_95 − 𝑇𝑖𝑛𝑑𝑜𝑜𝑟)) + 𝑐𝑝_𝑤𝑣
× (𝑤𝑖𝑎_95 × 𝑇𝑖𝑎_95 − 𝑤𝑖𝑛𝑑𝑜𝑜𝑟 × 𝑇𝑖𝑛𝑑𝑜𝑜𝑟)]
𝑄𝑆_83 = �̇� × 60 × [(𝑐𝑝𝑑𝑎 × (𝑇𝑖𝑎_83 − 𝑇𝑖𝑛𝑑𝑜𝑜𝑟)) + 𝑐𝑝_𝑤𝑣
× (𝑤𝑖𝑎_83 × 𝑇𝑖𝑎_83 − 𝑤𝑖𝑛𝑑𝑜𝑜𝑟 × 𝑇𝑖𝑛𝑑𝑜𝑜𝑟)]
The latent component of infiltration air heat contribution is computed as (in Btu/h):
𝑄𝑙_95 = �̇� × 60 × 𝐻𝑓𝑔 × (𝑤𝑖𝑎_95 − 𝑤𝑖𝑛𝑑𝑜𝑜𝑟)
𝑄𝑙_83 = �̇� × 60 × 𝐻83 × (𝑤𝑖𝑎_95 − 𝑤𝑖𝑛𝑑𝑜𝑜𝑟)
The notations are as follows:
• �̇�= dry air mass flow rate of infiltration air in lb/m. It is the measured condenser
mass flow for single duct air conditioners and the difference between condenser
inlet and outlet air flows for double duct air conditioners.
• cp_da= specific heat of dry air, 0.24 Btu/lb m − °F.
• Cp_wv= specific heat of water vapor, 0.444 Btu/lb m − °F.
• Tai_95, Tai_83= infiltration air dry-bulb temperatures, 95 °F and 83 °F, respectively.
• Tindoor= indoor chamber dry-bulb temperature, 80 °F.
• windoor= humidity ratio of the indoor chamber air, 0.0112 lb w/lb da.
• Hfg= latent heat of vaporization for water vapor, 1061 Btu/lb m.
• wia_95, wia_83= humidity ratios of the 95 °F and 83 °F dry-bulb infiltration air, 0.0141
and 0.01086 lb w/lb da, respectively.
• 60 = conversion factor from minutes to hours.
Seasonal calculation metrics
SACC - Seasonally Adjusted Cooling Capacity.
𝑆𝐴𝐶𝐶 = 𝐴𝐶𝐶95 × 0.2 + 𝐴𝐶𝐶83 × 0.8
Where:
• ACC95 and ACC83 = adjusted cooling capacity, in Btu/h, calculated above.
• 0.2 = weighting factor for ACC95.
• 0.8 = weighting factor for ACC83.
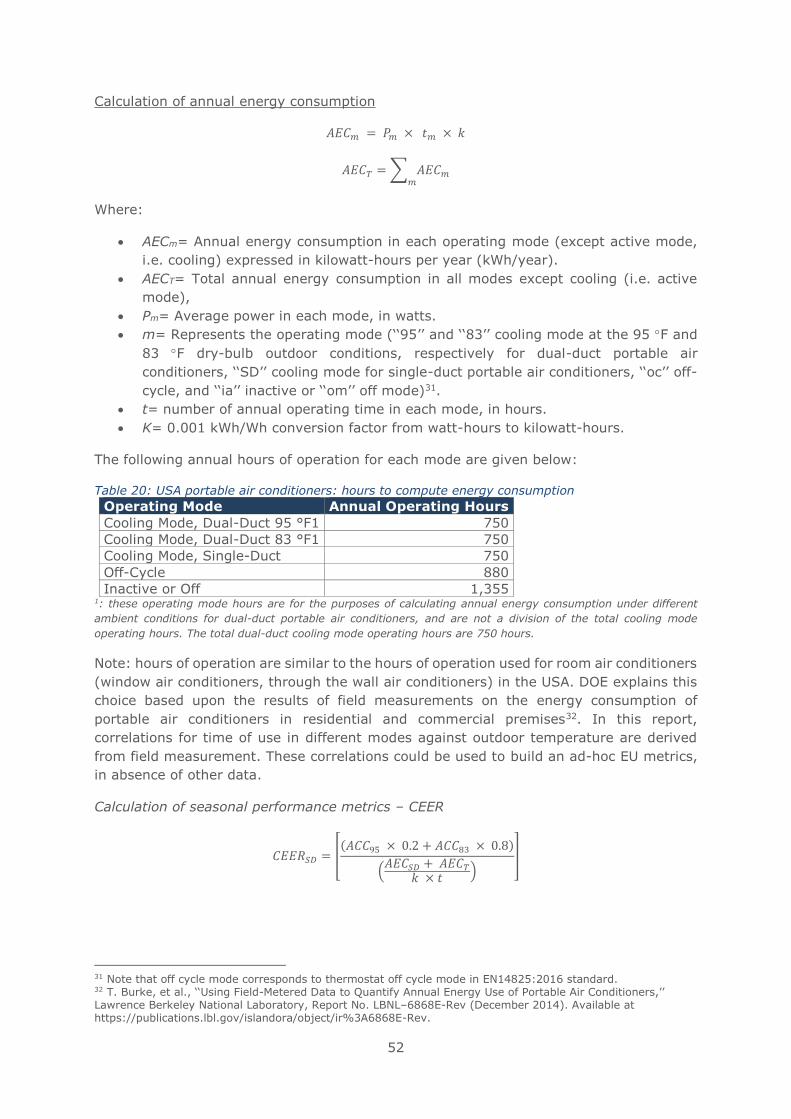
52
Calculation of annual energy consumption
𝐴𝐸𝐶𝑚 = 𝑃𝑚 × 𝑡𝑚 × 𝑘
𝐴𝐸𝐶𝑇 = ∑ 𝐴𝐸𝐶𝑚𝑚
Where:
• AECm= Annual energy consumption in each operating mode (except active mode,
i.e. cooling) expressed in kilowatt-hours per year (kWh/year).
• AECT= Total annual energy consumption in all modes except cooling (i.e. active
mode),
• Pm= Average power in each mode, in watts.
• m= Represents the operating mode (‘‘95’’ and ‘‘83’’ cooling mode at the 95 F and
83 F dry-bulb outdoor conditions, respectively for dual-duct portable air
conditioners, ‘‘SD’’ cooling mode for single-duct portable air conditioners, ‘‘oc’’ off-
cycle, and ‘‘ia’’ inactive or ‘‘om’’ off mode)31.
• t= number of annual operating time in each mode, in hours.
• K= 0.001 kWh/Wh conversion factor from watt-hours to kilowatt-hours.
The following annual hours of operation for each mode are given below:
Table 20: USA portable air conditioners: hours to compute energy consumption
Operating Mode Annual Operating Hours
Cooling Mode, Dual-Duct 95 °F1 750
Cooling Mode, Dual-Duct 83 °F1 750
Cooling Mode, Single-Duct 750
Off-Cycle 880
Inactive or Off 1,355 1: these operating mode hours are for the purposes of calculating annual energy consumption under different
ambient conditions for dual-duct portable air conditioners, and are not a division of the total cooling mode
operating hours. The total dual-duct cooling mode operating hours are 750 hours.
Note: hours of operation are similar to the hours of operation used for room air conditioners
(window air conditioners, through the wall air conditioners) in the USA. DOE explains this
choice based upon the results of field measurements on the energy consumption of
portable air conditioners in residential and commercial premises32. In this report,
correlations for time of use in different modes against outdoor temperature are derived
from field measurement. These correlations could be used to build an ad-hoc EU metrics,
in absence of other data.
Calculation of seasonal performance metrics – CEER
𝐶𝐸𝐸𝑅𝑆𝐷 = [(𝐴𝐶𝐶95 × 0.2 + 𝐴𝐶𝐶83 × 0.8)
(𝐴𝐸𝐶𝑆𝐷 + 𝐴𝐸𝐶𝑇
𝑘 × 𝑡)
]
31 Note that off cycle mode corresponds to thermostat off cycle mode in EN14825:2016 standard. 32 T. Burke, et al., ‘‘Using Field-Metered Data to Quantify Annual Energy Use of Portable Air Conditioners,’’ Lawrence Berkeley National Laboratory, Report No. LBNL–6868E-Rev (December 2014). Available at https://publications.lbl.gov/islandora/object/ir%3A6868E-Rev.
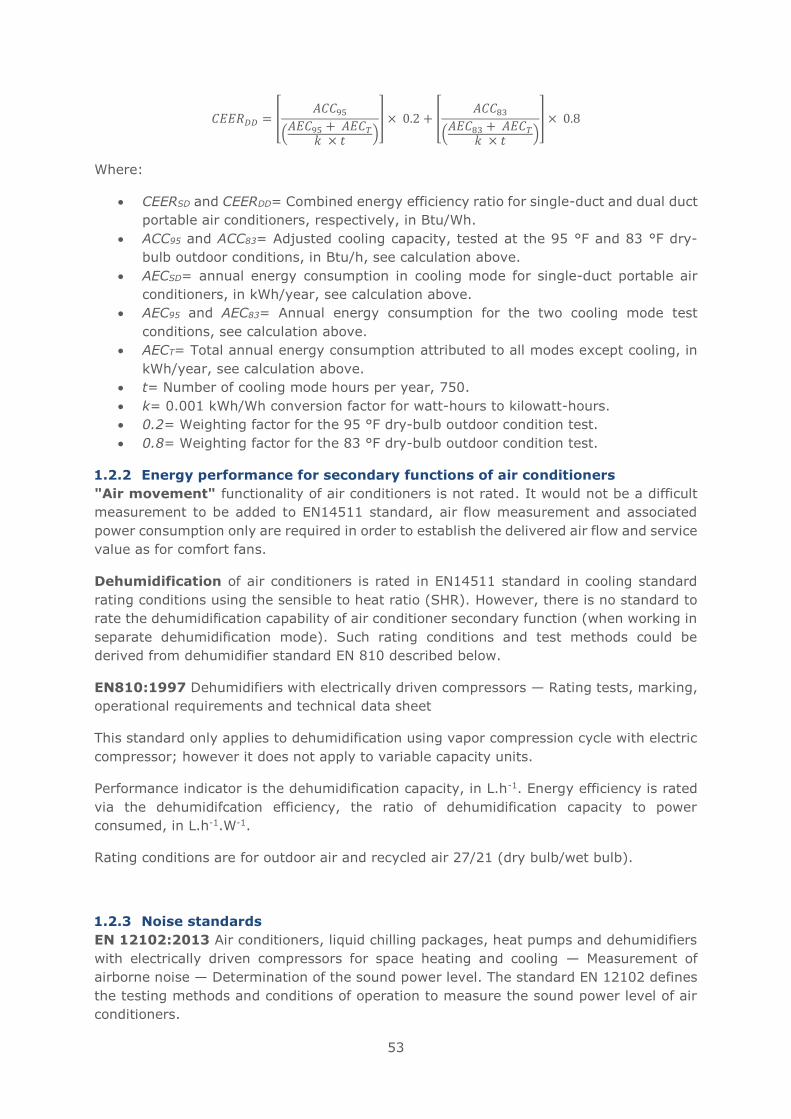
53
𝐶𝐸𝐸𝑅𝐷𝐷 = [𝐴𝐶𝐶95
(𝐴𝐸𝐶95 + 𝐴𝐸𝐶𝑇
𝑘 × 𝑡)
] × 0.2 + [𝐴𝐶𝐶83
(𝐴𝐸𝐶83 + 𝐴𝐸𝐶𝑇
𝑘 × 𝑡)
] × 0.8
Where:
• CEERSD and CEERDD= Combined energy efficiency ratio for single-duct and dual duct
portable air conditioners, respectively, in Btu/Wh.
• ACC95 and ACC83= Adjusted cooling capacity, tested at the 95 °F and 83 °F dry-
bulb outdoor conditions, in Btu/h, see calculation above.
• AECSD= annual energy consumption in cooling mode for single-duct portable air
conditioners, in kWh/year, see calculation above.
• AEC95 and AEC83= Annual energy consumption for the two cooling mode test
conditions, see calculation above.
• AECT= Total annual energy consumption attributed to all modes except cooling, in
kWh/year, see calculation above.
• t= Number of cooling mode hours per year, 750.
• k= 0.001 kWh/Wh conversion factor for watt-hours to kilowatt-hours.
• 0.2= Weighting factor for the 95 °F dry-bulb outdoor condition test.
• 0.8= Weighting factor for the 83 °F dry-bulb outdoor condition test.
1.2.2 Energy performance for secondary functions of air conditioners
"Air movement" functionality of air conditioners is not rated. It would not be a difficult
measurement to be added to EN14511 standard, air flow measurement and associated
power consumption only are required in order to establish the delivered air flow and service
value as for comfort fans.
Dehumidification of air conditioners is rated in EN14511 standard in cooling standard
rating conditions using the sensible to heat ratio (SHR). However, there is no standard to
rate the dehumidification capability of air conditioner secondary function (when working in
separate dehumidification mode). Such rating conditions and test methods could be
derived from dehumidifier standard EN 810 described below.
EN810:1997 Dehumidifiers with electrically driven compressors — Rating tests, marking,
operational requirements and technical data sheet
This standard only applies to dehumidification using vapor compression cycle with electric
compressor; however it does not apply to variable capacity units.
Performance indicator is the dehumidification capacity, in L.h-1. Energy efficiency is rated
via the dehumidifcation efficiency, the ratio of dehumidification capacity to power
consumed, in L.h-1.W-1.
Rating conditions are for outdoor air and recycled air 27/21 (dry bulb/wet bulb).
1.2.3 Noise standards
EN 12102:2013 Air conditioners, liquid chilling packages, heat pumps and dehumidifiers
with electrically driven compressors for space heating and cooling — Measurement of
airborne noise — Determination of the sound power level. The standard EN 12102 defines
the testing methods and conditions of operation to measure the sound power level of air
conditioners.
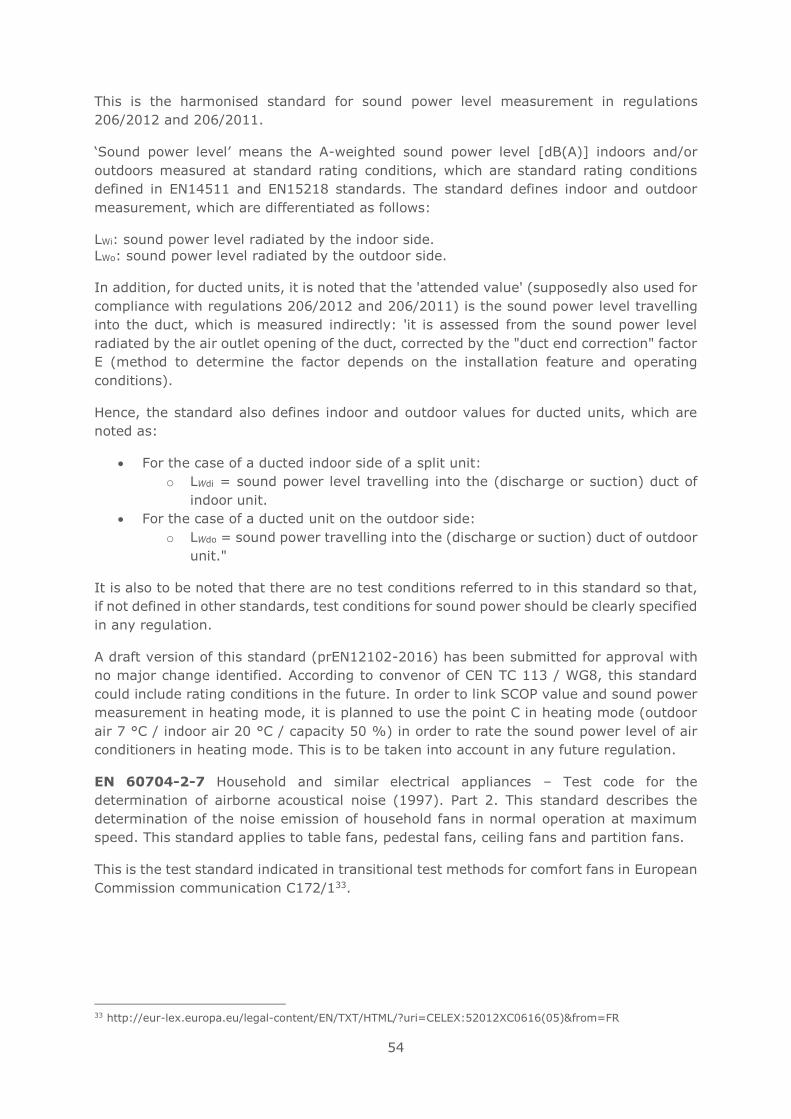
54
This is the harmonised standard for sound power level measurement in regulations
206/2012 and 206/2011.
‘Sound power level’ means the A-weighted sound power level [dB(A)] indoors and/or
outdoors measured at standard rating conditions, which are standard rating conditions
defined in EN14511 and EN15218 standards. The standard defines indoor and outdoor
measurement, which are differentiated as follows:
LWi: sound power level radiated by the indoor side.
LWo: sound power level radiated by the outdoor side.
In addition, for ducted units, it is noted that the 'attended value' (supposedly also used for
compliance with regulations 206/2012 and 206/2011) is the sound power level travelling
into the duct, which is measured indirectly: 'it is assessed from the sound power level
radiated by the air outlet opening of the duct, corrected by the "duct end correction" factor
E (method to determine the factor depends on the installation feature and operating
conditions).
Hence, the standard also defines indoor and outdoor values for ducted units, which are
noted as:
• For the case of a ducted indoor side of a split unit:
o LWdi = sound power level travelling into the (discharge or suction) duct of
indoor unit.
• For the case of a ducted unit on the outdoor side:
o LWdo = sound power travelling into the (discharge or suction) duct of outdoor
unit."
It is also to be noted that there are no test conditions referred to in this standard so that,
if not defined in other standards, test conditions for sound power should be clearly specified
in any regulation.
A draft version of this standard (prEN12102-2016) has been submitted for approval with
no major change identified. According to convenor of CEN TC 113 / WG8, this standard
could include rating conditions in the future. In order to link SCOP value and sound power
measurement in heating mode, it is planned to use the point C in heating mode (outdoor
air 7 °C / indoor air 20 °C / capacity 50 %) in order to rate the sound power level of air
conditioners in heating mode. This is to be taken into account in any future regulation.
EN 60704-2-7 Household and similar electrical appliances – Test code for the
determination of airborne acoustical noise (1997). Part 2. This standard describes the
determination of the noise emission of household fans in normal operation at maximum
speed. This standard applies to table fans, pedestal fans, ceiling fans and partition fans.
This is the test standard indicated in transitional test methods for comfort fans in European
Commission communication C172/133.
33 http://eur-lex.europa.eu/legal-content/EN/TXT/HTML/?uri=CELEX:52012XC0616(05)&from=FR
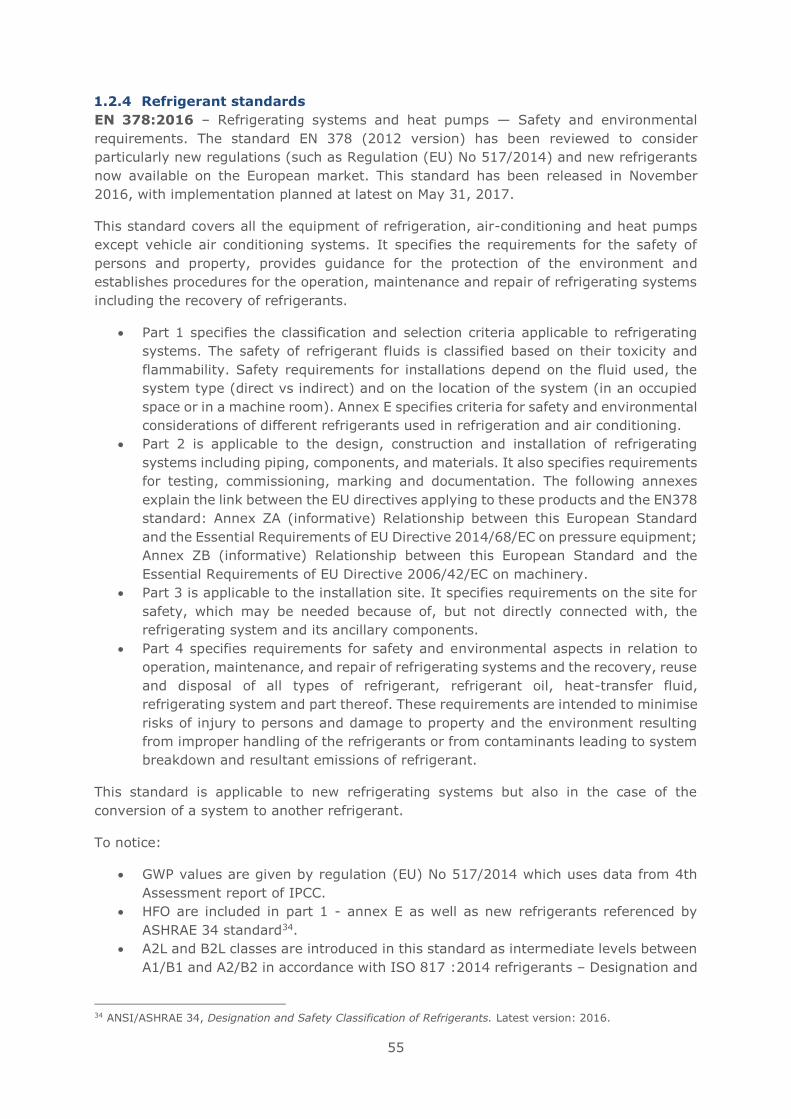
55
1.2.4 Refrigerant standards
EN 378:2016 – Refrigerating systems and heat pumps — Safety and environmental
requirements. The standard EN 378 (2012 version) has been reviewed to consider
particularly new regulations (such as Regulation (EU) No 517/2014) and new refrigerants
now available on the European market. This standard has been released in November
2016, with implementation planned at latest on May 31, 2017.
This standard covers all the equipment of refrigeration, air-conditioning and heat pumps
except vehicle air conditioning systems. It specifies the requirements for the safety of
persons and property, provides guidance for the protection of the environment and
establishes procedures for the operation, maintenance and repair of refrigerating systems
including the recovery of refrigerants.
• Part 1 specifies the classification and selection criteria applicable to refrigerating
systems. The safety of refrigerant fluids is classified based on their toxicity and
flammability. Safety requirements for installations depend on the fluid used, the
system type (direct vs indirect) and on the location of the system (in an occupied
space or in a machine room). Annex E specifies criteria for safety and environmental
considerations of different refrigerants used in refrigeration and air conditioning.
• Part 2 is applicable to the design, construction and installation of refrigerating
systems including piping, components, and materials. It also specifies requirements
for testing, commissioning, marking and documentation. The following annexes
explain the link between the EU directives applying to these products and the EN378
standard: Annex ZA (informative) Relationship between this European Standard
and the Essential Requirements of EU Directive 2014/68/EC on pressure equipment;
Annex ZB (informative) Relationship between this European Standard and the
Essential Requirements of EU Directive 2006/42/EC on machinery.
• Part 3 is applicable to the installation site. It specifies requirements on the site for
safety, which may be needed because of, but not directly connected with, the
refrigerating system and its ancillary components.
• Part 4 specifies requirements for safety and environmental aspects in relation to
operation, maintenance, and repair of refrigerating systems and the recovery, reuse
and disposal of all types of refrigerant, refrigerant oil, heat-transfer fluid,
refrigerating system and part thereof. These requirements are intended to minimise
risks of injury to persons and damage to property and the environment resulting
from improper handling of the refrigerants or from contaminants leading to system
breakdown and resultant emissions of refrigerant.
This standard is applicable to new refrigerating systems but also in the case of the
conversion of a system to another refrigerant.
To notice:
• GWP values are given by regulation (EU) No 517/2014 which uses data from 4th
Assessment report of IPCC.
• HFO are included in part 1 - annex E as well as new refrigerants referenced by
ASHRAE 34 standard34.
• A2L and B2L classes are introduced in this standard as intermediate levels between
A1/B1 and A2/B2 in accordance with ISO 817 :2014 refrigerants – Designation and
34 ANSI/ASHRAE 34, Designation and Safety Classification of Refrigerants. Latest version: 2016.
56
safety classification. Hydrocarbons such as R-290 are A3 refrigerants. Many HFC-
HFO blends with GWP lower than 700 are classified A2L as well as R-1234yf and R-
1234ze refrigerant fluids.
EN 16084:2011 - Refrigerating systems and heat pumps - Qualification of tightness of
components and joints. "This European Standard is intended to describe the qualification
procedure for type approval of the tightness of hermetically sealed and closed components,
joints and parts used in refrigerating systems and heat pumps as described in EN 378. The
sealed and closed components, joints and parts concerned are, in particular, fittings,
bursting discs, flanged or fitted assemblies. The tightness of flexible piping made from non-
metallic materials is dealt with in EN 1736. This standard cover metal flexible piping. The
requirements contained in this document are applicable to joints of maximum DN 50 and
components of internal volume of maximum 5 l and maximum weight of 50 kg. This
document is intended to characterise their tightness stresses met during their operations,
following the fitting procedure specified by the manufacturer, and to specify the minimal
list of necessary information to be provided by the supplier of a component to the person
in charge of carrying out this procedure. It specifies the level of tightness of the component,
as a whole, and its assembly as specified by its manufacturer. It applies to the hermetically
sealed and closed components, joints and parts used in the refrigerating installations,
including those with seals, whatever their material and their design are. This European
Standard specifies additional requirements for mechanical joints that can be recognised as
hermetically sealed joints."35
EN 60355-2-40 - Safety of electric heat pumps - covers sanitary hot water heat pumps,
air-conditioners, and dehumidifiers incorporating motor-compressors and hydronic room
fan coils, their maximum rated voltages being not more than 250 V for single phase
appliances and 600 V for all other appliances. This standard also applies to electric heat
pumps, air conditioners and dehumidifiers containing flammable refrigerant. The standard
establishes the requirements regarding safety of persons and objects. Furthermore, it
provides guidance for environmental protection, and establishes procedures for the
operation, maintenance and repair of refrigeration systems and the recovery of
refrigerants.
This standard also sets requirements for refrigerant charge sizes which might influence the
efficiency of air conditioners. Although this is only a standard (so used on a voluntary basis
and not legally binding), it is seen by manufacturers as mandatory in particular regarding
the safety part. According to (Schleicher et al., 2017)36, this standard and planned next
revision does not allow propane split air conditioners to reach A+++ SEER level. Delonghi
reports that this also limits the production of A++ single duct using propane with higher
than 2.5 kW. In these conditions, the development of propane and other A3 refrigerants
is not ready to start in Europe in the coming years.
EN 14624:2012 - Performance of portable leak detectors and of room monitors for
halogenated refrigerants "The purpose of this European Standard is to qualify the
performance of portable sniffing leak detectors and room monitors for halogenated
refrigerants. These leak detectors are designed for the detection of CFC, HCFC, HFC and
35 https://standards.cen.eu/dyn/www/f?p=204:110:0::::FSP_PROJECT:34680&cs=13FA5F7AB092D02583186A3C19D691C58 36 Tobias Schleicher, Jonathan Heubes, Ran Liu, Pascal Radermacher, Jens Gröger. The Blue Angel for Stationary Room Air Conditioners – a national eco‐label with international impact, Final Draft of the technical
Background Report for German Federal Environment Agency. Freiburg, June 2017.
57
PFC halogenated gases, and their detection limit is checked with a calibration leak or
calibration gas."37
The lowest sensitivity threshold of these detectors should be of 5000 ppm (threshold when
the leak detector is moving), which corresponds to about 3 g/y leakage for R134a, 2.1 g/y
for R410A and 1.5 g/y for R32. It gives an indirect evaluation of the best precision that
can be achieved during leakage tests performed on installed units (at installation or
maintenance time).
1.2.5 WEEE and RoHS standards
ISO 11469:2016 - Plastics - Generic identification and marking of plastics products
The EN ISO 11469 standard identifies specifies a system of uniform plastic material
marking system. The standard does not cover every aspect of marking (e.g. the marking
process, the minimum size of the item to be marked, the size of the lettering or the
appropriate location of the marking) but the marking system described is intended to help
identify plastics products for subsequent decisions concerning handling, waste recovery or
disposal. The standard refers to ISO 1043-1 for generic identification of the plastics.
EN ISO 1043-2:2011 - Plastics. Symbols and abbreviated terms. Fillers and reinforcing
materials. The EN ISO 1043 standard defines abbreviated terms for the basic polymers
used in plastics, symbols for components of these terms, and symbols for special
characteristics of plastics.
IEC TR 62635:2012 - Guidelines for end-of-life information provided by manufacturers
and recyclers and for recyclability rate calculation of electrical and electronic equipment
IEC/TR 62635:2012(E) provides a methodology for information exchange involving
electronic and electrical equipment manufacturers and recyclers. The standard also
provides a methodology enabling calculation of the recyclability and recoverability rates of
to facilitate optimized end of life treatment operations.
EN 50419:2006 - Marking of electrical and electronic equipment in accordance with
Article 11(2) of Directive 2002/96/EC (WEEE)
EN 50419 contains the product marking requirements needed to ensure compliance with
the WEEE Directive. EN 50419 also contains additional information relating to the marking
requirements, including positioning, visibility, dimensions, location and referenced
documents. The marking requirements are applicable to all manufacturers and producers
of electrical and electronic equipment placing products on the EU market.
EN 50625-1:2014 Collection, logistics & treatment requirements for WEEE - Part 1:
General treatment requirements
EN 50625 was prepared as part of a series of standards requested in Commission mandate
518 (detailed in section 3.2) which aim to support implementation and effectiveness of
Directive 2012/19/EU (WEEE). The standard contains requirements applicable to the
treatment of all types of WEEE and addresses all operators involved in the treatment
(including related handling, sorting, and storage) of WEEE. In particular, the standard
addresses the following issue areas:
• Management principles
37 https://standards.cen.eu/dyn/www/f?p=204:110:0::::FSP_PROJECT:28179&cs=1A51FA1204B81FECC2DB08458FA65628A
58
o Technical and infrastructural pre-conditions
o Training
o Monitoring
o Shipments
• Technical requirements
o General
o Receiving of WEEE at treatment facility
o Handling of WEEE
o Storage of WEEE prior to treatment
o De-pollution (including Annex A normative requirements)
o De-pollution monitoring (including Annex B normative requirements)
o Treatment of non de-polluted WEEE and fractions
o Storage of fractions
o Recycling and recovery targets (including Annex C & D normative requirements)
o Recovery and disposal of fractions
• Documentation
The standard applies to the treatment of WEEE until end-of-waste status is fulfilled, or until
the WEEE is prepared for re-use, recycled, recovered, or final disposal.
EN 50574 - on the collection, logistics & treatment requirements for end-of-life household
appliances containing volatile fluorocarbons or volatile hydrocarbons.
EN 62321 series - Determination of certain substances in electrotechnical products
The purpose of the harmonized EN 62321/IEC 62321 series of standards is to provide test
methods that will allow determination of the levels of certain substances of concern in
electrotechnical products on a consistent global basis.
EN 50581:2012 - Technical documentation for the evaluation of electrical and electronic
products with respect to restriction of hazardous substances
The EN 50581 standard specifies the technical documentation a producer of EEE has to
collect for applicable substance restrictions in order to demonstrate compliance with
Directive 2011/65/EU of the European Parliament and of the Council of 8 June 2011 on the
restriction of the use of certain hazardous substances in electrical and electronic equipment
(RoHS). The technical documentation required to meet the standard includes:
• A general product description
• Documentation of materials, parts and/or sub-assemblies
• Information showing the relationship between the technical documents and respective
materials, parts and/or sub-assemblies
• A list of harmonized standards and/or technical specifications used to prepare the
technical documents.
1.2.6 Mandates issued by the EC to the European Standardization Organizations
M488 - Mandate to CEN, CENELEC and ETSI for standardisation in the field of air
conditioners and comfort fans
This mandate supported the development of harmonised standards regarding regulation
626/2011 and 206/2012 for air conditioners and fans.
59
M544 – Standardisation mandate to the European standardisation organisations
as regards ecodesign requirements for networked standby in support of
Regulation (EC) No 1275/2008 and Regulation (EC) No 642/2009
This mandate should allow the introduction of network standby in a future revision of the
standard EN50564:2011. Networked air conditioners are common today and if standby and
off mode are still defined, in the future, in air conditioner standards EN14511, EN15218
and EN14825, these should be adapted to include corresponding evolutions. Today, it is
not clear whether network standby is taken into account or not in the standby
measurement tests for air conditioners.
If networked standby is to be taken into account then air conditioners fits the definition of
edge equipment in the draft version prEN 50643 which is: Edge equipment is networked
equipment that can be connected to a network and interact with that network or other
equipment and that does not have, as its primary function, the passing of network traffic
to provide a network.
Regarding networked standby there are some useful definitions from the regulation (EU)
No 801/2013 amending regulation (EC) No 1275/200838:
Network means a communication infrastructure with a topology of links, an architecture,
including the physical components, organisational principles, communication procedures
and formats (protocols).
Networked equipment means equipment that can connect to a network and has one or
more network ports
Networked standby means a condition in which the equipment is able to resume a
function by way of a remotely initiated trigger from a network connection;
M543 – Material Efficiency
In December 2015, the EC published a standardisation request to the European
standardisation organisations (ESO’s) covering ecodesign requirements on material
efficiency aspects for energy-related products in support of the implementation of Directive
2009/125/EC.39 It was noted in the mandate, that the absence of adequate metrics is one
of the reasons for the relative lack of ecodesign requirements related to material efficiency
in previous ecodesign implementing measures. The mandate therefore requests that the
ESOs draft new European standards and European standardisation deliverables on material
efficiency aspects for energy-related products in support of the ecodesign Directive
2009/125/EC. This standardisation request clarifies that the following material efficiency
aspects should be covered:
• Extending product lifetime.
• Ability to re-use components or recycle materials from products at end-of-life.
• Use of re-used components and/or recycled materials in products
38 http://eur-lex.europa.eu/legal-content/EN/TXT/PDF/?uri=CELEX:02008R1275-20170109&from=EN 39 European Commission Mandate 543 on Material Efficiency, available from http://ec.europa.eu/growth/tools-databases/mandates/index.cfm?fuseaction=search.detail&id=564
60
1.3 Legislation
Air conditioners and comfort fans are currently covered by a number of pieces of legislation,
both within the EU and third party countries, which attempt to address the environmental
impacts of these products through mandatory measures.
1.3.1 EU legislation
There are several pieces of environmental legislation which either directly or indirectly
address products within the scope of this review project.
EU Directive 2009/125/EC - Ecodesign for Energy-Related Products 40
The Ecodesign Directive provides consistent EU-wide rules for improving the environmental
performance of products placed on the EU market. This EU wide approach ensures that
Member States’ national regulations are aligned so that potential barriers to intra-EU trade
are removed.
The Directive’s main aim is to provide a framework for reducing the environmental impacts
of products throughout their entire life cycle. As many of the environmental impacts
associated with products are determined during the design phase, the ecodesign Directive
aims to bring about improvements in environmental performance through mandating
changes at the product design stage.
The Ecodesign Directive is a framework directive, meaning that it does not directly set
minimum requirements rather the aims of the Directive are implemented through product-
specific Regulations, which are directly applicable in all EU member states. For a product
to be covered by under the Ecodesign Directive it needs to meet the following criteria:
• have a volume of sales that exceeds 200,000 units per year throughout the internal
European market
• have a significant environmental impact within the internal market
• present significant potential for improvement in environmental impact without
incurring excessive costs
EU Regulation 206/2012/EU - Ecodesign Requirements for air conditioners and
comfort fans41
The European Commission published Commission Regulation (EU) No 206/2012
implementing ecodesign requirement measures for air conditioners and comfort fans. The
Regulation includes:
• Requirements on the energy efficiency for all air conditioners in scope
• Requirements on maximum energy consumption in off mode and standby mode
including power management demand for single duct, double duct and comfort fans
• Requirements for maximum sound power level for all air conditioner types in scope
• Information requirements for both air conditioners and comfort fans
The Regulation applies to:
• electric mains-operated air conditioners with a rated capacity of ≤ 12 kW for
cooling, or heating if the product has no cooling function, and comfort fans with an
electric fan power input ≤ 125W.
40 http://eur-lex.europa.eu/legal-content/EN/TXT/PDF/?uri=CELEX:32009L0125&from=EN 41 http://eur-lex.europa.eu/LexUriServ/LexUriServ.do?uri=OJ:L:2012:072:0007:0027:en:PDF
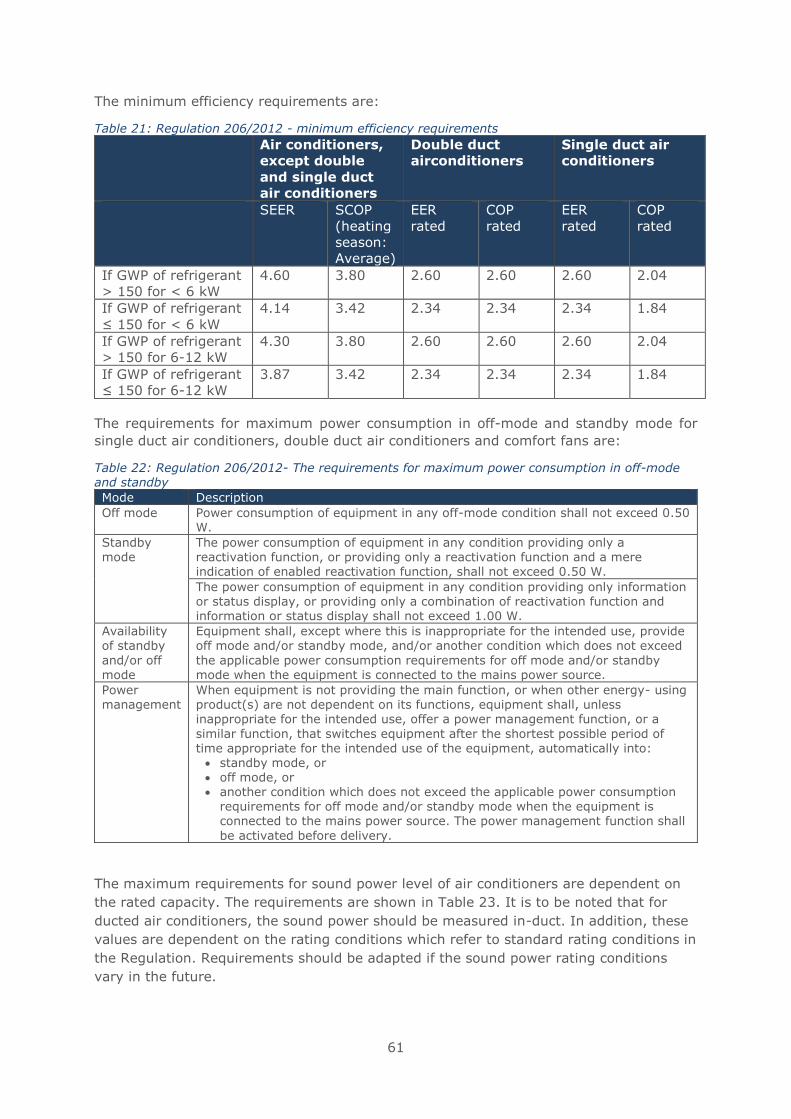
61
The minimum efficiency requirements are:
Table 21: Regulation 206/2012 - minimum efficiency requirements
Air conditioners,
except double
and single duct
air conditioners
Double duct
airconditioners
Single duct air
conditioners
SEER SCOP
(heating
season:
Average)
EER
rated
COP
rated
EER
rated
COP
rated
If GWP of refrigerant
> 150 for < 6 kW
4.60 3.80 2.60 2.60 2.60 2.04
If GWP of refrigerant
≤ 150 for < 6 kW
4.14 3.42 2.34 2.34 2.34 1.84
If GWP of refrigerant
> 150 for 6-12 kW
4.30 3.80 2.60 2.60 2.60 2.04
If GWP of refrigerant
≤ 150 for 6-12 kW
3.87 3.42 2.34 2.34 2.34 1.84
The requirements for maximum power consumption in off-mode and standby mode for
single duct air conditioners, double duct air conditioners and comfort fans are:
Table 22: Regulation 206/2012- The requirements for maximum power consumption in off-mode and standby
Mode Description
Off mode Power consumption of equipment in any off-mode condition shall not exceed 0.50 W.
Standby mode
The power consumption of equipment in any condition providing only a reactivation function, or providing only a reactivation function and a mere indication of enabled reactivation function, shall not exceed 0.50 W.
The power consumption of equipment in any condition providing only information or status display, or providing only a combination of reactivation function and information or status display shall not exceed 1.00 W.
Availability of standby
and/or off mode
Equipment shall, except where this is inappropriate for the intended use, provide off mode and/or standby mode, and/or another condition which does not exceed
the applicable power consumption requirements for off mode and/or standby mode when the equipment is connected to the mains power source.
Power management
When equipment is not providing the main function, or when other energy- using product(s) are not dependent on its functions, equipment shall, unless inappropriate for the intended use, offer a power management function, or a
similar function, that switches equipment after the shortest possible period of time appropriate for the intended use of the equipment, automatically into:
• standby mode, or • off mode, or • another condition which does not exceed the applicable power consumption
requirements for off mode and/or standby mode when the equipment is connected to the mains power source. The power management function shall
be activated before delivery.
The maximum requirements for sound power level of air conditioners are dependent on
the rated capacity. The requirements are shown in Table 23. It is to be noted that for
ducted air conditioners, the sound power should be measured in-duct. In addition, these
values are dependent on the rating conditions which refer to standard rating conditions in
the Regulation. Requirements should be adapted if the sound power rating conditions
vary in the future.
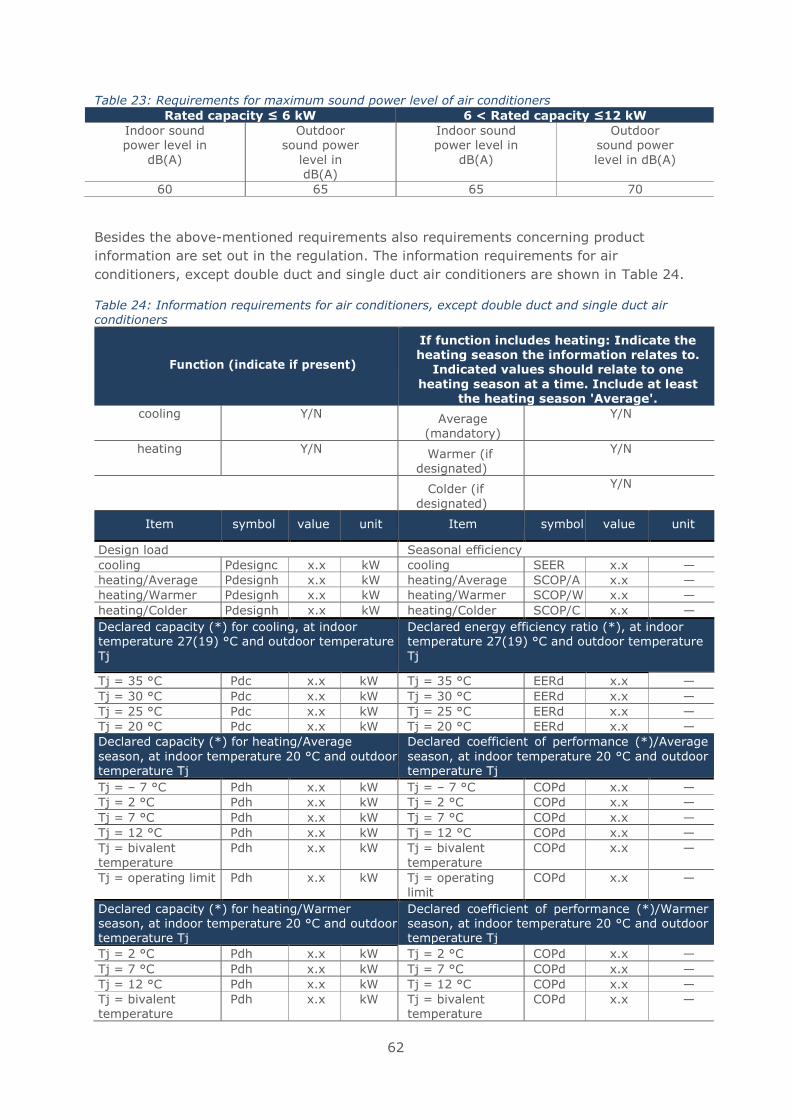
62
Table 23: Requirements for maximum sound power level of air conditioners
Rated capacity ≤ 6 kW 6 < Rated capacity ≤12 kW
Indoor sound power level in
dB(A)
Outdoor sound power
level in dB(A)
Indoor sound power level in
dB(A)
Outdoor sound power
level in dB(A)
60 65 65 70
Besides the above-mentioned requirements also requirements concerning product
information are set out in the regulation. The information requirements for air
conditioners, except double duct and single duct air conditioners are shown in Table 24.
Table 24: Information requirements for air conditioners, except double duct and single duct air conditioners
Function (indicate if present)
If function includes heating: Indicate the heating season the information relates to.
Indicated values should relate to one
heating season at a time. Include at least the heating season 'Average'.
cooling Y/N Average (mandatory)
Y/N
heating Y/N Warmer (if designated)
Y/N
Colder (if
designated)
Y/N
Item symbol value unit Item symbol value unit
Design load Seasonal efficiency
cooling Pdesignc x.x kW cooling SEER x.x —
heating/Average Pdesignh x.x kW heating/Average SCOP/A x.x —
heating/Warmer Pdesignh x.x kW heating/Warmer SCOP/W x.x —
heating/Colder Pdesignh x.x kW heating/Colder SCOP/C x.x —
Declared capacity (*) for cooling, at indoor temperature 27(19) °C and outdoor temperature
Tj
Declared energy efficiency ratio (*), at indoor temperature 27(19) °C and outdoor temperature
Tj
Tj = 35 °C Pdc x.x kW Tj = 35 °C EERd x.x —
Tj = 30 °C Pdc x.x kW Tj = 30 °C EERd x.x —
Tj = 25 °C Pdc x.x kW Tj = 25 °C EERd x.x —
Tj = 20 °C Pdc x.x kW Tj = 20 °C EERd x.x —
Declared capacity (*) for heating/Average
season, at indoor temperature 20 °C and outdoor temperature Tj
Declared coefficient of performance (*)/Average
season, at indoor temperature 20 °C and outdoor temperature Tj
Tj = – 7 °C Pdh x.x kW Tj = – 7 °C COPd x.x —
Tj = 2 °C Pdh x.x kW Tj = 2 °C COPd x.x —
Tj = 7 °C Pdh x.x kW Tj = 7 °C COPd x.x —
Tj = 12 °C Pdh x.x kW Tj = 12 °C COPd x.x —
Tj = bivalent
temperature
Pdh x.x kW Tj = bivalent
temperature
COPd x.x —
Tj = operating limit Pdh x.x kW Tj = operating limit
COPd x.x —
Declared capacity (*) for heating/Warmer season, at indoor temperature 20 °C and outdoor temperature Tj
Declared coefficient of performance (*)/Warmer season, at indoor temperature 20 °C and outdoor temperature Tj
Tj = 2 °C Pdh x.x kW Tj = 2 °C COPd x.x —
Tj = 7 °C Pdh x.x kW Tj = 7 °C COPd x.x —
Tj = 12 °C Pdh x.x kW Tj = 12 °C COPd x.x —
Tj = bivalent temperature
Pdh x.x kW Tj = bivalent temperature
COPd x.x —
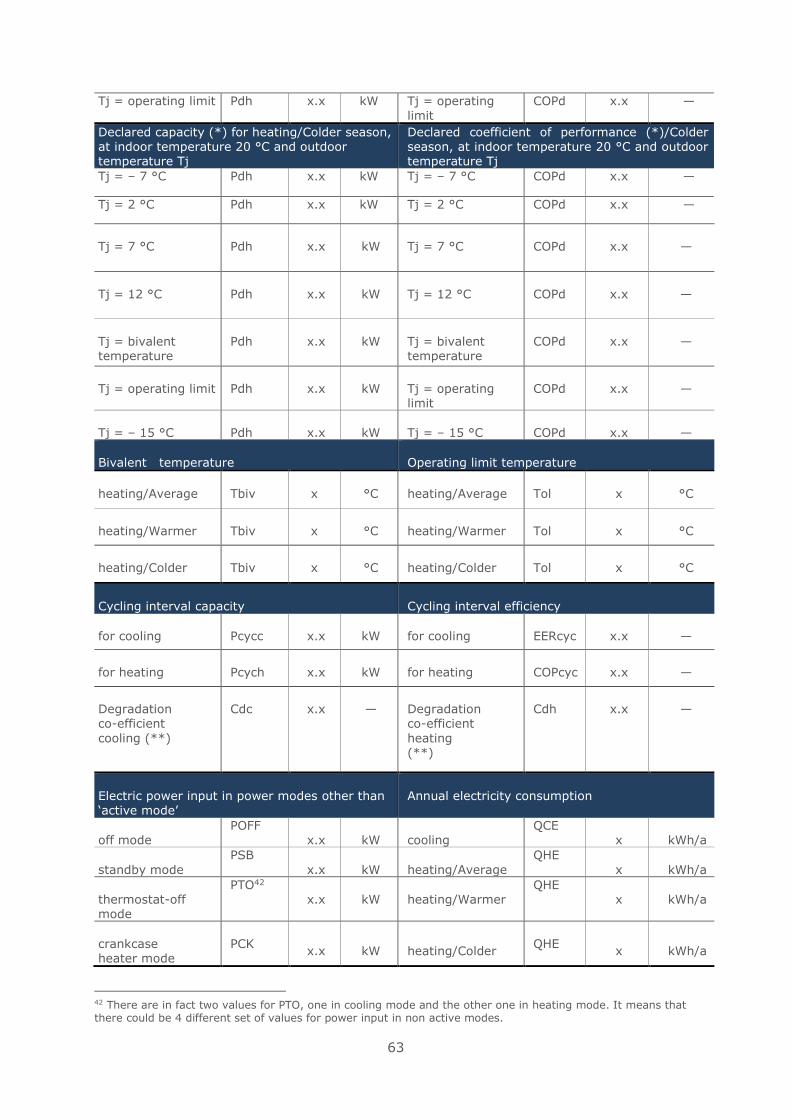
63
Tj = operating limit Pdh x.x kW Tj = operating
limit
COPd x.x —
Declared capacity (*) for heating/Colder season, at indoor temperature 20 °C and outdoor temperature Tj
Declared coefficient of performance (*)/Colder season, at indoor temperature 20 °C and outdoor temperature Tj
Tj = – 7 °C Pdh x.x kW Tj = – 7 °C COPd x.x —
Tj = 2 °C Pdh x.x kW Tj = 2 °C COPd x.x —
Tj = 7 °C
Pdh
x.x
kW
Tj = 7 °C
COPd
x.x
—
Tj = 12 °C
Pdh
x.x
kW
Tj = 12 °C
COPd
x.x
—
Tj = bivalent temperature
Pdh
x.x
kW
Tj = bivalent temperature
COPd
x.x
—
Tj = operating limit
Pdh
x.x
kW
Tj = operating limit
COPd
x.x
—
Tj = – 15 °C
Pdh
x.x
kW
Tj = – 15 °C
COPd
x.x
—
Bivalent temperature
Operating limit temperature
heating/Average
Tbiv
x
°C
heating/Average
Tol
x
°C
heating/Warmer
Tbiv
x
°C
heating/Warmer
Tol
x
°C
heating/Colder
Tbiv
x
°C
heating/Colder
Tol
x
°C
Cycling interval capacity
Cycling interval efficiency
for cooling
Pcycc
x.x
kW
for cooling
EERcyc
x.x
—
for heating
Pcych
x.x
kW
for heating
COPcyc
x.x
—
Degradation co-efficient
cooling (**)
Cdc
x.x
—
Degradation co-efficient
heating (**)
Cdh
x.x
—
Electric power input in power modes other than ‘active mode’
Annual electricity consumption
off mode
POFF x.x
kW
cooling
QCE x
kWh/a
standby mode
PSB
x.x
kW
heating/Average
QHE
x
kWh/a
thermostat-off mode
PTO42 x.x
kW
heating/Warmer
QHE x
kWh/a
crankcase heater mode
PCK
x.x
kW heating/Colder
QHE x
kWh/a
42 There are in fact two values for PTO, one in cooling mode and the other one in heating mode. It means that there could be 4 different set of values for power input in non active modes.
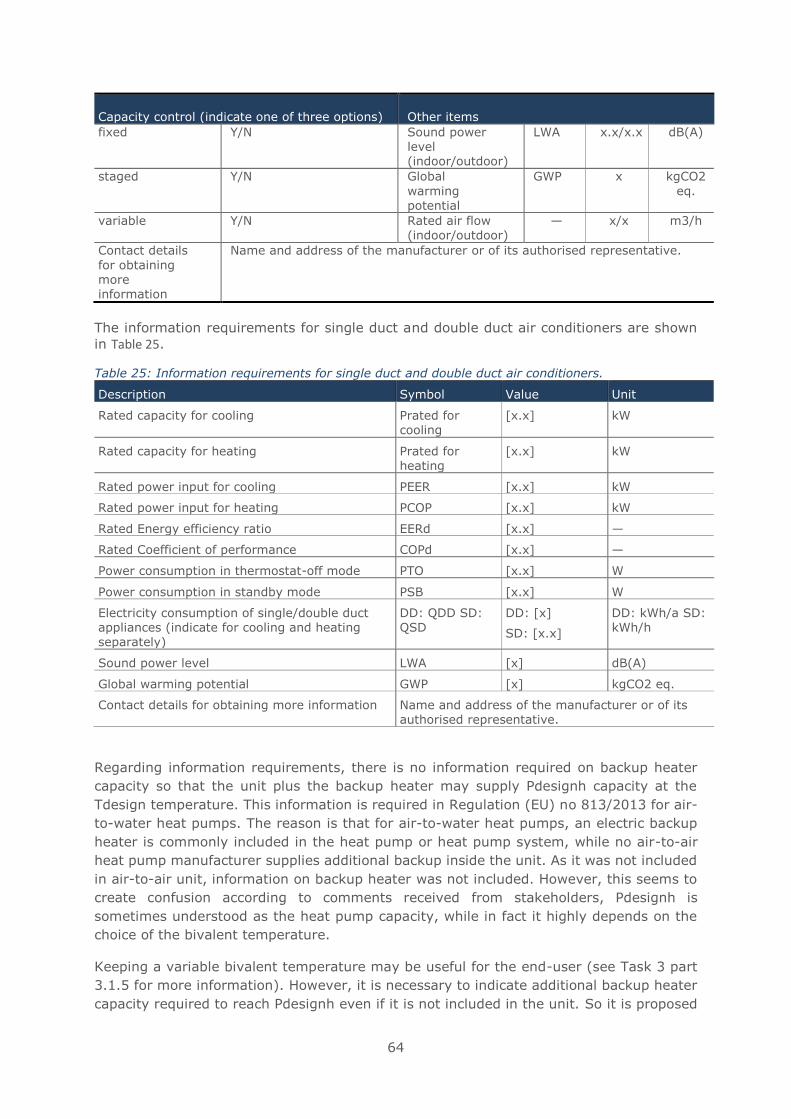
64
Capacity control (indicate one of three options)
Other items
fixed Y/N Sound power level (indoor/outdoor)
LWA x.x/x.x dB(A)
staged Y/N Global
warming potential
GWP x kgCO2
eq.
variable Y/N Rated air flow (indoor/outdoor)
— x/x m3/h
Contact details
for obtaining more information
Name and address of the manufacturer or of its authorised representative.
The information requirements for single duct and double duct air conditioners are shown
in Table 25.
Table 25: Information requirements for single duct and double duct air conditioners.
Description Symbol Value Unit
Rated capacity for cooling Prated for cooling
[x.x] kW
Rated capacity for heating Prated for heating
[x.x] kW
Rated power input for cooling PEER [x.x] kW
Rated power input for heating PCOP [x.x] kW
Rated Energy efficiency ratio EERd [x.x] —
Rated Coefficient of performance COPd [x.x] —
Power consumption in thermostat-off mode PTO [x.x] W
Power consumption in standby mode PSB [x.x] W
Electricity consumption of single/double duct appliances (indicate for cooling and heating separately)
DD: QDD SD: QSD
DD: [x]
SD: [x.x]
DD: kWh/a SD: kWh/h
Sound power level LWA [x] dB(A)
Global warming potential GWP [x] kgCO2 eq.
Contact details for obtaining more information Name and address of the manufacturer or of its authorised representative.
Regarding information requirements, there is no information required on backup heater
capacity so that the unit plus the backup heater may supply Pdesignh capacity at the
Tdesign temperature. This information is required in Regulation (EU) no 813/2013 for air-
to-water heat pumps. The reason is that for air-to-water heat pumps, an electric backup
heater is commonly included in the heat pump or heat pump system, while no air-to-air
heat pump manufacturer supplies additional backup inside the unit. As it was not included
in air-to-air unit, information on backup heater was not included. However, this seems to
create confusion according to comments received from stakeholders, Pdesignh is
sometimes understood as the heat pump capacity, while in fact it highly depends on the
choice of the bivalent temperature.
Keeping a variable bivalent temperature may be useful for the end-user (see Task 3 part
3.1.5 for more information). However, it is necessary to indicate additional backup heater
capacity required to reach Pdesignh even if it is not included in the unit. So it is proposed
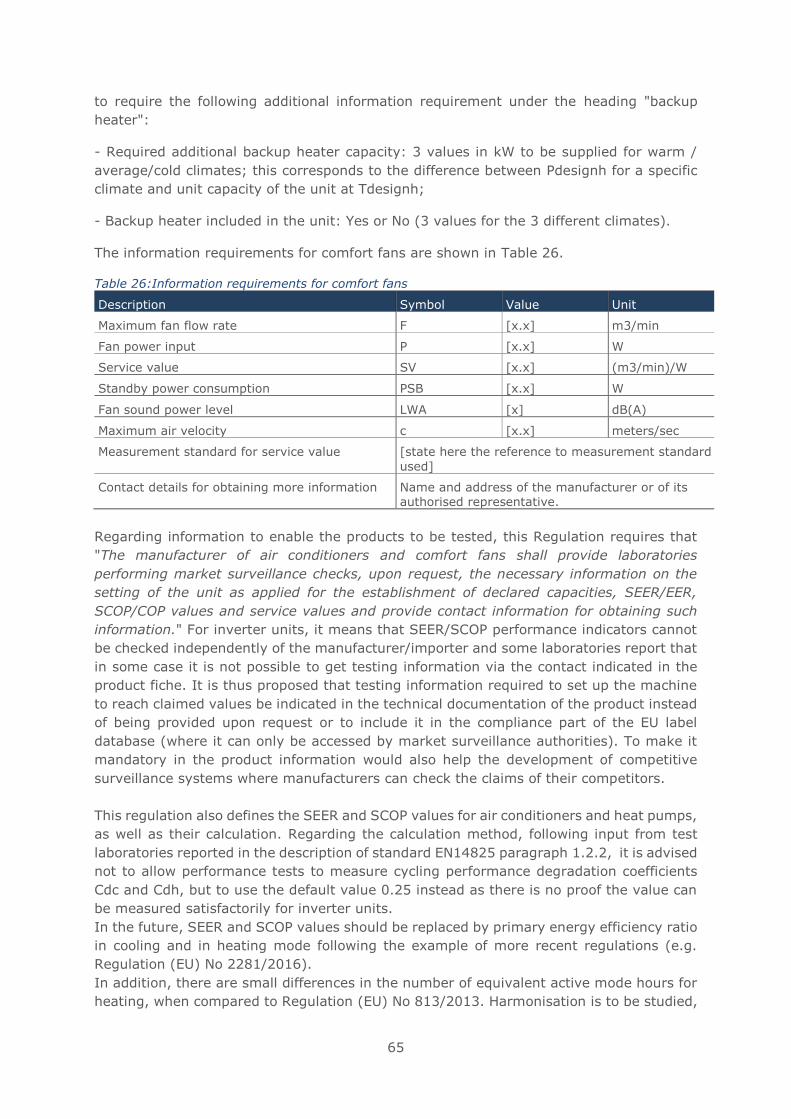
65
to require the following additional information requirement under the heading "backup
heater":
- Required additional backup heater capacity: 3 values in kW to be supplied for warm /
average/cold climates; this corresponds to the difference between Pdesignh for a specific
climate and unit capacity of the unit at Tdesignh;
- Backup heater included in the unit: Yes or No (3 values for the 3 different climates).
The information requirements for comfort fans are shown in Table 26.
Table 26:Information requirements for comfort fans
Description Symbol Value Unit
Maximum fan flow rate F [x.x] m3/min
Fan power input P [x.x] W
Service value SV [x.x] (m3/min)/W
Standby power consumption PSB [x.x] W
Fan sound power level LWA [x] dB(A)
Maximum air velocity c [x.x] meters/sec
Measurement standard for service value [state here the reference to measurement standard
used]
Contact details for obtaining more information Name and address of the manufacturer or of its authorised representative.
Regarding information to enable the products to be tested, this Regulation requires that
"The manufacturer of air conditioners and comfort fans shall provide laboratories
performing market surveillance checks, upon request, the necessary information on the
setting of the unit as applied for the establishment of declared capacities, SEER/EER,
SCOP/COP values and service values and provide contact information for obtaining such
information." For inverter units, it means that SEER/SCOP performance indicators cannot
be checked independently of the manufacturer/importer and some laboratories report that
in some case it is not possible to get testing information via the contact indicated in the
product fiche. It is thus proposed that testing information required to set up the machine
to reach claimed values be indicated in the technical documentation of the product instead
of being provided upon request or to include it in the compliance part of the EU label
database (where it can only be accessed by market surveillance authorities). To make it
mandatory in the product information would also help the development of competitive
surveillance systems where manufacturers can check the claims of their competitors.
This regulation also defines the SEER and SCOP values for air conditioners and heat pumps,
as well as their calculation. Regarding the calculation method, following input from test
laboratories reported in the description of standard EN14825 paragraph 1.2.2, it is advised
not to allow performance tests to measure cycling performance degradation coefficients
Cdc and Cdh, but to use the default value 0.25 instead as there is no proof the value can
be measured satisfactorily for inverter units.
In the future, SEER and SCOP values should be replaced by primary energy efficiency ratio
in cooling and in heating mode following the example of more recent regulations (e.g.
Regulation (EU) No 2281/2016).
In addition, there are small differences in the number of equivalent active mode hours for
heating, when compared to Regulation (EU) No 813/2013. Harmonisation is to be studied,
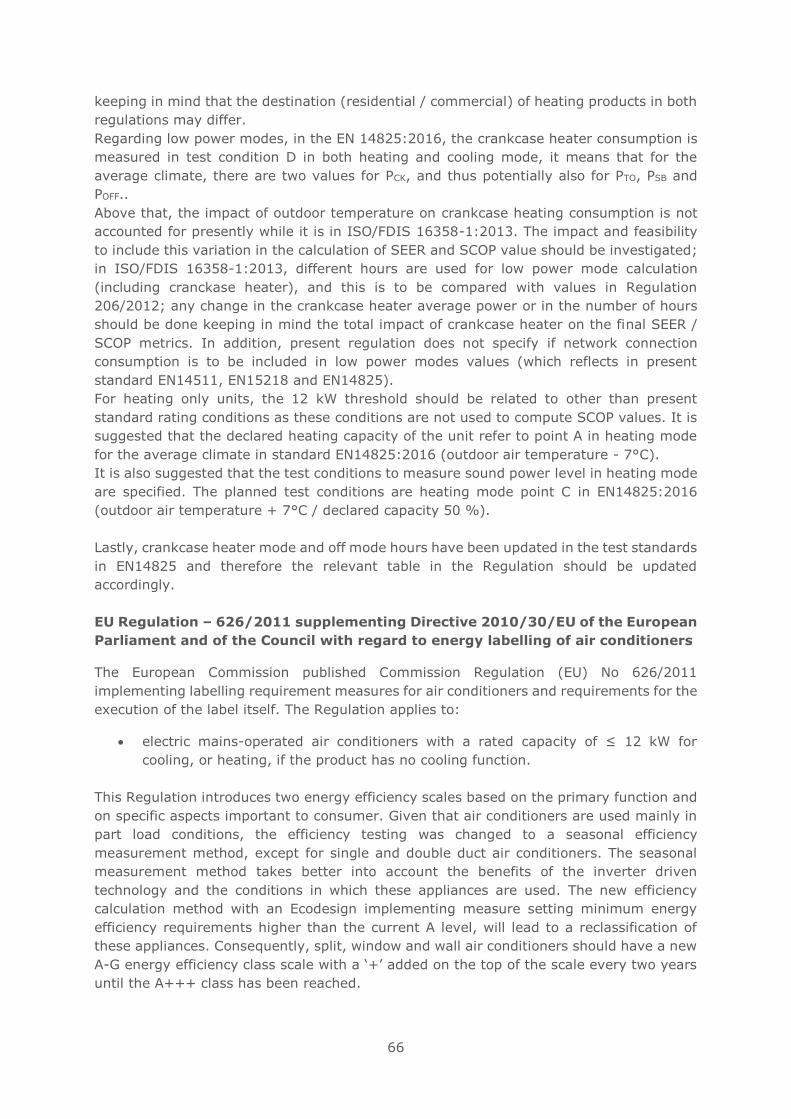
66
keeping in mind that the destination (residential / commercial) of heating products in both
regulations may differ.
Regarding low power modes, in the EN 14825:2016, the crankcase heater consumption is
measured in test condition D in both heating and cooling mode, it means that for the
average climate, there are two values for PCK, and thus potentially also for PTO, PSB and
POFF..
Above that, the impact of outdoor temperature on crankcase heating consumption is not
accounted for presently while it is in ISO/FDIS 16358-1:2013. The impact and feasibility
to include this variation in the calculation of SEER and SCOP value should be investigated;
in ISO/FDIS 16358-1:2013, different hours are used for low power mode calculation
(including cranckase heater), and this is to be compared with values in Regulation
206/2012; any change in the crankcase heater average power or in the number of hours
should be done keeping in mind the total impact of crankcase heater on the final SEER /
SCOP metrics. In addition, present regulation does not specify if network connection
consumption is to be included in low power modes values (which reflects in present
standard EN14511, EN15218 and EN14825).
For heating only units, the 12 kW threshold should be related to other than present
standard rating conditions as these conditions are not used to compute SCOP values. It is
suggested that the declared heating capacity of the unit refer to point A in heating mode
for the average climate in standard EN14825:2016 (outdoor air temperature - 7°C).
It is also suggested that the test conditions to measure sound power level in heating mode
are specified. The planned test conditions are heating mode point C in EN14825:2016
(outdoor air temperature + 7°C / declared capacity 50 %).
Lastly, crankcase heater mode and off mode hours have been updated in the test standards
in EN14825 and therefore the relevant table in the Regulation should be updated
accordingly.
EU Regulation – 626/2011 supplementing Directive 2010/30/EU of the European
Parliament and of the Council with regard to energy labelling of air conditioners
The European Commission published Commission Regulation (EU) No 626/2011
implementing labelling requirement measures for air conditioners and requirements for the
execution of the label itself. The Regulation applies to:
• electric mains-operated air conditioners with a rated capacity of ≤ 12 kW for
cooling, or heating, if the product has no cooling function.
This Regulation introduces two energy efficiency scales based on the primary function and
on specific aspects important to consumer. Given that air conditioners are used mainly in
part load conditions, the efficiency testing was changed to a seasonal efficiency
measurement method, except for single and double duct air conditioners. The seasonal
measurement method takes better into account the benefits of the inverter driven
technology and the conditions in which these appliances are used. The new efficiency
calculation method with an Ecodesign implementing measure setting minimum energy
efficiency requirements higher than the current A level, will lead to a reclassification of
these appliances. Consequently, split, window and wall air conditioners should have a new
A-G energy efficiency class scale with a ‘+’ added on the top of the scale every two years
until the A+++ class has been reached.
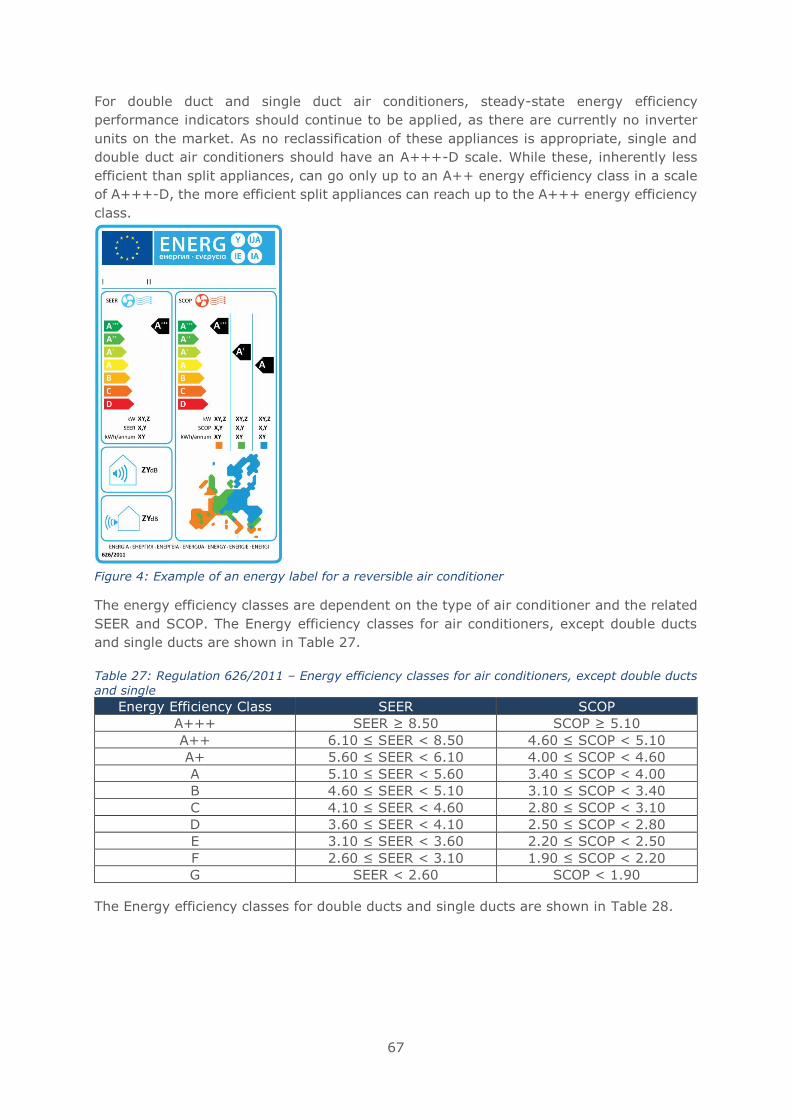
67
For double duct and single duct air conditioners, steady-state energy efficiency
performance indicators should continue to be applied, as there are currently no inverter
units on the market. As no reclassification of these appliances is appropriate, single and
double duct air conditioners should have an A+++-D scale. While these, inherently less
efficient than split appliances, can go only up to an A++ energy efficiency class in a scale
of A+++-D, the more efficient split appliances can reach up to the A+++ energy efficiency
class.
Figure 4: Example of an energy label for a reversible air conditioner
The energy efficiency classes are dependent on the type of air conditioner and the related
SEER and SCOP. The Energy efficiency classes for air conditioners, except double ducts
and single ducts are shown in Table 27.
Table 27: Regulation 626/2011 – Energy efficiency classes for air conditioners, except double ducts
and single
Energy Efficiency Class SEER SCOP
A+++ SEER ≥ 8.50 SCOP ≥ 5.10
A++ 6.10 ≤ SEER < 8.50 4.60 ≤ SCOP < 5.10
A+ 5.60 ≤ SEER < 6.10 4.00 ≤ SCOP < 4.60
A 5.10 ≤ SEER < 5.60 3.40 ≤ SCOP < 4.00
B 4.60 ≤ SEER < 5.10 3.10 ≤ SCOP < 3.40
C 4.10 ≤ SEER < 4.60 2.80 ≤ SCOP < 3.10
D 3.60 ≤ SEER < 4.10 2.50 ≤ SCOP < 2.80
E 3.10 ≤ SEER < 3.60 2.20 ≤ SCOP < 2.50
F 2.60 ≤ SEER < 3.10 1.90 ≤ SCOP < 2.20
G SEER < 2.60 SCOP < 1.90
The Energy efficiency classes for double ducts and single ducts are shown in Table 28.
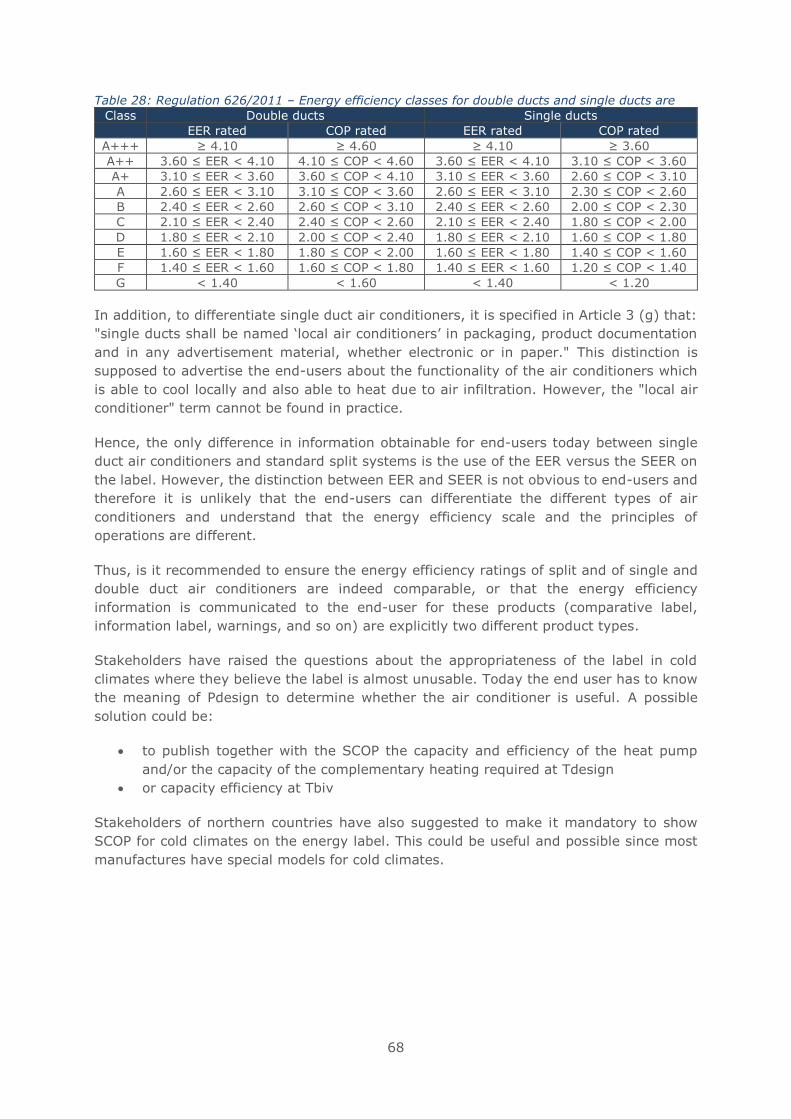
68
Table 28: Regulation 626/2011 – Energy efficiency classes for double ducts and single ducts are
Class Double ducts Single ducts
EER rated COP rated EER rated COP rated
A+++ ≥ 4.10 ≥ 4.60 ≥ 4.10 ≥ 3.60
A++ 3.60 ≤ EER < 4.10 4.10 ≤ COP < 4.60 3.60 ≤ EER < 4.10 3.10 ≤ COP < 3.60
A+ 3.10 ≤ EER < 3.60 3.60 ≤ COP < 4.10 3.10 ≤ EER < 3.60 2.60 ≤ COP < 3.10
A 2.60 ≤ EER < 3.10 3.10 ≤ COP < 3.60 2.60 ≤ EER < 3.10 2.30 ≤ COP < 2.60
B 2.40 ≤ EER < 2.60 2.60 ≤ COP < 3.10 2.40 ≤ EER < 2.60 2.00 ≤ COP < 2.30
C 2.10 ≤ EER < 2.40 2.40 ≤ COP < 2.60 2.10 ≤ EER < 2.40 1.80 ≤ COP < 2.00
D 1.80 ≤ EER < 2.10 2.00 ≤ COP < 2.40 1.80 ≤ EER < 2.10 1.60 ≤ COP < 1.80
E 1.60 ≤ EER < 1.80 1.80 ≤ COP < 2.00 1.60 ≤ EER < 1.80 1.40 ≤ COP < 1.60
F 1.40 ≤ EER < 1.60 1.60 ≤ COP < 1.80 1.40 ≤ EER < 1.60 1.20 ≤ COP < 1.40
G < 1.40 < 1.60 < 1.40 < 1.20
In addition, to differentiate single duct air conditioners, it is specified in Article 3 (g) that:
"single ducts shall be named ‘local air conditioners’ in packaging, product documentation
and in any advertisement material, whether electronic or in paper." This distinction is
supposed to advertise the end-users about the functionality of the air conditioners which
is able to cool locally and also able to heat due to air infiltration. However, the "local air
conditioner" term cannot be found in practice.
Hence, the only difference in information obtainable for end-users today between single
duct air conditioners and standard split systems is the use of the EER versus the SEER on
the label. However, the distinction between EER and SEER is not obvious to end-users and
therefore it is unlikely that the end-users can differentiate the different types of air
conditioners and understand that the energy efficiency scale and the principles of
operations are different.
Thus, is it recommended to ensure the energy efficiency ratings of split and of single and
double duct air conditioners are indeed comparable, or that the energy efficiency
information is communicated to the end-user for these products (comparative label,
information label, warnings, and so on) are explicitly two different product types.
Stakeholders have raised the questions about the appropriateness of the label in cold
climates where they believe the label is almost unusable. Today the end user has to know
the meaning of Pdesign to determine whether the air conditioner is useful. A possible
solution could be:
• to publish together with the SCOP the capacity and efficiency of the heat pump
and/or the capacity of the complementary heating required at Tdesign
• or capacity efficiency at Tbiv
Stakeholders of northern countries have also suggested to make it mandatory to show
SCOP for cold climates on the energy label. This could be useful and possible since most
manufactures have special models for cold climates.
69
Tolerances and uncertainties in Regulation 206/2012 and 626/2011
Ecodesign and Energy Labelling Regulations No 206/2012 and 626/2011 define tolerances
regarding the measured efficiency value compared to the declared value by manufacturer
as follows:
• 8 % on SEER and SCOP values for fixed air conditioners
• 10 % on EER and COP for portable air conditioners
For portable air conditioners, uncertainty of measurement in standard EN14825:2016 is of
10 %. Hence, for these products, both values are aligned, which is in agreement with
Regulation (EU) 2282/201643 regarding tolerances: as tolerance is larger or equal than
uncertainty of measurement, a value measured in a laboratory with minimum value
according to uncertainty still fits in the tolerance limit fixed by the product regulation.
However, for fix air conditioners, uncertainties of measurement in EN14825:2016 have
been set as follows:
• 5 % on EER and COP values for capacities measured that are higher than 2 kW
• 10 % for capacities between 1 and 2 kW
• 15 % for capacities below 1 kW
• And regarding standby/off mode, thermostat off and crankcase heater, 0.1 W for
value measured up to 10 W and 1 % above
With individual EER/COP uncertainty levels, for certain products, the SEER and SCOP
compound uncertainty is higher than regulation tolerances. The study team tested this
hypothesis on real units of various sizes and efficiency levels. Declared values are real unit
efficiency values. Capacities were decreased to the declared values minus maximum
allowed uncertainty, and power consumed in standby/thermostat-off/crankcase was
increased by maximum allowed uncertainty. Results are presented in Table 29
(problematic cases are highlighted in red).
43 http://eur-lex.europa.eu/legal-content/EN/TXT/?qid=1490878675216&uri=CELEX:32016R2282
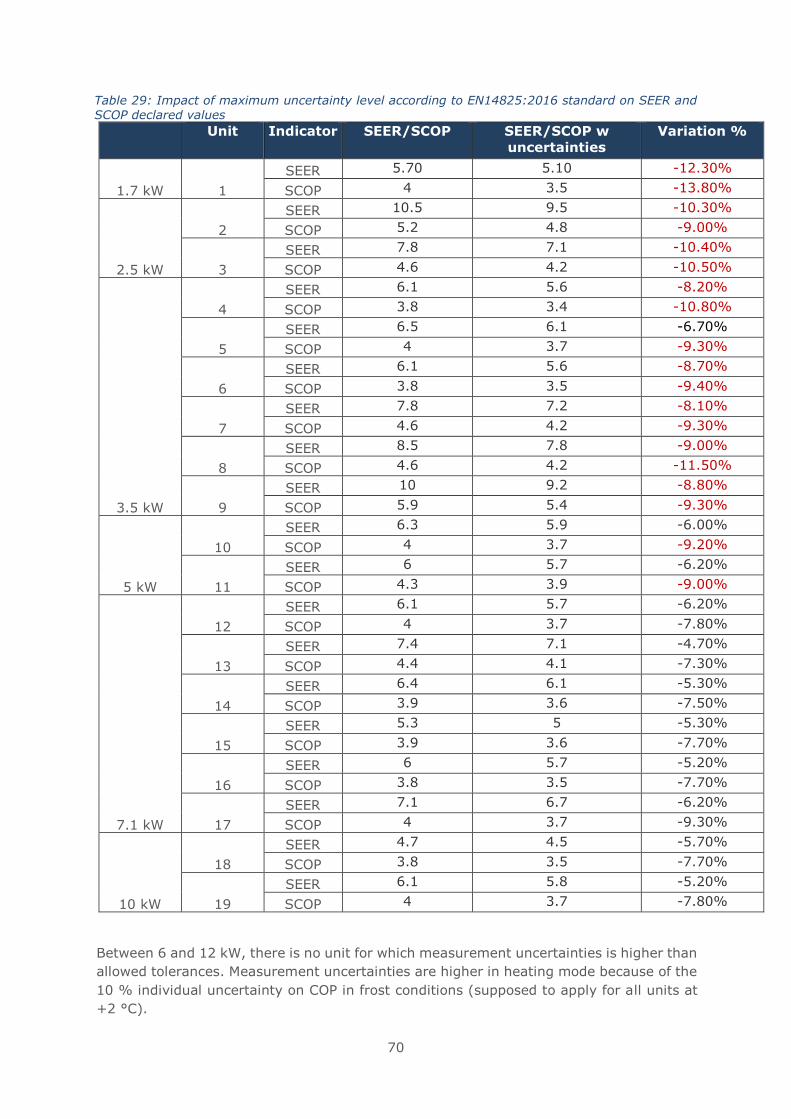
70
Table 29: Impact of maximum uncertainty level according to EN14825:2016 standard on SEER and
SCOP declared values Unit Indicator SEER/SCOP SEER/SCOP w
uncertainties
Variation %
1.7 kW 1
SEER 5.70 5.10 -12.30%
SCOP 4 3.5 -13.80%
2.5 kW
2
SEER 10.5 9.5 -10.30%
SCOP 5.2 4.8 -9.00%
3
SEER 7.8 7.1 -10.40%
SCOP 4.6 4.2 -10.50%
3.5 kW
4
SEER 6.1 5.6 -8.20%
SCOP 3.8 3.4 -10.80%
5
SEER 6.5 6.1 -6.70%
SCOP 4 3.7 -9.30%
6
SEER 6.1 5.6 -8.70%
SCOP 3.8 3.5 -9.40%
7
SEER 7.8 7.2 -8.10%
SCOP 4.6 4.2 -9.30%
8
SEER 8.5 7.8 -9.00%
SCOP 4.6 4.2 -11.50%
9
SEER 10 9.2 -8.80%
SCOP 5.9 5.4 -9.30%
5 kW
10
SEER 6.3 5.9 -6.00%
SCOP 4 3.7 -9.20%
11
SEER 6 5.7 -6.20%
SCOP 4.3 3.9 -9.00%
7.1 kW
12
SEER 6.1 5.7 -6.20%
SCOP 4 3.7 -7.80%
13
SEER 7.4 7.1 -4.70%
SCOP 4.4 4.1 -7.30%
14
SEER 6.4 6.1 -5.30%
SCOP 3.9 3.6 -7.50%
15
SEER 5.3 5 -5.30%
SCOP 3.9 3.6 -7.70%
16
SEER 6 5.7 -5.20%
SCOP 3.8 3.5 -7.70%
17
SEER 7.1 6.7 -6.20%
SCOP 4 3.7 -9.30%
10 kW
18
SEER 4.7 4.5 -5.70%
SCOP 3.8 3.5 -7.70%
19
SEER 6.1 5.8 -5.20%
SCOP 4 3.7 -7.80%
Between 6 and 12 kW, there is no unit for which measurement uncertainties is higher than
allowed tolerances. Measurement uncertainties are higher in heating mode because of the
10 % individual uncertainty on COP in frost conditions (supposed to apply for all units at
+2 °C).
71
Problems are related to units below 6 kW. It is enough that one of the declared capacity
points are below 2 kW to have uncertainty levels higher than the tolerance. For tolerances
to cover the worst-case situation of provisions for measurement uncertainties in
EN14825:2016, these should be increased to 14 % for SCOP for 1.7 kW unit (13 % for
SEER), 12 % for SCOP for 2.5 and 3.5 units (10 % for SEER) and to 10 % for SCOP for 5
kW units (7 % for SEER).
These values are in line with APF (annual performance factor compound of the equivalent
to SEER and SCOP in Japanese standards) tolerances in Japan (as reported in the
Preparatory study for 2004 and 2006 JRA standards) of 10 % for commercial air
conditioners (above 4 kW) and 15 % for residential units (below 4 kW). Nevertheless,
these are very high values in view of setting labeling requirements.
Zero tolerance is applied in the USA, and according to discussions with EU manufacturers
during this review study, this corresponds to measurements uncertainties as low as 2 to 3
% on the measurement of SEER and SCOP (HSPF in the USA). Such low uncertainty levels
are thought to be the result of regular Round Robin tests and harmonization efforts
between laboratories.
The ISO 16358:2013 standard uses the 5 % maximum uncertainty value as a basis
(reference also used for standard rating conditions tests in ISO5151). The case when
measurement uncertainty is above 5 % is not envisaged for variable capacity air
conditioners / heat pumps, whereas a test at 50 % capacity at 35 °C outdoor temperature
and 27 °C indoor is mandatory. This means that all laboratories using this standard should
be able to maintain a 5 % uncertainty level at capacity down to 1.7/2=0.85 kW (1.7 kW
is the lowest capacity unit identified on the EU market).
Base on the above assessment, it can be concluded that:
• in order for tolerances to be higher than maximum measurement uncertainties
implied by individual uncertainties mentioned in EN14825, these would have to be
increased to: 14 % and13% (respectively for SCOP and SEER) for below 2 kW
capacities, 12 % and10% (respectively SCOP and SEER) for between 2 and 6 kW,
10 % and8% (respectively SCOP and SEER) between 6 and 12 kW.
• nevertheless, manufacturers have suggested to reduce both tolerances and
measurement uncertainties; this requires investments to be done by laboratories
(and thus could result in higher test costs for manufacturers and the market
surveillance authorities); Round Robin tests should be made on a regular basis in
order to improve repeatability; possibly, the EN14825 standard should be enriched
in specifying in more details the measurement equipment required and installation
conditions in order to help improving repeatability. A first objective to be met with
such measures could be uncertainties of 5 % for capacities equal or above 1 kW
and 10 % for capacities below 1 kW and for frost conditions. This would help
decreasing maximum uncertainties, and consequently tolerances to the following
levels: 10 % and8 % (respectively SCOP and SEER) for below 6 kW, 9 % and 6 %
(respectively SCOP and SEER) for above 6 kW. This is a more optimal approach for
revising tolerances.
72
EU Regulation 1275/2008/EU - Ecodesign Requirements for standby and off
mode, and networked standby, electric power consumption of electrical and
electronic household and office equipment44
EU ecodesign requirements are mandatory for all manufacturers and suppliers wishing to
sell products consuming electric power in standby and off mode in the EU. A wide range of
equipment – computers, TVs, audio and video equipment, dishwashers, microwave ovens,
and electric toys – can have standby modes so the regulation covers a wide range of
products. The complete list of products is presented in annex 1 in the regulation. The
requirements for products listed in annex 1 is:
• Standby and off mode ≤ 0.5 Watts
• Standby with display ≤ 1 Watts
• Networked standby ≤ 3 Watts
• HiNA equipment ≤ 8 Watts
It should be noted that air conditioners not are included in the standby regulation but the
requirements for standby in Regulation 206/2012 (with and without a display) and off
mode are in line with the standby regulation. Stakeholders have raised the question
whether air conditioners also should comply with the requirements of networked standby
and HiNA equipment. The standby consumption is already included in the SEER calculation
and leaves more room for development for manufacturers. It should though be investigated
in later task whether it is feasible to include the requirements.
EU Draft Commission Regulation implementing Directive 2009/125/EC of the
European Parliament and of the Council with regard to ecodesign requirements
for electronic displays45
In principle, displays of air conditioners are in the scope of the proposed draft regulation.
However, there is an exemption which potentially excludes the displays of all air
conditioners today on the market. In article 1, point 5, the following exemption is stated:
Displays of a surface area smaller than or equal to 1 square decimetre.
EU Directive 2012/19/EU - WEEE Directive 46
The Waste Electrical and Electronic Equipment (WEEE) Directive implements the principle
of "extended producer responsibility” where producers of EEE are expected to take
responsibility for the environmental impact of their products at the end of life. As such, the
WEEE Directive aims to reduce environmental impacts through setting targets for the
separate collection, reuse, recovery, recycling and environmentally sound disposal of
WEEE.
As EEE, air conditioners and comfort fans fall under the scope of the WEEE Directive.
Ecodesign requirements for air conditioners and comfort fans could therefore be used to
assist the WEEE Directive aims via the introduction of product design requirements that
enhance reuse, material recovery and effective recycling.
44 http://eur-lex.europa.eu/legal-content/EN/TXT/PDF/?uri=CELEX:02008R1275-20170109&from=EN 45 http://ec.europa.eu/growth/tools-databases/tbt/en/search/?tbtaction=search.detail&Country_ID=EU&num=433&dspLang=en&basdatedeb=&basdatefin=&baspays=&basnotifnum=433&basnotifnum2=&bastypepays=&baskeywords 46 http://eur-lex.europa.eu/legal-content/EN/TXT/PDF/?uri=CELEX:32012L0019&from=EN
73
EU Regulation 1907/2006/EC - REACH Regulation 47
The Regulation on the Registration, Evaluation, Authorisation and Restriction of Chemicals
(REACH) addresses chemicals, and their safe use, and aims to improve the protection of
human health and the environment through a system of Registration, Evaluation,
Authorisation and Restriction of Chemicals. The REACH Regulation places greater
responsibility on industry to manage the risks from the chemicals they manufacture, import
and market in the EU. Companies are required to demonstrate how substances can be used
safely and risk management measures must be reported to users. The REACH Regulation
also establishes procedures for collecting and assessing information on the properties and
hazards of substances and requires that companies register their substances in a central
database. The entries in the database are then assessed to determine whether the risks of
the substances can be managed. The REACH Regulation allows for some chemicals to be
determined “substances of very high concern (SVHC)” due to their large potential negative
impacts on human health or the environment. The European Chemicals Agency must be
notified of the presence of SVHCs in certain products and the use of SVHCs may then be
subject to prior authorisation. Substances can also be banned were risks are deemed to
be unmanageable. As such, REACH encourages substitution of the most dangerous
chemicals when suitable alternatives have been identified.
As REACH applies to all chemical substances, which implies that it also covers the chemicals
that are used in air conditioners and comfort fans that are within scope of this review
project.
EU Directive 2011/65/EU - RoHS Directive48
The Restriction of Hazardous Substances (RoHS) Directive aims to reduce hazardous
substances from electrical and electronic equipment (EEE) that is placed on the EU market.
A number of hazardous substances are listed in the Directive along with maximum
concentration values that must be met. The RoHS Directive does contain some exemptions
where it has been decided that it may not be possible to manufacture some products
without the use of one or more of the banned substances.
EU Directive 2006/42/EC - Machinery Directive49
The Directive has the dual aim of harmonising the health and safety requirements
applicable to machinery on the basis of a high level of protection of health and safety, while
ensuring the free circulation of machinery on the EU market. The revised Machinery
Directive does not introduce radical changes compared with the previous versions. It
clarifies and consolidates the provisions of the Directive with the aim of improving its
practical application. This directive applies to products which are not residential and
includes some of the same safety standards as for residential air conditioners.
EU Directive 2004/108/EC - Electromagnetic Compatibility Directive 50
The Electromagnetic Compatibility Directive (EMC) Directive has the primary aim of
protecting the electromagnetic spectrum. The Directive requires that products must not
emit unwanted electromagnetic interference and must be protected against a normal level
of interference. The vast majority of complete electrical products must comply independent
of whether they are mains or battery powered. The EMC Directive does contain exemptions
47 http://eur-lex.europa.eu/legal-content/EN/TXT/PDF/?uri=CELEX:02006R1907-20140410&from=EN 48 http://eur-lex.europa.eu/legal-content/EN/TXT/PDF/?uri=CELEX:32011L0065&from=EN 49 http://eur-lex.europa.eu/legal-content/EN/TXT/PDF/?uri=CELEX:02006L0042-20160420&from=EN 50 http://eur-lex.europa.eu/LexUriServ/LexUriServ.do?uri=OJ:L:2004:390:0024:0037:en:PDF
74
for a range of components with no intrinsic function and some products that are already
covered by other directives such as medical, military and communications equipment.
The new EMC directive (2014/30/EU) has been published and will come into force on the
20th April 2016.51
EU Directive 2006/95/EC - Low Voltage Directive 52
The Low Voltage Directive (LVD) ensures that electrical equipment that operates within
certain voltage limits, provides a high level of protection. The LVD Directive covers all
health and safety risks of electrical equipment operating with a voltage of between 50 and
1000 volts for alternating current and between 75 and 1500 volts for direct current.
Consumer goods with a voltage below 50 for alternating current or 75 for direct current
are covered by the General Product Safety Directive (GPSD) (2001/95/EC).
The new Low Voltage Directive (2014/35/EU) will come into force on the 20th April 2016.53
Most air conditioners that are within scope of this review project would fall under the scope
of the LVD Directive.
EU Directive 97/23/EC – Pressure directive54
The Pressure Equipment Directive aims to guarantee free movement of these products in
the internal market while ensuring a high level of safety. The directive covers a very broad
range of products such as vessels, pressurised storage containers, heat exchangers, steam
generators, boilers, industrial piping, safety devices and pressure accessories. Such
equipment is widely used in the process industries (oil & gas, chemical, pharmaceutical,
plastics and rubber and the food and beverage industry), high temperature process
industry (glass, paper and board), energy production and in the supply of utilities, heating,
air conditioning and gas storage and transportation.
EU Directive 2010/31 – Energy Performance of Buildings55
Buildings are responsible for 40% of energy consumption and 36% of CO2 emissions in
the EU. While new buildings generally need fewer than three to five litres of heating oil per
square meter per year, older buildings consume about 25 litres on average. Some buildings
even require up to 60 litres. The energy performance of buildings also includes inspections
of air conditioners since they are important to the overall energy performance of buildings.
The EPBD defines an air-conditioning system as “a combination of all components required
to provide a form of air treatment in which temperature is controlled or can be lowered,
possibly in combination with the control of ventilation, humidity, and air cleanliness”.
Moreover, “the effective rated output (expressed in kW) is the maximum calorific output
specified and guaranteed by the manufacturer as being deliverable during continuous
operation while complying with the useful efficiency indicated by the manufacturer”.
However, even after defining those terms, article 9 remains unclear because the 12-
kilowatt limit can be defined in several ways. Member States will have to define the
meaning of the 12-kilowatt limit through a cost/benefit analysis56.
51 http://ec.europa.eu/growth/sectors/electrical-engineering/directives/index_en.htm 52 http://eur-lex.europa.eu/LexUriServ/LexUriServ.do?uri=OJ:L:2006:374:0010:0019:en:PDF 53 http://ec.europa.eu/growth/sectors/electrical-engineering/directives/index_en.htm 54 http://eur-lex.europa.eu/legal-content/EN/TXT/PDF/?uri=CELEX:01997L0023-20130101&from=EN 55 http://eur-lex.europa.eu/legal-content/EN/TXT/PDF/?uri=CELEX:32010L0031&from=EN 56 Dupont M. and Adnot J., present by the ECEEE 2005 Summer Study, Mandelieu, Côte d'Azur,
75
That limit is associated on the one hand to an energy saving potential and on the other
hand to a workload (number of inspections). The lower the limit (the wider the scope), the
higher the workload but the higher the energy savings. One can understand the weight of
consequences generated by that definition. There are 4 main ways to understand the
boundary:
• 12 kW per cooling system. Only systems with an effective rated output over 12
kilowatts will be taken into account.
• 12 kW per temperature controlled zone. Every cooling system included in the same
thermal zone (bound by a common control system) but with a total effective rated
output of the zone over 12 kW is taken into account. (The rated output of each
system can be lower than 12kW)
• 12 kW per building. Every cooling system included in the same building (bound by
exterior walls) but with a total effective rated output for the building over 12 kW is
taken into account. (The rated output of each system can be lower than 12kW)
• 12 kW per owner (or tenant) in a given building. Based on previous technical
definitions, the scope may be extended to the real ownership in case of a share of
the building.
Directive 2009/28 – renewable energy57
The Renewable Energy Directive establishes an overall policy for the production and
promotion of energy from renewable sources in the EU. It requires the EU to fulfil at least
20% of its total energy needs with renewables by 2020 – to be achieved through the
attainment of individual national targets. Air conditioners are able to obtain a considerable
amount of renewable energy. Each Member State shall adopt a national renewable energy
action plan. The national renewable energy action plans shall set out Member States’
national targets for the share of energy from renewable sources consumed in transport,
electricity and heating and cooling in 2020, taking into account the effects of other policy
measures relating to energy efficiency on final consumption of energy.
• Commission Decision of 1 March 2013 establishing the guidelines for Member
States on calculating renewable energy from heat pumps from different heat pump
technologies pursuant to Article 5 of Directive 2009/28/EC of the European
Parliament and of the Council
Commission Decision of 1 March 2013 – establishing the guidelines for Member States
on calculating renewable energy from heat pumps from different heat pump technologies
pursuant to Article 5 of Directive 2009/28/EC of the European Parliament and of the
Council.
The gross final consumption of energy from renewable sources in each Member State shall
be calculated as the sum of:
a. gross final consumption of electricity from renewable energy sources
b. gross final consumption of energy from renewable sources for heating and
cooling
c. final consumption of energy from renewable sources in transport
Aerothermal, geothermal and hydrothermal heat energy captured by heat pumps shall be
taken into account for the purposes of paragraph (b) provided that the final energy output
France, 30 May-4 June 2005. 57 http://eur-lex.europa.eu/legal-content/EN/TXT/PDF/?uri=CELEX:32009L0028&from=EN
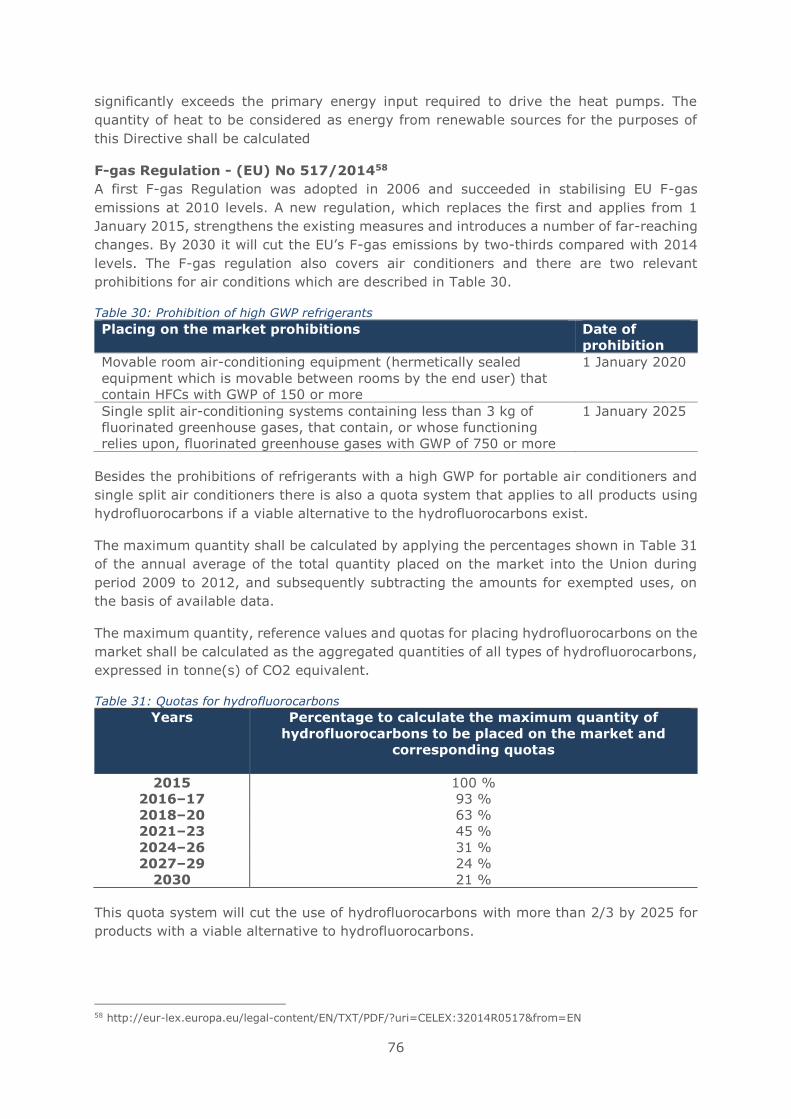
76
significantly exceeds the primary energy input required to drive the heat pumps. The
quantity of heat to be considered as energy from renewable sources for the purposes of
this Directive shall be calculated
F-gas Regulation - (EU) No 517/201458
A first F-gas Regulation was adopted in 2006 and succeeded in stabilising EU F-gas
emissions at 2010 levels. A new regulation, which replaces the first and applies from 1
January 2015, strengthens the existing measures and introduces a number of far-reaching
changes. By 2030 it will cut the EU’s F-gas emissions by two-thirds compared with 2014
levels. The F-gas regulation also covers air conditioners and there are two relevant
prohibitions for air conditions which are described in Table 30.
Table 30: Prohibition of high GWP refrigerants
Placing on the market prohibitions Date of
prohibition
Movable room air-conditioning equipment (hermetically sealed
equipment which is movable between rooms by the end user) that
contain HFCs with GWP of 150 or more
1 January 2020
Single split air-conditioning systems containing less than 3 kg of
fluorinated greenhouse gases, that contain, or whose functioning
relies upon, fluorinated greenhouse gases with GWP of 750 or more
1 January 2025
Besides the prohibitions of refrigerants with a high GWP for portable air conditioners and
single split air conditioners there is also a quota system that applies to all products using
hydrofluorocarbons if a viable alternative to the hydrofluorocarbons exist.
The maximum quantity shall be calculated by applying the percentages shown in Table 31
of the annual average of the total quantity placed on the market into the Union during
period 2009 to 2012, and subsequently subtracting the amounts for exempted uses, on
the basis of available data.
The maximum quantity, reference values and quotas for placing hydrofluorocarbons on the
market shall be calculated as the aggregated quantities of all types of hydrofluorocarbons,
expressed in tonne(s) of CO2 equivalent.
Table 31: Quotas for hydrofluorocarbons
Years Percentage to calculate the maximum quantity of
hydrofluorocarbons to be placed on the market and
corresponding quotas
2015 100 %
2016–17 93 %
2018–20 63 %
2021–23 45 %
2024–26 31 %
2027–29 24 %
2030 21 %
This quota system will cut the use of hydrofluorocarbons with more than 2/3 by 2025 for
products with a viable alternative to hydrofluorocarbons.
58 http://eur-lex.europa.eu/legal-content/EN/TXT/PDF/?uri=CELEX:32014R0517&from=EN
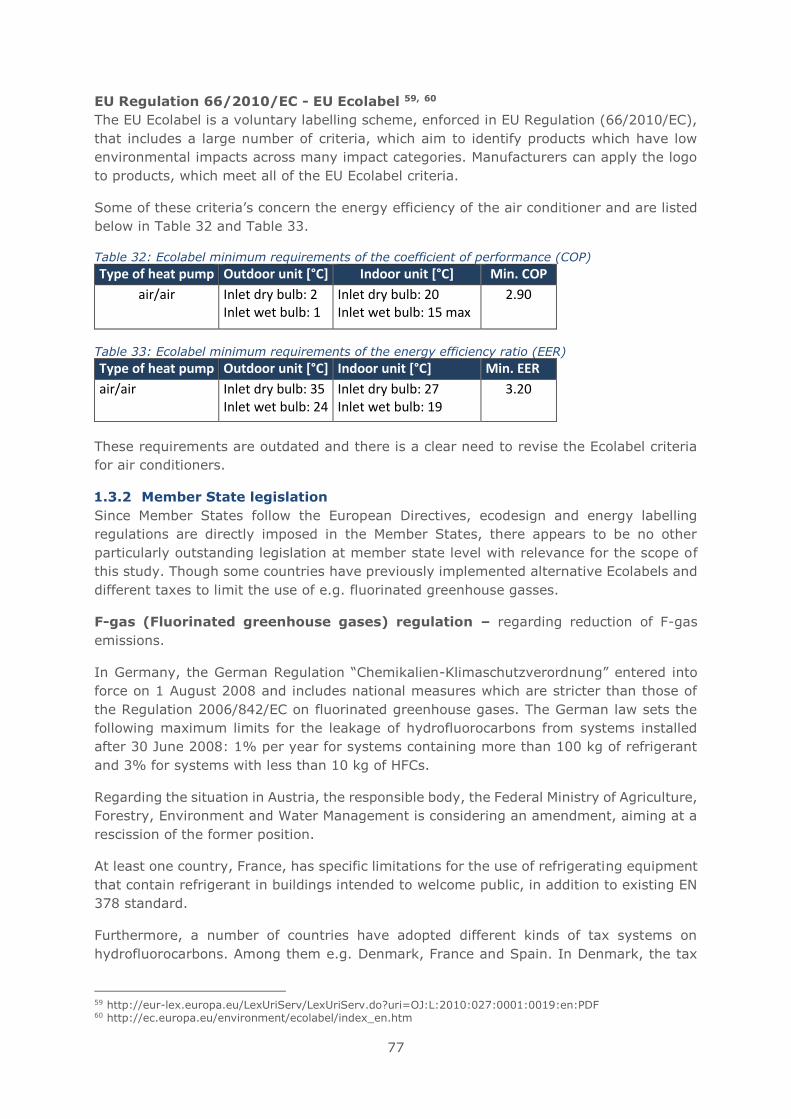
77
EU Regulation 66/2010/EC - EU Ecolabel 59, 60
The EU Ecolabel is a voluntary labelling scheme, enforced in EU Regulation (66/2010/EC),
that includes a large number of criteria, which aim to identify products which have low
environmental impacts across many impact categories. Manufacturers can apply the logo
to products, which meet all of the EU Ecolabel criteria.
Some of these criteria’s concern the energy efficiency of the air conditioner and are listed
below in Table 32 and Table 33.
Table 32: Ecolabel minimum requirements of the coefficient of performance (COP)
Type of heat pump Outdoor unit [°C] Indoor unit [°C] Min. COP
air/air Inlet dry bulb: 2 Inlet wet bulb: 1
Inlet dry bulb: 20 Inlet wet bulb: 15 max
2.90
Table 33: Ecolabel minimum requirements of the energy efficiency ratio (EER)
Type of heat pump Outdoor unit [°C] Indoor unit [°C] Min. EER
air/air Inlet dry bulb: 35 Inlet wet bulb: 24
Inlet dry bulb: 27 Inlet wet bulb: 19
3.20
These requirements are outdated and there is a clear need to revise the Ecolabel criteria
for air conditioners.
1.3.2 Member State legislation
Since Member States follow the European Directives, ecodesign and energy labelling
regulations are directly imposed in the Member States, there appears to be no other
particularly outstanding legislation at member state level with relevance for the scope of
this study. Though some countries have previously implemented alternative Ecolabels and
different taxes to limit the use of e.g. fluorinated greenhouse gasses.
F-gas (Fluorinated greenhouse gases) regulation – regarding reduction of F-gas
emissions.
In Germany, the German Regulation “Chemikalien-Klimaschutzverordnung” entered into
force on 1 August 2008 and includes national measures which are stricter than those of
the Regulation 2006/842/EC on fluorinated greenhouse gases. The German law sets the
following maximum limits for the leakage of hydrofluorocarbons from systems installed
after 30 June 2008: 1% per year for systems containing more than 100 kg of refrigerant
and 3% for systems with less than 10 kg of HFCs.
Regarding the situation in Austria, the responsible body, the Federal Ministry of Agriculture,
Forestry, Environment and Water Management is considering an amendment, aiming at a
rescission of the former position.
At least one country, France, has specific limitations for the use of refrigerating equipment
that contain refrigerant in buildings intended to welcome public, in addition to existing EN
378 standard.
Furthermore, a number of countries have adopted different kinds of tax systems on
hydrofluorocarbons. Among them e.g. Denmark, France and Spain. In Denmark, the tax
59 http://eur-lex.europa.eu/LexUriServ/LexUriServ.do?uri=OJ:L:2010:027:0001:0019:en:PDF 60 http://ec.europa.eu/environment/ecolabel/index_en.htm
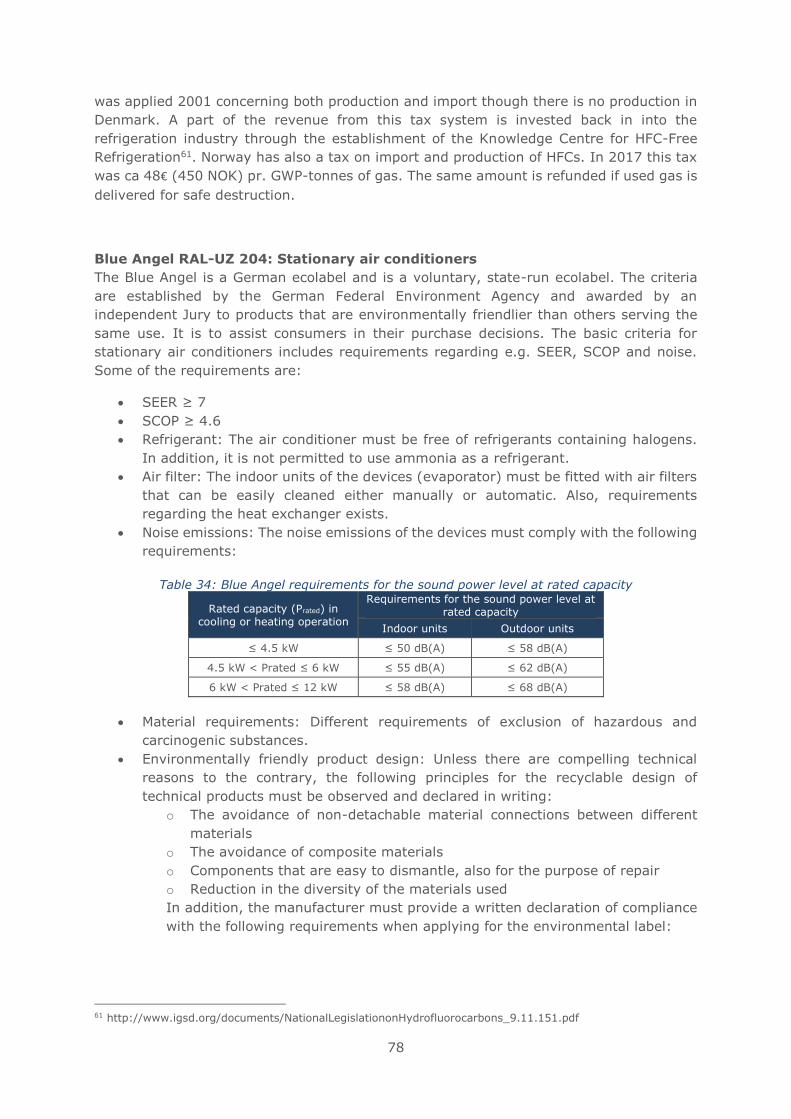
78
was applied 2001 concerning both production and import though there is no production in
Denmark. A part of the revenue from this tax system is invested back in into the
refrigeration industry through the establishment of the Knowledge Centre for HFC-Free
Refrigeration61. Norway has also a tax on import and production of HFCs. In 2017 this tax
was ca 48€ (450 NOK) pr. GWP-tonnes of gas. The same amount is refunded if used gas is
delivered for safe destruction.
Blue Angel RAL-UZ 204: Stationary air conditioners
The Blue Angel is a German ecolabel and is a voluntary, state-run ecolabel. The criteria
are established by the German Federal Environment Agency and awarded by an
independent Jury to products that are environmentally friendlier than others serving the
same use. It is to assist consumers in their purchase decisions. The basic criteria for
stationary air conditioners includes requirements regarding e.g. SEER, SCOP and noise.
Some of the requirements are:
• SEER ≥ 7
• SCOP ≥ 4.6
• Refrigerant: The air conditioner must be free of refrigerants containing halogens.
In addition, it is not permitted to use ammonia as a refrigerant.
• Air filter: The indoor units of the devices (evaporator) must be fitted with air filters
that can be easily cleaned either manually or automatic. Also, requirements
regarding the heat exchanger exists.
• Noise emissions: The noise emissions of the devices must comply with the following
requirements:
Table 34: Blue Angel requirements for the sound power level at rated capacity
Rated capacity (Prated) in cooling or heating operation
Requirements for the sound power level at rated capacity
Indoor units Outdoor units
≤ 4.5 kW ≤ 50 dB(A) ≤ 58 dB(A)
4.5 kW < Prated ≤ 6 kW ≤ 55 dB(A) ≤ 62 dB(A)
6 kW < Prated ≤ 12 kW ≤ 58 dB(A) ≤ 68 dB(A)
• Material requirements: Different requirements of exclusion of hazardous and
carcinogenic substances.
• Environmentally friendly product design: Unless there are compelling technical
reasons to the contrary, the following principles for the recyclable design of
technical products must be observed and declared in writing:
o The avoidance of non-detachable material connections between different
materials
o The avoidance of composite materials
o Components that are easy to dismantle, also for the purpose of repair
o Reduction in the diversity of the materials used
In addition, the manufacturer must provide a written declaration of compliance
with the following requirements when applying for the environmental label:
61 http://www.igsd.org/documents/NationalLegislationonHydrofluorocarbons_9.11.151.pdf
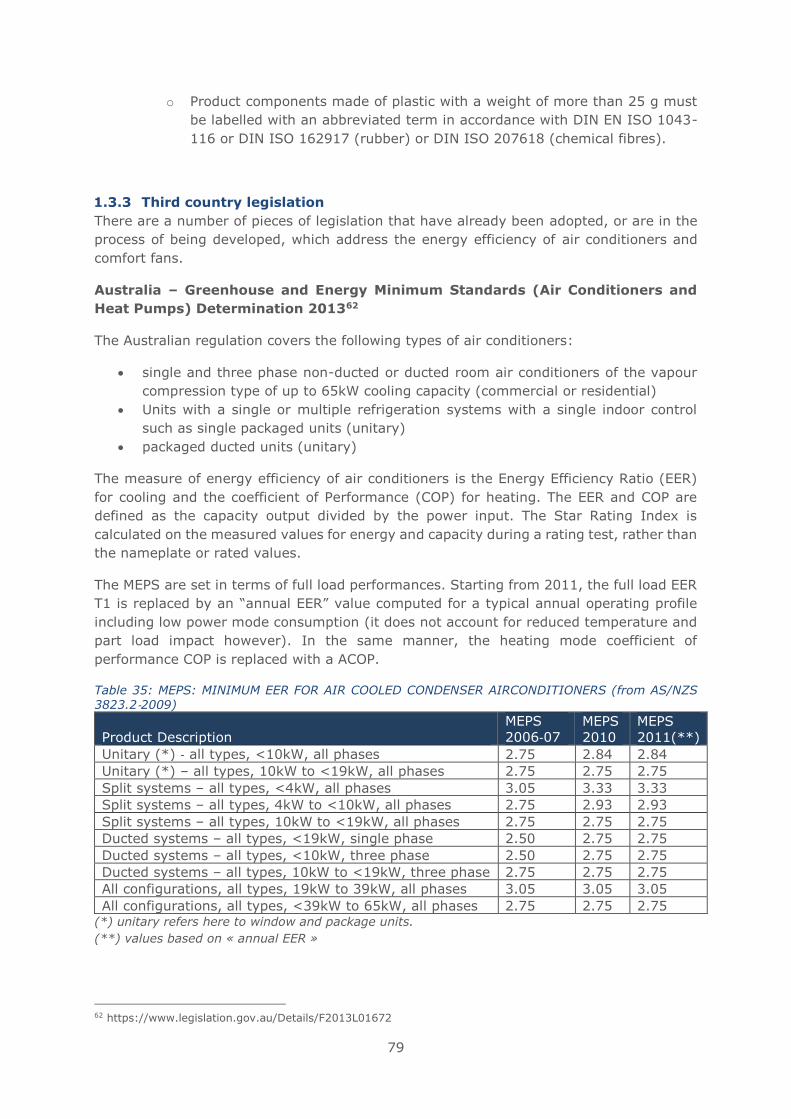
79
o Product components made of plastic with a weight of more than 25 g must
be labelled with an abbreviated term in accordance with DIN EN ISO 1043-
116 or DIN ISO 162917 (rubber) or DIN ISO 207618 (chemical fibres).
1.3.3 Third country legislation
There are a number of pieces of legislation that have already been adopted, or are in the
process of being developed, which address the energy efficiency of air conditioners and
comfort fans.
Australia – Greenhouse and Energy Minimum Standards (Air Conditioners and
Heat Pumps) Determination 201362
The Australian regulation covers the following types of air conditioners:
• single and three phase non-ducted or ducted room air conditioners of the vapour
compression type of up to 65kW cooling capacity (commercial or residential)
• Units with a single or multiple refrigeration systems with a single indoor control
such as single packaged units (unitary)
• packaged ducted units (unitary)
The measure of energy efficiency of air conditioners is the Energy Efficiency Ratio (EER)
for cooling and the coefficient of Performance (COP) for heating. The EER and COP are
defined as the capacity output divided by the power input. The Star Rating Index is
calculated on the measured values for energy and capacity during a rating test, rather than
the nameplate or rated values.
The MEPS are set in terms of full load performances. Starting from 2011, the full load EER
T1 is replaced by an “annual EER” value computed for a typical annual operating profile
including low power mode consumption (it does not account for reduced temperature and
part load impact however). In the same manner, the heating mode coefficient of
performance COP is replaced with a ACOP.
Table 35: MEPS: MINIMUM EER FOR AIR COOLED CONDENSER AIRCONDITIONERS (from AS/NZS 3823.2‐2009)
Product Description
MEPS
2006‐07 MEPS
2010
MEPS
2011(**)
Unitary (*) ‐ all types, <10kW, all phases 2.75 2.84 2.84
Unitary (*) – all types, 10kW to <19kW, all phases 2.75 2.75 2.75
Split systems – all types, <4kW, all phases 3.05 3.33 3.33
Split systems – all types, 4kW to <10kW, all phases 2.75 2.93 2.93
Split systems – all types, 10kW to <19kW, all phases 2.75 2.75 2.75
Ducted systems – all types, <19kW, single phase 2.50 2.75 2.75
Ducted systems – all types, <10kW, three phase 2.50 2.75 2.75
Ducted systems – all types, 10kW to <19kW, three phase 2.75 2.75 2.75
All configurations, all types, 19kW to 39kW, all phases 3.05 3.05 3.05
All configurations, all types, <39kW to 65kW, all phases 2.75 2.75 2.75 (*) unitary refers here to window and package units.
(**) values based on « annual EER »
62 https://www.legislation.gov.au/Details/F2013L01672
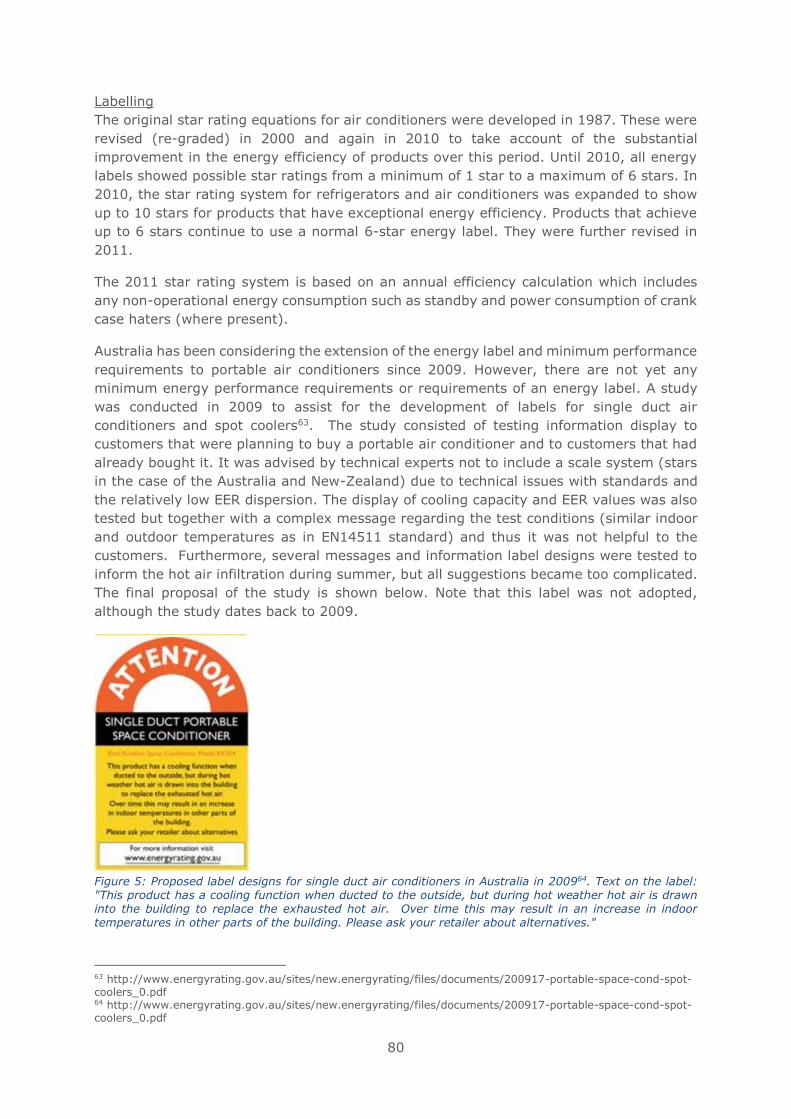
80
Labelling
The original star rating equations for air conditioners were developed in 1987. These were
revised (re-graded) in 2000 and again in 2010 to take account of the substantial
improvement in the energy efficiency of products over this period. Until 2010, all energy
labels showed possible star ratings from a minimum of 1 star to a maximum of 6 stars. In
2010, the star rating system for refrigerators and air conditioners was expanded to show
up to 10 stars for products that have exceptional energy efficiency. Products that achieve
up to 6 stars continue to use a normal 6-star energy label. They were further revised in
2011.
The 2011 star rating system is based on an annual efficiency calculation which includes
any non-operational energy consumption such as standby and power consumption of crank
case haters (where present).
Australia has been considering the extension of the energy label and minimum performance
requirements to portable air conditioners since 2009. However, there are not yet any
minimum energy performance requirements or requirements of an energy label. A study
was conducted in 2009 to assist for the development of labels for single duct air
conditioners and spot coolers63. The study consisted of testing information display to
customers that were planning to buy a portable air conditioner and to customers that had
already bought it. It was advised by technical experts not to include a scale system (stars
in the case of the Australia and New-Zealand) due to technical issues with standards and
the relatively low EER dispersion. The display of cooling capacity and EER values was also
tested but together with a complex message regarding the test conditions (similar indoor
and outdoor temperatures as in EN14511 standard) and thus it was not helpful to the
customers. Furthermore, several messages and information label designs were tested to
inform the hot air infiltration during summer, but all suggestions became too complicated.
The final proposal of the study is shown below. Note that this label was not adopted,
although the study dates back to 2009.
Figure 5: Proposed label designs for single duct air conditioners in Australia in 200964. Text on the label: "This product has a cooling function when ducted to the outside, but during hot weather hot air is drawn into the building to replace the exhausted hot air. Over time this may result in an increase in indoor temperatures in other parts of the building. Please ask your retailer about alternatives."
63 http://www.energyrating.gov.au/sites/new.energyrating/files/documents/200917-portable-space-cond-spot-coolers_0.pdf 64 http://www.energyrating.gov.au/sites/new.energyrating/files/documents/200917-portable-space-cond-spot-coolers_0.pdf
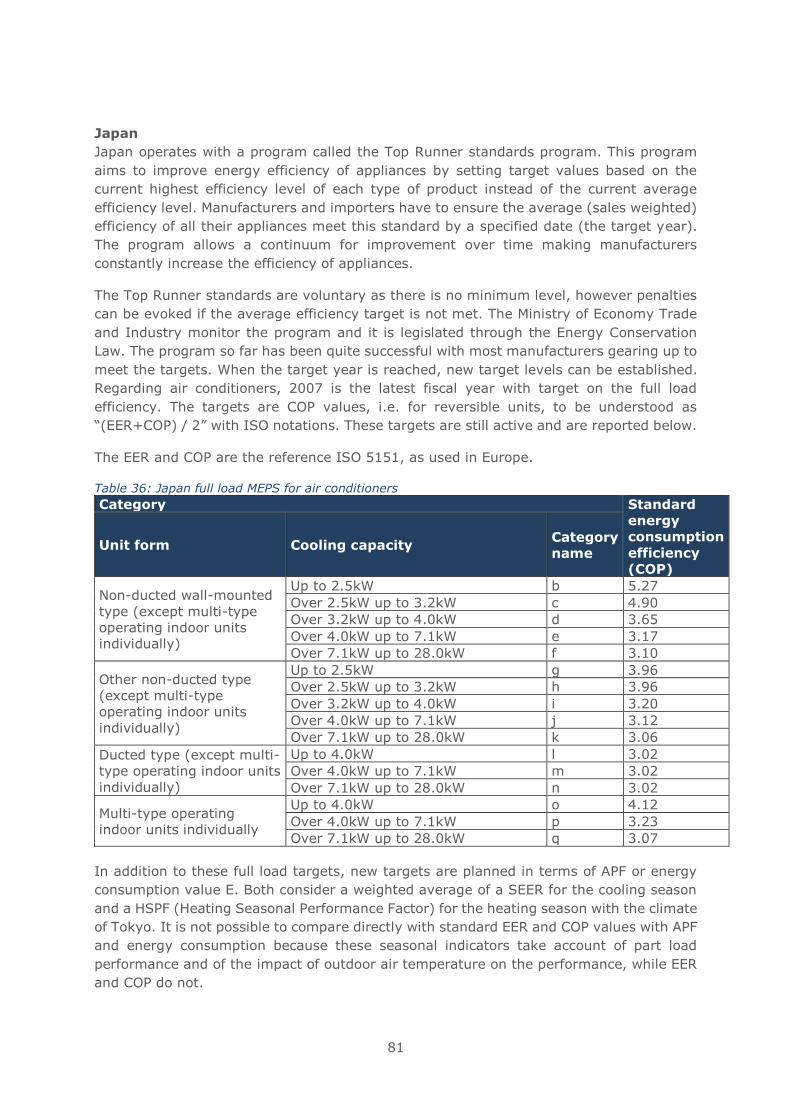
81
Japan
Japan operates with a program called the Top Runner standards program. This program
aims to improve energy efficiency of appliances by setting target values based on the
current highest efficiency level of each type of product instead of the current average
efficiency level. Manufacturers and importers have to ensure the average (sales weighted)
efficiency of all their appliances meet this standard by a specified date (the target year).
The program allows a continuum for improvement over time making manufacturers
constantly increase the efficiency of appliances.
The Top Runner standards are voluntary as there is no minimum level, however penalties
can be evoked if the average efficiency target is not met. The Ministry of Economy Trade
and Industry monitor the program and it is legislated through the Energy Conservation
Law. The program so far has been quite successful with most manufacturers gearing up to
meet the targets. When the target year is reached, new target levels can be established.
Regarding air conditioners, 2007 is the latest fiscal year with target on the full load
efficiency. The targets are COP values, i.e. for reversible units, to be understood as
“(EER+COP) / 2” with ISO notations. These targets are still active and are reported below.
The EER and COP are the reference ISO 5151, as used in Europe.
Table 36: Japan full load MEPS for air conditioners
Category Standard
energy
consumption
efficiency
(COP)
Unit form Cooling capacity Category
name
Non-ducted wall-mounted
type (except multi-type
operating indoor units
individually)
Up to 2.5kW b 5.27
Over 2.5kW up to 3.2kW c 4.90
Over 3.2kW up to 4.0kW d 3.65
Over 4.0kW up to 7.1kW e 3.17
Over 7.1kW up to 28.0kW f 3.10
Other non-ducted type
(except multi-type
operating indoor units
individually)
Up to 2.5kW g 3.96
Over 2.5kW up to 3.2kW h 3.96
Over 3.2kW up to 4.0kW i 3.20
Over 4.0kW up to 7.1kW j 3.12
Over 7.1kW up to 28.0kW k 3.06
Ducted type (except multi-
type operating indoor units
individually)
Up to 4.0kW l 3.02
Over 4.0kW up to 7.1kW m 3.02
Over 7.1kW up to 28.0kW n 3.02
Multi-type operating
indoor units individually
Up to 4.0kW o 4.12
Over 4.0kW up to 7.1kW p 3.23
Over 7.1kW up to 28.0kW q 3.07
In addition to these full load targets, new targets are planned in terms of APF or energy
consumption value E. Both consider a weighted average of a SEER for the cooling season
and a HSPF (Heating Seasonal Performance Factor) for the heating season with the climate
of Tokyo. It is not possible to compare directly with standard EER and COP values with APF
and energy consumption because these seasonal indicators take account of part load
performance and of the impact of outdoor air temperature on the performance, while EER
and COP do not.
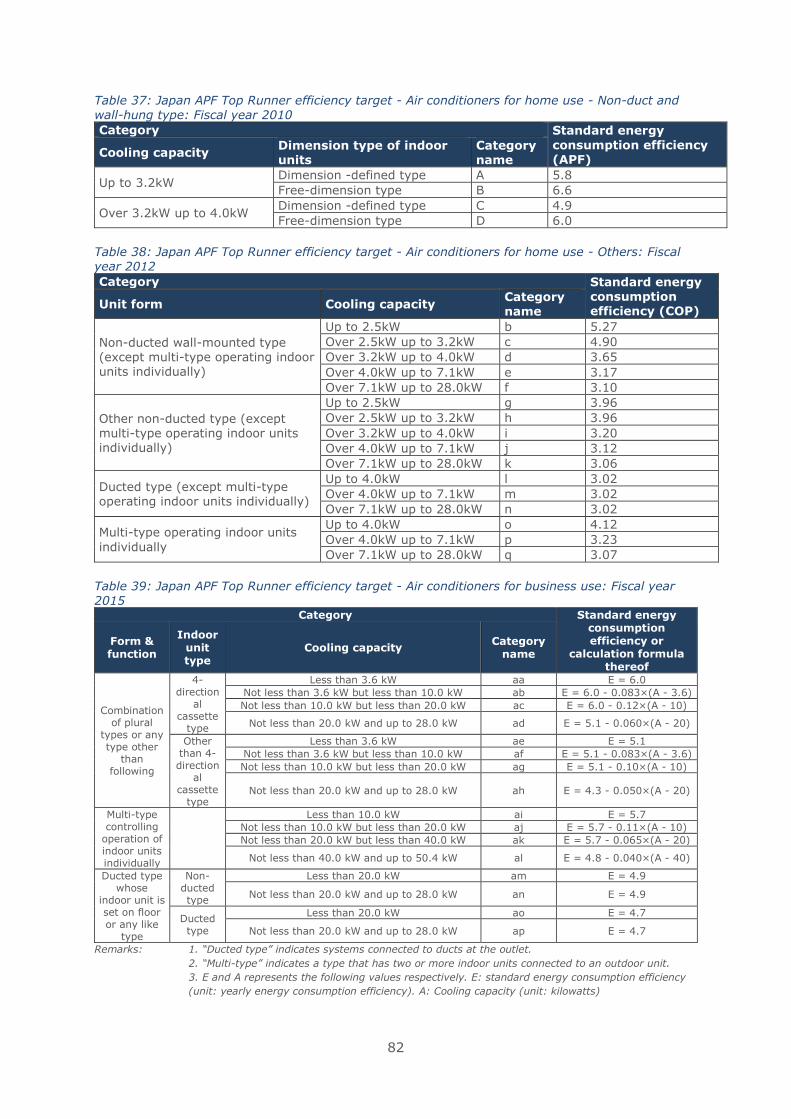
82
Table 37: Japan APF Top Runner efficiency target - Air conditioners for home use - Non-duct and
wall-hung type: Fiscal year 2010
Category Standard energy
consumption efficiency (APF)
Cooling capacity Dimension type of indoor units
Category name
Up to 3.2kW Dimension -defined type A 5.8
Free-dimension type B 6.6
Over 3.2kW up to 4.0kW Dimension -defined type C 4.9
Free-dimension type D 6.0
Table 38: Japan APF Top Runner efficiency target - Air conditioners for home use - Others: Fiscal year 2012
Category Standard energy consumption efficiency (COP)
Unit form Cooling capacity Category name
Non-ducted wall-mounted type (except multi-type operating indoor units individually)
Up to 2.5kW b 5.27
Over 2.5kW up to 3.2kW c 4.90
Over 3.2kW up to 4.0kW d 3.65
Over 4.0kW up to 7.1kW e 3.17
Over 7.1kW up to 28.0kW f 3.10
Other non-ducted type (except multi-type operating indoor units individually)
Up to 2.5kW g 3.96
Over 2.5kW up to 3.2kW h 3.96
Over 3.2kW up to 4.0kW i 3.20
Over 4.0kW up to 7.1kW j 3.12
Over 7.1kW up to 28.0kW k 3.06
Ducted type (except multi-type operating indoor units individually)
Up to 4.0kW l 3.02
Over 4.0kW up to 7.1kW m 3.02
Over 7.1kW up to 28.0kW n 3.02
Multi-type operating indoor units
individually
Up to 4.0kW o 4.12
Over 4.0kW up to 7.1kW p 3.23
Over 7.1kW up to 28.0kW q 3.07
Table 39: Japan APF Top Runner efficiency target - Air conditioners for business use: Fiscal year 2015
Category Standard energy consumption efficiency or
calculation formula thereof
Form & function
Indoor unit type
Cooling capacity Category
name
Combination of plural
types or any type other
than following
4-direction
al cassette
type
Less than 3.6 kW aa E = 6.0
Not less than 3.6 kW but less than 10.0 kW ab E = 6.0 - 0.083×(A - 3.6)
Not less than 10.0 kW but less than 20.0 kW ac E = 6.0 - 0.12×(A - 10)
Not less than 20.0 kW and up to 28.0 kW ad E = 5.1 - 0.060×(A - 20)
Other than 4-direction
al cassette
type
Less than 3.6 kW ae E = 5.1
Not less than 3.6 kW but less than 10.0 kW af E = 5.1 - 0.083×(A - 3.6)
Not less than 10.0 kW but less than 20.0 kW ag E = 5.1 - 0.10×(A - 10)
Not less than 20.0 kW and up to 28.0 kW ah E = 4.3 - 0.050×(A - 20)
Multi-type controlling
operation of indoor units individually
Less than 10.0 kW ai E = 5.7
Not less than 10.0 kW but less than 20.0 kW aj E = 5.7 - 0.11×(A - 10)
Not less than 20.0 kW but less than 40.0 kW ak E = 5.7 - 0.065×(A - 20)
Not less than 40.0 kW and up to 50.4 kW al E = 4.8 - 0.040×(A - 40)
Ducted type whose
indoor unit is set on floor or any like
type
Non-ducted type
Less than 20.0 kW am E = 4.9
Not less than 20.0 kW and up to 28.0 kW an E = 4.9
Ducted type
Less than 20.0 kW ao E = 4.7
Not less than 20.0 kW and up to 28.0 kW ap E = 4.7
Remarks: 1. “Ducted type” indicates systems connected to ducts at the outlet.
2. “Multi-type” indicates a type that has two or more indoor units connected to an outdoor unit.
3. E and A represents the following values respectively. E: standard energy consumption efficiency
(unit: yearly energy consumption efficiency). A: Cooling capacity (unit: kilowatts)
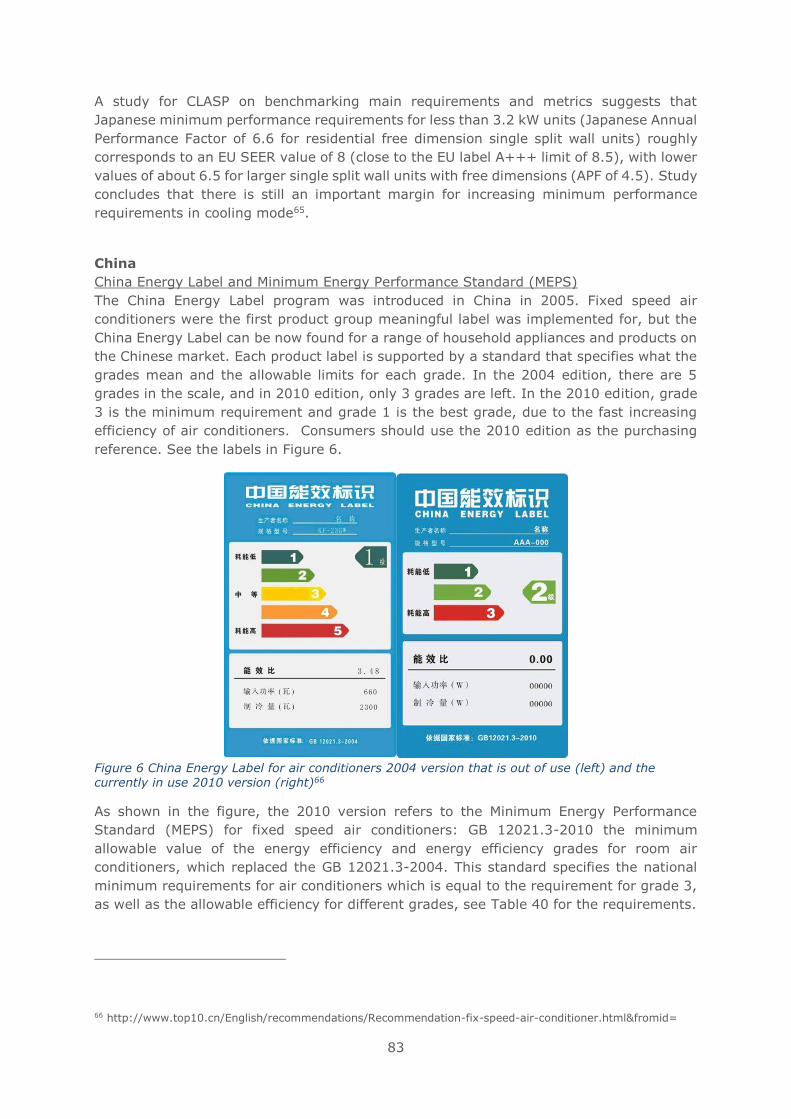
83
A study for CLASP on benchmarking main requirements and metrics suggests that
Japanese minimum performance requirements for less than 3.2 kW units (Japanese Annual
Performance Factor of 6.6 for residential free dimension single split wall units) roughly
corresponds to an EU SEER value of 8 (close to the EU label A+++ limit of 8.5), with lower
values of about 6.5 for larger single split wall units with free dimensions (APF of 4.5). Study
concludes that there is still an important margin for increasing minimum performance
requirements in cooling mode65.
China
China Energy Label and Minimum Energy Performance Standard (MEPS)
The China Energy Label program was introduced in China in 2005. Fixed speed air
conditioners were the first product group meaningful label was implemented for, but the
China Energy Label can be now found for a range of household appliances and products on
the Chinese market. Each product label is supported by a standard that specifies what the
grades mean and the allowable limits for each grade. In the 2004 edition, there are 5
grades in the scale, and in 2010 edition, only 3 grades are left. In the 2010 edition, grade
3 is the minimum requirement and grade 1 is the best grade, due to the fast increasing
efficiency of air conditioners. Consumers should use the 2010 edition as the purchasing
reference. See the labels in Figure 6.
Figure 6 China Energy Label for air conditioners 2004 version that is out of use (left) and the currently in use 2010 version (right)66
As shown in the figure, the 2010 version refers to the Minimum Energy Performance
Standard (MEPS) for fixed speed air conditioners: GB 12021.3-2010 the minimum
allowable value of the energy efficiency and energy efficiency grades for room air
conditioners, which replaced the GB 12021.3-2004. This standard specifies the national
minimum requirements for air conditioners which is equal to the requirement for grade 3,
as well as the allowable efficiency for different grades, see Table 40 for the requirements.
66 http://www.top10.cn/English/recommendations/Recommendation-fix-speed-air-conditioner.html&fromid=
84
Table 40 Minimum requirement and energy label allowable limits67
Type Cooling
capacity
Energy Efficiency Ratio (EER) W/W
Grade 1 Grade 2 Grade 3
Window/through-
the-wall
3.30 3.10 2.90
Split ≤ 4500W 3.60 3.40 3.20
> 4500 W and
≤ 7100 W
3.50 3.30 3.10
> 7100 W and
≤ 14000 W
3.40 3.20 3.00
The MEPS for variable speed (VS) air conditioners GB 21455 was implemented in 2008.
New version has been released in 2013. See the label in Figure 7.
Figure 7 China Energy Label for variable speed air conditioners according to MEPS GB 21455 -201368
In the standard GB 21455 -2013, requirements for Annual Performance Factor (APF) was
defined (see Table 41), this is the parameter to measure energy efficiency of VS air
conditioners with heating pump, whereas the seasonal energy efficiency ratio (SEER), as
originally defined in GB 21455 -2008, is the parameter to measure energy efficiency of VS
air conditioners without heating function. See the changes to SEER requirements in Table
42.
Table 41 APF requirement and energy label allowable limits for variable speed air conditioners according to MEPS GB 21455 -2013
Rated cooling capacity Annual Performance Factor (APF) Wh/Wh
Grade 1 Grade 2 Grade 3
≤ 4500W 4.5 4.0 3.5
> 4500 W and ≤ 7100 W 4.0 3.5 3.3
> 7100 W and ≤ 14000 W 3.7 3.3 3.1
67 GB 12021.3-2010 the minimum allowable value of the energy efficiency and energy efficiency grades for room air conditioners 68 http://www.topten.eu/uploads/File/EEDAL15_Luting_Huang_MEPS_China.pdf
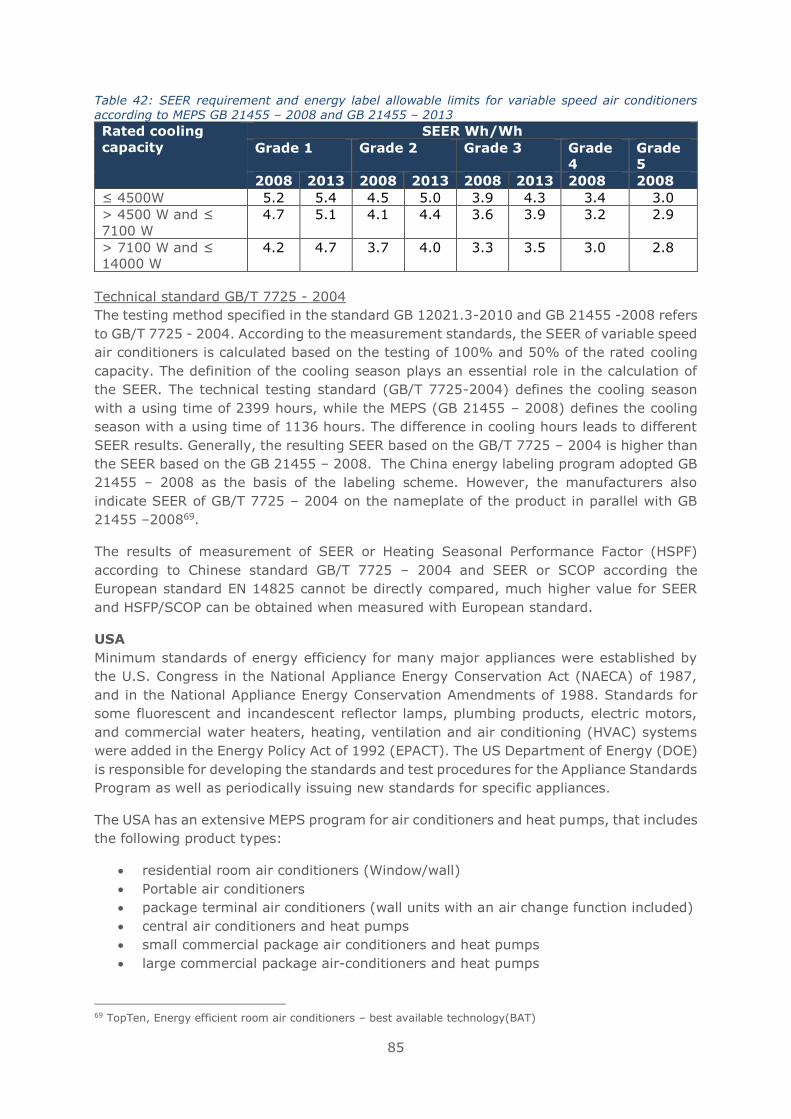
85
Table 42: SEER requirement and energy label allowable limits for variable speed air conditioners
according to MEPS GB 21455 – 2008 and GB 21455 – 2013
Rated cooling
capacity
SEER Wh/Wh
Grade 1 Grade 2 Grade 3 Grade
4
Grade
5
2008 2013 2008 2013 2008 2013 2008 2008
≤ 4500W 5.2 5.4 4.5 5.0 3.9 4.3 3.4 3.0
> 4500 W and ≤
7100 W
4.7 5.1 4.1 4.4 3.6 3.9 3.2 2.9
> 7100 W and ≤
14000 W
4.2 4.7 3.7 4.0 3.3 3.5 3.0 2.8
Technical standard GB/T 7725 - 2004
The testing method specified in the standard GB 12021.3-2010 and GB 21455 -2008 refers
to GB/T 7725 - 2004. According to the measurement standards, the SEER of variable speed
air conditioners is calculated based on the testing of 100% and 50% of the rated cooling
capacity. The definition of the cooling season plays an essential role in the calculation of
the SEER. The technical testing standard (GB/T 7725-2004) defines the cooling season
with a using time of 2399 hours, while the MEPS (GB 21455 – 2008) defines the cooling
season with a using time of 1136 hours. The difference in cooling hours leads to different
SEER results. Generally, the resulting SEER based on the GB/T 7725 – 2004 is higher than
the SEER based on the GB 21455 – 2008. The China energy labeling program adopted GB
21455 – 2008 as the basis of the labeling scheme. However, the manufacturers also
indicate SEER of GB/T 7725 – 2004 on the nameplate of the product in parallel with GB
21455 –200869.
The results of measurement of SEER or Heating Seasonal Performance Factor (HSPF)
according to Chinese standard GB/T 7725 – 2004 and SEER or SCOP according the
European standard EN 14825 cannot be directly compared, much higher value for SEER
and HSFP/SCOP can be obtained when measured with European standard.
USA
Minimum standards of energy efficiency for many major appliances were established by
the U.S. Congress in the National Appliance Energy Conservation Act (NAECA) of 1987,
and in the National Appliance Energy Conservation Amendments of 1988. Standards for
some fluorescent and incandescent reflector lamps, plumbing products, electric motors,
and commercial water heaters, heating, ventilation and air conditioning (HVAC) systems
were added in the Energy Policy Act of 1992 (EPACT). The US Department of Energy (DOE)
is responsible for developing the standards and test procedures for the Appliance Standards
Program as well as periodically issuing new standards for specific appliances.
The USA has an extensive MEPS program for air conditioners and heat pumps, that includes
the following product types:
• residential room air conditioners (Window/wall)
• Portable air conditioners
• package terminal air conditioners (wall units with an air change function included)
• central air conditioners and heat pumps
• small commercial package air conditioners and heat pumps
• large commercial package air-conditioners and heat pumps
69 TopTen, Energy efficient room air conditioners – best available technology(BAT)
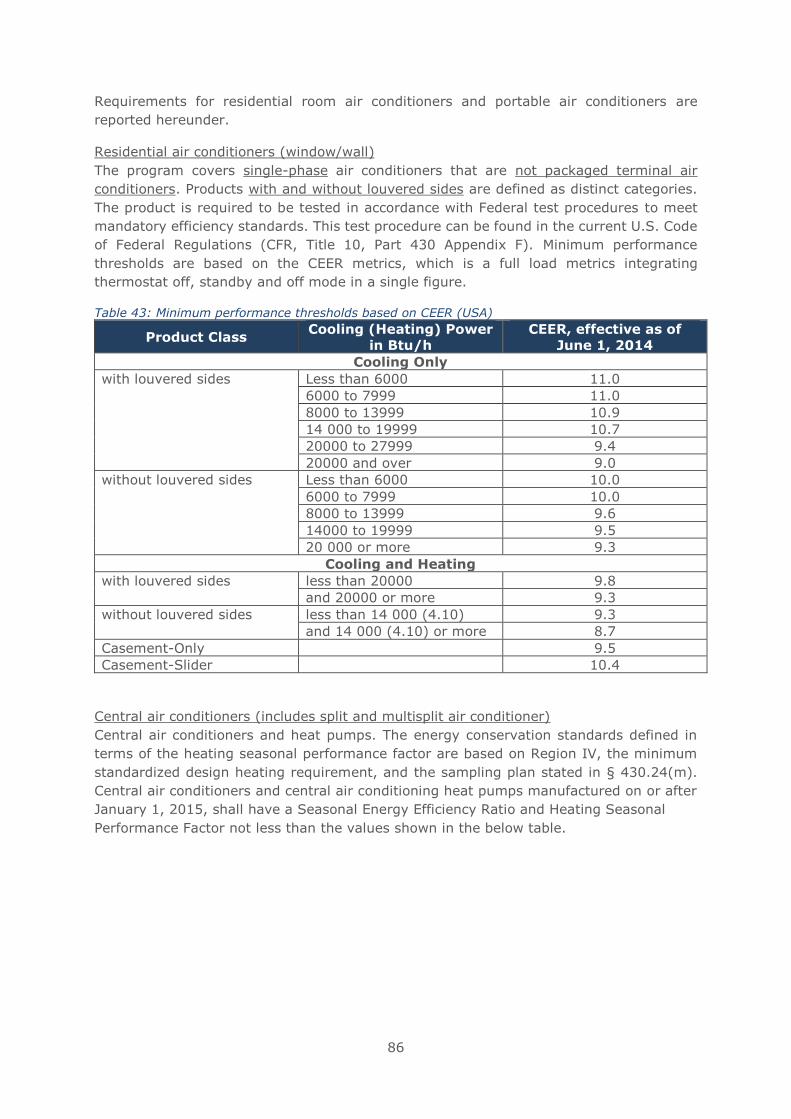
86
Requirements for residential room air conditioners and portable air conditioners are
reported hereunder.
Residential air conditioners (window/wall)
The program covers single-phase air conditioners that are not packaged terminal air
conditioners. Products with and without louvered sides are defined as distinct categories.
The product is required to be tested in accordance with Federal test procedures to meet
mandatory efficiency standards. This test procedure can be found in the current U.S. Code
of Federal Regulations (CFR, Title 10, Part 430 Appendix F). Minimum performance
thresholds are based on the CEER metrics, which is a full load metrics integrating
thermostat off, standby and off mode in a single figure.
Table 43: Minimum performance thresholds based on CEER (USA)
Product Class Cooling (Heating) Power
in Btu/h
CEER, effective as of
June 1, 2014
Cooling Only
with louvered sides Less than 6000 11.0
6000 to 7999 11.0
8000 to 13999 10.9
14 000 to 19999 10.7
20000 to 27999 9.4
20000 and over 9.0
without louvered sides Less than 6000 10.0
6000 to 7999 10.0
8000 to 13999 9.6
14000 to 19999 9.5
20 000 or more 9.3
Cooling and Heating
with louvered sides less than 20000 9.8
and 20000 or more 9.3
without louvered sides less than 14 000 (4.10) 9.3
and 14 000 (4.10) or more 8.7
Casement-Only 9.5
Casement-Slider 10.4
Central air conditioners (includes split and multisplit air conditioner)
Central air conditioners and heat pumps. The energy conservation standards defined in
terms of the heating seasonal performance factor are based on Region IV, the minimum
standardized design heating requirement, and the sampling plan stated in § 430.24(m).
Central air conditioners and central air conditioning heat pumps manufactured on or after
January 1, 2015, shall have a Seasonal Energy Efficiency Ratio and Heating Seasonal
Performance Factor not less than the values shown in the below table.
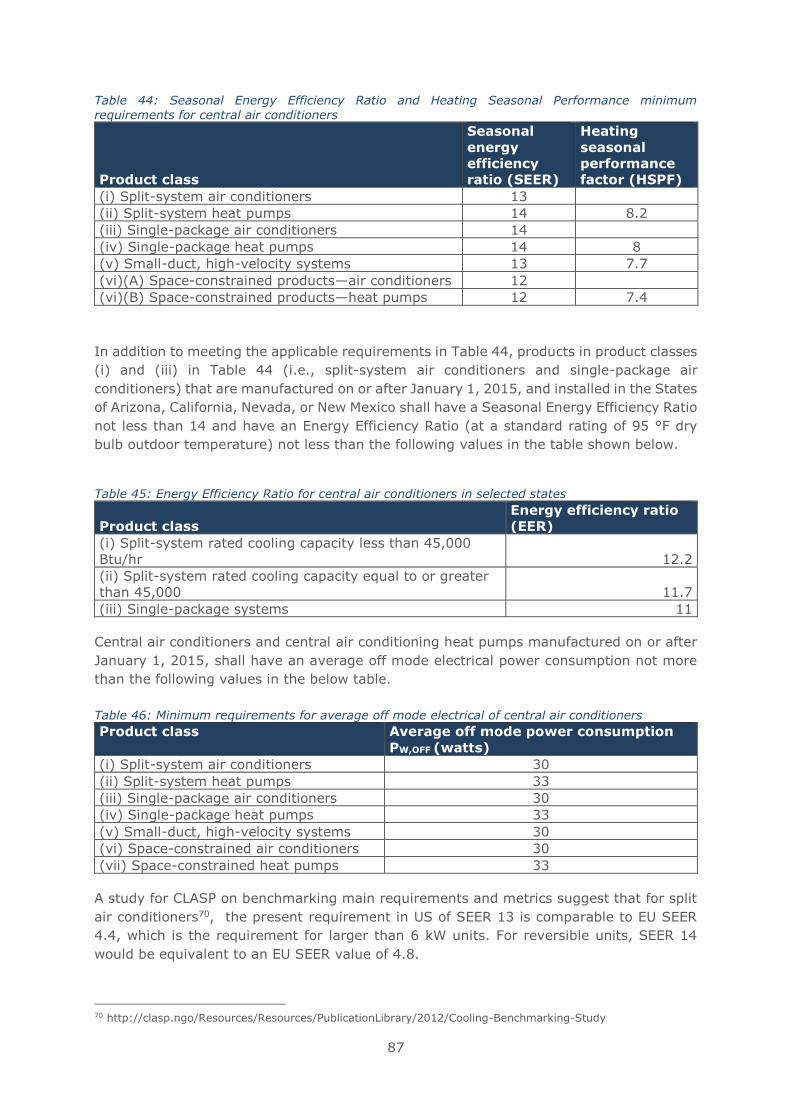
87
Table 44: Seasonal Energy Efficiency Ratio and Heating Seasonal Performance minimum
requirements for central air conditioners
Product class
Seasonal
energy
efficiency
ratio (SEER)
Heating
seasonal
performance
factor (HSPF)
(i) Split-system air conditioners 13 (ii) Split-system heat pumps 14 8.2
(iii) Single-package air conditioners 14 (iv) Single-package heat pumps 14 8
(v) Small-duct, high-velocity systems 13 7.7
(vi)(A) Space-constrained products—air conditioners 12 (vi)(B) Space-constrained products—heat pumps 12 7.4
In addition to meeting the applicable requirements in Table 44, products in product classes
(i) and (iii) in Table 44 (i.e., split-system air conditioners and single-package air
conditioners) that are manufactured on or after January 1, 2015, and installed in the States
of Arizona, California, Nevada, or New Mexico shall have a Seasonal Energy Efficiency Ratio
not less than 14 and have an Energy Efficiency Ratio (at a standard rating of 95 °F dry
bulb outdoor temperature) not less than the following values in the table shown below.
Table 45: Energy Efficiency Ratio for central air conditioners in selected states
Product class
Energy efficiency ratio
(EER)
(i) Split-system rated cooling capacity less than 45,000
Btu/hr 12.2
(ii) Split-system rated cooling capacity equal to or greater
than 45,000 11.7
(iii) Single-package systems 11
Central air conditioners and central air conditioning heat pumps manufactured on or after
January 1, 2015, shall have an average off mode electrical power consumption not more
than the following values in the below table.
Table 46: Minimum requirements for average off mode electrical of central air conditioners
Product class Average off mode power consumption
PW,OFF (watts)
(i) Split-system air conditioners 30
(ii) Split-system heat pumps 33
(iii) Single-package air conditioners 30
(iv) Single-package heat pumps 33
(v) Small-duct, high-velocity systems 30
(vi) Space-constrained air conditioners 30
(vii) Space-constrained heat pumps 33
A study for CLASP on benchmarking main requirements and metrics suggest that for split
air conditioners70, the present requirement in US of SEER 13 is comparable to EU SEER
4.4, which is the requirement for larger than 6 kW units. For reversible units, SEER 14
would be equivalent to an EU SEER value of 4.8.
70 http://clasp.ngo/Resources/Resources/PublicationLibrary/2012/Cooling-Benchmarking-Study
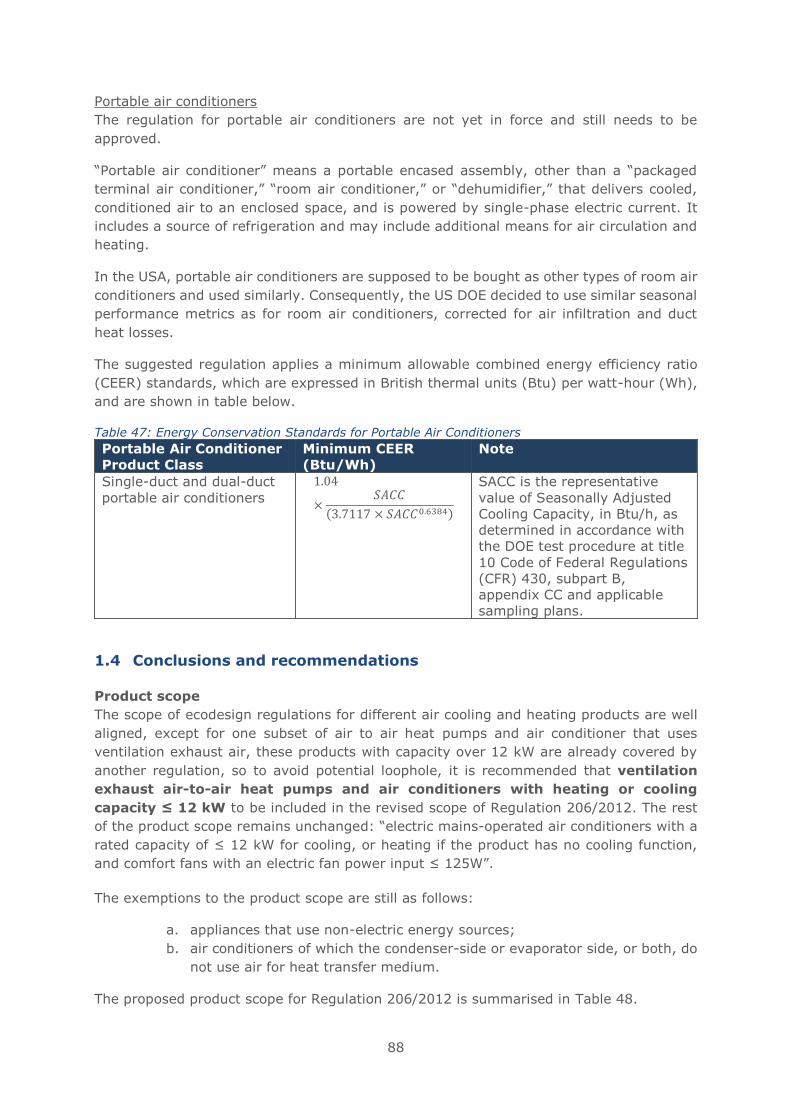
88
Portable air conditioners
The regulation for portable air conditioners are not yet in force and still needs to be
approved.
“Portable air conditioner” means a portable encased assembly, other than a “packaged
terminal air conditioner,” “room air conditioner,” or “dehumidifier,” that delivers cooled,
conditioned air to an enclosed space, and is powered by single-phase electric current. It
includes a source of refrigeration and may include additional means for air circulation and
heating.
In the USA, portable air conditioners are supposed to be bought as other types of room air
conditioners and used similarly. Consequently, the US DOE decided to use similar seasonal
performance metrics as for room air conditioners, corrected for air infiltration and duct
heat losses.
The suggested regulation applies a minimum allowable combined energy efficiency ratio
(CEER) standards, which are expressed in British thermal units (Btu) per watt-hour (Wh),
and are shown in table below.
Table 47: Energy Conservation Standards for Portable Air Conditioners
Portable Air Conditioner
Product Class
Minimum CEER
(Btu/Wh)
Note
Single-duct and dual-duct
portable air conditioners
1.04
×𝑆𝐴𝐶𝐶
(3.7117 × 𝑆𝐴𝐶𝐶0.6384)
SACC is the representative
value of Seasonally Adjusted
Cooling Capacity, in Btu/h, as
determined in accordance with
the DOE test procedure at title
10 Code of Federal Regulations
(CFR) 430, subpart B,
appendix CC and applicable
sampling plans.
1.4 Conclusions and recommendations
Product scope
The scope of ecodesign regulations for different air cooling and heating products are well
aligned, except for one subset of air to air heat pumps and air conditioner that uses
ventilation exhaust air, these products with capacity over 12 kW are already covered by
another regulation, so to avoid potential loophole, it is recommended that ventilation
exhaust air-to-air heat pumps and air conditioners with heating or cooling
capacity ≤ 12 kW to be included in the revised scope of Regulation 206/2012. The rest
of the product scope remains unchanged: “electric mains-operated air conditioners with a
rated capacity of ≤ 12 kW for cooling, or heating if the product has no cooling function,
and comfort fans with an electric fan power input ≤ 125W”.
The exemptions to the product scope are still as follows:
a. appliances that use non-electric energy sources;
b. air conditioners of which the condenser-side or evaporator side, or both, do
not use air for heat transfer medium.
The proposed product scope for Regulation 206/2012 is summarised in Table 48.
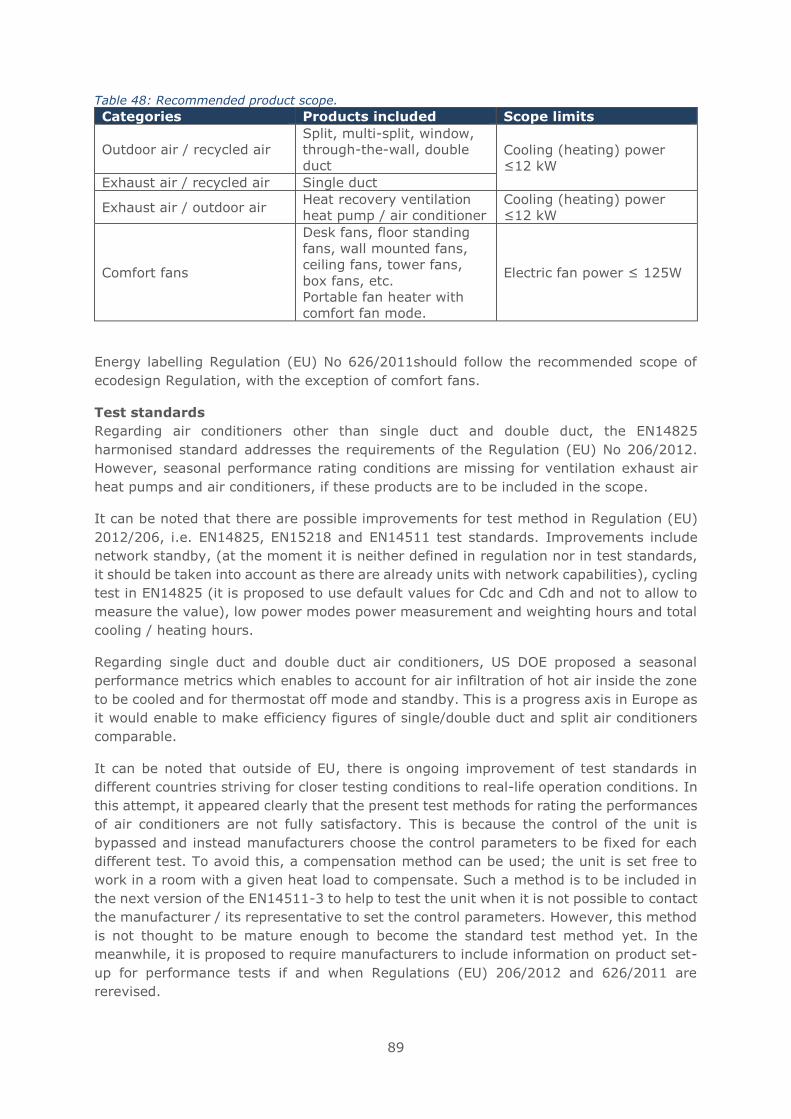
89
Table 48: Recommended product scope.
Categories Products included Scope limits
Outdoor air / recycled air
Split, multi-split, window,
through-the-wall, double
duct Cooling (heating) power
≤12 kW
Exhaust air / recycled air Single duct
Exhaust air / outdoor air Heat recovery ventilation
heat pump / air conditioner
Cooling (heating) power
≤12 kW
Comfort fans
Desk fans, floor standing
fans, wall mounted fans,
ceiling fans, tower fans,
box fans, etc.
Portable fan heater with
comfort fan mode.
Electric fan power ≤ 125W
Energy labelling Regulation (EU) No 626/2011should follow the recommended scope of
ecodesign Regulation, with the exception of comfort fans.
Test standards
Regarding air conditioners other than single duct and double duct, the EN14825
harmonised standard addresses the requirements of the Regulation (EU) No 206/2012.
However, seasonal performance rating conditions are missing for ventilation exhaust air
heat pumps and air conditioners, if these products are to be included in the scope.
It can be noted that there are possible improvements for test method in Regulation (EU)
2012/206, i.e. EN14825, EN15218 and EN14511 test standards. Improvements include
network standby, (at the moment it is neither defined in regulation nor in test standards,
it should be taken into account as there are already units with network capabilities), cycling
test in EN14825 (it is proposed to use default values for Cdc and Cdh and not to allow to
measure the value), low power modes power measurement and weighting hours and total
cooling / heating hours.
Regarding single duct and double duct air conditioners, US DOE proposed a seasonal
performance metrics which enables to account for air infiltration of hot air inside the zone
to be cooled and for thermostat off mode and standby. This is a progress axis in Europe as
it would enable to make efficiency figures of single/double duct and split air conditioners
comparable.
It can be noted that outside of EU, there is ongoing improvement of test standards in
different countries striving for closer testing conditions to real-life operation conditions. In
this attempt, it appeared clearly that the present test methods for rating the performances
of air conditioners are not fully satisfactory. This is because the control of the unit is
bypassed and instead manufacturers choose the control parameters to be fixed for each
different test. To avoid this, a compensation method can be used; the unit is set free to
work in a room with a given heat load to compensate. Such a method is to be included in
the next version of the EN14511-3 to help to test the unit when it is not possible to contact
the manufacturer / its representative to set the control parameters. However, this method
is not thought to be mature enough to become the standard test method yet. In the
meanwhile, it is proposed to require manufacturers to include information on product set-
up for performance tests if and when Regulations (EU) 206/2012 and 626/2011 are
rerevised.
90
Legislations
The new F-gas regulation introduced a quota system that will cut the use of
hydrofluorocarbons by more than 2/3 by 2025 for products with a viable alternative to
hydrofluorocarbons. Though, the challenge remains in finding these alternatives for air
conditioners which not are widely available today. Besides the quota system, prohibition
on the use of refrigerants with a high GWP is introduced. For split air conditioners,
refrigerants with a GWP higher than 750 is prohibited to use by 2025. As a result of the F-
gas regulation, the industry will be required to reduce the impact of high GWP refrigerants
and the need for a bonus system for air conditioners using low GWP refrigerant in the
revised ecodesign regulation is reduced.
Third country legislations show that there is a trend for increasing the stringency of
requirements for air conditioner efficiency, although it is often not directly comparable with
the EU requirement due to the differences in testing method. A study from CLASP on
benchmarking main requirements suggests that there is still an important margin for
increasing minimum performance requirements in cooling mode71 in the EU. Both the US
and Japan have more ambitious requirements today than the EU.
Regarding policies for portable air conditioners, there are different approaches worldwide.
In 2009, a study for national authorities of Australia and New Zealand suggested it could
be counterproductive to label the energy performance of single duct air conditioners and
that it could be of higher value to inform the customer on the problem linked to the outdoor
air infiltration instead. Meanwhile in Europe, there is a A+++ - G energy label for portable
air conditioners similar to the one for fixed air conditioners, with an indication of single
duct products being "local air conditioner" in the product fiche and other marketing
documentation, however this indication is rather "weak" because the difference of local air
conditioner is rarely ever understood by the consumers as intended. Therefore, it should
be considered that single duct and double duct products and other air conditioners could
be rated on the same efficiency scale on the energy labels to enable comparison by the
consumers.
As mentioned, a seasonal performance standard was developed by US DOE in 2016 for
portable air conditioners based on existing metrics and including the impact of infiltration
air so that portable cooling performance metrics may be comparable to the metrics of
other room air conditioners in the USA. Currently in the EU, air infiltration is not
measured by the standard, nor is the problem disseminated to the consumers. Since air
infiltration is not included, it is not clear that a product with a better EER leads to a
better field performance; false expectation would be given to the consumers, as an
increased EER may mean an increased condenser air flow and hence more infiltration.
Therefore, it is worth considering the infiltration issue for single duct in the current
review. The US DOE experience has further shown that air infiltration was also an issue
for double duct air conditioners; if it is worth considering the air infiltration issue for
double duct air conditioners too in the current review, it should be reminded that the
impact of infiltration is already accounted for in Europe for these products thanks to the
use of the calorimeter room test method.
71 Heating mode metrics were not compared in the frame of the study.

1
Review of Regulation 206/2012 and
626/2011
Air conditioners and comfort fans
Task 2 report
Final version
Date: May 2018

2
Prepared by:
Viegand Maagøe and ARMINES
Study team: Baijia Huang, Jan Viegand, Peter Martin Skov Hansen, Philippe Riviere,
Florian Dittmann
Quality manager: Jan Viegand
Website design and management: Viegand Maagøe A/S
Contract manager: Viegand Maagøe A/S
Prepared for:
European Commission
DG ENER C.3
Office: DM24 04/048
B-1049 Brussels, Belgium
Contact person: Veerle Beelaerts
E-mail: [email protected]
Project website: www.eco-airconditioners.eu
Specific contract no.: No. ENER/C3/FV 2016-537/03/FWC 2015-619
LOT2/01/SI2.749247
Implements Framework Contract: № ENER/C3/2015-619 LOT 2
This study was ordered and paid for by the European Commission, Directorate-General
for Energy.
As agreed with Policy Officer Veerle Beelaerts, some of the budget for data purchase was
reallocated for project work.
The information and views set out in this study are those of the author(s) and do not
necessarily reflect the official opinion of the Commission. The Commission does not
guarantee the accuracy of the data included in this study. Neither the Commission nor any
person acting on the Commission’s behalf may be held responsible for the use which may
be made of the information contained therein.
This report has been prepared by the authors to the best of their ability and knowledge.
The authors do not assume liability for any damage, material or immaterial, that may arise
from the use of the report or the information contained therein.
© European Union, May 2018.
Reproduction is authorised provided the source is acknowledged.
More information on the European Union is available on the internet (http://europa.eu).
Viegand Maagøe A/S
Nr. Farimagsgade 37
1364 Copenhagen K
Denmark
viegandmaagoe.dk
3
Table of contents List of tables ......................................................................................................... 4
List of figures ........................................................................................................ 5
Abbreviations ........................................................................................................ 7
Introduction to the task reports ............................................................................... 8
2 Task 2...........................................................................................................10
2.1 Generic Economic data ...............................................................................10
2.2 Market and Stock data ...............................................................................14
2.2.1 Present market ....................................................................................14
2.2.2 Model for estimating sales and stock ......................................................21
2.2.3 Estimated sales and stock .....................................................................27
2.3 Market trends ...........................................................................................29
2.3.1 General market trends ..........................................................................29
2.3.2 Market channels and production structure ...............................................33
2.3.3 Trends in product design and features ....................................................35
2.4 Consumer expenditure base data ................................................................39
2.4.1 Average EU consumer prices .................................................................39
2.4.2 Installations costs ................................................................................45
2.4.3 Repair and maintenance costs ...............................................................46
2.4.4 Disposal costs .....................................................................................46
2.4.5 Interest, inflation and discount rates ......................................................46
2.4.6 Electricity prices ..................................................................................46
2.5 Conclusions and recommendations ..............................................................48
Annex 1: Test conditions for SEER and SCOP determination of exhaust air-to-outdoor
air heat pumps and air conditioners .....................................................................50
Annex 2: Estimating 2015 stock for countries with insufficient sales data .................51
Annex 3: Cities by country to compute national average CDD from CNRM model .......57
Annex 4: CDD evolution and GNI per capita ..........................................................59
Annex 5: Changes in split air conditioner efficiency in Europe from 2006 to 2016 ......61
Annex 6: Electricity prices ..................................................................................62
4
List of tables Table 1: Prodcom categories covering products relevant for this study. .......................10
Table 2: Example of available data on PRODCOM for air conditioners ..........................11
Table 3: Distribution of split systems by type of indoor unit, BSRIA source ..................18
Table 4: Distribution of indoor units of split and multisplit systems by type of indoor unit,
BSRIA source .......................................................................................................18
Table 5: Compound annual sales growth rates of standard rated cooling capacity by
country for 16 EU countries, 1992-2015, sum of all product types and sectors .............23
Table 6: Comparison of CDD, saturation level in residential and service sectors,
penetration level in residential and service sectors in 2015 and 2030 ..........................27
Table 7: EU sales estimate and prevision of less than 12 kW units (in thousands), from
year 2010 to 2050 ................................................................................................28
Table 8: EU stock estimate and prevision of less than 12 kW units (in millions), from year
2011 to 2050 .......................................................................................................29
Table 9: Distribution of refrigerants in air conditioners sold, source GfK ......................36
Table 10: Estimated manufacturer selling price and final product price of portable air
conditioners, based on data from BSRIA and GfK ......................................................40
Table 11: Estimated manufacturer selling price of fix (split and multi-split) air
conditioners, based on data from BSRIA and GfK ......................................................41
Table 12: Estimated manufacturer selling price by product type, adapted from GfK and
BSRIA source .......................................................................................................42
Table 13: Example of mark-up multipliers depending on distribution routes for central air
conditioners, source US DOE ..................................................................................42
Table 14: Example of mark-up multipliers depending on distribution routes for portable
air conditioners, source US DOE .............................................................................43
Table 15: Average product price .............................................................................44
Table 16. Generic interest and inflation rates in the EU-28. ........................................46
Table 17. Household and industry electricity costs and annual increase from 2014 S1 to
2015 S1 (first half of the year). ..............................................................................47
Table 18: Real rates electricity prices from 1990 to 2030. Based on the Ecodesign impact
accounting ...........................................................................................................47
Table 19: Electricity priced suggested by the commission. .........................................48
Table 20: Conditions for determining EERA,B,C,D values in SEER calculation ...................50
Table 21: Conditions for determining COPA,B,C,D,E,F,G values in SCOP calculation .............50
Table 22: Average power of units installed per product type ......................................51
Table 23: Average lifetime of units per product type .................................................51
Table 24: Share of sales in the residential sector by country (years 2011-2015) ..........53
Table 25: Estimated penetration of cooled area by sector in 28 EU countries ...............54
Table 26: Share of the residential stock by product type and country ..........................55
Table 27: Share of the service sector stock by product type and country .....................56
Table 28: Cities by country to compute national average CDD from CNRM model .........57
Table 29:Eurovent Certita Certification split air conditioners below 12 kW certified
products, EER evolution 2006/2016 ........................................................................61
Table 30:Eurovent Certita Certification split air conditioners below 12 kW certified
products, COP evolution 2006/2016 ........................................................................61
5
List of figures Figure 1: Total production of air conditioners (PRODCOM code 28.25.12.20 and
28.25.12.50). PRODCOM assessed April 2017. .........................................................12
Figure 2: Total production, import and export quantity of comfort fans below 125 W
2009-2015. PRODCOM assessed April 2017. ............................................................13
Figure 3: Total EU sales and trading of comfort fans below 125 W 2009-2015. PRODCOM
assessed April 2017. .............................................................................................13
Figure 4: Total EU sales in units, 2005 data - EuP Lot 10 preparatory study (2008), other
split data - BSRIA source adapted, other portable data - BSRIA and GfK source adapted.
..........................................................................................................................15
Figure 5: Portable and Split air conditioners repartition by country of EU28 sales in 2007
and in 2015, sources BSRIA and GfK adapted. .........................................................16
Figure 6: Portable sales distribution by size, sources BSRIA and GfK adapted. .............17
Figure 7: Split sales distribution by size, source BSRIA. .............................................17
Figure 8: Repartition of portable and fixed split sales by sector of use, source BSRIA. ...19
Figure 9: Repartition of portable and split sales by application, source BSRIA. .............20
Figure 10: Portable air conditioners share by type and reversibility in Europe in years
2002-2005, source EuP Lot 10 study. ......................................................................21
Figure 11: Air conditioning sales in the residential sector in Spain (in GW of rated cooling
capacity); past sales - in blue (before crisis) and in red (post crisis); sales projection - in
green ; sales growth 2015-2025 in black dash line. ..................................................23
Figure 12: Saturation models and US penetration data (source EIA) of air conditioning in
the residential (left) and service sector (right), ........................................................25
Figure 13: CDD evolution following climate change impact according to CNRM model,
scenario RCP4.5, and country model according this report .........................................26
Figure 14: GNI per capita in US$(2015), source World Bank, and linear projections to
2030 ...................................................................................................................26
Figure 15: Sales estimates for EU28 countries of portable + split air conditioners, 2010-
2050 ...................................................................................................................28
Figure 16: Eurovent Certita Certification split air conditioners below 12 kW certified
products, EER evolution 2006/2016 ........................................................................30
Figure 17: Eurovent Certita Certification split air conditioners below 12 kW certified
products, COP evolution 2006/2016 ........................................................................30
Figure 18: Air conditioners average sales 2015/2016 - efficiency heating ....................31
Figure 19: Air conditioners average sales 2015/2016 - efficiency cooling .....................31
Figure 20: Correlation between Pdesignc and SEER (Air cooled Split Reverse cycle),
source ECC ..........................................................................................................32
Figure 21: ECC directory 2016, EER Vs SEER ...........................................................33
Figure 22: ECC directory 2016, COP Vs SCOP ...........................................................33
Figure 23: Distribution route for new construction, source US DOE .............................34
Figure 24: Distribution routes for portable and split air conditioners, source BSRIA .......34
Figure 25: ECC directory 2006 and 2016, air conditioners below 12 kW, sound power
level of outdoor unit in cooling mode.......................................................................37
Figure 26: ECC directory 2006 and 2016, air conditioners below 12 kW, sound power
level of indoor unit in cooling mode.........................................................................38
Figure 27: Share of air conditioners sold with network functions .................................39
Figure 28: Price premium for some of the split air conditioners ..................................45
Figure 29: Share of residential users for portable air conditioners and fixed air
conditioners .........................................................................................................48
6
Figure 30: Cooled area penetration in % of total floor area by sector in 16 EU countries
(black circles) and correlations (red circles) for other 12 EU countries; left - residential
(Penres - Residential penetration); right - services (Penser - Services penetration). .....54
Figure 31: CDD evolution following climate change impact according to CNRM model,
scenario RCP4.5, and country model according this report .........................................59
Figure 32: GNI per capita in US$(2015), source World Bank, and linear projections to
2030 ...................................................................................................................60
Figure 33: Development of electricity prices from first half of 2008 to first half of 2016
(based on EUROSTAT) ...........................................................................................62
Figure 34:Development of electricity prices from 1990 to 2050 (based on Ecodesign
impact accounting) ...............................................................................................62
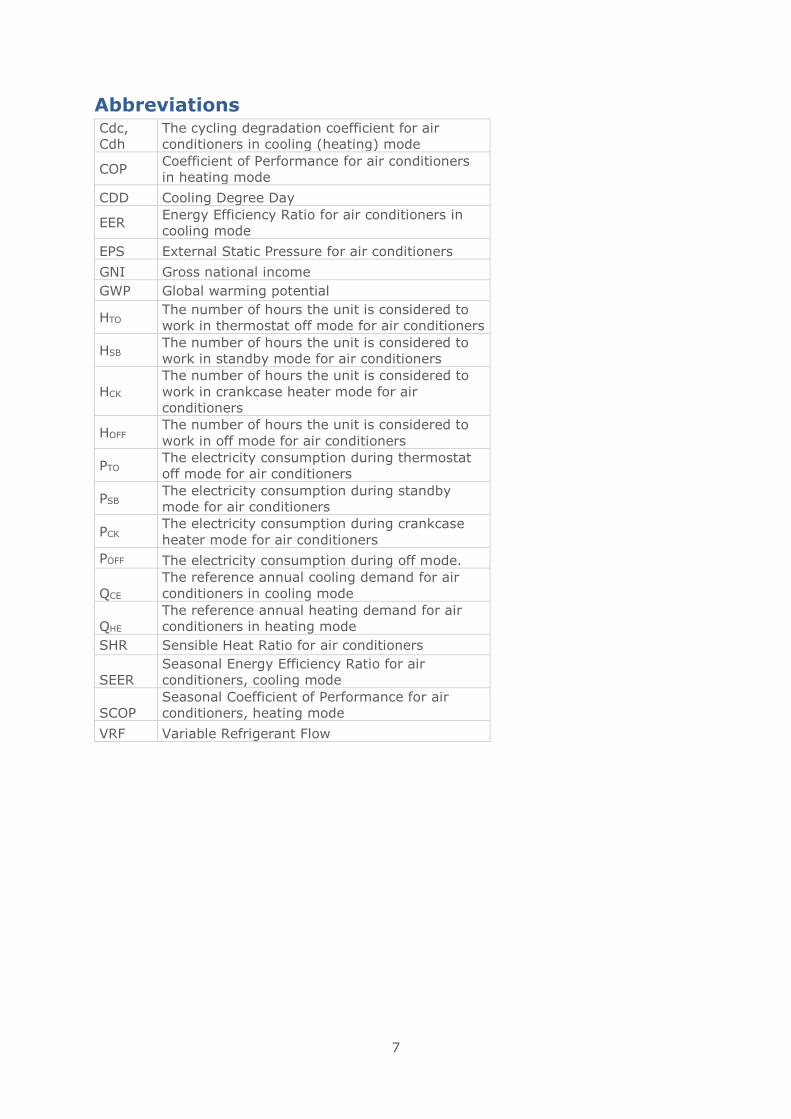
7
Abbreviations Cdc,
Cdh
The cycling degradation coefficient for air
conditioners in cooling (heating) mode
COP Coefficient of Performance for air conditioners
in heating mode
CDD Cooling Degree Day
EER Energy Efficiency Ratio for air conditioners in
cooling mode
EPS External Static Pressure for air conditioners
GNI Gross national income
GWP Global warming potential
HTO The number of hours the unit is considered to
work in thermostat off mode for air conditioners
HSB The number of hours the unit is considered to
work in standby mode for air conditioners
HCK
The number of hours the unit is considered to
work in crankcase heater mode for air
conditioners
HOFF The number of hours the unit is considered to
work in off mode for air conditioners
PTO The electricity consumption during thermostat
off mode for air conditioners
PSB The electricity consumption during standby
mode for air conditioners
PCK The electricity consumption during crankcase
heater mode for air conditioners
POFF The electricity consumption during off mode.
QCE
The reference annual cooling demand for air
conditioners in cooling mode
QHE
The reference annual heating demand for air
conditioners in heating mode
SHR Sensible Heat Ratio for air conditioners
SEER
Seasonal Energy Efficiency Ratio for air
conditioners, cooling mode
SCOP
Seasonal Coefficient of Performance for air
conditioners, heating mode
VRF Variable Refrigerant Flow

8
Introduction to the task reports This is the introduction to the interim report of the preparatory study on the Review of
Regulation 206/2012 and 626/2011 for air conditioners and comfort fans. The interim
report has been split into five tasks, following the structure of the MEErP methodology.
Each task report has been uploaded individually in the project’s website. These task
reports present the technical basis to define future ecodesign and energy labelling
requirements based on the existing Regulation (EU) 206/2012 and 626/2011.
The task reports start with the definition of the scope for this review study (i.e. task 1),
which assesses the current scope of the existing regulation in light of recent
developments with relevant legislation, standardisation and voluntary agreements in the
EU and abroad. Furthermore, assessing the possibility of merging implementing
measures that cover the similar groups of products or extend the scope to include new
product groups. The assessment results in a refined scope for this review study.
Following it is task 2, which updates the annual sales and stock of the products in scope
according to recent and future market trends and estimates future stocks. Furthermore,
it provides an update on the current development of low-GWP alternatives and sound
pressure level.
Next task is task 3, which presents a detailed overview of use patterns of products in scope
according to consumer use and technological developments. It also provides an analysis of
other aspects that affect the energy consumption during the use of these products, such
as component technologies. Furthermore, it also touches on aspects that are important for
material and resource efficiency such as repair and maintenance, and it gives an overview
of what happens to these products at their end of life.
Task 4 presents an analysis of current average technologies at product and component
level, and it identifies the Best Available Technologies both at product and component level.
An overview of the technical specifications as well as their overall energy consumption is
provided when data is available. Finally, the chapter discusses possible design options to
improve the resource efficiency.
Simplified tasks 5 & 6 report presents the base cases, which will be later used to define
the current and future impact of the current air condition regulation if no action is taken.
The report shows the base cases energy consumption at product category level and their
life cycle costs. It also provides a high-level overview of the life cycle global warming
potential of air conditioners and comfort fans giving an idea of the contribution of each
life cycle stage to the overall environmental impact. Finally, it presents some identified
design options which will be used to define reviewed ecodesign and energy labelling
requirements.
Task 7 report presents the policy options for an amended ecodesign regulation on air
conditioners and comfort fans. The options have been developed based on the work
throughout this review study, dialogue with stakeholders and with the European
Commission. The report presents an overview of the barriers and opportunities for the
reviewed energy efficiency policy options, and the rationale for the new
material/refrigerant efficiency policy options. This report will be the basis to calculate the
estimated energy and material savings potentials by implementing these policy options,
in comparison to no action (i.e. Business as Usual – BAU).

9
The task reports follow the MEErP methodology, with some adaptations which suit the
study goals.
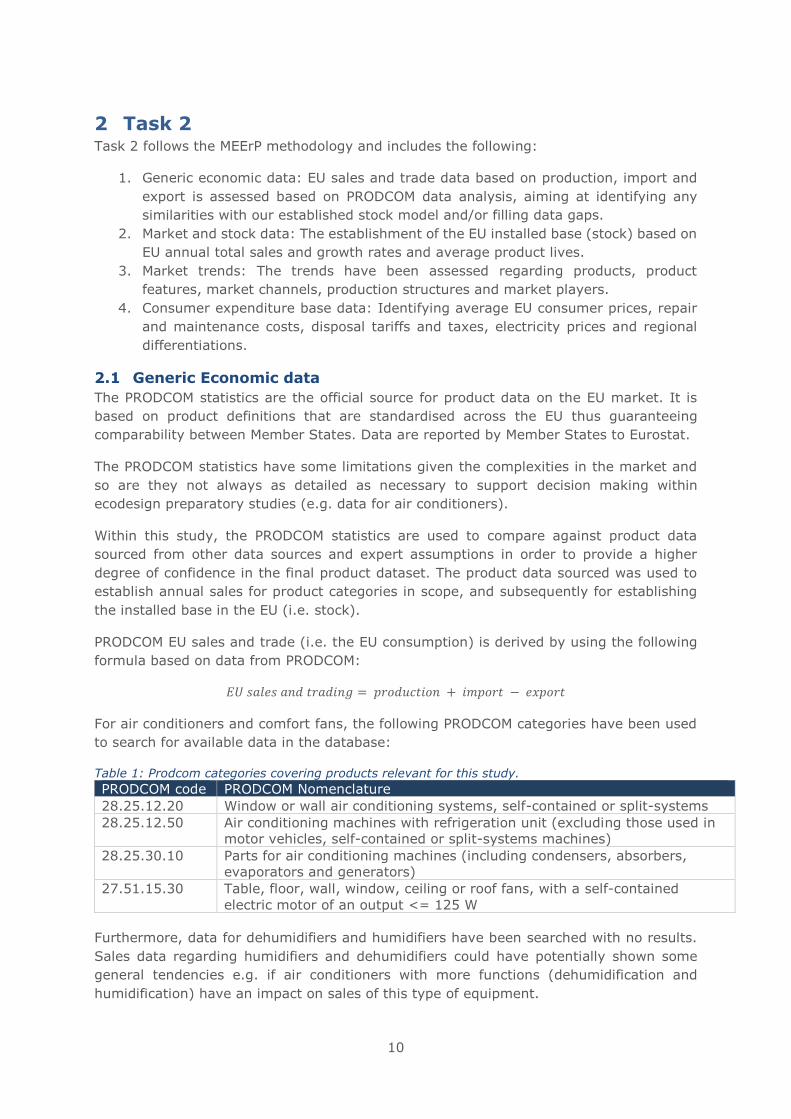
10
2 Task 2 Task 2 follows the MEErP methodology and includes the following:
1. Generic economic data: EU sales and trade data based on production, import and
export is assessed based on PRODCOM data analysis, aiming at identifying any
similarities with our established stock model and/or filling data gaps.
2. Market and stock data: The establishment of the EU installed base (stock) based on
EU annual total sales and growth rates and average product lives.
3. Market trends: The trends have been assessed regarding products, product
features, market channels, production structures and market players.
4. Consumer expenditure base data: Identifying average EU consumer prices, repair
and maintenance costs, disposal tariffs and taxes, electricity prices and regional
differentiations.
2.1 Generic Economic data
The PRODCOM statistics are the official source for product data on the EU market. It is
based on product definitions that are standardised across the EU thus guaranteeing
comparability between Member States. Data are reported by Member States to Eurostat.
The PRODCOM statistics have some limitations given the complexities in the market and
so are they not always as detailed as necessary to support decision making within
ecodesign preparatory studies (e.g. data for air conditioners).
Within this study, the PRODCOM statistics are used to compare against product data
sourced from other data sources and expert assumptions in order to provide a higher
degree of confidence in the final product dataset. The product data sourced was used to
establish annual sales for product categories in scope, and subsequently for establishing
the installed base in the EU (i.e. stock).
PRODCOM EU sales and trade (i.e. the EU consumption) is derived by using the following
formula based on data from PRODCOM:
𝐸𝑈 𝑠𝑎𝑙𝑒𝑠 𝑎𝑛𝑑 𝑡𝑟𝑎𝑑𝑖𝑛𝑔 = 𝑝𝑟𝑜𝑑𝑢𝑐𝑡𝑖𝑜𝑛 + 𝑖𝑚𝑝𝑜𝑟𝑡 − 𝑒𝑥𝑝𝑜𝑟𝑡
For air conditioners and comfort fans, the following PRODCOM categories have been used
to search for available data in the database:
Table 1: Prodcom categories covering products relevant for this study.
PRODCOM code PRODCOM Nomenclature
28.25.12.20 Window or wall air conditioning systems, self-contained or split-systems
28.25.12.50 Air conditioning machines with refrigeration unit (excluding those used in
motor vehicles, self-contained or split-systems machines)
28.25.30.10 Parts for air conditioning machines (including condensers, absorbers,
evaporators and generators)
27.51.15.30 Table, floor, wall, window, ceiling or roof fans, with a self-contained
electric motor of an output <= 125 W
Furthermore, data for dehumidifiers and humidifiers have been searched with no results.
Sales data regarding humidifiers and dehumidifiers could have potentially shown some
general tendencies e.g. if air conditioners with more functions (dehumidification and
humidification) have an impact on sales of this type of equipment.
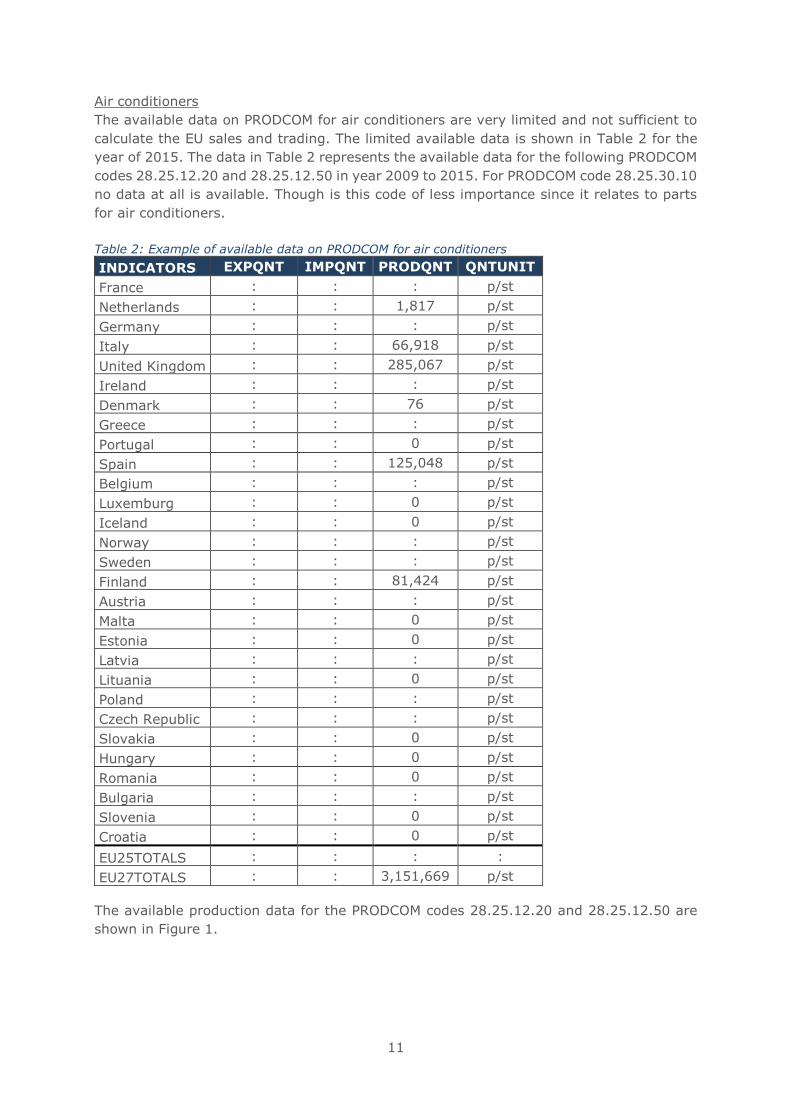
11
Air conditioners
The available data on PRODCOM for air conditioners are very limited and not sufficient to
calculate the EU sales and trading. The limited available data is shown in Table 2 for the
year of 2015. The data in Table 2 represents the available data for the following PRODCOM
codes 28.25.12.20 and 28.25.12.50 in year 2009 to 2015. For PRODCOM code 28.25.30.10
no data at all is available. Though is this code of less importance since it relates to parts
for air conditioners.
Table 2: Example of available data on PRODCOM for air conditioners
INDICATORS EXPQNT IMPQNT PRODQNT QNTUNIT
France : : : p/st
Netherlands : : 1,817 p/st
Germany : : : p/st
Italy : : 66,918 p/st
United Kingdom : : 285,067 p/st
Ireland : : : p/st
Denmark : : 76 p/st
Greece : : : p/st
Portugal : : 0 p/st
Spain : : 125,048 p/st
Belgium : : : p/st
Luxemburg : : 0 p/st
Iceland : : 0 p/st
Norway : : : p/st
Sweden : : : p/st
Finland : : 81,424 p/st
Austria : : : p/st
Malta : : 0 p/st
Estonia : : 0 p/st
Latvia : : : p/st
Lituania : : 0 p/st
Poland : : : p/st
Czech Republic : : : p/st
Slovakia : : 0 p/st
Hungary : : 0 p/st
Romania : : 0 p/st
Bulgaria : : : p/st
Slovenia : : 0 p/st
Croatia : : 0 p/st
EU25TOTALS : : : :
EU27TOTALS : : 3,151,669 p/st
The available production data for the PRODCOM codes 28.25.12.20 and 28.25.12.50 are
shown in Figure 1.
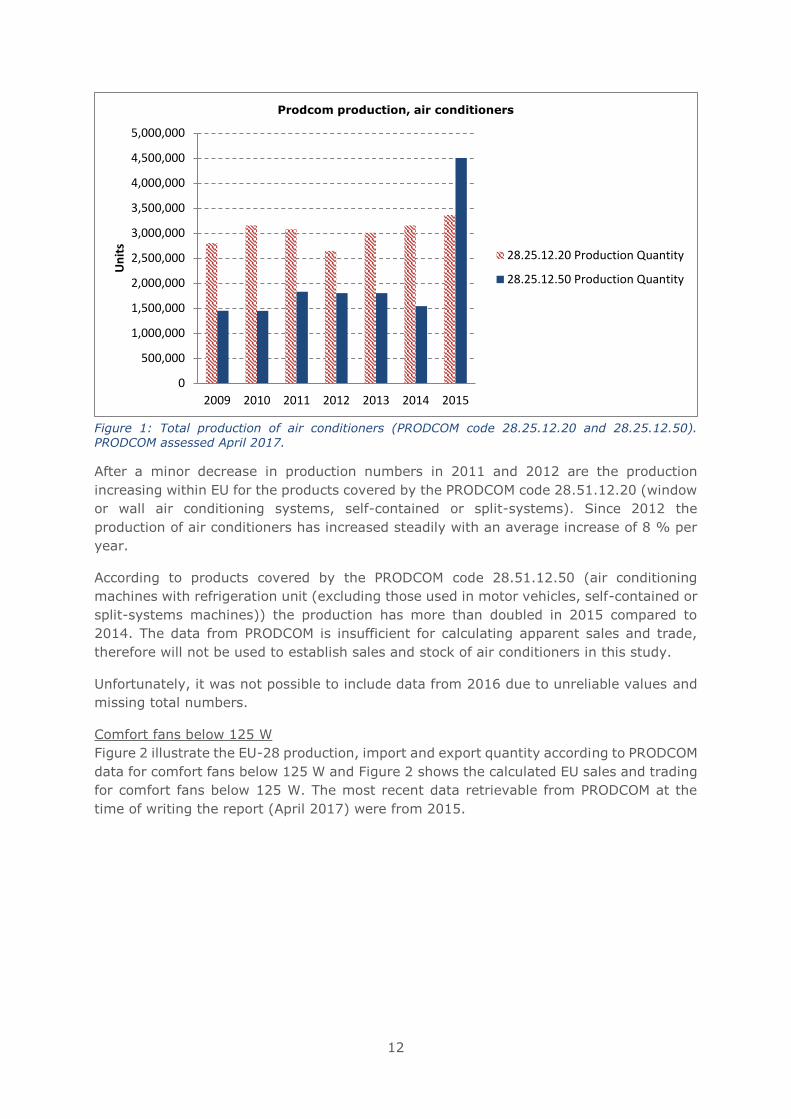
12
Figure 1: Total production of air conditioners (PRODCOM code 28.25.12.20 and 28.25.12.50). PRODCOM assessed April 2017.
After a minor decrease in production numbers in 2011 and 2012 are the production
increasing within EU for the products covered by the PRODCOM code 28.51.12.20 (window
or wall air conditioning systems, self-contained or split-systems). Since 2012 the
production of air conditioners has increased steadily with an average increase of 8 % per
year.
According to products covered by the PRODCOM code 28.51.12.50 (air conditioning
machines with refrigeration unit (excluding those used in motor vehicles, self-contained or
split-systems machines)) the production has more than doubled in 2015 compared to
2014. The data from PRODCOM is insufficient for calculating apparent sales and trade,
therefore will not be used to establish sales and stock of air conditioners in this study.
Unfortunately, it was not possible to include data from 2016 due to unreliable values and
missing total numbers.
Comfort fans below 125 W
Figure 2 illustrate the EU-28 production, import and export quantity according to PRODCOM
data for comfort fans below 125 W and Figure 2 shows the calculated EU sales and trading
for comfort fans below 125 W. The most recent data retrievable from PRODCOM at the
time of writing the report (April 2017) were from 2015.
0
500,000
1,000,000
1,500,000
2,000,000
2,500,000
3,000,000
3,500,000
4,000,000
4,500,000
5,000,000
2009 2010 2011 2012 2013 2014 2015
Un
its
Prodcom production, air conditioners
28.25.12.20 Production Quantity
28.25.12.50 Production Quantity
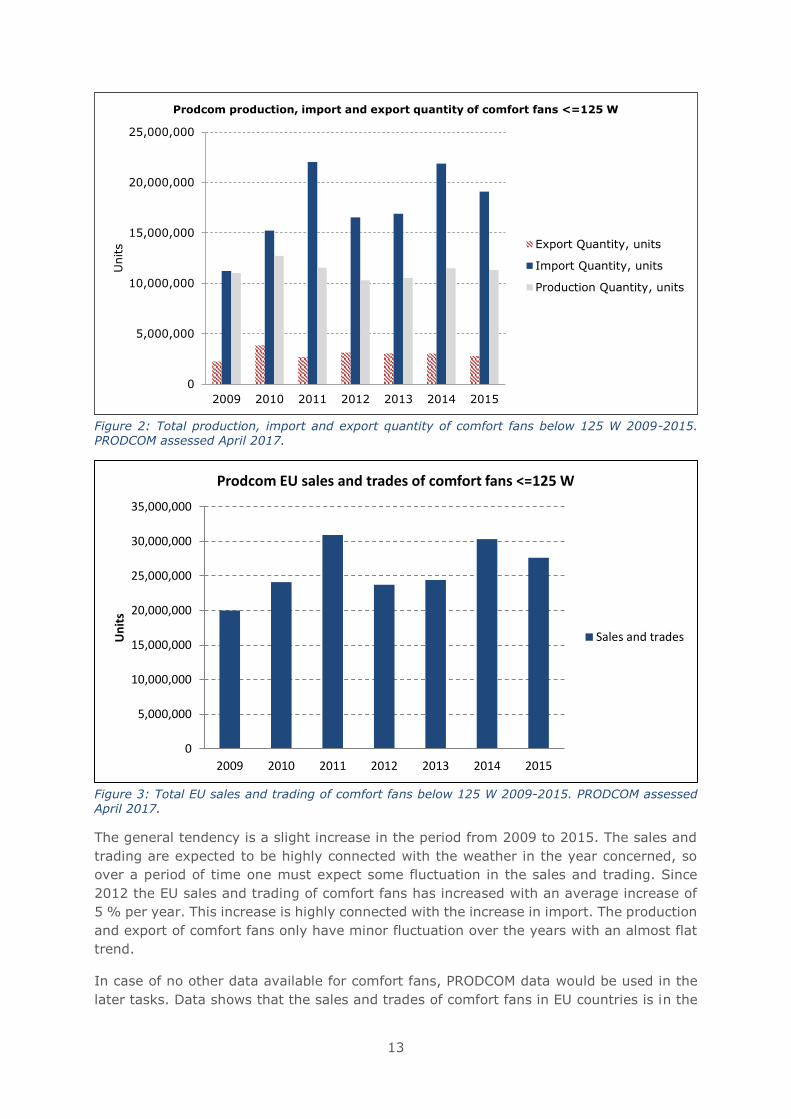
13
Figure 2: Total production, import and export quantity of comfort fans below 125 W 2009-2015. PRODCOM assessed April 2017.
Figure 3: Total EU sales and trading of comfort fans below 125 W 2009-2015. PRODCOM assessed April 2017.
The general tendency is a slight increase in the period from 2009 to 2015. The sales and
trading are expected to be highly connected with the weather in the year concerned, so
over a period of time one must expect some fluctuation in the sales and trading. Since
2012 the EU sales and trading of comfort fans has increased with an average increase of
5 % per year. This increase is highly connected with the increase in import. The production
and export of comfort fans only have minor fluctuation over the years with an almost flat
trend.
In case of no other data available for comfort fans, PRODCOM data would be used in the
later tasks. Data shows that the sales and trades of comfort fans in EU countries is in the
0
5,000,000
10,000,000
15,000,000
20,000,000
25,000,000
2009 2010 2011 2012 2013 2014 2015
Units
Prodcom production, import and export quantity of comfort fans <=125 W
Export Quantity, units
Import Quantity, units
Production Quantity, units
0
5,000,000
10,000,000
15,000,000
20,000,000
25,000,000
30,000,000
35,000,000
2009 2010 2011 2012 2013 2014 2015
Un
its
Prodcom EU sales and trades of comfort fans <=125 W
Sales and trades
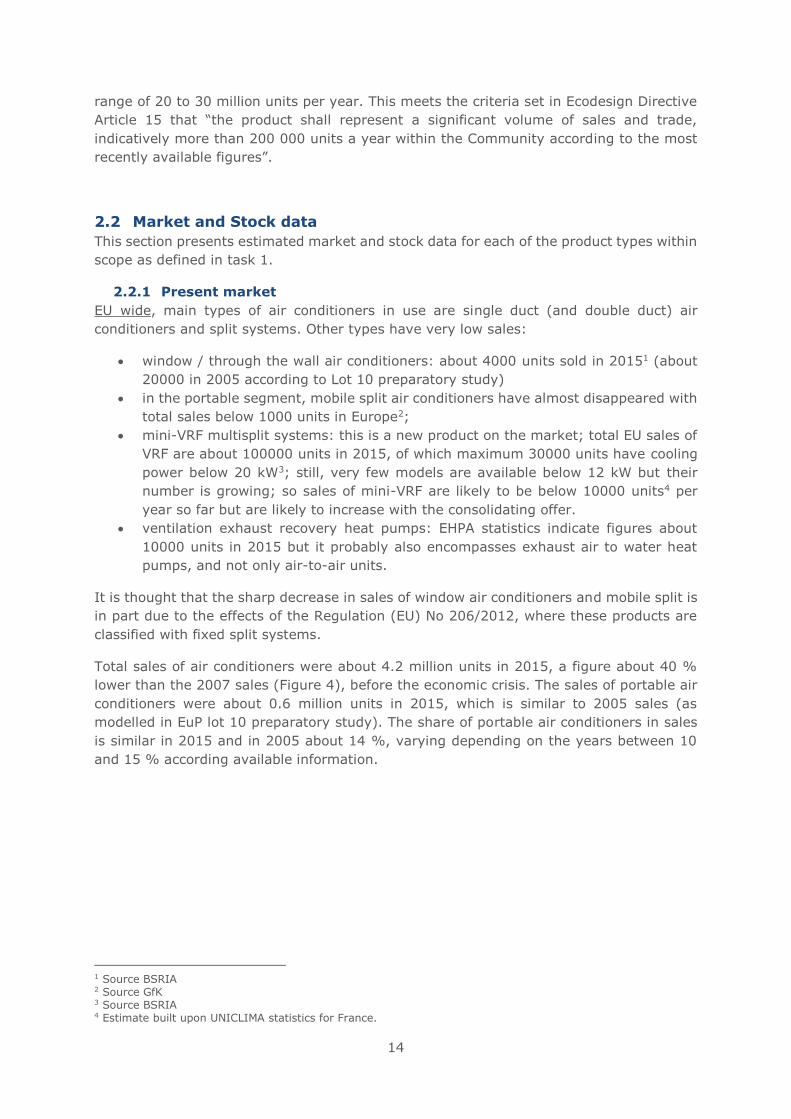
14
range of 20 to 30 million units per year. This meets the criteria set in Ecodesign Directive
Article 15 that “the product shall represent a significant volume of sales and trade,
indicatively more than 200 000 units a year within the Community according to the most
recently available figures”.
2.2 Market and Stock data
This section presents estimated market and stock data for each of the product types within
scope as defined in task 1.
2.2.1 Present market
EU wide, main types of air conditioners in use are single duct (and double duct) air
conditioners and split systems. Other types have very low sales:
• window / through the wall air conditioners: about 4000 units sold in 20151 (about
20000 in 2005 according to Lot 10 preparatory study)
• in the portable segment, mobile split air conditioners have almost disappeared with
total sales below 1000 units in Europe2;
• mini-VRF multisplit systems: this is a new product on the market; total EU sales of
VRF are about 100000 units in 2015, of which maximum 30000 units have cooling
power below 20 kW3; still, very few models are available below 12 kW but their
number is growing; so sales of mini-VRF are likely to be below 10000 units4 per
year so far but are likely to increase with the consolidating offer.
• ventilation exhaust recovery heat pumps: EHPA statistics indicate figures about
10000 units in 2015 but it probably also encompasses exhaust air to water heat
pumps, and not only air-to-air units.
It is thought that the sharp decrease in sales of window air conditioners and mobile split is
in part due to the effects of the Regulation (EU) No 206/2012, where these products are
classified with fixed split systems.
Total sales of air conditioners were about 4.2 million units in 2015, a figure about 40 %
lower than the 2007 sales (Figure 4), before the economic crisis. The sales of portable air
conditioners were about 0.6 million units in 2015, which is similar to 2005 sales (as
modelled in EuP lot 10 preparatory study). The share of portable air conditioners in sales
is similar in 2015 and in 2005 about 14 %, varying depending on the years between 10
and 15 % according available information.
1 Source BSRIA 2 Source GfK 3 Source BSRIA 4 Estimate built upon UNICLIMA statistics for France.
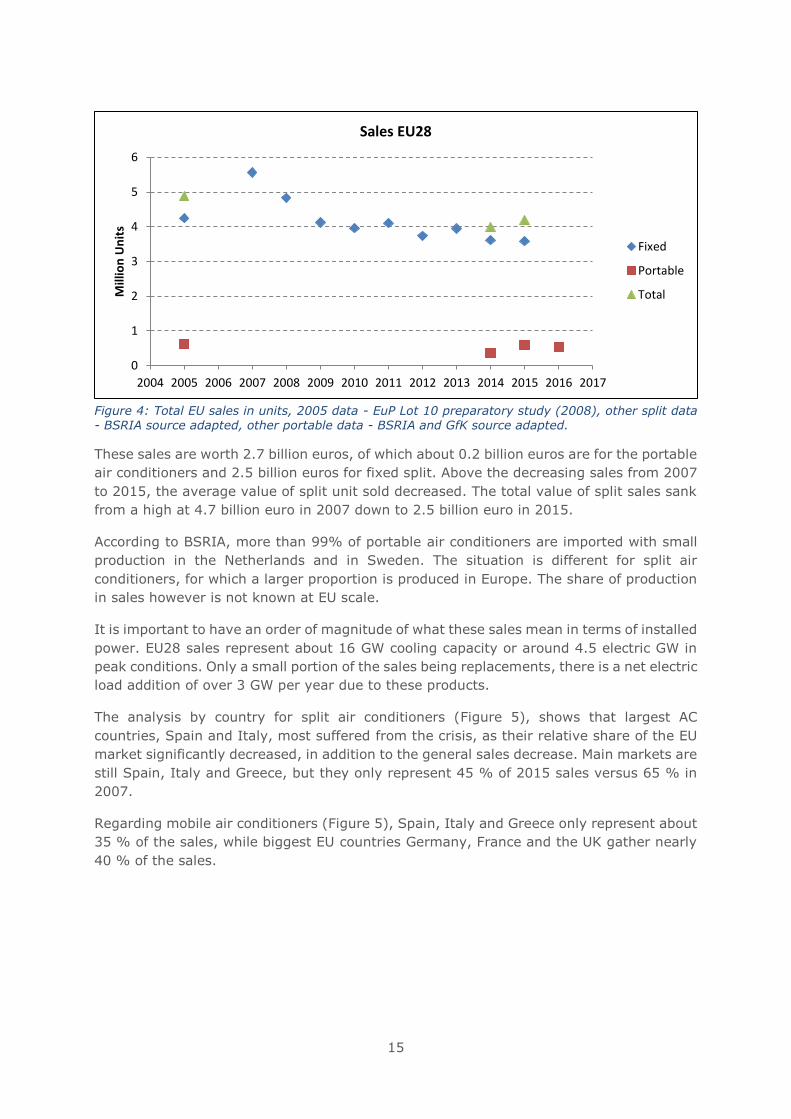
15
Figure 4: Total EU sales in units, 2005 data - EuP Lot 10 preparatory study (2008), other split data - BSRIA source adapted, other portable data - BSRIA and GfK source adapted.
These sales are worth 2.7 billion euros, of which about 0.2 billion euros are for the portable
air conditioners and 2.5 billion euros for fixed split. Above the decreasing sales from 2007
to 2015, the average value of split unit sold decreased. The total value of split sales sank
from a high at 4.7 billion euro in 2007 down to 2.5 billion euro in 2015.
According to BSRIA, more than 99% of portable air conditioners are imported with small
production in the Netherlands and in Sweden. The situation is different for split air
conditioners, for which a larger proportion is produced in Europe. The share of production
in sales however is not known at EU scale.
It is important to have an order of magnitude of what these sales mean in terms of installed
power. EU28 sales represent about 16 GW cooling capacity or around 4.5 electric GW in
peak conditions. Only a small portion of the sales being replacements, there is a net electric
load addition of over 3 GW per year due to these products.
The analysis by country for split air conditioners (Figure 5), shows that largest AC
countries, Spain and Italy, most suffered from the crisis, as their relative share of the EU
market significantly decreased, in addition to the general sales decrease. Main markets are
still Spain, Italy and Greece, but they only represent 45 % of 2015 sales versus 65 % in
2007.
Regarding mobile air conditioners (Figure 5), Spain, Italy and Greece only represent about
35 % of the sales, while biggest EU countries Germany, France and the UK gather nearly
40 % of the sales.
0
1
2
3
4
5
6
2004 2005 2006 2007 2008 2009 2010 2011 2012 2013 2014 2015 2016 2017
Mill
ion
Un
its
Sales EU28
Fixed
Portable
Total
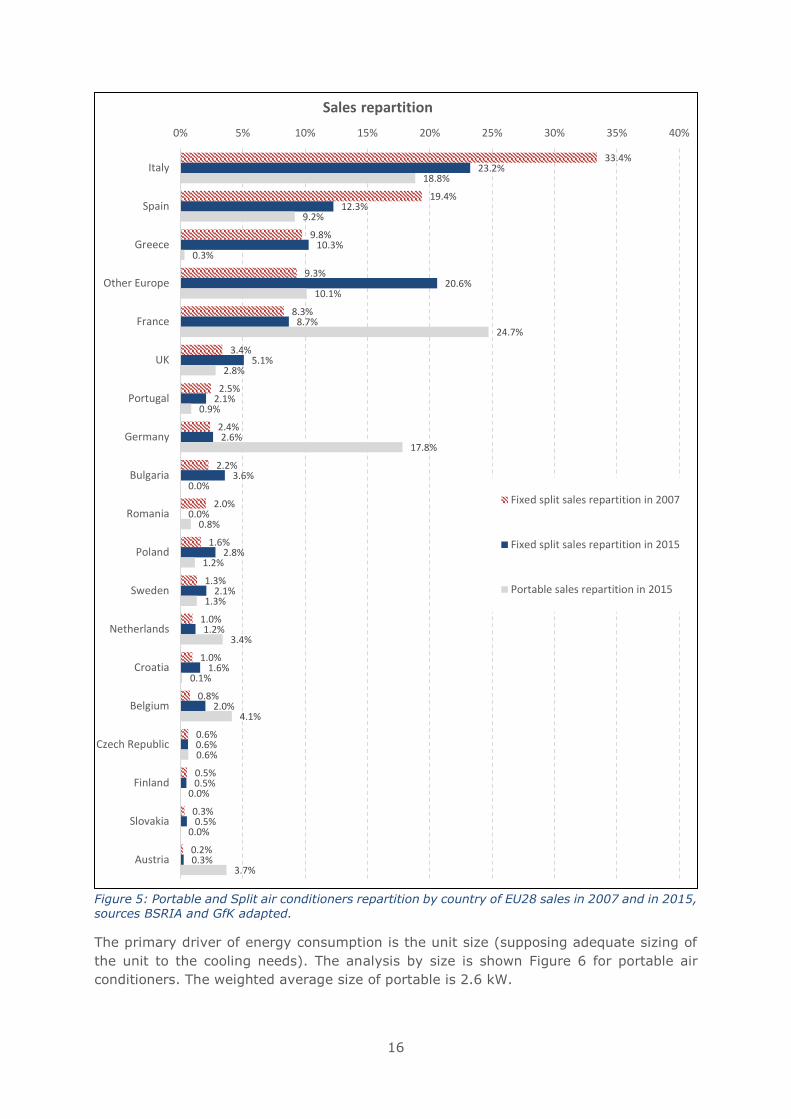
16
Figure 5: Portable and Split air conditioners repartition by country of EU28 sales in 2007 and in 2015, sources BSRIA and GfK adapted.
The primary driver of energy consumption is the unit size (supposing adequate sizing of
the unit to the cooling needs). The analysis by size is shown Figure 6 for portable air
conditioners. The weighted average size of portable is 2.6 kW.
33.4%
19.4%
9.8%
9.3%
8.3%
3.4%
2.5%
2.4%
2.2%
2.0%
1.6%
1.3%
1.0%
1.0%
0.8%
0.6%
0.5%
0.3%
0.2%
23.2%
12.3%
10.3%
20.6%
8.7%
5.1%
2.1%
2.6%
3.6%
0.0%
2.8%
2.1%
1.2%
1.6%
2.0%
0.6%
0.5%
0.5%
0.3%
18.8%
9.2%
0.3%
10.1%
24.7%
2.8%
0.9%
17.8%
0.0%
0.8%
1.2%
1.3%
3.4%
0.1%
4.1%
0.6%
0.0%
0.0%
3.7%
0% 5% 10% 15% 20% 25% 30% 35% 40%
Italy
Spain
Greece
Other Europe
France
UK
Portugal
Germany
Bulgaria
Romania
Poland
Sweden
Netherlands
Croatia
Belgium
Czech Republic
Finland
Slovakia
Austria
Sales repartition
Fixed split sales repartition in 2007
Fixed split sales repartition in 2015
Portable sales repartition in 2015
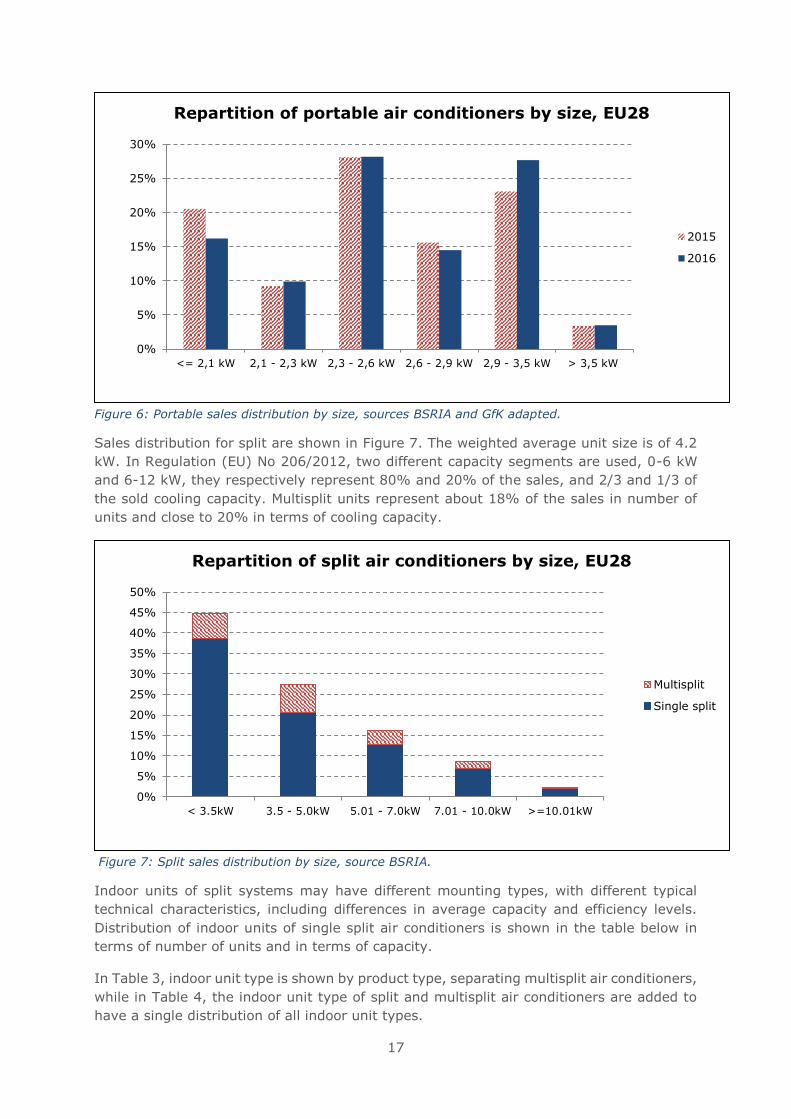
17
Figure 6: Portable sales distribution by size, sources BSRIA and GfK adapted.
Sales distribution for split are shown in Figure 7. The weighted average unit size is of 4.2
kW. In Regulation (EU) No 206/2012, two different capacity segments are used, 0-6 kW
and 6-12 kW, they respectively represent 80% and 20% of the sales, and 2/3 and 1/3 of
the sold cooling capacity. Multisplit units represent about 18% of the sales in number of
units and close to 20% in terms of cooling capacity.
Figure 7: Split sales distribution by size, source BSRIA.
Indoor units of split systems may have different mounting types, with different typical
technical characteristics, including differences in average capacity and efficiency levels.
Distribution of indoor units of single split air conditioners is shown in the table below in
terms of number of units and in terms of capacity.
In Table 3, indoor unit type is shown by product type, separating multisplit air conditioners,
while in Table 4, the indoor unit type of split and multisplit air conditioners are added to
have a single distribution of all indoor unit types.
0%
5%
10%
15%
20%
25%
30%
<= 2,1 kW 2,1 - 2,3 kW 2,3 - 2,6 kW 2,6 - 2,9 kW 2,9 - 3,5 kW > 3,5 kW
Repartition of portable air conditioners by size, EU28
2015
2016
0%
5%
10%
15%
20%
25%
30%
35%
40%
45%
50%
< 3.5kW 3.5 - 5.0kW 5.01 - 7.0kW 7.01 - 10.0kW >=10.01kW
Repartition of split air conditioners by size, EU28
Multisplit
Single split
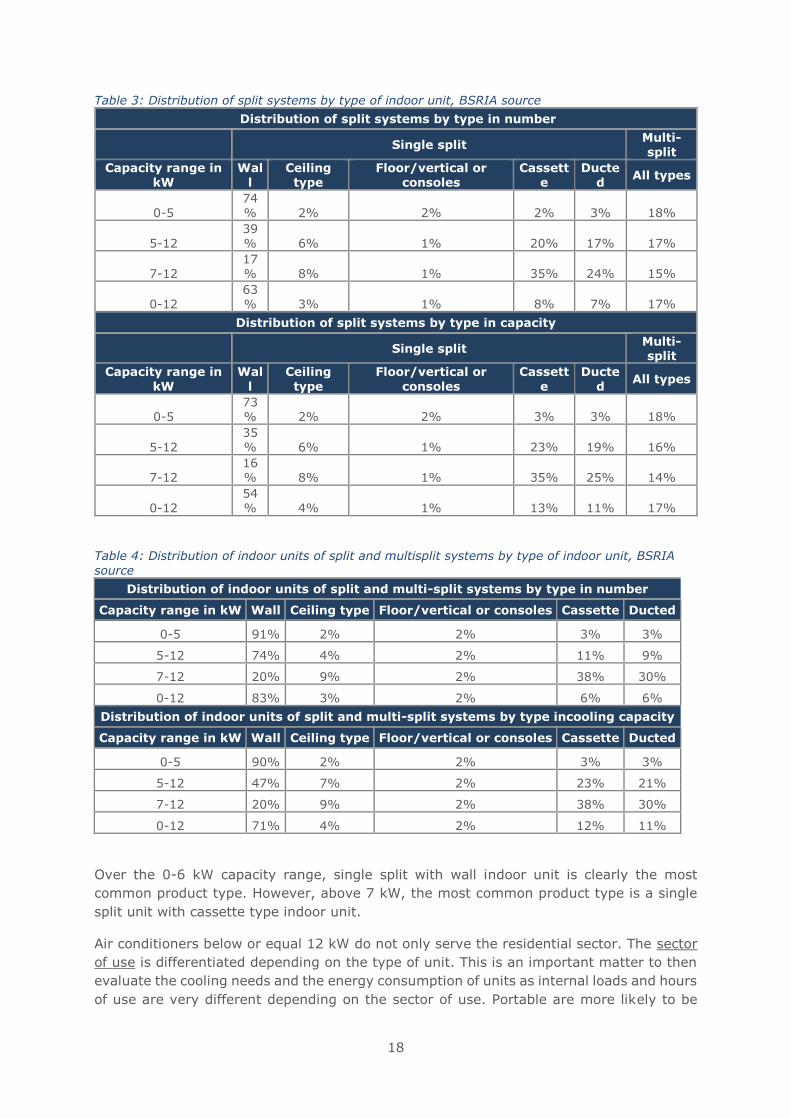
18
Table 3: Distribution of split systems by type of indoor unit, BSRIA source
Distribution of split systems by type in number
Single split Multi-split
Capacity range in kW
Wall
Ceiling type
Floor/vertical or consoles
Cassette
Ducted
All types
0-5 74% 2% 2% 2% 3% 18%
5-12 39% 6% 1% 20% 17% 17%
7-12 17% 8% 1% 35% 24% 15%
0-12 63% 3% 1% 8% 7% 17%
Distribution of split systems by type in capacity
Single split Multi-split
Capacity range in
kW
Wal
l
Ceiling
type
Floor/vertical or
consoles
Cassett
e
Ducte
d All types
0-5 73% 2% 2% 3% 3% 18%
5-12 35% 6% 1% 23% 19% 16%
7-12 16% 8% 1% 35% 25% 14%
0-12 54% 4% 1% 13% 11% 17%
Table 4: Distribution of indoor units of split and multisplit systems by type of indoor unit, BSRIA
source
Distribution of indoor units of split and multi-split systems by type in number
Capacity range in kW Wall Ceiling type Floor/vertical or consoles Cassette Ducted
0-5 91% 2% 2% 3% 3%
5-12 74% 4% 2% 11% 9%
7-12 20% 9% 2% 38% 30%
0-12 83% 3% 2% 6% 6%
Distribution of indoor units of split and multi-split systems by type incooling capacity
Capacity range in kW Wall Ceiling type Floor/vertical or consoles Cassette Ducted
0-5 90% 2% 2% 3% 3%
5-12 47% 7% 2% 23% 21%
7-12 20% 9% 2% 38% 30%
0-12 71% 4% 2% 12% 11%
Over the 0-6 kW capacity range, single split with wall indoor unit is clearly the most
common product type. However, above 7 kW, the most common product type is a single
split unit with cassette type indoor unit.
Air conditioners below or equal 12 kW do not only serve the residential sector. The sector
of use is differentiated depending on the type of unit. This is an important matter to then
evaluate the cooling needs and the energy consumption of units as internal loads and hours
of use are very different depending on the sector of use. Portable are more likely to be
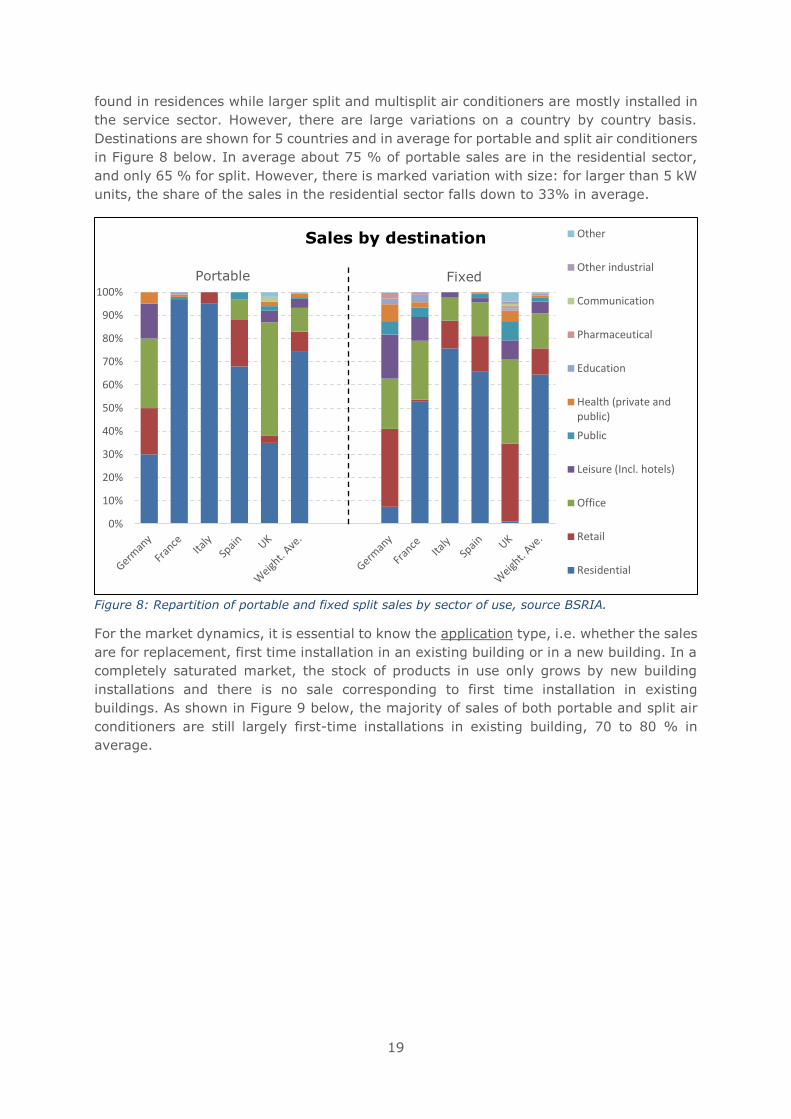
19
found in residences while larger split and multisplit air conditioners are mostly installed in
the service sector. However, there are large variations on a country by country basis.
Destinations are shown for 5 countries and in average for portable and split air conditioners
in Figure 8 below. In average about 75 % of portable sales are in the residential sector,
and only 65 % for split. However, there is marked variation with size: for larger than 5 kW
units, the share of the sales in the residential sector falls down to 33% in average.
Figure 8: Repartition of portable and fixed split sales by sector of use, source BSRIA.
For the market dynamics, it is essential to know the application type, i.e. whether the sales
are for replacement, first time installation in an existing building or in a new building. In a
completely saturated market, the stock of products in use only grows by new building
installations and there is no sale corresponding to first time installation in existing
buildings. As shown in Figure 9 below, the majority of sales of both portable and split air
conditioners are still largely first-time installations in existing building, 70 to 80 % in
average.
0%
10%
20%
30%
40%
50%
60%
70%
80%
90%
100%
Sales by destination Other
Other industrial
Communication
Pharmaceutical
Education
Health (private andpublic)
Public
Leisure (Incl. hotels)
Office
Retail
Residential
Portable Fixed
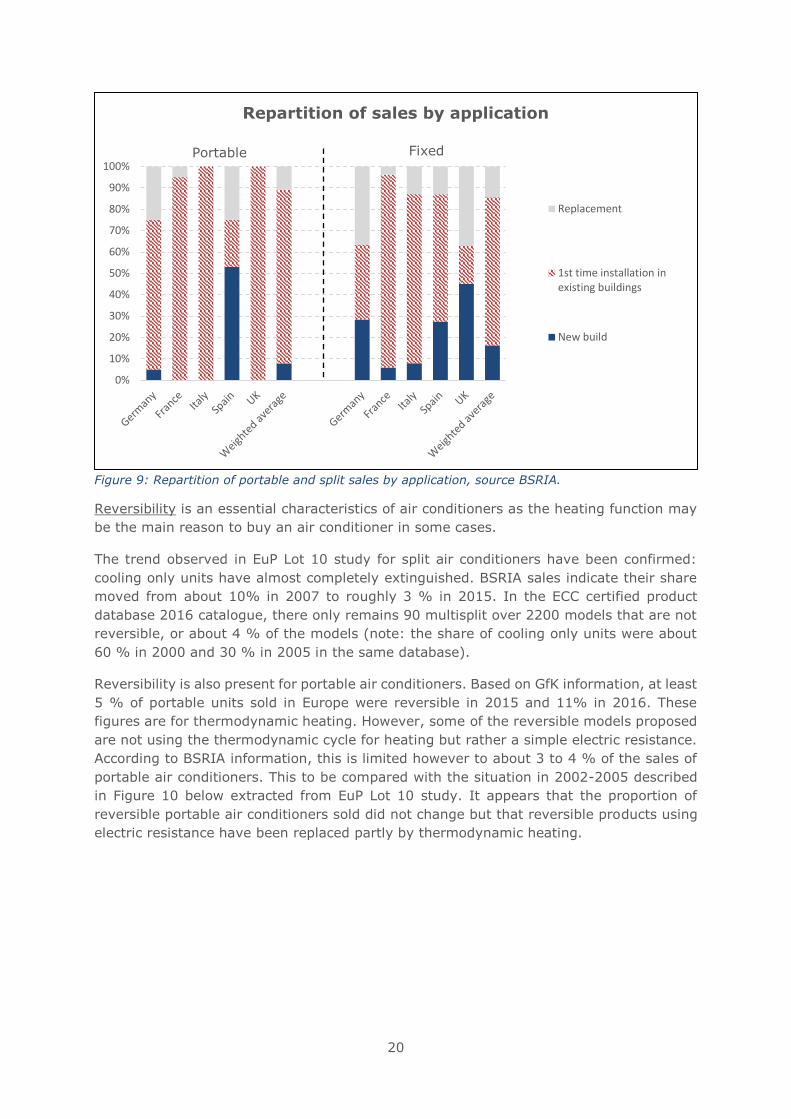
20
Figure 9: Repartition of portable and split sales by application, source BSRIA.
Reversibility is an essential characteristics of air conditioners as the heating function may
be the main reason to buy an air conditioner in some cases.
The trend observed in EuP Lot 10 study for split air conditioners have been confirmed:
cooling only units have almost completely extinguished. BSRIA sales indicate their share
moved from about 10% in 2007 to roughly 3 % in 2015. In the ECC certified product
database 2016 catalogue, there only remains 90 multisplit over 2200 models that are not
reversible, or about 4 % of the models (note: the share of cooling only units were about
60 % in 2000 and 30 % in 2005 in the same database).
Reversibility is also present for portable air conditioners. Based on GfK information, at least
5 % of portable units sold in Europe were reversible in 2015 and 11% in 2016. These
figures are for thermodynamic heating. However, some of the reversible models proposed
are not using the thermodynamic cycle for heating but rather a simple electric resistance.
According to BSRIA information, this is limited however to about 3 to 4 % of the sales of
portable air conditioners. This to be compared with the situation in 2002-2005 described
in Figure 10 below extracted from EuP Lot 10 study. It appears that the proportion of
reversible portable air conditioners sold did not change but that reversible products using
electric resistance have been replaced partly by thermodynamic heating.
0%
10%
20%
30%
40%
50%
60%
70%
80%
90%
100%
Repartition of sales by application
Replacement
1st time installation inexisting buildings
New build
Portable Fixed
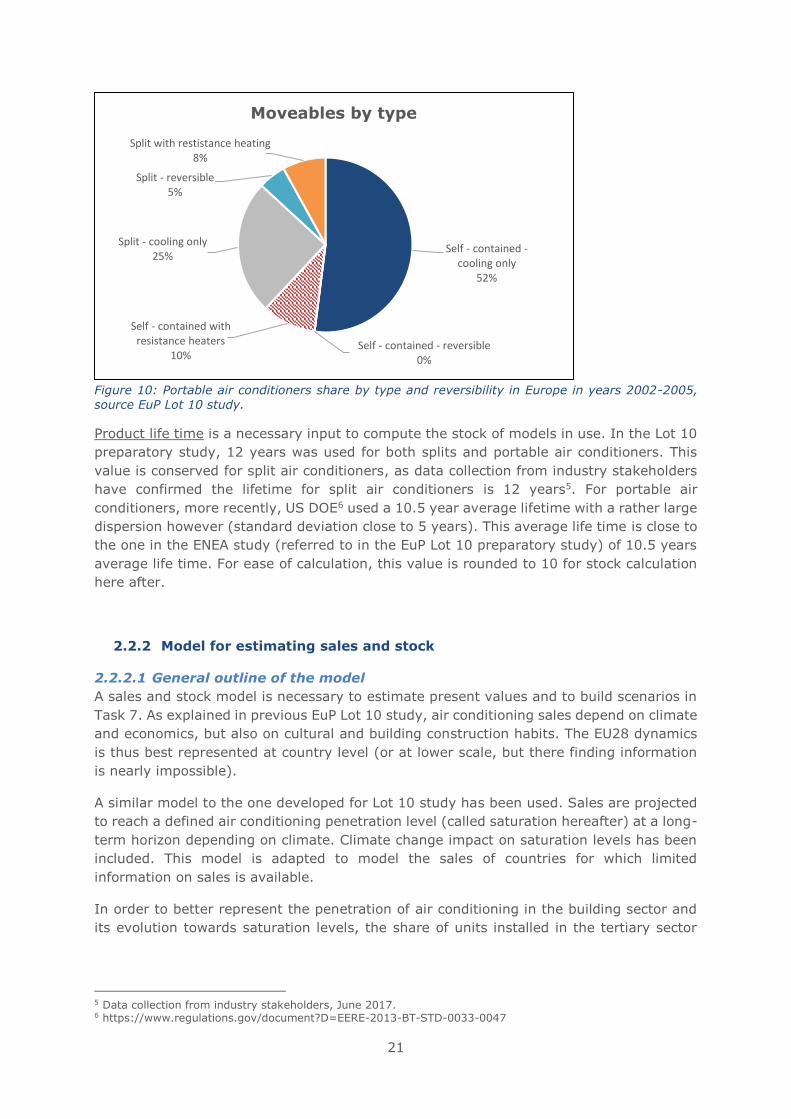
21
Figure 10: Portable air conditioners share by type and reversibility in Europe in years 2002-2005, source EuP Lot 10 study.
Product life time is a necessary input to compute the stock of models in use. In the Lot 10
preparatory study, 12 years was used for both splits and portable air conditioners. This
value is conserved for split air conditioners, as data collection from industry stakeholders
have confirmed the lifetime for split air conditioners is 12 years5. For portable air
conditioners, more recently, US DOE6 used a 10.5 year average lifetime with a rather large
dispersion however (standard deviation close to 5 years). This average life time is close to
the one in the ENEA study (referred to in the EuP Lot 10 preparatory study) of 10.5 years
average life time. For ease of calculation, this value is rounded to 10 for stock calculation
here after.
2.2.2 Model for estimating sales and stock
2.2.2.1 General outline of the model
A sales and stock model is necessary to estimate present values and to build scenarios in
Task 7. As explained in previous EuP Lot 10 study, air conditioning sales depend on climate
and economics, but also on cultural and building construction habits. The EU28 dynamics
is thus best represented at country level (or at lower scale, but there finding information
is nearly impossible).
A similar model to the one developed for Lot 10 study has been used. Sales are projected
to reach a defined air conditioning penetration level (called saturation hereafter) at a long-
term horizon depending on climate. Climate change impact on saturation levels has been
included. This model is adapted to model the sales of countries for which limited
information on sales is available.
In order to better represent the penetration of air conditioning in the building sector and
its evolution towards saturation levels, the share of units installed in the tertiary sector
5 Data collection from industry stakeholders, June 2017. 6 https://www.regulations.gov/document?D=EERE-2013-BT-STD-0033-0047
Self - contained -cooling only
52%
Self - contained - reversible0%
Self - contained with resistance heaters
10%
Split - cooling only25%
Split - reversible5%
Split with restistance heating8%
Moveables by type
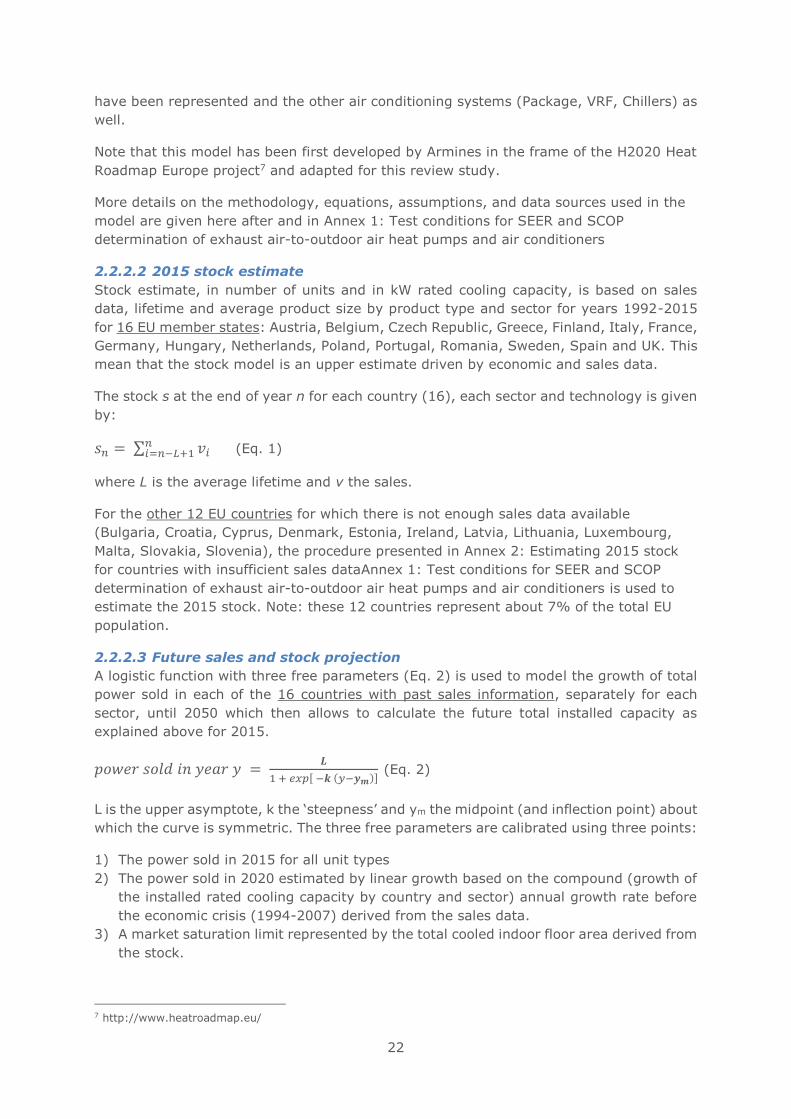
22
have been represented and the other air conditioning systems (Package, VRF, Chillers) as
well.
Note that this model has been first developed by Armines in the frame of the H2020 Heat
Roadmap Europe project7 and adapted for this review study.
More details on the methodology, equations, assumptions, and data sources used in the
model are given here after and in Annex 1: Test conditions for SEER and SCOP
determination of exhaust air-to-outdoor air heat pumps and air conditioners
2.2.2.2 2015 stock estimate
Stock estimate, in number of units and in kW rated cooling capacity, is based on sales
data, lifetime and average product size by product type and sector for years 1992-2015
for 16 EU member states: Austria, Belgium, Czech Republic, Greece, Finland, Italy, France,
Germany, Hungary, Netherlands, Poland, Portugal, Romania, Sweden, Spain and UK. This
mean that the stock model is an upper estimate driven by economic and sales data.
The stock s at the end of year n for each country (16), each sector and technology is given
by:
𝑠𝑛 = ∑ 𝑣𝑖𝑛𝑖=𝑛−𝐿+1 (Eq. 1)
where L is the average lifetime and v the sales.
For the other 12 EU countries for which there is not enough sales data available
(Bulgaria, Croatia, Cyprus, Denmark, Estonia, Ireland, Latvia, Lithuania, Luxembourg,
Malta, Slovakia, Slovenia), the procedure presented in Annex 2: Estimating 2015 stock
for countries with insufficient sales dataAnnex 1: Test conditions for SEER and SCOP
determination of exhaust air-to-outdoor air heat pumps and air conditioners is used to
estimate the 2015 stock. Note: these 12 countries represent about 7% of the total EU
population.
2.2.2.3 Future sales and stock projection
A logistic function with three free parameters (Eq. 2) is used to model the growth of total
power sold in each of the 16 countries with past sales information, separately for each
sector, until 2050 which then allows to calculate the future total installed capacity as
explained above for 2015.
𝑝𝑜𝑤𝑒𝑟 𝑠𝑜𝑙𝑑 𝑖𝑛 𝑦𝑒𝑎𝑟 𝑦 = 𝑳
1 + 𝑒𝑥𝑝[ −𝒌 (𝑦−𝒚𝒎)] (Eq. 2)
L is the upper asymptote, k the ‘steepness’ and ym the midpoint (and inflection point) about
which the curve is symmetric. The three free parameters are calibrated using three points:
1) The power sold in 2015 for all unit types
2) The power sold in 2020 estimated by linear growth based on the compound (growth of
the installed rated cooling capacity by country and sector) annual growth rate before
the economic crisis (1994-2007) derived from the sales data.
3) A market saturation limit represented by the total cooled indoor floor area derived from
the stock.
7 http://www.heatroadmap.eu/
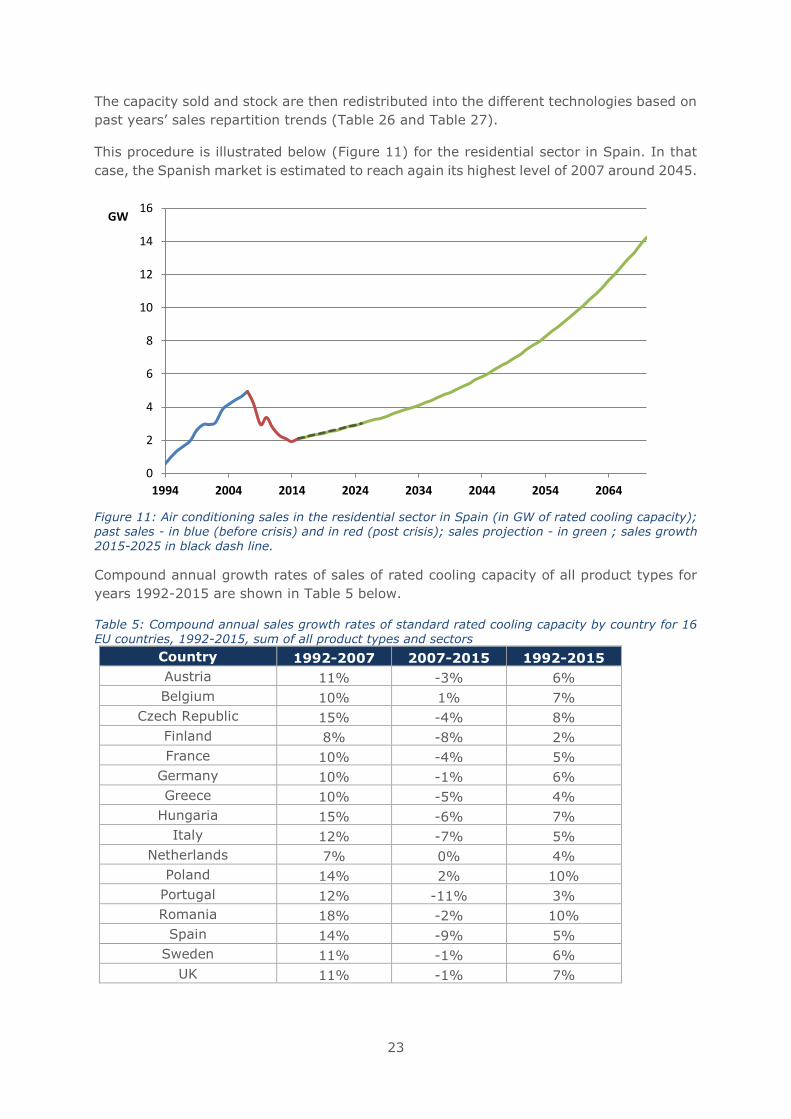
23
The capacity sold and stock are then redistributed into the different technologies based on
past years’ sales repartition trends (Table 26 and Table 27).
This procedure is illustrated below (Figure 11) for the residential sector in Spain. In that
case, the Spanish market is estimated to reach again its highest level of 2007 around 2045.
Figure 11: Air conditioning sales in the residential sector in Spain (in GW of rated cooling capacity); past sales - in blue (before crisis) and in red (post crisis); sales projection - in green ; sales growth
2015-2025 in black dash line.
Compound annual growth rates of sales of rated cooling capacity of all product types for
years 1992-2015 are shown in Table 5 below.
Table 5: Compound annual sales growth rates of standard rated cooling capacity by country for 16 EU countries, 1992-2015, sum of all product types and sectors
Country 1992-2007 2007-2015 1992-2015
Austria 11% -3% 6%
Belgium 10% 1% 7%
Czech Republic 15% -4% 8%
Finland 8% -8% 2%
France 10% -4% 5%
Germany 10% -1% 6%
Greece 10% -5% 4%
Hungaria 15% -6% 7%
Italy 12% -7% 5%
Netherlands 7% 0% 4%
Poland 14% 2% 10%
Portugal 12% -11% 3%
Romania 18% -2% 10%
Spain 14% -9% 5%
Sweden 11% -1% 6%
UK 11% -1% 7%
0
2
4
6
8
10
12
14
16
1994 2004 2014 2024 2034 2044 2054 2064
GW
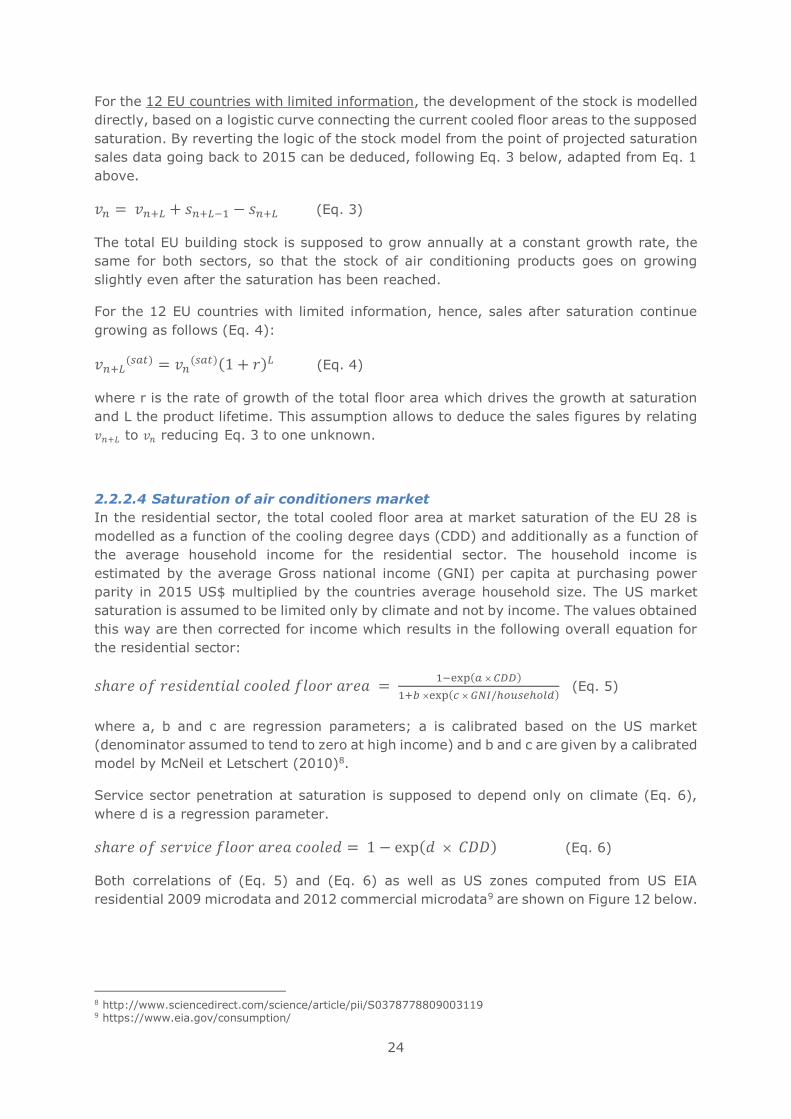
24
For the 12 EU countries with limited information, the development of the stock is modelled
directly, based on a logistic curve connecting the current cooled floor areas to the supposed
saturation. By reverting the logic of the stock model from the point of projected saturation
sales data going back to 2015 can be deduced, following Eq. 3 below, adapted from Eq. 1
above.
𝑣𝑛 = 𝑣𝑛+𝐿 + 𝑠𝑛+𝐿−1 − 𝑠𝑛+𝐿 (Eq. 3)
The total EU building stock is supposed to grow annually at a constant growth rate, the
same for both sectors, so that the stock of air conditioning products goes on growing
slightly even after the saturation has been reached.
For the 12 EU countries with limited information, hence, sales after saturation continue
growing as follows (Eq. 4):
𝑣𝑛+𝐿(𝑠𝑎𝑡) = 𝑣𝑛
(𝑠𝑎𝑡)(1 + 𝑟)𝐿 (Eq. 4)
where r is the rate of growth of the total floor area which drives the growth at saturation
and L the product lifetime. This assumption allows to deduce the sales figures by relating
𝑣𝑛+𝐿 to 𝑣𝑛 reducing Eq. 3 to one unknown.
2.2.2.4 Saturation of air conditioners market
In the residential sector, the total cooled floor area at market saturation of the EU 28 is
modelled as a function of the cooling degree days (CDD) and additionally as a function of
the average household income for the residential sector. The household income is
estimated by the average Gross national income (GNI) per capita at purchasing power
parity in 2015 US$ multiplied by the countries average household size. The US market
saturation is assumed to be limited only by climate and not by income. The values obtained
this way are then corrected for income which results in the following overall equation for
the residential sector:
𝑠ℎ𝑎𝑟𝑒 𝑜𝑓 𝑟𝑒𝑠𝑖𝑑𝑒𝑛𝑡𝑖𝑎𝑙 𝑐𝑜𝑜𝑙𝑒𝑑 𝑓𝑙𝑜𝑜𝑟 𝑎𝑟𝑒𝑎 = 1−exp(𝑎 × 𝐶𝐷𝐷)
1+𝑏 ×exp(𝑐 × 𝐺𝑁𝐼/ℎ𝑜𝑢𝑠𝑒ℎ𝑜𝑙𝑑) (Eq. 5)
where a, b and c are regression parameters; a is calibrated based on the US market
(denominator assumed to tend to zero at high income) and b and c are given by a calibrated
model by McNeil et Letschert (2010)8.
Service sector penetration at saturation is supposed to depend only on climate (Eq. 6),
where d is a regression parameter.
𝑠ℎ𝑎𝑟𝑒 𝑜𝑓 𝑠𝑒𝑟𝑣𝑖𝑐𝑒 𝑓𝑙𝑜𝑜𝑟 𝑎𝑟𝑒𝑎 𝑐𝑜𝑜𝑙𝑒𝑑 = 1 − exp(𝑑 × 𝐶𝐷𝐷) (Eq. 6)
Both correlations of (Eq. 5) and (Eq. 6) as well as US zones computed from US EIA
residential 2009 microdata and 2012 commercial microdata9 are shown on Figure 12 below.
8 http://www.sciencedirect.com/science/article/pii/S0378778809003119 9 https://www.eia.gov/consumption/
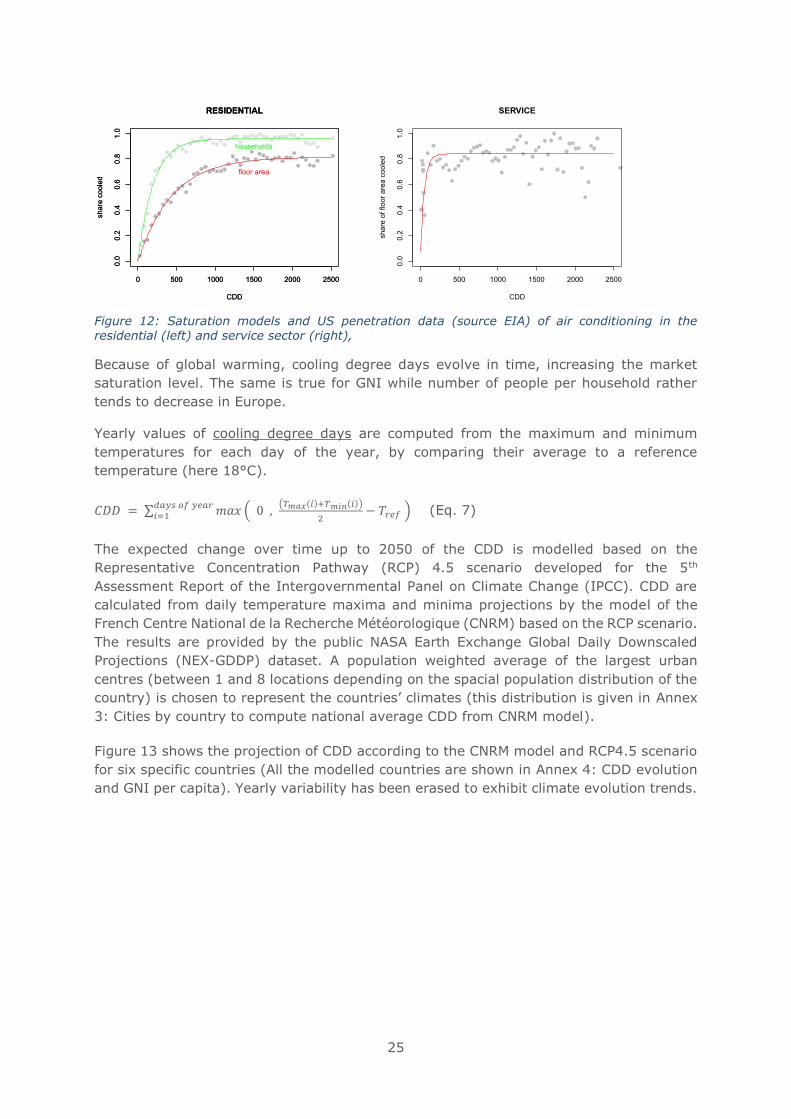
25
Figure 12: Saturation models and US penetration data (source EIA) of air conditioning in the residential (left) and service sector (right),
Because of global warming, cooling degree days evolve in time, increasing the market
saturation level. The same is true for GNI while number of people per household rather
tends to decrease in Europe.
Yearly values of cooling degree days are computed from the maximum and minimum
temperatures for each day of the year, by comparing their average to a reference
temperature (here 18°C).
𝐶𝐷𝐷 = ∑ 𝑚𝑎𝑥 ( 0 ,(𝑇𝑚𝑎𝑥(𝑖)+𝑇𝑚𝑖𝑛(𝑖))
2− 𝑇𝑟𝑒𝑓 )
𝑑𝑎𝑦𝑠 𝑜𝑓 𝑦𝑒𝑎𝑟𝑖=1 (Eq. 7)
The expected change over time up to 2050 of the CDD is modelled based on the
Representative Concentration Pathway (RCP) 4.5 scenario developed for the 5th
Assessment Report of the Intergovernmental Panel on Climate Change (IPCC). CDD are
calculated from daily temperature maxima and minima projections by the model of the
French Centre National de la Recherche Météorologique (CNRM) based on the RCP scenario.
The results are provided by the public NASA Earth Exchange Global Daily Downscaled
Projections (NEX-GDDP) dataset. A population weighted average of the largest urban
centres (between 1 and 8 locations depending on the spacial population distribution of the
country) is chosen to represent the countries’ climates (this distribution is given in Annex
3: Cities by country to compute national average CDD from CNRM model).
Figure 13 shows the projection of CDD according to the CNRM model and RCP4.5 scenario
for six specific countries (All the modelled countries are shown in Annex 4: CDD evolution
and GNI per capita). Yearly variability has been erased to exhibit climate evolution trends.
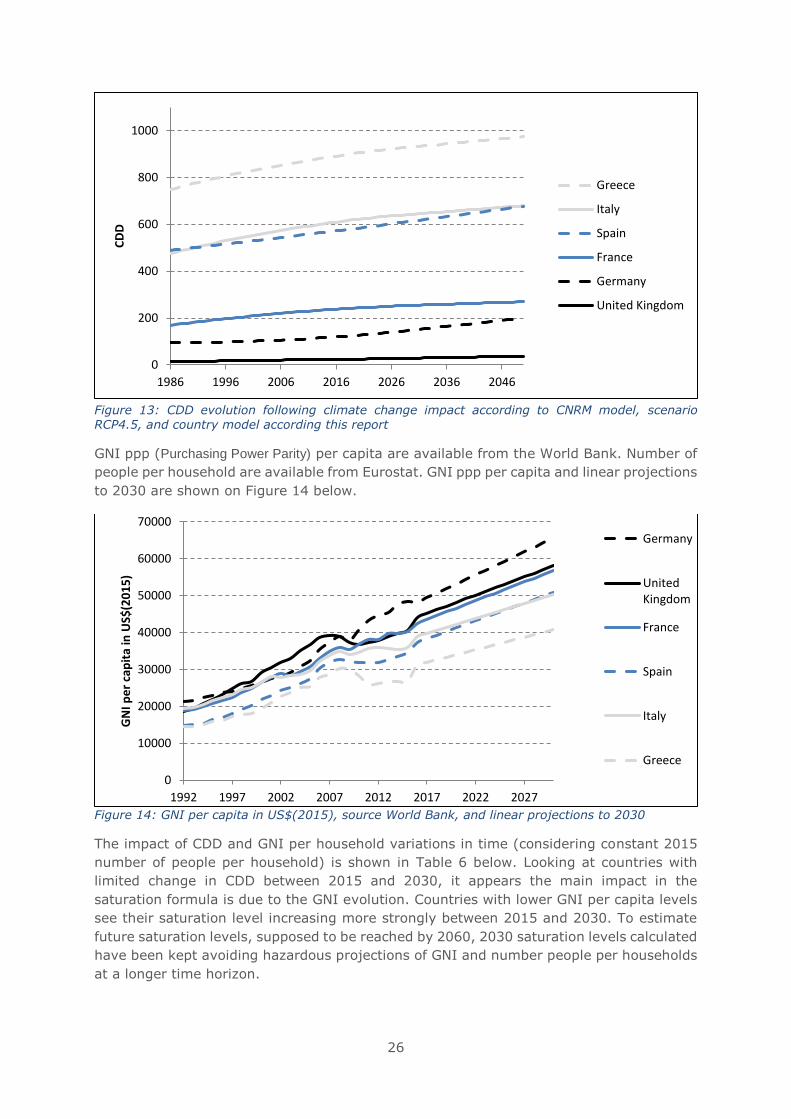
26
Figure 13: CDD evolution following climate change impact according to CNRM model, scenario RCP4.5, and country model according this report
GNI ppp (Purchasing Power Parity) per capita are available from the World Bank. Number of
people per household are available from Eurostat. GNI ppp per capita and linear projections
to 2030 are shown on Figure 14 below.
Figure 14: GNI per capita in US$(2015), source World Bank, and linear projections to 2030
The impact of CDD and GNI per household variations in time (considering constant 2015
number of people per household) is shown in Table 6 below. Looking at countries with
limited change in CDD between 2015 and 2030, it appears the main impact in the
saturation formula is due to the GNI evolution. Countries with lower GNI per capita levels
see their saturation level increasing more strongly between 2015 and 2030. To estimate
future saturation levels, supposed to be reached by 2060, 2030 saturation levels calculated
have been kept avoiding hazardous projections of GNI and number people per households
at a longer time horizon.
0
200
400
600
800
1000
1986 1996 2006 2016 2026 2036 2046
CD
D
Greece
Italy
Spain
France
Germany
United Kingdom
0
10000
20000
30000
40000
50000
60000
70000
1992 1997 2002 2007 2012 2017 2022 2027
GN
I pe
r ca
pit
a in
US$
(20
15
)
Germany
UnitedKingdom
France
Spain
Italy
Greece
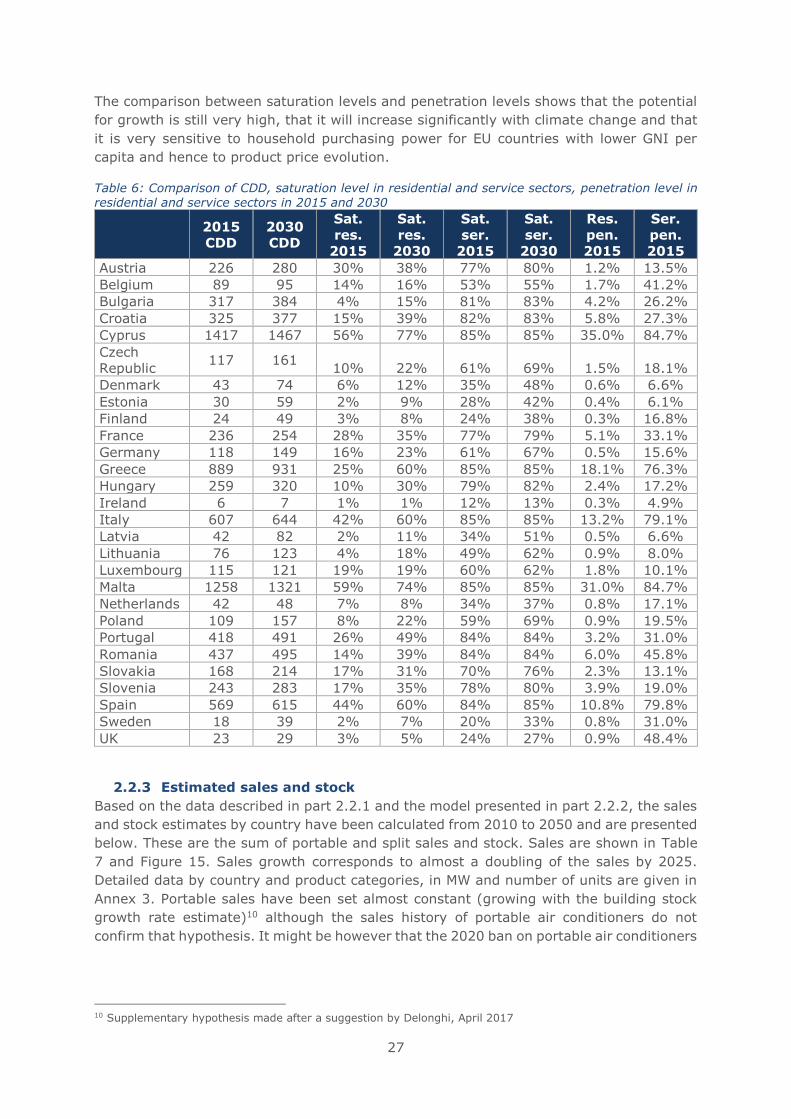
27
The comparison between saturation levels and penetration levels shows that the potential
for growth is still very high, that it will increase significantly with climate change and that
it is very sensitive to household purchasing power for EU countries with lower GNI per
capita and hence to product price evolution.
Table 6: Comparison of CDD, saturation level in residential and service sectors, penetration level in residential and service sectors in 2015 and 2030
2015
CDD
2030
CDD
Sat.
res.
2015
Sat.
res.
2030
Sat.
ser.
2015
Sat.
ser.
2030
Res.
pen.
2015
Ser.
pen.
2015
Austria 226 280 30% 38% 77% 80% 1.2% 13.5%
Belgium 89 95 14% 16% 53% 55% 1.7% 41.2%
Bulgaria 317 384 4% 15% 81% 83% 4.2% 26.2%
Croatia 325 377 15% 39% 82% 83% 5.8% 27.3%
Cyprus 1417 1467 56% 77% 85% 85% 35.0% 84.7%
Czech
Republic 117 161
10% 22% 61% 69% 1.5% 18.1%
Denmark 43 74 6% 12% 35% 48% 0.6% 6.6%
Estonia 30 59 2% 9% 28% 42% 0.4% 6.1%
Finland 24 49 3% 8% 24% 38% 0.3% 16.8%
France 236 254 28% 35% 77% 79% 5.1% 33.1%
Germany 118 149 16% 23% 61% 67% 0.5% 15.6%
Greece 889 931 25% 60% 85% 85% 18.1% 76.3%
Hungary 259 320 10% 30% 79% 82% 2.4% 17.2%
Ireland 6 7 1% 1% 12% 13% 0.3% 4.9%
Italy 607 644 42% 60% 85% 85% 13.2% 79.1%
Latvia 42 82 2% 11% 34% 51% 0.5% 6.6%
Lithuania 76 123 4% 18% 49% 62% 0.9% 8.0%
Luxembourg 115 121 19% 19% 60% 62% 1.8% 10.1%
Malta 1258 1321 59% 74% 85% 85% 31.0% 84.7%
Netherlands 42 48 7% 8% 34% 37% 0.8% 17.1%
Poland 109 157 8% 22% 59% 69% 0.9% 19.5%
Portugal 418 491 26% 49% 84% 84% 3.2% 31.0%
Romania 437 495 14% 39% 84% 84% 6.0% 45.8%
Slovakia 168 214 17% 31% 70% 76% 2.3% 13.1%
Slovenia 243 283 17% 35% 78% 80% 3.9% 19.0%
Spain 569 615 44% 60% 84% 85% 10.8% 79.8%
Sweden 18 39 2% 7% 20% 33% 0.8% 31.0%
UK 23 29 3% 5% 24% 27% 0.9% 48.4%
2.2.3 Estimated sales and stock
Based on the data described in part 2.2.1 and the model presented in part 2.2.2, the sales
and stock estimates by country have been calculated from 2010 to 2050 and are presented
below. These are the sum of portable and split sales and stock. Sales are shown in Table
7 and Figure 15. Sales growth corresponds to almost a doubling of the sales by 2025.
Detailed data by country and product categories, in MW and number of units are given in
Annex 3. Portable sales have been set almost constant (growing with the building stock
growth rate estimate)10 although the sales history of portable air conditioners do not
confirm that hypothesis. It might be however that the 2020 ban on portable air conditioners
10 Supplementary hypothesis made after a suggestion by Delonghi, April 2017
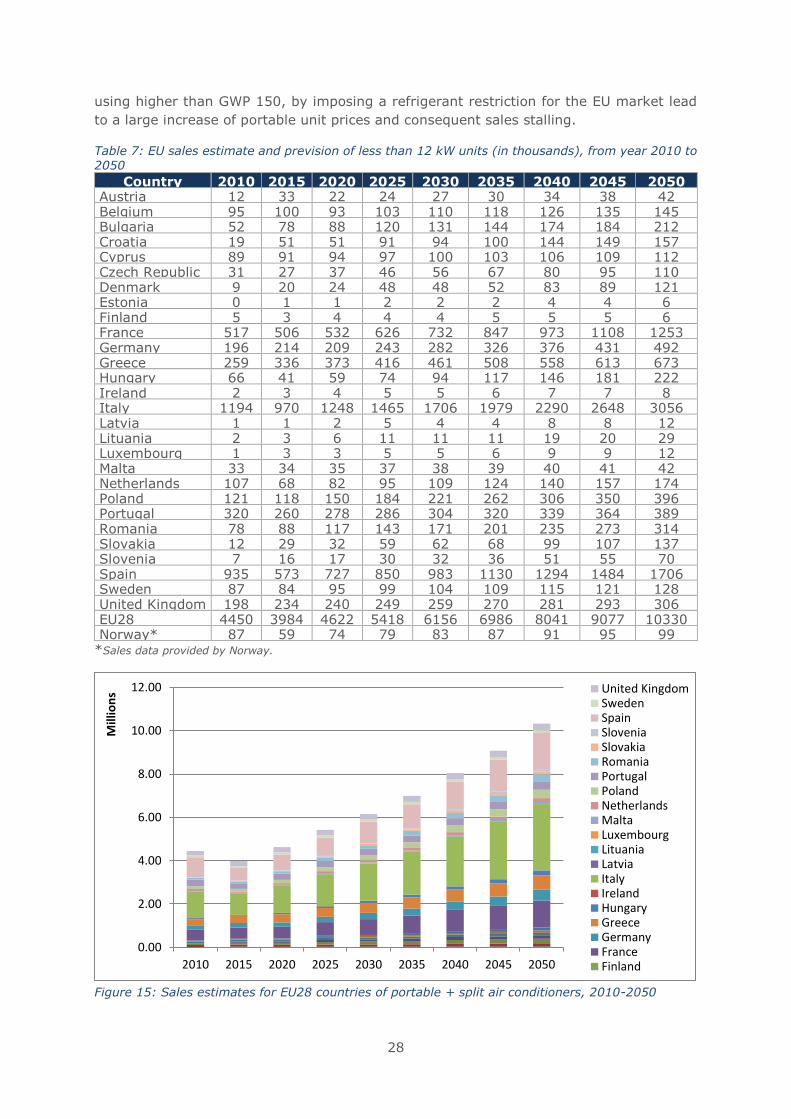
28
using higher than GWP 150, by imposing a refrigerant restriction for the EU market lead
to a large increase of portable unit prices and consequent sales stalling.
Table 7: EU sales estimate and prevision of less than 12 kW units (in thousands), from year 2010 to 2050
Country 2010 2015 2020 2025 2030 2035 2040 2045 2050 Austria 12 33 22 24 27 30 34 38 42 Belgium 95 100 93 103 110 118 126 135 145 Bulgaria 52 78 88 120 131 144 174 184 212 Croatia 19 51 51 91 94 100 144 149 157 Cyprus 89 91 94 97 100 103 106 109 112 Czech Republic 31 27 37 46 56 67 80 95 110 Denmark 9 20 24 48 48 52 83 89 121 Estonia 0 1 1 2 2 2 4 4 6 Finland 5 3 4 4 4 5 5 5 6 France 517 506 532 626 732 847 973 1108 1253 Germany 196 214 209 243 282 326 376 431 492 Greece 259 336 373 416 461 508 558 613 673 Hungary 66 41 59 74 94 117 146 181 222 Ireland 2 3 4 5 5 6 7 7 8 Italy 1194 970 1248 1465 1706 1979 2290 2648 3056 Latvia 1 1 2 5 4 4 8 8 12 Lituania 2 3 6 11 11 11 19 20 29 Luxembourg 1 3 3 5 5 6 9 9 12 Malta 33 34 35 37 38 39 40 41 42 Netherlands 107 68 82 95 109 124 140 157 174 Poland 121 118 150 184 221 262 306 350 396 Portugal 320 260 278 286 304 320 339 364 389 Romania 78 88 117 143 171 201 235 273 314 Slovakia 12 29 32 59 62 68 99 107 137 Slovenia 7 16 17 30 32 36 51 55 70 Spain 935 573 727 850 983 1130 1294 1484 1706 Sweden 87 84 95 99 104 109 115 121 128 United Kingdom 198 234 240 249 259 270 281 293 306 EU28 4450 3984 4622 5418 6156 6986 8041 9077 10330 Norway* 87 59 74 79 83 87 91 95 99
*Sales data provided by Norway.
Figure 15: Sales estimates for EU28 countries of portable + split air conditioners, 2010-2050
0.00
2.00
4.00
6.00
8.00
10.00
12.00
2010 2015 2020 2025 2030 2035 2040 2045 2050
Mill
ion
s United KingdomSwedenSpainSloveniaSlovakiaRomaniaPortugalPolandNetherlandsMaltaLuxembourgLituaniaLatviaItalyIrelandHungaryGreeceGermanyFranceFinland
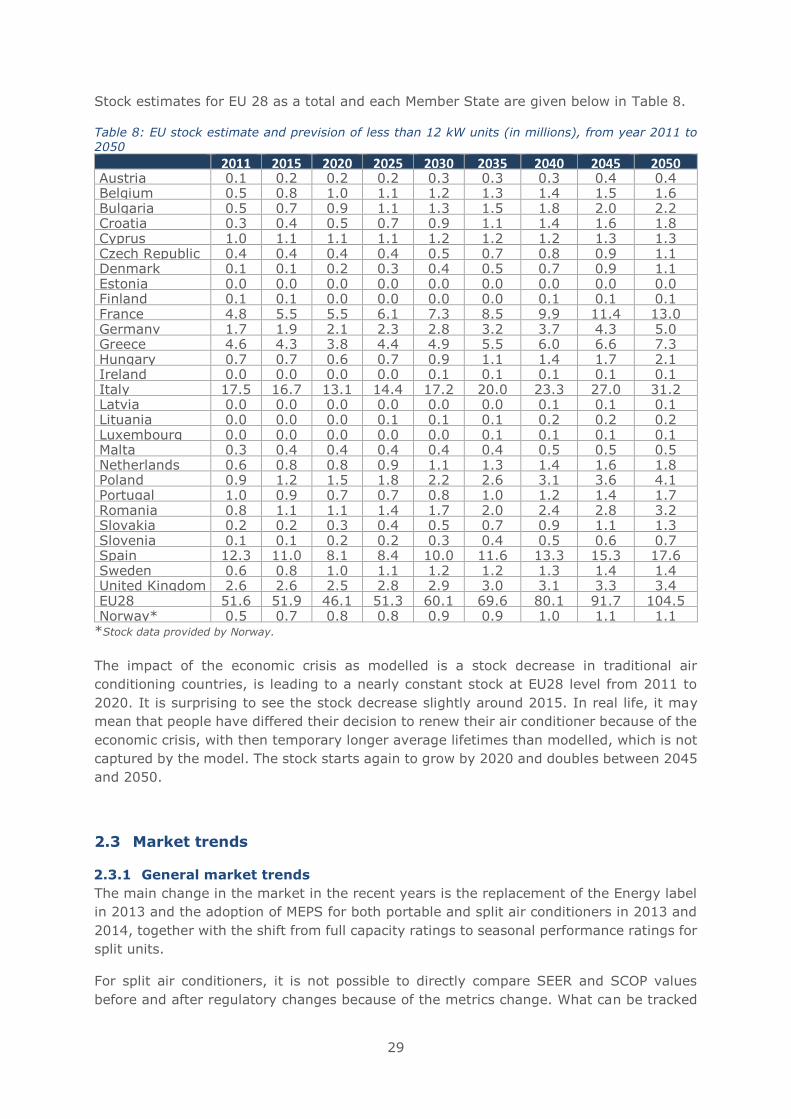
29
Stock estimates for EU 28 as a total and each Member State are given below in Table 8.
Table 8: EU stock estimate and prevision of less than 12 kW units (in millions), from year 2011 to 2050
2011 2015 2020 2025 2030 2035 2040 2045 2050 Austria 0.1 0.2 0.2 0.2 0.3 0.3 0.3 0.4 0.4 Belgium 0.5 0.8 1.0 1.1 1.2 1.3 1.4 1.5 1.6 Bulgaria 0.5 0.7 0.9 1.1 1.3 1.5 1.8 2.0 2.2 Croatia 0.3 0.4 0.5 0.7 0.9 1.1 1.4 1.6 1.8 Cyprus 1.0 1.1 1.1 1.1 1.2 1.2 1.2 1.3 1.3 Czech Republic 0.4 0.4 0.4 0.4 0.5 0.7 0.8 0.9 1.1 Denmark 0.1 0.1 0.2 0.3 0.4 0.5 0.7 0.9 1.1 Estonia 0.0 0.0 0.0 0.0 0.0 0.0 0.0 0.0 0.0 Finland 0.1 0.1 0.0 0.0 0.0 0.0 0.1 0.1 0.1 France 4.8 5.5 5.5 6.1 7.3 8.5 9.9 11.4 13.0 Germany 1.7 1.9 2.1 2.3 2.8 3.2 3.7 4.3 5.0 Greece 4.6 4.3 3.8 4.4 4.9 5.5 6.0 6.6 7.3 Hungary 0.7 0.7 0.6 0.7 0.9 1.1 1.4 1.7 2.1 Ireland 0.0 0.0 0.0 0.0 0.1 0.1 0.1 0.1 0.1 Italy 17.5 16.7 13.1 14.4 17.2 20.0 23.3 27.0 31.2 Latvia 0.0 0.0 0.0 0.0 0.0 0.0 0.1 0.1 0.1 Lituania 0.0 0.0 0.0 0.1 0.1 0.1 0.2 0.2 0.2 Luxembourg 0.0 0.0 0.0 0.0 0.0 0.1 0.1 0.1 0.1 Malta 0.3 0.4 0.4 0.4 0.4 0.4 0.5 0.5 0.5 Netherlands 0.6 0.8 0.8 0.9 1.1 1.3 1.4 1.6 1.8 Poland 0.9 1.2 1.5 1.8 2.2 2.6 3.1 3.6 4.1 Portugal 1.0 0.9 0.7 0.7 0.8 1.0 1.2 1.4 1.7 Romania 0.8 1.1 1.1 1.4 1.7 2.0 2.4 2.8 3.2 Slovakia 0.2 0.2 0.3 0.4 0.5 0.7 0.9 1.1 1.3 Slovenia 0.1 0.1 0.2 0.2 0.3 0.4 0.5 0.6 0.7 Spain 12.3 11.0 8.1 8.4 10.0 11.6 13.3 15.3 17.6 Sweden 0.6 0.8 1.0 1.1 1.2 1.2 1.3 1.4 1.4 United Kingdom 2.6 2.6 2.5 2.8 2.9 3.0 3.1 3.3 3.4 EU28 51.6 51.9 46.1 51.3 60.1 69.6 80.1 91.7 104.5 Norway* 0.5 0.7 0.8 0.8 0.9 0.9 1.0 1.1 1.1
*Stock data provided by Norway.
The impact of the economic crisis as modelled is a stock decrease in traditional air
conditioning countries, is leading to a nearly constant stock at EU28 level from 2011 to
2020. It is surprising to see the stock decrease slightly around 2015. In real life, it may
mean that people have differed their decision to renew their air conditioner because of the
economic crisis, with then temporary longer average lifetimes than modelled, which is not
captured by the model. The stock starts again to grow by 2020 and doubles between 2045
and 2050.
2.3 Market trends
2.3.1 General market trends
The main change in the market in the recent years is the replacement of the Energy label
in 2013 and the adoption of MEPS for both portable and split air conditioners in 2013 and
2014, together with the shift from full capacity ratings to seasonal performance ratings for
split units.
For split air conditioners, it is not possible to directly compare SEER and SCOP values
before and after regulatory changes because of the metrics change. What can be tracked
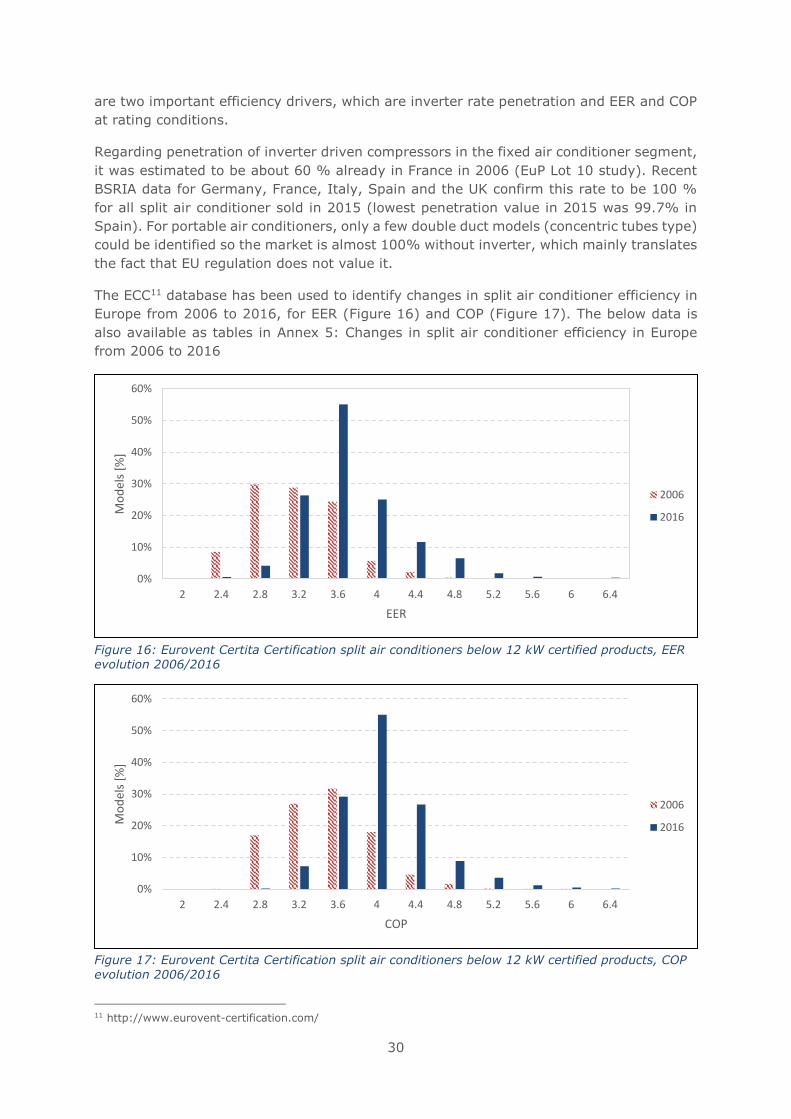
30
are two important efficiency drivers, which are inverter rate penetration and EER and COP
at rating conditions.
Regarding penetration of inverter driven compressors in the fixed air conditioner segment,
it was estimated to be about 60 % already in France in 2006 (EuP Lot 10 study). Recent
BSRIA data for Germany, France, Italy, Spain and the UK confirm this rate to be 100 %
for all split air conditioner sold in 2015 (lowest penetration value in 2015 was 99.7% in
Spain). For portable air conditioners, only a few double duct models (concentric tubes type)
could be identified so the market is almost 100% without inverter, which mainly translates
the fact that EU regulation does not value it.
The ECC11 database has been used to identify changes in split air conditioner efficiency in
Europe from 2006 to 2016, for EER (Figure 16) and COP (Figure 17). The below data is
also available as tables in Annex 5: Changes in split air conditioner efficiency in Europe
from 2006 to 2016
Figure 16: Eurovent Certita Certification split air conditioners below 12 kW certified products, EER evolution 2006/2016
Figure 17: Eurovent Certita Certification split air conditioners below 12 kW certified products, COP
evolution 2006/2016
11 http://www.eurovent-certification.com/
0%
10%
20%
30%
40%
50%
60%
2 2.4 2.8 3.2 3.6 4 4.4 4.8 5.2 5.6 6 6.4
Mo
del
s [%
]
EER
2006
2016
0%
10%
20%
30%
40%
50%
60%
2 2.4 2.8 3.2 3.6 4 4.4 4.8 5.2 5.6 6 6.4
Mo
del
s [%
]
COP
2006
2016
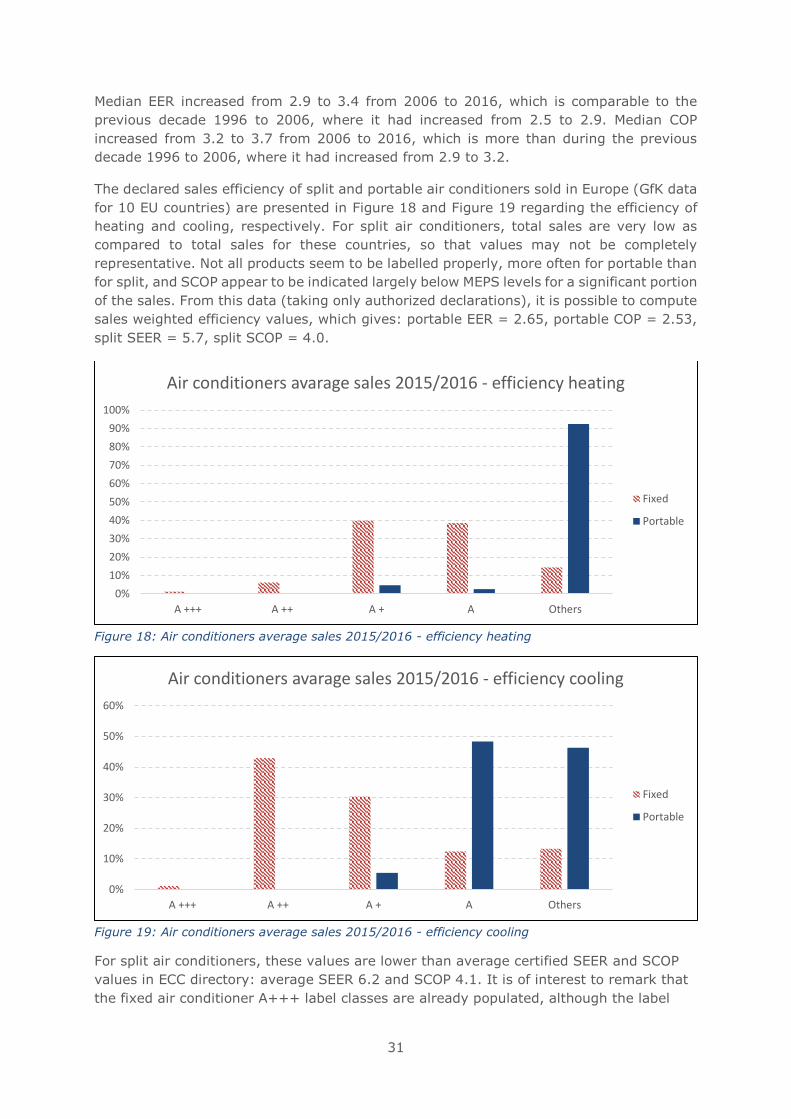
31
Median EER increased from 2.9 to 3.4 from 2006 to 2016, which is comparable to the
previous decade 1996 to 2006, where it had increased from 2.5 to 2.9. Median COP
increased from 3.2 to 3.7 from 2006 to 2016, which is more than during the previous
decade 1996 to 2006, where it had increased from 2.9 to 3.2.
The declared sales efficiency of split and portable air conditioners sold in Europe (GfK data
for 10 EU countries) are presented in Figure 18 and Figure 19 regarding the efficiency of
heating and cooling, respectively. For split air conditioners, total sales are very low as
compared to total sales for these countries, so that values may not be completely
representative. Not all products seem to be labelled properly, more often for portable than
for split, and SCOP appear to be indicated largely below MEPS levels for a significant portion
of the sales. From this data (taking only authorized declarations), it is possible to compute
sales weighted efficiency values, which gives: portable EER = 2.65, portable COP = 2.53,
split SEER = 5.7, split SCOP = 4.0.
Figure 18: Air conditioners average sales 2015/2016 - efficiency heating
Figure 19: Air conditioners average sales 2015/2016 - efficiency cooling
For split air conditioners, these values are lower than average certified SEER and SCOP
values in ECC directory: average SEER 6.2 and SCOP 4.1. It is of interest to remark that
the fixed air conditioner A+++ label classes are already populated, although the label
0%
10%
20%
30%
40%
50%
60%
70%
80%
90%
100%
A +++ A ++ A + A Others
Air conditioners avarage sales 2015/2016 - efficiency heating
Fixed
Portable
0%
10%
20%
30%
40%
50%
60%
A +++ A ++ A + A Others
Air conditioners avarage sales 2015/2016 - efficiency cooling
Fixed
Portable
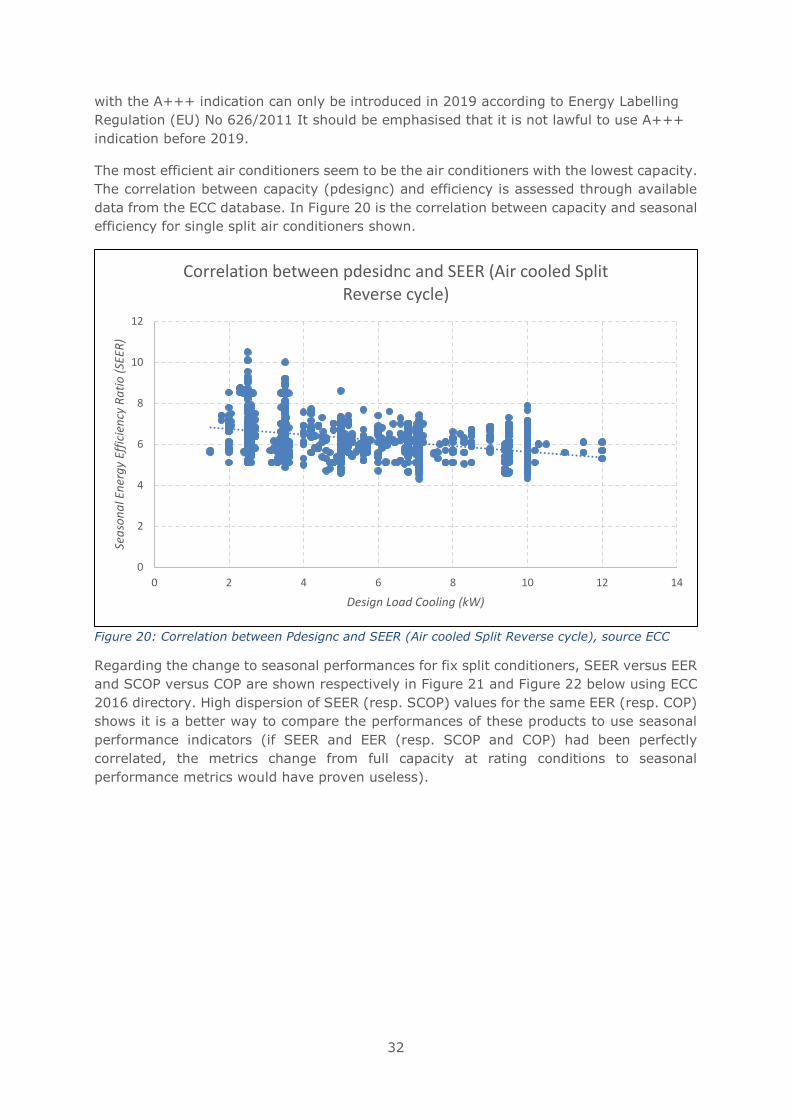
32
with the A+++ indication can only be introduced in 2019 according to Energy Labelling
Regulation (EU) No 626/2011 It should be emphasised that it is not lawful to use A+++
indication before 2019.
The most efficient air conditioners seem to be the air conditioners with the lowest capacity.
The correlation between capacity (pdesignc) and efficiency is assessed through available
data from the ECC database. In Figure 20 is the correlation between capacity and seasonal
efficiency for single split air conditioners shown.
Figure 20: Correlation between Pdesignc and SEER (Air cooled Split Reverse cycle), source ECC
Regarding the change to seasonal performances for fix split conditioners, SEER versus EER
and SCOP versus COP are shown respectively in Figure 21 and Figure 22 below using ECC
2016 directory. High dispersion of SEER (resp. SCOP) values for the same EER (resp. COP)
shows it is a better way to compare the performances of these products to use seasonal
performance indicators (if SEER and EER (resp. SCOP and COP) had been perfectly
correlated, the metrics change from full capacity at rating conditions to seasonal
performance metrics would have proven useless).
0
2
4
6
8
10
12
0 2 4 6 8 10 12 14
Sea
son
al E
ner
gy
Effi
cien
cy R
ati
o (
SEER
)
Design Load Cooling (kW)
Correlation between pdesidnc and SEER (Air cooled Split Reverse cycle)
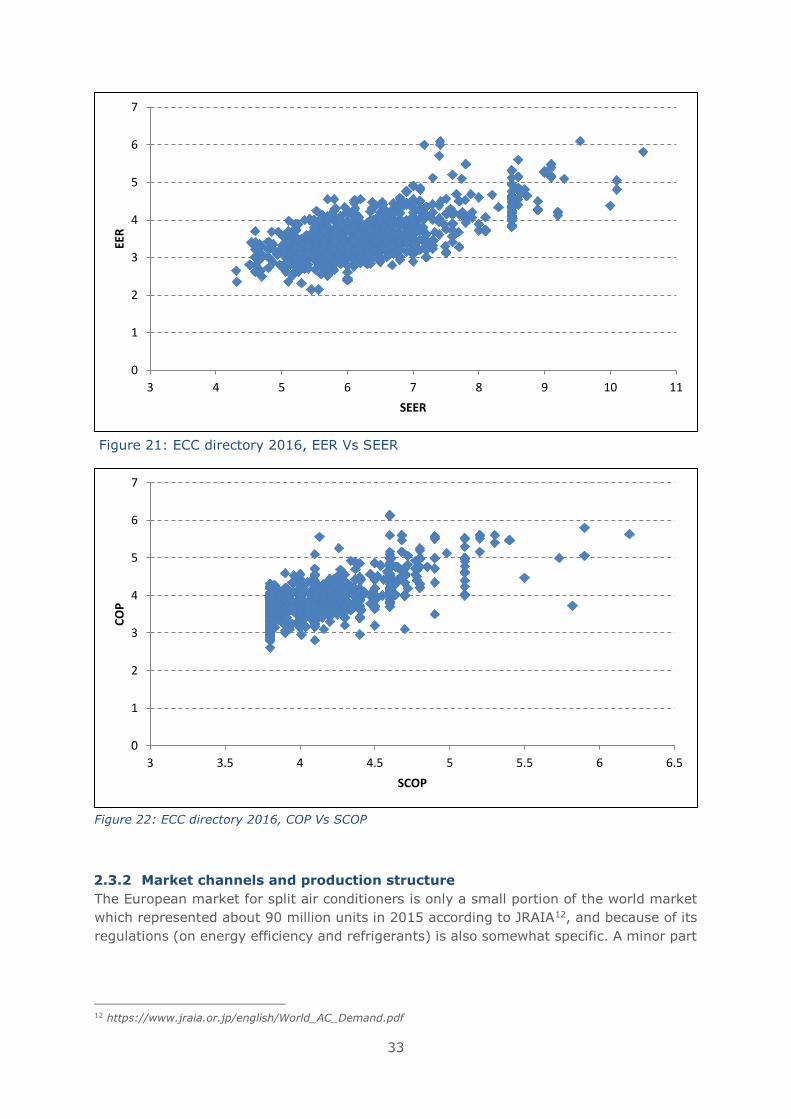
33
Figure 21: ECC directory 2016, EER Vs SEER
Figure 22: ECC directory 2016, COP Vs SCOP
2.3.2 Market channels and production structure
The European market for split air conditioners is only a small portion of the world market
which represented about 90 million units in 2015 according to JRAIA12, and because of its
regulations (on energy efficiency and refrigerants) is also somewhat specific. A minor part
12 https://www.jraia.or.jp/english/World_AC_Demand.pdf
0
1
2
3
4
5
6
7
3 4 5 6 7 8 9 10 11
EER
SEER
0
1
2
3
4
5
6
7
3 3.5 4 4.5 5 5.5 6 6.5
CO
P
SCOP
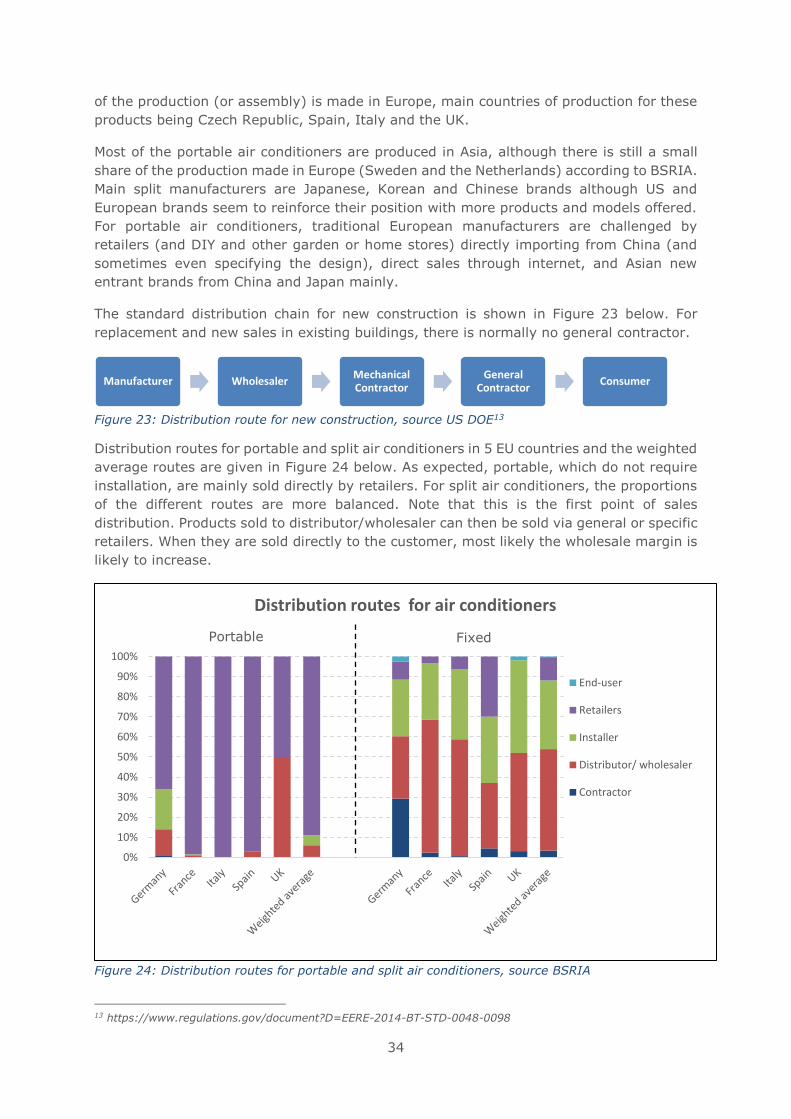
34
of the production (or assembly) is made in Europe, main countries of production for these
products being Czech Republic, Spain, Italy and the UK.
Most of the portable air conditioners are produced in Asia, although there is still a small
share of the production made in Europe (Sweden and the Netherlands) according to BSRIA.
Main split manufacturers are Japanese, Korean and Chinese brands although US and
European brands seem to reinforce their position with more products and models offered.
For portable air conditioners, traditional European manufacturers are challenged by
retailers (and DIY and other garden or home stores) directly importing from China (and
sometimes even specifying the design), direct sales through internet, and Asian new
entrant brands from China and Japan mainly.
The standard distribution chain for new construction is shown in Figure 23 below. For
replacement and new sales in existing buildings, there is normally no general contractor.
Figure 23: Distribution route for new construction, source US DOE13
Distribution routes for portable and split air conditioners in 5 EU countries and the weighted
average routes are given in Figure 24 below. As expected, portable, which do not require
installation, are mainly sold directly by retailers. For split air conditioners, the proportions
of the different routes are more balanced. Note that this is the first point of sales
distribution. Products sold to distributor/wholesaler can then be sold via general or specific
retailers. When they are sold directly to the customer, most likely the wholesale margin is
likely to increase.
Figure 24: Distribution routes for portable and split air conditioners, source BSRIA
13 https://www.regulations.gov/document?D=EERE-2014-BT-STD-0048-0098
Manufacturer WholesalerMechanical Contractor
General Contractor
Consumer
0%
10%
20%
30%
40%
50%
60%
70%
80%
90%
100%
Distribution routes for air conditioners
End-user
Retailers
Installer
Distributor/ wholesaler
Contractor
Portable Fixed
35
2.3.3 Trends in product design and features
Beside energy efficiency, the trends in product design identified mainly regard alternative
refrigerants, sound power (driven by Regulation (EU) No 206/2012) and "smart" functions.
The trend to include more air treatment functions observed in EuP Lot 10 study is more or
less generalised, such as dehumidification, fan only, cooling, heating and air purification.
2.3.3.1 Low GWP refrigerant
The planned ban of certain refrigerants by F-gas Regulation (EU) No 517/2014 with higher
than 750 values for split air conditioners in 2025 (resp. 150 for portable in 2020) is an
important motivation to adopt compatible refrigerant fluids. However, the answer is
different in both product segments.
In the split segment, there seems to be a clear trend. Daikin first, and now other Japanese
manufacturers are progressively converting their R410A split product range to R32 (it can
be noticed that not only single split products are proposed with R32 but also multisplit,
despite the ban only regards single split products). It is still the beginning of the conversion
however. In 2016, sales of R32 split are estimated to about 5 %, which is also the
proportion of models declared with R32 in the ECC14 directory. Basing on the ECC product
database, it seems there is no product using the GWP bonus (allowing an 8 % lower SEER
for split air conditioners) to enter the market with alternative refrigerant fluids. Instead,
R32 products are put on the market at the same capacity, efficiency and price as middle
efficiency or premium R410A units. It thus seems that the impact of the GWP bonus has
been null or negligible.
In the portable segment, one company already proposed propane products in 2006 and
still does15. But there does not seem to be other competitor using alternative refrigerants
compatible with the 2020 ban (GWP lower than 150) yet. Information on refrigerant in
portable air conditioners is surprising (Table 9) for several reasons. First, not all
refrigerants are known, while a refrigerant information label is required by Regulation (EU)
517/2014 for fluorinated gases. Secondly, it is prohibited to sell R22 products in Europe.
Third, there are R32 products being sold also for the portable segment although this is not
a viable option for the 2020 ban; this is probably a product developed for other markets
and imported (Japan for instance). Above that, the share of post ban compatible refrigerant
(propane here) is also about 5 % as for split air conditioners. This market is then late for
its conversion (because the ban is already in 2020 versus 2025 for split air conditioners).
According to experience from a company, it may prove difficult to find reasonably
expensive propane compressor manufacturers as at the moment demand volumes are very
limited (when compared to global sales)16. Thus, the portable air conditioning is likely to
adopt other than propane solutions for its conversion, most likely pure HFO or HFC/HFO
mixtures with high HFO proportions.
14 www.eurovent-certification.com 15 Consultation with Delonghi, April 2017 16 Consultation with Delonghi, April 2017
36
Table 9: Distribution of refrigerants in air conditioners sold, source GfK
Refrigerant Fixed average
share
2015/2016
Portable average
share
2015/2016
% %
R 407 C - 2.8%
R 410 A 96.3% 74.8%
R 290 - 5.5%
R 22 - 0.04%
R 32 0.4% 0.4%
<Others> 3.4% 16.4%
With the implementation of the F-gas regulation and the suggested removal of the bonus
systems, the only incitement to promote refrigerants with very low GWP i.e. < 150 is the
phase down schedule.
It can be discussed if this is sufficient and whether the GWP of the refrigerant should be
included with a different approach. A possible solution could be the Total Equivalent
Warming Impact methodology (TEWI)17. This methodology compares the impact of the
refrigerant leakage and the electricity used. In this matter, the equipment is rated
according to its total environmental impact and promotes low GWP refrigerants and
efficient equipment. The TEWI is calculated by the below equation (defined in Europe in
Standard EN378-1):
𝑇𝐸𝑊𝐼 = 𝐺𝑊𝑃 × 𝐿 × 𝑛 + 𝐺𝑊𝑃 × 𝑚 × (1 − 𝛼) + 𝑛 × 𝐸 × 𝛽
Where:
• GWP is the refrigerant Global Warming Potential (kg CO2/kg refrigerant)
• L is the annual leakage rate [kg/year]
• n is the systems operating lifetime [years]
• m is the refrigerant charge [kg]
• is the recycling factor [%]
• E is the annual energy consumption [kWh/year]
• β is CO2 emissions on energy generation [kg CO2/kWh]
2.3.3.2 Noise
Ecodesign Regulation (EU) No 206/2012 on air conditioners also has requirement
regarding maximum sound power level of indoor (60 dB(A) for ≤ 6 kW and 65 dB(A) for
> 6 kW) and outdoor units (65 dB(A) for ≤ 6 kW, 70 dB(A) for >6 kW). The reduction in
noise level due to ecodesign is visible when comparing 2006 and 2016 data for both
outdoor (Figure 25) and indoor units (Figure 26).
17 http://docs.lib.purdue.edu/cgi/viewcontent.cgi?article=1708&context=iracc
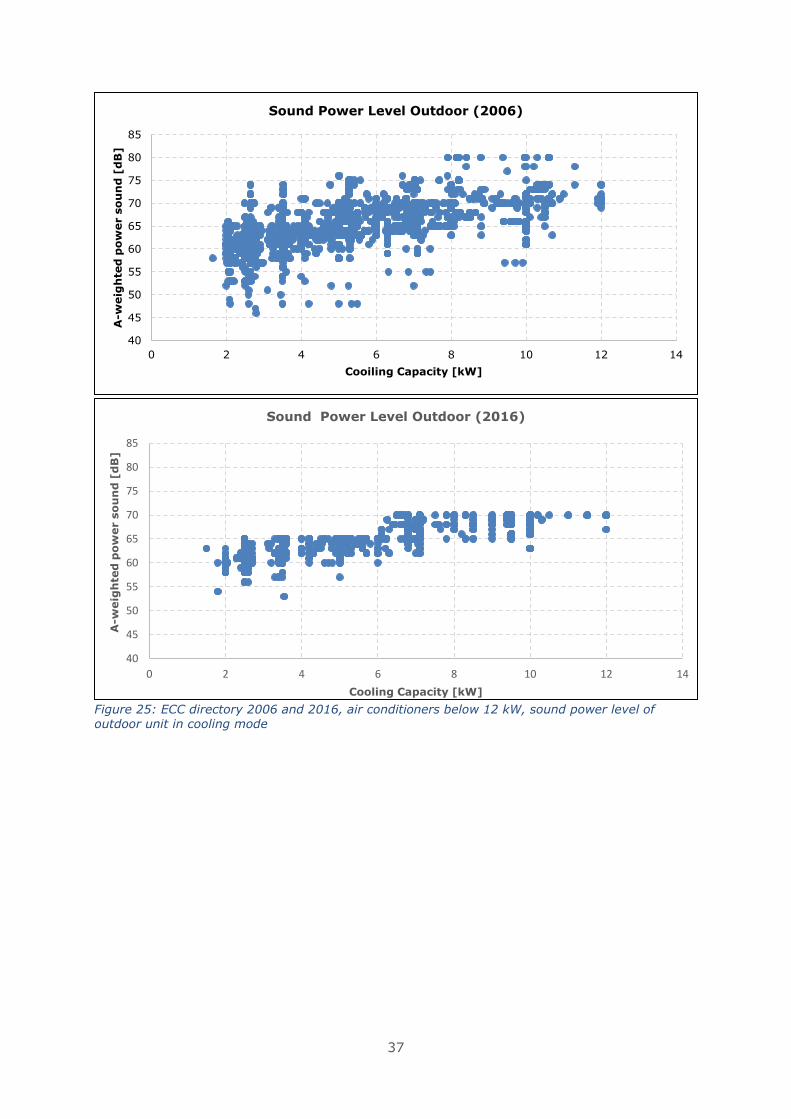
37
Figure 25: ECC directory 2006 and 2016, air conditioners below 12 kW, sound power level of outdoor unit in cooling mode
40
45
50
55
60
65
70
75
80
85
0 2 4 6 8 10 12 14
A-w
eig
hte
d p
ow
er s
ou
nd
[d
B]
Cooiling Capacity [kW]
Sound Power Level Outdoor (2006)
40
45
50
55
60
65
70
75
80
85
0 2 4 6 8 10 12 14
A-w
eig
hte
d p
ow
er s
ou
nd
[d
B]
Cooling Capacity [kW]
Sound Power Level Outdoor (2016)
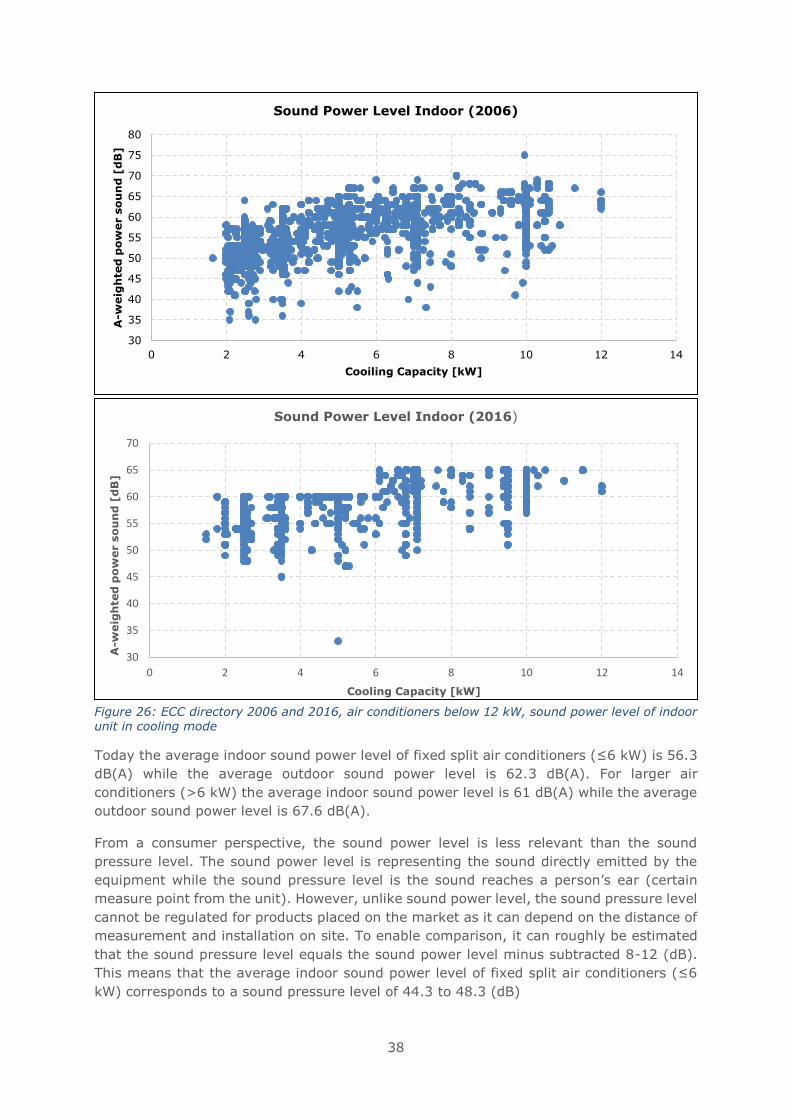
38
Figure 26: ECC directory 2006 and 2016, air conditioners below 12 kW, sound power level of indoor unit in cooling mode
Today the average indoor sound power level of fixed split air conditioners (≤6 kW) is 56.3
dB(A) while the average outdoor sound power level is 62.3 dB(A). For larger air
conditioners (>6 kW) the average indoor sound power level is 61 dB(A) while the average
outdoor sound power level is 67.6 dB(A).
From a consumer perspective, the sound power level is less relevant than the sound
pressure level. The sound power level is representing the sound directly emitted by the
equipment while the sound pressure level is the sound reaches a person’s ear (certain
measure point from the unit). However, unlike sound power level, the sound pressure level
cannot be regulated for products placed on the market as it can depend on the distance of
measurement and installation on site. To enable comparison, it can roughly be estimated
that the sound pressure level equals the sound power level minus subtracted 8-12 (dB).
This means that the average indoor sound power level of fixed split air conditioners (≤6
kW) corresponds to a sound pressure level of 44.3 to 48.3 (dB)
30
35
40
45
50
55
60
65
70
75
80
0 2 4 6 8 10 12 14
A-w
eig
hte
d p
ow
er s
ou
nd
[d
B]
Cooiling Capacity [kW]
Sound Power Level Indoor (2006)
30
35
40
45
50
55
60
65
70
0 2 4 6 8 10 12 14
A-w
eig
hte
d p
ow
er s
ou
nd
[d
B]
Cooling Capacity [kW]
Sound Power Level Indoor (2016)
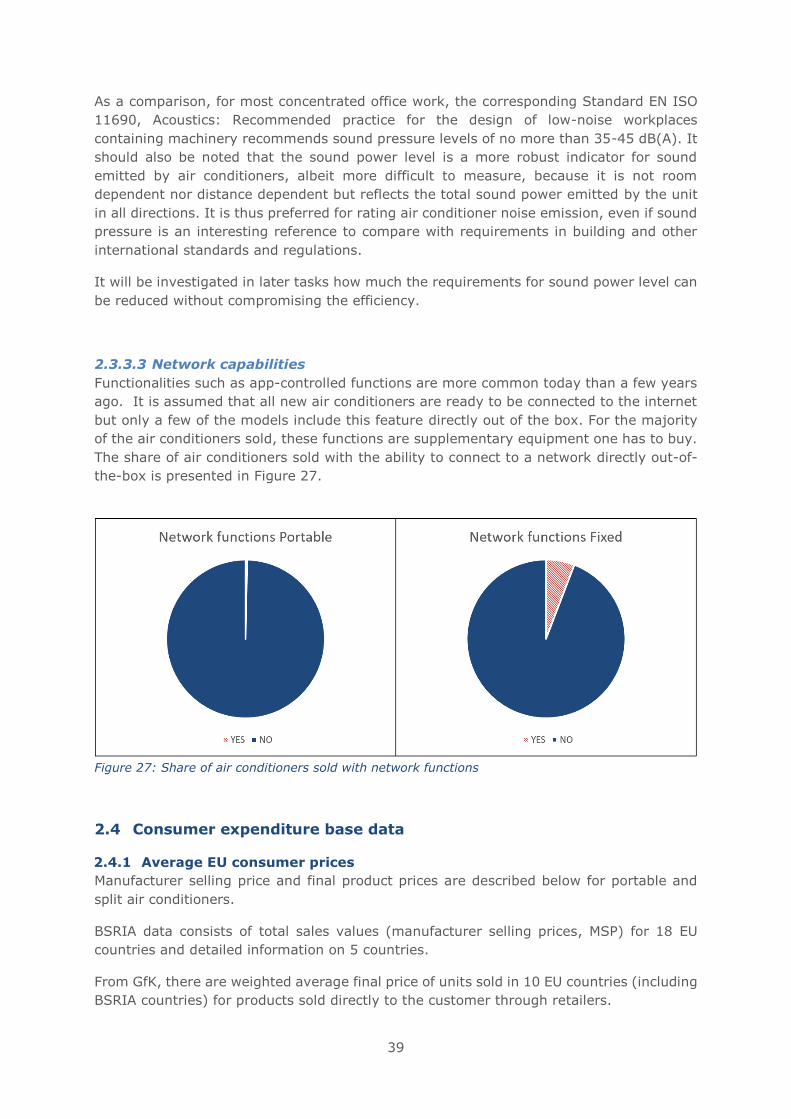
39
As a comparison, for most concentrated office work, the corresponding Standard EN ISO
11690, Acoustics: Recommended practice for the design of low-noise workplaces
containing machinery recommends sound pressure levels of no more than 35-45 dB(A). It
should also be noted that the sound power level is a more robust indicator for sound
emitted by air conditioners, albeit more difficult to measure, because it is not room
dependent nor distance dependent but reflects the total sound power emitted by the unit
in all directions. It is thus preferred for rating air conditioner noise emission, even if sound
pressure is an interesting reference to compare with requirements in building and other
international standards and regulations.
It will be investigated in later tasks how much the requirements for sound power level can
be reduced without compromising the efficiency.
2.3.3.3 Network capabilities
Functionalities such as app-controlled functions are more common today than a few years
ago. It is assumed that all new air conditioners are ready to be connected to the internet
but only a few of the models include this feature directly out of the box. For the majority
of the air conditioners sold, these functions are supplementary equipment one has to buy.
The share of air conditioners sold with the ability to connect to a network directly out-of-
the-box is presented in Figure 27.
Figure 27: Share of air conditioners sold with network functions
2.4 Consumer expenditure base data
2.4.1 Average EU consumer prices
Manufacturer selling price and final product prices are described below for portable and
split air conditioners.
BSRIA data consists of total sales values (manufacturer selling prices, MSP) for 18 EU
countries and detailed information on 5 countries.
From GfK, there are weighted average final price of units sold in 10 EU countries (including
BSRIA countries) for products sold directly to the customer through retailers.
40
In BSRIA data for portable air conditioners, there appears large variations in
manufacturing selling price depending on countries, average MSP for Germany is 393
euros, France 201 euros, 276 for Italy, 338 for Spain and 490 for the UK. Similar trends
have been found via online research of various online retail platforms from different
countries, the UK seems to have higher prices for portable air conditioners in general. This
probably reflects to a certain extent the different types of products sold in each country
(whether more or less capacity or higher or lower efficiency) and brands' market shares.
The weighted average manufacturer selling price across 18 EU countries according BSRIA
is 342 euros (Table 10), however, the average product size of product sold is not known
for all 18 EU countries, therefore the MSP or final product price ratio per kW is not derived.
It can be noticed in BSRIA data, prices are starting to increase again after a large drop
from 2005 to 2014.
GfK data for average final product price including VAT and retailer margin is 355 euros;
with an average size of 2.6 kW this corresponds to about 135 euros /kW (Table 10). Note
that GfK values correspond to much lower values than BSRIA estimates: removing 20 %
VAT and a typical 40 % retailer margin (see mark-up analysis hereafter at the end of
paragraph 2.4.1), the manufacturer selling price corresponds to 210 euros, versus 342
euros for BSRIA. Online research based on various retail platform from 7 countries18 show
also deviations from GfK data, with an average of 460 euros. Datasets on portable air
conditioners prices seems to deviate from each other.
BSRIA dataset contains likely more than only residential air conditioners and may be
missing a part of the low-cost market available through retailers. On the other hand, GfK
prices may underestimate the average price as other distribution routes apart from retails
are significant in Germany and in the UK for instance. It seems however more reasonable
to use the GfK estimate in the rest of the studies as residential air conditioners bought via
retailers is the most current situation, and the average capacity is known for the derived
prices. The final manufacturer selling price of 81 Euros per kW is coherent with the 82
Euros per kW (Price sold: 162 USD/kW, corrected for change rate USD/Euro 2014 of 1.33,
US retailer margin 1.39 and sales taxes of 1.07) hypothesis of the US DOE in the technical
support document of the final ruling proposal of portable air conditioners (based on 2014
price and mark-up information)19. It can also be noticed that according this same study,
the price per kW of double duct products is similar to the one of single duct air conditioners
(74 Euros/kW against 82 Euros/kW for single duct), with only slightly higher average
cooling capacity (3.4 kW against 2.8 kW).
Table 10: Estimated manufacturer selling price and final product price of portable air conditioners, based on data from BSRIA and GfK
BSRIA data GfK data
Manufacturer selling price weighted average (Euros) 342 210 (2.6 kW)
Manufacturer selling price ratio (Euros per kW) - 81
Average final product price (Euros) - 355 (2.6 kW)
Final product price ratio (Euros per kW) - 135
18 Spain, Italy, the UK, Netherlands, France, Germany, Denmark 19 https://www1.eere.energy.gov/buildings/appliance_standards/standards.aspx?productid=65
41
Regarding the prices of fixed split air conditioners, according to BSRIA data, there are
also important price variations, with the same countries exhibiting high prices and low
prices as for portable. An average fixed split air conditioner costs 1181 euros in Germany,
746 in France, 719 in Italy, 548 in Spain and 1264 in the UK. The weighted average
manufacturer selling price across 18 EU countries is of 704 euros (Table 11), or 154 Euros/
kW with the average unit size of 4.6 kW (weighting sales below 5 kW with anaverage size
of 3.5 kW unit and sales above 5 kW with an average size of 7.5 kW unit). This was 195
euros / kW in EuP Lot 10 study. This represents a 21 % price decrease in 10 years.
However, BSRIA expects the price to increase in the coming years with the renewed growth
of the construction sector. The product category has much influence on the price per kW.
According BSRIA, smaller split units have lower price per kW. With an average size of split
below 5 kW, e.g. a 3.5 kW unit, the manufacturer selling price is 138 euros/kW. Above 5
kW, using a 7.1 kW average product, the ratio is 165 euros/kW.
GfK data indicates final price values of about 180 euros/kW through retailer channel. When
removing 20% VAT and retailer margin (36 % value used here), this results only 110
euros/ kW as manufacturer selling price (Table 11).
The difference between the prices derived from BSRIA and GfK data is likely due to the
difference in product type (GfK distribution gives more weight to smaller products with
higher share of single split wall units), but also due to the difference in product distribution
types as manufacturer selling price varies depending on the distribution routes.
Table 11: Estimated manufacturer selling price of fix (split and multi-split) air conditioners, based on
data from BSRIA and GfK
BSRIA data GfK data
Manufacturer selling price weighted average (Euros) 704 (4.6 kW) 375(3.5kW)
Manufacturer selling price ratio (Euros per kW) 154 110
Average final product price (Euros) - 630 (3.5kW)
Final product price ratio (Euros per kW) - 180
We attempted above to compare manufacturer selling price seen as a constant value above
which a variable margin applied depending on destination. This is the US model developed
right after. However, BSRIA statistics does not give this value, but the compound value of
the product sold to its first buyer (that can be retail, wholesaler, installer, contractor or
end-user). For a manufacturer, selling directly to an installer enables to increase its margin
of the money given to the wholesaler in the complete value chain. We evaluated this
maximum gain based on mark-up values indicated in Table 12 and the product distribution
routes in Figure 24: this leads to a 20 % increase in manufacturer selling price (18 %
below 5 kW and 25 % above, when specifying the different distribution channels by size).
Hence, the weighted average BSRIA manufacturer selling price is now close to 128 (117
for less than 5 kW units and 132 for higher than 5 kW units) and thus closer to the estimate
from GfK value.
However, there is still some differences to be explained: GfK retail final price for single
split wall unit is 512 euros, however, the unit size is not known. Using again average BSRIA
product size and GfK product type distribution, the average wall unit type product size in
GfK data is probably about 3.4 kW, which gives when accounting for 36% retailer markup
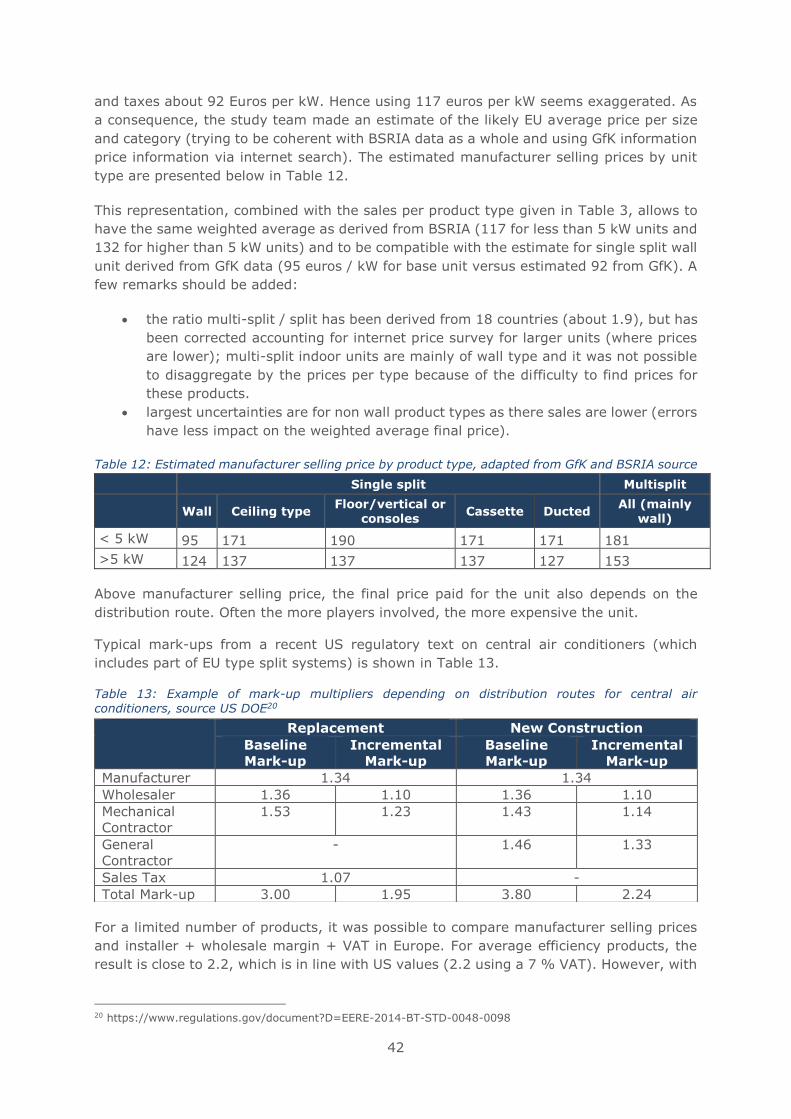
42
and taxes about 92 Euros per kW. Hence using 117 euros per kW seems exaggerated. As
a consequence, the study team made an estimate of the likely EU average price per size
and category (trying to be coherent with BSRIA data as a whole and using GfK information
price information via internet search). The estimated manufacturer selling prices by unit
type are presented below in Table 12.
This representation, combined with the sales per product type given in Table 3, allows to
have the same weighted average as derived from BSRIA (117 for less than 5 kW units and
132 for higher than 5 kW units) and to be compatible with the estimate for single split wall
unit derived from GfK data (95 euros / kW for base unit versus estimated 92 from GfK). A
few remarks should be added:
• the ratio multi-split / split has been derived from 18 countries (about 1.9), but has
been corrected accounting for internet price survey for larger units (where prices
are lower); multi-split indoor units are mainly of wall type and it was not possible
to disaggregate by the prices per type because of the difficulty to find prices for
these products.
• largest uncertainties are for non wall product types as there sales are lower (errors
have less impact on the weighted average final price).
Table 12: Estimated manufacturer selling price by product type, adapted from GfK and BSRIA source
Single split Multisplit
Wall Ceiling type Floor/vertical or
consoles Cassette Ducted
All (mainly wall)
< 5 kW 95 171 190 171 171 181
>5 kW 124 137 137 137 127 153
Above manufacturer selling price, the final price paid for the unit also depends on the
distribution route. Often the more players involved, the more expensive the unit.
Typical mark-ups from a recent US regulatory text on central air conditioners (which
includes part of EU type split systems) is shown in Table 13.
Table 13: Example of mark-up multipliers depending on distribution routes for central air conditioners, source US DOE20
For a limited number of products, it was possible to compare manufacturer selling prices
and installer + wholesale margin + VAT in Europe. For average efficiency products, the
result is close to 2.2, which is in line with US values (2.2 using a 7 % VAT). However, with
20 https://www.regulations.gov/document?D=EERE-2014-BT-STD-0048-0098
Replacement New Construction
Baseline
Mark-up
Incremental
Mark-up
Baseline
Mark-up
Incremental
Mark-up
Manufacturer 1.34 1.34
Wholesaler 1.36 1.10 1.36 1.10
Mechanical
Contractor
1.53 1.23 1.43 1.14
General
Contractor
- 1.46 1.33
Sales Tax 1.07 -
Total Mark-up 3.00 1.95 3.80 2.24
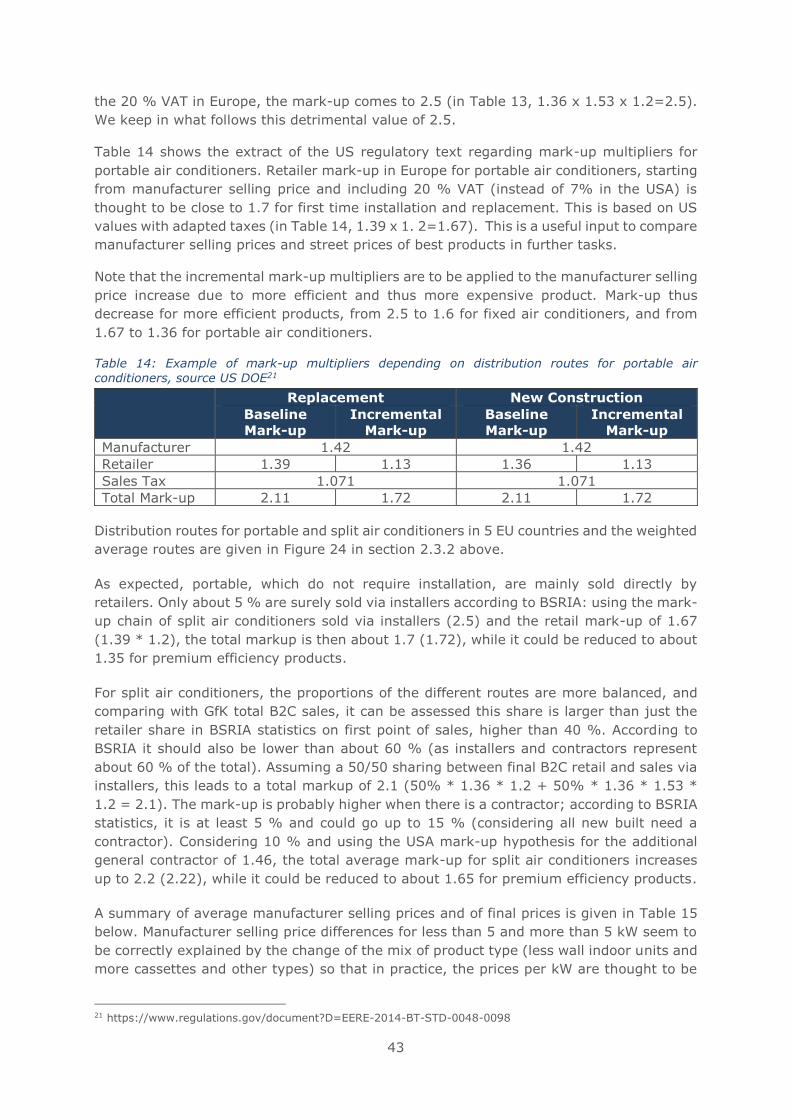
43
the 20 % VAT in Europe, the mark-up comes to 2.5 (in Table 13, 1.36 x 1.53 x 1.2=2.5).
We keep in what follows this detrimental value of 2.5.
Table 14 shows the extract of the US regulatory text regarding mark-up multipliers for
portable air conditioners. Retailer mark-up in Europe for portable air conditioners, starting
from manufacturer selling price and including 20 % VAT (instead of 7% in the USA) is
thought to be close to 1.7 for first time installation and replacement. This is based on US
values with adapted taxes (in Table 14, 1.39 x 1. 2=1.67). This is a useful input to compare
manufacturer selling prices and street prices of best products in further tasks.
Note that the incremental mark-up multipliers are to be applied to the manufacturer selling
price increase due to more efficient and thus more expensive product. Mark-up thus
decrease for more efficient products, from 2.5 to 1.6 for fixed air conditioners, and from
1.67 to 1.36 for portable air conditioners.
Table 14: Example of mark-up multipliers depending on distribution routes for portable air
conditioners, source US DOE21
Distribution routes for portable and split air conditioners in 5 EU countries and the weighted
average routes are given in Figure 24 in section 2.3.2 above.
As expected, portable, which do not require installation, are mainly sold directly by
retailers. Only about 5 % are surely sold via installers according to BSRIA: using the mark-
up chain of split air conditioners sold via installers (2.5) and the retail mark-up of 1.67
(1.39 * 1.2), the total markup is then about 1.7 (1.72), while it could be reduced to about
1.35 for premium efficiency products.
For split air conditioners, the proportions of the different routes are more balanced, and
comparing with GfK total B2C sales, it can be assessed this share is larger than just the
retailer share in BSRIA statistics on first point of sales, higher than 40 %. According to
BSRIA it should also be lower than about 60 % (as installers and contractors represent
about 60 % of the total). Assuming a 50/50 sharing between final B2C retail and sales via
installers, this leads to a total markup of 2.1 (50% * 1.36 * 1.2 + 50% * 1.36 * 1.53 *
1.2 = 2.1). The mark-up is probably higher when there is a contractor; according to BSRIA
statistics, it is at least 5 % and could go up to 15 % (considering all new built need a
contractor). Considering 10 % and using the USA mark-up hypothesis for the additional
general contractor of 1.46, the total average mark-up for split air conditioners increases
up to 2.2 (2.22), while it could be reduced to about 1.65 for premium efficiency products.
A summary of average manufacturer selling prices and of final prices is given in Table 15
below. Manufacturer selling price differences for less than 5 and more than 5 kW seem to
be correctly explained by the change of the mix of product type (less wall indoor units and
more cassettes and other types) so that in practice, the prices per kW are thought to be
21 https://www.regulations.gov/document?D=EERE-2014-BT-STD-0048-0098
Replacement New Construction
Baseline
Mark-up
Incremental
Mark-up
Baseline
Mark-up
Incremental
Mark-up
Manufacturer 1.42 1.42
Retailer 1.39 1.13 1.36 1.13
Sales Tax 1.071 1.071
Total Mark-up 2.11 1.72 2.11 1.72
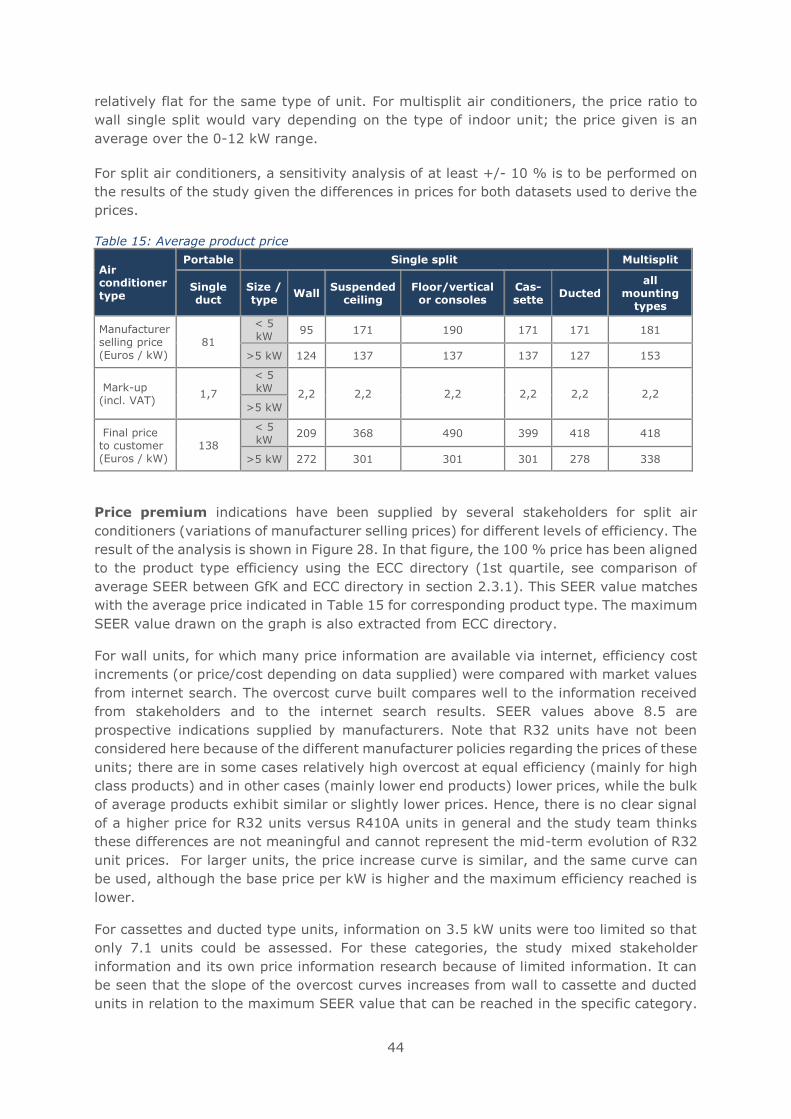
44
relatively flat for the same type of unit. For multisplit air conditioners, the price ratio to
wall single split would vary depending on the type of indoor unit; the price given is an
average over the 0-12 kW range.
For split air conditioners, a sensitivity analysis of at least +/- 10 % is to be performed on
the results of the study given the differences in prices for both datasets used to derive the
prices.
Table 15: Average product price
Air conditioner type
Portable Single split Multisplit
Single duct
Size / type
Wall Suspended
ceiling Floor/vertical
or consoles Cas-sette
Ducted all
mounting types
Manufacturer selling price (Euros / kW)
81
< 5 kW
95 171 190 171 171 181
>5 kW 124 137 137 137 127 153
Mark-up (incl. VAT)
1,7
< 5 kW
2,2 2,2 2,2 2,2 2,2 2,2
>5 kW
Final price to customer (Euros / kW)
138
< 5 kW
209 368 490 399 418 418
>5 kW 272 301 301 301 278 338
Price premium indications have been supplied by several stakeholders for split air
conditioners (variations of manufacturer selling prices) for different levels of efficiency. The
result of the analysis is shown in Figure 28. In that figure, the 100 % price has been aligned
to the product type efficiency using the ECC directory (1st quartile, see comparison of
average SEER between GfK and ECC directory in section 2.3.1). This SEER value matches
with the average price indicated in Table 15 for corresponding product type. The maximum
SEER value drawn on the graph is also extracted from ECC directory.
For wall units, for which many price information are available via internet, efficiency cost
increments (or price/cost depending on data supplied) were compared with market values
from internet search. The overcost curve built compares well to the information received
from stakeholders and to the internet search results. SEER values above 8.5 are
prospective indications supplied by manufacturers. Note that R32 units have not been
considered here because of the different manufacturer policies regarding the prices of these
units; there are in some cases relatively high overcost at equal efficiency (mainly for high
class products) and in other cases (mainly lower end products) lower prices, while the bulk
of average products exhibit similar or slightly lower prices. Hence, there is no clear signal
of a higher price for R32 units versus R410A units in general and the study team thinks
these differences are not meaningful and cannot represent the mid-term evolution of R32
unit prices. For larger units, the price increase curve is similar, and the same curve can
be used, although the base price per kW is higher and the maximum efficiency reached is
lower.
For cassettes and ducted type units, information on 3.5 kW units were too limited so that
only 7.1 units could be assessed. For these categories, the study mixed stakeholder
information and its own price information research because of limited information. It can
be seen that the slope of the overcost curves increases from wall to cassette and ducted
units in relation to the maximum SEER value that can be reached in the specific category.
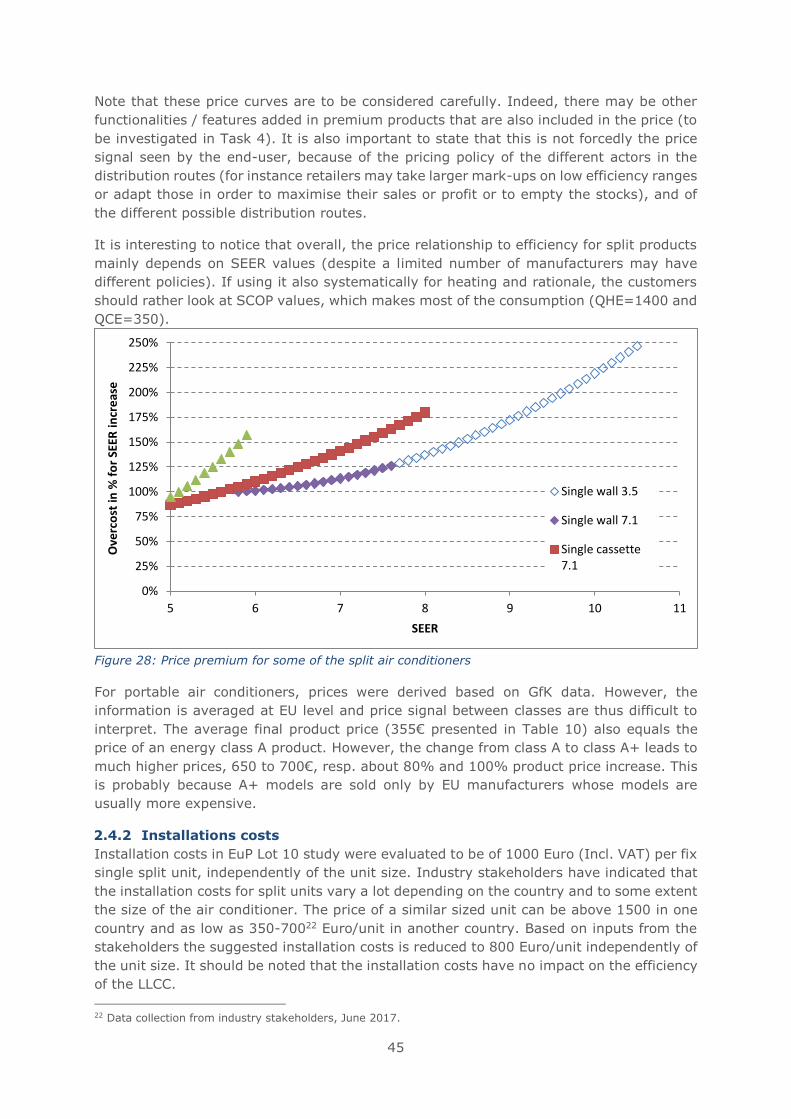
45
Note that these price curves are to be considered carefully. Indeed, there may be other
functionalities / features added in premium products that are also included in the price (to
be investigated in Task 4). It is also important to state that this is not forcedly the price
signal seen by the end-user, because of the pricing policy of the different actors in the
distribution routes (for instance retailers may take larger mark-ups on low efficiency ranges
or adapt those in order to maximise their sales or profit or to empty the stocks), and of
the different possible distribution routes.
It is interesting to notice that overall, the price relationship to efficiency for split products
mainly depends on SEER values (despite a limited number of manufacturers may have
different policies). If using it also systematically for heating and rationale, the customers
should rather look at SCOP values, which makes most of the consumption (QHE=1400 and
QCE=350).
Figure 28: Price premium for some of the split air conditioners
For portable air conditioners, prices were derived based on GfK data. However, the
information is averaged at EU level and price signal between classes are thus difficult to
interpret. The average final product price (355€ presented in Table 10) also equals the
price of an energy class A product. However, the change from class A to class A+ leads to
much higher prices, 650 to 700€, resp. about 80% and 100% product price increase. This
is probably because A+ models are sold only by EU manufacturers whose models are
usually more expensive.
2.4.2 Installations costs
Installation costs in EuP Lot 10 study were evaluated to be of 1000 Euro (Incl. VAT) per fix
single split unit, independently of the unit size. Industry stakeholders have indicated that
the installation costs for split units vary a lot depending on the country and to some extent
the size of the air conditioner. The price of a similar sized unit can be above 1500 in one
country and as low as 350-70022 Euro/unit in another country. Based on inputs from the
stakeholders the suggested installation costs is reduced to 800 Euro/unit independently of
the unit size. It should be noted that the installation costs have no impact on the efficiency
of the LLCC.
22 Data collection from industry stakeholders, June 2017.
0%
25%
50%
75%
100%
125%
150%
175%
200%
225%
250%
5 6 7 8 9 10 11
Ove
rco
st in
% f
or
SEER
incr
eas
e
SEER
Single wall 3.5
Single wall 7.1
Single cassette7.1
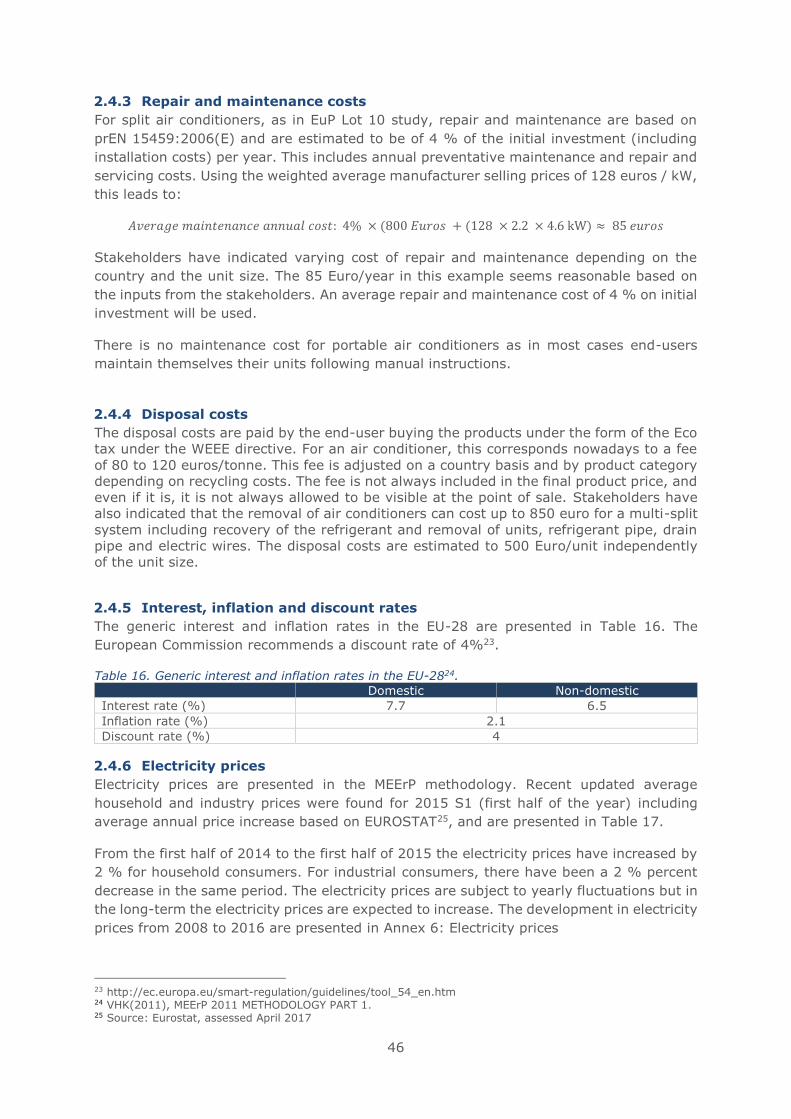
46
2.4.3 Repair and maintenance costs
For split air conditioners, as in EuP Lot 10 study, repair and maintenance are based on
prEN 15459:2006(E) and are estimated to be of 4 % of the initial investment (including
installation costs) per year. This includes annual preventative maintenance and repair and
servicing costs. Using the weighted average manufacturer selling prices of 128 euros / kW,
this leads to:
𝐴𝑣𝑒𝑟𝑎𝑔𝑒 𝑚𝑎𝑖𝑛𝑡𝑒𝑛𝑎𝑛𝑐𝑒 𝑎𝑛𝑛𝑢𝑎𝑙 𝑐𝑜𝑠𝑡: 4% × (800 𝐸𝑢𝑟𝑜𝑠 + (128 × 2.2 × 4.6 kW) ≈ 85 𝑒𝑢𝑟𝑜𝑠
Stakeholders have indicated varying cost of repair and maintenance depending on the
country and the unit size. The 85 Euro/year in this example seems reasonable based on
the inputs from the stakeholders. An average repair and maintenance cost of 4 % on initial
investment will be used.
There is no maintenance cost for portable air conditioners as in most cases end-users
maintain themselves their units following manual instructions.
2.4.4 Disposal costs
The disposal costs are paid by the end-user buying the products under the form of the Eco
tax under the WEEE directive. For an air conditioner, this corresponds nowadays to a fee
of 80 to 120 euros/tonne. This fee is adjusted on a country basis and by product category
depending on recycling costs. The fee is not always included in the final product price, and
even if it is, it is not always allowed to be visible at the point of sale. Stakeholders have
also indicated that the removal of air conditioners can cost up to 850 euro for a multi-split
system including recovery of the refrigerant and removal of units, refrigerant pipe, drain
pipe and electric wires. The disposal costs are estimated to 500 Euro/unit independently
of the unit size.
2.4.5 Interest, inflation and discount rates
The generic interest and inflation rates in the EU-28 are presented in Table 16. The
European Commission recommends a discount rate of 4%23.
Table 16. Generic interest and inflation rates in the EU-2824.
Domestic Non-domestic
Interest rate (%) 7.7 6.5
Inflation rate (%) 2.1
Discount rate (%) 4
2.4.6 Electricity prices
Electricity prices are presented in the MEErP methodology. Recent updated average
household and industry prices were found for 2015 S1 (first half of the year) including
average annual price increase based on EUROSTAT25, and are presented in Table 17.
From the first half of 2014 to the first half of 2015 the electricity prices have increased by
2 % for household consumers. For industrial consumers, there have been a 2 % percent
decrease in the same period. The electricity prices are subject to yearly fluctuations but in
the long-term the electricity prices are expected to increase. The development in electricity
prices from 2008 to 2016 are presented in Annex 6: Electricity prices
23 http://ec.europa.eu/smart-regulation/guidelines/tool_54_en.htm 24 VHK(2011), MEErP 2011 METHODOLOGY PART 1. 25 Source: Eurostat, assessed April 2017
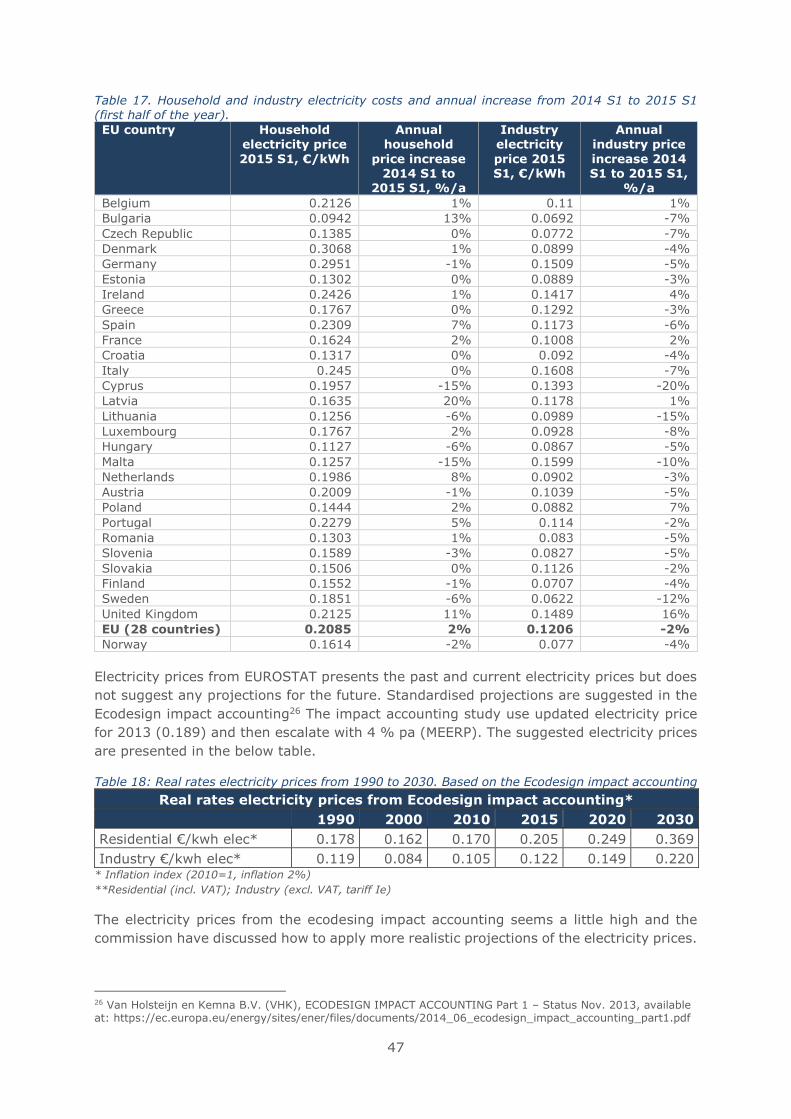
47
Table 17. Household and industry electricity costs and annual increase from 2014 S1 to 2015 S1
(first half of the year).
EU country Household electricity price
2015 S1, €/kWh
Annual household
price increase 2014 S1 to
2015 S1, %/a
Industry electricity
price 2015 S1, €/kWh
Annual industry price
increase 2014 S1 to 2015 S1,
%/a
Belgium 0.2126 1% 0.11 1%
Bulgaria 0.0942 13% 0.0692 -7%
Czech Republic 0.1385 0% 0.0772 -7%
Denmark 0.3068 1% 0.0899 -4%
Germany 0.2951 -1% 0.1509 -5%
Estonia 0.1302 0% 0.0889 -3%
Ireland 0.2426 1% 0.1417 4%
Greece 0.1767 0% 0.1292 -3%
Spain 0.2309 7% 0.1173 -6%
France 0.1624 2% 0.1008 2%
Croatia 0.1317 0% 0.092 -4%
Italy 0.245 0% 0.1608 -7%
Cyprus 0.1957 -15% 0.1393 -20%
Latvia 0.1635 20% 0.1178 1%
Lithuania 0.1256 -6% 0.0989 -15%
Luxembourg 0.1767 2% 0.0928 -8%
Hungary 0.1127 -6% 0.0867 -5%
Malta 0.1257 -15% 0.1599 -10%
Netherlands 0.1986 8% 0.0902 -3%
Austria 0.2009 -1% 0.1039 -5%
Poland 0.1444 2% 0.0882 7%
Portugal 0.2279 5% 0.114 -2%
Romania 0.1303 1% 0.083 -5%
Slovenia 0.1589 -3% 0.0827 -5%
Slovakia 0.1506 0% 0.1126 -2%
Finland 0.1552 -1% 0.0707 -4%
Sweden 0.1851 -6% 0.0622 -12%
United Kingdom 0.2125 11% 0.1489 16%
EU (28 countries) 0.2085 2% 0.1206 -2%
Norway 0.1614 -2% 0.077 -4%
Electricity prices from EUROSTAT presents the past and current electricity prices but does
not suggest any projections for the future. Standardised projections are suggested in the
Ecodesign impact accounting26 The impact accounting study use updated electricity price
for 2013 (0.189) and then escalate with 4 % pa (MEERP). The suggested electricity prices
are presented in the below table.
Table 18: Real rates electricity prices from 1990 to 2030. Based on the Ecodesign impact accounting
Real rates electricity prices from Ecodesign impact accounting*
1990 2000 2010 2015 2020 2030
Residential €/kwh elec* 0.178 0.162 0.170 0.205 0.249 0.369
Industry €/kwh elec* 0.119 0.084 0.105 0.122 0.149 0.220 * Inflation index (2010=1, inflation 2%)
**Residential (incl. VAT); Industry (excl. VAT, tariff Ie)
The electricity prices from the ecodesing impact accounting seems a little high and the
commission have discussed how to apply more realistic projections of the electricity prices.
26 Van Holsteijn en Kemna B.V. (VHK), ECODESIGN IMPACT ACCOUNTING Part 1 – Status Nov. 2013, available at: https://ec.europa.eu/energy/sites/ener/files/documents/2014_06_ecodesign_impact_accounting_part1.pdf
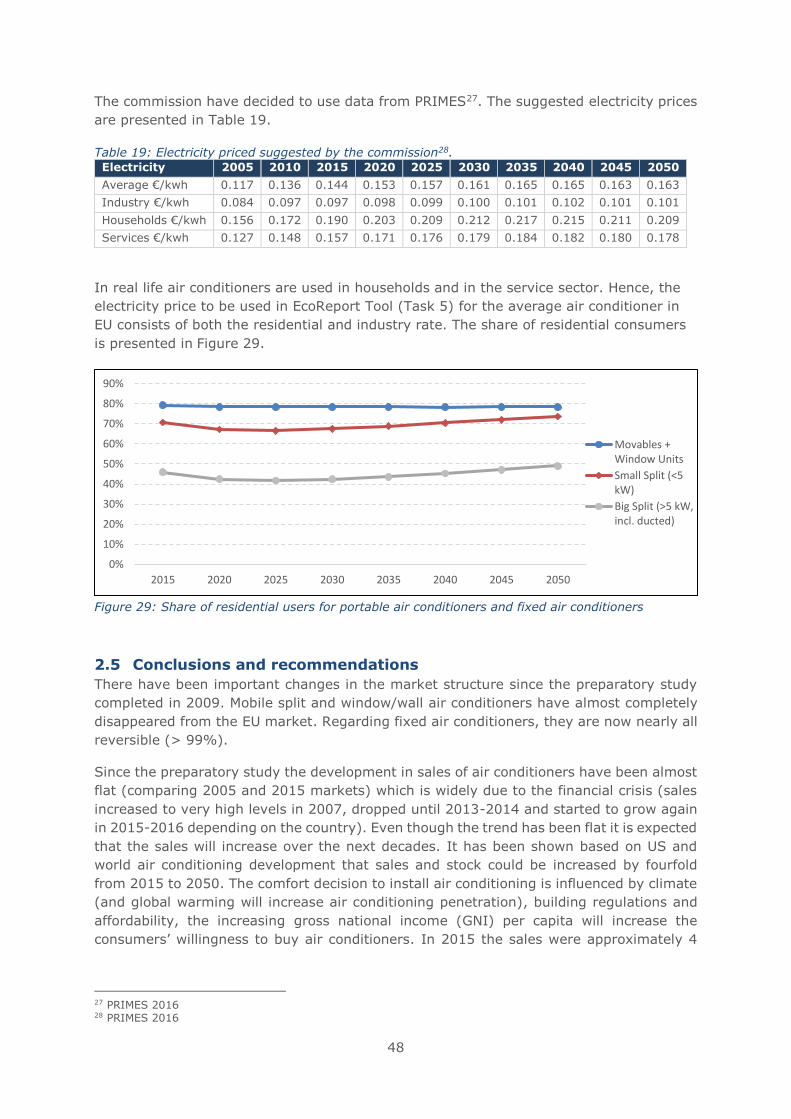
48
The commission have decided to use data from PRIMES27. The suggested electricity prices
are presented in Table 19.
Table 19: Electricity priced suggested by the commission28. Electricity 2005 2010 2015 2020 2025 2030 2035 2040 2045 2050
Average €/kwh 0.117 0.136 0.144 0.153 0.157 0.161 0.165 0.165 0.163 0.163
Industry €/kwh 0.084 0.097 0.097 0.098 0.099 0.100 0.101 0.102 0.101 0.101
Households €/kwh 0.156 0.172 0.190 0.203 0.209 0.212 0.217 0.215 0.211 0.209
Services €/kwh 0.127 0.148 0.157 0.171 0.176 0.179 0.184 0.182 0.180 0.178
In real life air conditioners are used in households and in the service sector. Hence, the
electricity price to be used in EcoReport Tool (Task 5) for the average air conditioner in
EU consists of both the residential and industry rate. The share of residential consumers
is presented in Figure 29.
Figure 29: Share of residential users for portable air conditioners and fixed air conditioners
2.5 Conclusions and recommendations
There have been important changes in the market structure since the preparatory study
completed in 2009. Mobile split and window/wall air conditioners have almost completely
disappeared from the EU market. Regarding fixed air conditioners, they are now nearly all
reversible (> 99%).
Since the preparatory study the development in sales of air conditioners have been almost
flat (comparing 2005 and 2015 markets) which is widely due to the financial crisis (sales
increased to very high levels in 2007, dropped until 2013-2014 and started to grow again
in 2015-2016 depending on the country). Even though the trend has been flat it is expected
that the sales will increase over the next decades. It has been shown based on US and
world air conditioning development that sales and stock could be increased by fourfold
from 2015 to 2050. The comfort decision to install air conditioning is influenced by climate
(and global warming will increase air conditioning penetration), building regulations and
affordability, the increasing gross national income (GNI) per capita will increase the
consumers’ willingness to buy air conditioners. In 2015 the sales were approximately 4
27 PRIMES 2016 28 PRIMES 2016
0%
10%
20%
30%
40%
50%
60%
70%
80%
90%
2015 2020 2025 2030 2035 2040 2045 2050
Movables +Window Units
Small Split (<5kW)
Big Split (>5 kW,incl. ducted)
49
million units and the stock were 53.7 million units. The sales and stocks are expected to
increase and reach above 10 million units in sales and 98.5 million units in stock by 2030.
The market is dominated by air conditioners with R 410A refrigerant, but this is expected
to change soon to refrigerants with much lower Global Warming Potential (GWP) due to
the F-gas regulation.
According to the market data of fixed air conditioners, A++ is well populated and the A+++
category is already populated before the regulation (EU) No 626/2011 introduces the
A+++ class. It should be noted that it is not lawful to use A+++ class indication before
2019. For portable air conditioners, only a few of them can reach an A++ mark currently.
Based on Eurovent Certita Certification data, it is clear to see the increasing trend of air
conditioners efficiency, median EER increased from 2.9 to 3.4 from 2006 to 2016, and COP
increased from 3.2 to 3.7 from 2006 to 2016. Sales weighted efficiency is calculated based
on available data; for portable air conditioner EER = 2.65, and COP = 2.53, for fixed split
air conditioners, SEER = 5.7, split SCOP = 4.0.
Today the average sound power levels of air conditioners are well below the ecodesign
requirements. For small fixed split air conditioners (≤6 kW), average indoor sound power
level is 56.5 dB(A) while the average outdoor sound power level is 62.4 dB(A). For larger
air conditioners (>6 kW) the average indoor sound power level is 61.1 dB(A) while the
average outdoor sound power level is 67.6 dB(A).
The average price of air conditioners decreased since the preparatory study due to the
financial crisis but started to increase again as observed recently. The average final product
price for portable air conditioners is found approx. 135 EUR/kW, while the manufacturer
selling price is approx. 80 EUR/kW. The average manufacturer selling price for fixed split
air conditioners is found approx. 130 EUR/kW and while the final product price is approx.
285 EUR/kW. The mark-up factor for split systems starting from manufacturer selling price
is approx. 2.2, and the mark-up for portable unit is approx. 1.7. Price increase for wall split
units, large cassettes and ducted units were identified and will be used in later tasks for
life cycle cost analysis.
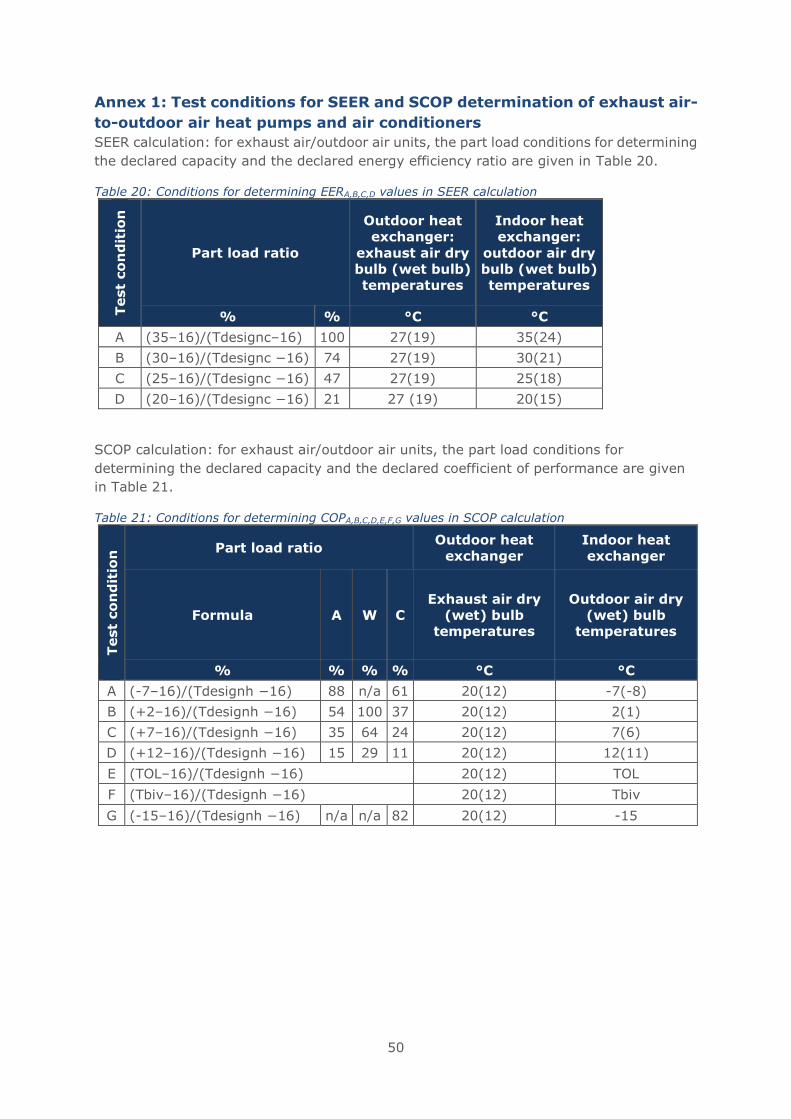
50
Annex 1: Test conditions for SEER and SCOP determination of exhaust air-
to-outdoor air heat pumps and air conditioners
SEER calculation: for exhaust air/outdoor air units, the part load conditions for determining
the declared capacity and the declared energy efficiency ratio are given in Table 20.
Table 20: Conditions for determining EERA,B,C,D values in SEER calculation
Test
co
nd
itio
n
Part load ratio
Outdoor heat
exchanger:
exhaust air dry
bulb (wet bulb)
temperatures
Indoor heat
exchanger:
outdoor air dry
bulb (wet bulb)
temperatures
% % °C °C
A (35–16)/(Tdesignc–16) 100 27(19) 35(24)
B (30–16)/(Tdesignc −16) 74 27(19) 30(21)
C (25–16)/(Tdesignc −16) 47 27(19) 25(18)
D (20–16)/(Tdesignc −16) 21 27 (19) 20(15)
SCOP calculation: for exhaust air/outdoor air units, the part load conditions for
determining the declared capacity and the declared coefficient of performance are given
in Table 21.
Table 21: Conditions for determining COPA,B,C,D,E,F,G values in SCOP calculation
Test
co
nd
itio
n Part load ratio
Outdoor heat
exchanger
Indoor heat
exchanger
Formula A W C
Exhaust air dry
(wet) bulb
temperatures
Outdoor air dry
(wet) bulb
temperatures
% % % % °C °C
A (-7–16)/(Tdesignh −16) 88 n/a 61 20(12) -7(-8)
B (+2–16)/(Tdesignh −16) 54 100 37 20(12) 2(1)
C (+7–16)/(Tdesignh −16) 35 64 24 20(12) 7(6)
D (+12–16)/(Tdesignh −16) 15 29 11 20(12) 12(11)
E (TOL–16)/(Tdesignh −16) 20(12) TOL
F (Tbiv–16)/(Tdesignh −16) 20(12) Tbiv
G (-15–16)/(Tdesignh −16) n/a n/a 82 20(12) -15
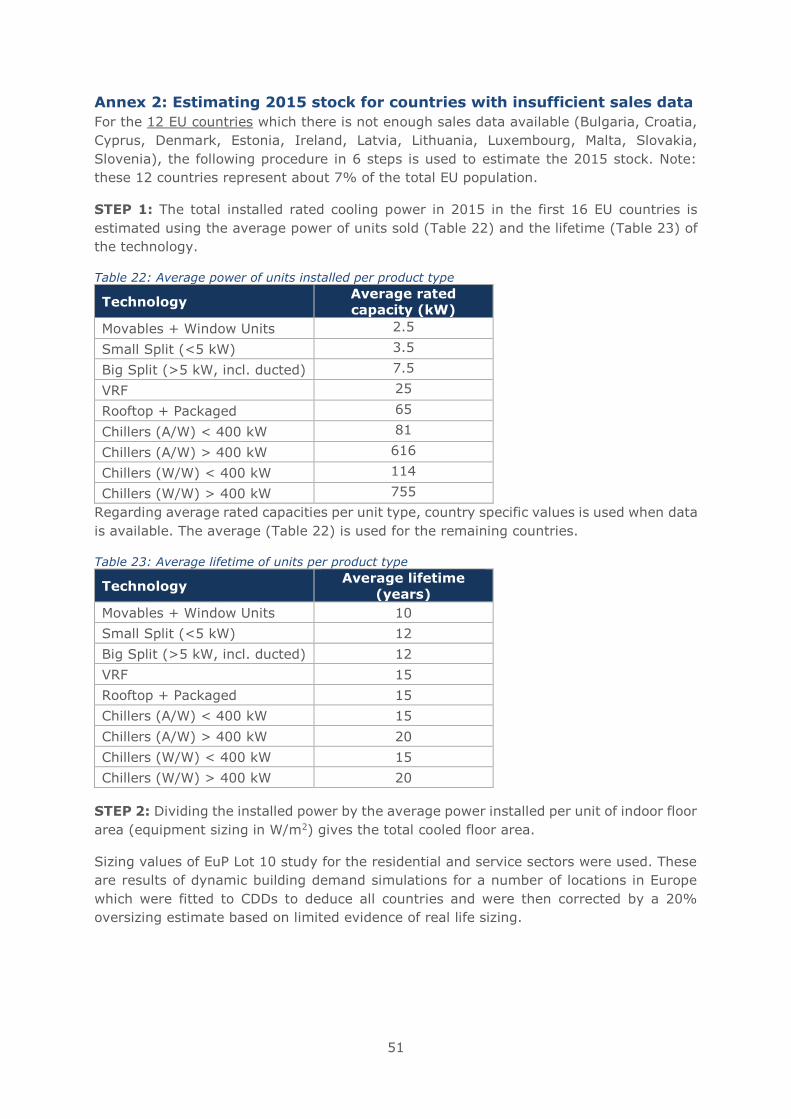
51
Annex 2: Estimating 2015 stock for countries with insufficient sales data
For the 12 EU countries which there is not enough sales data available (Bulgaria, Croatia,
Cyprus, Denmark, Estonia, Ireland, Latvia, Lithuania, Luxembourg, Malta, Slovakia,
Slovenia), the following procedure in 6 steps is used to estimate the 2015 stock. Note:
these 12 countries represent about 7% of the total EU population.
STEP 1: The total installed rated cooling power in 2015 in the first 16 EU countries is
estimated using the average power of units sold (Table 22) and the lifetime (Table 23) of
the technology.
Table 22: Average power of units installed per product type
Technology Average rated
capacity (kW)
Movables + Window Units 2.5
Small Split (<5 kW) 3.5
Big Split (>5 kW, incl. ducted) 7.5
VRF 25
Rooftop + Packaged 65
Chillers (A/W) < 400 kW 81
Chillers (A/W) > 400 kW 616
Chillers (W/W) < 400 kW 114
Chillers (W/W) > 400 kW 755
Regarding average rated capacities per unit type, country specific values is used when data
is available. The average (Table 22) is used for the remaining countries.
Table 23: Average lifetime of units per product type
Technology Average lifetime
(years)
Movables + Window Units 10
Small Split (<5 kW) 12
Big Split (>5 kW, incl. ducted) 12
VRF 15
Rooftop + Packaged 15
Chillers (A/W) < 400 kW 15
Chillers (A/W) > 400 kW 20
Chillers (W/W) < 400 kW 15
Chillers (W/W) > 400 kW 20
STEP 2: Dividing the installed power by the average power installed per unit of indoor floor
area (equipment sizing in W/m2) gives the total cooled floor area.
Sizing values of EuP Lot 10 study for the residential and service sectors were used. These
are results of dynamic building demand simulations for a number of locations in Europe
which were fitted to CDDs to deduce all countries and were then corrected by a 20%
oversizing estimate based on limited evidence of real life sizing.
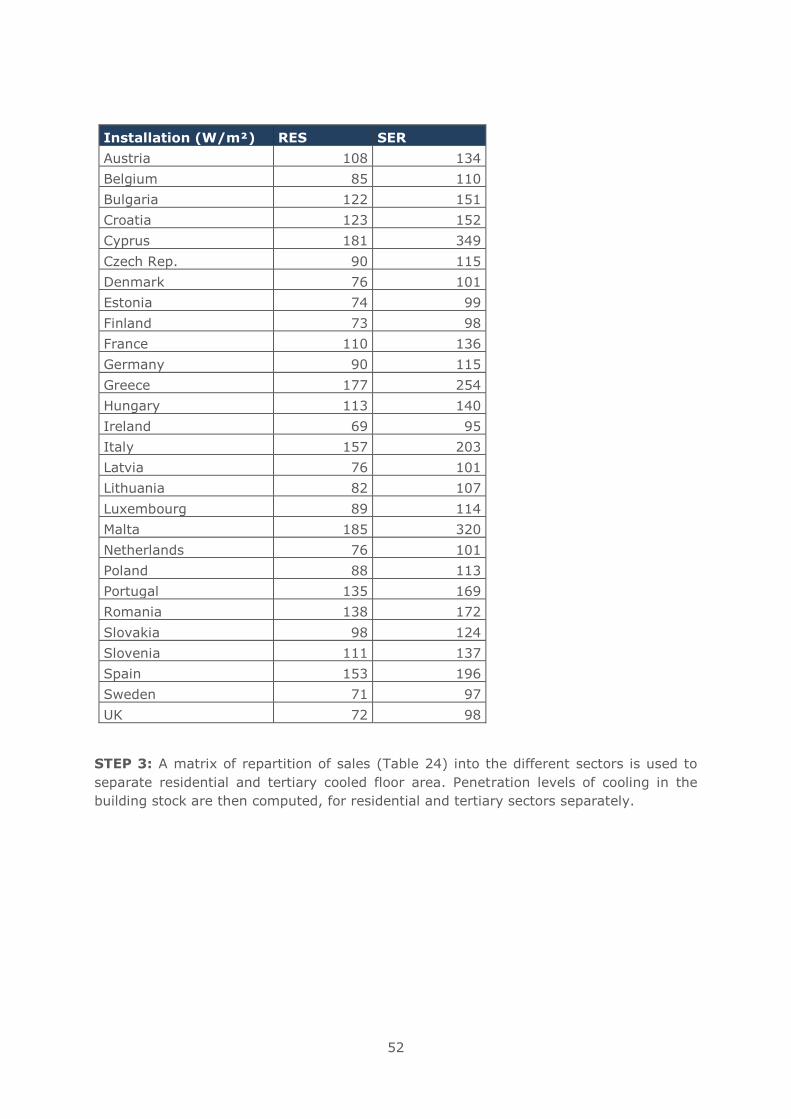
52
Installation (W/m²) RES SER
Austria 108 134
Belgium 85 110
Bulgaria 122 151
Croatia 123 152
Cyprus 181 349
Czech Rep. 90 115
Denmark 76 101
Estonia 74 99
Finland 73 98
France 110 136
Germany 90 115
Greece 177 254
Hungary 113 140
Ireland 69 95
Italy 157 203
Latvia 76 101
Lithuania 82 107
Luxembourg 89 114
Malta 185 320
Netherlands 76 101
Poland 88 113
Portugal 135 169
Romania 138 172
Slovakia 98 124
Slovenia 111 137
Spain 153 196
Sweden 71 97
UK 72 98
STEP 3: A matrix of repartition of sales (Table 24) into the different sectors is used to
separate residential and tertiary cooled floor area. Penetration levels of cooling in the
building stock are then computed, for residential and tertiary sectors separately.
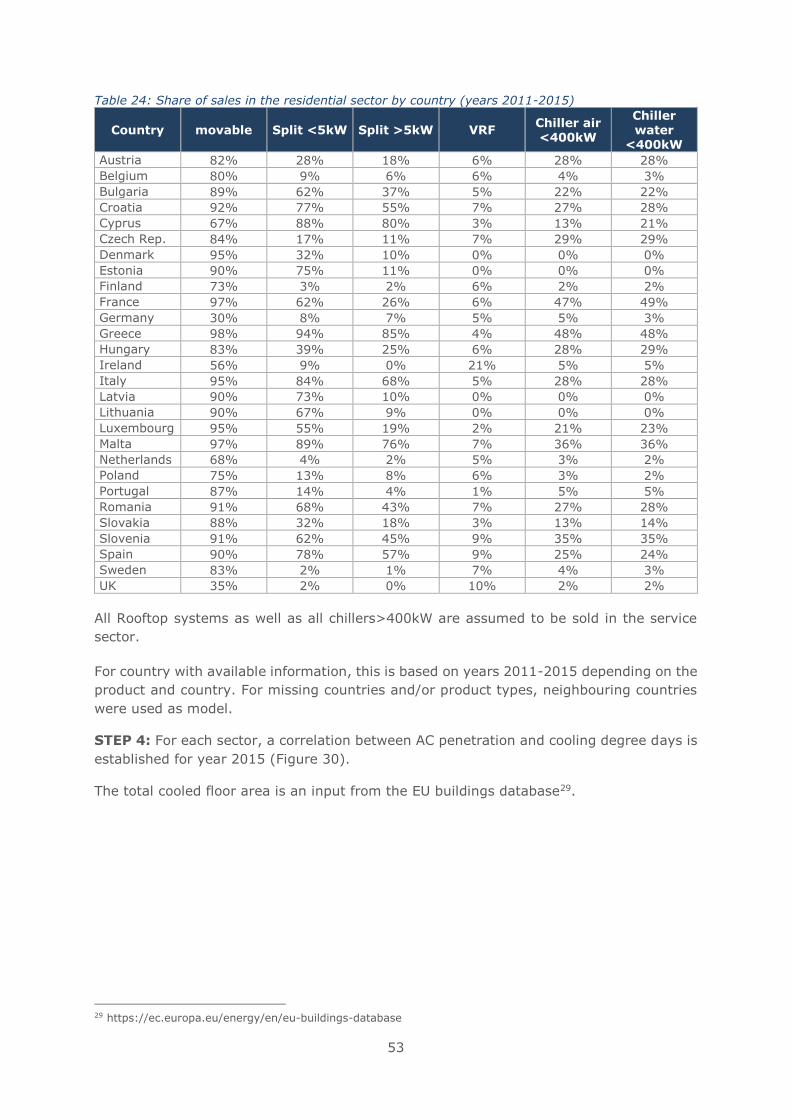
53
Table 24: Share of sales in the residential sector by country (years 2011-2015)
Country movable Split <5kW Split >5kW VRF Chiller air <400kW
Chiller water
<400kW
Austria 82% 28% 18% 6% 28% 28%
Belgium 80% 9% 6% 6% 4% 3%
Bulgaria 89% 62% 37% 5% 22% 22%
Croatia 92% 77% 55% 7% 27% 28%
Cyprus 67% 88% 80% 3% 13% 21%
Czech Rep. 84% 17% 11% 7% 29% 29%
Denmark 95% 32% 10% 0% 0% 0%
Estonia 90% 75% 11% 0% 0% 0%
Finland 73% 3% 2% 6% 2% 2%
France 97% 62% 26% 6% 47% 49%
Germany 30% 8% 7% 5% 5% 3%
Greece 98% 94% 85% 4% 48% 48%
Hungary 83% 39% 25% 6% 28% 29%
Ireland 56% 9% 0% 21% 5% 5%
Italy 95% 84% 68% 5% 28% 28%
Latvia 90% 73% 10% 0% 0% 0%
Lithuania 90% 67% 9% 0% 0% 0%
Luxembourg 95% 55% 19% 2% 21% 23%
Malta 97% 89% 76% 7% 36% 36%
Netherlands 68% 4% 2% 5% 3% 2%
Poland 75% 13% 8% 6% 3% 2%
Portugal 87% 14% 4% 1% 5% 5%
Romania 91% 68% 43% 7% 27% 28%
Slovakia 88% 32% 18% 3% 13% 14%
Slovenia 91% 62% 45% 9% 35% 35%
Spain 90% 78% 57% 9% 25% 24%
Sweden 83% 2% 1% 7% 4% 3%
UK 35% 2% 0% 10% 2% 2%
All Rooftop systems as well as all chillers>400kW are assumed to be sold in the service
sector.
For country with available information, this is based on years 2011-2015 depending on the
product and country. For missing countries and/or product types, neighbouring countries
were used as model.
STEP 4: For each sector, a correlation between AC penetration and cooling degree days is
established for year 2015 (Figure 30).
The total cooled floor area is an input from the EU buildings database29.
29 https://ec.europa.eu/energy/en/eu-buildings-database
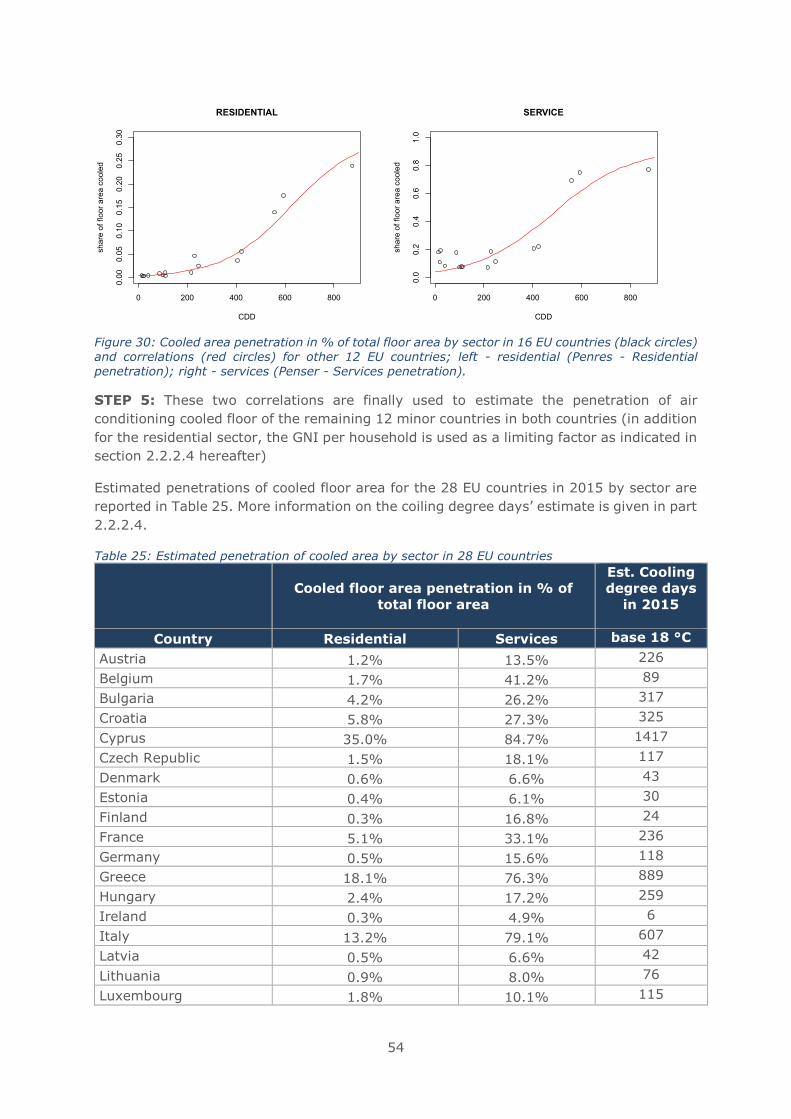
54
Figure 30: Cooled area penetration in % of total floor area by sector in 16 EU countries (black circles) and correlations (red circles) for other 12 EU countries; left - residential (Penres - Residential penetration); right - services (Penser - Services penetration).
STEP 5: These two correlations are finally used to estimate the penetration of air
conditioning cooled floor of the remaining 12 minor countries in both countries (in addition
for the residential sector, the GNI per household is used as a limiting factor as indicated in
section 2.2.2.4 hereafter)
Estimated penetrations of cooled floor area for the 28 EU countries in 2015 by sector are
reported in Table 25. More information on the coiling degree days’ estimate is given in part
2.2.2.4.
Table 25: Estimated penetration of cooled area by sector in 28 EU countries
Cooled floor area penetration in % of
total floor area
Est. Cooling
degree days
in 2015
Country Residential Services base 18 °C
Austria 1.2% 13.5% 226
Belgium 1.7% 41.2% 89
Bulgaria 4.2% 26.2% 317
Croatia 5.8% 27.3% 325
Cyprus 35.0% 84.7% 1417
Czech Republic 1.5% 18.1% 117
Denmark 0.6% 6.6% 43
Estonia 0.4% 6.1% 30
Finland 0.3% 16.8% 24
France 5.1% 33.1% 236
Germany 0.5% 15.6% 118
Greece 18.1% 76.3% 889
Hungary 2.4% 17.2% 259
Ireland 0.3% 4.9% 6
Italy 13.2% 79.1% 607
Latvia 0.5% 6.6% 42
Lithuania 0.9% 8.0% 76
Luxembourg 1.8% 10.1% 115
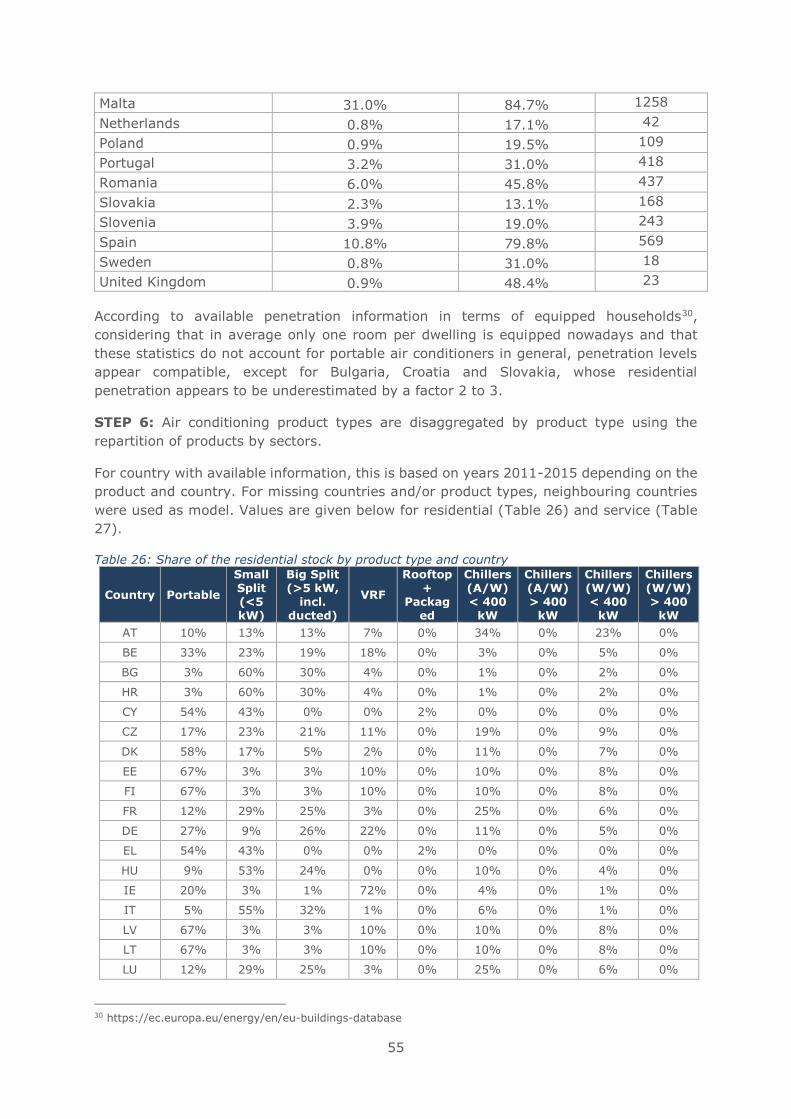
55
Malta 31.0% 84.7% 1258
Netherlands 0.8% 17.1% 42
Poland 0.9% 19.5% 109
Portugal 3.2% 31.0% 418
Romania 6.0% 45.8% 437
Slovakia 2.3% 13.1% 168
Slovenia 3.9% 19.0% 243
Spain 10.8% 79.8% 569
Sweden 0.8% 31.0% 18
United Kingdom 0.9% 48.4% 23
According to available penetration information in terms of equipped households30,
considering that in average only one room per dwelling is equipped nowadays and that
these statistics do not account for portable air conditioners in general, penetration levels
appear compatible, except for Bulgaria, Croatia and Slovakia, whose residential
penetration appears to be underestimated by a factor 2 to 3.
STEP 6: Air conditioning product types are disaggregated by product type using the
repartition of products by sectors.
For country with available information, this is based on years 2011-2015 depending on the
product and country. For missing countries and/or product types, neighbouring countries
were used as model. Values are given below for residential (Table 26) and service (Table
27).
Table 26: Share of the residential stock by product type and country
Country Portable
Small Split (<5 kW)
Big Split (>5 kW,
incl. ducted)
VRF
Rooftop +
Packaged
Chillers (A/W) < 400
kW
Chillers (A/W) > 400
kW
Chillers (W/W) < 400
kW
Chillers (W/W) > 400
kW
AT 10% 13% 13% 7% 0% 34% 0% 23% 0%
BE 33% 23% 19% 18% 0% 3% 0% 5% 0%
BG 3% 60% 30% 4% 0% 1% 0% 2% 0%
HR 3% 60% 30% 4% 0% 1% 0% 2% 0%
CY 54% 43% 0% 0% 2% 0% 0% 0% 0%
CZ 17% 23% 21% 11% 0% 19% 0% 9% 0%
DK 58% 17% 5% 2% 0% 11% 0% 7% 0%
EE 67% 3% 3% 10% 0% 10% 0% 8% 0%
FI 67% 3% 3% 10% 0% 10% 0% 8% 0%
FR 12% 29% 25% 3% 0% 25% 0% 6% 0%
DE 27% 9% 26% 22% 0% 11% 0% 5% 0%
EL 54% 43% 0% 0% 2% 0% 0% 0% 0%
HU 9% 53% 24% 0% 0% 10% 0% 4% 0%
IE 20% 3% 1% 72% 0% 4% 0% 1% 0%
IT 5% 55% 32% 1% 0% 6% 0% 1% 0%
LV 67% 3% 3% 10% 0% 10% 0% 8% 0%
LT 67% 3% 3% 10% 0% 10% 0% 8% 0%
LU 12% 29% 25% 3% 0% 25% 0% 6% 0%
30 https://ec.europa.eu/energy/en/eu-buildings-database
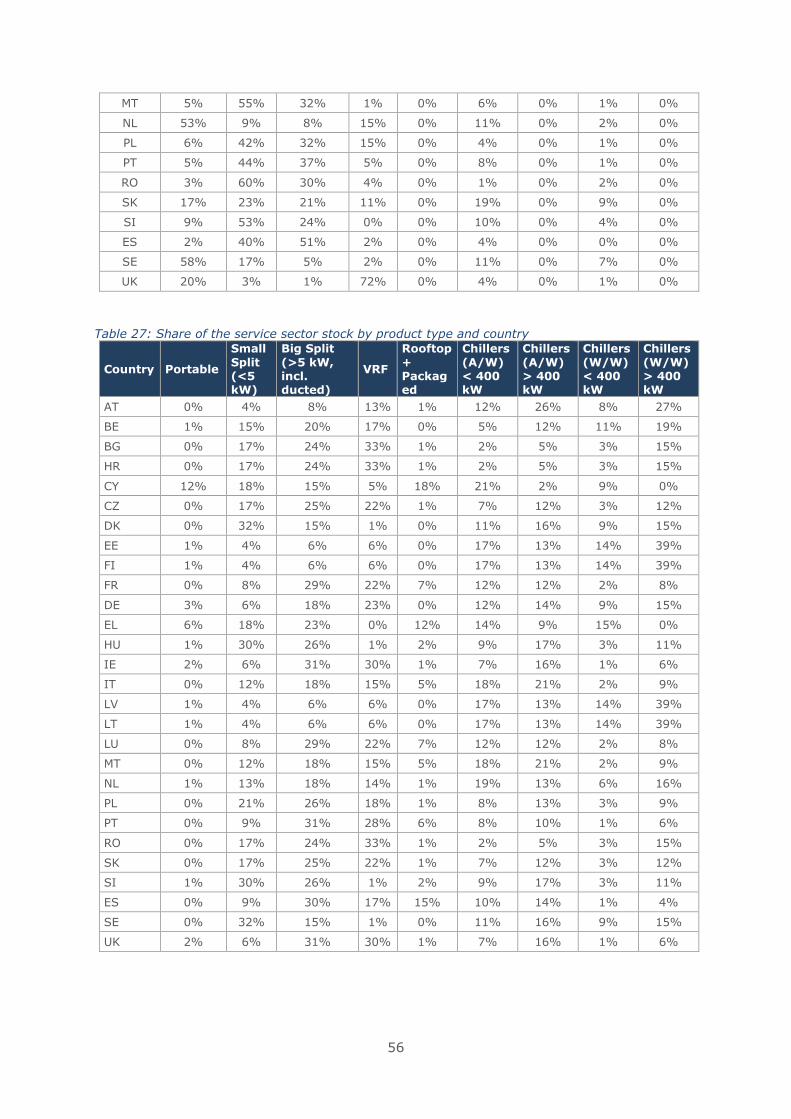
56
MT 5% 55% 32% 1% 0% 6% 0% 1% 0%
NL 53% 9% 8% 15% 0% 11% 0% 2% 0%
PL 6% 42% 32% 15% 0% 4% 0% 1% 0%
PT 5% 44% 37% 5% 0% 8% 0% 1% 0%
RO 3% 60% 30% 4% 0% 1% 0% 2% 0%
SK 17% 23% 21% 11% 0% 19% 0% 9% 0%
SI 9% 53% 24% 0% 0% 10% 0% 4% 0%
ES 2% 40% 51% 2% 0% 4% 0% 0% 0%
SE 58% 17% 5% 2% 0% 11% 0% 7% 0%
UK 20% 3% 1% 72% 0% 4% 0% 1% 0%
Table 27: Share of the service sector stock by product type and country
Country Portable
Small
Split (<5 kW)
Big Split
(>5 kW, incl. ducted)
VRF
Rooftop
+ Packaged
Chillers
(A/W) < 400 kW
Chillers
(A/W) > 400 kW
Chillers
(W/W) < 400 kW
Chillers
(W/W) > 400 kW
AT 0% 4% 8% 13% 1% 12% 26% 8% 27%
BE 1% 15% 20% 17% 0% 5% 12% 11% 19%
BG 0% 17% 24% 33% 1% 2% 5% 3% 15%
HR 0% 17% 24% 33% 1% 2% 5% 3% 15%
CY 12% 18% 15% 5% 18% 21% 2% 9% 0%
CZ 0% 17% 25% 22% 1% 7% 12% 3% 12%
DK 0% 32% 15% 1% 0% 11% 16% 9% 15%
EE 1% 4% 6% 6% 0% 17% 13% 14% 39%
FI 1% 4% 6% 6% 0% 17% 13% 14% 39%
FR 0% 8% 29% 22% 7% 12% 12% 2% 8%
DE 3% 6% 18% 23% 0% 12% 14% 9% 15%
EL 6% 18% 23% 0% 12% 14% 9% 15% 0%
HU 1% 30% 26% 1% 2% 9% 17% 3% 11%
IE 2% 6% 31% 30% 1% 7% 16% 1% 6%
IT 0% 12% 18% 15% 5% 18% 21% 2% 9%
LV 1% 4% 6% 6% 0% 17% 13% 14% 39%
LT 1% 4% 6% 6% 0% 17% 13% 14% 39%
LU 0% 8% 29% 22% 7% 12% 12% 2% 8%
MT 0% 12% 18% 15% 5% 18% 21% 2% 9%
NL 1% 13% 18% 14% 1% 19% 13% 6% 16%
PL 0% 21% 26% 18% 1% 8% 13% 3% 9%
PT 0% 9% 31% 28% 6% 8% 10% 1% 6%
RO 0% 17% 24% 33% 1% 2% 5% 3% 15%
SK 0% 17% 25% 22% 1% 7% 12% 3% 12%
SI 1% 30% 26% 1% 2% 9% 17% 3% 11%
ES 0% 9% 30% 17% 15% 10% 14% 1% 4%
SE 0% 32% 15% 1% 0% 11% 16% 9% 15%
UK 2% 6% 31% 30% 1% 7% 16% 1% 6%
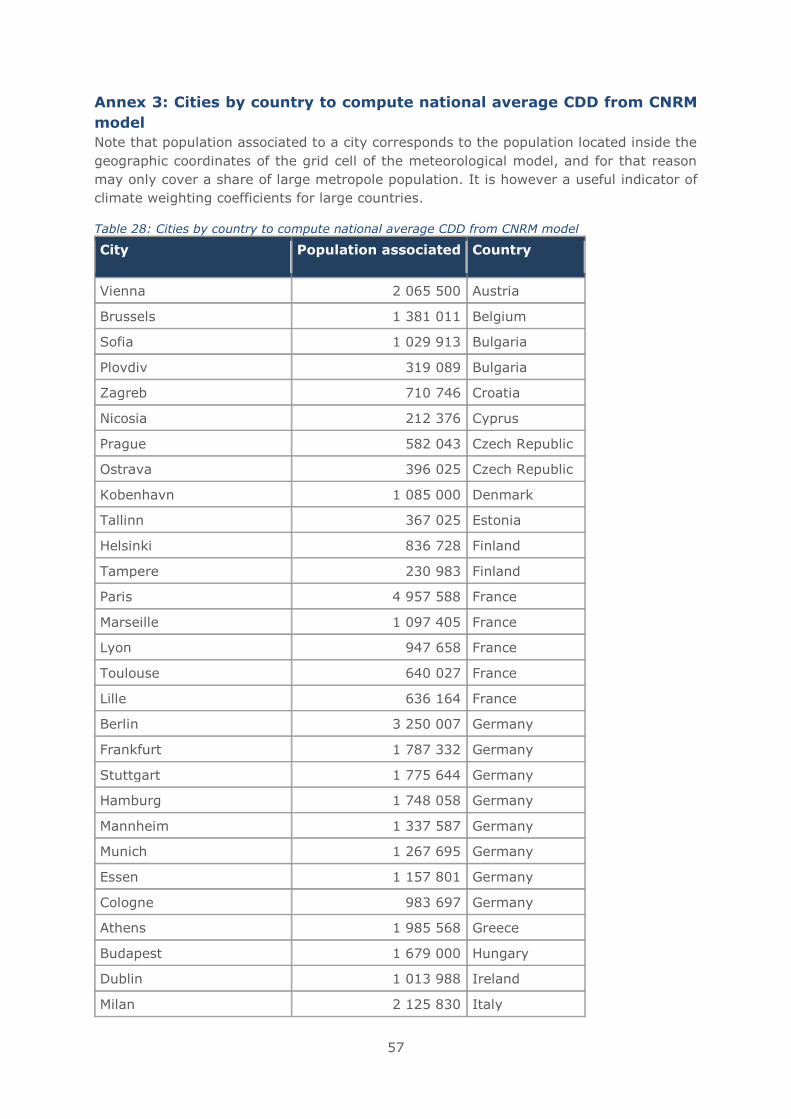
57
Annex 3: Cities by country to compute national average CDD from CNRM
model
Note that population associated to a city corresponds to the population located inside the
geographic coordinates of the grid cell of the meteorological model, and for that reason
may only cover a share of large metropole population. It is however a useful indicator of
climate weighting coefficients for large countries.
Table 28: Cities by country to compute national average CDD from CNRM model
City Population associated Country
Vienna 2 065 500 Austria
Brussels 1 381 011 Belgium
Sofia 1 029 913 Bulgaria
Plovdiv 319 089 Bulgaria
Zagreb 710 746 Croatia
Nicosia 212 376 Cyprus
Prague 582 043 Czech Republic
Ostrava 396 025 Czech Republic
Kobenhavn 1 085 000 Denmark
Tallinn 367 025 Estonia
Helsinki 836 728 Finland
Tampere 230 983 Finland
Paris 4 957 588 France
Marseille 1 097 405 France
Lyon 947 658 France
Toulouse 640 027 France
Lille 636 164 France
Berlin 3 250 007 Germany
Frankfurt 1 787 332 Germany
Stuttgart 1 775 644 Germany
Hamburg 1 748 058 Germany
Mannheim 1 337 587 Germany
Munich 1 267 695 Germany
Essen 1 157 801 Germany
Cologne 983 697 Germany
Athens 1 985 568 Greece
Budapest 1 679 000 Hungary
Dublin 1 013 988 Ireland
Milan 2 125 830 Italy
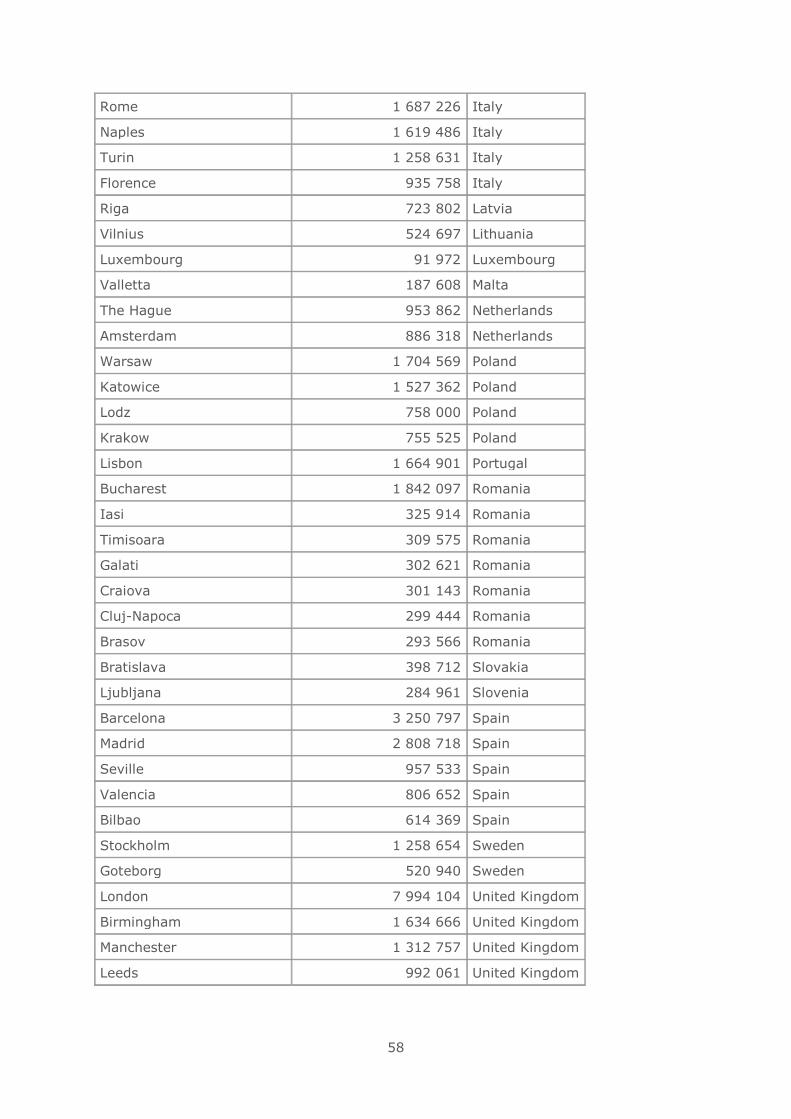
58
Rome 1 687 226 Italy
Naples 1 619 486 Italy
Turin 1 258 631 Italy
Florence 935 758 Italy
Riga 723 802 Latvia
Vilnius 524 697 Lithuania
Luxembourg 91 972 Luxembourg
Valletta 187 608 Malta
The Hague 953 862 Netherlands
Amsterdam 886 318 Netherlands
Warsaw 1 704 569 Poland
Katowice 1 527 362 Poland
Lodz 758 000 Poland
Krakow 755 525 Poland
Lisbon 1 664 901 Portugal
Bucharest 1 842 097 Romania
Iasi 325 914 Romania
Timisoara 309 575 Romania
Galati 302 621 Romania
Craiova 301 143 Romania
Cluj-Napoca 299 444 Romania
Brasov 293 566 Romania
Bratislava 398 712 Slovakia
Ljubljana 284 961 Slovenia
Barcelona 3 250 797 Spain
Madrid 2 808 718 Spain
Seville 957 533 Spain
Valencia 806 652 Spain
Bilbao 614 369 Spain
Stockholm 1 258 654 Sweden
Goteborg 520 940 Sweden
London 7 994 104 United Kingdom
Birmingham 1 634 666 United Kingdom
Manchester 1 312 757 United Kingdom
Leeds 992 061 United Kingdom
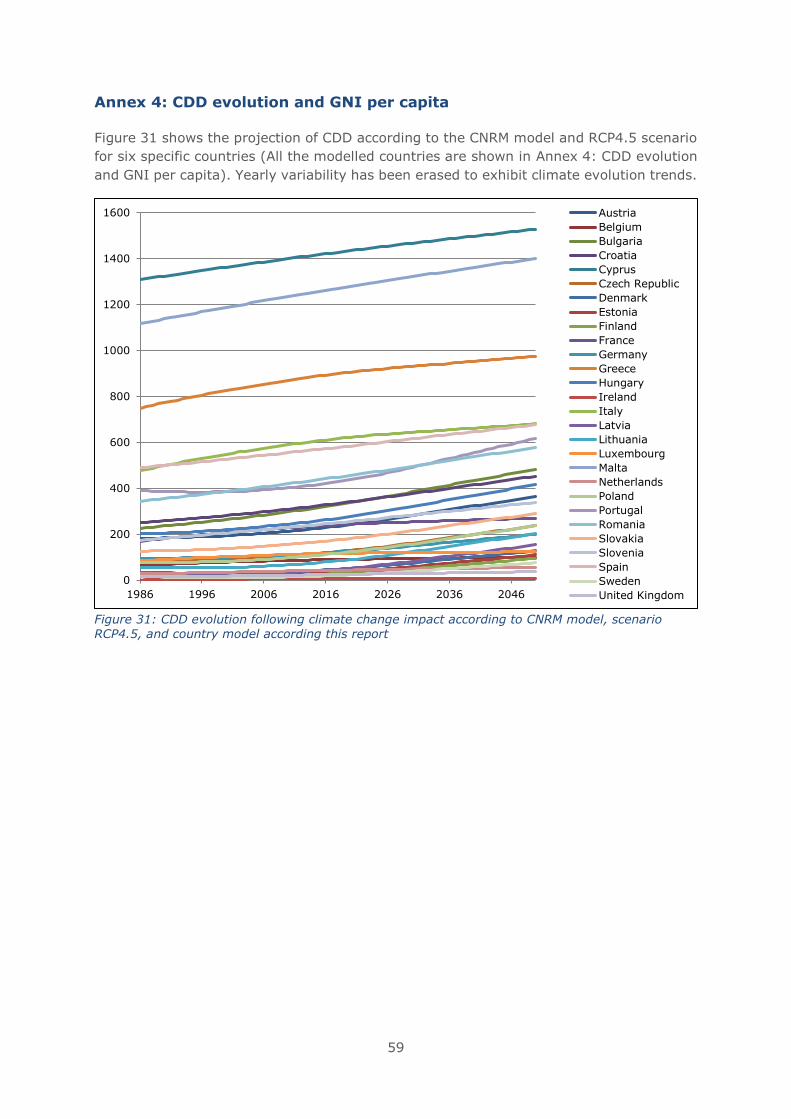
59
Annex 4: CDD evolution and GNI per capita
Figure 31 shows the projection of CDD according to the CNRM model and RCP4.5 scenario
for six specific countries (All the modelled countries are shown in Annex 4: CDD evolution
and GNI per capita). Yearly variability has been erased to exhibit climate evolution trends.
Figure 31: CDD evolution following climate change impact according to CNRM model, scenario RCP4.5, and country model according this report
0
200
400
600
800
1000
1200
1400
1600
1986 1996 2006 2016 2026 2036 2046
Austria
Belgium
Bulgaria
Croatia
Cyprus
Czech Republic
Denmark
Estonia
Finland
France
Germany
Greece
Hungary
Ireland
Italy
Latvia
Lithuania
Luxembourg
Malta
Netherlands
Poland
Portugal
Romania
Slovakia
Slovenia
Spain
Sweden
United Kingdom
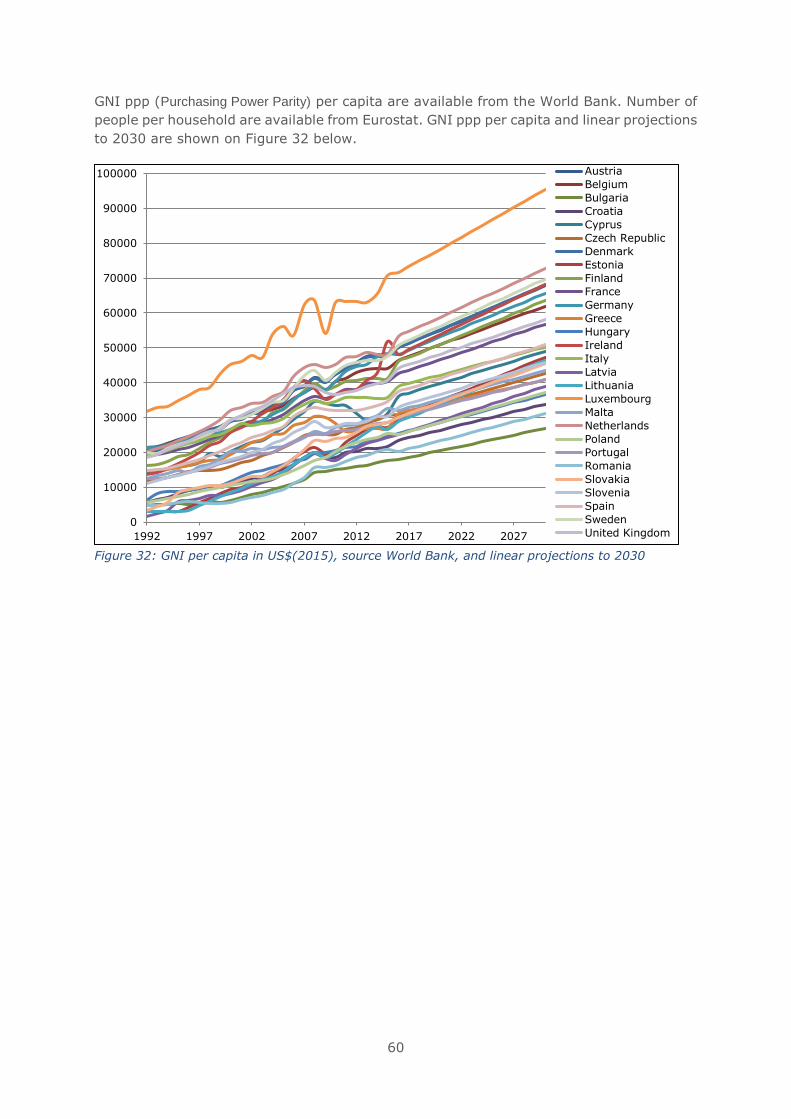
60
GNI ppp (Purchasing Power Parity) per capita are available from the World Bank. Number of
people per household are available from Eurostat. GNI ppp per capita and linear projections
to 2030 are shown on Figure 32 below.
Figure 32: GNI per capita in US$(2015), source World Bank, and linear projections to 2030
0
10000
20000
30000
40000
50000
60000
70000
80000
90000
100000
1992 1997 2002 2007 2012 2017 2022 2027
Austria
Belgium
Bulgaria
Croatia
Cyprus
Czech Republic
Denmark
Estonia
Finland
France
Germany
Greece
Hungary
Ireland
Italy
Latvia
Lithuania
Luxembourg
Malta
Netherlands
Poland
Portugal
Romania
Slovakia
Slovenia
Spain
Sweden
United Kingdom
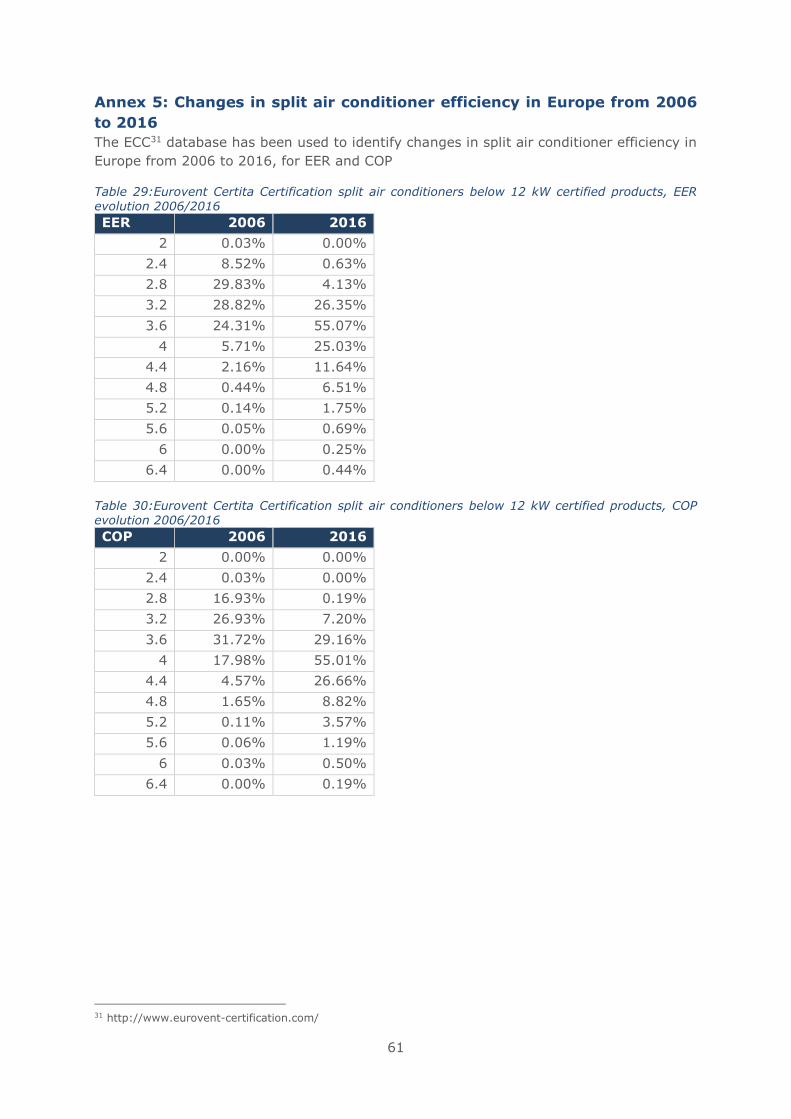
61
Annex 5: Changes in split air conditioner efficiency in Europe from 2006
to 2016
The ECC31 database has been used to identify changes in split air conditioner efficiency in
Europe from 2006 to 2016, for EER and COP
Table 29:Eurovent Certita Certification split air conditioners below 12 kW certified products, EER evolution 2006/2016
EER 2006 2016
2 0.03% 0.00%
2.4 8.52% 0.63%
2.8 29.83% 4.13%
3.2 28.82% 26.35%
3.6 24.31% 55.07%
4 5.71% 25.03%
4.4 2.16% 11.64%
4.8 0.44% 6.51%
5.2 0.14% 1.75%
5.6 0.05% 0.69%
6 0.00% 0.25%
6.4 0.00% 0.44%
Table 30:Eurovent Certita Certification split air conditioners below 12 kW certified products, COP evolution 2006/2016
COP 2006 2016
2 0.00% 0.00%
2.4 0.03% 0.00%
2.8 16.93% 0.19%
3.2 26.93% 7.20%
3.6 31.72% 29.16%
4 17.98% 55.01%
4.4 4.57% 26.66%
4.8 1.65% 8.82%
5.2 0.11% 3.57%
5.6 0.06% 1.19%
6 0.03% 0.50%
6.4 0.00% 0.19%
31 http://www.eurovent-certification.com/
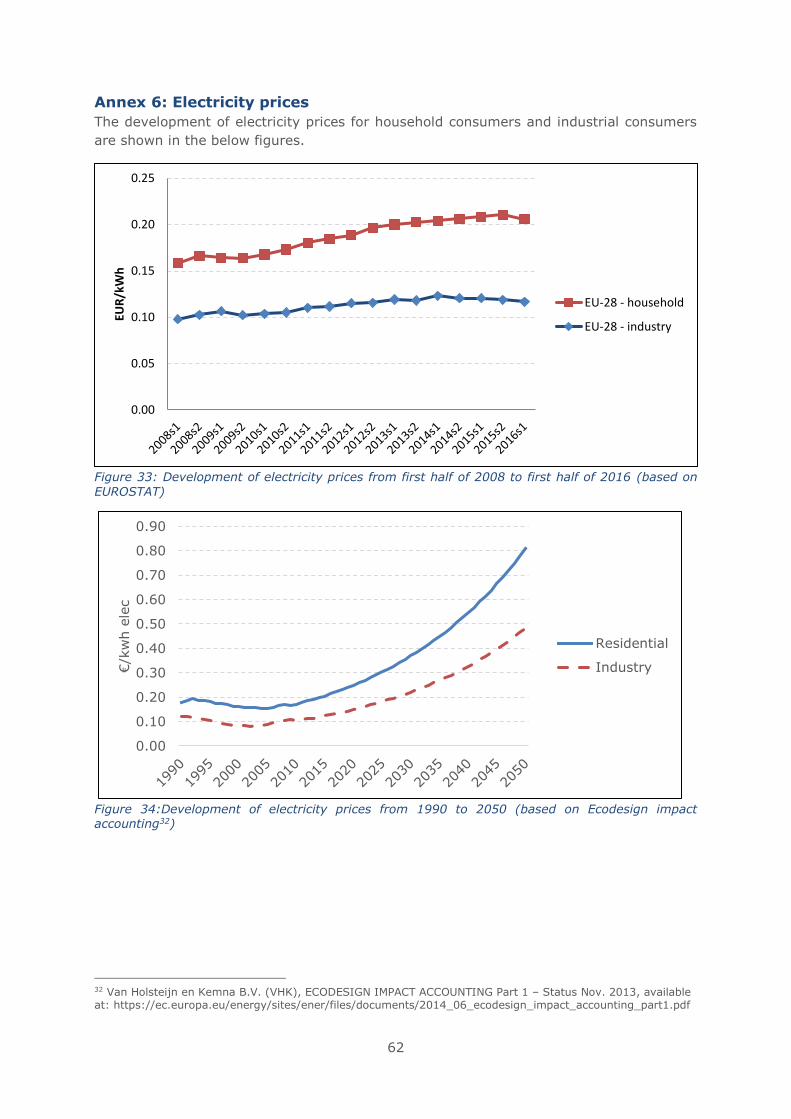
62
Annex 6: Electricity prices
The development of electricity prices for household consumers and industrial consumers
are shown in the below figures.
Figure 33: Development of electricity prices from first half of 2008 to first half of 2016 (based on
EUROSTAT)
Figure 34:Development of electricity prices from 1990 to 2050 (based on Ecodesign impact accounting32)
32 Van Holsteijn en Kemna B.V. (VHK), ECODESIGN IMPACT ACCOUNTING Part 1 – Status Nov. 2013, available at: https://ec.europa.eu/energy/sites/ener/files/documents/2014_06_ecodesign_impact_accounting_part1.pdf
0.00
0.05
0.10
0.15
0.20
0.25
EUR
/kW
h
EU-28 - household
EU-28 - industry
0.00
0.10
0.20
0.30
0.40
0.50
0.60
0.70
0.80
0.90
€/k
wh e
lec
Residential
Industry

1
Review of Regulation 206/2012 and
626/2011
Air conditioners and comfort fans
Task 3 report
Users
Final version
Date: May 2018
2
Prepared by:
Viegand Maagøe and ARMINES
Study team: Baijia Huang, Jan Viegand, Peter Martin Skov Hansen, Philippe Riviere
Quality manager: Jan Viegand
Website design and management: Viegand Maagøe A/S
Contract manager: Viegand Maagøe A/S
Prepared for:
European Commission
DG ENER C.3
Office: DM24 04/048
B-1049 Brussels, Belgium
Contact person: Veerle Beelaerts
E-mail: [email protected]
Project website: www.eco-airconditioners.eu
Specific contract no.: No. ENER/C3/FV 2016-537/03/FWC 2015-619
LOT2/01/SI2.749247
Implements Framework Contract: № ENER/C3/2015-619 LOT 2
This study was ordered and paid for by the European Commission, Directorate-General
for Energy.
As agreed with Policy Officer Veerle Beelaerts, some of the budget for data purchase was
reallocated for project work.
The information and views set out in this study are those of the author(s) and do not
necessarily reflect the official opinion of the Commission. The Commission does not
guarantee the accuracy of the data included in this study. Neither the Commission nor any
person acting on the Commission’s behalf may be held responsible for the use which may
be made of the information contained therein.
This report has been prepared by the authors to the best of their ability and knowledge.
The authors do not assume liability for any damage, material or immaterial, that may arise
from the use of the report or the information contained therein.
© European Union, May 2018.
Reproduction is authorised provided the source is acknowledged.
More information on the European Union is available on the internet (http://europa.eu).
Viegand Maagøe A/S
Nr. Farimagsgade 37
1364 Copenhagen K
Denmark
viegandmaagoe.dk
3
Table of contents
List of tables ......................................................................................................... 4
List of figures ........................................................................................................ 5
Abbreviations ........................................................................................................ 6
Introduction to the task reports ............................................................................... 7
3 Task 3............................................................................................................ 9
3.1 System aspects use phase ........................................................................... 9
3.1.1 Basics of energy consumption of air conditioners .....................................10
3.1.2 Cooling loads and SEER metrics parameters ............................................12
3.1.3 Heating loads and SCOP metrics parameters ...........................................26
3.1.4 Crankcase heater in SEER and SCOP metrics ...........................................29
3.1.5 Bivalent temperature in SCOP metrics ....................................................31
3.1.6 Case of portable air conditioners ............................................................33
3.1.7 Real life versus standard performances ...................................................51
3.1.8 Use patterns of comfort fans .................................................................54
3.2 End-of-life behaviours ................................................................................54
3.2.1 Product use and stock life .....................................................................54
3.2.2 Repair and maintenance practice ...........................................................57
3.2.3 Estimated second hand use ...................................................................60
3.2.4 Best practice in sustainable product use .................................................60
3.3 Local infrastructure ....................................................................................61
3.3.1 Electricity ............................................................................................61
3.3.2 Smart appliances .................................................................................66
3.4 Conclusions and recommendations ..............................................................69
Annex 1: Preparatory study Building Energy Simulation input .................................72
4
List of tables Table 1: Cooling load versus cooling degree days, source preparatory study. * indicates
CDD values not given in Preparatory study, these are issued from ASHRAE IWEC data.
Below in red shows that cooling loads appear very high as compared to the cooling
degree day (CDD) indicator in Nordic countries and other central Europe countries with
simulated low U values. .........................................................................................13
Table 2: Estimated weighted average (by cooled floor area) CDD and specific demand for
EU28 ..................................................................................................................20
Table 3: typical practices indicated by the industry ...................................................23
Table 4: Evaluation of monthly residential cooling degree days base 20.5 °C ...............26
Table 5: Equivalent full load hours calculation in Regulation 206/2012 ........................28
Table 6: Stakeholder view of good sizing practice in heating mode for air-to-air heat
pumps (capacities indicated at + 7°C standard rated capacities according to EN14511-2
standard) ............................................................................................................28
Table 7: Hours per mode in cooling mode in Regulation 206/2012 and proposed changes
..........................................................................................................................30
Table 8: Correction of power mode hours of heating only heat pumps (values to be
corrected in red) ..................................................................................................31
Table 9: Bivalent and operation limit temperatures according to climate in Regulation
(EU) no 206/2012 ................................................................................................32
Table 10: Bin number j, outdoor temperature Tj in oC and number of hours per bin hj
corresponding to the reference cooling season .........................................................38
Table 11: Summary of seasonal performance calculations, case A to C. Note 1:
equilibrium is the intersection between load and unit capacity corrected for infiltration at
27 °C indoor temperature. .....................................................................................44
Table 12: SEERon calculaiton details for a standard single duct unit ............................50
Table 13: Different definitions of lifetime .................................................................54
Table 14: Average lifetime assumptions adopted to the current study .........................57
Table 15: Upper estimates of the annual leakage rate ...............................................59
Regarding comfort fans the best sustainable product use is based on preparatory study.
The preparatory study suggests using fans with variable speeds and curved blades.
Besides this proper sizing is also important. Tre proper fan size dependent on the room
area is presented in Table 16.Table 16: Ideal fan width depending on the room area ....61
Table 17: Monthly electricity consumption ...............................................................64
Table 18 Average lifetime assumptions adopted to the current study ..........................70
Table 19: Construction, Internal Load and cooling equipment characteristics for
Residence ............................................................................................................72
Table 20: Construction, Internal Load and cooling equipment characteristics for Office ..73
Table 21: Construction, Internal Load and cooling equipment characteristics for retail ...74
Table 22: U values for old and new construction in different climates ..........................75
Table 23: Internal Gains ........................................................................................76
Table 24: Schedules for shop .................................................................................76
Table 25: Schedules for office ................................................................................76
Table 26: Schedules for residences .........................................................................77
5
List of figures Figure 1: Yearly cooling load versus cooling degree days (CDD) with base temperature 18
°C, source preparatory study. ................................................................................12
Figure 2: Average building cooling loads of some district cooling networks in Europe. ...14
Figure 3: Dependency of final specific energy consumption for cooling and useful cooling
demand in residencies of USA on climatic conditions in kWh/m2 (of total dwelling
surface)/year. ......................................................................................................15
Figure 4: Dependency of final specific energy consumption for cooling and useful cooling
demand in residencies of USA on climatic conditions reported to total dwelling are and to
cooled area only, adapted from (Jakubcionis and Carlsson, 2017). ..............................15
Figure 5: Simulation of cooling loads of typical old buildings, source ENTRANZE project 16
Figure 6: Comparison of residential cooling loads from different sources......................16
Figure 7: Comparison of service cooling loads from different sources ..........................17
Figure 8: Specific demand per country in residences and correlation, adapted from
preparatory study .................................................................................................19
Figure 9: Specific demand per country in services and correlation, adapted from
preparatory study .................................................................................................19
Figure 10: Link between field measured seasonal efficiency in cooling and in heating
mode, climate and unit sizing (A 95%tile load of 50% means that during 95% of the time
the part load ratio of the unit was 50% or lower - 100% partial load, means full capacity
of the unit) ..........................................................................................................21
Figure 11: Maximum cooling load in W/m2 and cooling degree days, source preparatory
study; CDD values not given in Preparatory study ....................................................22
Figure 12: Residential and services average maximum cooling load in W/m2 and cooling
degree days, source preparatory study....................................................................23
Figure 13: Impact of infiltration on heating capacity of reversible single duct unit in
average climate. Red point is EN14511 rated heating capacity. ..................................35
Figure 14: Impact of infiltration on heating capacity of reversible double duct unit in
average climate. Red point is EN14511 rated heating capacity. ..................................35
Figure 15: Evolution of load, capacity supplied, capacity with and without infiltration,
capacity ratio and EER for base case single duct .......................................................39
Figure 16: Hours of use per mode in the Burke study for residential portable air
conditioner sites ...................................................................................................40
Figure 17: Evolution of load, capacity supplied, capacity with and without infiltration,
capacity ratio and EER for standard double duct in the EU .........................................42
Figure 18: Evolution of load, capacity supplied, capacity with and without infiltration,
capacity ratio and EER for single duct used declared as single duct and used as double
duct ....................................................................................................................43
Figure 19 Lifetime for different types of air conditioners according to several sources ...56
Figure 20 Hourly labour cost in €, 2016 for European countries ..................................57
Figure 21: Net electricity generation, EU-28, 2015 (% of total, based on GWh) ............62
Figure 22: Hourly load values a random day in March ...............................................65
Figure 23:Hourly load values a random day in March and July - Spain .........................66
Figure 24: Composition of the electricity prices for household consumers ....................68
6
Abbreviations COP Coefficient of Performance for air conditioners
in heating mode
BLc Annual cooling load per square meter of room
area (kWh/m2/year/)
CDD Cooling Degree Day
EER Energy Efficiency Ratio for air conditioners in
cooling mode
GWP Global warming potential
HCK The number of hours the unit is considered to
work in crankcase heater mode for air
conditioners
HOFF The number of hours the unit is considered to
work in off mode for air conditioners
HSB The number of hours the unit is considered to
work in standby mode for air conditioners
HTO The number of hours the unit is considered to
work in thermostat off mode for air conditioners
INF Infiltration in kW (cooling capacity lost -
negative capacity value - because of
infiltration)
PCK The electricity consumption during crankcase
heater mode for air conditioners
POFF The electricity consumption during off mode.
PSB The electricity consumption during standby
mode for air conditioners
PTO The electricity consumption during thermostat
off mode for air conditioners
QCE The reference annual cooling demand for air
conditioners in cooling mode
QHE The reference annual heating demand for air
conditioners in heating mode
Sc Sizing coefficient for cooling
SCOP Seasonal Coefficient of Performance for air
conditioners, heating mode
SEER Seasonal Energy Efficiency Ratio for air
conditioners, cooling mode
SHR Sensible Heat Ratio for air conditioners
VRF Variable Refrigerant Flow
7
Introduction to the task reports This is the introduction to the interim report of the preparatory study on the Review of
Regulation 206/2012 and 626/2011 for air conditioners and comfort fans. The interim
report has been split into five tasks, following the structure of the MEErP methodology.
Each task report has been uploaded individually in the project’s website. These task
reports present the technical basis to define future ecodesign and energy labelling
requirements based on the existing Regulation (EU) 206/2012 and 626/2011.
The task reports start with the definition of the scope for this review study (i.e. task 1),
which assesses the current scope of the existing regulation in light of recent
developments with relevant legislation, standardisation and voluntary agreements in the
EU and abroad. Furthermore, assessing the possibility of merging implementing
measures that cover the similar groups of products or extend the scope to include new
product groups. The assessment results in a refined scope for this review study.
Following it is task 2, which updates the annual sales and stock of the products in scope
according to recent and future market trends and estimates future stocks. Furthermore,
it provides an update on the current development of low-GWP alternatives and sound
pressure level.
Next task is task 3, which presents a detailed overview of use patterns of products in scope
according to consumer use and technological developments. It also provides an analysis of
other aspects that affect the energy consumption during the use of these products, such
as component technologies. Furthermore, it also touches on aspects that are important for
material and resource efficiency such as repair and maintenance, and it gives an overview
of what happens to these products at their end of life.
Task 4 presents an analysis of current average technologies at product and component
level, and it identifies the Best Available Technologies both at product and component level.
An overview of the technical specifications as well as their overall energy consumption is
provided when data is available. Finally, the chapter discusses possible design options to
improve the resource efficiency.
Simplified tasks 5 & 6 report presents the base cases, which will be later used to define
the current and future impact of the current air condition regulation if no action is taken.
The report shows the base cases energy consumption at product category level and their
life cycle costs. It also provides a high-level overview of the life cycle global warming
potential of air conditioners and comfort fans giving an idea of the contribution of each
life cycle stage to the overall environmental impact. Finally, it presents some identified
design options which will be used to define reviewed ecodesign and energy labelling
requirements.
Task 7 report presents the policy options for an amended ecodesign regulation on air
conditioners and comfort fans. The options have been developed based on the work
throughout this review study, dialogue with stakeholders and with the European
Commission. The report presents an overview of the barriers and opportunities for the
reviewed energy efficiency policy options, and the rationale for the new
material/refrigerant efficiency policy options. This report will be the basis to calculate the
estimated energy and material savings potentials by implementing these policy options,
in comparison to no action (i.e. Business as Usual – BAU).

8
The task reports follow the MEErP methodology, with some adaptations which suit the
study goals.
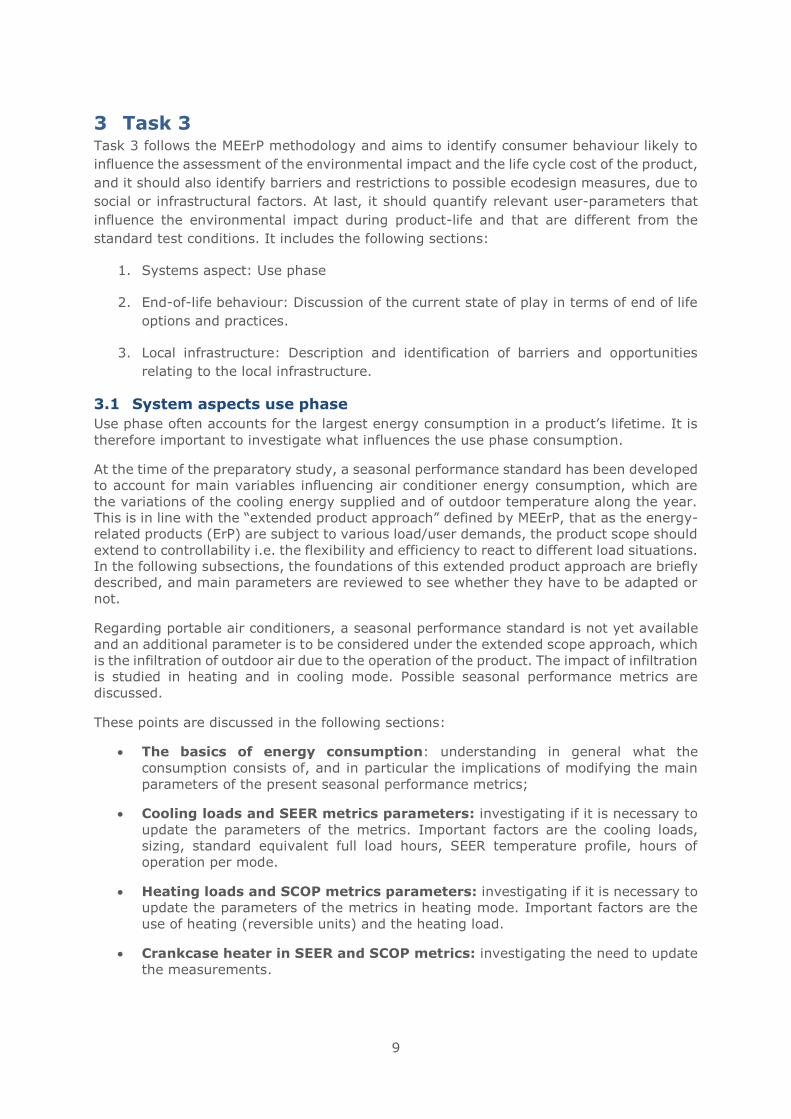
9
3 Task 3 Task 3 follows the MEErP methodology and aims to identify consumer behaviour likely to
influence the assessment of the environmental impact and the life cycle cost of the product,
and it should also identify barriers and restrictions to possible ecodesign measures, due to
social or infrastructural factors. At last, it should quantify relevant user-parameters that
influence the environmental impact during product-life and that are different from the
standard test conditions. It includes the following sections:
1. Systems aspect: Use phase
2. End-of-life behaviour: Discussion of the current state of play in terms of end of life
options and practices.
3. Local infrastructure: Description and identification of barriers and opportunities
relating to the local infrastructure.
3.1 System aspects use phase
Use phase often accounts for the largest energy consumption in a product’s lifetime. It is
therefore important to investigate what influences the use phase consumption.
At the time of the preparatory study, a seasonal performance standard has been developed
to account for main variables influencing air conditioner energy consumption, which are
the variations of the cooling energy supplied and of outdoor temperature along the year.
This is in line with the “extended product approach” defined by MEErP, that as the energy-
related products (ErP) are subject to various load/user demands, the product scope should
extend to controllability i.e. the flexibility and efficiency to react to different load situations.
In the following subsections, the foundations of this extended product approach are briefly
described, and main parameters are reviewed to see whether they have to be adapted or
not.
Regarding portable air conditioners, a seasonal performance standard is not yet available
and an additional parameter is to be considered under the extended scope approach, which
is the infiltration of outdoor air due to the operation of the product. The impact of infiltration
is studied in heating and in cooling mode. Possible seasonal performance metrics are
discussed.
These points are discussed in the following sections:
• The basics of energy consumption: understanding in general what the
consumption consists of, and in particular the implications of modifying the main
parameters of the present seasonal performance metrics;
• Cooling loads and SEER metrics parameters: investigating if it is necessary to
update the parameters of the metrics. Important factors are the cooling loads,
sizing, standard equivalent full load hours, SEER temperature profile, hours of
operation per mode.
• Heating loads and SCOP metrics parameters: investigating if it is necessary to
update the parameters of the metrics in heating mode. Important factors are the
use of heating (reversible units) and the heating load.
• Crankcase heater in SEER and SCOP metrics: investigating the need to update
the measurements.
10
• Case of portable air conditioners: investigating the infiltration of air and
whether seasonal performance cooling metrics should be adopted.
• Real life versus standard performance and the impact of proper maintenance.
• In the case of comfort fans, the use patterns of comfort fans.
3.1.1 Basics of energy consumption of air conditioners
The energy consumption used for cooling/heating by air conditioners (reversible air
conditioner) depends on the cooling load (respectively cooling and heating load), product
efficiency for hours with cooling SEERon (or heating SCOPon) and consumption of the unit
in auxiliary modes (thermostat-off, standby, crankcase heater).
Cooling energy consumption is calculated via the following equation:
𝑄𝐶𝐸 (𝑘𝑊ℎ) =𝑄𝐶
𝑆𝐸𝐸𝑅𝑜𝑛
+ 𝐻𝑇𝑂 × 𝑃𝑇𝑂 + 𝐻𝑆𝐵 × 𝑃𝑆𝐵 + 𝐻𝐶𝐾 × 𝑃𝐶𝐾 + 𝐻𝑂𝐹𝐹 × 𝑃𝑂𝐹𝐹
Where:
• QCE = Annual electricity consumption for cooling, expressed in kWh/a
• QC = The reference annual cooling demand, expressed in kWh/a
• HTO, HSB, HCK, HOFF = the number of hours the unit is considered to work in
respectively thermostat off mode, standby mode, crankcase heater mode and off
mode.
• PTO, PSB, PCK, POFF = the electricity consumption during respectively thermostat off
mode, standby mode, crankcase heater mode and off mode, expressed in kW
The cooling load is the sum of the transmission heat losses, air change due to ventilation
and infiltration, internal loads (heat loads due to people and equipment releasing heat
inside the building) and solar heat gains to maintain a desired room temperature.
Transmission and air change losses mainly depend on temperature difference
indoor/outdoor, hence on climate and indoor set point temperature and the building
envelope. In addition, there may be dehumidification loads due to moisture condensation
on cold coils of cooling equipment.
The cooling load of a cooled area/building is in general given in annual kWh of cooling load
per square meter of room area (noted as BLc). This is the useful unit for the building but
has no meaning for the product itself. What matters for a product consumption is the
cooling energy it supplies, or kWh cooling load per product noted below as Qce (product).
In Regulation 206/2012, it is supposed what is called a “perfect sizing” condition, which
means the capacity of the unit at design conditions is exactly matching the maximum
cooling load in these same conditions.
The link between the product and building loads is then derived as follows:
𝑄𝐶(𝑝𝑟𝑜𝑑𝑢𝑐𝑡) = 𝑃𝑑𝑒𝑠𝑖𝑔𝑛𝑐 (𝑖𝑛 𝑘𝑊) × 𝐻𝐶𝐸 (𝑖𝑛 ℎ𝑜𝑢𝑟𝑠)
and 𝐻𝐶𝐸 =𝐵𝐿𝑐 (𝑘𝑊ℎ/𝑚2/𝑦)
𝑆𝑐 (𝑊/𝑚2)
With:
• Sc: the sizing coefficient for cooling (Sc), which is the ratio linking the maximal
cooling load at design conditions and the cooled area,
11
• HCE: the equivalent number of full load cooling hours,
• Pdesignc: the maximum building cooling needs in kW, which is equal to the
maximum cooling capacity of the unit.
It is important to notice that the higher the sizing coefficient Sc, the lower the number of
equivalent hours HCE, the lower the reference annual cooling demand QC and the lower is
the energy consumption
Regarding the seasonal cooling efficiency of a given unit over a season, it depends on:
• the indoor and outdoor temperatures of operation,
• the indoor humidity,
• the load ratio of the unit (ratio of building cooling load to unit capacity), which in
turn depends on the sizing of the unit and on the unit's capability to modulate its
capacity,
• the indoor air flow set by the end-user (in general the outdoor air flow is fixed by
the unit controller),
• its power consumption when it is not cooling,
• and the maintenance of the unit.
Oversizing here may lead to decrease in efficiency and then to an increase in energy
consumption; this depends on efficiency variation with loads and also whether consumption
of the unit when compressor is not working is proportional or not to the size of the unit. It
is also important to notice that reducing the equivalent number of full load cooling hours
(Hce) tends to increase the weight of low power mode consumption and then to reduce
efficiency (increasing the gap between SEERon and SEER).
Regarding heating, what has been discussed above for cooling load is also valid for heating
load, with two main differences:
• there is no latent load for heating,
• in heating mode, products may not be designed to supply by themselves the whole
heating capacity of the building at design conditions due to e.g. the sizing was done
according to the cooling load (for reversible units), therefore part of the heat may
be supplied by a back-up heater1 (result of an economic optimization) so that
Pdesignh is a declaration of the manufacturer.
Using the same notations but replacing c for cooling by h for heating:
𝑄𝐻(𝑏𝑢𝑖𝑙𝑑𝑖𝑛𝑔) = 𝑃𝑑𝑒𝑠𝑖𝑔𝑛ℎ (𝑖𝑛 𝑘𝑊) × 𝐻𝐻𝐸 (𝑖𝑛 ℎ𝑜𝑢𝑟𝑠)
and 𝐻𝐻𝐸 =𝐵𝐿ℎ (𝑘𝑊ℎ/𝑚2/𝑦)
𝑆ℎ (𝑊/𝑚2)
Still it is supposed that the declared maximum capacity of the unit plus the back-up heater
capacity at Tdesignh equals the maximum building load in the same condition to derive the
heating load of the unit. In present Regulation (EU) 206/2012, the SCOPon calculation
includes the impact of an electric back-up heater with a coefficient of performance of 1.
1 An electric back-up heater is defined in Regulation (EU) N° 206/2012, but other types might be used.
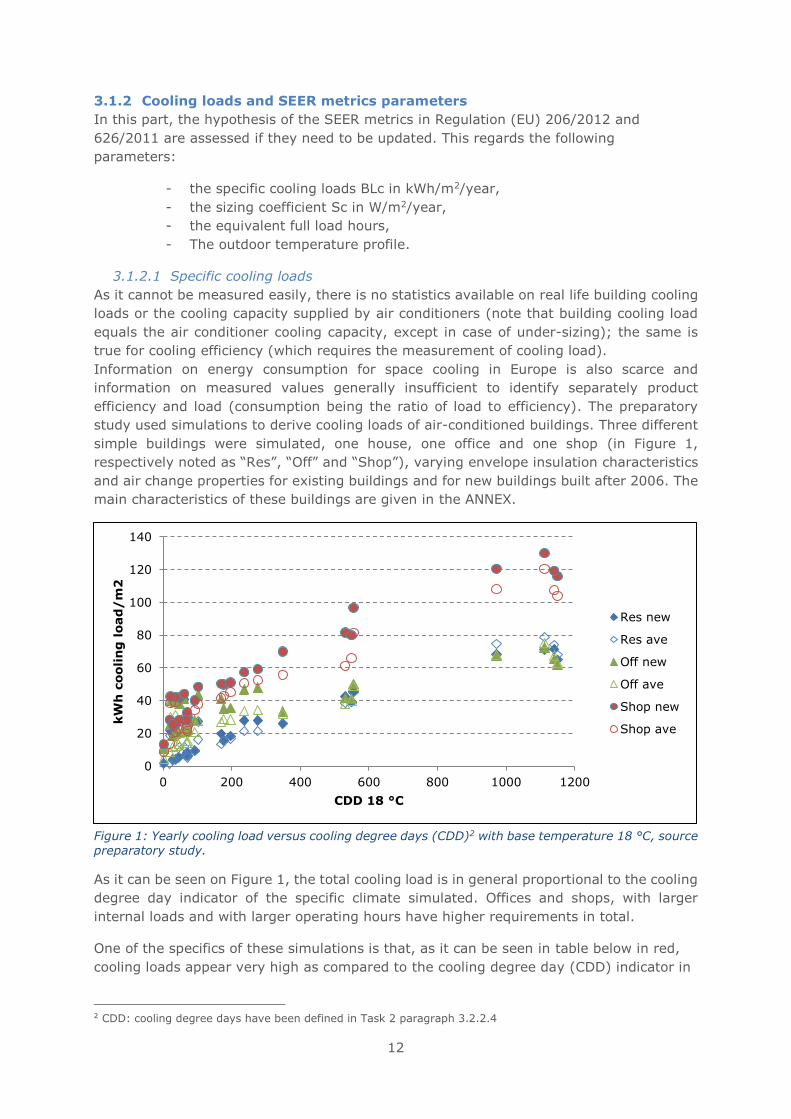
12
3.1.2 Cooling loads and SEER metrics parameters
In this part, the hypothesis of the SEER metrics in Regulation (EU) 206/2012 and
626/2011 are assessed if they need to be updated. This regards the following
parameters:
- the specific cooling loads BLc in kWh/m2/year,
- the sizing coefficient Sc in W/m2/year,
- the equivalent full load hours,
- The outdoor temperature profile.
3.1.2.1 Specific cooling loads
As it cannot be measured easily, there is no statistics available on real life building cooling
loads or the cooling capacity supplied by air conditioners (note that building cooling load
equals the air conditioner cooling capacity, except in case of under-sizing); the same is
true for cooling efficiency (which requires the measurement of cooling load).
Information on energy consumption for space cooling in Europe is also scarce and
information on measured values generally insufficient to identify separately product
efficiency and load (consumption being the ratio of load to efficiency). The preparatory
study used simulations to derive cooling loads of air-conditioned buildings. Three different
simple buildings were simulated, one house, one office and one shop (in Figure 1,
respectively noted as “Res”, “Off” and “Shop”), varying envelope insulation characteristics
and air change properties for existing buildings and for new buildings built after 2006. The
main characteristics of these buildings are given in the ANNEX.
Figure 1: Yearly cooling load versus cooling degree days (CDD)2 with base temperature 18 °C, source preparatory study.
As it can be seen on Figure 1, the total cooling load is in general proportional to the cooling
degree day indicator of the specific climate simulated. Offices and shops, with larger
internal loads and with larger operating hours have higher requirements in total.
One of the specifics of these simulations is that, as it can be seen in table below in red,
cooling loads appear very high as compared to the cooling degree day (CDD) indicator in
2 CDD: cooling degree days have been defined in Task 2 paragraph 3.2.2.4
0
20
40
60
80
100
120
140
0 200 400 600 800 1000 1200
kW
h c
ooli
ng
load
/m
2
CDD 18 °C
Res new
Res ave
Off new
Off ave
Shop new
Shop ave
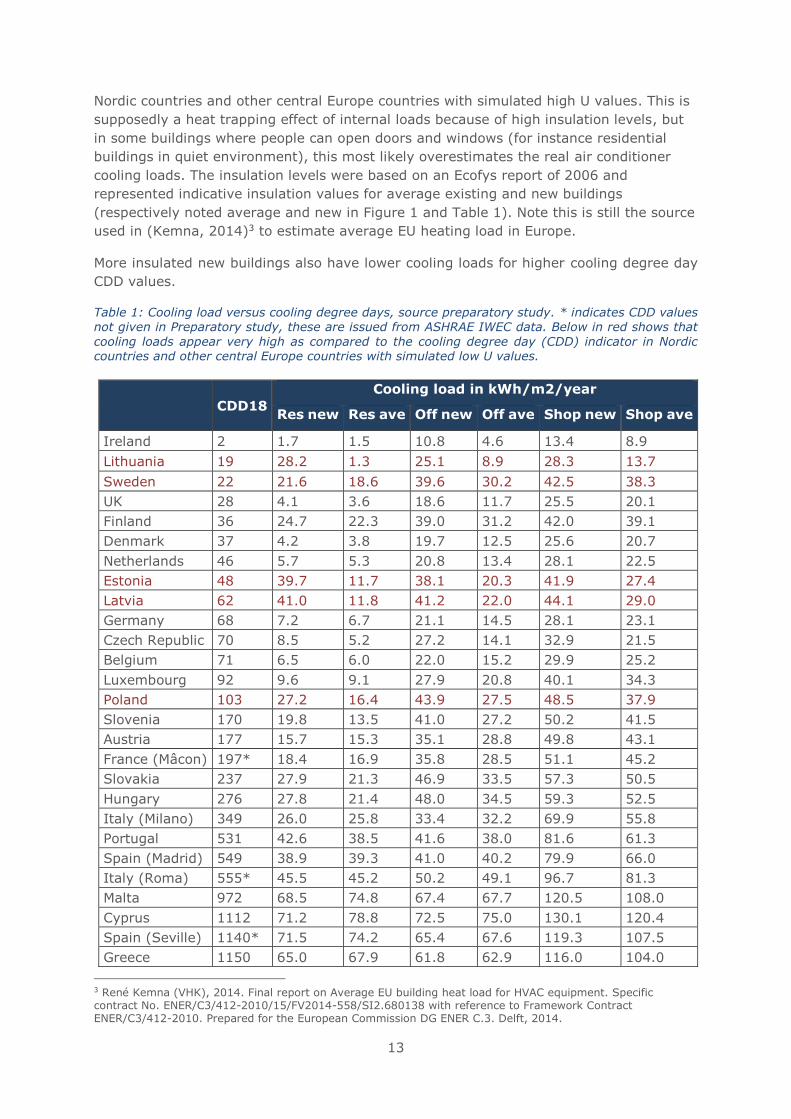
13
Nordic countries and other central Europe countries with simulated high U values. This is
supposedly a heat trapping effect of internal loads because of high insulation levels, but
in some buildings where people can open doors and windows (for instance residential
buildings in quiet environment), this most likely overestimates the real air conditioner
cooling loads. The insulation levels were based on an Ecofys report of 2006 and
represented indicative insulation values for average existing and new buildings
(respectively noted average and new in Figure 1 and Table 1). Note this is still the source
used in (Kemna, 2014)3 to estimate average EU heating load in Europe.
More insulated new buildings also have lower cooling loads for higher cooling degree day
CDD values.
Table 1: Cooling load versus cooling degree days, source preparatory study. * indicates CDD values
not given in Preparatory study, these are issued from ASHRAE IWEC data. Below in red shows that
cooling loads appear very high as compared to the cooling degree day (CDD) indicator in Nordic countries and other central Europe countries with simulated low U values.
CDD18
Cooling load in kWh/m2/year
Res new Res ave Off new Off ave Shop new Shop ave
Ireland 2 1.7 1.5 10.8 4.6 13.4 8.9
Lithuania 19 28.2 1.3 25.1 8.9 28.3 13.7
Sweden 22 21.6 18.6 39.6 30.2 42.5 38.3
UK 28 4.1 3.6 18.6 11.7 25.5 20.1
Finland 36 24.7 22.3 39.0 31.2 42.0 39.1
Denmark 37 4.2 3.8 19.7 12.5 25.6 20.7
Netherlands 46 5.7 5.3 20.8 13.4 28.1 22.5
Estonia 48 39.7 11.7 38.1 20.3 41.9 27.4
Latvia 62 41.0 11.8 41.2 22.0 44.1 29.0
Germany 68 7.2 6.7 21.1 14.5 28.1 23.1
Czech Republic 70 8.5 5.2 27.2 14.1 32.9 21.5
Belgium 71 6.5 6.0 22.0 15.2 29.9 25.2
Luxembourg 92 9.6 9.1 27.9 20.8 40.1 34.3
Poland 103 27.2 16.4 43.9 27.5 48.5 37.9
Slovenia 170 19.8 13.5 41.0 27.2 50.2 41.5
Austria 177 15.7 15.3 35.1 28.8 49.8 43.1
France (Mâcon) 197* 18.4 16.9 35.8 28.5 51.1 45.2
Slovakia 237 27.9 21.3 46.9 33.5 57.3 50.5
Hungary 276 27.8 21.4 48.0 34.5 59.3 52.5
Italy (Milano) 349 26.0 25.8 33.4 32.2 69.9 55.8
Portugal 531 42.6 38.5 41.6 38.0 81.6 61.3
Spain (Madrid) 549 38.9 39.3 41.0 40.2 79.9 66.0
Italy (Roma) 555* 45.5 45.2 50.2 49.1 96.7 81.3
Malta 972 68.5 74.8 67.4 67.7 120.5 108.0
Cyprus 1112 71.2 78.8 72.5 75.0 130.1 120.4
Spain (Seville) 1140* 71.5 74.2 65.4 67.6 119.3 107.5
Greece 1150 65.0 67.9 61.8 62.9 116.0 104.0
3 René Kemna (VHK), 2014. Final report on Average EU building heat load for HVAC equipment. Specific contract No. ENER/C3/412-2010/15/FV2014-558/SI2.680138 with reference to Framework Contract ENER/C3/412-2010. Prepared for the European Commission DG ENER C.3. Delft, 2014.
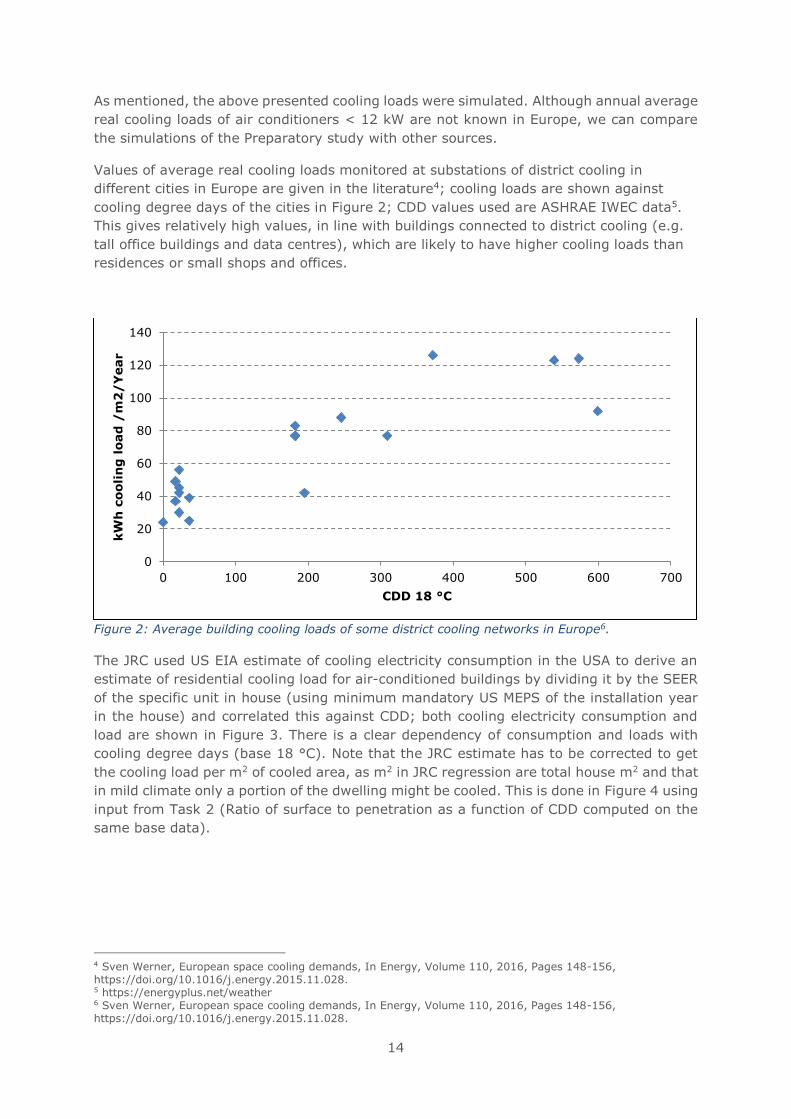
14
As mentioned, the above presented cooling loads were simulated. Although annual average
real cooling loads of air conditioners < 12 kW are not known in Europe, we can compare
the simulations of the Preparatory study with other sources.
Values of average real cooling loads monitored at substations of district cooling in
different cities in Europe are given in the literature4; cooling loads are shown against
cooling degree days of the cities in Figure 2; CDD values used are ASHRAE IWEC data5.
This gives relatively high values, in line with buildings connected to district cooling (e.g.
tall office buildings and data centres), which are likely to have higher cooling loads than
residences or small shops and offices.
Figure 2: Average building cooling loads of some district cooling networks in Europe6.
The JRC used US EIA estimate of cooling electricity consumption in the USA to derive an
estimate of residential cooling load for air-conditioned buildings by dividing it by the SEER
of the specific unit in house (using minimum mandatory US MEPS of the installation year
in the house) and correlated this against CDD; both cooling electricity consumption and
load are shown in Figure 3. There is a clear dependency of consumption and loads with
cooling degree days (base 18 °C). Note that the JRC estimate has to be corrected to get
the cooling load per m2 of cooled area, as m2 in JRC regression are total house m2 and that
in mild climate only a portion of the dwelling might be cooled. This is done in Figure 4 using
input from Task 2 (Ratio of surface to penetration as a function of CDD computed on the
same base data).
4 Sven Werner, European space cooling demands, In Energy, Volume 110, 2016, Pages 148-156, https://doi.org/10.1016/j.energy.2015.11.028. 5 https://energyplus.net/weather 6 Sven Werner, European space cooling demands, In Energy, Volume 110, 2016, Pages 148-156, https://doi.org/10.1016/j.energy.2015.11.028.
0
20
40
60
80
100
120
140
0 100 200 300 400 500 600 700
kW
h c
ooli
ng
load
/m
2/
Year
CDD 18 °C
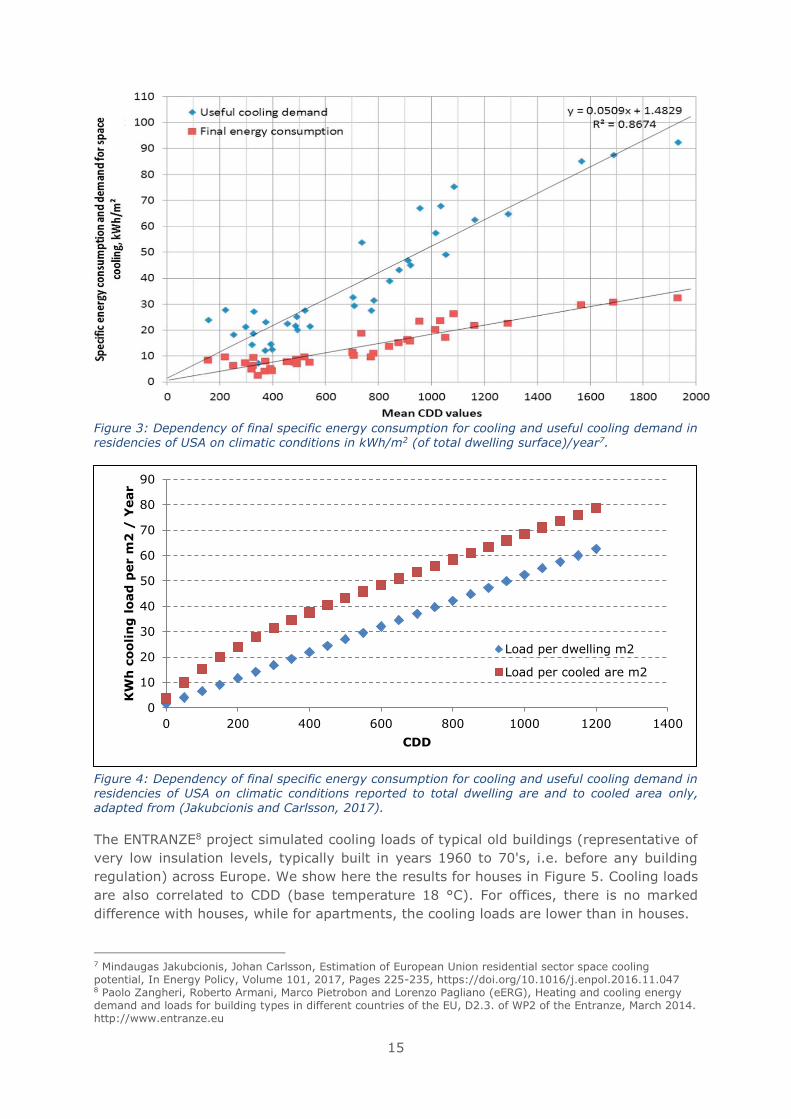
15
Figure 3: Dependency of final specific energy consumption for cooling and useful cooling demand in residencies of USA on climatic conditions in kWh/m2 (of total dwelling surface)/year7.
Figure 4: Dependency of final specific energy consumption for cooling and useful cooling demand in residencies of USA on climatic conditions reported to total dwelling are and to cooled area only, adapted from (Jakubcionis and Carlsson, 2017).
The ENTRANZE8 project simulated cooling loads of typical old buildings (representative of
very low insulation levels, typically built in years 1960 to 70's, i.e. before any building
regulation) across Europe. We show here the results for houses in Figure 5. Cooling loads
are also correlated to CDD (base temperature 18 °C). For offices, there is no marked
difference with houses, while for apartments, the cooling loads are lower than in houses.
7 Mindaugas Jakubcionis, Johan Carlsson, Estimation of European Union residential sector space cooling potential, In Energy Policy, Volume 101, 2017, Pages 225-235, https://doi.org/10.1016/j.enpol.2016.11.047 8 Paolo Zangheri, Roberto Armani, Marco Pietrobon and Lorenzo Pagliano (eERG), Heating and cooling energy demand and loads for building types in different countries of the EU, D2.3. of WP2 of the Entranze, March 2014. http://www.entranze.eu
0
10
20
30
40
50
60
70
80
90
0 200 400 600 800 1000 1200 1400
KW
h c
ooli
ng
load
per m
2 /
Year
CDD
Load per dwelling m2
Load per cooled are m2
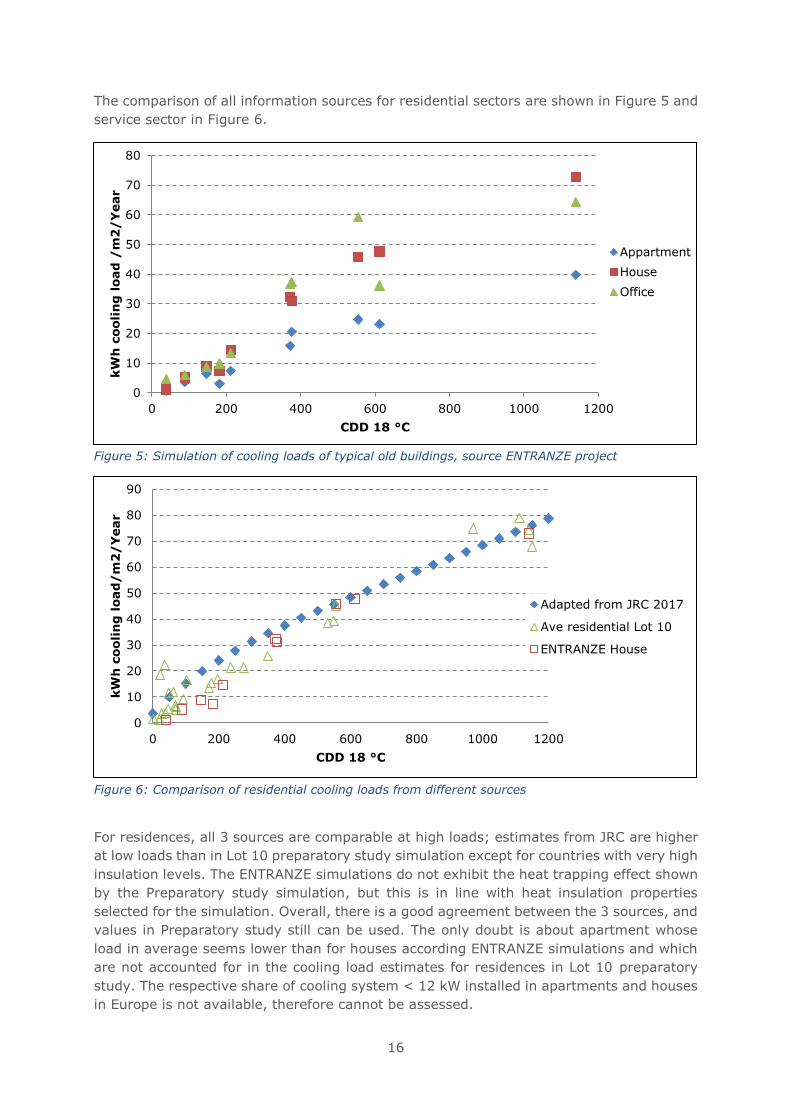
16
The comparison of all information sources for residential sectors are shown in Figure 5 and
service sector in Figure 6.
Figure 5: Simulation of cooling loads of typical old buildings, source ENTRANZE project
Figure 6: Comparison of residential cooling loads from different sources
For residences, all 3 sources are comparable at high loads; estimates from JRC are higher
at low loads than in Lot 10 preparatory study simulation except for countries with very high
insulation levels. The ENTRANZE simulations do not exhibit the heat trapping effect shown
by the Preparatory study simulation, but this is in line with heat insulation properties
selected for the simulation. Overall, there is a good agreement between the 3 sources, and
values in Preparatory study still can be used. The only doubt is about apartment whose
load in average seems lower than for houses according ENTRANZE simulations and which
are not accounted for in the cooling load estimates for residences in Lot 10 preparatory
study. The respective share of cooling system < 12 kW installed in apartments and houses
in Europe is not available, therefore cannot be assessed.
0
10
20
30
40
50
60
70
80
0 200 400 600 800 1000 1200
kW
h c
ooli
ng
load
/m
2/
Year
CDD 18 °C
Appartment
House
Office
0
10
20
30
40
50
60
70
80
90
0 200 400 600 800 1000 1200
kW
h c
ooli
ng
load
/m
2/
Year
CDD 18 °C
Adapted from JRC 2017
Ave residential Lot 10
ENTRANZE House
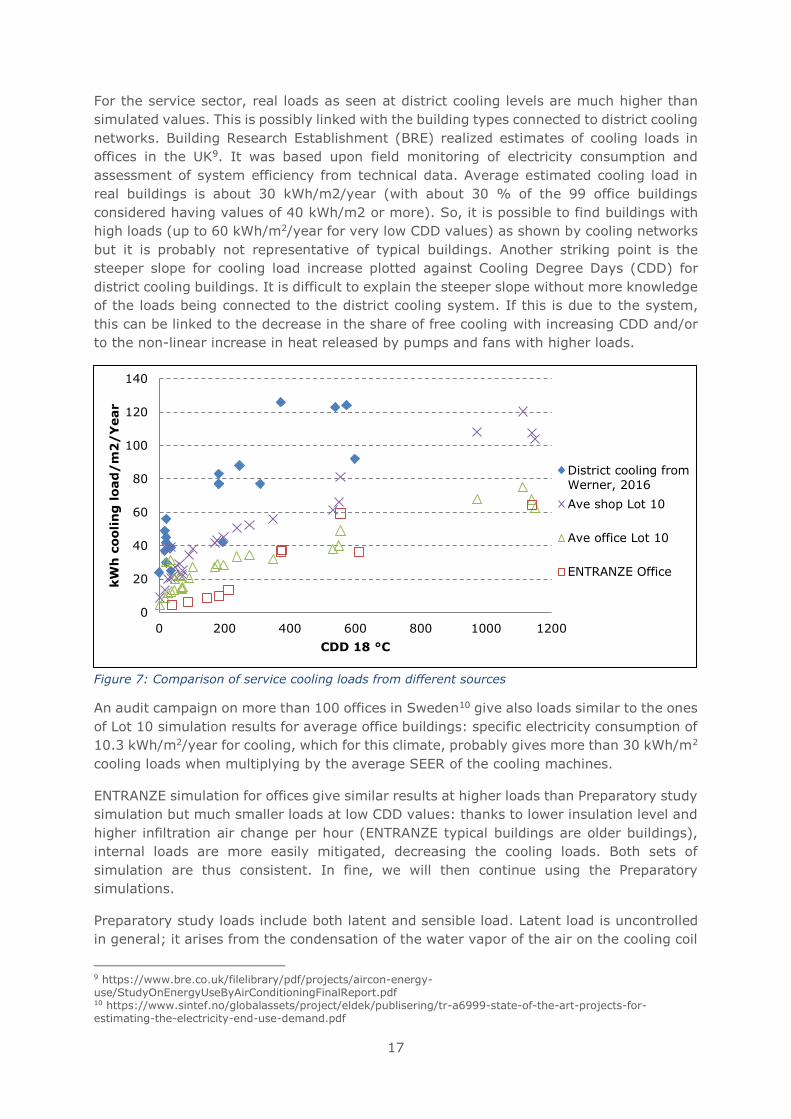
17
For the service sector, real loads as seen at district cooling levels are much higher than
simulated values. This is possibly linked with the building types connected to district cooling
networks. Building Research Establishment (BRE) realized estimates of cooling loads in
offices in the UK9. It was based upon field monitoring of electricity consumption and
assessment of system efficiency from technical data. Average estimated cooling load in
real buildings is about 30 kWh/m2/year (with about 30 % of the 99 office buildings
considered having values of 40 kWh/m2 or more). So, it is possible to find buildings with
high loads (up to 60 kWh/m2/year for very low CDD values) as shown by cooling networks
but it is probably not representative of typical buildings. Another striking point is the
steeper slope for cooling load increase plotted against Cooling Degree Days (CDD) for
district cooling buildings. It is difficult to explain the steeper slope without more knowledge
of the loads being connected to the district cooling system. If this is due to the system,
this can be linked to the decrease in the share of free cooling with increasing CDD and/or
to the non-linear increase in heat released by pumps and fans with higher loads.
Figure 7: Comparison of service cooling loads from different sources
An audit campaign on more than 100 offices in Sweden10 give also loads similar to the ones
of Lot 10 simulation results for average office buildings: specific electricity consumption of
10.3 kWh/m2/year for cooling, which for this climate, probably gives more than 30 kWh/m2
cooling loads when multiplying by the average SEER of the cooling machines.
ENTRANZE simulation for offices give similar results at higher loads than Preparatory study
simulation but much smaller loads at low CDD values: thanks to lower insulation level and
higher infiltration air change per hour (ENTRANZE typical buildings are older buildings),
internal loads are more easily mitigated, decreasing the cooling loads. Both sets of
simulation are thus consistent. In fine, we will then continue using the Preparatory
simulations.
Preparatory study loads include both latent and sensible load. Latent load is uncontrolled
in general; it arises from the condensation of the water vapor of the air on the cooling coil
9 https://www.bre.co.uk/filelibrary/pdf/projects/aircon-energy-use/StudyOnEnergyUseByAirConditioningFinalReport.pdf 10 https://www.sintef.no/globalassets/project/eldek/publisering/tr-a6999-state-of-the-art-projects-for-estimating-the-electricity-end-use-demand.pdf
0
20
40
60
80
100
120
140
0 200 400 600 800 1000 1200
kW
h c
ooli
ng
load
/m
2/
Year
CDD 18 °C
District cooling from
Werner, 2016
Ave shop Lot 10
Ave office Lot 10
ENTRANZE Office
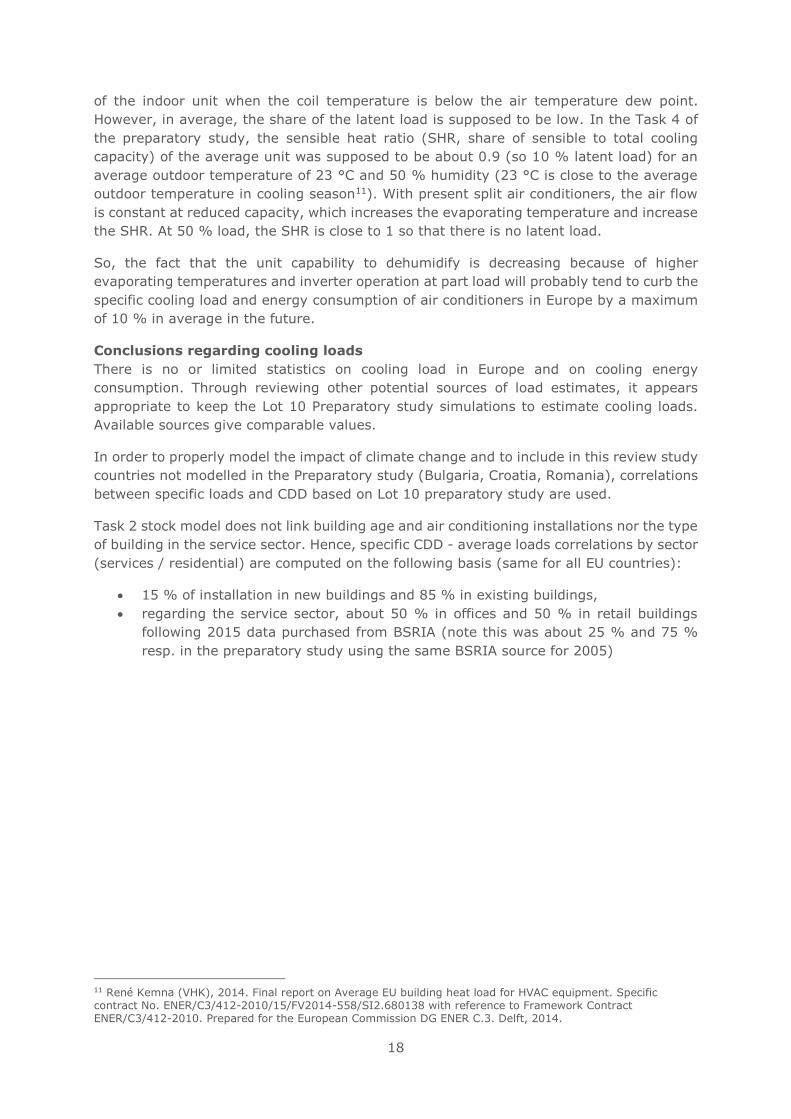
18
of the indoor unit when the coil temperature is below the air temperature dew point.
However, in average, the share of the latent load is supposed to be low. In the Task 4 of
the preparatory study, the sensible heat ratio (SHR, share of sensible to total cooling
capacity) of the average unit was supposed to be about 0.9 (so 10 % latent load) for an
average outdoor temperature of 23 °C and 50 % humidity (23 °C is close to the average
outdoor temperature in cooling season11). With present split air conditioners, the air flow
is constant at reduced capacity, which increases the evaporating temperature and increase
the SHR. At 50 % load, the SHR is close to 1 so that there is no latent load.
So, the fact that the unit capability to dehumidify is decreasing because of higher
evaporating temperatures and inverter operation at part load will probably tend to curb the
specific cooling load and energy consumption of air conditioners in Europe by a maximum
of 10 % in average in the future.
Conclusions regarding cooling loads
There is no or limited statistics on cooling load in Europe and on cooling energy
consumption. Through reviewing other potential sources of load estimates, it appears
appropriate to keep the Lot 10 Preparatory study simulations to estimate cooling loads.
Available sources give comparable values.
In order to properly model the impact of climate change and to include in this review study
countries not modelled in the Preparatory study (Bulgaria, Croatia, Romania), correlations
between specific loads and CDD based on Lot 10 preparatory study are used.
Task 2 stock model does not link building age and air conditioning installations nor the type
of building in the service sector. Hence, specific CDD - average loads correlations by sector
(services / residential) are computed on the following basis (same for all EU countries):
• 15 % of installation in new buildings and 85 % in existing buildings,
• regarding the service sector, about 50 % in offices and 50 % in retail buildings
following 2015 data purchased from BSRIA (note this was about 25 % and 75 %
resp. in the preparatory study using the same BSRIA source for 2005)
11 René Kemna (VHK), 2014. Final report on Average EU building heat load for HVAC equipment. Specific contract No. ENER/C3/412-2010/15/FV2014-558/SI2.680138 with reference to Framework Contract ENER/C3/412-2010. Prepared for the European Commission DG ENER C.3. Delft, 2014.
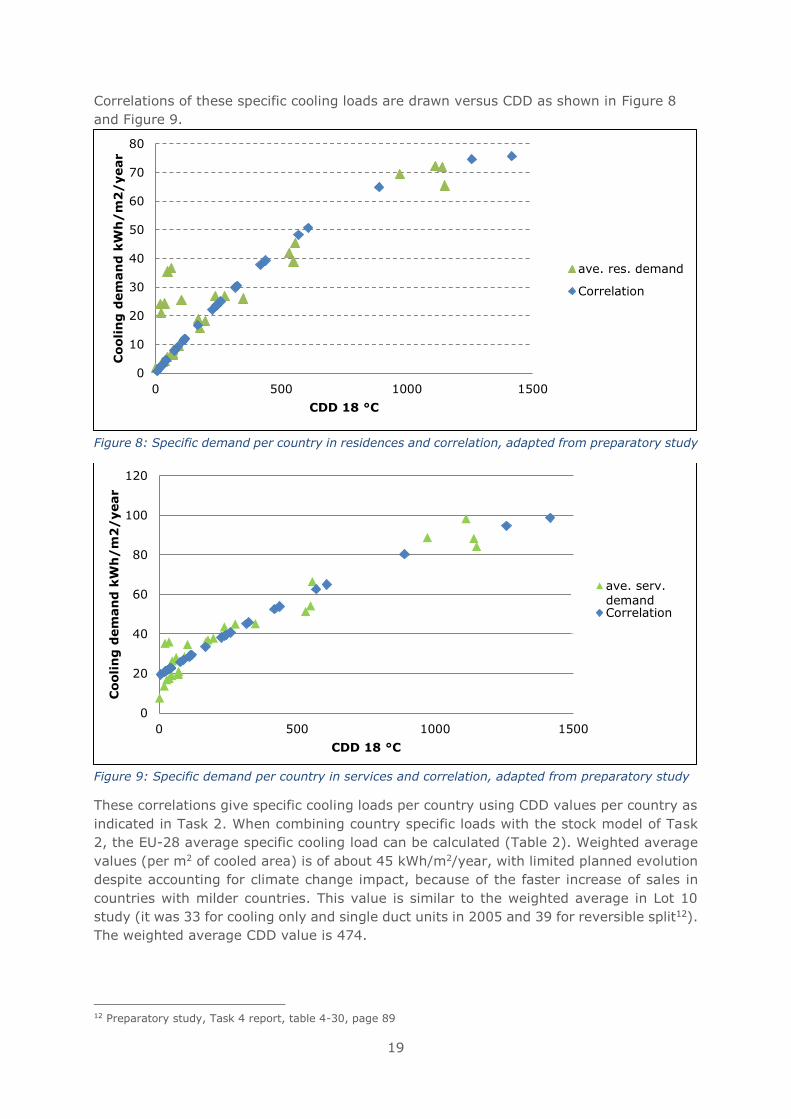
19
Correlations of these specific cooling loads are drawn versus CDD as shown in Figure 8
and Figure 9.
Figure 8: Specific demand per country in residences and correlation, adapted from preparatory study
Figure 9: Specific demand per country in services and correlation, adapted from preparatory study
These correlations give specific cooling loads per country using CDD values per country as
indicated in Task 2. When combining country specific loads with the stock model of Task
2, the EU-28 average specific cooling load can be calculated (Table 2). Weighted average
values (per m2 of cooled area) is of about 45 kWh/m2/year, with limited planned evolution
despite accounting for climate change impact, because of the faster increase of sales in
countries with milder countries. This value is similar to the weighted average in Lot 10
study (it was 33 for cooling only and single duct units in 2005 and 39 for reversible split12).
The weighted average CDD value is 474.
12 Preparatory study, Task 4 report, table 4-30, page 89
0
10
20
30
40
50
60
70
80
0 500 1000 1500
Cooli
ng
dem
an
d k
Wh
/m
2/
year
CDD 18 °C
ave. res. demand
Correlation
0
20
40
60
80
100
120
0 500 1000 1500
Cooli
ng
dem
an
d k
Wh
/m
2/
year
CDD 18 °C
ave. serv.
demandCorrelation
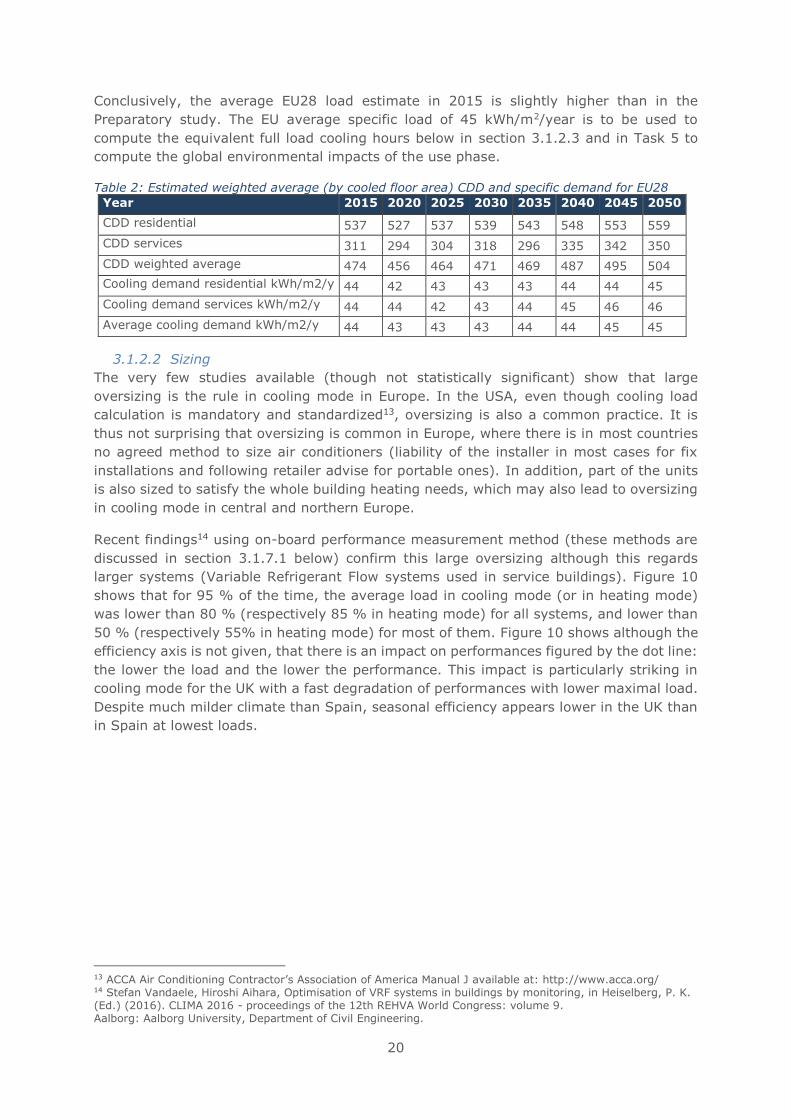
20
Conclusively, the average EU28 load estimate in 2015 is slightly higher than in the
Preparatory study. The EU average specific load of 45 kWh/m2/year is to be used to
compute the equivalent full load cooling hours below in section 3.1.2.3 and in Task 5 to
compute the global environmental impacts of the use phase.
Table 2: Estimated weighted average (by cooled floor area) CDD and specific demand for EU28
Year 2015 2020 2025 2030 2035 2040 2045 2050
CDD residential 537 527 537 539 543 548 553 559
CDD services 311 294 304 318 296 335 342 350
CDD weighted average 474 456 464 471 469 487 495 504
Cooling demand residential kWh/m2/y 44 42 43 43 43 44 44 45
Cooling demand services kWh/m2/y 44 44 42 43 44 45 46 46
Average cooling demand kWh/m2/y 44 43 43 43 44 44 45 45
3.1.2.2 Sizing
The very few studies available (though not statistically significant) show that large
oversizing is the rule in cooling mode in Europe. In the USA, even though cooling load
calculation is mandatory and standardized13, oversizing is also a common practice. It is
thus not surprising that oversizing is common in Europe, where there is in most countries
no agreed method to size air conditioners (liability of the installer in most cases for fix
installations and following retailer advise for portable ones). In addition, part of the units
is also sized to satisfy the whole building heating needs, which may also lead to oversizing
in cooling mode in central and northern Europe.
Recent findings14 using on-board performance measurement method (these methods are
discussed in section 3.1.7.1 below) confirm this large oversizing although this regards
larger systems (Variable Refrigerant Flow systems used in service buildings). Figure 10
shows that for 95 % of the time, the average load in cooling mode (or in heating mode)
was lower than 80 % (respectively 85 % in heating mode) for all systems, and lower than
50 % (respectively 55% in heating mode) for most of them. Figure 10 shows although the
efficiency axis is not given, that there is an impact on performances figured by the dot line:
the lower the load and the lower the performance. This impact is particularly striking in
cooling mode for the UK with a fast degradation of performances with lower maximal load.
Despite much milder climate than Spain, seasonal efficiency appears lower in the UK than
in Spain at lowest loads.
13 ACCA Air Conditioning Contractor’s Association of America Manual J available at: http://www.acca.org/ 14 Stefan Vandaele, Hiroshi Aihara, Optimisation of VRF systems in buildings by monitoring, in Heiselberg, P. K. (Ed.) (2016). CLIMA 2016 - proceedings of the 12th REHVA World Congress: volume 9. Aalborg: Aalborg University, Department of Civil Engineering.
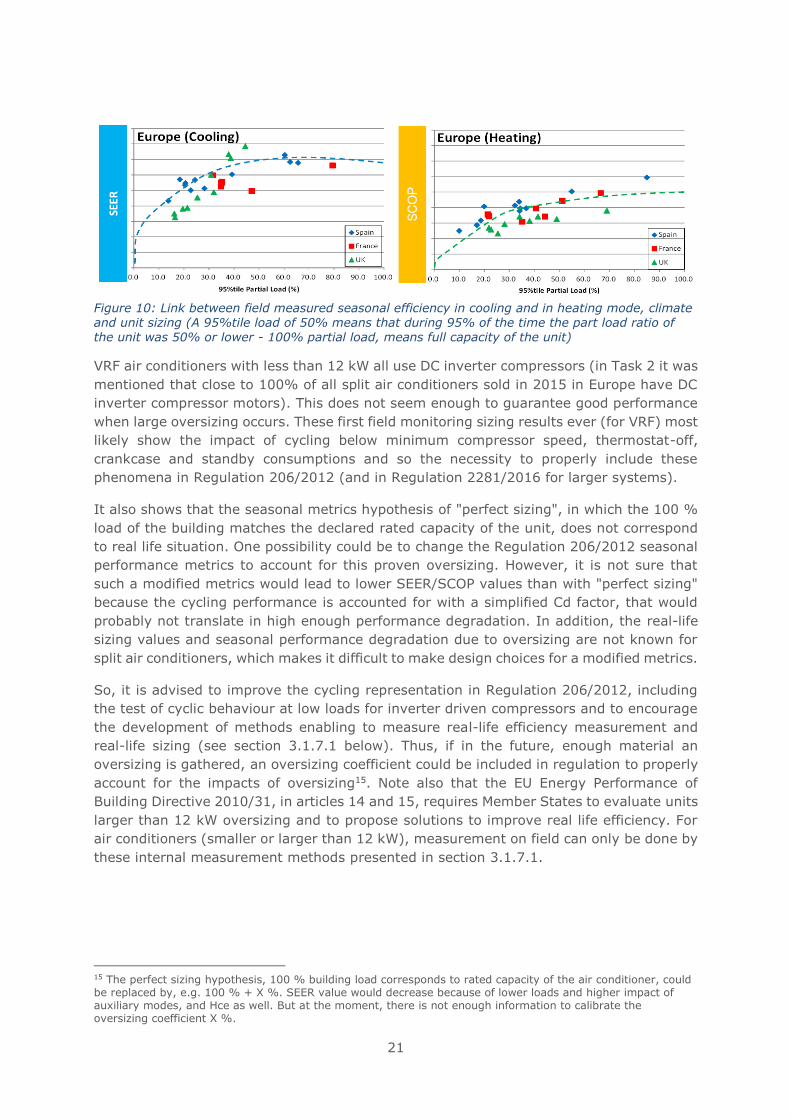
21
Figure 10: Link between field measured seasonal efficiency in cooling and in heating mode, climate
and unit sizing (A 95%tile load of 50% means that during 95% of the time the part load ratio of the unit was 50% or lower - 100% partial load, means full capacity of the unit)
VRF air conditioners with less than 12 kW all use DC inverter compressors (in Task 2 it was
mentioned that close to 100% of all split air conditioners sold in 2015 in Europe have DC
inverter compressor motors). This does not seem enough to guarantee good performance
when large oversizing occurs. These first field monitoring sizing results ever (for VRF) most
likely show the impact of cycling below minimum compressor speed, thermostat-off,
crankcase and standby consumptions and so the necessity to properly include these
phenomena in Regulation 206/2012 (and in Regulation 2281/2016 for larger systems).
It also shows that the seasonal metrics hypothesis of "perfect sizing", in which the 100 %
load of the building matches the declared rated capacity of the unit, does not correspond
to real life situation. One possibility could be to change the Regulation 206/2012 seasonal
performance metrics to account for this proven oversizing. However, it is not sure that
such a modified metrics would lead to lower SEER/SCOP values than with "perfect sizing"
because the cycling performance is accounted for with a simplified Cd factor, that would
probably not translate in high enough performance degradation. In addition, the real-life
sizing values and seasonal performance degradation due to oversizing are not known for
split air conditioners, which makes it difficult to make design choices for a modified metrics.
So, it is advised to improve the cycling representation in Regulation 206/2012, including
the test of cyclic behaviour at low loads for inverter driven compressors and to encourage
the development of methods enabling to measure real-life efficiency measurement and
real-life sizing (see section 3.1.7.1 below). Thus, if in the future, enough material an
oversizing is gathered, an oversizing coefficient could be included in regulation to properly
account for the impacts of oversizing15. Note also that the EU Energy Performance of
Building Directive 2010/31, in articles 14 and 15, requires Member States to evaluate units
larger than 12 kW oversizing and to propose solutions to improve real life efficiency. For
air conditioners (smaller or larger than 12 kW), measurement on field can only be done by
these internal measurement methods presented in section 3.1.7.1.
15 The perfect sizing hypothesis, 100 % building load corresponds to rated capacity of the air conditioner, could be replaced by, e.g. 100 % + X %. SEER value would decrease because of lower loads and higher impact of auxiliary modes, and Hce as well. But at the moment, there is not enough information to calibrate the oversizing coefficient X %.
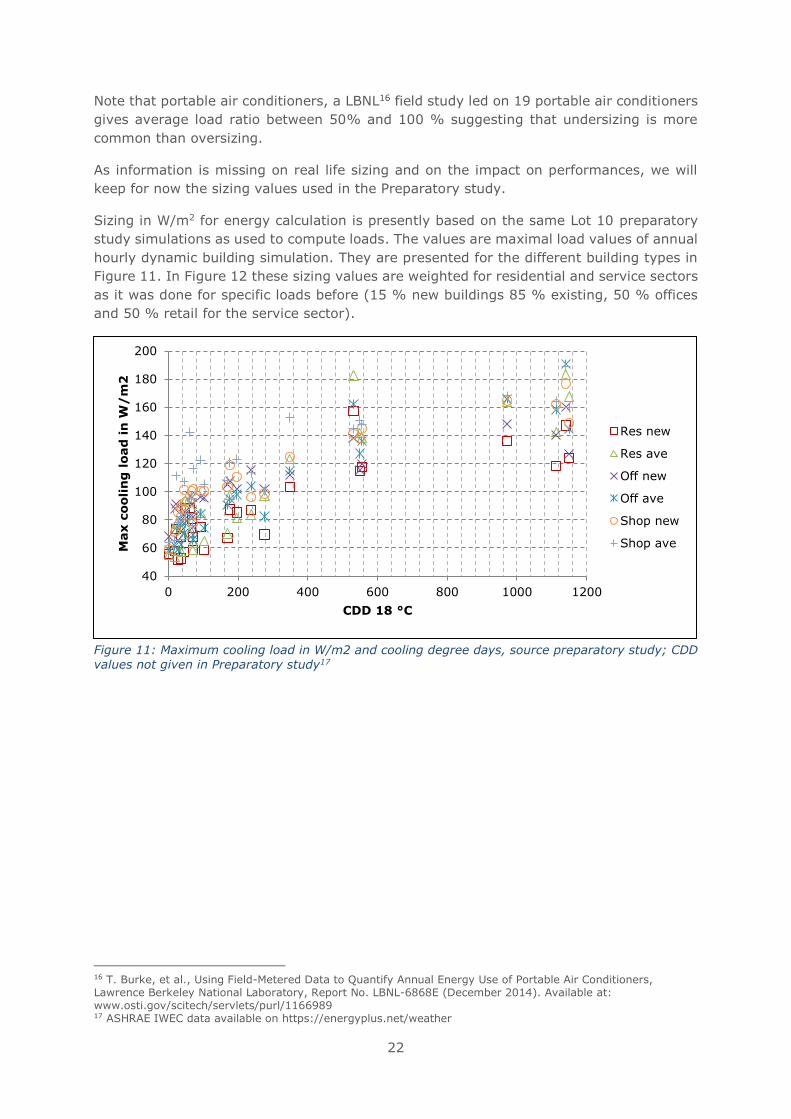
22
Note that portable air conditioners, a LBNL16 field study led on 19 portable air conditioners
gives average load ratio between 50% and 100 % suggesting that undersizing is more
common than oversizing.
As information is missing on real life sizing and on the impact on performances, we will
keep for now the sizing values used in the Preparatory study.
Sizing in W/m2 for energy calculation is presently based on the same Lot 10 preparatory
study simulations as used to compute loads. The values are maximal load values of annual
hourly dynamic building simulation. They are presented for the different building types in
Figure 11. In Figure 12 these sizing values are weighted for residential and service sectors
as it was done for specific loads before (15 % new buildings 85 % existing, 50 % offices
and 50 % retail for the service sector).
Figure 11: Maximum cooling load in W/m2 and cooling degree days, source preparatory study; CDD values not given in Preparatory study17
16 T. Burke, et al., Using Field-Metered Data to Quantify Annual Energy Use of Portable Air Conditioners, Lawrence Berkeley National Laboratory, Report No. LBNL-6868E (December 2014). Available at: www.osti.gov/scitech/servlets/purl/1166989 17 ASHRAE IWEC data available on https://energyplus.net/weather
40
60
80
100
120
140
160
180
200
0 200 400 600 800 1000 1200
Max c
ooli
ng
load
in
W/
m2
CDD 18 °C
Res new
Res ave
Off new
Off ave
Shop new
Shop ave
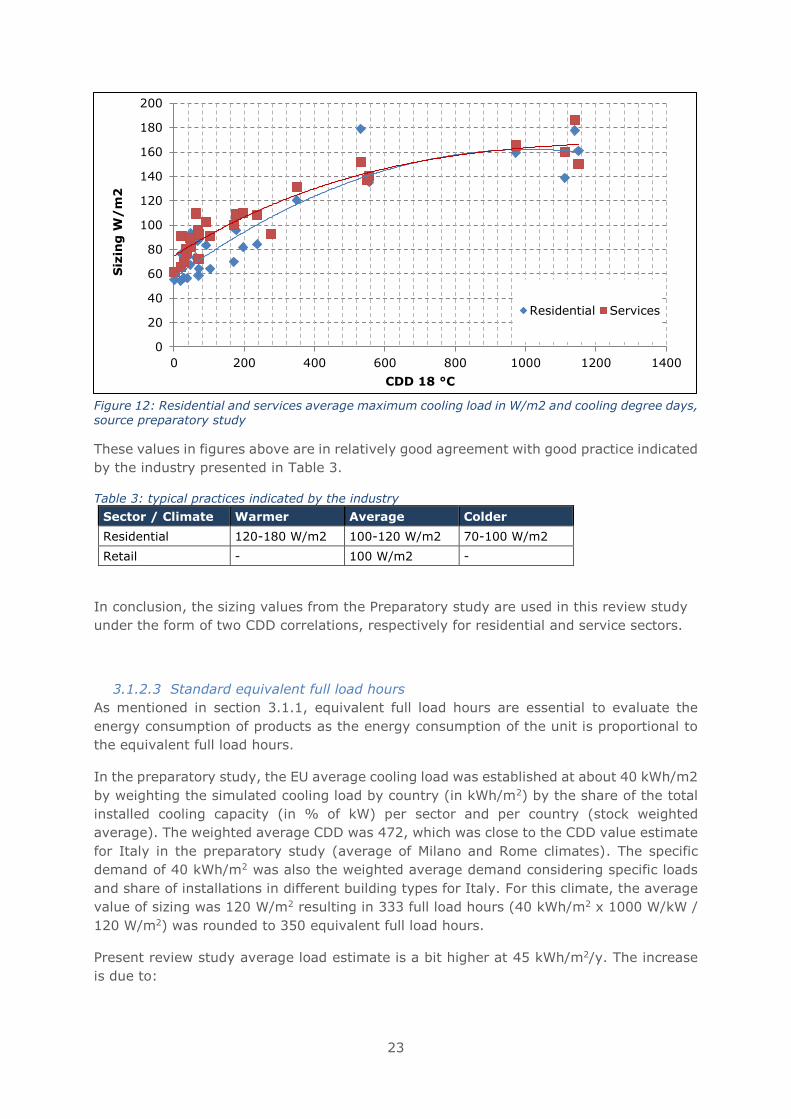
23
Figure 12: Residential and services average maximum cooling load in W/m2 and cooling degree days, source preparatory study
These values in figures above are in relatively good agreement with good practice indicated
by the industry presented in Table 3.
Table 3: typical practices indicated by the industry
Sector / Climate Warmer Average Colder
Residential 120-180 W/m2 100-120 W/m2 70-100 W/m2
Retail - 100 W/m2 -
In conclusion, the sizing values from the Preparatory study are used in this review study
under the form of two CDD correlations, respectively for residential and service sectors.
3.1.2.3 Standard equivalent full load hours
As mentioned in section 3.1.1, equivalent full load hours are essential to evaluate the
energy consumption of products as the energy consumption of the unit is proportional to
the equivalent full load hours.
In the preparatory study, the EU average cooling load was established at about 40 kWh/m2
by weighting the simulated cooling load by country (in kWh/m2) by the share of the total
installed cooling capacity (in % of kW) per sector and per country (stock weighted
average). The weighted average CDD was 472, which was close to the CDD value estimate
for Italy in the preparatory study (average of Milano and Rome climates). The specific
demand of 40 kWh/m2 was also the weighted average demand considering specific loads
and share of installations in different building types for Italy. For this climate, the average
value of sizing was 120 W/m2 resulting in 333 full load hours (40 kWh/m2 x 1000 W/kW /
120 W/m2) was rounded to 350 equivalent full load hours.
Present review study average load estimate is a bit higher at 45 kWh/m2/y. The increase
is due to:
0
20
40
60
80
100
120
140
160
180
200
0 200 400 600 800 1000 1200 1400
Siz
ing
W/
m2
CDD 18 °C
Residential Services
24
• the changes in the model used to assess the EU air conditioner stock of appliances,
in which the weight of Eastern and Northern countries have been decreased
according to available information for these countries (information not available for
these countries at the time of the Preparatory study),
• the increasing weight and CDD (as compared to Preparatory study estimate) for
Italy (estimated to represent about 30 % of the stock in 2015), which in turn
increases significantly the specific cooling demand for this country and the EU.
The 45 kWh/m2/year corresponds to CDD 474 (Table 2) and to sizing values in the range
130 to 140 W/m2. This leads to similar values as in present regulation: between 320 and
345 hours, it is then suggested to keep the present full load hour number of 350.
In conclusion, the number of equivalent full load cooling hours HCE is kept constant at 350
hours for this review study.
3.1.2.4 SEER temperature profile
Temperature profile has been established by weighting the temperature distribution of
cooling season hours of capital cities18 by sales of split air conditioners according to JRAIA
sales publications of 2006 supplied by EPEE, as explained in the Preparatory study Task 4
report19. Weighting ASHRAE IWEC data by the % sales distribution of split air conditioners
by country in numbers. Weighted average implied CDD value for air conditioner
installations in Europe was about 455.
Looking at the resulting distribution of hours by temperature bin in Regulation 206/2012,
it is supposed that cooling starts at 16.5 °C (0 % load at 16 °C bin). This is based on the
Preparatory study simulation results for residences and service buildings (the latter
supposedly represented about 60 % of the stock in GW of installed units in 2006 according
to the Preparatory study). The present input gives a 50/50 repartition. So, the situation is
not so different.
On this temperature profile, it was suggested by stakeholders to study whether it was
justified to rate cooling units with temperatures below 26 °C. Here are a few references on
that point. In Australia, Hart and de Dear20 data over 136 dwellings suggest that in the
residential sector, 18 °C is a good candidate for zero loads in average. More recently, in
France, a study on 10 dwellings in the South of France indicated first loads occurring
between 15 (but with centralized water based system) and about 25 °C average outdoor
air temperature, with most systems zero loads around 19 to 21 °C. (Kemna, 2014)11 using
average residential building characteristics and internal load suggests 20.5 °C could be a
good minimum value (20.5 °C outdoor leads to an average of 25 °C indoors because of
electric internal loads and solar gains equivalent to about 3.5 °C overheat inside the
building). 20.5 °C is also the reference used in the ISO/FDIS 16358-1:2013 standard21,
which is also targeting mainly residential units. In the USA, the AHRI standard uses 18.3
°C.
Hence, available information suggests values between 18 °C and 21 °C for the zero load
in residences.
18 Spain climate selected was different here from before in Preparatory study: half Madrid and Barcelone (not half Madrid and Seville, which was considered to give too high average CDD values for Spain). 19 Annex B.3 p 165 and below 20 Melissa Hart, Richard de Dear, Weather sensitivity in household appliance energy end-use, In Energy and Buildings, Volume 36, Issue 2, 2004, Pages 161-174, https://doi.org/10.1016/j.enbuild.2003.10.009. 21 See Task 1 for more information
25
However, for the service22 sector, this temperature can drop to much lower levels. It is not
uncommon to have cooling in large office buildings connected to district cooling at
temperatures below 10 °C. The preparatory study simulations indicated balance points
about 15 °C. So that the 17 °C (bin start 16.5 °C) was chosen as an average situation for
buildings cooled by air conditioners. For residential air conditioners only as an average
situation it may be too low. But being still at a 50/50 situation in installation proportions
of residential products and service products, the 16 °C still seems adapted.
Regarding the number of hours per temperature bin, (Kemna, 2014)11 studied a 3 month
cooling season for Europe using population weighted average temperature bin for EU
capital cities. The outdoor temperature for this weighted average is 23.2 °C, against 23 °C
for the average temperature profile used in (EU) Regulation 206/2012. The evaluated
monthly cooling degree days based on a simplified average model of a residential building
has been calculated and is shown in Figure 12.
To build the temperature profile, cooling seasons of 3 months (Nordic countries) to 6
months (Southern countries) and 5 months for central Europe, have been used. This
explains that the temperature profile, despite targeting southern Europe, gives more
weight to lower temperature bins (in addition to the fact that base temperature is lower).
If a residential metrics only were looked for, in addition to increasing the base outdoor
temperature, the length of seasons in central European countries should probably be
reduced to 3 to 4 months. This would tend to increase the average outdoor temperature of
operation.
Other residential seasonal performance standard has indeed temperature profile
corresponding to higher average outdoor temperature and load. What matters for SEER
determination is the energy weighted average temperature and load of the profile (energy
weights are obtained by multiplying load and number of hours):
• Regulation 206/2012 (50 residential / 50 services): energy weighted average load
ratio 51 %, temperature 25.6 °C (eq. full load hours 350)
• AHRI 210/240 (residential): 27.8 °C, 57 % (equivalent full load hours 730)
• ISO 16348 (residential): 27.5 °C, 50 % (equivalent full load hours 800)
Weighted average energy values for temperature is lower in Europe as compared to USA
and ISO standards, in agreement with milder average climate (lower equivalent full load
hours) and to the fact that residential only is targeted.
22 Service sector is sometimes also named tertiary or commercial sector and encompasses all non residential buildings except industrial ones.
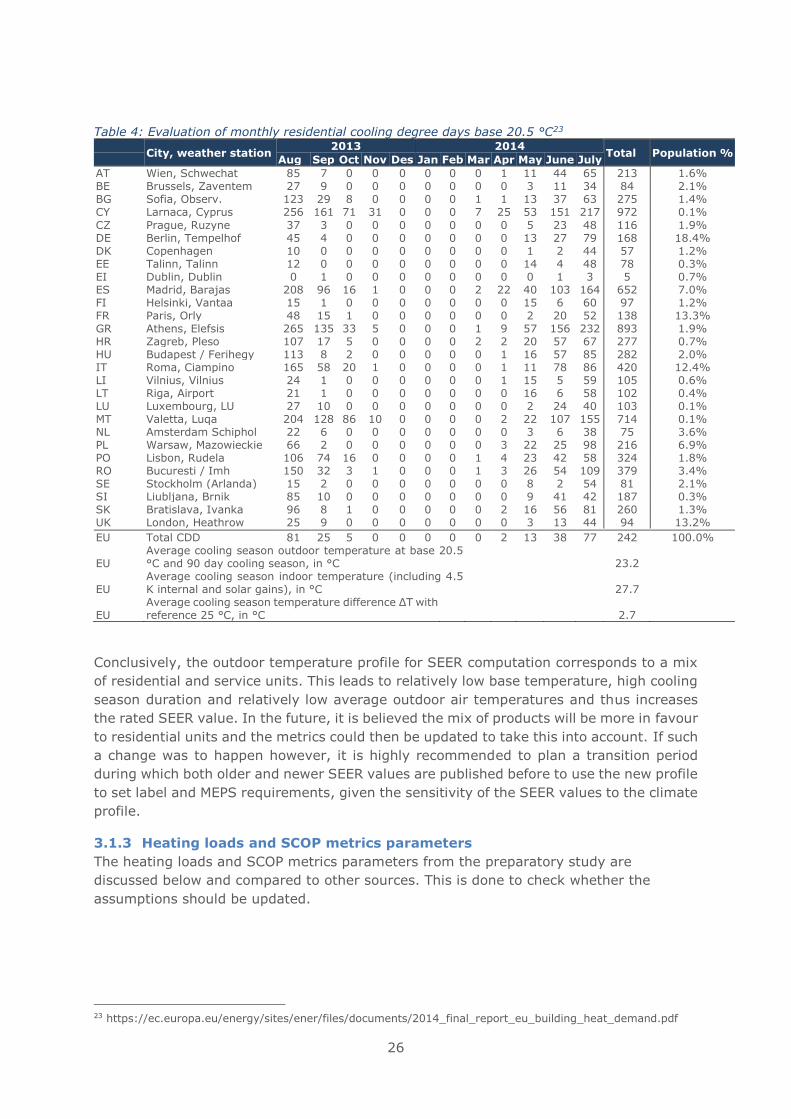
26
Table 4: Evaluation of monthly residential cooling degree days base 20.5 °C23
City, weather station 2013 2014
Total Population % Aug Sep Oct Nov Des Jan Feb Mar Apr May June July
AT Wien, Schwechat 85 7 0 0 0 0 0 0 1 11 44 65 213 1.6% BE Brussels, Zaventem 27 9 0 0 0 0 0 0 0 3 11 34 84 2.1% BG Sofia, Observ. 123 29 8 0 0 0 0 1 1 13 37 63 275 1.4% CY Larnaca, Cyprus 256 161 71 31 0 0 0 7 25 53 151 217 972 0.1%
CZ Prague, Ruzyne 37 3 0 0 0 0 0 0 0 5 23 48 116 1.9% DE Berlin, Tempelhof 45 4 0 0 0 0 0 0 0 13 27 79 168 18.4% DK Copenhagen 10 0 0 0 0 0 0 0 0 1 2 44 57 1.2% EE Talinn, Talinn 12 0 0 0 0 0 0 0 0 14 4 48 78 0.3% EI Dublin, Dublin 0 1 0 0 0 0 0 0 0 0 1 3 5 0.7% ES Madrid, Barajas 208 96 16 1 0 0 0 2 22 40 103 164 652 7.0% FI Helsinki, Vantaa 15 1 0 0 0 0 0 0 0 15 6 60 97 1.2% FR Paris, Orly 48 15 1 0 0 0 0 0 0 2 20 52 138 13.3% GR Athens, Elefsis 265 135 33 5 0 0 0 1 9 57 156 232 893 1.9% HR Zagreb, Pleso 107 17 5 0 0 0 0 2 2 20 57 67 277 0.7% HU Budapest / Ferihegy 113 8 2 0 0 0 0 0 1 16 57 85 282 2.0% IT Roma, Ciampino 165 58 20 1 0 0 0 0 1 11 78 86 420 12.4% LI Vilnius, Vilnius 24 1 0 0 0 0 0 0 1 15 5 59 105 0.6% LT Riga, Airport 21 1 0 0 0 0 0 0 0 16 6 58 102 0.4% LU Luxembourg, LU 27 10 0 0 0 0 0 0 0 2 24 40 103 0.1% MT Valetta, Luqa 204 128 86 10 0 0 0 0 2 22 107 155 714 0.1% NL Amsterdam Schiphol 22 6 0 0 0 0 0 0 0 3 6 38 75 3.6% PL Warsaw, Mazowieckie 66 2 0 0 0 0 0 0 3 22 25 98 216 6.9% PO Lisbon, Rudela 106 74 16 0 0 0 0 1 4 23 42 58 324 1.8% RO Bucuresti / Imh 150 32 3 1 0 0 0 1 3 26 54 109 379 3.4% SE Stockholm (Arlanda) 15 2 0 0 0 0 0 0 0 8 2 54 81 2.1% SI Liubljana, Brnik 85 10 0 0 0 0 0 0 0 9 41 42 187 0.3% SK Bratislava, Ivanka 96 8 1 0 0 0 0 0 2 16 56 81 260 1.3% UK London, Heathrow 25 9 0 0 0 0 0 0 0 3 13 44 94 13.2% EU Total CDD 81 25 5 0 0 0 0 0 2 13 38 77 242 100.0%
EU Average cooling season outdoor temperature at base 20.5 °C and 90 day cooling season, in °C 23.2
EU Average cooling season indoor temperature (including 4.5 K internal and solar gains), in °C 27.7
EU Average cooling season temperature difference ΔT with reference 25 °C, in °C 2.7
Conclusively, the outdoor temperature profile for SEER computation corresponds to a mix
of residential and service units. This leads to relatively low base temperature, high cooling
season duration and relatively low average outdoor air temperatures and thus increases
the rated SEER value. In the future, it is believed the mix of products will be more in favour
to residential units and the metrics could then be updated to take this into account. If such
a change was to happen however, it is highly recommended to plan a transition period
during which both older and newer SEER values are published before to use the new profile
to set label and MEPS requirements, given the sensitivity of the SEER values to the climate
profile.
3.1.3 Heating loads and SCOP metrics parameters
The heating loads and SCOP metrics parameters from the preparatory study are
discussed below and compared to other sources. This is done to check whether the
assumptions should be updated.
23 https://ec.europa.eu/energy/sites/ener/files/documents/2014_final_report_eu_building_heat_demand.pdf
27
3.1.3.1 Real use of reversibility
In the impact assessment study of (EU) Regulations 206/2012 and 626/2011, it was
supposed based on stakeholder input that only 33 % of reversible air conditioners were
used for heating24.
In Commission decision 2013/114/EU25, the percentage of reversible air conditioners
supposed to be used for heating are: 10 % for Southern Europe, 40 % for Central Europe
and 100 % for northern Europe (zones correspond to reference heating climates in (EU)
Regulation 206/2012). The following explanation is given (footnote 10):
"An Italian study (referred to on page 48 of ‘Outlook 2011 — European Heat Pump
Statistics’) finds that in less than 10 % of the cases, heat pumps were the only installed
heat generator. As reversible air-air heat pumps are the single most installed heat pump
technology type (60 % of all installed units — mostly installed in Italy, Spain and France,
as well as Sweden, Finland and Norway), it is important to adjust the figures appropriately.
The Impact Assessment of Commission Regulation (EU) No 206/2012 of 6 March 2012
implementing Directive 2009/125/EC of the European Parliament and of the Council with
regard to ecodesign requirements for air conditioners and comfort fans (OJ L 72,
10.3.2012, p. 7) assumes that EU wide, 33 % of reversible heat pumps are not used for
heating. In addition, one can assume that a large number of the 67 % of reversible heat
pumps are only used partly for heating, as the heat pump is installed in parallel to another
heating system. The proposed values are therefore appropriate to reduce the risk of over-
estimation.".
Complementary information was received from stakeholders, which suggests that present
rates of reversible units used for heating are higher, with residential rates between 20 %
(only heating means) and 60 % (used in addition, partial replacement or replacement of
an existing central systems) and commercial rates around 85 %. However, climate zone
indications are not specified.
In this study, we will use the most recent available information in the Commission decision
2013/114/EU.
3.1.3.2 Heating load
In heating mode, it was decided at the time of the preparatory study to use the heating
needs estimated in the preparatory study on space heating. The rationale is that reversible
air conditioners installed for heating do compete with other heating means and should then
be compared with the same heating loads, and that the heating needs identified from Lot
10 preparatory study are lower.
The equivalent full load hours have been defined based upon heating load and sizing
estimates for the 3 climates.
24 Impact Assessment [SWD(2012) 35] 25 http://eur-lex.europa.eu/legal-content/EN/TXT/?uri=CELEX%3A32013D0114
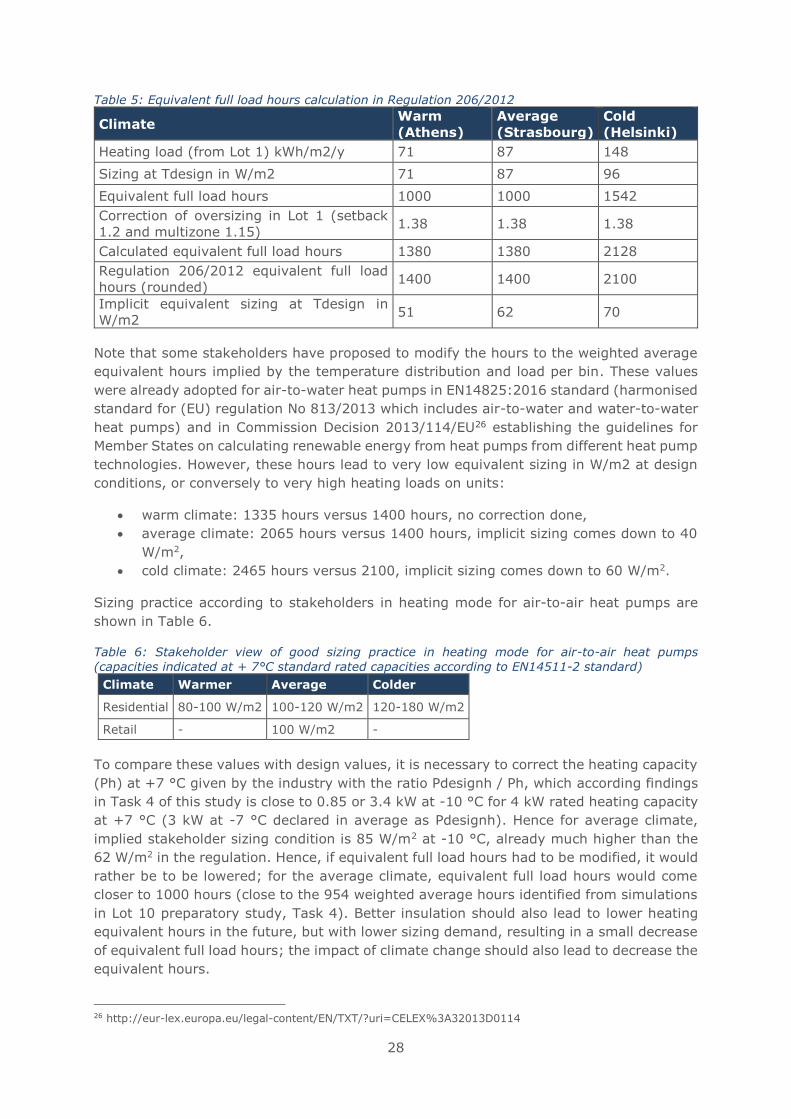
28
Table 5: Equivalent full load hours calculation in Regulation 206/2012
Climate Warm
(Athens)
Average
(Strasbourg)
Cold
(Helsinki)
Heating load (from Lot 1) kWh/m2/y 71 87 148
Sizing at Tdesign in W/m2 71 87 96
Equivalent full load hours 1000 1000 1542
Correction of oversizing in Lot 1 (setback
1.2 and multizone 1.15) 1.38 1.38 1.38
Calculated equivalent full load hours 1380 1380 2128
Regulation 206/2012 equivalent full load
hours (rounded) 1400 1400 2100
Implicit equivalent sizing at Tdesign in
W/m2 51 62 70
Note that some stakeholders have proposed to modify the hours to the weighted average
equivalent hours implied by the temperature distribution and load per bin. These values
were already adopted for air-to-water heat pumps in EN14825:2016 standard (harmonised
standard for (EU) regulation No 813/2013 which includes air-to-water and water-to-water
heat pumps) and in Commission Decision 2013/114/EU26 establishing the guidelines for
Member States on calculating renewable energy from heat pumps from different heat pump
technologies. However, these hours lead to very low equivalent sizing in W/m2 at design
conditions, or conversely to very high heating loads on units:
• warm climate: 1335 hours versus 1400 hours, no correction done,
• average climate: 2065 hours versus 1400 hours, implicit sizing comes down to 40
W/m2,
• cold climate: 2465 hours versus 2100, implicit sizing comes down to 60 W/m2.
Sizing practice according to stakeholders in heating mode for air-to-air heat pumps are
shown in Table 6.
Table 6: Stakeholder view of good sizing practice in heating mode for air-to-air heat pumps
(capacities indicated at + 7°C standard rated capacities according to EN14511-2 standard)
Climate Warmer Average Colder
Residential 80-100 W/m2 100-120 W/m2 120-180 W/m2
Retail - 100 W/m2 -
To compare these values with design values, it is necessary to correct the heating capacity
(Ph) at +7 °C given by the industry with the ratio Pdesignh / Ph, which according findings
in Task 4 of this study is close to 0.85 or 3.4 kW at -10 °C for 4 kW rated heating capacity
at +7 °C (3 kW at -7 °C declared in average as Pdesignh). Hence for average climate,
implied stakeholder sizing condition is 85 W/m2 at -10 °C, already much higher than the
62 W/m2 in the regulation. Hence, if equivalent full load hours had to be modified, it would
rather be to be lowered; for the average climate, equivalent full load hours would come
closer to 1000 hours (close to the 954 weighted average hours identified from simulations
in Lot 10 preparatory study, Task 4). Better insulation should also lead to lower heating
equivalent hours in the future, but with lower sizing demand, resulting in a small decrease
of equivalent full load hours; the impact of climate change should also lead to decrease the
equivalent hours.
26 http://eur-lex.europa.eu/legal-content/EN/TXT/?uri=CELEX%3A32013D0114
29
Hence, it does not seem justified to increase the number of equivalent full load heating
hours. And if a change had to be made in the coming years, it would rather be to decrease
the number of equivalent full load hours.
3.1.4 Crankcase heater in SEER and SCOP metrics
In the Regulation 206/2012, outdoor temperature for measurement of the crankcase
heater power value was not specified (nor for other modes, but there should be no
dependency to outdoor air temperature for other modes), although crankcase heater
operation may be controlled as a function of outdoor air temperature (amongst other
variables).
The reason for introducing the operation mode in the regulation was because it appeared
frequently that the crankcase heater start operation as soon as the compressor stop,
independently of the outdoor temperature, while operation is only required below a certain
outdoor temperature point.
In standard EN14825:2016, crankcase heater consumption is measured in test condition
D in cooling mode, i.e. at 20 °C outdoors (for heating only units this is 12 °C). This implies
that for units with temperature control, crankcase heater is very low or zero. Only for units
without a temperature control, crankcase value measured this way is high. Some
stakeholders have indicated some units with temperature control of crankcase heaters
between 12 and 20 °C, while others have more sophisticated control based on both indoor
and outdoor temperature.
In the cooling season, crankcase heater hours are per design hours with temperature below
16 °C (for the thermostat-off period) and others when the unit is in standby mode with
about 23 °C average (10/24 of the 2602 hours of cooling). In average, using 20 °C for
crankcase hours of reversible units in cooling mode is acceptable.
In the heating season, for standard inverter controlled reversible air conditioners, as per
standard temperature profile, the compressor is on most of the heating season.
Nevertheless, for some part load hours above 7 °C most units still cycle on and off and
crankcase consumption appears. Thermostat-off hours are hours with temperature above
16 °C. In average, using 12 °C for crankcase hours of reversible units in heating mode is
acceptable.
It is then proposed as a first improvement to require two distinct crankcase power values,
respectively for cooling mode - measured at 20 °C - and for heating mode - measured at
12 °C. Cooling (Heating) only unit crankcase power measurement should be done at 20 °C
(12 °C), as already written in standard EN14825:2016. This modification is already
included in draft standard prEN14825:2018.
3.1.4.1 Hours of operation per mode
The hours of operation adopted to the current study is presented in Table 7 and Table 8
for cooling and heating, respectively.
In Table 7 the hours per cooling mode is presented in the current regulation and the
suggested changes. This table also includes other power modes such as standby.
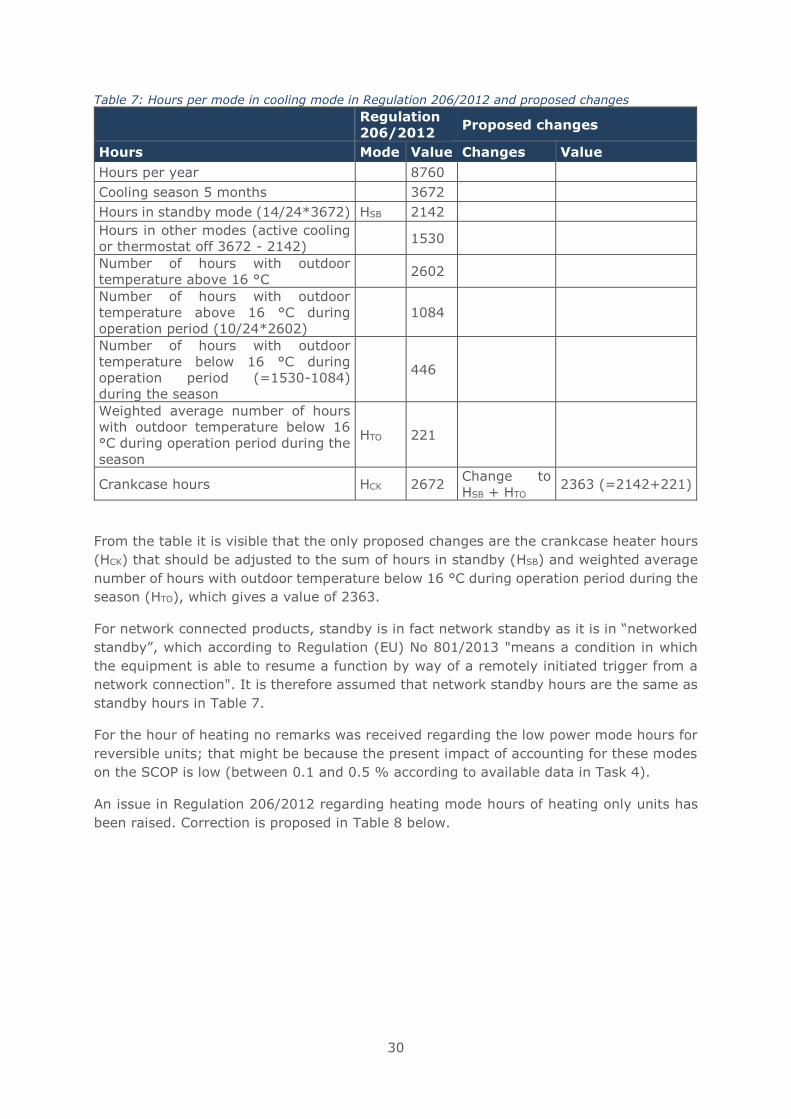
30
Table 7: Hours per mode in cooling mode in Regulation 206/2012 and proposed changes
Regulation
206/2012 Proposed changes
Hours Mode Value Changes Value
Hours per year 8760
Cooling season 5 months 3672
Hours in standby mode (14/24*3672) HSB 2142
Hours in other modes (active cooling
or thermostat off 3672 - 2142) 1530
Number of hours with outdoor
temperature above 16 °C 2602
Number of hours with outdoor
temperature above 16 °C during
operation period (10/24*2602)
1084
Number of hours with outdoor
temperature below 16 °C during
operation period (=1530-1084)
during the season
446
Weighted average number of hours
with outdoor temperature below 16
°C during operation period during the
season
HTO 221
Crankcase hours HCK 2672 Change to
HSB + HTO 2363 (=2142+221)
From the table it is visible that the only proposed changes are the crankcase heater hours
(HCK) that should be adjusted to the sum of hours in standby (HSB) and weighted average
number of hours with outdoor temperature below 16 °C during operation period during the
season (HTO), which gives a value of 2363.
For network connected products, standby is in fact network standby as it is in “networked
standby”, which according to Regulation (EU) No 801/2013 "means a condition in which
the equipment is able to resume a function by way of a remotely initiated trigger from a
network connection". It is therefore assumed that network standby hours are the same as
standby hours in Table 7.
For the hour of heating no remarks was received regarding the low power mode hours for
reversible units; that might be because the present impact of accounting for these modes
on the SCOP is low (between 0.1 and 0.5 % according to available data in Task 4).
An issue in Regulation 206/2012 regarding heating mode hours of heating only units has
been raised. Correction is proposed in Table 8 below.
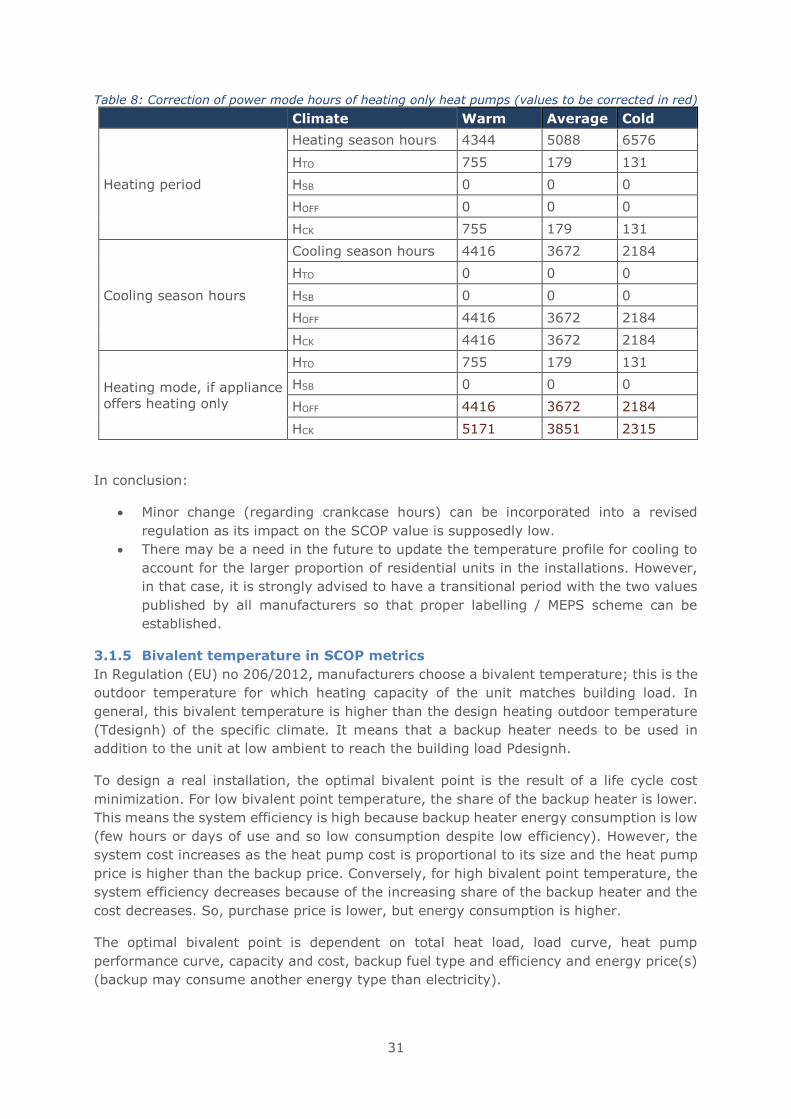
31
Table 8: Correction of power mode hours of heating only heat pumps (values to be corrected in red) Climate Warm Average Cold
Heating period
Heating season hours 4344 5088 6576
HTO 755 179 131
HSB 0 0 0
HOFF 0 0 0
HCK 755 179 131
Cooling season hours
Cooling season hours 4416 3672 2184
HTO 0 0 0
HSB 0 0 0
HOFF 4416 3672 2184
HCK 4416 3672 2184
Heating mode, if appliance
offers heating only
HTO 755 179 131
HSB 0 0 0
HOFF 4416 3672 2184
HCK 5171 3851 2315
In conclusion:
• Minor change (regarding crankcase hours) can be incorporated into a revised
regulation as its impact on the SCOP value is supposedly low.
• There may be a need in the future to update the temperature profile for cooling to
account for the larger proportion of residential units in the installations. However,
in that case, it is strongly advised to have a transitional period with the two values
published by all manufacturers so that proper labelling / MEPS scheme can be
established.
3.1.5 Bivalent temperature in SCOP metrics
In Regulation (EU) no 206/2012, manufacturers choose a bivalent temperature; this is the
outdoor temperature for which heating capacity of the unit matches building load. In
general, this bivalent temperature is higher than the design heating outdoor temperature
(Tdesignh) of the specific climate. It means that a backup heater needs to be used in
addition to the unit at low ambient to reach the building load Pdesignh.
To design a real installation, the optimal bivalent point is the result of a life cycle cost
minimization. For low bivalent point temperature, the share of the backup heater is lower.
This means the system efficiency is high because backup heater energy consumption is low
(few hours or days of use and so low consumption despite low efficiency). However, the
system cost increases as the heat pump cost is proportional to its size and the heat pump
price is higher than the backup price. Conversely, for high bivalent point temperature, the
system efficiency decreases because of the increasing share of the backup heater and the
cost decreases. So, purchase price is lower, but energy consumption is higher.
The optimal bivalent point is dependent on total heat load, load curve, heat pump
performance curve, capacity and cost, backup fuel type and efficiency and energy price(s)
(backup may consume another energy type than electricity).
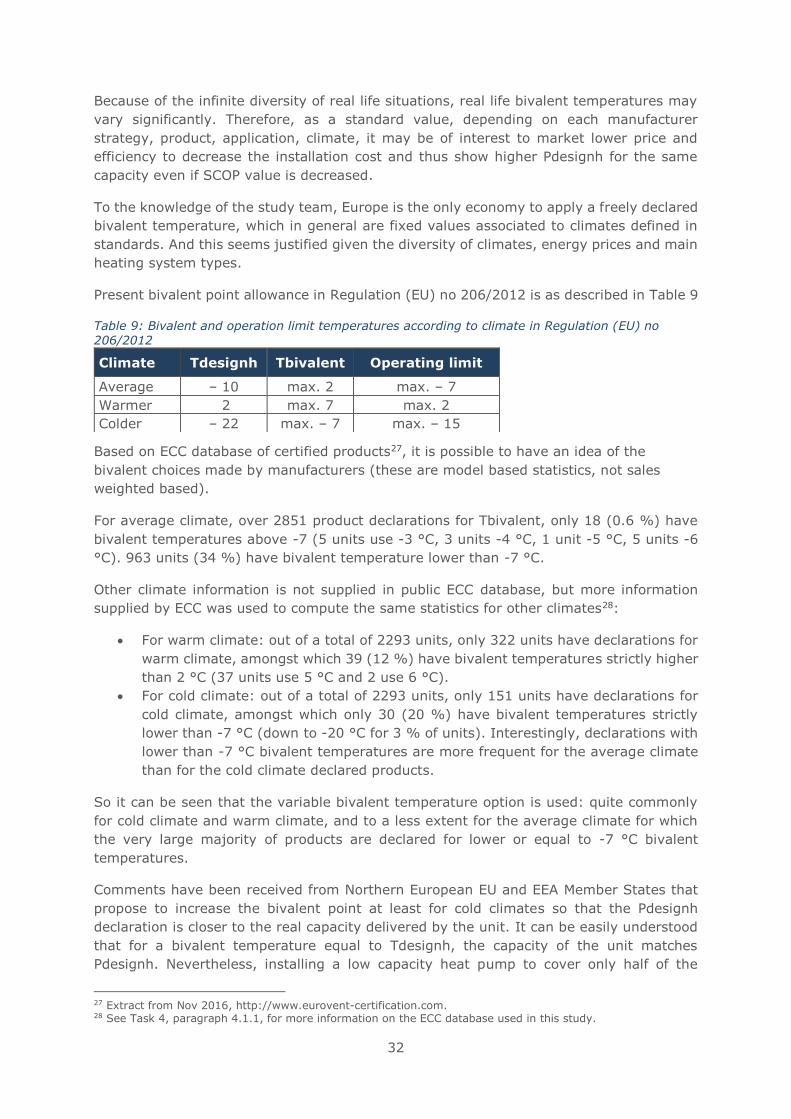
32
Because of the infinite diversity of real life situations, real life bivalent temperatures may
vary significantly. Therefore, as a standard value, depending on each manufacturer
strategy, product, application, climate, it may be of interest to market lower price and
efficiency to decrease the installation cost and thus show higher Pdesignh for the same
capacity even if SCOP value is decreased.
To the knowledge of the study team, Europe is the only economy to apply a freely declared
bivalent temperature, which in general are fixed values associated to climates defined in
standards. And this seems justified given the diversity of climates, energy prices and main
heating system types.
Present bivalent point allowance in Regulation (EU) no 206/2012 is as described in Table 9
Table 9: Bivalent and operation limit temperatures according to climate in Regulation (EU) no 206/2012
Based on ECC database of certified products27, it is possible to have an idea of the
bivalent choices made by manufacturers (these are model based statistics, not sales
weighted based).
For average climate, over 2851 product declarations for Tbivalent, only 18 (0.6 %) have
bivalent temperatures above -7 (5 units use -3 °C, 3 units -4 °C, 1 unit -5 °C, 5 units -6
°C). 963 units (34 %) have bivalent temperature lower than -7 °C.
Other climate information is not supplied in public ECC database, but more information
supplied by ECC was used to compute the same statistics for other climates28:
• For warm climate: out of a total of 2293 units, only 322 units have declarations for
warm climate, amongst which 39 (12 %) have bivalent temperatures strictly higher
than 2 °C (37 units use 5 °C and 2 use 6 °C).
• For cold climate: out of a total of 2293 units, only 151 units have declarations for
cold climate, amongst which only 30 (20 %) have bivalent temperatures strictly
lower than -7 °C (down to -20 °C for 3 % of units). Interestingly, declarations with
lower than -7 °C bivalent temperatures are more frequent for the average climate
than for the cold climate declared products.
So it can be seen that the variable bivalent temperature option is used: quite commonly
for cold climate and warm climate, and to a less extent for the average climate for which
the very large majority of products are declared for lower or equal to -7 °C bivalent
temperatures.
Comments have been received from Northern European EU and EEA Member States that
propose to increase the bivalent point at least for cold climates so that the Pdesignh
declaration is closer to the real capacity delivered by the unit. It can be easily understood
that for a bivalent temperature equal to Tdesignh, the capacity of the unit matches
Pdesignh. Nevertheless, installing a low capacity heat pump to cover only half of the
27 Extract from Nov 2016, http://www.eurovent-certification.com. 28 See Task 4, paragraph 4.1.1, for more information on the ECC database used in this study.
Climate Tdesignh Tbivalent Operating limit
Average – 10 max. 2 max. – 7
Warmer 2 max. 7 max. 2
Colder – 22 max. – 7 max. – 15
33
heating needs or less may still be economical in some situations and the manufacturer may
want to market such situations. So, this proposal does not seem in the interest of the end-
user.
The problem is rather if the manufacturer at the same time can publish high SCOP values
because choosing a high Tbivalent and showing a high heat pump capacity. In this matter,
the indication of the backup heater capacity required to reach Pdesignh capacity indicated
together with the Pdesignh chosen and the corresponding SCOP as proposed in Task 1
report should help in making the situation more transparent for the end-user.
3.1.6 Case of portable air conditioners
For portable air conditioners the most important factor to consider is the impact of air
infiltration. Infiltration of air has been discussed in previous tasks and the impact is
discussed in this subsection. Another important factor to discuss is the hours of use and
how portable air conditioners are used (as supplementary equipment or instead of e.g.
fixed air conditioners).
3.1.6.1 Different types of double duct air conditioners
There are two distinct types of double duct products:
- portable units, that are similar to single duct units but with two ducts
- units with fixed installation; one or two holes are to be made in a wall; these units can
operate all year round, providing often both heating and cooling; they look like a radiator
and for some models a supplementary indoor unit can be plugged to make a multi-split.
These units compete with standard split systems or window / through the wall air
conditioners and with other traditional heating means when reversible, as electric
radiators. Thus, double duct units with fixed installation are to be considered in the
regulation as standard air conditioners. The category double duct should refer to portable
air conditioners only (and possibly renamed / redefined categorisation in the regulation is
to be proposed). Consequently, SEER and SCOP metrics and similar energy labelling scale
should be used for those products. Bivalent point temperatures probably need to be
adapted.
What follows regards only portable air conditioners, with one or two ducts.
3.1.6.2 Updated information regarding portable air conditioners
Single duct air conditioners are peculiar because their inlet air at condenser is indoor air.
To compensate this air flow, infiltration of outdoor air in the building is necessary.
Simulations in preparatory study were done to simulate the infiltration impact on cooling
performance using dynamic simulations. However, there was no common consensus on
the values of the preparatory study and there are consequently no hours in (EU) Regulation
206/2012 to compute energy consumption of portable air conditioners in cooling mode,
nor for other modes. Manufacturers were mainly concerned by the complicated testing
method and by the high number of hours in thermostat-off and standby mode.
Although it was not identified in the Preparatory study, the same effect has been
highlighted for double duct products by the US DOE (see Task 1), that showed a difference
between inlet and outlet condenser air flow rates and thus an infiltration effect albeit lower
than for single duct units. In the USA, portable air conditioners are tested according to the
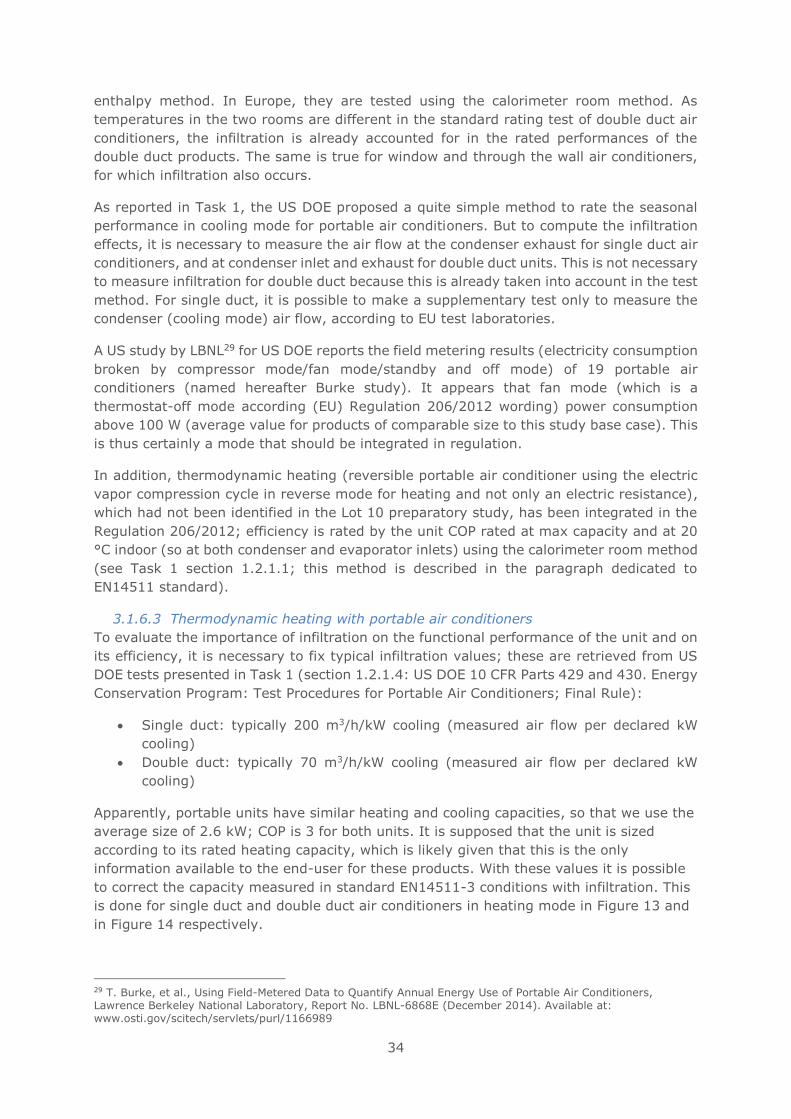
34
enthalpy method. In Europe, they are tested using the calorimeter room method. As
temperatures in the two rooms are different in the standard rating test of double duct air
conditioners, the infiltration is already accounted for in the rated performances of the
double duct products. The same is true for window and through the wall air conditioners,
for which infiltration also occurs.
As reported in Task 1, the US DOE proposed a quite simple method to rate the seasonal
performance in cooling mode for portable air conditioners. But to compute the infiltration
effects, it is necessary to measure the air flow at the condenser exhaust for single duct air
conditioners, and at condenser inlet and exhaust for double duct units. This is not necessary
to measure infiltration for double duct because this is already taken into account in the test
method. For single duct, it is possible to make a supplementary test only to measure the
condenser (cooling mode) air flow, according to EU test laboratories.
A US study by LBNL29 for US DOE reports the field metering results (electricity consumption
broken by compressor mode/fan mode/standby and off mode) of 19 portable air
conditioners (named hereafter Burke study). It appears that fan mode (which is a
thermostat-off mode according (EU) Regulation 206/2012 wording) power consumption
above 100 W (average value for products of comparable size to this study base case). This
is thus certainly a mode that should be integrated in regulation.
In addition, thermodynamic heating (reversible portable air conditioner using the electric
vapor compression cycle in reverse mode for heating and not only an electric resistance),
which had not been identified in the Lot 10 preparatory study, has been integrated in the
Regulation 206/2012; efficiency is rated by the unit COP rated at max capacity and at 20
°C indoor (so at both condenser and evaporator inlets) using the calorimeter room method
(see Task 1 section 1.2.1.1; this method is described in the paragraph dedicated to
EN14511 standard).
3.1.6.3 Thermodynamic heating with portable air conditioners
To evaluate the importance of infiltration on the functional performance of the unit and on
its efficiency, it is necessary to fix typical infiltration values; these are retrieved from US
DOE tests presented in Task 1 (section 1.2.1.4: US DOE 10 CFR Parts 429 and 430. Energy
Conservation Program: Test Procedures for Portable Air Conditioners; Final Rule):
• Single duct: typically 200 m3/h/kW cooling (measured air flow per declared kW
cooling)
• Double duct: typically 70 m3/h/kW cooling (measured air flow per declared kW
cooling)
Apparently, portable units have similar heating and cooling capacities, so that we use the
average size of 2.6 kW; COP is 3 for both units. It is supposed that the unit is sized
according to its rated heating capacity, which is likely given that this is the only
information available to the end-user for these products. With these values it is possible
to correct the capacity measured in standard EN14511-3 conditions with infiltration. This
is done for single duct and double duct air conditioners in heating mode in Figure 13 and
in Figure 14 respectively.
29 T. Burke, et al., Using Field-Metered Data to Quantify Annual Energy Use of Portable Air Conditioners, Lawrence Berkeley National Laboratory, Report No. LBNL-6868E (December 2014). Available at: www.osti.gov/scitech/servlets/purl/1166989
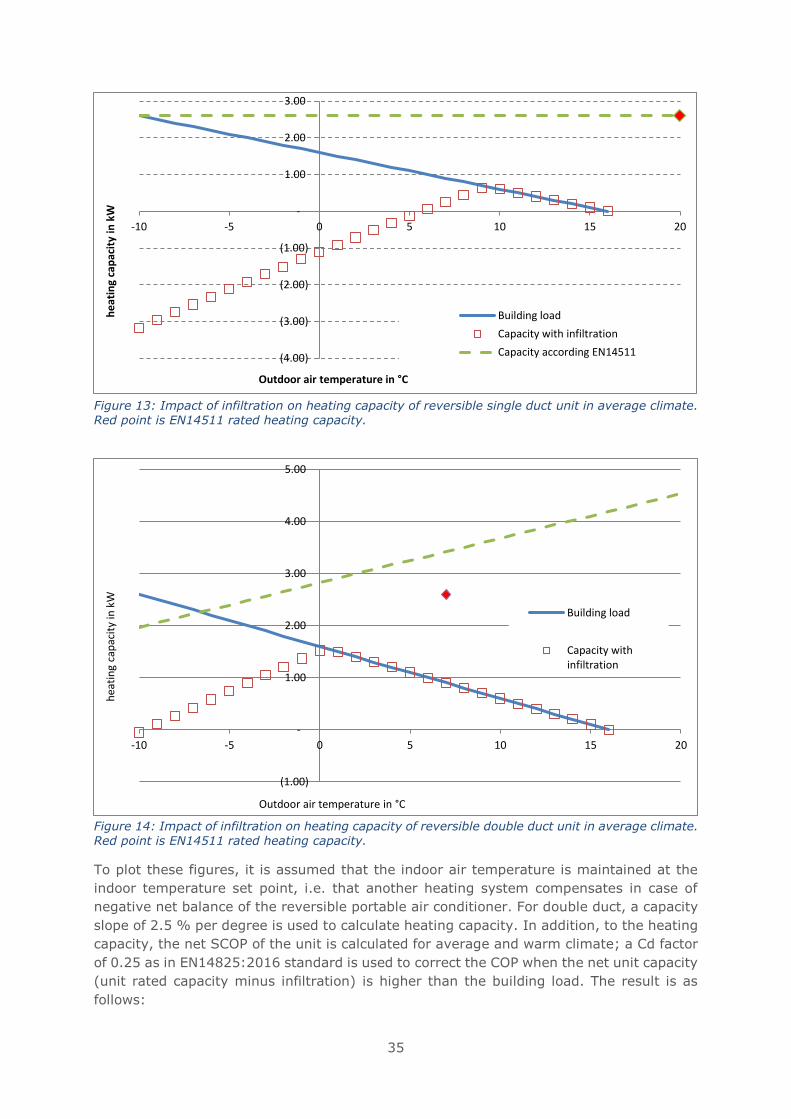
35
Figure 13: Impact of infiltration on heating capacity of reversible single duct unit in average climate. Red point is EN14511 rated heating capacity.
Figure 14: Impact of infiltration on heating capacity of reversible double duct unit in average climate. Red point is EN14511 rated heating capacity.
To plot these figures, it is assumed that the indoor air temperature is maintained at the
indoor temperature set point, i.e. that another heating system compensates in case of
negative net balance of the reversible portable air conditioner. For double duct, a capacity
slope of 2.5 % per degree is used to calculate heating capacity. In addition, to the heating
capacity, the net SCOP of the unit is calculated for average and warm climate; a Cd factor
of 0.25 as in EN14825:2016 standard is used to correct the COP when the net unit capacity
(unit rated capacity minus infiltration) is higher than the building load. The result is as
follows:
(4.00)
(3.00)
(2.00)
(1.00)
-
1.00
2.00
3.00
-10 -5 0 5 10 15 20
he
atin
g ca
pac
ity
in k
W
Outdoor air temperature in °C
Building load
Capacity with infiltration
Capacity according EN14511
(1.00)
-
1.00
2.00
3.00
4.00
5.00
-10 -5 0 5 10 15 20
hea
tin
g ca
pac
ity
in k
W
Outdoor air temperature in °C
Building load
Capacity withinfiltration
36
• for single duct: below 10 °C, the unit cannot cope with the heating load; below 6
°C, the unit cools the building; the average SCOP if working all year long is
negative (-0.4) for the average climate and equals 0.9 for the warm climate.
• for double duct: below 1 °C, the unit cannot cope with the heating load; but its
contribution remains positive down till - 9 °C, reaching - 0.1 kW at -10 °C versus
2.6 kW capacity bought; the average SCOP if working all year long (but it does
not satisfy the heating load below 1 °C) is 2.0 for the average climate and 2.9 for
the warm climate.
Hence, reversible single duct operation in heating mode is likely to be worse than electric
heating. Double duct operation is better in terms of performances, still it cannot deliver
the capacity that the customer is buying.
Manufacturers suggest these products are used only in mid-season, when people are
waiting for central heating systems to start, but there is no data available to sustain this
claim. In the meanwhile, these products are competing with electric portable heaters and
possibly in some cases with fix reversible air conditioners and the information to choose
product based on functionality (here heating capacity) and on the often used "heat pump"
wording advertisement is highly misleading.
Consequently, the present rating system for heating mode of portable products in
Regulation (EU) 206/2012 and the associated label in Regulation (EU) 626/2011 is to be
revised.
For single duct, estimated seasonal performance coefficient lies between -0.4 for average
climate and 0.9 for the warm climate. In order to keep the thermodynamic benefit for
highest outdoor temperatures and to maintain heating capacity at low outdoor
temperature, a hybrid version combining a 2.6 kW electric resistance in addition to the 2.6
kW thermodynamic heating system can be added. However, this gives a SCOP of 1.005 for
average climate and 1.09 for warm climate (below 10 °C, only the electric resistance
operates).
Thus, SCOP of thermodynamic heating with single duct is presently well below 1 and
including an electric heater could only bring little improvement over the present archetype,
with SCOP only slightly better than 1. It then seems useless to use single duct
thermodynamic heating, as an electric resistance alone, with a SCOP of 1, would be just
as efficient for the end-user. A simple option is then to ban thermodynamic heating for
single ducts.
But, for double duct products, a seasonal performance metrics could be developed.
For double duct, it is necessary to use the same scheme as for fixed air conditioners (SCOP
measurement and calculation) and to declare comparable heating capacity and
performance at design temperatures (note that infiltration impact is taken properly into
account for double duct tests following EN14511-3). Because of the negative capacity at -
10 °C, an evolution could be to add a complementary electric resistance. Bivalent point
temperatures should be adapted in EN14825 for these new products.
For single duct thermodynamic heating, manufacturers may want to pursue the
development of such reversible products. In that case, EN14825 procedure should be
adapted to include the impact of infiltration on capacity and performance. Air flow rate of
evaporator (in heating mode) should be measured in addition to performance test to enable
37
capacity and SCOP calculation. Bivalent point temperatures should be adapted in EN14825
for these new products. While waiting for a standard to measure the air flow rate, default
values should be used, as the ones indicated above. It should be noted to the purpose of
correcting capacities by infiltration, large uncertainties on the evaluation of the infiltration
air flow may still give a better information on the unit that present rating values without
the infiltration impact.
3.1.6.4 Capacity and performance in cooling mode for portable air conditioners
In the EU, the same requirements, 2.6 minimum EER value (Regulation 206/2012) and
same energy label grades (Regulation 626/2011) are used for single duct and double duct
despite significant differences in test procedures:
- Single duct air conditioners are tested at 35 °C dry bulb (24 °C wet bulb) both
indoor and outdoor while double duct are tested like other air conditioner types at
outdoor conditions 35 °C dry bulb (24 °C wet bulb) and indoor conditions 27 °C dry
bulb (19 °C wet bulb).
- Infiltrations are accounted for in the performance tests of double duct air
conditioners but not for single duct air conditioners.
It is of interest to notice that portable double duct products seem to have disappeared in
Europe while these are still present in the USA. In the USA the rated performances are
different: temperature conditions are 27/27 for single duct in the USA instead of 35/35 in
Europe and 35/27 for double duct in the USA, same as in Europe, but infiltration is not
taken into account in present rating for double ducts in the USA while it is accounted for in
Europe. The USA regulation proposal30 is now to include infiltration for both types of
products and to rate the performance of products at equal outdoor temperature conditions.
This goes into the direction of ensuring a level of playing field between both types of
products and also to better inform the consumer by integrating infiltration impact.
In addition, it has been commented by EU test laboratories that some units can be supplied
with one or two ducts so that the end-user may choose between both operating modes,
albeit not having information on the consequences of operating in the two modes. In that
case, it is clear that manufacturers should respect requirements for both types of
configuration and supply corresponding information. The impact for the end-user is
analysed hereafter.
Impact of part load and infiltration on seasonal performance
It is thus required to explore the impact of the differences in rated performances of portable
air conditioners with one or two ducts and to evaluate the impact of infiltration (which are
already part of the difference between both product types).
As infiltration depends on outdoor air temperature and humidity, it is necessary to show
the impact of infiltration on a typical profile of use. A typical profile of use is similar to other
air conditioners but keeping in mind the specifics of portable air conditioner use and
considering only the residential sector (about 80 % of sales).
To that purpose, the average bin hours distribution of the Regulation 206/2012 is used but
cut below an outdoor temperature of 23 °C (starting bin 22.5 °C), which according to (VHK,
2014)11, corresponds to an average temperature of 26 °C indoor in residences, and can
then be considered as the starting point of cooling for these units. Starting to cool at higher
30 USA Federal Register, Vol 81, No. 105, Wednesday June 1, 2016.
38
outdoor (and thus indoor) air temperature than for fixed air conditioning installations
translates the fact that most units are residential and that end-users may be reluctant to
use these units unless really needed because of higher noise (compressor and 2 fans
indoors). Hours per bin are shown in Table 10.
Table 10: Bin number j, outdoor temperature Tj in oC and number of hours per bin hj corresponding to the reference cooling season
j # 0 1 2 3 4 5 6 7 8 9 10 11 12 13 14 15 16 17
Tj °C 23 24 25 26 27 28 29 30 31 32 33 34 35 36 37 38 39 40
hj h 218 197 178 158 137 109 88 63 39 31 24 17 13 9 4 3 1 0
By definition, 0 % building load condition occurs at an outdoor temperature of 23 °C. 100
% load is supposed to occur at 35 °C. However, the capacity corresponding to this
maximum load is presently different for single and double duct products:
- For single duct: the rated cooling capacity is measured at 35 °C db / 24 °C wb
without accounting for the impact of infiltration. The sizing decision is however likely
to be based on this value (as it is the only one available) or on indications supplied
by manufacturers or salesmen based on room size equivalence ("this air conditioner
is adapted for a room of XX m2").
- For double duct: the rated cooling capacity is defined in the same conditions as for
fix air conditioner types and so the rated cooling capacity is also the maximum
cooling load at 35 °C outdoor condition but including infiltration.
Hence building load can be written as:
𝐵𝐿(𝑇𝑗) = 𝑃𝑑𝑒𝑠𝑖𝑔𝑛𝑐 × 𝑃𝐿𝑅(𝑇𝑗) = 𝑃𝑑𝑒𝑠𝑖𝑔𝑛𝑐 × (𝑇𝑗 − 23) / (35 − 23) (Eq 1)
with Pdesignc = Pcrated, the portable rated cooling capacity.
In order to compute the capacity and efficiency of these units along the building load curve,
it is necessary to compute the impact of infiltration on the unit capacity. This is done using
a method similar to the one used by the US DOE to account for infiltration and also by
integrating the potential variation of the cooling capacity with Tj.
𝑃𝑐_𝑐𝑜𝑟𝑟(𝑇𝑗) = 𝑃𝑐(𝑇𝑗) + 𝑄𝐼𝑁𝐹(𝑇𝑗) (𝐸𝑞 2)
Where:
• Pc_corr(Tj): maximum capacity of the unit corrected with infiltration
• Pc(Tj): maximum capacity in bin Tj without accounting for infiltration
• 𝑄𝐼𝑁𝐹
(𝑇𝑗) : Heat loss by infiltration (W)
The infiltration impact is calculated with the following formulas:
𝐼𝑓 𝑇𝑗 < 27, 𝑄𝐼𝑁𝐹(𝑇𝑗) = 27 − 𝑇𝑗
27 − 20 × [𝐴𝐹 × (𝑟ℎ𝑜𝑎𝑖𝑟27
× ℎ27 − 𝑟ℎ𝑜𝑎𝑖𝑟20× ℎ20)]
𝐼𝑓 𝑇𝑗 > 27, 𝑄𝐼𝑁𝐹(𝑇𝑗) = 27 − 𝑇𝑗
35 − 27 × [𝐴𝐹 × (𝑟ℎ𝑜𝑎𝑖𝑟35
× ℎ35 − 𝑟ℎ𝑜𝑎𝑖𝑟27× ℎ27)]
Where:
• 𝑄𝐼𝑁𝐹
(𝑇𝑗) : Heat loss by infiltration (W)
• Tj: outdoor temperature of bin j
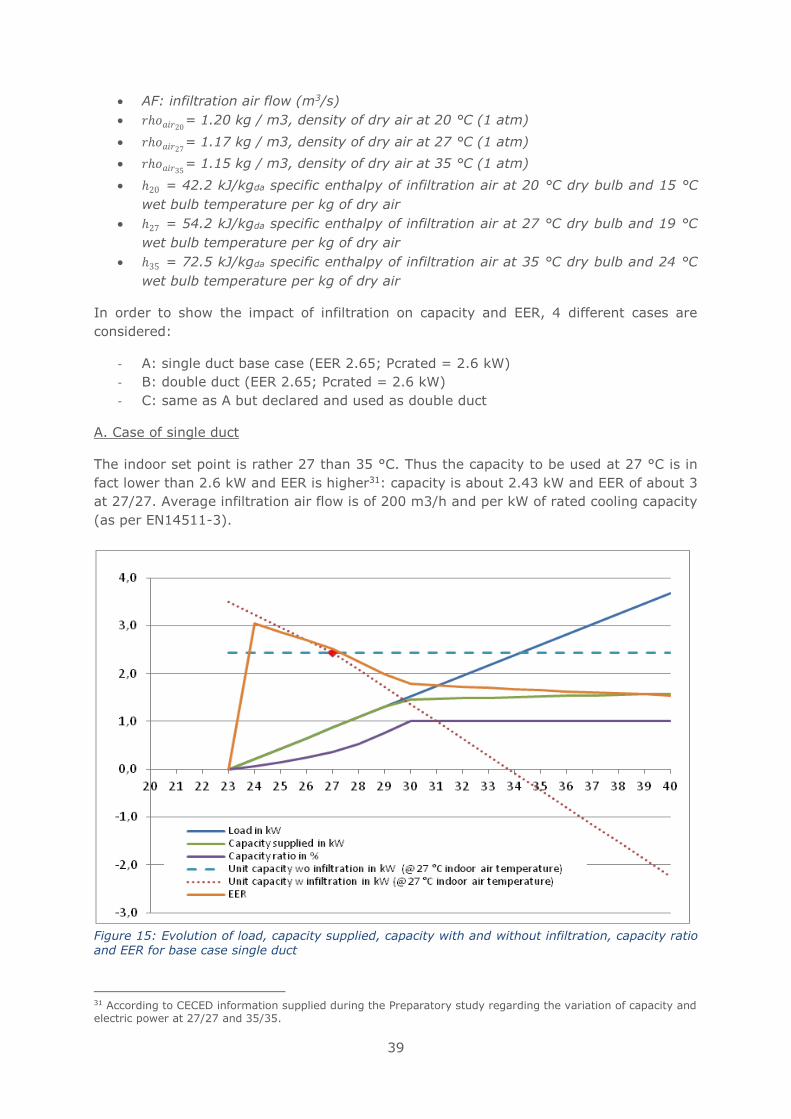
39
• AF: infiltration air flow (m3/s)
• 𝑟ℎ𝑜𝑎𝑖𝑟20= 1.20 kg / m3, density of dry air at 20 °C (1 atm)
• 𝑟ℎ𝑜𝑎𝑖𝑟27= 1.17 kg / m3, density of dry air at 27 °C (1 atm)
• 𝑟ℎ𝑜𝑎𝑖𝑟35= 1.15 kg / m3, density of dry air at 35 °C (1 atm)
• ℎ20 = 42.2 kJ/kgda specific enthalpy of infiltration air at 20 °C dry bulb and 15 °C
wet bulb temperature per kg of dry air
• ℎ27 = 54.2 kJ/kgda specific enthalpy of infiltration air at 27 °C dry bulb and 19 °C
wet bulb temperature per kg of dry air
• ℎ35 = 72.5 kJ/kgda specific enthalpy of infiltration air at 35 °C dry bulb and 24 °C
wet bulb temperature per kg of dry air
In order to show the impact of infiltration on capacity and EER, 4 different cases are
considered:
- A: single duct base case (EER 2.65; Pcrated = 2.6 kW)
- B: double duct (EER 2.65; Pcrated = 2.6 kW)
- C: same as A but declared and used as double duct
A. Case of single duct
The indoor set point is rather 27 than 35 °C. Thus the capacity to be used at 27 °C is in
fact lower than 2.6 kW and EER is higher31: capacity is about 2.43 kW and EER of about 3
at 27/27. Average infiltration air flow is of 200 m3/h and per kW of rated cooling capacity
(as per EN14511-3).
Figure 15: Evolution of load, capacity supplied, capacity with and without infiltration, capacity ratio and EER for base case single duct
31 According to CECED information supplied during the Preparatory study regarding the variation of capacity and electric power at 27/27 and 35/35.
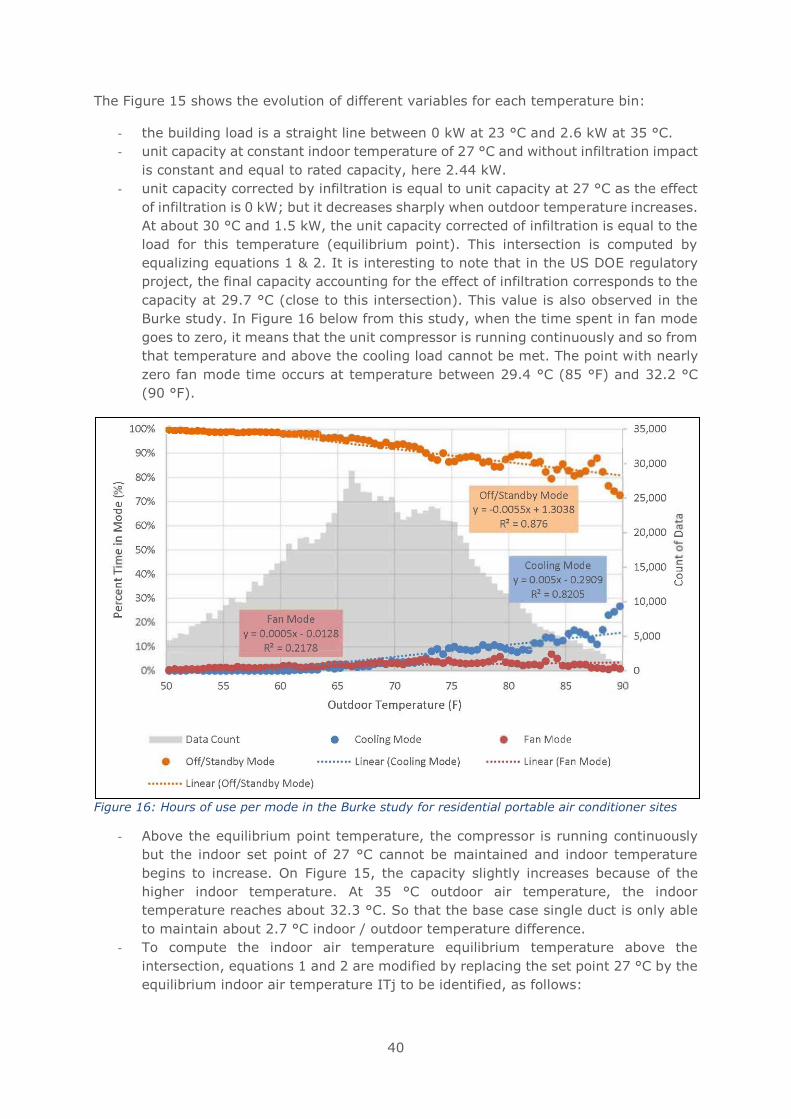
40
The Figure 15 shows the evolution of different variables for each temperature bin:
- the building load is a straight line between 0 kW at 23 °C and 2.6 kW at 35 °C.
- unit capacity at constant indoor temperature of 27 °C and without infiltration impact
is constant and equal to rated capacity, here 2.44 kW.
- unit capacity corrected by infiltration is equal to unit capacity at 27 °C as the effect
of infiltration is 0 kW; but it decreases sharply when outdoor temperature increases.
At about 30 °C and 1.5 kW, the unit capacity corrected of infiltration is equal to the
load for this temperature (equilibrium point). This intersection is computed by
equalizing equations 1 & 2. It is interesting to note that in the US DOE regulatory
project, the final capacity accounting for the effect of infiltration corresponds to the
capacity at 29.7 °C (close to this intersection). This value is also observed in the
Burke study. In Figure 16 below from this study, when the time spent in fan mode
goes to zero, it means that the unit compressor is running continuously and so from
that temperature and above the cooling load cannot be met. The point with nearly
zero fan mode time occurs at temperature between 29.4 °C (85 °F) and 32.2 °C
(90 °F).
Figure 16: Hours of use per mode in the Burke study for residential portable air conditioner sites
- Above the equilibrium point temperature, the compressor is running continuously
but the indoor set point of 27 °C cannot be maintained and indoor temperature
begins to increase. On Figure 15, the capacity slightly increases because of the
higher indoor temperature. At 35 °C outdoor air temperature, the indoor
temperature reaches about 32.3 °C. So that the base case single duct is only able
to maintain about 2.7 °C indoor / outdoor temperature difference.
- To compute the indoor air temperature equilibrium temperature above the
intersection, equations 1 and 2 are modified by replacing the set point 27 °C by the
equilibrium indoor air temperature ITj to be identified, as follows:
41
𝐵𝐿(𝑇𝑗) = 𝑃𝑑𝑒𝑠𝑖𝑔𝑛𝑐 × 𝑃𝐿𝑅(𝑇𝑗) = 𝑃𝑑𝑒𝑠𝑖𝑔𝑛𝑐 × (𝑇𝑗 + (𝐼𝑇𝑗 − 27) − 23) / (35 − 23) (𝐸𝑞 1 𝑏𝑖𝑠)
𝑄𝑐_𝑐𝑜𝑟𝑟(𝑇𝑗) = 𝑄𝑐(𝑇𝑗) + 𝑄𝐼𝑁𝐹(𝑇𝑗) (𝐸𝑞 2 𝑏𝑖𝑠)
With, 𝑄𝐼𝑁𝐹
(𝑇𝑗) = 𝐼𝑇𝑗−𝑇𝑗
35−27 × [𝐴𝐹 × (𝑟ℎ𝑜𝑎𝑖𝑟35
× ℎ35
− 𝑟ℎ𝑜𝑎𝑖𝑟27× ℎ27)]
In conclusion, regarding capacity, present rated capacity is 2.6 kW, but the unit can only
supply 1.5 kW at 2.7 K temperature difference indoor / outdoor. This information is not
communicated to the end-user today, which thinks capacity indicated for single duct is
comparable to kW cooling indications for fixed installations or mobile double ducts.
Regarding performances, infiltration modifies the capacity of the unit and modifies the
capacity ratio and so the part load performances. This needs to be accounted for to
compute seasonal performances.
The load ratio is computed by dividing the building load by the unit capacity corrected with
infiltration below the equilibrium point. Above that it is equal to 1. It can be seen that below
the equilibrium point, the capacity ratio of the unit is no longer a straight line because of
the infiltration effect. EER is computed based on the capacity supplied and the electricity
consumption of the unit, corrected by a cycling coefficient Cdc of 0.25 when load is lower
than the supplied capacity. A SEERon value can be computed with this method using the
following formula:
𝑆𝐸𝐸𝑅𝑜𝑛 =∑ ℎ𝑗 × 𝑃𝑐(𝑇𝑗)𝑛
𝑗=1
∑ ℎ𝑗 × (𝑃𝑐(𝑇𝑗)
𝐸𝐸𝑅(𝑇𝑗))𝑛
𝑗=1
Where:
• Tj = the bin temperature
• j = the bin number
• n = the amount of bins
• Pc(Tj) = below equilibrium point: the cooling demand of the building for the
corresponding temperature Tj; above the equilibrium point: the capacity of the unit
for the corresponding temperature Tj
• hj = the number of bin hours occurring at the corresponding temperature Tj
• EER(Tj) = the EER values of the unit for the corresponding temperature Tj.
The SEERon value reached is of 2.13 versus 3 presently rated EER at 27/27 or a 29 % gap.
The net effect of infiltration on SEERon is a 23 % gap, cycling then representing a 6 %
loss.
B. Case of standard double duct
Double duct air conditioners need to reach an EER of 2.6 to satisfy Regulation (EU)
206/2012. We use here the same capacity as for single duct of 2.6 kW (at conditions
outdoor 35 °C / indoor 27 °C) and same efficiency of 2.65. SEERon reaches 3.60.
Evolutions of capacity, load and load ratio, and efficiency with outdoor temperature are
shown in Figure 17.
It is interesting to note that this unit if tested at 27 °C / 27 °C would have a capacity of
4.6 kW and an EER close to 5.15 (note it is lower on Figure 17 because of cycling losses).
For matter of comparison, the scale of EER values on the EU market is 2.6 - 3.6. Thus,
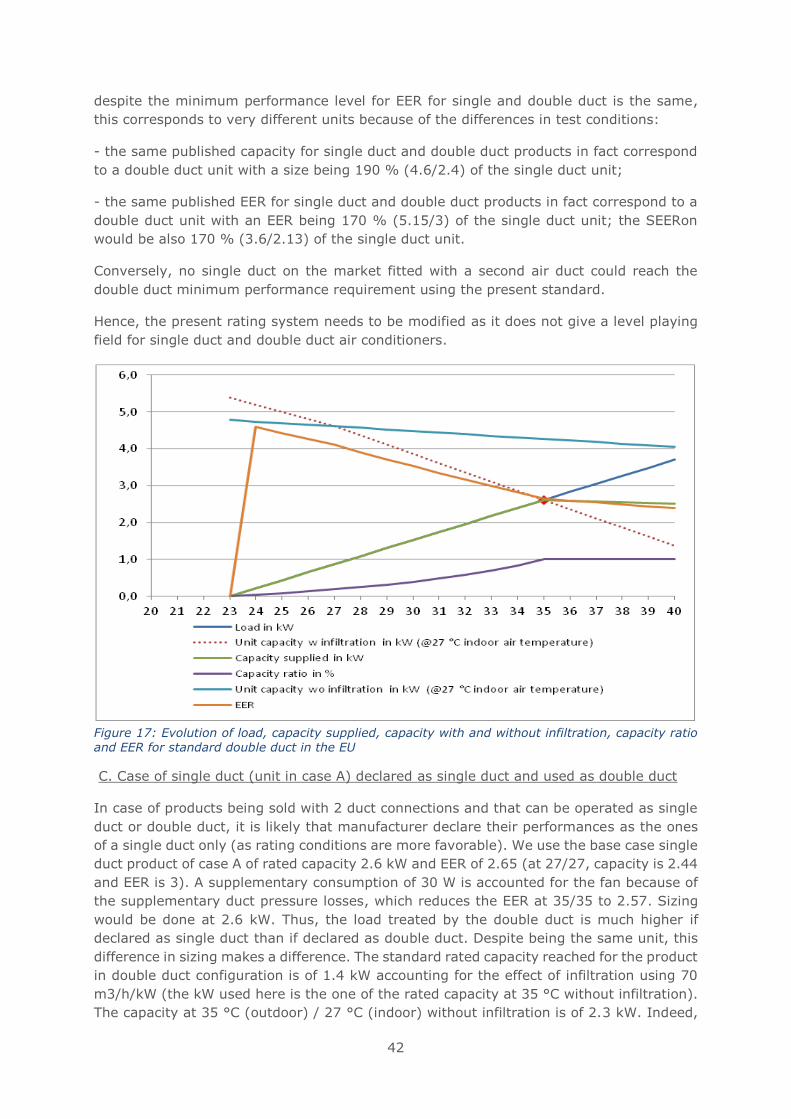
42
despite the minimum performance level for EER for single and double duct is the same,
this corresponds to very different units because of the differences in test conditions:
- the same published capacity for single duct and double duct products in fact correspond
to a double duct unit with a size being 190 % (4.6/2.4) of the single duct unit;
- the same published EER for single duct and double duct products in fact correspond to a
double duct unit with an EER being 170 % (5.15/3) of the single duct unit; the SEERon
would be also 170 % (3.6/2.13) of the single duct unit.
Conversely, no single duct on the market fitted with a second air duct could reach the
double duct minimum performance requirement using the present standard.
Hence, the present rating system needs to be modified as it does not give a level playing
field for single duct and double duct air conditioners.
Figure 17: Evolution of load, capacity supplied, capacity with and without infiltration, capacity ratio and EER for standard double duct in the EU
C. Case of single duct (unit in case A) declared as single duct and used as double duct
In case of products being sold with 2 duct connections and that can be operated as single
duct or double duct, it is likely that manufacturer declare their performances as the ones
of a single duct only (as rating conditions are more favorable). We use the base case single
duct product of case A of rated capacity 2.6 kW and EER of 2.65 (at 27/27, capacity is 2.44
and EER is 3). A supplementary consumption of 30 W is accounted for the fan because of
the supplementary duct pressure losses, which reduces the EER at 35/35 to 2.57. Sizing
would be done at 2.6 kW. Thus, the load treated by the double duct is much higher if
declared as single duct than if declared as double duct. Despite being the same unit, this
difference in sizing makes a difference. The standard rated capacity reached for the product
in double duct configuration is of 1.4 kW accounting for the effect of infiltration using 70
m3/h/kW (the kW used here is the one of the rated capacity at 35 °C without infiltration).
The capacity at 35 °C (outdoor) / 27 °C (indoor) without infiltration is of 2.3 kW. Indeed,
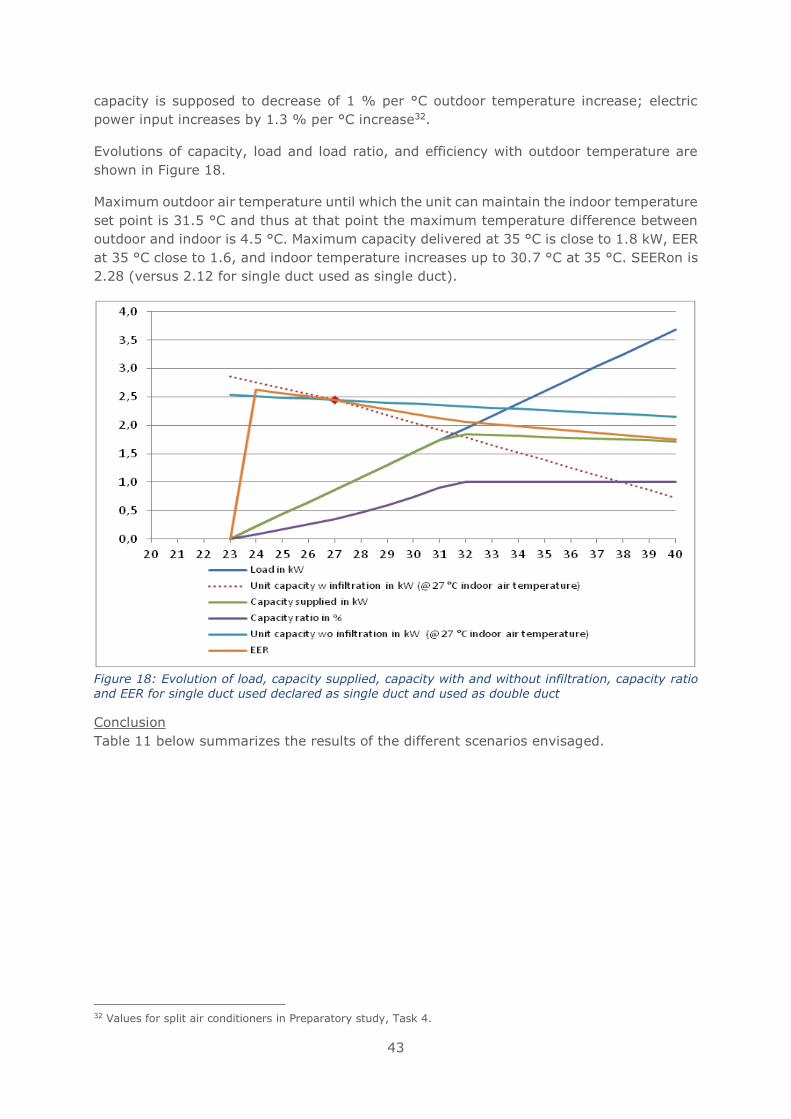
43
capacity is supposed to decrease of 1 % per °C outdoor temperature increase; electric
power input increases by 1.3 % per °C increase32.
Evolutions of capacity, load and load ratio, and efficiency with outdoor temperature are
shown in Figure 18.
Maximum outdoor air temperature until which the unit can maintain the indoor temperature
set point is 31.5 °C and thus at that point the maximum temperature difference between
outdoor and indoor is 4.5 °C. Maximum capacity delivered at 35 °C is close to 1.8 kW, EER
at 35 °C close to 1.6, and indoor temperature increases up to 30.7 °C at 35 °C. SEERon is
2.28 (versus 2.12 for single duct used as single duct).
Figure 18: Evolution of load, capacity supplied, capacity with and without infiltration, capacity ratio
and EER for single duct used declared as single duct and used as double duct
Conclusion
Table 11 below summarizes the results of the different scenarios envisaged.
32 Values for split air conditioners in Preparatory study, Task 4.
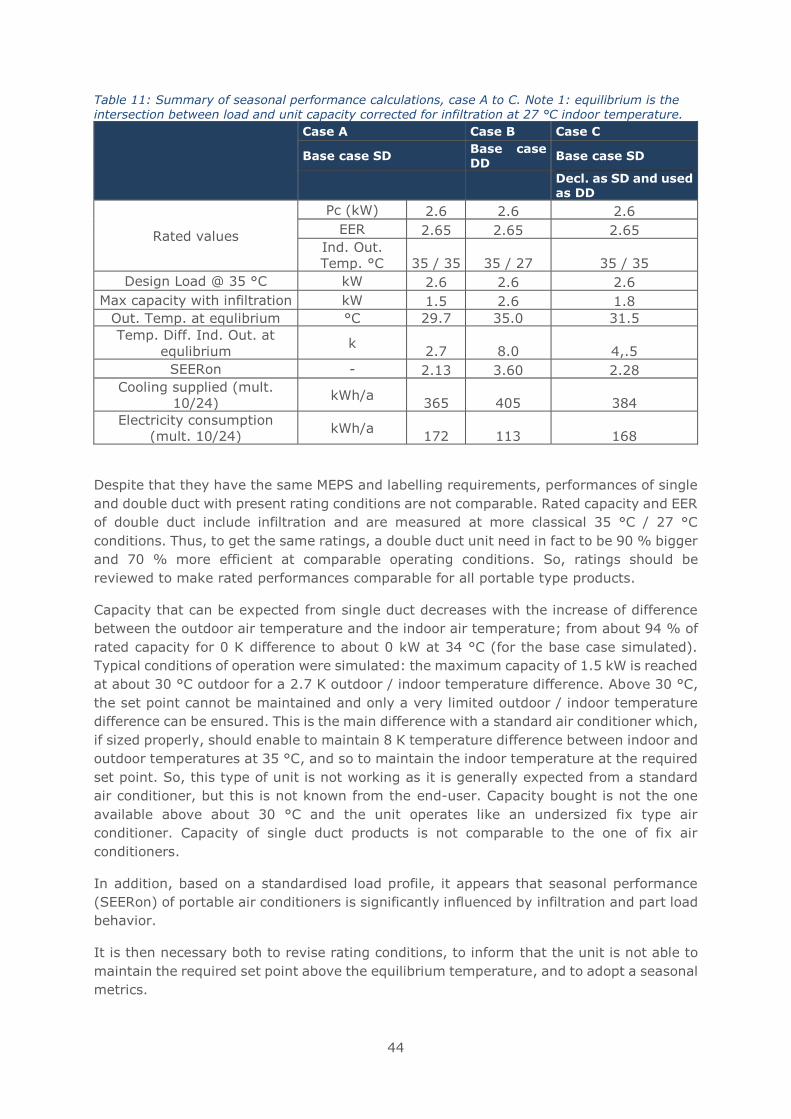
44
Table 11: Summary of seasonal performance calculations, case A to C. Note 1: equilibrium is the
intersection between load and unit capacity corrected for infiltration at 27 °C indoor temperature.
Case A Case B Case C
Base case SD Base case DD
Base case SD
Decl. as SD and used as DD
Rated values
Pc (kW) 2.6 2.6 2.6
EER 2.65 2.65 2.65
Ind. Out.
Temp. °C 35 / 35 35 / 27 35 / 35
Design Load @ 35 °C kW 2.6 2.6 2.6
Max capacity with infiltration kW 1.5 2.6 1.8
Out. Temp. at equlibrium °C 29.7 35.0 31.5
Temp. Diff. Ind. Out. at
equlibrium k
2.7 8.0 4,.5
SEERon - 2.13 3.60 2.28
Cooling supplied (mult.
10/24) kWh/a
365 405 384
Electricity consumption
(mult. 10/24) kWh/a
172 113 168
Despite that they have the same MEPS and labelling requirements, performances of single
and double duct with present rating conditions are not comparable. Rated capacity and EER
of double duct include infiltration and are measured at more classical 35 °C / 27 °C
conditions. Thus, to get the same ratings, a double duct unit need in fact to be 90 % bigger
and 70 % more efficient at comparable operating conditions. So, ratings should be
reviewed to make rated performances comparable for all portable type products.
Capacity that can be expected from single duct decreases with the increase of difference
between the outdoor air temperature and the indoor air temperature; from about 94 % of
rated capacity for 0 K difference to about 0 kW at 34 °C (for the base case simulated).
Typical conditions of operation were simulated: the maximum capacity of 1.5 kW is reached
at about 30 °C outdoor for a 2.7 K outdoor / indoor temperature difference. Above 30 °C,
the set point cannot be maintained and only a very limited outdoor / indoor temperature
difference can be ensured. This is the main difference with a standard air conditioner which,
if sized properly, should enable to maintain 8 K temperature difference between indoor and
outdoor temperatures at 35 °C, and so to maintain the indoor temperature at the required
set point. So, this type of unit is not working as it is generally expected from a standard
air conditioner, but this is not known from the end-user. Capacity bought is not the one
available above about 30 °C and the unit operates like an undersized fix type air
conditioner. Capacity of single duct products is not comparable to the one of fix air
conditioners.
In addition, based on a standardised load profile, it appears that seasonal performance
(SEERon) of portable air conditioners is significantly influenced by infiltration and part load
behavior.
It is then necessary both to revise rating conditions, to inform that the unit is not able to
maintain the required set point above the equilibrium temperature, and to adopt a seasonal
metrics.
45
Update of rating conditions
It appears that despite the points mentioned above regarding the lack of capacity of single
duct and their limitation as regards outdoor / indoor temperature difference, there is a
solid market for these products. Regarding portable double duct air conditioners, their
market share is presently very low (can hardly be found in stores in Europe). This is
probably at least partly due to the unfavorable rating conditions. Clearly, revised ratings
should use the same temperature conditions including infiltration, if occurring for those
conditions, to make both product types comparable.
In the USA, the US DOE kept a weighted average capacity (SACC) including infiltration
corresponding to the following conditions 29.7 °C outdoor temperature for 27 °C indoor.
This tends to decrease significantly the capacity and EER of single duct air conditioners
(close to 40 % loss; for the hypothesis kept on infiltration, capacity decreases from 2.6 to
about 1.6 kW) and to increase the capacity and EER of double duct air conditioner (from
1.5 kW to about 2.2 kW with infiltration).
Decreasing the capacity rating of single duct air conditioners may lead to increase the size
of installed products, with limited comfort gains and with increased consumption (for case
A before, oversizing by a factor 2 leads to 32 % increase in energy consumption, with only
5 % more cooling energy delivered with equilibrium occurring slightly above 31 °C instead
of 30 °C; increase in consumption is thus mainly due to seasonal performance decrease
because of cycling).
On the other hand, decreasing the capacity of single duct by including infiltration may make
the comparison with fix air conditioners more realistic. It has been seen before that for a
typical profile of use, a single duct air conditioner would not deliver more than 1.5 kW
(against 2.6 kW rated). However, this maximum capacity delivered depends on the load
curve (and so on the design condition) and on the capacity corrected by infiltration. And
so, the maximum capacity delivered, and coincident outdoor temperature vary for each
product and installation. Using this intersection between capacity and standardised load
would lead to have a variable temperature for a given capacity (comparison of 1.5 kW at
30 °C or 1.9 kW at 32 °C is not straightforward).
On the other hand, the risk of oversizing is limited because capacity is not thought to be
the main driver to choose a portable unit. Instead it is more likely that the end-users
choose the size of the unit based on indications supplied by manufacturers regarding the
area for which the product is adapted. This information may vary depending on the climate
of the country where the product is sold.
This also means that it is not really an issue if capacity corresponds to a variable outdoor
temperature depending on the unit.
So, capacity at equilibrium temperature should be kept as the unit capacity to be published
on the product information. It gives the best possible estimate of the real service supplied
by a specific portable unit. In addition, in order to show the difference with fixed appliances,
it is necessary to add the following note to warn end-users:
above an outdoor temperature of XX °C (the "equilibrium" temperature), the equipment
may not allow to maintain the indoor temperature at YY °C lower than the outdoor air
temperature. Both XX and YY should be computed based on ratings. The formula are given
below in the seasonal performance index part.
46
This applies to single duct and to double duct portable air conditioners.
Seasonal performance index
Using Regulation (EU) 206/2012 and taking a cooling season corresponding to hours above
23 °C, this leads to 1289 hours. As for fix installations, they are supposed to be used only
10 hours over 24, or about 58 % of the time, which leads to 750 hours in standby mode
and leaves 549 hours for hours when the unit is on.
Using these figures and the standard SEERon simulation here before (2.6 kW single duct
unit with EER 2.65, air flow at condenser of 520 m3/h), this leads to the following figures:
- cooling energy supplied: 365 kWh/a
- electricity consumption (cooling mode only): 172 kWh/a
It is clear that integrating standby power consumption makes no difference; with 1 W
power, standby power consumption is 0.75 kWh or 0.4 % or yearly electricity consumption
for cooling. So further progress on standby power consumption cannot be expected from
including standby in seasonal performance metrics.
In the Burke study, the fan mode includes both thermostat-off hours (hours with unit on
and without cooling need in Regulation (EU) 206/2012) and fractions of hours when the
unit is cycling. For these later hours, it is proposed to account for cycling by using a Cd
factor and so these hours are not accounted for here. So the Burke study cannot be used
to define thermostat-off hours. To do so the hours in bin 23 °C (no load) are considered;
this corresponds to 218 hours, to be multiplied by 10/24 to only keep the hours when the
unit is on or 91 hours. If thermostat-off power is slightly above 100 W, as measured for
units of similar size as the one of the base case, this is still significant: 9 kWh or 4.5 %.
So, the following equations should be used to compute SEER, and maximum temperature
operating conditions for rating portable products.
𝑆𝐸𝐸𝑅 =∑ ℎ𝑗 × 𝑃𝑐_𝑐𝑜𝑟𝑟(𝑇𝑗)𝑛
𝑗=1
∑ ℎ𝑗 × 𝑃𝑐_𝑐𝑜𝑟𝑟(𝑇𝑗)𝑛𝑗=1
𝑆𝐸𝐸𝑅𝑜𝑛+ 𝐻𝑇𝑂 × 𝑃𝑇𝑂 + 𝐻𝑆𝐵 × 𝑃𝑆𝐵
𝑆𝐸𝐸𝑅𝑜𝑛 =∑ ℎ𝑗 × 𝑃𝑐_𝑐𝑜𝑟𝑟(𝑇𝑗)𝑛
𝑗=1
∑ ℎ𝑗 × (𝑃𝑐_𝑐𝑜𝑟𝑟(𝑇𝑗)𝐸𝐸𝑅𝑏𝑖𝑛(𝑇𝑗)
)𝑛𝑗=1
Where:
• Tj = the bin temperature
• j = the bin number
• n = the amount of bins
• Pc_corr(Tj) = below equilibrium point: the cooling demand of the building for the
corresponding temperature Tj; above the equilibrium point: the capacity of the unit
for the corresponding temperature Tj
• hj = the number of bin hours occurring at the corresponding temperature Tj
• EERbin(Tj) = the EER values of the unit for the corresponding temperature Tj.
• HTO, HSB: the number of hours the unit is considered to work in thermostat-off mode
• PTO, PSB: the electricity consumption during thermostat-off mode
Calculation of Pc_corr(Tj) and EERbin(Tj) for single duct air conditioners
47
The capacity Qc(Tj) for temperature of bin j should be computed as follows.
𝑄𝑐(𝑇𝑗) = 𝑄𝑐(27) (𝐸𝑞 1)
Where:
• Qc(27): rated capacity at 27(19) indoor and outdoor
Capacity should then be corrected for infiltration as follows:
𝑄𝑐𝑐𝑜𝑟𝑟(𝑇𝑗) = 𝑄𝑐(𝑇𝑗) + 𝑄𝐼𝑁𝐹(𝑇𝑗) (𝐸𝑞 2)
Where:
• Qc_corr(Tj): maximum capacity of the unit corrected with infiltration
• Qc(Tj): maximum capacity in bin Tj without accounting for infiltration
The infiltration impact is calculated with the following formulas:
𝐼𝑓 𝑇𝑗 < 27, 𝑄𝐼𝑁𝐹(𝑇𝑗) = 27 − 𝑇𝑗
27 − 20 × [𝐴𝐹 × (𝑟ℎ𝑜𝑎𝑖𝑟27
× ℎ27 − 𝑟ℎ𝑜𝑎𝑖𝑟20× ℎ20)]
𝐼𝑓 𝑇𝑗 > 27, 𝑄𝐼𝑁𝐹(𝑇𝑗) = 27 − 𝑇𝑗
35 − 27 × [𝐴𝐹 × (𝑟ℎ𝑜𝑎𝑖𝑟35
× ℎ35 − 𝑟ℎ𝑜𝑎𝑖𝑟27× ℎ27)] =
27 − 𝑇𝑗
35 − 27 × 𝐼𝑁𝐹
Where:
• 𝑄𝐼𝑁𝐹
(𝑇𝑗) : Heat loss by infiltration (W)
• Tj: outdoor temperature of bin j
• AF: infiltration air flow (m3/s)
• 𝑟ℎ𝑜𝑎𝑖𝑟20= 1.20 kg / m3, density of dry air at 20 °C (1 atm)
• 𝑟ℎ𝑜𝑎𝑖𝑟27= 1.17 kg / m3, density of dry air at 27 °C (1 atm)
• 𝑟ℎ𝑜𝑎𝑖𝑟35= 1.15 kg / m3, density of dry air at 35 °C (1 atm)
• ℎ20 = 42.2 kJ/kgda specific enthalpy of infiltration air at 20 °C dry bulb and 15 °C
wet bulb temperature per kg of dry air
• ℎ27 = 54.2 kJ/kgda specific enthalpy of infiltration air at 27 °C dry bulb and 19 °C
wet bulb temperature per kg of dry air
• ℎ35 = 72.5 kJ/kgda specific enthalpy of infiltration air at 35 °C dry bulb and 24 °C
wet bulb temperature per kg of dry air
• INF = infiltration in kW (cooling capacity loss - negative capacity value due to
infiltration)
Equilibrium temperature, which is the intersection between building load curve (Eq 3) and
capacity corrected with infiltration (Eq 2) is determined and noted Teq.
𝑄𝑐_𝑐𝑜𝑟𝑟(𝑇𝑗) = 𝑄𝑐(27) + 27 − 𝑇𝑗
35 − 27 × 𝐼𝑁𝐹 (𝐸𝑞 2)
𝐵𝐿(𝑇𝑗) = 𝑄𝑐(27) × (𝑇𝑗 − 23) / (35 − 23) (𝐸𝑞 3)
48
𝑇𝑒𝑞 =
𝑄𝑐(27) +27
35 − 27× 𝐼𝑁𝐹 +
23(35 − 23)
× 𝑄𝑐(27)
𝑄𝑐(27)35 − 23
+𝐼𝑁𝐹
(35 − 27)
(𝐸𝑞 4)
Pc_corr(Tj) is then computed as follows:
𝐼𝑓 𝑇𝑗 ≤ 𝑇𝑒𝑞: 𝑃𝑐_𝑐𝑜𝑟𝑟(𝑇𝑗) = 𝐵𝐿(𝑇𝑗)
𝐼𝑓 𝑇𝑗 > 𝑇𝑒𝑞: 𝑃𝑐_𝑐𝑜𝑟𝑟(𝑇𝑗) = 𝑄𝑐_𝑐𝑜𝑟𝑟(𝑇𝑗)
The unit capacity information to be published is Pc_corr(Teq).
To compute EERbin(Tj), two cases may occur. In both cases, the capacity ratio should be
computed as follows:
𝐶𝑅(𝑇𝑗) = 𝑚𝑖𝑛 (1 ; 𝑃𝑐_𝑐𝑜𝑟𝑟(𝑇𝑗) / 𝐵𝐿(𝑇𝑗))
Case 1: on-off unit
𝐼𝑓 𝐶𝑅(𝑇𝑗) < 1; 𝐸𝐸𝑅𝑏𝑖𝑛(𝑇𝑗) = 𝐸𝐸𝑅𝑟𝑎𝑡𝑒𝑑 𝑥 (1 − 𝐶𝑑𝑐 𝑥 (1 − 𝐶𝑅(𝑇𝑗)))
With Cdc cycling coefficient with a value 0.25 by default.
Case 2: inverter unit
A supplementary test should be made at 27 (19) / 27 (19) temperature conditions and at
33 % capacity ratio. The part load coefficient of EER variation noted PLc should be
computed as follows:
𝑃𝐿𝑐 =
𝐸𝐸𝑅(27; 33%) − 𝐸𝐸𝑅(27; 100%)𝐸𝐸𝑅(27; 100%)
𝑄𝑐(27; 100%) − 𝑄𝑐(27; 33%)𝑄𝑐(27; 100%)
(Eq 5)
And EERbin(Tj) should be computed as follows:
𝐼𝑓 𝐶𝑅(𝑇𝑗) ≥ 0.33; 𝐸𝐸𝑅𝑏𝑖𝑛(𝑇𝑗) = 𝐸𝐸𝑅𝑟𝑎𝑡𝑒𝑑 𝑥 (1 + 𝑃𝐿𝑐 𝑥 (1 – 𝐶𝑅(𝑇𝑗)))
𝐼𝑓 𝐶𝑅(𝑇𝑗) < 0.33; 𝐸𝐸𝑅𝑏𝑖𝑛(𝑇𝑗) = 𝐸𝐸𝑅𝑟𝑎𝑡𝑒𝑑 𝑥 (1 + 𝑃𝐿𝑐 𝑥 (1 – 0.33))𝑥(1 − 0.25 𝑥 (1 – 𝐶𝑅(𝑇𝑗)/0.33))
Calculation of Pc_corr(Tj) and EERbin(Tj) for double duct air conditioners
𝑄𝑐(𝑇𝑗) = 𝑄𝑐(27) + (𝑄𝑐(35) − 𝑄𝑐(27))/8 𝑥 (𝑇𝑗 – 27) (𝐸𝑞 1𝑏𝑖𝑠)
Where:
• Qc(27): rated capacity at 27(19) indoor and outdoor
• Qc(35): rated capacity at 27(19) indoor and 35(24) outdoor
Capacity should then be corrected for infiltration as follows:
49
𝑄𝑐_𝑐𝑜𝑟𝑟(𝑇𝑗) = 𝑄𝑐(𝑇𝑗) (𝐸𝑞 2𝑏𝑖𝑠)
Equilibrium temperature, which is the intersection between building load curve (Eq 3) and
capacity corrected with infiltration (Eq 2) is determined and noted Teq.
𝑄𝑐_𝑐𝑜𝑟𝑟(𝑇𝑗) = 𝑄𝑐(27) + (𝑄𝑐(35) − 𝑄𝑐(27))/8 𝑥 (𝑇𝑗 − 27) (𝐸𝑞 2𝑏𝑖𝑠)
𝐵𝐿(𝑇𝑗) = 𝑄𝑐(27) × (𝑇𝑗 − 23) / (35 − 23) (𝐸𝑞 3)
𝑇𝑒𝑞 = 𝑄𝑐(27) − 27 ×
𝑄𝑐(35) − 𝑄𝑐(27)8
+ 23 ×𝑄𝑐(27)
(35 − 23)
𝑄𝑐(27)35 − 23
−𝑄𝑐(35) − 𝑄𝑐(27)
(35 − 27)
(𝐸𝑞 4)
Pc_corr(Tj) is then computed as follows:
𝐼𝑓 𝑇𝑗 ≤ 𝑇𝑒𝑞: 𝑃𝑐_𝑐𝑜𝑟𝑟(𝑇𝑗) = 𝐵𝐿(𝑇𝑗)
𝐼𝑓 𝑇𝑗 > 𝑇𝑒𝑞: 𝑃𝑐_𝑐𝑜𝑟𝑟(𝑇𝑗) = 𝑄𝑐_𝑐𝑜𝑟𝑟(𝑇𝑗)
To compute EERbin(Tj), two cases may occur. In both cases, the capacity ratio (CR(Tj))
should be computed as follows:
𝐶𝑅(𝑇𝑗) = 𝑚𝑖𝑛 (1 ; 𝑃𝑐_𝑐𝑜𝑟𝑟(𝑇𝑗) / 𝐵𝐿(𝑇𝑗))
For double duct units, the efficiency at maximum capacity should be computed as follows:
𝐸𝐸𝑅(𝑇𝑗) = 𝐸𝐸𝑅(27) + (𝐸𝐸𝑅(35) − 𝐸𝐸𝑅(27))/8 𝑥 (𝑇𝑗 − 27)
Where:
• EER(27): rated EER at 27(19) indoor and outdoor
• EER(35): rated EER at 27(19) indoor and 35(24) outdoor
Case 1: on-off unit
𝐼𝑓 𝐶𝑅(𝑇𝑗) < 1; 𝐸𝐸𝑅𝑏𝑖𝑛(𝑇𝑗) = 𝐸𝐸𝑅(𝑇𝑗) 𝑥 (1 − 𝐶𝑑𝑐 𝑥 (1 − 𝐶𝑅(𝑇𝑗)))
With Cdc cycling coefficient with a value 0.25 by default.
Case 2: inverter unit
A supplementary test should be made at 27 (19) / 27 (19) temperature conditions and at
33 % capacity ratio. The part load coefficient of EER variation noted PLc should be
computed as follows:
𝑃𝐿𝑐 =
𝐸𝐸𝑅(27; 33%) − 𝐸𝐸𝑅(27; 100%)𝐸𝐸𝑅(27; 100%)
𝑄𝑐(27; 100%) − 𝑄𝑐(27; 33%)𝑄𝑐((27; 100%)
(𝐸𝑞 5)
And EERbin(Tj) should be computed as follows:
𝐼𝑓 𝐶𝑅(𝑇𝑗) ≥ 0.33; 𝐸𝐸𝑅𝑏𝑖𝑛(𝑇𝑗) = 𝐸𝐸𝑅𝑟𝑎𝑡𝑒𝑑 𝑥 (1 + 𝑃𝐿𝑐 𝑥 (1 – 𝐶𝑅(𝑇𝑗)))
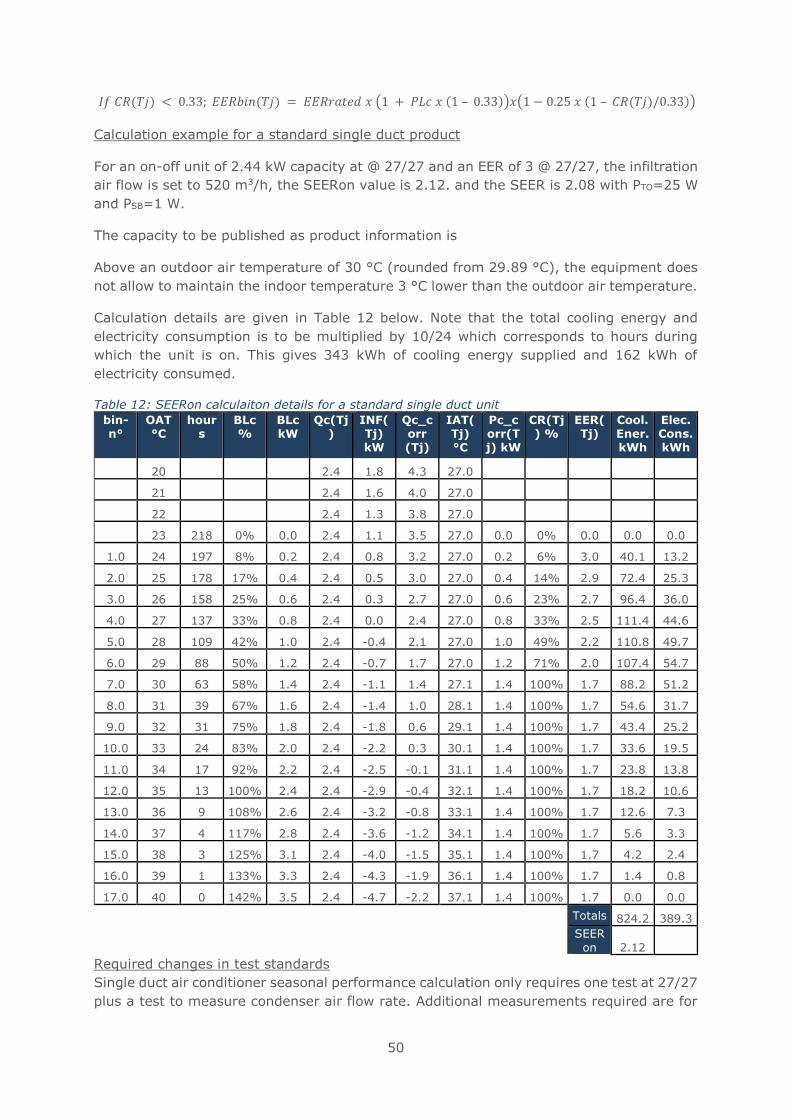
50
𝐼𝑓 𝐶𝑅(𝑇𝑗) < 0.33; 𝐸𝐸𝑅𝑏𝑖𝑛(𝑇𝑗) = 𝐸𝐸𝑅𝑟𝑎𝑡𝑒𝑑 𝑥 (1 + 𝑃𝐿𝑐 𝑥 (1 – 0.33))𝑥(1 − 0.25 𝑥 (1 – 𝐶𝑅(𝑇𝑗)/0.33))
Calculation example for a standard single duct product
For an on-off unit of 2.44 kW capacity at @ 27/27 and an EER of 3 @ 27/27, the infiltration
air flow is set to 520 m3/h, the SEERon value is 2.12. and the SEER is 2.08 with PTO=25 W
and PSB=1 W.
The capacity to be published as product information is
Above an outdoor air temperature of 30 °C (rounded from 29.89 °C), the equipment does
not allow to maintain the indoor temperature 3 °C lower than the outdoor air temperature.
Calculation details are given in Table 12 below. Note that the total cooling energy and
electricity consumption is to be multiplied by 10/24 which corresponds to hours during
which the unit is on. This gives 343 kWh of cooling energy supplied and 162 kWh of
electricity consumed.
Table 12: SEERon calculaiton details for a standard single duct unit
bin-n°
OAT °C
hours
BLc %
BLc kW
Qc(Tj)
INF(Tj) kW
Qc_corr (Tj)
IAT(Tj) °C
Pc_corr(Tj) kW
CR(Tj) %
EER(Tj)
Cool. Ener. kWh
Elec. Cons. kWh
20 2.4 1.8 4.3 27.0
21 2.4 1.6 4.0 27.0
22 2.4 1.3 3.8 27.0
23 218 0% 0.0 2.4 1.1 3.5 27.0 0.0 0% 0.0 0.0 0.0
1.0 24 197 8% 0.2 2.4 0.8 3.2 27.0 0.2 6% 3.0 40.1 13.2
2.0 25 178 17% 0.4 2.4 0.5 3.0 27.0 0.4 14% 2.9 72.4 25.3
3.0 26 158 25% 0.6 2.4 0.3 2.7 27.0 0.6 23% 2.7 96.4 36.0
4.0 27 137 33% 0.8 2.4 0.0 2.4 27.0 0.8 33% 2.5 111.4 44.6
5.0 28 109 42% 1.0 2.4 -0.4 2.1 27.0 1.0 49% 2.2 110.8 49.7
6.0 29 88 50% 1.2 2.4 -0.7 1.7 27.0 1.2 71% 2.0 107.4 54.7
7.0 30 63 58% 1.4 2.4 -1.1 1.4 27.1 1.4 100% 1.7 88.2 51.2
8.0 31 39 67% 1.6 2.4 -1.4 1.0 28.1 1.4 100% 1.7 54.6 31.7
9.0 32 31 75% 1.8 2.4 -1.8 0.6 29.1 1.4 100% 1.7 43.4 25.2
10.0 33 24 83% 2.0 2.4 -2.2 0.3 30.1 1.4 100% 1.7 33.6 19.5
11.0 34 17 92% 2.2 2.4 -2.5 -0.1 31.1 1.4 100% 1.7 23.8 13.8
12.0 35 13 100% 2.4 2.4 -2.9 -0.4 32.1 1.4 100% 1.7 18.2 10.6
13.0 36 9 108% 2.6 2.4 -3.2 -0.8 33.1 1.4 100% 1.7 12.6 7.3
14.0 37 4 117% 2.8 2.4 -3.6 -1.2 34.1 1.4 100% 1.7 5.6 3.3
15.0 38 3 125% 3.1 2.4 -4.0 -1.5 35.1 1.4 100% 1.7 4.2 2.4
16.0 39 1 133% 3.3 2.4 -4.3 -1.9 36.1 1.4 100% 1.7 1.4 0.8
17.0 40 0 142% 3.5 2.4 -4.7 -2.2 37.1 1.4 100% 1.7 0.0 0.0
Totals 824.2 389.3
SEER
on 2.12
Required changes in test standards
Single duct air conditioner seasonal performance calculation only requires one test at 27/27
plus a test to measure condenser air flow rate. Additional measurements required are for
51
thermostat-off and standby (standby is already done). It is proposed that the capacity of
single duct to be used is the capacity at 27/27 as it is then comparable with the one of
double duct air conditioners.
For double duct, it is necessary to have two tests at 27/27 and 35/27 but there is no need
to measure air flow rate. Additional measurements required are for thermostat-off and
standby (standby is already done). It is proposed that the capacity of double duct to be
used is the capacity at 27/27 as it is then comparable with the one of single duct air
conditioners.
3.1.7 Real life versus standard performances
In the following section the real-life performance is discussed for both fixed and portable
air conditioners.
For large efficiency increase of split air conditioners due to large indoor air flow increase,
several comments have been received regarding the risk of designing units that operate
very efficiently under EN14825 conditions but not in real life:
• In heating mode, temperature should not be blown below 32 °C (temperature of
the skin) and probably closer to 40 °C to avoid "cold draft" effect. In case the
temperature blown is too low, the end-user is likely to increase the indoor set point,
thus increasing heating load and decreasing the real life SCOP and thus increasing
the difference between standardized performance and real life one.
• In cooling mode, cooling without dehumidification does not allow to enter the
comfort zone. This is likely to lead end-user to decrease the cooling temperature
set point to feel more comfortable, with increased cooling load and decreased
efficiency and thus increasing the difference between standardized performance and
real life one.
Hence, building very efficient machines by increasing the indoor air flow may lead to
disconnect the SEER and SCOP ratings from real life performances.
These comments were received for very large increase in indoor air flow rates over the
base cases in Task 6. However, some of these air flow levels match the ones of existing
products on the EU market (for products of the same capacity). It means there is a risk
that some of the most efficient units on the EU market already have air flow levels which
imply the savings expected by the end-user are not realized in practice.
It is thus proposed, for units in the scope of this study, to complete the data supplied in
test report of EN14511-3 with a measurement of the blown air temperature in heating
mode and blown air temperature and humidity in cooling mode. These temperatures are
normally measured during tests but not disclosed/published. They should now be available
in the technical documentation of the products.
These values are to be reviewed at the time of the next revision of Regulation 206/2012
and 626/2011. The review should evaluate the possible impacts and the required changes
in the standard and the regulation to ensure that SEER and SCOPs remain representative
of real life. Possible measures could include minimum air temperature supply in heating
mode, minimum sensible to heat ratio for certain conditions in cooling mode or lowering
the cooling temperature set point from 27 °C to lower values, particularly at low loads.
52
3.1.7.1 In situ continuous performance measurement
As explained in part 3.1.1, there is presently no agreed method to measure in-situ
performance of air-to-air heat pump performance on sites, which makes it impossible to
compare in-situ and standard performances as is currently done for other energy
consuming products.
The reason why is that measuring capacity on the air side is cumbersome in real life. In a
lab, indoor air flow and temperature inlet and outlet (and humidity) can be measured to
evaluate cooling capacities at indoor unit side (although not precise enough). Stated in the
standard, indirect measurement is done as follows: an electric heater heats the room and
the air conditioner must stabilize the room temperature and the cooling capacity matches
the heater energy and room losses, this is used for all air conditioners in scope. It is a more
precise method but not possible to be done on field. As the above methods cannot be used
on field, no measured capacity on field means real life efficiency cannot be measured.
However, on-board performance measurement on the refrigerant side is possible and
highly precise (with the same or even better precision than standard measurement on the
air side as performed today). At least one compressor manufacturer already developed
such a method basing upon the compressor performance curves (sold as an option to
system assembler with the compressor) and also one air conditioner manufacturer33.
Several other methods are possible (using the expansion valve or the compressor energy
balance)34, and at least one of these methods is being developed35.
These methods could be generalized and used by all manufacturers, but an important
standardization work has to be done to ensure their reliability. This should include methods
to correct performance evaluation for dynamic conditions and the way faults are filtered,
as well as possible checks of on-board measurement capabilities by third parties.
This seems an important topic to improve further the efficiency and to reduce real life
consumption of air conditioners, as well as to ensure that test standards are aligned with
real life operating conditions as regards sizing, equivalent full load hours and other
operating hours. As these methods could apply in practice to most types of vapor
compression cycles, this would also help the unfortunate inspectors of HVAC systems (EPB
Directive 2010/31/EU, articles 14 and 15), that presently have little information on system
performance or adequate sizing.
3.1.7.2 Additional information to end-user to reduce real life consumption
UBA36 suggests other ways to cut real life energy consumption to be studied and possibly
become Ecodesign requirements:
33 Stefan Vandaele, Hiroshi Aihara, Optimisation of VRF systems in buildings by monitoring, in Heiselberg, P. K. (Ed.) (2016). CLIMA 2016 - proceedings of the 12th REHVA World Congress: volume 9. Aalborg: Aalborg University, Department of Civil Engineering. 34 Kim, Woohyun and Braun, James E., "Evaluation of Virtual Refrigerant Mass Flow Sensors" (2012).
International Refrigeration and Air Conditioning Conference. Paper 1245. http://docs.lib.purdue.edu/iracc/1245 35 C.T. Tran, P. Rivière, D. Marchio, C. Arzano-Daurelle, In situ measurement methods of air to air heat pump performance, In International Journal of Refrigeration, Volume 36, Issue 5, 2013, Pages 1442-1455, ISSN 0140-7007, https://doi.org/10.1016/j.ijrefrig.2013.03.021. 36 Jens Schuberth (UBA) et al., Minimum requirements on monitoring equipment for assessing the energy efficiency of heating, ventilation and air conditioning products, Submission by the Federal Environment Agency (UBA) and the Federal Institute for Materials Research and Testing (BAM) on the Ecodesign Process, 14th March 2018.
53
• Electricity consumption measurement and display: in general, literature indicates small
but non-negligible gains; this is already a common feature of many fix air conditioners
although electricity consumption may not be measured but deducted from the
measured variables of the unit;
• Energy efficiency monitoring by energy signature methods: use the change in
correlations between electricity consumption and outdoor air temperature to detect
change in consumption pattern and inform the end-user; this requires however large
computing / data storage capacity which may not be available in the units and could
only be available to smart appliances; plus this method may not work for all
installations;
• mandatory saving mode allowing to control a fixed temperature difference between
indoor and outdoor temperature, rather than a fixed indoor temperature set point;
It is proposed to include the electricity consumption measurement in the standardisation
work to be done regarding in-situ continuous performance measurement. It is indeed
necessary to fix a certain number of requirements (e.g. maximum uncertainty, minimum
acquisition and averaging times, test of the functionality in the unit based on standard
tests).
3.1.7.3 Compensation method
In the present standard test procedure for split air conditioners in EN14825 standard, the
test points are obtained by fixing the control parameters of the unit; in a compensation
method, the load is fixed (e.g. heat is added in a closed room) and the controls of the air
conditioner sense the increase in temperature and adjust the air conditioner capacity to
match the load; the intent is to include the impact of air conditioner controls in terms of
seasonal performances. Compensation method investigations were already mentioned in
Task 1. To note, a round robin test should begin in 2017/2018 to test a new compensation
test method proposal for air-to-air units in different laboratories in Europe.
3.1.7.4 Impact of a lack of maintenance
To reach the 500 hours equivalent full load hours in the first EU label for air conditioners37,
a 20 % provision for fouling of the heat exchangers was accounted for following Breuker &
al38 findings. More recently in the IEE project Harmonac39, it was found that cleaning the
surface of indoor heat exchanger not equipped of filter could save 17 % energy
consumption.
In the Lot 10 preparatory study, it was supposed that most units were fitted with filters
and that for split units a regular maintenance check was the standard and thus the impact
of heat exchanger fouling was not taken into account. This is still thought to be the case
for fixed installations. If it was not the case, a measure as the one proposed by UBA - to
equip units with a visual heat exchanger cleaning signal as in Regulation EU no 2014/1253
- could prove useful and would most likely be cost-effective.
37 Commission Directive 2002/31/EC of 22 March 2002 implementing Council Directive 92/75/EEC with regard to energy labelling of household air-conditioners 38 Value taken from the following reference, M. Breuker&J. E.Braun, Common faults and their impacts for rooftop air conditioners, July 1998, HVAC&R Research, p.303-318 39 Ian Knight and James Cambray, Quantifying the Energy Conservation Opportunities found in Air-Conditioning Inspections as required by EPBD Article 9, IEECB conference, 2010.
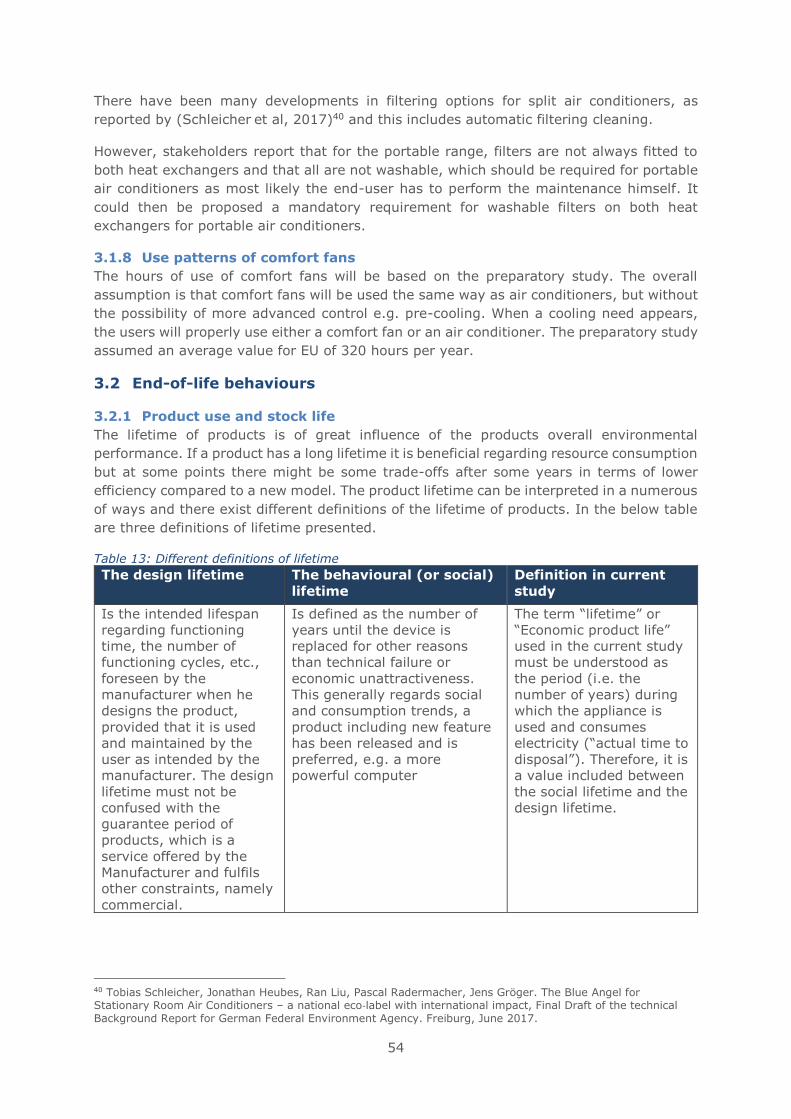
54
There have been many developments in filtering options for split air conditioners, as
reported by (Schleicher et al, 2017)40 and this includes automatic filtering cleaning.
However, stakeholders report that for the portable range, filters are not always fitted to
both heat exchangers and that all are not washable, which should be required for portable
air conditioners as most likely the end-user has to perform the maintenance himself. It
could then be proposed a mandatory requirement for washable filters on both heat
exchangers for portable air conditioners.
3.1.8 Use patterns of comfort fans
The hours of use of comfort fans will be based on the preparatory study. The overall
assumption is that comfort fans will be used the same way as air conditioners, but without
the possibility of more advanced control e.g. pre-cooling. When a cooling need appears,
the users will properly use either a comfort fan or an air conditioner. The preparatory study
assumed an average value for EU of 320 hours per year.
3.2 End-of-life behaviours
3.2.1 Product use and stock life
The lifetime of products is of great influence of the products overall environmental
performance. If a product has a long lifetime it is beneficial regarding resource consumption
but at some points there might be some trade-offs after some years in terms of lower
efficiency compared to a new model. The product lifetime can be interpreted in a numerous
of ways and there exist different definitions of the lifetime of products. In the below table
are three definitions of lifetime presented.
Table 13: Different definitions of lifetime
The design lifetime The behavioural (or social)
lifetime
Definition in current
study
Is the intended lifespan
regarding functioning
time, the number of
functioning cycles, etc.,
foreseen by the
manufacturer when he
designs the product,
provided that it is used
and maintained by the
user as intended by the
manufacturer. The design
lifetime must not be
confused with the
guarantee period of
products, which is a
service offered by the
Manufacturer and fulfils
other constraints, namely
commercial.
Is defined as the number of
years until the device is
replaced for other reasons
than technical failure or
economic unattractiveness.
This generally regards social
and consumption trends, a
product including new feature
has been released and is
preferred, e.g. a more
powerful computer
The term “lifetime” or
“Economic product life”
used in the current study
must be understood as
the period (i.e. the
number of years) during
which the appliance is
used and consumes
electricity (“actual time to
disposal”). Therefore, it is
a value included between
the social lifetime and the
design lifetime.
40 Tobias Schleicher, Jonathan Heubes, Ran Liu, Pascal Radermacher, Jens Gröger. The Blue Angel for Stationary Room Air Conditioners – a national eco‐label with international impact, Final Draft of the technical
Background Report for German Federal Environment Agency. Freiburg, June 2017.
55
An accurate lifetime can be difficult to determine as many factors can affect the lifetime
such as location, marine climate and the hours of operating in different modes. Depending
on the type of air conditioners other factors can also have an impact e.g. if portable air
conditioners are moved frequently they a subject to bump into doors or furniture which in
the end can affect the lifetime. For fixed air conditioners, the lifetime can be significantly
reduced due to customer installation. The main causes for replacement of air conditioners
are listed below41:
- breakdown
- drop in performance
- rise in sound noise
- replacement by more energy efficient models,
- building renovation
- the end-user is moving
The overall assumptions regarding lifetime are unchanged since the preparatory study42
and the previous assumptions used are briefly described below.
ENERGY STAR has published a brochure43 about room air conditioners where it is written
that the typical product life for a room air conditioner is ten years44. Furthermore, because
models that are at least 10-years old use 20% more energy than a new ENERGY STAR
model, ENERGY STAR advocates consumers to replace 10-year-old room air conditioner
with a new ENERGY STAR qualified model.
White certificates in France had estimated the lifetime of air conditioners (only single
split package and multi split package air conditioners) that were used in French overseas
departments and territories at 9 years. However, these conditions were expected to be
more intensive since the climate in general are hot and air is charged in salt leading to the
accelerated corrosion of the heat exchange areas of the outdoor unit. The lifetime of
reversible air conditioners (only single split package and multi-split package air
conditioners) used in France was estimated to 16 years.
JRAIA informed at a stakeholder meeting during the preparatory study that the product
life for residential units in Japan was estimated to be about 12 years based on an analysis
of recycled products and for commercial units it is thought to be between 10 and 15 years.
They thought it could be longer in Europe than in Japan because of less hours of usage in
average, especially since a large part of the products are not reversible or not used as
such, whereas in Japan residential air conditioners are used in winter and summer time.
Today are most fixed air conditioners sold in Europe reversible.
41 Preparatory study on the environmental performance of residential room conditioning appliances (airco and ventilation), Contract TREN/D1/40-2005/LOT10/S07.56606. CO-ORDINATOR: Philippe RIVIERE, ARMINES, France. Air conditioners, final report. December 2008. This report can be downloaded from DG ENERGY website: https://ec.europa.eu/energy/en/topics/energy-efficiency/energy-efficient-products. 42 Preparatory study on the environmental performance of residential room conditioning appliances (airco and ventilation), Contract TREN/D1/40-2005/LOT10/S07.56606. CO-ORDINATOR: Philippe RIVIERE, ARMINES, France. Air conditioners, final report. December 2008. This report can be downloaded from DG ENERGY website: https://ec.europa.eu/energy/en/topics/energy-efficiency/energy-efficient-products. 43 http://www.energystar.gov/ia/partners/manuf_res/downloads/Room_Air_Conditioners_Partner_Resou rce_Guide.pdf 44 29th Annual Portrait of the U.S. Appliance Industry, Appliance Magazine, September 2006.
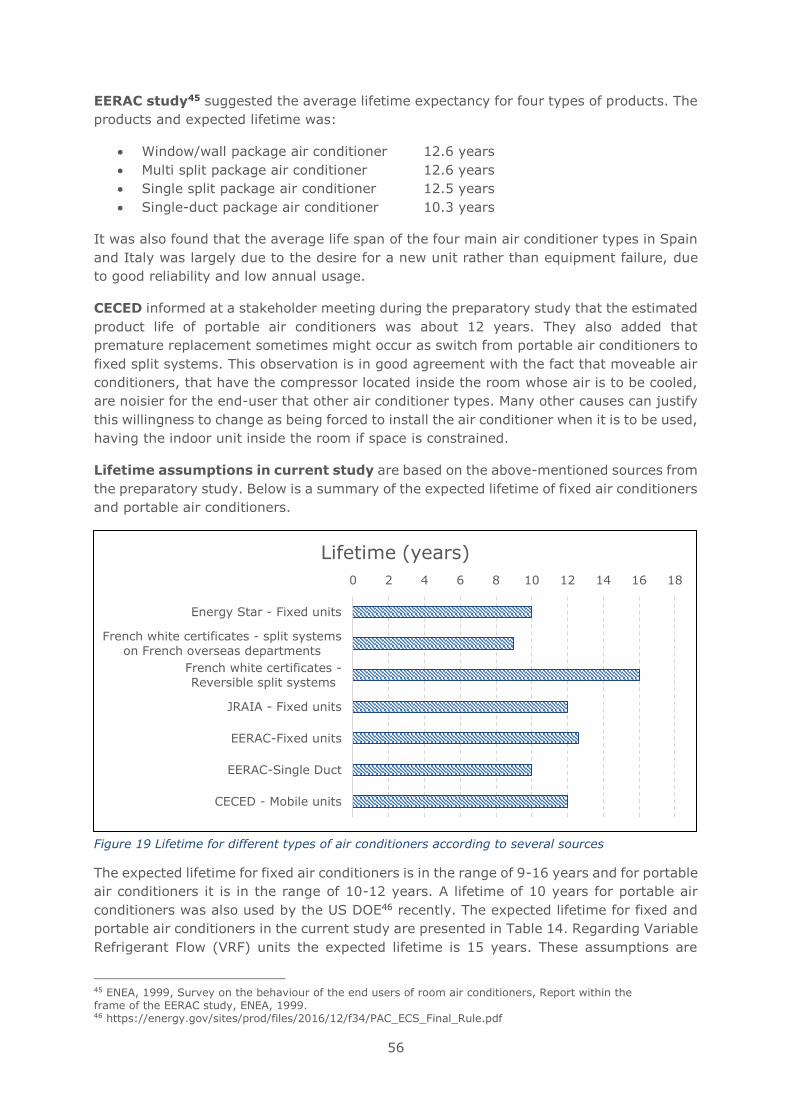
56
EERAC study45 suggested the average lifetime expectancy for four types of products. The
products and expected lifetime was:
• Window/wall package air conditioner 12.6 years
• Multi split package air conditioner 12.6 years
• Single split package air conditioner 12.5 years
• Single-duct package air conditioner 10.3 years
It was also found that the average life span of the four main air conditioner types in Spain
and Italy was largely due to the desire for a new unit rather than equipment failure, due
to good reliability and low annual usage.
CECED informed at a stakeholder meeting during the preparatory study that the estimated
product life of portable air conditioners was about 12 years. They also added that
premature replacement sometimes might occur as switch from portable air conditioners to
fixed split systems. This observation is in good agreement with the fact that moveable air
conditioners, that have the compressor located inside the room whose air is to be cooled,
are noisier for the end-user that other air conditioner types. Many other causes can justify
this willingness to change as being forced to install the air conditioner when it is to be used,
having the indoor unit inside the room if space is constrained.
Lifetime assumptions in current study are based on the above-mentioned sources from
the preparatory study. Below is a summary of the expected lifetime of fixed air conditioners
and portable air conditioners.
Figure 19 Lifetime for different types of air conditioners according to several sources
The expected lifetime for fixed air conditioners is in the range of 9-16 years and for portable
air conditioners it is in the range of 10-12 years. A lifetime of 10 years for portable air
conditioners was also used by the US DOE46 recently. The expected lifetime for fixed and
portable air conditioners in the current study are presented in Table 14. Regarding Variable
Refrigerant Flow (VRF) units the expected lifetime is 15 years. These assumptions are
45 ENEA, 1999, Survey on the behaviour of the end users of room air conditioners, Report within the frame of the EERAC study, ENEA, 1999. 46 https://energy.gov/sites/prod/files/2016/12/f34/PAC_ECS_Final_Rule.pdf
0 2 4 6 8 10 12 14 16 18
Energy Star - Fixed units
French white certificates - split systems
on French overseas departments
French white certificates -
Reversible split systems
JRAIA - Fixed units
EERAC-Fixed units
EERAC-Single Duct
CECED - Mobile units
Lifetime (years)
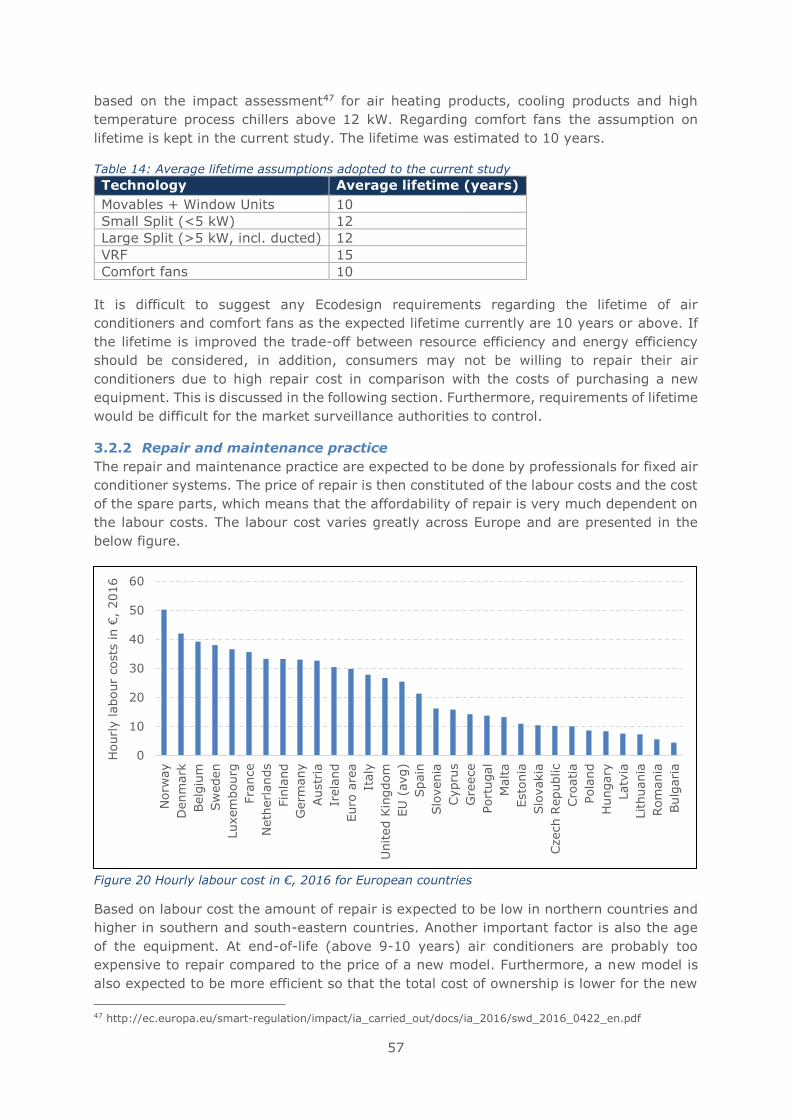
57
based on the impact assessment47 for air heating products, cooling products and high
temperature process chillers above 12 kW. Regarding comfort fans the assumption on
lifetime is kept in the current study. The lifetime was estimated to 10 years.
Table 14: Average lifetime assumptions adopted to the current study
Technology Average lifetime (years)
Movables + Window Units 10
Small Split (<5 kW) 12
Large Split (>5 kW, incl. ducted) 12
VRF 15
Comfort fans 10
It is difficult to suggest any Ecodesign requirements regarding the lifetime of air
conditioners and comfort fans as the expected lifetime currently are 10 years or above. If
the lifetime is improved the trade-off between resource efficiency and energy efficiency
should be considered, in addition, consumers may not be willing to repair their air
conditioners due to high repair cost in comparison with the costs of purchasing a new
equipment. This is discussed in the following section. Furthermore, requirements of lifetime
would be difficult for the market surveillance authorities to control.
3.2.2 Repair and maintenance practice
The repair and maintenance practice are expected to be done by professionals for fixed air
conditioner systems. The price of repair is then constituted of the labour costs and the cost
of the spare parts, which means that the affordability of repair is very much dependent on
the labour costs. The labour cost varies greatly across Europe and are presented in the
below figure.
Figure 20 Hourly labour cost in €, 2016 for European countries
Based on labour cost the amount of repair is expected to be low in northern countries and
higher in southern and south-eastern countries. Another important factor is also the age
of the equipment. At end-of-life (above 9-10 years) air conditioners are probably too
expensive to repair compared to the price of a new model. Furthermore, a new model is
also expected to be more efficient so that the total cost of ownership is lower for the new
47 http://ec.europa.eu/smart-regulation/impact/ia_carried_out/docs/ia_2016/swd_2016_0422_en.pdf
0
10
20
30
40
50
60
Norw
ay
Denm
ark
Belg
ium
Sw
eden
Luxem
bourg
Fra
nce
Neth
erl
ands
Fin
land
Germ
any
Austr
ia
Irela
nd
Euro
are
a
Italy
United K
ingdom
EU
(avg)
Spain
Slo
venia
Cypru
s
Gre
ece
Port
ugal
Malta
Esto
nia
Slo
vakia
Czech R
epublic
Cro
atia
Pola
nd
Hungary
Latv
ia
Lithuania
Rom
ania
Bulg
ari
a
Hourly labour
costs
in €
, 2016
58
model compared to repairing the old one an extending the lifetime. This balance is
dependent on the efficiency and price of a new model and the cost of repair. The amount
of repair is assumed to be low currently but may change in the future since there is an
increased focus on resource consumption within the EU. With an increased focus on
resources and lower impacts of electricity (both renewable energy and more efficient
products) the impact of the resource consumption may be more important. An improved
lifetime of certain products could potentially save energy in the future as less materials are
used. But, the electricity consumption is still believed to be the most important factor
currently. Regarding comfort fans the repair and maintenance practice is assumed to be
negligible. This is due to the low purchase price and simplicity of the product. The same
assumption was made in the preparatory study.
Currently there are no observed problems with the repair service of air conditioners, but
the high repair cost could pose a challenge even for relatively new products after the
warranty expires. To avoid unnecessary replacement of efficient air conditioners it should
be considered how Ecodesign requirements potentially could ease the repair and
maintenance practice to lower the cost of repair and prevent premature failure. This
subject will be discussed further in task 4. Though, it may be difficult for the market
surveillance authorities to control.
Spare parts
Spare parts are available on the internet from some manufacturers48,49 and third-party
companies offering spare parts and sometimes also a repair service. In any case the most
likely scenario is that the service is performed by a professional which would add extra
expenses to the costs of the spare parts. Important technical problems like a compressor
breakdown may occur when the appliance is old. Since the lifetime of a compressor is
estimated around 12 years50, it is very unlikely that a compressor change would occur
during the lifetime of the air conditioner. If it happens after 10 or 12 years, it is most likely
that the end-user will change the complete unit given the cost of the intervention. It is not
known if repair actions are often carried out neither which ones and consequently, it is not
possible to estimate additional material for repair. Stakeholders have indicated that the
most bought spare parts are printed circuit boards. One stakeholder informed that the
majority of their air conditioners was sold with a maintenance contract and their most sold
spare part was the compressor. The most bought spare parts are properly affected whether
the air conditioners are sold with a maintenance contract or not. The availability of the
spare parts is assumed to be 10 years based on stakeholder inputs.
Normal maintenance like cleanliness of the filters, emptying and cleaning the condensate
container requires no additional material. Manufacturers now propose washable filters. In
general, for products in the scope, most of the air conditioners are assumed to be sold
without a maintenance contract.
48 http://www.daikin.com/products/ac/services/parts/index.html 49 http://www.toshiba-aircon.co.uk/products/spare-parts 50 Preparatory study on the environmental performance of residential room conditioning appliances (airco and ventilation), Contract TREN/D1/40-2005/LOT10/S07.56606. CO-ORDINATOR: Philippe RIVIERE, ARMINES, France. Air conditioners, final report. December 2008. This report can be downloaded from DG ENERGY website: https://ec.europa.eu/energy/en/topics/energy-efficiency/energy-efficient-products.
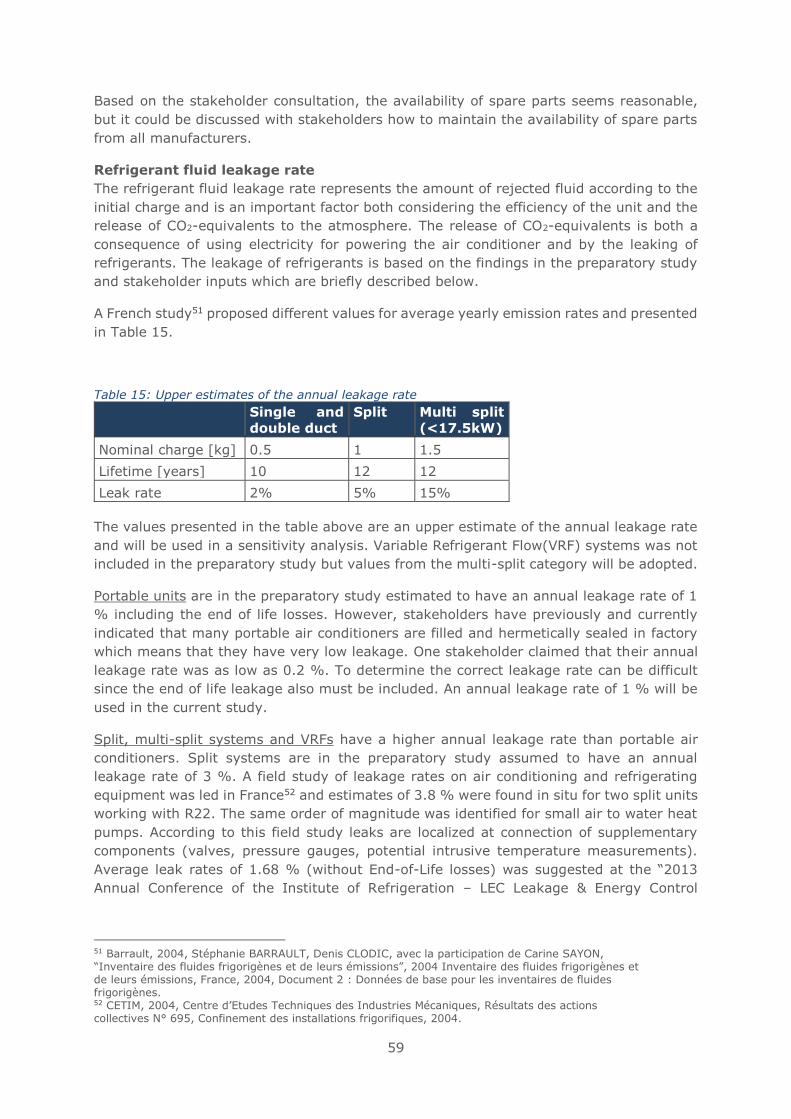
59
Based on the stakeholder consultation, the availability of spare parts seems reasonable,
but it could be discussed with stakeholders how to maintain the availability of spare parts
from all manufacturers.
Refrigerant fluid leakage rate
The refrigerant fluid leakage rate represents the amount of rejected fluid according to the
initial charge and is an important factor both considering the efficiency of the unit and the
release of CO2-equivalents to the atmosphere. The release of CO2-equivalents is both a
consequence of using electricity for powering the air conditioner and by the leaking of
refrigerants. The leakage of refrigerants is based on the findings in the preparatory study
and stakeholder inputs which are briefly described below.
A French study51 proposed different values for average yearly emission rates and presented
in Table 15.
Table 15: Upper estimates of the annual leakage rate Single and
double duct
Split Multi split
(<17.5kW)
Nominal charge [kg] 0.5 1 1.5
Lifetime [years] 10 12 12
Leak rate 2% 5% 15%
The values presented in the table above are an upper estimate of the annual leakage rate
and will be used in a sensitivity analysis. Variable Refrigerant Flow(VRF) systems was not
included in the preparatory study but values from the multi-split category will be adopted.
Portable units are in the preparatory study estimated to have an annual leakage rate of 1
% including the end of life losses. However, stakeholders have previously and currently
indicated that many portable air conditioners are filled and hermetically sealed in factory
which means that they have very low leakage. One stakeholder claimed that their annual
leakage rate was as low as 0.2 %. To determine the correct leakage rate can be difficult
since the end of life leakage also must be included. An annual leakage rate of 1 % will be
used in the current study.
Split, multi-split systems and VRFs have a higher annual leakage rate than portable air
conditioners. Split systems are in the preparatory study assumed to have an annual
leakage rate of 3 %. A field study of leakage rates on air conditioning and refrigerating
equipment was led in France52 and estimates of 3.8 % were found in situ for two split units
working with R22. The same order of magnitude was identified for small air to water heat
pumps. According to this field study leaks are localized at connection of supplementary
components (valves, pressure gauges, potential intrusive temperature measurements).
Average leak rates of 1.68 % (without End-of-Life losses) was suggested at the “2013
Annual Conference of the Institute of Refrigeration – LEC Leakage & Energy Control
51 Barrault, 2004, Stéphanie BARRAULT, Denis CLODIC, avec la participation de Carine SAYON, “Inventaire des fluides frigorigènes et de leurs émissions”, 2004 Inventaire des fluides frigorigènes et de leurs émissions, France, 2004, Document 2 : Données de base pour les inventaires de fluides frigorigènes. 52 CETIM, 2004, Centre d’Etudes Techniques des Industries Mécaniques, Résultats des actions collectives N° 695, Confinement des installations frigorifiques, 2004.
60
system”. Including End-of-Life loses an annual refrigerant leakage rate of 3 % seems
reasonable.
End-of-Life refrigerant leakage rates are difficult to estimate since the rate is depending on
how the units are treated and which functions are available. Some products today are
equipped with a “pump-down” function to recover refrigerant from indoor units and
connecting pipes into the outdoor unit. These functions are facilitating recovery of
refrigerants and are preventing refrigerants to be emitted to the atmosphere. Different
scenarios are made in the sensitivity analysis to cover the importance of refrigerant
leakage.
As many uncontrollable factors such as the installation of the equipment have an impact
on the leakage rate, it is difficult to implement requirements in the Ecodesign regulation.
The challenge may also be related the handling at End-of-Life. This leakage at End-of-life
may be improved by pump-down systems and is further discussed in Task 4.
3.2.3 Estimated second hand use
The estimated second-hand market is based on the preparatory study which made some
assumptions based of statement from UNICLIMA and a survey on Ebay carried out in
preparatory study and supported by desk research over several online platforms during
the current review study. The statement from UNICLIMA stresses that there were no
incentive or economic justification for refurbishment or second-hand use of fixed air
conditioners since the cost of reinstalling a fixed air conditioner and fill it with a new fluid
costs more money than a new product. Regarding portable air conditioners, a second-hand
market exists. The situation may change but there is at the moment very little second-
hand use of the products. It was confirmed by a survey led on Ebay in the frame of the
preparatory study where very few products were available, despite of direct imports from
China of new products. Main second-hand market is thought to relate to people buying a
portable air conditioner before the summer in case of heat wave and willing to recover the
money once the summer has ended. The same assumption as for portable air conditioners
can be made for comfort fans. A recent survey on Ebay and sites alike confirmed that a
second-hand market also exist for comfort fans despite their low initial price.
If the air conditioner is barely used in its primary life, after being resold as a second-hand
product, it could potentially increase its typical lifetime. However, the second-hand market
exists for air conditioners is rather small, because of the high costs to uninstall/install and
refurbish the equipment. Due to the small market in the EU, it is assumed that it has no or
very limited impact on the average lifetime evaluation and can be neglected in the coming
tasks. The impacts of a second-hand market could potentially negative impacts due to the
trade-offs between material consumption and energy consumption. As reusing old and
inefficient air conditioners means that although raw materials are saved but it is at the cost
of higher electricity consumption.
3.2.4 Best practice in sustainable product use
Sustainable product use can minimise the energy consumption of air conditioners. A few
best practices are listed in this section.
First it is important to purchase a properly sized air conditioner which is described in a
previous section. Following the purchase of the air conditioners the end users can also
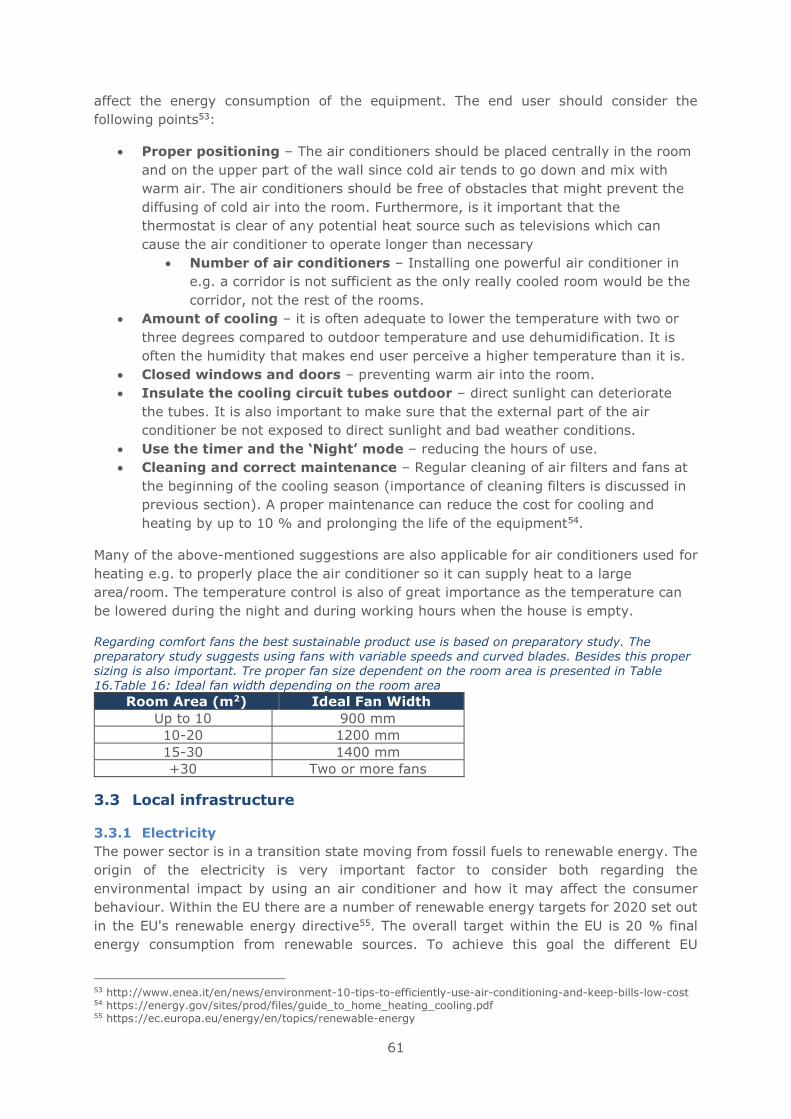
61
affect the energy consumption of the equipment. The end user should consider the
following points53:
• Proper positioning – The air conditioners should be placed centrally in the room
and on the upper part of the wall since cold air tends to go down and mix with
warm air. The air conditioners should be free of obstacles that might prevent the
diffusing of cold air into the room. Furthermore, is it important that the
thermostat is clear of any potential heat source such as televisions which can
cause the air conditioner to operate longer than necessary
• Number of air conditioners – Installing one powerful air conditioner in
e.g. a corridor is not sufficient as the only really cooled room would be the
corridor, not the rest of the rooms.
• Amount of cooling – it is often adequate to lower the temperature with two or
three degrees compared to outdoor temperature and use dehumidification. It is
often the humidity that makes end user perceive a higher temperature than it is.
• Closed windows and doors – preventing warm air into the room.
• Insulate the cooling circuit tubes outdoor – direct sunlight can deteriorate
the tubes. It is also important to make sure that the external part of the air
conditioner be not exposed to direct sunlight and bad weather conditions.
• Use the timer and the ‘Night’ mode – reducing the hours of use.
• Cleaning and correct maintenance – Regular cleaning of air filters and fans at
the beginning of the cooling season (importance of cleaning filters is discussed in
previous section). A proper maintenance can reduce the cost for cooling and
heating by up to 10 % and prolonging the life of the equipment54.
Many of the above-mentioned suggestions are also applicable for air conditioners used for
heating e.g. to properly place the air conditioner so it can supply heat to a large
area/room. The temperature control is also of great importance as the temperature can
be lowered during the night and during working hours when the house is empty.
Regarding comfort fans the best sustainable product use is based on preparatory study. The preparatory study suggests using fans with variable speeds and curved blades. Besides this proper sizing is also important. Tre proper fan size dependent on the room area is presented in Table 16.Table 16: Ideal fan width depending on the room area
Room Area (m2) Ideal Fan Width
Up to 10 900 mm
10-20 1200 mm
15-30 1400 mm
+30 Two or more fans
3.3 Local infrastructure
3.3.1 Electricity
The power sector is in a transition state moving from fossil fuels to renewable energy. The
origin of the electricity is very important factor to consider both regarding the
environmental impact by using an air conditioner and how it may affect the consumer
behaviour. Within the EU there are a number of renewable energy targets for 2020 set out
in the EU's renewable energy directive55. The overall target within the EU is 20 % final
energy consumption from renewable sources. To achieve this goal the different EU
53 http://www.enea.it/en/news/environment-10-tips-to-efficiently-use-air-conditioning-and-keep-bills-low-cost 54 https://energy.gov/sites/prod/files/guide_to_home_heating_cooling.pdf 55 https://ec.europa.eu/energy/en/topics/renewable-energy
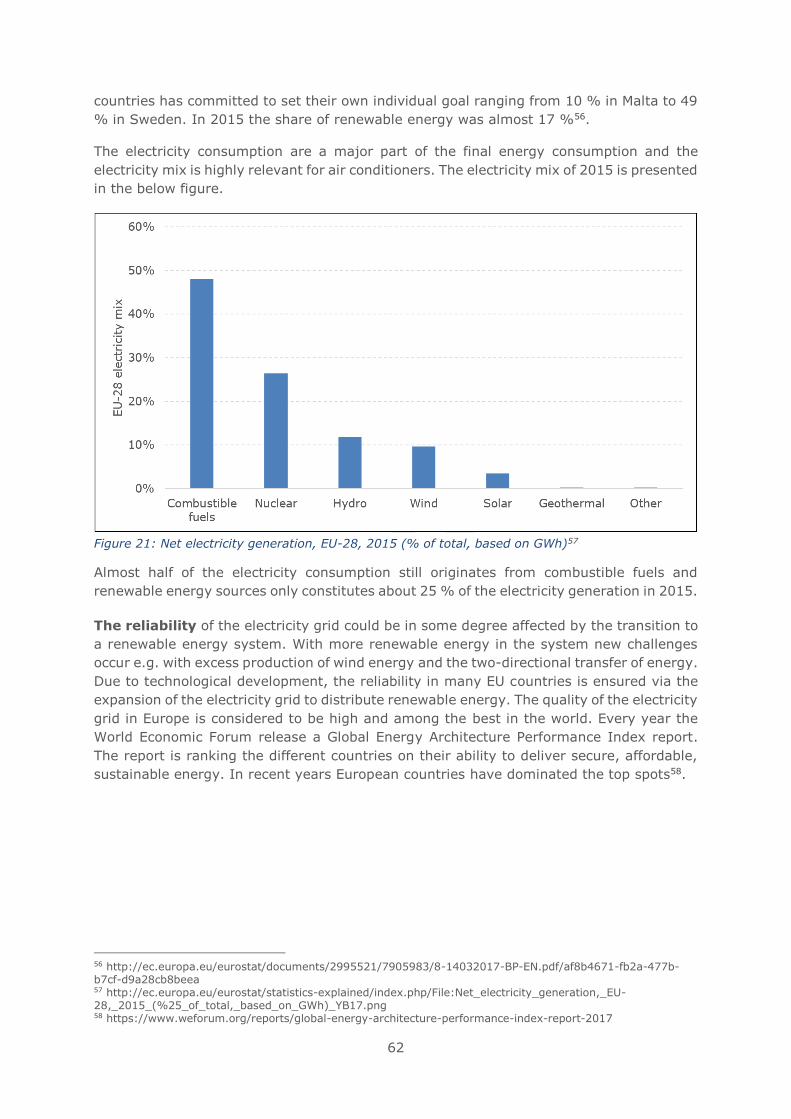
62
countries has committed to set their own individual goal ranging from 10 % in Malta to 49
% in Sweden. In 2015 the share of renewable energy was almost 17 %56.
The electricity consumption are a major part of the final energy consumption and the
electricity mix is highly relevant for air conditioners. The electricity mix of 2015 is presented
in the below figure.
Figure 21: Net electricity generation, EU-28, 2015 (% of total, based on GWh)57
Almost half of the electricity consumption still originates from combustible fuels and
renewable energy sources only constitutes about 25 % of the electricity generation in 2015.
The reliability of the electricity grid could be in some degree affected by the transition to
a renewable energy system. With more renewable energy in the system new challenges
occur e.g. with excess production of wind energy and the two-directional transfer of energy.
Due to technological development, the reliability in many EU countries is ensured via the
expansion of the electricity grid to distribute renewable energy. The quality of the electricity
grid in Europe is considered to be high and among the best in the world. Every year the
World Economic Forum release a Global Energy Architecture Performance Index report.
The report is ranking the different countries on their ability to deliver secure, affordable,
sustainable energy. In recent years European countries have dominated the top spots58.
56 http://ec.europa.eu/eurostat/documents/2995521/7905983/8-14032017-BP-EN.pdf/af8b4671-fb2a-477b-b7cf-d9a28cb8beea 57 http://ec.europa.eu/eurostat/statistics-explained/index.php/File:Net_electricity_generation,_EU-28,_2015_(%25_of_total,_based_on_GWh)_YB17.png 58 https://www.weforum.org/reports/global-energy-architecture-performance-index-report-2017
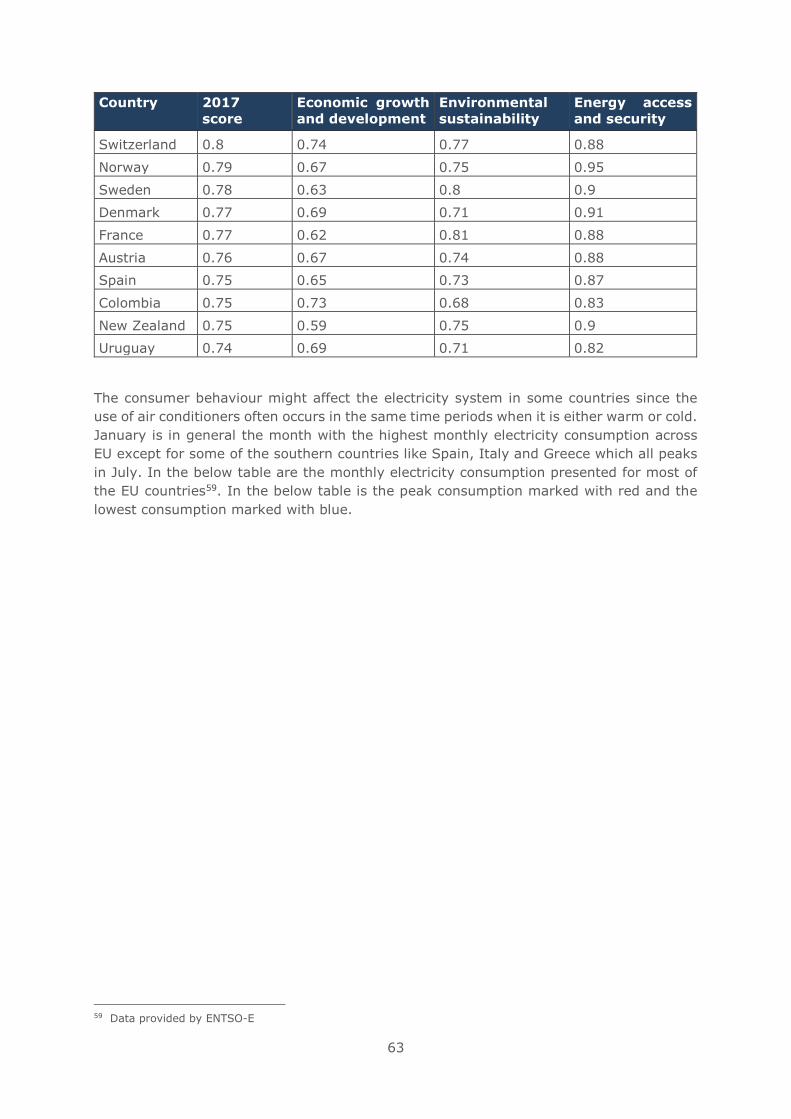
63
Country 2017
score
Economic growth
and development
Environmental
sustainability
Energy access
and security
Switzerland 0.8 0.74 0.77 0.88
Norway 0.79 0.67 0.75 0.95
Sweden 0.78 0.63 0.8 0.9
Denmark 0.77 0.69 0.71 0.91
France 0.77 0.62 0.81 0.88
Austria 0.76 0.67 0.74 0.88
Spain 0.75 0.65 0.73 0.87
Colombia 0.75 0.73 0.68 0.83
New Zealand 0.75 0.59 0.75 0.9
Uruguay 0.74 0.69 0.71 0.82
The consumer behaviour might affect the electricity system in some countries since the
use of air conditioners often occurs in the same time periods when it is either warm or cold.
January is in general the month with the highest monthly electricity consumption across
EU except for some of the southern countries like Spain, Italy and Greece which all peaks
in July. In the below table are the monthly electricity consumption presented for most of
the EU countries59. In the below table is the peak consumption marked with red and the
lowest consumption marked with blue.
59 Data provided by ENTSO-E
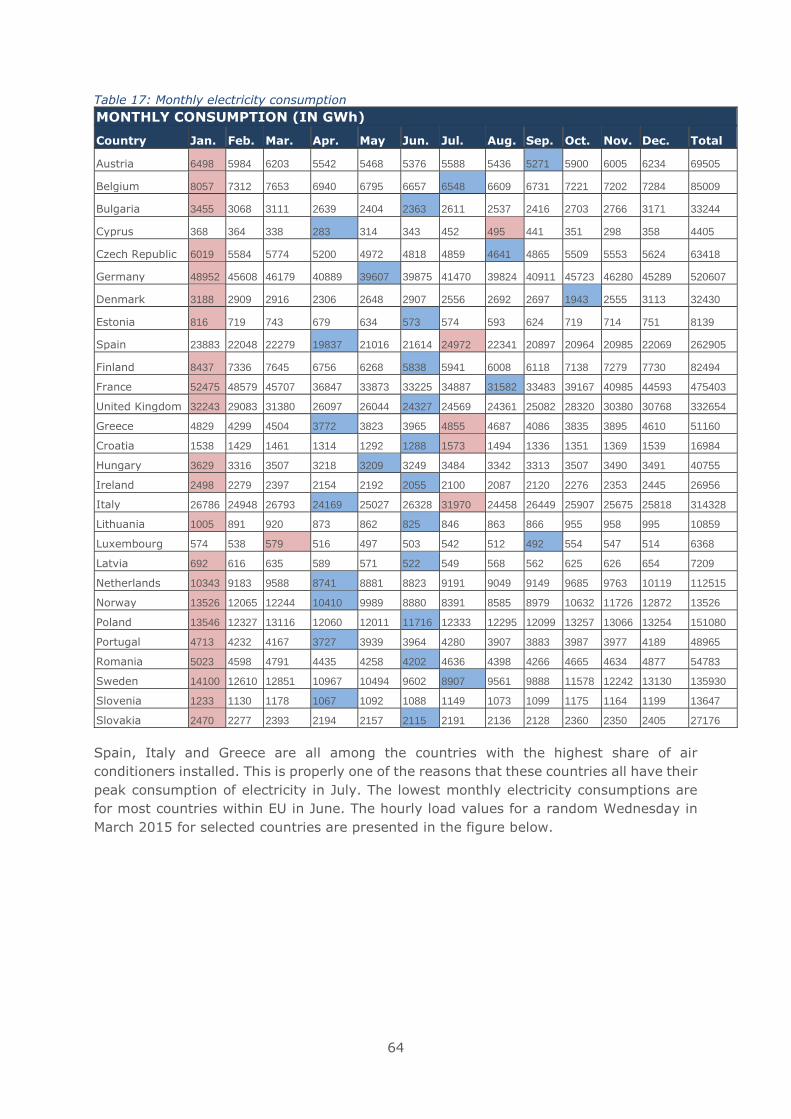
64
Table 17: Monthly electricity consumption
MONTHLY CONSUMPTION (IN GWh)
Country Jan. Feb. Mar. Apr. May Jun. Jul. Aug. Sep. Oct. Nov. Dec. Total
Austria 6498 5984 6203 5542 5468 5376 5588 5436 5271 5900 6005 6234 69505
Belgium 8057 7312 7653 6940 6795 6657 6548 6609 6731 7221 7202 7284 85009
Bulgaria 3455 3068 3111 2639 2404 2363 2611 2537 2416 2703 2766 3171 33244
Cyprus 368 364 338 283 314 343 452 495 441 351 298 358 4405
Czech Republic 6019 5584 5774 5200 4972 4818 4859 4641 4865 5509 5553 5624 63418
Germany 48952 45608 46179 40889 39607 39875 41470 39824 40911 45723 46280 45289 520607
Denmark 3188 2909 2916 2306 2648 2907 2556 2692 2697 1943 2555 3113 32430
Estonia 816 719 743 679 634 573 574 593 624 719 714 751 8139
Spain 23883 22048 22279 19837 21016 21614 24972 22341 20897 20964 20985 22069 262905
Finland 8437 7336 7645 6756 6268 5838 5941 6008 6118 7138 7279 7730 82494
France 52475 48579 45707 36847 33873 33225 34887 31582 33483 39167 40985 44593 475403
United Kingdom 32243 29083 31380 26097 26044 24327 24569 24361 25082 28320 30380 30768 332654
Greece 4829 4299 4504 3772 3823 3965 4855 4687 4086 3835 3895 4610 51160
Croatia 1538 1429 1461 1314 1292 1288 1573 1494 1336 1351 1369 1539 16984
Hungary 3629 3316 3507 3218 3209 3249 3484 3342 3313 3507 3490 3491 40755
Ireland 2498 2279 2397 2154 2192 2055 2100 2087 2120 2276 2353 2445 26956
Italy 26786 24948 26793 24169 25027 26328 31970 24458 26449 25907 25675 25818 314328
Lithuania 1005 891 920 873 862 825 846 863 866 955 958 995 10859
Luxembourg 574 538 579 516 497 503 542 512 492 554 547 514 6368
Latvia 692 616 635 589 571 522 549 568 562 625 626 654 7209
Netherlands 10343 9183 9588 8741 8881 8823 9191 9049 9149 9685 9763 10119 112515
Norway 13526 12065 12244 10410 9989 8880 8391 8585 8979 10632 11726 12872 13526
Poland 13546 12327 13116 12060 12011 11716 12333 12295 12099 13257 13066 13254 151080
Portugal 4713 4232 4167 3727 3939 3964 4280 3907 3883 3987 3977 4189 48965
Romania 5023 4598 4791 4435 4258 4202 4636 4398 4266 4665 4634 4877 54783
Sweden 14100 12610 12851 10967 10494 9602 8907 9561 9888 11578 12242 13130 135930
Slovenia 1233 1130 1178 1067 1092 1088 1149 1073 1099 1175 1164 1199 13647
Slovakia 2470 2277 2393 2194 2157 2115 2191 2136 2128 2360 2350 2405 27176
Spain, Italy and Greece are all among the countries with the highest share of air
conditioners installed. This is properly one of the reasons that these countries all have their
peak consumption of electricity in July. The lowest monthly electricity consumptions are
for most countries within EU in June. The hourly load values for a random Wednesday in
March 2015 for selected countries are presented in the figure below.
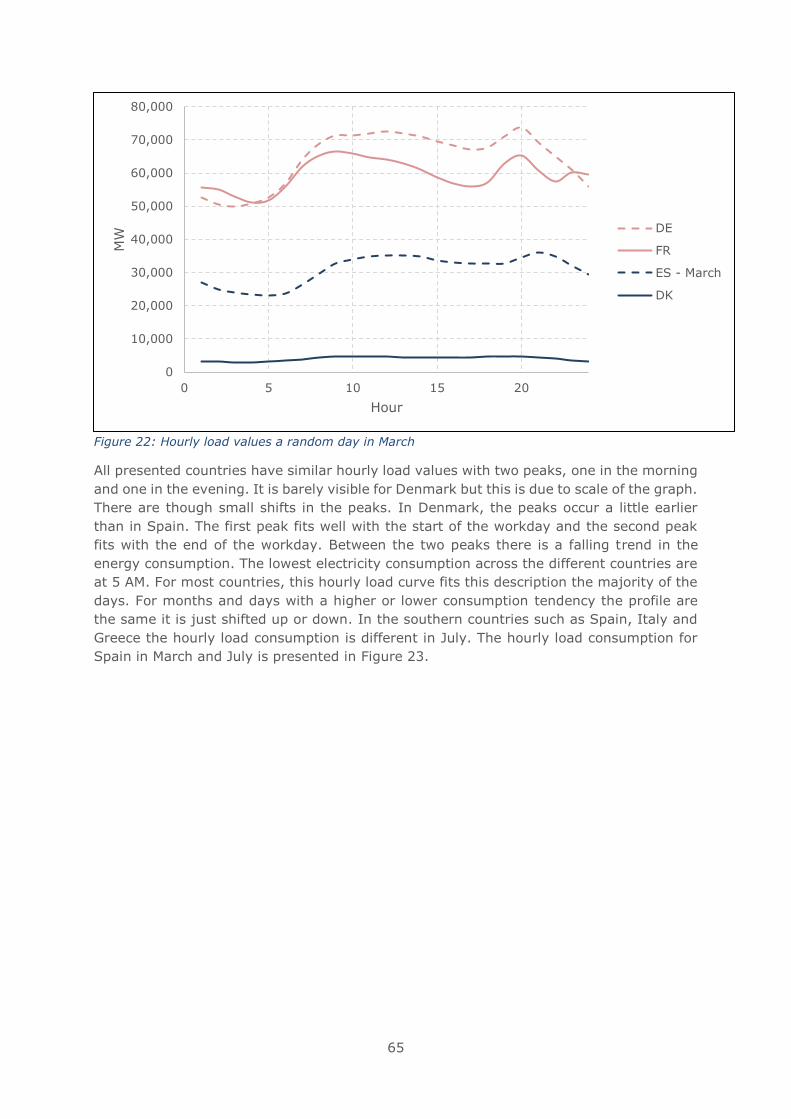
65
Figure 22: Hourly load values a random day in March
All presented countries have similar hourly load values with two peaks, one in the morning
and one in the evening. It is barely visible for Denmark but this is due to scale of the graph.
There are though small shifts in the peaks. In Denmark, the peaks occur a little earlier
than in Spain. The first peak fits well with the start of the workday and the second peak
fits with the end of the workday. Between the two peaks there is a falling trend in the
energy consumption. The lowest electricity consumption across the different countries are
at 5 AM. For most countries, this hourly load curve fits this description the majority of the
days. For months and days with a higher or lower consumption tendency the profile are
the same it is just shifted up or down. In the southern countries such as Spain, Italy and
Greece the hourly load consumption is different in July. The hourly load consumption for
Spain in March and July is presented in Figure 23.
0
10,000
20,000
30,000
40,000
50,000
60,000
70,000
80,000
0 5 10 15 20
MW
Hour
DE
FR
ES - March
DK
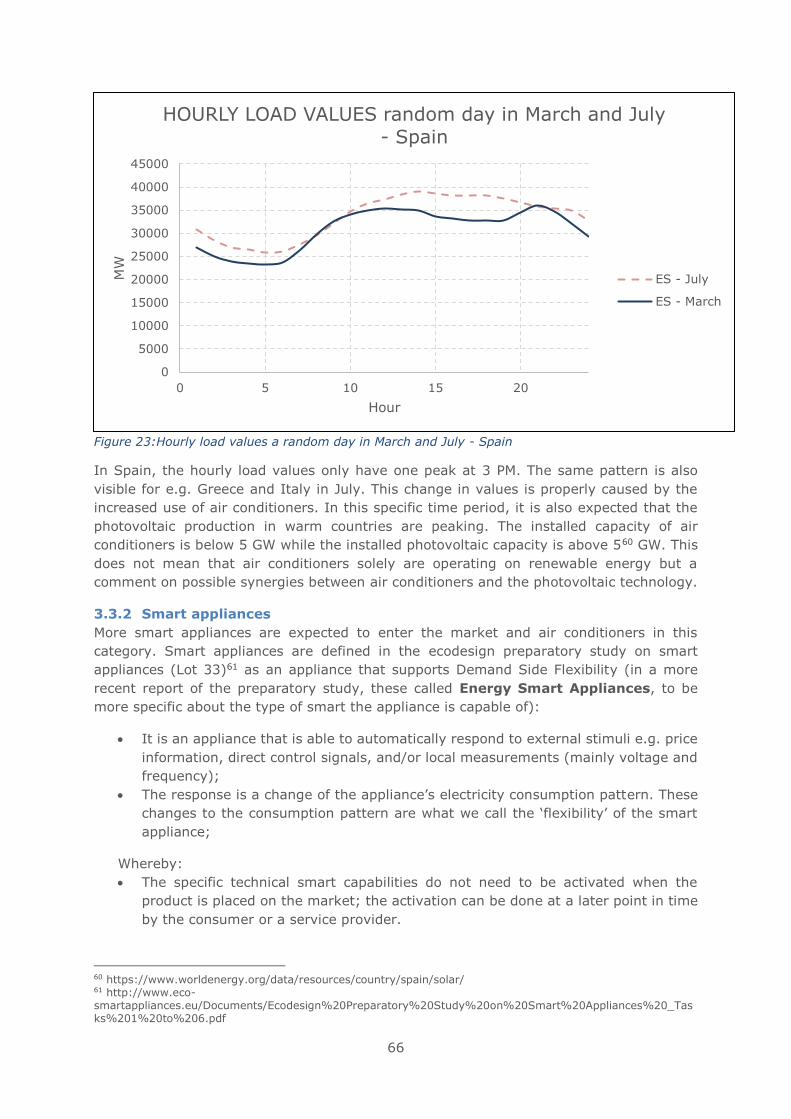
66
Figure 23:Hourly load values a random day in March and July - Spain
In Spain, the hourly load values only have one peak at 3 PM. The same pattern is also
visible for e.g. Greece and Italy in July. This change in values is properly caused by the
increased use of air conditioners. In this specific time period, it is also expected that the
photovoltaic production in warm countries are peaking. The installed capacity of air
conditioners is below 5 GW while the installed photovoltaic capacity is above 560 GW. This
does not mean that air conditioners solely are operating on renewable energy but a
comment on possible synergies between air conditioners and the photovoltaic technology.
3.3.2 Smart appliances
More smart appliances are expected to enter the market and air conditioners in this
category. Smart appliances are defined in the ecodesign preparatory study on smart
appliances (Lot 33)61 as an appliance that supports Demand Side Flexibility (in a more
recent report of the preparatory study, these called Energy Smart Appliances, to be
more specific about the type of smart the appliance is capable of):
• It is an appliance that is able to automatically respond to external stimuli e.g. price
information, direct control signals, and/or local measurements (mainly voltage and
frequency);
• The response is a change of the appliance’s electricity consumption pattern. These
changes to the consumption pattern are what we call the ‘flexibility’ of the smart
appliance;
Whereby:
• The specific technical smart capabilities do not need to be activated when the
product is placed on the market; the activation can be done at a later point in time
by the consumer or a service provider.
60 https://www.worldenergy.org/data/resources/country/spain/solar/ 61 http://www.eco-smartappliances.eu/Documents/Ecodesign%20Preparatory%20Study%20on%20Smart%20Appliances%20_Tasks%201%20to%206.pdf
0
5000
10000
15000
20000
25000
30000
35000
40000
45000
0 5 10 15 20
MW
Hour
HOURLY LOAD VALUES random day in March and July - Spain
ES - July
ES - March
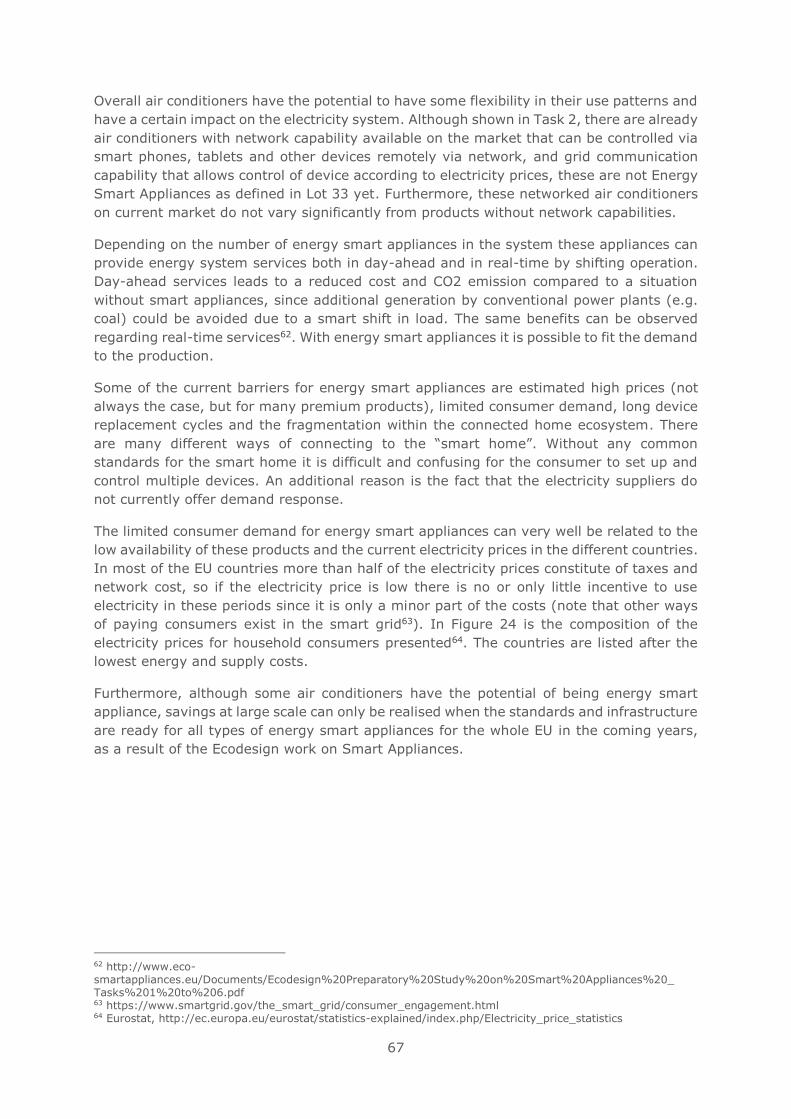
67
Overall air conditioners have the potential to have some flexibility in their use patterns and
have a certain impact on the electricity system. Although shown in Task 2, there are already
air conditioners with network capability available on the market that can be controlled via
smart phones, tablets and other devices remotely via network, and grid communication
capability that allows control of device according to electricity prices, these are not Energy
Smart Appliances as defined in Lot 33 yet. Furthermore, these networked air conditioners
on current market do not vary significantly from products without network capabilities.
Depending on the number of energy smart appliances in the system these appliances can
provide energy system services both in day-ahead and in real-time by shifting operation.
Day-ahead services leads to a reduced cost and CO2 emission compared to a situation
without smart appliances, since additional generation by conventional power plants (e.g.
coal) could be avoided due to a smart shift in load. The same benefits can be observed
regarding real-time services62. With energy smart appliances it is possible to fit the demand
to the production.
Some of the current barriers for energy smart appliances are estimated high prices (not
always the case, but for many premium products), limited consumer demand, long device
replacement cycles and the fragmentation within the connected home ecosystem. There
are many different ways of connecting to the “smart home”. Without any common
standards for the smart home it is difficult and confusing for the consumer to set up and
control multiple devices. An additional reason is the fact that the electricity suppliers do
not currently offer demand response.
The limited consumer demand for energy smart appliances can very well be related to the
low availability of these products and the current electricity prices in the different countries.
In most of the EU countries more than half of the electricity prices constitute of taxes and
network cost, so if the electricity price is low there is no or only little incentive to use
electricity in these periods since it is only a minor part of the costs (note that other ways
of paying consumers exist in the smart grid63). In Figure 24 is the composition of the
electricity prices for household consumers presented64. The countries are listed after the
lowest energy and supply costs.
Furthermore, although some air conditioners have the potential of being energy smart
appliance, savings at large scale can only be realised when the standards and infrastructure
are ready for all types of energy smart appliances for the whole EU in the coming years,
as a result of the Ecodesign work on Smart Appliances.
62 http://www.eco-smartappliances.eu/Documents/Ecodesign%20Preparatory%20Study%20on%20Smart%20Appliances%20_ Tasks%201%20to%206.pdf 63 https://www.smartgrid.gov/the_smart_grid/consumer_engagement.html 64 Eurostat, http://ec.europa.eu/eurostat/statistics-explained/index.php/Electricity_price_statistics
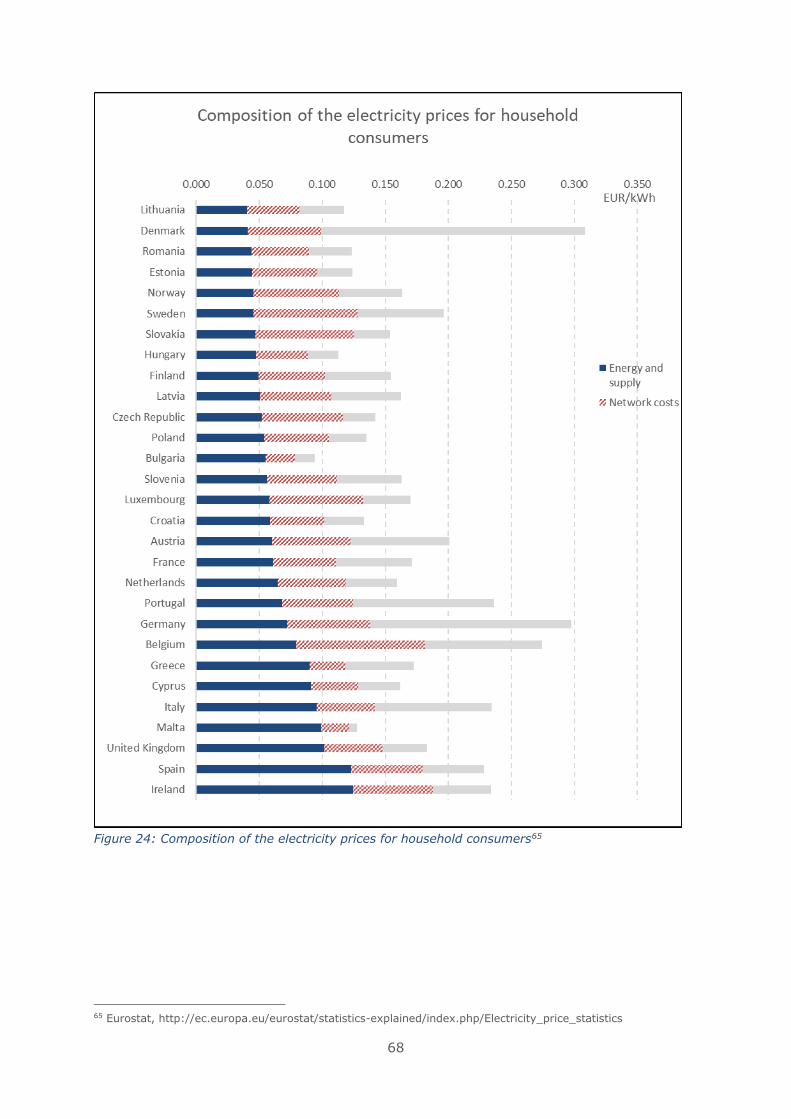
68
Figure 24: Composition of the electricity prices for household consumers65
65 Eurostat, http://ec.europa.eu/eurostat/statistics-explained/index.php/Electricity_price_statistics
69
3.4 Conclusions and recommendations
System aspects use phase
Base on the assessment on use phase in section 3.1, the following conclusions and
recommendations can be summarised.
One of the most important point for air conditioner use phase energy consumption is
the number of equivalent full load hours that is used to compute the energy consumption
and seasonal performances, this is the ratio of the specific yearly cooling load (in
kWh/m2/year) divided by the sizing coefficient (in W/m2). For reversible air conditioners,
the equivalent full load hours for heating is also important.
The seasonal performance metrics used to rate SEER and SCOP of fix air conditioners was
thoroughly reviewed to evaluate the need for changing some of the SEER and SCOP
metrics parameters, assessment and considerations have been presented.
Available data for cooling loads has been reviewed and compared to preparatory study
simulations. It is recommended to keep these values presented in section 3.1.2.1.
Correlations versus Cooling Degree Days (CDD) are proposed to enable to account for
climate change and to derive cooling load values for EU28 countries which was not modelled
in the preparatory study.
Significant oversizing of air conditioners is observed in practice and begins to be
quantifiable due to the development of on-board performance measurement methods.
Nevertheless, data is not yet available to properly quantify the oversizing and the
consequences in terms of energy efficiency. In addition, present rating of very low loads
(impact on performance of inverter compressor cycling below minimum speed) should be
improved so that that effect might be included in the SEER metrics. It is therefore proposed
to maintain the metrics hypothesis of "perfect sizing" where it is assumed the 100 % load
of the building matches the declared rated capacity of the unit for now.
Available data of sizing coefficients has been reviewed and compared to preparatory
study simulations. It is recommended to keep the preparatory study values.
The evaluation of the weighted average EU28 specific cooling load and sizing coefficients
leads to a figure close to the one obtained in the preparatory study for equivalent full
load hours in cooling mode, which is close to 350 hours. it is thus recommended to keep
this value.
Regarding heating, the heating loads and sizing coefficients are derived from the space
heating preparatory study and there is no change proposed regarding these values. Note
that oversizing is also a concern here and might be included in future studies. To evaluate
the environmental impact of reversible air conditioners in Tasks 5 and 7, it is necessary
to account for the fact that part of the reversible air conditioners is not used for heating in
Europe. Most recent data source from Commission decision 2013/114/EU and stakeholder
inputs results in the assumption of ca. 30 % of reversible air conditioners used for heating
in average for stock units and 50 % for new units.
Low power mode hours have been reviewed. It is proposed to require two distinct
crankcase power values for reversible units, respectively for cooling mode - measured
at 20 °C - and for heating mode - measured at 12 °C. Cooling (or heating) only unit
crankcase power measurement should be done at 20 °C (12 °C), as already written in
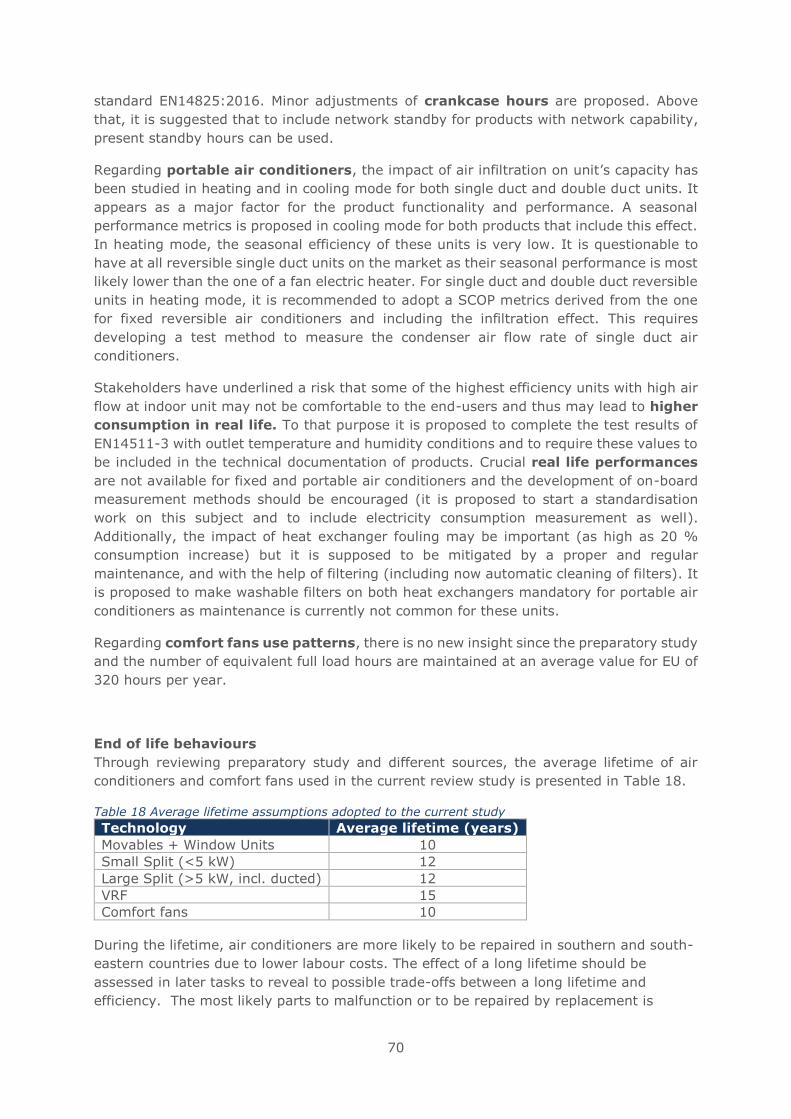
70
standard EN14825:2016. Minor adjustments of crankcase hours are proposed. Above
that, it is suggested that to include network standby for products with network capability,
present standby hours can be used.
Regarding portable air conditioners, the impact of air infiltration on unit’s capacity has
been studied in heating and in cooling mode for both single duct and double duct units. It
appears as a major factor for the product functionality and performance. A seasonal
performance metrics is proposed in cooling mode for both products that include this effect.
In heating mode, the seasonal efficiency of these units is very low. It is questionable to
have at all reversible single duct units on the market as their seasonal performance is most
likely lower than the one of a fan electric heater. For single duct and double duct reversible
units in heating mode, it is recommended to adopt a SCOP metrics derived from the one
for fixed reversible air conditioners and including the infiltration effect. This requires
developing a test method to measure the condenser air flow rate of single duct air
conditioners.
Stakeholders have underlined a risk that some of the highest efficiency units with high air
flow at indoor unit may not be comfortable to the end-users and thus may lead to higher
consumption in real life. To that purpose it is proposed to complete the test results of
EN14511-3 with outlet temperature and humidity conditions and to require these values to
be included in the technical documentation of products. Crucial real life performances
are not available for fixed and portable air conditioners and the development of on-board
measurement methods should be encouraged (it is proposed to start a standardisation
work on this subject and to include electricity consumption measurement as well).
Additionally, the impact of heat exchanger fouling may be important (as high as 20 %
consumption increase) but it is supposed to be mitigated by a proper and regular
maintenance, and with the help of filtering (including now automatic cleaning of filters). It
is proposed to make washable filters on both heat exchangers mandatory for portable air
conditioners as maintenance is currently not common for these units.
Regarding comfort fans use patterns, there is no new insight since the preparatory study
and the number of equivalent full load hours are maintained at an average value for EU of
320 hours per year.
End of life behaviours
Through reviewing preparatory study and different sources, the average lifetime of air
conditioners and comfort fans used in the current review study is presented in Table 18.
Table 18 Average lifetime assumptions adopted to the current study
Technology Average lifetime (years)
Movables + Window Units 10
Small Split (<5 kW) 12
Large Split (>5 kW, incl. ducted) 12
VRF 15
Comfort fans 10
During the lifetime, air conditioners are more likely to be repaired in southern and south-
eastern countries due to lower labour costs. The effect of a long lifetime should be
assessed in later tasks to reveal to possible trade-offs between a long lifetime and
efficiency. The most likely parts to malfunction or to be repaired by replacement is
71
printed circuits boards and compressors based on stakeholder inputs. These parts are
also available through the entire life of the products. When comforts fans malfunctions,
they are expected to be discarded due to their low purchase price.
There are opportunities for Ecodesign in terms of product lifetime, enabling easy repair and
maintenance as well as refrigerant leakage, however these can be problematic for market
surveillance to verify, and Ecodesign which sets requirements at the beginning of the
product’s life may have limited impact on these aspects at the end of life.
The second-hand market for fixed air conditioners are very limited, but for both portable
air conditioners and comfort fans this market is more widespread. Though, it is still
assumed to be negligible and therefore not included in later tasks.
Regarding the best practice in sustainable product use it is important that the air
conditioner is properly sized, well-placed and regularly maintained to reduce the energy
consumption. These factors can reduce the cost of heating and cooling by up to 10%. It
should therefore be discussed whether these information’s should be made mandatory in
the user manual.
Local infrastructure
The power sector is in a transition state moving from fossil fuels to renewable energy which
challenges the existing infrastructure. In Europe the electricity system is characterized by
a high share of renewable energy and high reliability.
Most countries have similar hourly load values with two peaks, one in the morning and one
in the evening. The first peak fits well with the start of the workday and the second peak
fits with the end of the workday. Between the two peaks there is a falling trend in the
energy consumption. Though, it seems like the need for cooling is affecting the hourly load
values for southern countries in the summer period. In these countries the peak load occurs
in the middle of the day which could indicate a high use of air conditioners.
The consumer demand of energy smart appliance is still low due to the lack of products
and the relatively small cost saving as a result of the non-flexible electricity prices and
composition. Although some air conditioners have network and grid communication
capability, but savings at large scale can only be realised when the standards and
infrastructure are ready for all types of energy smart appliances in the coming years.
72
Annex 1: Preparatory study Building Energy Simulation input
The preparatory study for Lot 10 used simulations to derive cooling loads of air-conditioned
buildings. Three different simple buildings were simulated, one house, one office and one
shop, envelope insulation characteristics and air change properties for existing buildings
and for new buildings built after 2006. The main characteristics of the three buildings are
given in this annex.
Geometry
Residence
The residence is modelled as an apartment with characteristics as defined in Table 19. The
exposed surfaces are the roof and facades in four orientations, while the floor is detached
to a fully symmetric zone with identical boundary conditions. The exterior dimensions are
8 by 12.5 m with a total floor area of 100 m2. The exposed wall area is 98 m2. Distinct
windows are placed in each wall with a window to wall ratio of 0.15, where operable shades
are employed. The conditioned area represents the 30% of the total floor area, with south
and west exposed facade.
Office
The office is modelled as a rectangular building with a core, conditioned zone and
characteristics as described in Table 20. The exterior dimensions are 10 by 10 m with a
total conditioned space of 100 m2. The flour is detached to a fully symmetric zone with
identical boundary conditions.
Retail
The retail store is modelled as a rectangular building with a single zone, as part of a strip
mall with adjacent zones on two sides, characteristics as identified in Table 21 and in two
orientations (north-south). The exterior dimensions are 25 by 25 m2 with 50 m2 of total
conditioned floor area. Windows to wall ratio was set equal to 0.6, with operable shades.
Table 19: Construction, Internal Load and cooling equipment characteristics for Residence
Construction Characteristic Old New
Zones 1 (conditioned)
1 (unconditioned)
Floor area 100 m2
Roof U-values range
(W/m2K)
0.2-0.9 0.2-0.5
Wall constructions U-values range
(W/m2K)
0.2-1.2 0.3-1.2
Windows 16 m2
Clear with
operable shades
Interior Load
73
Infiltration Air Change per
hour (ACH)
0.8-1.5 0.2-0.4
Lighting 7-15 (W/m2)
Equipment 7-10 (W/m2)
Occupancy 1 person / 20 m2
Equipment
Thermostat Cooling set point 25-26 25-26
Natural ventilation Window operation
available
Table 20: Construction, Internal Load and cooling equipment characteristics for Office
Construction Characteristic Old New
Zones 1 (conditioned)
1 (unconditioned)
Floor area 100 m2
Roof U-values range
(W/m2K)
0.2-0.9 0.2-0.5
Wall constructions U-values range
(W/m2K)
0.2-1.2 0.3-1.2
Windows 25 m2
Clear with
operable shades
Interior Load
Infiltration Air Change per
hour (ACH)
0.8-1.5 0.2-0.4
Lighting 15-18 (W/m2)
Equipment 12-15 (W/m2)
Occupancy 1 person / 9 m2
Equipment
Thermostat Cooling set point 24-26 24-26
Natural ventilation Window operation
available
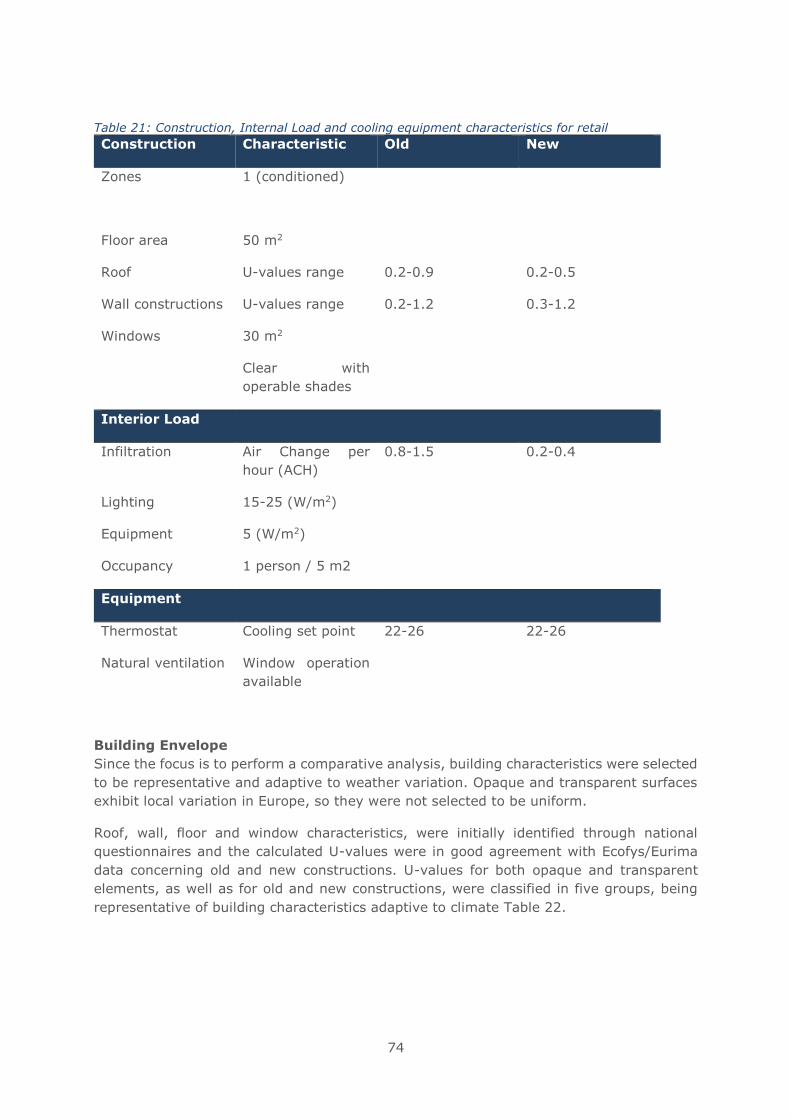
74
Table 21: Construction, Internal Load and cooling equipment characteristics for retail
Construction Characteristic Old New
Zones 1 (conditioned)
Floor area 50 m2
Roof U-values range 0.2-0.9 0.2-0.5
Wall constructions U-values range 0.2-1.2 0.3-1.2
Windows 30 m2
Clear with
operable shades
Interior Load
Infiltration Air Change per
hour (ACH)
0.8-1.5 0.2-0.4
Lighting 15-25 (W/m2)
Equipment 5 (W/m2)
Occupancy 1 person / 5 m2
Equipment
Thermostat Cooling set point 22-26 22-26
Natural ventilation Window operation
available
Building Envelope
Since the focus is to perform a comparative analysis, building characteristics were selected
to be representative and adaptive to weather variation. Opaque and transparent surfaces
exhibit local variation in Europe, so they were not selected to be uniform.
Roof, wall, floor and window characteristics, were initially identified through national
questionnaires and the calculated U-values were in good agreement with Ecofys/Eurima
data concerning old and new constructions. U-values for both opaque and transparent
elements, as well as for old and new constructions, were classified in five groups, being
representative of building characteristics adaptive to climate Table 22.
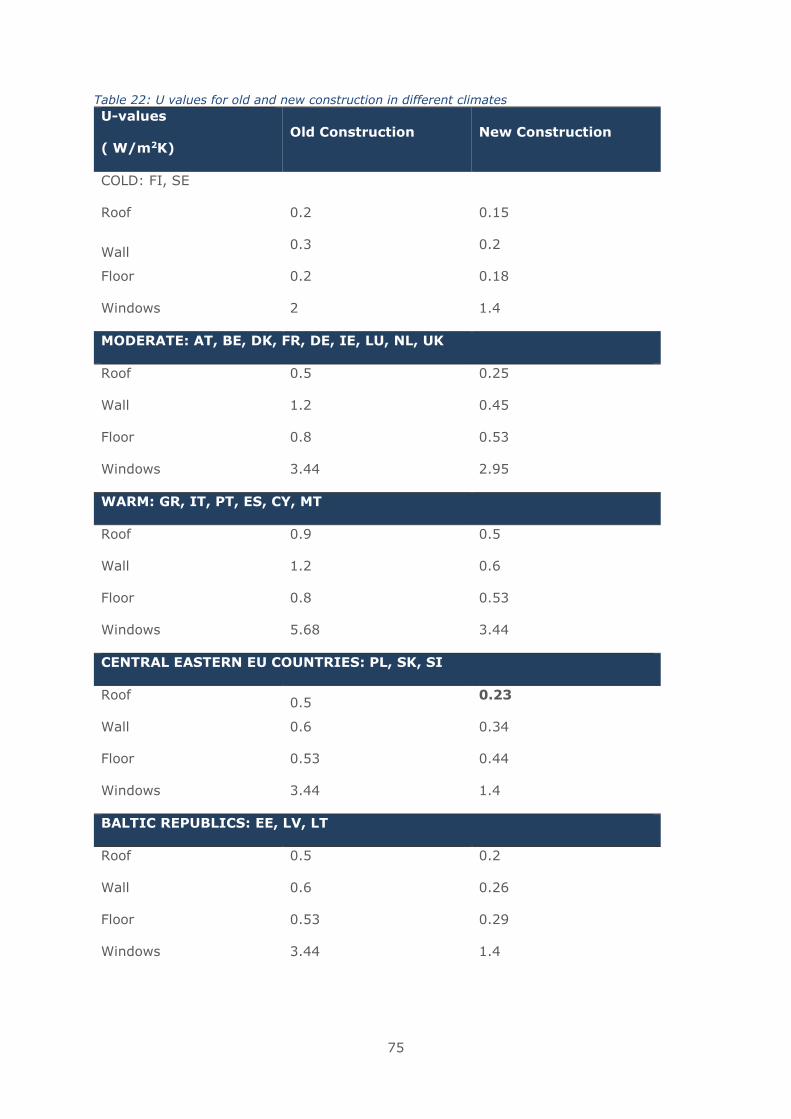
75
Table 22: U values for old and new construction in different climates
U-values
( W/m2K) Old Construction New Construction
COLD: FI, SE
Roof 0.2 0.15
Wall 0.3 0.2
Floor 0.2 0.18
Windows 2 1.4
MODERATE: AT, BE, DK, FR, DE, IE, LU, NL, UK
Roof 0.5 0.25
Wall 1.2 0.45
Floor 0.8 0.53
Windows 3.44 2.95
WARM: GR, IT, PT, ES, CY, MT
Roof 0.9 0.5
Wall 1.2 0.6
Floor 0.8 0.53
Windows 5.68 3.44
CENTRAL EASTERN EU COUNTRIES: PL, SK, SI
Roof 0.5
0.23
Wall 0.6 0.34
Floor 0.53 0.44
Windows 3.44 1.4
BALTIC REPUBLICS: EE, LV, LT
Roof 0.5 0.2
Wall 0.6 0.26
Floor 0.53 0.29
Windows 3.44 1.4
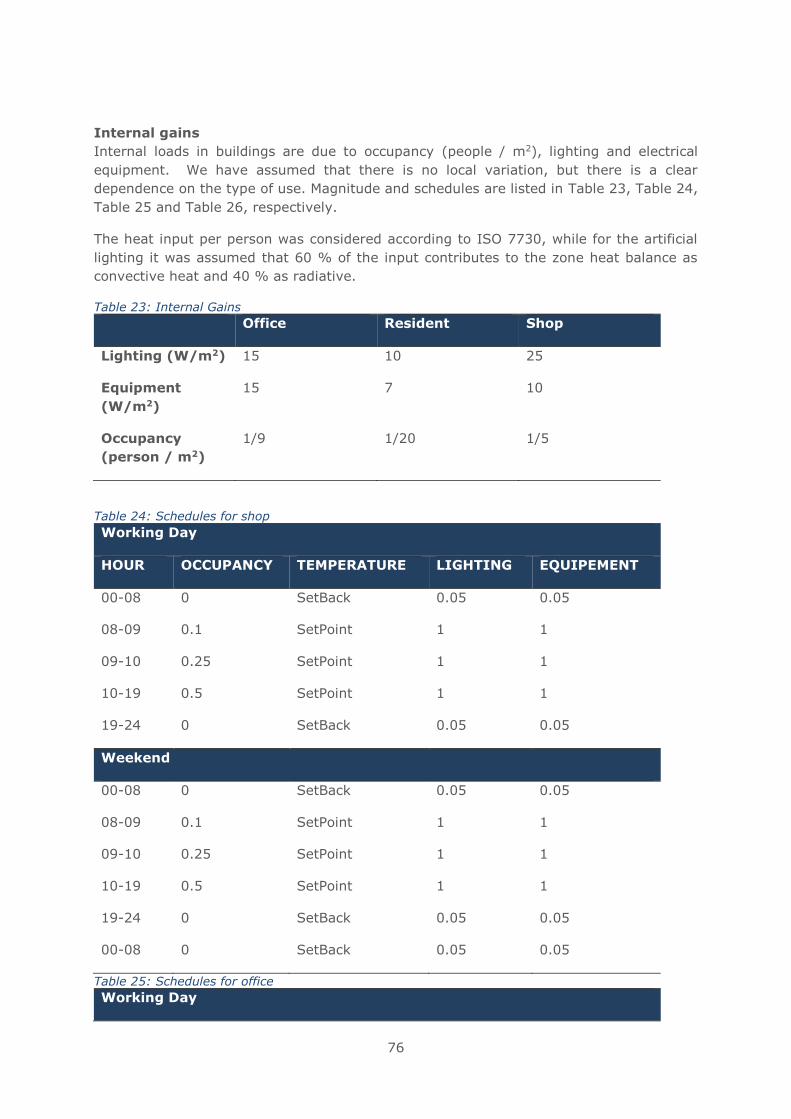
76
Internal gains
Internal loads in buildings are due to occupancy (people / m2), lighting and electrical
equipment. We have assumed that there is no local variation, but there is a clear
dependence on the type of use. Magnitude and schedules are listed in Table 23, Table 24,
Table 25 and Table 26, respectively.
The heat input per person was considered according to ISO 7730, while for the artificial
lighting it was assumed that 60 % of the input contributes to the zone heat balance as
convective heat and 40 % as radiative.
Table 23: Internal Gains
Office Resident Shop
Lighting (W/m2) 15 10 25
Equipment
(W/m2)
15 7 10
Occupancy
(person / m2)
1/9 1/20 1/5
Table 24: Schedules for shop
Working Day
HOUR OCCUPANCY TEMPERATURE LIGHTING EQUIPEMENT
00-08 0 SetBack 0.05 0.05
08-09 0.1 SetPoint 1 1
09-10 0.25 SetPoint 1 1
10-19 0.5 SetPoint 1 1
19-24 0 SetBack 0.05 0.05
Weekend
00-08 0 SetBack 0.05 0.05
08-09 0.1 SetPoint 1 1
09-10 0.25 SetPoint 1 1
10-19 0.5 SetPoint 1 1
19-24 0 SetBack 0.05 0.05
00-08 0 SetBack 0.05 0.05
Table 25: Schedules for office
Working Day
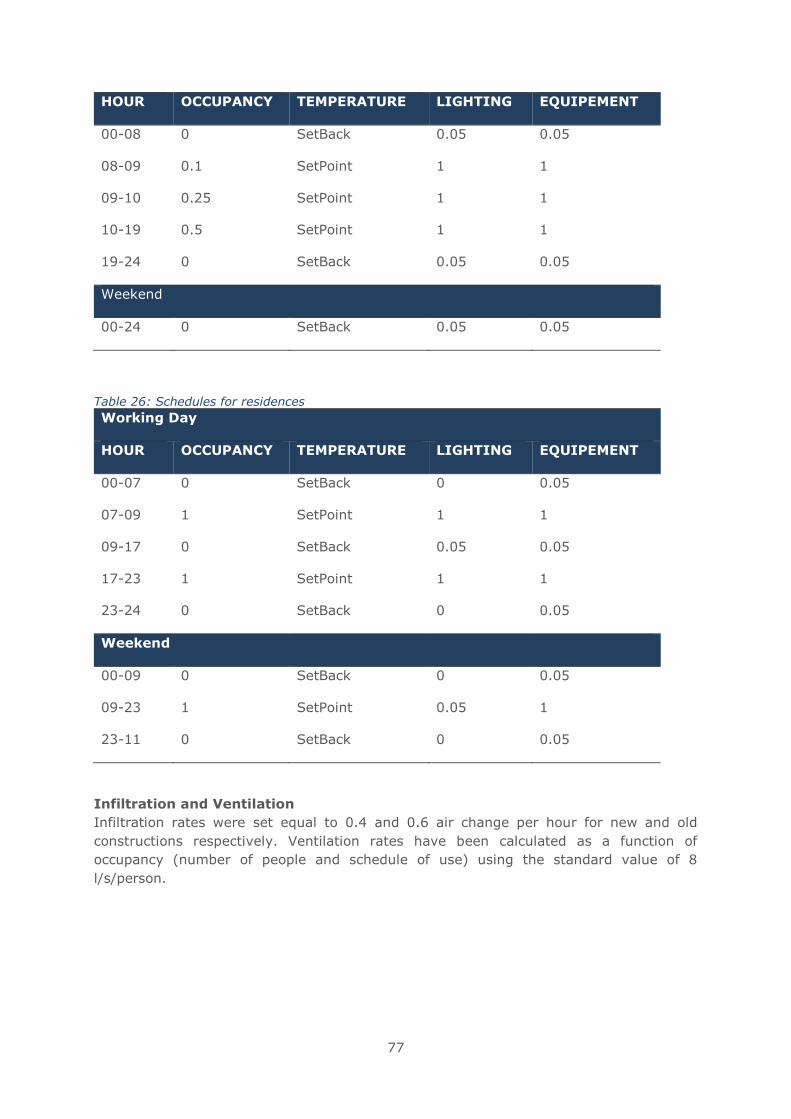
77
HOUR OCCUPANCY TEMPERATURE LIGHTING EQUIPEMENT
00-08 0 SetBack 0.05 0.05
08-09 0.1 SetPoint 1 1
09-10 0.25 SetPoint 1 1
10-19 0.5 SetPoint 1 1
19-24 0 SetBack 0.05 0.05
Weekend
00-24 0 SetBack 0.05 0.05
Table 26: Schedules for residences
Working Day
HOUR OCCUPANCY TEMPERATURE LIGHTING EQUIPEMENT
00-07 0 SetBack 0 0.05
07-09 1 SetPoint 1 1
09-17 0 SetBack 0.05 0.05
17-23 1 SetPoint 1 1
23-24 0 SetBack 0 0.05
Weekend
00-09 0 SetBack 0 0.05
09-23 1 SetPoint 0.05 1
23-11 0 SetBack 0 0.05
Infiltration and Ventilation
Infiltration rates were set equal to 0.4 and 0.6 air change per hour for new and old
constructions respectively. Ventilation rates have been calculated as a function of
occupancy (number of people and schedule of use) using the standard value of 8
l/s/person.

1
Review of Regulation 206/2012 and
626/2011
Air conditioners and comfort fans
Task 4 report
Technologies
Final version
Date: May 2018
2
Prepared by:
Viegand Maagøe and ARMINES
Study team: Baijia Huang, Jan Viegand, Peter Martin Skov Hansen, Philippe Riviere,
Hassane Asloune
Quality manager: Jan Viegand
Website design and management: Viegand Maagøe A/S
Contract manager: Viegand Maagøe A/S
Prepared for:
European Commission
DG ENER C.3
Office: DM24 04/048
B-1049 Brussels, Belgium
Contact person: Veerle Beelaerts
E-mail: [email protected]
Project website: www.eco-airconditioners.eu
Specific contract no.: No. ENER/C3/FV 2016-537/03/FWC 2015-619
LOT2/01/SI2.749247
Implements Framework Contract: № ENER/C3/2015-619 LOT 2
This study was ordered and paid for by the European Commission, Directorate-General
for Energy.
As agreed with Policy Officer Veerle Beelaerts, some of the budget for data purchase was
reallocated for project work.
The information and views set out in this study are those of the author(s) and do not
necessarily reflect the official opinion of the Commission. The Commission does not
guarantee the accuracy of the data included in this study. Neither the Commission nor any
person acting on the Commission’s behalf may be held responsible for the use which may
be made of the information contained therein.
This report has been prepared by the authors to the best of their ability and knowledge.
The authors do not assume liability for any damage, material or immaterial, that may arise
from the use of the report or the information contained therein.
© European Union, May 2018.
Reproduction is authorised provided the source is acknowledged.
More information on the European Union is available on the internet (http://europa.eu).
Viegand Maagøe A/S
Nr. Farimagsgade 37
1364 Copenhagen K
Denmark
viegandmaagoe.dk
3
Table of contents List of tables ......................................................................................................... 4
List of figures ........................................................................................................ 5
Abbreviations ........................................................................................................ 6
Introduction to the task reports ............................................................................... 7
4 Introduction to Task 4 ...................................................................................... 9
4.1 Technical product description ...................................................................... 9
4.1.1 Existing products ................................................................................ 9
4.1.2 Products with standard improvement (design) options ............................24
4.2 Technology roadmap ................................................................................33
4.2.1 BNAT based on same product archetype ...............................................34
4.2.2 Alternative technologies to electric vapor compression ............................38
4.3 Production and distribution ........................................................................41
4.3.1 Bill-of-Materials (BOM) ........................................................................41
4.3.2 Primary scrap production during manufacturing .....................................43
4.3.3 Packaging materials ...........................................................................43
4.3.4 Volume and weight of the packaged product ..........................................44
4.3.5 Means of transport .............................................................................44
4.4 End-of-Life ..............................................................................................44
4.4.1 Technical product life ..........................................................................45
4.4.1 Materials flow and collection at end-of-life .............................................45
4.4.1 Recyclability of air conditioners and comfort fans ...................................47
4.4.2 Design options regarding resource efficiency .........................................48
4.5 Conclusions and recommendations .............................................................54
Annex 1: Design guidelines .................................................................................57
Annex 2: Impact of resource requirements ...........................................................60
4
List of tables
Table 1: Repartition of product per class in number and capacity ................................10
Table 2: Repartition of product per type on the 0-6 and 6-12 kW capacity ranges,
adaptation from BSRIA data...................................................................................10
Table 3: Distribution of SEER and SCOP over the 0-6 kW range, source ECC directory and
own calculation ....................................................................................................12
Table 4: Distribution of SEER and SCOP over the 6-12 kW range, adapted from ECC
directory .............................................................................................................13
Table 5: Standby power of air conditioners ..............................................................17
Table 6: Distribution of off mode, standby, thermostat-off and crankcase power for the 0-
6 kW and 6-12 kW cooling capacity ranges, crankcase values in italic are highly uncertain
because of a very low number of declared values and probably not representative,
adapted from ECC directory ...................................................................................18
Table 7: Average SEER and SCOP values by sound power bin, adapted from ECC
directory .............................................................................................................21
Table 8: Fixed air conditioners existing product main characteristics (model weighted) .22
Table 9: Portable air conditioner existing product main characteristics ........................23
Table 10:Fixed air conditioners existing product main characteristics (sales weighted) ..24
Table 11: best available products main characteristics ..............................................31
Table 12 Summary and status of the different alternatives to vapor compression
technologies ........................................................................................................41
Table 13: Average material composition of air conditioners ........................................42
Table 14: Material composition of comfort fans ........................................................43
Table 15: Calculated collection rate of large household equipment in Europe, 2014 ......46
Table 16: Recycling rates from EcoReport Tool adopted in the current study ................48
Table 17: List of critical raw materials .....................................................................49
Table 18: Alignment with other regulations ..............................................................52
Table 19: Existing average products main characteristics ..........................................54
Table 20: Recycling compatibility of different types of plastic. 1= Compatible, 2 =
Compatible with limitations, 3 = Compatible only in small amounts, 4 = Not compatible
..........................................................................................................................59
Table 21: Impact of different measures to increase the reparability of washing machines
..........................................................................................................................61
5
List of figures Figure 1: Distribution of models per size in the 0-6 kW range, adapted from ECC
directory .............................................................................................................11
Figure 2: Distribution of models per size in the 6-12 kW range, adapted from ECC
directory .............................................................................................................11
Figure 3: SEER distribution by model between 3.4 and 3.6 kW, adapted from ECC
directory .............................................................................................................14
Figure 4: SEER distribution by model between 7.0 and 7.2 kW, adapted from ECC
directory .............................................................................................................14
Figure 5: Part load EER of 3.5 kW units distribution in cooling mode, source Eurovent
Certita Certification ...............................................................................................15
Figure 6: Part load COP of 3.5 kW units distribution in heating mode, source unknown
manufacturers part of Eurovent Certita Certification ..................................................15
Figure 7: Part load EER of 7.1 kW units distribution in heating mode, source unknown
manufacturers part of Eurovent Certita Certification ..................................................16
Figure 8: Part load COP of 7.1 kW units distribution in heating mode, source unknown
manufacturers part of Eurovent Certita Certification ..................................................16
Figure 9 EER versus specific refrigerant charge in kg/kW (capacity and EER at T1
condition), 5 m piping length .................................................................................20
Figure 10: Micro Channel Heat Exchanger ................................................................26
Figure 11: R410A single speed AC motor rotary compressor EER plotted against pressure
ratio, source (Lei et al, 2013) .................................................................................28
Figure 12: Coefficient of performance and volumetric capacity of selected low-global-
warming-potential fluids ........................................................................................35
Figure 13: Miniaturized Air -to-Refrigerant Heat Exchangers research project findings
illustration ...........................................................................................................37
Figure 14: Alternative cooling technologies identified in (Goetzler et al., 2014) ............39
Figure 15: Material composition of fixed air conditioners based on information from a
manufacturer’s homepage. ....................................................................................42
Figure 16: Combined size of indoor and outdoor unit ................................................44
Figure 17: The waste process flow for commercial refrigerants appliances ...................47
Figure 18: Metal wheel. The metal wheel shows which resources that can be recovered
at the different types of smelters ............................................................................58
Figure 19: Impact of all options towards increased reparability ..................................61
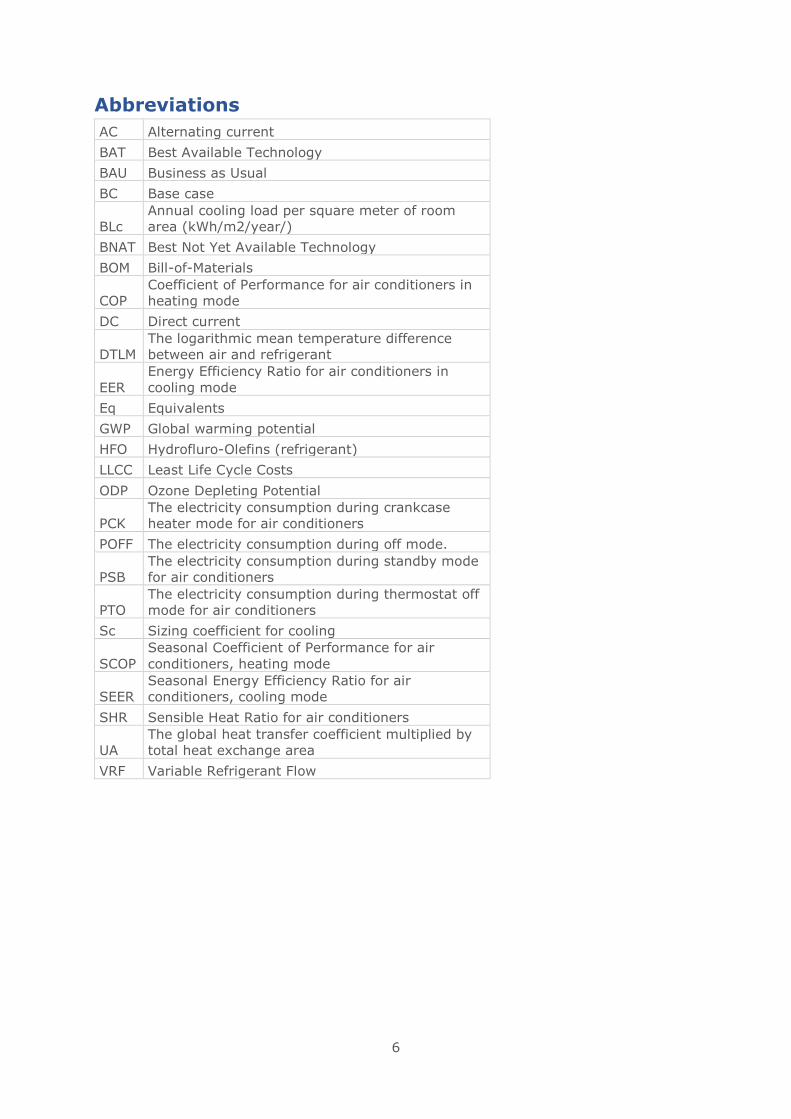
6
Abbreviations
AC Alternating current
BAT Best Available Technology
BAU Business as Usual
BC Base case
BLc
Annual cooling load per square meter of room
area (kWh/m2/year/)
BNAT Best Not Yet Available Technology
BOM Bill-of-Materials
COP
Coefficient of Performance for air conditioners in
heating mode
DC Direct current
DTLM
The logarithmic mean temperature difference
between air and refrigerant
EER
Energy Efficiency Ratio for air conditioners in
cooling mode
Eq Equivalents
GWP Global warming potential
HFO Hydrofluro-Olefins (refrigerant)
LLCC Least Life Cycle Costs
ODP Ozone Depleting Potential
PCK
The electricity consumption during crankcase
heater mode for air conditioners
POFF The electricity consumption during off mode.
PSB
The electricity consumption during standby mode
for air conditioners
PTO
The electricity consumption during thermostat off
mode for air conditioners
Sc Sizing coefficient for cooling
SCOP
Seasonal Coefficient of Performance for air
conditioners, heating mode
SEER
Seasonal Energy Efficiency Ratio for air
conditioners, cooling mode
SHR Sensible Heat Ratio for air conditioners
UA
The global heat transfer coefficient multiplied by
total heat exchange area
VRF Variable Refrigerant Flow
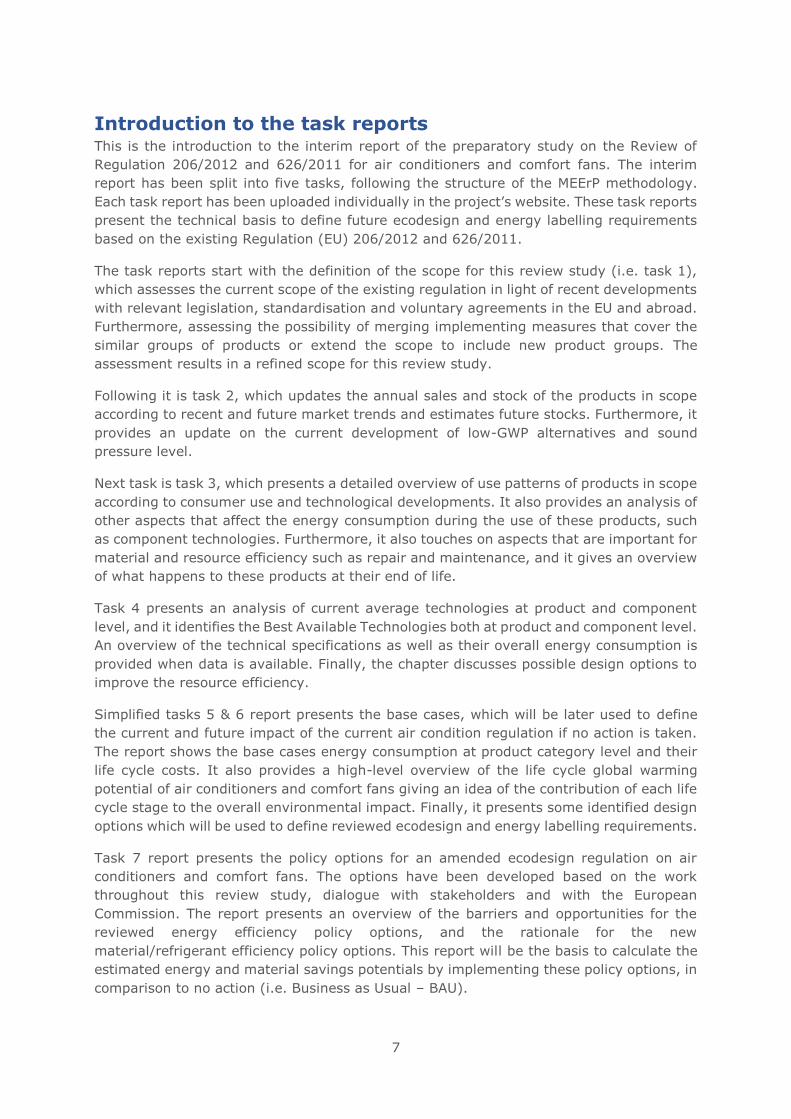
7
Introduction to the task reports This is the introduction to the interim report of the preparatory study on the Review of
Regulation 206/2012 and 626/2011 for air conditioners and comfort fans. The interim
report has been split into five tasks, following the structure of the MEErP methodology.
Each task report has been uploaded individually in the project’s website. These task reports
present the technical basis to define future ecodesign and energy labelling requirements
based on the existing Regulation (EU) 206/2012 and 626/2011.
The task reports start with the definition of the scope for this review study (i.e. task 1),
which assesses the current scope of the existing regulation in light of recent developments
with relevant legislation, standardisation and voluntary agreements in the EU and abroad.
Furthermore, assessing the possibility of merging implementing measures that cover the
similar groups of products or extend the scope to include new product groups. The
assessment results in a refined scope for this review study.
Following it is task 2, which updates the annual sales and stock of the products in scope
according to recent and future market trends and estimates future stocks. Furthermore, it
provides an update on the current development of low-GWP alternatives and sound
pressure level.
Next task is task 3, which presents a detailed overview of use patterns of products in scope
according to consumer use and technological developments. It also provides an analysis of
other aspects that affect the energy consumption during the use of these products, such
as component technologies. Furthermore, it also touches on aspects that are important for
material and resource efficiency such as repair and maintenance, and it gives an overview
of what happens to these products at their end of life.
Task 4 presents an analysis of current average technologies at product and component
level, and it identifies the Best Available Technologies both at product and component level.
An overview of the technical specifications as well as their overall energy consumption is
provided when data is available. Finally, the chapter discusses possible design options to
improve the resource efficiency.
Simplified tasks 5 & 6 report presents the base cases, which will be later used to define
the current and future impact of the current air condition regulation if no action is taken.
The report shows the base cases energy consumption at product category level and their
life cycle costs. It also provides a high-level overview of the life cycle global warming
potential of air conditioners and comfort fans giving an idea of the contribution of each life
cycle stage to the overall environmental impact. Finally, it presents some identified design
options which will be used to define reviewed ecodesign and energy labelling requirements.
Task 7 report presents the policy options for an amended ecodesign regulation on air
conditioners and comfort fans. The options have been developed based on the work
throughout this review study, dialogue with stakeholders and with the European
Commission. The report presents an overview of the barriers and opportunities for the
reviewed energy efficiency policy options, and the rationale for the new
material/refrigerant efficiency policy options. This report will be the basis to calculate the
estimated energy and material savings potentials by implementing these policy options, in
comparison to no action (i.e. Business as Usual – BAU).

8
The task reports follow the MEErP methodology, with some adaptations which suit the
study goals.
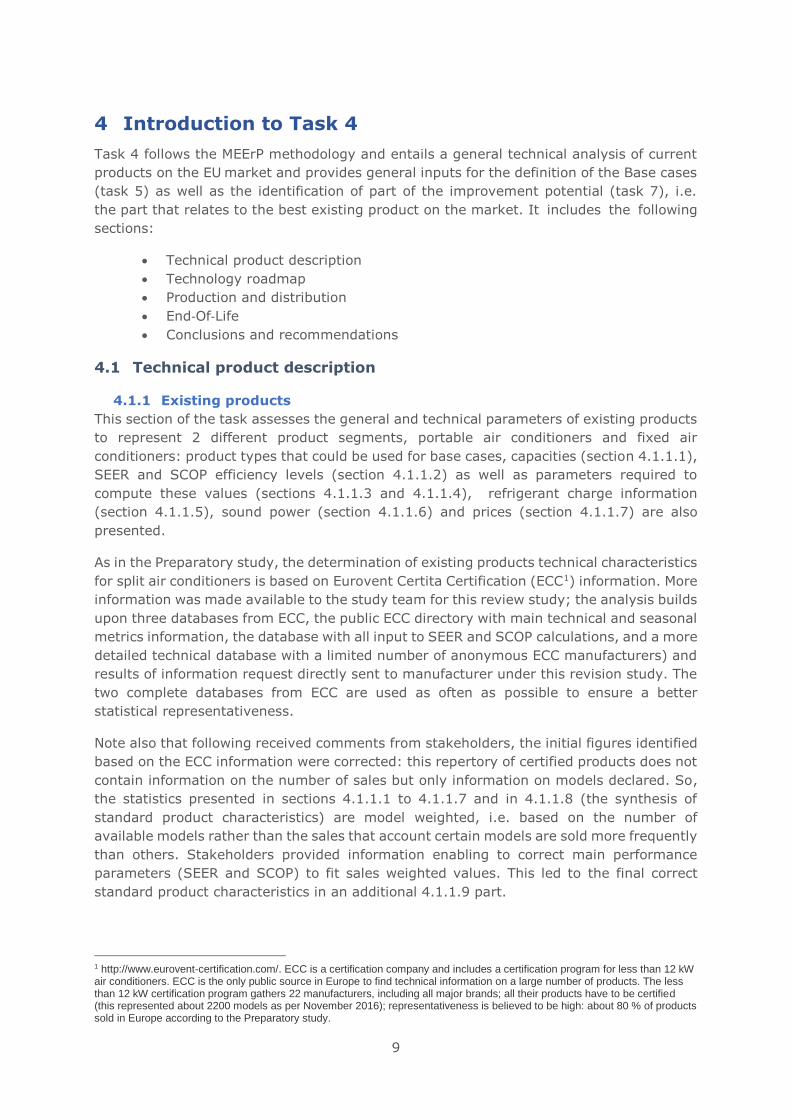
9
4 Introduction to Task 4
Task 4 follows the MEErP methodology and entails a general technical analysis of current
products on the EU market and provides general inputs for the definition of the Base cases
(task 5) as well as the identification of part of the improvement potential (task 7), i.e.
the part that relates to the best existing product on the market. It includes the following
sections:
• Technical product description
• Technology roadmap
• Production and distribution
• End‐Of‐Life
• Conclusions and recommendations
4.1 Technical product description
4.1.1 Existing products
This section of the task assesses the general and technical parameters of existing products
to represent 2 different product segments, portable air conditioners and fixed air
conditioners: product types that could be used for base cases, capacities (section 4.1.1.1),
SEER and SCOP efficiency levels (section 4.1.1.2) as well as parameters required to
compute these values (sections 4.1.1.3 and 4.1.1.4), refrigerant charge information
(section 4.1.1.5), sound power (section 4.1.1.6) and prices (section 4.1.1.7) are also
presented.
As in the Preparatory study, the determination of existing products technical characteristics
for split air conditioners is based on Eurovent Certita Certification (ECC1) information. More
information was made available to the study team for this review study; the analysis builds
upon three databases from ECC, the public ECC directory with main technical and seasonal
metrics information, the database with all input to SEER and SCOP calculations, and a more
detailed technical database with a limited number of anonymous ECC manufacturers) and
results of information request directly sent to manufacturer under this revision study. The
two complete databases from ECC are used as often as possible to ensure a better
statistical representativeness.
Note also that following received comments from stakeholders, the initial figures identified
based on the ECC information were corrected: this repertory of certified products does not
contain information on the number of sales but only information on models declared. So,
the statistics presented in sections 4.1.1.1 to 4.1.1.7 and in 4.1.1.8 (the synthesis of
standard product characteristics) are model weighted, i.e. based on the number of
available models rather than the sales that account certain models are sold more frequently
than others. Stakeholders provided information enabling to correct main performance
parameters (SEER and SCOP) to fit sales weighted values. This led to the final correct
standard product characteristics in an additional 4.1.1.9 part.
1 http://www.eurovent-certification.com/. ECC is a certification company and includes a certification program for less than 12 kW air conditioners. ECC is the only public source in Europe to find technical information on a large number of products. The less than 12 kW certification program gathers 22 manufacturers, including all major brands; all their products have to be certified (this represented about 2200 models as per November 2016); representativeness is believed to be high: about 80 % of products sold in Europe according to the Preparatory study.
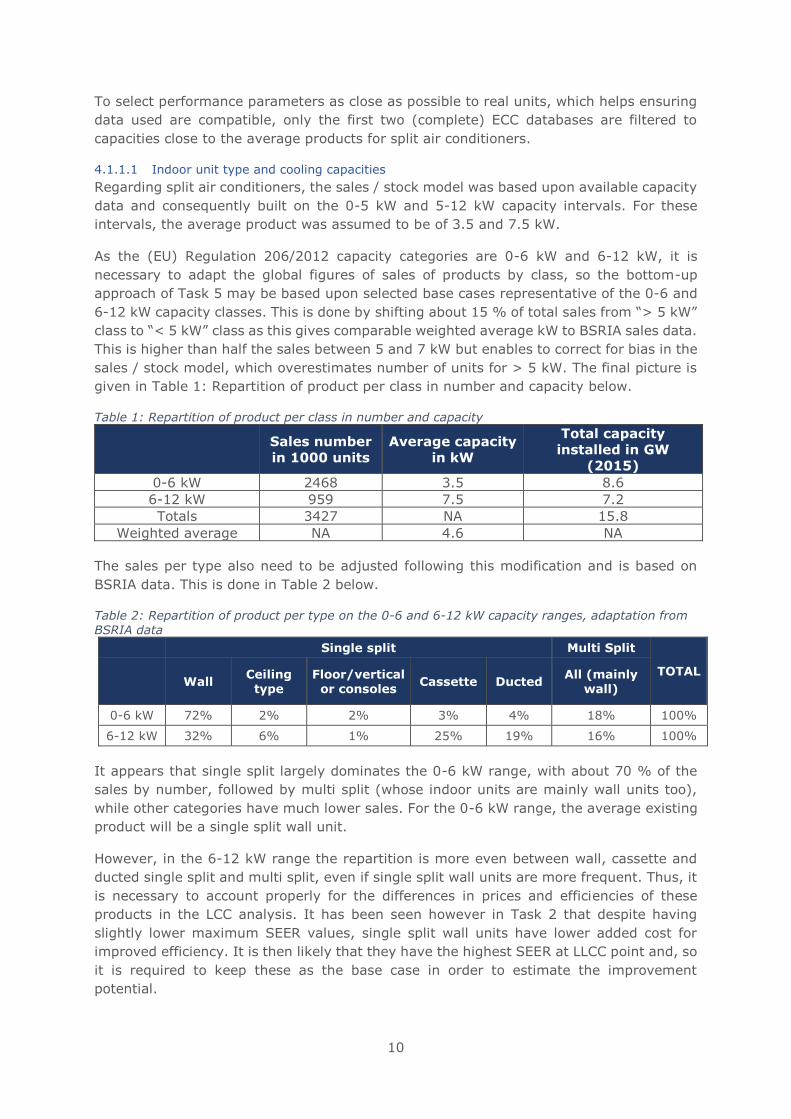
10
To select performance parameters as close as possible to real units, which helps ensuring
data used are compatible, only the first two (complete) ECC databases are filtered to
capacities close to the average products for split air conditioners.
4.1.1.1 Indoor unit type and cooling capacities
Regarding split air conditioners, the sales / stock model was based upon available capacity
data and consequently built on the 0-5 kW and 5-12 kW capacity intervals. For these
intervals, the average product was assumed to be of 3.5 and 7.5 kW.
As the (EU) Regulation 206/2012 capacity categories are 0-6 kW and 6-12 kW, it is
necessary to adapt the global figures of sales of products by class, so the bottom-up
approach of Task 5 may be based upon selected base cases representative of the 0-6 and
6-12 kW capacity classes. This is done by shifting about 15 % of total sales from “> 5 kW”
class to “< 5 kW” class as this gives comparable weighted average kW to BSRIA sales data.
This is higher than half the sales between 5 and 7 kW but enables to correct for bias in the
sales / stock model, which overestimates number of units for > 5 kW. The final picture is
given in Table 1: Repartition of product per class in number and capacity below.
Table 1: Repartition of product per class in number and capacity
Sales number
in 1000 units
Average capacity
in kW
Total capacity
installed in GW
(2015)
0-6 kW 2468 3.5 8.6
6-12 kW 959 7.5 7.2
Totals 3427 NA 15.8
Weighted average NA 4.6 NA
The sales per type also need to be adjusted following this modification and is based on
BSRIA data. This is done in Table 2 below.
Table 2: Repartition of product per type on the 0-6 and 6-12 kW capacity ranges, adaptation from BSRIA data
Single split Multi Split
TOTAL Wall Ceiling type
Floor/vertical or consoles
Cassette Ducted All (mainly
wall)
0-6 kW 72% 2% 2% 3% 4% 18% 100%
6-12 kW 32% 6% 1% 25% 19% 16% 100%
It appears that single split largely dominates the 0-6 kW range, with about 70 % of the
sales by number, followed by multi split (whose indoor units are mainly wall units too),
while other categories have much lower sales. For the 0-6 kW range, the average existing
product will be a single split wall unit.
However, in the 6-12 kW range the repartition is more even between wall, cassette and
ducted single split and multi split, even if single split wall units are more frequent. Thus, it
is necessary to account properly for the differences in prices and efficiencies of these
products in the LCC analysis. It has been seen however in Task 2 that despite having
slightly lower maximum SEER values, single split wall units have lower added cost for
improved efficiency. It is then likely that they have the highest SEER at LLCC point and, so
it is required to keep these as the base case in order to estimate the improvement
potential.
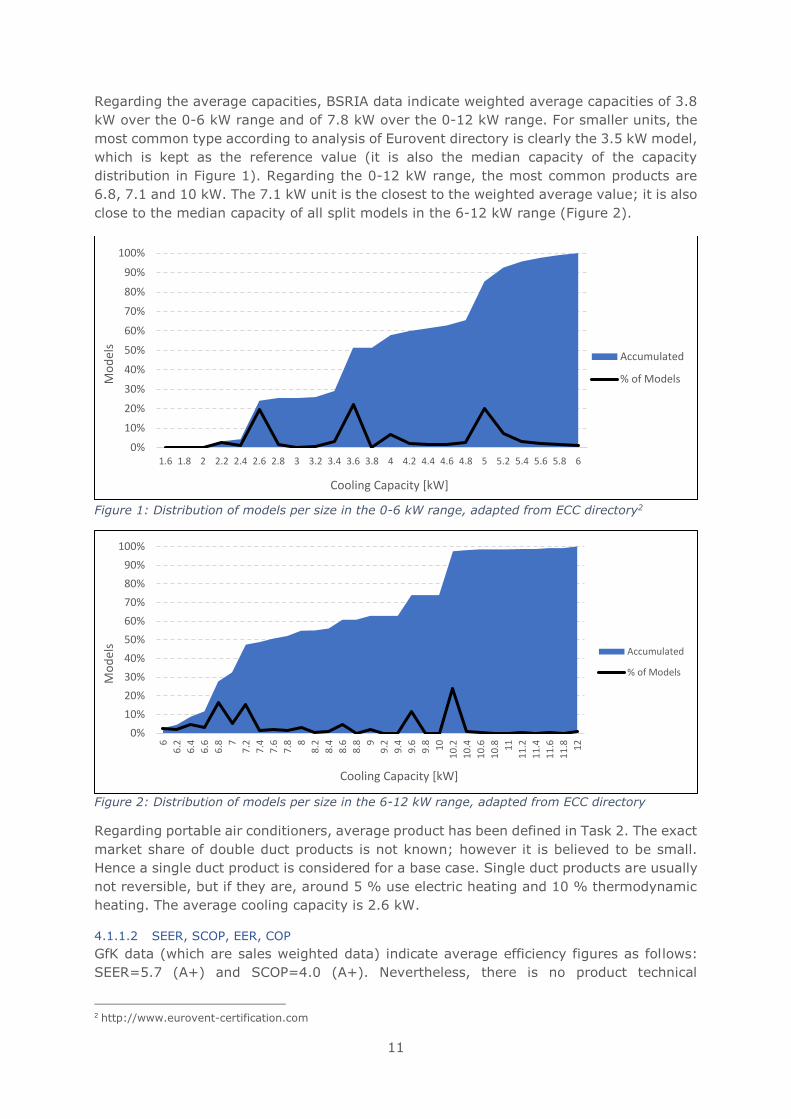
11
Regarding the average capacities, BSRIA data indicate weighted average capacities of 3.8
kW over the 0-6 kW range and of 7.8 kW over the 0-12 kW range. For smaller units, the
most common type according to analysis of Eurovent directory is clearly the 3.5 kW model,
which is kept as the reference value (it is also the median capacity of the capacity
distribution in Figure 1). Regarding the 0-12 kW range, the most common products are
6.8, 7.1 and 10 kW. The 7.1 kW unit is the closest to the weighted average value; it is also
close to the median capacity of all split models in the 6-12 kW range (Figure 2).
Figure 1: Distribution of models per size in the 0-6 kW range, adapted from ECC directory2
Figure 2: Distribution of models per size in the 6-12 kW range, adapted from ECC directory
Regarding portable air conditioners, average product has been defined in Task 2. The exact
market share of double duct products is not known; however it is believed to be small.
Hence a single duct product is considered for a base case. Single duct products are usually
not reversible, but if they are, around 5 % use electric heating and 10 % thermodynamic
heating. The average cooling capacity is 2.6 kW.
4.1.1.2 SEER, SCOP, EER, COP
GfK data (which are sales weighted data) indicate average efficiency figures as follows:
SEER=5.7 (A+) and SCOP=4.0 (A+). Nevertheless, there is no product technical
2 http://www.eurovent-certification.com
0%
10%
20%
30%
40%
50%
60%
70%
80%
90%
100%
1.6 1.8 2 2.2 2.4 2.6 2.8 3 3.2 3.4 3.6 3.8 4 4.2 4.4 4.6 4.8 5 5.2 5.4 5.6 5.8 6
Mo
del
s
Cooling Capacity [kW]
Accumulated
% of Models
0%
10%
20%
30%
40%
50%
60%
70%
80%
90%
100%
6
6.2
6.4
6.6
6.8 7
7.2
7.4
7.6
7.8 8
8.2
8.4
8.6
8.8 9
9.2
9.4
9.6
9.8 10
10
.2
10
.4
10
.6
10
.8 11
11
.2
11
.4
11
.6
11
.8 12
Mo
del
s
Cooling Capacity [kW]
Accumulated
% of Models
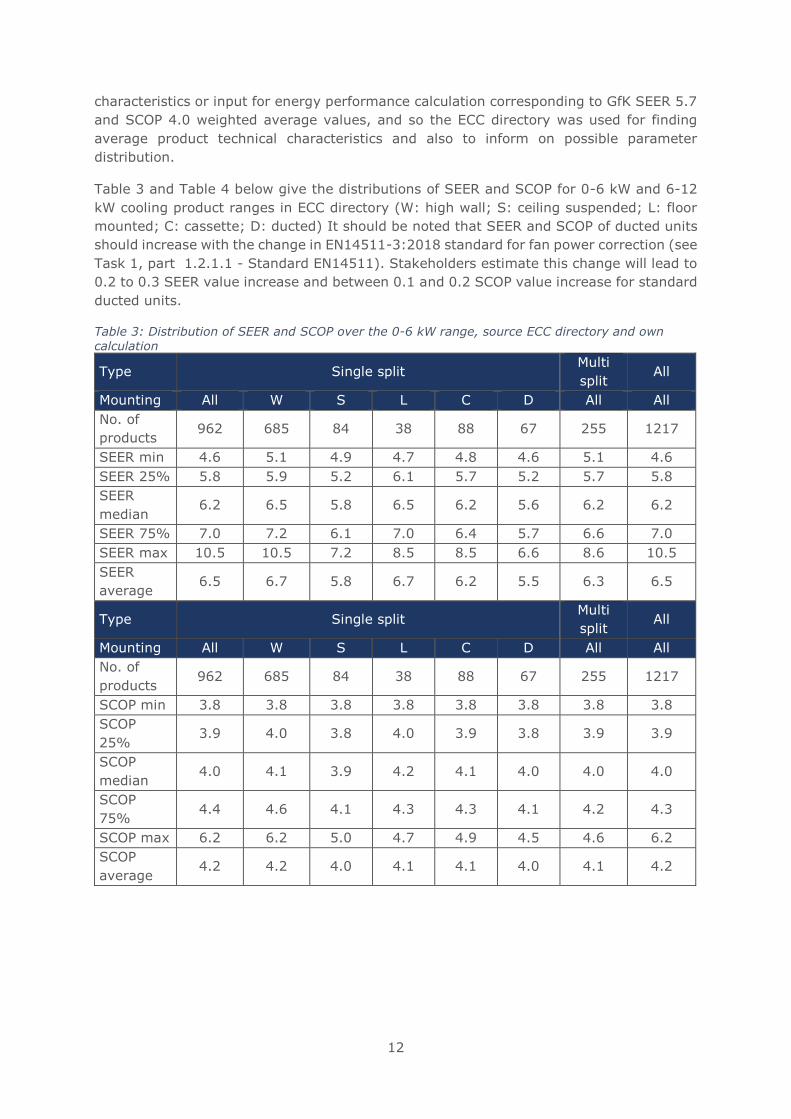
12
characteristics or input for energy performance calculation corresponding to GfK SEER 5.7
and SCOP 4.0 weighted average values, and so the ECC directory was used for finding
average product technical characteristics and also to inform on possible parameter
distribution.
Table 3 and Table 4 below give the distributions of SEER and SCOP for 0-6 kW and 6-12
kW cooling product ranges in ECC directory (W: high wall; S: ceiling suspended; L: floor
mounted; C: cassette; D: ducted) It should be noted that SEER and SCOP of ducted units
should increase with the change in EN14511-3:2018 standard for fan power correction (see
Task 1, part 1.2.1.1 - Standard EN14511). Stakeholders estimate this change will lead to
0.2 to 0.3 SEER value increase and between 0.1 and 0.2 SCOP value increase for standard
ducted units.
Table 3: Distribution of SEER and SCOP over the 0-6 kW range, source ECC directory and own calculation
Type Single split Multi
split All
Mounting All W S L C D All All
No. of
products 962 685 84 38 88 67 255 1217
SEER min 4.6 5.1 4.9 4.7 4.8 4.6 5.1 4.6
SEER 25% 5.8 5.9 5.2 6.1 5.7 5.2 5.7 5.8
SEER
median 6.2 6.5 5.8 6.5 6.2 5.6 6.2 6.2
SEER 75% 7.0 7.2 6.1 7.0 6.4 5.7 6.6 7.0
SEER max 10.5 10.5 7.2 8.5 8.5 6.6 8.6 10.5
SEER
average 6.5 6.7 5.8 6.7 6.2 5.5 6.3 6.5
Type Single split Multi
split All
Mounting All W S L C D All All
No. of
products 962 685 84 38 88 67 255 1217
SCOP min 3.8 3.8 3.8 3.8 3.8 3.8 3.8 3.8
SCOP
25% 3.9 4.0 3.8 4.0 3.9 3.8 3.9 3.9
SCOP
median 4.0 4.1 3.9 4.2 4.1 4.0 4.0 4.0
SCOP
75% 4.4 4.6 4.1 4.3 4.3 4.1 4.2 4.3
SCOP max 6.2 6.2 5.0 4.7 4.9 4.5 4.6 6.2
SCOP
average 4.2 4.2 4.0 4.1 4.1 4.0 4.1 4.2
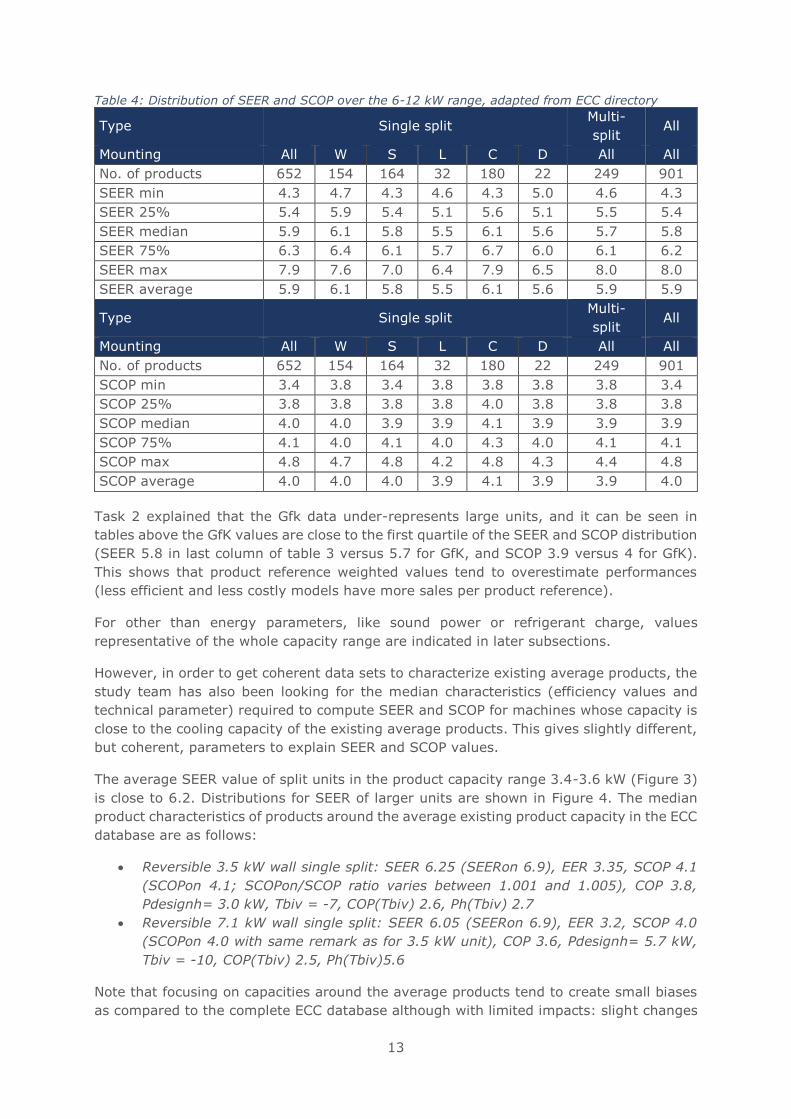
13
Table 4: Distribution of SEER and SCOP over the 6-12 kW range, adapted from ECC directory
Type Single split Multi-
split All
Mounting All W S L C D All All
No. of products 652 154 164 32 180 22 249 901
SEER min 4.3 4.7 4.3 4.6 4.3 5.0 4.6 4.3
SEER 25% 5.4 5.9 5.4 5.1 5.6 5.1 5.5 5.4
SEER median 5.9 6.1 5.8 5.5 6.1 5.6 5.7 5.8
SEER 75% 6.3 6.4 6.1 5.7 6.7 6.0 6.1 6.2
SEER max 7.9 7.6 7.0 6.4 7.9 6.5 8.0 8.0
SEER average 5.9 6.1 5.8 5.5 6.1 5.6 5.9 5.9
Type Single split Multi-
split All
Mounting All W S L C D All All
No. of products 652 154 164 32 180 22 249 901
SCOP min 3.4 3.8 3.4 3.8 3.8 3.8 3.8 3.4
SCOP 25% 3.8 3.8 3.8 3.8 4.0 3.8 3.8 3.8
SCOP median 4.0 4.0 3.9 3.9 4.1 3.9 3.9 3.9
SCOP 75% 4.1 4.0 4.1 4.0 4.3 4.0 4.1 4.1
SCOP max 4.8 4.7 4.8 4.2 4.8 4.3 4.4 4.8
SCOP average 4.0 4.0 4.0 3.9 4.1 3.9 3.9 4.0
Task 2 explained that the Gfk data under-represents large units, and it can be seen in
tables above the GfK values are close to the first quartile of the SEER and SCOP distribution
(SEER 5.8 in last column of table 3 versus 5.7 for GfK, and SCOP 3.9 versus 4 for GfK).
This shows that product reference weighted values tend to overestimate performances
(less efficient and less costly models have more sales per product reference).
For other than energy parameters, like sound power or refrigerant charge, values
representative of the whole capacity range are indicated in later subsections.
However, in order to get coherent data sets to characterize existing average products, the
study team has also been looking for the median characteristics (efficiency values and
technical parameter) required to compute SEER and SCOP for machines whose capacity is
close to the cooling capacity of the existing average products. This gives slightly different,
but coherent, parameters to explain SEER and SCOP values.
The average SEER value of split units in the product capacity range 3.4-3.6 kW (Figure 3)
is close to 6.2. Distributions for SEER of larger units are shown in Figure 4. The median
product characteristics of products around the average existing product capacity in the ECC
database are as follows:
• Reversible 3.5 kW wall single split: SEER 6.25 (SEERon 6.9), EER 3.35, SCOP 4.1
(SCOPon 4.1; SCOPon/SCOP ratio varies between 1.001 and 1.005), COP 3.8,
Pdesignh= 3.0 kW, Tbiv = -7, COP(Tbiv) 2.6, Ph(Tbiv) 2.7
• Reversible 7.1 kW wall single split: SEER 6.05 (SEERon 6.9), EER 3.2, SCOP 4.0
(SCOPon 4.0 with same remark as for 3.5 kW unit), COP 3.6, Pdesignh= 5.7 kW,
Tbiv = -10, COP(Tbiv) 2.5, Ph(Tbiv)5.6
Note that focusing on capacities around the average products tend to create small biases
as compared to the complete ECC database although with limited impacts: slight changes
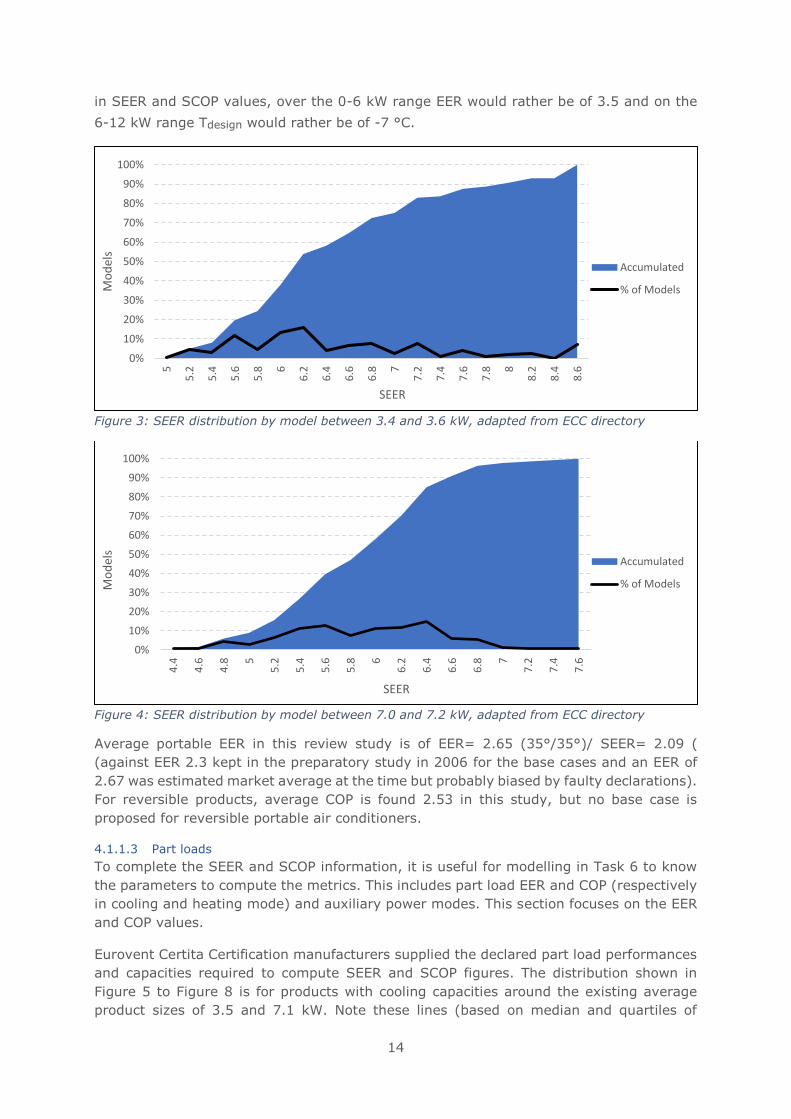
14
in SEER and SCOP values, over the 0-6 kW range EER would rather be of 3.5 and on the
6-12 kW range Tdesign would rather be of -7 °C.
Figure 3: SEER distribution by model between 3.4 and 3.6 kW, adapted from ECC directory
Figure 4: SEER distribution by model between 7.0 and 7.2 kW, adapted from ECC directory
Average portable EER in this review study is of EER= 2.65 (35°/35°)/ SEER= 2.09 (
(against EER 2.3 kept in the preparatory study in 2006 for the base cases and an EER of
2.67 was estimated market average at the time but probably biased by faulty declarations).
For reversible products, average COP is found 2.53 in this study, but no base case is
proposed for reversible portable air conditioners.
4.1.1.3 Part loads
To complete the SEER and SCOP information, it is useful for modelling in Task 6 to know
the parameters to compute the metrics. This includes part load EER and COP (respectively
in cooling and heating mode) and auxiliary power modes. This section focuses on the EER
and COP values.
Eurovent Certita Certification manufacturers supplied the declared part load performances
and capacities required to compute SEER and SCOP figures. The distribution shown in
Figure 5 to Figure 8 is for products with cooling capacities around the existing average
product sizes of 3.5 and 7.1 kW. Note these lines (based on median and quartiles of
0%
10%
20%
30%
40%
50%
60%
70%
80%
90%
100%5
5.2
5.4
5.6
5.8 6
6.2
6.4
6.6
6.8 7
7.2
7.4
7.6
7.8 8
8.2
8.4
8.6
Mo
del
s
SEER
Accumulated
% of Models
0%
10%
20%
30%
40%
50%
60%
70%
80%
90%
100%
4.4
4.6
4.8 5
5.2
5.4
5.6
5.8 6
6.2
6.4
6.6
6.8 7
7.2
7.4
7.6
Mo
del
s
SEER
Accumulated
% of Models
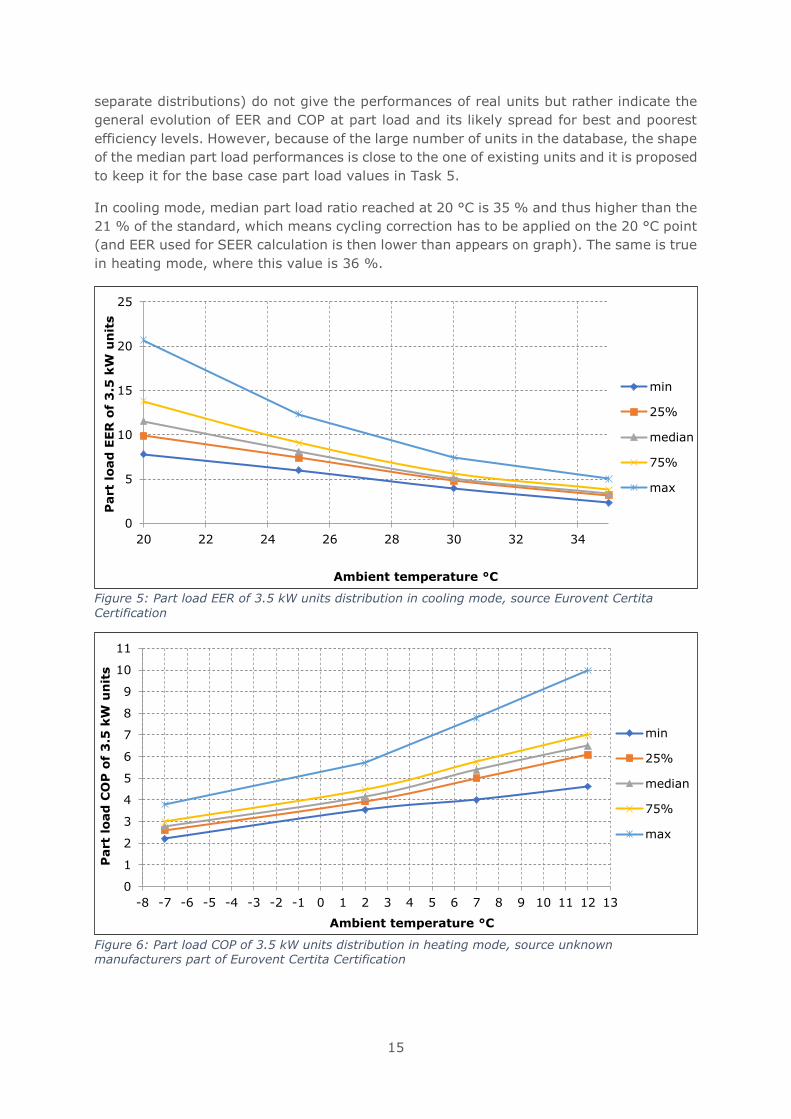
15
separate distributions) do not give the performances of real units but rather indicate the
general evolution of EER and COP at part load and its likely spread for best and poorest
efficiency levels. However, because of the large number of units in the database, the shape
of the median part load performances is close to the one of existing units and it is proposed
to keep it for the base case part load values in Task 5.
In cooling mode, median part load ratio reached at 20 °C is 35 % and thus higher than the
21 % of the standard, which means cycling correction has to be applied on the 20 °C point
(and EER used for SEER calculation is then lower than appears on graph). The same is true
in heating mode, where this value is 36 %.
Figure 5: Part load EER of 3.5 kW units distribution in cooling mode, source Eurovent Certita
Certification
Figure 6: Part load COP of 3.5 kW units distribution in heating mode, source unknown manufacturers part of Eurovent Certita Certification
0
5
10
15
20
25
20 22 24 26 28 30 32 34
Part
load
EER
of
3.5
kW
un
its
Ambient temperature °C
min
25%
median
75%
max
0
1
2
3
4
5
6
7
8
9
10
11
-8 -7 -6 -5 -4 -3 -2 -1 0 1 2 3 4 5 6 7 8 9 10 11 12 13
Part
load
CO
P o
f 3
.5 k
W u
nit
s
Ambient temperature °C
min
25%
median
75%
max
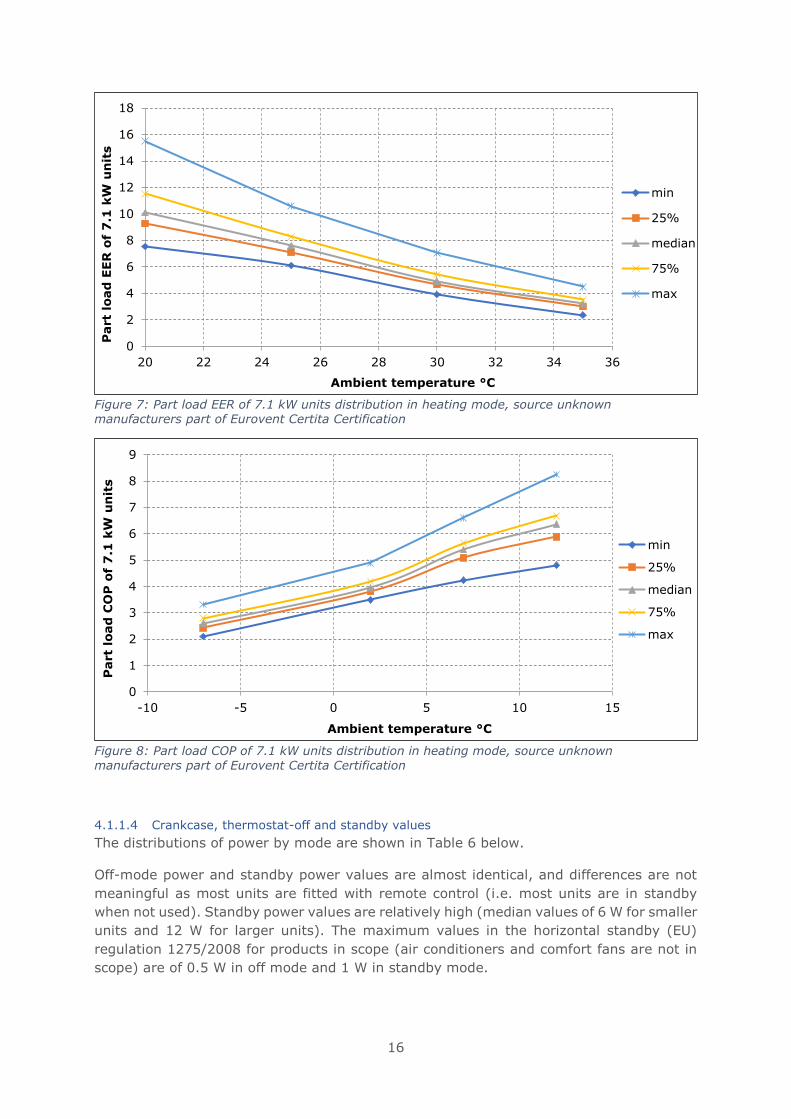
16
Figure 7: Part load EER of 7.1 kW units distribution in heating mode, source unknown manufacturers part of Eurovent Certita Certification
Figure 8: Part load COP of 7.1 kW units distribution in heating mode, source unknown
manufacturers part of Eurovent Certita Certification
4.1.1.4 Crankcase, thermostat-off and standby values
The distributions of power by mode are shown in Table 6 below.
Off-mode power and standby power values are almost identical, and differences are not
meaningful as most units are fitted with remote control (i.e. most units are in standby
when not used). Standby power values are relatively high (median values of 6 W for smaller
units and 12 W for larger units). The maximum values in the horizontal standby (EU)
regulation 1275/2008 for products in scope (air conditioners and comfort fans are not in
scope) are of 0.5 W in off mode and 1 W in standby mode.
0
2
4
6
8
10
12
14
16
18
20 22 24 26 28 30 32 34 36
Part
load
EER
of
7.1
kW
un
its
Ambient temperature °C
min
25%
median
75%
max
0
1
2
3
4
5
6
7
8
9
-10 -5 0 5 10 15
Part
load
CO
P o
f 7
.1 k
W u
nit
s
Ambient temperature °C
min
25%
median
75%
max
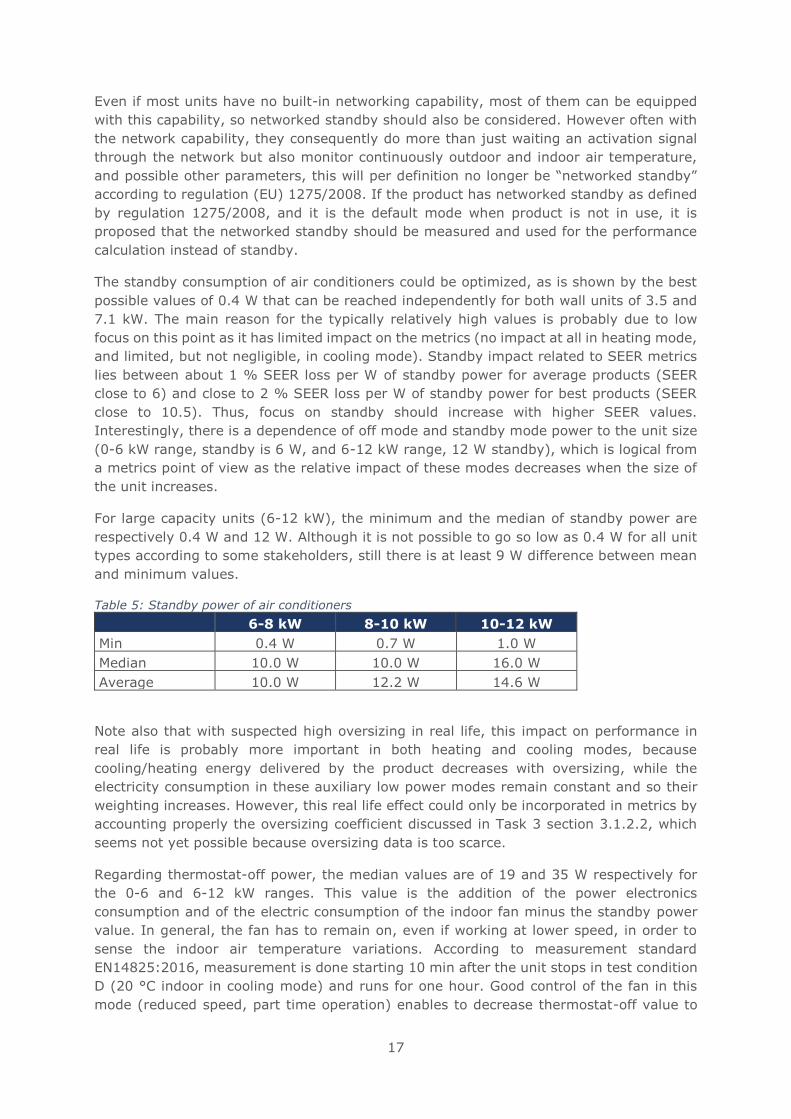
17
Even if most units have no built-in networking capability, most of them can be equipped
with this capability, so networked standby should also be considered. However often with
the network capability, they consequently do more than just waiting an activation signal
through the network but also monitor continuously outdoor and indoor air temperature,
and possible other parameters, this will per definition no longer be “networked standby”
according to regulation (EU) 1275/2008. If the product has networked standby as defined
by regulation 1275/2008, and it is the default mode when product is not in use, it is
proposed that the networked standby should be measured and used for the performance
calculation instead of standby.
The standby consumption of air conditioners could be optimized, as is shown by the best
possible values of 0.4 W that can be reached independently for both wall units of 3.5 and
7.1 kW. The main reason for the typically relatively high values is probably due to low
focus on this point as it has limited impact on the metrics (no impact at all in heating mode,
and limited, but not negligible, in cooling mode). Standby impact related to SEER metrics
lies between about 1 % SEER loss per W of standby power for average products (SEER
close to 6) and close to 2 % SEER loss per W of standby power for best products (SEER
close to 10.5). Thus, focus on standby should increase with higher SEER values.
Interestingly, there is a dependence of off mode and standby mode power to the unit size
(0-6 kW range, standby is 6 W, and 6-12 kW range, 12 W standby), which is logical from
a metrics point of view as the relative impact of these modes decreases when the size of
the unit increases.
For large capacity units (6-12 kW), the minimum and the median of standby power are
respectively 0.4 W and 12 W. Although it is not possible to go so low as 0.4 W for all unit
types according to some stakeholders, still there is at least 9 W difference between mean
and minimum values.
Table 5: Standby power of air conditioners
6-8 kW 8-10 kW 10-12 kW
Min 0.4 W 0.7 W 1.0 W
Median 10.0 W 10.0 W 16.0 W
Average 10.0 W 12.2 W 14.6 W
Note also that with suspected high oversizing in real life, this impact on performance in
real life is probably more important in both heating and cooling modes, because
cooling/heating energy delivered by the product decreases with oversizing, while the
electricity consumption in these auxiliary low power modes remain constant and so their
weighting increases. However, this real life effect could only be incorporated in metrics by
accounting properly the oversizing coefficient discussed in Task 3 section 3.1.2.2, which
seems not yet possible because oversizing data is too scarce.
Regarding thermostat-off power, the median values are of 19 and 35 W respectively for
the 0-6 and 6-12 kW ranges. This value is the addition of the power electronics
consumption and of the electric consumption of the indoor fan minus the standby power
value. In general, the fan has to remain on, even if working at lower speed, in order to
sense the indoor air temperature variations. According to measurement standard
EN14825:2016, measurement is done starting 10 min after the unit stops in test condition
D (20 °C indoor in cooling mode) and runs for one hour. Good control of the fan in this
mode (reduced speed, part time operation) enables to decrease thermostat-off value to
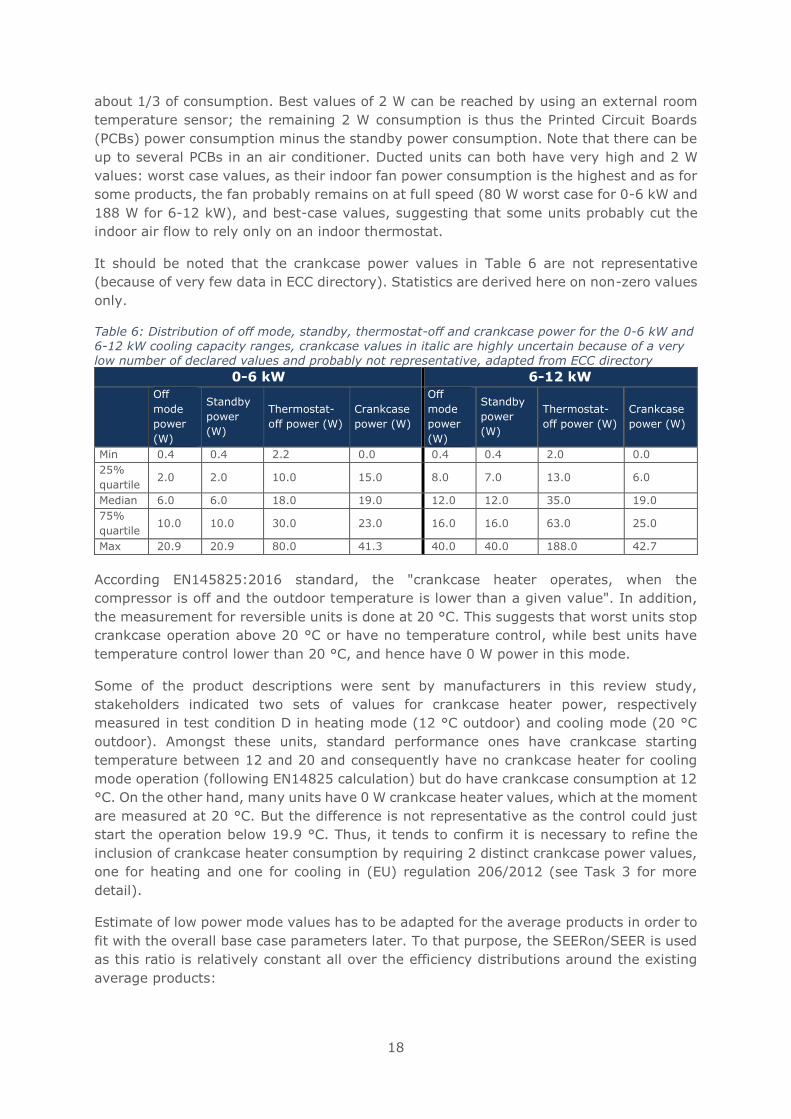
18
about 1/3 of consumption. Best values of 2 W can be reached by using an external room
temperature sensor; the remaining 2 W consumption is thus the Printed Circuit Boards
(PCBs) power consumption minus the standby power consumption. Note that there can be
up to several PCBs in an air conditioner. Ducted units can both have very high and 2 W
values: worst case values, as their indoor fan power consumption is the highest and as for
some products, the fan probably remains on at full speed (80 W worst case for 0-6 kW and
188 W for 6-12 kW), and best-case values, suggesting that some units probably cut the
indoor air flow to rely only on an indoor thermostat.
It should be noted that the crankcase power values in Table 6 are not representative
(because of very few data in ECC directory). Statistics are derived here on non-zero values
only.
Table 6: Distribution of off mode, standby, thermostat-off and crankcase power for the 0-6 kW and 6-12 kW cooling capacity ranges, crankcase values in italic are highly uncertain because of a very low number of declared values and probably not representative, adapted from ECC directory
0-6 kW 6-12 kW
Off
mode
power
(W)
Standby
power
(W)
Thermostat-
off power (W)
Crankcase
power (W)
Off
mode
power
(W)
Standby
power
(W)
Thermostat-
off power (W)
Crankcase
power (W)
Min 0.4 0.4 2.2 0.0 0.4 0.4 2.0 0.0
25%
quartile 2.0 2.0 10.0 15.0 8.0 7.0 13.0 6.0
Median 6.0 6.0 18.0 19.0 12.0 12.0 35.0 19.0
75%
quartile 10.0 10.0 30.0 23.0 16.0 16.0 63.0 25.0
Max 20.9 20.9 80.0 41.3 40.0 40.0 188.0 42.7
According EN145825:2016 standard, the "crankcase heater operates, when the
compressor is off and the outdoor temperature is lower than a given value". In addition,
the measurement for reversible units is done at 20 °C. This suggests that worst units stop
crankcase operation above 20 °C or have no temperature control, while best units have
temperature control lower than 20 °C, and hence have 0 W power in this mode.
Some of the product descriptions were sent by manufacturers in this review study,
stakeholders indicated two sets of values for crankcase heater power, respectively
measured in test condition D in heating mode (12 °C outdoor) and cooling mode (20 °C
outdoor). Amongst these units, standard performance ones have crankcase starting
temperature between 12 and 20 and consequently have no crankcase heater for cooling
mode operation (following EN14825 calculation) but do have crankcase consumption at 12
°C. On the other hand, many units have 0 W crankcase heater values, which at the moment
are measured at 20 °C. But the difference is not representative as the control could just
start the operation below 19.9 °C. Thus, it tends to confirm it is necessary to refine the
inclusion of crankcase heater consumption by requiring 2 distinct crankcase power values,
one for heating and one for cooling in (EU) regulation 206/2012 (see Task 3 for more
detail).
Estimate of low power mode values has to be adapted for the average products in order to
fit with the overall base case parameters later. To that purpose, the SEERon/SEER is used
as this ratio is relatively constant all over the efficiency distributions around the existing
average products:
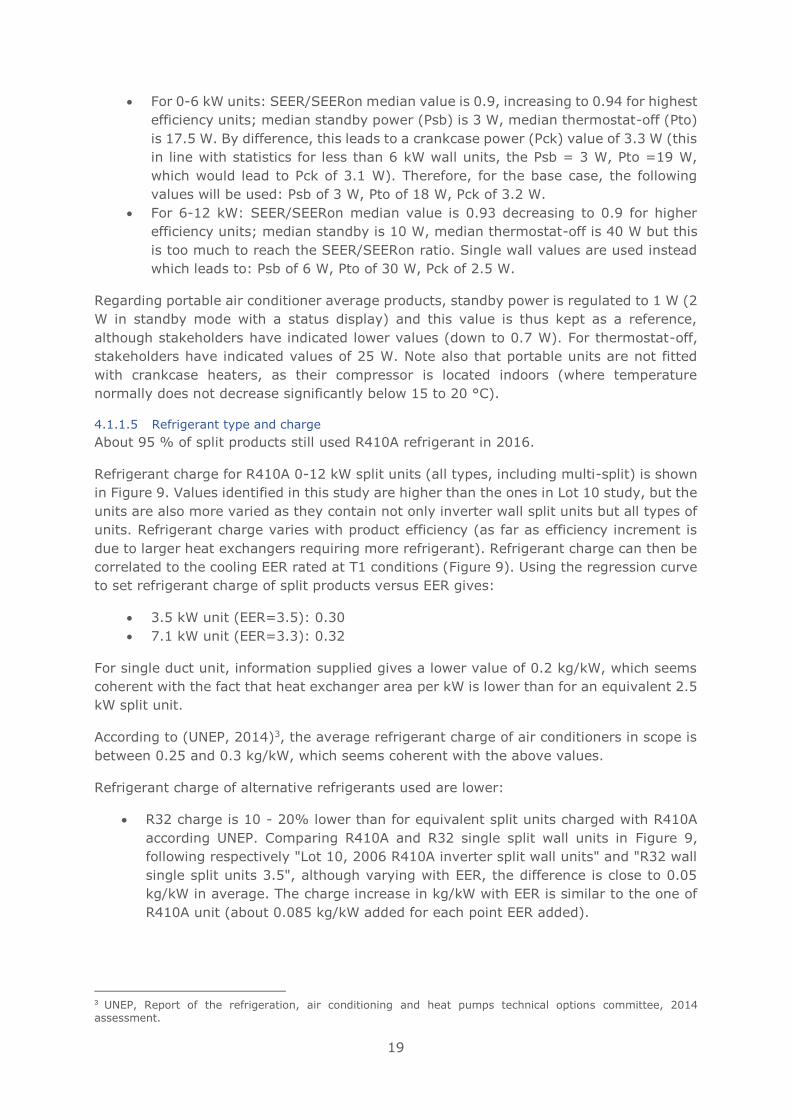
19
• For 0-6 kW units: SEER/SEERon median value is 0.9, increasing to 0.94 for highest
efficiency units; median standby power (Psb) is 3 W, median thermostat-off (Pto)
is 17.5 W. By difference, this leads to a crankcase power (Pck) value of 3.3 W (this
in line with statistics for less than 6 kW wall units, the Psb = 3 W, Pto =19 W,
which would lead to Pck of 3.1 W). Therefore, for the base case, the following
values will be used: Psb of 3 W, Pto of 18 W, Pck of 3.2 W.
• For 6-12 kW: SEER/SEERon median value is 0.93 decreasing to 0.9 for higher
efficiency units; median standby is 10 W, median thermostat-off is 40 W but this
is too much to reach the SEER/SEERon ratio. Single wall values are used instead
which leads to: Psb of 6 W, Pto of 30 W, Pck of 2.5 W.
Regarding portable air conditioner average products, standby power is regulated to 1 W (2
W in standby mode with a status display) and this value is thus kept as a reference,
although stakeholders have indicated lower values (down to 0.7 W). For thermostat-off,
stakeholders have indicated values of 25 W. Note also that portable units are not fitted
with crankcase heaters, as their compressor is located indoors (where temperature
normally does not decrease significantly below 15 to 20 °C).
4.1.1.5 Refrigerant type and charge
About 95 % of split products still used R410A refrigerant in 2016.
Refrigerant charge for R410A 0-12 kW split units (all types, including multi-split) is shown
in Figure 9. Values identified in this study are higher than the ones in Lot 10 study, but the
units are also more varied as they contain not only inverter wall split units but all types of
units. Refrigerant charge varies with product efficiency (as far as efficiency increment is
due to larger heat exchangers requiring more refrigerant). Refrigerant charge can then be
correlated to the cooling EER rated at T1 conditions (Figure 9). Using the regression curve
to set refrigerant charge of split products versus EER gives:
• 3.5 kW unit (EER=3.5): 0.30
• 7.1 kW unit (EER=3.3): 0.32
For single duct unit, information supplied gives a lower value of 0.2 kg/kW, which seems
coherent with the fact that heat exchanger area per kW is lower than for an equivalent 2.5
kW split unit.
According to (UNEP, 2014)3, the average refrigerant charge of air conditioners in scope is
between 0.25 and 0.3 kg/kW, which seems coherent with the above values.
Refrigerant charge of alternative refrigerants used are lower:
• R32 charge is 10 - 20% lower than for equivalent split units charged with R410A
according UNEP. Comparing R410A and R32 single split wall units in Figure 9,
following respectively "Lot 10, 2006 R410A inverter split wall units" and "R32 wall
single split units 3.5", although varying with EER, the difference is close to 0.05
kg/kW in average. The charge increase in kg/kW with EER is similar to the one of
R410A unit (about 0.085 kg/kW added for each point EER added).
3 UNEP, Report of the refrigeration, air conditioning and heat pumps technical options committee, 2014 assessment.
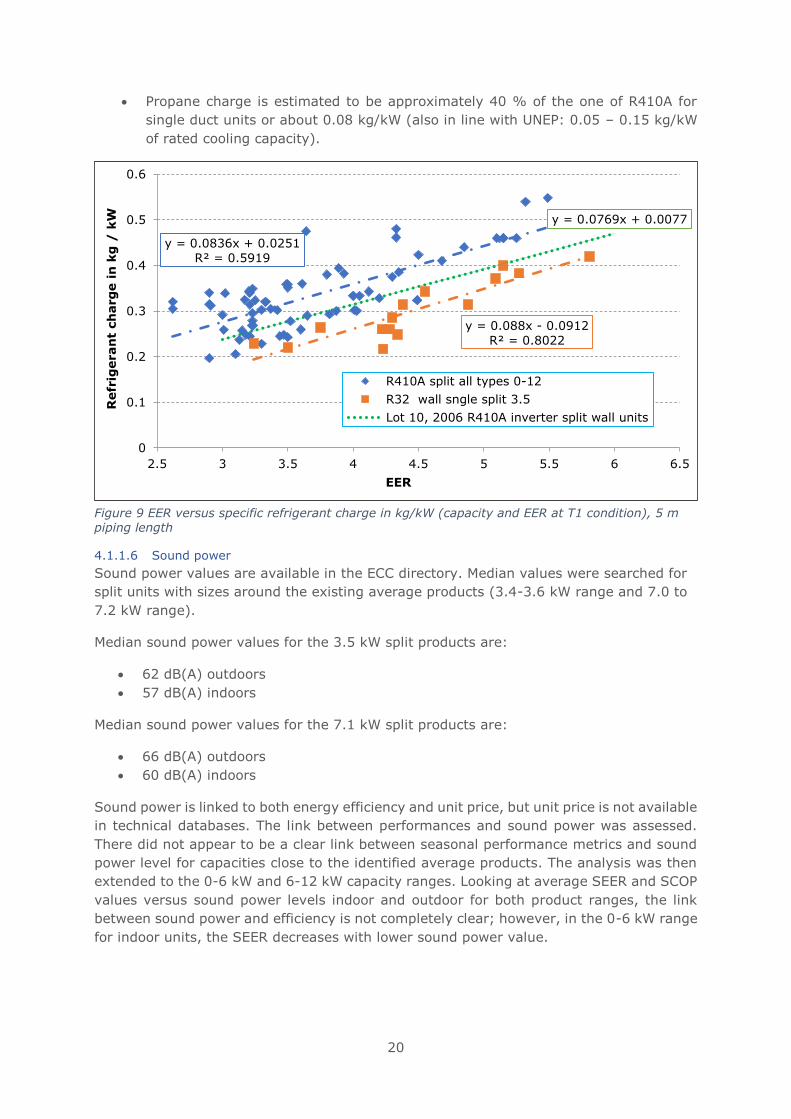
20
• Propane charge is estimated to be approximately 40 % of the one of R410A for
single duct units or about 0.08 kg/kW (also in line with UNEP: 0.05 – 0.15 kg/kW
of rated cooling capacity).
Figure 9 EER versus specific refrigerant charge in kg/kW (capacity and EER at T1 condition), 5 m piping length
4.1.1.6 Sound power
Sound power values are available in the ECC directory. Median values were searched for
split units with sizes around the existing average products (3.4-3.6 kW range and 7.0 to
7.2 kW range).
Median sound power values for the 3.5 kW split products are:
• 62 dB(A) outdoors
• 57 dB(A) indoors
Median sound power values for the 7.1 kW split products are:
• 66 dB(A) outdoors
• 60 dB(A) indoors
Sound power is linked to both energy efficiency and unit price, but unit price is not available
in technical databases. The link between performances and sound power was assessed.
There did not appear to be a clear link between seasonal performance metrics and sound
power level for capacities close to the identified average products. The analysis was then
extended to the 0-6 kW and 6-12 kW capacity ranges. Looking at average SEER and SCOP
values versus sound power levels indoor and outdoor for both product ranges, the link
between sound power and efficiency is not completely clear; however, in the 0-6 kW range
for indoor units, the SEER decreases with lower sound power value.
y = 0.0836x + 0.0251
R² = 0.5919
y = 0.088x - 0.0912
R² = 0.8022
y = 0.0769x + 0.0077
0
0.1
0.2
0.3
0.4
0.5
0.6
2.5 3 3.5 4 4.5 5 5.5 6 6.5
Refr
igeran
t ch
arg
e i
n k
g /
kW
EER
R410A split all types 0-12
R32 wall sngle split 3.5
Lot 10, 2006 R410A inverter split wall units
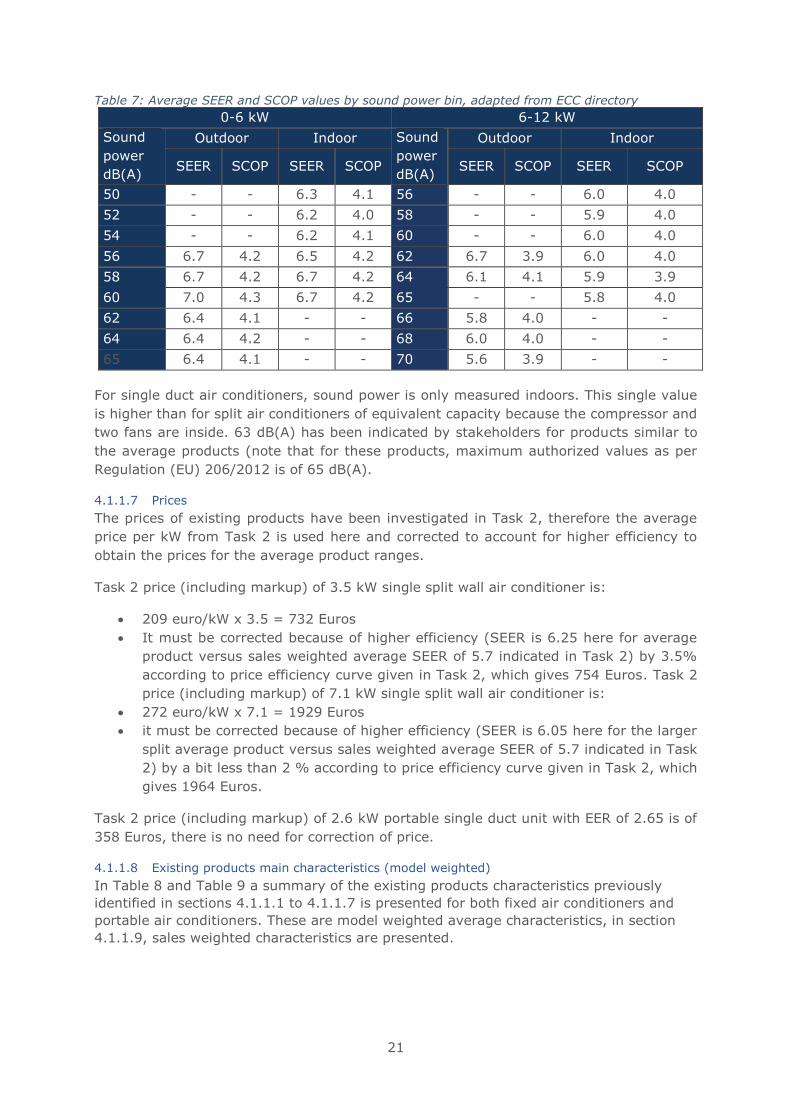
21
Table 7: Average SEER and SCOP values by sound power bin, adapted from ECC directory
0-6 kW 6-12 kW
Sound
power
dB(A)
Outdoor Indoor Sound
power
dB(A)
Outdoor Indoor
SEER SCOP SEER SCOP SEER SCOP SEER SCOP
50 - - 6.3 4.1 56 - - 6.0 4.0
52 - - 6.2 4.0 58 - - 5.9 4.0
54 - - 6.2 4.1 60 - - 6.0 4.0
56 6.7 4.2 6.5 4.2 62 6.7 3.9 6.0 4.0
58 6.7 4.2 6.7 4.2 64 6.1 4.1 5.9 3.9
60 7.0 4.3 6.7 4.2 65 - - 5.8 4.0
62 6.4 4.1 - - 66 5.8 4.0 - -
64 6.4 4.2 - - 68 6.0 4.0 - -
65 6.4 4.1 - - 70 5.6 3.9 - -
For single duct air conditioners, sound power is only measured indoors. This single value
is higher than for split air conditioners of equivalent capacity because the compressor and
two fans are inside. 63 dB(A) has been indicated by stakeholders for products similar to
the average products (note that for these products, maximum authorized values as per
Regulation (EU) 206/2012 is of 65 dB(A).
4.1.1.7 Prices
The prices of existing products have been investigated in Task 2, therefore the average
price per kW from Task 2 is used here and corrected to account for higher efficiency to
obtain the prices for the average product ranges.
Task 2 price (including markup) of 3.5 kW single split wall air conditioner is:
• 209 euro/kW x 3.5 = 732 Euros
• It must be corrected because of higher efficiency (SEER is 6.25 here for average
product versus sales weighted average SEER of 5.7 indicated in Task 2) by 3.5%
according to price efficiency curve given in Task 2, which gives 754 Euros. Task 2
price (including markup) of 7.1 kW single split wall air conditioner is:
• 272 euro/kW x 7.1 = 1929 Euros
• it must be corrected because of higher efficiency (SEER is 6.05 here for the larger
split average product versus sales weighted average SEER of 5.7 indicated in Task
2) by a bit less than 2 % according to price efficiency curve given in Task 2, which
gives 1964 Euros.
Task 2 price (including markup) of 2.6 kW portable single duct unit with EER of 2.65 is of
358 Euros, there is no need for correction of price.
4.1.1.8 Existing products main characteristics (model weighted)
In Table 8 and Table 9 a summary of the existing products characteristics previously
identified in sections 4.1.1.1 to 4.1.1.7 is presented for both fixed air conditioners and
portable air conditioners. These are model weighted average characteristics, in section
4.1.1.9, sales weighted characteristics are presented.
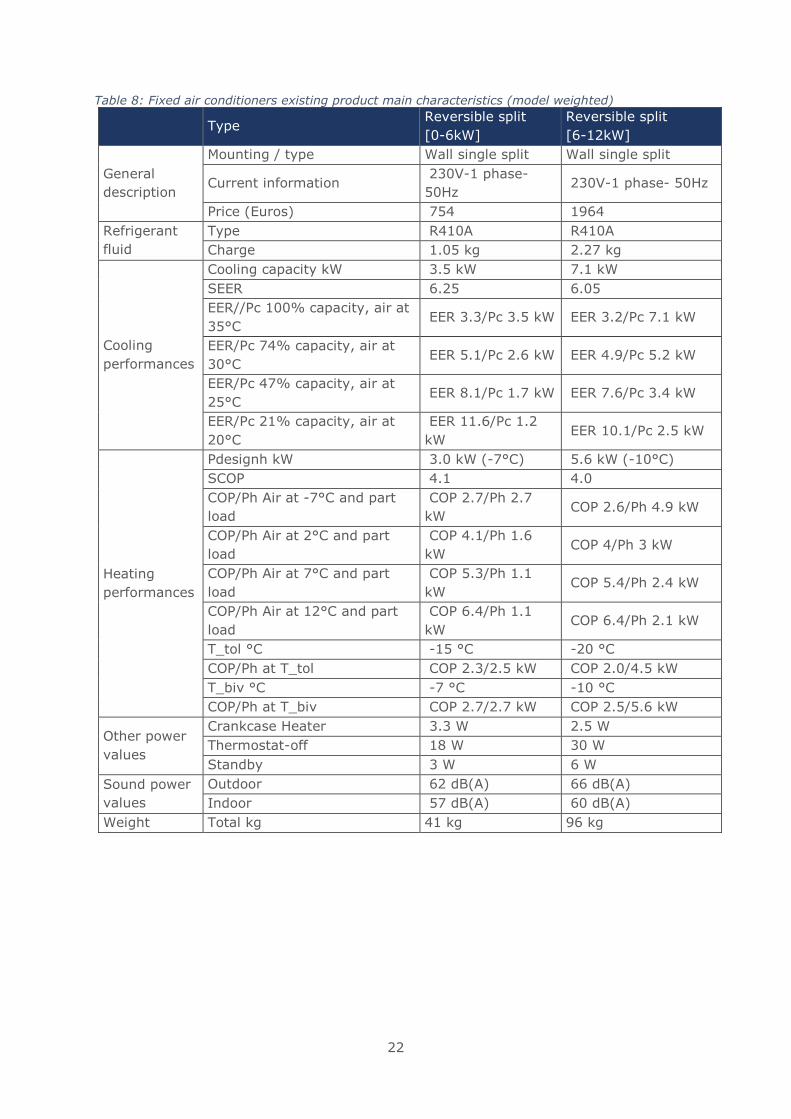
22
Table 8: Fixed air conditioners existing product main characteristics (model weighted)
Type
Reversible split
[0-6kW]
Reversible split
[6-12kW]
General
description
Mounting / type Wall single split Wall single split
Current information 230V-1 phase-
50Hz 230V-1 phase- 50Hz
Price (Euros) 754 1964
Refrigerant
fluid
Type R410A R410A
Charge 1.05 kg 2.27 kg
Cooling
performances
Cooling capacity kW 3.5 kW 7.1 kW
SEER 6.25 6.05
EER//Pc 100% capacity, air at
35°C EER 3.3/Pc 3.5 kW EER 3.2/Pc 7.1 kW
EER/Pc 74% capacity, air at
30°C EER 5.1/Pc 2.6 kW EER 4.9/Pc 5.2 kW
EER/Pc 47% capacity, air at
25°C EER 8.1/Pc 1.7 kW EER 7.6/Pc 3.4 kW
EER/Pc 21% capacity, air at
20°C
EER 11.6/Pc 1.2
kW EER 10.1/Pc 2.5 kW
Heating
performances
Pdesignh kW 3.0 kW (-7°C) 5.6 kW (-10°C)
SCOP 4.1 4.0
COP/Ph Air at -7°C and part
load
COP 2.7/Ph 2.7
kW COP 2.6/Ph 4.9 kW
COP/Ph Air at 2°C and part
load
COP 4.1/Ph 1.6
kW COP 4/Ph 3 kW
COP/Ph Air at 7°C and part
load
COP 5.3/Ph 1.1
kW COP 5.4/Ph 2.4 kW
COP/Ph Air at 12°C and part
load
COP 6.4/Ph 1.1
kW COP 6.4/Ph 2.1 kW
T_tol °C -15 °C -20 °C
COP/Ph at T_tol COP 2.3/2.5 kW COP 2.0/4.5 kW
T_biv °C -7 °C -10 °C
COP/Ph at T_biv COP 2.7/2.7 kW COP 2.5/5.6 kW
Other power
values
Crankcase Heater 3.3 W 2.5 W
Thermostat-off 18 W 30 W
Standby 3 W 6 W
Sound power
values
Outdoor 62 dB(A) 66 dB(A)
Indoor 57 dB(A) 60 dB(A)
Weight Total kg 41 kg 96 kg
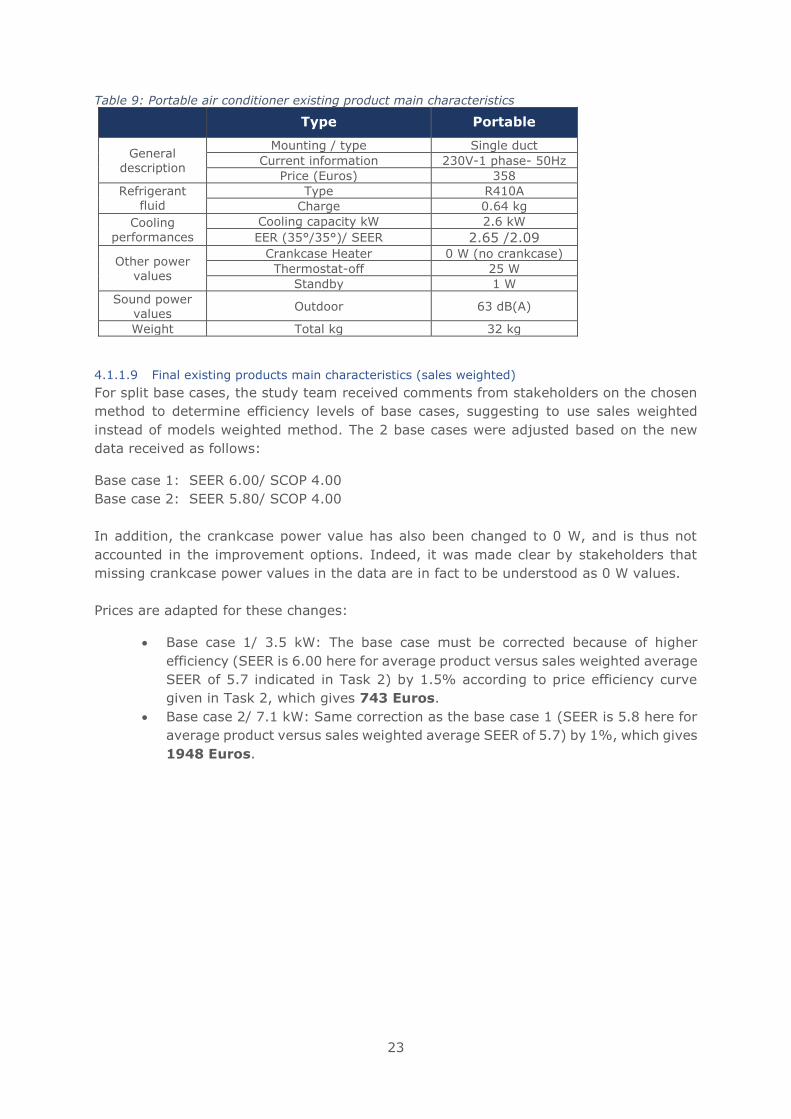
23
Table 9: Portable air conditioner existing product main characteristics
Type Portable
General description
Mounting / type Single duct
Current information 230V-1 phase- 50Hz
Price (Euros) 358
Refrigerant fluid
Type R410A
Charge 0.64 kg
Cooling performances
Cooling capacity kW 2.6 kW
EER (35°/35°)/ SEER 2.65 /2.09
Other power values
Crankcase Heater 0 W (no crankcase)
Thermostat-off 25 W
Standby 1 W
Sound power values
Outdoor 63 dB(A)
Weight Total kg 32 kg
4.1.1.9 Final existing products main characteristics (sales weighted)
For split base cases, the study team received comments from stakeholders on the chosen
method to determine efficiency levels of base cases, suggesting to use sales weighted
instead of models weighted method. The 2 base cases were adjusted based on the new
data received as follows:
Base case 1: SEER 6.00/ SCOP 4.00
Base case 2: SEER 5.80/ SCOP 4.00
In addition, the crankcase power value has also been changed to 0 W, and is thus not
accounted in the improvement options. Indeed, it was made clear by stakeholders that
missing crankcase power values in the data are in fact to be understood as 0 W values.
Prices are adapted for these changes:
• Base case 1/ 3.5 kW: The base case must be corrected because of higher
efficiency (SEER is 6.00 here for average product versus sales weighted average
SEER of 5.7 indicated in Task 2) by 1.5% according to price efficiency curve
given in Task 2, which gives 743 Euros.
• Base case 2/ 7.1 kW: Same correction as the base case 1 (SEER is 5.8 here for
average product versus sales weighted average SEER of 5.7) by 1%, which gives
1948 Euros.
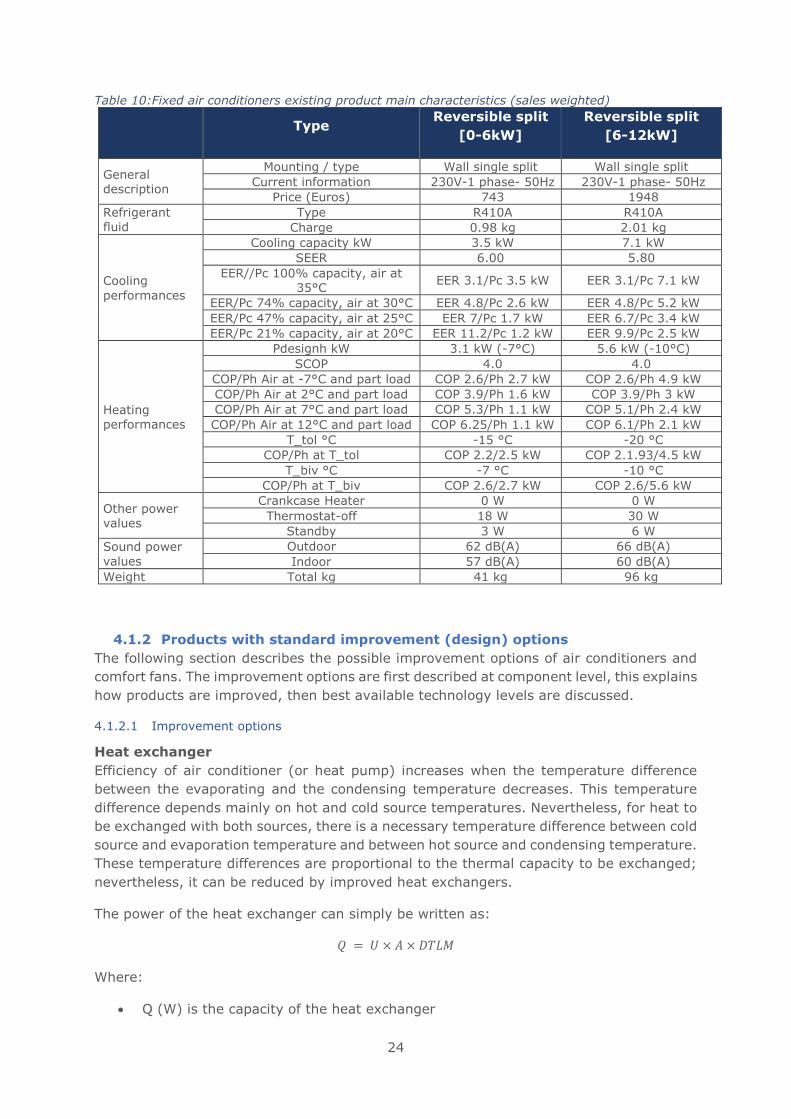
24
Table 10:Fixed air conditioners existing product main characteristics (sales weighted)
Type Reversible split
[0-6kW]
Reversible split
[6-12kW]
General description
Mounting / type Wall single split Wall single split
Current information 230V-1 phase- 50Hz 230V-1 phase- 50Hz
Price (Euros) 743 1948
Refrigerant fluid
Type R410A R410A
Charge 0.98 kg 2.01 kg
Cooling
performances
Cooling capacity kW 3.5 kW 7.1 kW
SEER 6.00 5.80
EER//Pc 100% capacity, air at 35°C
EER 3.1/Pc 3.5 kW EER 3.1/Pc 7.1 kW
EER/Pc 74% capacity, air at 30°C EER 4.8/Pc 2.6 kW EER 4.8/Pc 5.2 kW
EER/Pc 47% capacity, air at 25°C EER 7/Pc 1.7 kW EER 6.7/Pc 3.4 kW
EER/Pc 21% capacity, air at 20°C EER 11.2/Pc 1.2 kW EER 9.9/Pc 2.5 kW
Heating performances
Pdesignh kW 3.1 kW (-7°C) 5.6 kW (-10°C)
SCOP 4.0 4.0
COP/Ph Air at -7°C and part load COP 2.6/Ph 2.7 kW COP 2.6/Ph 4.9 kW
COP/Ph Air at 2°C and part load COP 3.9/Ph 1.6 kW COP 3.9/Ph 3 kW
COP/Ph Air at 7°C and part load COP 5.3/Ph 1.1 kW COP 5.1/Ph 2.4 kW
COP/Ph Air at 12°C and part load COP 6.25/Ph 1.1 kW COP 6.1/Ph 2.1 kW
T_tol °C -15 °C -20 °C
COP/Ph at T_tol COP 2.2/2.5 kW COP 2.1.93/4.5 kW
T_biv °C -7 °C -10 °C
COP/Ph at T_biv COP 2.6/2.7 kW COP 2.6/5.6 kW
Other power values
Crankcase Heater 0 W 0 W
Thermostat-off 18 W 30 W
Standby 3 W 6 W
Sound power
values
Outdoor 62 dB(A) 66 dB(A)
Indoor 57 dB(A) 60 dB(A)
Weight Total kg 41 kg 96 kg
4.1.2 Products with standard improvement (design) options
The following section describes the possible improvement options of air conditioners and
comfort fans. The improvement options are first described at component level, this explains
how products are improved, then best available technology levels are discussed.
4.1.2.1 Improvement options
Heat exchanger
Efficiency of air conditioner (or heat pump) increases when the temperature difference
between the evaporating and the condensing temperature decreases. This temperature
difference depends mainly on hot and cold source temperatures. Nevertheless, for heat to
be exchanged with both sources, there is a necessary temperature difference between cold
source and evaporation temperature and between hot source and condensing temperature.
These temperature differences are proportional to the thermal capacity to be exchanged;
nevertheless, it can be reduced by improved heat exchangers.
The power of the heat exchanger can simply be written as:
𝑄 = 𝑈 × 𝐴 × 𝐷𝑇𝐿𝑀
Where:
• Q (W) is the capacity of the heat exchanger
25
• U (W/m²/K) is the global heat transfer coefficient (accounting for air and refrigerant
side thermal convective resistances) and divided by the total heat exchange area
• A (m²) the total heat exchange area (air side)
• DTLM the logarithmic mean temperature difference between air and refrigerant
Efficiency of the air conditioner in heating and cooling modes is directly a function of the
compression ratio, the pressure ratio between the high and low-pressure sides. The lower
the difference the higher the efficiency. With inverter technology, refrigerant flow rate is
reduced at part load. This decreases the temperature difference between air streams and
refrigerant temperatures and thus the pressure ratio and the work to be supplied by the
compressor. When reducing the refrigerant flow rate by half, there is twice as less capacity
to exchange through the heat exchanger and the temperature difference between the air
stream and the refrigerant fluid decreases. To get about this level of efficiency at rated
capacity, global heat transfer coefficients at both heat exchangers (UA) have to be
increased by a factor of 2. The simpler way to do it is to oversize both heat exchangers
and to increase air flow rates consequently. Strategies developed by manufacturers vary
depending on the technologies used to reach highest efficient EER and COP. According to
the Preparatory study, increasing both heat exchanger UA values by a factor 2 without
increasing the air flow rate still leads to about 40 % savings. Increasing heat exchange
area at both heat exchangers is the main improvement option available to all
manufacturers. There are however physical and cost limitations to oversizing heat
exchangers. For instance, portable air conditioners compete on size for the same capacity,
cassette air conditioner indoor units have to fit in standard sizes of ceiling panels,
suspended ceiling indoor units cannot be too heavy (as they have to be suspended).
Increasing the heat transfer performance
The resistance to heat exchange between refrigerant fluid and air can be decreased by
improving refrigerant tube design or fin design or increase the fin density. For refrigerant
tubes, high quality copper tubes with internally grooved design to maximize heat exchange
intensity is used, and conduction and convection are very high already.
Still it is possible to optimize tube diameter. Refrigerant tube typical sizes vary between
inside tube diameter of 4 mm and 9 mm depending on unit size, efficiency and heat
exchanger type. High efficient units have lower internal diameter. This allows for higher
refrigerant heat exchange coefficients and then to use less copper quantity (cost
reduction), but also implies higher pressure losses. Best available technologies then use
two different tube sizes in the same heat exchanger to optimize heat transfer, pressure
loss and cost (e.g. 4 and 6 mm instead of 5 mm for best 3.5 kW units).
Regarding the air side heat transfer, no recent evolutions on the fin pattern could be
identified. Best available units still use complex fin designs of slit or grooved type. Fin
density is limited for reversible units because of frost and in both modes by pressure losses
and the air side which imply larger fan power consumption.
Further improvement could come from the adoption of microchannel heat exchangers;
these are made of flat tubes with rectangular cross section with dimensions of 1 to 3 mm.
Fins pass between the tubes and are brazed to the tubes. The resulting microchannel coil
transfers more heat per unit of face area than present heat exchanger of comparable
capacity. According to stakeholders, microchannel heat exchangers can improve SEER
(SCOP) by 3-5% compared with tube and fin Cu/Al at equivalent heat exchanger size
because of higher heat transfer area for the same outdoor unit size and equal flow rate;
this figure is coherent (right order of magnitude) with the 20 % UA performance increase
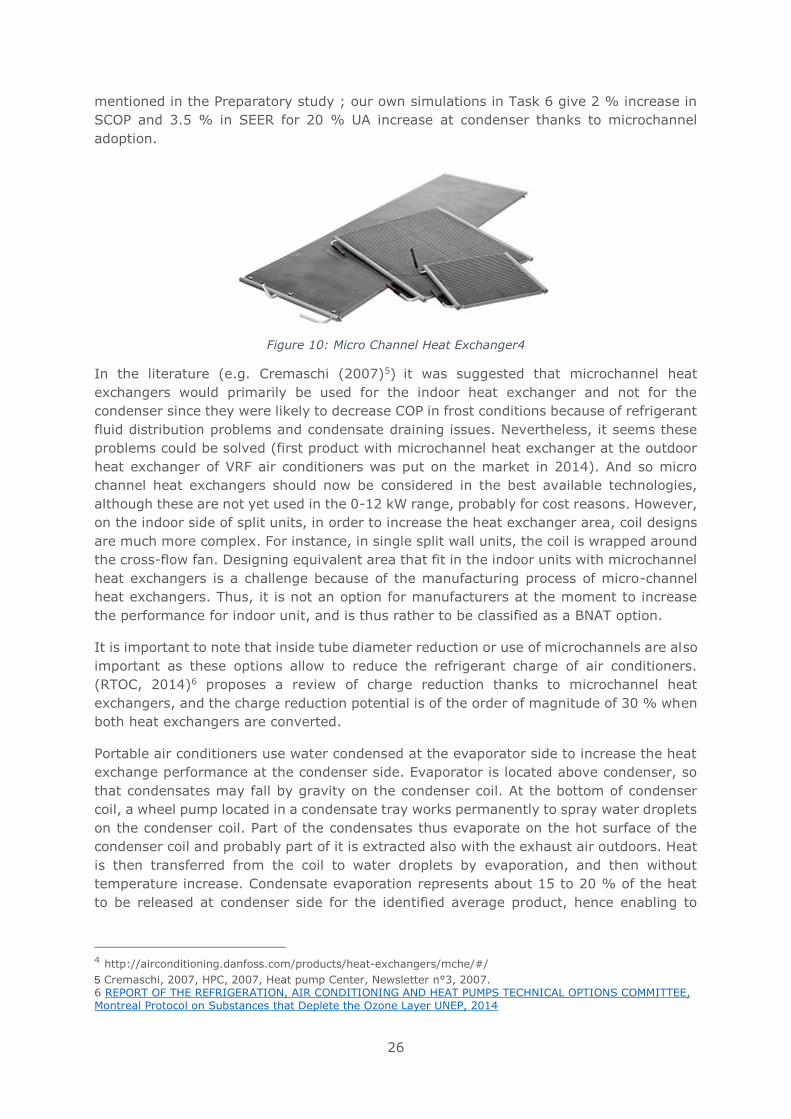
26
mentioned in the Preparatory study ; our own simulations in Task 6 give 2 % increase in
SCOP and 3.5 % in SEER for 20 % UA increase at condenser thanks to microchannel
adoption.
Figure 10: Micro Channel Heat Exchanger4
In the literature (e.g. Cremaschi (2007)5) it was suggested that microchannel heat
exchangers would primarily be used for the indoor heat exchanger and not for the
condenser since they were likely to decrease COP in frost conditions because of refrigerant
fluid distribution problems and condensate draining issues. Nevertheless, it seems these
problems could be solved (first product with microchannel heat exchanger at the outdoor
heat exchanger of VRF air conditioners was put on the market in 2014). And so micro
channel heat exchangers should now be considered in the best available technologies,
although these are not yet used in the 0-12 kW range, probably for cost reasons. However,
on the indoor side of split units, in order to increase the heat exchanger area, coil designs
are much more complex. For instance, in single split wall units, the coil is wrapped around
the cross-flow fan. Designing equivalent area that fit in the indoor units with microchannel
heat exchangers is a challenge because of the manufacturing process of micro-channel
heat exchangers. Thus, it is not an option for manufacturers at the moment to increase
the performance for indoor unit, and is thus rather to be classified as a BNAT option.
It is important to note that inside tube diameter reduction or use of microchannels are also
important as these options allow to reduce the refrigerant charge of air conditioners.
(RTOC, 2014)6 proposes a review of charge reduction thanks to microchannel heat
exchangers, and the charge reduction potential is of the order of magnitude of 30 % when
both heat exchangers are converted.
Portable air conditioners use water condensed at the evaporator side to increase the heat
exchange performance at the condenser side. Evaporator is located above condenser, so
that condensates may fall by gravity on the condenser coil. At the bottom of condenser
coil, a wheel pump located in a condensate tray works permanently to spray water droplets
on the condenser coil. Part of the condensates thus evaporate on the hot surface of the
condenser coil and probably part of it is extracted also with the exhaust air outdoors. Heat
is then transferred from the coil to water droplets by evaporation, and then without
temperature increase. Condensate evaporation represents about 15 to 20 % of the heat
to be released at condenser side for the identified average product, hence enabling to
4 http://airconditioning.danfoss.com/products/heat-exchangers/mche/#/ 5 Cremaschi, 2007, HPC, 2007, Heat pump Center, Newsletter n°3, 2007. 6 REPORT OF THE REFRIGERATION, AIR CONDITIONING AND HEAT PUMPS TECHNICAL OPTIONS COMMITTEE, Montreal Protocol on Substances that Deplete the Ozone Layer UNEP, 2014
27
reduce the size of the condenser of this same amount. This value varies with the SHR ratio
of the unit, and then as a function of air flow rate and evaporation temperature.
For portable air conditioners, coil design is simpler than in indoor units of split systems
(standard horizontal copper tubes with vertical aluminium fins) and so microchannel heat
exchangers could be an interesting option for both heat exchangers. Single duct
manufacturers have reported however disappointing performances at the condenser due
to refrigerant fluid distribution issues and to the specific requirement of proper condensate
evaporation at condenser side for this coil. Hence for portable, it seems water condensation
at evaporator and water evaporation at condenser side makes it difficult to use
microchannel heat exchangers for now.
Compressor
The compressor is the component that consumes the most energy in an air conditioner
system. Its energy consumption depends directly on the high and low pressure which are
fixed by heat exchangers; still, at given low- and high-pressure conditions, the compressor
efficiency is crucial for the overall system efficiency. Once the temperature difference
between evaporation and condensation temperatures has been fixed by the heat exchanger
designs, this directly gives evaporating and condensing pressures and the pressure ratio
(ratio of the condensing to the evaporating pressure). Delivering a given cooling capacity
in these conditions requires a particular refrigerant mass flow. This set of conditions
enables to choose a compressor, and it can be more or less efficient to deliver this flow
against the operating pressure ratio. Compressor efficiency is defined by its efficiency value
at standard operating conditions, which enables to compare efficiency for one single
performance point. However, in seasonal performance metrics, the outdoor temperature
and capacity to be delivered vary, which in turn influences the pressure ratio and the
compressor efficiency.
Air conditioning compressor technologies have evolved over the past several years.
Regulatory efforts worldwide (introduction of seasonal metrics in largest markets) have
contributed to the phase out of single speed compressors and introduction of higher
efficiency variable speed DC compressors in split air conditioners. As reported in Task 2,
DC inverter compressor penetration is now close to 100 % for split air conditioners in
Europe. For these compressors, required system capacity can be matched by adjusting the
frequency and then the mass flow for a given temperature difference between evaporating
and condensing temperatures. This also affects efficiency.
Units in the scope only use rotary (also named rotary vane) compressors. Information on
compressor performances of these products is limited, despite more than 100 million split
units fitted with rotary vane compressor being sold each year. Information can be found
at standard rating conditions (AHRI standard conditions) for some compressor
manufacturers, with fragmentary information only to explain the differences in
performances. Air conditioner manufacturer also supplied rating compressor performance
in standard conditions or at cooling/heating rating points. Non nominal performance values
could be found for single speed AC compressors but not for DC inverter rotary compressors
and information on the impact of frequency variation on performances is also limited.
In the preparatory study, the standard AHRI EER (Efficiency in standard AHRI conditions,
named COP when in SI units in US standards) was evaluated to be of 2.8 for AC single
speed rotary compressor. Several options were simulated with best DC inverter rotary
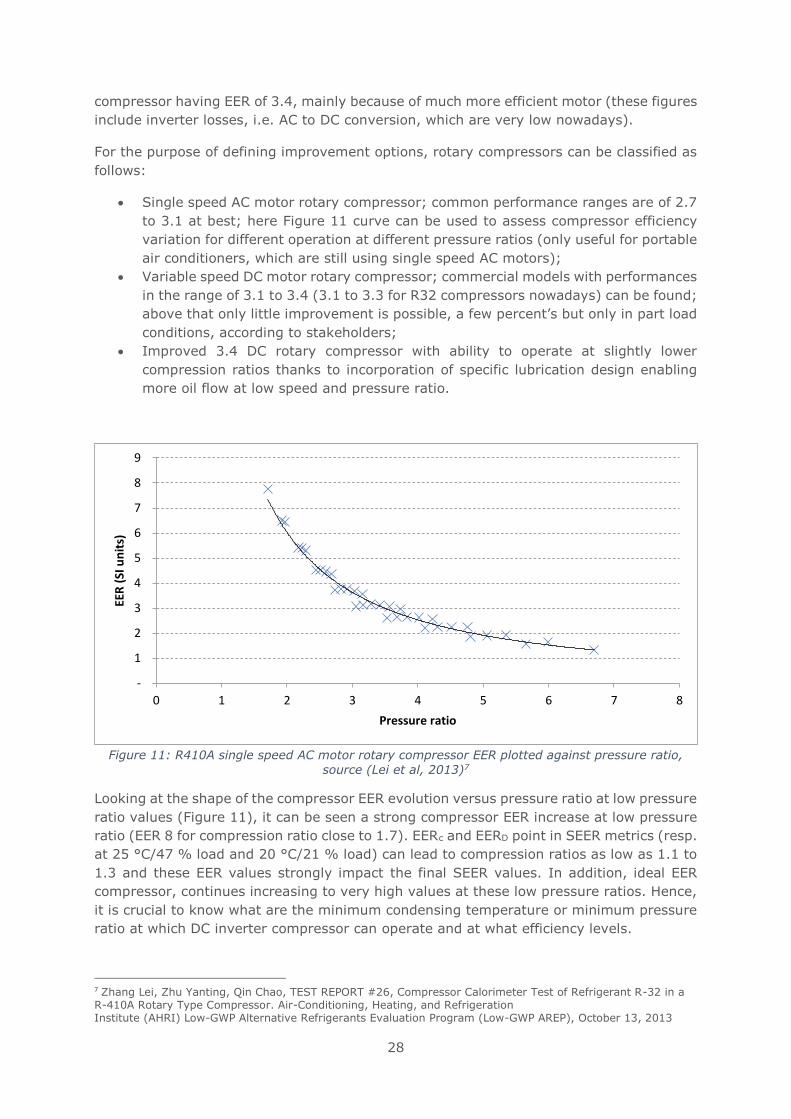
28
compressor having EER of 3.4, mainly because of much more efficient motor (these figures
include inverter losses, i.e. AC to DC conversion, which are very low nowadays).
For the purpose of defining improvement options, rotary compressors can be classified as
follows:
• Single speed AC motor rotary compressor; common performance ranges are of 2.7
to 3.1 at best; here Figure 11 curve can be used to assess compressor efficiency
variation for different operation at different pressure ratios (only useful for portable
air conditioners, which are still using single speed AC motors);
• Variable speed DC motor rotary compressor; commercial models with performances
in the range of 3.1 to 3.4 (3.1 to 3.3 for R32 compressors nowadays) can be found;
above that only little improvement is possible, a few percent’s but only in part load
conditions, according to stakeholders;
• Improved 3.4 DC rotary compressor with ability to operate at slightly lower
compression ratios thanks to incorporation of specific lubrication design enabling
more oil flow at low speed and pressure ratio.
Figure 11: R410A single speed AC motor rotary compressor EER plotted against pressure ratio,
source (Lei et al, 2013)7
Looking at the shape of the compressor EER evolution versus pressure ratio at low pressure
ratio values (Figure 11), it can be seen a strong compressor EER increase at low pressure
ratio (EER 8 for compression ratio close to 1.7). EERc and EERD point in SEER metrics (resp.
at 25 °C/47 % load and 20 °C/21 % load) can lead to compression ratios as low as 1.1 to
1.3 and these EER values strongly impact the final SEER values. In addition, ideal EER
compressor, continues increasing to very high values at these low pressure ratios. Hence,
it is crucial to know what are the minimum condensing temperature or minimum pressure
ratio at which DC inverter compressor can operate and at what efficiency levels.
7 Zhang Lei, Zhu Yanting, Qin Chao, TEST REPORT #26, Compressor Calorimeter Test of Refrigerant R-32 in a R-410A Rotary Type Compressor. Air-Conditioning, Heating, and Refrigeration Institute (AHRI) Low-GWP Alternative Refrigerants Evaluation Program (Low-GWP AREP), October 13, 2013
-
1
2
3
4
5
6
7
8
9
0 1 2 3 4 5 6 7 8
EER
(SI
un
its)
Pressure ratio
29
This can only be done by the study team on the basis of reverse engineering from
performance and technical characteristics of best units available to the study team. A first
evaluation (to be refined in Task 6) is that minimum operating compression ratio can go
down to about 1.1 for best twin rotary DC inverter compressor versus typically 1.2 to 1.3
for standard DC inverter rotary compressors.
According to stakeholders, it is difficult nowadays to find good DC inverter compressor for
hydrocarbon units. Hence, for portable units, present products cannot benefit of the
performance gain of using both propane (higher EER by 5 to 10 %) and DC inverter
compressor. This will probably be possible in the near future, but that depends on the
general trend to adopt hydrocarbons as refrigerant fluid in Europe or in other large AC
countries.
As for non-nominal performances, there is little information regarding the consumption
required by the power conversion from AC to DC for DC inverter compressor. In any case,
stakeholders have indicated that improvement potential was possible, although limited to
1 W constant gain (when compressor operates).
Compressor heat losses at low ambient is thought to be significant and because most units
are reversible, compressors are fitted with elastomeric (polymer with rubber-like
properties) insulation. One option here is to recover part of this heat for heating. This may
be done through phase change material/combination of dense enough material with
refrigerant piping inside. In any case, the energy quantity recovered is thought to be low
and it is used only for short periods for space heating during defrost cycle. As defrost cycle
impact on the performances of these units is thought to be low (about 5 % loss at 2 °C on
the capacity and COP), this option is not considered here.
A supplementary option used by some manufacturers in heating mode already is
refrigerant vapor injection. At the outlet of the condenser, liquid and vapor are separated;
vapor is injected at an intermediate suction port in the compressor; liquid enters the
evaporator which allows for larger capacity to be exchanged with outdoor air. Main injection
types are with intermediate heat exchanger or with flash tank (Heo et al., 2011)8. These
technologies enable to increase the capacity at low ambient in heating mode and to
increase COP. Published values by (Heo et al., 2011) give COP gain of 10 % and heating
capacity gain of 25 % at -15 °C. SCOP benefit is however limited to 0.5 to 1 % as the gain
is mainly at low ambient which has low weight in SCOP average metrics. There is however
an economic interest if the unit is selected for heating as it enables, for the same basic
component sizes, to have larger thermodynamic capacity at low ambient and then higher
Pdesignh without increasing the resistive heating part. It is then an option of high interest
for Northern Europe.
Standby, thermostat off and crankcase power
Units with standby power down to 0.4 W are available for both split units (see section
4.1.1.2) and for portable air conditioners. For portable units, indeed DOE’s test sample9
shows standby values down to 0.46 W.
For base case 7.1 kW, the median standby value is 6 W. Adopting the best technology
gives a maximum reduction of 5.6 W. However, it might not be possible for all products
8 J. Heo, M.W. Jeong, C. Baek, Y. Kim, Comparison of the heating performance of air-source heat pumps using various types of refrigerant injection, Int. J. Refrigeration, 34 (2) (2011), pp. 444-453 9 TECHNICAL SUPPORT DOCUMENT: ENERGY EFFICIENCY PROGRAM FOR CONSUMER PRODUCTS: Residential Central Air Conditioners and Heat Pumps, US Department of energy 2016
30
to reach a 0.4 W value, such as for multi-split units or due to electromagnetic
compatibility tests etc. according to stakeholders, but usually for these products the
difference between the median and min value of standby power is higher than 5.6 W due
to the different sizes than our base cases. A standby power cut of 5.6 W is thus a
conservative view of the gains that can be reached thanks to a better design of standby
(see Table 5).
Thermostat-off consumption is the addition of the unit control power consumption plus the
fan average power over a 60 mins measurement period minus the standby power. Lowest
value for thermostat off power is of 2 W for split units currently on the market as per ECC
databases. This value leaves no place for fan consumption, and this can be reached by
using an external room temperature sensor. There are other possible design choices, like
operation at reduced fan speed of the indoor unit, or part of the time; this leads to
reductions of fan power consumptions by 1/2 to 1/3 at best.
Refrigerant charge reduction and alternative refrigerant fluid
Regarding split air conditioners, most products are still using R410A, the conversion from
R410A to R32 already started (R410A is banned in single split air conditioners from 2025
onwards), because manufacturers are already anticipating this change. So R32 is the
candidate replacement fluid for R410A. However, it may not be the long-term choice. There
has been extensive search for alternate fluids these last years and final solution to reach
low GWP (below 150) presently contemplates HFO mixtures and hydrocarbons. Recently,
Godrej developed high efficiency propane split air conditioners with DC inverter compressor
and fan in India10. In 2018, a Midea propane split unit was awarded the Blue Angel Ecolabel
in Germany11. Hydrocarbons are a potential long term solution but manufacturers need to
be convinced on its safety before engaging their liability in manufacturing such units, which
is not the case yet for most split air conditioner manufacturers in Europe.
For best split products in Europe, almost all manufacturers now offer R32 and no longer
R410A.
For portable products, propane has been used for some years already by one
manufacturer12, while other manufacturers still use R410A. At the moment, there is no
other fluid envisaged, but any replacement fluid also used for split or car air conditioning
(like R32) could also be a solution if it does not lead to large product size increase (as with
HFOs), as it guarantees to find parts to build a product (particularly compressors).
Hydrocarbons can be used to meet 2020 ban requirement for products using fluids with
GWP > 150. However, it may not be the unique solution, and it is difficult to anticipate
right now in which direction the market will go. However, it is believed that there will
probably be a mix of hydrocarbons and of mixtures based on HFO on the market.
Indoor and outdoor fans
Larger-Diameter Fan
10 http://www.godrejnxw-ac.com/ 11 https://www.businesswire.com/news/home/20180320006123/en/Midea-Launches-World%E2%80%99s-Eco-Friendly-Air-Conditioner-Certified 12 Interview with Delonghi, 2017
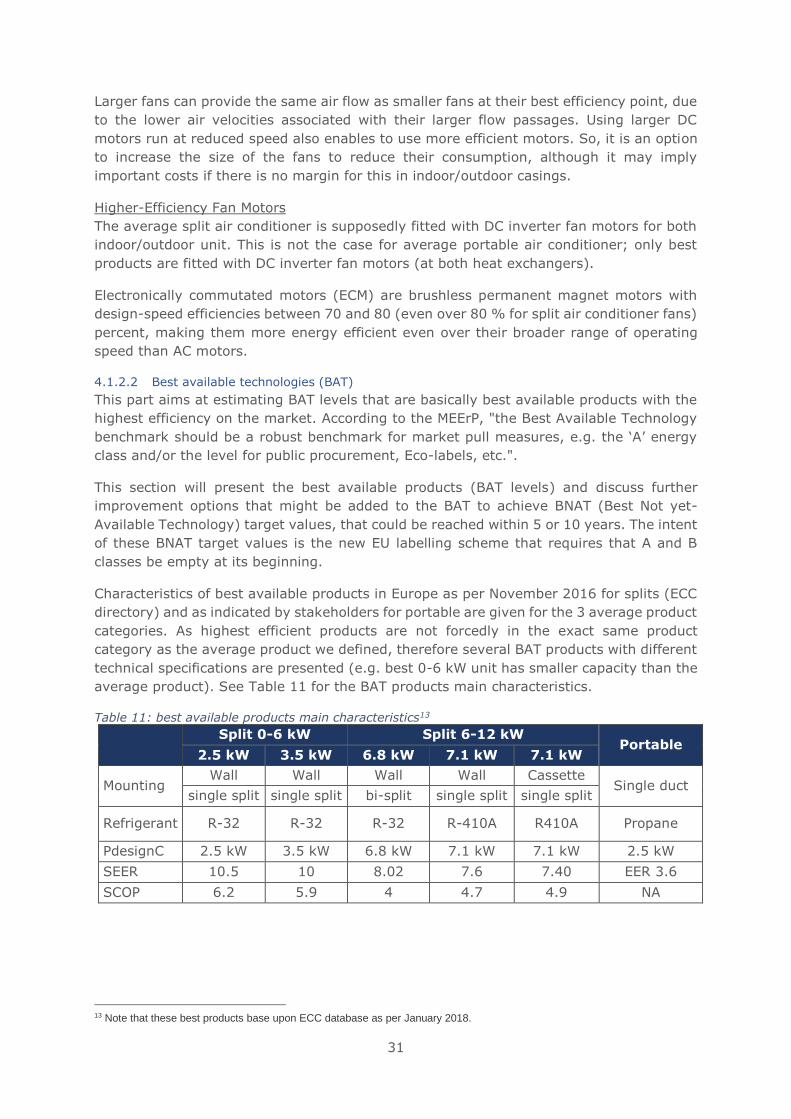
31
Larger fans can provide the same air flow as smaller fans at their best efficiency point, due
to the lower air velocities associated with their larger flow passages. Using larger DC
motors run at reduced speed also enables to use more efficient motors. So, it is an option
to increase the size of the fans to reduce their consumption, although it may imply
important costs if there is no margin for this in indoor/outdoor casings.
Higher-Efficiency Fan Motors
The average split air conditioner is supposedly fitted with DC inverter fan motors for both
indoor/outdoor unit. This is not the case for average portable air conditioner; only best
products are fitted with DC inverter fan motors (at both heat exchangers).
Electronically commutated motors (ECM) are brushless permanent magnet motors with
design-speed efficiencies between 70 and 80 (even over 80 % for split air conditioner fans)
percent, making them more energy efficient even over their broader range of operating
speed than AC motors.
4.1.2.2 Best available technologies (BAT)
This part aims at estimating BAT levels that are basically best available products with the
highest efficiency on the market. According to the MEErP, "the Best Available Technology
benchmark should be a robust benchmark for market pull measures, e.g. the ‘A’ energy
class and/or the level for public procurement, Eco-labels, etc.".
This section will present the best available products (BAT levels) and discuss further
improvement options that might be added to the BAT to achieve BNAT (Best Not yet-
Available Technology) target values, that could be reached within 5 or 10 years. The intent
of these BNAT target values is the new EU labelling scheme that requires that A and B
classes be empty at its beginning.
Characteristics of best available products in Europe as per November 2016 for splits (ECC
directory) and as indicated by stakeholders for portable are given for the 3 average product
categories. As highest efficient products are not forcedly in the exact same product
category as the average product we defined, therefore several BAT products with different
technical specifications are presented (e.g. best 0-6 kW unit has smaller capacity than the
average product). See Table 11 for the BAT products main characteristics.
Table 11: best available products main characteristics13
Split 0-6 kW Split 6-12 kW
Portable 2.5 kW 3.5 kW 6.8 kW 7.1 kW 7.1 kW
Mounting Wall Wall Wall Wall Cassette
Single duct single split single split bi-split single split single split
Refrigerant R-32 R-32 R-32 R-410A R410A Propane
PdesignC 2.5 kW 3.5 kW 6.8 kW 7.1 kW 7.1 kW 2.5 kW
SEER 10.5 10 8.02 7.6 7.40 EER 3.6
SCOP 6.2 5.9 4 4.7 4.9 NA
13 Note that these best products base upon ECC database as per January 2018.
32
0-6 kW split range
BAT level for SEER is presently of 10 (3.5 kW unit) and of 10.5 (2.5 kW unit). BAT level
for SCOP is of 5.9 (3.5 kW unit) and 6.2 (2.5 kW unit). These are real units. They have
already been designed with R32 instead of R410A.
For BNAT, SEER levels could be higher because there are more efficient units on a SEERon
basis, up to 12.2 for 2.5 kW units, but that still suffer a high contribution of standby and
thermostat-off power consumption. By altering thermostat-off value to half the value
(reduced indoor fan speed) and standby value to 0.4 W, best SEER of about 10.9 could be
reached. Note however that these more efficient units on a SEERon basis are also less
efficient in heating mode. The only left option on top would be micro channel heat
exchangers to be used at the condenser, which could still increase SEERon by maximum
3.5 %, which would push SEER BNAT value close to 11.3. It should however be14
acknowledged that there is high uncertainty on the evaluation of EERC and EERD points
and, if rotary compressor designs may decrease the minimum compression ratio above
which these compressors can operate efficiently, this can significantly increase the
maximum SEER levels that can be reached. Unfortunately, we have no information here.
BNAT SCOP level could be higher than BAT levels by 2 % using microchannel heat
exchanger at outdoor heat exchanger and thus BNAT level comes to 6.3, a value which is
believed to be more robust than the maximum SEER level because rotary compressor
efficiency at low pressure ratio has less impact than in cooling mode. Note that these levels
leave no margin for noise reduction of 3.5 kW units and only 2 to 3 dB(A) maximum for
smaller 2.5 kW units. It also means that for 4 to 6 kW units, sound power level present
requirements may prevent to reach such performance levels.
To conclude, for the 0-6 kW range:
• BAT levels are SEER 10.5 and SCOP 6.2
• BNAT levels are SEER 11.3 and SCOP 6.3
6-12 kW split range
On this capacity range, best products have SEER levels of 8 (existing bi-split wall unit and
BAT seen by stakeholders for cassette) and SCOP level of 4.9 (single split cassette unit) ;
note that highest SEER and SCOP values cannot be reached for the same unit. There is no
physical limitation to explain why wall units of 7.1 kW could not be as efficient as 3.5 kW
units. This is only probably a cost issue. However, regarding cassette, in addition to costs
there may be physical limitations (size of ceiling panels in which indoor units have to be
mounted).
To conclude, for the 6-12 kW range:
• BAT levels are SEER 8 (SCOP 4) and SCOP 4.9 (SEER 7.4)
• BNAT levels are SEER 11.3 and SCOP 6.3
Portable
Best available portable product is right over the A++ energy label class, with EER of 3.6
(at 35/35). SEER is of 2.82. For BNAT targets, it is possible to reach higher performance
levels by increasing evaporator heat exchanger size but not with propane (because of
refrigerant charge limitation), the fluid used for the best product presently available. This
33
best product uses a standard AC motor rotary compressor amongst the few available for
propane; there could be significant gains at maximum capacity (using present metrics)
and much more with the newly proposed SEER metrics.
Micro channel heat exchangers on both sides is presented as a best non-available
technology by stakeholders in this product range, although it seems to be the way forward,
as it enables both to gain heat exchanger area at same product volume and to decrease
refrigerant charge (and so to potentially further increase heat exchanger area and
efficiency as it would allow to alleviate the refrigerant charge maximum limit).
BNAT EER basing on propane unit could be higher than 3.6 (BAT level) using highest
efficiency DC inverter compressor, and if microchannel heat exchanger can be used. As
manufacturers indicate that microchannel heat exchanger is not available, BNAT is derived
from modelling an improved propane unit in Task 6, by considering the combination of all
other options. BNAT EER (measured at 27/27) levels are of 5.45 (about 4.9 at 35/35) and
SEER of 4.3 with the proposed metrics (Cf Task 3).Regarding standby power mode, BAT
value for existing products is 0.7 -0.8 W according to stakeholders, and BNAT value of 0.4
W is feasible.
To conclude, for portables:
• BAT levels are EER of 3.6 (35/35) and SEER of 2.82
• BNAT EER levels (determined in Task 6) are of 5.45 (27/27) (or about 4.9 at
35/35) and SEER of 4.3
4.2 Technology roadmap
Current product technologies including best available technologies (BAT) have been
presented in the previous section, this section aims to show technological development
into the near future, an outlook of technologies yet to enter the market (BNAT).
Efficient heating and cooling is an important topic to reach climate objectives as heating
and cooling together represents 50 % of the EU energy consumption and is still mainly
based on fossil fuels15. Regarding systems, EU research funding is thus mostly focalized on
developing heating and cooling systems mobilizing renewable energy, which includes heat
pumps but with little technological developments16. However, there is Research &
Developments (R&D) funded by the EU, via non-EU R&D programs (like regional funds)
and by Member States in the heat pump field, even if not regarding directly air-to-air
products.
Looking abroad, the US DOE recently published a technology roadmap of emerging and
future air conditioning technologies, that is used as a basis to identify best non available
technologies for air conditioners (Goetzler et al., 2014 and 2016)17, together with the
15 An EU Strategy on Heating and Cooling, COM(2016) 51 final 16 European Commission, Overview of support activities and projects of the European Union on energy efficiency and renewable energy in the heating & cooling sector. Horizon 2020, Framework Programme 7 and Intelligent Energy Europe programmes of the European Union, Luxembourg: Publications Office of the European Union, 2016 © European Union, 2016. https://ec.europa.eu/energy/sites/ener/files/documents/overview_of_eu_support_activities_to_h-c_-_final.pdf 17 Goetzler et al. 2014. “Energy Savings Potential and R&D Opportunities for Non-Vapor-Compression HVAC Technologies.” https://energy.gov/eere/buildings/downloads/non-vapor-compression-hvac-technologies-report W. Goetzler, M. Guernsey, J. Young, J. Fuhrman, O. Abdelaziz, The Future of Air Conditioning for Buildings, Prepared for: U.S. Department of Energy Office of Energy Efficiency and Renewable Energy Building Technologies Office, July 2016. http://eere.energy.gov/buildings
34
Ecodesign refrigerator technology roadmap18 as some emerging technologies for fridges
are common for air conditioners, and reports regarding heat pump research needs19 and
alternative technologies to high GWP vapor compression technologies20. More information
is then presented on highlighted technologies.
The technologies are presented in 2 different categories:
- Best Not yet Available Technology (BNAT) with the same product archetype (electric
vapor compression cycle)
- Alternative technologies to electric vapor compression cycle
In each case, the technology is described; research and development stage are assessed
as well as potential improvement potential and indications on costs when available.
4.2.1 BNAT based on same product archetype
Field performance measurement
On-board performance measurement method was already described in Task 3 as a way to
measure the real life performances and operating conditions of air conditioners. The
technology is mature, and several methods are available to every manufacturer that can
be used with very limited cost. The compressor or the expansion valve performance maps
can indeed be used as refrigerant flow meter, which combined with measurements that
are already done for controlling the capacity of the unit gives access to the unit capacity.
These methods can also be used to improve fault detection21 and then to help to maintain
the performances of the units along their lifetime.
Standardization work could help ensuring their reliability. This could include methods to
correct performance evaluation for dynamic conditions and the way faults are filtered, as
well as possible checks of on-board measurement capabilities by third parties.
Refrigerant fluid with lower environmental impacts
There is not yet a consensus on the future refrigerant fluids that will be used for air
conditioners after the bans of 2020 for portable air conditioners (GWP lower than 150) and
of 2025 for split air conditioners (GWP lower than 750 for single split units) following
Regulation (EU) 517/2014. For split air conditioners, the immediate solution is R32 with a
GWP of 675. But it may be a temporary solution. For portable air conditioners, even if
propane is already used, it is only by one manufacturer in Europe nowadays and other
solutions may be preferred after 2020.
The fact that automotive industry already adopted the HFO R1234yf makes it a potential
candidate for air conditioners too because it means that optimized components are readily
available. However, size increase is probably too important, and this would tend to
18 http://www.ecodesign-fridges.eu/Documents/Household%20Refrigeration%20Review%20TECHNOLOGY%20ROADMAP%20FINAL%2020160304.pdf 19 BRGP, CETIAT, CSTB, EDF, GDF SUEZ, Armines/Mines ParisTech, Besoins en R&D pour le développement des pompes à chaleur, Rapport final Convention ADEME : 1105C0043, Responsables du projet: David Canal et Michèle Mondot, Janvier 2014. 20 S. Barrault, D. Clodic, E. Devin, T. Michineau, X. Pan, Alternatives to high GWP in refrigeration and air-conditioning applications, final report, study funded by Ademe, Afce and Uniclima, December 4 2013 21 Kim, Woohyun and Braun, James E., "Evaluation of Virtual Refrigerant Mass Flow Sensors" (2012). International Refrigeration and Air Conditioning Conference. Paper 1245. http://docs.lib.purdue.edu/iracc/1245
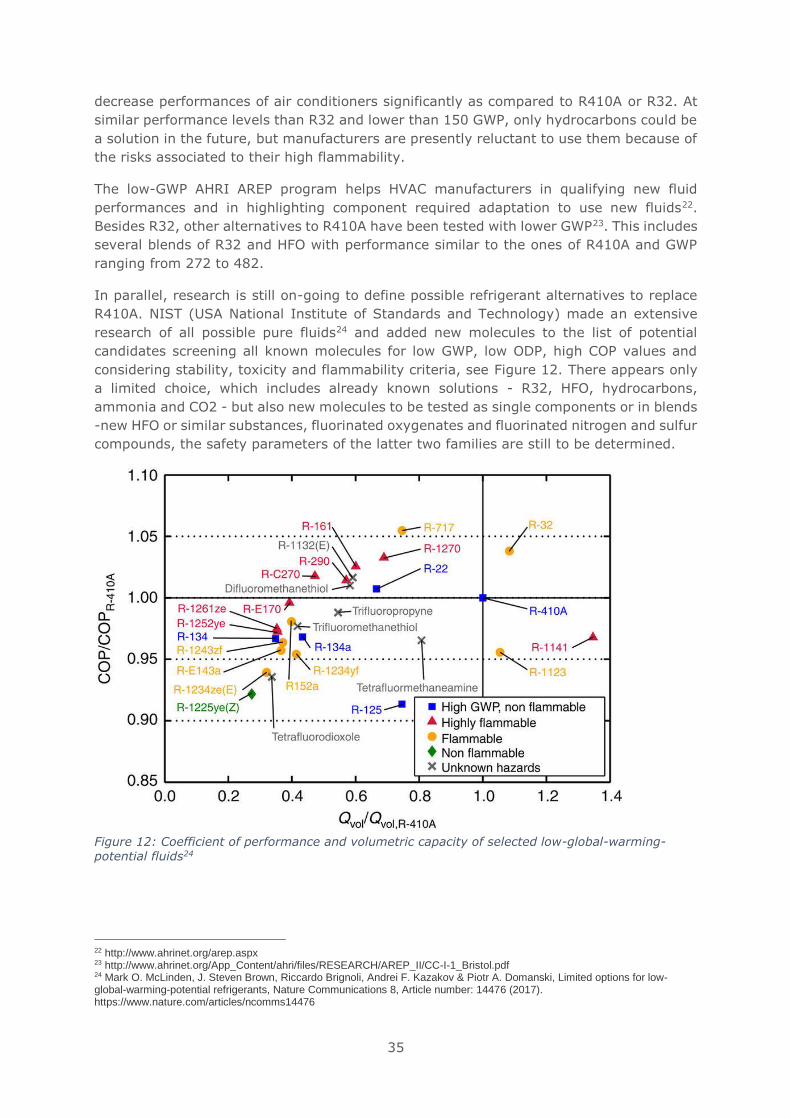
35
decrease performances of air conditioners significantly as compared to R410A or R32. At
similar performance levels than R32 and lower than 150 GWP, only hydrocarbons could be
a solution in the future, but manufacturers are presently reluctant to use them because of
the risks associated to their high flammability.
The low-GWP AHRI AREP program helps HVAC manufacturers in qualifying new fluid
performances and in highlighting component required adaptation to use new fluids22.
Besides R32, other alternatives to R410A have been tested with lower GWP23. This includes
several blends of R32 and HFO with performance similar to the ones of R410A and GWP
ranging from 272 to 482.
In parallel, research is still on-going to define possible refrigerant alternatives to replace
R410A. NIST (USA National Institute of Standards and Technology) made an extensive
research of all possible pure fluids24 and added new molecules to the list of potential
candidates screening all known molecules for low GWP, low ODP, high COP values and
considering stability, toxicity and flammability criteria, see Figure 12. There appears only
a limited choice, which includes already known solutions - R32, HFO, hydrocarbons,
ammonia and CO2 - but also new molecules to be tested as single components or in blends
-new HFO or similar substances, fluorinated oxygenates and fluorinated nitrogen and sulfur
compounds, the safety parameters of the latter two families are still to be determined.
Figure 12: Coefficient of performance and volumetric capacity of selected low-global-warming-potential fluids24
22 http://www.ahrinet.org/arep.aspx 23 http://www.ahrinet.org/App_Content/ahri/files/RESEARCH/AREP_II/CC-I-1_Bristol.pdf 24 Mark O. McLinden, J. Steven Brown, Riccardo Brignoli, Andrei F. Kazakov & Piotr A. Domanski, Limited options for low-global-warming-potential refrigerants, Nature Communications 8, Article number: 14476 (2017). https://www.nature.com/articles/ncomms14476
36
Improved compressor efficiency
Air conditioner compressor use rotary vane compressors with DC inverter and very high
efficiency motors. Research is still active to propose solutions to improve the performances
of these compressors. This includes for instance improved compressor design such as
rotary spool compressor25, control of twin rotary intermediate pressure26 and optimization
of injection design and control.
Research is still on-going on small oil free centrifugal compressors, with working prototypes
using gas lift bearings. The first advantage is to avoid the need for oil lubrication, which is
useful to reach high temperature levels, but present limited improvement potential to
improve efficiency above rotary compressor efficiency levels as oil circulating ratios are
thought to be relatively low already (less than 0.5 % as a mass fraction of mass plus oil
mass flow). Targeted isentropic efficiency levels are between 75 % and 79 %27, which
would present a small improvement only over best rotary compressor efficiency levels.
The overall potential impact of this on-going research which improves SEER or SCOP for
air conditioners beyond present best efficiency levels is thus limited, although significant
savings could be obtained for larger temperature differences and larger systems. Time to
market is supposedly low.
Improved heat exchanger designs
Micro channel heat exchanger is now a mature technology with large OEMs already
proposing market solutions. Research is still active however to optimize their design. For
instance, the US DOE funded a project to develop miniaturized air-to-refrigerant heat
exchangers that are 20% better, in size, weight and performance, which could then lead
to 20 % more surface available at equivalent air conditioner outdoor unit size. Figure 13
below gives a view of proposed new designs to achieve such savings.
25 http://toradengineering.com/wp-content/uploads/2012/06/Torad-Rotary-Spool-Compressor-White-Paper.pdf 26 Gang Yan, Qinglei Jia, Tao Bai, Experimental investigation on vapor injection heat pump with a newly designed twin rotary variable speed compressor for cold regions, In International Journal of Refrigeration, Volume 62, 2016, Pages 232-241. 27 Cordin Arpagaus, Frédéric Bless, Stefan S. Bertsch, Adeel Javed, Jürg Schiffmann, Heat Pump driven by a Small-Scale Oil-Free Turbocompressor, System Design and Simulation, 12th IEA International Heat Pump Conference, Rotterdam, 2017.
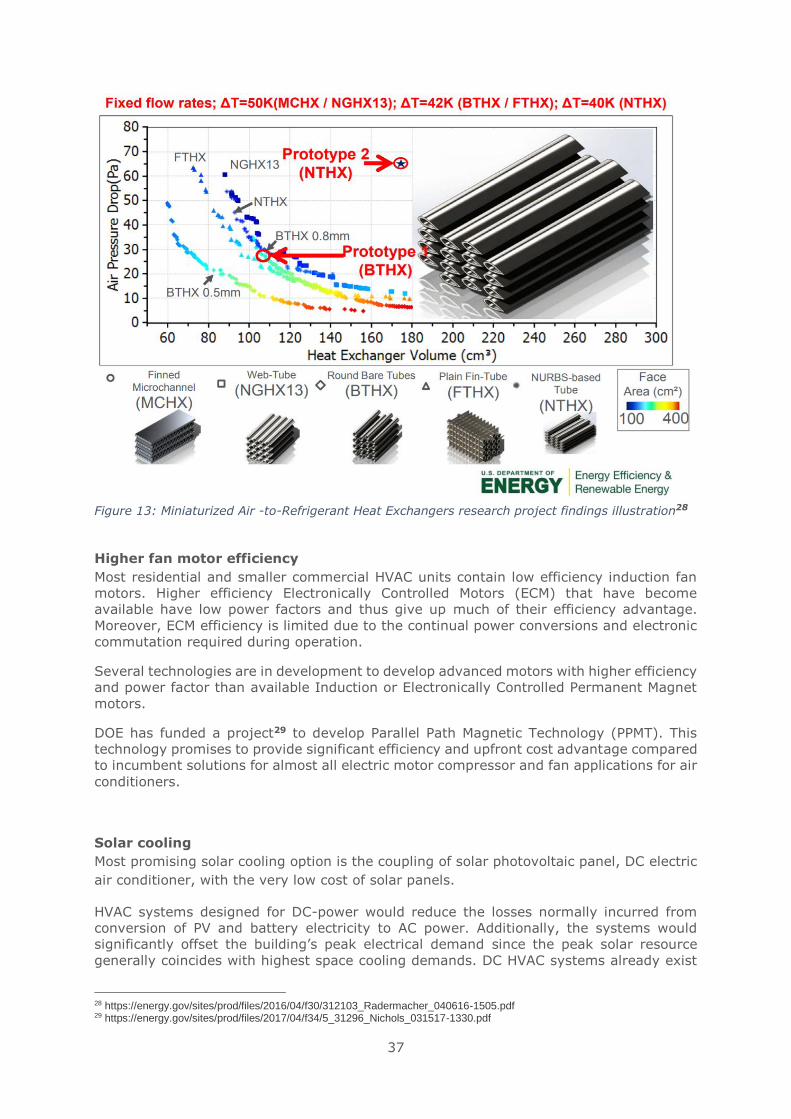
37
Figure 13: Miniaturized Air -to-Refrigerant Heat Exchangers research project findings illustration28
Higher fan motor efficiency
Most residential and smaller commercial HVAC units contain low efficiency induction fan
motors. Higher efficiency Electronically Controlled Motors (ECM) that have become
available have low power factors and thus give up much of their efficiency advantage.
Moreover, ECM efficiency is limited due to the continual power conversions and electronic
commutation required during operation.
Several technologies are in development to develop advanced motors with higher efficiency
and power factor than available Induction or Electronically Controlled Permanent Magnet
motors.
DOE has funded a project29 to develop Parallel Path Magnetic Technology (PPMT). This
technology promises to provide significant efficiency and upfront cost advantage compared
to incumbent solutions for almost all electric motor compressor and fan applications for air
conditioners.
Solar cooling
Most promising solar cooling option is the coupling of solar photovoltaic panel, DC electric
air conditioner, with the very low cost of solar panels.
HVAC systems designed for DC-power would reduce the losses normally incurred from
conversion of PV and battery electricity to AC power. Additionally, the systems would
significantly offset the building’s peak electrical demand since the peak solar resource
generally coincides with highest space cooling demands. DC HVAC systems already exist
28 https://energy.gov/sites/prod/files/2016/04/f30/312103_Radermacher_040616-1505.pdf 29 https://energy.gov/sites/prod/files/2017/04/f34/5_31296_Nichols_031517-1330.pdf
38
for specialized markets such as telecommunications, electronics, and transportation
systems. The preparatory study already noted the will to market such products in 2007:
"Sanyo announced the release of a product coupling solar panels and a classical air
conditioner plus batteries. Cooling loads being high when electricity can be produced a
small battery is advertised to be enough for the product to be almost independent from
the grid."30 But still limited options exist for building-scale HVAC systems.
Research studies show an interesting solar contribution for southern EU countries (e.g. 64
% of electricity coming from solar panels for an office building in Alicante, using 235 W
photovoltaic panel, and a split with EER of 4.05 and 3.5 kW cooling capacity at nominal
ratings31).
This is thus a quite interesting option for Southern EU countries in the present context of
the development of renewable energies, with less subsidies and more self-consumption,
with very low time to market if the right electricity tariffs and/or incentive conditions
appear.
4.2.2 Alternative technologies to electric vapor compression
Vapor compression systems using electrically driven compressors are operated as Rankine
cycle while utilizing refrigerant liquid–vapour phase change, and it has become the
dominant use in heat pumps and air-conditioners around the world due to its scalability,
reliability, the availability of nontoxic and non-flammable refrigerants, use of electricity
(widely available), and relatively compact size.
Many alternative technologies to vapor compression have shown promising results in
laboratory studies, but most have yet to be tested as full-scale prototypes. Further
research and development is required to demonstrate the viability of alternative
technologies, including demonstrating their ability to compete with conventional vapor
compression products on cost, efficiency, reliability, maintenance requirements, occupant
comfort, and safety.
There are a large number of technologies which, on the short to long term could reach the
air conditioning market and compete with air conditioners. Figure 14 shows different
alternative cooling technologies identified in (Goetzler et al., 2014)17. A focus is made for
most promising ones according to existing roadmaps.
30 NYT, 2007, Sanyo Uses Sun to Cool Air, The New York Times, September 3, 2007. 31 F.J. Aguilar, S. Aledo, P.V. Quiles, Experimental analysis of an air conditioner powered by photovoltaic energy and supported by the grid, In Applied Thermal Engineering, Volume 123, 2017, Pages 486-497.
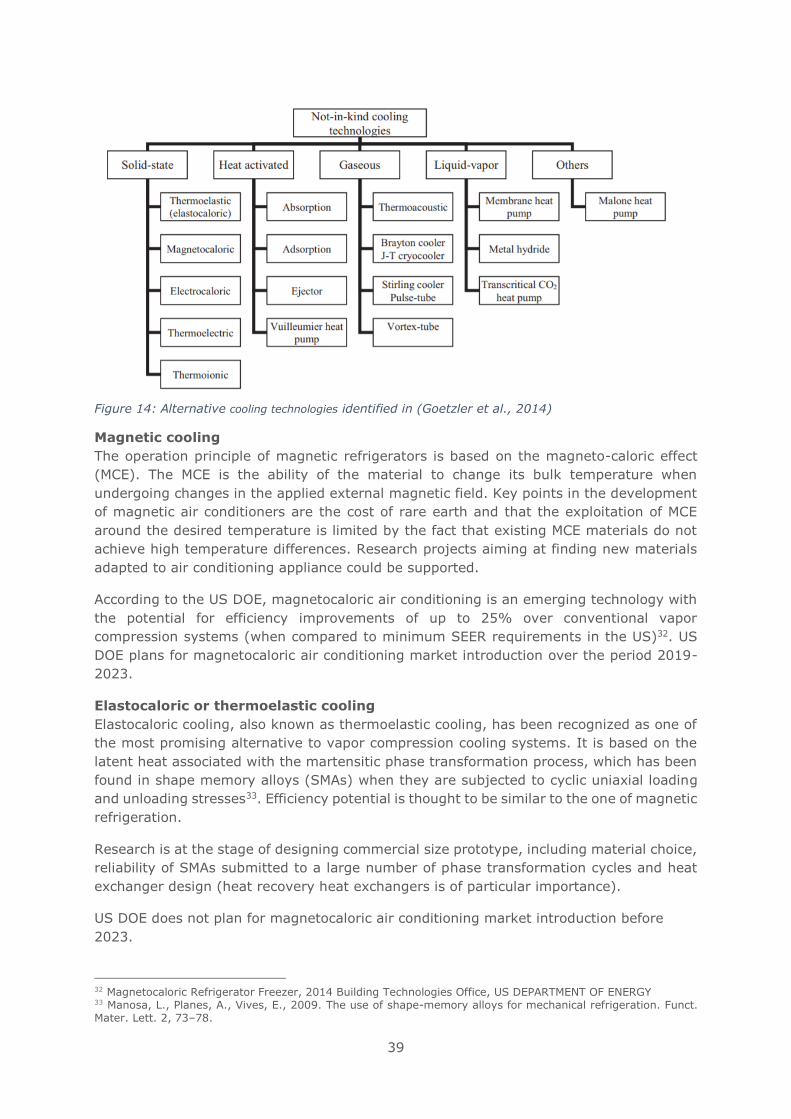
39
Figure 14: Alternative cooling technologies identified in (Goetzler et al., 2014)
Magnetic cooling
The operation principle of magnetic refrigerators is based on the magneto-caloric effect
(MCE). The MCE is the ability of the material to change its bulk temperature when
undergoing changes in the applied external magnetic field. Key points in the development
of magnetic air conditioners are the cost of rare earth and that the exploitation of MCE
around the desired temperature is limited by the fact that existing MCE materials do not
achieve high temperature differences. Research projects aiming at finding new materials
adapted to air conditioning appliance could be supported.
According to the US DOE, magnetocaloric air conditioning is an emerging technology with
the potential for efficiency improvements of up to 25% over conventional vapor
compression systems (when compared to minimum SEER requirements in the US)32. US
DOE plans for magnetocaloric air conditioning market introduction over the period 2019-
2023.
Elastocaloric or thermoelastic cooling
Elastocaloric cooling, also known as thermoelastic cooling, has been recognized as one of
the most promising alternative to vapor compression cooling systems. It is based on the
latent heat associated with the martensitic phase transformation process, which has been
found in shape memory alloys (SMAs) when they are subjected to cyclic uniaxial loading
and unloading stresses33. Efficiency potential is thought to be similar to the one of magnetic
refrigeration.
Research is at the stage of designing commercial size prototype, including material choice,
reliability of SMAs submitted to a large number of phase transformation cycles and heat
exchanger design (heat recovery heat exchangers is of particular importance).
US DOE does not plan for magnetocaloric air conditioning market introduction before
2023.
32 Magnetocaloric Refrigerator Freezer, 2014 Building Technologies Office, US DEPARTMENT OF ENERGY 33 Manosa, L., Planes, A., Vives, E., 2009. The use of shape-memory alloys for mechanical refrigeration. Funct. Mater. Lett. 2, 73–78.
40
Electro-chemical compression
Developing electrochemical compressors could offer scalable operation, utilize low GWP
refrigerants, and operate with minimal noise, but their success ultimately depends on cycle
efficiency and cost compared to electromechanical compressors. In place of a motor-driven
compressor, electrochemical compressors raise the pressure of a hydrogen working fluid
using a proton exchange membrane and electricity source. The pressurized hydrogen gas
combines with water, ammonia, or another refrigerant, raising its pressure and driving the
combined working fluid through condenser, expansion valve, and evaporator in a standard
vapor-compression cycle. Prototypes have already been developed and tested by Xergy
Inc. however; it remains system integration (developing compatible heat exchangers,
controls and seals with this new system compression). US DOE plans for market
introduction over the period 2019-2023.
Thermal compression
Stirling cycle has been the subject of numerous energy researchers for decades as being
theoretically the most efficient cycle. This is a motor cycle that uses hot and cold source
to produce mechanical work which can be used to run the mechanical compressor of a
standard vapor compression cycle. The hot source can be gas or other fossil or renewable
fuel. A recent variation of this cycle using thermal compression and a CO2 supercritical
cycle has been developed34. Burning gas, designed as a high temperature air-to-water heat
pumps, ηs value of close to 2 (according Regulation N (EU) 813/2013) are foreseen, which
would make it the best available technology on this segment. Development of such a
system in an air-to-air version could allow reaching higher SCOP values than present BAT
levels, but with however lowering efficiency levels in cooling mode. Note that there is no
planned development of such system for now which means that it most likely could not
reach the market before 2020 to 2025.
Electro-caloric heat pump
Electrocaloric cooling is a recent technology. When exposed to an electric field, electric
(dipole) moments in the material become oriented and the entropy is reduced. This is
similar to the magnetic field induced magnetic moment change in Magnetocaloric
materials. Quite a few materials candidates have been developed so far, most of which
are polymers or ceramics. P(VDF-TrFE) and P(VDF-TrFE-CFE) have shown superior latent
heat to other materials. One challenge for this technology is the limitation in the shape of
the materials. Only thin films can be applied since a high electric field is needed (hundreds
of MV/m). However, no power efficiency, parasitic pump power and other losses were
included. More studies are on both materials level and system level prototype development
is still needed to fully understand the potential for this NIK technology. This is thus a
potential technology for the long-term.
Summary and development status
Based on the above, the Table 12 below presents a summary comparing the status of the
different alternatives to vapor compression technologies, as well as energy efficiency
improvement potential, expected cost, complexity and barriers.
34 http://www.boostheat.com
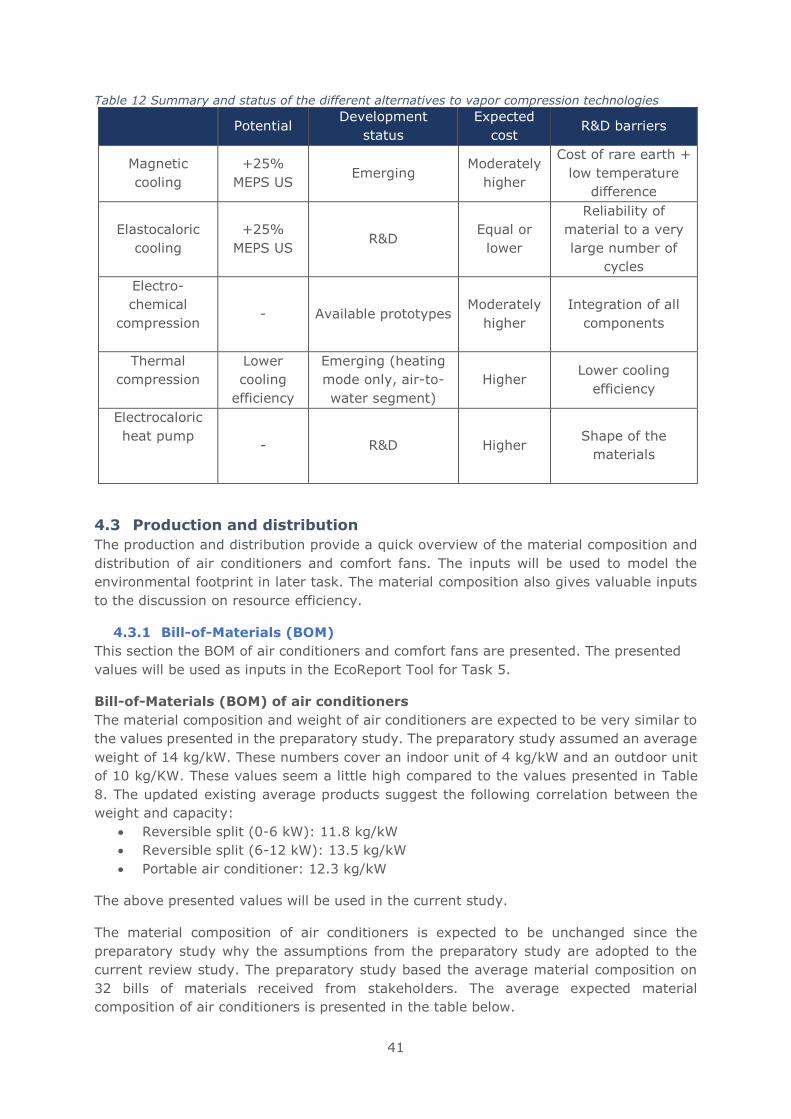
41
Table 12 Summary and status of the different alternatives to vapor compression technologies
Potential Development
status
Expected
cost R&D barriers
Magnetic
cooling
+25%
MEPS US Emerging
Moderately
higher
Cost of rare earth +
low temperature
difference
Elastocaloric
cooling
+25%
MEPS US R&D
Equal or
lower
Reliability of
material to a very
large number of
cycles
Electro-
chemical
compression
- Available prototypes Moderately
higher
Integration of all
components
Thermal
compression
Lower
cooling
efficiency
Emerging (heating
mode only, air-to-
water segment)
Higher Lower cooling
efficiency
Electrocaloric
heat pump
- R&D Higher Shape of the
materials
4.3 Production and distribution
The production and distribution provide a quick overview of the material composition and
distribution of air conditioners and comfort fans. The inputs will be used to model the
environmental footprint in later task. The material composition also gives valuable inputs
to the discussion on resource efficiency.
4.3.1 Bill-of-Materials (BOM)
This section the BOM of air conditioners and comfort fans are presented. The presented
values will be used as inputs in the EcoReport Tool for Task 5.
Bill-of-Materials (BOM) of air conditioners
The material composition and weight of air conditioners are expected to be very similar to
the values presented in the preparatory study. The preparatory study assumed an average
weight of 14 kg/kW. These numbers cover an indoor unit of 4 kg/kW and an outdoor unit
of 10 kg/KW. These values seem a little high compared to the values presented in Table
8. The updated existing average products suggest the following correlation between the
weight and capacity:
• Reversible split (0-6 kW): 11.8 kg/kW
• Reversible split (6-12 kW): 13.5 kg/kW
• Portable air conditioner: 12.3 kg/kW
The above presented values will be used in the current study.
The material composition of air conditioners is expected to be unchanged since the
preparatory study why the assumptions from the preparatory study are adopted to the
current review study. The preparatory study based the average material composition on
32 bills of materials received from stakeholders. The average expected material
composition of air conditioners is presented in the table below.
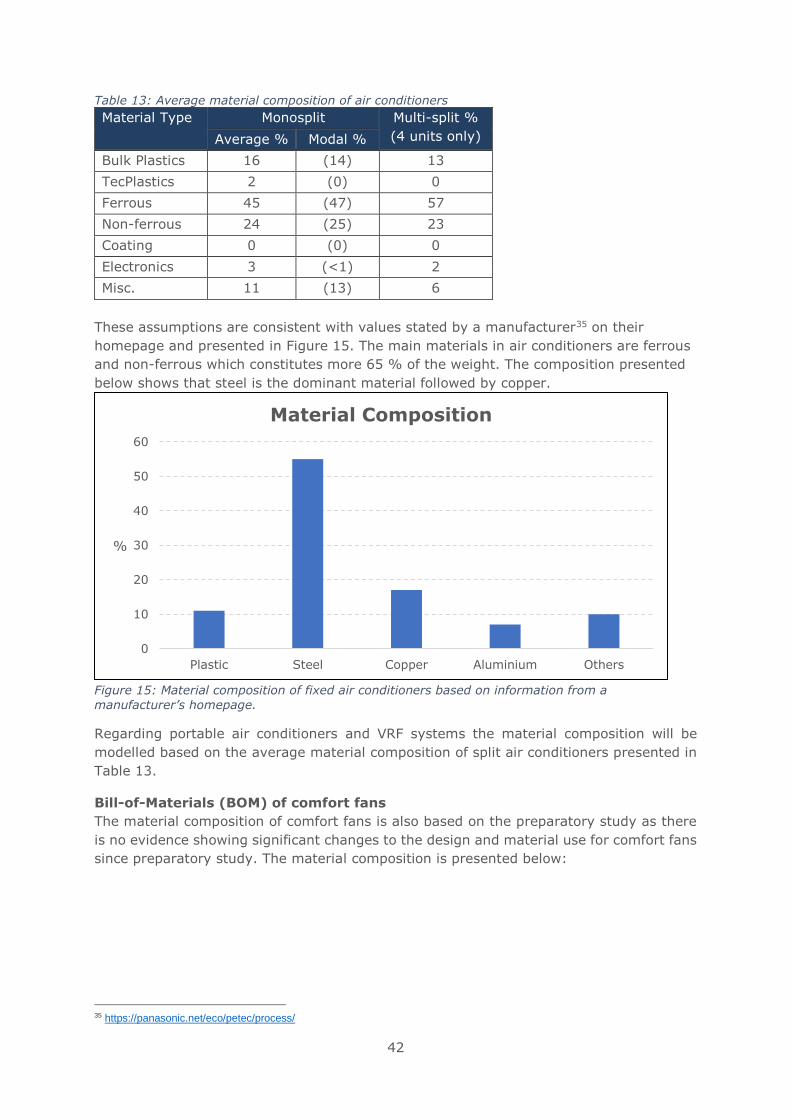
42
Table 13: Average material composition of air conditioners
Material Type Monosplit Multi-split %
(4 units only) Average % Modal %
Bulk Plastics 16 (14) 13
TecPlastics 2 (0) 0
Ferrous 45 (47) 57
Non-ferrous 24 (25) 23
Coating 0 (0) 0
Electronics 3 (<1) 2
Misc. 11 (13) 6
These assumptions are consistent with values stated by a manufacturer35 on their
homepage and presented in Figure 15. The main materials in air conditioners are ferrous
and non-ferrous which constitutes more 65 % of the weight. The composition presented
below shows that steel is the dominant material followed by copper.
Figure 15: Material composition of fixed air conditioners based on information from a
manufacturer’s homepage.
Regarding portable air conditioners and VRF systems the material composition will be
modelled based on the average material composition of split air conditioners presented in
Table 13.
Bill-of-Materials (BOM) of comfort fans
The material composition of comfort fans is also based on the preparatory study as there
is no evidence showing significant changes to the design and material use for comfort fans
since preparatory study. The material composition is presented below:
35 https://panasonic.net/eco/petec/process/
0
10
20
30
40
50
60
Plastic Steel Copper Aluminium Others
%
Material Composition
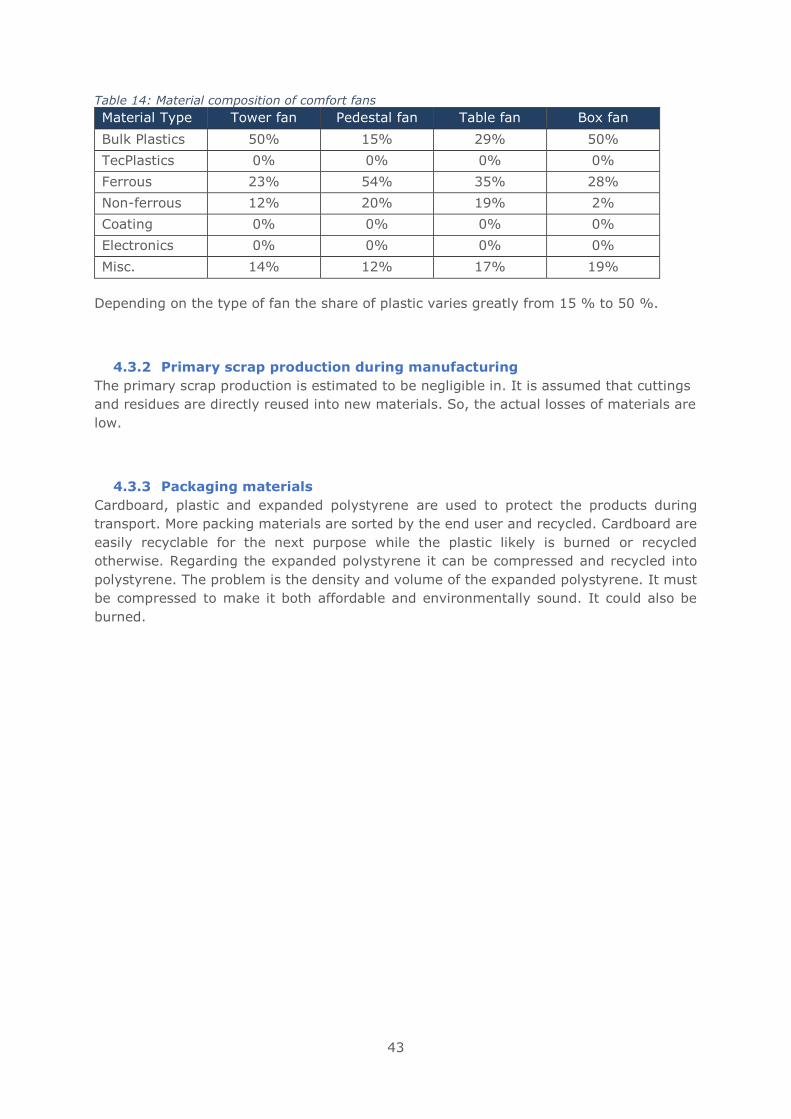
43
Table 14: Material composition of comfort fans
Material Type Tower fan Pedestal fan Table fan Box fan
Bulk Plastics 50% 15% 29% 50%
TecPlastics 0% 0% 0% 0%
Ferrous 23% 54% 35% 28%
Non-ferrous 12% 20% 19% 2%
Coating 0% 0% 0% 0%
Electronics 0% 0% 0% 0%
Misc. 14% 12% 17% 19%
Depending on the type of fan the share of plastic varies greatly from 15 % to 50 %.
4.3.2 Primary scrap production during manufacturing
The primary scrap production is estimated to be negligible in. It is assumed that cuttings
and residues are directly reused into new materials. So, the actual losses of materials are
low.
4.3.3 Packaging materials
Cardboard, plastic and expanded polystyrene are used to protect the products during
transport. More packing materials are sorted by the end user and recycled. Cardboard are
easily recyclable for the next purpose while the plastic likely is burned or recycled
otherwise. Regarding the expanded polystyrene it can be compressed and recycled into
polystyrene. The problem is the density and volume of the expanded polystyrene. It must
be compressed to make it both affordable and environmentally sound. It could also be
burned.
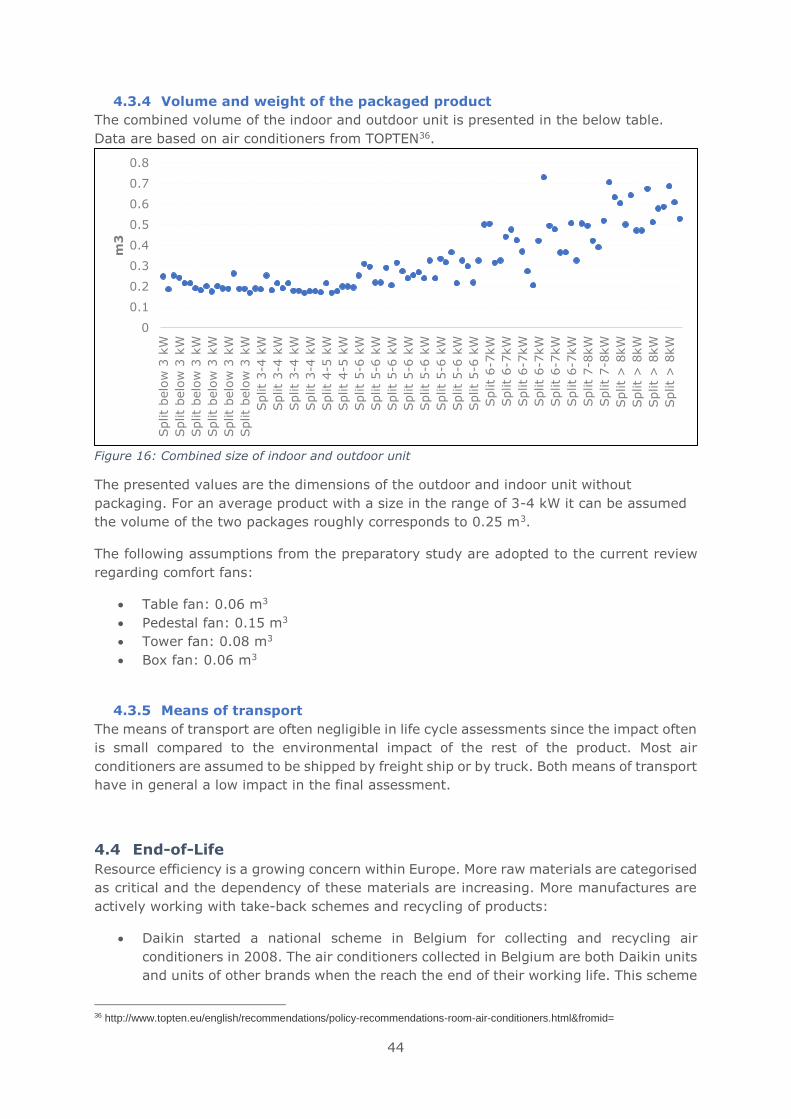
44
4.3.4 Volume and weight of the packaged product
The combined volume of the indoor and outdoor unit is presented in the below table.
Data are based on air conditioners from TOPTEN36.
Figure 16: Combined size of indoor and outdoor unit
The presented values are the dimensions of the outdoor and indoor unit without
packaging. For an average product with a size in the range of 3-4 kW it can be assumed
the volume of the two packages roughly corresponds to 0.25 m3.
The following assumptions from the preparatory study are adopted to the current review
regarding comfort fans:
• Table fan: 0.06 m3
• Pedestal fan: 0.15 m3
• Tower fan: 0.08 m3
• Box fan: 0.06 m3
4.3.5 Means of transport
The means of transport are often negligible in life cycle assessments since the impact often
is small compared to the environmental impact of the rest of the product. Most air
conditioners are assumed to be shipped by freight ship or by truck. Both means of transport
have in general a low impact in the final assessment.
4.4 End-of-Life
Resource efficiency is a growing concern within Europe. More raw materials are categorised
as critical and the dependency of these materials are increasing. More manufactures are
actively working with take-back schemes and recycling of products:
• Daikin started a national scheme in Belgium for collecting and recycling air
conditioners in 2008. The air conditioners collected in Belgium are both Daikin units
and units of other brands when the reach the end of their working life. This scheme
36 http://www.topten.eu/english/recommendations/policy-recommendations-room-air-conditioners.html&fromid=
0
0.1
0.2
0.3
0.4
0.5
0.6
0.7
0.8Split
belo
w 3
kW
Split
belo
w 3
kW
Split
belo
w 3
kW
Split
belo
w 3
kW
Split
belo
w 3
kW
Split
belo
w 3
kW
Split
3-4
kW
Split
3-4
kW
Split
3-4
kW
Split
3-4
kW
Split
4-5
kW
Split
4-5
kW
Split
5-6
kW
Split
5-6
kW
Split
5-6
kW
Split
5-6
kW
Split
5-6
kW
Split
5-6
kW
Split
5-6
kW
Split
5-6
kW
Split
6-7
kW
Split
6-7
kW
Split
6-7
kW
Split
6-7
kW
Split
6-7
kW
Split
6-7
kW
Split
7-8
kW
Split
7-8
kW
Split
> 8
kW
Split
> 8
kW
Split
> 8
kW
Split
> 8
kW
m3
45
has increased the mass of collected units in Belgium from 42.5 tonnes to 73.40
tonnes in 2012. Daikin has also introduced different schemes or participated in
existing take back schemes in Greece, Italy, Spain and in Netherlands37.
• Toshiba has a case study in Japan investigating the use of plastics in air conditioners
recycled from decommissioned air conditioners. They collect glass fiber-reinforced
AS resin from old air conditioners. When the old air conditioners arrive at the facility
the unit is dismantled, and the selected plastic parts are crushed, cleaned and the
contaminants are removed. Afterwards are the processed plastic shipped to another
company for recycling. The recycled plastics are then used as materials for outdoor
unit fans in home and industrial air conditioners38.
Most of the air conditioners and comfort fans are though expected to be collected through
national collection schemes. The following sections describe the current collection rate and
the pre-processing of the equipment. Furthermore, different options to improve the
resource consumption are discussed.
4.4.1 Technical product life
The technical product life is described in task 3. The average lifetime of air conditioners
varies between 10 and 15 years (12 years used in later tasks). The estimated lifetime of
comfort fans is 10 years.
4.4.1 Materials flow and collection at end-of-life
Air conditioners and comfort fans are collected at end-of-life and send suited facilities for
reprocessing. Illegal trade and sales of scrap challenge the collection rate for some product
categories. The statistics from Eurostat shows products put on the market and waste
collected for large household equipment39. This statistic does not refine the actual number
of air conditioners collected so the actual collection rate can be difficult to quantify. This is
also the case for comfort fans.
From 2019 onwards, the minimum collection rate to be achieved annually shall be 65% of
the average weight of Electrical and Electronic Equipment (EEE) placed on the market in
the three preceding years in each Member State, or alternatively 85% of Waste Electrical
and Electronic Equipment (WEEE) generated on the territory of that Member State. Below
in Table 15 is the collection rate for large household appliances calculated based on the
WEEE collected in 2014 and the average weight of EEE placed on the market in the three
preceding years:
37 http://eu.daikineurope.com/corporate-home/environment-leadership/initiatives-throughout-the-product-life-cycle/end-of-life/ 38 https://www.toshiba.co.jp/env/en/products/homeappliance.htm
39 http://appsso.eurostat.ec.europa.eu/nui/show.do?dataset=env_waselee&lang=en
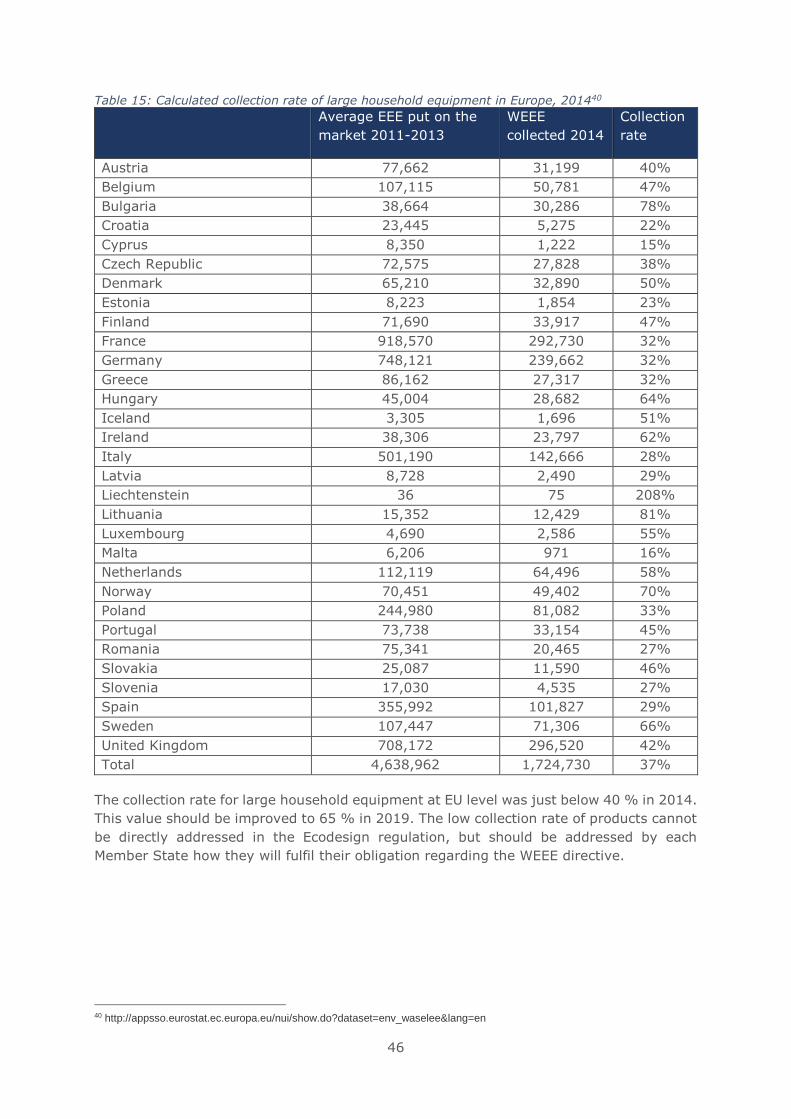
46
Table 15: Calculated collection rate of large household equipment in Europe, 201440
Average EEE put on the
market 2011-2013
WEEE
collected 2014
Collection
rate
Austria 77,662 31,199 40%
Belgium 107,115 50,781 47%
Bulgaria 38,664 30,286 78%
Croatia 23,445 5,275 22%
Cyprus 8,350 1,222 15%
Czech Republic 72,575 27,828 38%
Denmark 65,210 32,890 50%
Estonia 8,223 1,854 23%
Finland 71,690 33,917 47%
France 918,570 292,730 32%
Germany 748,121 239,662 32%
Greece 86,162 27,317 32%
Hungary 45,004 28,682 64%
Iceland 3,305 1,696 51%
Ireland 38,306 23,797 62%
Italy 501,190 142,666 28%
Latvia 8,728 2,490 29%
Liechtenstein 36 75 208%
Lithuania 15,352 12,429 81%
Luxembourg 4,690 2,586 55%
Malta 6,206 971 16%
Netherlands 112,119 64,496 58%
Norway 70,451 49,402 70%
Poland 244,980 81,082 33%
Portugal 73,738 33,154 45%
Romania 75,341 20,465 27%
Slovakia 25,087 11,590 46%
Slovenia 17,030 4,535 27%
Spain 355,992 101,827 29%
Sweden 107,447 71,306 66%
United Kingdom 708,172 296,520 42%
Total 4,638,962 1,724,730 37%
The collection rate for large household equipment at EU level was just below 40 % in 2014.
This value should be improved to 65 % in 2019. The low collection rate of products cannot
be directly addressed in the Ecodesign regulation, but should be addressed by each
Member State how they will fulfil their obligation regarding the WEEE directive.
40 http://appsso.eurostat.ec.europa.eu/nui/show.do?dataset=env_waselee&lang=en
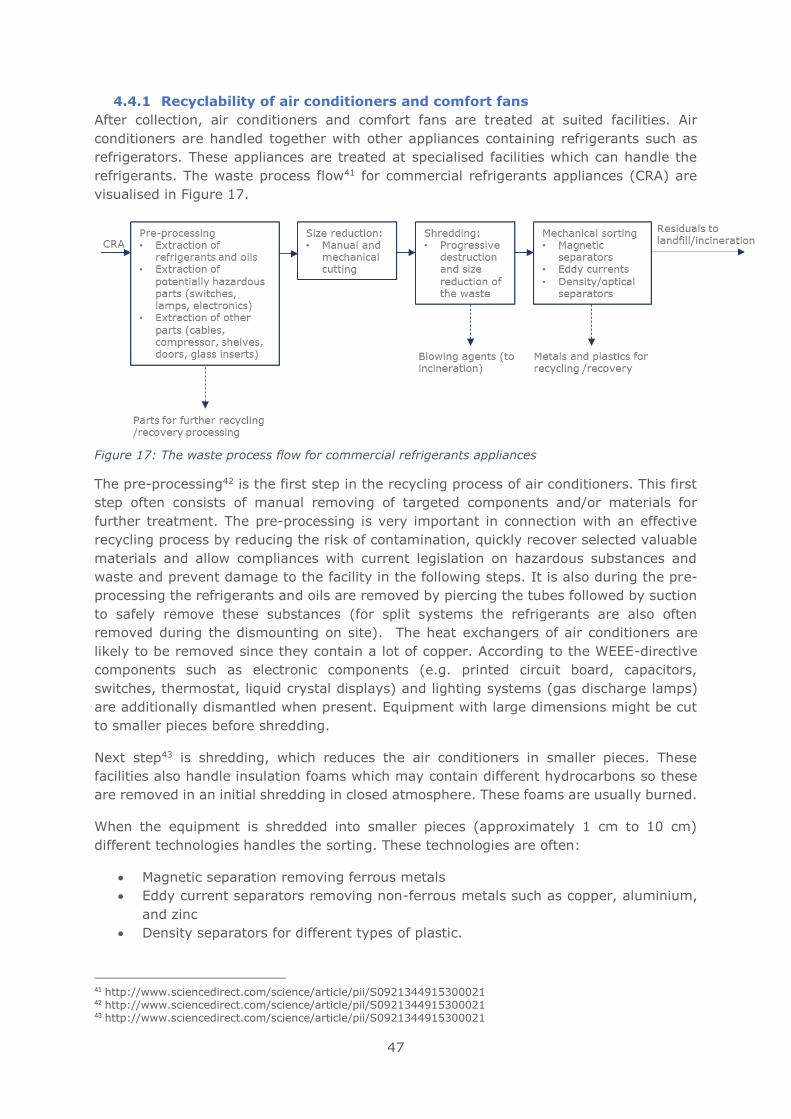
47
4.4.1 Recyclability of air conditioners and comfort fans
After collection, air conditioners and comfort fans are treated at suited facilities. Air
conditioners are handled together with other appliances containing refrigerants such as
refrigerators. These appliances are treated at specialised facilities which can handle the
refrigerants. The waste process flow41 for commercial refrigerants appliances (CRA) are
visualised in Figure 17.
Figure 17: The waste process flow for commercial refrigerants appliances
The pre-processing42 is the first step in the recycling process of air conditioners. This first
step often consists of manual removing of targeted components and/or materials for
further treatment. The pre-processing is very important in connection with an effective
recycling process by reducing the risk of contamination, quickly recover selected valuable
materials and allow compliances with current legislation on hazardous substances and
waste and prevent damage to the facility in the following steps. It is also during the pre-
processing the refrigerants and oils are removed by piercing the tubes followed by suction
to safely remove these substances (for split systems the refrigerants are also often
removed during the dismounting on site). The heat exchangers of air conditioners are
likely to be removed since they contain a lot of copper. According to the WEEE-directive
components such as electronic components (e.g. printed circuit board, capacitors,
switches, thermostat, liquid crystal displays) and lighting systems (gas discharge lamps)
are additionally dismantled when present. Equipment with large dimensions might be cut
to smaller pieces before shredding.
Next step43 is shredding, which reduces the air conditioners in smaller pieces. These
facilities also handle insulation foams which may contain different hydrocarbons so these
are removed in an initial shredding in closed atmosphere. These foams are usually burned.
When the equipment is shredded into smaller pieces (approximately 1 cm to 10 cm)
different technologies handles the sorting. These technologies are often:
• Magnetic separation removing ferrous metals
• Eddy current separators removing non-ferrous metals such as copper, aluminium,
and zinc
• Density separators for different types of plastic.
41 http://www.sciencedirect.com/science/article/pii/S0921344915300021 42 http://www.sciencedirect.com/science/article/pii/S0921344915300021 43 http://www.sciencedirect.com/science/article/pii/S0921344915300021
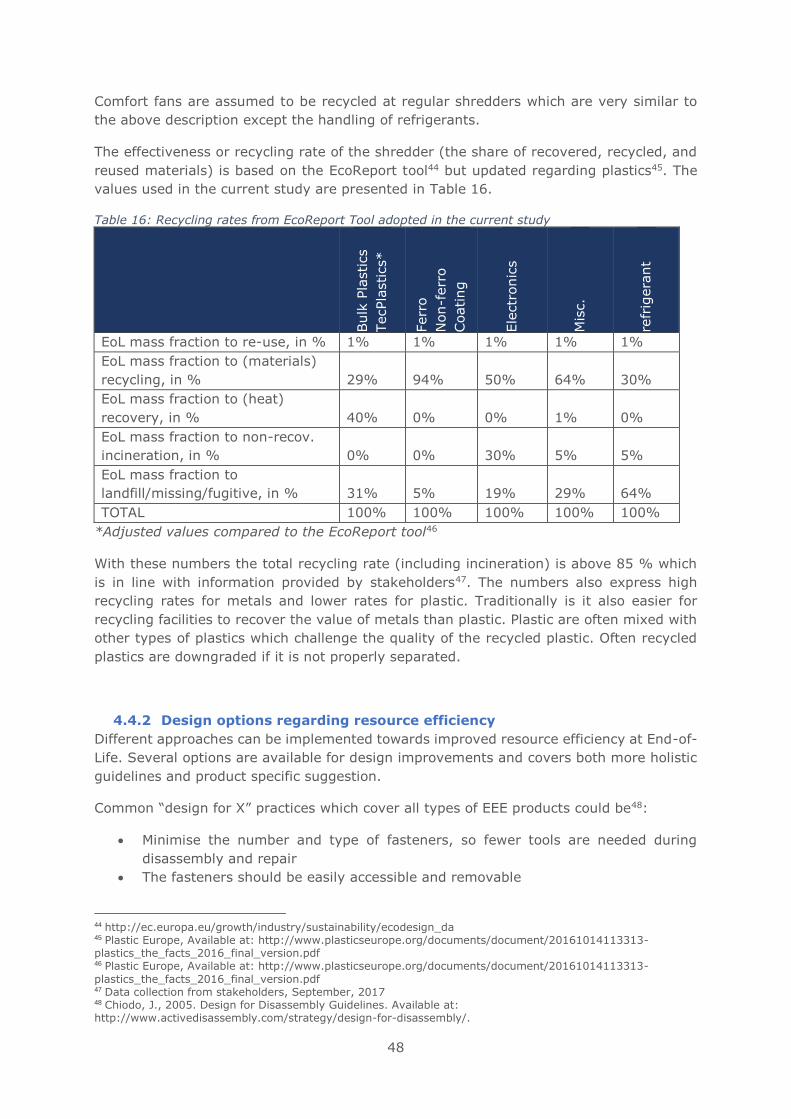
48
Comfort fans are assumed to be recycled at regular shredders which are very similar to
the above description except the handling of refrigerants.
The effectiveness or recycling rate of the shredder (the share of recovered, recycled, and
reused materials) is based on the EcoReport tool44 but updated regarding plastics45. The
values used in the current study are presented in Table 16.
Table 16: Recycling rates from EcoReport Tool adopted in the current study
Bulk
Pla
stics
TecPla
stics*
Ferr
o
Non-f
err
o
Coating
Ele
ctr
onic
s
Mis
c.
refr
igera
nt
EoL mass fraction to re-use, in % 1% 1% 1% 1% 1%
EoL mass fraction to (materials)
recycling, in % 29% 94% 50% 64% 30%
EoL mass fraction to (heat)
recovery, in % 40% 0% 0% 1% 0%
EoL mass fraction to non-recov.
incineration, in % 0% 0% 30% 5% 5%
EoL mass fraction to
landfill/missing/fugitive, in % 31% 5% 19% 29% 64%
TOTAL 100% 100% 100% 100% 100%
*Adjusted values compared to the EcoReport tool46
With these numbers the total recycling rate (including incineration) is above 85 % which
is in line with information provided by stakeholders47. The numbers also express high
recycling rates for metals and lower rates for plastic. Traditionally is it also easier for
recycling facilities to recover the value of metals than plastic. Plastic are often mixed with
other types of plastics which challenge the quality of the recycled plastic. Often recycled
plastics are downgraded if it is not properly separated.
4.4.2 Design options regarding resource efficiency
Different approaches can be implemented towards improved resource efficiency at End-of-
Life. Several options are available for design improvements and covers both more holistic
guidelines and product specific suggestion.
Common “design for X” practices which cover all types of EEE products could be48:
• Minimise the number and type of fasteners, so fewer tools are needed during
disassembly and repair
• The fasteners should be easily accessible and removable
44 http://ec.europa.eu/growth/industry/sustainability/ecodesign_da 45 Plastic Europe, Available at: http://www.plasticseurope.org/documents/document/20161014113313-plastics_the_facts_2016_final_version.pdf 46 Plastic Europe, Available at: http://www.plasticseurope.org/documents/document/20161014113313-
plastics_the_facts_2016_final_version.pdf 47 Data collection from stakeholders, September, 2017 48 Chiodo, J., 2005. Design for Disassembly Guidelines. Available at: http://www.activedisassembly.com/strategy/design-for-disassembly/.
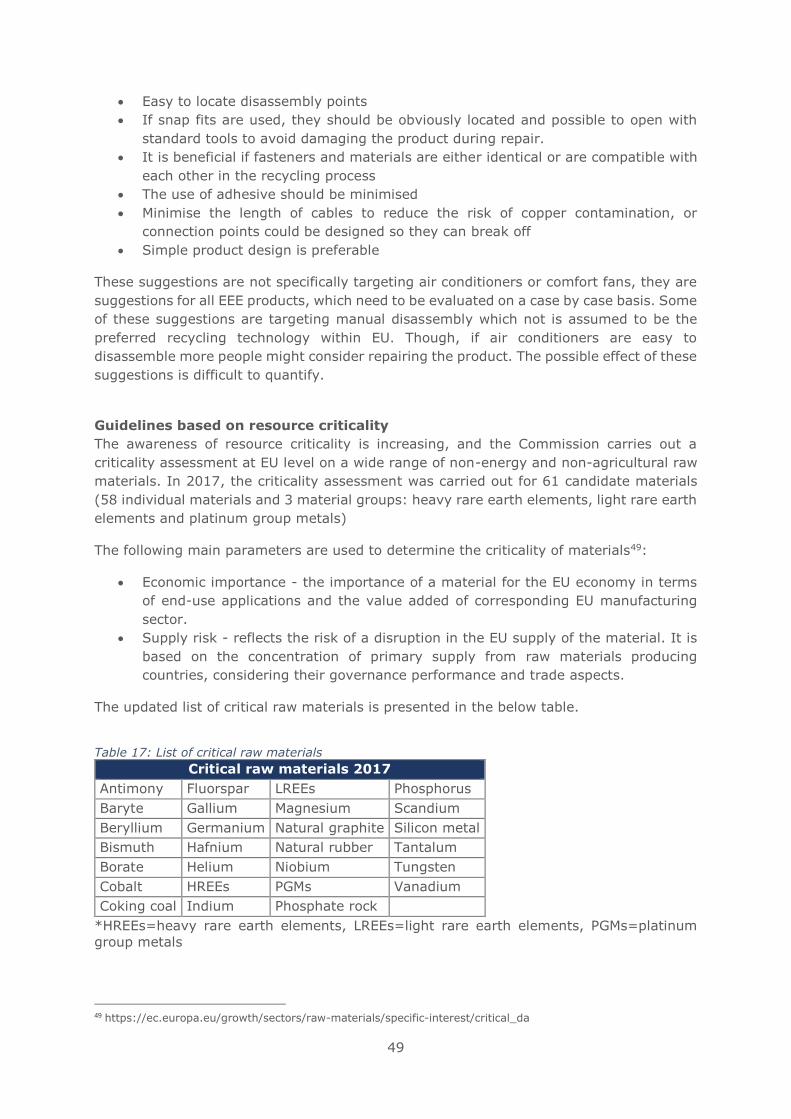
49
• Easy to locate disassembly points
• If snap fits are used, they should be obviously located and possible to open with
standard tools to avoid damaging the product during repair.
• It is beneficial if fasteners and materials are either identical or are compatible with
each other in the recycling process
• The use of adhesive should be minimised
• Minimise the length of cables to reduce the risk of copper contamination, or
connection points could be designed so they can break off
• Simple product design is preferable
These suggestions are not specifically targeting air conditioners or comfort fans, they are
suggestions for all EEE products, which need to be evaluated on a case by case basis. Some
of these suggestions are targeting manual disassembly which not is assumed to be the
preferred recycling technology within EU. Though, if air conditioners are easy to
disassemble more people might consider repairing the product. The possible effect of these
suggestions is difficult to quantify.
Guidelines based on resource criticality
The awareness of resource criticality is increasing, and the Commission carries out a
criticality assessment at EU level on a wide range of non-energy and non-agricultural raw
materials. In 2017, the criticality assessment was carried out for 61 candidate materials
(58 individual materials and 3 material groups: heavy rare earth elements, light rare earth
elements and platinum group metals)
The following main parameters are used to determine the criticality of materials49:
• Economic importance - the importance of a material for the EU economy in terms
of end-use applications and the value added of corresponding EU manufacturing
sector.
• Supply risk - reflects the risk of a disruption in the EU supply of the material. It is
based on the concentration of primary supply from raw materials producing
countries, considering their governance performance and trade aspects.
The updated list of critical raw materials is presented in the below table.
Table 17: List of critical raw materials
Critical raw materials 2017
Antimony Fluorspar LREEs Phosphorus
Baryte Gallium Magnesium Scandium
Beryllium Germanium Natural graphite Silicon metal
Bismuth Hafnium Natural rubber Tantalum
Borate Helium Niobium Tungsten
Cobalt HREEs PGMs Vanadium
Coking coal Indium Phosphate rock
*HREEs=heavy rare earth elements, LREEs=light rare earth elements, PGMs=platinum
group metals
49 https://ec.europa.eu/growth/sectors/raw-materials/specific-interest/critical_da
50
Both air conditioners and comfort fans may contain several raw materials categorised as
critical. Raw materials like vanadium and phosphorous are in some designations of steel
used as alloying elements. These alloying elements are not included in this assessment as
they are very difficult to quantify and more obvious choices are present such as:
• Printed circuit boards which may contain several critical materials such as gold,
silver, palladium, antimony, bismuth, tantalum etc.50
• Compressor and heat exchangers which may contain copper
• Wires which may contain copper
• Motor (comfort fans)
The composition of printed circuit boards is difficult to quantify but it is estimated as low
grade for air conditioners and comfort fans. The product development of air conditioners
indicates higher grades of boards in the future due to the implementation of more
functions.
Printed circuit board are already targeted components according to the WEEE-directive and
compressors, heat exchanger and wires are already target due to their high amount of
copper. Copper is also very important to remove before shredding to minimise the risk of
copper contamination in the iron fraction since it directly can influence the mechanical
properties of the recycled iron/steel51. Avoiding contaminants is one of the key points of
design for recycling guidelines. Design for recycling mainly focuses on the recycling
compatibility of different materials avoiding losses at End-of-Life. This can be done by
respecting a few common guidelines such as minimising the use of non-reversible
adhesives. See more details in Annex 1.
Guidelines supporting the WEEE directive
The WEEE directive contains several parts supporting resource efficiency and selective
requirements. How the directive is interpreted and adopted to the member states can vary
greatly. Based on WEEE-directive special articles and annexes are highlighted below to
pinpoint which design improvements which could comply with the directive:
• Article 4, Product design: “Member States shall, without prejudice to the
requirements of Union legislation on the proper functioning of the internal market
and on product design, including Directive 2009/125/EC, encourage cooperation
between producers and recyclers and measures to promote the design and
production of EEE, notably in view of facilitating re-use, dismantling and recovery
of WEEE, its components and materials.”
• Article 8, Proper treatment:
o Member states shall ensure that all separately collected WEEE undergoes
proper treatment including the removal of the following components
following substances, mixtures and components:
▪ Mercury containing components, such as switches or backlighting
lamps
▪ Batteries
50http://www.wrap.org.uk/sites/files/wrap/Techniques%20for%20recovering%20printed%20circuit%20boards%2C%20final.pdf 51 http://www.rmz-mg.com/letniki/rmz50/rmz50_0627-0641.pdf
51
▪ Printed circuit boards of mobile phones generally, and of other
devices if the surface of the printed circuit board is greater than 10
square centimetres,
▪ Plastic containing brominated flame retardants,
▪ Chlorofluorocarbons (CFC), hydrochlorofluorocarbons (HCFC) or
hydrofluorocarbons (HFC), hydrocarbons (HC),
▪ External electric cables,
o The following components of WEEE that is separately collected have to be
treated as indicated:
▪ Equipment containing gases that are ozone depleting or have a global
warming potential (GWP) above 15, such as those contained in foams
and refrigeration circuits: the gases must be properly extracted and
properly treated. Ozone-depleting gases must be treated in
accordance with Regulation
• Article 15 Information for treatment facilities: “In order to facilitate the preparation
for re-use and the correct and environmentally sound treatment of WEEE, including
maintenance, upgrade, refurbishment and recycling, Member States shall take the
necessary measures to ensure that producers provide information free of charge
about preparation for re-use and treatment in respect of each type of new EEE
placed for the first time on the Union market within one year after the equipment
is placed on the market.”
Design for re-use, dismantling and recovery of WEEE all fits in the category of design for
repair. Design for repair is described in Annex 1. The overall purpose of design for repair
is to ease the repair process by allowing easy access to critical components. Based on
stakeholder inputs printed circuit boards and compressors are among the most bought
spare parts. These parts should ideally be easily located and changed if possible. If printed
circuit boards are located and removed easily it also fits with the proper treatment
definition if this information also are available for the recycling facilities. Regarding
refrigerants pump-down systems may be beneficial in the recycling process and preventing
leakage before the equipment is handled at the facility.
Resource efficiency requirements in other ecodesign regulations
Some of the above-mentioned suggestions for addressing resource efficiency of air
conditioners are already part of the most recent suggestions for other household
appliances(dishwashers, washing machines, refrigerators).
The overview of requirements in other ecodesign regulations shows that the emphasis is
placed on repair information, ease of dismantling and the availability of spare parts. The
effect of such requirements may have little impact in each regulation vertically as the
energy consumption often is the most important factor in relation to emission of CO2.
However, if material efficiency requirements are aligned across several regulations, the
impact can be much greater, and it ensures regulatory consistency within ecodesign
framework. In Table 18, different resource efficiency requirements in other regulations are
presented.
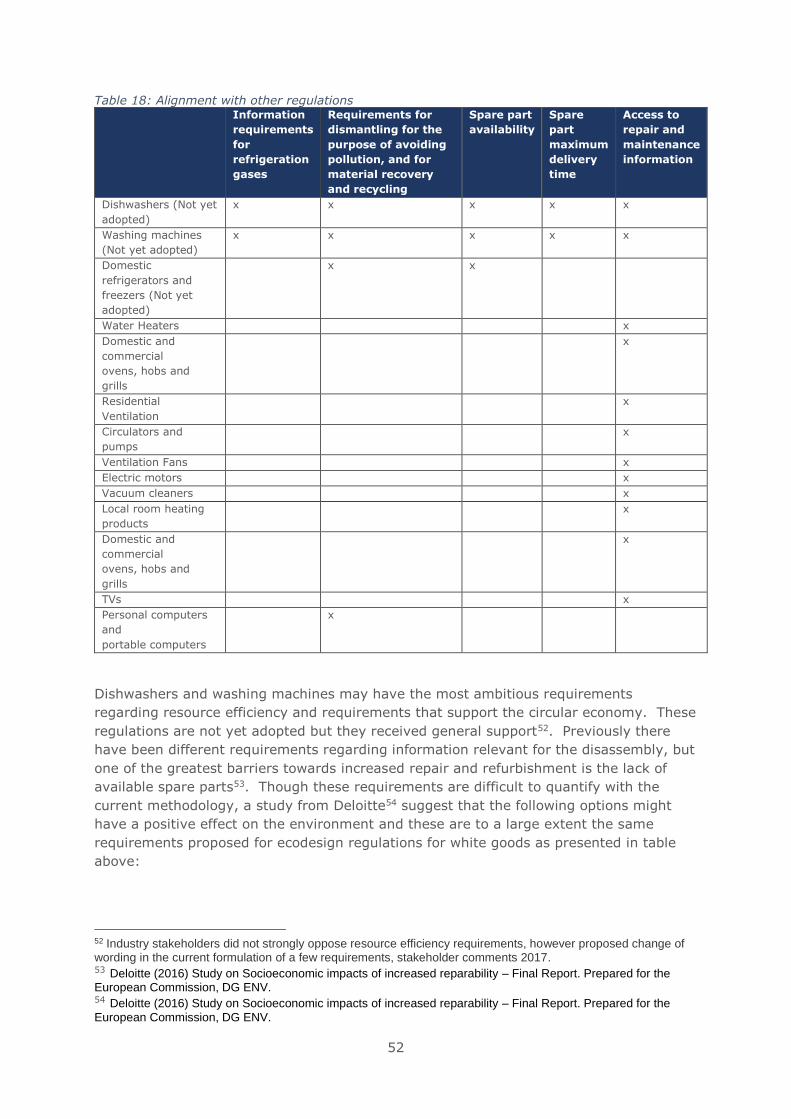
52
Table 18: Alignment with other regulations Information
requirements
for
refrigeration
gases
Requirements for
dismantling for the
purpose of avoiding
pollution, and for
material recovery
and recycling
Spare part
availability
Spare
part
maximum
delivery
time
Access to
repair and
maintenance
information
Dishwashers (Not yet
adopted)
x x x x x
Washing machines
(Not yet adopted)
x x x x x
Domestic
refrigerators and
freezers (Not yet
adopted)
x x
Water Heaters x
Domestic and
commercial
ovens, hobs and
grills
x
Residential
Ventilation
x
Circulators and
pumps
x
Ventilation Fans x
Electric motors x
Vacuum cleaners x
Local room heating
products
x
Domestic and
commercial
ovens, hobs and
grills
x
TVs x
Personal computers
and
portable computers
x
Dishwashers and washing machines may have the most ambitious requirements
regarding resource efficiency and requirements that support the circular economy. These
regulations are not yet adopted but they received general support52. Previously there
have been different requirements regarding information relevant for the disassembly, but
one of the greatest barriers towards increased repair and refurbishment is the lack of
available spare parts53. Though these requirements are difficult to quantify with the
current methodology, a study from Deloitte54 suggest that the following options might
have a positive effect on the environment and these are to a large extent the same
requirements proposed for ecodesign regulations for white goods as presented in table
above:
52 Industry stakeholders did not strongly oppose resource efficiency requirements, however proposed change of wording in the current formulation of a few requirements, stakeholder comments 2017. 53 Deloitte (2016) Study on Socioeconomic impacts of increased reparability – Final Report. Prepared for the European Commission, DG ENV. 54 Deloitte (2016) Study on Socioeconomic impacts of increased reparability – Final Report. Prepared for the
European Commission, DG ENV.
53
• Measures to ensure provision of information to consumers on possibilities to repair
the product
• Measures to ensure provision of technical information to facilitate repair to
professionals
• Measures to enable an easier dismantling of products
• Measures to ensure availability of spare parts for at least a certain amount of years
from the time that production ceases of the specific models
• Different combination of the above-mentioned options
The effect of these options and the study from Deloitte are further described in Annex 2.
Based on the above considerations it is therefore recommended to consider aligning with
resource efficiency requirements regulations for dishwashers/washing machines or
domestic refrigerators and freezers.
Recommendations regarding resource efficiency
The low collection rate of air conditioner and comfort fans can challenge the improvement
potential of any suggestions regarding resource efficiency since many products does not
reach the desired recycling facility. The collection rate is expected to increase and fulfil the
WEEE directive in 2019. The current low collection rates cannot be directly addressed in
the Ecodesign regulation since it is not related to the design of the product.
Based on the list of critical raw materials and the WEEE directive the following components
and materials are of special interest:
• Printed circuit boards
• Compressor and heat exchangers
These components should follow some of the common “design for X” practices described
in the beginning of section 4.4.2 so these targeted components could easily be repaired or
removed at End-of-Life supporting the WEEE directive and improving the recycling of
critical resources.
The possible points to be considered and discussed with stakeholders for improving
resource efficiency of air conditioners:
• Requirements of availability of spare parts (selected parts)
• Requirements of exploded views and instructions for disassembly
• Requirements regarding the number of operation to remove targeted components
(e.g. printed circuit boards greater than 10 square centimetres)
• Requirements of pump-down systems to minimise leakage of refrigerants End-of-
life
All the above suggestions should be carefully discussed since the impact can be difficult to
quantify, but also difficult for the market surveillance authorities to check. The
improvement potential is also difficult to quantify since the improvement potential is
calculated in CO2-eq. Though, the study from Deloitte55 indicates that some of these
55 Deloitte (2016) Study on Socioeconomic impacts of increased reparability – Final Report. Prepared for the European Commission, DG ENV.
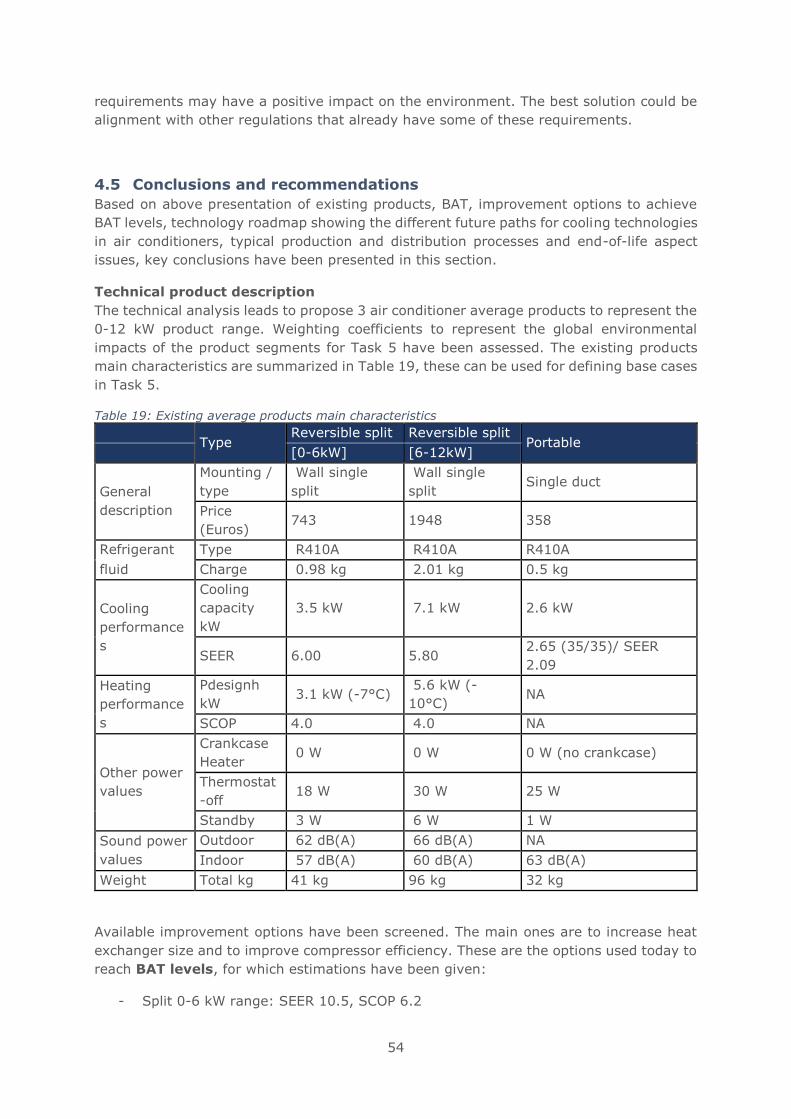
54
requirements may have a positive impact on the environment. The best solution could be
alignment with other regulations that already have some of these requirements.
4.5 Conclusions and recommendations
Based on above presentation of existing products, BAT, improvement options to achieve
BAT levels, technology roadmap showing the different future paths for cooling technologies
in air conditioners, typical production and distribution processes and end-of-life aspect
issues, key conclusions have been presented in this section.
Technical product description
The technical analysis leads to propose 3 air conditioner average products to represent the
0-12 kW product range. Weighting coefficients to represent the global environmental
impacts of the product segments for Task 5 have been assessed. The existing products
main characteristics are summarized in Table 19, these can be used for defining base cases
in Task 5.
Table 19: Existing average products main characteristics
Type Reversible split Reversible split
Portable [0-6kW] [6-12kW]
General
description
Mounting /
type
Wall single
split
Wall single
split Single duct
Price
(Euros) 743 1948 358
Refrigerant Type R410A R410A R410A
fluid Charge 0.98 kg 2.01 kg 0.5 kg
Cooling
performance
s
Cooling
capacity
kW
3.5 kW 7.1 kW 2.6 kW
SEER 6.00 5.80 2.65 (35/35)/ SEER
2.09
Heating
performance
s
Pdesignh
kW 3.1 kW (-7°C)
5.6 kW (-
10°C) NA
SCOP 4.0 4.0 NA
Other power
values
Crankcase
Heater 0 W 0 W 0 W (no crankcase)
Thermostat
-off 18 W 30 W 25 W
Standby 3 W 6 W 1 W
Sound power
values
Outdoor 62 dB(A) 66 dB(A) NA
Indoor 57 dB(A) 60 dB(A) 63 dB(A)
Weight Total kg 41 kg 96 kg 32 kg
Available improvement options have been screened. The main ones are to increase heat
exchanger size and to improve compressor efficiency. These are the options used today to
reach BAT levels, for which estimations have been given:
- Split 0-6 kW range: SEER 10.5, SCOP 6.2
55
- Split 6-12 k range: SEER 8 (SCOP=4), SCOP 4.9 (SEER=7.4)
- Portable: EER= 3.6 (35°/35°)/ SEER= 2.82
In view of a possible revision of the EU energy label, BNAT target values that can
typically be used to define the A energy class efficiency level have been assessed, with
values slightly above BAT levels:
- Split 0-6 kW range: SEER 11.3, SCOP 6.3
- Split 6-12 k range: SEER 11.3, SCOP 6.3
- Portable: EER of 5.45 (27/27) (or EER 4.9 at 35/35) and SEER of 4.3
All these units will have to use new refrigerant fluids by 2020 for portable air conditioners
and most of them by 2025 for split air conditioners below 12 kW (the ban does not apply
to multi-split units) according F-gas Regulation (EU) 517/2014. For split units, the
conversion to R32 (GWP 675) instead of R410A is already well advanced and best available
products, close to BAT levels, already use R32. However, for portable units, only one
manufacturer is starting to use refrigerant with lower than 150 GWP. In addition, since it
is proposed to change the metrics for a seasonal performance metrics, there are more
uncertainties on the technical options available to manufacturers to supply products in the
coming years. It is one of the reasons why the BAT level has been limited to EER of 3.6
(35°/35°) (present A++ existing product).
It is also to be noted that present BAT level split units in the 0-6 kW range and portable
air conditioners have sound power levels close to the maximum sound power requirements
in Regulation (EU) 206/2012. So, for these units, further limitation of sound power level
may come at a cost that is to be accounted for in life cycle cost evaluation. There is however
a larger margin for 6-12 kW split units, although it varies significantly depending on the
indoor unit mounting type.
Technology roadmap
There are ongoing R&D works to improve the efficiency and decrease the environmental
impact of HVAC systems in general which may affect the future of air conditioners. Urgent
research regards the refrigerant fluids to be used in a few years to replace present HFC is
also going on. Solar photovoltaic electric air conditioner could be developed in the coming
years, which can offer an interesting solution to consume more renewable electricity and
limit grid impact of air conditioning in southern EU countries. Several alternative
technologies to electric vapor compression could also reach the market before 2023 and
they can compete with present air conditioners; this includes magneto-caloric cooling and
electro-chemical compression.
Production and distribution
The BOM of air conditioners and comfort fans are largely maintained the same as presented
in the preparatory study as there is no evidence showing significant changes to the design
and material use for these products since the preparatory study.
End-of-life, resources criticality and efficiency
Total EU collection rate for large EEE equipment is 37% in 2014. The collection rate is
expected to increase to 65 % in 2019. The current low collection rate of these products
cannot be directly addressed in the Ecodesign regulation, but should be addressed by each
Member State how they will fulfil their obligation regarding the WEEE directive.

56
After collection the air conditioners are shredded at specialised facilities with an assumed
recycling rate above 85 % as most of the air conditioners consist of iron. The recycling rate
of iron is expected to be high. Though, the critical resources are mainly located in the heat
exchanger, compressor, and the printed circuits boards as they all contain platinum group
metals. It should therefore be investigated how the recycling of these components can be
improved. This can be done by simple design guidelines which improve the liberation or
removal at End-of-Life. Some of these suggestions are already included in other regulations
and it could prove beneficial to align with these regulations.
These suggestions should be properly discussed with stakeholders.
57
Annex 1: Design guidelines
The following design guidelines are common design guidelines improving the recycling
and repair process of EEE products and are not only specifically targeting air conditioners
or comfort fans. The guidelines provide a number of ideas of simple operation which
improves the resource efficiency of products either in the recycling process or by a
prolonged life.
Design for recycling
Design for recycling is quite complicated due to the mix of products at End-of-Life. Different
products are discarded together which increases the complexity and risk of contamination.
Even within the same product group contaminant can appear. To prevent contamination
End-of-Life and to improve the quality of the recycled product it is important to consider
the material mix and how the different materials are liberated at End-of-Life. For design
for recycling, it is important to consider56:
• To reduce the use of materials, and especially the use of materials that will cause
loss or contamination in the recycling process. It should be considered how the
materials would behave in the sorting and processing End-of-Life
• To identify materials in assemblies combined in an inappropriate way so resources
are lost during recycling. E.g. the connection between a metal screws and plastic,
where one of them may be lost due to incomplete liberation. Also, some mix of
metal are problematic, and the different types om smelters cannot handle all types
of metal. In Figure 18 the metal wheel is shown which explains which resources can
be recovered by the different smelters. In Table 20 a rough guideline for plastic
recyclability is shown.
• Proper labelling both on plastic, but also general futures such as marking of tapping
points of generators
• Minimise the use non-reversible adhesives, and avoid the use of bolt/rivets to obtain
maximum liberation at End-Of-Life
56 Reuter, M.A. & Schaik, A.V.A.N., 2013. 10 Design for Recycling Rules , Product Centric Recycling & Urban / Landfill Mining. , pp.1–15.
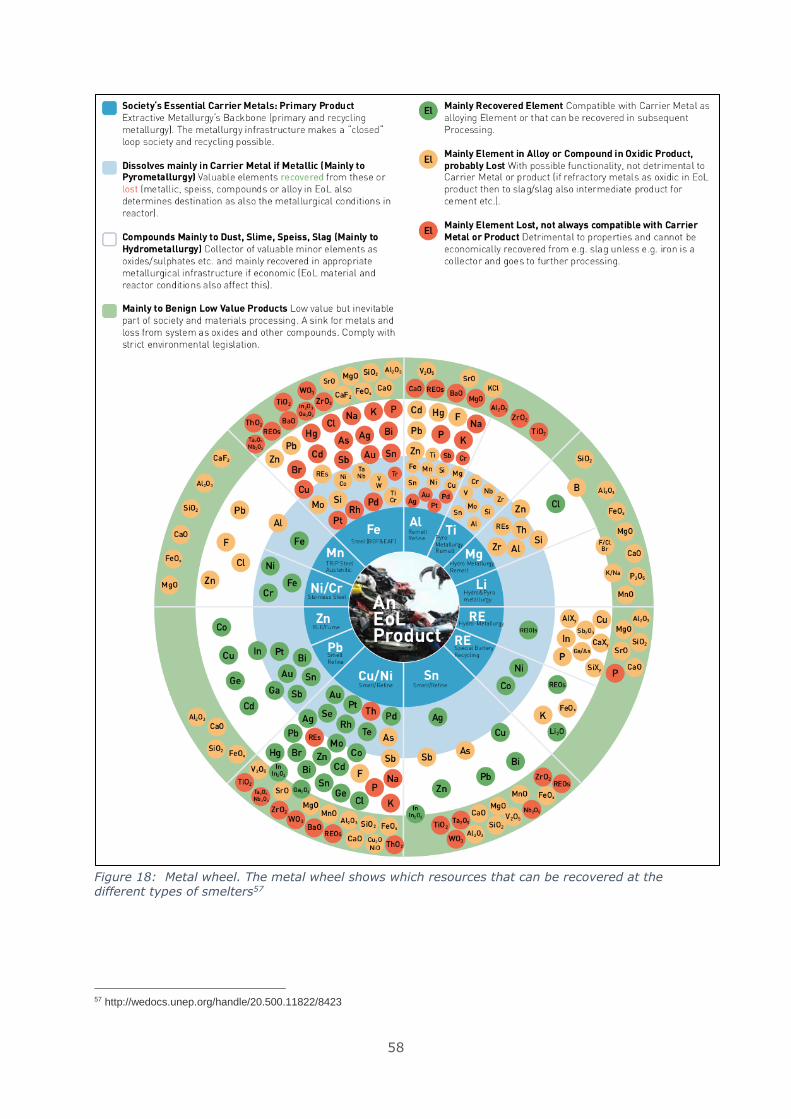
58
Figure 18: Metal wheel. The metal wheel shows which resources that can be recovered at the different types of smelters57
57 http://wedocs.unep.org/handle/20.500.11822/8423
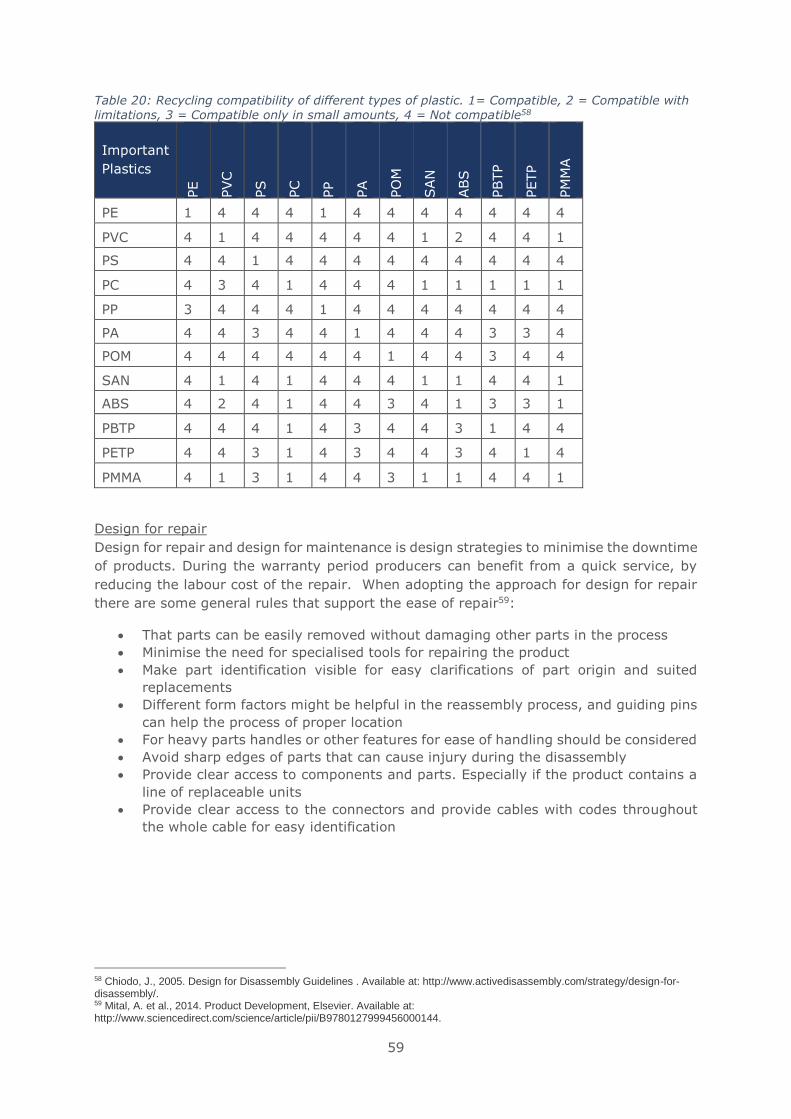
59
Table 20: Recycling compatibility of different types of plastic. 1= Compatible, 2 = Compatible with
limitations, 3 = Compatible only in small amounts, 4 = Not compatible58
Important
Plastics
PE
PVC
PS
PC
PP
PA
PO
M
SAN
ABS
PBTP
PETP
PM
MA
PE 1 4 4 4 1 4 4 4 4 4 4 4
PVC 4 1 4 4 4 4 4 1 2 4 4 1
PS 4 4 1 4 4 4 4 4 4 4 4 4
PC 4 3 4 1 4 4 4 1 1 1 1 1
PP 3 4 4 4 1 4 4 4 4 4 4 4
PA 4 4 3 4 4 1 4 4 4 3 3 4
POM 4 4 4 4 4 4 1 4 4 3 4 4
SAN 4 1 4 1 4 4 4 1 1 4 4 1
ABS 4 2 4 1 4 4 3 4 1 3 3 1
PBTP 4 4 4 1 4 3 4 4 3 1 4 4
PETP 4 4 3 1 4 3 4 4 3 4 1 4
PMMA 4 1 3 1 4 4 3 1 1 4 4 1
Design for repair
Design for repair and design for maintenance is design strategies to minimise the downtime
of products. During the warranty period producers can benefit from a quick service, by
reducing the labour cost of the repair. When adopting the approach for design for repair
there are some general rules that support the ease of repair59:
• That parts can be easily removed without damaging other parts in the process
• Minimise the need for specialised tools for repairing the product
• Make part identification visible for easy clarifications of part origin and suited
replacements
• Different form factors might be helpful in the reassembly process, and guiding pins
can help the process of proper location
• For heavy parts handles or other features for ease of handling should be considered
• Avoid sharp edges of parts that can cause injury during the disassembly
• Provide clear access to components and parts. Especially if the product contains a
line of replaceable units
• Provide clear access to the connectors and provide cables with codes throughout
the whole cable for easy identification
58 Chiodo, J., 2005. Design for Disassembly Guidelines . Available at: http://www.activedisassembly.com/strategy/design-for-disassembly/. 59 Mital, A. et al., 2014. Product Development, Elsevier. Available at: http://www.sciencedirect.com/science/article/pii/B9780127999456000144.
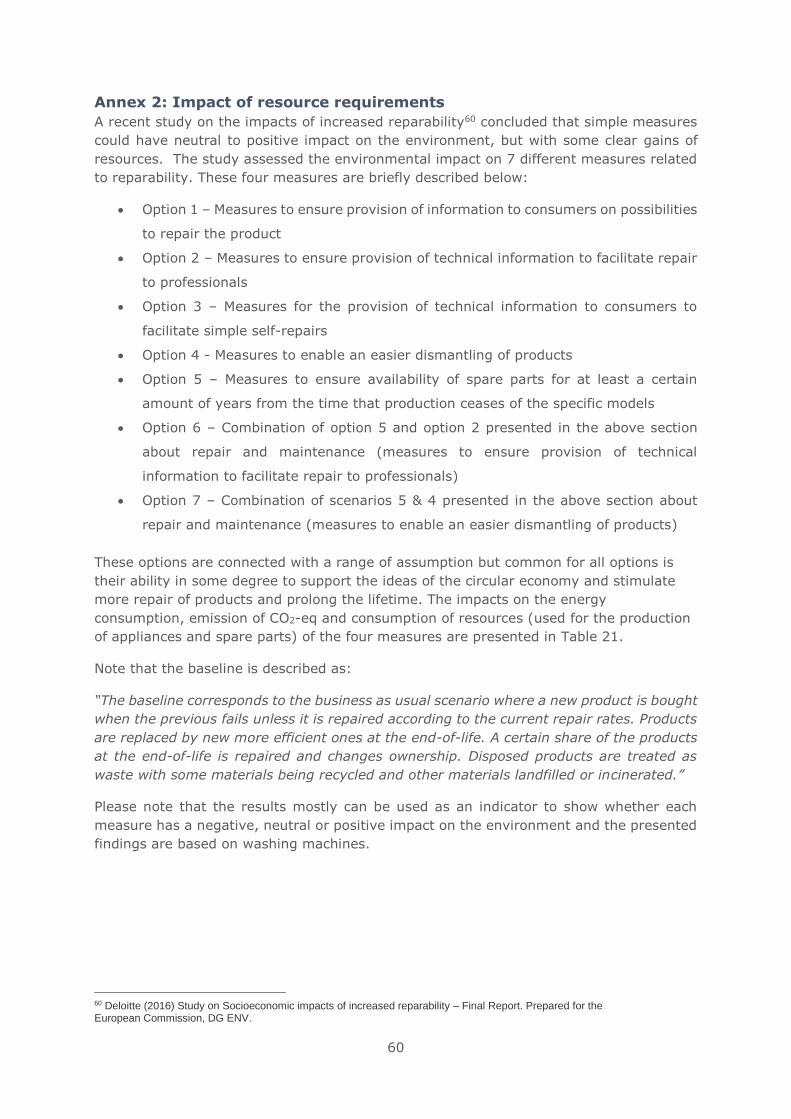
60
Annex 2: Impact of resource requirements
A recent study on the impacts of increased reparability60 concluded that simple measures
could have neutral to positive impact on the environment, but with some clear gains of
resources. The study assessed the environmental impact on 7 different measures related
to reparability. These four measures are briefly described below:
• Option 1 – Measures to ensure provision of information to consumers on possibilities
to repair the product
• Option 2 – Measures to ensure provision of technical information to facilitate repair
to professionals
• Option 3 – Measures for the provision of technical information to consumers to
facilitate simple self-repairs
• Option 4 - Measures to enable an easier dismantling of products
• Option 5 – Measures to ensure availability of spare parts for at least a certain
amount of years from the time that production ceases of the specific models
• Option 6 – Combination of option 5 and option 2 presented in the above section
about repair and maintenance (measures to ensure provision of technical
information to facilitate repair to professionals)
• Option 7 – Combination of scenarios 5 & 4 presented in the above section about
repair and maintenance (measures to enable an easier dismantling of products)
These options are connected with a range of assumption but common for all options is
their ability in some degree to support the ideas of the circular economy and stimulate
more repair of products and prolong the lifetime. The impacts on the energy
consumption, emission of CO2-eq and consumption of resources (used for the production
of appliances and spare parts) of the four measures are presented in Table 21.
Note that the baseline is described as:
“The baseline corresponds to the business as usual scenario where a new product is bought
when the previous fails unless it is repaired according to the current repair rates. Products
are replaced by new more efficient ones at the end-of-life. A certain share of the products
at the end-of-life is repaired and changes ownership. Disposed products are treated as
waste with some materials being recycled and other materials landfilled or incinerated.”
Please note that the results mostly can be used as an indicator to show whether each
measure has a negative, neutral or positive impact on the environment and the presented
findings are based on washing machines.
60 Deloitte (2016) Study on Socioeconomic impacts of increased reparability – Final Report. Prepared for the European Commission, DG ENV.
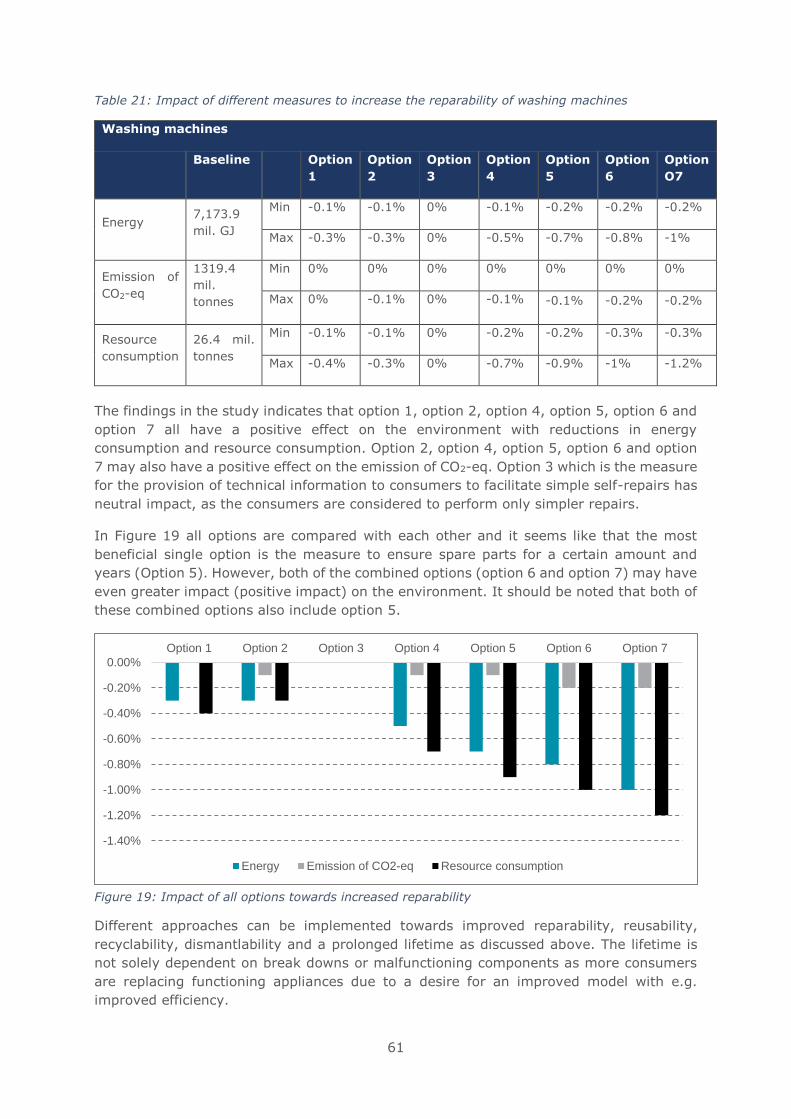
61
Table 21: Impact of different measures to increase the reparability of washing machines
Washing machines
Baseline Option
1
Option
2
Option
3
Option
4
Option
5
Option
6
Option
O7
Energy 7,173.9
mil. GJ
Min -0.1% -0.1% 0% -0.1% -0.2% -0.2% -0.2%
Max -0.3% -0.3% 0% -0.5% -0.7% -0.8% -1%
Emission of
CO2-eq
1319.4
mil.
tonnes
Min 0% 0% 0% 0% 0% 0% 0%
Max 0% -0.1% 0% -0.1% -0.1% -0.2% -0.2%
Resource
consumption
26.4 mil.
tonnes
Min -0.1% -0.1% 0% -0.2% -0.2% -0.3% -0.3%
Max -0.4% -0.3% 0% -0.7% -0.9% -1% -1.2%
The findings in the study indicates that option 1, option 2, option 4, option 5, option 6 and
option 7 all have a positive effect on the environment with reductions in energy
consumption and resource consumption. Option 2, option 4, option 5, option 6 and option
7 may also have a positive effect on the emission of CO2-eq. Option 3 which is the measure
for the provision of technical information to consumers to facilitate simple self-repairs has
neutral impact, as the consumers are considered to perform only simpler repairs.
In Figure 19 all options are compared with each other and it seems like that the most
beneficial single option is the measure to ensure spare parts for a certain amount and
years (Option 5). However, both of the combined options (option 6 and option 7) may have
even greater impact (positive impact) on the environment. It should be noted that both of
these combined options also include option 5.
Figure 19: Impact of all options towards increased reparability
Different approaches can be implemented towards improved reparability, reusability,
recyclability, dismantlability and a prolonged lifetime as discussed above. The lifetime is
not solely dependent on break downs or malfunctioning components as more consumers
are replacing functioning appliances due to a desire for an improved model with e.g.
improved efficiency.
-1.40%
-1.20%
-1.00%
-0.80%
-0.60%
-0.40%
-0.20%
0.00%
Option 1 Option 2 Option 3 Option 4 Option 5 Option 6 Option 7
Energy Emission of CO2-eq Resource consumption
1
Review of Regulation 206/2012 and
626/2011
Air conditioners and comfort fans
Task 5 report
ENVIRONMENT & ECONOMICS
Final version
Date: May 2018

2
Prepared by:
Viegand Maagøe and ARMINES
Study team: Baijia Huang, Jan Viegand, Peter Martin Skov Hansen, Philippe Riviere
Quality manager: Jan Viegand
Website design and management: Viegand Maagøe A/S
Contract manager: Viegand Maagøe A/S
Prepared for:
European Commission
DG ENER C.3
Office: DM24 04/048
B-1049 Brussels, Belgium
Contact person: Veerle Beelaerts
E-mail: [email protected]
Project website: www.eco-airconditioners.eu
Specific contract no.: No. ENER/C3/FV 2016-537/03/FWC 2015-619
LOT2/01/SI2.749247
Implements Framework Contract: № ENER/C3/2015-619 LOT 2
This study was ordered and paid for by the European Commission, Directorate-General
for Energy.
As agreed with Policy Officer Veerle Beelaerts, some of the budget for data purchase was
reallocated for project work.
The information and views set out in this study are those of the author(s) and do not
necessarily reflect the official opinion of the Commission. The Commission does not
guarantee the accuracy of the data included in this study. Neither the Commission nor any
person acting on the Commission’s behalf may be held responsible for the use which may
be made of the information contained therein.
This report has been prepared by the authors to the best of their ability and knowledge.
The authors do not assume liability for any damage, material or immaterial, that may arise
from the use of the report or the information contained therein.
© European Union, May 2018.
Reproduction is authorised provided the source is acknowledged.
More information on the European Union is available on the internet (http://europa.eu).
Viegand Maagøe A/S
Nr. Farimagsgade 37
1364 Copenhagen K
Denmark
viegandmaagoe.dk
3
Table of contents List of Tables ........................................................................................................ 4
List of Figures ....................................................................................................... 5
Abbreviations ........................................................................................................ 6
Introduction to the task reports ............................................................................... 7
5 Introduction to Task 5 ...................................................................................... 9
5.1 Product‐specific inputs ............................................................................... 9
5.1.1 Test standard for performance and consumption data ..............................10
5.1.2 Economic data .....................................................................................10
5.1.3 Annual resources consumption (energy) .................................................12
5.1.4 Resources and End-of-Life ....................................................................15
5.2 Base‐Case Environmental Impact Assessment .............................................18
5.3 Base‐Case Life Cycle Costs for consumer ....................................................25
5.4 EU Totals ..................................................................................................26
5.5 Conclusions and recommendations ..............................................................30
Annex 1: Impact of refrigerant ............................................................................32
4
List of Tables Table 1: EU 28 annual sales and estimated stock of all air conditioners in scope ...........10
Table 2: Repartition of split product per class in number and capacity in 2015 .............11
Table 3: Input economic data for EcoReport tool ......................................................12
Table 4: An extract of information from task 3 and 4 to calculate the energy consumption
..........................................................................................................................13
Table 5: An extract of information from task 3 and 4 to calculate the energy consumption
..........................................................................................................................15
Table 6: The weight to size ratio of air conditioners (base cases) ................................16
Table 7: Average material composition of air conditioners .........................................16
Table 8: The calculated material composition ...........................................................16
Table 9: Recycling rates from EcoReport Tool adopted in the current study ..................17
Table 10: Impacts BC 1 Reversible split [0-6 kW] .....................................................22
Table 11: Impacts BC 2 Reversible split [6-12 kW] ...................................................22
Table 12: Impacts – BC 3 Portable air conditioner ....................................................22
Table 13: All impact categories for BC 1- Reversible split [0-6 kW]. The life cycle phase
with the highest impact for each of the categories is highlighted with red text. .............23
Table 14: All impact categories for BC 2 Reversible split [6-12kW]. The life cycle phase
with the highest impact for each of the categories is highlighted with red text. .............23
Table 15: All impact categories for BC 3 Portable air conditioner. The life cycle phase with
the highest impact for each of the categories is highlighted with red text. ...................24
Table 16: Life cycle cost of the three base cases ......................................................26
Table 17: Environmental impacts during the entire lifetime of air conditioner sold in 2015
..........................................................................................................................27
Table 18: Environmental impacts of air conditioner (EU-27 stock) ..............................28
Table 19: Environmental impact share of EU total impacts (EU-27 stock) ....................28
Table 20: Annual consumer expenditure in EU27 ......................................................29
Table 21: The combined impact and value of gold and copper in all air conditioners
(stock) ................................................................................................................30
Table 22: Calculated leakage of refrigerants per year ................................................32
5
List of Figures Figure 1: Total energy consumption BC 1 Reversible split [0-6kW] .............................20
Figure 2: Global warming potential BC 1 Reversible split [0-6kW] ...............................20
Figure 3: Total energy consumption – BC 2 Reversible split [6-12kW] .........................20
Figure 4: Global warming potential – BC 2 Reversible split [6-12kW] ..........................21
Figure 5: Total energy consumption – BC 3 Portable air conditioner ............................21
Figure 6: Global warming potential – BC 3 Portable air conditioner .............................21
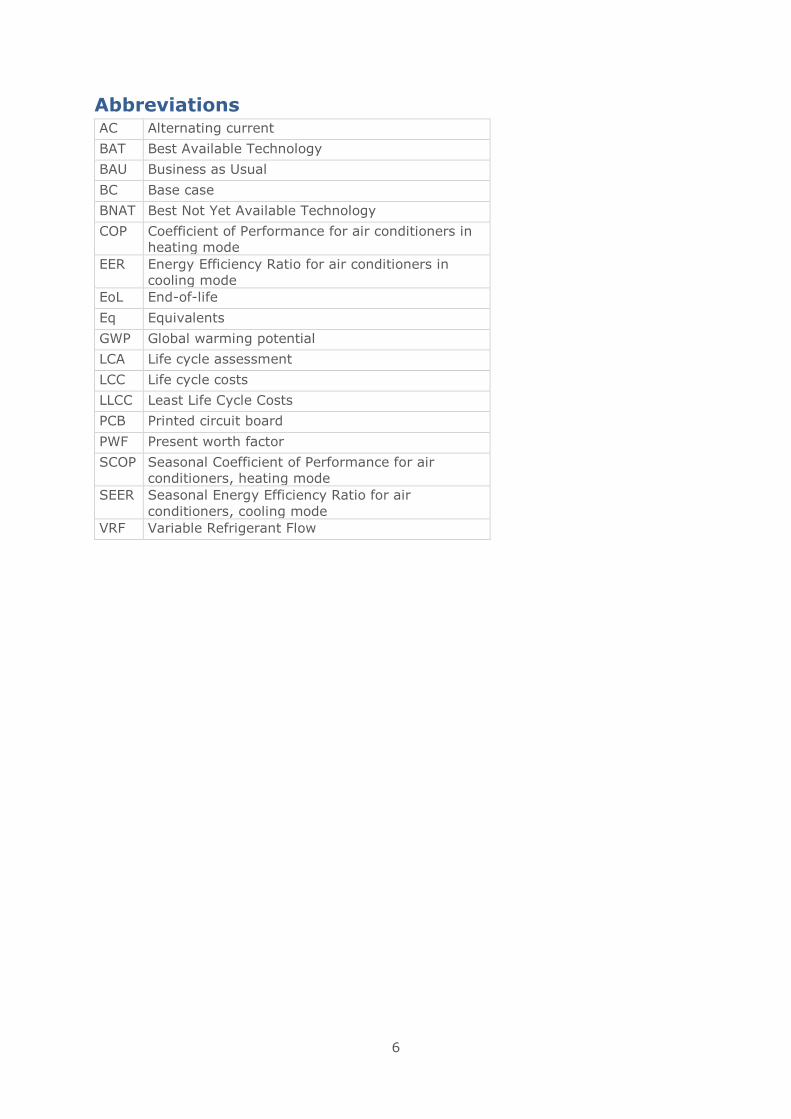
6
Abbreviations AC Alternating current
BAT Best Available Technology
BAU Business as Usual
BC Base case
BNAT Best Not Yet Available Technology
COP Coefficient of Performance for air conditioners in
heating mode
EER Energy Efficiency Ratio for air conditioners in
cooling mode
EoL End-of-life
Eq Equivalents
GWP Global warming potential
LCA Life cycle assessment
LCC Life cycle costs
LLCC Least Life Cycle Costs
PCB Printed circuit board
PWF Present worth factor
SCOP Seasonal Coefficient of Performance for air
conditioners, heating mode
SEER Seasonal Energy Efficiency Ratio for air
conditioners, cooling mode
VRF Variable Refrigerant Flow

7
Introduction to the task reports This is the introduction to the interim report of the preparatory study on the Review of
Regulation 206/2012 and 626/2011 for air conditioners and comfort fans. The interim
report has been split into five tasks, following the structure of the MEErP methodology.
Each task report has been uploaded individually in the project’s website. These task reports
present the technical basis to define future ecodesign and energy labelling requirements
based on the existing Regulation (EU) 206/2012 and 626/2011.
The task reports start with the definition of the scope for this review study (i.e. task 1),
which assesses the current scope of the existing regulation in light of recent developments
with relevant legislation, standardisation and voluntary agreements in the EU and abroad.
Furthermore, assessing the possibility of merging implementing measures that cover the
similar groups of products or extend the scope to include new product groups. The
assessment results in a refined scope for this review study.
Following it is task 2, which updates the annual sales and stock of the products in scope
according to recent and future market trends and estimates future stocks. Furthermore, it
provides an update on the current development of low-GWP alternatives and sound
pressure level.
Next task is task 3, which presents a detailed overview of use patterns of products in scope
according to consumer use and technological developments. It also provides an analysis of
other aspects that affect the energy consumption during the use of these products, such
as component technologies. Furthermore, it also touches on aspects that are important for
material and resource efficiency such as repair and maintenance, and it gives an overview
of what happens to these products at their end of life.
Task 4 presents an analysis of current average technologies at product and component
level, and it identifies the Best Available Technologies both at product and component level.
An overview of the technical specifications as well as their overall energy consumption is
provided when data is available. Finally, the chapter discusses possible design options to
improve the resource efficiency.
Simplified tasks 5 & 6 report presents the base cases, which will be later used to define
the current and future impact of the current air condition regulation if no action is taken.
The report shows the base cases energy consumption at product category level and their
life cycle costs. It also provides a high-level overview of the life cycle global warming
potential of air conditioners and comfort fans giving an idea of the contribution of each life
cycle stage to the overall environmental impact. Finally, it presents some identified design
options which will be used to define reviewed ecodesign and energy labelling requirements.
Task 7 report presents the policy options for an amended ecodesign regulation on air
conditioners and comfort fans. The options have been developed based on the work
throughout this review study, dialogue with stakeholders and with the European
Commission. The report presents an overview of the barriers and opportunities for the
reviewed energy efficiency policy options, and the rationale for the new
material/refrigerant efficiency policy options. This report will be the basis to calculate the
estimated energy and material savings potentials by implementing these policy options, in
comparison to no action (i.e. Business as Usual – BAU).

8
The task reports follow the MEErP methodology, with some adaptations which suit the
study goals.
9
5 Introduction to Task 5 Task 5 follows the MEErP methodology and aims to identify base cases based on findings
from previously performed tasks. The base cases are used to quantify the environmental
impacts and the life cycle costs of air conditioners and comfort fans. The base cases will
also be used in later tasks to identify the improvement potential. Task 5 includes the
following sections:
1. Product‐specific inputs: Base cases based on previous tasks.
2. Base‐Case Environmental Impact Assessment: Using the EcoReport tool to
calculate emission/resource categories
3. Base‐Case Life Cycle Costs for consumer: Life Cycle Costs (LCC) of air conditioners
and comfort fans
4. EU Totals: Aggregated environmental impacts and Life Cycle Costs
5. Conclusions and recommendations
5.1 Product‐specific inputs
In this task, three base cases are defined based on the data and information from Task 4:
• Base case 1: for fixed reversible air conditioners < 6 kW, 3.5 kW wall single split
• Base case 2: for fixed reversible air in range of 6 – 12 kW, 7.1 kW wall single split
• Base case 3: for portable air conditioner, 2.6 kW single duct
The final EcoReport Tool inputs for the base cases built through the work of tasks 1 – 4 are
presented in this task.
Task 1 analyses show the relevance of extending the scope to include ventilation exhaust
air conditioners in the regulation, however it is not identified as a separate base case due
to lack of reliable data for sales and performance.
Base-Case Environmental Impact Assessment and Base-Case Life Cycle Costs for the
consumers have been established per base case and aggregated at EU level.
This task summarises the data, assess the environmental and economic impact of the
products in scope, and list improvement potentials and barriers for use in Tasks 6-7
Regarding comfort fans no changes have been suggested in the previous tasks, so the base
cases and impacts of the base cases are unchanged since the preparatory study. The
comfort fans will therefore not be further assessed.
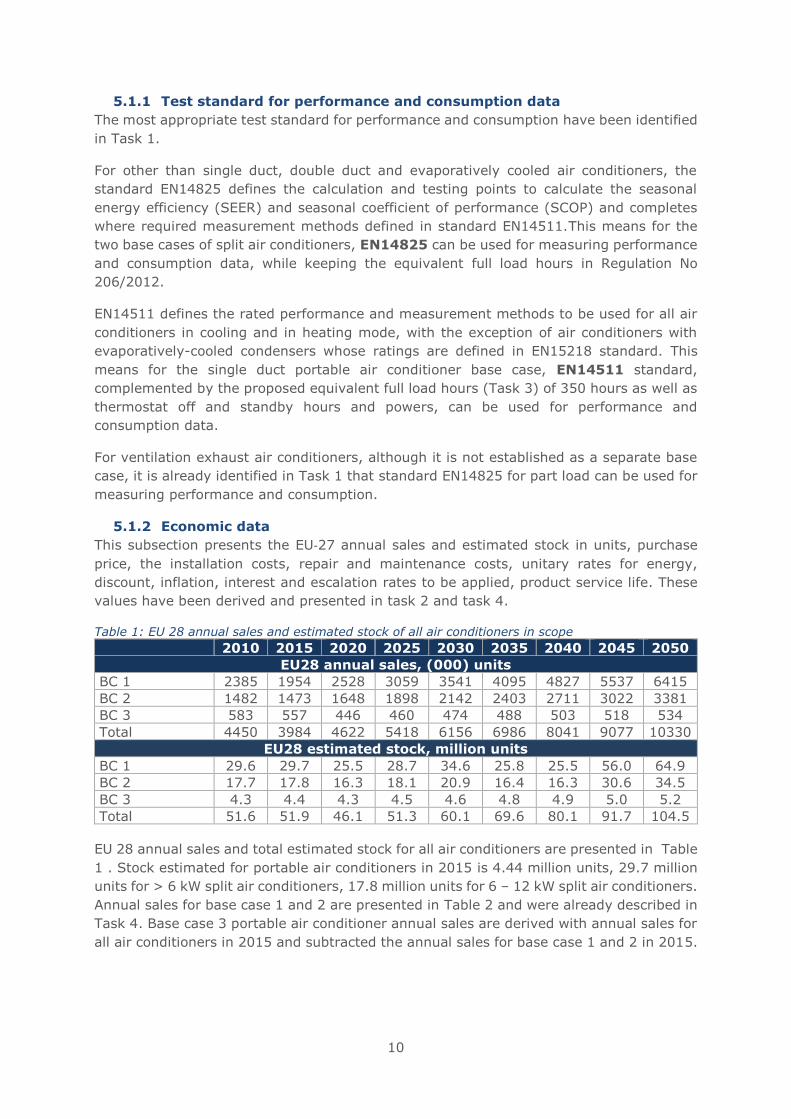
10
5.1.1 Test standard for performance and consumption data
The most appropriate test standard for performance and consumption have been identified
in Task 1.
For other than single duct, double duct and evaporatively cooled air conditioners, the
standard EN14825 defines the calculation and testing points to calculate the seasonal
energy efficiency (SEER) and seasonal coefficient of performance (SCOP) and completes
where required measurement methods defined in standard EN14511.This means for the
two base cases of split air conditioners, EN14825 can be used for measuring performance
and consumption data, while keeping the equivalent full load hours in Regulation No
206/2012.
EN14511 defines the rated performance and measurement methods to be used for all air
conditioners in cooling and in heating mode, with the exception of air conditioners with
evaporatively-cooled condensers whose ratings are defined in EN15218 standard. This
means for the single duct portable air conditioner base case, EN14511 standard,
complemented by the proposed equivalent full load hours (Task 3) of 350 hours as well as
thermostat off and standby hours and powers, can be used for performance and
consumption data.
For ventilation exhaust air conditioners, although it is not established as a separate base
case, it is already identified in Task 1 that standard EN14825 for part load can be used for
measuring performance and consumption.
5.1.2 Economic data
This subsection presents the EU‐27 annual sales and estimated stock in units, purchase
price, the installation costs, repair and maintenance costs, unitary rates for energy,
discount, inflation, interest and escalation rates to be applied, product service life. These
values have been derived and presented in task 2 and task 4.
Table 1: EU 28 annual sales and estimated stock of all air conditioners in scope 2010 2015 2020 2025 2030 2035 2040 2045 2050
EU28 annual sales, (000) units
BC 1 2385 1954 2528 3059 3541 4095 4827 5537 6415
BC 2 1482 1473 1648 1898 2142 2403 2711 3022 3381
BC 3 583 557 446 460 474 488 503 518 534
Total 4450 3984 4622 5418 6156 6986 8041 9077 10330
EU28 estimated stock, million units
BC 1 29.6 29.7 25.5 28.7 34.6 25.8 25.5 56.0 64.9
BC 2 17.7 17.8 16.3 18.1 20.9 16.4 16.3 30.6 34.5
BC 3 4.3 4.4 4.3 4.5 4.6 4.8 4.9 5.0 5.2
Total 51.6 51.9 46.1 51.3 60.1 69.6 80.1 91.7 104.5
EU 28 annual sales and total estimated stock for all air conditioners are presented in Table
1 . Stock estimated for portable air conditioners in 2015 is 4.44 million units, 29.7 million
units for > 6 kW split air conditioners, 17.8 million units for 6 – 12 kW split air conditioners.
Annual sales for base case 1 and 2 are presented in Table 2 and were already described in
Task 4. Base case 3 portable air conditioner annual sales are derived with annual sales for
all air conditioners in 2015 and subtracted the annual sales for base case 1 and 2 in 2015.
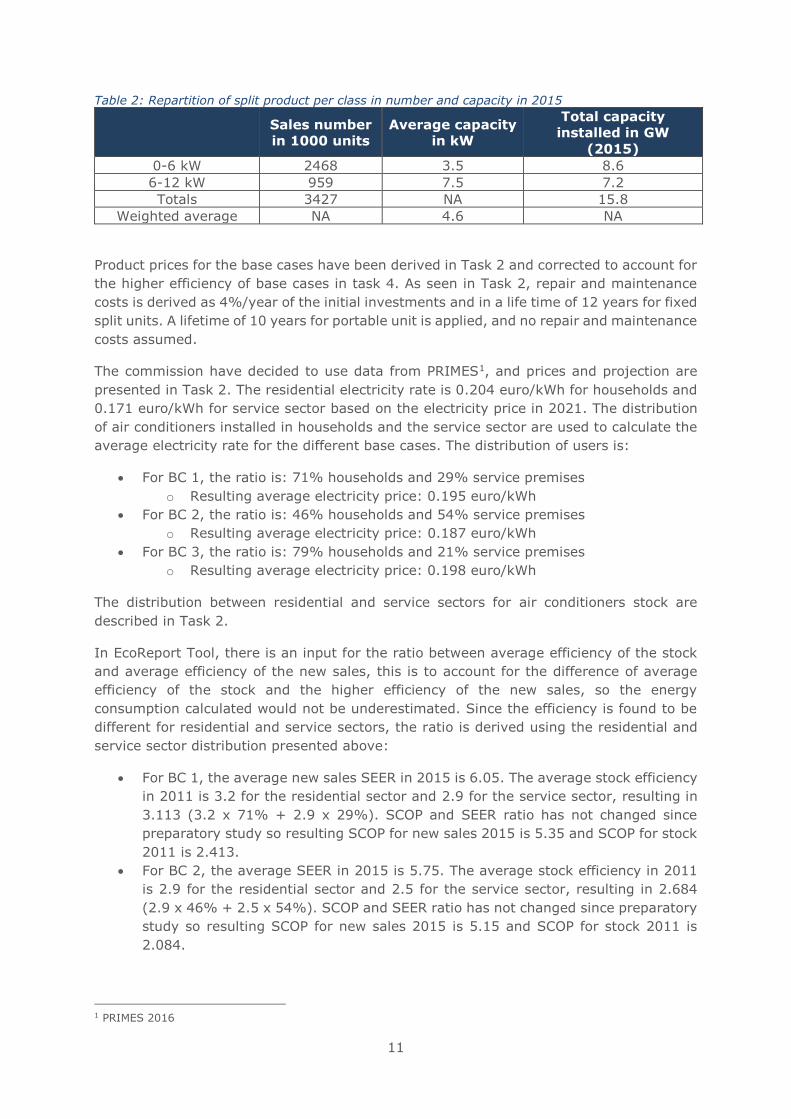
11
Table 2: Repartition of split product per class in number and capacity in 2015
Sales number
in 1000 units
Average capacity
in kW
Total capacity
installed in GW
(2015)
0-6 kW 2468 3.5 8.6
6-12 kW 959 7.5 7.2
Totals 3427 NA 15.8
Weighted average NA 4.6 NA
Product prices for the base cases have been derived in Task 2 and corrected to account for
the higher efficiency of base cases in task 4. As seen in Task 2, repair and maintenance
costs is derived as 4%/year of the initial investments and in a life time of 12 years for fixed
split units. A lifetime of 10 years for portable unit is applied, and no repair and maintenance
costs assumed.
The commission have decided to use data from PRIMES1, and prices and projection are
presented in Task 2. The residential electricity rate is 0.204 euro/kWh for households and
0.171 euro/kWh for service sector based on the electricity price in 2021. The distribution
of air conditioners installed in households and the service sector are used to calculate the
average electricity rate for the different base cases. The distribution of users is:
• For BC 1, the ratio is: 71% households and 29% service premises
o Resulting average electricity price: 0.195 euro/kWh
• For BC 2, the ratio is: 46% households and 54% service premises
o Resulting average electricity price: 0.187 euro/kWh
• For BC 3, the ratio is: 79% households and 21% service premises
o Resulting average electricity price: 0.198 euro/kWh
The distribution between residential and service sectors for air conditioners stock are
described in Task 2.
In EcoReport Tool, there is an input for the ratio between average efficiency of the stock
and average efficiency of the new sales, this is to account for the difference of average
efficiency of the stock and the higher efficiency of the new sales, so the energy
consumption calculated would not be underestimated. Since the efficiency is found to be
different for residential and service sectors, the ratio is derived using the residential and
service sector distribution presented above:
• For BC 1, the average new sales SEER in 2015 is 6.05. The average stock efficiency
in 2011 is 3.2 for the residential sector and 2.9 for the service sector, resulting in
3.113 (3.2 x 71% + 2.9 x 29%). SCOP and SEER ratio has not changed since
preparatory study so resulting SCOP for new sales 2015 is 5.35 and SCOP for stock
2011 is 2.413.
• For BC 2, the average SEER in 2015 is 5.75. The average stock efficiency in 2011
is 2.9 for the residential sector and 2.5 for the service sector, resulting in 2.684
(2.9 x 46% + 2.5 x 54%). SCOP and SEER ratio has not changed since preparatory
study so resulting SCOP for new sales 2015 is 5.15 and SCOP for stock 2011 is
2.084.
1 PRIMES 2016
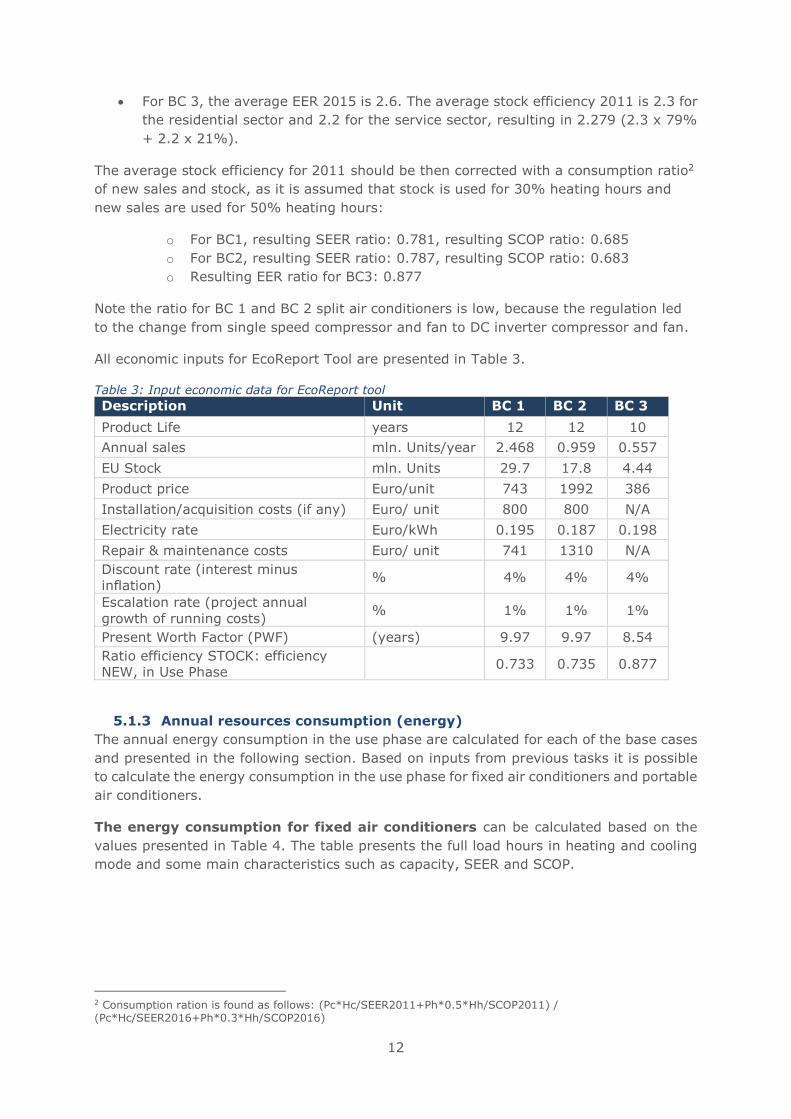
12
• For BC 3, the average EER 2015 is 2.6. The average stock efficiency 2011 is 2.3 for
the residential sector and 2.2 for the service sector, resulting in 2.279 (2.3 x 79%
+ 2.2 x 21%).
The average stock efficiency for 2011 should be then corrected with a consumption ratio2
of new sales and stock, as it is assumed that stock is used for 30% heating hours and
new sales are used for 50% heating hours:
o For BC1, resulting SEER ratio: 0.781, resulting SCOP ratio: 0.685
o For BC2, resulting SEER ratio: 0.787, resulting SCOP ratio: 0.683
o Resulting EER ratio for BC3: 0.877
Note the ratio for BC 1 and BC 2 split air conditioners is low, because the regulation led
to the change from single speed compressor and fan to DC inverter compressor and fan.
All economic inputs for EcoReport Tool are presented in Table 3.
Table 3: Input economic data for EcoReport tool
Description Unit BC 1 BC 2 BC 3
Product Life years 12 12 10
Annual sales mln. Units/year 2.468 0.959 0.557
EU Stock mln. Units 29.7 17.8 4.44
Product price Euro/unit 743 1992 386
Installation/acquisition costs (if any) Euro/ unit 800 800 N/A
Electricity rate Euro/kWh 0.195 0.187 0.198
Repair & maintenance costs Euro/ unit 741 1310 N/A
Discount rate (interest minus
inflation) % 4% 4% 4%
Escalation rate (project annual
growth of running costs) % 1% 1% 1%
Present Worth Factor (PWF) (years) 9.97 9.97 8.54
Ratio efficiency STOCK: efficiency
NEW, in Use Phase 0.733 0.735 0.877
5.1.3 Annual resources consumption (energy)
The annual energy consumption in the use phase are calculated for each of the base cases
and presented in the following section. Based on inputs from previous tasks it is possible
to calculate the energy consumption in the use phase for fixed air conditioners and portable
air conditioners.
The energy consumption for fixed air conditioners can be calculated based on the
values presented in Table 4. The table presents the full load hours in heating and cooling
mode and some main characteristics such as capacity, SEER and SCOP.
2 Consumption ration is found as follows: (Pc*Hc/SEER2011+Ph*0.5*Hh/SCOP2011) / (Pc*Hc/SEER2016+Ph*0.3*Hh/SCOP2016)
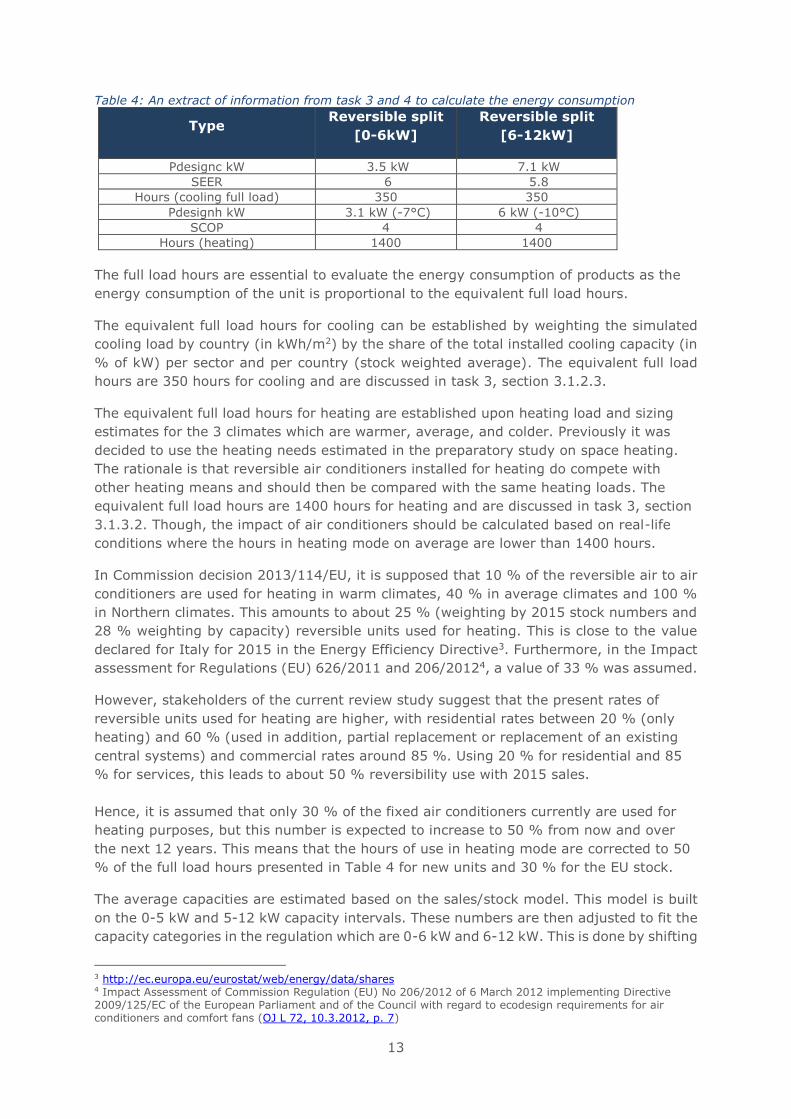
13
Table 4: An extract of information from task 3 and 4 to calculate the energy consumption
Type Reversible split
[0-6kW]
Reversible split
[6-12kW]
Pdesignc kW 3.5 kW 7.1 kW
SEER 6 5.8
Hours (cooling full load) 350 350
Pdesignh kW 3.1 kW (-7°C) 6 kW (-10°C)
SCOP 4 4
Hours (heating) 1400 1400
The full load hours are essential to evaluate the energy consumption of products as the
energy consumption of the unit is proportional to the equivalent full load hours.
The equivalent full load hours for cooling can be established by weighting the simulated
cooling load by country (in kWh/m2) by the share of the total installed cooling capacity (in
% of kW) per sector and per country (stock weighted average). The equivalent full load
hours are 350 hours for cooling and are discussed in task 3, section 3.1.2.3.
The equivalent full load hours for heating are established upon heating load and sizing
estimates for the 3 climates which are warmer, average, and colder. Previously it was
decided to use the heating needs estimated in the preparatory study on space heating.
The rationale is that reversible air conditioners installed for heating do compete with
other heating means and should then be compared with the same heating loads. The
equivalent full load hours are 1400 hours for heating and are discussed in task 3, section
3.1.3.2. Though, the impact of air conditioners should be calculated based on real-life
conditions where the hours in heating mode on average are lower than 1400 hours.
In Commission decision 2013/114/EU, it is supposed that 10 % of the reversible air to air
conditioners are used for heating in warm climates, 40 % in average climates and 100 %
in Northern climates. This amounts to about 25 % (weighting by 2015 stock numbers and
28 % weighting by capacity) reversible units used for heating. This is close to the value
declared for Italy for 2015 in the Energy Efficiency Directive3. Furthermore, in the Impact
assessment for Regulations (EU) 626/2011 and 206/20124, a value of 33 % was assumed.
However, stakeholders of the current review study suggest that the present rates of
reversible units used for heating are higher, with residential rates between 20 % (only
heating) and 60 % (used in addition, partial replacement or replacement of an existing
central systems) and commercial rates around 85 %. Using 20 % for residential and 85
% for services, this leads to about 50 % reversibility use with 2015 sales.
Hence, it is assumed that only 30 % of the fixed air conditioners currently are used for
heating purposes, but this number is expected to increase to 50 % from now and over
the next 12 years. This means that the hours of use in heating mode are corrected to 50
% of the full load hours presented in Table 4 for new units and 30 % for the EU stock.
The average capacities are estimated based on the sales/stock model. This model is built
on the 0-5 kW and 5-12 kW capacity intervals. These numbers are then adjusted to fit the
capacity categories in the regulation which are 0-6 kW and 6-12 kW. This is done by shifting
3 http://ec.europa.eu/eurostat/web/energy/data/shares 4 Impact Assessment of Commission Regulation (EU) No 206/2012 of 6 March 2012 implementing Directive 2009/125/EC of the European Parliament and of the Council with regard to ecodesign requirements for air conditioners and comfort fans (OJ L 72, 10.3.2012, p. 7)
14
about 15 % of total sales from “> 5 kW” class to “< 5 kW” class as this gives comparable
weighted average kW to BSRIA sales data. The BSRIA data indicates weighted average
capacities of 3.8 kW in the 0-6 kW interval and of 7.8 kW in the 6-12 kW interval. For air
conditioners equal to or below 6 kW the most common type of air conditioner is the 3.5
kW according to the Eurovent. This value is adopted as the reference value. Above 6 kW
the most common product capacities are 6.8, 7.1 and 10 kW. The 7.1 kW model is the
closest to the weighted average value and is adopted as the reference value. The cooling
capacities of the base cases for fixed air conditioners are discussed in Task 4 section
4.1.1.1.
The heating capacity, SEER and SCOP are then derived from the base cases as the median
product characteristics of products around the base case (cooling) capacities in the ECC
database.
• Reversible 3.5 kW wall single split base case: SEER 6.00, SCOP 4.0, Pdesignh= 3.1
kW
• Reversible 7.1 kW wall single split base case: SEER 5.80, SCOP 4.0, Pdesignh= 5.6
kW
These values are extracted from Task 4 section 4.1.1.2.
The data presented in Table 4 can then be used to calculate the annual energy consumption
by the following equation:
𝐸𝑛𝑒𝑟𝑔𝑦 𝑐𝑜𝑛𝑠𝑢𝑚𝑝𝑡𝑖𝑜𝑛𝑎𝑛𝑛𝑢𝑎𝑙 =𝑃𝑑𝑒𝑠𝑖𝑔𝑛𝑐 × 𝐻𝐶𝐸
𝑆𝐸𝐸𝑅+
𝑃𝑑𝑒𝑠𝑖𝑔𝑛ℎ × 𝐻𝐻𝐸 × 50 %
𝑆𝐶𝑂𝑃
Where:
• Pdesignc = the maximum building cooling needs in kW, which is equal to the
maximum cooling capacity of the unit
• HCE: the equivalent number of full load cooling hours
• Pdesignh = the maximum building heating needs in kW, which is equal to the
maximum heating capacity of the unit
• HCE: the equivalent number of full load heating hours
The annual energy consumption for fixed split air conditioners equal to or below 6 kW
(BC1) is then calculated to:
𝐸𝑛𝑒𝑟𝑔𝑦 𝑐𝑜𝑛𝑠𝑢𝑚𝑝𝑡𝑖𝑜𝑛𝑎𝑛𝑛𝑢𝑎𝑙 =3.5 𝑘𝑊 × 350ℎ
6 ×
3.1 𝑘𝑊 × 1400ℎ × 50 %
4.1= 747 𝑘𝑊ℎ
The annual energy consumption for fixed split air conditioners above 6 kW (BC 2) is then
calculated to:
𝐸𝑛𝑒𝑟𝑔𝑦 𝑐𝑜𝑛𝑠𝑢𝑚𝑝𝑡𝑖𝑜𝑛𝑎𝑛𝑛𝑢𝑎𝑙 =7.1 𝑘𝑊 × 350ℎ
5.8 +
6 𝑘𝑊 × 1400ℎ × 50 %
4= 1478 𝑘𝑊ℎ
These values are used in the EcoReport tool.
The energy consumption for portable air conditioners (BC 3) can be calculated based
on the values presented in Table 5. The table presents the hours in cooling (full load),
thermostat-off mode and in standby and the energy consumption in these modes. The
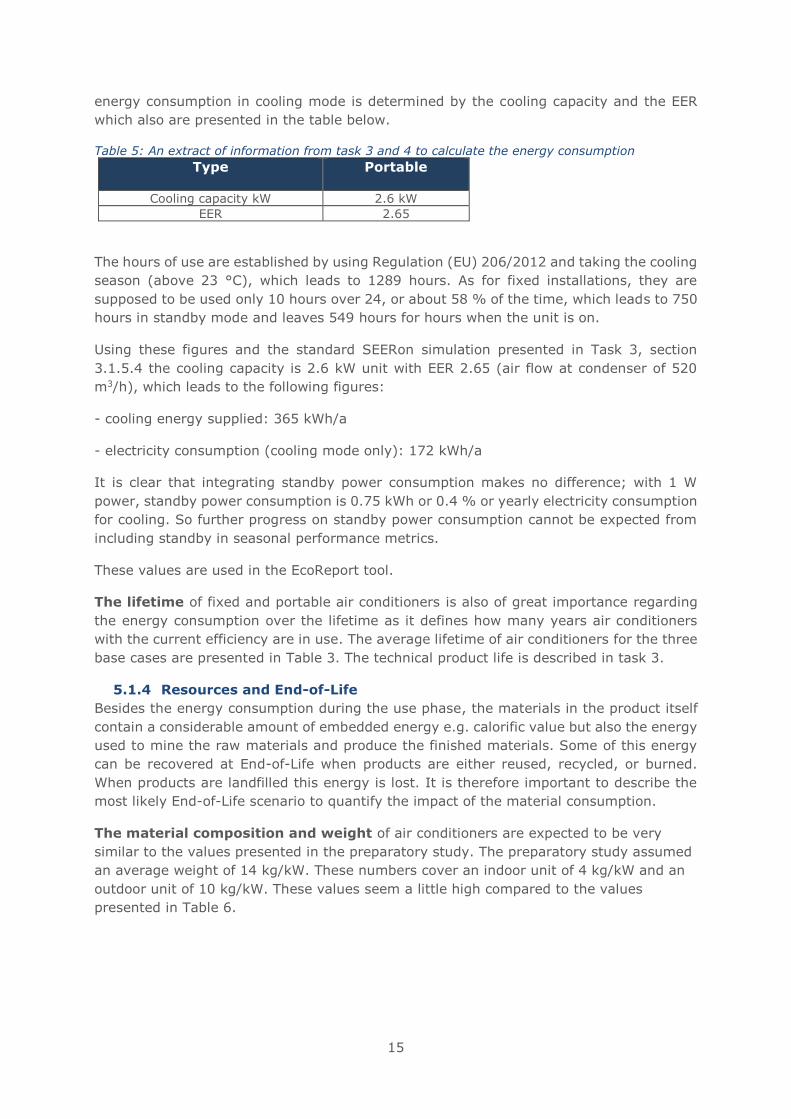
15
energy consumption in cooling mode is determined by the cooling capacity and the EER
which also are presented in the table below.
Table 5: An extract of information from task 3 and 4 to calculate the energy consumption
Type Portable
Cooling capacity kW 2.6 kW
EER 2.65
The hours of use are established by using Regulation (EU) 206/2012 and taking the cooling
season (above 23 °C), which leads to 1289 hours. As for fixed installations, they are
supposed to be used only 10 hours over 24, or about 58 % of the time, which leads to 750
hours in standby mode and leaves 549 hours for hours when the unit is on.
Using these figures and the standard SEERon simulation presented in Task 3, section
3.1.5.4 the cooling capacity is 2.6 kW unit with EER 2.65 (air flow at condenser of 520
m3/h), which leads to the following figures:
- cooling energy supplied: 365 kWh/a
- electricity consumption (cooling mode only): 172 kWh/a
It is clear that integrating standby power consumption makes no difference; with 1 W
power, standby power consumption is 0.75 kWh or 0.4 % or yearly electricity consumption
for cooling. So further progress on standby power consumption cannot be expected from
including standby in seasonal performance metrics.
These values are used in the EcoReport tool.
The lifetime of fixed and portable air conditioners is also of great importance regarding
the energy consumption over the lifetime as it defines how many years air conditioners
with the current efficiency are in use. The average lifetime of air conditioners for the three
base cases are presented in Table 3. The technical product life is described in task 3.
5.1.4 Resources and End-of-Life
Besides the energy consumption during the use phase, the materials in the product itself
contain a considerable amount of embedded energy e.g. calorific value but also the energy
used to mine the raw materials and produce the finished materials. Some of this energy
can be recovered at End-of-Life when products are either reused, recycled, or burned.
When products are landfilled this energy is lost. It is therefore important to describe the
most likely End-of-Life scenario to quantify the impact of the material consumption.
The material composition and weight of air conditioners are expected to be very
similar to the values presented in the preparatory study. The preparatory study assumed
an average weight of 14 kg/kW. These numbers cover an indoor unit of 4 kg/kW and an
outdoor unit of 10 kg/kW. These values seem a little high compared to the values
presented in Table 6.
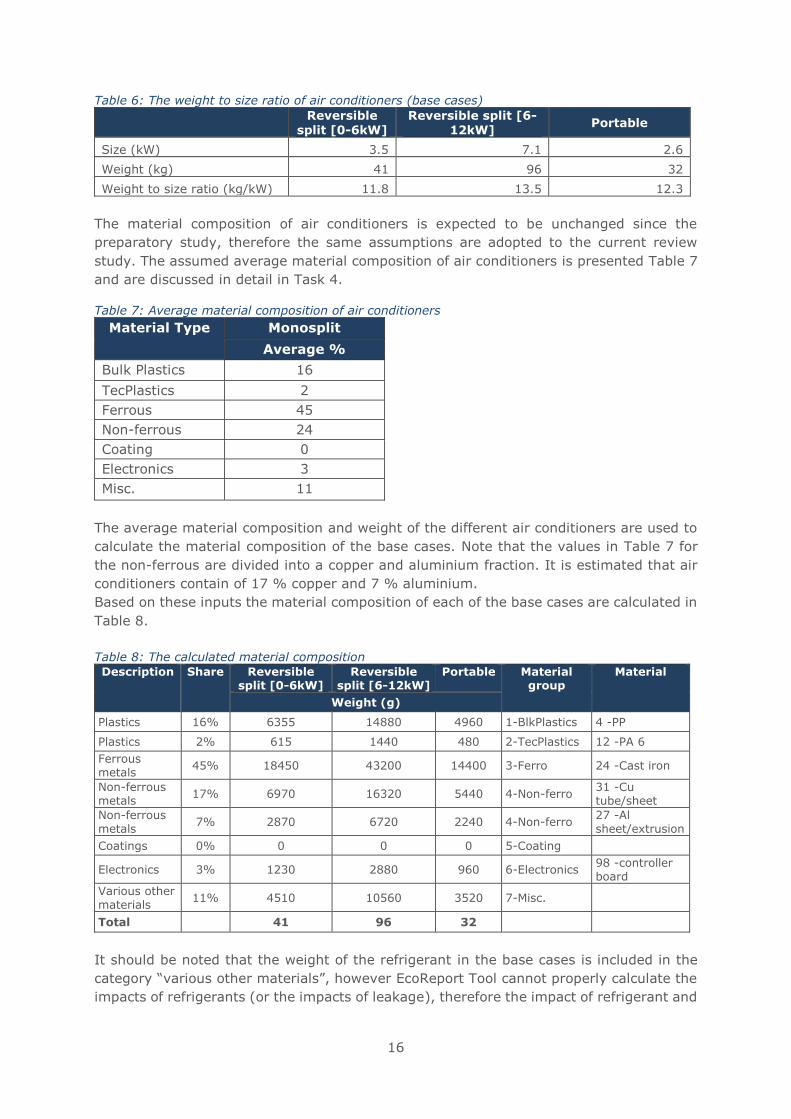
16
Table 6: The weight to size ratio of air conditioners (base cases)
Reversible
split [0-6kW] Reversible split [6-
12kW] Portable
Size (kW) 3.5 7.1 2.6
Weight (kg) 41 96 32
Weight to size ratio (kg/kW) 11.8 13.5 12.3
The material composition of air conditioners is expected to be unchanged since the
preparatory study, therefore the same assumptions are adopted to the current review
study. The assumed average material composition of air conditioners is presented Table 7
and are discussed in detail in Task 4.
Table 7: Average material composition of air conditioners
Material Type Monosplit
Average %
Bulk Plastics 16
TecPlastics 2
Ferrous 45
Non-ferrous 24
Coating 0
Electronics 3
Misc. 11
The average material composition and weight of the different air conditioners are used to
calculate the material composition of the base cases. Note that the values in Table 7 for
the non-ferrous are divided into a copper and aluminium fraction. It is estimated that air
conditioners contain of 17 % copper and 7 % aluminium.
Based on these inputs the material composition of each of the base cases are calculated in
Table 8.
Table 8: The calculated material composition Description Share Reversible
split [0-6kW] Reversible
split [6-12kW] Portable Material
group Material
Weight (g)
Plastics 16% 6355 14880 4960 1-BlkPlastics 4 -PP
Plastics 2% 615 1440 480 2-TecPlastics 12 -PA 6
Ferrous metals
45% 18450 43200 14400 3-Ferro 24 -Cast iron
Non-ferrous metals
17% 6970 16320 5440 4-Non-ferro 31 -Cu tube/sheet
Non-ferrous metals
7% 2870 6720 2240 4-Non-ferro 27 -Al sheet/extrusion
Coatings 0% 0 0 0 5-Coating
Electronics 3% 1230 2880 960 6-Electronics 98 -controller board
Various other materials
11% 4510 10560 3520 7-Misc.
Total 41 96 32
It should be noted that the weight of the refrigerant in the base cases is included in the
category “various other materials”, however EcoReport Tool cannot properly calculate the
impacts of refrigerants (or the impacts of leakage), therefore the impact of refrigerant and
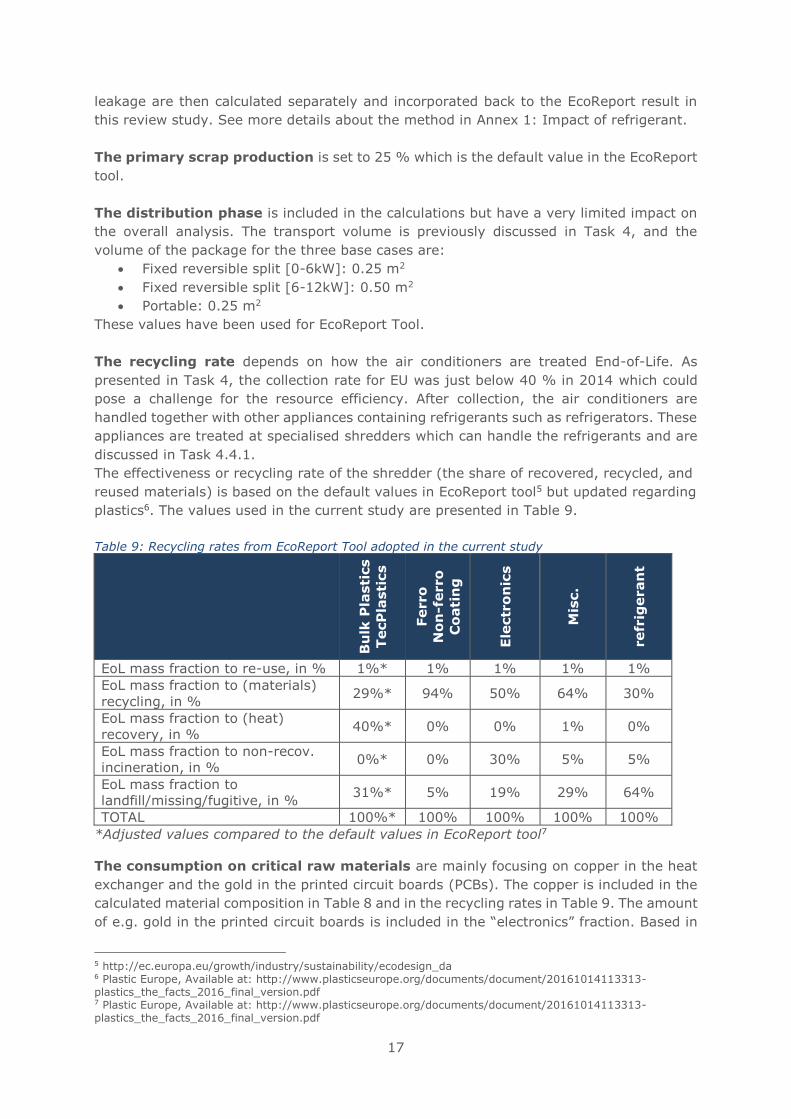
17
leakage are then calculated separately and incorporated back to the EcoReport result in
this review study. See more details about the method in Annex 1: Impact of refrigerant.
The primary scrap production is set to 25 % which is the default value in the EcoReport
tool.
The distribution phase is included in the calculations but have a very limited impact on
the overall analysis. The transport volume is previously discussed in Task 4, and the
volume of the package for the three base cases are:
• Fixed reversible split [0-6kW]: 0.25 m2
• Fixed reversible split [6-12kW]: 0.50 m2
• Portable: 0.25 m2
These values have been used for EcoReport Tool.
The recycling rate depends on how the air conditioners are treated End-of-Life. As
presented in Task 4, the collection rate for EU was just below 40 % in 2014 which could
pose a challenge for the resource efficiency. After collection, the air conditioners are
handled together with other appliances containing refrigerants such as refrigerators. These
appliances are treated at specialised shredders which can handle the refrigerants and are
discussed in Task 4.4.1.
The effectiveness or recycling rate of the shredder (the share of recovered, recycled, and
reused materials) is based on the default values in EcoReport tool5 but updated regarding
plastics6. The values used in the current study are presented in Table 9.
Table 9: Recycling rates from EcoReport Tool adopted in the current study
Bu
lk P
lasti
cs
TecP
lasti
cs
Ferro
No
n-f
erro
Co
ati
ng
Ele
ctr
on
ics
Mis
c.
refr
igeran
t
EoL mass fraction to re-use, in % 1%* 1% 1% 1% 1%
EoL mass fraction to (materials)
recycling, in % 29%* 94% 50% 64% 30%
EoL mass fraction to (heat)
recovery, in % 40%* 0% 0% 1% 0%
EoL mass fraction to non-recov.
incineration, in % 0%* 0% 30% 5% 5%
EoL mass fraction to
landfill/missing/fugitive, in % 31%* 5% 19% 29% 64%
TOTAL 100%* 100% 100% 100% 100%
*Adjusted values compared to the default values in EcoReport tool7
The consumption on critical raw materials are mainly focusing on copper in the heat
exchanger and the gold in the printed circuit boards (PCBs). The copper is included in the
calculated material composition in Table 8 and in the recycling rates in Table 9. The amount
of e.g. gold in the printed circuit boards is included in the “electronics” fraction. Based in
5 http://ec.europa.eu/growth/industry/sustainability/ecodesign_da 6 Plastic Europe, Available at: http://www.plasticseurope.org/documents/document/20161014113313-plastics_the_facts_2016_final_version.pdf 7 Plastic Europe, Available at: http://www.plasticseurope.org/documents/document/20161014113313-plastics_the_facts_2016_final_version.pdf
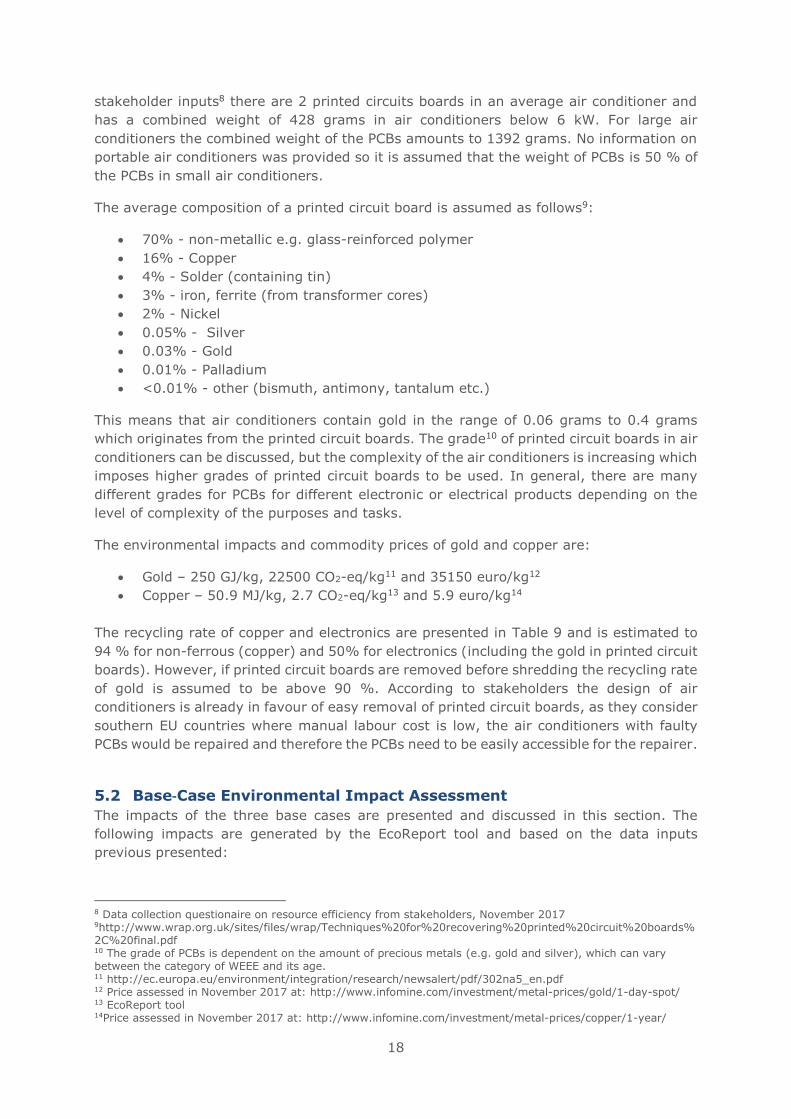
18
stakeholder inputs8 there are 2 printed circuits boards in an average air conditioner and
has a combined weight of 428 grams in air conditioners below 6 kW. For large air
conditioners the combined weight of the PCBs amounts to 1392 grams. No information on
portable air conditioners was provided so it is assumed that the weight of PCBs is 50 % of
the PCBs in small air conditioners.
The average composition of a printed circuit board is assumed as follows9:
• 70% - non-metallic e.g. glass-reinforced polymer
• 16% - Copper
• 4% - Solder (containing tin)
• 3% - iron, ferrite (from transformer cores)
• 2% - Nickel
• 0.05% - Silver
• 0.03% - Gold
• 0.01% - Palladium
• <0.01% - other (bismuth, antimony, tantalum etc.)
This means that air conditioners contain gold in the range of 0.06 grams to 0.4 grams
which originates from the printed circuit boards. The grade10 of printed circuit boards in air
conditioners can be discussed, but the complexity of the air conditioners is increasing which
imposes higher grades of printed circuit boards to be used. In general, there are many
different grades for PCBs for different electronic or electrical products depending on the
level of complexity of the purposes and tasks.
The environmental impacts and commodity prices of gold and copper are:
• Gold – 250 GJ/kg, 22500 CO2-eq/kg11 and 35150 euro/kg12
• Copper – 50.9 MJ/kg, 2.7 CO2-eq/kg13 and 5.9 euro/kg14
The recycling rate of copper and electronics are presented in Table 9 and is estimated to
94 % for non-ferrous (copper) and 50% for electronics (including the gold in printed circuit
boards). However, if printed circuit boards are removed before shredding the recycling rate
of gold is assumed to be above 90 %. According to stakeholders the design of air
conditioners is already in favour of easy removal of printed circuit boards, as they consider
southern EU countries where manual labour cost is low, the air conditioners with faulty
PCBs would be repaired and therefore the PCBs need to be easily accessible for the repairer.
5.2 Base‐Case Environmental Impact Assessment
The impacts of the three base cases are presented and discussed in this section. The
following impacts are generated by the EcoReport tool and based on the data inputs
previous presented:
8 Data collection questionaire on resource efficiency from stakeholders, November 2017 9http://www.wrap.org.uk/sites/files/wrap/Techniques%20for%20recovering%20printed%20circuit%20boards%2C%20final.pdf 10 The grade of PCBs is dependent on the amount of precious metals (e.g. gold and silver), which can vary between the category of WEEE and its age. 11 http://ec.europa.eu/environment/integration/research/newsalert/pdf/302na5_en.pdf 12 Price assessed in November 2017 at: http://www.infomine.com/investment/metal-prices/gold/1-day-spot/ 13 EcoReport tool 14Price assessed in November 2017 at: http://www.infomine.com/investment/metal-prices/copper/1-year/
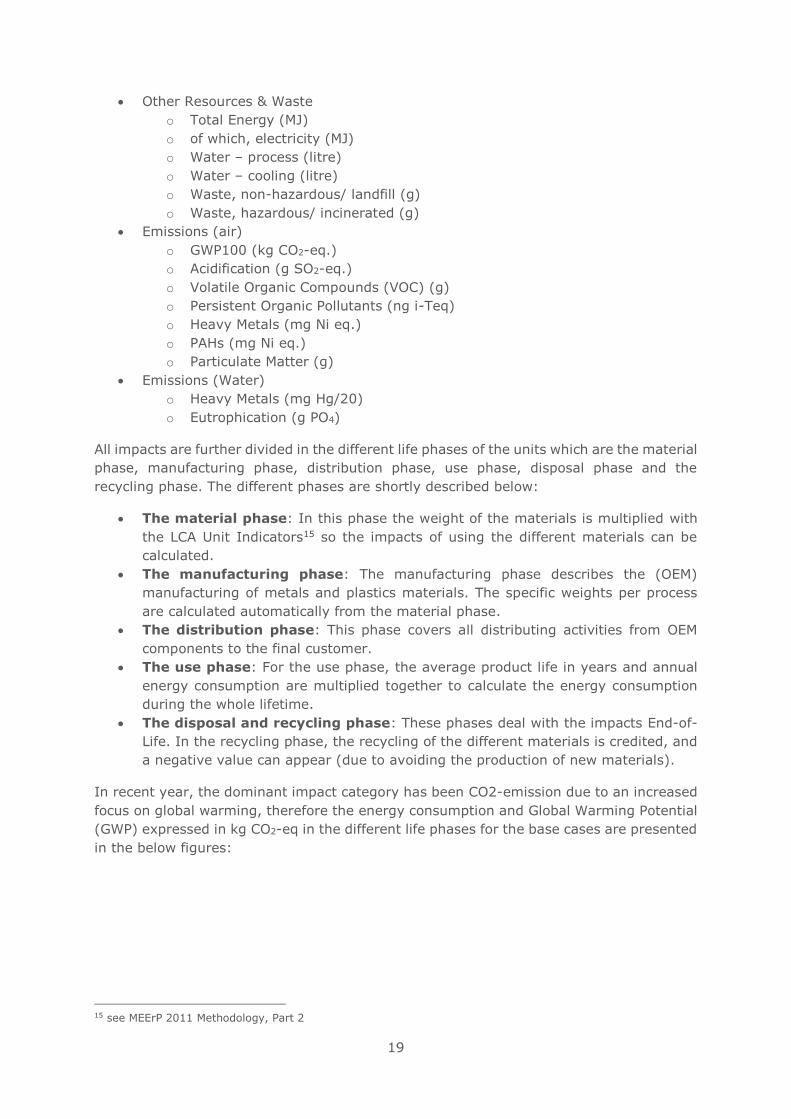
19
• Other Resources & Waste
o Total Energy (MJ)
o of which, electricity (MJ)
o Water – process (litre)
o Water – cooling (litre)
o Waste, non-hazardous/ landfill (g)
o Waste, hazardous/ incinerated (g)
• Emissions (air)
o GWP100 (kg CO2-eq.)
o Acidification (g SO2-eq.)
o Volatile Organic Compounds (VOC) (g)
o Persistent Organic Pollutants (ng i-Teq)
o Heavy Metals (mg Ni eq.)
o PAHs (mg Ni eq.)
o Particulate Matter (g)
• Emissions (Water)
o Heavy Metals (mg Hg/20)
o Eutrophication (g PO4)
All impacts are further divided in the different life phases of the units which are the material
phase, manufacturing phase, distribution phase, use phase, disposal phase and the
recycling phase. The different phases are shortly described below:
• The material phase: In this phase the weight of the materials is multiplied with
the LCA Unit Indicators15 so the impacts of using the different materials can be
calculated.
• The manufacturing phase: The manufacturing phase describes the (OEM)
manufacturing of metals and plastics materials. The specific weights per process
are calculated automatically from the material phase.
• The distribution phase: This phase covers all distributing activities from OEM
components to the final customer.
• The use phase: For the use phase, the average product life in years and annual
energy consumption are multiplied together to calculate the energy consumption
during the whole lifetime.
• The disposal and recycling phase: These phases deal with the impacts End-of-
Life. In the recycling phase, the recycling of the different materials is credited, and
a negative value can appear (due to avoiding the production of new materials).
In recent year, the dominant impact category has been CO2-emission due to an increased
focus on global warming, therefore the energy consumption and Global Warming Potential
(GWP) expressed in kg CO2-eq in the different life phases for the base cases are presented
in the below figures:
15 see MEErP 2011 Methodology, Part 2
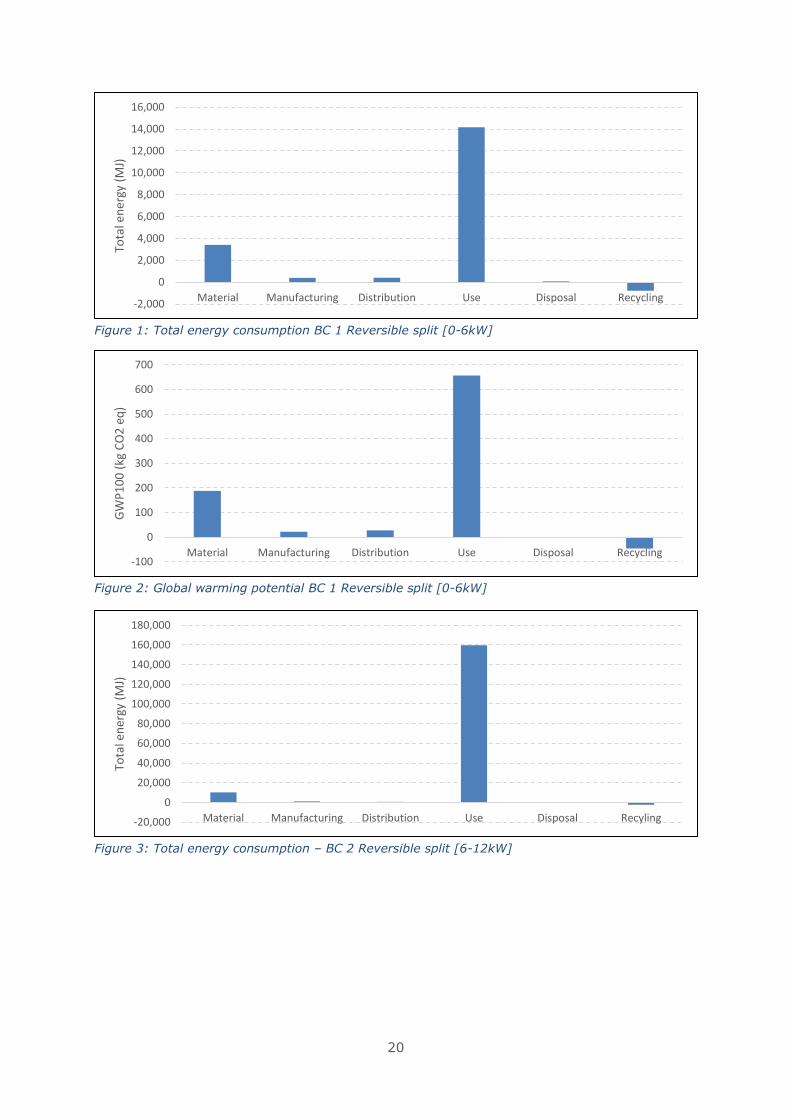
20
Figure 1: Total energy consumption BC 1 Reversible split [0-6kW]
Figure 2: Global warming potential BC 1 Reversible split [0-6kW]
Figure 3: Total energy consumption – BC 2 Reversible split [6-12kW]
-2,000
0
2,000
4,000
6,000
8,000
10,000
12,000
14,000
16,000
Material Manufacturing Distribution Use Disposal Recycling
Tota
l en
ergy
(M
J)
-100
0
100
200
300
400
500
600
700
Material Manufacturing Distribution Use Disposal Recycling
GW
P1
00
(kg
CO
2 e
q)
-20,000
0
20,000
40,000
60,000
80,000
100,000
120,000
140,000
160,000
180,000
Material Manufacturing Distribution Use Disposal Recyling
Tota
l en
ergy
(M
J)
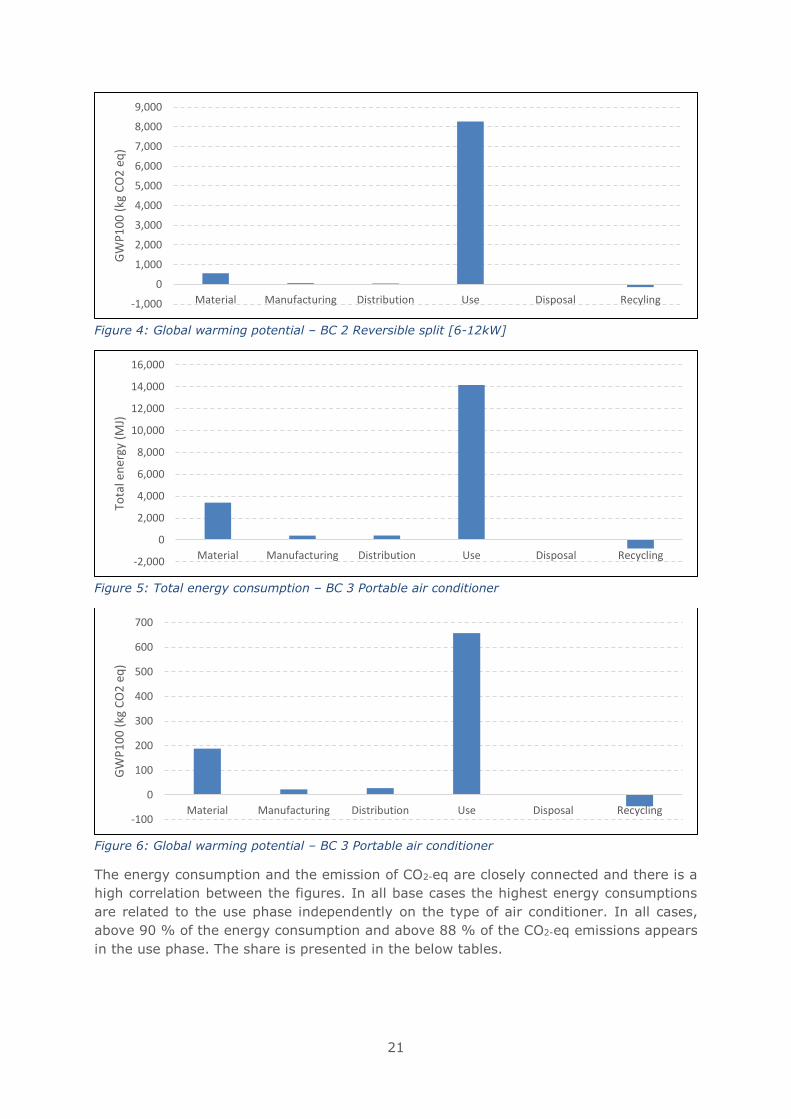
21
Figure 4: Global warming potential – BC 2 Reversible split [6-12kW]
Figure 5: Total energy consumption – BC 3 Portable air conditioner
Figure 6: Global warming potential – BC 3 Portable air conditioner
The energy consumption and the emission of CO2-eq are closely connected and there is a
high correlation between the figures. In all base cases the highest energy consumptions
are related to the use phase independently on the type of air conditioner. In all cases,
above 90 % of the energy consumption and above 88 % of the CO2-eq emissions appears
in the use phase. The share is presented in the below tables.
-1,000
0
1,000
2,000
3,000
4,000
5,000
6,000
7,000
8,000
9,000
Material Manufacturing Distribution Use Disposal Recyling
GW
P1
00
(kg
CO
2 e
q)
-2,000
0
2,000
4,000
6,000
8,000
10,000
12,000
14,000
16,000
Material Manufacturing Distribution Use Disposal Recycling
Tota
l en
ergy
(M
J)
-100
0
100
200
300
400
500
600
700
Material Manufacturing Distribution Use Disposal Recycling
GW
P1
00
(kg
CO
2 e
q)
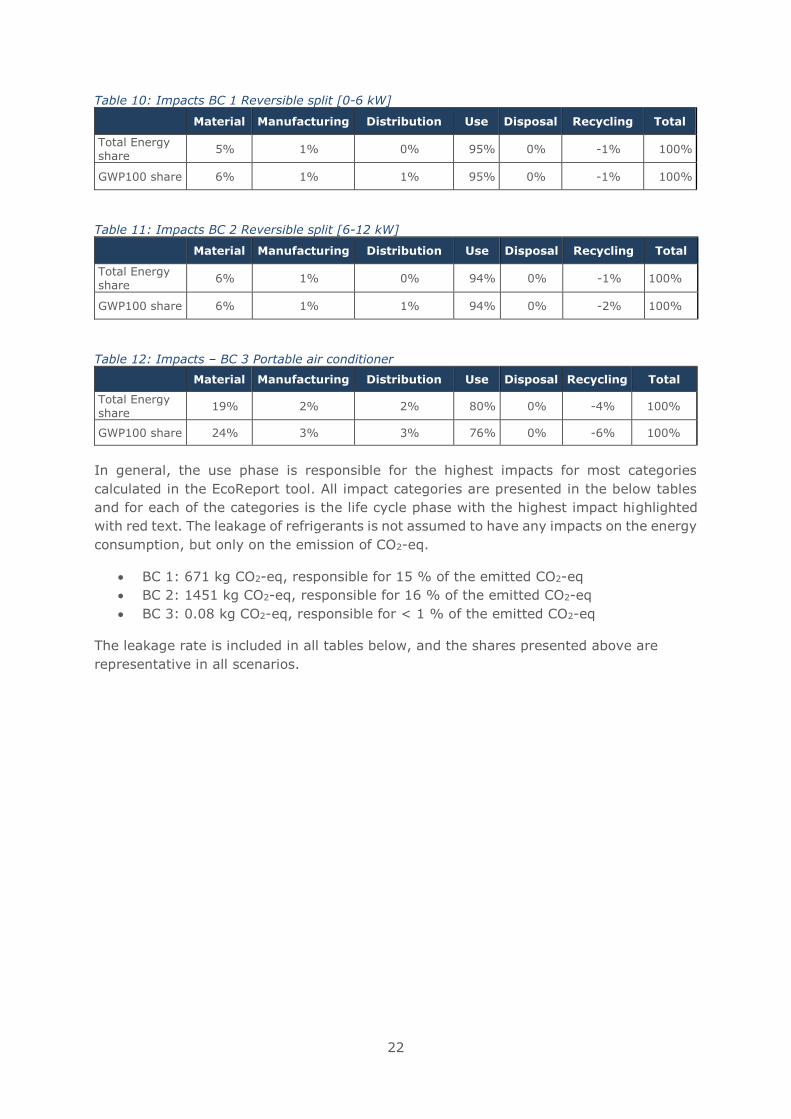
22
Table 10: Impacts BC 1 Reversible split [0-6 kW]
Material Manufacturing Distribution Use Disposal Recycling Total
Total Energy share
5% 1% 0% 95% 0% -1% 100%
GWP100 share 6% 1% 1% 95% 0% -1% 100%
Table 11: Impacts BC 2 Reversible split [6-12 kW]
Material Manufacturing Distribution Use Disposal Recycling Total
Total Energy share
6% 1% 0% 94% 0% -1% 100%
GWP100 share 6% 1% 1% 94% 0% -2% 100%
Table 12: Impacts – BC 3 Portable air conditioner
Material Manufacturing Distribution Use Disposal Recycling Total
Total Energy share
19% 2% 2% 80% 0% -4% 100%
GWP100 share 24% 3% 3% 76% 0% -6% 100%
In general, the use phase is responsible for the highest impacts for most categories
calculated in the EcoReport tool. All impact categories are presented in the below tables
and for each of the categories is the life cycle phase with the highest impact highlighted
with red text. The leakage of refrigerants is not assumed to have any impacts on the energy
consumption, but only on the emission of CO2-eq.
• BC 1: 671 kg CO2-eq, responsible for 15 % of the emitted CO2-eq
• BC 2: 1451 kg CO2-eq, responsible for 16 % of the emitted CO2-eq
• BC 3: 0.08 kg CO2-eq, responsible for < 1 % of the emitted CO2-eq
The leakage rate is included in all tables below, and the shares presented above are
representative in all scenarios.
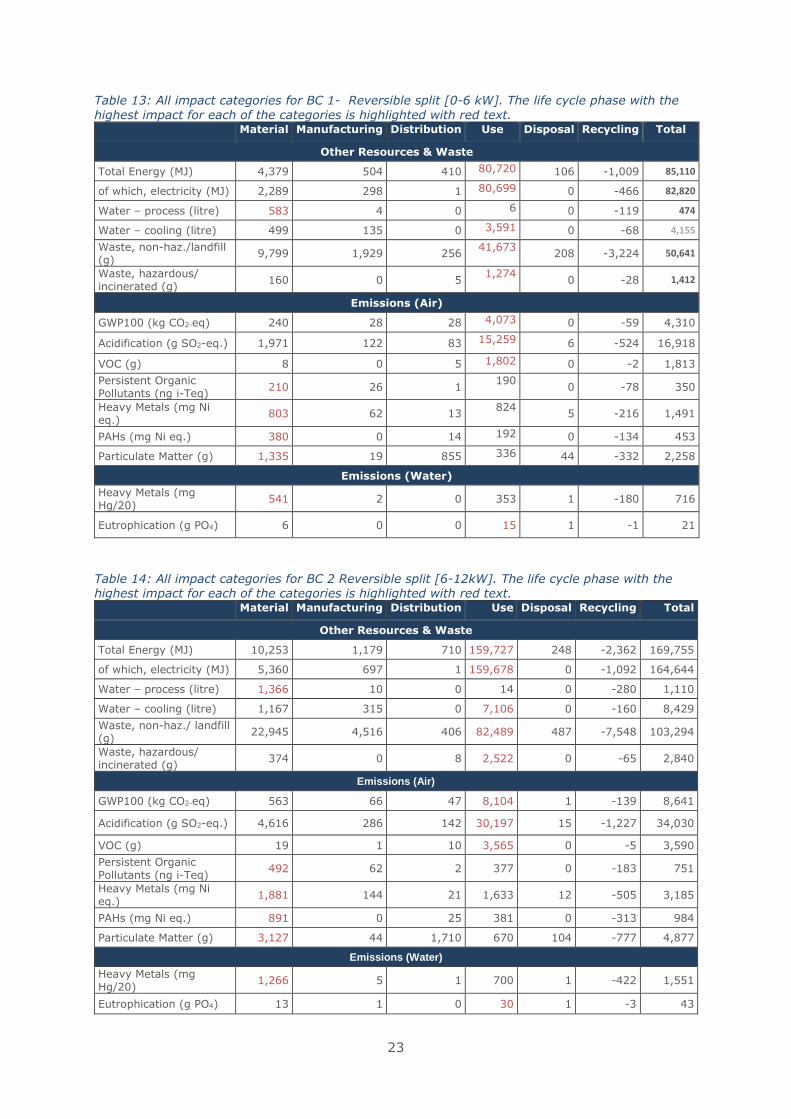
23
Table 13: All impact categories for BC 1- Reversible split [0-6 kW]. The life cycle phase with the
highest impact for each of the categories is highlighted with red text.
Material Manufacturing Distribution Use Disposal Recycling Total
Other Resources & Waste
Total Energy (MJ) 4,379 504 410 80,720 106 -1,009 85,110
of which, electricity (MJ) 2,289 298 1 80,699 0 -466 82,820
Water – process (litre) 583 4 0 6 0 -119 474
Water – cooling (litre) 499 135 0 3,591 0 -68 4,155
Waste, non-haz./landfill (g)
9,799 1,929 256 41,673
208 -3,224 50,641
Waste, hazardous/ incinerated (g)
160 0 5 1,274
0 -28 1,412
Emissions (Air)
GWP100 (kg CO2-eq) 240 28 28 4,073 0 -59 4,310
Acidification (g SO2-eq.) 1,971 122 83 15,259 6 -524 16,918
VOC (g) 8 0 5 1,802 0 -2 1,813
Persistent Organic Pollutants (ng i-Teq)
210 26 1 190
0 -78 350
Heavy Metals (mg Ni eq.)
803 62 13 824
5 -216 1,491
PAHs (mg Ni eq.) 380 0 14 192 0 -134 453
Particulate Matter (g) 1,335 19 855 336 44 -332 2,258
Emissions (Water)
Heavy Metals (mg Hg/20)
541 2 0 353 1 -180 716
Eutrophication (g PO4) 6 0 0 15 1 -1 21
Table 14: All impact categories for BC 2 Reversible split [6-12kW]. The life cycle phase with the highest impact for each of the categories is highlighted with red text.
Material Manufacturing Distribution Use Disposal Recycling Total
Other Resources & Waste
Total Energy (MJ) 10,253 1,179 710 159,727 248 -2,362 169,755
of which, electricity (MJ) 5,360 697 1 159,678 0 -1,092 164,644
Water – process (litre) 1,366 10 0 14 0 -280 1,110
Water – cooling (litre) 1,167 315 0 7,106 0 -160 8,429
Waste, non-haz./ landfill (g)
22,945 4,516 406 82,489 487 -7,548 103,294
Waste, hazardous/ incinerated (g)
374 0 8 2,522 0 -65 2,840
Emissions (Air)
GWP100 (kg CO2-eq) 563 66 47 8,104 1 -139 8,641
Acidification (g SO2-eq.) 4,616 286 142 30,197 15 -1,227 34,030
VOC (g) 19 1 10 3,565 0 -5 3,590
Persistent Organic Pollutants (ng i-Teq)
492 62 2 377 0 -183 751
Heavy Metals (mg Ni eq.)
1,881 144 21 1,633 12 -505 3,185
PAHs (mg Ni eq.) 891 0 25 381 0 -313 984
Particulate Matter (g) 3,127 44 1,710 670 104 -777 4,877
Emissions (Water)
Heavy Metals (mg Hg/20)
1,266 5 1 700 1 -422 1,551
Eutrophication (g PO4) 13 1 0 30 1 -3 43
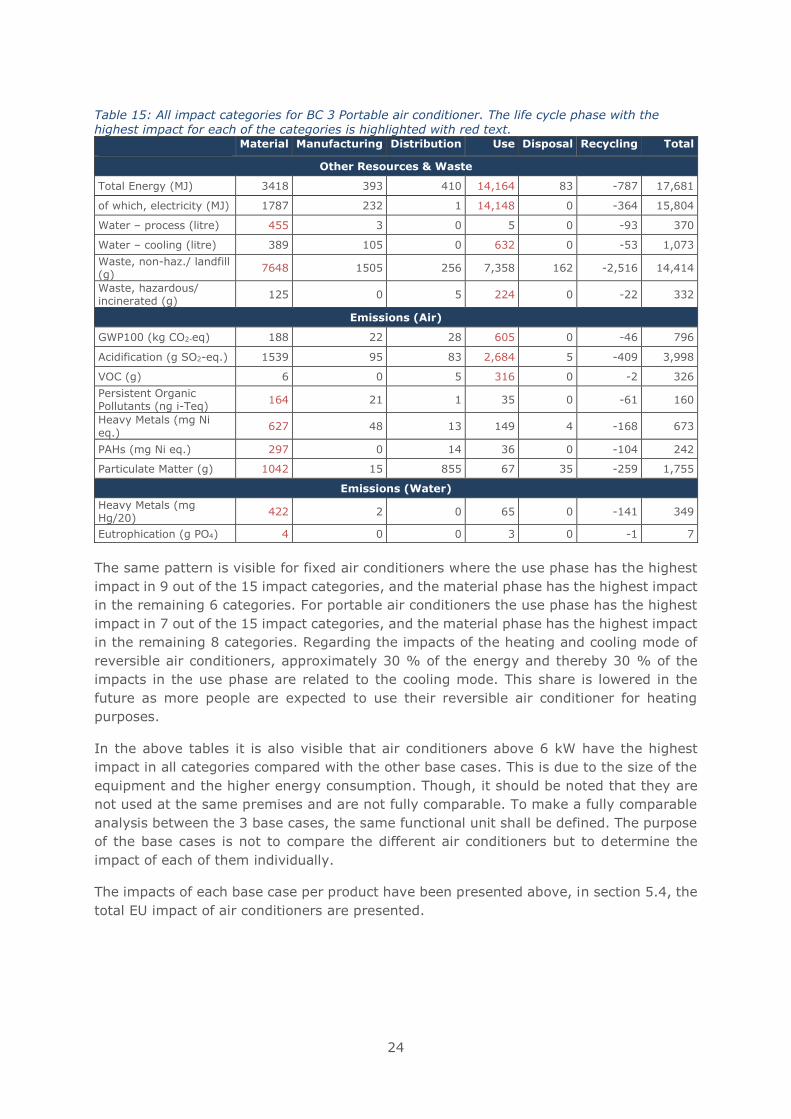
24
Table 15: All impact categories for BC 3 Portable air conditioner. The life cycle phase with the highest impact for each of the categories is highlighted with red text.
Material Manufacturing Distribution Use Disposal Recycling Total
Other Resources & Waste
Total Energy (MJ) 3418 393 410 14,164 83 -787 17,681
of which, electricity (MJ) 1787 232 1 14,148 0 -364 15,804
Water – process (litre) 455 3 0 5 0 -93 370
Water – cooling (litre) 389 105 0 632 0 -53 1,073
Waste, non-haz./ landfill (g)
7648 1505 256 7,358 162 -2,516 14,414
Waste, hazardous/ incinerated (g)
125 0 5 224 0 -22 332
Emissions (Air)
GWP100 (kg CO2-eq) 188 22 28 605 0 -46 796
Acidification (g SO2-eq.) 1539 95 83 2,684 5 -409 3,998
VOC (g) 6 0 5 316 0 -2 326
Persistent Organic Pollutants (ng i-Teq)
164 21 1 35 0 -61 160
Heavy Metals (mg Ni
eq.) 627 48 13 149 4 -168 673
PAHs (mg Ni eq.) 297 0 14 36 0 -104 242
Particulate Matter (g) 1042 15 855 67 35 -259 1,755
Emissions (Water)
Heavy Metals (mg Hg/20)
422 2 0 65 0 -141 349
Eutrophication (g PO4) 4 0 0 3 0 -1 7
The same pattern is visible for fixed air conditioners where the use phase has the highest
impact in 9 out of the 15 impact categories, and the material phase has the highest impact
in the remaining 6 categories. For portable air conditioners the use phase has the highest
impact in 7 out of the 15 impact categories, and the material phase has the highest impact
in the remaining 8 categories. Regarding the impacts of the heating and cooling mode of
reversible air conditioners, approximately 30 % of the energy and thereby 30 % of the
impacts in the use phase are related to the cooling mode. This share is lowered in the
future as more people are expected to use their reversible air conditioner for heating
purposes.
In the above tables it is also visible that air conditioners above 6 kW have the highest
impact in all categories compared with the other base cases. This is due to the size of the
equipment and the higher energy consumption. Though, it should be noted that they are
not used at the same premises and are not fully comparable. To make a fully comparable
analysis between the 3 base cases, the same functional unit shall be defined. The purpose
of the base cases is not to compare the different air conditioners but to determine the
impact of each of them individually.
The impacts of each base case per product have been presented above, in section 5.4, the
total EU impact of air conditioners are presented.
25
The consumption of critical raw materials is also determined for the base cases per
product. For each of the base case, the amount of gold and copper calculated and the
derived impacts regarding energy, emission of CO2-eq and market value in euros.
• For BC 1:
o 0.128 grams of gold, 32.1 MJ, 2.9 kg CO2-eq. and 4.5 euros
o 6970 grams of copper, 355 MJ, 21 kg CO2-eq. and 41 euros
• For BC 2:
o 0.4176 grams of gold, 104.4 MJ, 9.4 kg CO2-eq. and 14.7 euros
o 16320 grams of copper, 831 MJ, 49 kg CO2-eq. and 96 euros
• For BC 3:
o 0.0642 grams of gold, 16.1 MJ, 1.4 kg CO2-eq. and 2.3 euros
o 5440 grams of copper, 277 MJ, 16 kg CO2-eq. and 32 euros
Both copper and gold have limited impacts compared with the impacts of the use phase.
Copper is responsible for less than 1 % of the emission of CO2-eq over the lifetime and
gold has an even lower impact.
5.3 Base‐Case Life Cycle Costs for consumer
The base-case life cycle costs for the consumer are calculated based on the data presented
in section 5.1.2. The life cycle costs for consumers are calculated by the following equation:
𝐿𝐶𝐶 = 𝑃𝑃 + 𝑃𝑊𝐹 × 𝑂𝐸 + 𝐸𝑜𝐿
Where:
• LCC is Life Cycle Costs
• PP is the purchase price
• OE is the operating expense
• PWF (Present Worth Factor)
• EoL is End-of-life costs (disposal costs, recycling charge) or benefit (resale).
The present worth factor is automatically calculated in the EcoReport tool. The formula to
calculate the present worth factor is:
𝑃𝑊𝐹 = {1 – 1/(1 + 𝑟)𝑁 }/𝑟
Where:
• N is the product life
• r is the discount rate minus the growth rate of running cost components (e.g.
energy, water rates)
The discount rate is assumed to be 4 % and the escalation rate (annual growth rate of
running costs) are assumed to be approximately 1% and the resulting values for the
different base cases are:
• BC 1 – 9.97
• BC 2 – 9.97
• BC 3 – 8.54
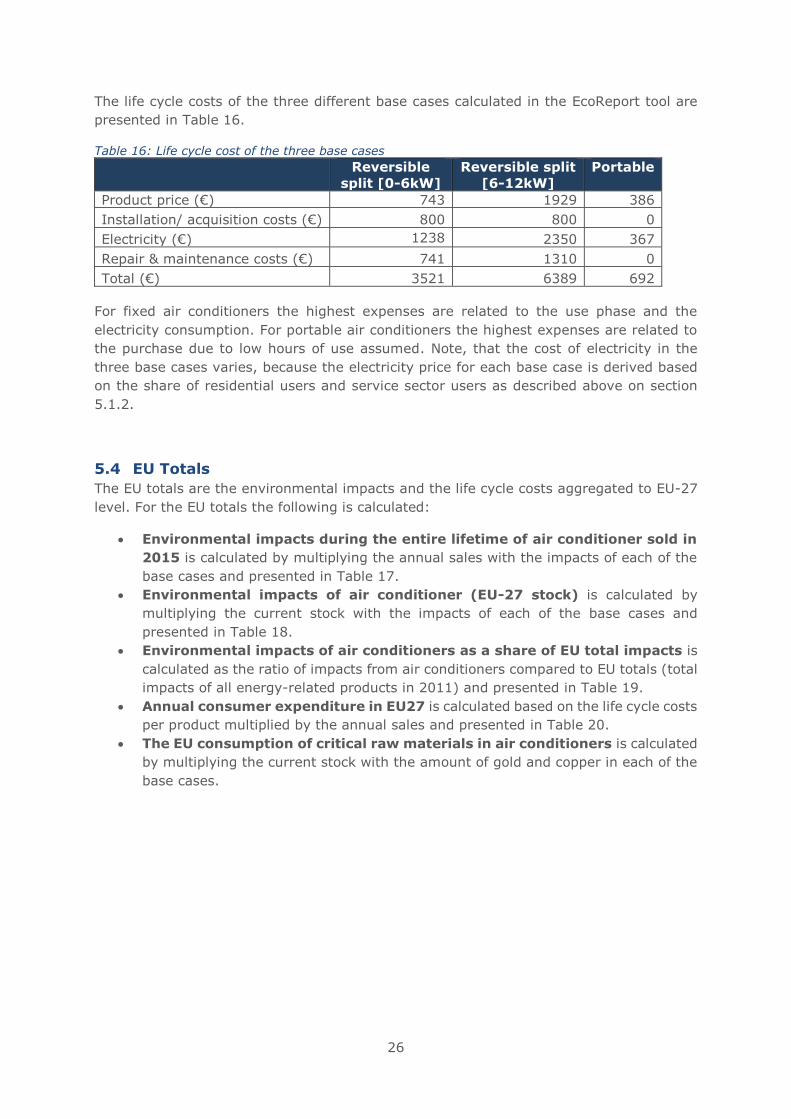
26
The life cycle costs of the three different base cases calculated in the EcoReport tool are
presented in Table 16.
Table 16: Life cycle cost of the three base cases Reversible
split [0-6kW]
Reversible split
[6-12kW]
Portable
Product price (€) 743 1929 386
Installation/ acquisition costs (€) 800 800 0
Electricity (€) 1238 2350 367
Repair & maintenance costs (€) 741 1310 0
Total (€) 3521 6389 692
For fixed air conditioners the highest expenses are related to the use phase and the
electricity consumption. For portable air conditioners the highest expenses are related to
the purchase due to low hours of use assumed. Note, that the cost of electricity in the
three base cases varies, because the electricity price for each base case is derived based
on the share of residential users and service sector users as described above on section
5.1.2.
5.4 EU Totals
The EU totals are the environmental impacts and the life cycle costs aggregated to EU-27
level. For the EU totals the following is calculated:
• Environmental impacts during the entire lifetime of air conditioner sold in
2015 is calculated by multiplying the annual sales with the impacts of each of the
base cases and presented in Table 17.
• Environmental impacts of air conditioner (EU-27 stock) is calculated by
multiplying the current stock with the impacts of each of the base cases and
presented in Table 18.
• Environmental impacts of air conditioners as a share of EU total impacts is
calculated as the ratio of impacts from air conditioners compared to EU totals (total
impacts of all energy-related products in 2011) and presented in Table 19.
• Annual consumer expenditure in EU27 is calculated based on the life cycle costs
per product multiplied by the annual sales and presented in Table 20.
• The EU consumption of critical raw materials in air conditioners is calculated
by multiplying the current stock with the amount of gold and copper in each of the
base cases.
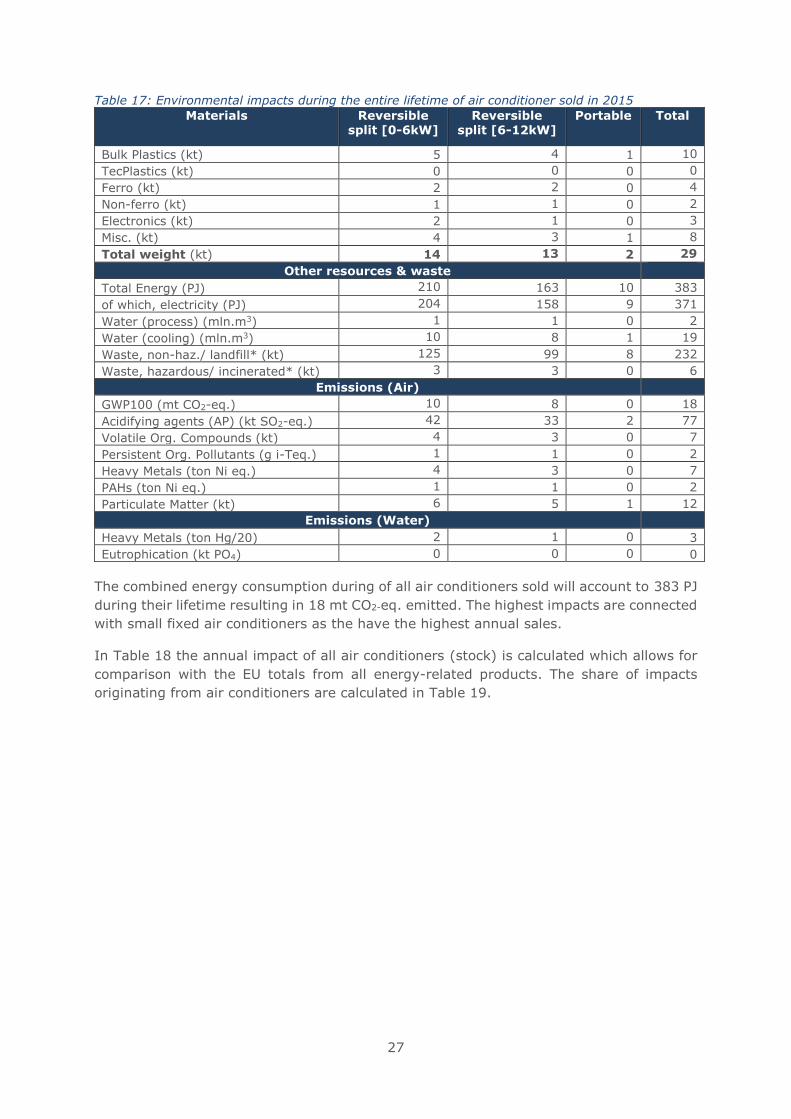
27
Table 17: Environmental impacts during the entire lifetime of air conditioner sold in 2015
Materials Reversible split [0-6kW]
Reversible split [6-12kW]
Portable Total
Bulk Plastics (kt) 5 4 1 10
TecPlastics (kt) 0 0 0 0
Ferro (kt) 2 2 0 4
Non-ferro (kt) 1 1 0 2
Electronics (kt) 2 1 0 3
Misc. (kt) 4 3 1 8
Total weight (kt) 14 13 2 29
Other resources & waste
Total Energy (PJ) 210 163 10 383
of which, electricity (PJ) 204 158 9 371
Water (process) (mln.m3) 1 1 0 2
Water (cooling) (mln.m3) 10 8 1 19
Waste, non-haz./ landfill* (kt) 125 99 8 232
Waste, hazardous/ incinerated* (kt) 3 3 0 6
Emissions (Air)
GWP100 (mt CO2-eq.) 10 8 0 18
Acidifying agents (AP) (kt SO2-eq.) 42 33 2 77
Volatile Org. Compounds (kt) 4 3 0 7
Persistent Org. Pollutants (g i-Teq.) 1 1 0 2
Heavy Metals (ton Ni eq.) 4 3 0 7
PAHs (ton Ni eq.) 1 1 0 2
Particulate Matter (kt) 6 5 1 12
Emissions (Water)
Heavy Metals (ton Hg/20) 2 1 0 3
Eutrophication (kt PO4) 0 0 0 0
The combined energy consumption during of all air conditioners sold will account to 383 PJ
during their lifetime resulting in 18 mt CO2-eq. emitted. The highest impacts are connected
with small fixed air conditioners as the have the highest annual sales.
In Table 18 the annual impact of all air conditioners (stock) is calculated which allows for
comparison with the EU totals from all energy-related products. The share of impacts
originating from air conditioners are calculated in Table 19.
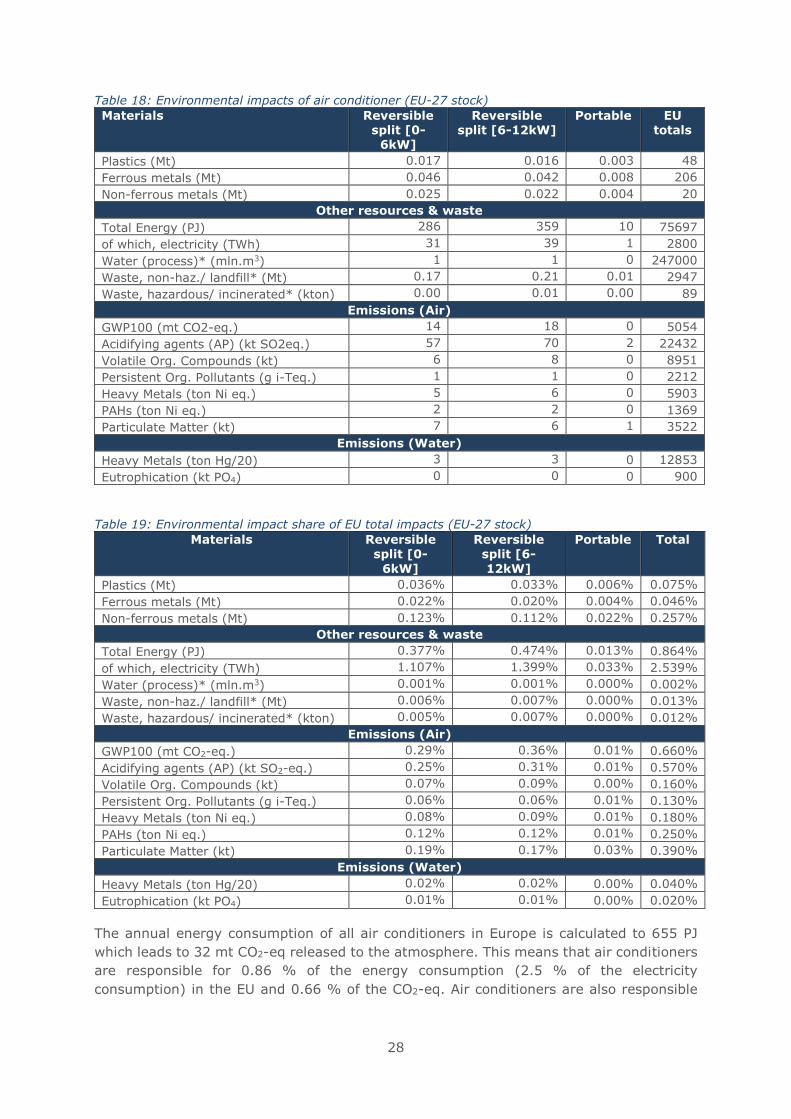
28
Table 18: Environmental impacts of air conditioner (EU-27 stock)
Materials Reversible split [0-
6kW]
Reversible split [6-12kW]
Portable EU totals
Plastics (Mt) 0.017 0.016 0.003 48
Ferrous metals (Mt) 0.046 0.042 0.008 206
Non-ferrous metals (Mt) 0.025 0.022 0.004 20
Other resources & waste
Total Energy (PJ) 286 359 10 75697
of which, electricity (TWh) 31 39 1 2800
Water (process)* (mln.m3) 1 1 0 247000
Waste, non-haz./ landfill* (Mt) 0.17 0.21 0.01 2947
Waste, hazardous/ incinerated* (kton) 0.00 0.01 0.00 89
Emissions (Air)
GWP100 (mt CO2-eq.) 14 18 0 5054
Acidifying agents (AP) (kt SO2eq.) 57 70 2 22432
Volatile Org. Compounds (kt) 6 8 0 8951
Persistent Org. Pollutants (g i-Teq.) 1 1 0 2212
Heavy Metals (ton Ni eq.) 5 6 0 5903
PAHs (ton Ni eq.) 2 2 0 1369
Particulate Matter (kt) 7 6 1 3522
Emissions (Water)
Heavy Metals (ton Hg/20) 3 3 0 12853
Eutrophication (kt PO4) 0 0 0 900
Table 19: Environmental impact share of EU total impacts (EU-27 stock)
Materials Reversible split [0-
6kW]
Reversible split [6-
12kW]
Portable Total
Plastics (Mt) 0.036% 0.033% 0.006% 0.075%
Ferrous metals (Mt) 0.022% 0.020% 0.004% 0.046%
Non-ferrous metals (Mt) 0.123% 0.112% 0.022% 0.257%
Other resources & waste
Total Energy (PJ) 0.377% 0.474% 0.013% 0.864%
of which, electricity (TWh) 1.107% 1.399% 0.033% 2.539%
Water (process)* (mln.m3) 0.001% 0.001% 0.000% 0.002%
Waste, non-haz./ landfill* (Mt) 0.006% 0.007% 0.000% 0.013%
Waste, hazardous/ incinerated* (kton) 0.005% 0.007% 0.000% 0.012%
Emissions (Air)
GWP100 (mt CO2-eq.) 0.29% 0.36% 0.01% 0.660%
Acidifying agents (AP) (kt SO2-eq.) 0.25% 0.31% 0.01% 0.570%
Volatile Org. Compounds (kt) 0.07% 0.09% 0.00% 0.160%
Persistent Org. Pollutants (g i-Teq.) 0.06% 0.06% 0.01% 0.130%
Heavy Metals (ton Ni eq.) 0.08% 0.09% 0.01% 0.180%
PAHs (ton Ni eq.) 0.12% 0.12% 0.01% 0.250%
Particulate Matter (kt) 0.19% 0.17% 0.03% 0.390%
Emissions (Water)
Heavy Metals (ton Hg/20) 0.02% 0.02% 0.00% 0.040%
Eutrophication (kt PO4) 0.01% 0.01% 0.00% 0.020%
The annual energy consumption of all air conditioners in Europe is calculated to 655 PJ
which leads to 32 mt CO2-eq released to the atmosphere. This means that air conditioners
are responsible for 0.86 % of the energy consumption (2.5 % of the electricity
consumption) in the EU and 0.66 % of the CO2-eq. Air conditioners are also responsible
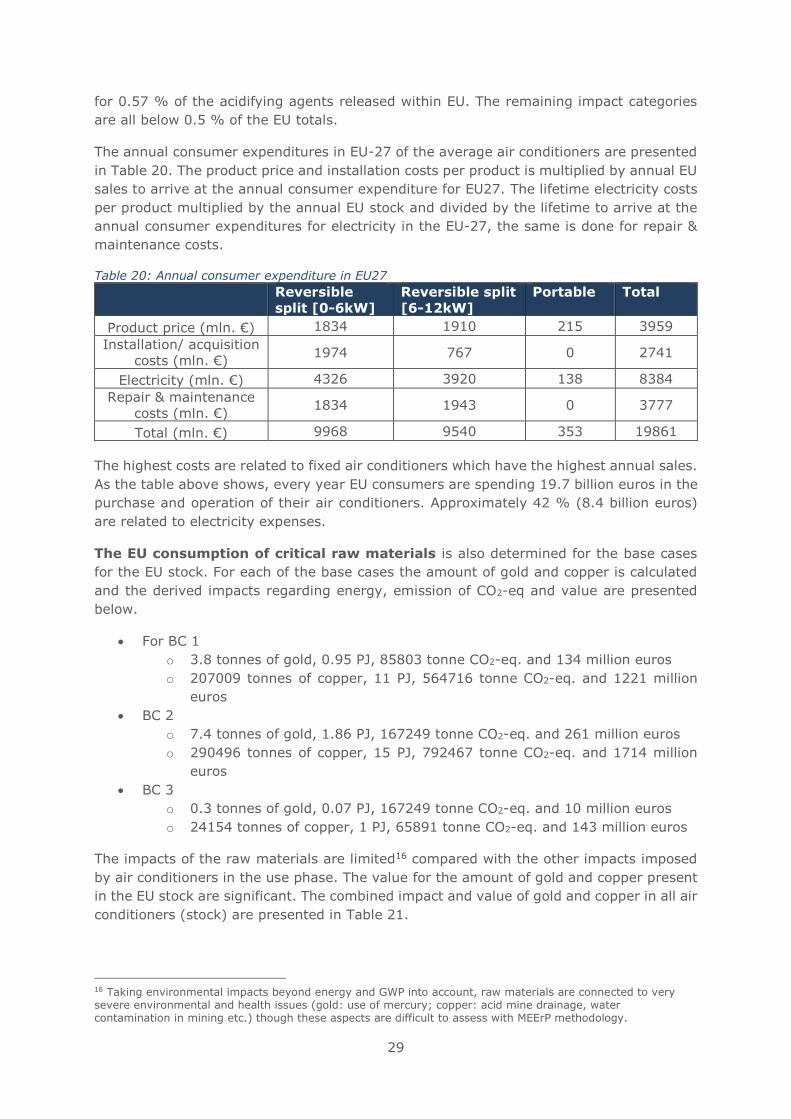
29
for 0.57 % of the acidifying agents released within EU. The remaining impact categories
are all below 0.5 % of the EU totals.
The annual consumer expenditures in EU-27 of the average air conditioners are presented
in Table 20. The product price and installation costs per product is multiplied by annual EU
sales to arrive at the annual consumer expenditure for EU27. The lifetime electricity costs
per product multiplied by the annual EU stock and divided by the lifetime to arrive at the
annual consumer expenditures for electricity in the EU-27, the same is done for repair &
maintenance costs.
Table 20: Annual consumer expenditure in EU27 Reversible
split [0-6kW] Reversible split
[6-12kW] Portable Total
Product price (mln. €) 1834 1910 215 3959
Installation/ acquisition
costs (mln. €) 1974 767 0 2741
Electricity (mln. €) 4326 3920 138 8384
Repair & maintenance
costs (mln. €) 1834 1943 0 3777
Total (mln. €) 9968 9540 353 19861
The highest costs are related to fixed air conditioners which have the highest annual sales.
As the table above shows, every year EU consumers are spending 19.7 billion euros in the
purchase and operation of their air conditioners. Approximately 42 % (8.4 billion euros)
are related to electricity expenses.
The EU consumption of critical raw materials is also determined for the base cases
for the EU stock. For each of the base cases the amount of gold and copper is calculated
and the derived impacts regarding energy, emission of CO2-eq and value are presented
below.
• For BC 1
o 3.8 tonnes of gold, 0.95 PJ, 85803 tonne CO2-eq. and 134 million euros
o 207009 tonnes of copper, 11 PJ, 564716 tonne CO2-eq. and 1221 million
euros
• BC 2
o 7.4 tonnes of gold, 1.86 PJ, 167249 tonne CO2-eq. and 261 million euros
o 290496 tonnes of copper, 15 PJ, 792467 tonne CO2-eq. and 1714 million
euros
• BC 3
o 0.3 tonnes of gold, 0.07 PJ, 167249 tonne CO2-eq. and 10 million euros
o 24154 tonnes of copper, 1 PJ, 65891 tonne CO2-eq. and 143 million euros
The impacts of the raw materials are limited16 compared with the other impacts imposed
by air conditioners in the use phase. The value for the amount of gold and copper present
in the EU stock are significant. The combined impact and value of gold and copper in all air
conditioners (stock) are presented in Table 21.
16 Taking environmental impacts beyond energy and GWP into account, raw materials are connected to very severe environmental and health issues (gold: use of mercury; copper: acid mine drainage, water contamination in mining etc.) though these aspects are difficult to assess with MEErP methodology.
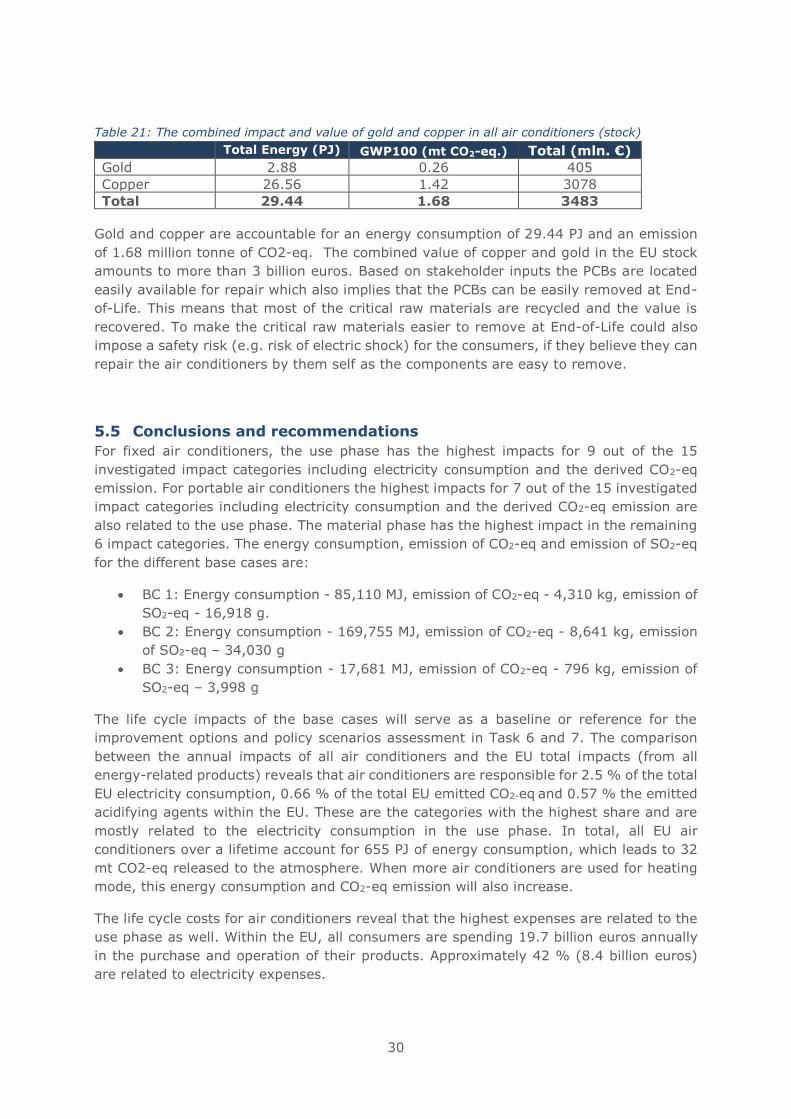
30
Table 21: The combined impact and value of gold and copper in all air conditioners (stock)
Total Energy (PJ) GWP100 (mt CO2-eq.) Total (mln. €)
Gold 2.88 0.26 405
Copper 26.56 1.42 3078
Total 29.44 1.68 3483
Gold and copper are accountable for an energy consumption of 29.44 PJ and an emission
of 1.68 million tonne of CO2-eq. The combined value of copper and gold in the EU stock
amounts to more than 3 billion euros. Based on stakeholder inputs the PCBs are located
easily available for repair which also implies that the PCBs can be easily removed at End-
of-Life. This means that most of the critical raw materials are recycled and the value is
recovered. To make the critical raw materials easier to remove at End-of-Life could also
impose a safety risk (e.g. risk of electric shock) for the consumers, if they believe they can
repair the air conditioners by them self as the components are easy to remove.
5.5 Conclusions and recommendations
For fixed air conditioners, the use phase has the highest impacts for 9 out of the 15
investigated impact categories including electricity consumption and the derived CO2-eq
emission. For portable air conditioners the highest impacts for 7 out of the 15 investigated
impact categories including electricity consumption and the derived CO2-eq emission are
also related to the use phase. The material phase has the highest impact in the remaining
6 impact categories. The energy consumption, emission of CO2-eq and emission of SO2-eq
for the different base cases are:
• BC 1: Energy consumption - 85,110 MJ, emission of CO2-eq - 4,310 kg, emission of
SO2-eq - 16,918 g.
• BC 2: Energy consumption - 169,755 MJ, emission of CO2-eq - 8,641 kg, emission
of SO2-eq – 34,030 g
• BC 3: Energy consumption - 17,681 MJ, emission of CO2-eq - 796 kg, emission of
SO2-eq – 3,998 g
The life cycle impacts of the base cases will serve as a baseline or reference for the
improvement options and policy scenarios assessment in Task 6 and 7. The comparison
between the annual impacts of all air conditioners and the EU total impacts (from all
energy-related products) reveals that air conditioners are responsible for 2.5 % of the total
EU electricity consumption, 0.66 % of the total EU emitted CO2-eq and 0.57 % the emitted
acidifying agents within the EU. These are the categories with the highest share and are
mostly related to the electricity consumption in the use phase. In total, all EU air
conditioners over a lifetime account for 655 PJ of energy consumption, which leads to 32
mt CO2-eq released to the atmosphere. When more air conditioners are used for heating
mode, this energy consumption and CO2-eq emission will also increase.
The life cycle costs for air conditioners reveal that the highest expenses are related to the
use phase as well. Within the EU, all consumers are spending 19.7 billion euros annually
in the purchase and operation of their products. Approximately 42 % (8.4 billion euros)
are related to electricity expenses.
31
The critical raw materials consumed during production have limited impacts and constitutes
below 1 % of the impacts imposed by air conditioners over a lifetime. In the EU stock, the
raw materials (gold and copper) embedded account for an energy consumption of 29.44
PJ and an emission of 1.68 million tonnes of CO2-eq. The combined value of copper and
gold in the stock amounts to more than 3 billion euros. The majority of these raw materials
are considered to be recycled at End-of-Life as most air conditioners already are facilitating
easy dismantling and repair.
32
Annex 1: Impact of refrigerant
In the EcoReport Tool inputs, the refrigerant weight is included in the category “various
other materials”. However, it cannot properly calculate the impacts of refrigerants (or the
impacts of leaking). The impact of the refrigerant and leakage are then calculated
separately in this review study. The yearly leakage is presented in Table 22.
Table 22: Calculated leakage of refrigerants per year
Reversible split [0-6kW]
Reversible split [6-12kW]
Portable
Refrigerant charge 0.98 kg 2.01 kg 0.26 kg
Annual leakage rate 3 % 3 % 1 %
GWP R410A (GWP 2088) R410A (GWP 2088) R290 (GWP 3.3)
Average Leakage kg/year
0.027 kg/year 0.058 kg/year 0.0025 kg/year
The leakage of refrigerants during the lifetime of the air conditioners is included directly in
the EcoReport tool manually, as kg CO2-eq in the use phase, in the result sheet under the
“Life cycle Impact per product”. This includes the impact of leakage in all of the results by
the EcoReport tool.
Regarding the EU stock, as the leakage rate of older air conditioners in the stock are difficult
to determine, the values presented in Table 22 are used for calculating the emission of
CO2-eq of stock as well.

1
Review of Regulation 206/2012 and
626/2011
Air conditioners and comfort fans
Task 6 report
DESIGN OPTIONS
Final version
Date: May 2018
2
Prepared by:
Viegand Maagøe and ARMINES
Study team: Baijia Huang, Jan Viegand, Peter Martin Skov Hansen, Philippe Riviere,
Hassane Asloune
Quality manager: Jan Viegand
Website design and management: Viegand Maagøe A/S
Contract manager: Viegand Maagøe A/S
Prepared for:
European Commission
DG ENER C.3
Office: DM24 04/048
B-1049 Brussels, Belgium
Contact person: Veerle Beelaerts
E-mail: [email protected]
Project website: www.eco-airconditioners.eu
Specific contract no.: No. ENER/C3/FV 2016-537/03/FWC 2015-619
LOT2/01/SI2.749247
Implements Framework Contract: № ENER/C3/2015-619 LOT 2
This study was ordered and paid for by the European Commission, Directorate-General
for Energy.
As agreed with Policy Officer Veerle Beelaerts, some of the budget for data purchase was
reallocated for project work.
The information and views set out in this study are those of the author(s) and do not
necessarily reflect the official opinion of the Commission. The Commission does not
guarantee the accuracy of the data included in this study. Neither the Commission nor any
person acting on the Commission’s behalf may be held responsible for the use which may
be made of the information contained therein.
This report has been prepared by the authors to the best of their ability and knowledge.
The authors do not assume liability for any damage, material or immaterial, that may arise
from the use of the report or the information contained therein.
© European Union, May 2018.
Reproduction is authorised provided the source is acknowledged.
More information on the European Union is available on the internet (http://europa.eu).
Viegand Maagøe A/S
Nr. Farimagsgade 37
1364 Copenhagen K
Denmark
viegandmaagoe.dk
3
Table of contents
List of tables ......................................................................................................... 4
List of figures ........................................................................................................ 5
Abbreviations ........................................................................................................ 7
Introduction to the task reports ............................................................................... 8
6 Introduction to Task 6 .....................................................................................10
6.1 Options ....................................................................................................10
6.1.1 Refrigerant ..........................................................................................10
6.1.2 Compressor ........................................................................................11
6.1.3 Heat exchangers and fans .....................................................................11
6.1.4 Standby, thermostat-off and crankcase heater ........................................13
6.1.5 Summary of options by product type ......................................................13
6.2 Impacts ...................................................................................................14
6.2.1 Energy efficiency modelling ...................................................................14
6.2.2 Environmental improvement assessment ................................................23
6.3 Costs .......................................................................................................28
6.4 Analysis LLCC and BNAT .............................................................................31
6.4.1 Ranking of the individual improvement options ........................................31
6.4.2 Positive or negative effects of improvement options .................................35
6.4.3 Cumulative improvement ......................................................................37
6.5 Prices uncertainties....................................................................................51
6.6 Long‐term targets ....................................................................................51
6.7 Conclusions and recommendations ..............................................................51
Annex 1 – Sensitivity analysis on heating and electricity prices ..................................55
4
List of tables
Table 1: list of individual options for base case 3.5 kW ..............................................13
Table 2: list of individual options for base case 7.1 kW ..............................................13
Table 3: list of options for base case, single duct 2.6 kW ...........................................13
Table 4: Main parameters for the base cases for split 3.5 kW and 7.1 kW ....................20
Table 5 : Main parameters for the base case for single duct 2.6 kW ............................20
Table 6: Impact of individual options on performance of the unit for split 3.5 kW (1%
electricity price increase and for 50% heating hours) ................................................21
Table 7: Impact of individual options on performance of the unit for split 7.1 kW (1%
electricity price increase and for 50% heating hours) ................................................22
Table 8: Impact of individual options on performance of the unit for single duct 2.6 kW,
for R290 (cooling only) ..........................................................................................22
Table 9: Impact of individual options on cost and on performance of the unit for single
duct 2.6 kW, for R1234yf (cooling only) ..................................................................22
Table 10: Refrigerant charge for the different improvement options ............................23
Table 11: percentage of cost per component for three base cases, BC 3 with three
refrigerant types ..................................................................................................28
Table 12: Overcost of individual options for reversible 3.5 kW units ............................29
Table 13: Overcost of individual options for reversible 7.1 kW units ............................29
Table 14: Variation in system component material costs of using R290 and R1234yf
compared to R410A ..............................................................................................30
Table 15: Variation of costs compared with R410A ....................................................31
Table 16: Variation of refrigerant costs and charge compared with R410A ...................31
Table 17: Overcost of individual options for single duct 2.6 kW units. For R290 ............31
Table 18: Overcost of individual options for single duct 2.6 kW units. For R1234YF .......31
Table 19: Ranking of individual options by simple payback time, reversible 3.5 kW unit
(1% electricity price increase and for 50% heating hours) .........................................32
Table 20: Ranking of individual options by simple payback time, single duct 2.6 kW unit,
R290 ...................................................................................................................34
Table 21: Ranking of individual options by simple payback time, single duct 2.6 kW unit,
R1234yf ..............................................................................................................34
Table 22: Sound power and air flow for base case and larger air flows, split units .........35
Table 23: Sound power and air flow for base case and BAT, single duct 2.6 kW unit .....36
Table 24: Ranking of individual and combined options (used to find LLCC) by simple
payback time, reversible 3.5 kW unit (50% heating hours and 1% electricity price
increase) .............................................................................................................38
Table 25: Ranking of individual and combined options (used to find LLCC) by simple
payback time, reversible 7.1 kW unit (50% heating hours and 1% electricity price
increase) .............................................................................................................41
Table 26: Ranking of combined options by simple payback time, single duct 2.6 kW,
R290 ...................................................................................................................45
5
List of figures
Figure 1: Compressor efficiency curve as a function of the compression ratio for the
different compressor options ..................................................................................18
Figure 2: Total energy consumption of the base case and the different improvement
options – for BC 1 (split 3.5 kW) ............................................................................24
Figure 3: Emission of CO2 (kg CO2-eq) of the base case and the different improvement
options – for BC 1 (split 3.5 kW) ............................................................................24
Figure 4: Emission of acidifying agents (g SO2-eq) of the base case and the different
improvement options – for BC 1 (split 3.5 kW) .........................................................24
Figure 5: Total energy consumption of the base case and the different improvement
options – for BC 2 (split 7.1 kW) ............................................................................25
Figure 6: Emission of CO2 (kg CO2-eq) of the base case and the different improvement
options – for BC 2 (split 7.1 kW) ............................................................................25
Figure 7: Emission of acidifying agents (g SO2-eq) of the base case and the different
improvement options – for BC 2 (split 7.1 kW) .........................................................26
Figure 8: Total energy consumption of the base case and the different improvement
options – for BC 3 (single duct 2.6 kW – R290 and R1234yf) .....................................26
Figure 9: Emission of CO2 (kg CO2-eq) of the base case and the different improvement
options – for BC 3 (single duct 2.6 kW– R290 and R1234yf) ......................................27
Figure 10: Emission of acidifying agents (g SO2-eq) of the base case and the different
improvement options – for BC 3 (single duct 2.6 kW– R290 and R1234yf) ...................27
Figure 11: increase of sound power vs increase of airflow rate ...................................30
Figure 12: LCC and Energy consumption for split 3.5 kW unit, ranking by decreasing
energy consummation ...........................................................................................32
Figure 13: LCC and energy consumption for split 7.1 kW unit, ranking by decreasing
energy consumption .............................................................................................33
Figure 14 : LCC and energy consumption for single duct 2.6 kW unit (only cooling), R290
..........................................................................................................................34
Figure 15 : LCC and energy consumption for single duct 2.6 kW unit (only cooling),
R1234yf ..............................................................................................................35
Figure 16: LCC curve of reversible 3.5 kW unit (50% heating hours and 1% electricity
price increase) .....................................................................................................38
Figure 17: LCC & Energy consumption of reversible 3.5 kW unit (50% heating hours and
1% electricity price increase) .................................................................................39
Figure 18: Total energy consumption of the base case, LLCC and BNAT – for BC 1 (split
3.5 kW) ...............................................................................................................40
Figure 19: Emission of CO2 (kg CO2-eq) of the base case, LLCC and BNAT – for BC 1
(split 3.5 kW) .......................................................................................................40
Figure 20: Emission of acidifying agents (g SO2-eq) of the base case, LLCC and BNAT –
for BC 1 (split 3.5 kW) ..........................................................................................40
Figure 21: LCC curve of reversible 7.1 kW unit (50% heating hours and 1% electricity
price increase) .....................................................................................................42
Figure 22: LCC & Energy consumption of reversible 7.1 kW unit (50% heating hours and
1% electricity price increase) .................................................................................42
Figure 23: Total energy consumption of the base case, LLCC and BNAT – for BC 2 (split
7.1 kW) ...............................................................................................................43
Figure 24: Emission of CO2 (kg CO2-eq) of the base case, LLCC and BNAT – for BC 2
(split 7.1 kW) .......................................................................................................44
6
Figure 25: Emission of acidifying agents (g SO2-eq) of the base case, LLCC and BNAT –
for BC 2 (split 7.1 kW) ..........................................................................................44
Figure 26: LCC curve of single duct 2.6 kW unit (cooling only, 1% electricity price
increase), R290 ....................................................................................................45
Figure 27: LCC & Energy consumption of single duct 2.6 kW unit (cooling only, 1%
electricity price increase), R290..............................................................................46
Figure 28: LCC curve of single duct 2.6 kW unit (cooling only, 1% electricity price
increase), R1234YF ...............................................................................................47
Figure 29: LCC & Energy consumption of single duct 2.6 kW unit (cooling only, 1%
electricity price increase), R1234YF ........................................................................48
Figure 30: Total energy consumption of the base case, LLCC and BNAT – for BC 3 (single
duct 2.6 kW – R290) .............................................................................................49
Figure 31: Emission of CO2 (kg CO2-eq) of the base case, LLCC and BNAT – for BC 3
(single duct 2.6 kW – R290) ..................................................................................49
Figure 32: Emission of acidifying agents (g SO2-eq) of the base case, LLCC and BNAT –
for BC 3 (single duct 2.6 kW – R290) ......................................................................49
Figure 33: Total energy consumption of the base case, LLCC and BNAT – for BC 3 (single
duct 2.6 kW – R1234yf) ........................................................................................50
Figure 34: Emission of CO2 (kg CO2-eq) of the base case, LLCC and BNAT – for BC 3
(single duct 2.6 kW – R1234yf) ..............................................................................50
Figure 35: Emission of acidifying agents (g SO2-eq) of the base case, LLCC and BNAT –
for BC 3 (single duct 2.6 kW – R1234yf) ..................................................................50
Figure 36 BC 1: 30% heating/ 0% electricity price increase .......................................55
Figure 37 BC 1: 30% heating/ 1% electricity price increase .......................................55
Figure 38 BC 1 : 50% heating/ 0% electricity price increase ......................................56
Figure 39 BC 1 : 50% heating/ 1% electricity price increase ......................................56
Figure 40 BC 2 : 30% heating/ 0% electricity price increase ......................................57
Figure 41 BC 2 : 30% heating/ 1% electricity price increase ......................................57
Figure 42 BC 2 : 50% heating/ 0% electricity price increase ......................................58
Figure 43 BC 2 : 50% heating/ 1% electricity price increase ......................................58
Figure 44 BC 3 : R290/ 0% electricity price increase .................................................59
Figure 45 BC 3 : R290/ 1% electricity price increase .................................................59
Figure 46 BC 3: R1234yf/ 0% electricity price increase .............................................60
Figure 47 BC 3: R1234yf/ 1% electricity price increase .............................................60
7
Abbreviations
AC Alternating current
BAT Best Available Technology
BAU Business as Usual
BC Base case
BLc Annual cooling load per square meter of room area (kWh/m2/year/)
BNAT Best Not Yet Available Technology
COP Coefficient of Performance for air conditioners in heating mode
DC Direct current
EER Energy Efficiency Ratio for air conditioners in cooling mode
Eq Equivalents
GWP Global warming potential
K Kelvin
LLCC Least Life Cycle Costs
MHE Microchannel heat exchangers
SCOP Seasonal Coefficient of Performance for air conditioners, heating mode
SEER Seasonal Energy Efficiency Ratio for air conditioners, cooling mode
SHR Sensible Heat Ratio for air conditioners
PWF Present Worth Factor
8
Introduction to the task reports
This is the introduction to the Review of Regulation 206/2012 and 626/2011 for air
conditioners and comfort fans. The report has been split into seven tasks, following the
structure of the MEErP methodology. Each task report has been uploaded individually in
the project’s website. These task reports present the technical basis to define future
ecodesign and energy labelling requirements based on the existing Regulation (EU)
206/2012 and 626/2011.
The task reports start with the definition of the scope for this review study (i.e. task 1),
which assesses the current scope of the existing regulation in light of recent developments
with relevant legislation, standardisation and voluntary agreements in the EU and abroad.
Furthermore, assessing the possibility of merging implementing measures that cover the
similar groups of products or extend the scope to include new product groups. The
assessment results in a refined scope for this review study.
Following it is task 2, which updates the annual sales and stock of the products in scope
according to recent and future market trends and estimates future stocks. Furthermore, it
provides an update on the current development of low-GWP alternatives and sound
pressure level.
Next task is task 3, which presents a detailed overview of use patterns of products in scope
according to consumer use and technological developments. It also provides an analysis of
other aspects that affect the energy consumption during the use of these products, such
as component technologies. Furthermore, it also touches on aspects that are important for
material and resource efficiency such as repair and maintenance, and it gives an overview
of what happens to these products at their end of life.
Task 4 presents an analysis of current average technologies at product and component
level, and it identifies the Best Available Technologies both at product and component level.
An overview of the technical specifications as well as their overall energy consumption is
provided when data is available. Finally, the chapter discusses possible design options to
improve the resource efficiency.
Simplified tasks 5 & 6 report presents the base cases, which will be later used to define
the current and future impact of the current air condition regulation if no action is taken.
The report shows the base cases energy consumption at product category level and their
life cycle costs. It also provides a high-level overview of the life cycle global warming
potential of air conditioners and comfort fans giving an idea of the contribution of each life
cycle stage to the overall environmental impact. Finally, it presents some identified design
options which will be used to define reviewed ecodesign and energy labelling requirements.
Task 7 report presents the policy options for an amended ecodesign regulation on air
conditioners and comfort fans. The options have been developed based on the work
throughout this review study, dialogue with stakeholders and with the European
Commission. The report presents an overview of the barriers and opportunities for the
reviewed energy efficiency policy options, and the rationale for the new
material/refrigerant efficiency policy options. This report will be the basis to calculate the
estimated energy and material savings potentials by implementing these policy options, in
comparison to no action (i.e. Business as Usual – BAU).

9
The task reports follow the MEErP methodology, with some adaptations which suit the
study goals.
10
6 Introduction to Task 6
Task 6 follows the MEErP methodology and aims to identify design options and their
monetary consequences in terms of Life Cycle Cost for the consumer, their environmental
costs and benefits and pinpointing the solution with the Least Life Cycle Costs (LLCC) and
the Best Not Available Technology (BNAT). Life Cycle Cost functions as an indicator on
whether the suggested design solutions have a negative or positive impact on the
consumer expenditures over the total life of air conditioners and comfort fans. Task 6
includes the following sections:
1. Options: Identification and description of design options taken into account
2. Impacts: The environmental improvement per design option based the EcoReport
tool
3. Costs: The effect on price due to implementation of the suggested design options
4. Analysis LLCC and BAT: The impact at EU level considering both costs and
environmental impacts
5. Long‐term targets: The long-term technical potential (BNAT)
6. Conclusions and recommendations
6.1 Options
In this section, different improvement options for air conditioners are discussed. The
individual EcoReport Tool result of each option is not investigated here (as it will be
presented in later section) but only the energy consumed in each case.
6.1.1 Refrigerant
For split air conditioners, R32 is likely to replace R410A in the coming years, with a
complete conversion to happen before 2025 for single split according to Regulation (EU N°
517/2014) ban according to EPEE (European Partnership for Energy & the Environment)1.
Note that even if this regulation only applies to single split systems, the conversion covers
also multi-split systems with the logics that as for these products there are possible
replacement fluids; the ban pushes for their adoption in order to reserve quotas for other
sectors. GWP consequently will decrease from 2088 to 675 for split air conditioners. R32
has higher performances (with charge and expansion valve optimization, as compared to
R410A for a split unit, COP increases by 4 % and capacity by 5 %) than R410A2,3, but it
also has higher costs for safety measures because of its flammability. As in the EU, the
price of R32 units (at equal efficiency level) is now about similar to the ones of R410A units
1 Andrea Voigt, INPAC, 2017 2 RTOC 2014, UNEP TECHNICAL OPTIONS COMMITTEE, ASSESSMENT REPORT OF THE REFRIGERATION, AIR CONDITIONING AND HEAT PUMPS MONTREAL PROTOCOL ON SUBSTANCES THAT DEPLETE THE OZONE LAYER, 2014 3 AHRI low GWP program, http://www.ahrinet.org/App_Content/ahri/files/RESEARCH/AREP_Final_Reports/AHRI_Low_GWP_AREP_Rpt_062.pdf
11
(this means that the gain in performance more or less compensates for the increased cost
due to safety measures), no option is proposed for R32 as an alternative to R410A. The
improvement potential is evaluated for R410A and is thought to be similar for R32 and
R410A.
For portable air conditioners, propane is the only alternative to R410A presently available
on the market with GWP lower than 150. It has been available for more than a decade, but
its share remains low and there is no trend that its share increases. In this review study,
R290 and R1234yf are considered the two alternatives of R410A portable air conditioners.
6.1.2 Compressor
Compression efficiency
Split systems basic DC compressor EER (ASHRAE conditions SI units) has been identified
to be about 3.13. The first option to improve efficiency is to use a higher efficiency rotary
compressor with EER 3.4. A second option is to use a 3.4 EER rotary compressor with
improved oil management which enables to operate at lower compression ratio (minimum
compressor ratio down to 1.1 versus 1.2 for other compressors). The improvement options
are noted as CP1 and CP2 for base case 1 and 2.
For single duct air conditioners, the R410A base case is fitted with a 2.7 EER (ASHRAE
conditions) AC rotary compressor. At equal global compressor efficiency and standard
testing conditions, the compressor EER with R290 or R1234yf is higher because of the
alternative fluid properties (R290 EER = 2,98; R1234yf EER = 3,02). We suppose here that
it is possible to build rotary compressors for alternative refrigerant with similar global
efficiencies as for R410A levels of 3.13 and 3.4. This leaves to maximum EER compressor
values in standard conditions of 3.75 for R290 and up to 3.8 for R1234yf with best inverter
DC compressor. For R1234yf, this hypothesis bases upon DC rotary compressor using
R134a that can indeed reach such performance levels in small capacity ranges for the same
ASHRAE conditions. For propane, in India, high efficiency units with propane (at
performance levels comparable to the ones of best R32 or R410A DC inverter split) are
available.
Intermediate values are used to define improvement levels. The improvement options are
noted as CP1 (3.45 EER for R290 and 3.5 EER for R1234yf) CP2 (3.75 EER for R290 and
3.80 EER for R1234yf)
Vapour injection and phase separation
Efficiency improvement is estimated to be of about 0.5 % on the SCOP value. The
significant increase in capacity at low outdoor temperature has limited economic value for
the average climate as product price is mainly depending on their cooling capacity and
efficiency (as seen in Task 2, price premium of split air conditioners can be drawn with
SEER and cooling capacity and not with SCOP or capacity at heating design conditions). It
is thus not considered as an option.
6.1.3 Heat exchangers and fans
Heat exchanger area and air flow are increased proportionally to maximize the gain of heat
exchanger oversizing. Doing so, fan power is considered to remain constant by increasing
proportionally to the air flow the fan and/or motor efficiency. For more efficient products,
it is observed that the fan mechanical efficiency and motor efficiency increase to reach
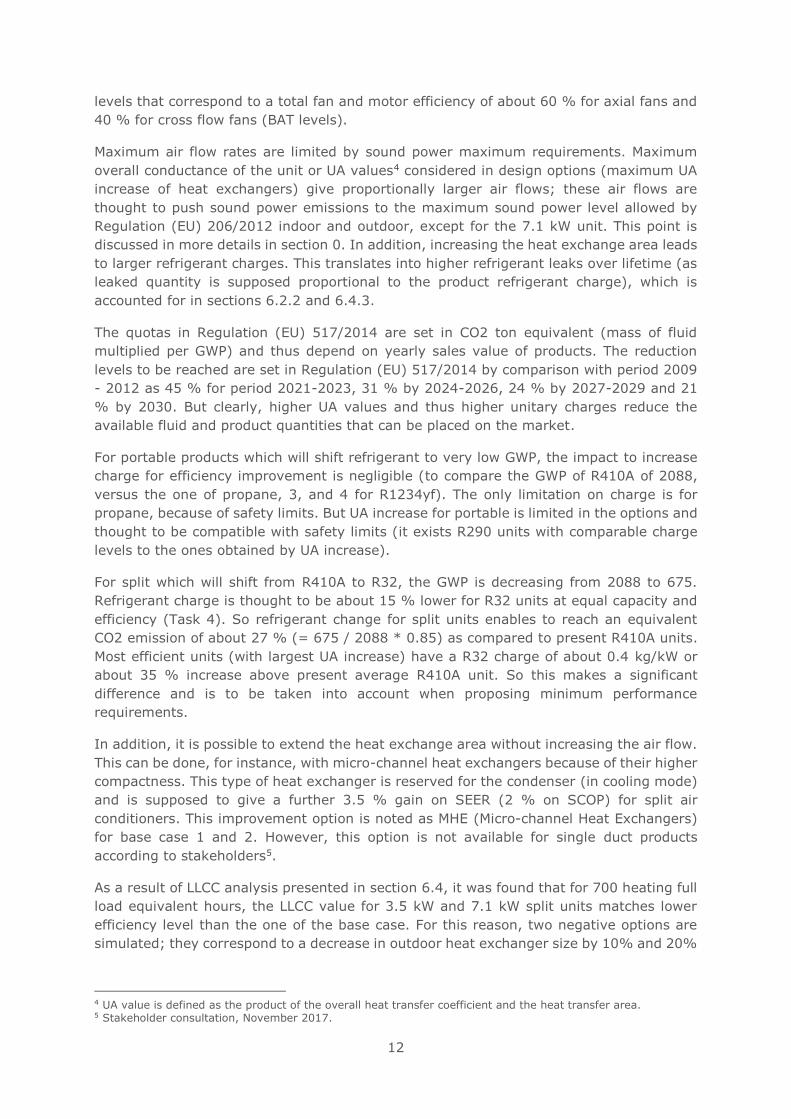
12
levels that correspond to a total fan and motor efficiency of about 60 % for axial fans and
40 % for cross flow fans (BAT levels).
Maximum air flow rates are limited by sound power maximum requirements. Maximum
overall conductance of the unit or UA values4 considered in design options (maximum UA
increase of heat exchangers) give proportionally larger air flows; these air flows are
thought to push sound power emissions to the maximum sound power level allowed by
Regulation (EU) 206/2012 indoor and outdoor, except for the 7.1 kW unit. This point is
discussed in more details in section 0. In addition, increasing the heat exchange area leads
to larger refrigerant charges. This translates into higher refrigerant leaks over lifetime (as
leaked quantity is supposed proportional to the product refrigerant charge), which is
accounted for in sections 6.2.2 and 6.4.3.
The quotas in Regulation (EU) 517/2014 are set in CO2 ton equivalent (mass of fluid
multiplied per GWP) and thus depend on yearly sales value of products. The reduction
levels to be reached are set in Regulation (EU) 517/2014 by comparison with period 2009
- 2012 as 45 % for period 2021-2023, 31 % by 2024-2026, 24 % by 2027-2029 and 21
% by 2030. But clearly, higher UA values and thus higher unitary charges reduce the
available fluid and product quantities that can be placed on the market.
For portable products which will shift refrigerant to very low GWP, the impact to increase
charge for efficiency improvement is negligible (to compare the GWP of R410A of 2088,
versus the one of propane, 3, and 4 for R1234yf). The only limitation on charge is for
propane, because of safety limits. But UA increase for portable is limited in the options and
thought to be compatible with safety limits (it exists R290 units with comparable charge
levels to the ones obtained by UA increase).
For split which will shift from R410A to R32, the GWP is decreasing from 2088 to 675.
Refrigerant charge is thought to be about 15 % lower for R32 units at equal capacity and
efficiency (Task 4). So refrigerant change for split units enables to reach an equivalent
CO2 emission of about 27 % (= 675 / 2088 * 0.85) as compared to present R410A units.
Most efficient units (with largest UA increase) have a R32 charge of about 0.4 kg/kW or
about 35 % increase above present average R410A unit. So this makes a significant
difference and is to be taken into account when proposing minimum performance
requirements.
In addition, it is possible to extend the heat exchange area without increasing the air flow.
This can be done, for instance, with micro-channel heat exchangers because of their higher
compactness. This type of heat exchanger is reserved for the condenser (in cooling mode)
and is supposed to give a further 3.5 % gain on SEER (2 % on SCOP) for split air
conditioners. This improvement option is noted as MHE (Micro-channel Heat Exchangers)
for base case 1 and 2. However, this option is not available for single duct products
according to stakeholders5.
As a result of LLCC analysis presented in section 6.4, it was found that for 700 heating full
load equivalent hours, the LLCC value for 3.5 kW and 7.1 kW split units matches lower
efficiency level than the one of the base case. For this reason, two negative options are
simulated; they correspond to a decrease in outdoor heat exchanger size by 10% and 20%
4 UA value is defined as the product of the overall heat transfer coefficient and the heat transfer area. 5 Stakeholder consultation, November 2017.
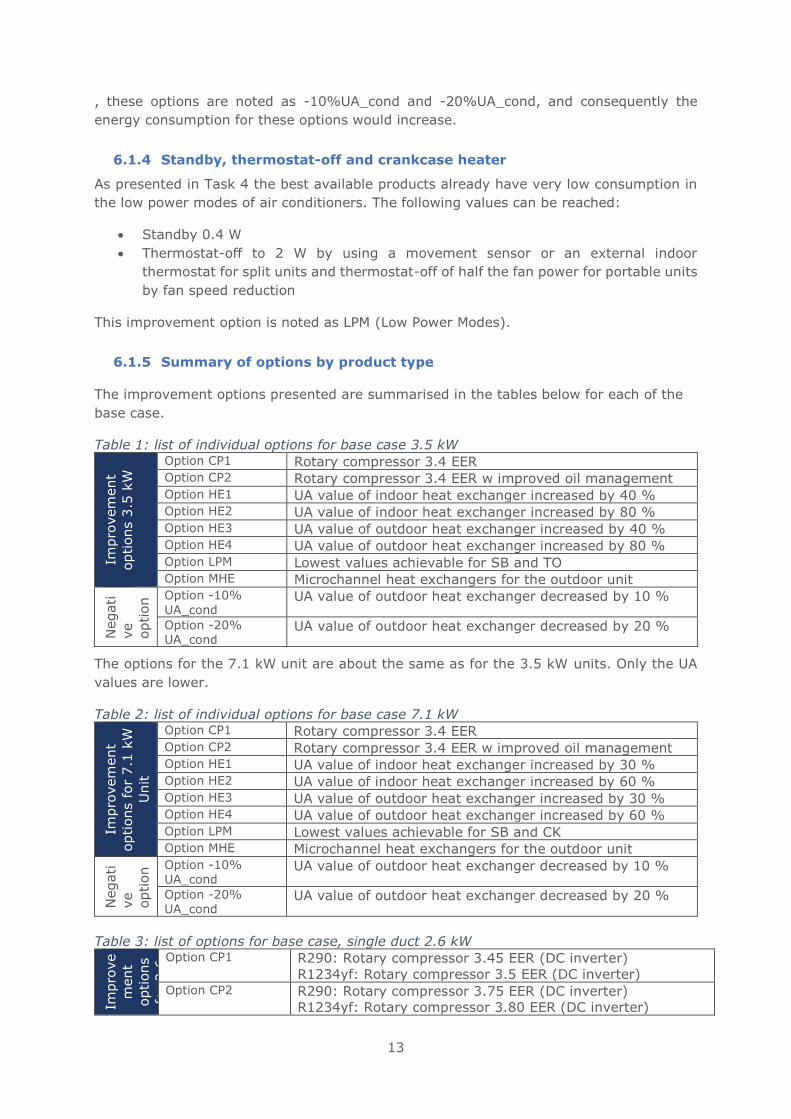
13
, these options are noted as -10%UA_cond and -20%UA_cond, and consequently the
energy consumption for these options would increase.
6.1.4 Standby, thermostat-off and crankcase heater
As presented in Task 4 the best available products already have very low consumption in
the low power modes of air conditioners. The following values can be reached:
• Standby 0.4 W
• Thermostat-off to 2 W by using a movement sensor or an external indoor
thermostat for split units and thermostat-off of half the fan power for portable units
by fan speed reduction
This improvement option is noted as LPM (Low Power Modes).
6.1.5 Summary of options by product type
The improvement options presented are summarised in the tables below for each of the
base case.
Table 1: list of individual options for base case 3.5 kW
Impro
vem
ent
options 3
.5 k
W Option CP1 Rotary compressor 3.4 EER
Option CP2 Rotary compressor 3.4 EER w improved oil management Option HE1 UA value of indoor heat exchanger increased by 40 % Option HE2 UA value of indoor heat exchanger increased by 80 % Option HE3 UA value of outdoor heat exchanger increased by 40 % Option HE4 UA value of outdoor heat exchanger increased by 80 % Option LPM Lowest values achievable for SB and TO Option MHE Microchannel heat exchangers for the outdoor unit
Negati
ve
option
s
Option -10%
UA_cond UA value of outdoor heat exchanger decreased by 10 %
Option -20% UA_cond
UA value of outdoor heat exchanger decreased by 20 %
The options for the 7.1 kW unit are about the same as for the 3.5 kW units. Only the UA
values are lower.
Table 2: list of individual options for base case 7.1 kW
Impro
vem
ent
options f
or
7.1
kW
Unit
Option CP1 Rotary compressor 3.4 EER Option CP2 Rotary compressor 3.4 EER w improved oil management Option HE1 UA value of indoor heat exchanger increased by 30 % Option HE2 UA value of indoor heat exchanger increased by 60 % Option HE3 UA value of outdoor heat exchanger increased by 30 % Option HE4 UA value of outdoor heat exchanger increased by 60 % Option LPM Lowest values achievable for SB and CK Option MHE Microchannel heat exchangers for the outdoor unit
Negati
ve
option
s
Option -10% UA_cond
UA value of outdoor heat exchanger decreased by 10 %
Option -20% UA_cond
UA value of outdoor heat exchanger decreased by 20 %
Table 3: list of options for base case, single duct 2.6 kW
Impro
ve
ment
options
for
2.6
kW
Unit Option CP1 R290: Rotary compressor 3.45 EER (DC inverter)
R1234yf: Rotary compressor 3.5 EER (DC inverter) Option CP2 R290: Rotary compressor 3.75 EER (DC inverter)
R1234yf: Rotary compressor 3.80 EER (DC inverter)
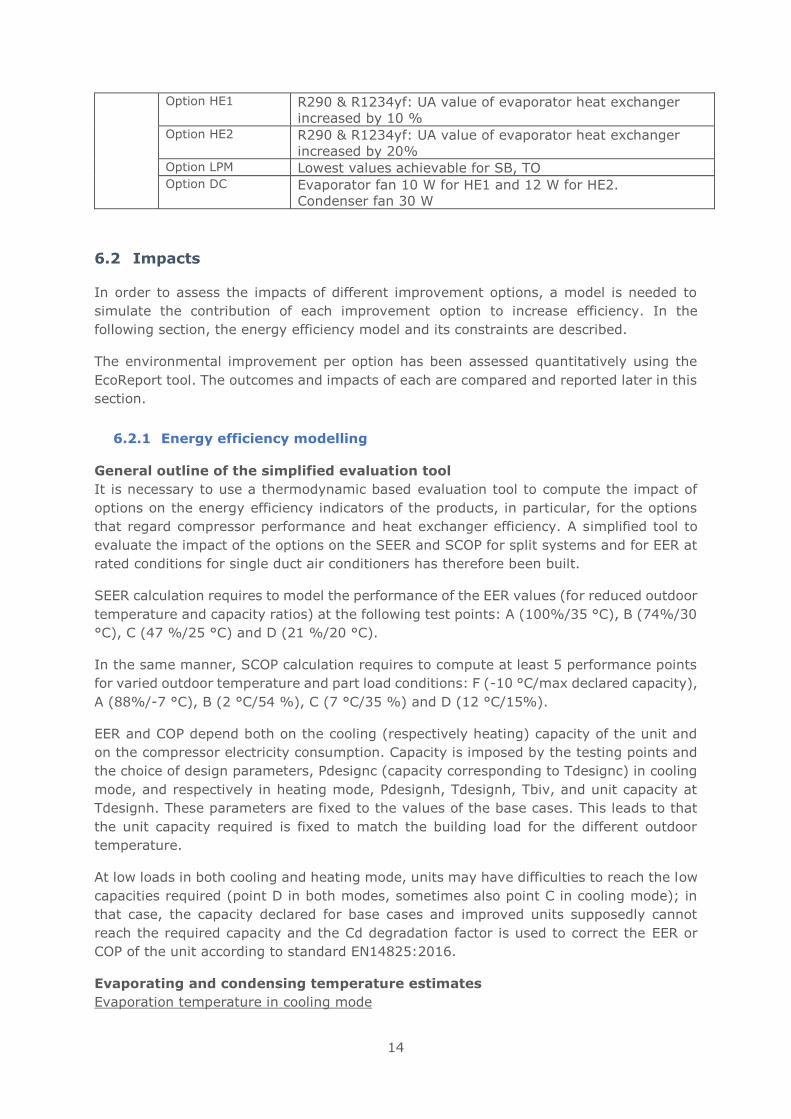
14
Option HE1 R290 & R1234yf: UA value of evaporator heat exchanger
increased by 10 % Option HE2 R290 & R1234yf: UA value of evaporator heat exchanger
increased by 20% Option LPM Lowest values achievable for SB, TO Option DC Evaporator fan 10 W for HE1 and 12 W for HE2.
Condenser fan 30 W
6.2 Impacts
In order to assess the impacts of different improvement options, a model is needed to
simulate the contribution of each improvement option to increase efficiency. In the
following section, the energy efficiency model and its constraints are described.
The environmental improvement per option has been assessed quantitatively using the
EcoReport tool. The outcomes and impacts of each are compared and reported later in this
section.
6.2.1 Energy efficiency modelling
General outline of the simplified evaluation tool
It is necessary to use a thermodynamic based evaluation tool to compute the impact of
options on the energy efficiency indicators of the products, in particular, for the options
that regard compressor performance and heat exchanger efficiency. A simplified tool to
evaluate the impact of the options on the SEER and SCOP for split systems and for EER at
rated conditions for single duct air conditioners has therefore been built.
SEER calculation requires to model the performance of the EER values (for reduced outdoor
temperature and capacity ratios) at the following test points: A (100%/35 °C), B (74%/30
°C), C (47 %/25 °C) and D (21 %/20 °C).
In the same manner, SCOP calculation requires to compute at least 5 performance points
for varied outdoor temperature and part load conditions: F (-10 °C/max declared capacity),
A (88%/-7 °C), B (2 °C/54 %), C (7 °C/35 %) and D (12 °C/15%).
EER and COP depend both on the cooling (respectively heating) capacity of the unit and
on the compressor electricity consumption. Capacity is imposed by the testing points and
the choice of design parameters, Pdesignc (capacity corresponding to Tdesignc) in cooling
mode, and respectively in heating mode, Pdesignh, Tdesignh, Tbiv, and unit capacity at
Tdesignh. These parameters are fixed to the values of the base cases. This leads to that
the unit capacity required is fixed to match the building load for the different outdoor
temperature.
At low loads in both cooling and heating mode, units may have difficulties to reach the low
capacities required (point D in both modes, sometimes also point C in cooling mode); in
that case, the capacity declared for base cases and improved units supposedly cannot
reach the required capacity and the Cd degradation factor is used to correct the EER or
COP of the unit according to standard EN14825:2016.
Evaporating and condensing temperature estimates
Evaporation temperature in cooling mode
15
For the evaporator in cooling mode, the cooling capacity to be exchanged is known. There
are two distinct situations to compute the evaporating temperature:
CASE 1: for single duct rated capacity, for split EERA (100%/35 °C) and in most cases for
EERB (74%/30 °C) test conditions, there is dehumidification. In that case, the heat
exchanger capacity is computed from an assumed heat exchanger effectiveness value (also
called bypass factor for a coil with dehumidification) and a given air flow rate. Cooling
capacity is decreased by the fan motor power (supposing that all motor losses convert to
heat in the air stream and that useful fan energy converts to pressure losses and then to
heat in the air stream ultimately). Refrigerant fluid evaporating temperature (Tev) is
identified by iteration so that the sum of the sensible and latent capacities reaches the
cooling output of the simulated point.
CASE 2: for EERC and EERD, there is no dehumidification. In that case, Tev is identified by
iteratively equalizing two DTLM (the logarithmic mean temperature difference between air
and refrigerant) values computed with the help of the equations below:
• 𝐷𝑇𝐿𝑀1 = 𝑄 / 𝑈𝐴; 𝑤𝑖𝑡ℎ 𝑈𝐴 = 𝑁𝑈𝑇𝐴 × 𝑚𝐶𝑝; 𝑁𝑈𝑇𝐴 = 𝑙𝑛(1/(1 − 𝜀𝐴))
• 𝐷𝑇𝐿𝑀2 = ((𝑇𝑎_𝑖 − 𝑇𝑒𝑣) − (𝑇𝑎_𝑜 − 𝑇𝑒𝑣)) / 𝐿𝑛 ((𝑇𝑎_𝑖 − 𝑇𝑒𝑣)/ (𝑇𝑎_𝑜 − 𝑇𝑒𝑣))
With:
• Q: cooling capacity to be exchanged at evaporator
• UA: global heat exchange coefficient of the heat exchanger in W/K
• m: air flow rate in kg/s
• Cp: air specific heat at constant pressure in J/kg/K
• NUT: number of unit transfer (ratio of UA to mCp). NUTA refers to the reference
point used to fix UA, in that case point A (100% load and 35 °C outdoor). This is a
constant for all 4 points simulated.
• ε: heat exchanger effectiveness; εA refers to the reference point used to fix UA, in
that case point A (100% load and 35 °C outdoor); this is a constant for all 4
points simulated.
• Ta_i: evaporator inlet air temperature
• Ta_o: evaporator outlet air temperature
• Tev: refrigerant fluid evaporating temperature
UA is variable and varies proportionally to the air flow rate, while NUTA is supposed constant
whatever the testing point6.
and with:
𝑇𝑎_𝑜 = 𝑇𝑎_𝑖 − 𝑄 / 𝑚𝐶𝑝
Note that in both cases superheat is not considered in the heat exchanger calculation,
evaporating side is considered isothermal. Refrigerant fluid pressure losses are not
considered either.
Condensation temperature in cooling mode
6 This might lead to slightly underestimate the UA value at lower air flow as U is in first order proportional to the air speed v in power of 0.75 to 0.8 and so NUT (UA/mCp) should be proportional to v-0.2 and so slightly increase with decreased air flow. However, the refrigerant side conduction coefficient also decreases with more complex effect to model. So this simplification is considered an acceptable first order estimate and allows the model to correctly fit part load performances.
16
The same iterative method on DTLM is applied at condenser as in CASE 2 for the
evaporator. Condenser heat capacity for the specific point is the sum of the cooling capacity
and of the compressor electricity consumption computed below so that there is an iteration
on the condensing temperature value Tc.
Sub-cooling and superheat horn7 are not considered in DTLM2 calculation (formula above
in this section - CASE 2) at the condenser; thus, condenser refrigerant temperature is
supposed to be constant and equals Tc value.
Case of single duct
Most single duct units use evaporator condensates to increase condenser performance.
Water condensates are evaporated on the condenser coil. Water which is not directly
evaporated flows down in a tray below the condenser and a wheel pump runs permanently
to sprinkle water on the condenser. All water condensate helps to increase the heat transfer
at the condenser due to evaporation. Calculating the amount of energy to evaporate
condensed water, this corresponds to about 25 % of condenser heat release without the
water condensate. It is supposed in DTLM calculation of the condenser that the heat to be
rejected is lower by 25 % (only 75 % of the heat extracted corresponds to sensible heating
of the air at the condenser). This value is adjusted when evaporating temperature varies
(case of larger evaporator or of inverter use with new metrics).
Condensing temperature in heating mode
The calculation is the same as for condensing temperature in cooling mode except the
power consumption of the fan is added to the heating capacity and that the capacity of the
heat exchanger is defined by the heating part load ratio of the test point simulated.
Evaporating temperature in heating mode
Evaporator capacity is the difference between the heating capacity and the compressor
power. The DTLM iteration is used to compute the evaporating temperature.
Evaporator superheat (SH)
It is constant to 2 K (electronic expansion valve) for all split simulations and to 6 K
(capillary tube or thermostatic expansion valve) for single duct. As it only intervenes in the
model in modifying the compressor work, its variation has very limited impact on the global
efficiency (less than 0.5 % when changing from 2 to 6 K).
Condenser subcooling (SC)
Condenser subcooling is set constant for single duct.
A reference value is defined in standard rating conditions in cooling mode and at declared
unit capacity at -10 °C in heating mode. In part load, subcooling value is supposed equal
to the product of the reference subcooling value multiplied by the ratio of the specific test
point temperature difference between the condensing temperature and the inlet air
temperature to the same ratio for the reference test conditions8. For example, in cooling
mode:
𝑆𝐶𝐵,𝐶,𝐷 = 𝑆𝐶𝐴 × (𝑇𝑐_𝐵,𝐶,𝐷 − 𝑇𝑎_𝑖_ 𝐵,𝐶,𝐷) / (𝑇𝑐_𝐴 − 𝑇𝑎_𝑖_𝐴)
7 Superheat horn means the transformation occurring in the condenser during which the refrigerant fluid at high temperature and high pressure flowing out of the compressor is cooled down to high pressure saturation temperature. 8 Approximation suggested by manufacturers to model air cooled chiller SEPR performance point in the frame of Lot 1 commercial refrigeration impact assessment study.
17
With:
• SC A,B,C,D: subcooling in test conditions A or B or C or D in K
• Tc_ A,B,C,D: condensing temperature in test conditions A or B or C or D in K
• Ta_i_ A,B,C,D: condenser inlet air temperature in test conditions A or B or C or D in
K
Air flow reduction at low loads for split units (with inverter compressor and fans)
At low loads in cooling mode, condenser fan power is reduced to maintain performance.
This is also the case at low loads in heating mode at the evaporator. In these conditions,
compressor power is low and fan power is no longer small in comparison to compressor
electricity consumption; so, it is more efficient to decrease fan power, even if compressor
power increases.
Refrigerant temperature is found with the same iteration of CASE 2 for evaporation
temperature in cooling mode above, with changed flow rate. UA is assumed proportional
to flow and NUT is constant as discussed above.
Fan power is assumed to vary with flow rate as follows for these test conditions with
reduced air flow rates:
𝑃𝑓 = 𝑃𝑓𝑁 × (0.1 + 0.9 × 𝐴𝐹𝑅3 )
With:
• PfN: nominal electric power of the fan motor
• AFR: ratio of the reduced air flow to the nominal air flow
Compressor efficiency estimate
EER (respectively COP) of the compressor is calculated from Tev and Tc. Superheat and
subcooling are also considered.
A correlation between the global efficiency of the compressor and the compression ratio
(Pc/Pev) is used:
𝜂𝑔 = 𝑓 (𝑃𝑐
𝑃𝑒𝑣)
The compressor EER (respectively COP) is then computed as the ratio of the EERis
(respectively COPis) obtained for the isentropic cycle defined by Tev, SH, Tc, SC, an
isentropic compression and an isenthalpic expansion. The properties of the fluid at the
different state points are computed using Refprop 99.
EER (COP) = EERis (COPis) / ηg
with:
• EERis (COPis): EER(COP) of the isentropic cycle
Performance curves of a 2.9 EER (ASHRAE standard conditions, SI units) AC rotary
compressor were published recently10 in the frame of the AHRI Low-GWP Alternative
9 https://www.nist.gov/srd/refprop 10 http://www.ahrinet.org/App_Content/ahri/files/RESEARCH/PasswordProtected/AHRI%20Low-GWP%20AREP-Rpt-026.pdf
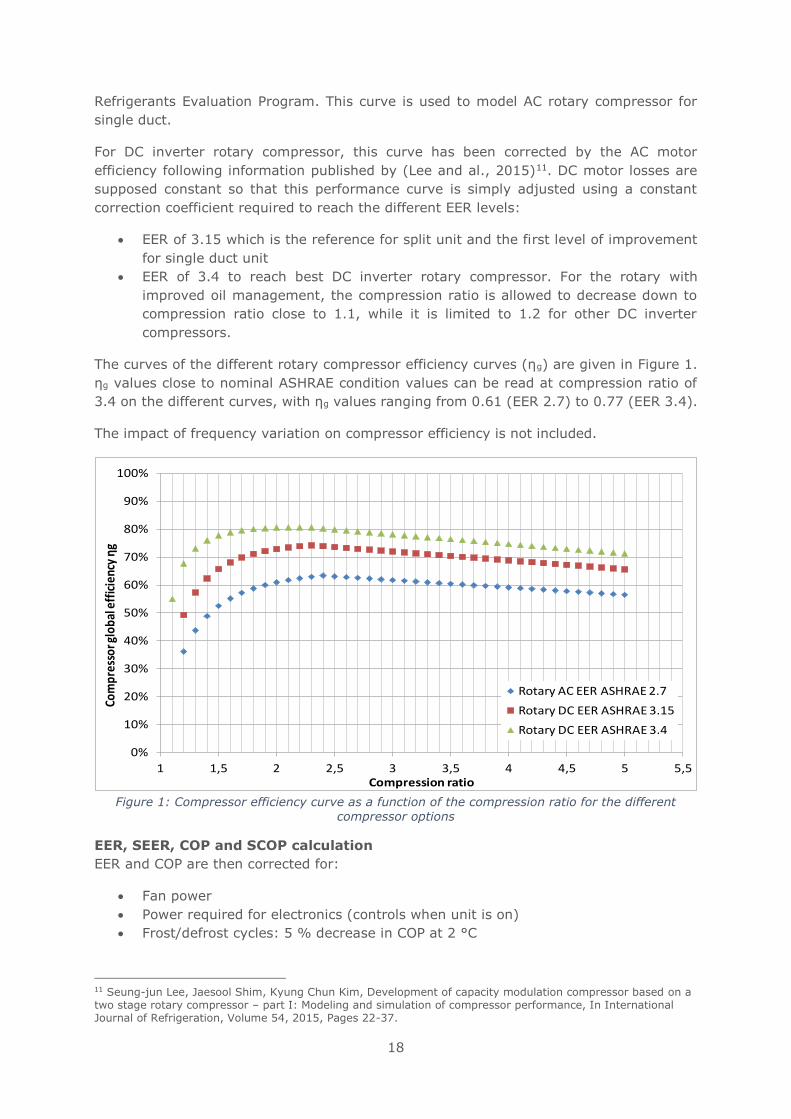
18
Refrigerants Evaluation Program. This curve is used to model AC rotary compressor for
single duct.
For DC inverter rotary compressor, this curve has been corrected by the AC motor
efficiency following information published by (Lee and al., 2015)11. DC motor losses are
supposed constant so that this performance curve is simply adjusted using a constant
correction coefficient required to reach the different EER levels:
• EER of 3.15 which is the reference for split unit and the first level of improvement
for single duct unit
• EER of 3.4 to reach best DC inverter rotary compressor. For the rotary with
improved oil management, the compression ratio is allowed to decrease down to
compression ratio close to 1.1, while it is limited to 1.2 for other DC inverter
compressors.
The curves of the different rotary compressor efficiency curves (ηg) are given in Figure 1.
ηg values close to nominal ASHRAE condition values can be read at compression ratio of
3.4 on the different curves, with ηg values ranging from 0.61 (EER 2.7) to 0.77 (EER 3.4).
The impact of frequency variation on compressor efficiency is not included.
Figure 1: Compressor efficiency curve as a function of the compression ratio for the different
compressor options
EER, SEER, COP and SCOP calculation
EER and COP are then corrected for:
• Fan power
• Power required for electronics (controls when unit is on)
• Frost/defrost cycles: 5 % decrease in COP at 2 °C
11 Seung-jun Lee, Jaesool Shim, Kyung Chun Kim, Development of capacity modulation compressor based on a two stage rotary compressor – part I: Modeling and simulation of compressor performance, In International Journal of Refrigeration, Volume 54, 2015, Pages 22-37.
0%
10%
20%
30%
40%
50%
60%
70%
80%
90%
100%
1 1,5 2 2,5 3 3,5 4 4,5 5 5,5
Com
pres
sor g
loba
l eff
icie
ncy ηg
Compression ratio
Rotary AC EER ASHRAE 2.7
Rotary DC EER ASHRAE 3.15
Rotary DC EER ASHRAE 3.4
19
Thermostat-off, crankcase and standby power are input to the calculation.
SEER (and respectively SCOP) then follows Regulation (EU) N° 206/2012 and standard
EN14825:2016.
Base case identification
There are a large number of parameters to be adjusted in the model despite the model
being extremely simplified. Identification is made possible thanks to detailed
characteristics of products close to the base cases and BAT levels supplied by
manufacturers12. Main parameters for the base cases used in the model are given in Table
4 and Error! Reference source not found., for the 3 base cases.
For split units, in cooling mode, Pdesignc is the refrigerating capacity at 100 % load. In
heating mode, Pdesignh (manufacturer declaration of maximal heat load at - 10 °C) was
identified in Task 4 when defining the base cases. It was 3.1 kW for the 3.5 kW unit and
5.6 kW for the 7.1 kW units. However, for the 3.5 kW unit for instance, the heating capacity
of 2.7 kW at - 7 °C (88 % load) has been identified to 2.74 with the energy efficiency
model. This small difference led to 3.06 kW at - 10 °C and the Pdesignh value of 3.0 kW
has been adjusted to 3.1 kW due to the restraints of the model. The same rationale applies
for the 7.1 kW unit for which the Pdesignh value used is 5.70.
For single duct unit, the model simulates the base case unit as it is presently tested.
Capacity is 2.6 kW at rated conditions, thus without accounting for infiltrations (impact of
infiltration is discussed in section 6.4.3).
The single duct units base case using R1234yf and R290 were determined by adapting the
base case of R410A. AHRI report regarding the "soft adaptation" (larger compressor,
different circuiting of heat exchanger to limit pressure losses, change of expansion valve)
of a R410A unit to use R1234yf13 was used; if compressor had had the same global
efficiency for R1234yf as for R410A unit, the loss in capacity would have been of 7 % and
the electric consumption 5 % higher. These figures were used to adapt the R410A base
case single duct with the same methodology but to supply the same capacity (i.e.
increasing heat exchanger size to compensate the capacity loss), using a compressor with
the same global efficiency Etag. In total, the efficiency loss at equal capacity is estimated
to about 13 % or EER 2.62 at 27/27 conditions. For propane, the same procedure was
done for a 3 % capacity loss and about 10 % increase in compressor EER of same Etag
leading to an efficiency gain of 6 % or EER 3.16 (versus EER 3 at 27/27 conditions for
R410A base case).
12 Data collection for current and BAT technologies from stakeholders, September 2017 13 http://www.ahrinet.org/App_Content/ahri/files/RESEARCH/AREP_Final_Reports/AHRI%20Low-GWP%20AREP-Rpt-010_with%20addendum.pdf
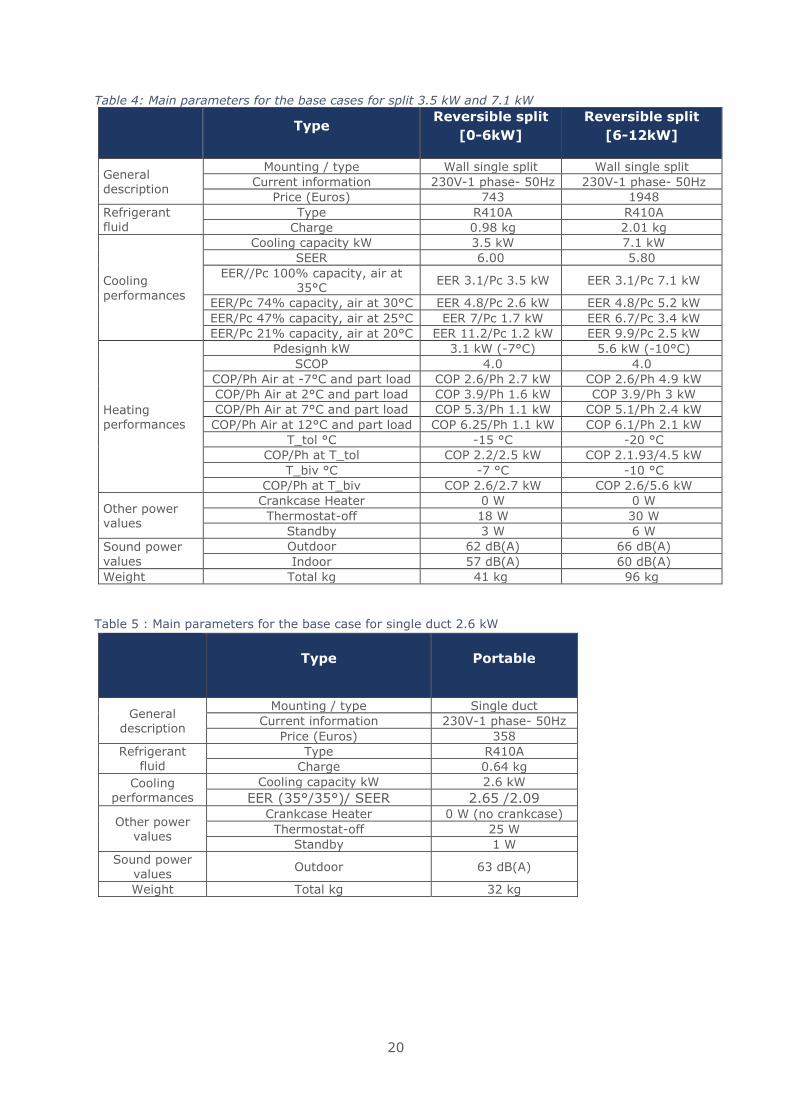
20
Table 4: Main parameters for the base cases for split 3.5 kW and 7.1 kW
Type Reversible split
[0-6kW]
Reversible split
[6-12kW]
General description
Mounting / type Wall single split Wall single split
Current information 230V-1 phase- 50Hz 230V-1 phase- 50Hz
Price (Euros) 743 1948
Refrigerant fluid
Type R410A R410A
Charge 0.98 kg 2.01 kg
Cooling
performances
Cooling capacity kW 3.5 kW 7.1 kW
SEER 6.00 5.80
EER//Pc 100% capacity, air at 35°C
EER 3.1/Pc 3.5 kW EER 3.1/Pc 7.1 kW
EER/Pc 74% capacity, air at 30°C EER 4.8/Pc 2.6 kW EER 4.8/Pc 5.2 kW
EER/Pc 47% capacity, air at 25°C EER 7/Pc 1.7 kW EER 6.7/Pc 3.4 kW
EER/Pc 21% capacity, air at 20°C EER 11.2/Pc 1.2 kW EER 9.9/Pc 2.5 kW
Heating performances
Pdesignh kW 3.1 kW (-7°C) 5.6 kW (-10°C)
SCOP 4.0 4.0
COP/Ph Air at -7°C and part load COP 2.6/Ph 2.7 kW COP 2.6/Ph 4.9 kW
COP/Ph Air at 2°C and part load COP 3.9/Ph 1.6 kW COP 3.9/Ph 3 kW
COP/Ph Air at 7°C and part load COP 5.3/Ph 1.1 kW COP 5.1/Ph 2.4 kW
COP/Ph Air at 12°C and part load COP 6.25/Ph 1.1 kW COP 6.1/Ph 2.1 kW
T_tol °C -15 °C -20 °C
COP/Ph at T_tol COP 2.2/2.5 kW COP 2.1.93/4.5 kW
T_biv °C -7 °C -10 °C
COP/Ph at T_biv COP 2.6/2.7 kW COP 2.6/5.6 kW
Other power values
Crankcase Heater 0 W 0 W
Thermostat-off 18 W 30 W
Standby 3 W 6 W
Sound power
values
Outdoor 62 dB(A) 66 dB(A)
Indoor 57 dB(A) 60 dB(A)
Weight Total kg 41 kg 96 kg
Table 5 : Main parameters for the base case for single duct 2.6 kW
Type Portable
General description
Mounting / type Single duct
Current information 230V-1 phase- 50Hz
Price (Euros) 358
Refrigerant
fluid
Type R410A
Charge 0.64 kg
Cooling performances
Cooling capacity kW 2.6 kW
EER (35°/35°)/ SEER 2.65 /2.09
Other power values
Crankcase Heater 0 W (no crankcase)
Thermostat-off 25 W
Standby 1 W
Sound power values
Outdoor 63 dB(A)
Weight Total kg 32 kg
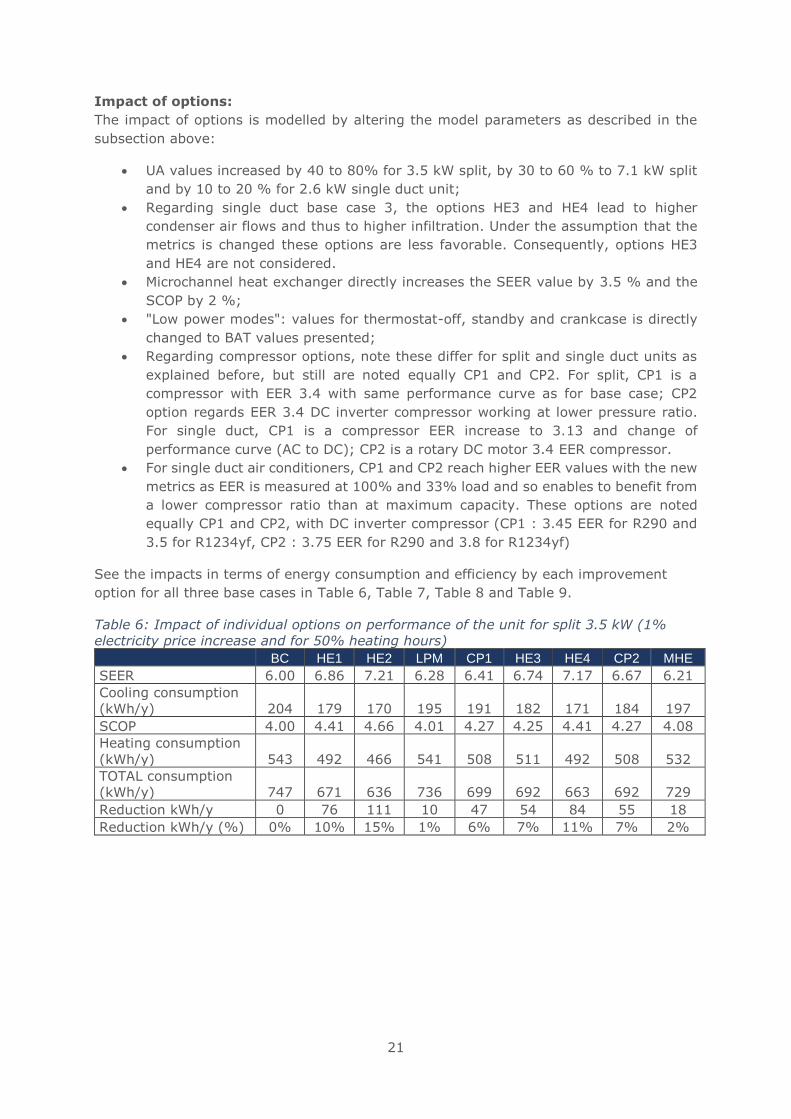
21
Impact of options:
The impact of options is modelled by altering the model parameters as described in the
subsection above:
• UA values increased by 40 to 80% for 3.5 kW split, by 30 to 60 % to 7.1 kW split
and by 10 to 20 % for 2.6 kW single duct unit;
• Regarding single duct base case 3, the options HE3 and HE4 lead to higher
condenser air flows and thus to higher infiltration. Under the assumption that the
metrics is changed these options are less favorable. Consequently, options HE3
and HE4 are not considered.
• Microchannel heat exchanger directly increases the SEER value by 3.5 % and the
SCOP by 2 %;
• "Low power modes": values for thermostat-off, standby and crankcase is directly
changed to BAT values presented;
• Regarding compressor options, note these differ for split and single duct units as
explained before, but still are noted equally CP1 and CP2. For split, CP1 is a
compressor with EER 3.4 with same performance curve as for base case; CP2
option regards EER 3.4 DC inverter compressor working at lower pressure ratio.
For single duct, CP1 is a compressor EER increase to 3.13 and change of
performance curve (AC to DC); CP2 is a rotary DC motor 3.4 EER compressor.
• For single duct air conditioners, CP1 and CP2 reach higher EER values with the new
metrics as EER is measured at 100% and 33% load and so enables to benefit from
a lower compressor ratio than at maximum capacity. These options are noted
equally CP1 and CP2, with DC inverter compressor (CP1 : 3.45 EER for R290 and
3.5 for R1234yf, CP2 : 3.75 EER for R290 and 3.8 for R1234yf)
See the impacts in terms of energy consumption and efficiency by each improvement
option for all three base cases in Table 6, Table 7, Table 8 and Table 9.
Table 6: Impact of individual options on performance of the unit for split 3.5 kW (1%
electricity price increase and for 50% heating hours)
BC HE1 HE2 LPM CP1 HE3 HE4 CP2 MHE
SEER 6.00 6.86 7.21 6.28 6.41 6.74 7.17 6.67 6.21
Cooling consumption
(kWh/y) 204 179 170 195 191 182 171 184 197
SCOP 4.00 4.41 4.66 4.01 4.27 4.25 4.41 4.27 4.08
Heating consumption
(kWh/y) 543 492 466 541 508 511 492 508 532
TOTAL consumption
(kWh/y) 747 671 636 736 699 692 663 692 729
Reduction kWh/y 0 76 111 10 47 54 84 55 18
Reduction kWh/y (%) 0% 10% 15% 1% 6% 7% 11% 7% 2%
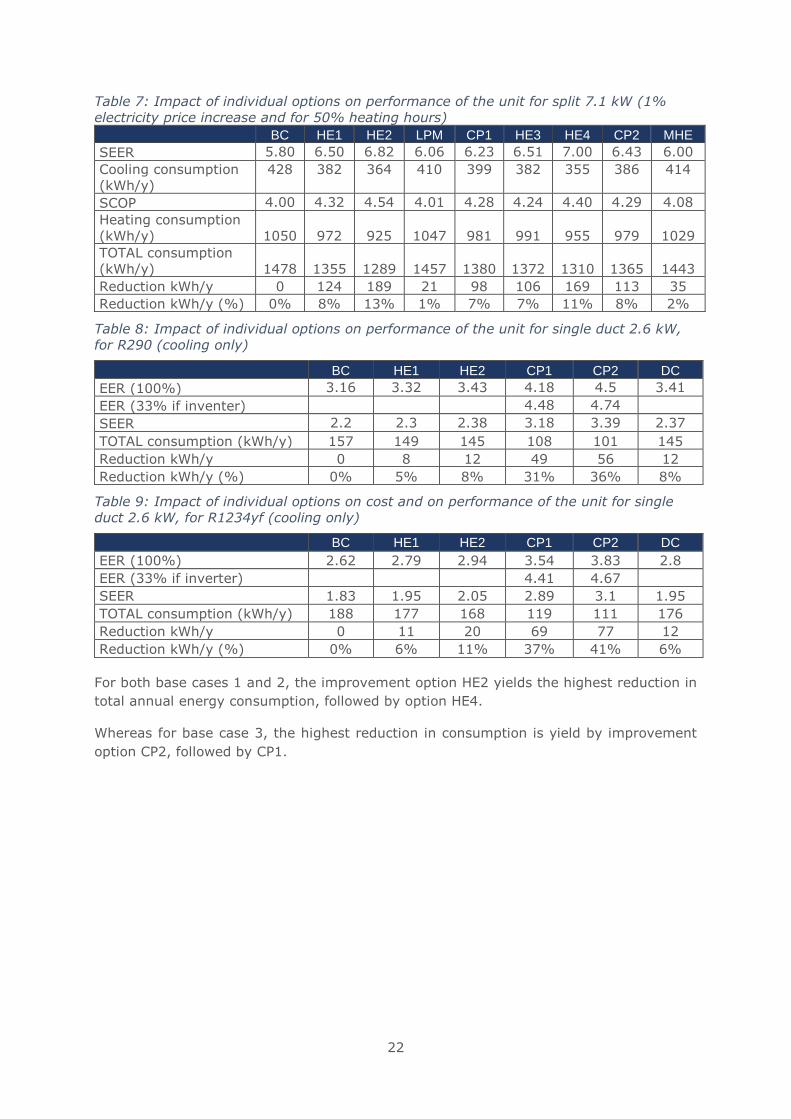
22
Table 7: Impact of individual options on performance of the unit for split 7.1 kW (1%
electricity price increase and for 50% heating hours)
BC HE1 HE2 LPM CP1 HE3 HE4 CP2 MHE
SEER 5.80 6.50 6.82 6.06 6.23 6.51 7.00 6.43 6.00
Cooling consumption
(kWh/y)
428 382 364 410 399 382 355 386 414
SCOP 4.00 4.32 4.54 4.01 4.28 4.24 4.40 4.29 4.08
Heating consumption
(kWh/y) 1050 972 925 1047 981 991 955 979 1029
TOTAL consumption
(kWh/y) 1478 1355 1289 1457 1380 1372 1310 1365 1443
Reduction kWh/y 0 124 189 21 98 106 169 113 35
Reduction kWh/y (%) 0% 8% 13% 1% 7% 7% 11% 8% 2%
Table 8: Impact of individual options on performance of the unit for single duct 2.6 kW,
for R290 (cooling only)
BC HE1 HE2 CP1 CP2 DC
EER (100%) 3.16 3.32 3.43 4.18 4.5 3.41
EER (33% if inventer) 4.48 4.74
SEER 2.2 2.3 2.38 3.18 3.39 2.37
TOTAL consumption (kWh/y) 157 149 145 108 101 145
Reduction kWh/y 0 8 12 49 56 12
Reduction kWh/y (%) 0% 5% 8% 31% 36% 8%
Table 9: Impact of individual options on cost and on performance of the unit for single
duct 2.6 kW, for R1234yf (cooling only)
BC HE1 HE2 CP1 CP2 DC
EER (100%) 2.62 2.79 2.94 3.54 3.83 2.8
EER (33% if inverter) 4.41 4.67
SEER 1.83 1.95 2.05 2.89 3.1 1.95
TOTAL consumption (kWh/y) 188 177 168 119 111 176
Reduction kWh/y 0 11 20 69 77 12
Reduction kWh/y (%) 0% 6% 11% 37% 41% 6%
For both base cases 1 and 2, the improvement option HE2 yields the highest reduction in
total annual energy consumption, followed by option HE4.
Whereas for base case 3, the highest reduction in consumption is yield by improvement
option CP2, followed by CP1.
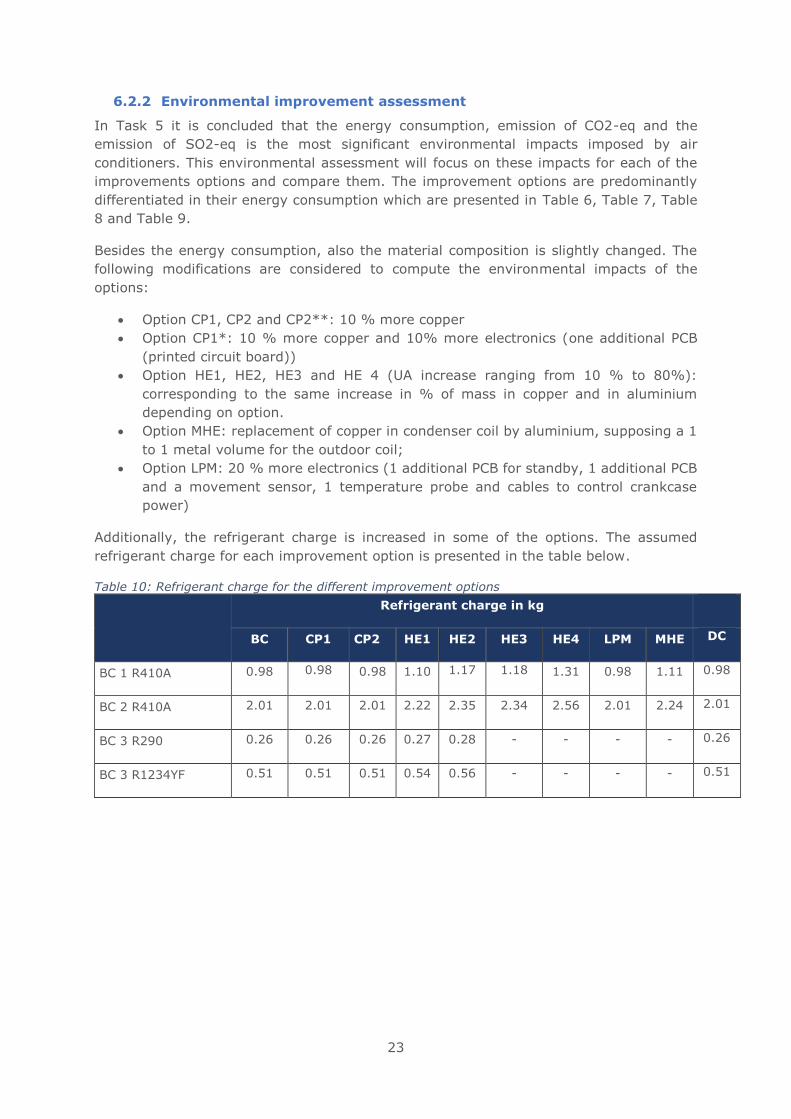
23
6.2.2 Environmental improvement assessment
In Task 5 it is concluded that the energy consumption, emission of CO2-eq and the
emission of SO2-eq is the most significant environmental impacts imposed by air
conditioners. This environmental assessment will focus on these impacts for each of the
improvements options and compare them. The improvement options are predominantly
differentiated in their energy consumption which are presented in Table 6, Table 7, Table
8 and Table 9.
Besides the energy consumption, also the material composition is slightly changed. The
following modifications are considered to compute the environmental impacts of the
options:
• Option CP1, CP2 and CP2**: 10 % more copper
• Option CP1*: 10 % more copper and 10% more electronics (one additional PCB
(printed circuit board))
• Option HE1, HE2, HE3 and HE 4 (UA increase ranging from 10 % to 80%):
corresponding to the same increase in % of mass in copper and in aluminium
depending on option.
• Option MHE: replacement of copper in condenser coil by aluminium, supposing a 1
to 1 metal volume for the outdoor coil;
• Option LPM: 20 % more electronics (1 additional PCB for standby, 1 additional PCB
and a movement sensor, 1 temperature probe and cables to control crankcase
power)
Additionally, the refrigerant charge is increased in some of the options. The assumed
refrigerant charge for each improvement option is presented in the table below.
Table 10: Refrigerant charge for the different improvement options
Refrigerant charge in kg
BC CP1 CP2 HE1 HE2 HE3 HE4 LPM MHE DC
BC 1 R410A 0.98 0.98
0.98 1.10 1.17
1.18
1.31 0.98 1.11 0.98
BC 2 R410A 2.01 2.01 2.01 2.22 2.35 2.34 2.56 2.01 2.24 2.01
BC 3 R290 0.26 0.26 0.26 0.27 0.28 - - - - 0.26
BC 3 R1234YF 0.51 0.51 0.51 0.54 0.56 - - - - 0.51
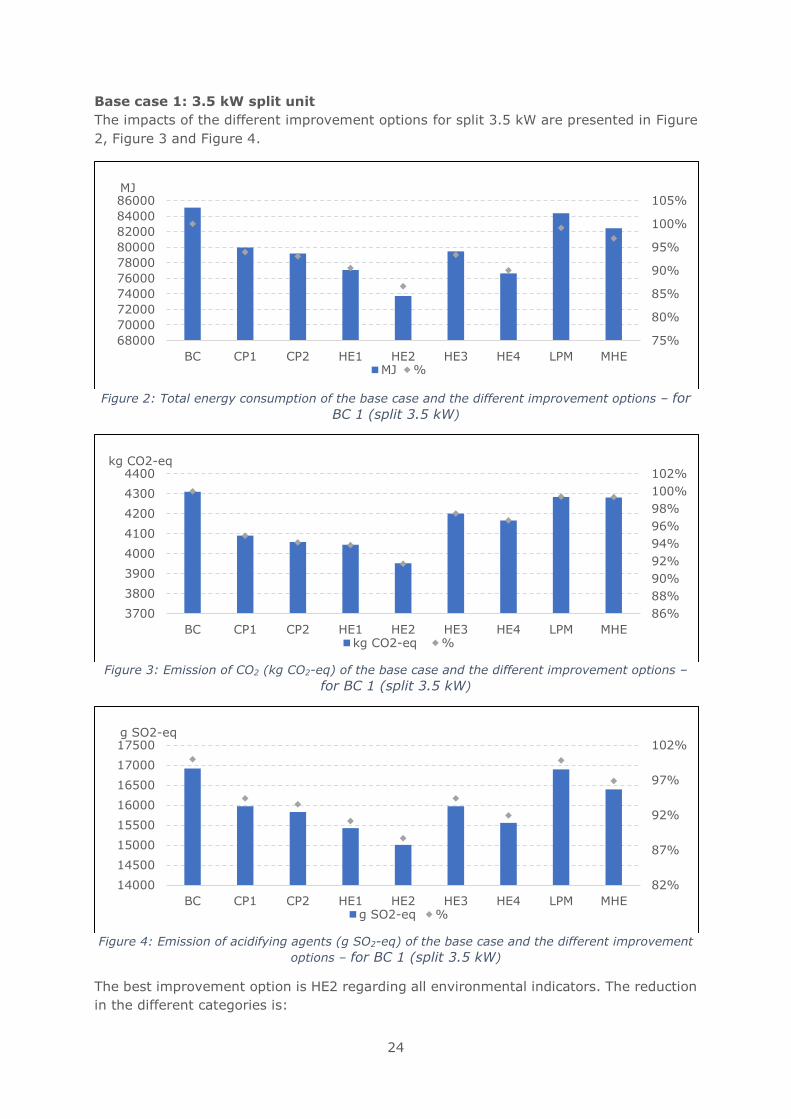
24
Base case 1: 3.5 kW split unit
The impacts of the different improvement options for split 3.5 kW are presented in Figure
2, Figure 3 and Figure 4.
Figure 2: Total energy consumption of the base case and the different improvement options – for
BC 1 (split 3.5 kW)
Figure 3: Emission of CO2 (kg CO2-eq) of the base case and the different improvement options –
for BC 1 (split 3.5 kW)
Figure 4: Emission of acidifying agents (g SO2-eq) of the base case and the different improvement
options – for BC 1 (split 3.5 kW)
The best improvement option is HE2 regarding all environmental indicators. The reduction
in the different categories is:
75%
80%
85%
90%
95%
100%
105%
68000
70000
72000
74000
76000
78000
80000
82000
84000
86000
BC CP1 CP2 HE1 HE2 HE3 HE4 LPM MHE
MJ
MJ %
86%
88%
90%
92%
94%
96%
98%
100%
102%
3700
3800
3900
4000
4100
4200
4300
4400
BC CP1 CP2 HE1 HE2 HE3 HE4 LPM MHE
kg CO2-eq
kg CO2-eq %
82%
87%
92%
97%
102%
14000
14500
15000
15500
16000
16500
17000
17500
BC CP1 CP2 HE1 HE2 HE3 HE4 LPM MHE
g SO2-eq
g SO2-eq %
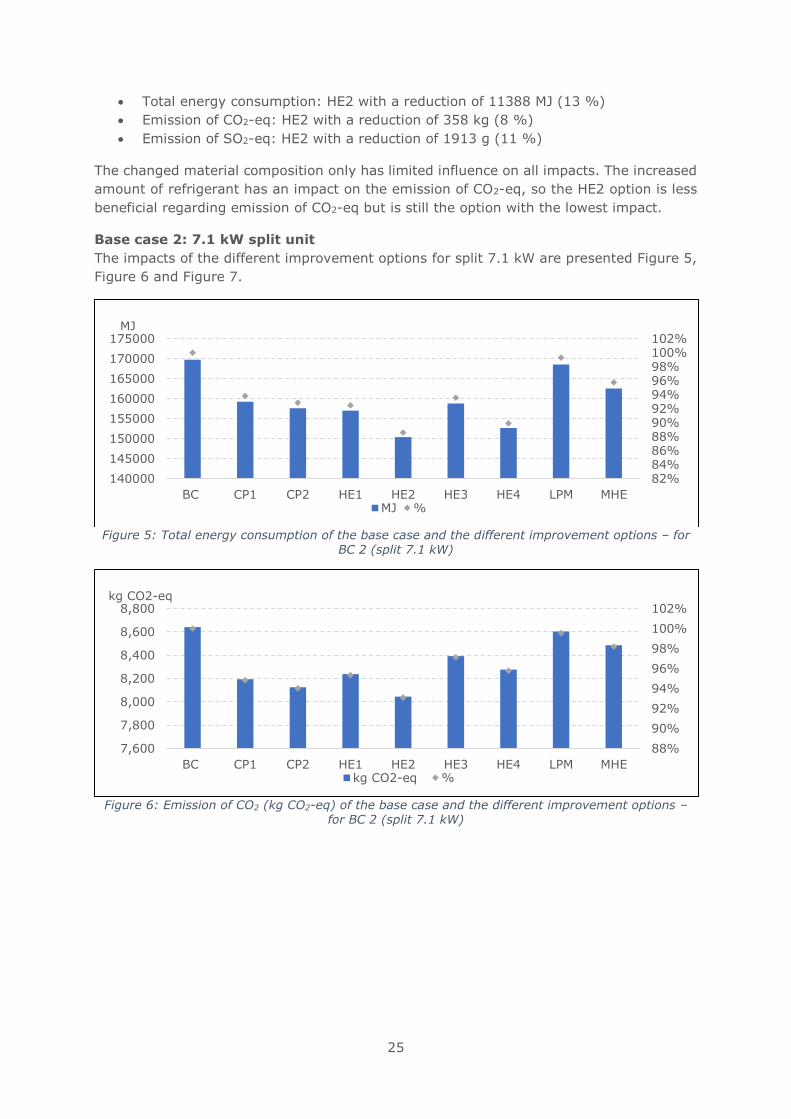
25
• Total energy consumption: HE2 with a reduction of 11388 MJ (13 %)
• Emission of CO2-eq: HE2 with a reduction of 358 kg (8 %)
• Emission of SO2-eq: HE2 with a reduction of 1913 g (11 %)
The changed material composition only has limited influence on all impacts. The increased
amount of refrigerant has an impact on the emission of CO2-eq, so the HE2 option is less
beneficial regarding emission of CO2-eq but is still the option with the lowest impact.
Base case 2: 7.1 kW split unit
The impacts of the different improvement options for split 7.1 kW are presented Figure 5,
Figure 6 and Figure 7.
Figure 5: Total energy consumption of the base case and the different improvement options – for
BC 2 (split 7.1 kW)
Figure 6: Emission of CO2 (kg CO2-eq) of the base case and the different improvement options –
for BC 2 (split 7.1 kW)
82%84%86%88%90%92%94%96%98%100%102%
140000
145000
150000
155000
160000
165000
170000
175000
BC CP1 CP2 HE1 HE2 HE3 HE4 LPM MHE
MJ
MJ %
88%
90%
92%
94%
96%
98%
100%
102%
7,600
7,800
8,000
8,200
8,400
8,600
8,800
BC CP1 CP2 HE1 HE2 HE3 HE4 LPM MHE
kg CO2-eq
kg CO2-eq %
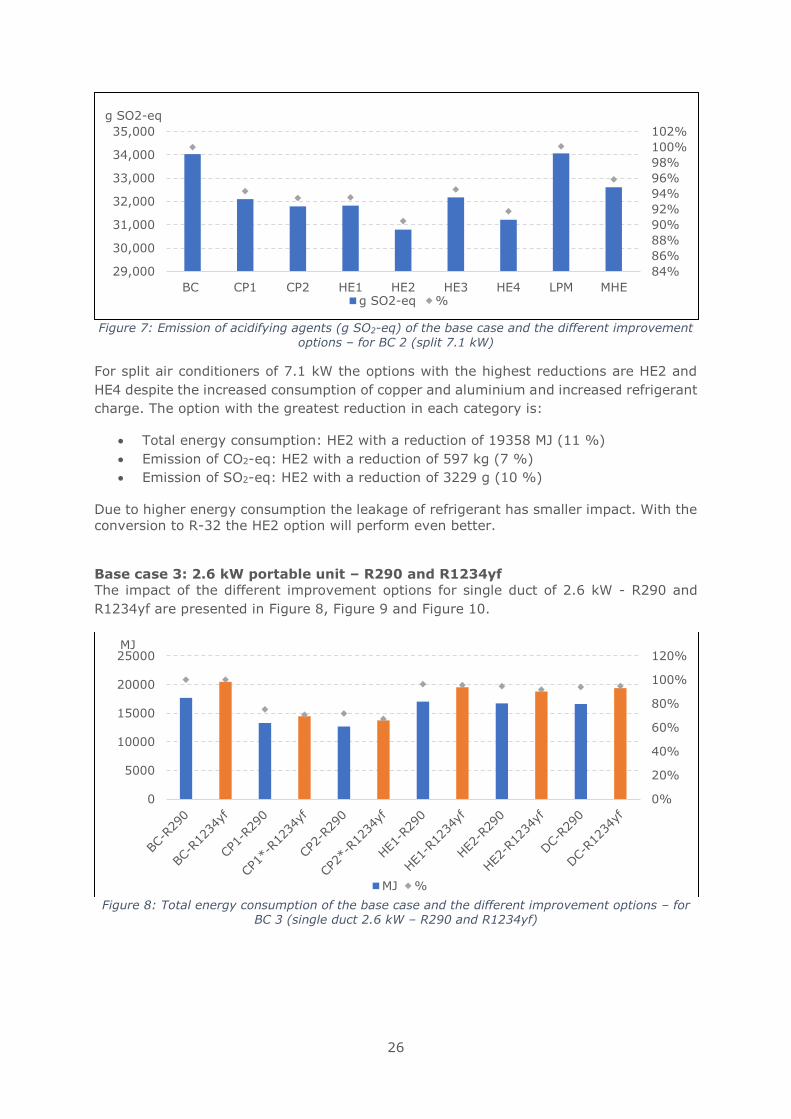
26
Figure 7: Emission of acidifying agents (g SO2-eq) of the base case and the different improvement
options – for BC 2 (split 7.1 kW)
For split air conditioners of 7.1 kW the options with the highest reductions are HE2 and
HE4 despite the increased consumption of copper and aluminium and increased refrigerant
charge. The option with the greatest reduction in each category is:
• Total energy consumption: HE2 with a reduction of 19358 MJ (11 %)
• Emission of CO2-eq: HE2 with a reduction of 597 kg (7 %)
• Emission of SO2-eq: HE2 with a reduction of 3229 g (10 %)
Due to higher energy consumption the leakage of refrigerant has smaller impact. With the
conversion to R-32 the HE2 option will perform even better.
Base case 3: 2.6 kW portable unit – R290 and R1234yf
The impact of the different improvement options for single duct of 2.6 kW - R290 and
R1234yf are presented in Figure 8, Figure 9 and Figure 10.
Figure 8: Total energy consumption of the base case and the different improvement options – for
BC 3 (single duct 2.6 kW – R290 and R1234yf)
84%
86%
88%
90%
92%
94%
96%
98%
100%
102%
29,000
30,000
31,000
32,000
33,000
34,000
35,000
BC CP1 CP2 HE1 HE2 HE3 HE4 LPM MHE
g SO2-eq
g SO2-eq %
0%
20%
40%
60%
80%
100%
120%
0
5000
10000
15000
20000
25000MJ
MJ %
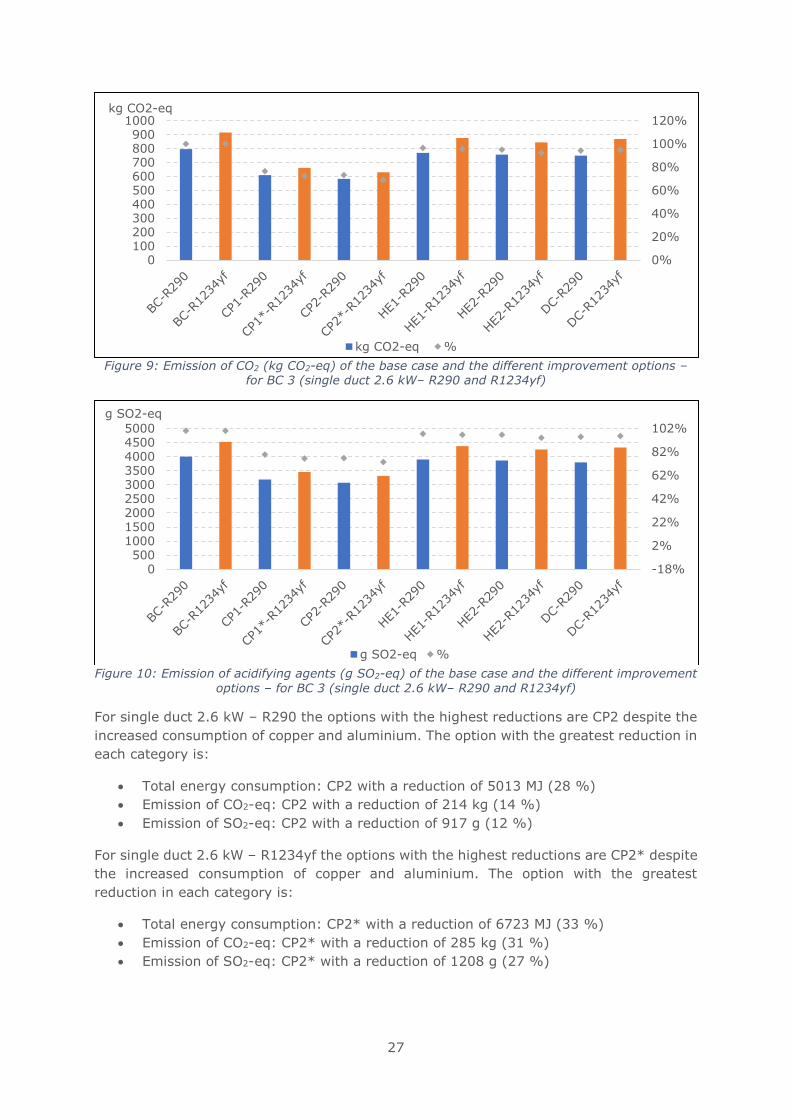
27
Figure 9: Emission of CO2 (kg CO2-eq) of the base case and the different improvement options –
for BC 3 (single duct 2.6 kW– R290 and R1234yf)
Figure 10: Emission of acidifying agents (g SO2-eq) of the base case and the different improvement
options – for BC 3 (single duct 2.6 kW– R290 and R1234yf)
For single duct 2.6 kW – R290 the options with the highest reductions are CP2 despite the
increased consumption of copper and aluminium. The option with the greatest reduction in
each category is:
• Total energy consumption: CP2 with a reduction of 5013 MJ (28 %)
• Emission of CO2-eq: CP2 with a reduction of 214 kg (14 %)
• Emission of SO2-eq: CP2 with a reduction of 917 g (12 %)
For single duct 2.6 kW – R1234yf the options with the highest reductions are CP2* despite
the increased consumption of copper and aluminium. The option with the greatest
reduction in each category is:
• Total energy consumption: CP2* with a reduction of 6723 MJ (33 %)
• Emission of CO2-eq: CP2* with a reduction of 285 kg (31 %)
• Emission of SO2-eq: CP2* with a reduction of 1208 g (27 %)
0%
20%
40%
60%
80%
100%
120%
0100200300400500600700800900
1000kg CO2-eq
kg CO2-eq %
-18%
2%
22%
42%
62%
82%
102%
0500
100015002000250030003500400045005000
g SO2-eq
g SO2-eq %
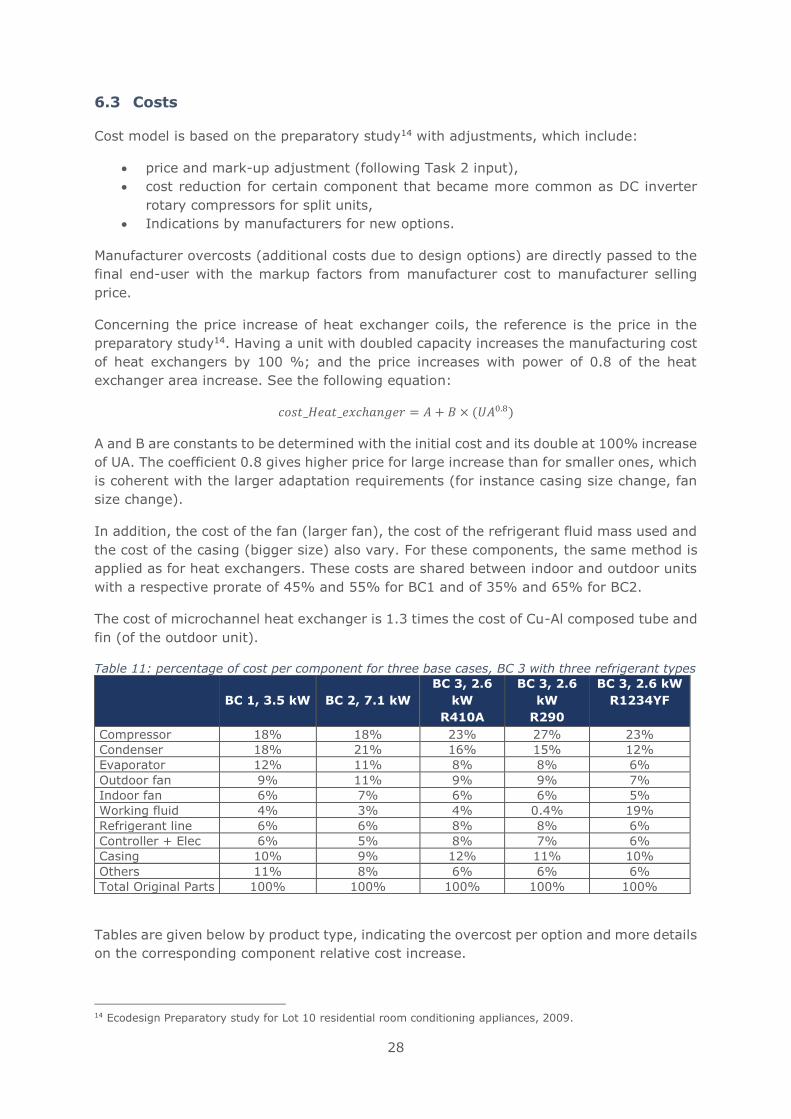
28
6.3 Costs
Cost model is based on the preparatory study14 with adjustments, which include:
• price and mark-up adjustment (following Task 2 input),
• cost reduction for certain component that became more common as DC inverter
rotary compressors for split units,
• Indications by manufacturers for new options.
Manufacturer overcosts (additional costs due to design options) are directly passed to the
final end-user with the markup factors from manufacturer cost to manufacturer selling
price.
Concerning the price increase of heat exchanger coils, the reference is the price in the
preparatory study14. Having a unit with doubled capacity increases the manufacturing cost
of heat exchangers by 100 %; and the price increases with power of 0.8 of the heat
exchanger area increase. See the following equation:
𝑐𝑜𝑠𝑡_𝐻𝑒𝑎𝑡_𝑒𝑥𝑐ℎ𝑎𝑛𝑔𝑒𝑟 = 𝐴 + 𝐵 × (𝑈𝐴0.8)
A and B are constants to be determined with the initial cost and its double at 100% increase
of UA. The coefficient 0.8 gives higher price for large increase than for smaller ones, which
is coherent with the larger adaptation requirements (for instance casing size change, fan
size change).
In addition, the cost of the fan (larger fan), the cost of the refrigerant fluid mass used and
the cost of the casing (bigger size) also vary. For these components, the same method is
applied as for heat exchangers. These costs are shared between indoor and outdoor units
with a respective prorate of 45% and 55% for BC1 and of 35% and 65% for BC2.
The cost of microchannel heat exchanger is 1.3 times the cost of Cu-Al composed tube and
fin (of the outdoor unit).
Table 11: percentage of cost per component for three base cases, BC 3 with three refrigerant types
BC 1, 3.5 kW BC 2, 7.1 kW
BC 3, 2.6
kW
R410A
BC 3, 2.6
kW
R290
BC 3, 2.6 kW
R1234YF
Compressor 18% 18% 23% 27% 23%
Condenser 18% 21% 16% 15% 12%
Evaporator 12% 11% 8% 8% 6%
Outdoor fan 9% 11% 9% 9% 7%
Indoor fan 6% 7% 6% 6% 5%
Working fluid 4% 3% 4% 0.4% 19%
Refrigerant line 6% 6% 8% 8% 6%
Controller + Elec 6% 5% 8% 7% 6%
Casing 10% 9% 12% 11% 10%
Others 11% 8% 6% 6% 6%
Total Original Parts 100% 100% 100% 100% 100%
Tables are given below by product type, indicating the overcost per option and more details
on the corresponding component relative cost increase.
14 Ecodesign Preparatory study for Lot 10 residential room conditioning appliances, 2009.
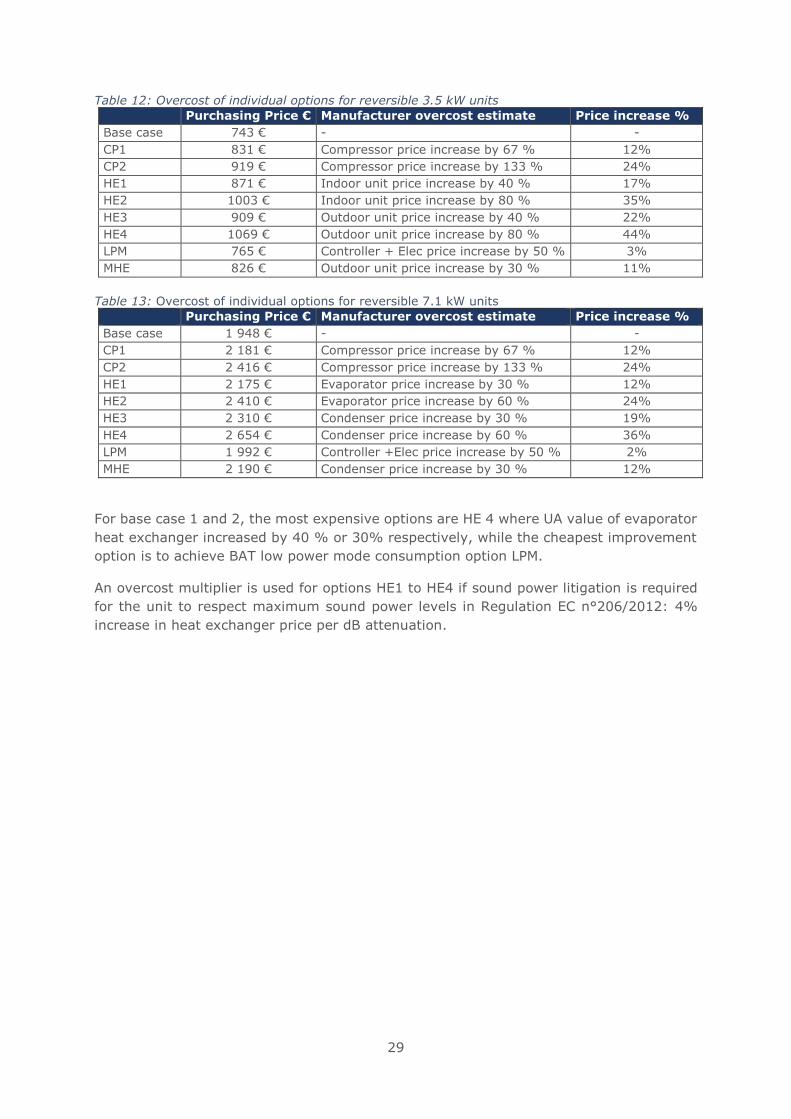
29
Table 12: Overcost of individual options for reversible 3.5 kW units
Purchasing Price € Manufacturer overcost estimate Price increase %
Base case 743 € - -
CP1 831 € Compressor price increase by 67 % 12%
CP2 919 € Compressor price increase by 133 % 24%
HE1 871 € Indoor unit price increase by 40 % 17%
HE2 1003 € Indoor unit price increase by 80 % 35%
HE3 909 € Outdoor unit price increase by 40 % 22%
HE4 1069 € Outdoor unit price increase by 80 % 44%
LPM 765 € Controller + Elec price increase by 50 % 3%
MHE 826 € Outdoor unit price increase by 30 % 11%
Table 13: Overcost of individual options for reversible 7.1 kW units
Purchasing Price € Manufacturer overcost estimate Price increase %
Base case 1 948 € - -
CP1 2 181 € Compressor price increase by 67 % 12%
CP2 2 416 € Compressor price increase by 133 % 24%
HE1 2 175 € Evaporator price increase by 30 % 12%
HE2 2 410 € Evaporator price increase by 60 % 24%
HE3 2 310 € Condenser price increase by 30 % 19%
HE4 2 654 € Condenser price increase by 60 % 36%
LPM 1 992 € Controller +Elec price increase by 50 % 2%
MHE 2 190 € Condenser price increase by 30 % 12%
For base case 1 and 2, the most expensive options are HE 4 where UA value of evaporator
heat exchanger increased by 40 % or 30% respectively, while the cheapest improvement
option is to achieve BAT low power mode consumption option LPM.
An overcost multiplier is used for options HE1 to HE4 if sound power litigation is required
for the unit to respect maximum sound power levels in Regulation EC n°206/2012: 4%
increase in heat exchanger price per dB attenuation.
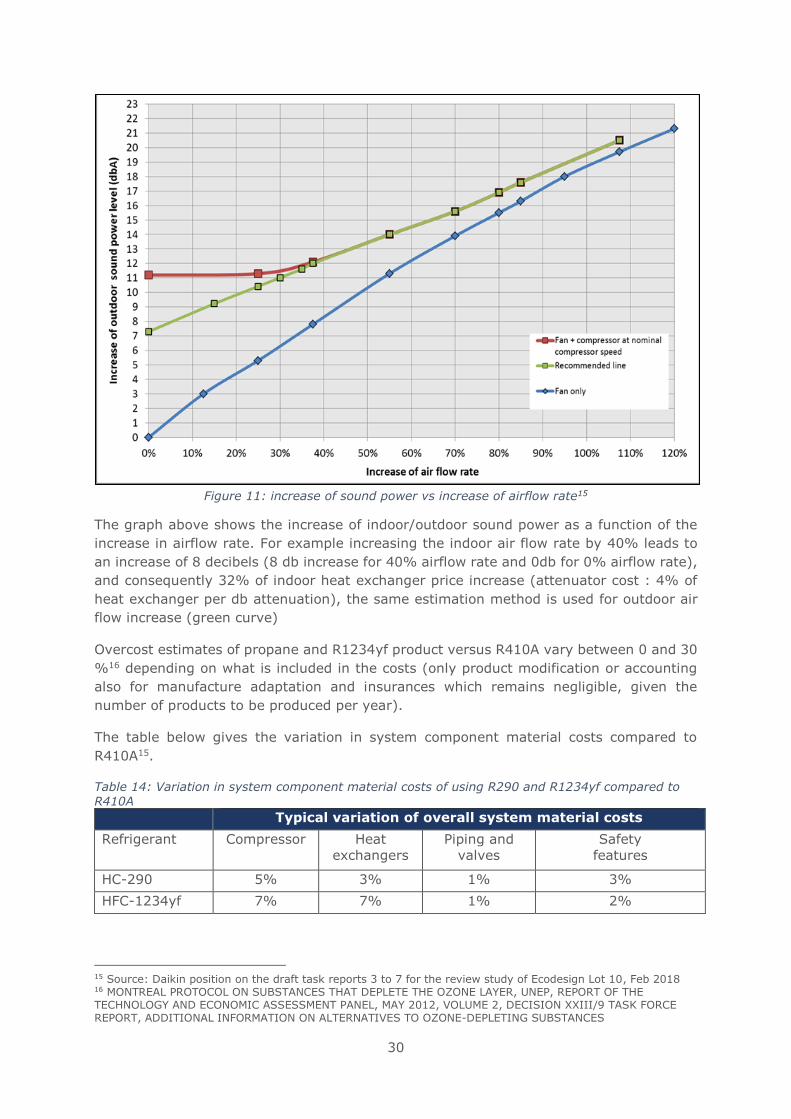
30
Figure 11: increase of sound power vs increase of airflow rate15
The graph above shows the increase of indoor/outdoor sound power as a function of the
increase in airflow rate. For example increasing the indoor air flow rate by 40% leads to
an increase of 8 decibels (8 db increase for 40% airflow rate and 0db for 0% airflow rate),
and consequently 32% of indoor heat exchanger price increase (attenuator cost : 4% of
heat exchanger per db attenuation), the same estimation method is used for outdoor air
flow increase (green curve)
Overcost estimates of propane and R1234yf product versus R410A vary between 0 and 30
%16 depending on what is included in the costs (only product modification or accounting
also for manufacture adaptation and insurances which remains negligible, given the
number of products to be produced per year).
The table below gives the variation in system component material costs compared to
R410A15.
Table 14: Variation in system component material costs of using R290 and R1234yf compared to R410A
Typical variation of overall system material costs
Refrigerant Compressor Heat
exchangers
Piping and
valves
Safety
features
HC-290 5% 3% 1% 3%
HFC-1234yf 7% 7% 1% 2%
15 Source: Daikin position on the draft task reports 3 to 7 for the review study of Ecodesign Lot 10, Feb 2018 16 MONTREAL PROTOCOL ON SUBSTANCES THAT DEPLETE THE OZONE LAYER, UNEP, REPORT OF THE TECHNOLOGY AND ECONOMIC ASSESSMENT PANEL, MAY 2012, VOLUME 2, DECISION XXIII/9 TASK FORCE REPORT, ADDITIONAL INFORMATION ON ALTERNATIVES TO OZONE-DEPLETING SUBSTANCES
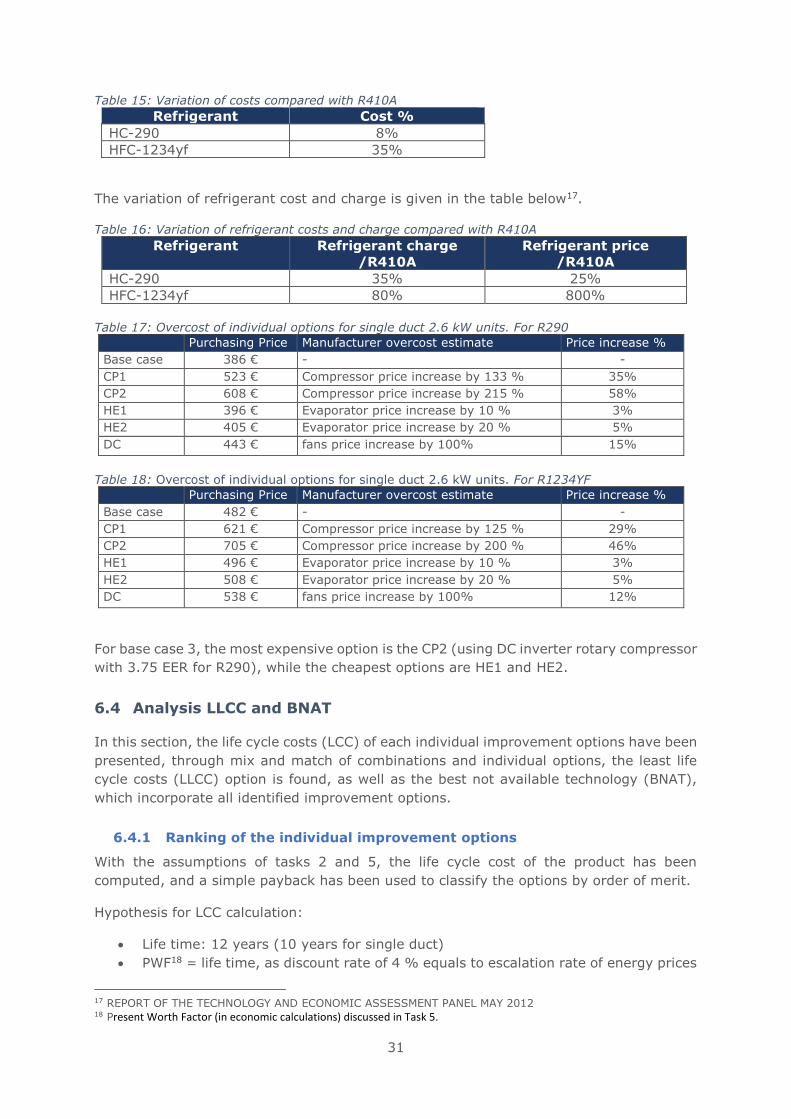
31
Table 15: Variation of costs compared with R410A
Refrigerant Cost %
HC-290 8%
HFC-1234yf 35%
The variation of refrigerant cost and charge is given in the table below17.
Table 16: Variation of refrigerant costs and charge compared with R410A
Refrigerant Refrigerant charge
/R410A Refrigerant price
/R410A
HC-290 35% 25%
HFC-1234yf 80% 800%
Table 17: Overcost of individual options for single duct 2.6 kW units. For R290
Purchasing Price
€
Manufacturer overcost estimate Price increase %
Base case 386 € - -
CP1 523 € Compressor price increase by 133 % 35%
CP2 608 € Compressor price increase by 215 % 58%
HE1 396 € Evaporator price increase by 10 % 3%
HE2 405 € Evaporator price increase by 20 % 5%
DC 443 € fans price increase by 100% 15%
Table 18: Overcost of individual options for single duct 2.6 kW units. For R1234YF
Purchasing Price
€
Manufacturer overcost estimate Price increase %
Base case 482 € - -
CP1 621 € Compressor price increase by 125 % 29%
CP2 705 € Compressor price increase by 200 % 46%
HE1 496 € Evaporator price increase by 10 % 3%
HE2 508 € Evaporator price increase by 20 % 5%
DC 538 € fans price increase by 100% 12%
For base case 3, the most expensive option is the CP2 (using DC inverter rotary compressor
with 3.75 EER for R290), while the cheapest options are HE1 and HE2.
6.4 Analysis LLCC and BNAT
In this section, the life cycle costs (LCC) of each individual improvement options have been
presented, through mix and match of combinations and individual options, the least life
cycle costs (LLCC) option is found, as well as the best not available technology (BNAT),
which incorporate all identified improvement options.
6.4.1 Ranking of the individual improvement options
With the assumptions of tasks 2 and 5, the life cycle cost of the product has been
computed, and a simple payback has been used to classify the options by order of merit.
Hypothesis for LCC calculation:
• Life time: 12 years (10 years for single duct)
• PWF18 = life time, as discount rate of 4 % equals to escalation rate of energy prices
17 REPORT OF THE TECHNOLOGY AND ECONOMIC ASSESSMENT PANEL MAY 2012 18 Present Worth Factor (in economic calculations) discussed in Task 5.
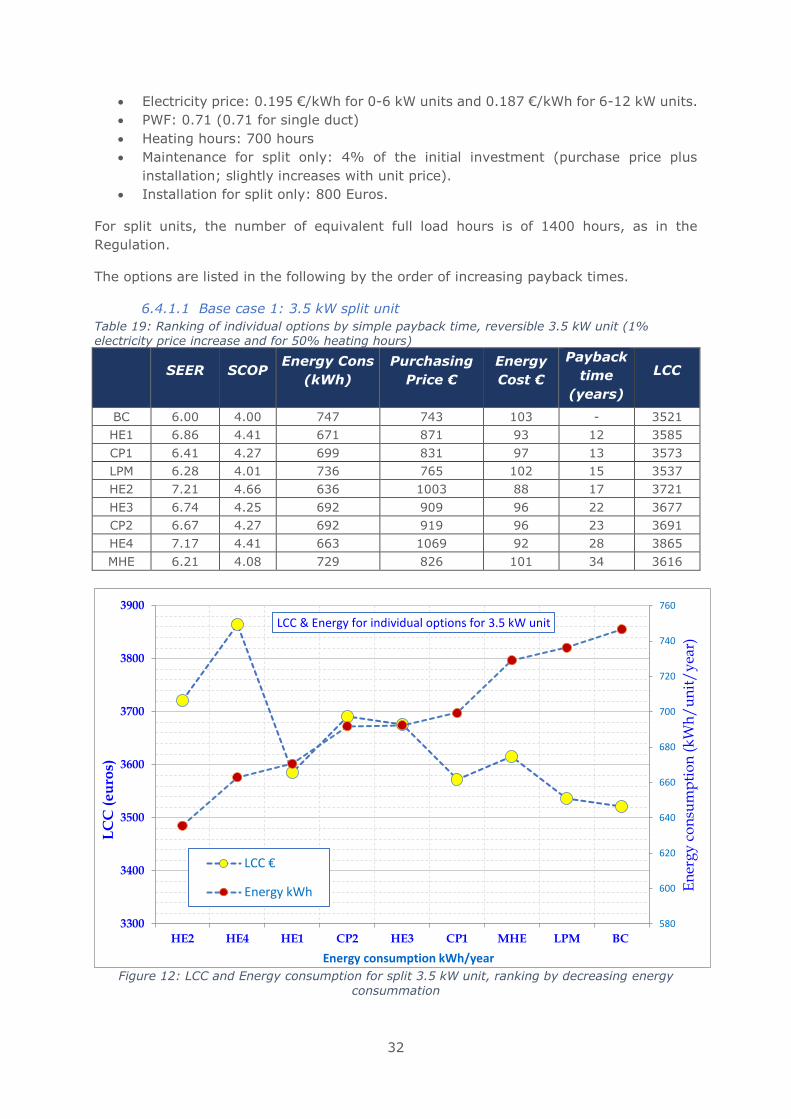
32
• Electricity price: 0.195 €/kWh for 0-6 kW units and 0.187 €/kWh for 6-12 kW units.
• PWF: 0.71 (0.71 for single duct)
• Heating hours: 700 hours
• Maintenance for split only: 4% of the initial investment (purchase price plus
installation; slightly increases with unit price).
• Installation for split only: 800 Euros.
For split units, the number of equivalent full load hours is of 1400 hours, as in the
Regulation.
The options are listed in the following by the order of increasing payback times.
6.4.1.1 Base case 1: 3.5 kW split unit
Table 19: Ranking of individual options by simple payback time, reversible 3.5 kW unit (1% electricity price increase and for 50% heating hours)
SEER SCOP Energy Cons
(kWh)
Purchasing
Price €
Energy
Cost €
Payback
time
(years)
LCC
BC 6.00 4.00 747 743 103 - 3521
HE1 6.86 4.41 671 871 93 12 3585
CP1 6.41 4.27 699 831 97 13 3573
LPM 6.28 4.01 736 765 102 15 3537
HE2 7.21 4.66 636 1003 88 17 3721
HE3 6.74 4.25 692 909 96 22 3677
CP2 6.67 4.27 692 919 96 23 3691
HE4 7.17 4.41 663 1069 92 28 3865
MHE 6.21 4.08 729 826 101 34 3616
Figure 12: LCC and Energy consumption for split 3.5 kW unit, ranking by decreasing energy
consummation
580
600
620
640
660
680
700
720
740
760
3300
3400
3500
3600
3700
3800
3900
HE2 HE4 HE1 CP2 HE3 CP1 MHE LPM BC
En
erg
y c
on
sum
pti
on
(k
Wh
/u
nit
/y
ear)
LC
C (
eu
ros)
Energy consumption kWh/year
LCC & Energy for individual options for 3.5 kW unit
LCC €
Energy kWh
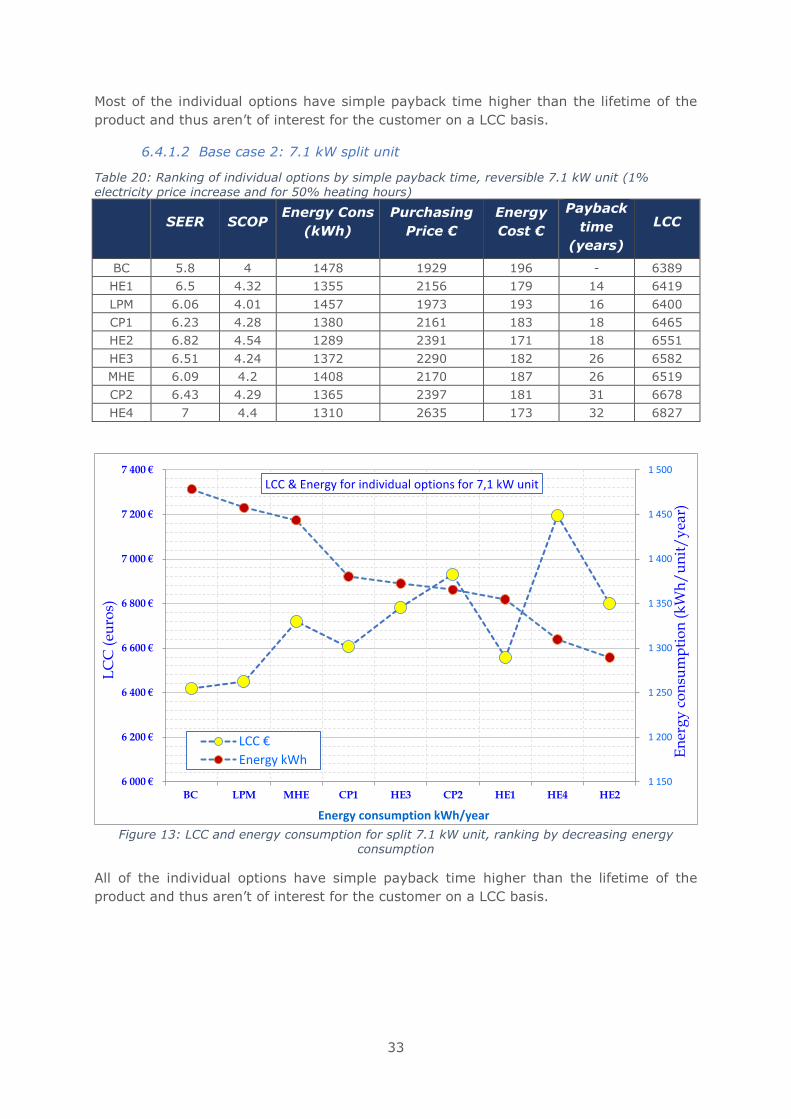
33
Most of the individual options have simple payback time higher than the lifetime of the
product and thus aren’t of interest for the customer on a LCC basis.
6.4.1.2 Base case 2: 7.1 kW split unit
Table 20: Ranking of individual options by simple payback time, reversible 7.1 kW unit (1% electricity price increase and for 50% heating hours)
SEER SCOP Energy Cons
(kWh)
Purchasing
Price €
Energy
Cost €
Payback
time
(years)
LCC
BC 5.8 4 1478 1929 196 - 6389
HE1 6.5 4.32 1355 2156 179 14 6419
LPM 6.06 4.01 1457 1973 193 16 6400
CP1 6.23 4.28 1380 2161 183 18 6465
HE2 6.82 4.54 1289 2391 171 18 6551
HE3 6.51 4.24 1372 2290 182 26 6582
MHE 6.09 4.2 1408 2170 187 26 6519
CP2 6.43 4.29 1365 2397 181 31 6678
HE4 7 4.4 1310 2635 173 32 6827
Figure 13: LCC and energy consumption for split 7.1 kW unit, ranking by decreasing energy
consumption
All of the individual options have simple payback time higher than the lifetime of the
product and thus aren’t of interest for the customer on a LCC basis.
1 150
1 200
1 250
1 300
1 350
1 400
1 450
1 500
6 000 €
6 200 €
6 400 €
6 600 €
6 800 €
7 000 €
7 200 €
7 400 €
BC LPM MHE CP1 HE3 CP2 HE1 HE4 HE2
En
erg
y c
on
sum
pti
on
(k
Wh
/u
nit
/y
ear)
LC
C (
euro
s)
Energy consumption kWh/year
LCC & Energy for individual options for 7,1 kW unit
LCC €
Energy kWh
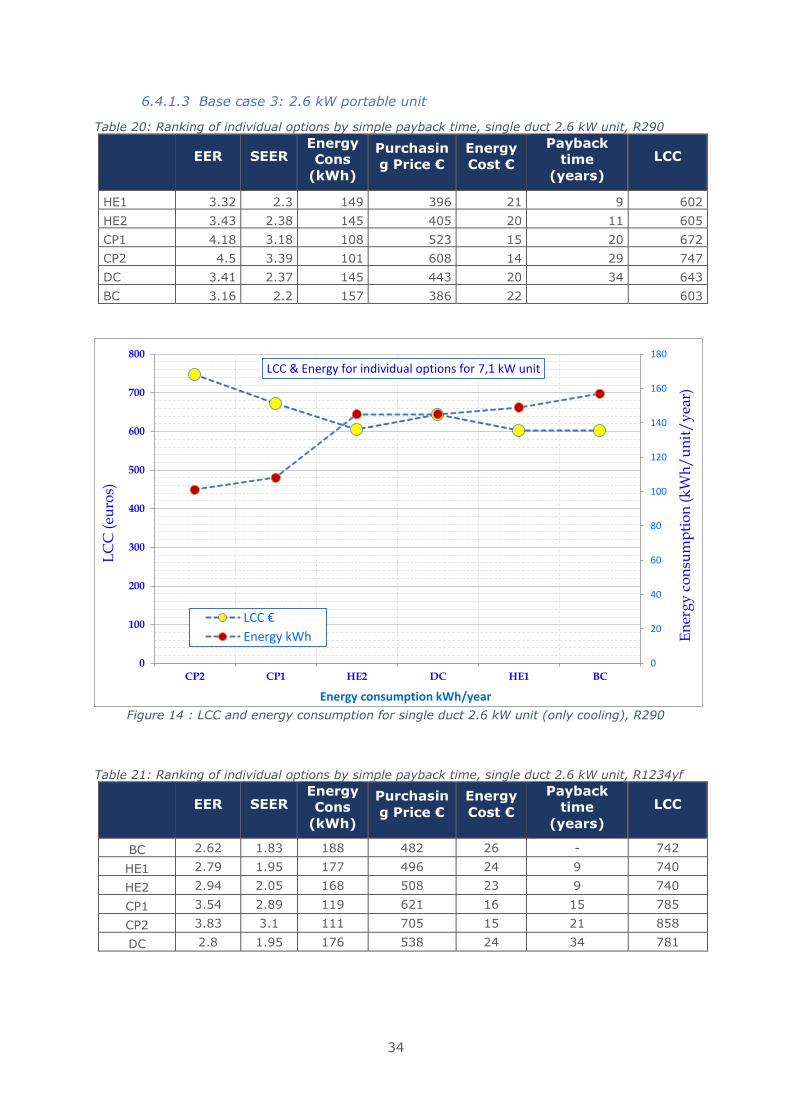
34
6.4.1.3 Base case 3: 2.6 kW portable unit
Table 20: Ranking of individual options by simple payback time, single duct 2.6 kW unit, R290
EER SEER Energy
Cons
(kWh)
Purchasin
g Price €
Energy
Cost €
Payback
time
(years)
LCC
HE1 3.32 2.3 149 396 21 9 602
HE2 3.43 2.38 145 405 20 11 605
CP1 4.18 3.18 108 523 15 20 672
CP2 4.5 3.39 101 608 14 29 747
DC 3.41 2.37 145 443 20 34 643
BC 3.16 2.2 157 386 22 603
Figure 14 : LCC and energy consumption for single duct 2.6 kW unit (only cooling), R290
Table 21: Ranking of individual options by simple payback time, single duct 2.6 kW unit, R1234yf
EER SEER Energy
Cons
(kWh)
Purchasin
g Price €
Energy
Cost €
Payback
time
(years)
LCC
BC 2.62 1.83 188 482 26 - 742
HE1 2.79 1.95 177 496 24 9 740
HE2 2.94 2.05 168 508 23 9 740
CP1 3.54 2.89 119 621 16 15 785
CP2 3.83 3.1 111 705 15 21 858
DC 2.8 1.95 176 538 24 34 781
0
20
40
60
80
100
120
140
160
180
0
100
200
300
400
500
600
700
800
CP2 CP1 HE2 DC HE1 BCE
ner
gy
co
nsu
mp
tio
n (
kW
h/
un
it/
yea
r)
LC
C (
euro
s)
Energy consumption kWh/year
LCC & Energy for individual options for 7,1 kW unit
LCC €
Energy kWh
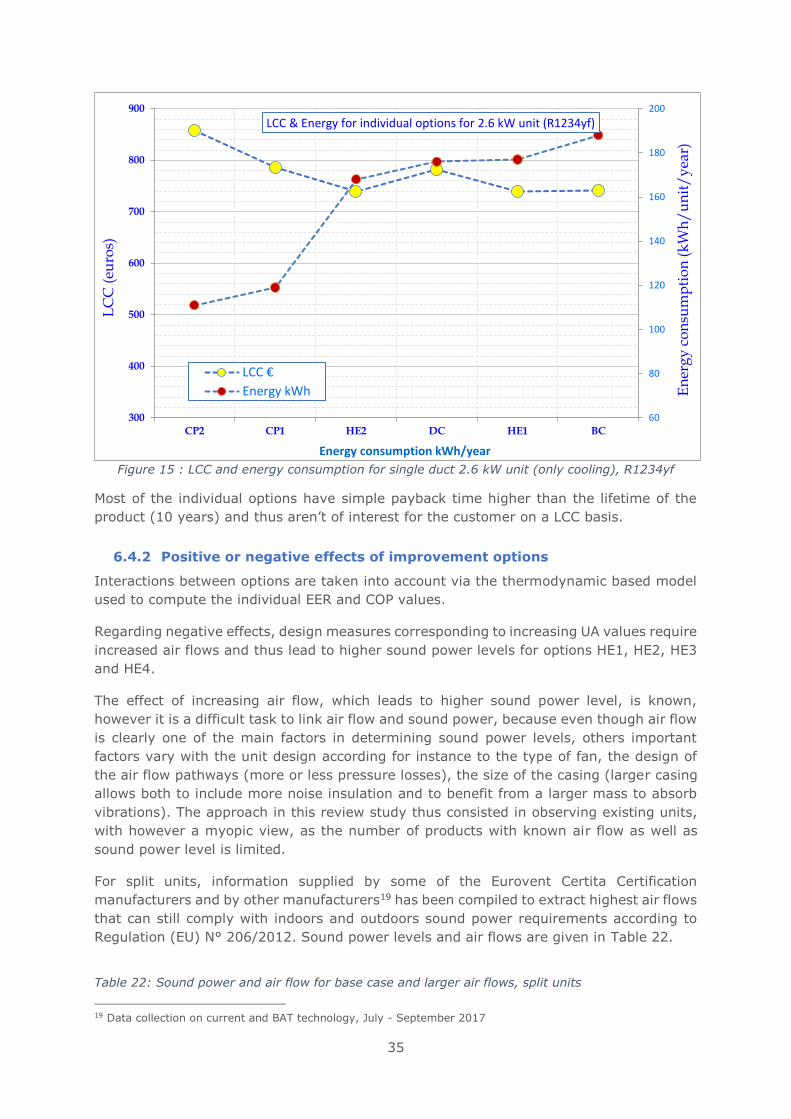
35
Figure 15 : LCC and energy consumption for single duct 2.6 kW unit (only cooling), R1234yf
Most of the individual options have simple payback time higher than the lifetime of the
product (10 years) and thus aren’t of interest for the customer on a LCC basis.
6.4.2 Positive or negative effects of improvement options
Interactions between options are taken into account via the thermodynamic based model
used to compute the individual EER and COP values.
Regarding negative effects, design measures corresponding to increasing UA values require
increased air flows and thus lead to higher sound power levels for options HE1, HE2, HE3
and HE4.
The effect of increasing air flow, which leads to higher sound power level, is known,
however it is a difficult task to link air flow and sound power, because even though air flow
is clearly one of the main factors in determining sound power levels, others important
factors vary with the unit design according for instance to the type of fan, the design of
the air flow pathways (more or less pressure losses), the size of the casing (larger casing
allows both to include more noise insulation and to benefit from a larger mass to absorb
vibrations). The approach in this review study thus consisted in observing existing units,
with however a myopic view, as the number of products with known air flow as well as
sound power level is limited.
For split units, information supplied by some of the Eurovent Certita Certification
manufacturers and by other manufacturers19 has been compiled to extract highest air flows
that can still comply with indoors and outdoors sound power requirements according to
Regulation (EU) N° 206/2012. Sound power levels and air flows are given in Table 22.
Table 22: Sound power and air flow for base case and larger air flows, split units
19 Data collection on current and BAT technology, July - September 2017
60
80
100
120
140
160
180
200
300
400
500
600
700
800
900
CP2 CP1 HE2 DC HE1 BC
En
erg
y c
on
sum
pti
on
(k
Wh
/u
nit
/y
ear)
LC
C (
euro
s)
Energy consumption kWh/year
LCC & Energy for individual options for 2.6 kW unit (R1234yf)
LCC €
Energy kWh
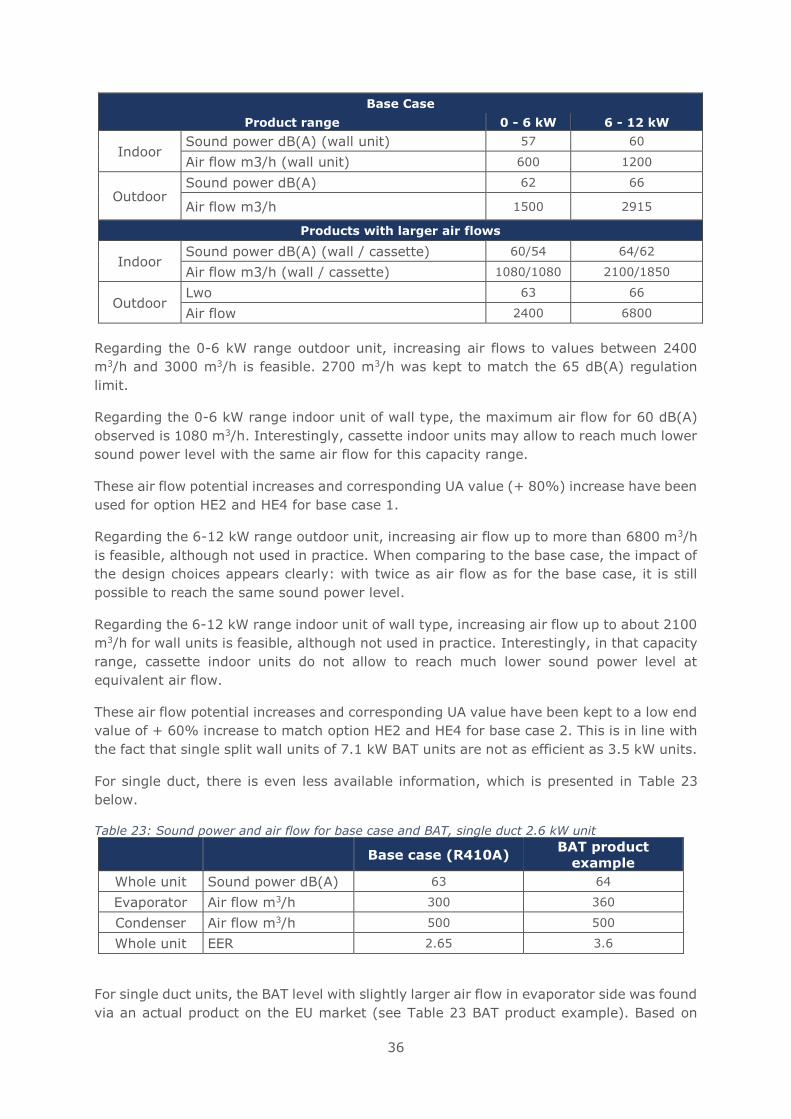
36
Base Case
Product range 0 - 6 kW 6 - 12 kW
Indoor Sound power dB(A) (wall unit) 57 60
Air flow m3/h (wall unit) 600 1200
Outdoor Sound power dB(A) 62 66
Air flow m3/h 1500 2915
Products with larger air flows
Indoor Sound power dB(A) (wall / cassette) 60/54 64/62
Air flow m3/h (wall / cassette) 1080/1080 2100/1850
Outdoor Lwo 63 66
Air flow 2400 6800
Regarding the 0-6 kW range outdoor unit, increasing air flows to values between 2400
m3/h and 3000 m3/h is feasible. 2700 m3/h was kept to match the 65 dB(A) regulation
limit.
Regarding the 0-6 kW range indoor unit of wall type, the maximum air flow for 60 dB(A)
observed is 1080 m3/h. Interestingly, cassette indoor units may allow to reach much lower
sound power level with the same air flow for this capacity range.
These air flow potential increases and corresponding UA value (+ 80%) increase have been
used for option HE2 and HE4 for base case 1.
Regarding the 6-12 kW range outdoor unit, increasing air flow up to more than 6800 m3/h
is feasible, although not used in practice. When comparing to the base case, the impact of
the design choices appears clearly: with twice as air flow as for the base case, it is still
possible to reach the same sound power level.
Regarding the 6-12 kW range indoor unit of wall type, increasing air flow up to about 2100
m3/h for wall units is feasible, although not used in practice. Interestingly, in that capacity
range, cassette indoor units do not allow to reach much lower sound power level at
equivalent air flow.
These air flow potential increases and corresponding UA value have been kept to a low end
value of + 60% increase to match option HE2 and HE4 for base case 2. This is in line with
the fact that single split wall units of 7.1 kW BAT units are not as efficient as 3.5 kW units.
For single duct, there is even less available information, which is presented in Table 23
below.
Table 23: Sound power and air flow for base case and BAT, single duct 2.6 kW unit
Base case (R410A)
BAT product
example
Whole unit Sound power dB(A) 63 64
Evaporator Air flow m3/h 300 360
Condenser Air flow m3/h 500 500
Whole unit EER 2.65 3.6
For single duct units, the BAT level with slightly larger air flow in evaporator side was found
via an actual product on the EU market (see Table 23 BAT product example). Based on
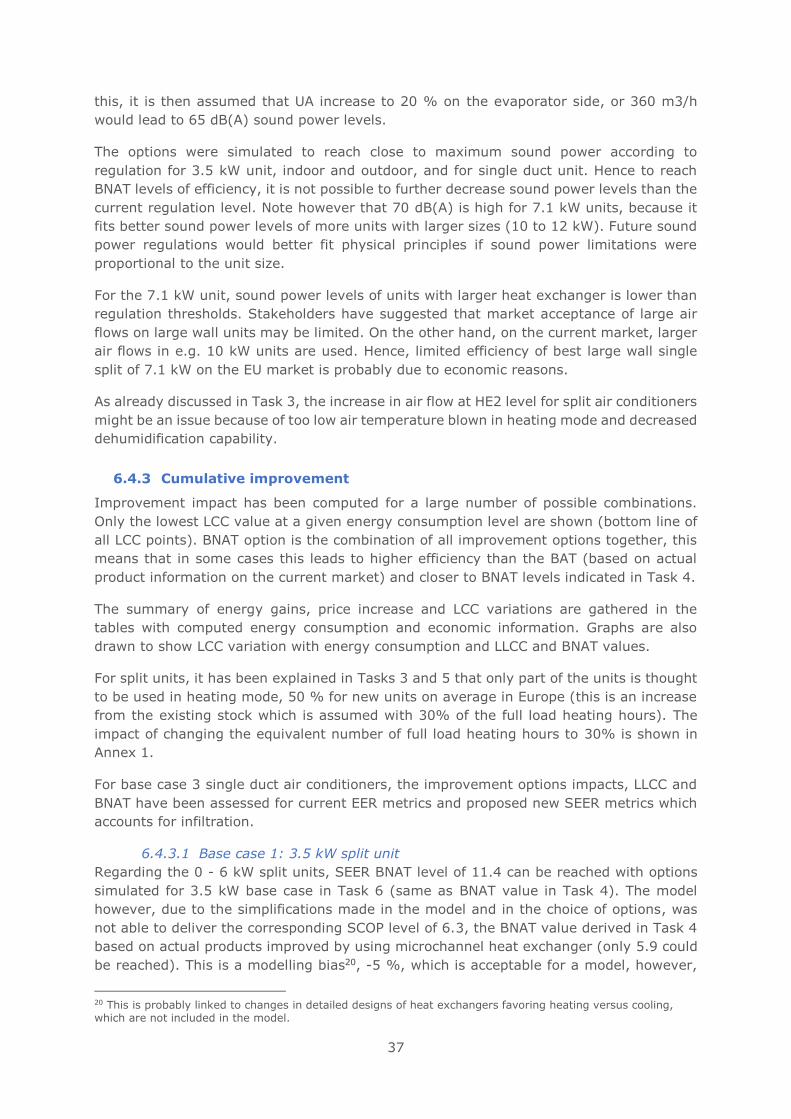
37
this, it is then assumed that UA increase to 20 % on the evaporator side, or 360 m3/h
would lead to 65 dB(A) sound power levels.
The options were simulated to reach close to maximum sound power according to
regulation for 3.5 kW unit, indoor and outdoor, and for single duct unit. Hence to reach
BNAT levels of efficiency, it is not possible to further decrease sound power levels than the
current regulation level. Note however that 70 dB(A) is high for 7.1 kW units, because it
fits better sound power levels of more units with larger sizes (10 to 12 kW). Future sound
power regulations would better fit physical principles if sound power limitations were
proportional to the unit size.
For the 7.1 kW unit, sound power levels of units with larger heat exchanger is lower than
regulation thresholds. Stakeholders have suggested that market acceptance of large air
flows on large wall units may be limited. On the other hand, on the current market, larger
air flows in e.g. 10 kW units are used. Hence, limited efficiency of best large wall single
split of 7.1 kW on the EU market is probably due to economic reasons.
As already discussed in Task 3, the increase in air flow at HE2 level for split air conditioners
might be an issue because of too low air temperature blown in heating mode and decreased
dehumidification capability.
6.4.3 Cumulative improvement
Improvement impact has been computed for a large number of possible combinations.
Only the lowest LCC value at a given energy consumption level are shown (bottom line of
all LCC points). BNAT option is the combination of all improvement options together, this
means that in some cases this leads to higher efficiency than the BAT (based on actual
product information on the current market) and closer to BNAT levels indicated in Task 4.
The summary of energy gains, price increase and LCC variations are gathered in the
tables with computed energy consumption and economic information. Graphs are also
drawn to show LCC variation with energy consumption and LLCC and BNAT values.
For split units, it has been explained in Tasks 3 and 5 that only part of the units is thought
to be used in heating mode, 50 % for new units on average in Europe (this is an increase
from the existing stock which is assumed with 30% of the full load heating hours). The
impact of changing the equivalent number of full load heating hours to 30% is shown in
Annex 1.
For base case 3 single duct air conditioners, the improvement options impacts, LLCC and
BNAT have been assessed for current EER metrics and proposed new SEER metrics which
accounts for infiltration.
6.4.3.1 Base case 1: 3.5 kW split unit
Regarding the 0 - 6 kW split units, SEER BNAT level of 11.4 can be reached with options
simulated for 3.5 kW base case in Task 6 (same as BNAT value in Task 4). The model
however, due to the simplifications made in the model and in the choice of options, was
not able to deliver the corresponding SCOP level of 6.3, the BNAT value derived in Task 4
based on actual products improved by using microchannel heat exchanger (only 5.9 could
be reached). This is a modelling bias20, -5 %, which is acceptable for a model, however,
20 This is probably linked to changes in detailed designs of heat exchangers favoring heating versus cooling, which are not included in the model.
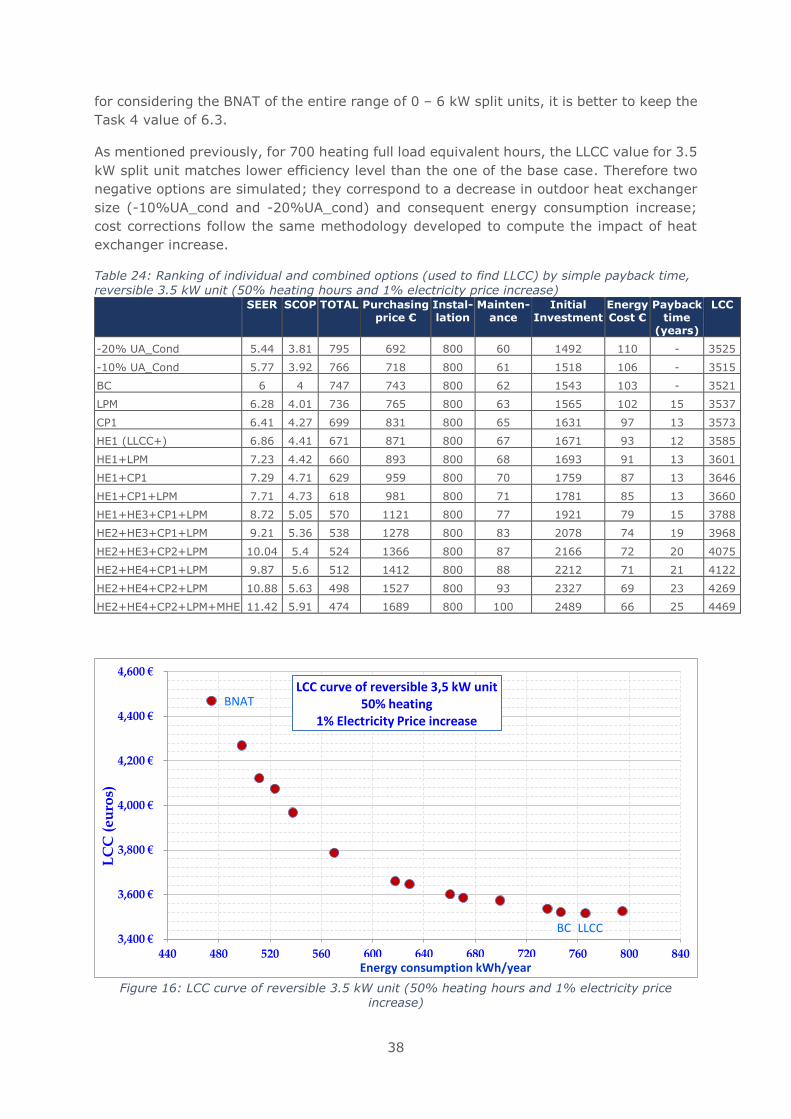
38
for considering the BNAT of the entire range of 0 – 6 kW split units, it is better to keep the
Task 4 value of 6.3.
As mentioned previously, for 700 heating full load equivalent hours, the LLCC value for 3.5
kW split unit matches lower efficiency level than the one of the base case. Therefore two
negative options are simulated; they correspond to a decrease in outdoor heat exchanger
size (-10%UA_cond and -20%UA_cond) and consequent energy consumption increase;
cost corrections follow the same methodology developed to compute the impact of heat
exchanger increase.
Table 24: Ranking of individual and combined options (used to find LLCC) by simple payback time, reversible 3.5 kW unit (50% heating hours and 1% electricity price increase)
SEER SCOP TOTAL Purchasing price €
Instal-lation
Mainten-ance
Initial Investment
Energy Cost €
Payback time
(years)
LCC
-20% UA_Cond 5.44 3.81 795 692 800 60 1492 110 - 3525
-10% UA_Cond 5.77 3.92 766 718 800 61 1518 106 - 3515
BC 6 4 747 743 800 62 1543 103 - 3521
LPM 6.28 4.01 736 765 800 63 1565 102 15 3537
CP1 6.41 4.27 699 831 800 65 1631 97 13 3573
HE1 (LLCC+) 6.86 4.41 671 871 800 67 1671 93 12 3585
HE1+LPM 7.23 4.42 660 893 800 68 1693 91 13 3601
HE1+CP1 7.29 4.71 629 959 800 70 1759 87 13 3646
HE1+CP1+LPM 7.71 4.73 618 981 800 71 1781 85 13 3660
HE1+HE3+CP1+LPM 8.72 5.05 570 1121 800 77 1921 79 15 3788
HE2+HE3+CP1+LPM 9.21 5.36 538 1278 800 83 2078 74 19 3968
HE2+HE3+CP2+LPM 10.04 5.4 524 1366 800 87 2166 72 20 4075
HE2+HE4+CP1+LPM 9.87 5.6 512 1412 800 88 2212 71 21 4122
HE2+HE4+CP2+LPM 10.88 5.63 498 1527 800 93 2327 69 23 4269
HE2+HE4+CP2+LPM+MHE 11.42 5.91 474 1689 800 100 2489 66 25 4469
Figure 16: LCC curve of reversible 3.5 kW unit (50% heating hours and 1% electricity price
increase)
BC
BNAT
LLCC3,400 €
3,600 €
3,800 €
4,000 €
4,200 €
4,400 €
4,600 €
440 480 520 560 600 640 680 720 760 800 840
LC
C (
eu
ros)
Energy consumption kWh/year
LCC curve of reversible 3,5 kW unit50% heating
1% Electricity Price increase
39
Figure 17: LCC & Energy consumption of reversible 3.5 kW unit (50% heating hours and 1%
electricity price increase)
LLCC curve is relatively flat between the option -10% UA_cond (SEER of 5.77 and LLCC of
3515 Euros), the LLCC (base case, SEER of 6.00 and LLCC of 3521 Euros) and the option
HE1 (SEER of 6.86 and LLCC of 3585 Euros) with a relative difference of LCC of 1.8% and
0.2% for HE1 and -10%UA_cond respectively compared to the base case. For a scenario
of 30% heating hours and 0% electricity price increase, relative differences can increase
to 3.5% and 0.65% respectively. The LLCC chosen is then the base case:
• SEER 6.00
• SCOP 4.00
• LCC = 3521 €
BNAT (all options): SEER= 11.4, SCOP = 5.9, LCC= 4469 €, 25 years of payback time
To summarize:
• LLCC: Base case, SEER 6.00, SCOP 4.00
• BAT: SEER 10.5, SCOP 6.2
• BNAT: SEER 11.4, SCOP 5.9
Environmental impacts of the LLCC and BNAT – 50% heating
The impacts of the base case (LLCC) and the BNAT for split 3.5 kW are presented in Figure
18, Figure 19 and Figure 20. The presented impact categories are the energy consumption,
emission of CO2-eq and emission of SO2-eq.
0
100
200
300
400
500
600
700
800
900
0
1000
2000
3000
4000
5000
6000
20%
Co
nd
10%
Co
nd
BC
LP
M
CP
1
HE
1
HE
1+
LP
M
HE
1+
CP
1
HE
1+
CP
1+
LP
M
HE
1+
HE
3+C
P1
+L
PM
HE
2+
HE
3+C
P1
+L
PM
HE
2+
HE
3+C
P2
+L
PM
HE
2+
HE
4+C
P1
+L
PM
HE
2+
HE
4+C
P2
+L
PM
HE
2+
HE
4+C
P2
+L
PM
+M
HE
En
erg
y c
on
sum
pti
on
(k
Wh
)
LC
C (
eu
ros)
LCC curve of reversible 3.5 kW unit
LCC €
Energy kWh
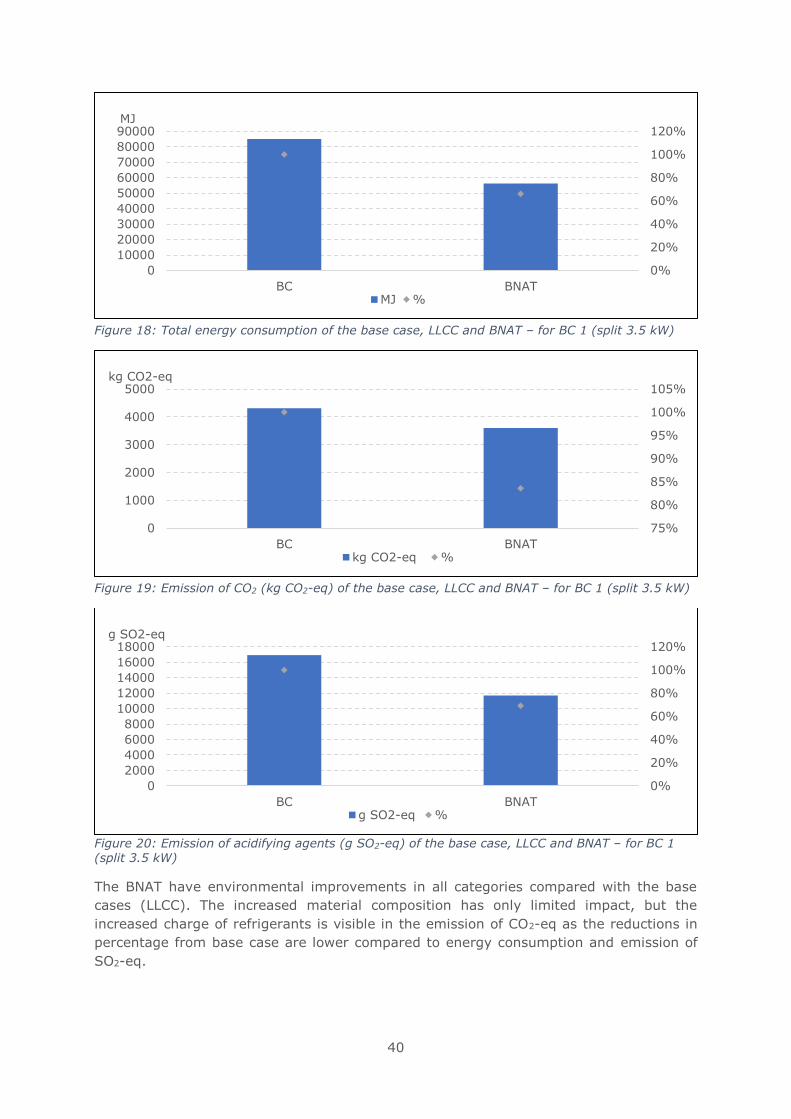
40
Figure 18: Total energy consumption of the base case, LLCC and BNAT – for BC 1 (split 3.5 kW)
Figure 19: Emission of CO2 (kg CO2-eq) of the base case, LLCC and BNAT – for BC 1 (split 3.5 kW)
Figure 20: Emission of acidifying agents (g SO2-eq) of the base case, LLCC and BNAT – for BC 1 (split 3.5 kW)
The BNAT have environmental improvements in all categories compared with the base
cases (LLCC). The increased material composition has only limited impact, but the
increased charge of refrigerants is visible in the emission of CO2-eq as the reductions in
percentage from base case are lower compared to energy consumption and emission of
SO2-eq.
0%
20%
40%
60%
80%
100%
120%
0
10000
20000
30000
40000
50000
60000
70000
80000
90000
BC BNAT
MJ
MJ %
75%
80%
85%
90%
95%
100%
105%
0
1000
2000
3000
4000
5000
BC BNAT
kg CO2-eq
kg CO2-eq %
0%
20%
40%
60%
80%
100%
120%
0
2000
4000
6000
8000
10000
12000
14000
16000
18000
BC BNAT
g SO2-eq
g SO2-eq %
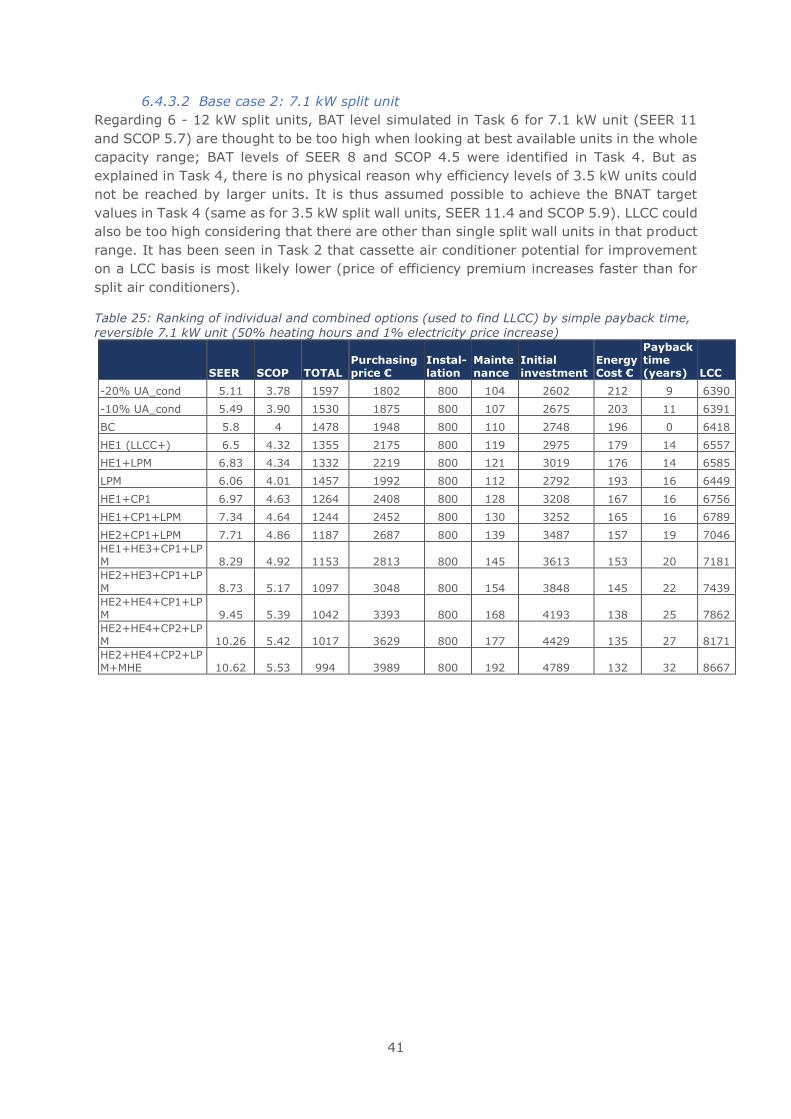
41
6.4.3.2 Base case 2: 7.1 kW split unit
Regarding 6 - 12 kW split units, BAT level simulated in Task 6 for 7.1 kW unit (SEER 11
and SCOP 5.7) are thought to be too high when looking at best available units in the whole
capacity range; BAT levels of SEER 8 and SCOP 4.5 were identified in Task 4. But as
explained in Task 4, there is no physical reason why efficiency levels of 3.5 kW units could
not be reached by larger units. It is thus assumed possible to achieve the BNAT target
values in Task 4 (same as for 3.5 kW split wall units, SEER 11.4 and SCOP 5.9). LLCC could
also be too high considering that there are other than single split wall units in that product
range. It has been seen in Task 2 that cassette air conditioner potential for improvement
on a LCC basis is most likely lower (price of efficiency premium increases faster than for
split air conditioners).
Table 25: Ranking of individual and combined options (used to find LLCC) by simple payback time,
reversible 7.1 kW unit (50% heating hours and 1% electricity price increase)
SEER SCOP TOTAL Purchasing price €
Instal-lation
Maintenance
Initial investment
Energy Cost €
Payback time (years) LCC
-20% UA_cond 5.11 3.78 1597 1802 800 104 2602 212 9 6390
-10% UA_cond 5.49 3.90 1530 1875 800 107 2675 203 11 6391
BC 5.8 4 1478 1948 800 110 2748 196 0 6418
HE1 (LLCC+) 6.5 4.32 1355 2175 800 119 2975 179 14 6557
HE1+LPM 6.83 4.34 1332 2219 800 121 3019 176 14 6585
LPM 6.06 4.01 1457 1992 800 112 2792 193 16 6449
HE1+CP1 6.97 4.63 1264 2408 800 128 3208 167 16 6756
HE1+CP1+LPM 7.34 4.64 1244 2452 800 130 3252 165 16 6789
HE2+CP1+LPM 7.71 4.86 1187 2687 800 139 3487 157 19 7046
HE1+HE3+CP1+LPM 8.29 4.92 1153 2813 800 145 3613 153 20 7181
HE2+HE3+CP1+LP
M 8.73 5.17 1097 3048 800 154 3848 145 22 7439
HE2+HE4+CP1+LPM 9.45 5.39 1042 3393 800 168 4193 138 25 7862
HE2+HE4+CP2+LPM 10.26 5.42 1017 3629 800 177 4429 135 27 8171
HE2+HE4+CP2+LPM+MHE 10.62 5.53 994 3989 800 192 4789 132 32 8667
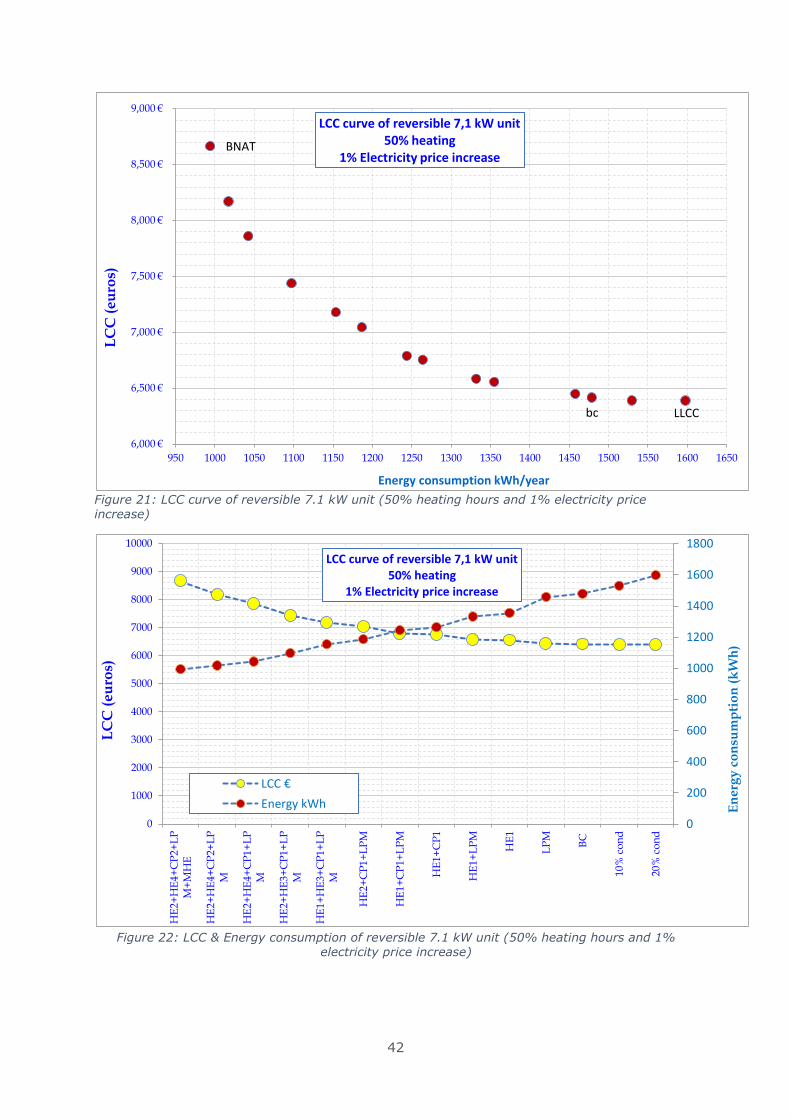
42
Figure 21: LCC curve of reversible 7.1 kW unit (50% heating hours and 1% electricity price increase)
Figure 22: LCC & Energy consumption of reversible 7.1 kW unit (50% heating hours and 1%
electricity price increase)
bc
BNAT
LLCC
6,000 €
6,500 €
7,000 €
7,500 €
8,000 €
8,500 €
9,000 €
950 1000 1050 1100 1150 1200 1250 1300 1350 1400 1450 1500 1550 1600 1650
LC
C (
eu
ros)
Energy consumption kWh/year
LCC curve of reversible 7,1 kW unit50% heating
1% Electricity price increase
0
200
400
600
800
1000
1200
1400
1600
1800
0
1000
2000
3000
4000
5000
6000
7000
8000
9000
10000
HE
2+
HE
4+C
P2
+L
PM
+M
HE
HE
2+
HE
4+C
P2
+L
PM
HE
2+
HE
4+C
P1
+L
PM
HE
2+
HE
3+C
P1
+L
PM
HE
1+
HE
3+C
P1
+L
PM
HE
2+
CP
1+
LP
M
HE
1+
CP
1+
LP
M
HE
1+
CP
1
HE
1+
LP
M
HE
1
LP
M
BC
10%
co
nd
20%
co
nd
En
erg
y c
on
sum
pti
on
(k
Wh
)
LC
C (
eu
ros)
LCC curve of reversible 7,1 kW unit50% heating
1% Electricity price increase
LCC €
Energy kWh
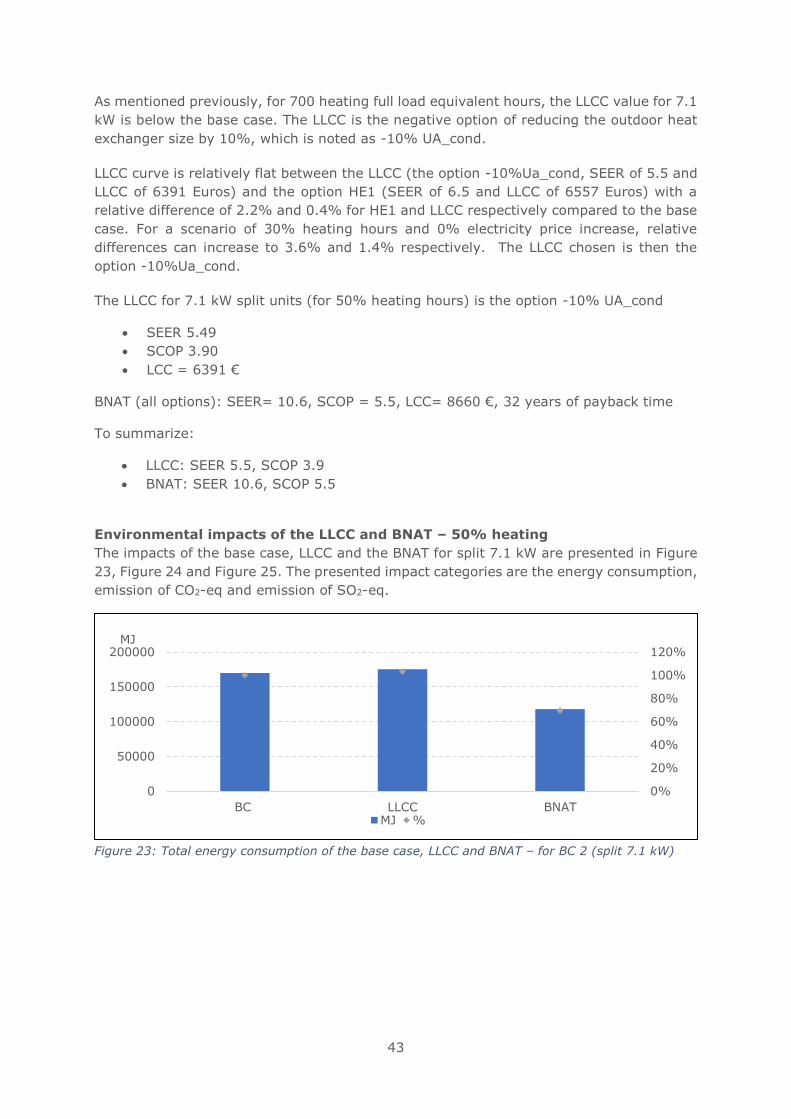
43
As mentioned previously, for 700 heating full load equivalent hours, the LLCC value for 7.1
kW is below the base case. The LLCC is the negative option of reducing the outdoor heat
exchanger size by 10%, which is noted as -10% UA_cond.
LLCC curve is relatively flat between the LLCC (the option -10%Ua_cond, SEER of 5.5 and
LLCC of 6391 Euros) and the option HE1 (SEER of 6.5 and LLCC of 6557 Euros) with a
relative difference of 2.2% and 0.4% for HE1 and LLCC respectively compared to the base
case. For a scenario of 30% heating hours and 0% electricity price increase, relative
differences can increase to 3.6% and 1.4% respectively. The LLCC chosen is then the
option -10%Ua_cond.
The LLCC for 7.1 kW split units (for 50% heating hours) is the option -10% UA_cond
• SEER 5.49
• SCOP 3.90
• LCC = 6391 €
BNAT (all options): SEER= 10.6, SCOP = 5.5, LCC= 8660 €, 32 years of payback time
To summarize:
• LLCC: SEER 5.5, SCOP 3.9
• BNAT: SEER 10.6, SCOP 5.5
Environmental impacts of the LLCC and BNAT – 50% heating
The impacts of the base case, LLCC and the BNAT for split 7.1 kW are presented in Figure
23, Figure 24 and Figure 25. The presented impact categories are the energy consumption,
emission of CO2-eq and emission of SO2-eq.
Figure 23: Total energy consumption of the base case, LLCC and BNAT – for BC 2 (split 7.1 kW)
0%
20%
40%
60%
80%
100%
120%
0
50000
100000
150000
200000
BC LLCC BNAT
MJ
MJ %
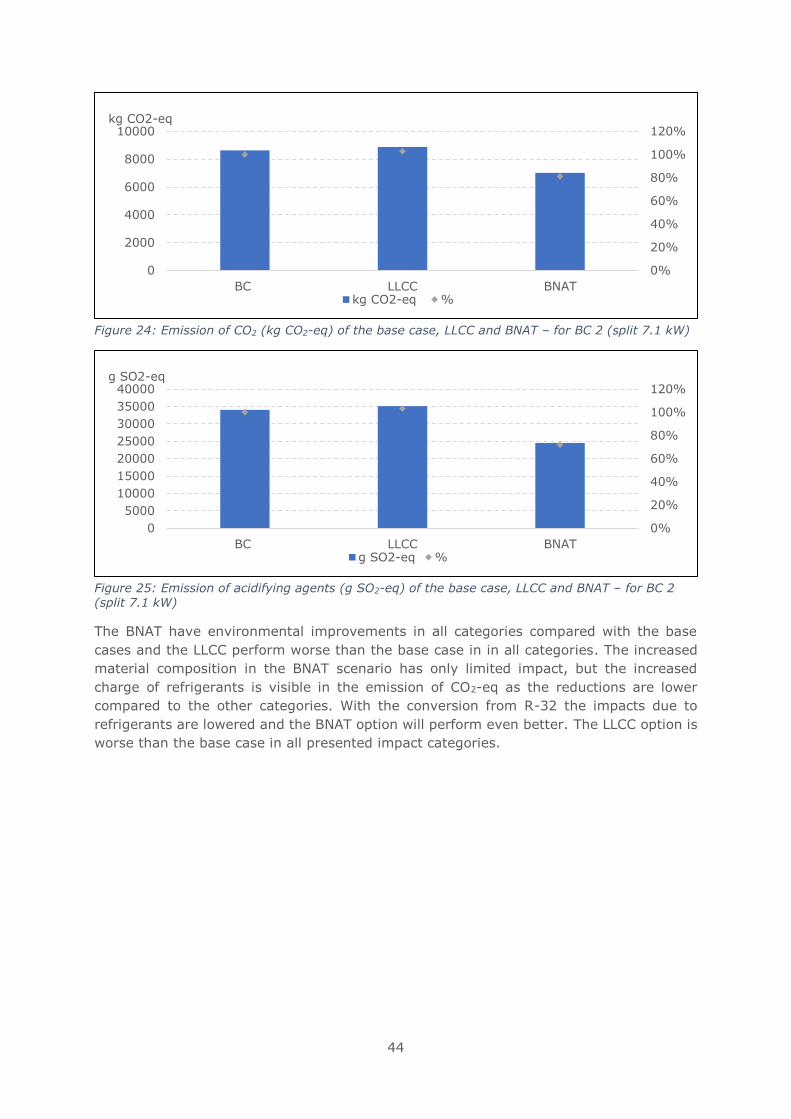
44
Figure 24: Emission of CO2 (kg CO2-eq) of the base case, LLCC and BNAT – for BC 2 (split 7.1 kW)
Figure 25: Emission of acidifying agents (g SO2-eq) of the base case, LLCC and BNAT – for BC 2 (split 7.1 kW)
The BNAT have environmental improvements in all categories compared with the base
cases and the LLCC perform worse than the base case in in all categories. The increased
material composition in the BNAT scenario has only limited impact, but the increased
charge of refrigerants is visible in the emission of CO2-eq as the reductions are lower
compared to the other categories. With the conversion from R-32 the impacts due to
refrigerants are lowered and the BNAT option will perform even better. The LLCC option is
worse than the base case in all presented impact categories.
0%
20%
40%
60%
80%
100%
120%
0
2000
4000
6000
8000
10000
BC LLCC BNAT
kg CO2-eq
kg CO2-eq %
0%
20%
40%
60%
80%
100%
120%
0
5000
10000
15000
20000
25000
30000
35000
40000
BC LLCC BNAT
g SO2-eq
g SO2-eq %
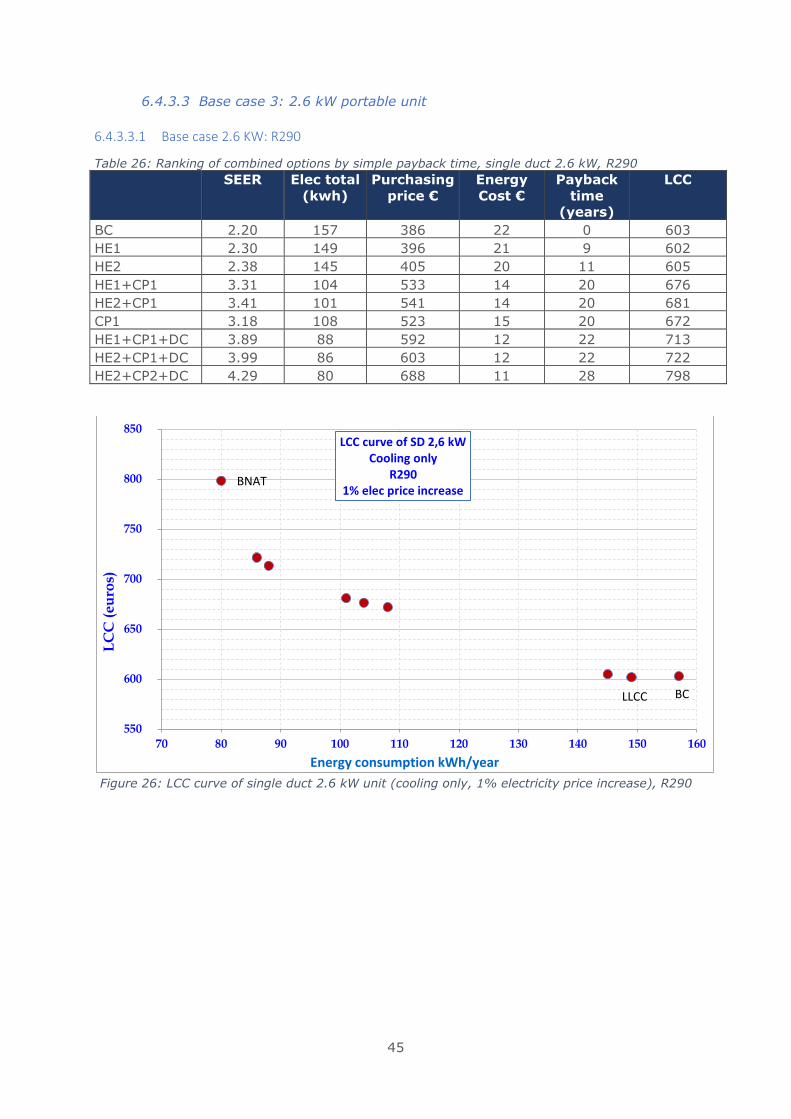
45
6.4.3.3 Base case 3: 2.6 kW portable unit
6.4.3.3.1 Base case 2.6 KW: R290
Table 26: Ranking of combined options by simple payback time, single duct 2.6 kW, R290 SEER Elec total
(kwh)
Purchasing
price €
Energy
Cost €
Payback
time
(years)
LCC
BC 2.20 157 386 22 0 603
HE1 2.30 149 396 21 9 602
HE2 2.38 145 405 20 11 605
HE1+CP1 3.31 104 533 14 20 676
HE2+CP1 3.41 101 541 14 20 681
CP1 3.18 108 523 15 20 672
HE1+CP1+DC 3.89 88 592 12 22 713
HE2+CP1+DC 3.99 86 603 12 22 722
HE2+CP2+DC 4.29 80 688 11 28 798
Figure 26: LCC curve of single duct 2.6 kW unit (cooling only, 1% electricity price increase), R290
BCLLCC
BNAT
550
600
650
700
750
800
850
70 80 90 100 110 120 130 140 150 160
LC
C (
eu
ros)
Energy consumption kWh/year
LCC curve of SD 2,6 kW Cooling only
R2901% elec price increase
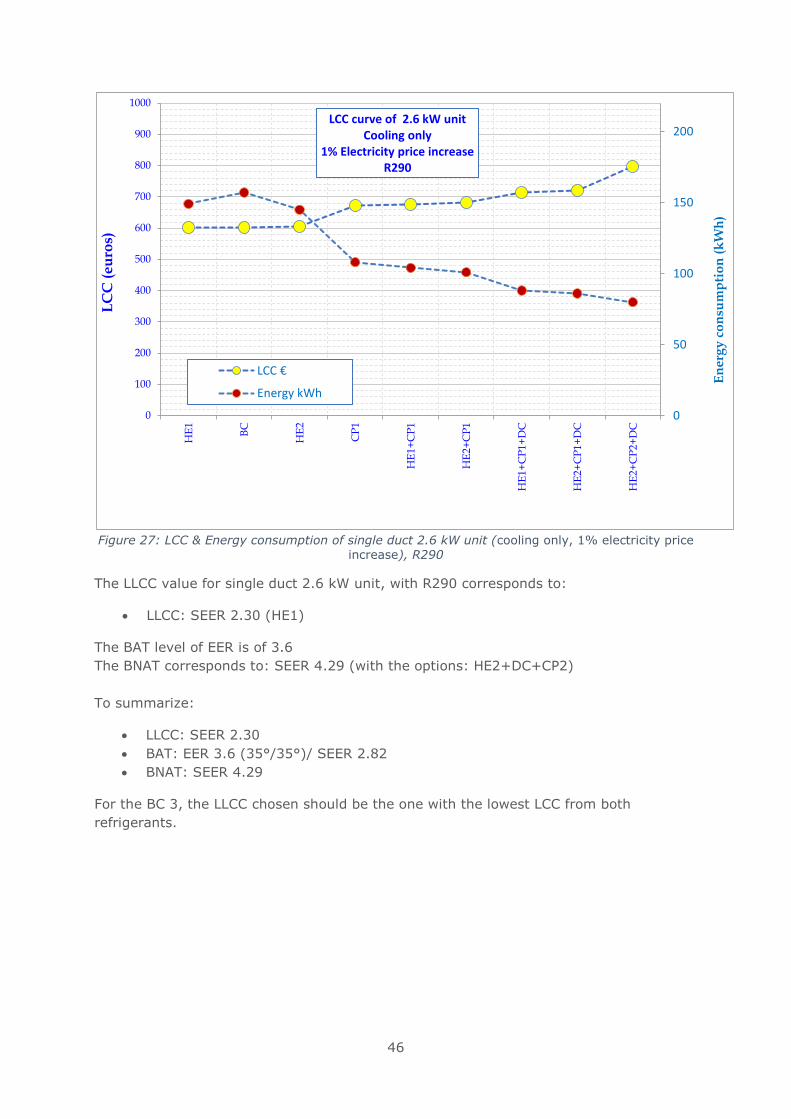
46
Figure 27: LCC & Energy consumption of single duct 2.6 kW unit (cooling only, 1% electricity price
increase), R290
The LLCC value for single duct 2.6 kW unit, with R290 corresponds to:
• LLCC: SEER 2.30 (HE1)
The BAT level of EER is of 3.6
The BNAT corresponds to: SEER 4.29 (with the options: HE2+DC+CP2)
To summarize:
• LLCC: SEER 2.30
• BAT: EER 3.6 (35°/35°)/ SEER 2.82
• BNAT: SEER 4.29
For the BC 3, the LLCC chosen should be the one with the lowest LCC from both
refrigerants.
0
50
100
150
200
0
100
200
300
400
500
600
700
800
900
1000
HE
1
BC
HE
2
CP
1
HE
1+
CP
1
HE
2+
CP
1
HE
1+
CP
1+
DC
HE
2+
CP
1+
DC
HE
2+
CP
2+
DC
En
erg
y c
on
sum
pti
on
(k
Wh
)
LC
C (
eu
ros)
LCC curve of 2.6 kW unitCooling only
1% Electricity price increaseR290
LCC €
Energy kWh
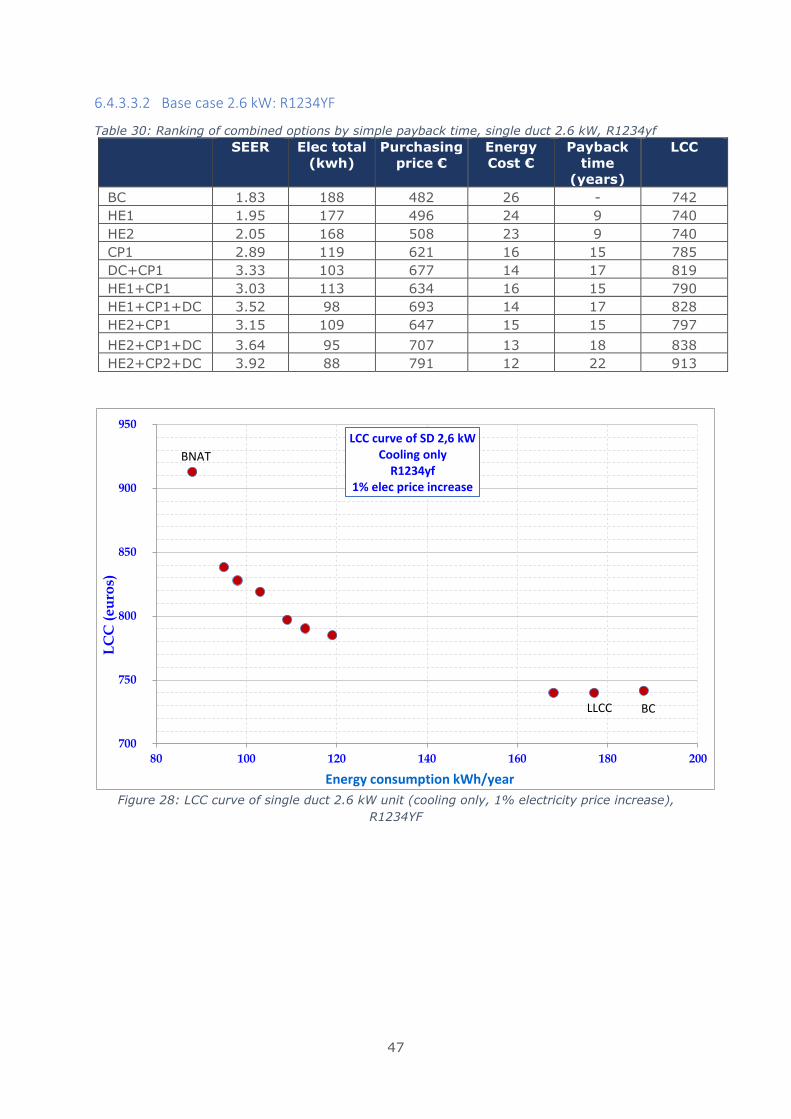
47
6.4.3.3.2 Base case 2.6 kW: R1234YF
Table 30: Ranking of combined options by simple payback time, single duct 2.6 kW, R1234yf SEER Elec total
(kwh)
Purchasing
price €
Energy
Cost €
Payback
time
(years)
LCC
BC 1.83 188 482 26 - 742
HE1 1.95 177 496 24 9 740
HE2 2.05 168 508 23 9 740
CP1 2.89 119 621 16 15 785
DC+CP1 3.33 103 677 14 17 819
HE1+CP1 3.03 113 634 16 15 790
HE1+CP1+DC 3.52 98 693 14 17 828
HE2+CP1 3.15 109 647 15 15 797
HE2+CP1+DC 3.64 95 707 13 18 838
HE2+CP2+DC 3.92 88 791 12 22 913
Figure 28: LCC curve of single duct 2.6 kW unit (cooling only, 1% electricity price increase),
R1234YF
BCLLCC
BNAT
700
750
800
850
900
950
80 100 120 140 160 180 200
LC
C (
eu
ros)
Energy consumption kWh/year
LCC curve of SD 2,6 kW Cooling only
R1234yf1% elec price increase
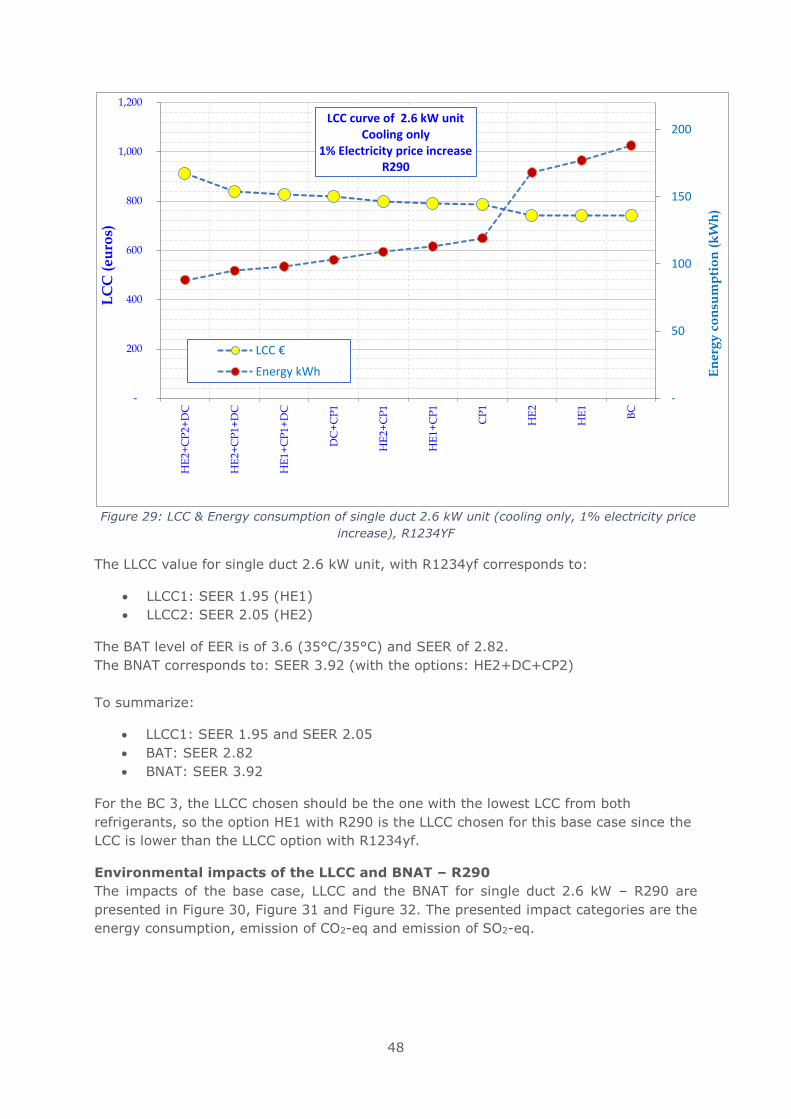
48
Figure 29: LCC & Energy consumption of single duct 2.6 kW unit (cooling only, 1% electricity price
increase), R1234YF
The LLCC value for single duct 2.6 kW unit, with R1234yf corresponds to:
• LLCC1: SEER 1.95 (HE1)
• LLCC2: SEER 2.05 (HE2)
The BAT level of EER is of 3.6 (35°C/35°C) and SEER of 2.82.
The BNAT corresponds to: SEER 3.92 (with the options: HE2+DC+CP2)
To summarize:
• LLCC1: SEER 1.95 and SEER 2.05
• BAT: SEER 2.82
• BNAT: SEER 3.92
For the BC 3, the LLCC chosen should be the one with the lowest LCC from both
refrigerants, so the option HE1 with R290 is the LLCC chosen for this base case since the
LCC is lower than the LLCC option with R1234yf.
Environmental impacts of the LLCC and BNAT – R290
The impacts of the base case, LLCC and the BNAT for single duct 2.6 kW – R290 are
presented in Figure 30, Figure 31 and Figure 32. The presented impact categories are the
energy consumption, emission of CO2-eq and emission of SO2-eq.
-
50
100
150
200
-
200
400
600
800
1,000
1,200
HE
2+
CP
2+
DC
HE
2+
CP
1+
DC
HE
1+
CP
1+
DC
DC
+C
P1
HE
2+
CP
1
HE
1+
CP
1
CP
1
HE
2
HE
1
BC
En
erg
y c
on
sum
pti
on
(k
Wh
)
LC
C (
eu
ros)
LCC curve of 2.6 kW unitCooling only
1% Electricity price increaseR290
LCC €
Energy kWh
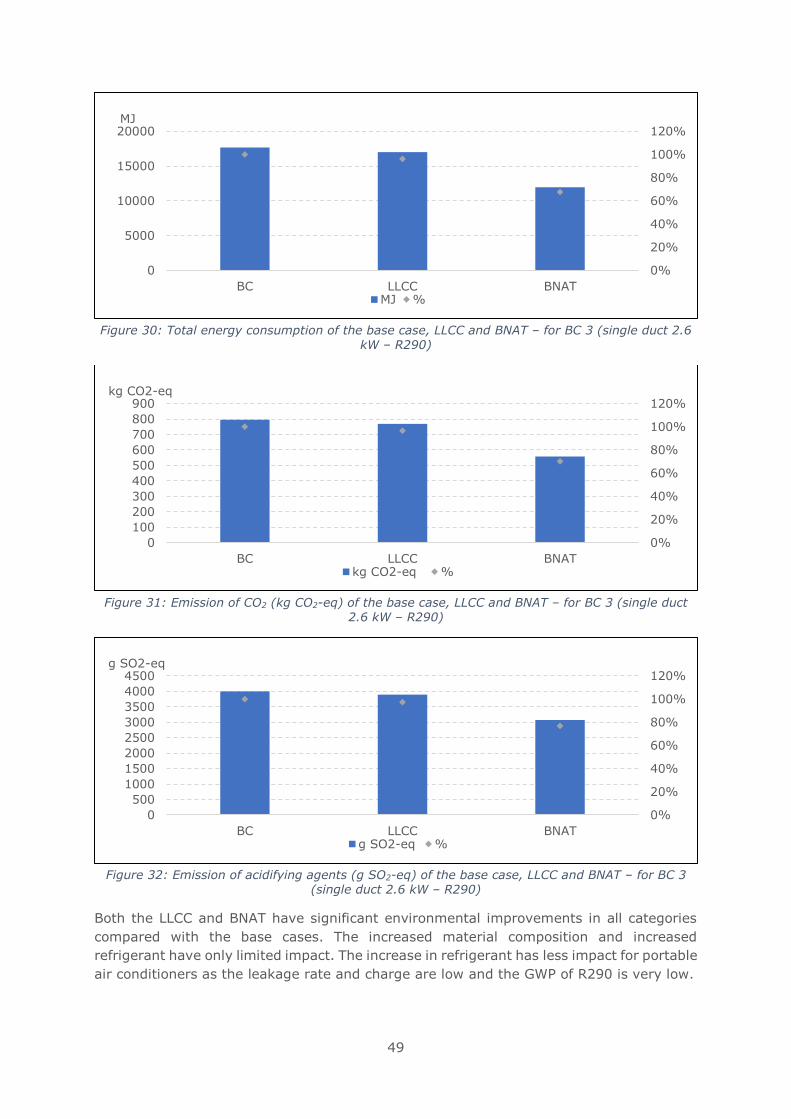
49
Figure 30: Total energy consumption of the base case, LLCC and BNAT – for BC 3 (single duct 2.6
kW – R290)
Figure 31: Emission of CO2 (kg CO2-eq) of the base case, LLCC and BNAT – for BC 3 (single duct
2.6 kW – R290)
Figure 32: Emission of acidifying agents (g SO2-eq) of the base case, LLCC and BNAT – for BC 3
(single duct 2.6 kW – R290)
Both the LLCC and BNAT have significant environmental improvements in all categories
compared with the base cases. The increased material composition and increased
refrigerant have only limited impact. The increase in refrigerant has less impact for portable
air conditioners as the leakage rate and charge are low and the GWP of R290 is very low.
0%
20%
40%
60%
80%
100%
120%
0
5000
10000
15000
20000
BC LLCC BNAT
MJ
MJ %
0%
20%
40%
60%
80%
100%
120%
0
100
200
300
400
500
600
700
800
900
BC LLCC BNAT
kg CO2-eq
kg CO2-eq %
0%
20%
40%
60%
80%
100%
120%
0
500
1000
1500
2000
2500
3000
3500
4000
4500
BC LLCC BNAT
g SO2-eq
g SO2-eq %
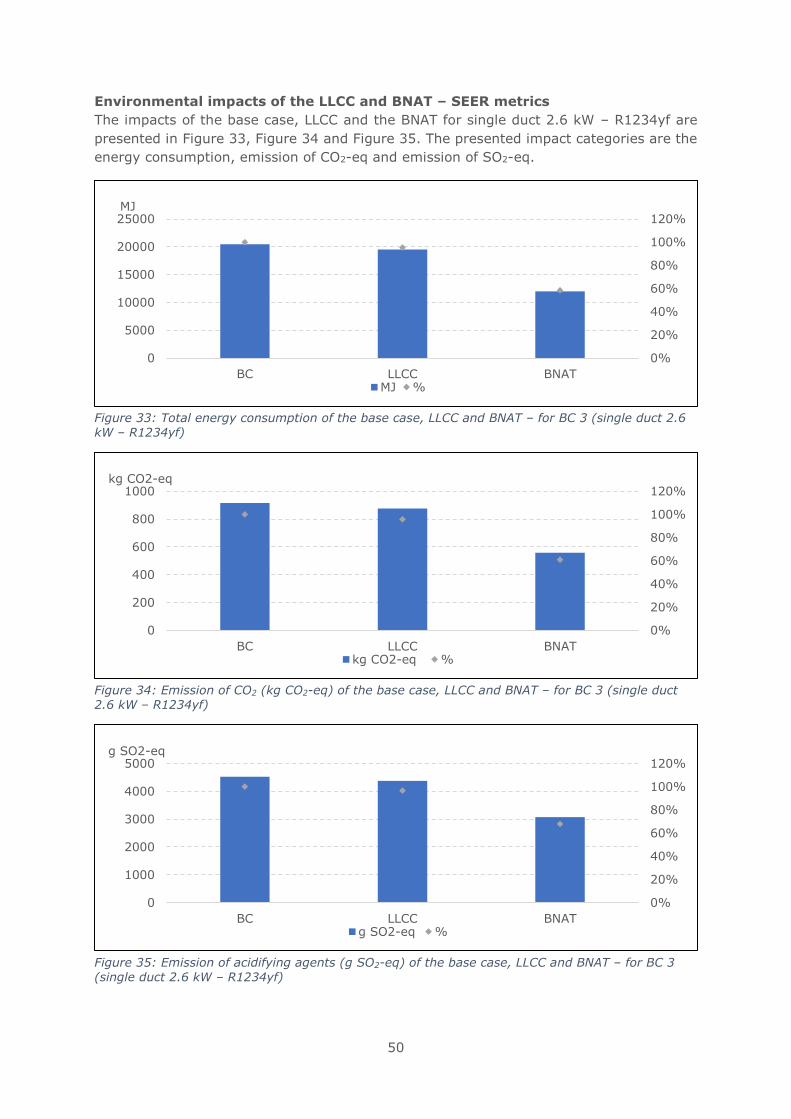
50
Environmental impacts of the LLCC and BNAT – SEER metrics
The impacts of the base case, LLCC and the BNAT for single duct 2.6 kW – R1234yf are
presented in Figure 33, Figure 34 and Figure 35. The presented impact categories are the
energy consumption, emission of CO2-eq and emission of SO2-eq.
Figure 33: Total energy consumption of the base case, LLCC and BNAT – for BC 3 (single duct 2.6 kW – R1234yf)
Figure 34: Emission of CO2 (kg CO2-eq) of the base case, LLCC and BNAT – for BC 3 (single duct 2.6 kW – R1234yf)
Figure 35: Emission of acidifying agents (g SO2-eq) of the base case, LLCC and BNAT – for BC 3
(single duct 2.6 kW – R1234yf)
0%
20%
40%
60%
80%
100%
120%
0
5000
10000
15000
20000
25000
BC LLCC BNAT
MJ
MJ %
0%
20%
40%
60%
80%
100%
120%
0
200
400
600
800
1000
BC LLCC BNAT
kg CO2-eq
kg CO2-eq %
0%
20%
40%
60%
80%
100%
120%
0
1000
2000
3000
4000
5000
BC LLCC BNAT
g SO2-eq
g SO2-eq %
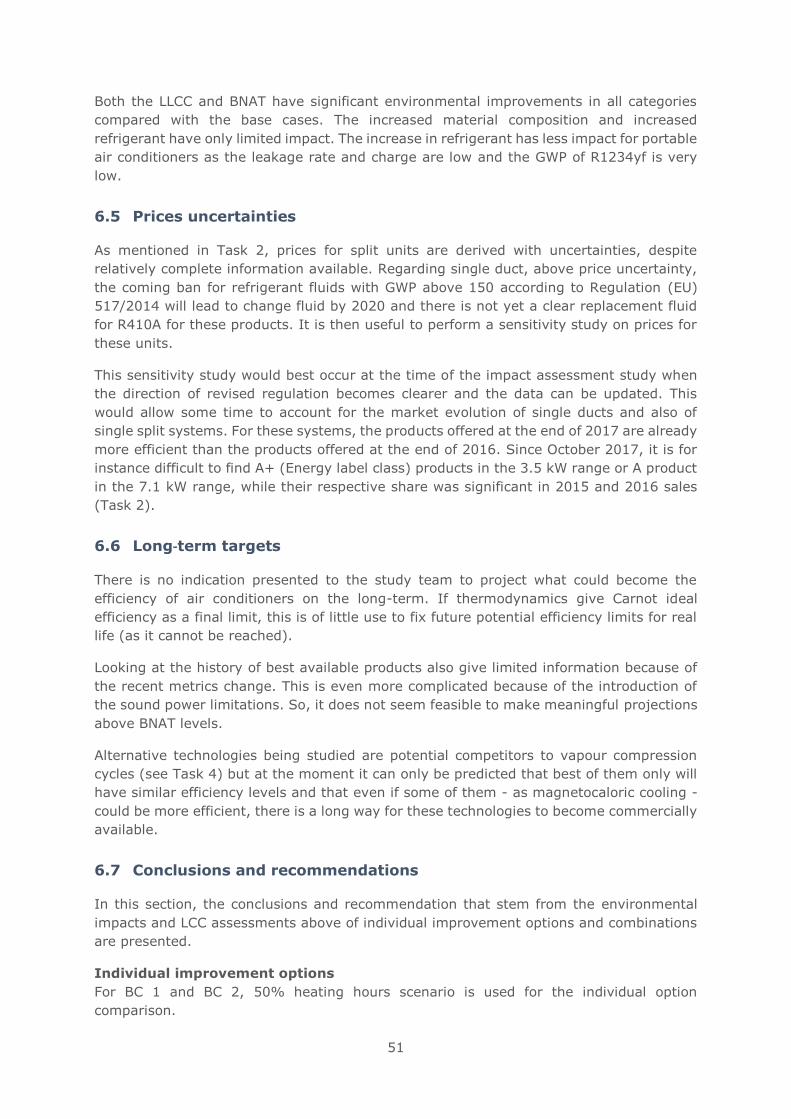
51
Both the LLCC and BNAT have significant environmental improvements in all categories
compared with the base cases. The increased material composition and increased
refrigerant have only limited impact. The increase in refrigerant has less impact for portable
air conditioners as the leakage rate and charge are low and the GWP of R1234yf is very
low.
6.5 Prices uncertainties
As mentioned in Task 2, prices for split units are derived with uncertainties, despite
relatively complete information available. Regarding single duct, above price uncertainty,
the coming ban for refrigerant fluids with GWP above 150 according to Regulation (EU)
517/2014 will lead to change fluid by 2020 and there is not yet a clear replacement fluid
for R410A for these products. It is then useful to perform a sensitivity study on prices for
these units.
This sensitivity study would best occur at the time of the impact assessment study when
the direction of revised regulation becomes clearer and the data can be updated. This
would allow some time to account for the market evolution of single ducts and also of
single split systems. For these systems, the products offered at the end of 2017 are already
more efficient than the products offered at the end of 2016. Since October 2017, it is for
instance difficult to find A+ (Energy label class) products in the 3.5 kW range or A product
in the 7.1 kW range, while their respective share was significant in 2015 and 2016 sales
(Task 2).
6.6 Long‐term targets
There is no indication presented to the study team to project what could become the
efficiency of air conditioners on the long-term. If thermodynamics give Carnot ideal
efficiency as a final limit, this is of little use to fix future potential efficiency limits for real
life (as it cannot be reached).
Looking at the history of best available products also give limited information because of
the recent metrics change. This is even more complicated because of the introduction of
the sound power limitations. So, it does not seem feasible to make meaningful projections
above BNAT levels.
Alternative technologies being studied are potential competitors to vapour compression
cycles (see Task 4) but at the moment it can only be predicted that best of them only will
have similar efficiency levels and that even if some of them - as magnetocaloric cooling -
could be more efficient, there is a long way for these technologies to become commercially
available.
6.7 Conclusions and recommendations
In this section, the conclusions and recommendation that stem from the environmental
impacts and LCC assessments above of individual improvement options and combinations
are presented.
Individual improvement options
For BC 1 and BC 2, 50% heating hours scenario is used for the individual option
comparison.
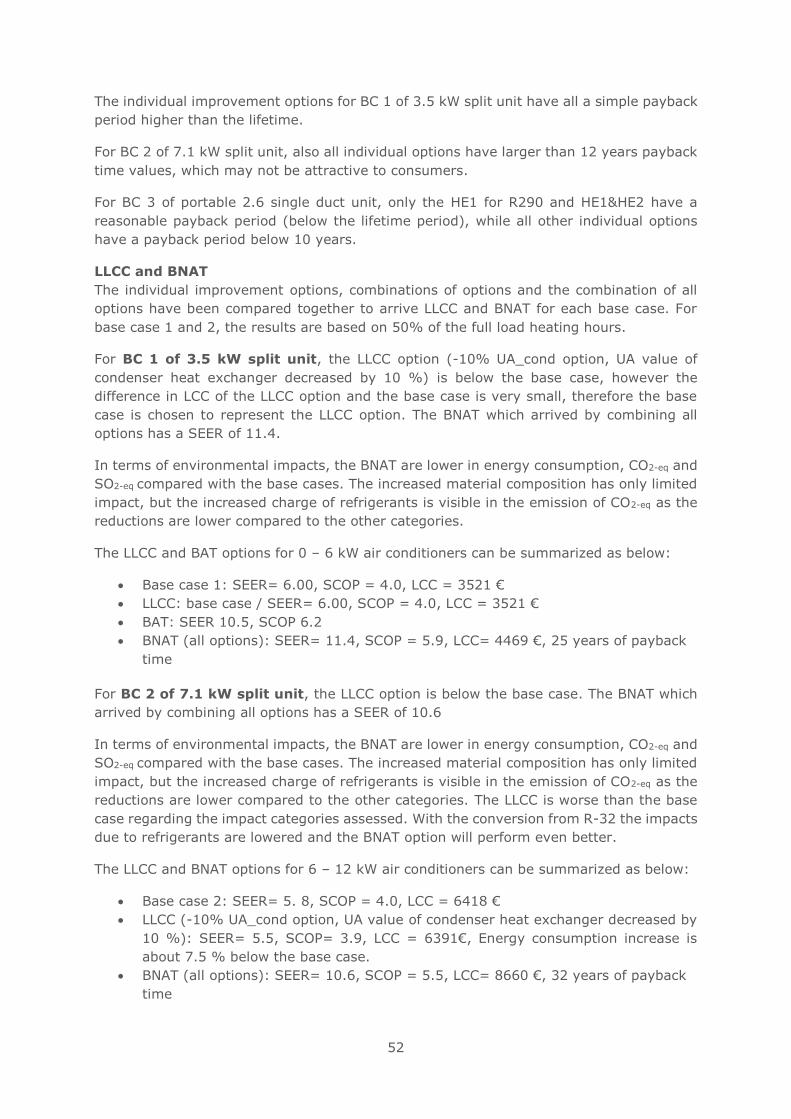
52
The individual improvement options for BC 1 of 3.5 kW split unit have all a simple payback
period higher than the lifetime.
For BC 2 of 7.1 kW split unit, also all individual options have larger than 12 years payback
time values, which may not be attractive to consumers.
For BC 3 of portable 2.6 single duct unit, only the HE1 for R290 and HE1&HE2 have a
reasonable payback period (below the lifetime period), while all other individual options
have a payback period below 10 years.
LLCC and BNAT
The individual improvement options, combinations of options and the combination of all
options have been compared together to arrive LLCC and BNAT for each base case. For
base case 1 and 2, the results are based on 50% of the full load heating hours.
For BC 1 of 3.5 kW split unit, the LLCC option (-10% UA_cond option, UA value of
condenser heat exchanger decreased by 10 %) is below the base case, however the
difference in LCC of the LLCC option and the base case is very small, therefore the base
case is chosen to represent the LLCC option. The BNAT which arrived by combining all
options has a SEER of 11.4.
In terms of environmental impacts, the BNAT are lower in energy consumption, CO2-eq and
SO2-eq compared with the base cases. The increased material composition has only limited
impact, but the increased charge of refrigerants is visible in the emission of CO2-eq as the
reductions are lower compared to the other categories.
The LLCC and BAT options for 0 – 6 kW air conditioners can be summarized as below:
• Base case 1: SEER= 6.00, SCOP = 4.0, LCC = 3521 €
• LLCC: base case / SEER= 6.00, SCOP = 4.0, LCC = 3521 €
• BAT: SEER 10.5, SCOP 6.2
• BNAT (all options): SEER= 11.4, SCOP = 5.9, LCC= 4469 €, 25 years of payback
time
For BC 2 of 7.1 kW split unit, the LLCC option is below the base case. The BNAT which
arrived by combining all options has a SEER of 10.6
In terms of environmental impacts, the BNAT are lower in energy consumption, CO2-eq and
SO2-eq compared with the base cases. The increased material composition has only limited
impact, but the increased charge of refrigerants is visible in the emission of CO2-eq as the
reductions are lower compared to the other categories. The LLCC is worse than the base
case regarding the impact categories assessed. With the conversion from R-32 the impacts
due to refrigerants are lowered and the BNAT option will perform even better.
The LLCC and BNAT options for 6 – 12 kW air conditioners can be summarized as below:
• Base case 2: SEER= 5. 8, SCOP = 4.0, LCC = 6418 €
• LLCC (-10% UA_cond option, UA value of condenser heat exchanger decreased by
10 %): SEER= 5.5, SCOP= 3.9, LCC = 6391€, Energy consumption increase is
about 7.5 % below the base case.
• BNAT (all options): SEER= 10.6, SCOP = 5.5, LCC= 8660 €, 32 years of payback
time
53
For BC 3 portable single duct unit, LLCC option with R290 is achieved with the individual
option HE1 (UA value of evaporator heat exchanger increased by 10 %, BNAT achieves a
SEER of 4.29. And with R1234yf the LLCC is achieved with the 2 individual options HE1
and HE2, BNAT achieves a SEER of 3.92.
The LLCC, BAT, BNAT options for portable air conditioners can be summarized as below:
• Base case 3:
o With refrigerant R410A: EER= 2.65 (35°/35°), SEER= 2.09
o With refrigerant R290: EER= 2.79 (35°/35°), SEER= 2.20
o With refrigerant R1234yf: EER= 2.32 (35°/35°), SEER= 1.83
• LLCC:
o With refrigerant R290: (HE1): EER= 2.93 (35°/35°), SEER= 2.30,
electricity consumption 149 kWh, LCC of 602 €
o With refrigerant R1234YF, two LLCC points found:
(HE1): EER= 2.47 (35°/35°), SEER= 1.95, electricity consumption 177
kWh, LCC of 740 €
(HE2): EER= 2.60 (35°/35°), SEER= 2.05, electricity consumption 168
kWh, LCC of 740 €
• BAT: EER= 3.6 (35°/35°), SEER= 2.82, electricity consumption 122 kWh, as
found currently on the market
• BNAT:
o With refrigerant R290: EER= 4.83 (35 °C/35 °C), SEER= 4.29, electricity
consumption 80 kWh
o With refrigerant R1234yf: EER= 4.15 (35 °C/35 °C), SEER= 3.92,
electricity consumption 88 kWh
For the BC 3, the LLCC chosen should be the one with the lowest LCC from both
refrigerants, so the option HE1 with R290 is the LLCC chosen for this base case since the
LCC is lower than the LLCC option with R1234yf.
However, it is possible in real life, the LLCC and BNAT values would be lower even these
improvement options have been applied, due to a potential new metrics (seasonable
performance) and the change of refrigerant fluid (alternative fluid to the F-gas ban).
Conversely, the inclusion of standby mode and thermostat-off mode options could slightly
decrease the energy consumption.
In terms of environmental impacts, LLCC and BNAT have significant improvement
compared with the base case. With the shift of refrigerant, the BNAT can be significant
better than the base case.
Sound power levels
Reducing sound power levels and increasing energy efficiency are potentially contradictory
goals that air conditioner designers have to balance. To reach higher efficiency levels, close
to BAT levels, it is not possible to decrease sound power maximum requirements for single
duct nor for the 0-6 kW range. Regarding the 6 - 12 kW range, there is a margin for
reducing outdoor sound power of the 7.1 kW unit, but this is due to the fact that the 6-12
kW range of current requirement has taken into account of the bigger units with larger air
flows and hence sound power emissions. In order to further reduce sound power levels, it
would probably require revising the requirements by making the sound power limits
54
proportional to the cooling capacity of the products. This would need a more in-depth
analysis to develop.
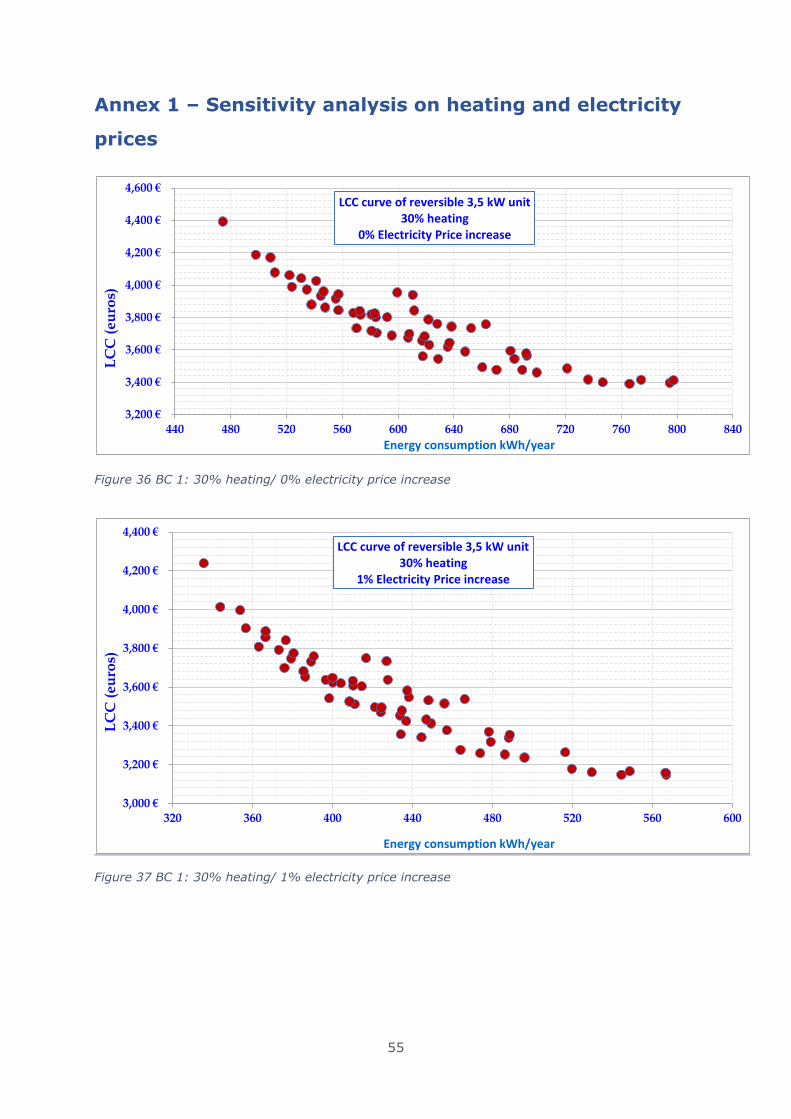
55
Annex 1 – Sensitivity analysis on heating and electricity
prices
Figure 36 BC 1: 30% heating/ 0% electricity price increase
Figure 37 BC 1: 30% heating/ 1% electricity price increase
3,200 €
3,400 €
3,600 €
3,800 €
4,000 €
4,200 €
4,400 €
4,600 €
440 480 520 560 600 640 680 720 760 800 840
LC
C (
eu
ros)
Energy consumption kWh/year
LCC curve of reversible 3,5 kW unit30% heating
0% Electricity Price increase
3,000 €
3,200 €
3,400 €
3,600 €
3,800 €
4,000 €
4,200 €
4,400 €
320 360 400 440 480 520 560 600
LC
C (
eu
ros)
Energy consumption kWh/year
LCC curve of reversible 3,5 kW unit30% heating
1% Electricity Price increase
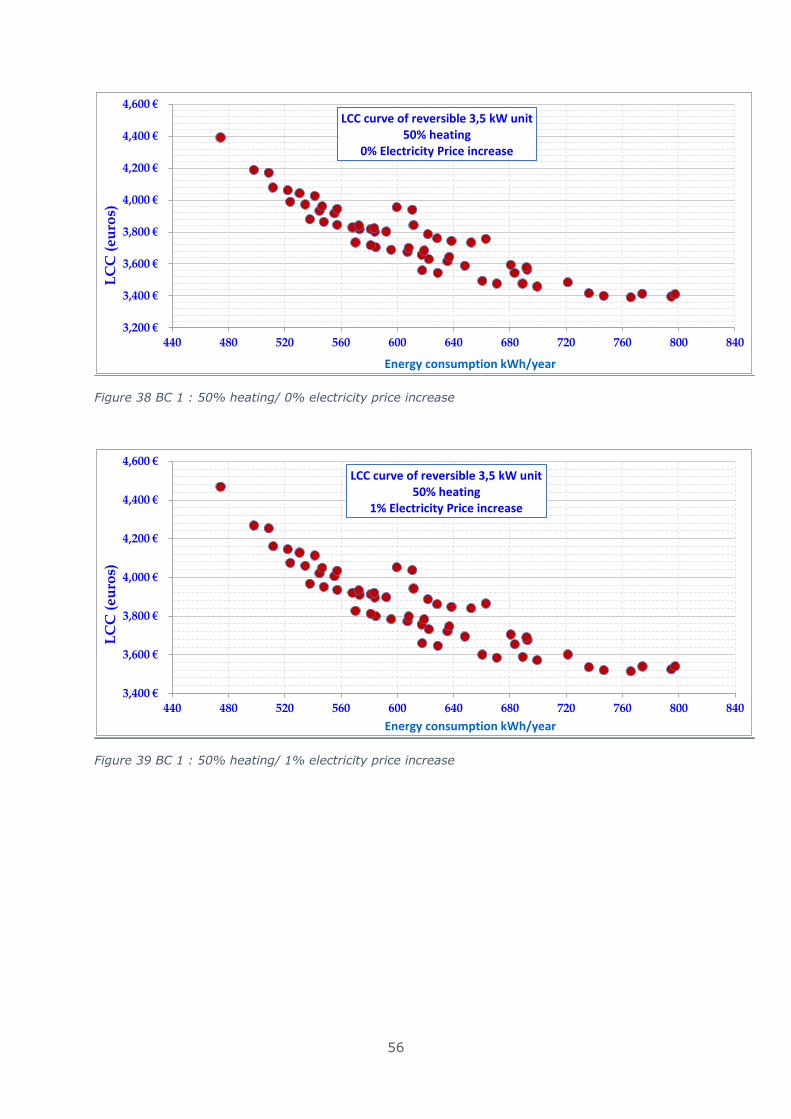
56
Figure 38 BC 1 : 50% heating/ 0% electricity price increase
Figure 39 BC 1 : 50% heating/ 1% electricity price increase
3,200 €
3,400 €
3,600 €
3,800 €
4,000 €
4,200 €
4,400 €
4,600 €
440 480 520 560 600 640 680 720 760 800 840
LC
C (
eu
ros)
Energy consumption kWh/year
LCC curve of reversible 3,5 kW unit50% heating
0% Electricity Price increase
3,400 €
3,600 €
3,800 €
4,000 €
4,200 €
4,400 €
4,600 €
440 480 520 560 600 640 680 720 760 800 840
LC
C (
eu
ros)
Energy consumption kWh/year
LCC curve of reversible 3,5 kW unit50% heating
1% Electricity Price increase
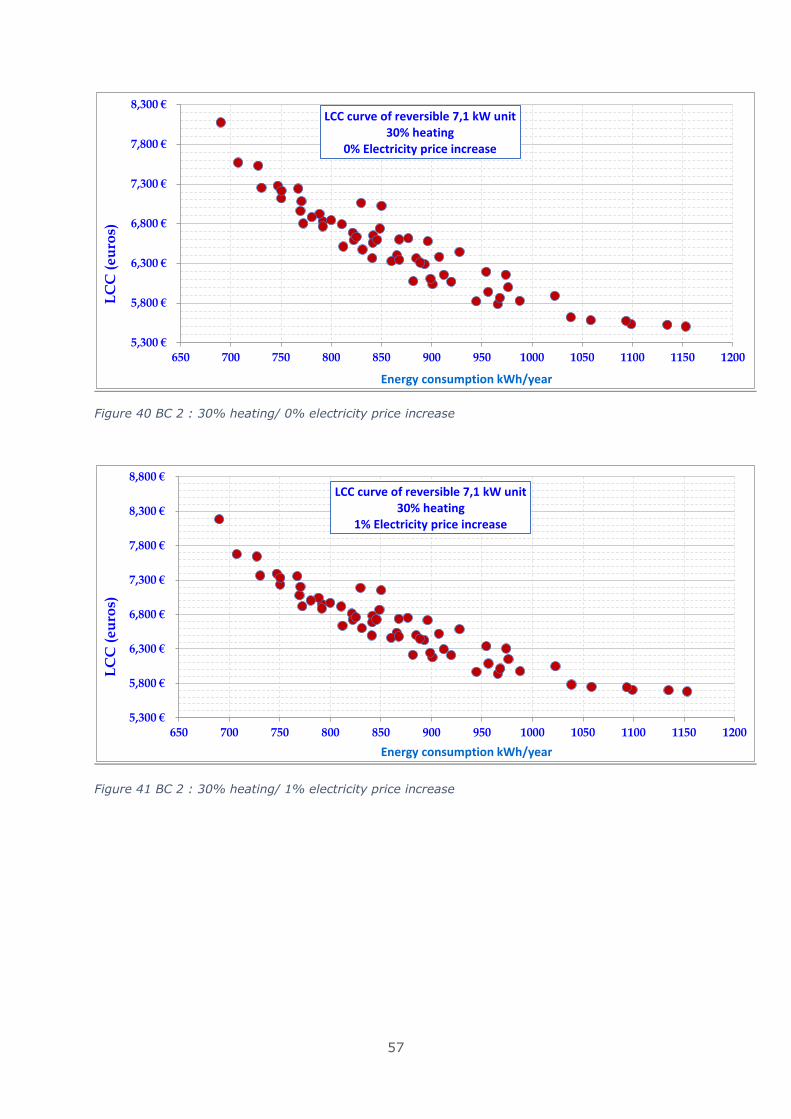
57
Figure 40 BC 2 : 30% heating/ 0% electricity price increase
Figure 41 BC 2 : 30% heating/ 1% electricity price increase
5,300 €
5,800 €
6,300 €
6,800 €
7,300 €
7,800 €
8,300 €
650 700 750 800 850 900 950 1000 1050 1100 1150 1200
LC
C (
eu
ros)
Energy consumption kWh/year
LCC curve of reversible 7,1 kW unit30% heating
0% Electricity price increase
5,300 €
5,800 €
6,300 €
6,800 €
7,300 €
7,800 €
8,300 €
8,800 €
650 700 750 800 850 900 950 1000 1050 1100 1150 1200
LC
C (
eu
ros)
Energy consumption kWh/year
LCC curve of reversible 7,1 kW unit30% heating
1% Electricity price increase
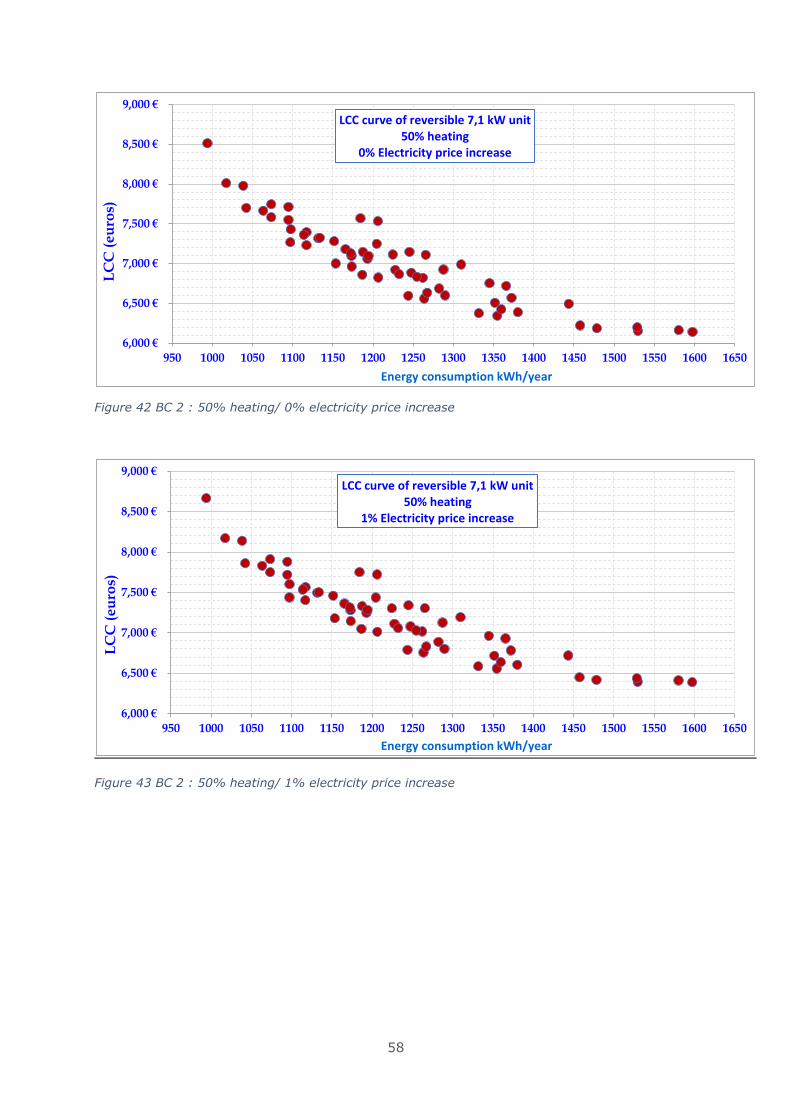
58
Figure 42 BC 2 : 50% heating/ 0% electricity price increase
Figure 43 BC 2 : 50% heating/ 1% electricity price increase
6,000 €
6,500 €
7,000 €
7,500 €
8,000 €
8,500 €
9,000 €
950 1000 1050 1100 1150 1200 1250 1300 1350 1400 1450 1500 1550 1600 1650
LC
C (
eu
ros)
Energy consumption kWh/year
LCC curve of reversible 7,1 kW unit50% heating
0% Electricity price increase
6,000 €
6,500 €
7,000 €
7,500 €
8,000 €
8,500 €
9,000 €
950 1000 1050 1100 1150 1200 1250 1300 1350 1400 1450 1500 1550 1600 1650
LC
C (
eu
ros)
Energy consumption kWh/year
LCC curve of reversible 7,1 kW unit50% heating
1% Electricity price increase
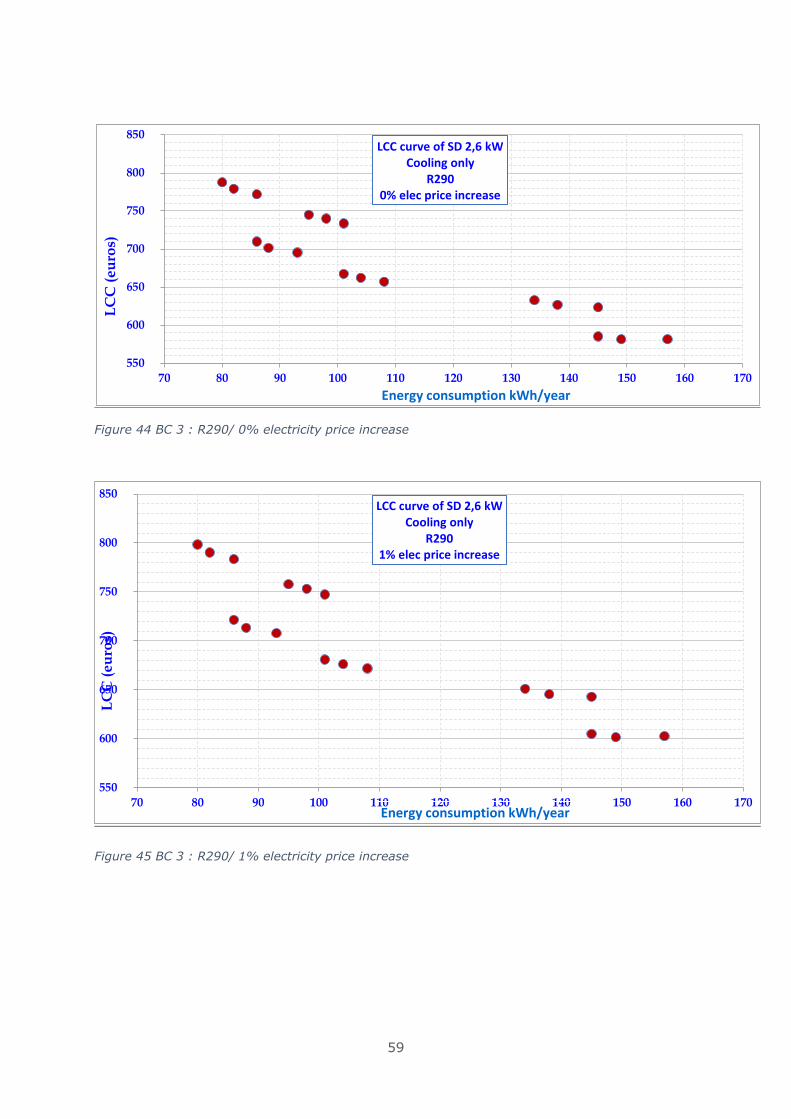
59
Figure 44 BC 3 : R290/ 0% electricity price increase
Figure 45 BC 3 : R290/ 1% electricity price increase
550
600
650
700
750
800
850
70 80 90 100 110 120 130 140 150 160 170
LC
C (
eu
ros)
Energy consumption kWh/year
LCC curve of SD 2,6 kW Cooling only
R2900% elec price increase
550
600
650
700
750
800
850
70 80 90 100 110 120 130 140 150 160 170
LC
C (
eu
ros)
Energy consumption kWh/year
LCC curve of SD 2,6 kW Cooling only
R2901% elec price increase
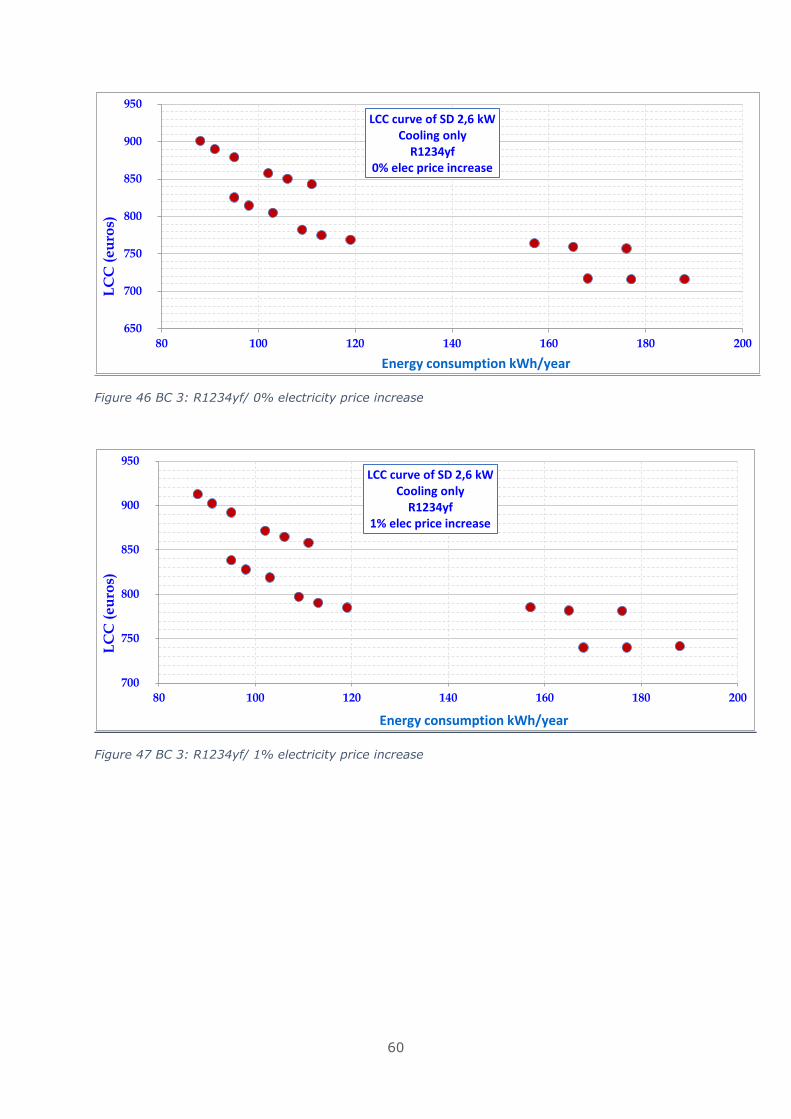
60
Figure 46 BC 3: R1234yf/ 0% electricity price increase
Figure 47 BC 3: R1234yf/ 1% electricity price increase
650
700
750
800
850
900
950
80 100 120 140 160 180 200
LC
C (
eu
ros)
Energy consumption kWh/year
LCC curve of SD 2,6 kW Cooling only
R1234yf0% elec price increase
700
750
800
850
900
950
80 100 120 140 160 180 200
LC
C (
eu
ros)
Energy consumption kWh/year
LCC curve of SD 2,6 kW Cooling only
R1234yf1% elec price increase

1
Review of Regulation 206/2012 and
626/2011
Air conditioners and comfort fans
Task 7 report
SCENARIOS
Final version
Date: May 2018

2
Prepared by:
Viegand Maagøe and ARMINES
Study team: Baijia Huang, Jan Viegand, Peter Martin Skov Hansen, Philippe Riviere
Quality manager: Jan Viegand
Website design and management: Viegand Maagøe A/S
Contract manager: Viegand Maagøe A/S
Prepared for:
European Commission
DG ENER C.3
Office: DM24 04/048
B-1049 Brussels, Belgium
Contact person: Veerle Beelaerts
E-mail: [email protected]
Project website: www.eco-airconditioners.eu
Specific contract no.: No. ENER/C3/FV 2016-537/03/FWC 2015-619
LOT2/01/SI2.749247
Implements Framework Contract: № ENER/C3/2015-619 LOT 2
This study was ordered and paid for by the European Commission, Directorate-General
for Energy.
As agreed with Policy Officer Veerle Beelaerts, some of the budget for data purchase was
reallocated for project work.
The information and views set out in this study are those of the author(s) and do not
necessarily reflect the official opinion of the Commission. The Commission does not
guarantee the accuracy of the data included in this study. Neither the Commission nor any
person acting on the Commission’s behalf may be held responsible for the use which may
be made of the information contained therein.
This report has been prepared by the authors to the best of their ability and knowledge.
The authors do not assume liability for any damage, material or immaterial, that may arise
from the use of the report or the information contained therein.
© European Union, May 2018.
Reproduction is authorised provided the source is acknowledged.
More information on the European Union is available on the internet (http://europa.eu).
Viegand Maagøe A/S
Nr. Farimagsgade 37
1364 Copenhagen K
Denmark
viegandmaagoe.dk
3
Table of contents List of tables ......................................................................................................... 4
List of figures ........................................................................................................ 6
Abbreviations ........................................................................................................ 8
Introduction to the task reports ............................................................................... 9
7 Introduction to Task 7 .....................................................................................11
7.1 Policy analysis ...........................................................................................11
7.1.1 Stakeholder consultation.......................................................................11
7.1.2 Barriers and opportunities for improvements ...........................................12
7.1.3 Policy options ......................................................................................13
7.1.4 Recommended policy measures .............................................................14
7.1.5 Metrics changes ...................................................................................23
7.1.6 Proposed tolerances and uncertainties ....................................................27
7.2 Scenario analysis.......................................................................................32
7.2.1 Before EU regulation – 0 scenario ..........................................................33
7.2.2 Business-as-Usual (BAU) - scenario 1 .....................................................35
7.2.3 Policy scenarios ...................................................................................39
7.3 Impact analysis for consumers and industry .................................................44
7.3.1 Consumer impacts ...............................................................................44
7.3.2 Industry impacts..................................................................................47
7.4 Sensitivity analysis ....................................................................................49
7.5 Comparison of air-to-air heat pumps and other heating products.....................50
7.6 Conclusions and recommendations ..............................................................50
Annex 1 – Comfort fans assessment ....................................................................60
Annex 2 – Policy scenarios assumptions ...............................................................69
Annex 3 – Tables and figures ..............................................................................70
4
List of tables Table 1: Proposed minimum efficiency requirements for air conditioners in a potential
revised ecodesign regulation ..................................................................................14
Table 2: Proposed new label schemes for SEER ........................................................17
Table 3: Proposed new label scheme for SCOP .........................................................18
Table 4: Proposed new label schemes for a combined label ........................................19
Table 5: Discussion on material efficiency improvements options presented in Task 4. ..21
Table 6: Alignment with other regulations ...............................................................22
Table 7: Measurement uncertainty calculation results for 6 split units of different sizes. 30
Table 8: Measurement uncertainty calculation results for 2 single duct units of different
sizes ...................................................................................................................31
Table 9: Summary of policy scenarios and brief descriptions ......................................33
Table 10: Development of SEER and SCOP of air conditioners sold - with no EU regulation
..........................................................................................................................33
Table 11: The annual energy consumption and emission of CO2-eq in scenario 0 (no
intervention from EU) ...........................................................................................34
Table 12: Development of SEER and SCOP with the current regulation ........................35
Table 13: The annual energy consumption and emission of CO2-eq in scenario 1 (current
regulation) ..........................................................................................................37
Table 14: The accumulated savings in energy and emission of CO2-eq in scenario 1
(effect of current regulation) compared to scenario 0 ................................................37
Table 15: Impacts of scenario 2 (1 tier eco) – Annual savings compared to scenario 1
(current regulation) in TWh, Primary energy and CO2-eq ...........................................43
Table 16: Impacts of scenario 3 (lbl) - Annual savings compared to scenario 1 (current
regulation) in TWh, Primary energy and CO2-eq .......................................................43
Table 17: Impacts of scenario 4 (eco+lbl) - Annual savings compared to scenario 1
(current regulation) in TWh, Primary energy and CO2-eq ...........................................43
Table 18: Total annual consumer expenditures in absolute values and annual savings
compared with 1 BAU current regulation..................................................................47
Table 19: Assumptions to model to industry impacts. ................................................47
Table 20: The calculated impacts of higher levels of recycling and the effect of higher
leakage. ..............................................................................................................49
Table 21: Summary of policy scenarios and brief descriptions ....................................51
Table 22: Proposed minimum efficiency requirements for air conditioners in a potential
revised ecodesign regulation ..................................................................................51
Table 23: Proposed new label schemes for SEER ......................................................52
Table 24: Proposed new label scheme for SCOP .......................................................52
Table 25: Proposed new label schemes for a combined label ......................................53
Table 26: The annual electricity consumption, emission of CO2-eq and associated savings
in 2030 ...............................................................................................................54
Table 27: The annual electricity consumption, emission of CO2-eq and associated savings
in 2040 ...............................................................................................................55
Table 28: Prodcom categories covering products relevant for this study. .....................60
Table 29: Suggested minimum requirements in the preparatory study ........................66
Table 30: LLCC and BAT for different types of comfort fans - based on the preparatory
study ..................................................................................................................66
Table 31: Assumptions in all scenarios ....................................................................69
Table 32: Development of SEER and SCOP average sales values in the different
scenarios. ............................................................................................................70
5
Table 33: Impacts of scenario 0 (before regulation) - TWh, Primary energy and CO2-eq in
absolute values ....................................................................................................71
Table 34: Impacts of scenario 1 (current regulation) - TWh, Primary energy and CO2-eq
in absolute values .................................................................................................71
Table 35: Impacts of scenario 2 (1 tier eco) - TWh, Primary energy and CO2-eq in
absolute values ....................................................................................................72
Table 36: Impacts of scenario 3 (lbl) - TWh, Primary energy and CO2-eq in absolute
values .................................................................................................................72
Table 37: Impacts of scenario 4 (eco+lbl) - TWh, Primary energy and CO2-eq in absolute
values .................................................................................................................72
Table 38: The accumulated savings in energy and emission of CO2-eq of the policy
options compared to the current regulation (scenario 1) ............................................73
Table 39: Development in purchase price per unit in absolute values ..........................74
Table 40: Annual consumer purchase costs of air conditioners in absolute values .........74
Table 41: Annual consumer electricity costs in absolute values ...................................75
Table 42: Annual installation and maintenance costs in absolute values ......................75
Table 43: Industry impacts - Manufacturer turnover (Mln EUR) ..................................75
Table 44: Industry impacts - Manufacture total personnel (Persons) ...........................76
Table 45: Industry impacts - OEM total personnel (Persons) ......................................76
Table 46: Industry impacts - OEM total personnel – EU (Persons) ...............................76
Table 47: Industry impacts - Wholesaler turnover (Mln EUR) .....................................76
Table 48: Industry impacts - Wholesaler total personnel (Persons) ............................77
Table 49: The calculated impacts of higher levels of recycling and the effect of higher
leakage in absolute values. ....................................................................................77
6
List of figures Figure 1: Current minimum efficiency requirement set by Regulation 206/2012 ...........15
Figure 2 Current energy efficiency classes for air conditioners other than single and
double ducts set by Regulation 626/2011 ................................................................16
Figure 3: Current energy efficiency classes for single and double ducts set by Regulation
626/2011 ............................................................................................................17
Figure 4: Example of proposed energy label for single and double duct units (not final
revised label), example of expressing sound power level in a scale of A-G (middle), and
example of sound power level expressed by pictograms of sound waves used by tyre
labels (left). .........................................................................................................18
Figure 5: ECC directory 2006, air conditioners below 12 kW, sound power level of indoor
unit in cooling mode .............................................................................................34
Figure 6: ECC directory 2006, air conditioners below 12 kW, sound power level of
outdoor unit in cooling mode ..................................................................................35
Figure 7: Comparison of the annual energy consumption of scenario 0 and scenario 1. .36
Figure 8: Comparison of the annual emission of CO2-eq in scenario 0 and scenario 1. ...36
Figure 9: Comparison of the indoor sound power level in 2006 (blue dots and) and 2016
(Green dots) ........................................................................................................38
Figure 10: Comparison of the outdoor sound power level in 2006 (blue dots and) and
2016 (Green dots) ................................................................................................38
Figure 11: Comparison of the SEER development for BC1 in all scenarios ....................39
Figure 12: Comparison of the SEER development for B2 in all scenarios ......................39
Figure 13: Comparison of the SEER development for BC3 in all scenarios ....................40
Figure 14: Comparison of the SCOP development for BC1 in all scenarios ....................40
Figure 15: Comparison of the SCOP development for BC2 in all scenarios ....................41
Figure 16: Comparison of the annual energy consumption of three base cases in all
scenarios .............................................................................................................42
Figure 17: Comparison of the annual emission of CO2-eq of three base cases in all
scenarios .............................................................................................................42
Figure 18: The accumulated savings in electricity (TWh) and emission of CO2-eq of the
policy options compared to the current regulation (scenario 1) ...................................44
Figure 19: The accumulated savings in emissions of CO2-eq of the policy options
compared to the current regulation (scenario 1) .......................................................44
Figure 20: Annual consumer purchase costs of air conditioners in absolute values ........45
Figure 21: Annual consumer electricity costs in absolute values .................................46
Figure 22: Total annual consumer expenditures in absolute values .............................46
Figure 23: Industry turnover per year for different policy scenarios ............................48
Figure 24: Number of personnel in air conditioner industry for different policy scenarios49
Figure 25: Total production, import and export quantity of comfort fans below 125 W
2009-2015. PRODCOM assessed April 2017. ............................................................61
Figure 26: Total EU sales and trading of comfort fans below 125 W 2009-2015.
PRODCOM assessed April 2017. ..............................................................................61
Figure 27: Comparison of EU sales and trading of comfort fans below 125 W 2009-2015
of current PRODCOM data (assessed April 2017) and expected sales and trades from the
preparatory study .................................................................................................62
Figure 28: Assumed stock development - preparatory study ......................................62
Figure 29: Types of comfort fans - assumption from the preparatory study ..................63
Figure 30: Spread in wattage and service values of comfort fans ................................64
Figure 31: Spread in service values of the different types of comfort fans ....................64
7
Figure 32: LLCC from the preparatory study and current service value. .......................67
Figure 33: Comparison of impacts of the different scenarios – Primary energy (PJ) in
absolute values ....................................................................................................70
Figure 34: Comparison of impacts of the different scenarios – Emission of CO2 (Mt) in
absolute values ....................................................................................................71
Figure 35: The accumulated savings in primary energy (PJ)of the policy options
compared to the current regulation (scenario 1) .......................................................73
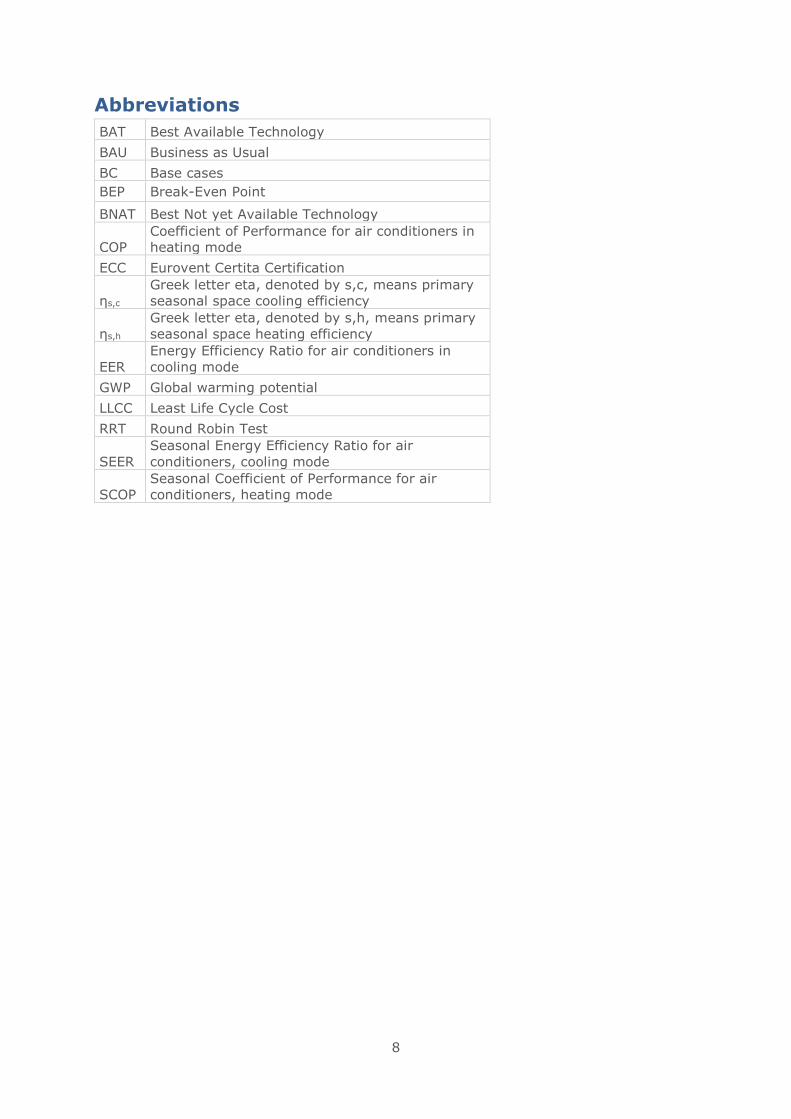
8
Abbreviations
BAT Best Available Technology
BAU Business as Usual
BC Base cases
BEP Break-Even Point
BNAT Best Not yet Available Technology
COP
Coefficient of Performance for air conditioners in
heating mode
ECC Eurovent Certita Certification
ηs,c
Greek letter eta, denoted by s,c, means primary
seasonal space cooling efficiency
ηs,h
Greek letter eta, denoted by s,h, means primary
seasonal space heating efficiency
EER
Energy Efficiency Ratio for air conditioners in
cooling mode
GWP Global warming potential
LLCC Least Life Cycle Cost
RRT Round Robin Test
SEER
Seasonal Energy Efficiency Ratio for air
conditioners, cooling mode
SCOP
Seasonal Coefficient of Performance for air
conditioners, heating mode
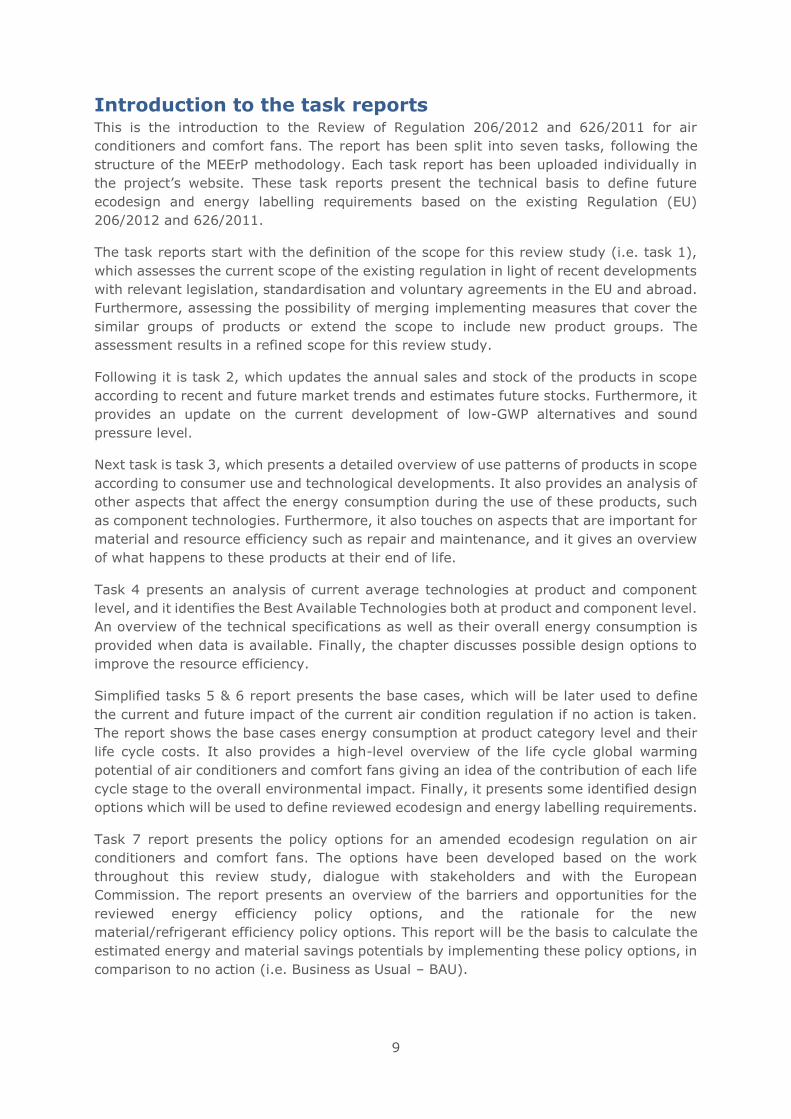
9
Introduction to the task reports This is the introduction to the Review of Regulation 206/2012 and 626/2011 for air
conditioners and comfort fans. The report has been split into seven tasks, following the
structure of the MEErP methodology. Each task report has been uploaded individually in
the project’s website. These task reports present the technical basis to define future
ecodesign and energy labelling requirements based on the existing Regulation (EU)
206/2012 and 626/2011.
The task reports start with the definition of the scope for this review study (i.e. task 1),
which assesses the current scope of the existing regulation in light of recent developments
with relevant legislation, standardisation and voluntary agreements in the EU and abroad.
Furthermore, assessing the possibility of merging implementing measures that cover the
similar groups of products or extend the scope to include new product groups. The
assessment results in a refined scope for this review study.
Following it is task 2, which updates the annual sales and stock of the products in scope
according to recent and future market trends and estimates future stocks. Furthermore, it
provides an update on the current development of low-GWP alternatives and sound
pressure level.
Next task is task 3, which presents a detailed overview of use patterns of products in scope
according to consumer use and technological developments. It also provides an analysis of
other aspects that affect the energy consumption during the use of these products, such
as component technologies. Furthermore, it also touches on aspects that are important for
material and resource efficiency such as repair and maintenance, and it gives an overview
of what happens to these products at their end of life.
Task 4 presents an analysis of current average technologies at product and component
level, and it identifies the Best Available Technologies both at product and component level.
An overview of the technical specifications as well as their overall energy consumption is
provided when data is available. Finally, the chapter discusses possible design options to
improve the resource efficiency.
Simplified tasks 5 & 6 report presents the base cases, which will be later used to define
the current and future impact of the current air condition regulation if no action is taken.
The report shows the base cases energy consumption at product category level and their
life cycle costs. It also provides a high-level overview of the life cycle global warming
potential of air conditioners and comfort fans giving an idea of the contribution of each life
cycle stage to the overall environmental impact. Finally, it presents some identified design
options which will be used to define reviewed ecodesign and energy labelling requirements.
Task 7 report presents the policy options for an amended ecodesign regulation on air
conditioners and comfort fans. The options have been developed based on the work
throughout this review study, dialogue with stakeholders and with the European
Commission. The report presents an overview of the barriers and opportunities for the
reviewed energy efficiency policy options, and the rationale for the new
material/refrigerant efficiency policy options. This report will be the basis to calculate the
estimated energy and material savings potentials by implementing these policy options, in
comparison to no action (i.e. Business as Usual – BAU).

10
The task reports follow the MEErP methodology, with some adaptations which suit the
study goals.
11
7 Introduction to Task 7 In task 7, a number of policy scenarios will be established based on the analyses and
stakeholder consultations. Task 7 presents the ecodesign and energy labelling
requirements, both for energy efficiency and for material efficiency. The focus will be on
updating the existing regulations in terms of updating requirements and possible new
requirements, e.g. energy efficiency, the use of low-GWP refrigerants, etc. Moreover,
feasibility of policy options that address durability, reparability, disassembly and
recyclability is analysed.
The scenarios together with a Business-As-Usual scenario is modelled for the period from
2015 until 2030, including sensitivity analyses.
The task is concluded with a summary of the work undertaken in Task 7, with an overview
of both positive and negative impacts related to each policy scenario as well as a set of
recommendations.
This task report includes the following:
1. Overview of the barriers and opportunities for the suggested policy measures, focusing
on ecodesign energy requirements and energy labelling.
2. Definition of proposed scope for ecodesign and energy labelling requirements.
3. Definition of policy measures for energy requirements, including timing and target
levels.
4. Definition of material efficiency requirements, including the rationale for defining these
requirements.
5. Scenario analyses presenting the effect of implementing the energy requirements.
6. Sensitivity analyses of the main parameters in the scenario analysis.
7.1 Policy analysis
According to MEErP and based on the results of the policy analysis, a (package of) policy
instrument(s) should be selected and the impacts of the policy scenario(s) should be
assessed on the energy system, the end-user and on industry in comparison with the
impacts of the BAU scenario.
7.1.1 Stakeholder consultation
Stakeholders have been contacted and consulted from the very beginning of the study.
Various industry stakeholders have supplied technical specifications of current average
products, best available product on the market and best available technology (BAT).
Consultation on material efficiency has also been carried out to assess the feasibility and
needs for ecodesign policy interventions. Detailed market data and prices have been
purchased from market intelligence company such as GfK1 and BSRIA2, and much of the
analysis regarding efficiencies, sound power level, other technical parameters are based
on the datasets from Eurovent Certita Certification (ECC3). The analysis of efficiencies is
1 www.gfk.com 2 https://www.bsria.co.uk 3 http://www.eurovent-certification.com/. ECC is a certification company and includes a certification program for less than 12 kW air conditioners. ECC is the only public source in Europe to find technical information on a large number of products. The less than 12 kW certification program gathers 22 manufacturers, including all major brands; all their products have to be certified (this represented about 2200 models as per November
12
updated with datasets received from industry stakeholders after the second stakeholder
meeting to make sure the result is based on sales weighted data to be more representative
of the market.
After two stakeholder meetings, many industry stakeholders, NGOs, member states and
consumer organisations have submitted comments and suggestions to the study, most of
which have been taken into consideration or incorporated.
7.1.2 Barriers and opportunities for improvements
This subsection describes briefly the barriers and opportunities for improvements
environmental impact, as well as opportunities for a revised Ecodesign measure.
Task 1 – 4 has shown that the current ecodesign and energy labelling regulations on air
conditioners and comfort fans can be improved.
Scope coverage of current regulations for certain product group is blurry and to avoid
loophole and ensure consistency with other regulations, the scope is recommended to
extend to cover ventilation exhaust air conditioners and air to air heat pumps.
Low power modes power consumption and hours have been reviewed and it is shown that
there is improvement potential to achieve lower power consumption in standby/off modes,
thermostat-off mode and crankcase heater mode. The potential has not been realised by
the industry due to the limited impact the consumption in each mode has on the overall
efficiency calculation for SEER and SCOP. An opportunity for revised ecodesign measure is
to propose to revise the weighting of the low power modes in the metrics, in order to create
a greater incentive for manufacturers to reduce the power consumption. This is also
identified as one of the improvement options to achieve higher efficiency in Task 6.
Assessment of existing average product and best available technology (BAT) shows that
there is still potential for higher efficiency of heating and cooling for fixed air conditioners
and of cooling by portable air conditioners. Least Life Cycle Cost (LLCC) assessment
revealed that the LLCC option is close to the base case, as the LCC of a few different options
are quite close to each other and the largest saving potential has already been achieved
with current regulation due to the technology of inverter. The BNAT option shows the long-
term potential, which is significant in comparison with LLCC option, although with the
current cost for improvement, it is not the most economical option. However, this shows
the level of achievable technology that could be used to set as a goal or a pulling force in
the form of energy class scale.
To balance the energy efficiency and sound power level is crucial, for fixed air conditioners
in the range of 6 – 12 kW capacity, there is a slight potential to lower the maximum sound
power level requirement, whereas other air conditioners have no margin to achieve lower
sound power at the same time achieve a higher minimum efficiency requirement as
proposed.
To be able to better compare single and double duct air conditioners with others, it is
suggested to split double duct air conditioners in two distinct categories, fix and portable
products; indeed, fix double duct air conditioners in fact compete with split air conditioners,
while portable double duct compete with single duct air conditioners. In addition, for
portable air conditioners and heat pumps, there should be a seasonal performance metrics,
2016); representativeness is believed to be high: about 80 % of products sold in Europe according to the Preparatory study.
13
and there should be a test method that includes the infiltration air flow in the measurement.
This would ensure better consumer understanding of the energy label which does not make
a distinction between single/double duct air conditioners and others, and reports a more
realistic performance at the same discourage consumers to use thermodynamic heating
with single duct products. More details in section 7.1.5.
7.1.3 Policy options
There are several product policy instruments available, which could be used to regulate air
conditioners and comfort fans. Given that there are already ecodesign and energy labelling
regulation for these products, the focus of policy options is easily identified. The basic types
of policy instruments as presented below:
1) No action option – Business as usual (BAU), the current regulations are to be
retained as they are. The first overall decision to be made is whether there is a need
for further EU intervention. This BAU scenario will be used as reference for
comparison with other policy scenarios.
2) Ecodesign requirements (under the Ecodesign Directive (2009/125/EC)): This
means mandatory minimum requirements would be introduced for a set of
parameters, the manufacturers would bear the responsibility for their products to
be compliant when placed on the market and the Member States would verify
compliance via market surveillance activities. This acts as a “push” instrument for
products to achieve better performance because all appliances will have a minimum
level of energy efficiency performance regulated by the implementing measure.
Since there is already Ecodesign regulation No 206/2012 for air conditioners and
comfort fans, this policy option will be analysed in one or more scenarios with newly
proposed requirements in this review study.
3) Energy labelling (under the Energy Labelling Regulation (2017/1369/EU)4): This
implies mandatory labelling of the product for a set of parameters. Manufacturers
are responsible for labelling their products and it is also enforced by Member State
market surveillance. This acts as a “pull” instrument because the consumers will
choose the products they want to purchase which can pull the market towards
higher energy performance. Since there is already Energy Labelling regulation No
626/2011, this policy option will be analysed in one or more scenarios with newly
proposed requirements and energy class scale.
4) Self-regulation as an alternative to Ecodesign requirements: The Ecodesign
Directive (2009/125/EC) recognizes self-regulation by industry as an alternative to
binding legislation. Self-regulation, which can be based on voluntary agreements,
is a valid alternative as long as it delivers the policy objectives set out in the
legislation faster and in a less costly manner than mandatory requirements. The
directive gives specific requirements for self-regulative measures. This option was
already discarded since preparatory study as there have been established ecodesign
and energy labelling regulations since.
5) Voluntary labelling implies manufacturers can choose whether to label their
products. In the case of ENERGY STAR 5 and Ecolabel 6 , the specifications are
established through regulations, ensuring that the labelled product belongs to the
4 Regulation (EU) 2017/1369 of the European Parliament and of the Council of 4 July 2017 setting a framework for energy labelling and repealing Directive 2010/30/EU 5 Regulation (EC) No 106/2008 of the European Parliament and of the Council of 15 January 2008 on a Community energy-efficiency labelling programme for office equipment (recast version) 6 Regulation (EC) No 66/2010 of the European Parliament and of the Council of 25 November 2009 on the EU Ecolabel
14
upper segment of the market in terms of energy consumption and other
environmental aspects. Member States are responsible for market surveillance. The
US ENERGY STAR covers air conditioners, but it is not in scope of the EU-US ENERGY
STAR agreement (covers only office equipment). However, EU Regulation
66/2010/EC7 for EU Ecolabel already covers air conditioners under heat pumps8,
therefore this policy option will not be further analysed in detail.
In conclusion, policy options 1, 2 and 3 will be analysed further in the later sections of this
task.
7.1.4 Recommended policy measures
In this section, policy measures assessed in previous section as feasible options are
selected for further analysis, including timing and target levels. In the following subsection,
the discussions include whether there should be revised ecodesign requirements, such as
minimum (or maximum) requirements, and whether it should be complemented with
revised energy labelling schemes, needs for new standards to be developed as well as the
existing measurement standards that could be used and lastly possibility of setting material
efficiency requirements and information requirements on installation of the product or
other user information.
7.1.4.1 Ecodesign requirements
LLCC identified in the Task 6 and used for setting the immediate minimum requirement for
ecodesign.
For portable air conditioners, it is also recommended to set minimum ecodesign
requirements based on seasonal performance metrics (SEER and SCOP) for portable air
conditioners as well using the proposed metrics as transitional method.
It is proposed the following ecodesign requirements and timing:
• Tier 1: from 2021, minimum efficiency requirement with one tier based on BC:
o LLCC for BC 1 (BC): SEER= 6.0, SCOP= 4.0, LCC = 3521€
o LLCC for BC 2 ((10% UA cond): SEER= 5.5, SCOP= 3.9, LCC = 6391€
o LLCC for BC 3 (HE1): SEER= 2.3, LCC = 602€, 9 years of payback time
See proposed ecodesign minimum efficiency requirements summarised in the table below.
Table 1: Proposed minimum efficiency requirements for air conditioners in a potential revised
ecodesign regulation
Tier 1, January 2023
SEER SCOP
Other than portable, < 6 kW 6 4
Other than portable, 6 – 12 kW 5.5 3.9
Portable 2.3 -
As seen in the table, it is the opinion of the study team that no SCOP minimum requirement
should be proposed for single and double duct air conditioners at this time. It is proposed
to start the development of a new standard in line with EN14825 plus infiltrations (with
default values if required). With this potential new standard in place, double duct products
will have to be improved to stay on the market to compete with performance of other
products. It is proposed that the single ducts would not be allowed to operate in
7 http://eur-lex.europa.eu/LexUriServ/LexUriServ.do?uri=OJ:L:2010:027:0001:0019:en:PDF 8 http://ec.europa.eu/environment/ecolabel/eu-ecolabel-products-and-services.html
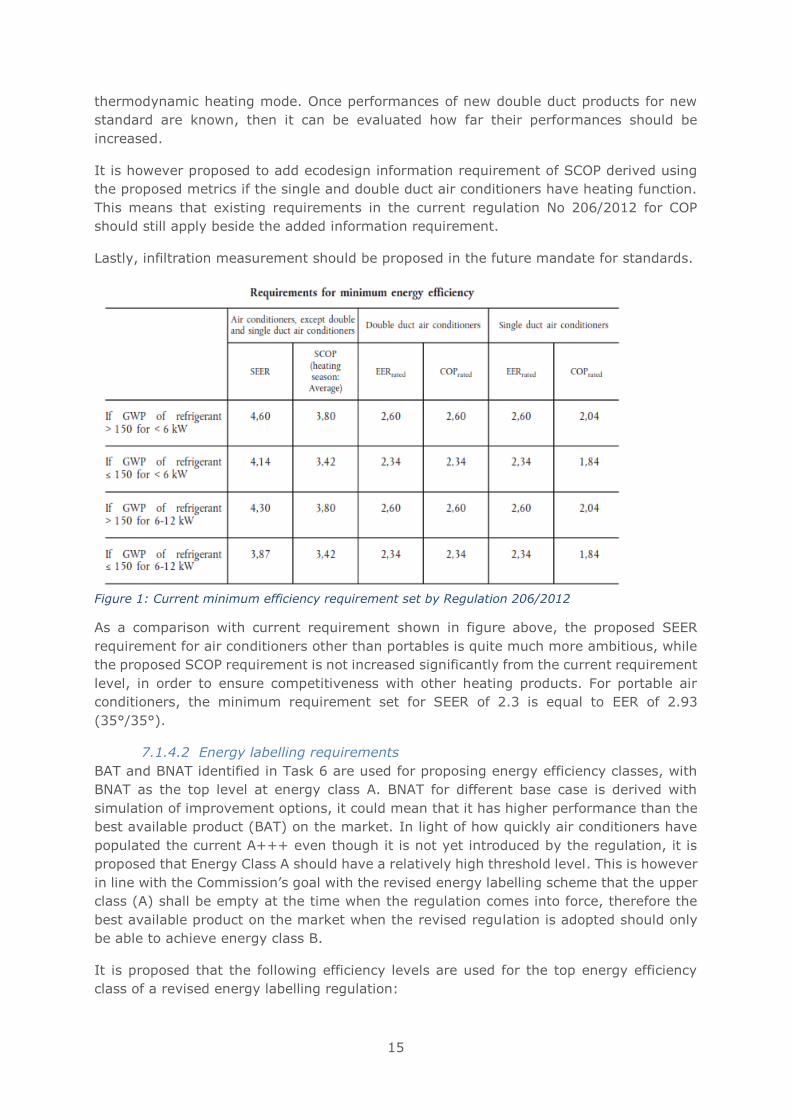
15
thermodynamic heating mode. Once performances of new double duct products for new
standard are known, then it can be evaluated how far their performances should be
increased.
It is however proposed to add ecodesign information requirement of SCOP derived using
the proposed metrics if the single and double duct air conditioners have heating function.
This means that existing requirements in the current regulation No 206/2012 for COP
should still apply beside the added information requirement.
Lastly, infiltration measurement should be proposed in the future mandate for standards.
Figure 1: Current minimum efficiency requirement set by Regulation 206/2012
As a comparison with current requirement shown in figure above, the proposed SEER
requirement for air conditioners other than portables is quite much more ambitious, while
the proposed SCOP requirement is not increased significantly from the current requirement
level, in order to ensure competitiveness with other heating products. For portable air
conditioners, the minimum requirement set for SEER of 2.3 is equal to EER of 2.93
(35°/35°).
7.1.4.2 Energy labelling requirements
BAT and BNAT identified in Task 6 are used for proposing energy efficiency classes, with
BNAT as the top level at energy class A. BNAT for different base case is derived with
simulation of improvement options, it could mean that it has higher performance than the
best available product (BAT) on the market. In light of how quickly air conditioners have
populated the current A+++ even though it is not yet introduced by the regulation, it is
proposed that Energy Class A should have a relatively high threshold level. This is however
in line with the Commission’s goal with the revised energy labelling scheme that the upper
class (A) shall be empty at the time when the regulation comes into force, therefore the
best available product on the market when the revised regulation is adopted should only
be able to achieve energy class B.
It is proposed that the following efficiency levels are used for the top energy efficiency
class of a revised energy labelling regulation:
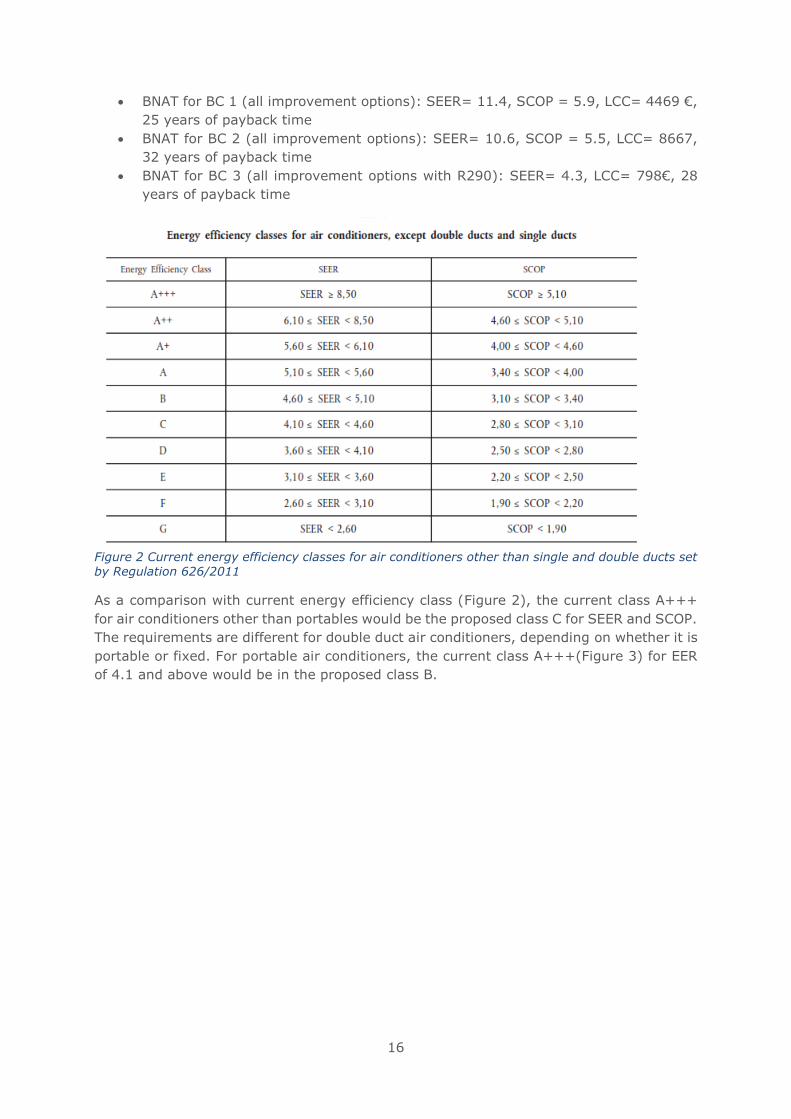
16
• BNAT for BC 1 (all improvement options): SEER= 11.4, SCOP = 5.9, LCC= 4469 €,
25 years of payback time
• BNAT for BC 2 (all improvement options): SEER= 10.6, SCOP = 5.5, LCC= 8667,
32 years of payback time
• BNAT for BC 3 (all improvement options with R290): SEER= 4.3, LCC= 798€, 28
years of payback time
Figure 2 Current energy efficiency classes for air conditioners other than single and double ducts set by Regulation 626/2011
As a comparison with current energy efficiency class (Figure 2), the current class A+++
for air conditioners other than portables would be the proposed class C for SEER and SCOP.
The requirements are different for double duct air conditioners, depending on whether it is
portable or fixed. For portable air conditioners, the current class A+++(Figure 3) for EER
of 4.1 and above would be in the proposed class B.
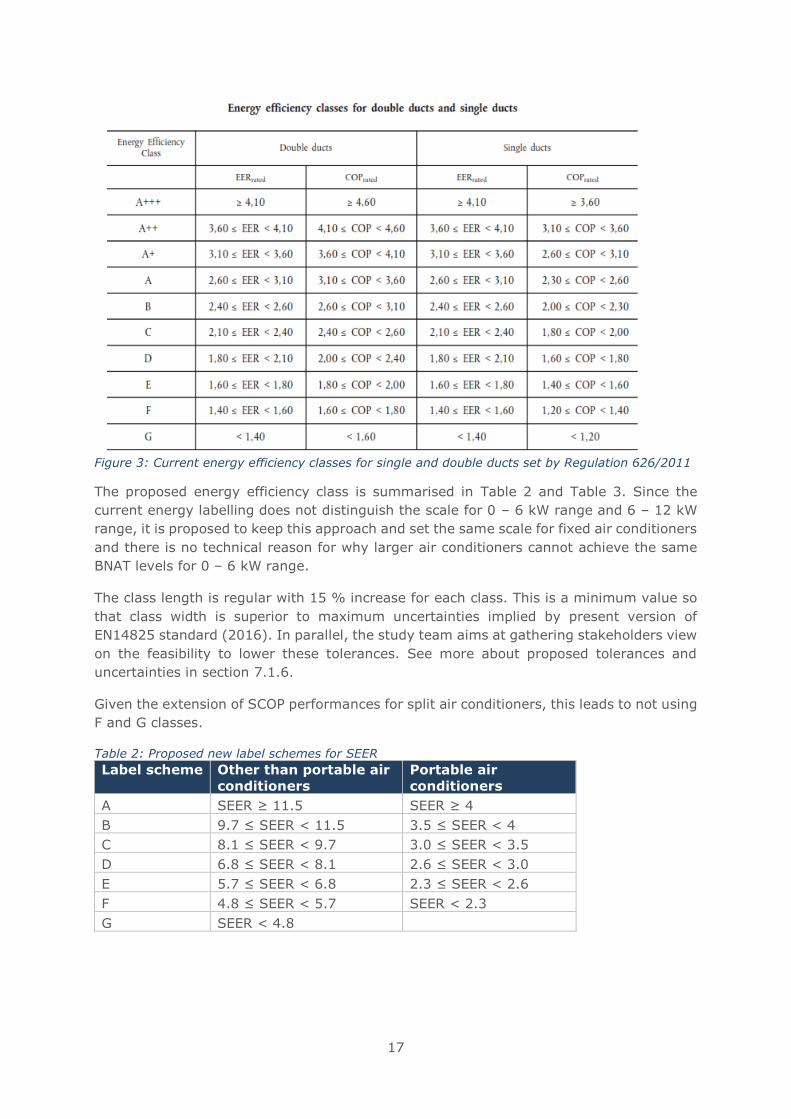
17
Figure 3: Current energy efficiency classes for single and double ducts set by Regulation 626/2011
The proposed energy efficiency class is summarised in Table 2 and Table 3. Since the
current energy labelling does not distinguish the scale for 0 – 6 kW range and 6 – 12 kW
range, it is proposed to keep this approach and set the same scale for fixed air conditioners
and there is no technical reason for why larger air conditioners cannot achieve the same
BNAT levels for 0 – 6 kW range.
The class length is regular with 15 % increase for each class. This is a minimum value so
that class width is superior to maximum uncertainties implied by present version of
EN14825 standard (2016). In parallel, the study team aims at gathering stakeholders view
on the feasibility to lower these tolerances. See more about proposed tolerances and
uncertainties in section 7.1.6.
Given the extension of SCOP performances for split air conditioners, this leads to not using
F and G classes.
Table 2: Proposed new label schemes for SEER
Label scheme Other than portable air
conditioners
Portable air
conditioners
A SEER ≥ 11.5 SEER ≥ 4
B 9.7 ≤ SEER < 11.5 3.5 ≤ SEER < 4
C 8.1 ≤ SEER < 9.7 3.0 ≤ SEER < 3.5
D 6.8 ≤ SEER < 8.1 2.6 ≤ SEER < 3.0
E 5.7 ≤ SEER < 6.8 2.3 ≤ SEER < 2.6
F 4.8 ≤ SEER < 5.7 SEER < 2.3
G SEER < 4.8
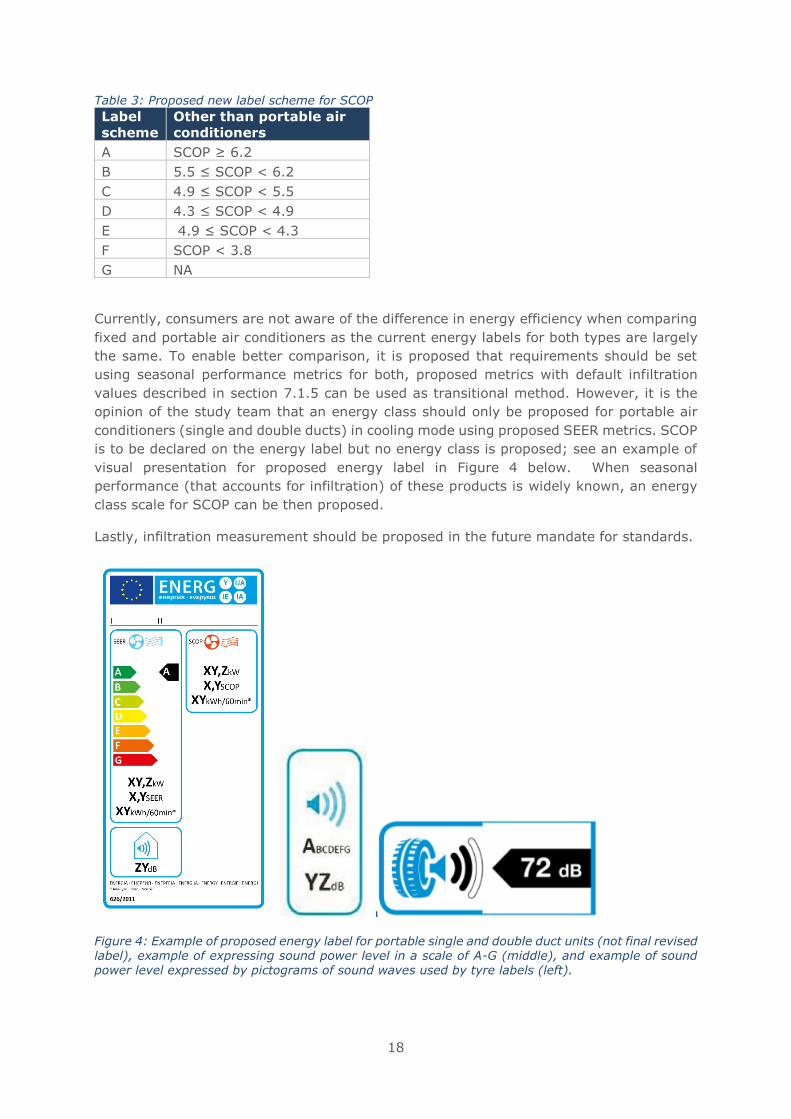
18
Table 3: Proposed new label scheme for SCOP
Label
scheme
Other than portable air
conditioners
A SCOP ≥ 6.2
B 5.5 ≤ SCOP < 6.2
C 4.9 ≤ SCOP < 5.5
D 4.3 ≤ SCOP < 4.9
E 4.9 ≤ SCOP < 4.3
F SCOP < 3.8
G NA
Currently, consumers are not aware of the difference in energy efficiency when comparing
fixed and portable air conditioners as the current energy labels for both types are largely
the same. To enable better comparison, it is proposed that requirements should be set
using seasonal performance metrics for both, proposed metrics with default infiltration
values described in section 7.1.5 can be used as transitional method. However, it is the
opinion of the study team that an energy class should only be proposed for portable air
conditioners (single and double ducts) in cooling mode using proposed SEER metrics. SCOP
is to be declared on the energy label but no energy class is proposed; see an example of
visual presentation for proposed energy label in Figure 4 below. When seasonal
performance (that accounts for infiltration) of these products is widely known, an energy
class scale for SCOP can be then proposed.
Lastly, infiltration measurement should be proposed in the future mandate for standards.
Figure 4: Example of proposed energy label for portable single and double duct units (not final revised label), example of expressing sound power level in a scale of A-G (middle), and example of sound power level expressed by pictograms of sound waves used by tyre labels (left).
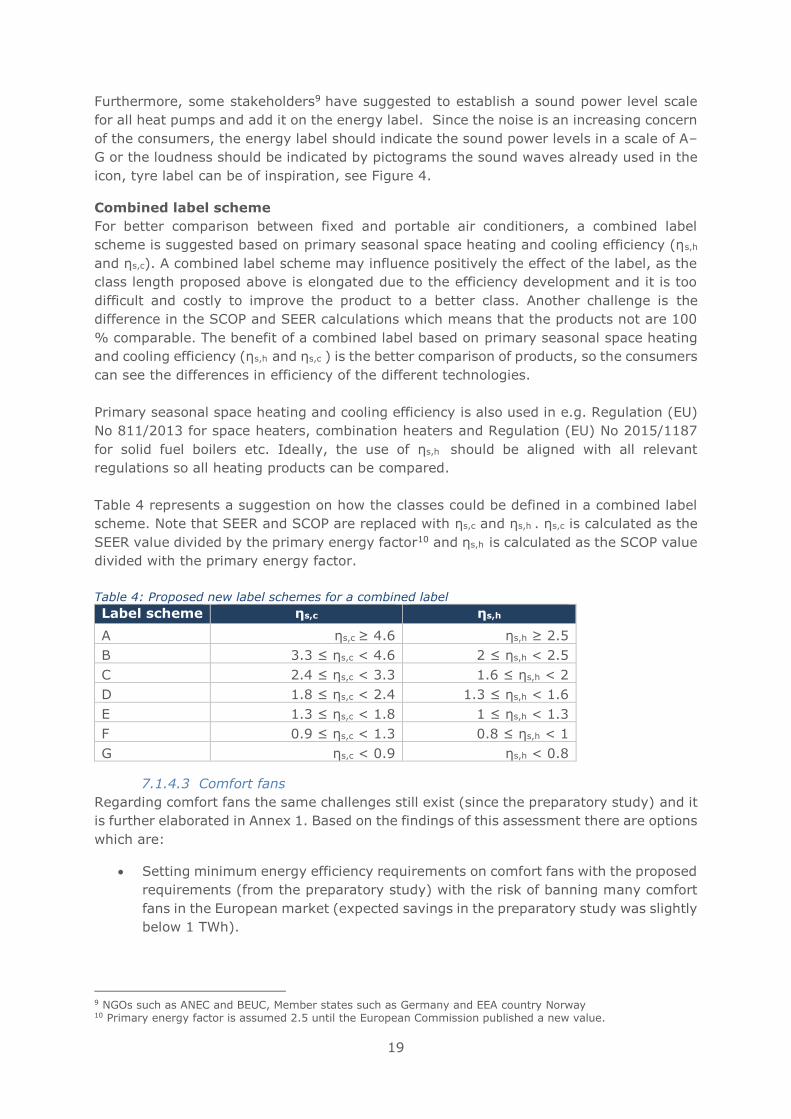
19
Furthermore, some stakeholders9 have suggested to establish a sound power level scale
for all heat pumps and add it on the energy label. Since the noise is an increasing concern
of the consumers, the energy label should indicate the sound power levels in a scale of A–
G or the loudness should be indicated by pictograms the sound waves already used in the
icon, tyre label can be of inspiration, see Figure 4.
Combined label scheme
For better comparison between fixed and portable air conditioners, a combined label
scheme is suggested based on primary seasonal space heating and cooling efficiency (ηs,h
and ηs,c). A combined label scheme may influence positively the effect of the label, as the
class length proposed above is elongated due to the efficiency development and it is too
difficult and costly to improve the product to a better class. Another challenge is the
difference in the SCOP and SEER calculations which means that the products not are 100
% comparable. The benefit of a combined label based on primary seasonal space heating
and cooling efficiency (ηs,h and ηs,c ) is the better comparison of products, so the consumers
can see the differences in efficiency of the different technologies.
Primary seasonal space heating and cooling efficiency is also used in e.g. Regulation (EU)
No 811/2013 for space heaters, combination heaters and Regulation (EU) No 2015/1187
for solid fuel boilers etc. Ideally, the use of ηs,h should be aligned with all relevant
regulations so all heating products can be compared.
Table 4 represents a suggestion on how the classes could be defined in a combined label
scheme. Note that SEER and SCOP are replaced with ηs,c and ηs,h . ηs,c is calculated as the
SEER value divided by the primary energy factor10 and ηs,h is calculated as the SCOP value
divided with the primary energy factor.
Table 4: Proposed new label schemes for a combined label
Label scheme ηs,c ηs,h
A ηs,c ≥ 4.6 ηs,h ≥ 2.5
B 3.3 ≤ ηs,c < 4.6 2 ≤ ηs,h < 2.5
C 2.4 ≤ ηs,c < 3.3 1.6 ≤ ηs,h < 2
D 1.8 ≤ ηs,c < 2.4 1.3 ≤ ηs,h < 1.6
E 1.3 ≤ ηs,c < 1.8 1 ≤ ηs,h < 1.3
F 0.9 ≤ ηs,c < 1.3 0.8 ≤ ηs,h < 1
G ηs,c < 0.9 ηs,h < 0.8
7.1.4.3 Comfort fans
Regarding comfort fans the same challenges still exist (since the preparatory study) and it
is further elaborated in Annex 1. Based on the findings of this assessment there are options
which are:
• Setting minimum energy efficiency requirements on comfort fans with the proposed
requirements (from the preparatory study) with the risk of banning many comfort
fans in the European market (expected savings in the preparatory study was slightly
below 1 TWh).
9 NGOs such as ANEC and BEUC, Member states such as Germany and EEA country Norway 10 Primary energy factor is assumed 2.5 until the European Commission published a new value.
20
• Enforcing better market surveillance on the current information requirement and
gathering accurate information on comfort fan efficiency and test methods through
a complementary study/efficiency tests with corresponding costs.
7.1.4.4 Material efficiency requirement
Material efficiency requirements are very difficult to model, as the material efficiency is
dependent on the waste handling system. This system can change due to commodity prices
which potentially can change the business model of shredders. If the commodity prices are
subject to a significant increase the recycling may be improved due to improved economic
incentive and vice versa. As long as the preferred recycling option is shredding all
suggestions regarding improved disassembly are not reasonable regarding improvement
in recycling rates. The affordability of repair could be improved due to design for
disassembly, but manufactures have indicated that they already are targeting to improve
the reparability so they do not believe that there is a need to include these requirements.
This was supported by exploded views of appliances where it was visible that the assembly
was proportionate simple and parts like the PCBs was easily reachable, see Table 5 for
more detail. Furthermore, air conditioners already have to comply with the requirements
in the WEEE directive, but the transposition of the directive is different in Member state.
Another challenge is the End-of-Life shredding if air conditioners are mixed with other types
of appliances (E.g. refrigerators). Then the impact of material requirements (e.g.
requirements of the type of plastic used for the casing) will be reduced as air conditioners
are mixed with other products containing different materials and the risk of contamination
will increase. To improve the recycling rate of air conditioners the best solution is to make
horizontal requirements of product families so products that are recycled together consist
of compatible materials. Another solution is to improve the recycling facilities by investing
in improved sorting technologies or new technologies such as carbon capture
technologies 11 . Carbon capture technologies can in the future use CO2 (e.g. from
combustion of plastic) as a feedstock for polymers.
Opportunities for setting material efficiency requirements in ecodesign exist, however
without the appropriate assessment tool the impacts of any requirements cannot be
properly assessed. EcoReport tool can assess the impacts of the amount of raw materials
used, the percentage of mass fraction at end of life is reused, recycled or utilised for heat
recovery. Nevertheless, the EcoReport tool focuses mainly on energy and CO2-related
indicators, with the significant use phase energy consumption, any impacts of potential
material efficiency requirement are in comparison very small, in Task 5 it was also
concluded that the use phase related to the highest impacts due to the high energy
consumption. In addition, the environmental impacts of improving material efficiency
cannot be properly assessed as it is expected to have greater influence on other
environmental indicators not included in EcoReport Tool such as abiotic depletion.
Industry stakeholder implied that material efficiency requirements would have very little
impact as air conditioners are assembled and designed with repair and maintenance in
mind, and unlikely to affect the recycling process for air conditioners, as most of the
household appliances are shredded. In the sensitivity analyses in section 7.4, the potential
impacts of increasing the recycling rate to maximum are calculated and the results shows
little significance.
11 https://setis.ec.europa.eu/setis-reports/setis-magazine/carbon-capture-utilisation-and-storage/co2-feedstock-polymers
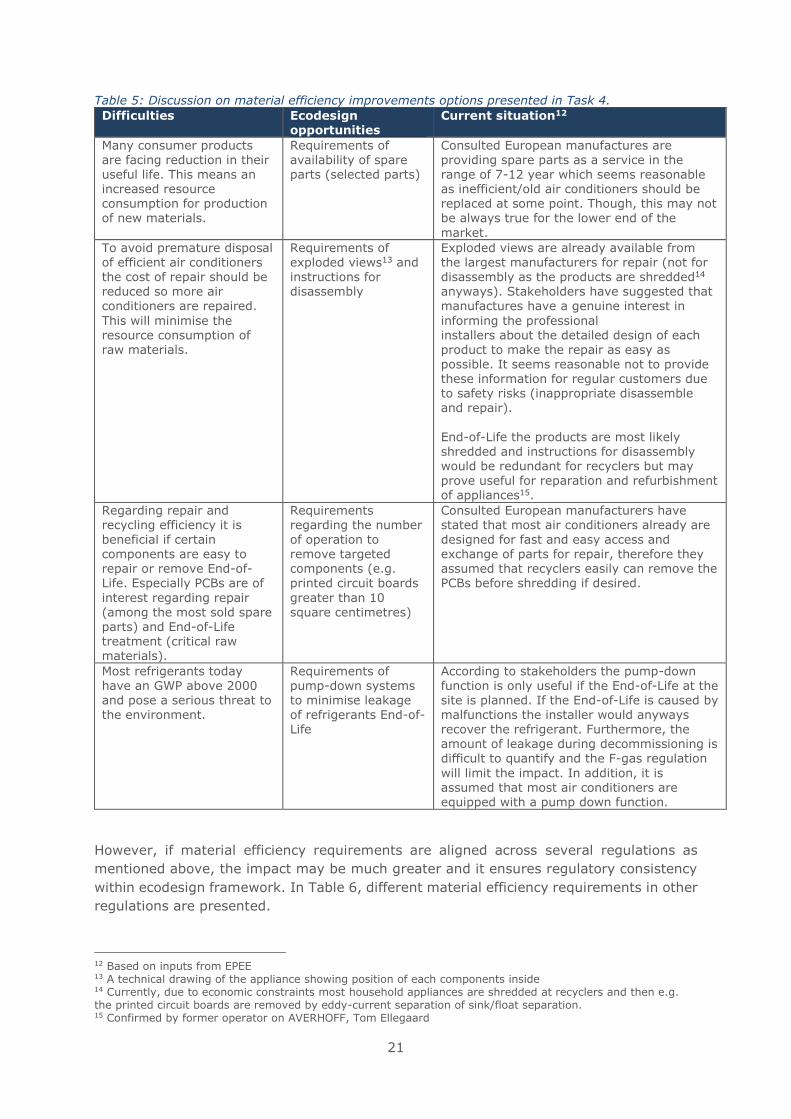
21
Table 5: Discussion on material efficiency improvements options presented in Task 4.
Difficulties Ecodesign opportunities
Current situation12
Many consumer products are facing reduction in their useful life. This means an increased resource consumption for production of new materials.
Requirements of availability of spare parts (selected parts)
Consulted European manufactures are providing spare parts as a service in the range of 7-12 year which seems reasonable as inefficient/old air conditioners should be replaced at some point. Though, this may not be always true for the lower end of the
market.
To avoid premature disposal of efficient air conditioners the cost of repair should be reduced so more air conditioners are repaired.
This will minimise the resource consumption of raw materials.
Requirements of exploded views13 and instructions for disassembly
Exploded views are already available from the largest manufacturers for repair (not for disassembly as the products are shredded14 anyways). Stakeholders have suggested that manufactures have a genuine interest in
informing the professional installers about the detailed design of each product to make the repair as easy as possible. It seems reasonable not to provide these information for regular customers due to safety risks (inappropriate disassemble and repair).
End-of-Life the products are most likely shredded and instructions for disassembly would be redundant for recyclers but may prove useful for reparation and refurbishment of appliances15.
Regarding repair and recycling efficiency it is
beneficial if certain components are easy to repair or remove End-of-Life. Especially PCBs are of
interest regarding repair (among the most sold spare parts) and End-of-Life treatment (critical raw materials).
Requirements regarding the number
of operation to remove targeted components (e.g. printed circuit boards
greater than 10 square centimetres)
Consulted European manufacturers have stated that most air conditioners already are
designed for fast and easy access and exchange of parts for repair, therefore they assumed that recyclers easily can remove the PCBs before shredding if desired.
Most refrigerants today have an GWP above 2000 and pose a serious threat to the environment.
Requirements of pump-down systems to minimise leakage of refrigerants End-of-Life
According to stakeholders the pump-down function is only useful if the End-of-Life at the site is planned. If the End-of-Life is caused by malfunctions the installer would anyways recover the refrigerant. Furthermore, the amount of leakage during decommissioning is
difficult to quantify and the F-gas regulation
will limit the impact. In addition, it is assumed that most air conditioners are equipped with a pump down function.
However, if material efficiency requirements are aligned across several regulations as
mentioned above, the impact may be much greater and it ensures regulatory consistency
within ecodesign framework. In Table 6, different material efficiency requirements in other
regulations are presented.
12 Based on inputs from EPEE 13 A technical drawing of the appliance showing position of each components inside 14 Currently, due to economic constraints most household appliances are shredded at recyclers and then e.g. the printed circuit boards are removed by eddy-current separation of sink/float separation. 15 Confirmed by former operator on AVERHOFF, Tom Ellegaard
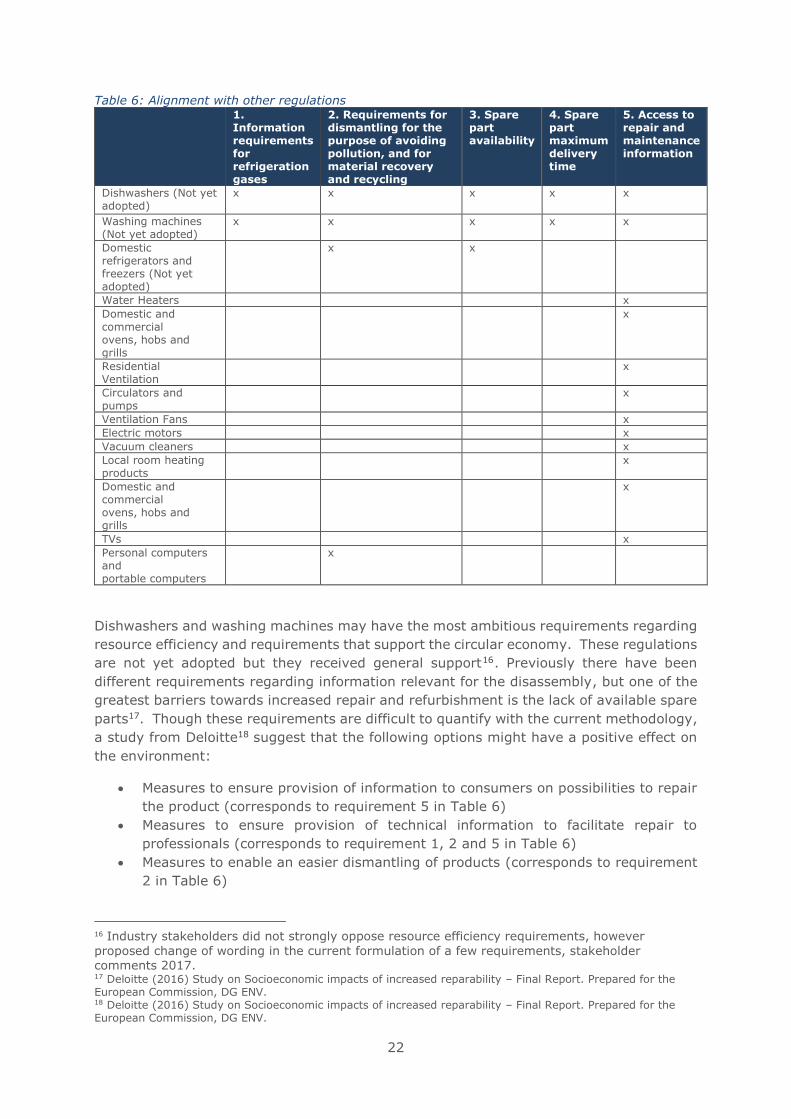
22
Table 6: Alignment with other regulations 1.
Information requirements for refrigeration gases
2. Requirements for dismantling for the purpose of avoiding pollution, and for material recovery and recycling
3. Spare part availability
4. Spare part maximum delivery time
5. Access to repair and maintenance information
Dishwashers (Not yet adopted)
x x x x x
Washing machines (Not yet adopted)
x x x x x
Domestic refrigerators and freezers (Not yet adopted)
x x
Water Heaters x
Domestic and commercial ovens, hobs and grills
x
Residential Ventilation
x
Circulators and pumps
x
Ventilation Fans x
Electric motors x
Vacuum cleaners x
Local room heating products
x
Domestic and commercial ovens, hobs and grills
x
TVs x
Personal computers and portable computers
x
Dishwashers and washing machines may have the most ambitious requirements regarding
resource efficiency and requirements that support the circular economy. These regulations
are not yet adopted but they received general support16. Previously there have been
different requirements regarding information relevant for the disassembly, but one of the
greatest barriers towards increased repair and refurbishment is the lack of available spare
parts17. Though these requirements are difficult to quantify with the current methodology,
a study from Deloitte18 suggest that the following options might have a positive effect on
the environment:
• Measures to ensure provision of information to consumers on possibilities to repair
the product (corresponds to requirement 5 in Table 6)
• Measures to ensure provision of technical information to facilitate repair to
professionals (corresponds to requirement 1, 2 and 5 in Table 6)
• Measures to enable an easier dismantling of products (corresponds to requirement
2 in Table 6)
16 Industry stakeholders did not strongly oppose resource efficiency requirements, however
proposed change of wording in the current formulation of a few requirements, stakeholder comments 2017. 17 Deloitte (2016) Study on Socioeconomic impacts of increased reparability – Final Report. Prepared for the European Commission, DG ENV. 18 Deloitte (2016) Study on Socioeconomic impacts of increased reparability – Final Report. Prepared for the European Commission, DG ENV.
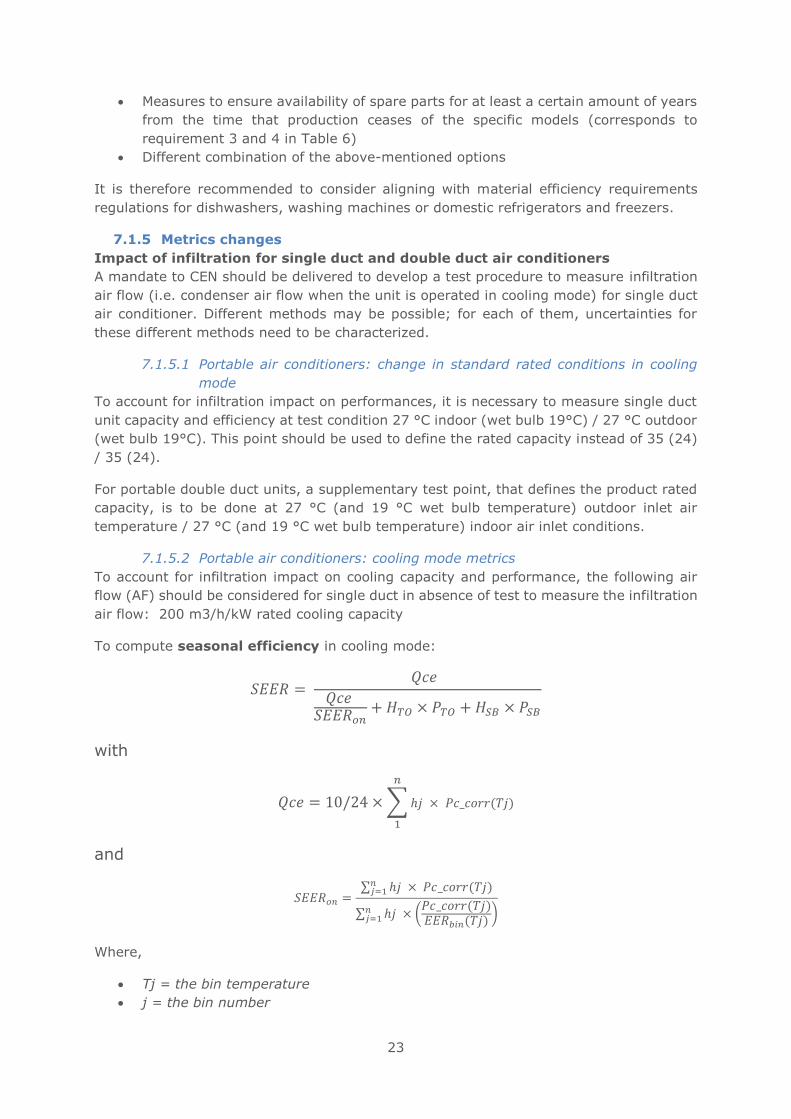
23
• Measures to ensure availability of spare parts for at least a certain amount of years
from the time that production ceases of the specific models (corresponds to
requirement 3 and 4 in Table 6)
• Different combination of the above-mentioned options
It is therefore recommended to consider aligning with material efficiency requirements
regulations for dishwashers, washing machines or domestic refrigerators and freezers.
7.1.5 Metrics changes
Impact of infiltration for single duct and double duct air conditioners
A mandate to CEN should be delivered to develop a test procedure to measure infiltration
air flow (i.e. condenser air flow when the unit is operated in cooling mode) for single duct
air conditioner. Different methods may be possible; for each of them, uncertainties for
these different methods need to be characterized.
7.1.5.1 Portable air conditioners: change in standard rated conditions in cooling
mode
To account for infiltration impact on performances, it is necessary to measure single duct
unit capacity and efficiency at test condition 27 °C indoor (wet bulb 19°C) / 27 °C outdoor
(wet bulb 19°C). This point should be used to define the rated capacity instead of 35 (24)
/ 35 (24).
For portable double duct units, a supplementary test point, that defines the product rated
capacity, is to be done at 27 °C (and 19 °C wet bulb temperature) outdoor inlet air
temperature / 27 °C (and 19 °C wet bulb temperature) indoor air inlet conditions.
7.1.5.2 Portable air conditioners: cooling mode metrics
To account for infiltration impact on cooling capacity and performance, the following air
flow (AF) should be considered for single duct in absence of test to measure the infiltration
air flow: 200 m3/h/kW rated cooling capacity
To compute seasonal efficiency in cooling mode:
𝑆𝐸𝐸𝑅 = 𝑄𝑐𝑒
𝑄𝑐𝑒 𝑆𝐸𝐸𝑅𝑜𝑛
+ 𝐻𝑇𝑂 × 𝑃𝑇𝑂 + 𝐻𝑆𝐵 × 𝑃𝑆𝐵
with
𝑄𝑐𝑒 = 10/24 × ∑ ℎ𝑗 × 𝑃𝑐_𝑐𝑜𝑟𝑟(𝑇𝑗)
𝑛
1
and
𝑆𝐸𝐸𝑅𝑜𝑛 =∑ ℎ𝑗 × 𝑃𝑐_𝑐𝑜𝑟𝑟(𝑇𝑗)𝑛
𝑗=1
∑ ℎ𝑗 × (𝑃𝑐_𝑐𝑜𝑟𝑟(𝑇𝑗)𝐸𝐸𝑅𝑏𝑖𝑛(𝑇𝑗)
)𝑛𝑗=1
Where,
• Tj = the bin temperature
• j = the bin number
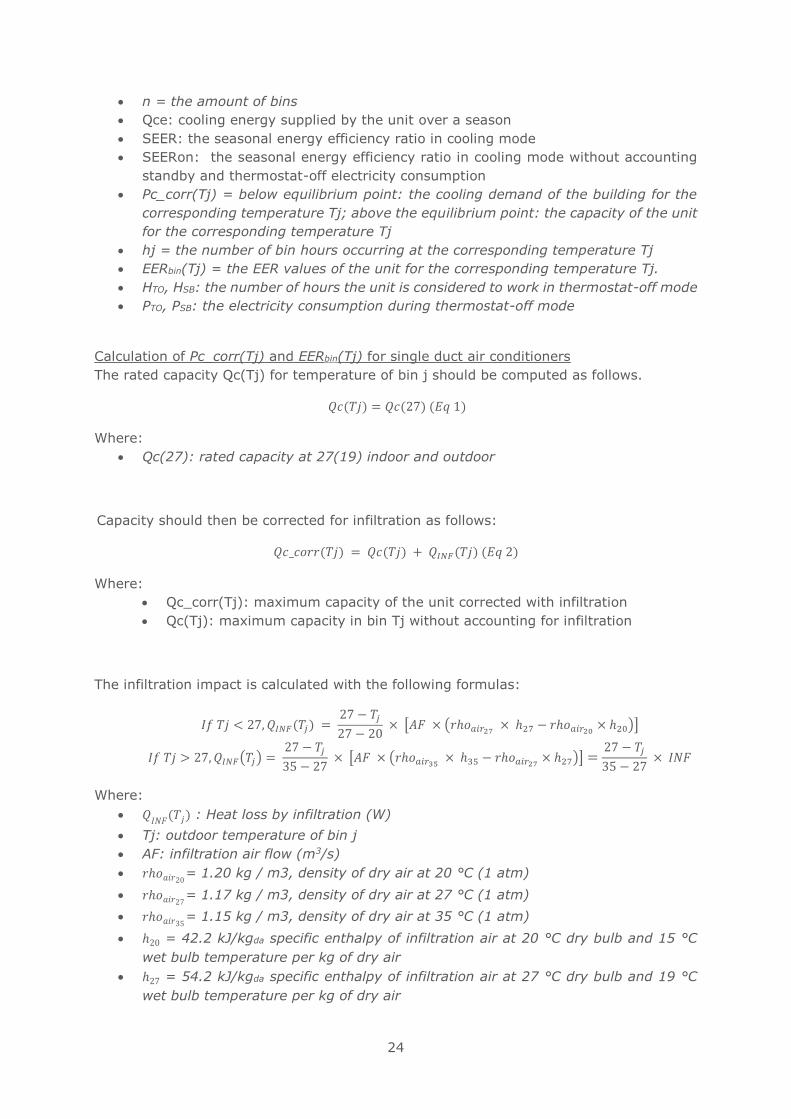
24
• n = the amount of bins
• Qce: cooling energy supplied by the unit over a season
• SEER: the seasonal energy efficiency ratio in cooling mode
• SEERon: the seasonal energy efficiency ratio in cooling mode without accounting
standby and thermostat-off electricity consumption
• Pc_corr(Tj) = below equilibrium point: the cooling demand of the building for the
corresponding temperature Tj; above the equilibrium point: the capacity of the unit
for the corresponding temperature Tj
• hj = the number of bin hours occurring at the corresponding temperature Tj
• EERbin(Tj) = the EER values of the unit for the corresponding temperature Tj.
• HTO, HSB: the number of hours the unit is considered to work in thermostat-off mode
• PTO, PSB: the electricity consumption during thermostat-off mode
Calculation of Pc_corr(Tj) and EERbin(Tj) for single duct air conditioners
The rated capacity Qc(Tj) for temperature of bin j should be computed as follows.
𝑄𝑐(𝑇𝑗) = 𝑄𝑐(27) (𝐸𝑞 1)
Where:
• Qc(27): rated capacity at 27(19) indoor and outdoor
Capacity should then be corrected for infiltration as follows:
𝑄𝑐_𝑐𝑜𝑟𝑟(𝑇𝑗) = 𝑄𝑐(𝑇𝑗) + 𝑄𝐼𝑁𝐹(𝑇𝑗) (𝐸𝑞 2)
Where:
• Qc_corr(Tj): maximum capacity of the unit corrected with infiltration
• Qc(Tj): maximum capacity in bin Tj without accounting for infiltration
The infiltration impact is calculated with the following formulas:
𝐼𝑓 𝑇𝑗 < 27, 𝑄𝐼𝑁𝐹(𝑇𝑗) = 27 − 𝑇𝑗
27 − 20 × [𝐴𝐹 × (𝑟ℎ𝑜𝑎𝑖𝑟27
× ℎ27 − 𝑟ℎ𝑜𝑎𝑖𝑟20× ℎ20)]
𝐼𝑓 𝑇𝑗 > 27, 𝑄𝐼𝑁𝐹(𝑇𝑗) = 27 − 𝑇𝑗
35 − 27 × [𝐴𝐹 × (𝑟ℎ𝑜𝑎𝑖𝑟35
× ℎ35 − 𝑟ℎ𝑜𝑎𝑖𝑟27× ℎ27)] =
27 − 𝑇𝑗
35 − 27 × 𝐼𝑁𝐹
Where:
• 𝑄𝐼𝑁𝐹
(𝑇𝑗) : Heat loss by infiltration (W)
• Tj: outdoor temperature of bin j
• AF: infiltration air flow (m3/s)
• 𝑟ℎ𝑜𝑎𝑖𝑟20= 1.20 kg / m3, density of dry air at 20 °C (1 atm)
• 𝑟ℎ𝑜𝑎𝑖𝑟27= 1.17 kg / m3, density of dry air at 27 °C (1 atm)
• 𝑟ℎ𝑜𝑎𝑖𝑟35= 1.15 kg / m3, density of dry air at 35 °C (1 atm)
• ℎ20 = 42.2 kJ/kgda specific enthalpy of infiltration air at 20 °C dry bulb and 15 °C
wet bulb temperature per kg of dry air
• ℎ27 = 54.2 kJ/kgda specific enthalpy of infiltration air at 27 °C dry bulb and 19 °C
wet bulb temperature per kg of dry air
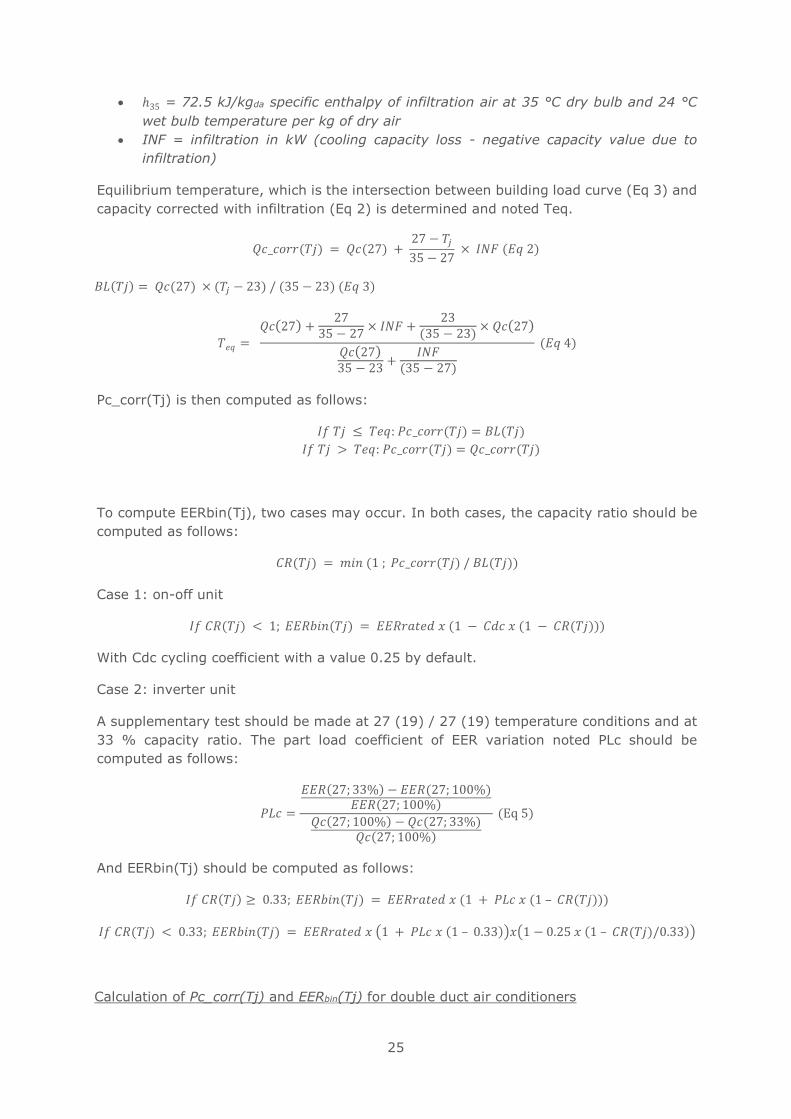
25
• ℎ35 = 72.5 kJ/kgda specific enthalpy of infiltration air at 35 °C dry bulb and 24 °C
wet bulb temperature per kg of dry air
• INF = infiltration in kW (cooling capacity loss - negative capacity value due to
infiltration)
Equilibrium temperature, which is the intersection between building load curve (Eq 3) and
capacity corrected with infiltration (Eq 2) is determined and noted Teq.
𝑄𝑐_𝑐𝑜𝑟𝑟(𝑇𝑗) = 𝑄𝑐(27) + 27 − 𝑇𝑗
35 − 27 × 𝐼𝑁𝐹 (𝐸𝑞 2)
𝐵𝐿(𝑇𝑗) = 𝑄𝑐(27) × (𝑇𝑗 − 23) / (35 − 23) (𝐸𝑞 3)
𝑇𝑒𝑞 =
𝑄𝑐(27) +27
35 − 27× 𝐼𝑁𝐹 +
23(35 − 23)
× 𝑄𝑐(27)
𝑄𝑐(27)35 − 23
+𝐼𝑁𝐹
(35 − 27)
(𝐸𝑞 4)
Pc_corr(Tj) is then computed as follows:
𝐼𝑓 𝑇𝑗 ≤ 𝑇𝑒𝑞: 𝑃𝑐_𝑐𝑜𝑟𝑟(𝑇𝑗) = 𝐵𝐿(𝑇𝑗)
𝐼𝑓 𝑇𝑗 > 𝑇𝑒𝑞: 𝑃𝑐_𝑐𝑜𝑟𝑟(𝑇𝑗) = 𝑄𝑐_𝑐𝑜𝑟𝑟(𝑇𝑗)
To compute EERbin(Tj), two cases may occur. In both cases, the capacity ratio should be
computed as follows:
𝐶𝑅(𝑇𝑗) = 𝑚𝑖𝑛 (1 ; 𝑃𝑐_𝑐𝑜𝑟𝑟(𝑇𝑗) / 𝐵𝐿(𝑇𝑗))
Case 1: on-off unit
𝐼𝑓 𝐶𝑅(𝑇𝑗) < 1; 𝐸𝐸𝑅𝑏𝑖𝑛(𝑇𝑗) = 𝐸𝐸𝑅𝑟𝑎𝑡𝑒𝑑 𝑥 (1 − 𝐶𝑑𝑐 𝑥 (1 − 𝐶𝑅(𝑇𝑗)))
With Cdc cycling coefficient with a value 0.25 by default.
Case 2: inverter unit
A supplementary test should be made at 27 (19) / 27 (19) temperature conditions and at
33 % capacity ratio. The part load coefficient of EER variation noted PLc should be
computed as follows:
𝑃𝐿𝑐 =
𝐸𝐸𝑅(27; 33%) − 𝐸𝐸𝑅(27; 100%)𝐸𝐸𝑅(27; 100%)
𝑄𝑐(27; 100%) − 𝑄𝑐(27; 33%)𝑄𝑐(27; 100%)
(Eq 5)
And EERbin(Tj) should be computed as follows:
𝐼𝑓 𝐶𝑅(𝑇𝑗) ≥ 0.33; 𝐸𝐸𝑅𝑏𝑖𝑛(𝑇𝑗) = 𝐸𝐸𝑅𝑟𝑎𝑡𝑒𝑑 𝑥 (1 + 𝑃𝐿𝑐 𝑥 (1 – 𝐶𝑅(𝑇𝑗)))
𝐼𝑓 𝐶𝑅(𝑇𝑗) < 0.33; 𝐸𝐸𝑅𝑏𝑖𝑛(𝑇𝑗) = 𝐸𝐸𝑅𝑟𝑎𝑡𝑒𝑑 𝑥 (1 + 𝑃𝐿𝑐 𝑥 (1 – 0.33))𝑥(1 − 0.25 𝑥 (1 – 𝐶𝑅(𝑇𝑗)/0.33))
Calculation of Pc_corr(Tj) and EERbin(Tj) for double duct air conditioners
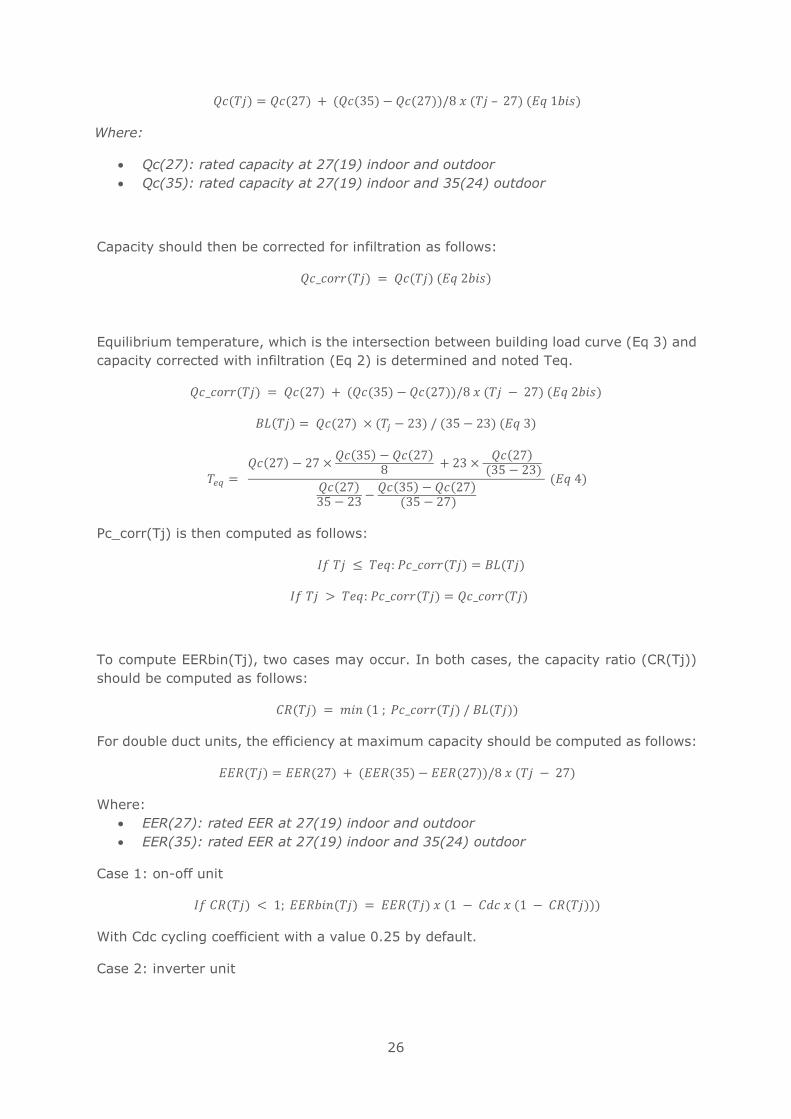
26
𝑄𝑐(𝑇𝑗) = 𝑄𝑐(27) + (𝑄𝑐(35) − 𝑄𝑐(27))/8 𝑥 (𝑇𝑗 – 27) (𝐸𝑞 1𝑏𝑖𝑠)
Where:
• Qc(27): rated capacity at 27(19) indoor and outdoor
• Qc(35): rated capacity at 27(19) indoor and 35(24) outdoor
Capacity should then be corrected for infiltration as follows:
𝑄𝑐_𝑐𝑜𝑟𝑟(𝑇𝑗) = 𝑄𝑐(𝑇𝑗) (𝐸𝑞 2𝑏𝑖𝑠)
Equilibrium temperature, which is the intersection between building load curve (Eq 3) and
capacity corrected with infiltration (Eq 2) is determined and noted Teq.
𝑄𝑐_𝑐𝑜𝑟𝑟(𝑇𝑗) = 𝑄𝑐(27) + (𝑄𝑐(35) − 𝑄𝑐(27))/8 𝑥 (𝑇𝑗 − 27) (𝐸𝑞 2𝑏𝑖𝑠)
𝐵𝐿(𝑇𝑗) = 𝑄𝑐(27) × (𝑇𝑗 − 23) / (35 − 23) (𝐸𝑞 3)
𝑇𝑒𝑞 = 𝑄𝑐(27) − 27 ×
𝑄𝑐(35) − 𝑄𝑐(27)8
+ 23 ×𝑄𝑐(27)
(35 − 23)
𝑄𝑐(27)35 − 23
−𝑄𝑐(35) − 𝑄𝑐(27)
(35 − 27)
(𝐸𝑞 4)
Pc_corr(Tj) is then computed as follows:
𝐼𝑓 𝑇𝑗 ≤ 𝑇𝑒𝑞: 𝑃𝑐_𝑐𝑜𝑟𝑟(𝑇𝑗) = 𝐵𝐿(𝑇𝑗)
𝐼𝑓 𝑇𝑗 > 𝑇𝑒𝑞: 𝑃𝑐_𝑐𝑜𝑟𝑟(𝑇𝑗) = 𝑄𝑐_𝑐𝑜𝑟𝑟(𝑇𝑗)
To compute EERbin(Tj), two cases may occur. In both cases, the capacity ratio (CR(Tj))
should be computed as follows:
𝐶𝑅(𝑇𝑗) = 𝑚𝑖𝑛 (1 ; 𝑃𝑐_𝑐𝑜𝑟𝑟(𝑇𝑗) / 𝐵𝐿(𝑇𝑗))
For double duct units, the efficiency at maximum capacity should be computed as follows:
𝐸𝐸𝑅(𝑇𝑗) = 𝐸𝐸𝑅(27) + (𝐸𝐸𝑅(35) − 𝐸𝐸𝑅(27))/8 𝑥 (𝑇𝑗 − 27)
Where:
• EER(27): rated EER at 27(19) indoor and outdoor
• EER(35): rated EER at 27(19) indoor and 35(24) outdoor
Case 1: on-off unit
𝐼𝑓 𝐶𝑅(𝑇𝑗) < 1; 𝐸𝐸𝑅𝑏𝑖𝑛(𝑇𝑗) = 𝐸𝐸𝑅(𝑇𝑗) 𝑥 (1 − 𝐶𝑑𝑐 𝑥 (1 − 𝐶𝑅(𝑇𝑗)))
With Cdc cycling coefficient with a value 0.25 by default.
Case 2: inverter unit
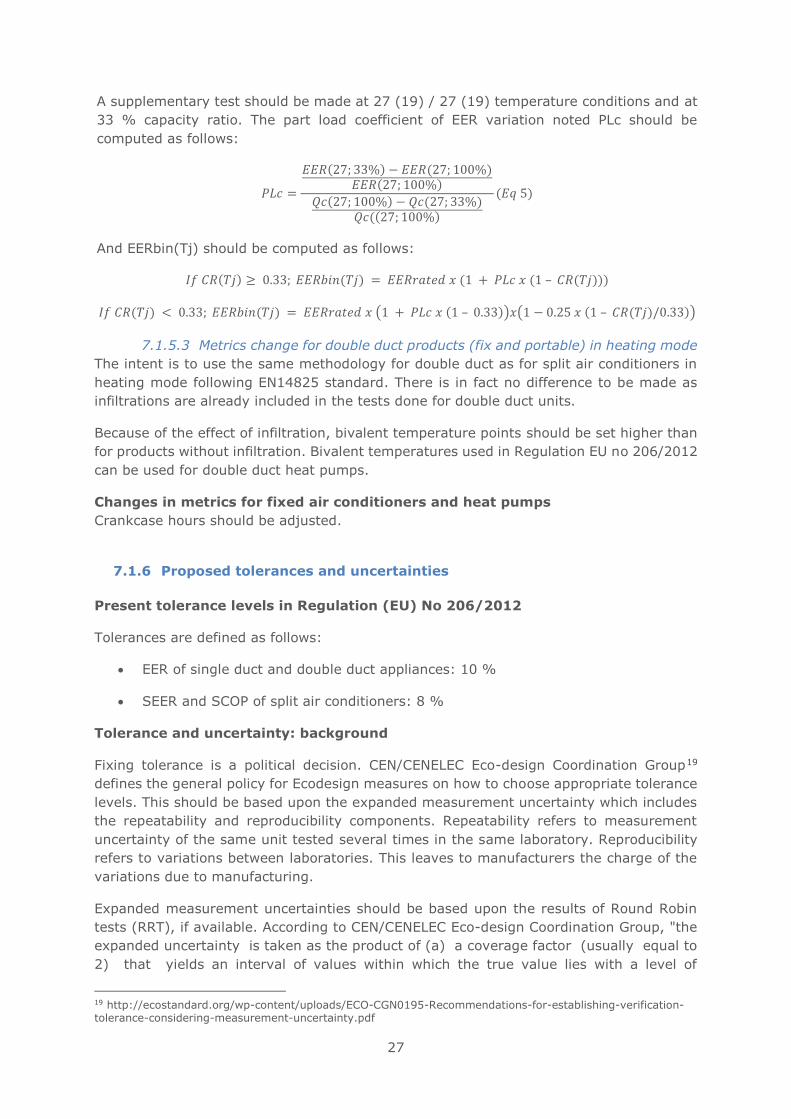
27
A supplementary test should be made at 27 (19) / 27 (19) temperature conditions and at
33 % capacity ratio. The part load coefficient of EER variation noted PLc should be
computed as follows:
𝑃𝐿𝑐 =
𝐸𝐸𝑅(27; 33%) − 𝐸𝐸𝑅(27; 100%)𝐸𝐸𝑅(27; 100%)
𝑄𝑐(27; 100%) − 𝑄𝑐(27; 33%)𝑄𝑐((27; 100%)
(𝐸𝑞 5)
And EERbin(Tj) should be computed as follows:
𝐼𝑓 𝐶𝑅(𝑇𝑗) ≥ 0.33; 𝐸𝐸𝑅𝑏𝑖𝑛(𝑇𝑗) = 𝐸𝐸𝑅𝑟𝑎𝑡𝑒𝑑 𝑥 (1 + 𝑃𝐿𝑐 𝑥 (1 – 𝐶𝑅(𝑇𝑗)))
𝐼𝑓 𝐶𝑅(𝑇𝑗) < 0.33; 𝐸𝐸𝑅𝑏𝑖𝑛(𝑇𝑗) = 𝐸𝐸𝑅𝑟𝑎𝑡𝑒𝑑 𝑥 (1 + 𝑃𝐿𝑐 𝑥 (1 – 0.33))𝑥(1 − 0.25 𝑥 (1 – 𝐶𝑅(𝑇𝑗)/0.33))
7.1.5.3 Metrics change for double duct products (fix and portable) in heating mode
The intent is to use the same methodology for double duct as for split air conditioners in
heating mode following EN14825 standard. There is in fact no difference to be made as
infiltrations are already included in the tests done for double duct units.
Because of the effect of infiltration, bivalent temperature points should be set higher than
for products without infiltration. Bivalent temperatures used in Regulation EU no 206/2012
can be used for double duct heat pumps.
Changes in metrics for fixed air conditioners and heat pumps
Crankcase hours should be adjusted.
7.1.6 Proposed tolerances and uncertainties
Present tolerance levels in Regulation (EU) No 206/2012
Tolerances are defined as follows:
• EER of single duct and double duct appliances: 10 %
• SEER and SCOP of split air conditioners: 8 %
Tolerance and uncertainty: background
Fixing tolerance is a political decision. CEN/CENELEC Eco-design Coordination Group19
defines the general policy for Ecodesign measures on how to choose appropriate tolerance
levels. This should be based upon the expanded measurement uncertainty which includes
the repeatability and reproducibility components. Repeatability refers to measurement
uncertainty of the same unit tested several times in the same laboratory. Reproducibility
refers to variations between laboratories. This leaves to manufacturers the charge of the
variations due to manufacturing.
Expanded measurement uncertainties should be based upon the results of Round Robin
tests (RRT), if available. According to CEN/CENELEC Eco-design Coordination Group, "the
expanded uncertainty is taken as the product of (a) a coverage factor (usually equal to
2) that yields an interval of values within which the true value lies with a level of
19 http://ecostandard.org/wp-content/uploads/ECO-CGN0195-Recommendations-for-establishing-verification-tolerance-considering-measurement-uncertainty.pdf
28
confidence of approximately 95 %, and (b) the standard deviation of the results divided
by the square root of the number of results".
It is thus strongly advised to lead Round Robin tests for both SEER of portable air
conditioners and SEER and SCOP of fixed air conditioners. However, at the time this report
is written, such results are not available. For portable air conditioners, a preliminary report
on a still on-going Round Robin test reported by UBA 20 could allow to compute EER
expanded uncertainties: reproducibility standard deviation was determined to be of 1 %
(test in 2 different laboratories) and the repeatability standard deviation was not greater
than 0.6 % in each test laboratory (with 4 tests by laboratory). Further results from
additional laboratories are expected by mid-2018 to deliver statistically valid reproducibility
value. Applying Eco-design coordination group methodology to present results (an
approximation is used here as individual test results have not been supplied) would lead
to expanded uncertainties below 3 % (2 x √(0.012+0.0062) = 2.3 %). This seems very low
as compared to present tolerances of 10 % on EER for single duct air conditioners in
Regulation (EU) n° 206/2012 so it seems better to wait for the complete RRT to be
completed and final report to become available.
In absence of Round Robin test indications, existing standard EN14825:2016 includes
maximum measurement expanded uncertainties (including both repeatability and
reproducibility) for capacity and electricity values so that it is possible to calculate
maximum expanded measurement uncertainty for seasonal performance indicators. These
expanded measurement uncertainties are also used for portable air conditioners here
because the same measurement method as for split air conditioners (calorimetric room) is
also used for these products. A supplementary measurement is required for single duct air
conditioners, this is the condenser air flow, which measurement expanded uncertainty is 5
% according to EN14511-3:2013.
To calculate the expanded uncertainty, as measurement uncertainties indicated in
EN14825:2016 are expanded measurement uncertainties, it is enough to propagate the
uncertainties to compute seasonal performance metrics expanded uncertainties of
measurement from these values.
We then use this method to determine the maximum expanded uncertainties from available
standard information for a number of representative units. Calculation of SEER and SCOP
uncertainties are done using the software EES21, which allows to prevent uncertainty
propagation uprate due to derivative calculation simplifications or errors. Discussion with
test laboratories on this subject show there might be a need for a CEN TC 113 guidance
on how to calculate measurement uncertainties for SEER / SCOP as the calculation by hand
is quite complex and time consuming (and then may lead to significant errors).
Individual measurement uncertainties
Expanded individual measurement uncertainties are defined as:
• (EN14825:2016) Regarding thermal capacities: 15 % below 1 kW, 10% between 1
and 2 kW, 5 % above 2 kW and 10 % (or 15 % if capacity is less than 1 kW) in
non-stationary conditions - i.e. for test points including frost/defrost cycles.
20 UBA and BAM, Comments received February 6 2018. 21 Klein, S.A., EES – Engineering Equation Solver, Version 10.039, 2016, F-Chart Software, http://fchart.com
29
• (EN14825:2016) Regarding electric power: 1 % with a minimum value of 0.1 W
below 10 W (useful for auxiliary power mode measurement22)
• (EN14511:3, 2016) For infiltration measurement of single duct air conditioners, 5%
on the air flow rate.
Best possible values achievable by the time of the measures have been discussed with test
laboratories:
• Regarding thermal capacities: 10 % below 2 kW, 5 % above 2 kW and 5 % (or 10
% if capacity is less than 1 kW) in non-stationary conditions - i.e. for test points
including frost/defrost cycles.
• Regarding electric power: 1 % with a minimum value of 0.1 W below 10 W
• For infiltration air flow measurement of single duct air conditioners, 5%.
Note that for infiltration air flow of single duct air conditioners, manufacturers indicated
that the air flow test is to be done in realistic operating conditions because the air flow
decreases when the quantity of condensates increases in the condenser air flow (most
single duct units indeed recirculate the condensates from the evaporator to the condenser
so that they may be evaporated). The impact of a higher uncertainty level of 10 % is thus
tested hereafter.
EU test laboratories have indicated that to further decrease expanded measurement
uncertainties for thermal capacities, which are the major components in the final
repeatability uncertainty of SEER and SCOP value, it would be necessary that EU test
laboratories build new calorimetric room chambers of smaller size, which, even if they had
the money to invest in, could not be realistically ready at the time revised air conditioner
regulations enter into force. Basing upon the example of measurement uncertainty in other
economies, manufacturers believe it is still possible to go lower by forcing all test
laboratories to standardize some of the measurement methods between the laboratories.
Expanded uncertainty calculation for split air conditioners
Six different unit types are considered. For these units, all parameters required to compute
SEER / SCOP are available. For all these units, as explained before in Task 4, the building
load required at D point condition cannot be reached. This tends to reduce the
measurement uncertainty for lower capacity units as measurement uncertainties presently
increases with decreasing capacity. Consequently, it is supposed in what follows that the
same efficiency at D point can be obtained without cycling but by adjusting the capacity to
the required building load. This gives an idea of the uncertainty increase for machines that
can reach such low capacity levels. This tend to increase SEER/SCOP expanded uncertainty
between 0.5 % (smaller units) to 0.3 % (larger units).
Calculation results are shown in Table 7 for both present uncertainty levels and the
improved scenario described above.
22 Note this value is to be increased to 0.3 W in the next revision of EN14825:2016, but this has a negligible impact on SEER and SCOP uncertainty values.
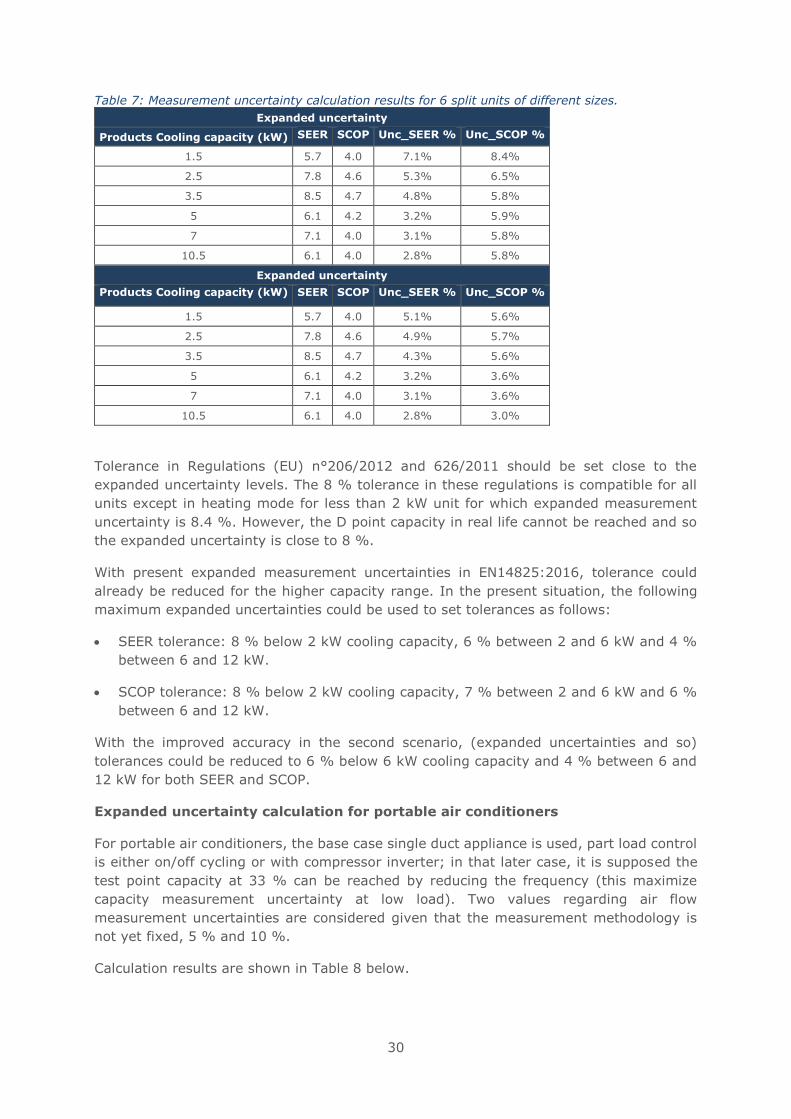
30
Table 7: Measurement uncertainty calculation results for 6 split units of different sizes.
Expanded uncertainty
Products Cooling capacity (kW) SEER SCOP Unc_SEER % Unc_SCOP %
1.5 5.7 4.0 7.1% 8.4%
2.5 7.8 4.6 5.3% 6.5%
3.5 8.5 4.7 4.8% 5.8%
5 6.1 4.2 3.2% 5.9%
7 7.1 4.0 3.1% 5.8%
10.5 6.1 4.0 2.8% 5.8%
Expanded uncertainty
Products Cooling capacity (kW) SEER SCOP Unc_SEER % Unc_SCOP %
1.5 5.7 4.0 5.1% 5.6%
2.5 7.8 4.6 4.9% 5.7%
3.5 8.5 4.7 4.3% 5.6%
5 6.1 4.2 3.2% 3.6%
7 7.1 4.0 3.1% 3.6%
10.5 6.1 4.0 2.8% 3.0%
Tolerance in Regulations (EU) n°206/2012 and 626/2011 should be set close to the
expanded uncertainty levels. The 8 % tolerance in these regulations is compatible for all
units except in heating mode for less than 2 kW unit for which expanded measurement
uncertainty is 8.4 %. However, the D point capacity in real life cannot be reached and so
the expanded uncertainty is close to 8 %.
With present expanded measurement uncertainties in EN14825:2016, tolerance could
already be reduced for the higher capacity range. In the present situation, the following
maximum expanded uncertainties could be used to set tolerances as follows:
• SEER tolerance: 8 % below 2 kW cooling capacity, 6 % between 2 and 6 kW and 4 %
between 6 and 12 kW.
• SCOP tolerance: 8 % below 2 kW cooling capacity, 7 % between 2 and 6 kW and 6 %
between 6 and 12 kW.
With the improved accuracy in the second scenario, (expanded uncertainties and so)
tolerances could be reduced to 6 % below 6 kW cooling capacity and 4 % between 6 and
12 kW for both SEER and SCOP.
Expanded uncertainty calculation for portable air conditioners
For portable air conditioners, the base case single duct appliance is used, part load control
is either on/off cycling or with compressor inverter; in that later case, it is supposed the
test point capacity at 33 % can be reached by reducing the frequency (this maximize
capacity measurement uncertainty at low load). Two values regarding air flow
measurement uncertainties are considered given that the measurement methodology is
not yet fixed, 5 % and 10 %.
Calculation results are shown in Table 8 below.
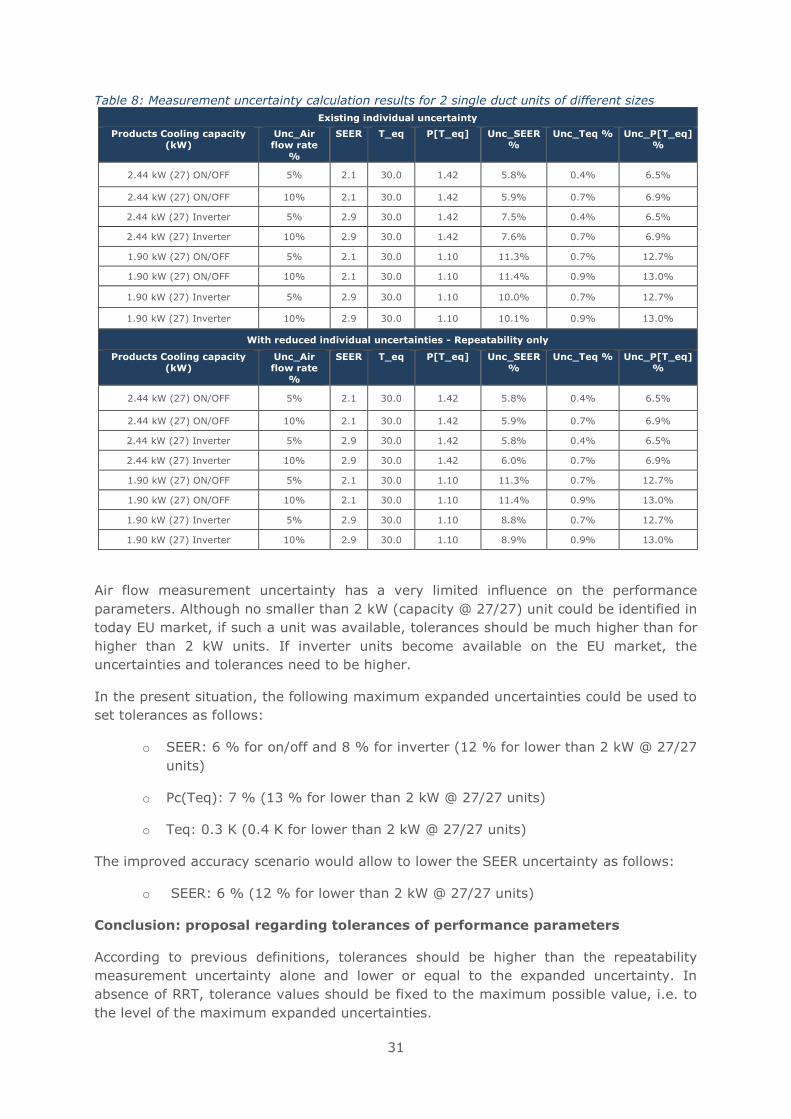
31
Table 8: Measurement uncertainty calculation results for 2 single duct units of different sizes
Existing individual uncertainty
Products Cooling capacity
(kW)
Unc_Air
flow rate
%
SEER T_eq P[T_eq] Unc_SEER
%
Unc_Teq % Unc_P[T_eq]
%
2.44 kW (27) ON/OFF 5% 2.1 30.0 1.42 5.8% 0.4% 6.5%
2.44 kW (27) ON/OFF 10% 2.1 30.0 1.42 5.9% 0.7% 6.9%
2.44 kW (27) Inverter 5% 2.9 30.0 1.42 7.5% 0.4% 6.5%
2.44 kW (27) Inverter 10% 2.9 30.0 1.42 7.6% 0.7% 6.9%
1.90 kW (27) ON/OFF 5% 2.1 30.0 1.10 11.3% 0.7% 12.7%
1.90 kW (27) ON/OFF 10% 2.1 30.0 1.10 11.4% 0.9% 13.0%
1.90 kW (27) Inverter 5% 2.9 30.0 1.10 10.0% 0.7% 12.7%
1.90 kW (27) Inverter 10% 2.9 30.0 1.10 10.1% 0.9% 13.0%
With reduced individual uncertainties - Repeatability only
Products Cooling capacity
(kW)
Unc_Air
flow rate
%
SEER T_eq P[T_eq] Unc_SEER
%
Unc_Teq % Unc_P[T_eq]
%
2.44 kW (27) ON/OFF 5% 2.1 30.0 1.42 5.8% 0.4% 6.5%
2.44 kW (27) ON/OFF 10% 2.1 30.0 1.42 5.9% 0.7% 6.9%
2.44 kW (27) Inverter 5% 2.9 30.0 1.42 5.8% 0.4% 6.5%
2.44 kW (27) Inverter 10% 2.9 30.0 1.42 6.0% 0.7% 6.9%
1.90 kW (27) ON/OFF 5% 2.1 30.0 1.10 11.3% 0.7% 12.7%
1.90 kW (27) ON/OFF 10% 2.1 30.0 1.10 11.4% 0.9% 13.0%
1.90 kW (27) Inverter 5% 2.9 30.0 1.10 8.8% 0.7% 12.7%
1.90 kW (27) Inverter 10% 2.9 30.0 1.10 8.9% 0.9% 13.0%
Air flow measurement uncertainty has a very limited influence on the performance
parameters. Although no smaller than 2 kW (capacity @ 27/27) unit could be identified in
today EU market, if such a unit was available, tolerances should be much higher than for
higher than 2 kW units. If inverter units become available on the EU market, the
uncertainties and tolerances need to be higher.
In the present situation, the following maximum expanded uncertainties could be used to
set tolerances as follows:
o SEER: 6 % for on/off and 8 % for inverter (12 % for lower than 2 kW @ 27/27
units)
o Pc(Teq): 7 % (13 % for lower than 2 kW @ 27/27 units)
o Teq: 0.3 K (0.4 K for lower than 2 kW @ 27/27 units)
The improved accuracy scenario would allow to lower the SEER uncertainty as follows:
o SEER: 6 % (12 % for lower than 2 kW @ 27/27 units)
Conclusion: proposal regarding tolerances of performance parameters
According to previous definitions, tolerances should be higher than the repeatability
measurement uncertainty alone and lower or equal to the expanded uncertainty. In
absence of RRT, tolerance values should be fixed to the maximum possible value, i.e. to
the level of the maximum expanded uncertainties.
32
With present measurement uncertainties, tolerance levels can be set as follows:
• split air conditioners:
o SEER tolerance: 8 % below 2 kW cooling capacity, 6 % between 2 and 6 kW
and 4 % between 6 and 12 kW.
o SCOP tolerance: 8 % below 2 kW cooling capacity, 7 % between 2 and 6 kW
and 6 % between 6 and 12 kW.
• portable air conditioners:
o SEER: 6 % for on/off and 8 % for inverter (12 % for lower than 2 kW @ 27/27
units)
o Pc(Teq): 7 % (13 % for lower than 2 kW @ 27/27 units)
o Teq: 0.3 K (0.4 K for lower than 2 kW @ 27/27 units)
SEER and SCOP tolerance levels in Regulations (EU) No 206/2012 and 626/2011 need to
be revised.
With improved measurement accuracy, tolerances could be reduced to the following levels:
• split air conditioners:
o SEER: 6 % below 6 kW cooling capacity and 4 % between 6 and 12 kW
o SCOP: 6 % below 6 kW cooling capacity and 4 % between 6 and 12 kW
• portable air conditioners:
o SEER: 6 % (12 % for lower than 2 kW @ 27/27 units)
Further discussions with test laboratories and manufacturers are required about the
conditions of feasibility and timing of this improved scenario.
These proposed air conditioner performance indicators should be the subject of regular
Round Robin Tests amongst EU laboratories. These RRT should be used to calculate the
expanded measurement uncertainties from test results and to lower tolerances depending
on the RRT results. Individual measurement uncertainties on capacity should also be
adjusted depending on the results of such campaigns.
A RRT campaign is on-going for portable air conditioners and could be used to reduce the
expanded uncertainty on EER measurements and thus also on the performance parameters
indicated here.
7.2 Scenario analysis
The scenario analysis investigates the impact of the current regulation and revised
regulation regarding reduction in energy consumption and emission of CO2-eq. The impact
of changes to material composition are not included as the impacts are very limited due to
changes in the material composition. Nor are suggestions towards improved material
efficiency included due to the limited impact (industry have already improved due to a
focus on reparability) and to the difficulties with quantifying the improvement potential.
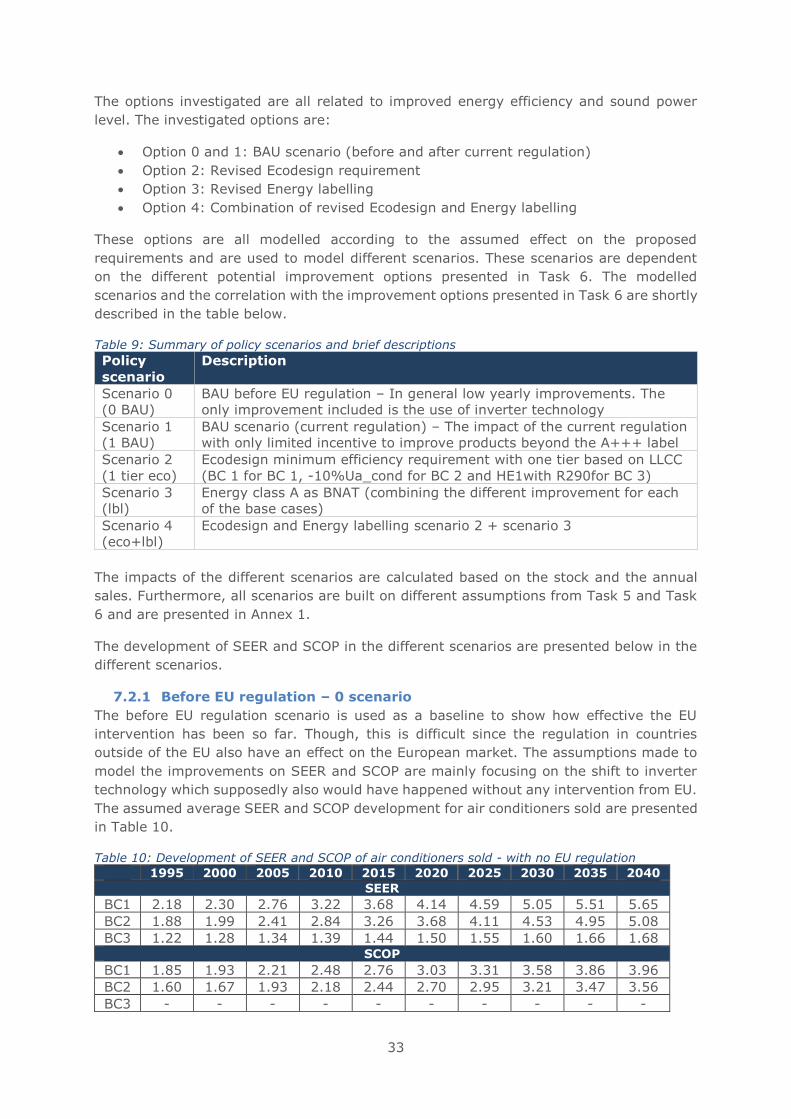
33
The options investigated are all related to improved energy efficiency and sound power
level. The investigated options are:
• Option 0 and 1: BAU scenario (before and after current regulation)
• Option 2: Revised Ecodesign requirement
• Option 3: Revised Energy labelling
• Option 4: Combination of revised Ecodesign and Energy labelling
These options are all modelled according to the assumed effect on the proposed
requirements and are used to model different scenarios. These scenarios are dependent
on the different potential improvement options presented in Task 6. The modelled
scenarios and the correlation with the improvement options presented in Task 6 are shortly
described in the table below.
Table 9: Summary of policy scenarios and brief descriptions
Policy
scenario
Description
Scenario 0
(0 BAU)
BAU before EU regulation – In general low yearly improvements. The
only improvement included is the use of inverter technology
Scenario 1
(1 BAU)
BAU scenario (current regulation) – The impact of the current regulation
with only limited incentive to improve products beyond the A+++ label
Scenario 2
(1 tier eco)
Ecodesign minimum efficiency requirement with one tier based on LLCC
(BC 1 for BC 1, -10%Ua_cond for BC 2 and HE1with R290for BC 3)
Scenario 3
(lbl)
Energy class A as BNAT (combining the different improvement for each
of the base cases)
Scenario 4
(eco+lbl)
Ecodesign and Energy labelling scenario 2 + scenario 3
The impacts of the different scenarios are calculated based on the stock and the annual
sales. Furthermore, all scenarios are built on different assumptions from Task 5 and Task
6 and are presented in Annex 1.
The development of SEER and SCOP in the different scenarios are presented below in the
different scenarios.
7.2.1 Before EU regulation – 0 scenario
The before EU regulation scenario is used as a baseline to show how effective the EU
intervention has been so far. Though, this is difficult since the regulation in countries
outside of the EU also have an effect on the European market. The assumptions made to
model the improvements on SEER and SCOP are mainly focusing on the shift to inverter
technology which supposedly also would have happened without any intervention from EU.
The assumed average SEER and SCOP development for air conditioners sold are presented
in Table 10.
Table 10: Development of SEER and SCOP of air conditioners sold - with no EU regulation
1995 2000 2005 2010 2015 2020 2025 2030 2035 2040
SEER
BC1 2.18 2.30 2.76 3.22 3.68 4.14 4.59 5.05 5.51 5.65
BC2 1.88 1.99 2.41 2.84 3.26 3.68 4.11 4.53 4.95 5.08
BC3 1.22 1.28 1.34 1.39 1.44 1.50 1.55 1.60 1.66 1.68 SCOP
BC1 1.85 1.93 2.21 2.48 2.76 3.03 3.31 3.58 3.86 3.96
BC2 1.60 1.67 1.93 2.18 2.44 2.70 2.95 3.21 3.47 3.56
BC3 - - - - - - - - - -
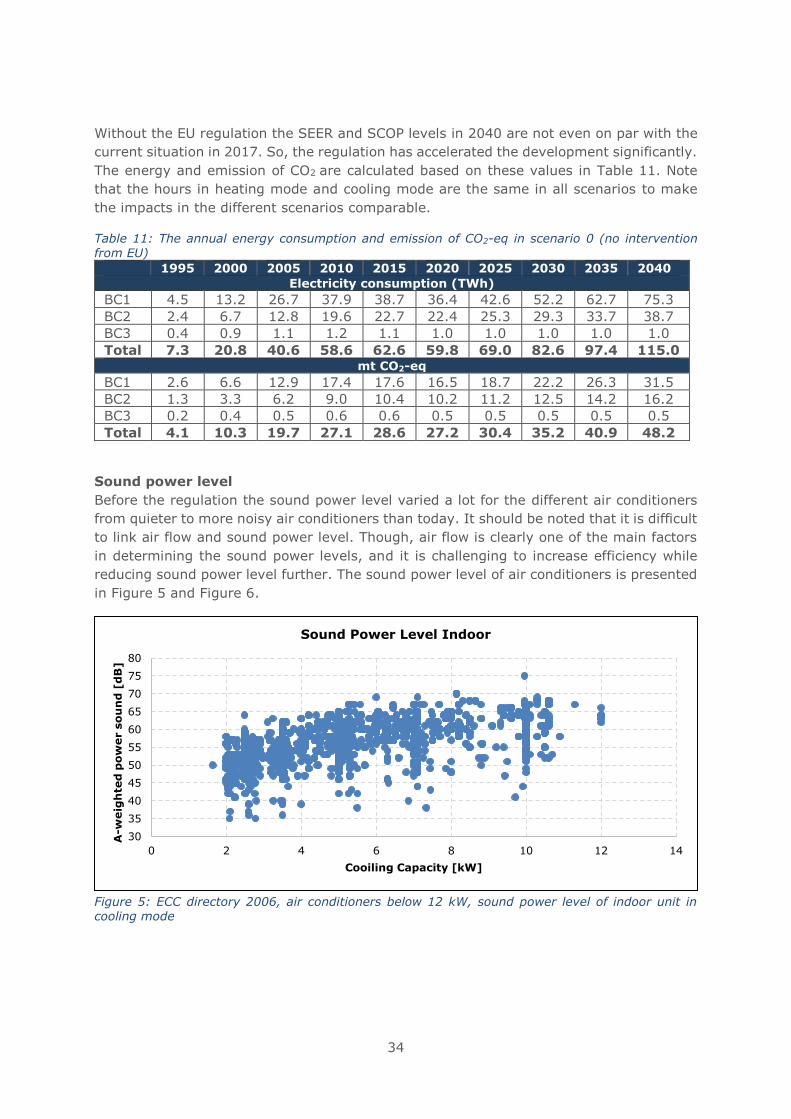
34
Without the EU regulation the SEER and SCOP levels in 2040 are not even on par with the
current situation in 2017. So, the regulation has accelerated the development significantly.
The energy and emission of CO2 are calculated based on these values in Table 11. Note
that the hours in heating mode and cooling mode are the same in all scenarios to make
the impacts in the different scenarios comparable.
Table 11: The annual energy consumption and emission of CO2-eq in scenario 0 (no intervention from EU)
1995 2000 2005 2010 2015 2020 2025 2030 2035 2040
Electricity consumption (TWh)
BC1 4.5 13.2 26.7 37.9 38.7 36.4 42.6 52.2 62.7 75.3
BC2 2.4 6.7 12.8 19.6 22.7 22.4 25.3 29.3 33.7 38.7
BC3 0.4 0.9 1.1 1.2 1.1 1.0 1.0 1.0 1.0 1.0
Total 7.3 20.8 40.6 58.6 62.6 59.8 69.0 82.6 97.4 115.0 mt CO2-eq
BC1 2.6 6.6 12.9 17.4 17.6 16.5 18.7 22.2 26.3 31.5
BC2 1.3 3.3 6.2 9.0 10.4 10.2 11.2 12.5 14.2 16.2
BC3 0.2 0.4 0.5 0.6 0.6 0.5 0.5 0.5 0.5 0.5
Total 4.1 10.3 19.7 27.1 28.6 27.2 30.4 35.2 40.9 48.2
Sound power level
Before the regulation the sound power level varied a lot for the different air conditioners
from quieter to more noisy air conditioners than today. It should be noted that it is difficult
to link air flow and sound power level. Though, air flow is clearly one of the main factors
in determining the sound power levels, and it is challenging to increase efficiency while
reducing sound power level further. The sound power level of air conditioners is presented
in Figure 5 and Figure 6.
Figure 5: ECC directory 2006, air conditioners below 12 kW, sound power level of indoor unit in cooling mode
30
35
40
45
50
55
60
65
70
75
80
0 2 4 6 8 10 12 14
A-w
eig
hte
d p
ow
er s
ou
nd
[d
B]
Cooiling Capacity [kW]
Sound Power Level Indoor
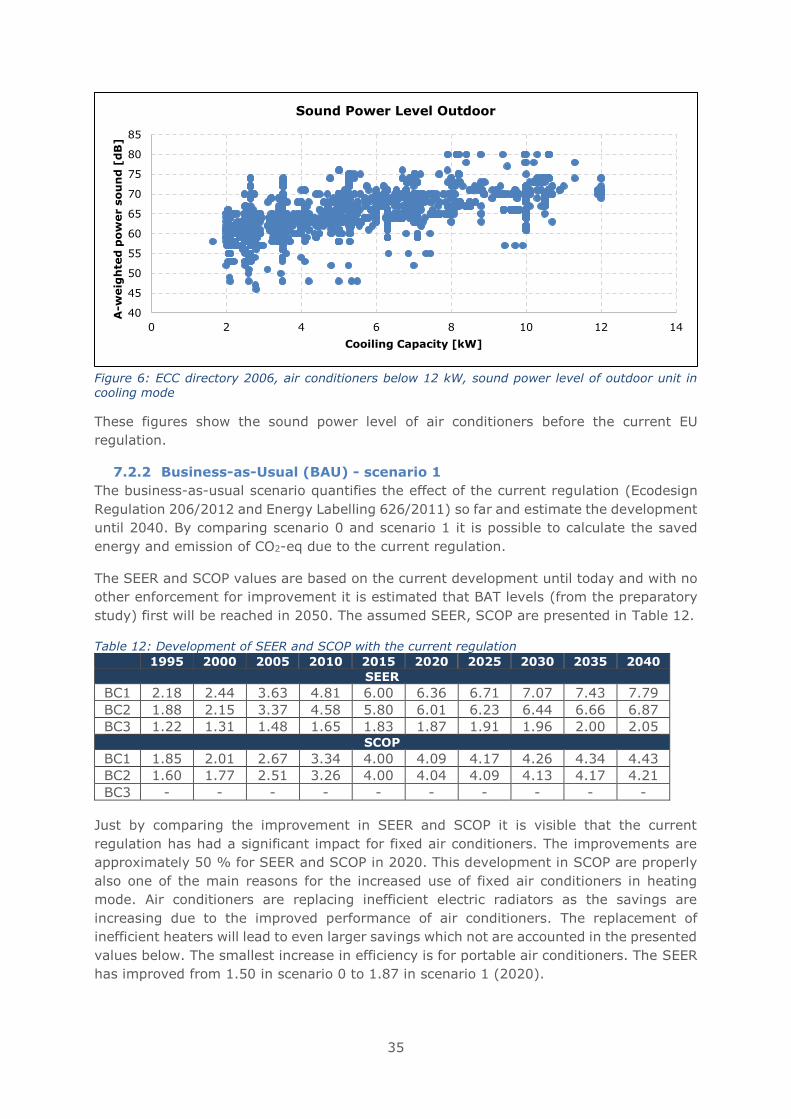
35
Figure 6: ECC directory 2006, air conditioners below 12 kW, sound power level of outdoor unit in cooling mode
These figures show the sound power level of air conditioners before the current EU
regulation.
7.2.2 Business-as-Usual (BAU) - scenario 1
The business-as-usual scenario quantifies the effect of the current regulation (Ecodesign
Regulation 206/2012 and Energy Labelling 626/2011) so far and estimate the development
until 2040. By comparing scenario 0 and scenario 1 it is possible to calculate the saved
energy and emission of CO2-eq due to the current regulation.
The SEER and SCOP values are based on the current development until today and with no
other enforcement for improvement it is estimated that BAT levels (from the preparatory
study) first will be reached in 2050. The assumed SEER, SCOP are presented in Table 12.
Table 12: Development of SEER and SCOP with the current regulation
1995 2000 2005 2010 2015 2020 2025 2030 2035 2040
SEER
BC1 2.18 2.44 3.63 4.81 6.00 6.36 6.71 7.07 7.43 7.79
BC2 1.88 2.15 3.37 4.58 5.80 6.01 6.23 6.44 6.66 6.87
BC3 1.22 1.31 1.48 1.65 1.83 1.87 1.91 1.96 2.00 2.05 SCOP
BC1 1.85 2.01 2.67 3.34 4.00 4.09 4.17 4.26 4.34 4.43
BC2 1.60 1.77 2.51 3.26 4.00 4.04 4.09 4.13 4.17 4.21
BC3 - - - - - - - - - -
Just by comparing the improvement in SEER and SCOP it is visible that the current
regulation has had a significant impact for fixed air conditioners. The improvements are
approximately 50 % for SEER and SCOP in 2020. This development in SCOP are properly
also one of the main reasons for the increased use of fixed air conditioners in heating
mode. Air conditioners are replacing inefficient electric radiators as the savings are
increasing due to the improved performance of air conditioners. The replacement of
inefficient heaters will lead to even larger savings which not are accounted in the presented
values below. The smallest increase in efficiency is for portable air conditioners. The SEER
has improved from 1.50 in scenario 0 to 1.87 in scenario 1 (2020).
40
45
50
55
60
65
70
75
80
85
0 2 4 6 8 10 12 14
A-w
eig
hte
d p
ow
er s
ou
nd
[d
B]
Cooiling Capacity [kW]
Sound Power Level Outdoor
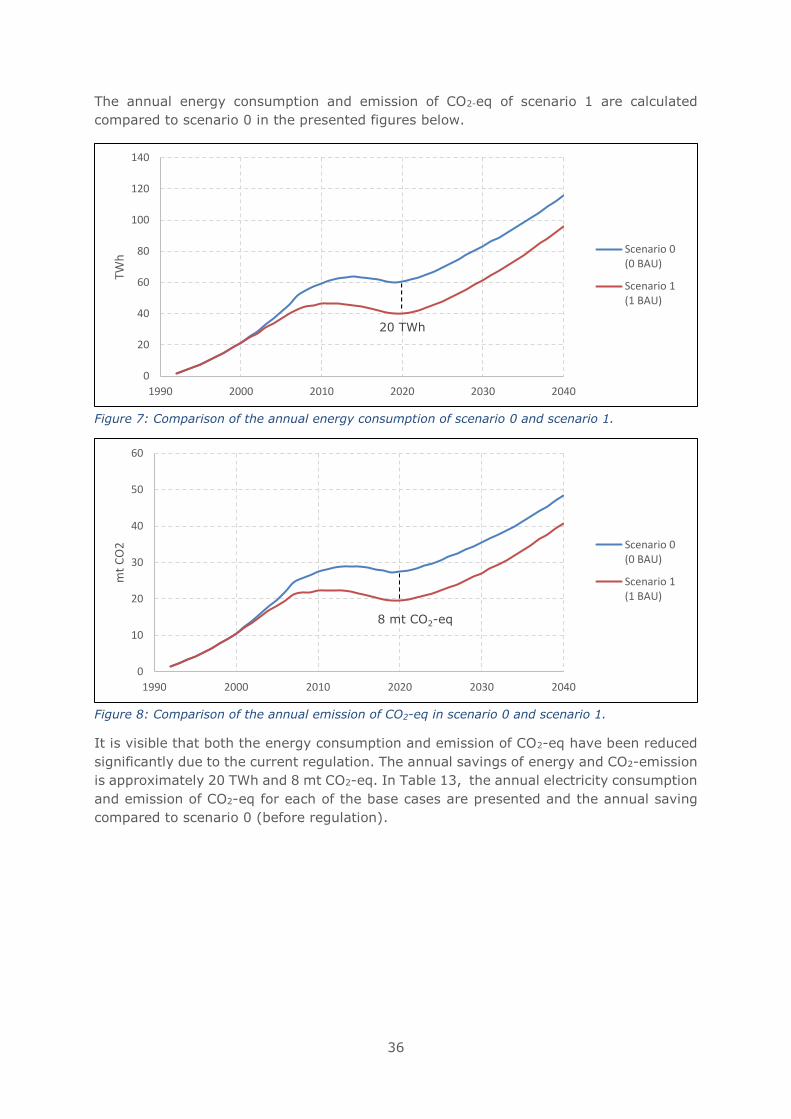
36
The annual energy consumption and emission of CO2-eq of scenario 1 are calculated
compared to scenario 0 in the presented figures below.
Figure 7: Comparison of the annual energy consumption of scenario 0 and scenario 1.
Figure 8: Comparison of the annual emission of CO2-eq in scenario 0 and scenario 1.
It is visible that both the energy consumption and emission of CO2-eq have been reduced
significantly due to the current regulation. The annual savings of energy and CO2-emission
is approximately 20 TWh and 8 mt CO2-eq. In Table 13, the annual electricity consumption
and emission of CO2-eq for each of the base cases are presented and the annual saving
compared to scenario 0 (before regulation).
0
20
40
60
80
100
120
140
1990 2000 2010 2020 2030 2040
TWh
Scenario 0(0 BAU)
Scenario 1(1 BAU)
20 TWh
0
10
20
30
40
50
60
1990 2000 2010 2020 2030 2040
mt
CO
2 Scenario 0(0 BAU)
Scenario 1(1 BAU)
8 mt CO2-eq
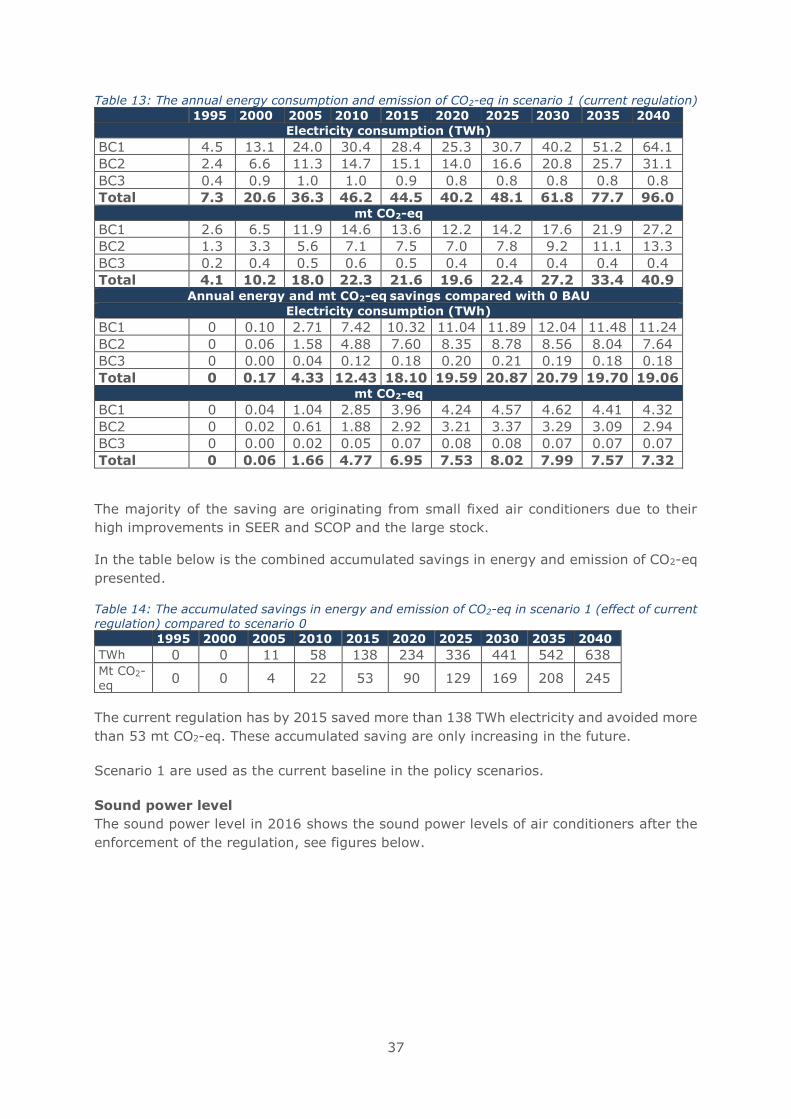
37
Table 13: The annual energy consumption and emission of CO2-eq in scenario 1 (current regulation)
1995 2000 2005 2010 2015 2020 2025 2030 2035 2040
Electricity consumption (TWh)
BC1 4.5 13.1 24.0 30.4 28.4 25.3 30.7 40.2 51.2 64.1
BC2 2.4 6.6 11.3 14.7 15.1 14.0 16.6 20.8 25.7 31.1
BC3 0.4 0.9 1.0 1.0 0.9 0.8 0.8 0.8 0.8 0.8
Total 7.3 20.6 36.3 46.2 44.5 40.2 48.1 61.8 77.7 96.0 mt CO2-eq
BC1 2.6 6.5 11.9 14.6 13.6 12.2 14.2 17.6 21.9 27.2
BC2 1.3 3.3 5.6 7.1 7.5 7.0 7.8 9.2 11.1 13.3
BC3 0.2 0.4 0.5 0.6 0.5 0.4 0.4 0.4 0.4 0.4
Total 4.1 10.2 18.0 22.3 21.6 19.6 22.4 27.2 33.4 40.9 Annual energy and mt CO2-eq savings compared with 0 BAU
Electricity consumption (TWh)
BC1 0 0.10 2.71 7.42 10.32 11.04 11.89 12.04 11.48 11.24
BC2 0 0.06 1.58 4.88 7.60 8.35 8.78 8.56 8.04 7.64
BC3 0 0.00 0.04 0.12 0.18 0.20 0.21 0.19 0.18 0.18
Total 0 0.17 4.33 12.43 18.10 19.59 20.87 20.79 19.70 19.06 mt CO2-eq
BC1 0 0.04 1.04 2.85 3.96 4.24 4.57 4.62 4.41 4.32
BC2 0 0.02 0.61 1.88 2.92 3.21 3.37 3.29 3.09 2.94
BC3 0 0.00 0.02 0.05 0.07 0.08 0.08 0.07 0.07 0.07
Total 0 0.06 1.66 4.77 6.95 7.53 8.02 7.99 7.57 7.32
The majority of the saving are originating from small fixed air conditioners due to their
high improvements in SEER and SCOP and the large stock.
In the table below is the combined accumulated savings in energy and emission of CO2-eq
presented.
Table 14: The accumulated savings in energy and emission of CO2-eq in scenario 1 (effect of current regulation) compared to scenario 0
1995 2000 2005 2010 2015 2020 2025 2030 2035 2040
TWh 0 0 11 58 138 234 336 441 542 638 Mt CO2-eq
0 0 4 22 53 90 129 169 208 245
The current regulation has by 2015 saved more than 138 TWh electricity and avoided more
than 53 mt CO2-eq. These accumulated saving are only increasing in the future.
Scenario 1 are used as the current baseline in the policy scenarios.
Sound power level
The sound power level in 2016 shows the sound power levels of air conditioners after the
enforcement of the regulation, see figures below.
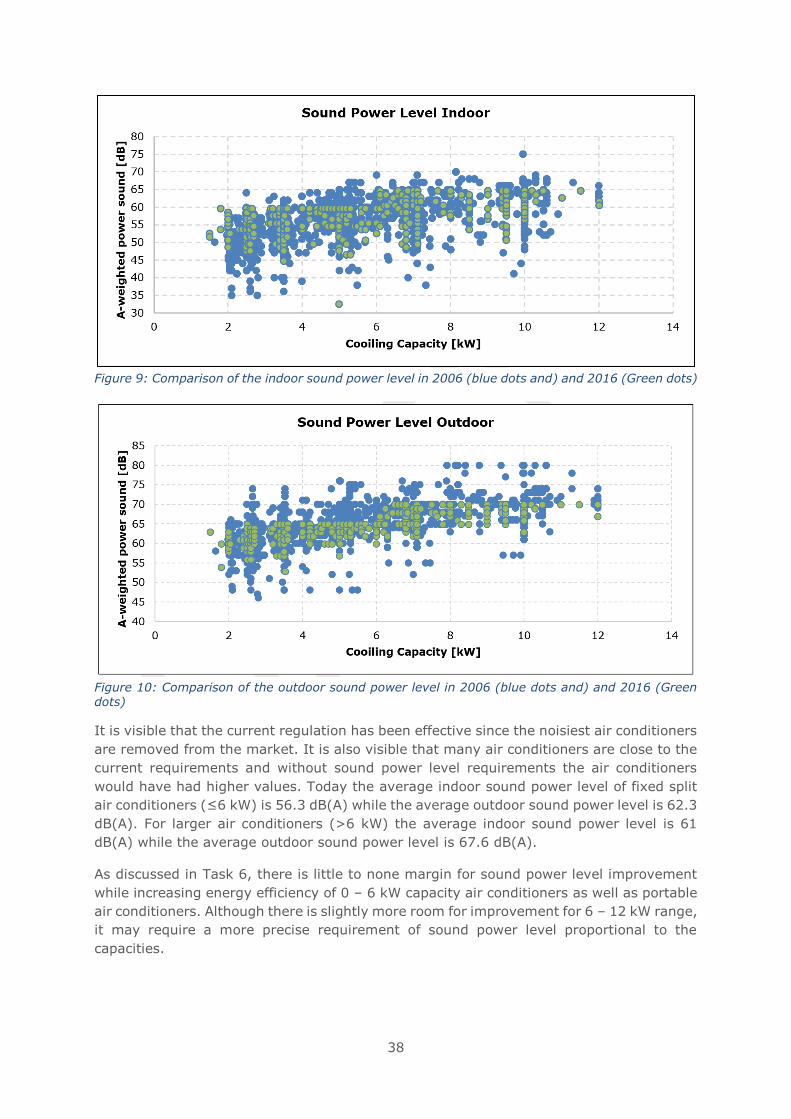
38
Figure 9: Comparison of the indoor sound power level in 2006 (blue dots and) and 2016 (Green dots)
Figure 10: Comparison of the outdoor sound power level in 2006 (blue dots and) and 2016 (Green dots)
It is visible that the current regulation has been effective since the noisiest air conditioners
are removed from the market. It is also visible that many air conditioners are close to the
current requirements and without sound power level requirements the air conditioners
would have had higher values. Today the average indoor sound power level of fixed split
air conditioners (≤6 kW) is 56.3 dB(A) while the average outdoor sound power level is 62.3
dB(A). For larger air conditioners (>6 kW) the average indoor sound power level is 61
dB(A) while the average outdoor sound power level is 67.6 dB(A).
As discussed in Task 6, there is little to none margin for sound power level improvement
while increasing energy efficiency of 0 – 6 kW capacity air conditioners as well as portable
air conditioners. Although there is slightly more room for improvement for 6 – 12 kW range,
it may require a more precise requirement of sound power level proportional to the
capacities.
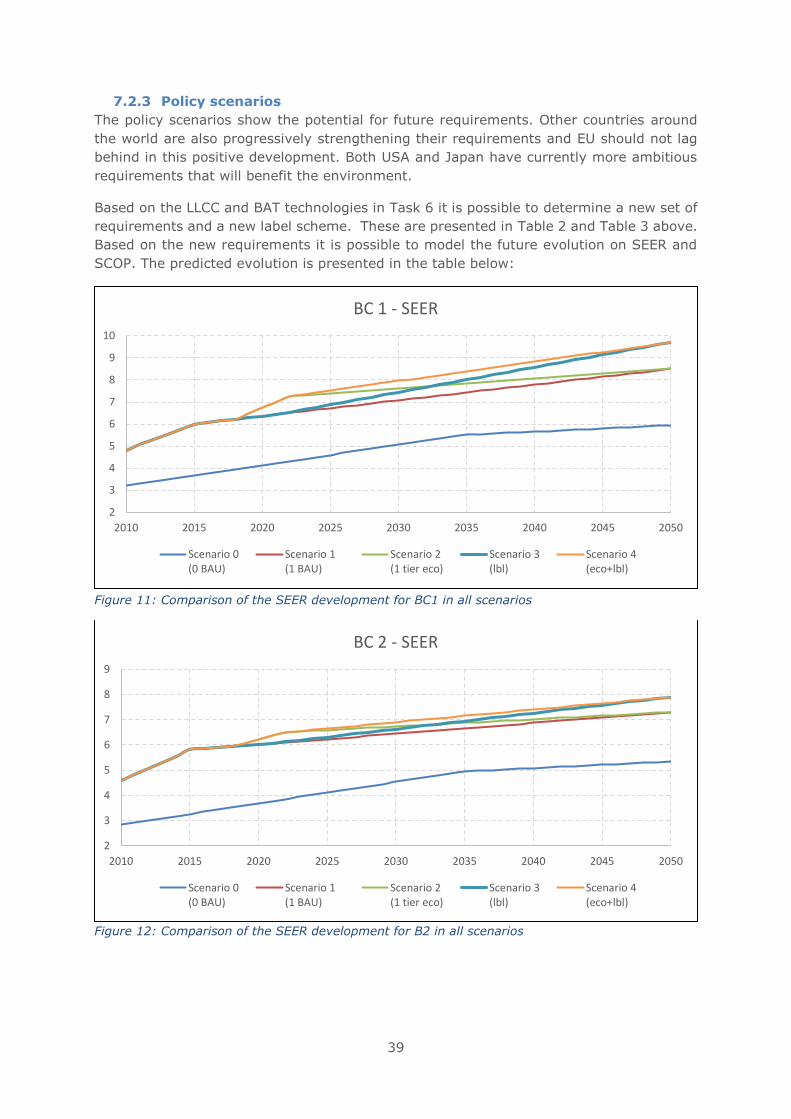
39
7.2.3 Policy scenarios
The policy scenarios show the potential for future requirements. Other countries around
the world are also progressively strengthening their requirements and EU should not lag
behind in this positive development. Both USA and Japan have currently more ambitious
requirements that will benefit the environment.
Based on the LLCC and BAT technologies in Task 6 it is possible to determine a new set of
requirements and a new label scheme. These are presented in Table 2 and Table 3 above.
Based on the new requirements it is possible to model the future evolution on SEER and
SCOP. The predicted evolution is presented in the table below:
Figure 11: Comparison of the SEER development for BC1 in all scenarios
Figure 12: Comparison of the SEER development for B2 in all scenarios
2
3
4
5
6
7
8
9
10
2010 2015 2020 2025 2030 2035 2040 2045 2050
BC 1 - SEER
Scenario 0(0 BAU)
Scenario 1(1 BAU)
Scenario 2(1 tier eco)
Scenario 3(lbl)
Scenario 4(eco+lbl)
2
3
4
5
6
7
8
9
2010 2015 2020 2025 2030 2035 2040 2045 2050
BC 2 - SEER
Scenario 0(0 BAU)
Scenario 1(1 BAU)
Scenario 2(1 tier eco)
Scenario 3(lbl)
Scenario 4(eco+lbl)
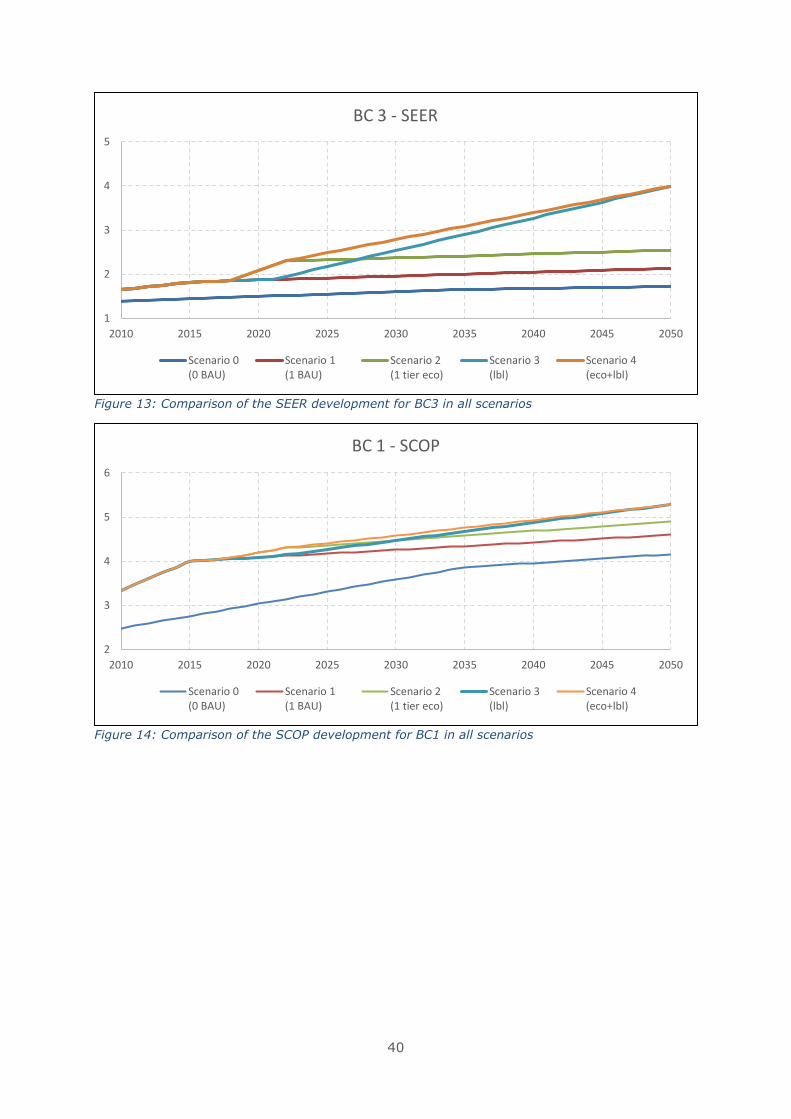
40
Figure 13: Comparison of the SEER development for BC3 in all scenarios
Figure 14: Comparison of the SCOP development for BC1 in all scenarios
1
2
3
4
5
2010 2015 2020 2025 2030 2035 2040 2045 2050
BC 3 - SEER
Scenario 0(0 BAU)
Scenario 1(1 BAU)
Scenario 2(1 tier eco)
Scenario 3(lbl)
Scenario 4(eco+lbl)
2
3
4
5
6
2010 2015 2020 2025 2030 2035 2040 2045 2050
BC 1 - SCOP
Scenario 0(0 BAU)
Scenario 1(1 BAU)
Scenario 2(1 tier eco)
Scenario 3(lbl)
Scenario 4(eco+lbl)
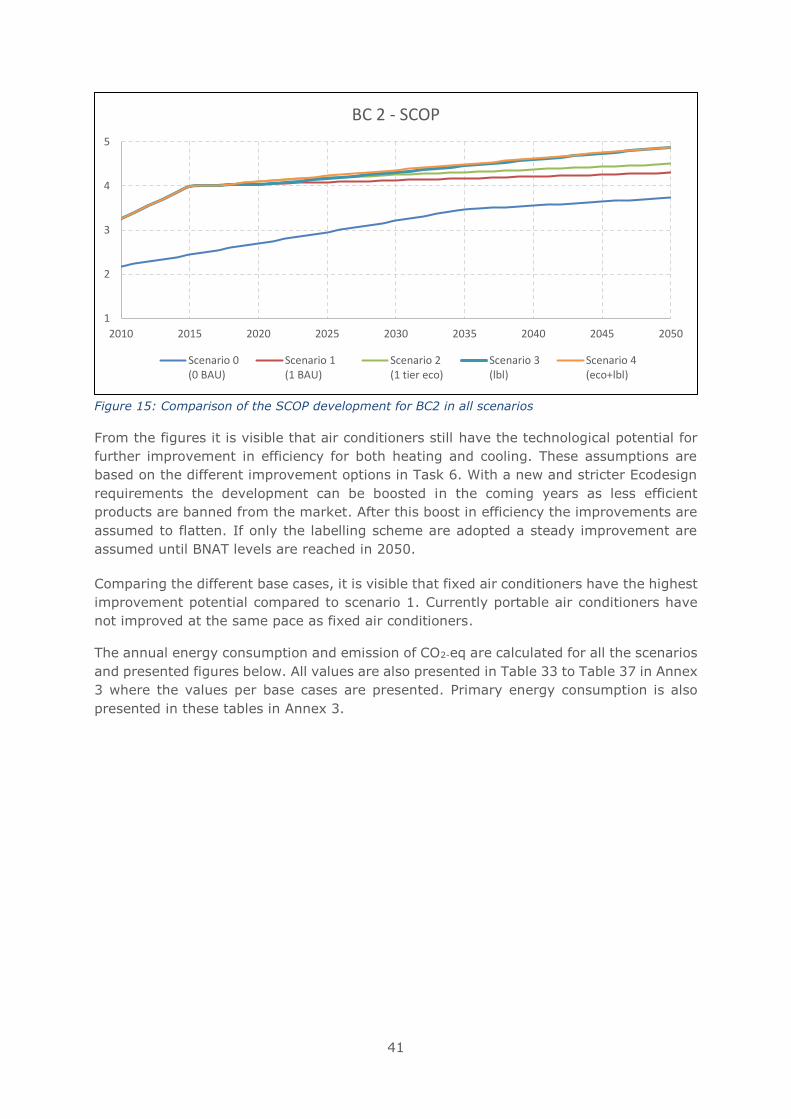
41
Figure 15: Comparison of the SCOP development for BC2 in all scenarios
From the figures it is visible that air conditioners still have the technological potential for
further improvement in efficiency for both heating and cooling. These assumptions are
based on the different improvement options in Task 6. With a new and stricter Ecodesign
requirements the development can be boosted in the coming years as less efficient
products are banned from the market. After this boost in efficiency the improvements are
assumed to flatten. If only the labelling scheme are adopted a steady improvement are
assumed until BNAT levels are reached in 2050.
Comparing the different base cases, it is visible that fixed air conditioners have the highest
improvement potential compared to scenario 1. Currently portable air conditioners have
not improved at the same pace as fixed air conditioners.
The annual energy consumption and emission of CO2-eq are calculated for all the scenarios
and presented figures below. All values are also presented in Table 33 to Table 37 in Annex
3 where the values per base cases are presented. Primary energy consumption is also
presented in these tables in Annex 3.
1
2
3
4
5
2010 2015 2020 2025 2030 2035 2040 2045 2050
BC 2 - SCOP
Scenario 0(0 BAU)
Scenario 1(1 BAU)
Scenario 2(1 tier eco)
Scenario 3(lbl)
Scenario 4(eco+lbl)
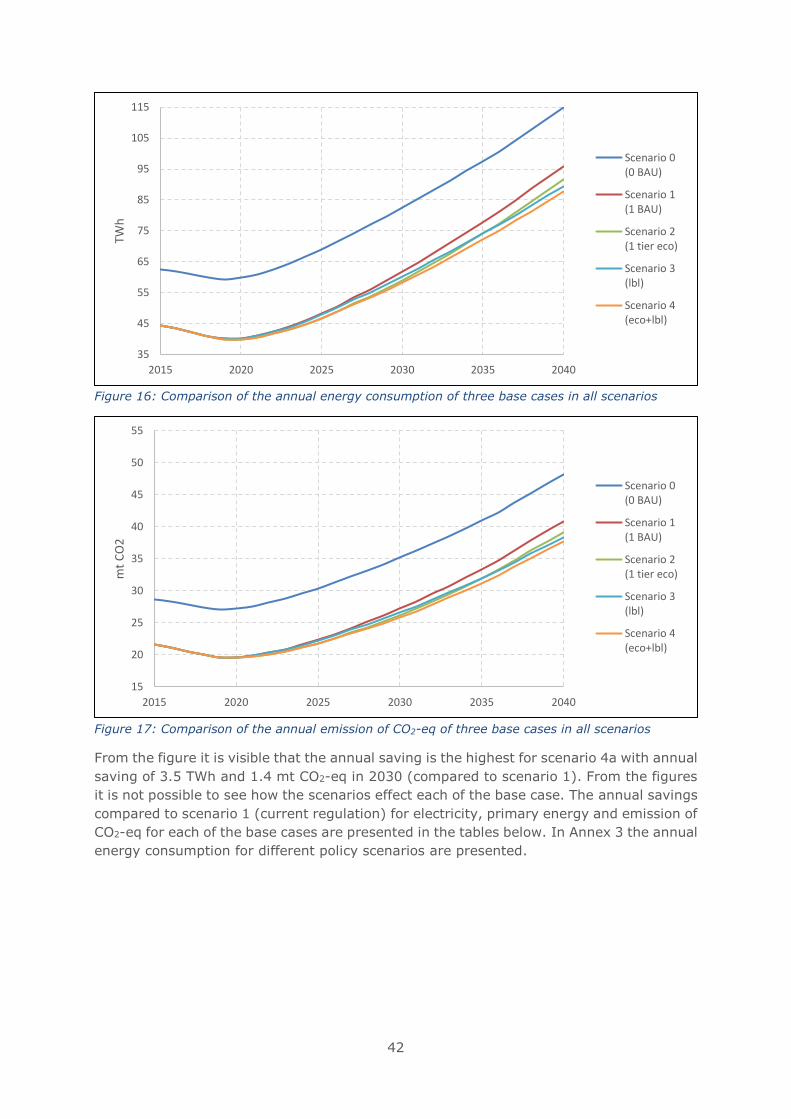
42
Figure 16: Comparison of the annual energy consumption of three base cases in all scenarios
Figure 17: Comparison of the annual emission of CO2-eq of three base cases in all scenarios
From the figure it is visible that the annual saving is the highest for scenario 4a with annual
saving of 3.5 TWh and 1.4 mt CO2-eq in 2030 (compared to scenario 1). From the figures
it is not possible to see how the scenarios effect each of the base case. The annual savings
compared to scenario 1 (current regulation) for electricity, primary energy and emission of
CO2-eq for each of the base cases are presented in the tables below. In Annex 3 the annual
energy consumption for different policy scenarios are presented.
35
45
55
65
75
85
95
105
115
2015 2020 2025 2030 2035 2040
TWh
Scenario 0(0 BAU)
Scenario 1(1 BAU)
Scenario 2(1 tier eco)
Scenario 3(lbl)
Scenario 4(eco+lbl)
15
20
25
30
35
40
45
50
55
2015 2020 2025 2030 2035 2040
mt
CO
2
Scenario 0(0 BAU)
Scenario 1(1 BAU)
Scenario 2(1 tier eco)
Scenario 3(lbl)
Scenario 4(eco+lbl)
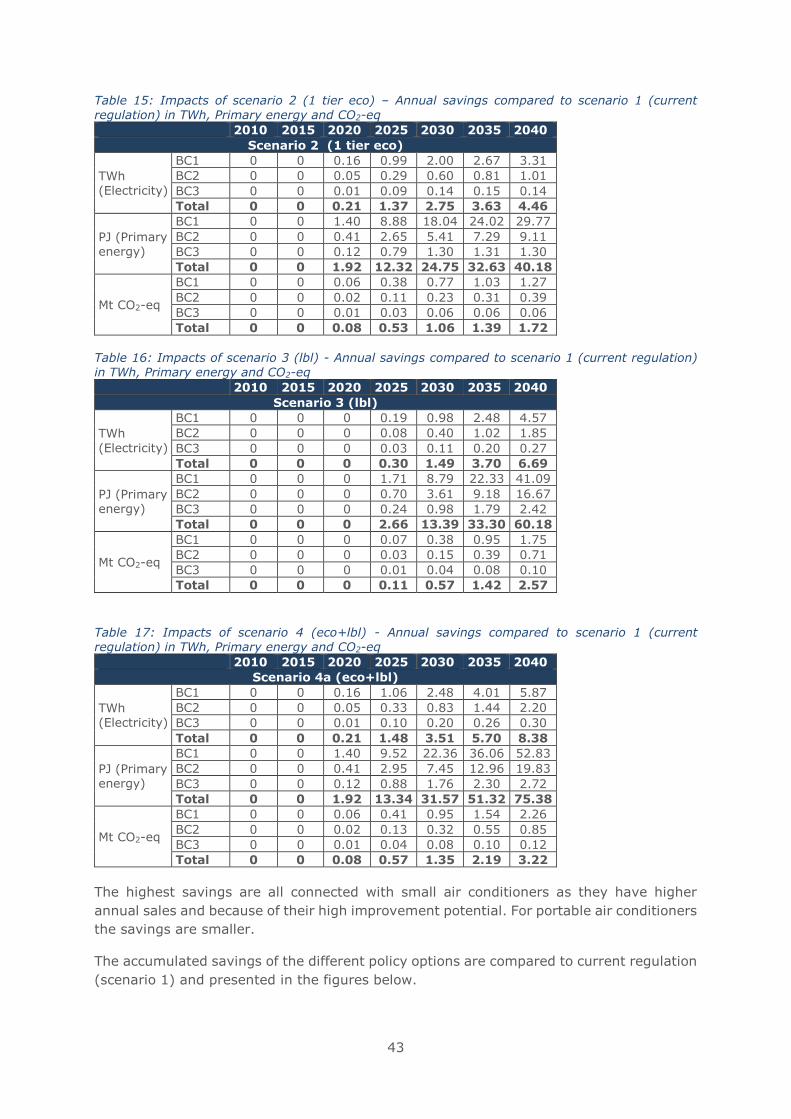
43
Table 15: Impacts of scenario 2 (1 tier eco) – Annual savings compared to scenario 1 (current
regulation) in TWh, Primary energy and CO2-eq
2010 2015 2020 2025 2030 2035 2040
Scenario 2 (1 tier eco)
TWh (Electricity)
BC1 0 0 0.16 0.99 2.00 2.67 3.31
BC2 0 0 0.05 0.29 0.60 0.81 1.01
BC3 0 0 0.01 0.09 0.14 0.15 0.14
Total 0 0 0.21 1.37 2.75 3.63 4.46
PJ (Primary energy)
BC1 0 0 1.40 8.88 18.04 24.02 29.77
BC2 0 0 0.41 2.65 5.41 7.29 9.11
BC3 0 0 0.12 0.79 1.30 1.31 1.30
Total 0 0 1.92 12.32 24.75 32.63 40.18
Mt CO2-eq
BC1 0 0 0.06 0.38 0.77 1.03 1.27
BC2 0 0 0.02 0.11 0.23 0.31 0.39
BC3 0 0 0.01 0.03 0.06 0.06 0.06
Total 0 0 0.08 0.53 1.06 1.39 1.72
Table 16: Impacts of scenario 3 (lbl) - Annual savings compared to scenario 1 (current regulation) in TWh, Primary energy and CO2-eq
2010 2015 2020 2025 2030 2035 2040
Scenario 3 (lbl)
TWh
(Electricity)
BC1 0 0 0 0.19 0.98 2.48 4.57
BC2 0 0 0 0.08 0.40 1.02 1.85
BC3 0 0 0 0.03 0.11 0.20 0.27
Total 0 0 0 0.30 1.49 3.70 6.69
PJ (Primary energy)
BC1 0 0 0 1.71 8.79 22.33 41.09
BC2 0 0 0 0.70 3.61 9.18 16.67
BC3 0 0 0 0.24 0.98 1.79 2.42
Total 0 0 0 2.66 13.39 33.30 60.18
Mt CO2-eq
BC1 0 0 0 0.07 0.38 0.95 1.75
BC2 0 0 0 0.03 0.15 0.39 0.71
BC3 0 0 0 0.01 0.04 0.08 0.10
Total 0 0 0 0.11 0.57 1.42 2.57
Table 17: Impacts of scenario 4 (eco+lbl) - Annual savings compared to scenario 1 (current regulation) in TWh, Primary energy and CO2-eq
2010 2015 2020 2025 2030 2035 2040
Scenario 4a (eco+lbl)
TWh (Electricity)
BC1 0 0 0.16 1.06 2.48 4.01 5.87
BC2 0 0 0.05 0.33 0.83 1.44 2.20
BC3 0 0 0.01 0.10 0.20 0.26 0.30
Total 0 0 0.21 1.48 3.51 5.70 8.38
PJ (Primary energy)
BC1 0 0 1.40 9.52 22.36 36.06 52.83
BC2 0 0 0.41 2.95 7.45 12.96 19.83
BC3 0 0 0.12 0.88 1.76 2.30 2.72
Total 0 0 1.92 13.34 31.57 51.32 75.38
Mt CO2-eq
BC1 0 0 0.06 0.41 0.95 1.54 2.26
BC2 0 0 0.02 0.13 0.32 0.55 0.85
BC3 0 0 0.01 0.04 0.08 0.10 0.12
Total 0 0 0.08 0.57 1.35 2.19 3.22
The highest savings are all connected with small air conditioners as they have higher
annual sales and because of their high improvement potential. For portable air conditioners
the savings are smaller.
The accumulated savings of the different policy options are compared to current regulation
(scenario 1) and presented in the figures below.
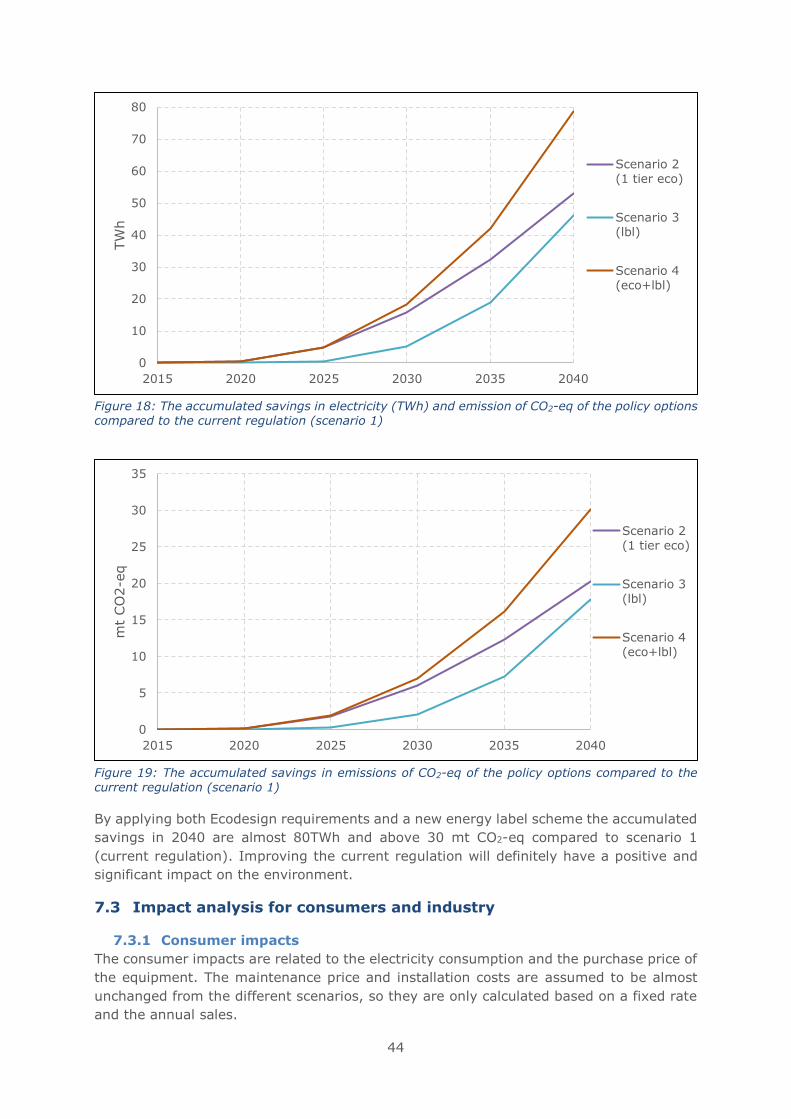
44
Figure 18: The accumulated savings in electricity (TWh) and emission of CO2-eq of the policy options compared to the current regulation (scenario 1)
Figure 19: The accumulated savings in emissions of CO2-eq of the policy options compared to the current regulation (scenario 1)
By applying both Ecodesign requirements and a new energy label scheme the accumulated
savings in 2040 are almost 80TWh and above 30 mt CO2-eq compared to scenario 1
(current regulation). Improving the current regulation will definitely have a positive and
significant impact on the environment.
7.3 Impact analysis for consumers and industry
7.3.1 Consumer impacts
The consumer impacts are related to the electricity consumption and the purchase price of
the equipment. The maintenance price and installation costs are assumed to be almost
unchanged from the different scenarios, so they are only calculated based on a fixed rate
and the annual sales.
0
10
20
30
40
50
60
70
80
2015 2020 2025 2030 2035 2040
TW
h
Scenario 2
(1 tier eco)
Scenario 3
(lbl)
Scenario 4(eco+lbl)
0
5
10
15
20
25
30
35
2015 2020 2025 2030 2035 2040
mt
CO
2-e
q
Scenario 2
(1 tier eco)
Scenario 3
(lbl)
Scenario 4
(eco+lbl)
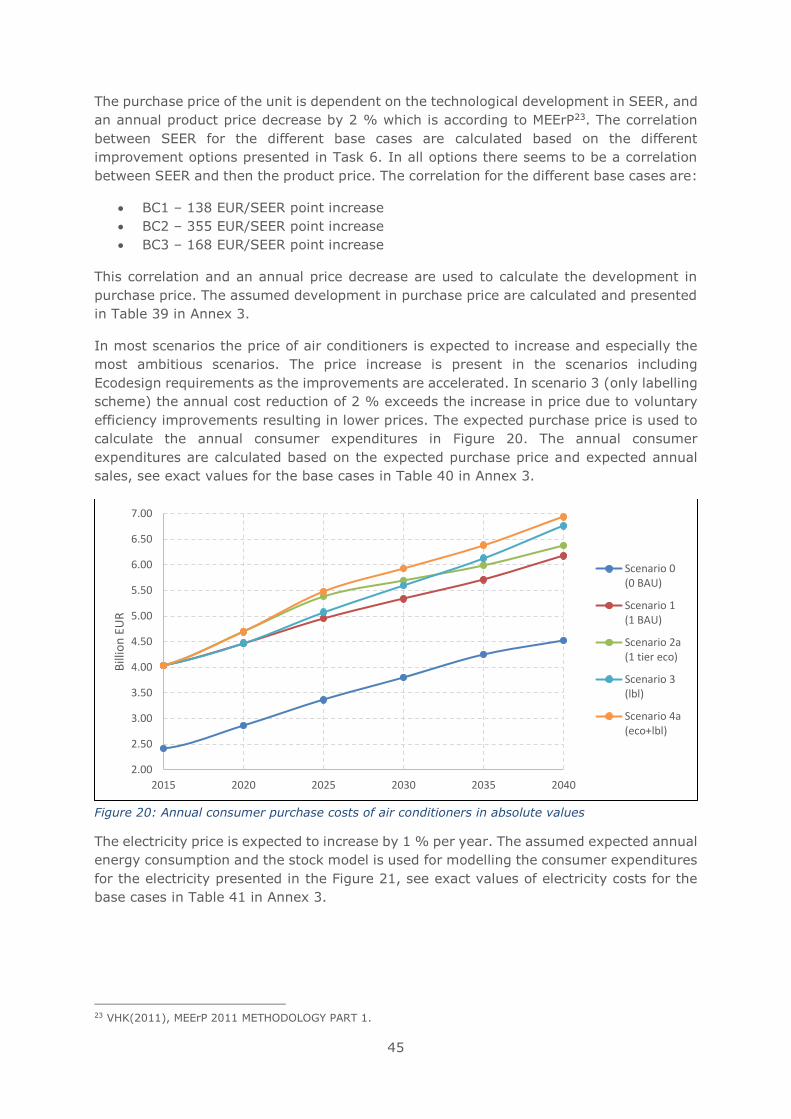
45
The purchase price of the unit is dependent on the technological development in SEER, and
an annual product price decrease by 2 % which is according to MEErP23. The correlation
between SEER for the different base cases are calculated based on the different
improvement options presented in Task 6. In all options there seems to be a correlation
between SEER and then the product price. The correlation for the different base cases are:
• BC1 – 138 EUR/SEER point increase
• BC2 – 355 EUR/SEER point increase
• BC3 – 168 EUR/SEER point increase
This correlation and an annual price decrease are used to calculate the development in
purchase price. The assumed development in purchase price are calculated and presented
in Table 39 in Annex 3.
In most scenarios the price of air conditioners is expected to increase and especially the
most ambitious scenarios. The price increase is present in the scenarios including
Ecodesign requirements as the improvements are accelerated. In scenario 3 (only labelling
scheme) the annual cost reduction of 2 % exceeds the increase in price due to voluntary
efficiency improvements resulting in lower prices. The expected purchase price is used to
calculate the annual consumer expenditures in Figure 20. The annual consumer
expenditures are calculated based on the expected purchase price and expected annual
sales, see exact values for the base cases in Table 40 in Annex 3.
Figure 20: Annual consumer purchase costs of air conditioners in absolute values
The electricity price is expected to increase by 1 % per year. The assumed expected annual
energy consumption and the stock model is used for modelling the consumer expenditures
for the electricity presented in the Figure 21, see exact values of electricity costs for the
base cases in Table 41 in Annex 3.
23 VHK(2011), MEErP 2011 METHODOLOGY PART 1.
2.00
2.50
3.00
3.50
4.00
4.50
5.00
5.50
6.00
6.50
7.00
2015 2020 2025 2030 2035 2040
Bill
ion
EU
R
Scenario 0(0 BAU)
Scenario 1(1 BAU)
Scenario 2a(1 tier eco)
Scenario 3(lbl)
Scenario 4a(eco+lbl)
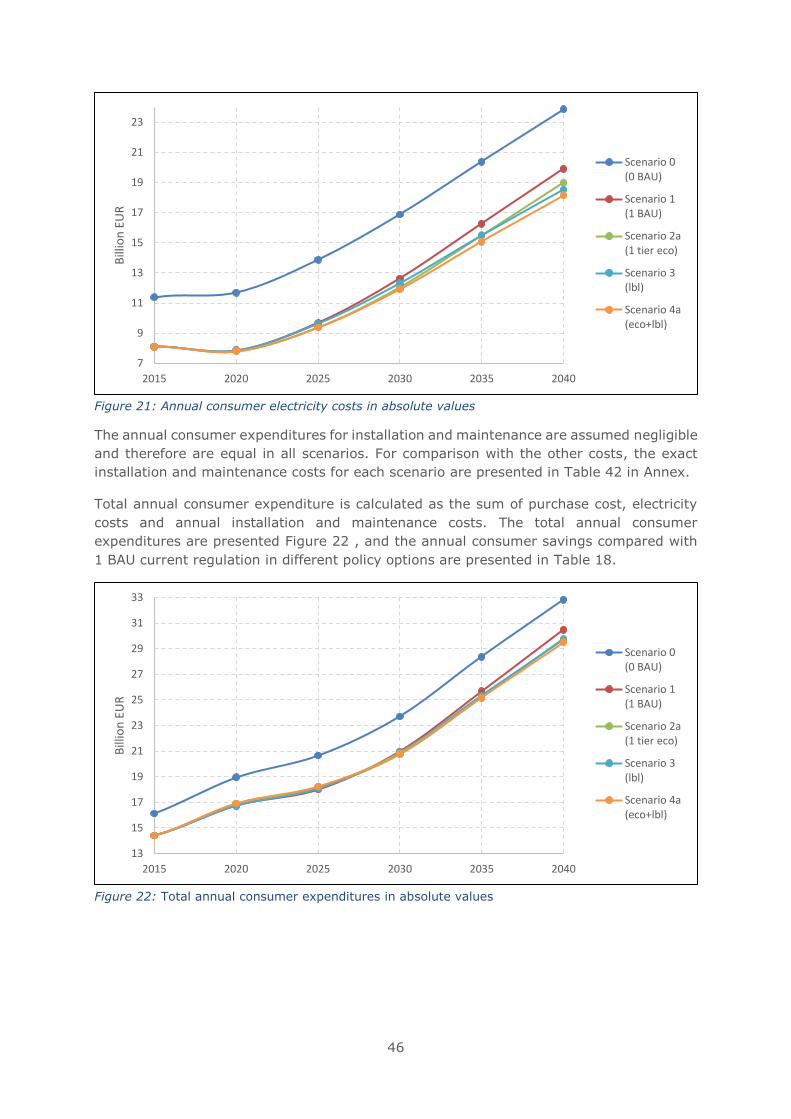
46
Figure 21: Annual consumer electricity costs in absolute values
The annual consumer expenditures for installation and maintenance are assumed negligible
and therefore are equal in all scenarios. For comparison with the other costs, the exact
installation and maintenance costs for each scenario are presented in Table 42 in Annex.
Total annual consumer expenditure is calculated as the sum of purchase cost, electricity
costs and annual installation and maintenance costs. The total annual consumer
expenditures are presented Figure 22 , and the annual consumer savings compared with
1 BAU current regulation in different policy options are presented in Table 18.
Figure 22: Total annual consumer expenditures in absolute values
7
9
11
13
15
17
19
21
23
2015 2020 2025 2030 2035 2040
Bill
ion
EU
R
Scenario 0(0 BAU)
Scenario 1(1 BAU)
Scenario 2a(1 tier eco)
Scenario 3(lbl)
Scenario 4a(eco+lbl)
13
15
17
19
21
23
25
27
29
31
33
2015 2020 2025 2030 2035 2040
Bill
ion
EU
R
Scenario 0(0 BAU)
Scenario 1(1 BAU)
Scenario 2a(1 tier eco)
Scenario 3(lbl)
Scenario 4a(eco+lbl)
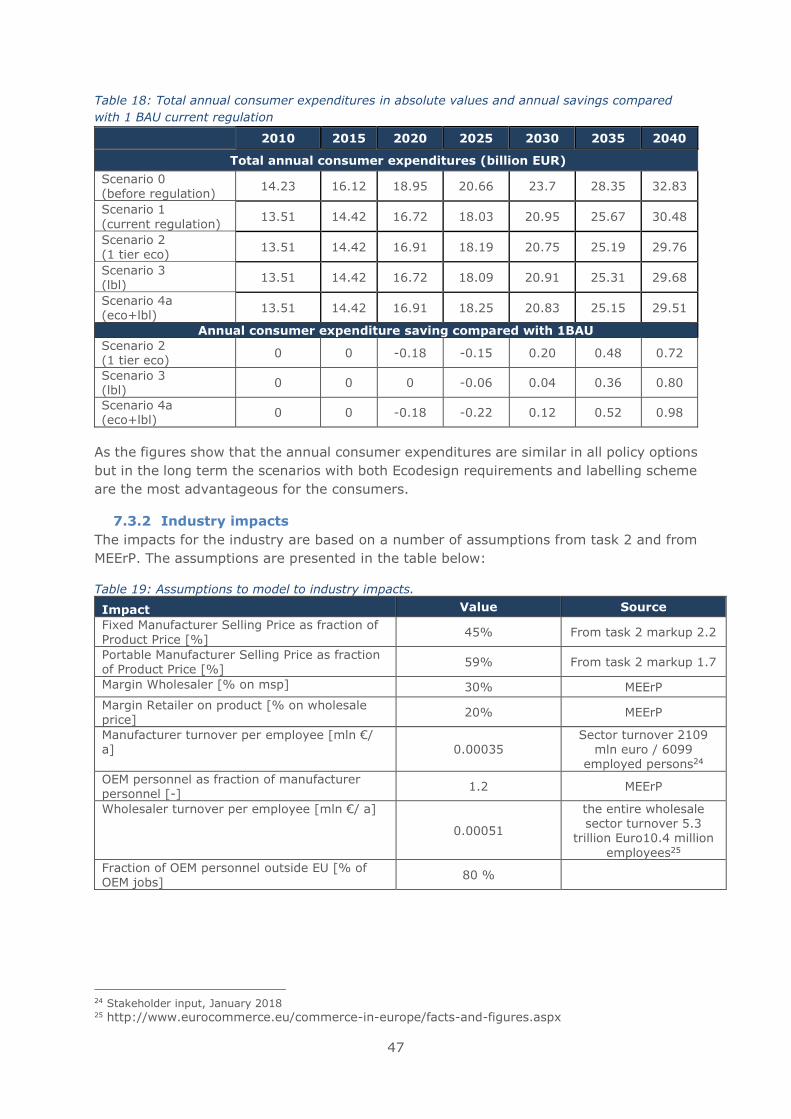
47
Table 18: Total annual consumer expenditures in absolute values and annual savings compared
with 1 BAU current regulation
2010 2015 2020 2025 2030 2035 2040
Total annual consumer expenditures (billion EUR)
Scenario 0 (before regulation)
14.23 16.12 18.95 20.66 23.7 28.35 32.83
Scenario 1
(current regulation) 13.51 14.42 16.72 18.03 20.95 25.67 30.48
Scenario 2 (1 tier eco)
13.51 14.42 16.91 18.19 20.75 25.19 29.76
Scenario 3 (lbl)
13.51 14.42 16.72 18.09 20.91 25.31 29.68
Scenario 4a (eco+lbl)
13.51 14.42 16.91 18.25 20.83 25.15 29.51
Annual consumer expenditure saving compared with 1BAU
Scenario 2 (1 tier eco)
0 0 -0.18 -0.15 0.20 0.48 0.72
Scenario 3 (lbl)
0 0 0 -0.06 0.04 0.36 0.80
Scenario 4a (eco+lbl)
0 0 -0.18 -0.22 0.12 0.52 0.98
As the figures show that the annual consumer expenditures are similar in all policy options
but in the long term the scenarios with both Ecodesign requirements and labelling scheme
are the most advantageous for the consumers.
7.3.2 Industry impacts
The impacts for the industry are based on a number of assumptions from task 2 and from
MEErP. The assumptions are presented in the table below:
Table 19: Assumptions to model to industry impacts.
Impact Value Source
Fixed Manufacturer Selling Price as fraction of
Product Price [%] 45% From task 2 markup 2.2
Portable Manufacturer Selling Price as fraction of Product Price [%]
59% From task 2 markup 1.7
Margin Wholesaler [% on msp] 30% MEErP
Margin Retailer on product [% on wholesale price]
20% MEErP
Manufacturer turnover per employee [mln €/ a] 0.00035
Sector turnover 2109 mln euro / 6099
employed persons24
OEM personnel as fraction of manufacturer personnel [-]
1.2 MEErP
Wholesaler turnover per employee [mln €/ a]
0.00051
the entire wholesale sector turnover 5.3
trillion Euro10.4 million
employees25
Fraction of OEM personnel outside EU [% of OEM jobs]
80 %
24 Stakeholder input, January 2018 25 http://www.eurocommerce.eu/commerce-in-europe/facts-and-figures.aspx
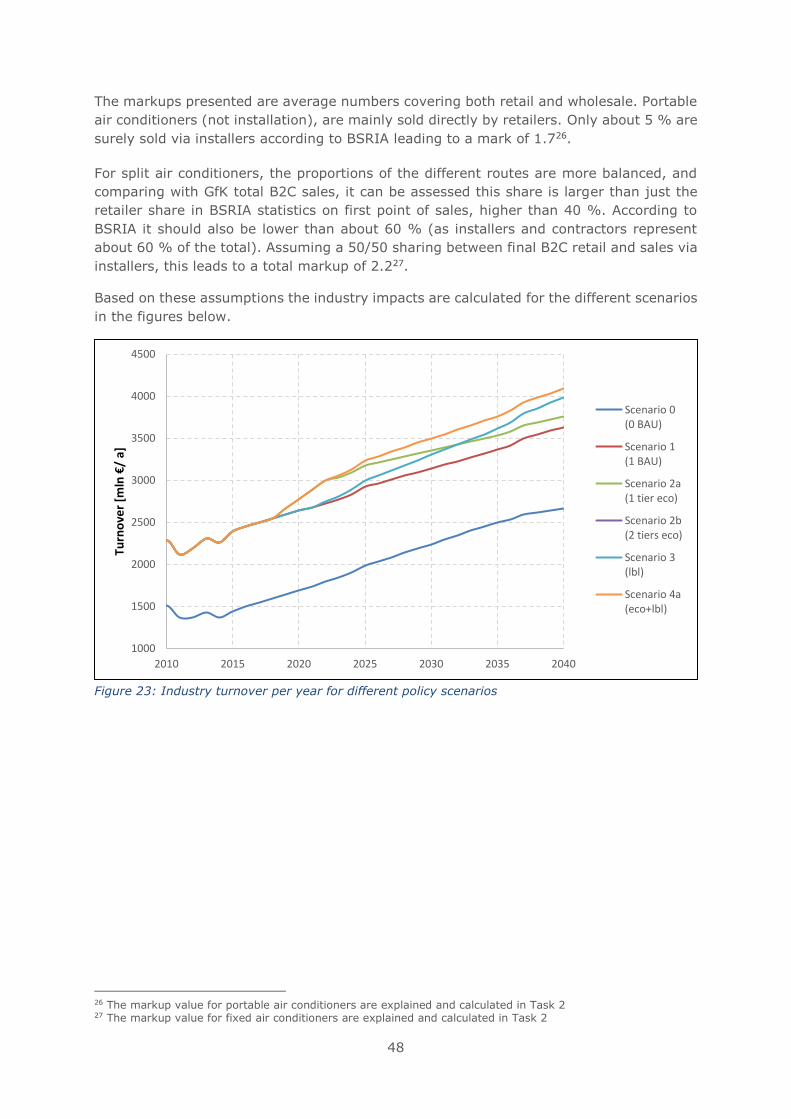
48
The markups presented are average numbers covering both retail and wholesale. Portable
air conditioners (not installation), are mainly sold directly by retailers. Only about 5 % are
surely sold via installers according to BSRIA leading to a mark of 1.726.
For split air conditioners, the proportions of the different routes are more balanced, and
comparing with GfK total B2C sales, it can be assessed this share is larger than just the
retailer share in BSRIA statistics on first point of sales, higher than 40 %. According to
BSRIA it should also be lower than about 60 % (as installers and contractors represent
about 60 % of the total). Assuming a 50/50 sharing between final B2C retail and sales via
installers, this leads to a total markup of 2.227.
Based on these assumptions the industry impacts are calculated for the different scenarios
in the figures below.
Figure 23: Industry turnover per year for different policy scenarios
26 The markup value for portable air conditioners are explained and calculated in Task 2 27 The markup value for fixed air conditioners are explained and calculated in Task 2
1000
1500
2000
2500
3000
3500
4000
4500
2010 2015 2020 2025 2030 2035 2040
Turn
ove
r [m
ln €
/ a]
Scenario 0(0 BAU)
Scenario 1(1 BAU)
Scenario 2a(1 tier eco)
Scenario 2b(2 tiers eco)
Scenario 3(lbl)
Scenario 4a(eco+lbl)
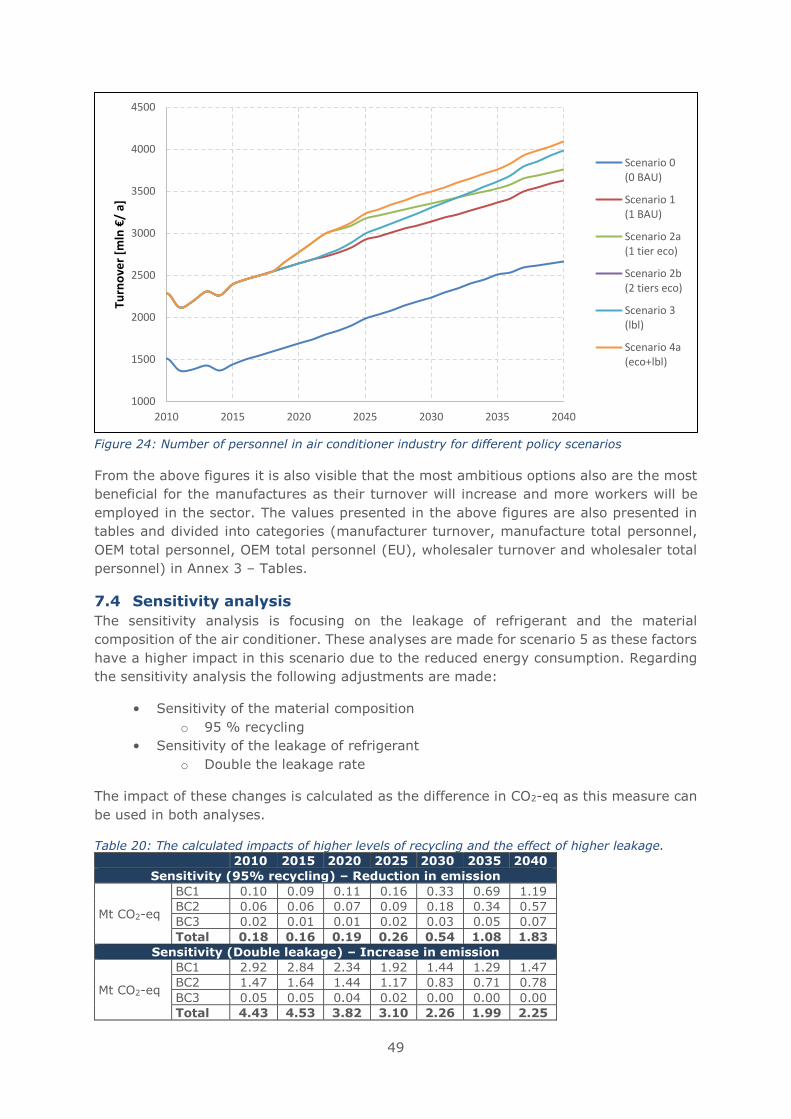
49
Figure 24: Number of personnel in air conditioner industry for different policy scenarios
From the above figures it is also visible that the most ambitious options also are the most
beneficial for the manufactures as their turnover will increase and more workers will be
employed in the sector. The values presented in the above figures are also presented in
tables and divided into categories (manufacturer turnover, manufacture total personnel,
OEM total personnel, OEM total personnel (EU), wholesaler turnover and wholesaler total
personnel) in Annex 3 – Tables.
7.4 Sensitivity analysis
The sensitivity analysis is focusing on the leakage of refrigerant and the material
composition of the air conditioner. These analyses are made for scenario 5 as these factors
have a higher impact in this scenario due to the reduced energy consumption. Regarding
the sensitivity analysis the following adjustments are made:
• Sensitivity of the material composition
o 95 % recycling
• Sensitivity of the leakage of refrigerant
o Double the leakage rate
The impact of these changes is calculated as the difference in CO2-eq as this measure can
be used in both analyses.
Table 20: The calculated impacts of higher levels of recycling and the effect of higher leakage.
2010 2015 2020 2025 2030 2035 2040
Sensitivity (95% recycling) – Reduction in emission
Mt CO2-eq
BC1 0.10 0.09 0.11 0.16 0.33 0.69 1.19
BC2 0.06 0.06 0.07 0.09 0.18 0.34 0.57
BC3 0.02 0.01 0.01 0.02 0.03 0.05 0.07
Total 0.18 0.16 0.19 0.26 0.54 1.08 1.83
Sensitivity (Double leakage) – Increase in emission
Mt CO2-eq
BC1 2.92 2.84 2.34 1.92 1.44 1.29 1.47
BC2 1.47 1.64 1.44 1.17 0.83 0.71 0.78
BC3 0.05 0.05 0.04 0.02 0.00 0.00 0.00
Total 4.43 4.53 3.82 3.10 2.26 1.99 2.25
1000
1500
2000
2500
3000
3500
4000
4500
2010 2015 2020 2025 2030 2035 2040
Turn
ove
r [m
ln €
/ a]
Scenario 0(0 BAU)
Scenario 1(1 BAU)
Scenario 2a(1 tier eco)
Scenario 2b(2 tiers eco)
Scenario 3(lbl)
Scenario 4a(eco+lbl)
50
Note that in Table 20, for 95% recycling rate, the figures are the reduction in emission, for
double leakage rate, the figures are the increase in emission
The sensitivity analysis show that increased recycling can reduce the annual emission of
CO2-eq with approximately 0.2 mt, but the recycling rates in this scenario are very
optimistic and may not be obtainable in the near future. If the leakage is higher (e.g. twice
as high) than assumed, then the emission of CO2-eq be 3.8 mt higher in 2020. Due to the
f-gas regulation this impact is reduced to 2.3 mt CO2-eq in 2040 and the impact of leakage
is reduced. These tables are also presented in absolute values in Table 49 in Annex 3.
It is also proposed that sensitivity analysis to be carried out for product prices and
overcosts in the impact assessment.
7.5 Comparison of air-to-air heat pumps and other heating products
Air-to-air heat pump, despite being a specific product group and having presently its own
Ecodesign and Labelling regulations (No. 206/2012 and 626/2011), are competing with
other heating means. This includes, direct electric heating, larger than 12 kW air-to-air
heat pumps, but also water-based heating solutions.
From an end-user point of view, it would be easier if all these products competing on the
heating function could be compared directly, for instance using the same energy label or
energy class scale.
Above national differences, it should also be avoided that minimum performance
requirements and or different labelling scale lead to distort the heating market in a wrong
direction (i.e. leading to more energy consumption or CO2 emissions). For instance, to
excessively increase minimum efficiency requirement for air-to-air heat pumps could
significantly increase their price making those units less affordable. It could thus affect
their sales and make direct electric heating more economical for buildings with average to
low heat loads. The same might be true for consumers who consider replacing fossil fuel
boiler with air-to-air heat pumps at the time when heating system and generator need to
be replaced.
Ecodesign and Energy Labelling Directive only require impact assessment including
environmental impacts, costs and competitiveness within the same product group. As
competition exists between this various product groups that all have the same "space
heating" function, it is advised to include a supplementary dimension in the impact
assessment of future or revised Ecodesign and labelling regulations or to conduct a
dedicated study on the comparison of the proposed and existing regulations across the
different product groups that offer space heating.
7.6 Conclusions and recommendations
Policy options
Based on the assessment, the following policy options are chosen for further analysis:
• No action option – Business as usual (BAU), the current regulations are to be
retained as they are. This BAU scenario will be used as reference for comparison
with other policy scenarios.
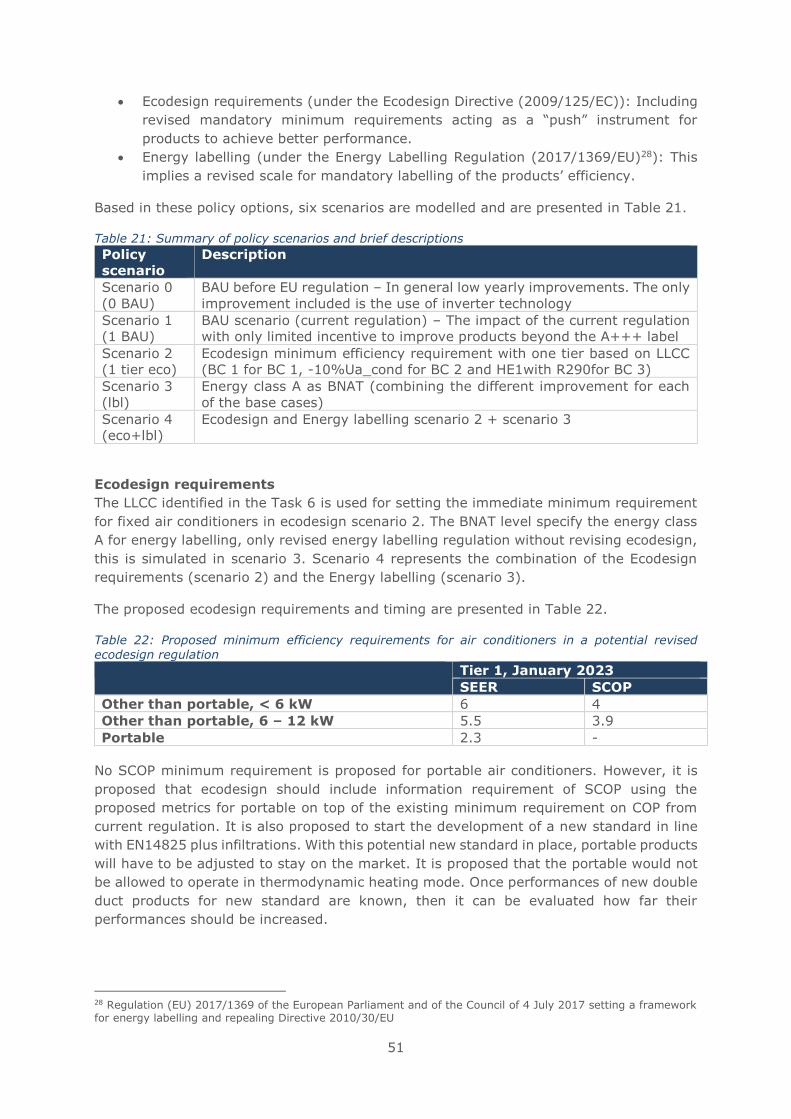
51
• Ecodesign requirements (under the Ecodesign Directive (2009/125/EC)): Including
revised mandatory minimum requirements acting as a “push” instrument for
products to achieve better performance.
• Energy labelling (under the Energy Labelling Regulation (2017/1369/EU)28): This
implies a revised scale for mandatory labelling of the products’ efficiency.
Based in these policy options, six scenarios are modelled and are presented in Table 21.
Table 21: Summary of policy scenarios and brief descriptions
Policy
scenario
Description
Scenario 0
(0 BAU)
BAU before EU regulation – In general low yearly improvements. The only
improvement included is the use of inverter technology
Scenario 1
(1 BAU)
BAU scenario (current regulation) – The impact of the current regulation
with only limited incentive to improve products beyond the A+++ label
Scenario 2
(1 tier eco)
Ecodesign minimum efficiency requirement with one tier based on LLCC
(BC 1 for BC 1, -10%Ua_cond for BC 2 and HE1with R290for BC 3)
Scenario 3
(lbl)
Energy class A as BNAT (combining the different improvement for each
of the base cases)
Scenario 4
(eco+lbl)
Ecodesign and Energy labelling scenario 2 + scenario 3
Ecodesign requirements
The LLCC identified in the Task 6 is used for setting the immediate minimum requirement
for fixed air conditioners in ecodesign scenario 2. The BNAT level specify the energy class
A for energy labelling, only revised energy labelling regulation without revising ecodesign,
this is simulated in scenario 3. Scenario 4 represents the combination of the Ecodesign
requirements (scenario 2) and the Energy labelling (scenario 3).
The proposed ecodesign requirements and timing are presented in Table 22.
Table 22: Proposed minimum efficiency requirements for air conditioners in a potential revised ecodesign regulation
Tier 1, January 2023
SEER SCOP
Other than portable, < 6 kW 6 4
Other than portable, 6 – 12 kW 5.5 3.9
Portable 2.3 -
No SCOP minimum requirement is proposed for portable air conditioners. However, it is
proposed that ecodesign should include information requirement of SCOP using the
proposed metrics for portable on top of the existing minimum requirement on COP from
current regulation. It is also proposed to start the development of a new standard in line
with EN14825 plus infiltrations. With this potential new standard in place, portable products
will have to be adjusted to stay on the market. It is proposed that the portable would not
be allowed to operate in thermodynamic heating mode. Once performances of new double
duct products for new standard are known, then it can be evaluated how far their
performances should be increased.
28 Regulation (EU) 2017/1369 of the European Parliament and of the Council of 4 July 2017 setting a framework for energy labelling and repealing Directive 2010/30/EU
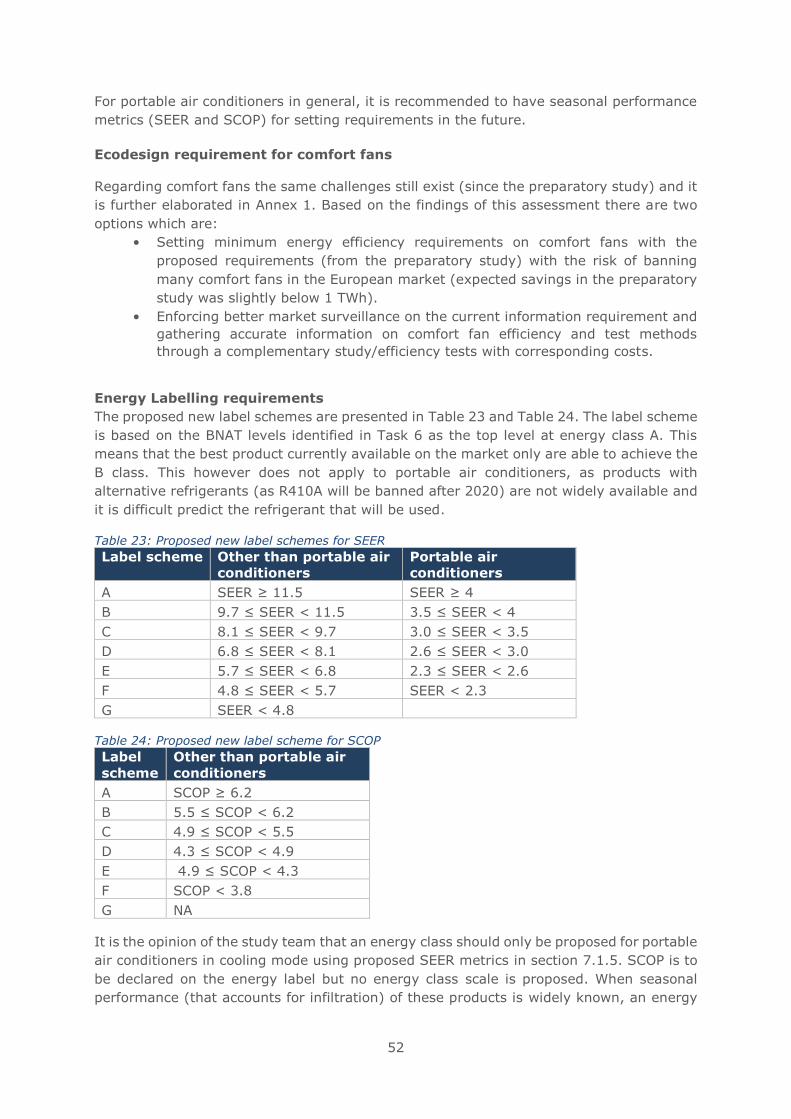
52
For portable air conditioners in general, it is recommended to have seasonal performance
metrics (SEER and SCOP) for setting requirements in the future.
Ecodesign requirement for comfort fans
Regarding comfort fans the same challenges still exist (since the preparatory study) and it
is further elaborated in Annex 1. Based on the findings of this assessment there are two
options which are:
• Setting minimum energy efficiency requirements on comfort fans with the
proposed requirements (from the preparatory study) with the risk of banning
many comfort fans in the European market (expected savings in the preparatory
study was slightly below 1 TWh).
• Enforcing better market surveillance on the current information requirement and
gathering accurate information on comfort fan efficiency and test methods
through a complementary study/efficiency tests with corresponding costs.
Energy Labelling requirements
The proposed new label schemes are presented in Table 23 and Table 24. The label scheme
is based on the BNAT levels identified in Task 6 as the top level at energy class A. This
means that the best product currently available on the market only are able to achieve the
B class. This however does not apply to portable air conditioners, as products with
alternative refrigerants (as R410A will be banned after 2020) are not widely available and
it is difficult predict the refrigerant that will be used.
Table 23: Proposed new label schemes for SEER
Label scheme Other than portable air
conditioners
Portable air
conditioners
A SEER ≥ 11.5 SEER ≥ 4
B 9.7 ≤ SEER < 11.5 3.5 ≤ SEER < 4
C 8.1 ≤ SEER < 9.7 3.0 ≤ SEER < 3.5
D 6.8 ≤ SEER < 8.1 2.6 ≤ SEER < 3.0
E 5.7 ≤ SEER < 6.8 2.3 ≤ SEER < 2.6
F 4.8 ≤ SEER < 5.7 SEER < 2.3
G SEER < 4.8 Table 24: Proposed new label scheme for SCOP
Label
scheme
Other than portable air
conditioners
A SCOP ≥ 6.2
B 5.5 ≤ SCOP < 6.2
C 4.9 ≤ SCOP < 5.5
D 4.3 ≤ SCOP < 4.9
E 4.9 ≤ SCOP < 4.3
F SCOP < 3.8
G NA
It is the opinion of the study team that an energy class should only be proposed for portable
air conditioners in cooling mode using proposed SEER metrics in section 7.1.5. SCOP is to
be declared on the energy label but no energy class scale is proposed. When seasonal
performance (that accounts for infiltration) of these products is widely known, an energy
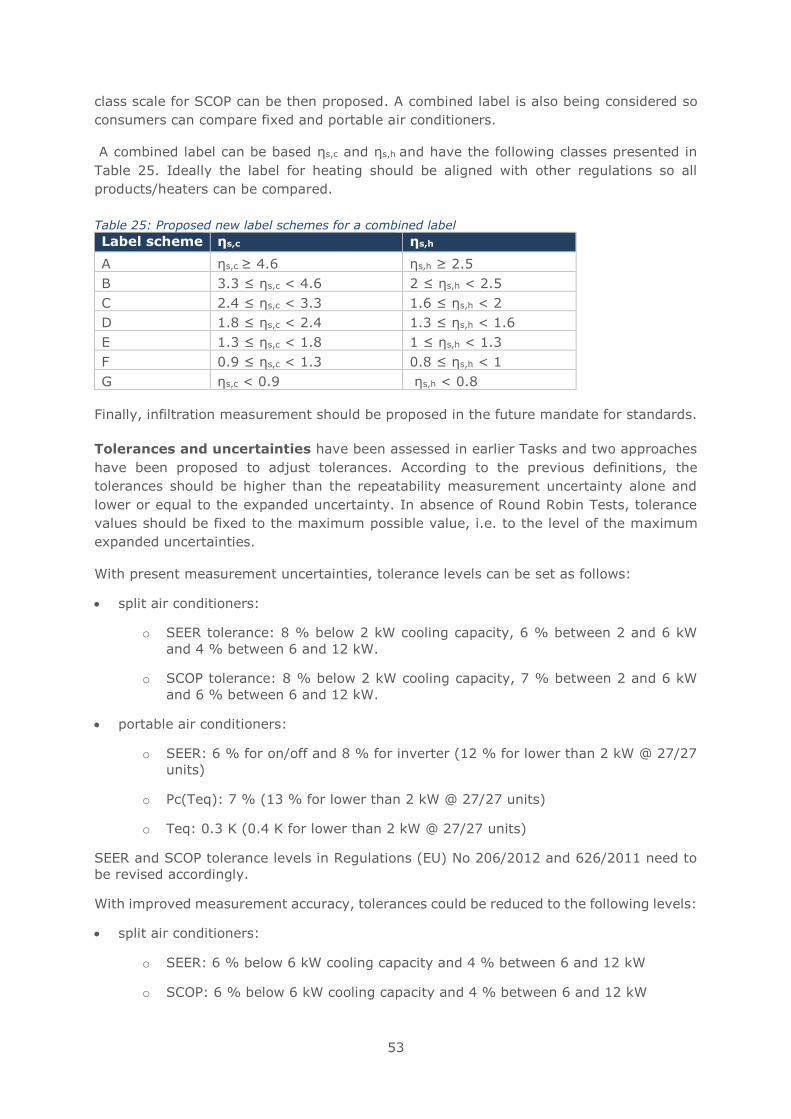
53
class scale for SCOP can be then proposed. A combined label is also being considered so
consumers can compare fixed and portable air conditioners.
A combined label can be based ηs,c and ηs,h and have the following classes presented in
Table 25. Ideally the label for heating should be aligned with other regulations so all
products/heaters can be compared.
Table 25: Proposed new label schemes for a combined label
Label scheme ηs,c ηs,h
A ηs,c ≥ 4.6 ηs,h ≥ 2.5
B 3.3 ≤ ηs,c < 4.6 2 ≤ ηs,h < 2.5
C 2.4 ≤ ηs,c < 3.3 1.6 ≤ ηs,h < 2
D 1.8 ≤ ηs,c < 2.4 1.3 ≤ ηs,h < 1.6
E 1.3 ≤ ηs,c < 1.8 1 ≤ ηs,h < 1.3
F 0.9 ≤ ηs,c < 1.3 0.8 ≤ ηs,h < 1
G ηs,c < 0.9 ηs,h < 0.8
Finally, infiltration measurement should be proposed in the future mandate for standards.
Tolerances and uncertainties have been assessed in earlier Tasks and two approaches
have been proposed to adjust tolerances. According to the previous definitions, the
tolerances should be higher than the repeatability measurement uncertainty alone and
lower or equal to the expanded uncertainty. In absence of Round Robin Tests, tolerance
values should be fixed to the maximum possible value, i.e. to the level of the maximum
expanded uncertainties.
With present measurement uncertainties, tolerance levels can be set as follows:
• split air conditioners:
o SEER tolerance: 8 % below 2 kW cooling capacity, 6 % between 2 and 6 kW
and 4 % between 6 and 12 kW.
o SCOP tolerance: 8 % below 2 kW cooling capacity, 7 % between 2 and 6 kW
and 6 % between 6 and 12 kW.
• portable air conditioners:
o SEER: 6 % for on/off and 8 % for inverter (12 % for lower than 2 kW @ 27/27
units)
o Pc(Teq): 7 % (13 % for lower than 2 kW @ 27/27 units)
o Teq: 0.3 K (0.4 K for lower than 2 kW @ 27/27 units)
SEER and SCOP tolerance levels in Regulations (EU) No 206/2012 and 626/2011 need to
be revised accordingly.
With improved measurement accuracy, tolerances could be reduced to the following levels:
• split air conditioners:
o SEER: 6 % below 6 kW cooling capacity and 4 % between 6 and 12 kW
o SCOP: 6 % below 6 kW cooling capacity and 4 % between 6 and 12 kW
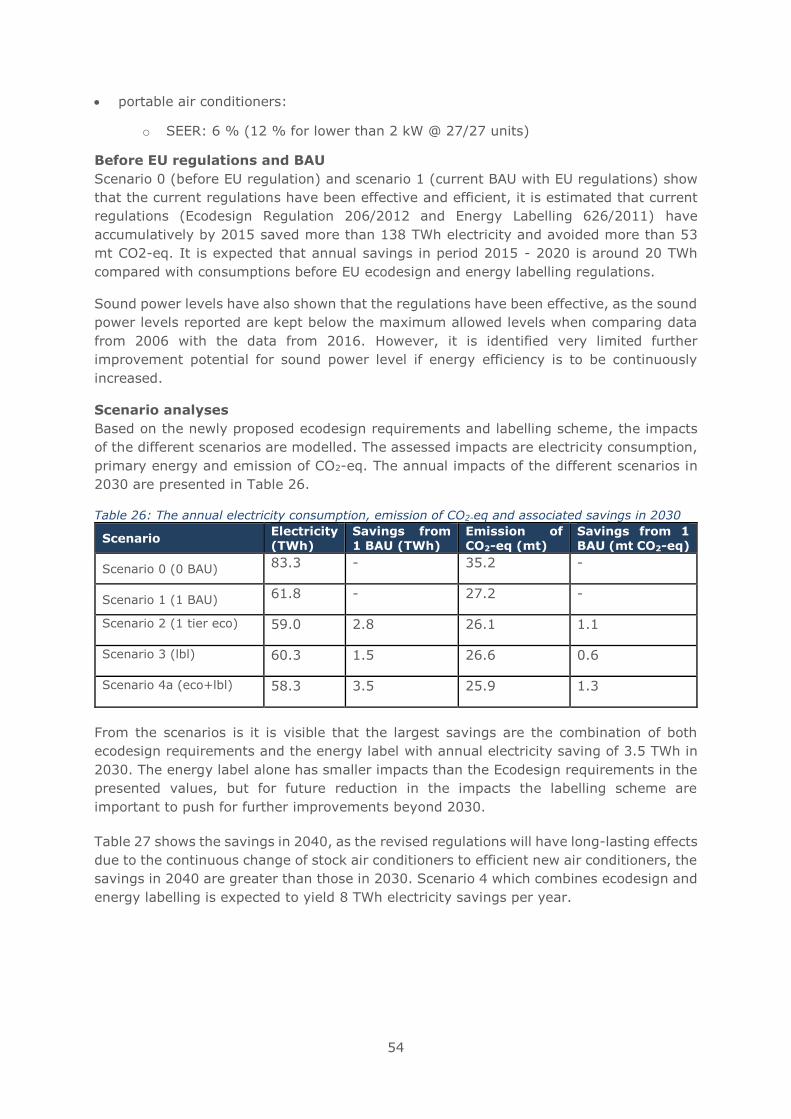
54
• portable air conditioners:
o SEER: 6 % (12 % for lower than 2 kW @ 27/27 units)
Before EU regulations and BAU
Scenario 0 (before EU regulation) and scenario 1 (current BAU with EU regulations) show
that the current regulations have been effective and efficient, it is estimated that current
regulations (Ecodesign Regulation 206/2012 and Energy Labelling 626/2011) have
accumulatively by 2015 saved more than 138 TWh electricity and avoided more than 53
mt CO2-eq. It is expected that annual savings in period 2015 - 2020 is around 20 TWh
compared with consumptions before EU ecodesign and energy labelling regulations.
Sound power levels have also shown that the regulations have been effective, as the sound
power levels reported are kept below the maximum allowed levels when comparing data
from 2006 with the data from 2016. However, it is identified very limited further
improvement potential for sound power level if energy efficiency is to be continuously
increased.
Scenario analyses
Based on the newly proposed ecodesign requirements and labelling scheme, the impacts
of the different scenarios are modelled. The assessed impacts are electricity consumption,
primary energy and emission of CO2-eq. The annual impacts of the different scenarios in
2030 are presented in Table 26.
Table 26: The annual electricity consumption, emission of CO2-eq and associated savings in 2030
From the scenarios is it is visible that the largest savings are the combination of both
ecodesign requirements and the energy label with annual electricity saving of 3.5 TWh in
2030. The energy label alone has smaller impacts than the Ecodesign requirements in the
presented values, but for future reduction in the impacts the labelling scheme are
important to push for further improvements beyond 2030.
Table 27 shows the savings in 2040, as the revised regulations will have long-lasting effects
due to the continuous change of stock air conditioners to efficient new air conditioners, the
savings in 2040 are greater than those in 2030. Scenario 4 which combines ecodesign and
energy labelling is expected to yield 8 TWh electricity savings per year.
Scenario Electricity
(TWh)
Savings from
1 BAU (TWh)
Emission of
CO2-eq (mt)
Savings from 1
BAU (mt CO2-eq)
Scenario 0 (0 BAU) 83.3 - 35.2 -
Scenario 1 (1 BAU) 61.8 - 27.2 -
Scenario 2 (1 tier eco)
59.0 2.8 26.1 1.1
Scenario 3 (lbl)
60.3 1.5 26.6 0.6
Scenario 4a (eco+lbl)
58.3 3.5 25.9 1.3
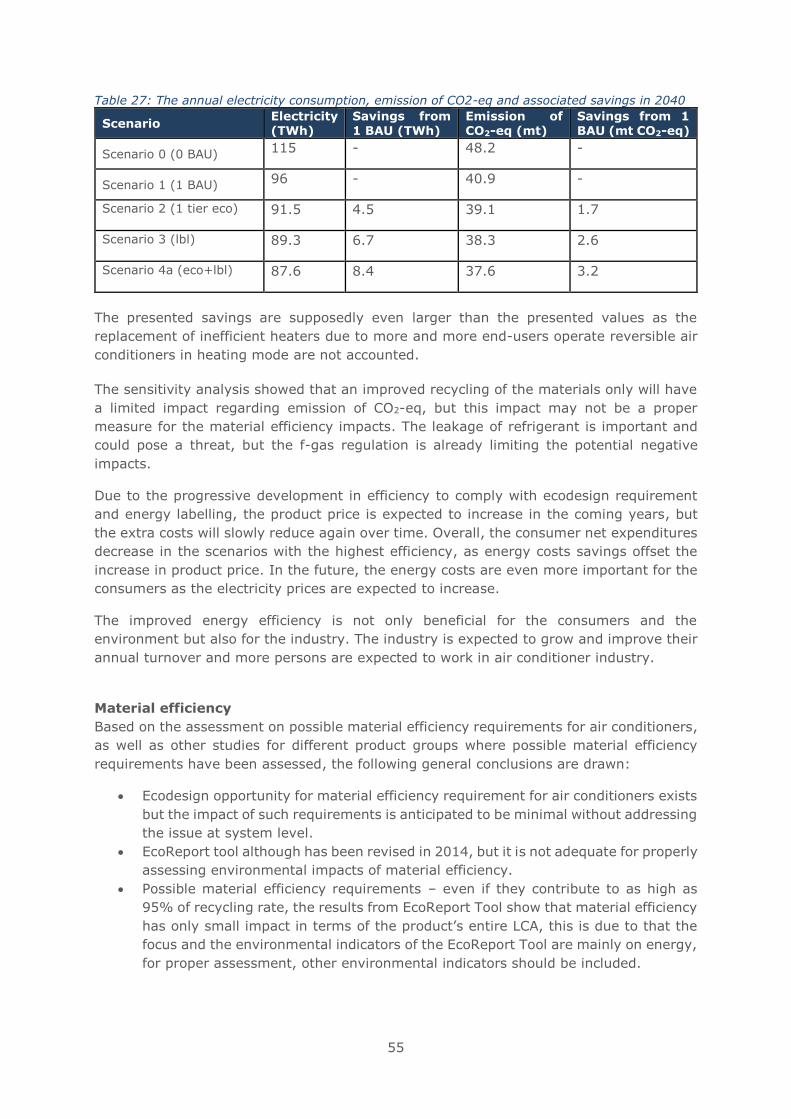
55
Table 27: The annual electricity consumption, emission of CO2-eq and associated savings in 2040
The presented savings are supposedly even larger than the presented values as the
replacement of inefficient heaters due to more and more end-users operate reversible air
conditioners in heating mode are not accounted.
The sensitivity analysis showed that an improved recycling of the materials only will have
a limited impact regarding emission of CO2-eq, but this impact may not be a proper
measure for the material efficiency impacts. The leakage of refrigerant is important and
could pose a threat, but the f-gas regulation is already limiting the potential negative
impacts.
Due to the progressive development in efficiency to comply with ecodesign requirement
and energy labelling, the product price is expected to increase in the coming years, but
the extra costs will slowly reduce again over time. Overall, the consumer net expenditures
decrease in the scenarios with the highest efficiency, as energy costs savings offset the
increase in product price. In the future, the energy costs are even more important for the
consumers as the electricity prices are expected to increase.
The improved energy efficiency is not only beneficial for the consumers and the
environment but also for the industry. The industry is expected to grow and improve their
annual turnover and more persons are expected to work in air conditioner industry.
Material efficiency
Based on the assessment on possible material efficiency requirements for air conditioners,
as well as other studies for different product groups where possible material efficiency
requirements have been assessed, the following general conclusions are drawn:
• Ecodesign opportunity for material efficiency requirement for air conditioners exists
but the impact of such requirements is anticipated to be minimal without addressing
the issue at system level.
• EcoReport tool although has been revised in 2014, but it is not adequate for properly
assessing environmental impacts of material efficiency.
• Possible material efficiency requirements – even if they contribute to as high as
95% of recycling rate, the results from EcoReport Tool show that material efficiency
has only small impact in terms of the product’s entire LCA, this is due to that the
focus and the environmental indicators of the EcoReport Tool are mainly on energy,
for proper assessment, other environmental indicators should be included.
Scenario Electricity (TWh)
Savings from 1 BAU (TWh)
Emission of CO2-eq (mt)
Savings from 1 BAU (mt CO2-eq)
Scenario 0 (0 BAU) 115 - 48.2 -
Scenario 1 (1 BAU) 96 - 40.9 -
Scenario 2 (1 tier eco)
91.5 4.5 39.1 1.7
Scenario 3 (lbl)
89.3 6.7 38.3 2.6
Scenario 4a (eco+lbl)
87.6 8.4 37.6 3.2
56
• There could be synergies with DG Environment’s development of Product
Environmental Footprint (PEF). The methodology can be simplified and applied in
Ecodesign to assess other environmental impacts.
• Material efficiency of electrical and electronic products requires a system approach
within which the recycling processes, methods and facilities are addressed together
with product design. However, system approach of recycling processes, methods
and facilities is rather in the scope of WEEE directive than ecodesign.
• Furthermore, material efficiency is an issue that should be addressed at a horizontal
level, as per product group, the associated saving potential is low, but horizontally
across all electrical and electronic products, large savings potential can be achieved.
Therefore it may prove effective to align material efficiency requirements with other
regulations (such as for dishwasher, washing machines and domestic refrigerators
and freezers).
• Looking prospectively, to address the issue at a horizontal level, voluntary labelling
of recycled materials and minimum percentage used in product could be considered
as a policy model. FSC labelling approach from the European Union Timber
Regulation(EUTR) could be of inspiration.
• Unpredictable consequences and barriers exist for ecodesign requirements on
material efficiency that encourages reuse, as it is currently unclear who should take
on the ownership of a refurbished product and responsibility of the product’s safety.
Summary of suggestions
This section summarises the suggestions from Task 1 to Task 6.
• Ventilation exhaust air-to-air heat pumps and air conditioners ≤ 12 kW
It is advised to include these products in the scope of Regulation (EU) No
206/2012 and 626/2011 when their thermal power is below or equal to 12 kW and
to specify SEER and SCOP rating conditions and also to better specify which air is
used indoor and outdoor for air conditioners and heat pumps in Regulation (EU)
No 206/2012.
Test conditions proposed for SEER and SCOP determination of exhaust air-to-
outdoor air heat pumps and air conditioners are described in Task 1, Annex 1.
However, the latest update in April 2018 of this issue is that according to CEN TC
113 WG 7, it is not possible to develop a SEER/SCOP for these units. Without
SEER/SCOP, it is difficult to include these products in scope. The reason is that
these units are ventilation units where heat recovery is made by the heat pump
instead of being done by a heat recovery heat exchanger. The fact that these
units have two functions would make SCOP / SEER results not directly comparable
to the ones of other heat pumps. In other words they indeed supply capacity but
part of it might be supplied at an indoor temperature below 20 °C so capacity
related to heating (and so to Pdesignh declaration) is only a part of measured
capacity.
• Definition of a heat pump and air-to-air heat pump
The definition of a heat pump and air-to-air heat pump will also be added to the
regulation. The definitions will be adapted from Regulation (EU) No 2016/2281
and are described above in section 1.1.1.2.
57
• Residential fan heaters
It is recommended to include information requirement on the "air movement"
function of residential fan heaters in Regulation (EU) No 2015/1188 (similar to the
information requirement for comfort fans in Regulation 206/2012).
• Noise standards - EN 12102:2013
A draft version of this standard (prEN12102-2016) has been submitted for
approval with no major change identified. According to convenor of CEN TC 113 /
WG8, this standard could include rating conditions in the future. In order to link
SCOP value and sound power measurement in heating mode, it is planned to use
the point C in heating mode (outdoor air 7 °C / indoor air 20 °C / capacity 50 %)
in order to rate the sound power level of air conditioners in heating mode. This is
to be taken into account in any future regulation.
• EU Regulation 206/2012/EU - Ecodesign Requirements for air
conditioners and comfort fans
Regarding the calculation method, following input from test laboratories reported
in the description of standard EN14825 in Task 1 section 1.2.2, it is advised not to
allow performance tests to measure cycling performance degradation coefficients
Cdc and Cdh, but to use the default value 0.25 instead as there is no proof the
value can be measured satisfactorily for inverter units. However, in a possible
mandate to CEN for the revised regulation could emphasize the need to define
properly cycling tests for inverter units.
In the future, SEER and SCOP values should be replaced by primary energy
efficiency ratio in cooling and in heating mode following the example of more
recent regulations (e.g. Regulation (EU) No 2281/2016).
For heating only air-to-air heat pumps, it is also suggested that the test conditions
to measure sound power level in heating mode are specified. The planned test
conditions are heating mode point C in EN14825:2016 (outdoor air temperature +
7°C / declared capacity 50 %).
Finally, the crankcase hours should be changed from 2672 to 2363.
• Backup heater capacity
It is suggested to indicate the necessary additional backup heater capacity required
to reach Pdesignh even if it is not included in the unit. So it is proposed to require
the following additional information requirement under the naming "backup
heater":
o Required additional backup heater capacity: 3 values in kW to be supplied
for warm / average/cold climates; this corresponds to the difference
between Pdesignh for a specific climate and unit capacity of the unit at
Tdesignh;
o Backup heater included in the unit: Yes or No (3 values for the 3 different
climates).
• EU Regulation 1275/2008/EU - Ecodesign Requirements for standby and
off mode, and networked standby, electric power consumption of
electrical and electronic household and office equipment
It should be noted that air conditioners are not included in the standby regulation
but the requirements for standby in Regulation 206/2012 (with and without a
display) and off mode are in line with the standby regulation. Stakeholders have
58
raised the question whether air conditioners also should comply with the
requirements of networked standby and HiNA equipment. The standby
consumption is already included in the SEER calculation and leaves more room for
development for manufacturers. It is suggested that if the air conditioners are
networked by default, the networked standby consumption should be included in
the efficiency calculation instead of standby consumption, present standby hours
can be used.
• Low power mode hours
Low power mode hours have been reviewed. In the EN 14825:2016, the
crankcase heater consumption is measured in test condition D in both heating and
cooling mode, it means that for the average climate, there are two values for PCK,
and thus potentially also for PTO, PSB and POFF.
It is proposed to require two distinct crankcase power values for reversible
units, respectively for cooling mode - measured at 20 °C - and for heating mode -
measured at 12 °C. Cooling (or heating) only unit crankcase power measurement
should be done at 20 °C (12 °C), as already written in standard EN14825:2016.
Minor adjustments of crankcase hours are proposed, see above.
• Measurement of blown air temperature
It is proposed, for units in the scope of this study, to complete the data supplied
in test report of EN14511-3 with a measurement of the blown air temperature in
heating mode and blown air temperature and humidity in cooling mode. These
temperatures are normally measured during tests but not published. They should
be available in the technical documentation of the products for data collection
purpose. These values are to be reviewed at the time of the next revision of
Regulation 206/2012 and 626/2011 and evaluate the possible impacts and the
required changes in the standard and the regulation to ensure that SEER and
SCOP remain representative of real life. More details in Task 3, section 3.1.7.
• In situ continuous performance measurement
On-board measurement and others similar methods for in-situ continuous
performance measurement could be generalized and used by all manufacturers,
some of the manufacturers are already developing these methods themselves.
However, it is important to carry out standardization work to ensure their reliability.
This should include methods to correct performance evaluation for dynamic
conditions and the way faults are filtered, as well as possible checks of on-board
measurement capabilities by third parties. This is an important topic to improve
further the efficiency and to reduce real life consumption of air conditioners, as well
as to ensure that test standards are aligned with real life operating conditions as
regards sizing, equivalent full load hours and other operating hours.
• Additional information to end-user to reduce real life consumption
Another suggestion to cut real life energy consumption is to ensure continuous
monitoring. It is proposed to include the electricity consumption measurement in
the standardisation work to be done regarding in-situ continuous performance
measurement mentioned above. It is necessary to fix a certain number of
requirements (e.g. maximum uncertainty, minimum acquisition and averaging
times, test of the functionality in the unit based on standard tests).
• Testing information for set-up in technical documentation

59
It is thus proposed that testing information required to set up the machine to reach
claimed values be indicated in the technical documentation of the product, instead
of being provided upon request or to include it in the EU energy labelling database
(where it can only be accessed by market surveillance authorities). To make it
mandatory in the product information would also help the development of
competitive surveillance systems where manufacturers can check the claims of their
competitors.
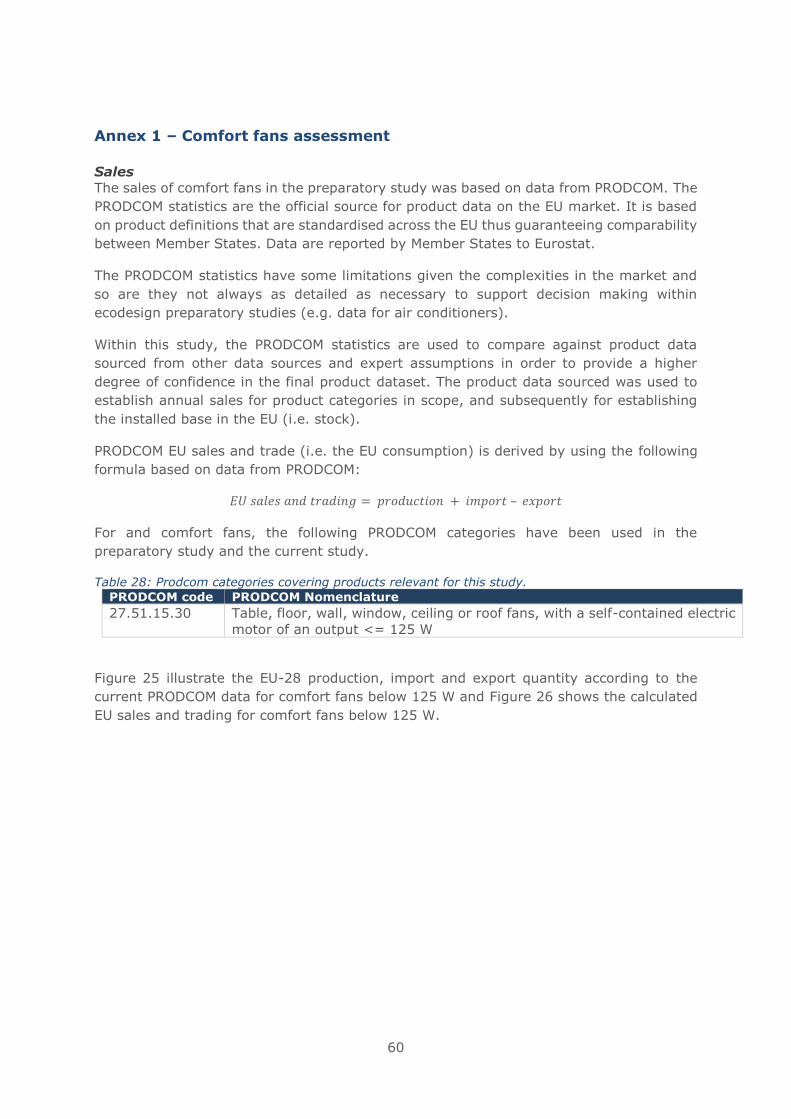
60
Annex 1 – Comfort fans assessment
Sales
The sales of comfort fans in the preparatory study was based on data from PRODCOM. The
PRODCOM statistics are the official source for product data on the EU market. It is based
on product definitions that are standardised across the EU thus guaranteeing comparability
between Member States. Data are reported by Member States to Eurostat.
The PRODCOM statistics have some limitations given the complexities in the market and
so are they not always as detailed as necessary to support decision making within
ecodesign preparatory studies (e.g. data for air conditioners).
Within this study, the PRODCOM statistics are used to compare against product data
sourced from other data sources and expert assumptions in order to provide a higher
degree of confidence in the final product dataset. The product data sourced was used to
establish annual sales for product categories in scope, and subsequently for establishing
the installed base in the EU (i.e. stock).
PRODCOM EU sales and trade (i.e. the EU consumption) is derived by using the following
formula based on data from PRODCOM:
𝐸𝑈 𝑠𝑎𝑙𝑒𝑠 𝑎𝑛𝑑 𝑡𝑟𝑎𝑑𝑖𝑛𝑔 = 𝑝𝑟𝑜𝑑𝑢𝑐𝑡𝑖𝑜𝑛 + 𝑖𝑚𝑝𝑜𝑟𝑡 – 𝑒𝑥𝑝𝑜𝑟𝑡
For and comfort fans, the following PRODCOM categories have been used in the
preparatory study and the current study.
Table 28: Prodcom categories covering products relevant for this study.
PRODCOM code PRODCOM Nomenclature
27.51.15.30 Table, floor, wall, window, ceiling or roof fans, with a self-contained electric
motor of an output <= 125 W
Figure 25 illustrate the EU-28 production, import and export quantity according to the
current PRODCOM data for comfort fans below 125 W and Figure 26 shows the calculated
EU sales and trading for comfort fans below 125 W.
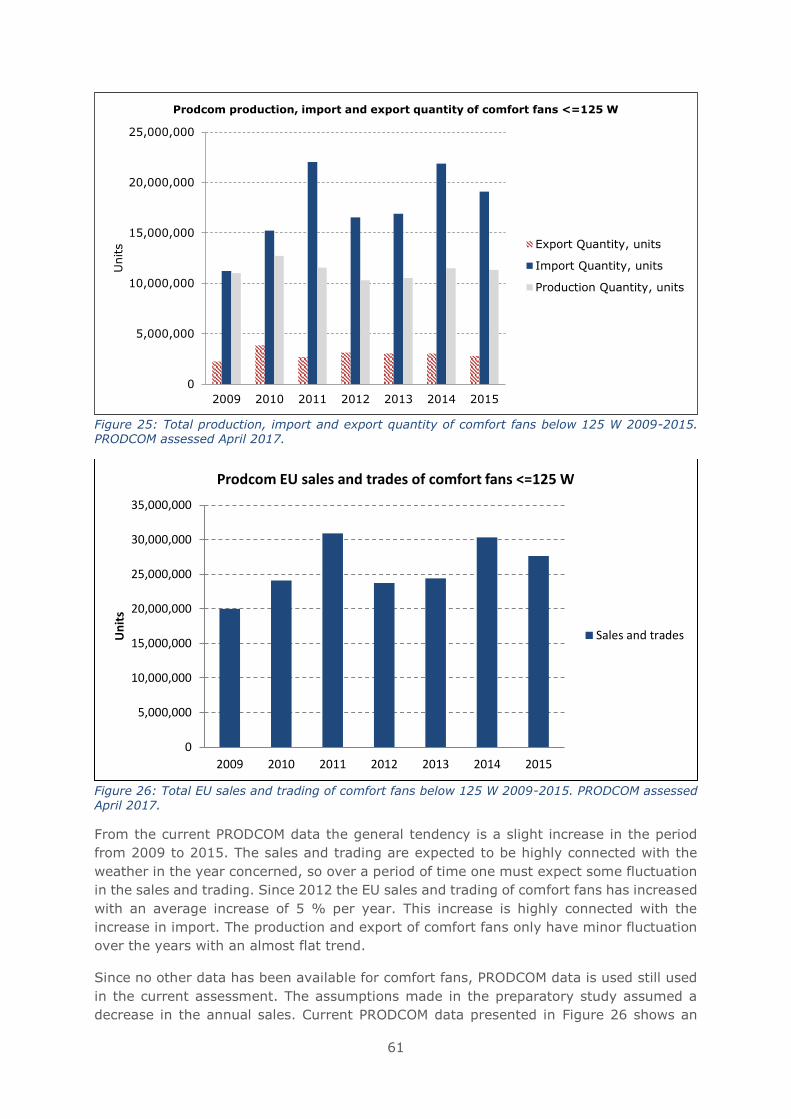
61
Figure 25: Total production, import and export quantity of comfort fans below 125 W 2009-2015. PRODCOM assessed April 2017.
Figure 26: Total EU sales and trading of comfort fans below 125 W 2009-2015. PRODCOM assessed April 2017.
From the current PRODCOM data the general tendency is a slight increase in the period
from 2009 to 2015. The sales and trading are expected to be highly connected with the
weather in the year concerned, so over a period of time one must expect some fluctuation
in the sales and trading. Since 2012 the EU sales and trading of comfort fans has increased
with an average increase of 5 % per year. This increase is highly connected with the
increase in import. The production and export of comfort fans only have minor fluctuation
over the years with an almost flat trend.
Since no other data has been available for comfort fans, PRODCOM data is used still used
in the current assessment. The assumptions made in the preparatory study assumed a
decrease in the annual sales. Current PRODCOM data presented in Figure 26 shows an
0
5,000,000
10,000,000
15,000,000
20,000,000
25,000,000
2009 2010 2011 2012 2013 2014 2015
Units
Prodcom production, import and export quantity of comfort fans <=125 W
Export Quantity, units
Import Quantity, units
Production Quantity, units
0
5,000,000
10,000,000
15,000,000
20,000,000
25,000,000
30,000,000
35,000,000
2009 2010 2011 2012 2013 2014 2015
Un
its
Prodcom EU sales and trades of comfort fans <=125 W
Sales and trades
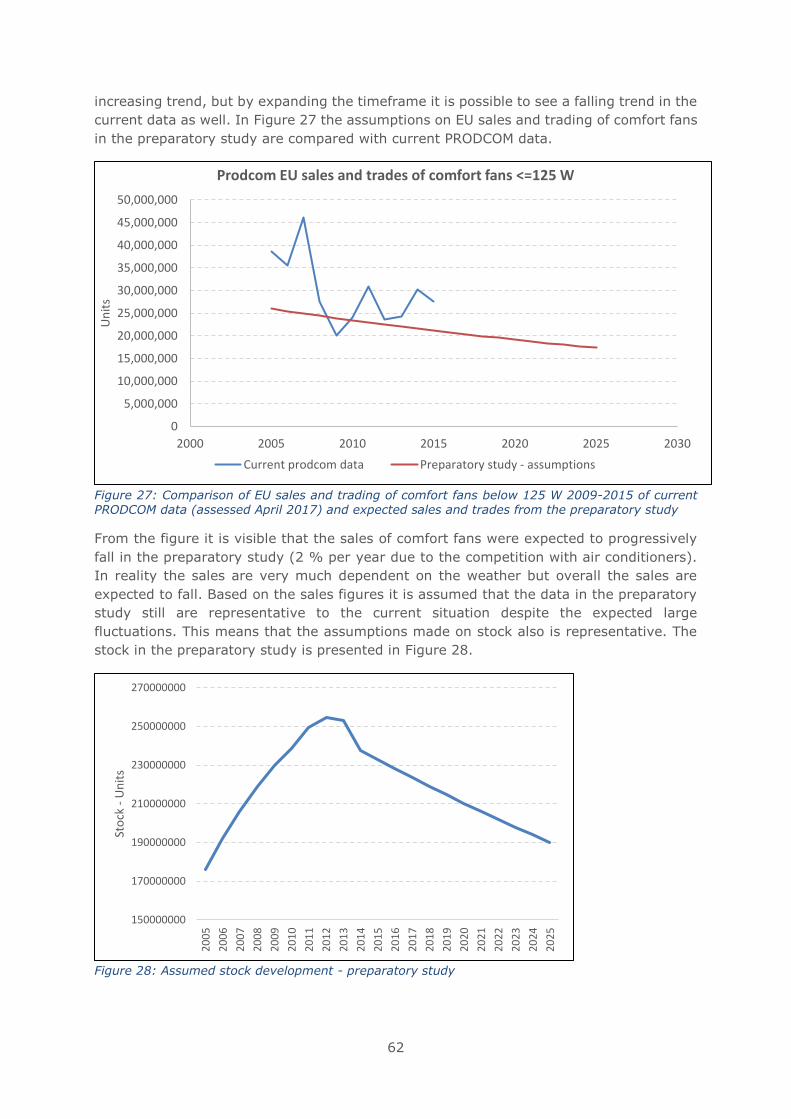
62
increasing trend, but by expanding the timeframe it is possible to see a falling trend in the
current data as well. In Figure 27 the assumptions on EU sales and trading of comfort fans
in the preparatory study are compared with current PRODCOM data.
Figure 27: Comparison of EU sales and trading of comfort fans below 125 W 2009-2015 of current PRODCOM data (assessed April 2017) and expected sales and trades from the preparatory study
From the figure it is visible that the sales of comfort fans were expected to progressively
fall in the preparatory study (2 % per year due to the competition with air conditioners).
In reality the sales are very much dependent on the weather but overall the sales are
expected to fall. Based on the sales figures it is assumed that the data in the preparatory
study still are representative to the current situation despite the expected large
fluctuations. This means that the assumptions made on stock also is representative. The
stock in the preparatory study is presented in Figure 28.
Figure 28: Assumed stock development - preparatory study
0
5,000,000
10,000,000
15,000,000
20,000,000
25,000,000
30,000,000
35,000,000
40,000,000
45,000,000
50,000,000
2000 2005 2010 2015 2020 2025 2030
Un
its
Prodcom EU sales and trades of comfort fans <=125 W
Current prodcom data Preparatory study - assumptions
150000000
170000000
190000000
210000000
230000000
250000000
270000000
20
05
20
06
20
07
20
08
20
09
20
10
20
11
20
12
20
13
20
14
20
15
20
16
20
17
20
18
20
19
20
20
20
21
20
22
20
23
20
24
20
25
Sto
ck -
Un
its
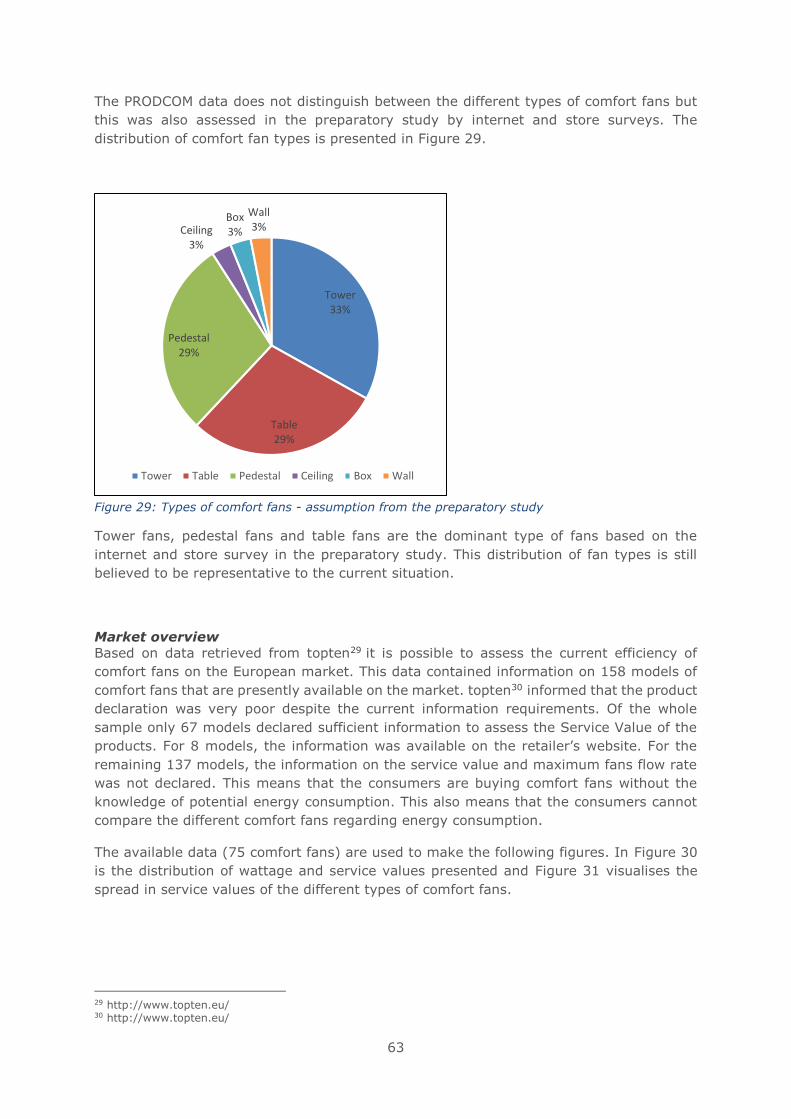
63
The PRODCOM data does not distinguish between the different types of comfort fans but
this was also assessed in the preparatory study by internet and store surveys. The
distribution of comfort fan types is presented in Figure 29.
Figure 29: Types of comfort fans - assumption from the preparatory study
Tower fans, pedestal fans and table fans are the dominant type of fans based on the
internet and store survey in the preparatory study. This distribution of fan types is still
believed to be representative to the current situation.
Market overview
Based on data retrieved from topten29 it is possible to assess the current efficiency of
comfort fans on the European market. This data contained information on 158 models of
comfort fans that are presently available on the market. topten30 informed that the product
declaration was very poor despite the current information requirements. Of the whole
sample only 67 models declared sufficient information to assess the Service Value of the
products. For 8 models, the information was available on the retailer’s website. For the
remaining 137 models, the information on the service value and maximum fans flow rate
was not declared. This means that the consumers are buying comfort fans without the
knowledge of potential energy consumption. This also means that the consumers cannot
compare the different comfort fans regarding energy consumption.
The available data (75 comfort fans) are used to make the following figures. In Figure 30
is the distribution of wattage and service values presented and Figure 31 visualises the
spread in service values of the different types of comfort fans.
29 http://www.topten.eu/ 30 http://www.topten.eu/
Tower33%
Table29%
Pedestal29%
Ceiling3%
Box3%
Wall3%
Tower Table Pedestal Ceiling Box Wall
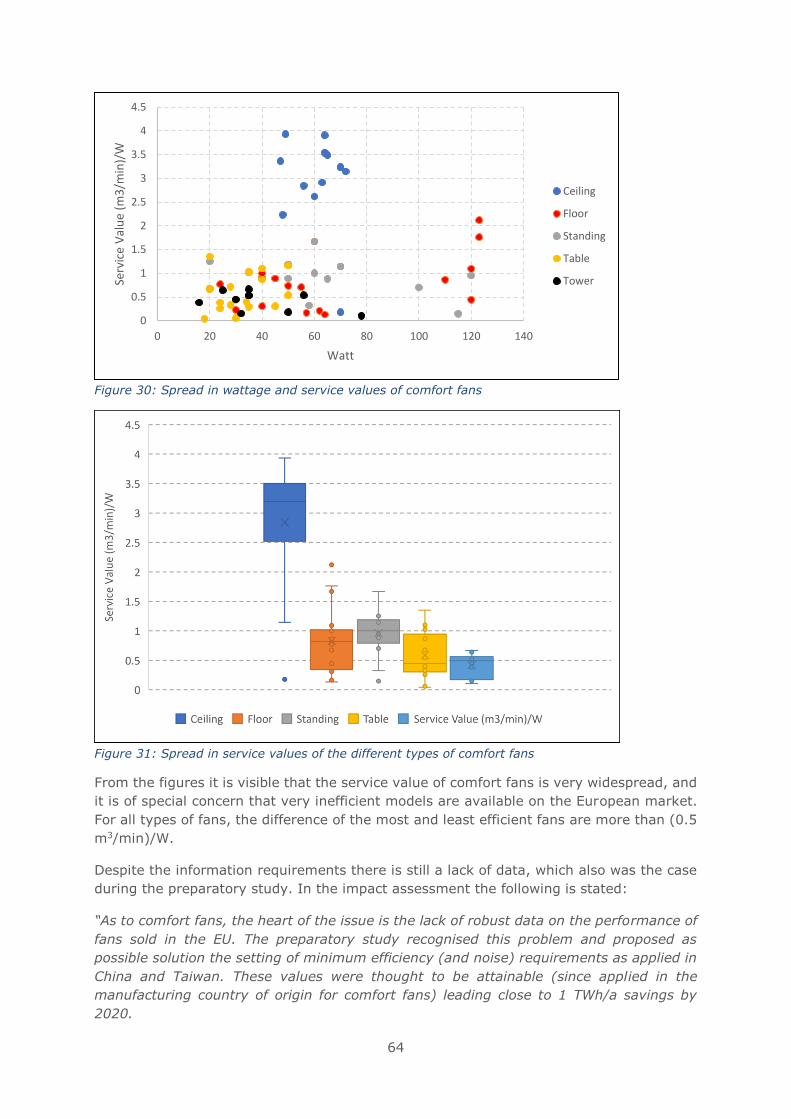
64
Figure 30: Spread in wattage and service values of comfort fans
Figure 31: Spread in service values of the different types of comfort fans
From the figures it is visible that the service value of comfort fans is very widespread, and
it is of special concern that very inefficient models are available on the European market.
For all types of fans, the difference of the most and least efficient fans are more than (0.5
m3/min)/W.
Despite the information requirements there is still a lack of data, which also was the case
during the preparatory study. In the impact assessment the following is stated:
“As to comfort fans, the heart of the issue is the lack of robust data on the performance of
fans sold in the EU. The preparatory study recognised this problem and proposed as
possible solution the setting of minimum efficiency (and noise) requirements as applied in
China and Taiwan. These values were thought to be attainable (since applied in the
manufacturing country of origin for comfort fans) leading close to 1 TWh/a savings by
2020.
0
0.5
1
1.5
2
2.5
3
3.5
4
4.5
0 20 40 60 80 100 120 140
Serv
ice
Val
ue
(m3
/min
)/W
Watt
Ceiling
Floor
Standing
Table
Tower
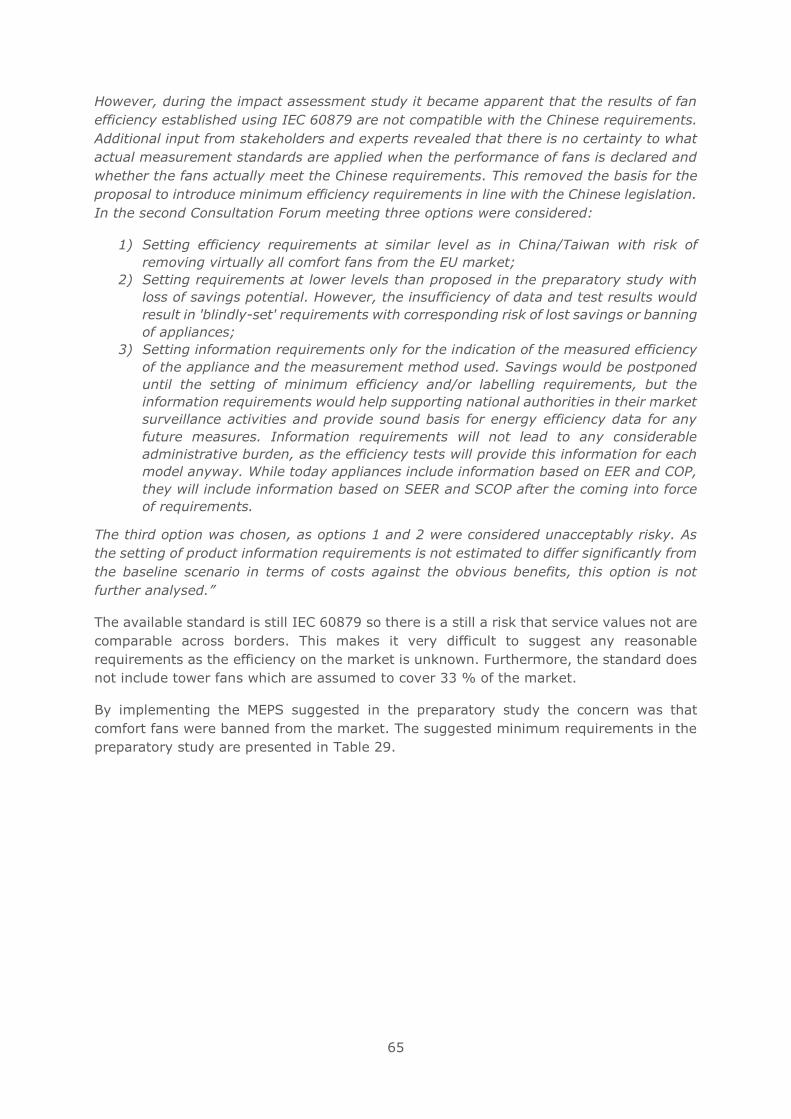
65
However, during the impact assessment study it became apparent that the results of fan
efficiency established using IEC 60879 are not compatible with the Chinese requirements.
Additional input from stakeholders and experts revealed that there is no certainty to what
actual measurement standards are applied when the performance of fans is declared and
whether the fans actually meet the Chinese requirements. This removed the basis for the
proposal to introduce minimum efficiency requirements in line with the Chinese legislation.
In the second Consultation Forum meeting three options were considered:
1) Setting efficiency requirements at similar level as in China/Taiwan with risk of
removing virtually all comfort fans from the EU market;
2) Setting requirements at lower levels than proposed in the preparatory study with
loss of savings potential. However, the insufficiency of data and test results would
result in 'blindly-set' requirements with corresponding risk of lost savings or banning
of appliances;
3) Setting information requirements only for the indication of the measured efficiency
of the appliance and the measurement method used. Savings would be postponed
until the setting of minimum efficiency and/or labelling requirements, but the
information requirements would help supporting national authorities in their market
surveillance activities and provide sound basis for energy efficiency data for any
future measures. Information requirements will not lead to any considerable
administrative burden, as the efficiency tests will provide this information for each
model anyway. While today appliances include information based on EER and COP,
they will include information based on SEER and SCOP after the coming into force
of requirements.
The third option was chosen, as options 1 and 2 were considered unacceptably risky. As
the setting of product information requirements is not estimated to differ significantly from
the baseline scenario in terms of costs against the obvious benefits, this option is not
further analysed.”
The available standard is still IEC 60879 so there is a still a risk that service values not are
comparable across borders. This makes it very difficult to suggest any reasonable
requirements as the efficiency on the market is unknown. Furthermore, the standard does
not include tower fans which are assumed to cover 33 % of the market.
By implementing the MEPS suggested in the preparatory study the concern was that
comfort fans were banned from the market. The suggested minimum requirements in the
preparatory study are presented in Table 29.
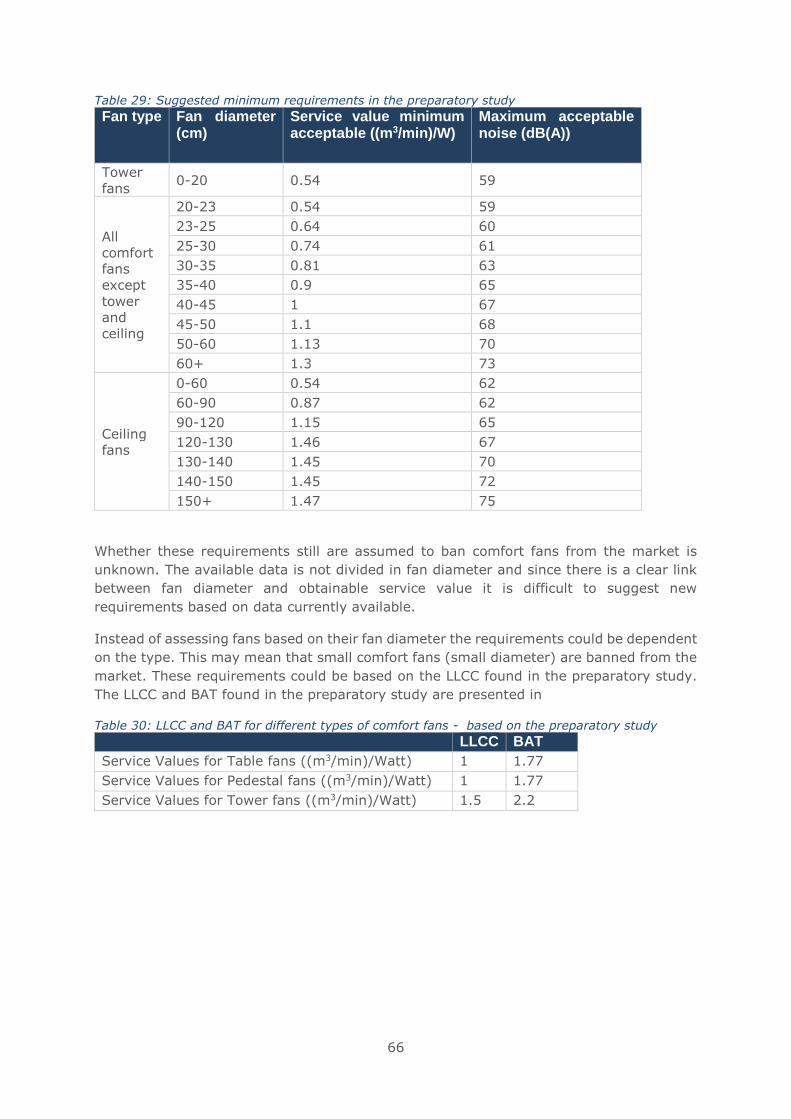
66
Table 29: Suggested minimum requirements in the preparatory study
Fan type Fan diameter (cm)
Service value minimum acceptable ((m3/min)/W)
Maximum acceptable noise (dB(A))
Tower
fans 0-20 0.54 59
All
comfort
fans
except
tower
and
ceiling
20-23 0.54 59
23-25 0.64 60
25-30 0.74 61
30-35 0.81 63
35-40 0.9 65
40-45 1 67
45-50 1.1 68
50-60 1.13 70
60+ 1.3 73
Ceiling
fans
0-60 0.54 62
60-90 0.87 62
90-120 1.15 65
120-130 1.46 67
130-140 1.45 70
140-150 1.45 72
150+ 1.47 75
Whether these requirements still are assumed to ban comfort fans from the market is
unknown. The available data is not divided in fan diameter and since there is a clear link
between fan diameter and obtainable service value it is difficult to suggest new
requirements based on data currently available.
Instead of assessing fans based on their fan diameter the requirements could be dependent
on the type. This may mean that small comfort fans (small diameter) are banned from the
market. These requirements could be based on the LLCC found in the preparatory study.
The LLCC and BAT found in the preparatory study are presented in
Table 30: LLCC and BAT for different types of comfort fans - based on the preparatory study LLCC BAT
Service Values for Table fans ((m3/min)/Watt) 1 1.77
Service Values for Pedestal fans ((m3/min)/Watt) 1 1.77
Service Values for Tower fans ((m3/min)/Watt) 1.5 2.2
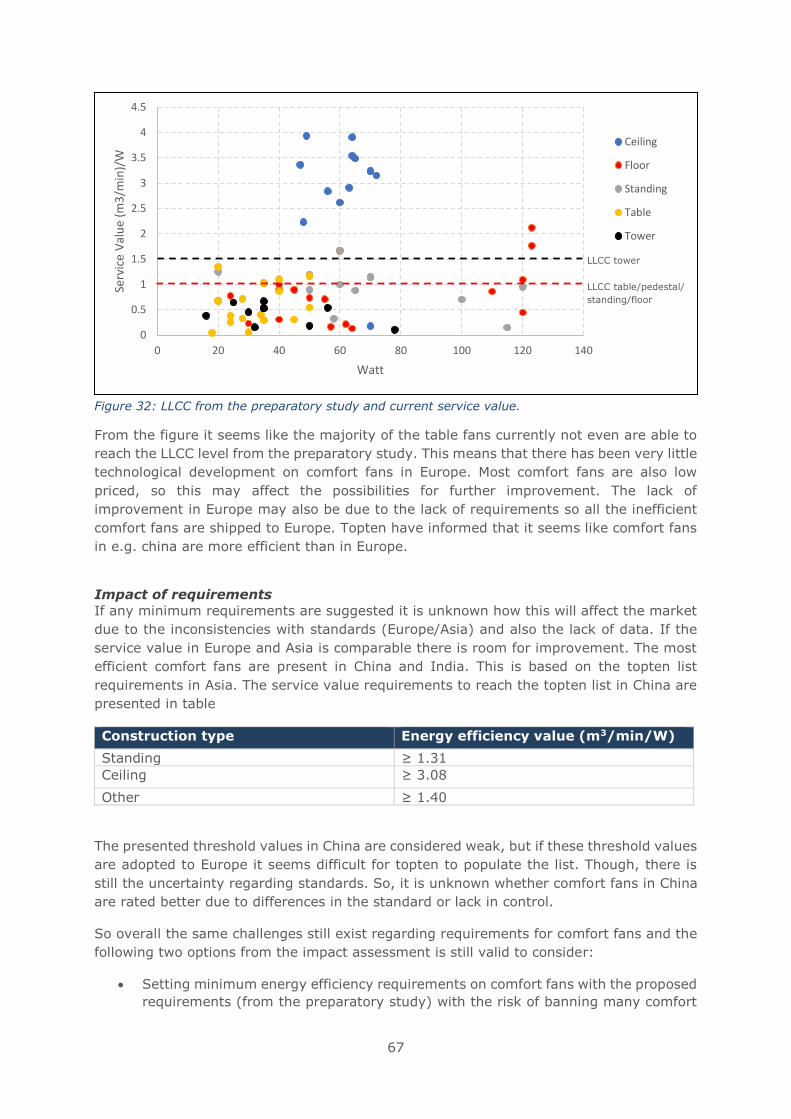
67
Figure 32: LLCC from the preparatory study and current service value.
From the figure it seems like the majority of the table fans currently not even are able to
reach the LLCC level from the preparatory study. This means that there has been very little
technological development on comfort fans in Europe. Most comfort fans are also low
priced, so this may affect the possibilities for further improvement. The lack of
improvement in Europe may also be due to the lack of requirements so all the inefficient
comfort fans are shipped to Europe. Topten have informed that it seems like comfort fans
in e.g. china are more efficient than in Europe.
Impact of requirements
If any minimum requirements are suggested it is unknown how this will affect the market
due to the inconsistencies with standards (Europe/Asia) and also the lack of data. If the
service value in Europe and Asia is comparable there is room for improvement. The most
efficient comfort fans are present in China and India. This is based on the topten list
requirements in Asia. The service value requirements to reach the topten list in China are
presented in table
Construction type Energy efficiency value (m3/min/W)
Standing ≥ 1.31
Ceiling ≥ 3.08
Other ≥ 1.40
The presented threshold values in China are considered weak, but if these threshold values
are adopted to Europe it seems difficult for topten to populate the list. Though, there is
still the uncertainty regarding standards. So, it is unknown whether comfort fans in China
are rated better due to differences in the standard or lack in control.
So overall the same challenges still exist regarding requirements for comfort fans and the
following two options from the impact assessment is still valid to consider:
• Setting minimum energy efficiency requirements on comfort fans with the proposed
requirements (from the preparatory study) with the risk of banning many comfort
0
0.5
1
1.5
2
2.5
3
3.5
4
4.5
0 20 40 60 80 100 120 140
Serv
ice
Val
ue
(m3
/min
)/W
Watt
Ceiling
Floor
Standing
Table
Tower
LLCC tower
LLCC table/pedestal/
standing/floor
68
fans in the European market (expected savings in the preparatory study was slightly
below 1 TWh).
• Enforcing better market surveillance on the current information requirement and
gathering accurate information on comfort fan efficiency and test methods through
a complementary study/efficiency tests with corresponding costs.
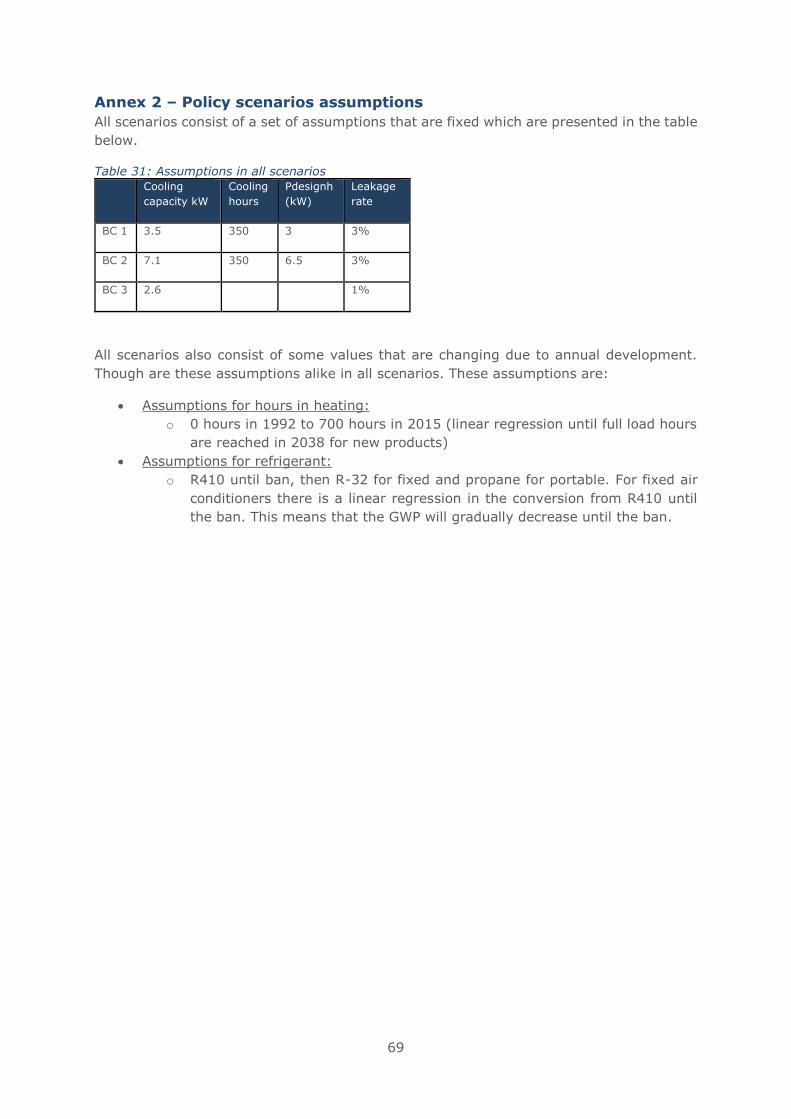
69
Annex 2 – Policy scenarios assumptions
All scenarios consist of a set of assumptions that are fixed which are presented in the table
below.
Table 31: Assumptions in all scenarios
Cooling
capacity kW
Cooling
hours
Pdesignh
(kW)
Leakage
rate
BC 1 3.5 350 3 3%
BC 2 7.1 350 6.5 3%
BC 3 2.6 1%
All scenarios also consist of some values that are changing due to annual development.
Though are these assumptions alike in all scenarios. These assumptions are:
• Assumptions for hours in heating:
o 0 hours in 1992 to 700 hours in 2015 (linear regression until full load hours
are reached in 2038 for new products)
• Assumptions for refrigerant:
o R410 until ban, then R-32 for fixed and propane for portable. For fixed air
conditioners there is a linear regression in the conversion from R410 until
the ban. This means that the GWP will gradually decrease until the ban.
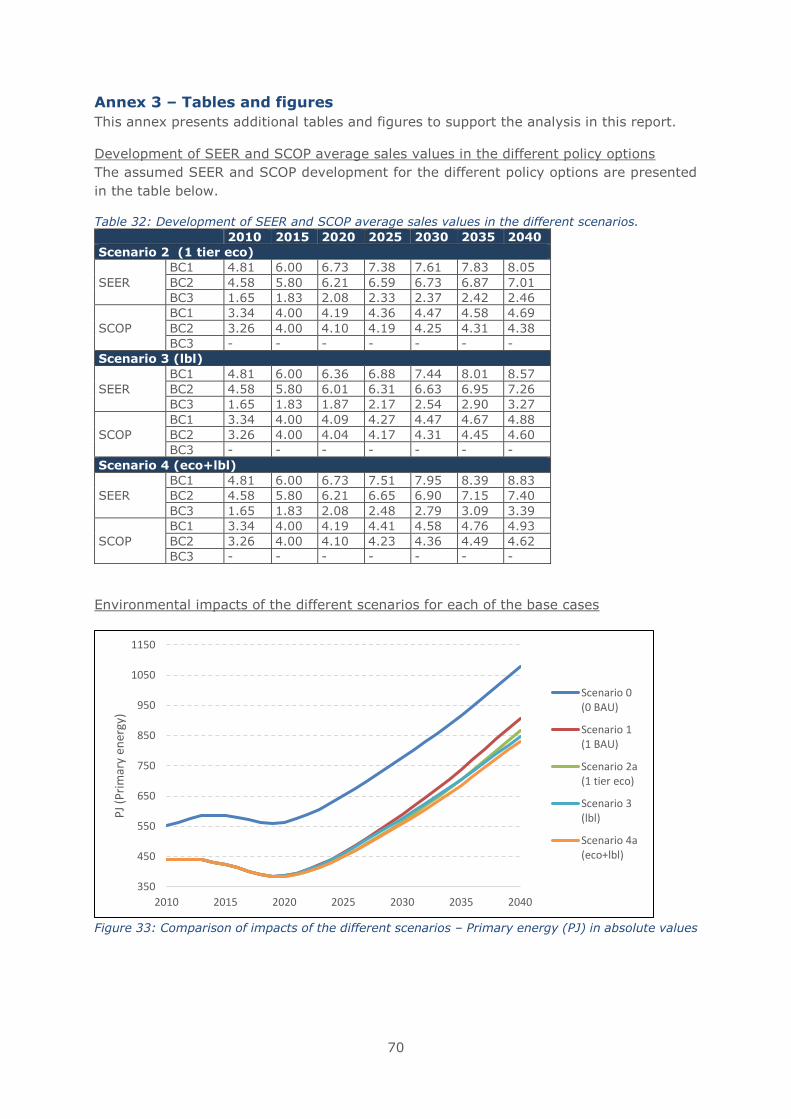
70
Annex 3 – Tables and figures
This annex presents additional tables and figures to support the analysis in this report.
Development of SEER and SCOP average sales values in the different policy options
The assumed SEER and SCOP development for the different policy options are presented
in the table below.
Table 32: Development of SEER and SCOP average sales values in the different scenarios.
2010 2015 2020 2025 2030 2035 2040
Scenario 2 (1 tier eco)
SEER
BC1 4.81 6.00 6.73 7.38 7.61 7.83 8.05
BC2 4.58 5.80 6.21 6.59 6.73 6.87 7.01
BC3 1.65 1.83 2.08 2.33 2.37 2.42 2.46
SCOP
BC1 3.34 4.00 4.19 4.36 4.47 4.58 4.69
BC2 3.26 4.00 4.10 4.19 4.25 4.31 4.38
BC3 - - - - - - -
Scenario 3 (lbl)
SEER
BC1 4.81 6.00 6.36 6.88 7.44 8.01 8.57
BC2 4.58 5.80 6.01 6.31 6.63 6.95 7.26
BC3 1.65 1.83 1.87 2.17 2.54 2.90 3.27
SCOP
BC1 3.34 4.00 4.09 4.27 4.47 4.67 4.88
BC2 3.26 4.00 4.04 4.17 4.31 4.45 4.60
BC3 - - - - - - -
Scenario 4 (eco+lbl)
SEER BC1 4.81 6.00 6.73 7.51 7.95 8.39 8.83
BC2 4.58 5.80 6.21 6.65 6.90 7.15 7.40
BC3 1.65 1.83 2.08 2.48 2.79 3.09 3.39
SCOP BC1 3.34 4.00 4.19 4.41 4.58 4.76 4.93
BC2 3.26 4.00 4.10 4.23 4.36 4.49 4.62
BC3 - - - - - - -
Environmental impacts of the different scenarios for each of the base cases
Figure 33: Comparison of impacts of the different scenarios – Primary energy (PJ) in absolute values
350
450
550
650
750
850
950
1050
1150
2010 2015 2020 2025 2030 2035 2040
PJ
(Pri
mar
y en
ergy
)
Scenario 0(0 BAU)
Scenario 1(1 BAU)
Scenario 2a(1 tier eco)
Scenario 3(lbl)
Scenario 4a(eco+lbl)
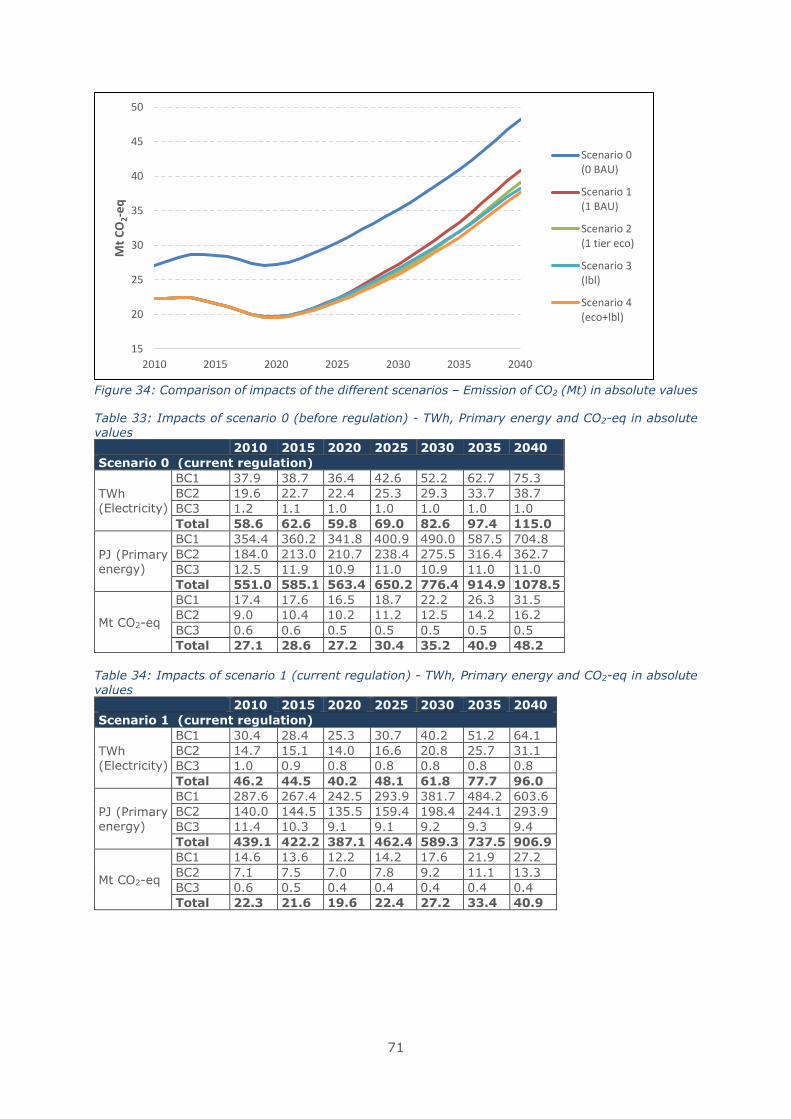
71
Figure 34: Comparison of impacts of the different scenarios – Emission of CO2 (Mt) in absolute values
Table 33: Impacts of scenario 0 (before regulation) - TWh, Primary energy and CO2-eq in absolute values
2010 2015 2020 2025 2030 2035 2040
Scenario 0 (current regulation)
TWh (Electricity)
BC1 37.9 38.7 36.4 42.6 52.2 62.7 75.3
BC2 19.6 22.7 22.4 25.3 29.3 33.7 38.7
BC3 1.2 1.1 1.0 1.0 1.0 1.0 1.0
Total 58.6 62.6 59.8 69.0 82.6 97.4 115.0
PJ (Primary energy)
BC1 354.4 360.2 341.8 400.9 490.0 587.5 704.8
BC2 184.0 213.0 210.7 238.4 275.5 316.4 362.7
BC3 12.5 11.9 10.9 11.0 10.9 11.0 11.0
Total 551.0 585.1 563.4 650.2 776.4 914.9 1078.5
Mt CO2-eq
BC1 17.4 17.6 16.5 18.7 22.2 26.3 31.5
BC2 9.0 10.4 10.2 11.2 12.5 14.2 16.2
BC3 0.6 0.6 0.5 0.5 0.5 0.5 0.5
Total 27.1 28.6 27.2 30.4 35.2 40.9 48.2
Table 34: Impacts of scenario 1 (current regulation) - TWh, Primary energy and CO2-eq in absolute values
2010 2015 2020 2025 2030 2035 2040
Scenario 1 (current regulation)
TWh
(Electricity)
BC1 30.4 28.4 25.3 30.7 40.2 51.2 64.1
BC2 14.7 15.1 14.0 16.6 20.8 25.7 31.1
BC3 1.0 0.9 0.8 0.8 0.8 0.8 0.8
Total 46.2 44.5 40.2 48.1 61.8 77.7 96.0
PJ (Primary energy)
BC1 287.6 267.4 242.5 293.9 381.7 484.2 603.6
BC2 140.0 144.5 135.5 159.4 198.4 244.1 293.9
BC3 11.4 10.3 9.1 9.1 9.2 9.3 9.4
Total 439.1 422.2 387.1 462.4 589.3 737.5 906.9
Mt CO2-eq
BC1 14.6 13.6 12.2 14.2 17.6 21.9 27.2
BC2 7.1 7.5 7.0 7.8 9.2 11.1 13.3
BC3 0.6 0.5 0.4 0.4 0.4 0.4 0.4
Total 22.3 21.6 19.6 22.4 27.2 33.4 40.9
15
20
25
30
35
40
45
50
2010 2015 2020 2025 2030 2035 2040
Mt
CO
2-e
q
Scenario 0(0 BAU)
Scenario 1(1 BAU)
Scenario 2(1 tier eco)
Scenario 3(lbl)
Scenario 4(eco+lbl)
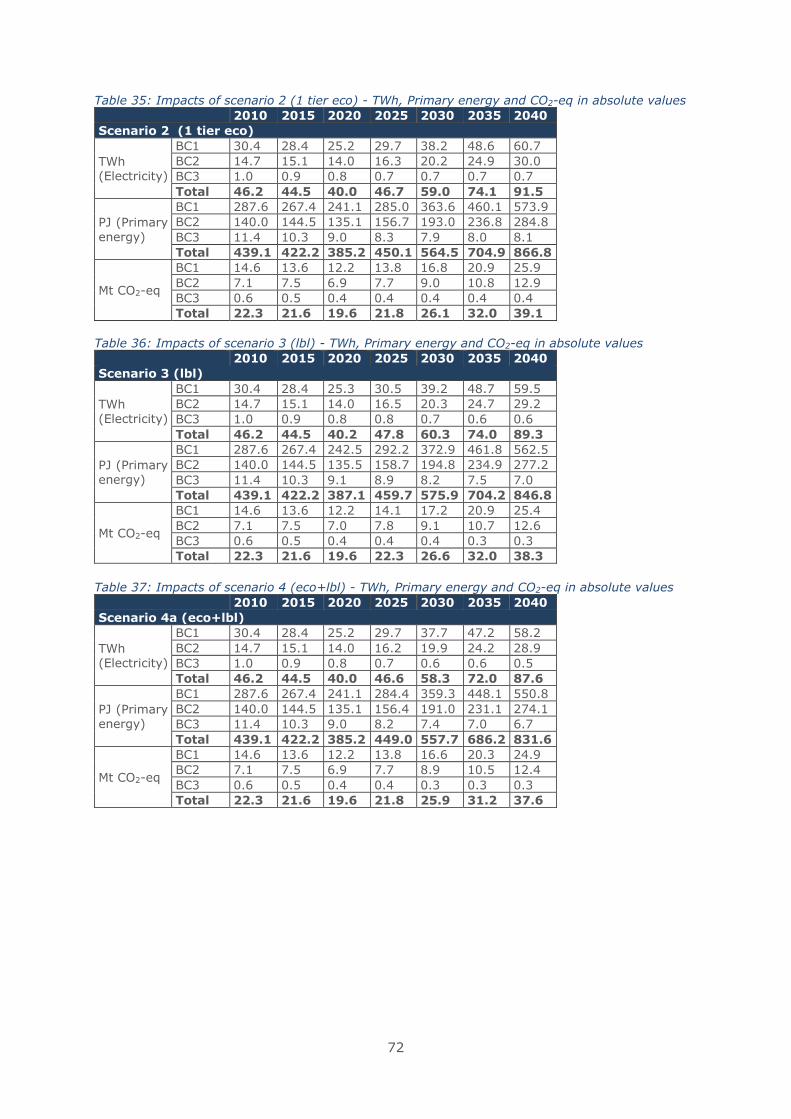
72
Table 35: Impacts of scenario 2 (1 tier eco) - TWh, Primary energy and CO2-eq in absolute values
2010 2015 2020 2025 2030 2035 2040
Scenario 2 (1 tier eco)
TWh (Electricity)
BC1 30.4 28.4 25.2 29.7 38.2 48.6 60.7
BC2 14.7 15.1 14.0 16.3 20.2 24.9 30.0
BC3 1.0 0.9 0.8 0.7 0.7 0.7 0.7
Total 46.2 44.5 40.0 46.7 59.0 74.1 91.5
PJ (Primary
energy)
BC1 287.6 267.4 241.1 285.0 363.6 460.1 573.9
BC2 140.0 144.5 135.1 156.7 193.0 236.8 284.8
BC3 11.4 10.3 9.0 8.3 7.9 8.0 8.1
Total 439.1 422.2 385.2 450.1 564.5 704.9 866.8
Mt CO2-eq
BC1 14.6 13.6 12.2 13.8 16.8 20.9 25.9
BC2 7.1 7.5 6.9 7.7 9.0 10.8 12.9
BC3 0.6 0.5 0.4 0.4 0.4 0.4 0.4
Total 22.3 21.6 19.6 21.8 26.1 32.0 39.1
Table 36: Impacts of scenario 3 (lbl) - TWh, Primary energy and CO2-eq in absolute values
2010 2015 2020 2025 2030 2035 2040
Scenario 3 (lbl)
TWh (Electricity)
BC1 30.4 28.4 25.3 30.5 39.2 48.7 59.5
BC2 14.7 15.1 14.0 16.5 20.3 24.7 29.2
BC3 1.0 0.9 0.8 0.8 0.7 0.6 0.6
Total 46.2 44.5 40.2 47.8 60.3 74.0 89.3
PJ (Primary energy)
BC1 287.6 267.4 242.5 292.2 372.9 461.8 562.5
BC2 140.0 144.5 135.5 158.7 194.8 234.9 277.2
BC3 11.4 10.3 9.1 8.9 8.2 7.5 7.0
Total 439.1 422.2 387.1 459.7 575.9 704.2 846.8
Mt CO2-eq
BC1 14.6 13.6 12.2 14.1 17.2 20.9 25.4
BC2 7.1 7.5 7.0 7.8 9.1 10.7 12.6
BC3 0.6 0.5 0.4 0.4 0.4 0.3 0.3
Total 22.3 21.6 19.6 22.3 26.6 32.0 38.3
Table 37: Impacts of scenario 4 (eco+lbl) - TWh, Primary energy and CO2-eq in absolute values
2010 2015 2020 2025 2030 2035 2040
Scenario 4a (eco+lbl)
TWh (Electricity)
BC1 30.4 28.4 25.2 29.7 37.7 47.2 58.2
BC2 14.7 15.1 14.0 16.2 19.9 24.2 28.9
BC3 1.0 0.9 0.8 0.7 0.6 0.6 0.5
Total 46.2 44.5 40.0 46.6 58.3 72.0 87.6
PJ (Primary energy)
BC1 287.6 267.4 241.1 284.4 359.3 448.1 550.8
BC2 140.0 144.5 135.1 156.4 191.0 231.1 274.1
BC3 11.4 10.3 9.0 8.2 7.4 7.0 6.7
Total 439.1 422.2 385.2 449.0 557.7 686.2 831.6
Mt CO2-eq
BC1 14.6 13.6 12.2 13.8 16.6 20.3 24.9
BC2 7.1 7.5 6.9 7.7 8.9 10.5 12.4
BC3 0.6 0.5 0.4 0.4 0.3 0.3 0.3
Total 22.3 21.6 19.6 21.8 25.9 31.2 37.6
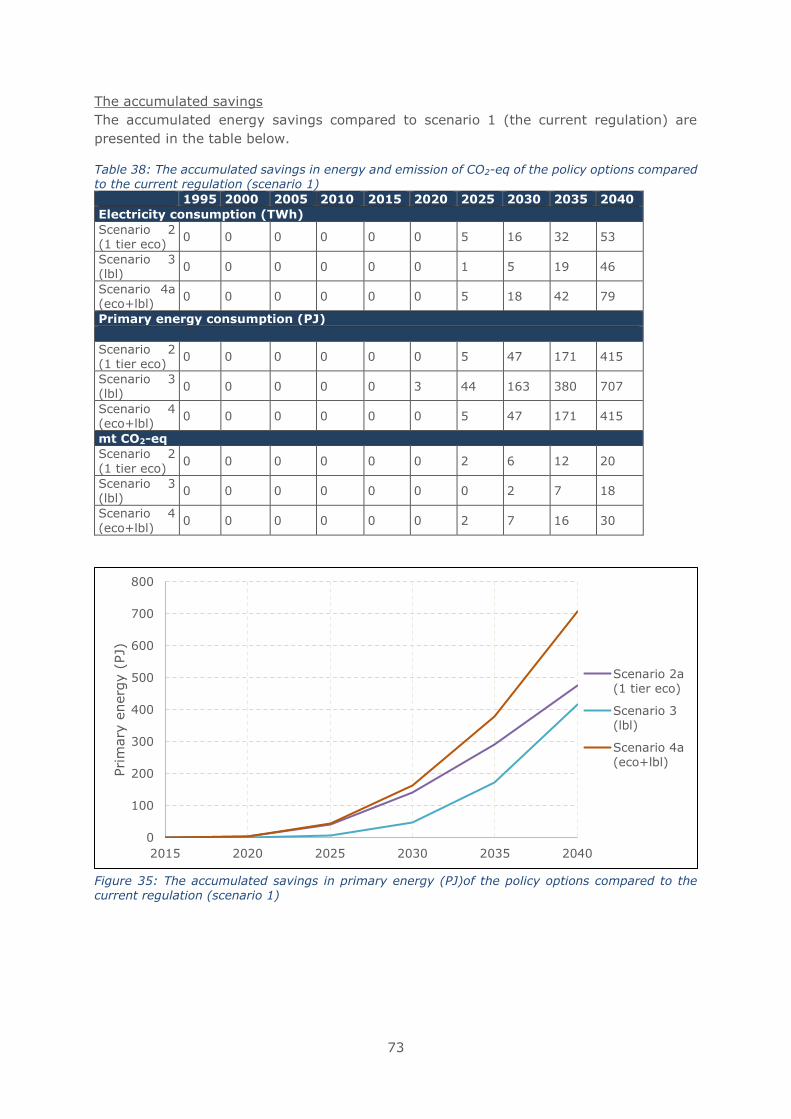
73
The accumulated savings
The accumulated energy savings compared to scenario 1 (the current regulation) are
presented in the table below.
Table 38: The accumulated savings in energy and emission of CO2-eq of the policy options compared to the current regulation (scenario 1)
1995 2000 2005 2010 2015 2020 2025 2030 2035 2040
Electricity consumption (TWh)
Scenario 2 (1 tier eco)
0 0 0 0 0 0 5 16 32 53
Scenario 3 (lbl)
0 0 0 0 0 0 1 5 19 46
Scenario 4a (eco+lbl)
0 0 0 0 0 0 5 18 42 79
Primary energy consumption (PJ)
Scenario 2 (1 tier eco)
0 0 0 0 0 0 5 47 171 415
Scenario 3 (lbl)
0 0 0 0 0 3 44 163 380 707
Scenario 4 (eco+lbl)
0 0 0 0 0 0 5 47 171 415
mt CO2-eq Scenario 2
(1 tier eco) 0 0 0 0 0 0 2 6 12 20
Scenario 3 (lbl)
0 0 0 0 0 0 0 2 7 18
Scenario 4
(eco+lbl) 0 0 0 0 0 0 2 7 16 30
Figure 35: The accumulated savings in primary energy (PJ)of the policy options compared to the current regulation (scenario 1)
0
100
200
300
400
500
600
700
800
2015 2020 2025 2030 2035 2040
Pri
mary
energ
y (
PJ)
Scenario 2a
(1 tier eco)
Scenario 3
(lbl)
Scenario 4a
(eco+lbl)
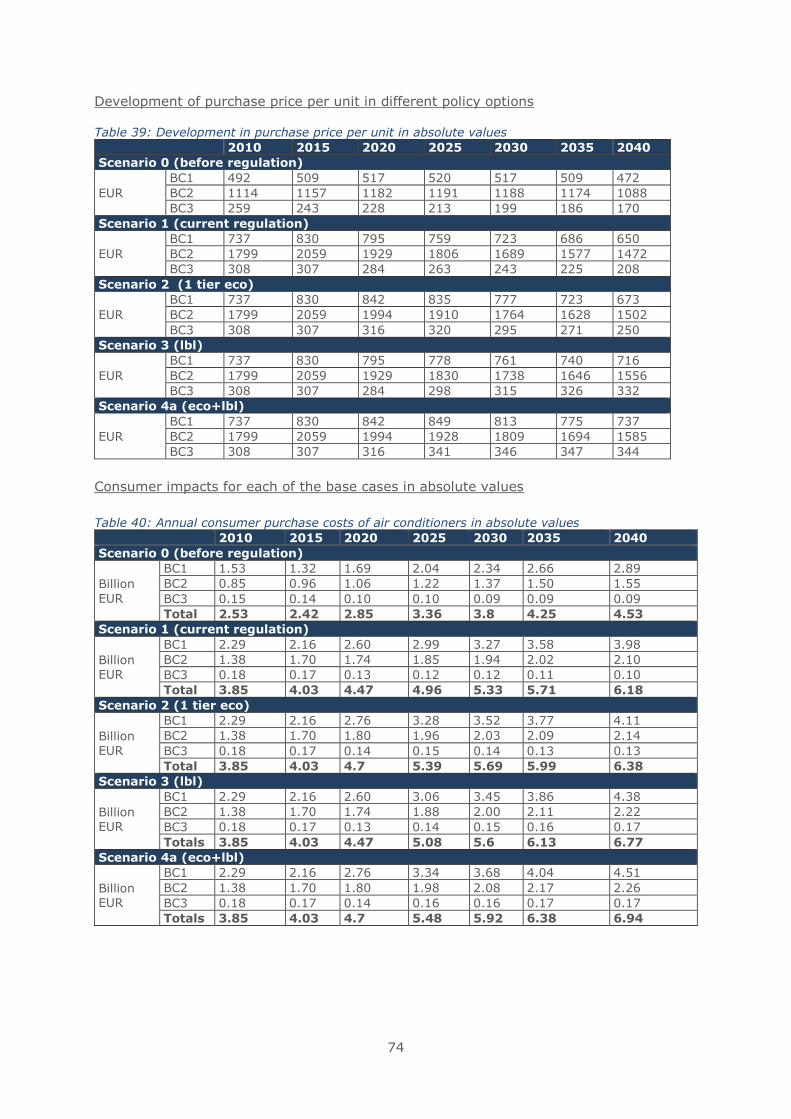
74
Development of purchase price per unit in different policy options
Table 39: Development in purchase price per unit in absolute values
2010 2015 2020 2025 2030 2035 2040
Scenario 0 (before regulation)
EUR
BC1 492 509 517 520 517 509 472
BC2 1114 1157 1182 1191 1188 1174 1088
BC3 259 243 228 213 199 186 170
Scenario 1 (current regulation)
EUR
BC1 737 830 795 759 723 686 650
BC2 1799 2059 1929 1806 1689 1577 1472
BC3 308 307 284 263 243 225 208
Scenario 2 (1 tier eco)
EUR
BC1 737 830 842 835 777 723 673
BC2 1799 2059 1994 1910 1764 1628 1502
BC3 308 307 316 320 295 271 250
Scenario 3 (lbl)
EUR BC1 737 830 795 778 761 740 716
BC2 1799 2059 1929 1830 1738 1646 1556
BC3 308 307 284 298 315 326 332
Scenario 4a (eco+lbl)
EUR BC1 737 830 842 849 813 775 737
BC2 1799 2059 1994 1928 1809 1694 1585
BC3 308 307 316 341 346 347 344
Consumer impacts for each of the base cases in absolute values
Table 40: Annual consumer purchase costs of air conditioners in absolute values
2010 2015 2020 2025 2030 2035 2040
Scenario 0 (before regulation)
Billion
EUR
BC1 1.53 1.32 1.69 2.04 2.34 2.66 2.89
BC2 0.85 0.96 1.06 1.22 1.37 1.50 1.55
BC3 0.15 0.14 0.10 0.10 0.09 0.09 0.09
Total 2.53 2.42 2.85 3.36 3.8 4.25 4.53
Scenario 1 (current regulation)
Billion EUR
BC1 2.29 2.16 2.60 2.99 3.27 3.58 3.98
BC2 1.38 1.70 1.74 1.85 1.94 2.02 2.10
BC3 0.18 0.17 0.13 0.12 0.12 0.11 0.10
Total 3.85 4.03 4.47 4.96 5.33 5.71 6.18
Scenario 2 (1 tier eco)
Billion EUR
BC1 2.29 2.16 2.76 3.28 3.52 3.77 4.11
BC2 1.38 1.70 1.80 1.96 2.03 2.09 2.14
BC3 0.18 0.17 0.14 0.15 0.14 0.13 0.13
Total 3.85 4.03 4.7 5.39 5.69 5.99 6.38
Scenario 3 (lbl)
Billion EUR
BC1 2.29 2.16 2.60 3.06 3.45 3.86 4.38
BC2 1.38 1.70 1.74 1.88 2.00 2.11 2.22
BC3 0.18 0.17 0.13 0.14 0.15 0.16 0.17
Totals 3.85 4.03 4.47 5.08 5.6 6.13 6.77
Scenario 4a (eco+lbl)
Billion EUR
BC1 2.29 2.16 2.76 3.34 3.68 4.04 4.51
BC2 1.38 1.70 1.80 1.98 2.08 2.17 2.26
BC3 0.18 0.17 0.14 0.16 0.16 0.17 0.17
Totals 3.85 4.03 4.7 5.48 5.92 6.38 6.94
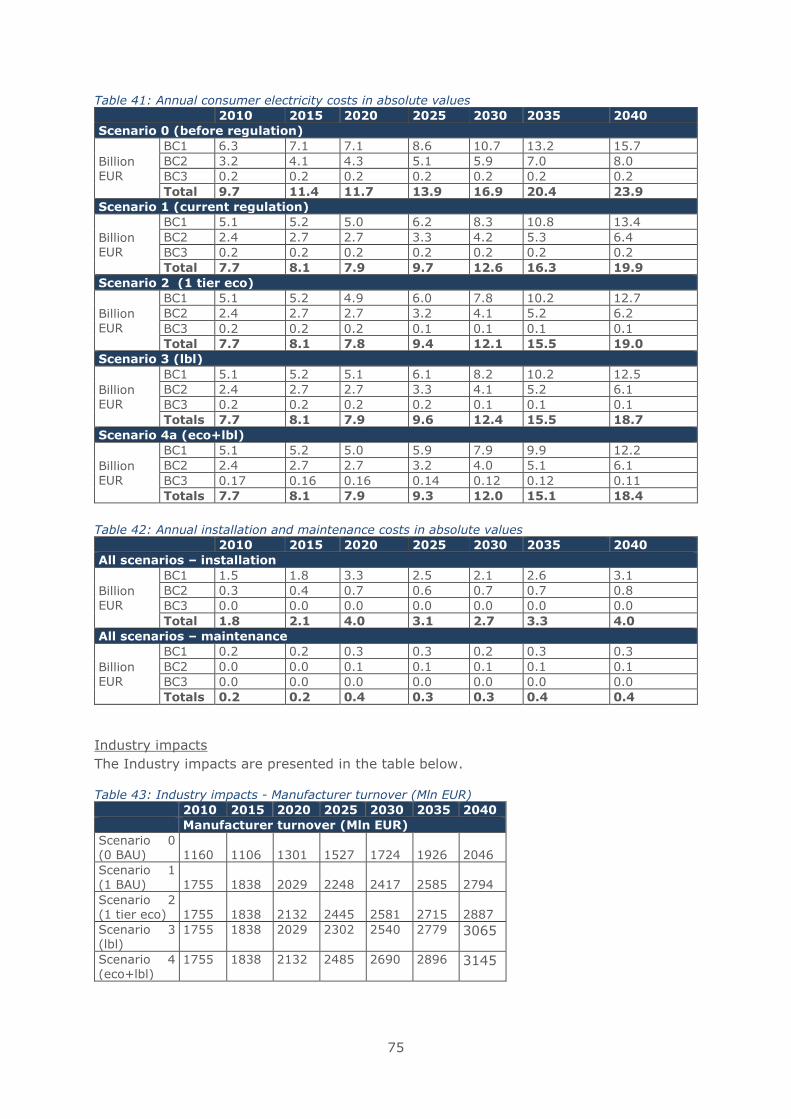
75
Table 41: Annual consumer electricity costs in absolute values
2010 2015 2020 2025 2030 2035 2040
Scenario 0 (before regulation)
Billion EUR
BC1 6.3 7.1 7.1 8.6 10.7 13.2 15.7
BC2 3.2 4.1 4.3 5.1 5.9 7.0 8.0
BC3 0.2 0.2 0.2 0.2 0.2 0.2 0.2
Total 9.7 11.4 11.7 13.9 16.9 20.4 23.9
Scenario 1 (current regulation)
Billion EUR
BC1 5.1 5.2 5.0 6.2 8.3 10.8 13.4
BC2 2.4 2.7 2.7 3.3 4.2 5.3 6.4
BC3 0.2 0.2 0.2 0.2 0.2 0.2 0.2
Total 7.7 8.1 7.9 9.7 12.6 16.3 19.9
Scenario 2 (1 tier eco)
Billion
EUR
BC1 5.1 5.2 4.9 6.0 7.8 10.2 12.7
BC2 2.4 2.7 2.7 3.2 4.1 5.2 6.2
BC3 0.2 0.2 0.2 0.1 0.1 0.1 0.1
Total 7.7 8.1 7.8 9.4 12.1 15.5 19.0
Scenario 3 (lbl)
Billion EUR
BC1 5.1 5.2 5.1 6.1 8.2 10.2 12.5
BC2 2.4 2.7 2.7 3.3 4.1 5.2 6.1
BC3 0.2 0.2 0.2 0.2 0.1 0.1 0.1
Totals 7.7 8.1 7.9 9.6 12.4 15.5 18.7
Scenario 4a (eco+lbl)
Billion EUR
BC1 5.1 5.2 5.0 5.9 7.9 9.9 12.2
BC2 2.4 2.7 2.7 3.2 4.0 5.1 6.1
BC3 0.17 0.16 0.16 0.14 0.12 0.12 0.11
Totals 7.7 8.1 7.9 9.3 12.0 15.1 18.4
Table 42: Annual installation and maintenance costs in absolute values
2010 2015 2020 2025 2030 2035 2040
All scenarios – installation
Billion EUR
BC1 1.5 1.8 3.3 2.5 2.1 2.6 3.1
BC2 0.3 0.4 0.7 0.6 0.7 0.7 0.8
BC3 0.0 0.0 0.0 0.0 0.0 0.0 0.0
Total 1.8 2.1 4.0 3.1 2.7 3.3 4.0
All scenarios – maintenance
Billion EUR
BC1 0.2 0.2 0.3 0.3 0.2 0.3 0.3
BC2 0.0 0.0 0.1 0.1 0.1 0.1 0.1
BC3 0.0 0.0 0.0 0.0 0.0 0.0 0.0
Totals 0.2 0.2 0.4 0.3 0.3 0.4 0.4
Industry impacts
The Industry impacts are presented in the table below.
Table 43: Industry impacts - Manufacturer turnover (Mln EUR)
2010 2015 2020 2025 2030 2035 2040
Manufacturer turnover (Mln EUR)
Scenario 0 (0 BAU) 1160 1106 1301 1527 1724 1926 2046
Scenario 1 (1 BAU) 1755 1838 2029 2248 2417 2585 2794
Scenario 2 (1 tier eco) 1755 1838 2132 2445 2581 2715 2887
Scenario 3 (lbl)
1755 1838 2029 2302 2540 2779 3065
Scenario 4
(eco+lbl)
1755 1838 2132 2485 2690 2896 3145
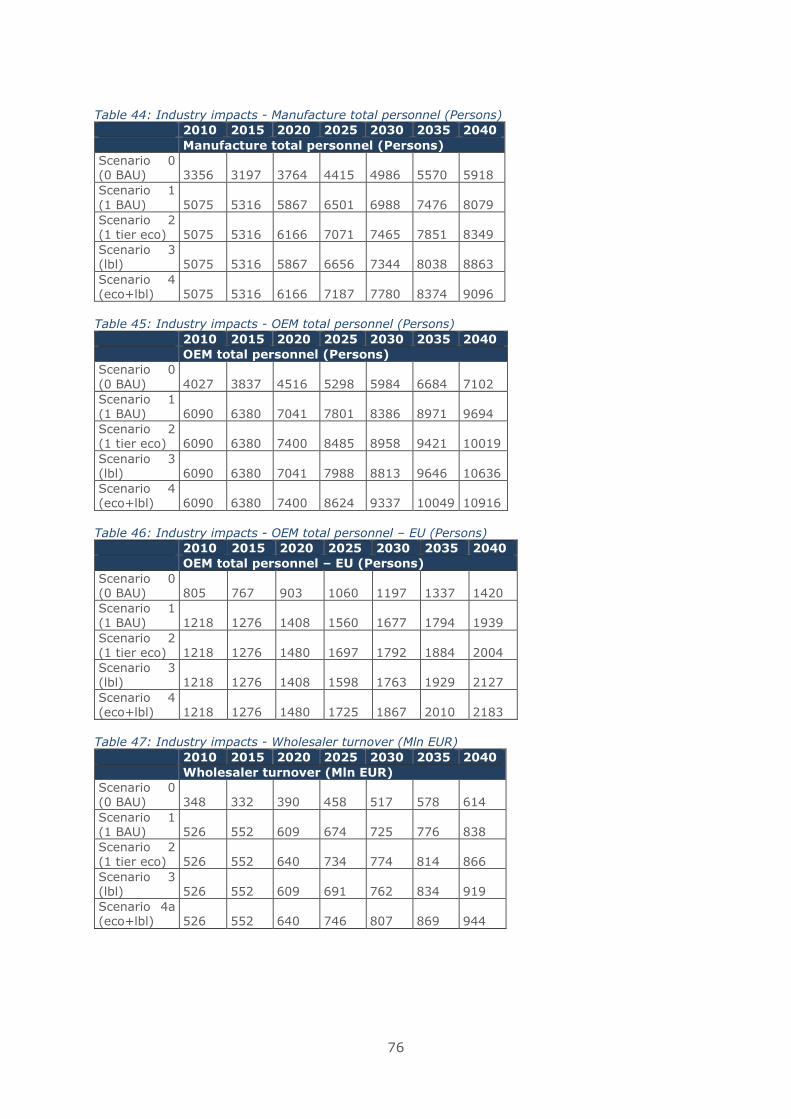
76
Table 44: Industry impacts - Manufacture total personnel (Persons)
2010 2015 2020 2025 2030 2035 2040
Manufacture total personnel (Persons)
Scenario 0 (0 BAU) 3356 3197 3764 4415 4986 5570 5918
Scenario 1
(1 BAU) 5075 5316 5867 6501 6988 7476 8079
Scenario 2 (1 tier eco) 5075 5316 6166 7071 7465 7851 8349
Scenario 3 (lbl) 5075 5316 5867 6656 7344 8038 8863
Scenario 4 (eco+lbl) 5075 5316 6166 7187 7780 8374 9096
Table 45: Industry impacts - OEM total personnel (Persons)
2010 2015 2020 2025 2030 2035 2040
OEM total personnel (Persons)
Scenario 0
(0 BAU) 4027 3837 4516 5298 5984 6684 7102
Scenario 1 (1 BAU) 6090 6380 7041 7801 8386 8971 9694
Scenario 2 (1 tier eco) 6090 6380 7400 8485 8958 9421 10019
Scenario 3 (lbl) 6090 6380 7041 7988 8813 9646 10636
Scenario 4 (eco+lbl) 6090 6380 7400 8624 9337 10049 10916
Table 46: Industry impacts - OEM total personnel – EU (Persons)
2010 2015 2020 2025 2030 2035 2040
OEM total personnel – EU (Persons)
Scenario 0 (0 BAU) 805 767 903 1060 1197 1337 1420
Scenario 1 (1 BAU) 1218 1276 1408 1560 1677 1794 1939
Scenario 2 (1 tier eco) 1218 1276 1480 1697 1792 1884 2004
Scenario 3 (lbl) 1218 1276 1408 1598 1763 1929 2127
Scenario 4 (eco+lbl) 1218 1276 1480 1725 1867 2010 2183
Table 47: Industry impacts - Wholesaler turnover (Mln EUR)
2010 2015 2020 2025 2030 2035 2040
Wholesaler turnover (Mln EUR)
Scenario 0 (0 BAU) 348 332 390 458 517 578 614
Scenario 1 (1 BAU) 526 552 609 674 725 776 838
Scenario 2 (1 tier eco) 526 552 640 734 774 814 866
Scenario 3 (lbl) 526 552 609 691 762 834 919
Scenario 4a (eco+lbl) 526 552 640 746 807 869 944
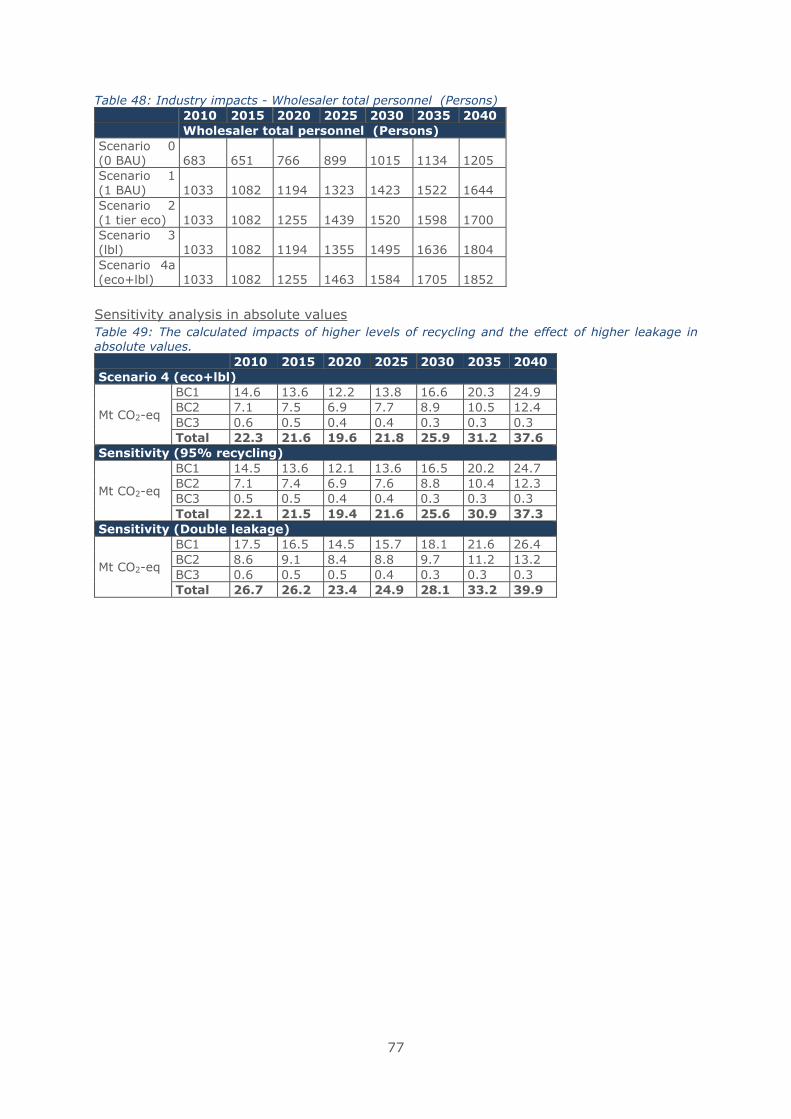
77
Table 48: Industry impacts - Wholesaler total personnel (Persons)
2010 2015 2020 2025 2030 2035 2040
Wholesaler total personnel (Persons)
Scenario 0 (0 BAU) 683 651 766 899 1015 1134 1205
Scenario 1 (1 BAU) 1033 1082 1194 1323 1423 1522 1644
Scenario 2 (1 tier eco) 1033 1082 1255 1439 1520 1598 1700
Scenario 3 (lbl) 1033 1082 1194 1355 1495 1636 1804
Scenario 4a (eco+lbl) 1033 1082 1255 1463 1584 1705 1852
Sensitivity analysis in absolute values
Table 49: The calculated impacts of higher levels of recycling and the effect of higher leakage in absolute values.
2010 2015 2020 2025 2030 2035 2040
Scenario 4 (eco+lbl)
Mt CO2-eq
BC1 14.6 13.6 12.2 13.8 16.6 20.3 24.9
BC2 7.1 7.5 6.9 7.7 8.9 10.5 12.4
BC3 0.6 0.5 0.4 0.4 0.3 0.3 0.3
Total 22.3 21.6 19.6 21.8 25.9 31.2 37.6
Sensitivity (95% recycling)
Mt CO2-eq
BC1 14.5 13.6 12.1 13.6 16.5 20.2 24.7
BC2 7.1 7.4 6.9 7.6 8.8 10.4 12.3
BC3 0.5 0.5 0.4 0.4 0.3 0.3 0.3
Total 22.1 21.5 19.4 21.6 25.6 30.9 37.3
Sensitivity (Double leakage)
Mt CO2-eq
BC1 17.5 16.5 14.5 15.7 18.1 21.6 26.4
BC2 8.6 9.1 8.4 8.8 9.7 11.2 13.2
BC3 0.6 0.5 0.5 0.4 0.3 0.3 0.3
Total 26.7 26.2 23.4 24.9 28.1 33.2 39.9