mir-93, mir-98, and mir-197 regulate expression of tumor suppressor gene fus1
TRANSCRIPT
miR-93, miR-98 and miR-197 regulate expression of tumorsuppressor gene FUS1
Liqin Du1,*, Jeoffrey J. Schageman1, Maria C. Subauste1, Barbara Saber1, Scott M.Hammond8, Ludmila Prudkin5, Ignacio I. Wistuba5,6, Lin Ji7, Jack A. Roth7, John D.Minna2,3,4, and Alexander Pertsemlidis1,3,*1Eugene McDermott Center for Human Growth and Development, UT Southwestern MedicalCenter, 5323 Harry Hines Boulevard, Dallas, Texas 75390.2Nancy and Jake Hamon Center for Therapeutic Oncology Research, UT Southwestern MedicalCenter, 5323 Harry Hines Boulevard, Dallas, Texas 75390.3Department of Internal Medicine, UT Southwestern Medical Center, 5323 Harry Hines Boulevard,Dallas, Texas 75390.4Department of Pharmacology, UT Southwestern Medical Center, 5323 Harry Hines Boulevard,Dallas, Texas 75390.5Department of Pathology, The University of Texas M. D. Anderson Cancer Center, 1515 HolcombeBoulevard, Houston, Texas 77030.6Department of Thoracic/Head and Neck Medical Oncology, The University of Texas M. D.Anderson Cancer Center, 1515 Holcombe Boulevard, Houston, Texas 77030.7Department of Thoracic Surgery, The University of Texas M. D. Anderson Cancer Center, 1515Holcombe Boulevard, Houston, Texas 77030.8Lineberger Comprehensive Cancer Center, University of North Carolina School of Medicine atChapel Hill, Chapel Hill, NC 27599.
AbstractFUS1 is a tumor suppressor gene located on human chromosome 3p21, and expression of Fus1protein is highly regulated at various levels, leading to lost or greatly diminished tumor suppressorfunction in many lung cancers. Here we show that selected microRNAs (miRNAs) interact with the3’ untranslated region (3’ UTR) of FUS1, leading to down-regulation of protein expression. Usingcomputational methods, we first predicted that FUS1 is a target of three miRNAs, miR-93, miR-98and miR-197, and then showed that exogenous over-expression of these miRNAs inhibited Fus1protein expression. We then confirmed that the three miRNAs target the 3’UTR region of theFUS1 transcript, and that individual deletion of the three miRNA target sites in the FUS1 3’UTRrestores the expression level of Fus1 protein. We further found that miR-93 and miR-98 are expressedat higher levels in small cell lung cancer cell lines (SCLC) than in non-small cell lung cancer celllines (NSCLC) and immortalized human bronchial epithelial cells (HBECs), and that miR-197 isexpressed at higher levels in both SCLC and NSCLC than in HBECs. Finally, we found that elevatedmiR-93 and miR-197 expression is correlated with reduced Fus1 expression in NSCLC tumor
*to whom correspondence should be addressed. Alexander Pertsemlidis, PhD, McDermott Center for Human Growth and Development,UT Southwestern Medical Center, Dallas, Texas 75390-8591, T: (214) 648-1921, F: (214) 648-1666,[email protected], Liqin Du, MD, PhD, Eugene McDermott Center for Human Growth and Development,UT Southwestern Medical Center, Dallas, Texas 75390-8591, T: (214) 648-7729, F: (214) 648-1666, [email protected].
NIH Public AccessAuthor ManuscriptMol Cancer Res. Author manuscript; available in PMC 2010 August 1.
Published in final edited form as:Mol Cancer Res. 2009 August ; 7(8): 1234–1243. doi:10.1158/1541-7786.MCR-08-0507.
NIH
-PA Author Manuscript
NIH
-PA Author Manuscript
NIH
-PA Author Manuscript
specimens. These results suggest that the three miRNAs are negative regulators of Fus1 expressionin lung cancers.
KeywordsmicroRNA; lung cancer; tumor suppressor gene
IntroductionFUS1, also known as TUSC2 (tumor suppressor candidate 2), is a tumor suppressor genelocated on human chromosome 3p21.3, a region in which deficient gene expression isfrequently seen in lung cancer (1). The tumor suppressor function of Fus1 has beendemonstrated in studies showing that over-expression of Fus1 significantly inhibits tumorgrowth and progression in mouse models (2), and that FUS1 knockout mice show an increasedfrequency of spontaneous cancers (3). More recently, Prudkin et al. found a reduction orcomplete loss of Fus1 expression in 82% of NSCLCs and 100% of SCLCs studied, which wasassociated with significantly worse overall survival (4), further demonstrating that Fus1 playsan important role in the pathogenesis of lung cancer.
Loss or reduced FUS1 expression could be caused by various mechanisms. Allelic loss of the3p21.3 chromosomal region containing FUS1 is the major cause of loss or reduction of Fus1expression in lung cancer (1,5). In other cases, however, the FUS1 gene and FUS1 mRNAexpression level are normal, but the Fus1 protein is not expressed at detectable levels (1,6),suggesting that Fus1 expression may be down-regulated at certain post-transcriptional stages.One mechanism regulating FUS1 expression and function has already been shown by Uno etal., who demonstrated that loss of myristoylation of Fus1 protein causes it to be rapidlydegraded and removes its ability to suppress tumor growth (7). Recent work on non-codingRNAs suggests other mechanisms by which transcription and translation of FUS1 might alsobe effectively uncoupled, including translational repression and destabilization of the FUS1mRNA, both of which can be mediated by miRNAs.
miRNAs are short, 21 to 23 nucleotide RNAs that regulate gene expression by binding tosequences in the 3’ untranslated region (3’ UTR) of an expressed mRNA, resulting in eithermodulation of translation efficiency or degradation of the mRNA (8–10). miRNAs have beenshown to regulate expression of a variety of genes involved in embryonic development and inhuman disease (8,11–21), including cancer (22–26). The 3’ UTR of FUS1 is highly conserved,strongly suggesting that it plays an important role in regulating FUS1 expression. Targetprediction shows that at least 3 miRNAs — miR-93, miR-98 and miR-197 — potentiallyinteract with the FUS1 3’UTR. We therefore examined the role of these miRNAs in regulatingFus1 protein expression.
ResultsThe 3’UTR of FUS1 plays a significant role in regulating FUS1 expression levels in NCI-H1299cells
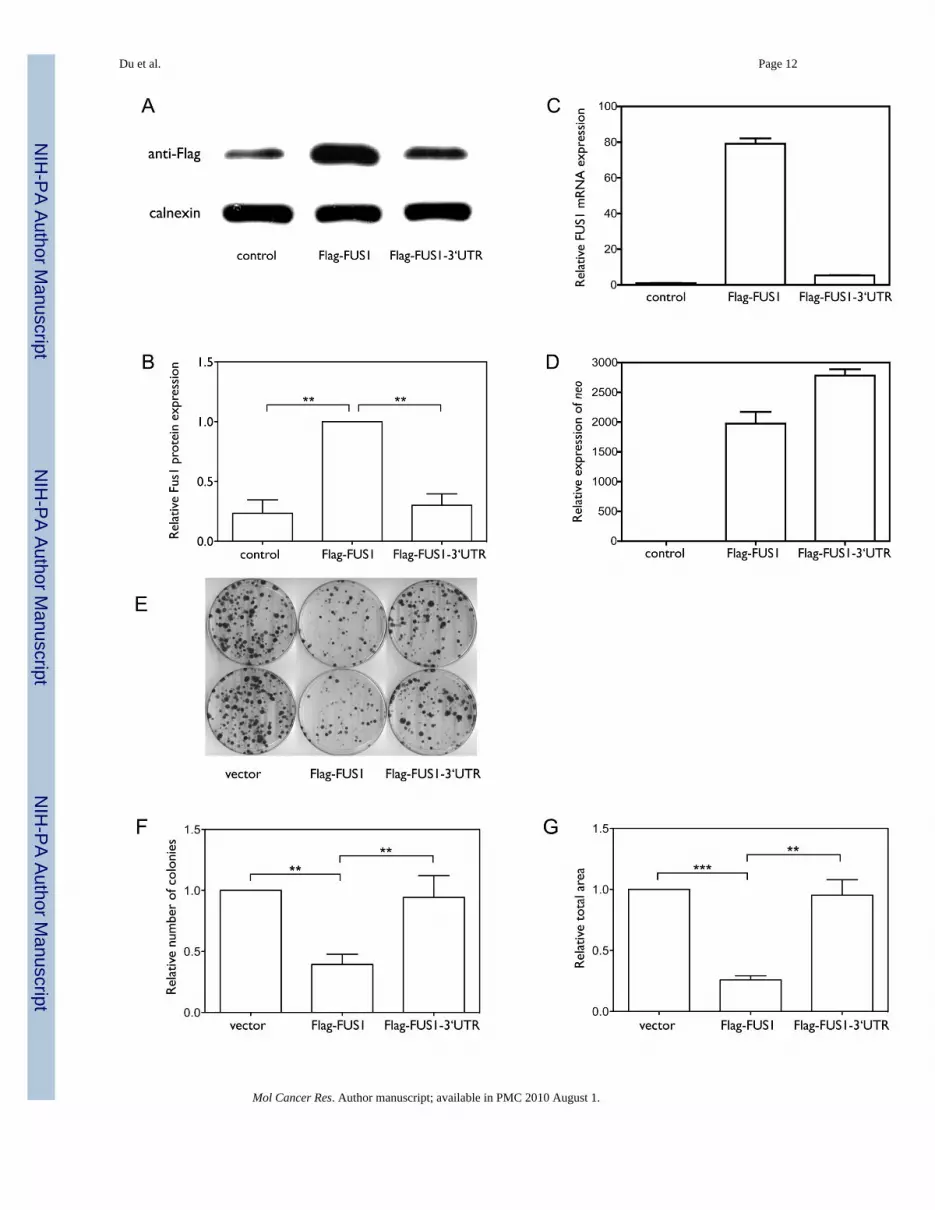
Previous studies have shown that Fus1 is expressed in normal lung epithelial cells, but theexpression is frequently reduced or lost in lung cancer cell lines and in lung cancer specimens(4,7), despite the FUS1 mRNA being expressed in these cells. To assess the role of the 3’UTRof FUS1 in regulating Fus1 protein expression, we compared the levels of expression of therecombinant proteins from Flag-FUS1 (Flag-tagged FUS1 without the 3’UTR), and Flag-FUS1-3’UTR (Flag-tagged FUS1 with the full-length 3’UTR) constructs. As shown in Figure1A, 1B and 1C, both the mRNA and protein expression levels of Fus1 were significantly lower
Du et al. Page 2
Mol Cancer Res. Author manuscript; available in PMC 2010 August 1.
NIH
-PA Author Manuscript
NIH
-PA Author Manuscript
NIH
-PA Author Manuscript
in cells expressing Flag-FUS1-3’UTR than in cells expressing Flag-FUS1 (p=0.0024 andp=0.0019, n=5). mRNA expression levels of neo (Figure 1D), which was also present in theexpression vector and served as a control for expression efficiency of the vector (27), indicatedthat the higher expression level of Fus1 protein in cells expressing Flag-FUS1 was not due tohigher expression efficiency of this construct relative to that of the Flag-FUS1-3’UTR. Aninverse relationship between exogenously induced over-expression of FUS1 and the growthrate of H1299 cells has already been established (6). We therefore examined the contributionof the 3’UTR of FUS1 to cell proliferation by colony formation assay. As shown in Figure 1E–G, Flag-FUS1 expression significantly inhibited cell growth relative to Flag-FUS1-3’UTR andthe control vector, with the number and size of colonies formed in the presence of Flag-FUS1much smaller than in the presence of Flag-FUS1-3’UTR (p=0.0081 and p=0.0011) or the vectorcontrol (p=0.0048 and p=0.0004, by two-tailed paired t-test). Taken together, these resultsimplicate the 3’UTR of FUS1 in reducing levels of Fus1 expression and tumor suppressorfunction.
miR-93, miR-98 and miR-197 are predicted to target the 3’UTR of FUS1Using a program we developed (miRmate), we identified three miRNAs — miR-93, miR-98and miR-197 — that are highly likely to interact with the 3’ UTR of FUS1. As shown in Figure2A, the predicted target sites of miR-93 and miR-98 are located in regions that are highlyevolutionarily conserved, while the predicted target site of miR-197 does not fall in a highlyconserved region. Figure 2B shows the structure of the miRNA:target interactions for miR-93,miR-98 and miR-197, with the conservation of the target sites across species. Both PicTar(28) and TargetScan(29) also predict several miRNA target sites in the FUS1 3’UTR, includingthose for miR-93 and miR-98.
miR-93, miR-98 and miR-197 translationally repress Fus1 by targeting specific sequences inthe 3’UTR of FUS1
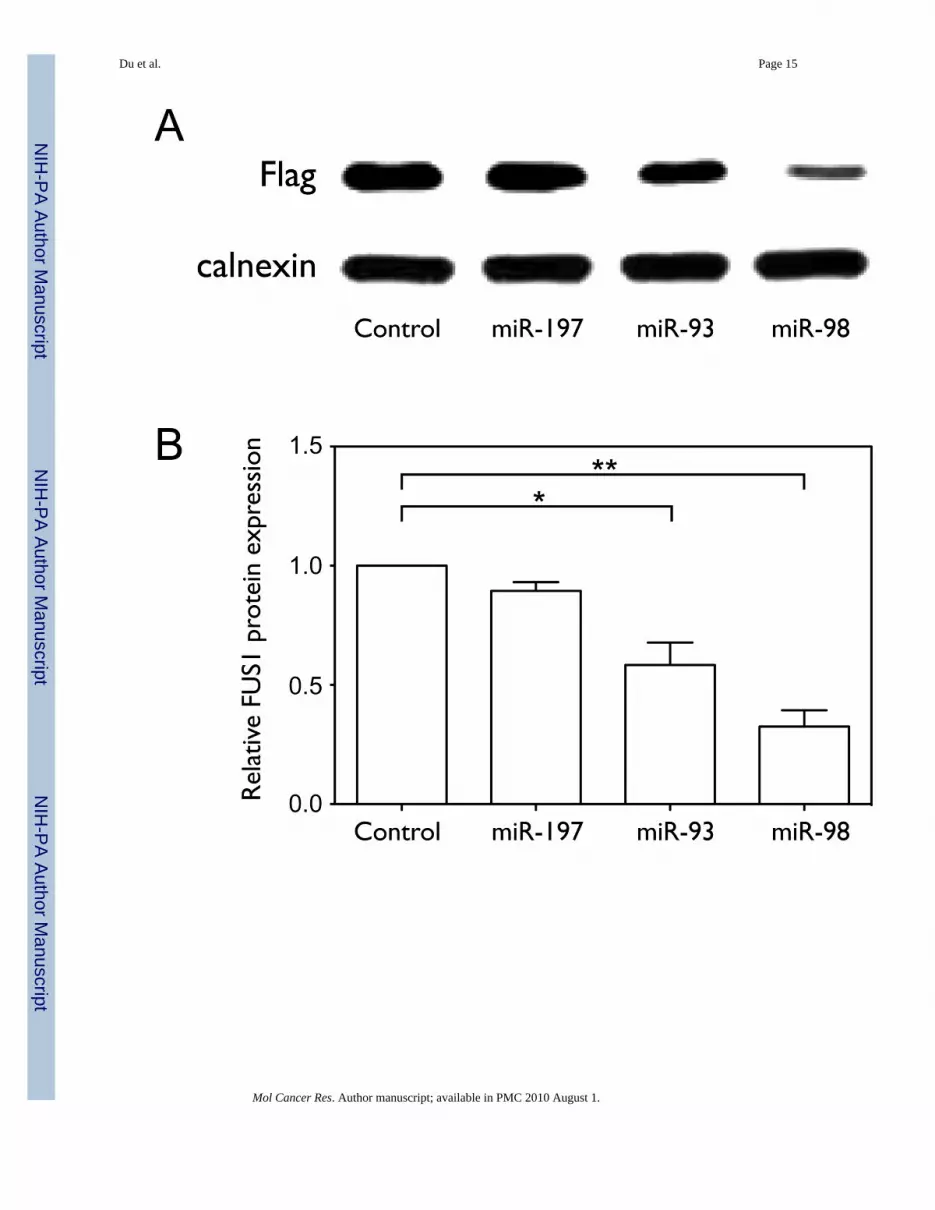
In order to test the effect of the three miRNAs on Fus1 protein expression, we co-transfectedNCI-H1299 cells with the Flag-FUS1-3’UTR construct and with either control or miRNAexpression constructs. As shown in Figure 3A and 3B, over-expression of miR-93 or miR-98significantly inhibited Fus1 protein expression (0.58±0.16 and 0.32±0.12 relative to control,with p=0.0239 and p=0.0050, by one-tailed paired t-test, n=3), with miR-98 showing a greatereffect than miR-93. miR-197 does not significantly decrease Fus1 protein expression (0.89±0.06 relative to control, with p=0.0515, n=3), although the over-expressed level of miR-197relative to endogenous control is much higher than that of miR-93 and miR-98, as shown inFigure 3E. FUS1 mRNA levels are not significantly affected by miRNA over-expression(Figure 3C), and neo expression levels measured as a control for transfection efficiency arenot significantly different between samples (Figure 3D).
To test the specificity of the interaction between the three miRNAs and the 3’UTR of FUS1,we placed the 3’UTR of FUS1 downstream of the luciferase coding region in an expressionconstruct. We co-expressed the reporter construct with either a vector expressing a candidatemiRNA, a control vector expressing miR-199b, which is not predicted to target the 3’UTR ofFUS1, or an empty vector (pCMV6), and monitored luciferase activity. As shown Figure 3F,each miRNA repressed luciferase activity by 25–30%, as compared with the control. Thismagnitude of repression is consistent with that observed in previous studies of miRNAregulation using luciferase reporter vectors (28, 30).
To further confirm the specific target sites of the three miRNAs in the 3’UTR of FUS1, wedeleted the seed sequences of the miR-93, miR-98 and miR-197 target sites (Figure 2B) in the3’UTR of the Flag-FUS1-3’UTR construct, and compared protein expression and tumorsuppressor function of FUS1 with that of the wildtype Flag-FUS1 and Flag-FUS1-3’UTR
Du et al. Page 3
Mol Cancer Res. Author manuscript; available in PMC 2010 August 1.
NIH
-PA Author Manuscript
NIH
-PA Author Manuscript
NIH
-PA Author Manuscript
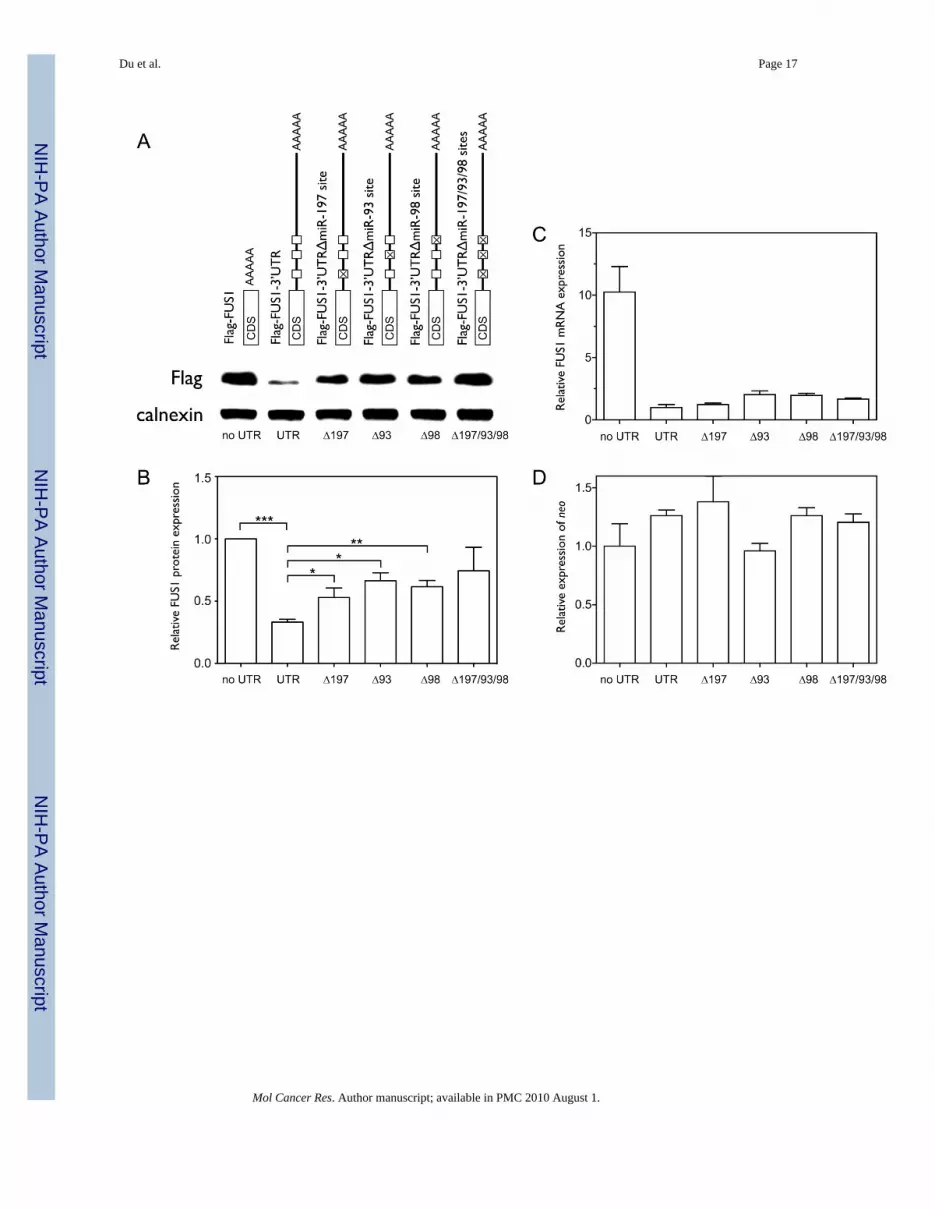
constructs in transfected NCI-H1299 cells. As shown in Figure 4A and 4B, individual deletionsof the seed sequences of the miR-197, miR-93, and miR-98 target sites significantly increasedthe expression level of Fus1 protein relative to wildtype Flag-FUS1-3’UTR (1.6 fold withp=0.0477, 2 fold with p=0.0259, and 1.85 fold with p=0.0067, respectively, by one-tailed pairedt-test, n=4) with the combinatorial deletion showing higher levels of protein expression thanindividual deletions (2.24 fold). Relative levels of FUS1 (Figure 4C) and neo mRNA (Figure4D) measured by qRT-PCR were not altered by the deletions. As shown in Figure 4E–G, over-expression of the Flag-FUS1-3’UTR expression constructs with individual deletions of themiR-197, miR-93 and miR-98 seed target sequences as wells as combined deletion of the threetarget sites significantly decreased the number (p=0.0012, p=0.0328, p=0.0036 and p=0.0024,respectively, by one-tailed paired t-test, n=3) and size (p=0.0044, p=0.0500, p=0.0083 andp=0.0101, respectively, by one-tailed paired t-test, n=3) of the colonies formed as comparedwith wildtype Flag-FUS1-3’UTR construct. The above results indicate that removal of thethree miRNAs target sites in the 3’UTR of FUS1 significantly restores Fus1 protein expression,and correspondingly, restores its function as a tumor suppressor.
Overall, these results indicate that miR-93, miR-98 and miR-197 negatively regulate FUS1tumor suppressor function by inhibiting Fus1 protein expression through targeting specificsites in the FUS1 3’UTR.
miR-93 and miR-98 are expressed at higher levels in SCLC than in NSCLC and HBEC celllines, and miR-197 is expressed at higher levels in both SCLC and NSCLC relative to HBECcell lines
To evaluate the physiological relevance of these miRNAs in lung cancer pathogenesis, weanalyzed endogenous expression levels of these three miRNAs in 9 SCLC cell lines, 8 NSCLCcell lines, and 3 immortalized normal human bronchial epithelial cell lines (HBECs). Weprofiled expression levels of 136 miRNAs in these cell lines in duplicate using miRNAmicroarrays. The normalized expression profiles allowed us to identify miRNAs withstatistically significant differential expression between SCLC and NSCLC cell lines andbetween lung cancer cell lines and HBECs. We found that miR-93 and miR-98 are over-expressed in SCLCs relative to NSCLC and HBECs, and miR-197 is over-expressed in bothSCLCs and NSCLC relative to HBECs. As shown in Figure 5A and 5B, the expression levelsof miR-93, miR-98 and miR-197 differ significantly among the different cell lines, andgenerally miR-93 and miR-98 are expressed at higher levels in SCLC (n=9) as compared withNSCLC (1.88 fold with p=0.0001 by two-tailed t-test, and 3.04 fold with p<0.0001, n=8) andHBECs (1.98 fold with p=0.0100, and 2.50 fold with p=0.0077, n=3), whereas miR-197 isexpressed at higher levels in both SCLCs and NSCLCs as compared with HBECs (2.07 foldwith p=0.0060, and 1.84 fold with p=0.0206). This suggests that aberrant expression ofmiR-197 might contribute to both SCLC and NSCLC tumorigenesis in general, while miR-93and miR-98 may play a more important role in the development of SCLCs than NSCLCs.
Expression of miR-93 and miR-197 is inversely correlated with Fus1 expression in lungcancer tumor specimens
Levels of all three miRNAs differ dramatically between the NSCLC cell lines, suggesting thataberrant expression of the miRNAs may contribute to the decrease of Fus1 expression inspecific NSCLCs. In order to examine the correlation of the three miRNAs with Fus1 level,we measured the expression levels of miR-93, miR-98 and miR-197 in 20 NSCLC tumorspecimens (14 adenocarcinoma and 6 squamous cell carcinoma) samples by qRT-PCR. Thesesamples had been previously characterized as positive for Fus1 expression byimmunohistochemical staining (4) and were classified into two groups, “low” and “high”,based on Fus1 expression. As shown in Figure 6A, expression of miR-93 and miR-197 issignificantly higher in samples in the “low” Fus1 group than in the “high” Fus1 group (1.62
Du et al. Page 4
Mol Cancer Res. Author manuscript; available in PMC 2010 August 1.
NIH
-PA Author Manuscript
NIH
-PA Author Manuscript
NIH
-PA Author Manuscript
fold with p=0.0164, and 1.48 fold with p=0.0265 by one-tailed t-test with n=10), whileexpression of miR-98 is not significantly different between the two groups (p=0.3390, n=10).In contrast, expression levels of miR-205 and miR-338, which are not predicted to targetFUS1 mRNA, are not significantly different between the two groups (p=0.4961 and p=0.4318),as shown in Figure 6B.
DiscussionThe 3’UTRs of many protein-coding mRNAs have been shown to play an important role inregulating protein expression. Regulatory elements typically located in 3’UTRs include AU-rich elements (ARE) and iron-response elements (IREs) (31). Binding of the trans-actingfactors ARE binding proteins (ARE-BP) and IRE binding proteins (IRE-BP) to AREs andIREs, respectively, leads to either translational repression/enhancement or mRNAstabilization/destabilization. In this study, we show that the 3’UTR significantly represses theexpression of FUS1 at both the mRNA and protein levels. Analysis of the FUS1 3’UTR shows,however, that it lacks typical ARE and IRE elements, suggesting a different regulatorymechanism. Using computational methods, we predicted that the 3’UTR of FUS1 containstarget sites of at least three miRNAs, including miR-93, miR-98 and miR-197. We showedthat deletion of the seed sequences of the miRNA target sites in the 3’UTR significantly restoresprotein expression levels (Figure 4A) and, correspondingly, the tumor suppressor function ofFUS1 (Figure 4E–G), suggesting that Fus1 expression is under significant repression byendogenous expression of the three miRNAs.
In order to confirm the direct interaction of the miRNAs with the 3’UTR of FUS1, we conductedluciferase reporter assays in HEK 293 cells. Our results (Figure 3F) show that for miR-197,both a 1:1 ratio and a 5:1 ratio of miRNA vector to luciferase reporter vector result in themaximum reduction of the luciferase activity. For miR-93 and miR-98, however, a 1:1 ratioof miRNA expression vector to luciferase reporter vector is not enough to significantly inhibitluciferase activity, and a 5:1 ratio is needed to reach the maximum effect. These data indicatethat the 3’UTR of FUS1 is more sensitive to lower doses of miR-197 than of miR-93 andmiR-98, which suggests that miR-197 might have a more substantial direct effect on the 3’UTRof FUS1 than do miR-93 and miR-98. However, when over-expressing the three miRNAs inNCI-H1299 cells, miR-93 and miR-98 significantly inhibited Fus1 protein expression, whereasunexpectedly, miR-197 did not have a significant inhibitory effect (Figure 3A). The followingpossibilities could lead to the above outcome: 1) miR-197 regulates Fus1 expression throughboth direct and indirect mechanisms. In H1299 cells, miR-197 might inhibit the expression ofanother gene that down-regulates Fus1 expression. The resulting down-regulation of this genewill compensate for the direct inhibitory effect of miR-197 on the 3’UTR of FUS1. If bothpathways are active in H1299 cells, then over-expression of miR-197 in H1299 would notsignificantly decrease Fus1 expression due to the opposing directions of these two regulatorypathways. 2) In H1299 cells, but not in HEK293 cells, the 3’UTR of FUS1 is maximallyrepressed by endogenous miR-197, so that exogenous introduction of miR-197 cannot lead tofurther significant inhibition of Fus1 expression (Figure 3A). In this case, removal of themiR-197 target site would release FUS1 from repression by endogenous miR-197, leading tothe observed significant increase in Fus1 protein (Figure 4A and 4B).
As for the role of the 3’UTR in regulating FUS1 mRNA levels, our results indicate that the3’UTR is responsible not only for decreasing expression of the Fus1 protein product, but alsofor significantly down-regulating mRNA expression (Figure 1A and 1C). On the other hand,our results (Figure 3C and Figure 4C) also show that the three miRNAs do not significantlyaffect FUS1 mRNA levels. The above results clearly indicate that there are additional undefinedsite(s) in the 3’UTR of FUS1 that influence mRNA stability. However, combined removal ofthe three miRNA target sites restores protein expression nearly completely (Figure 4A). This
Du et al. Page 5
Mol Cancer Res. Author manuscript; available in PMC 2010 August 1.
NIH
-PA Author Manuscript
NIH
-PA Author Manuscript
NIH
-PA Author Manuscript
result not only suggests that the low levels of FUS1-3’UTR mRNA can be translated veryefficiently upon removal of the miRNA target sites, but also seems to imply that mRNAstability (as reflected in mRNA levels) does not play a significant role in controlling Fus1protein levels. We speculate that the disruption of only the mRNA de-stabilizing site(s) wouldsignificantly increase both the FUS1 mRNA and protein level. It is also reasonable to infer,however, that the removal of both the miRNA regulatory sites and the mRNA de-stabilizingsites altogether (by removing the 3’UTR as shown in Figure 4A) could not bring the Fus1protein to a significantly higher level than what would be observed after removing either themiRNA target sites or the mRNA de-stabilizing site(s), since the significantly elevated Fus1protein level might induce more intensive down-regulation of Fus1 through a mechanism suchas protein degradation, thereby leading to lower than “predicted” Fus1 levels. Thesepossibilities suggest attractive future directions for studying the regulation of FUS1 mRNAstability and Fus1 protein regulation at the post-translational level.
Of the three miRNAs that translationally repress Fus1, miR-93 and miR-98 are overexpressedin SCLC relative to NSCLC and HBECs. This finding is of particular interest given the earlydissemination and rapid clinical evolution of SCLC relative to the slow clinical progression ofNSCLC. Coupled with the finding that average Fus1 expression is significantly lower in SCLCtissue specimens than in NSCLC tissue specimens and normal lung epithelia (4), it is reasonableto speculate that the overexpression of these two miRNAs in SCLC is one of the factorscontributing to the loss or reduction of Fus1 expression. miR-93 and miR-197 are expressedat higher levels in specimens where Fus1 expression is low, and at lower levels in specimenswhere Fus1 expression is high, suggesting that miR-93 and miR-197 are responsible, at leastpartially, for the reduced Fus1 expression in the former. The expression of miR-98, however,does not differ significantly between the two groups, possibly because the endogenous levelof miR-98 is not high enough to affect the Fus1 level in NSCLC tissue specimens, especiallyin the presence of high levels of miR-93 and miR-197 in the specimens with low Fus1expression. Overall, our results indicate that the expression of the three miRNAs is related toFus1 expression in lung cancer, suggesting that the aberrant expression of these miRNAs mightplay a role during the tumorigenesis of lung cancer by regulating Fus1 expression.
miR-93 and miR-98 have been linked to cancer in previous studies. For example, Blenkironet al. recently showed that miR-93 expression is upregulated in primary breast cancer ascompared with normal breast cells (32). Yanaihara, et al. reported that over-expression ofmiR-93 correlated with worse prognosis of lung adenocarcinoma patients (33). These studies,however, did not investigate whether miR-93 has an oncogenic function. Our results thusprovide the first evidence that miR-93 acts as an oncogene by down-regulating the expressionof tumor suppressor gene FUS1. Hebert et al. showed that miR-98 targets Hmga2 in head andneck squamous cell carcinoma (HNSCC) cells (34). Hmga2 expression has been linked toseveral other types of cancers and has been shown to be associated with enhanced selectivechemosensitivity of cancer cells to the topoisomerase II inhibitor doxorubicin (35–37).Interestingly, translocations frequently append the 3’UTR of HMGA2 to the 3’ end of tumorsuppressor genes such as FHIT, RAD51L1 and HEI10, suggesting that translational repressionof these tumor suppressor genes by miR-98 may contribute to tumorigenesis. Coupling theseresults, we speculate that miR-98 may play a critical role in the development of cancer byregulating expression of multiple cancer-related proteins, including Fus1. In contrast to miR-93and miR-98, little is known about the function of miR-197. Our results therefore implicatemiR-197 in carcinogenesis through its down-regulation of Fus1 expression. Unlike miR-93and miR-98, which are overexpressed in SCLC, miR-197 is overexpressed in both NSCLCand SCLC relative to normal HBECs, suggesting that miR-197 plays a more important role indown-regulating Fus1 expression in NSCLC than either miR-93 or miR-98.
Du et al. Page 6
Mol Cancer Res. Author manuscript; available in PMC 2010 August 1.
NIH
-PA Author Manuscript
NIH
-PA Author Manuscript
NIH
-PA Author Manuscript
Overall, our results are the first demonstration that three miRNAs – miR-197, miR-93 andmiR-98 – down-regulate Fus1 expression by targeting the 3’UTR of FUS1, and also clearlyindicate that there are additional undefined site(s) in the 3’UTR of FUS1 that influence mRNAstability. In addition, given the rapid growth of the miRNA family, it is reasonable to expectthat there are unknown miRNAs that regulate Fus1 expression. For example, recent work byLee et al. has shown that miR-378 can down-regulate Fus1 expression in U87 cells (38). Furtherstudy is needed to define the full set of regulatory sites in the 3’UTR of FUS1 and of regulatorsof Fus1 expression. From a clinical perspective, while our preliminary investigation in lungcancer cell lines and clinical samples suggests that aberrant expression of these miRNAs playsa role in down-regulating Fus1 expression, further investigation is needed to fully define theirrole in the development and progression of lung cancer in vivo.
Materials and MethodsCell lines
Lung cancer cell lines (NCI-H146, NCI-H157, NCI-H187, NCI-H209, NCI-H526, NCI-H889,NCI-H1299, NCI-H1648, NCI-H1672, NCI-H1770, NCI-H1819, NCI-H2052, NCIH2107,NCI-H2171, NCI-H2195, NCI-H2122, NCI-H2887, HCC366, HCC970, HCC1195, andHCC2450) were from the Hamon Center collection. HEK-293 cells were obtained from ATCC(Manassas, VA). Lung cancer cell lines and HBECs were grown in RPMI 1640 supplementedwith 5% FBS (Atlanta Biologicals, Lawrenceville, GA). HEK-293 cells were grown inDulbecco’s MEM (Mediatech, Manassas, VA) supplemented with 10% FBS.
Construction of expression vectorsmiR-197, miR-93, and miR-98 and miR-199b were amplified by PCR from genomic humanDNA using the following primers:
miR-197 forward, 5’- ATTACTTTGCCCATATTCATTTTGA-3’;
miR-197 reverse, 5’-GCAACAGTGTGAATGTACTTAATGC-3’;
miR-93 forward, 5’-AGTCTCTGGCTGACTACATCACAG-3’;
miR-93 reverse, 5’-CTACTCACAAAACAGGAGTGGAATC-3’;
miR-98 forward, 5’-TGTATGACTGCCGTATGTTTCCTATT-3’;
miR-98 reverse, 5’-AATTCTTAAAGTATGCTTTCCATTCC-3’;
miR-199b forward, 5’-CTTCGGGGTTGGACACTAGGTAGGAG-3’;
miR-199b reverse, 5’-GTGTATGTCTTTGGGATGTGAGGATGG-3’.
The amplified sequences were inserted into the EcoRI and XmaI restriction sites of the multiplecloning site of expression vector pCMV6 and verified by sequencing. To investigate theregulation of Fus1 by miRNAs, we added a Flag tag to the N-terminus of Fus1 and made threederivative constructs: Flag-FUS1, Flag-FUS1-3'UTR and Flag (as a negative control) basedon the pcDNA3.1 expression vector. We also made mutated constructs based on Flag-FUS1-3'UTR with the miR-93, miR-98 and miR-197 seed sequences of the target sites deletedindividually and in combination. In order to test the interaction between specific miRNAs andthe 3’UTR of FUS1, the 1.2 kb 3’UTR was cloned into pMIR-REPORT (Ambion, Austin,TX), a reporter construct containing a luciferase cDNA under the control of a mammalianpromoter/terminator system.
Du et al. Page 7
Mol Cancer Res. Author manuscript; available in PMC 2010 August 1.
NIH
-PA Author Manuscript
NIH
-PA Author Manuscript
NIH
-PA Author Manuscript
TransfectionCells were plated and cultured overnight. Cells were then transfected with specified expressionvectors using Lipofectamine 2000 (Invitrogen, Carlsbad, CA) or FuGENE 6 TransfectionReagent (Roche, Basel, Switzerland). After 48 hours, cells were harvested and specified assayswere conducted.
Luciferase AssayLuciferase activity and β-galactosidase activity were measured using the Luciferase AssaySystem and β-galactosidase Assay System (Promega, Madison, WI), respectively. Luciferaseactivity was adjusted for transfection efficiency by normalizing by the β-galactosidase activityof each sample.
Quantitative RT-PCRTotal RNA was prepared using the mirVana™ miRNA Isolation Kit (Ambion, Austin, TX)followed by treatment with DNase. Quantitative RT-PCR (qRT-PCR) of miRNAs wasconducted on an ABI PRISM 7900 Sequence Detection System using TaqMan® UniversalPCR Master Mix and miRNA Expression Assay primer and probe sets (Applied Biosystems,Foster City, CA). RNU19 RNA was used as an internal control for normalization of cDNAloading. FUS1 and neo expression were measured using TaqMan® reverse transcription kitswith qRT-PCR conducted using TaqMan® Universal PCR Master Mix and Gene ExpressionAssay primer and probe sets (Applied Biosystems). GAPDH mRNA was used as an internalcontrol for normalization of cDNA loading. Threshold cycle times (Ct) were obtained andrelative gene expression was calculated using the comparative cycle time method (39).
qRT-PCR in lung tumor samplesFour 20 µm sections were collected from each of 20 formalin-fixed paraffin-embedded (FFPE)lung tumor tissue specimens (14 adenocarcinoma, 6 squamous cell carcinoma) previouslycharacterized for Fus1 expression by immunohistochemical staining (4). Deparaffinization,digestion, and RNA isolation were performed using the RecoverAll™ Total Nucleic AcidIsolation kit (Ambion, Austin, TX), according to manufacturer instructions. RNAconcentration and quality were assessed by spectrophotometer. miRNA expression wasmeasured using 10 ng of total RNA from each sample with TaqMan® microRNA Assays onan ABI 7900HT Real Time PCR Instrument (Applied Biosystems). We used RNU19 as aloading control and normalized all measurements to RNU19 levels. We determined the miRNAexpression levels using the absolute quantification method.
Western blotsCells were washed with ice-cold phosphate buffered saline (PBS) and cell lysates prepared byincubating cells in NP-40 buffer for 1 h on ice. Cell lysates were centrifuged at 13,000 rpm for15 minutes at 4°C and the pellets were discarded. Protein concentration of the supernatant wasdetermined using the PIERCE BCA assay (PIERCE, Rockford, IL). For electrophoresis, equalamounts of cell lysate protein (30 µg) were resolved by SDS-PAGE and transferred topolyvinylidene difluoride (PVDF) membrane (Millipore, Billerica, MA). Flag-tagged Fus1protein was detected by immunoblotting with mouse anti-Flag primary antibody (Sigma-Aldrich, St. Louis, MO) followed by incubation with goat anti-mouse HRP-conjugatedsecondary antibody (Santa Cruz Biotechnology, Santa Cruz, CA). Calnexin protein wasdetected by immunoblotting with rabbit anti-calnexin primary antibody StressgenBiotechnologies, San Diego, CA) followed by incubation with goat anti-rabbit HRP-conjugated secondary antibody (Santa Cruz Biotechnology). Bands were detected by exposingthe membrane to Kodak™ X-OMAT™ Blue XB-1 film (Eastman Kodak, Rochester, NY) for1–2 minutes. Band intensities were quantitated using a Kodak™ Image Station 2000.
Du et al. Page 8
Mol Cancer Res. Author manuscript; available in PMC 2010 August 1.
NIH
-PA Author Manuscript
NIH
-PA Author Manuscript
NIH
-PA Author Manuscript
miRNA:target prediction methodInteractions between miR-197, miR-93 and miR-98 and the 3’UTR of FUS1 were predictedby miRmate, a microRNA target prediction algorithm developed in our lab. The determinantsof the interaction between microRNAs and their target sites are believed to be (1) perfectcomplementarity in the seed sequence (bases 2–8 of the miRNA), (2) a favorable free energyof hybridization (ΔG ≈ −20–25 kcal/mol), and (3) accessibility of the target site in the 3’UTR.Most target prediction methods include one or more of these, and often include evolutionaryconservation of the target site. miRmate considers complementarity (including the G·Ubasepairing found in RNA duplexes), based on variable weighting of positions across themiRNA, so as to encourage (but not require) complete complementarity at positions 2–8 of themiRNA (the seed region) and mismatches and insertions in the central bulge at positions 9–11of the miRNA. This allows strong complementarity at the 3’ end to compensate for suboptimalcomplementarity at the 5’ end. This analysis is coupled with an estimate of the hybridizationfree energy of the predicted mRNA-miRNA duplexes. Evolutionary conservation acrossspecies is used post hoc to prioritize candidate target sites. Of the relatively small number ofexperimentally validated miRNA:target pairs, miRmate correctly identifies more with lower(better) rank fractions and misses fewer than other commonly used methods, includingTargetScan, miRanda and PicTar.
Colony formation assayNCI-H1299 cells were plated in 100 mm dishes, grown for 24 h, and transfected with plasmidspcDNA3.1/Flag, pcDNA3.1/Flag-FUS1, and pcDNA3.1/Flag-FUS1-3'UTR. After 48 h oftransfection, the cells were trypsinized, and 5,000 cells were replated in 10 cm dishes andcultured in G418 (800 µg/ml) supplemented medium (RPMI 1640, 5% fetal bovine serum) for2 weeks. Colonies were then stained with 1% crystal violet in ethanol/PBS (15%/85%).
miRNA expression profilingOligonucleotide probes for 136 nonredundant, conserved human and mouse miRNAs,antisense to the published mature sequences, were synthesized and spotted in duplicate onCorning GAPS-2 coated slides using a robotic spotter (40). RNA species smaller than 200 ntwere isolated from total RNA samples and labeled with a fluorescent modified dinucleotide(5’-phosphate-cytidyl-uridyl-Cy3-3’) using T4 RNA ligase (40). Samples were hybridized tothe array along with an equimolar reference oligonucleotide set corresponding to all maturemiRNAs, which had been labeled with Cy5. The reference set allows normalization of differentdatasets to a common standard and in principle allows measurement of absolute expressionlevels. Array images were analyzed with GenePix Pro 4.1 (Molecular Devices, Sunnyvale,CA). We measured raw Cy3/Cy5 ratios, which we log transformed, normalized by mediancentering and clustered using average linkage hierarchical clustering based on Pearsoncorrelation.
Supplementary MaterialRefer to Web version on PubMed Central for supplementary material.
References1. Lerman MI, Minna JD. The 630-kb lung cancer homozygous deletion region on human chromosome
3p21.3: identification and evaluation of the resident candidate tumor suppressor genes. TheInternational Lung Cancer Chromosome 3p21.3 Tumor Suppressor Gene Consortium. Cancer Res2000;60(21):6116–6133. [PubMed: 11085536]
Du et al. Page 9
Mol Cancer Res. Author manuscript; available in PMC 2010 August 1.
NIH
-PA Author Manuscript
NIH
-PA Author Manuscript
NIH
-PA Author Manuscript
2. Ji L, Nishizaki M, Gao B, et al. Expression of several genes in the human chromosome 3p21.3homozygous deletion region by an adenovirus vector results in tumor suppressor activities in vitro andin vivo. Cancer Res 2000;62(9):2715–2720. [PubMed: 11980673]
3. Ivanova AV, Ivanov SV, Pascal V, et al. Autoimmunity, spontaneous tumourigenesis, and IL-15insufficiency in mice with a targeted disruption of the tumour suppressor gene Fus1. The Journal ofpathology 2007;211(5):591–601. [PubMed: 17318811]
4. Prudkin L, Behrens C, Liu DD, et al. Loss and reduction of FUS1 protein expression is a frequentphenomenon in the pathogenesis of lung cancer. Clin Cancer Res 2008;14(1):41–47. [PubMed:18172250]
5. Zabarovsky ER, Lerman MI, Minna JD. Tumor suppressor genes on chromosome 3p involved in thepathogenesis of lung and other cancers. Oncogene 2002;21(45):6915–6935. [PubMed: 12362274]
6. Kondo M, Ji L, Kamibayashi C, et al. Overexpression of candidate tumor suppressor gene FUS1isolated from the 3p21.3 homozygous deletion region leads to G1 arrest and growth inhibition of lungcancer cells. Oncogene 2001;20(43):6258–6262. [PubMed: 11593436]
7. Uno F, Sasaki J, Nishizaki M, et al. Myristoylation of the fus1 protein is required for tumor suppressionin human lung cancer cells. Cancer Res 2004;64(9):2969–2976. [PubMed: 15126327]
8. Yekta S, Shih IH, Bartel DP. MicroRNA-directed cleavage of HOXB8 mRNA. Science (New York,NY 2004;304(5670):594–596.
9. Vasudevan, S.; Tong, Y.; Steitz, JA. Science (New York, NY. Vol. 318. 2007. Switching fromrepression to activation: microRNAs can up-regulate translation; p. 1931-1934.
10. Novotny GW, Sonne SB, Nielsen JE, et al. Translational repression of E2F1 mRNA in carcinoma insitu and normal testis correlates with expression of the miR-17-92 cluster. Cell death anddifferentiation 2007;14(4):879–882. [PubMed: 17218954]
11. Caudy AA, Myers M, Hannon GJ, Hammond SM. Fragile X-related protein and VIG associate withthe RNA interference machinery. Genes Dev 2002;16(19):2491–2496. [PubMed: 12368260]
12. Calin GA, Dumitru CD, Shimizu M, et al. Frequent deletions and down-regulation of micro-RNAgenes miR15 and miR16 at 13q14 in chronic lymphocytic leukemia. Proc Natl Acad Sci U S A2002;99(24):15524–15529. [PubMed: 12434020]
13. Dostie, J.; Mourelatos, Z.; Yang, M.; Sharma, A.; Dreyfuss, G. RNA (New York, NY. Vol. 9. 2003.Numerous microRNPs in neuronal cells containing novel microRNAs; p. 180-186.
14. Xu LL, Shi Y, Petrovics G, et al. PMEPA1, an androgen-regulated NEDD4-binding protein, exhibitscell growth inhibitory function and decreased expression during prostate cancer progression. CancerRes 2003;63(15):4299–4304. [PubMed: 12907594]
15. Calin GA, Liu CG, Sevignani C, et al. MicroRNA profiling reveals distinct signatures in B cell chroniclymphocytic leukemias. Proc Natl Acad Sci U S A 2004;101(32):11755–11760. [PubMed:15284443]
16. Calin GA, Sevignani C, Dumitru CD, et al. Human microRNA genes are frequently located at fragilesites and genomic regions involved in cancers. Proc Natl Acad Sci U S A 2009;101(9):2999–3004.[PubMed: 14973191]
17. Chang J, Nicolas E, Marks D, et al. miR-122, a mammalian liver-specific microRNA, is processedfrom hcr mRNA and may downregulate the high affinity cationic amino acid transporter CAT-1.RNA Biology 2004;1(2):106–113. [PubMed: 17179747]
18. Chen, CZ.; Li, L.; Lodish, HF.; Bartel, DP. Science (New York, NY. Vol. 303. 2004. MicroRNAsmodulate hematopoietic lineage differentiation; p. 83-86.
19. Esau C, Kang X, Peralta E, et al. MicroRNA-143 regulates adipocyte differentiation. J Biol Chem2004;279(50):52361–52365. [PubMed: 15504739]
20. Jin P, Alisch RS, Warren ST. RNA and microRNAs in fragile X mental retardation. Nat Cell Biol2004;6(11):1048–1053. [PubMed: 15516998]
21. Poy MN, Eliasson L, Krutzfeldt J, et al. A pancreatic islet-specific microRNA regulates insulinsecretion. Nature 2004;432(7014):226–230. [PubMed: 15538371]
22. Korpal M, Lee ES, Hu G, Kang Y. The miR-200 family inhibits epithelial-mesenchymal transitionand cancer cell migration by direct targeting of E-cadherin transcriptional repressors ZEB1 andZEB2. J Biol Chem. 2008
Du et al. Page 10
Mol Cancer Res. Author manuscript; available in PMC 2010 August 1.
NIH
-PA Author Manuscript
NIH
-PA Author Manuscript
NIH
-PA Author Manuscript
23. Schultz J, Lorenz P, Gross G, Ibrahim S, Kunz M. MicroRNA let-7b targets important cell cyclemolecules in malignant melanoma cells and interferes with anchorage-independent growth. Cell Res2008;18(5):549–557. [PubMed: 18379589]
24. Boyerinas B, Park SM, Shomron N, et al. Identification of let-7-regulated oncofetal genes. CancerRes 2008;68(8):2587–2591. [PubMed: 18413726]
25. Takakura S, Mitsutake N, Nakashima M, et al. Oncogenic role of miR-17-92 cluster in anaplasticthyroid cancer cells. Cancer science. 2008
26. Kim S, Lee UJ, Kim MN, et al. MicroRNA miR-199a* regulates the MET proto-oncogene and thedownstream extracellular signal-regulated kinase 2 (ERK2). J Biol Chem 2008;283(26):18158–18166. [PubMed: 18456660]
27. Jeyaseelan K, Ma D, Armugam A. Real-time detection of gene promoter activity: quantitation oftoxin gene transcription. Nucleic Acids Res 2001;29(12):E58–E58. [PubMed: 11410681]
28. Krek A, Grun D, Poy MN, et al. Combinatorial microRNA target predictions. Nature genetics 2005;37(5):495–500. [PubMed: 15806104]
29. Grimson A, Farh KK, Johnston WK, Garrett-Engele P, Lim LP, Bartel DP. MicroRNA targetingspecificity in mammals: determinants beyond seed pairing. Molecular cell 2007;27(1):91–105.[PubMed: 17612493]
30. Zhu S, Si ML, Wu H, Mo YY. MicroRNA-21 targets the tumor suppressor gene tropomyosin 1(TPM1). J Biol Chem 2007;282(19):14328–14336. [PubMed: 17363372]
31. Lopez de Silanes I, Quesada MP, Esteller M. Aberrant regulation of messenger RNA 3'-untranslatedregion in human cancer. Cell Oncol 2007;29(1):1–17. [PubMed: 17429137]
32. Blenkiron C, Goldstein LD, Thorne NP, et al. MicroRNA expression profiling of human breast canceridentifies new markers of tumour subtype. Genome Biol 2007;8(10):R214. [PubMed: 17922911]
33. Yanaihara N, Caplen N, Bowman E, et al. Unique microRNA molecular profiles in lung cancerdiagnosis and prognosis. Cancer Cell 2006;9(3):189–198. [PubMed: 16530703]
34. Hebert C, Norris K, Scheper MA, Nikitakis N, Sauk JJ. High mobility group A2 is a target formiRNA-98 in head and neck squamous cell carcinoma. Mol Cancer 2007;6:5. [PubMed: 17222355]
35. Sarhadi VK, Wikman H, Salmenkivi K, et al. Increased expression of high mobility group A proteinsin lung cancer. The Journal of pathology 2006;209(2):206–212. [PubMed: 16521118]
36. Sgarra R, Rustighi A, Tessari MA, et al. Nuclear phosphoproteins HMGA and their relationship withchromatin structure and cancer. FEBS letters 2004;574(1–3):1–8. [PubMed: 15358530]
37. Boo LM, Lin HH, Chung V, et al. High mobility group A2 potentiates genotoxic stress in part throughthe modulation of basal and DNA damage-dependent phosphatidylinositol 3-kinase-related proteinkinase activation. Cancer Res 2005;65(15):6622–6630. [PubMed: 16061642]
38. Lee DY, Deng Z, Wang CH, Yang BB. MicroRNA-378 promotes cell survival, tumor growth, andangiogenesis by targeting SuFu and Fus-1 expression. Proc Natl Acad Sci U S A 2007;104(51):20350–20355. [PubMed: 18077375]
39. Bookout AL, Mangelsdorf DJ. Quantitative real-time PCR protocol for analysis of nuclear receptorsignaling pathways. Nuclear receptor signaling 2003;1:e012. [PubMed: 16604184]
40. Thomson JM, Parker J, Perou CM, Hammond SM. A custom microarray platform for analysis ofmicroRNA gene expression. Nat Methods 2004;1(1):47–53. [PubMed: 15782152]
AcknowledgementsThe authors gratefully acknowledge the technical assistance of J. Michael Thomson and Summer Goodson and thankDavid Shames, Michael Peyton and Cheng Hui Lee for thoughtful insights and discussions and critical reading of themanuscript. This work was supported in part by Public Health Service grant number P50 CA75907 from the UTSouthwestern/MD Anderson Cancer Center Lung Specialized Program of Research Excellence (UTSW/MDACCLung SPORE) and the National Cancer Institute.
Du et al. Page 11
Mol Cancer Res. Author manuscript; available in PMC 2010 August 1.
NIH
-PA Author Manuscript
NIH
-PA Author Manuscript
NIH
-PA Author Manuscript
Du et al. Page 12
Mol Cancer Res. Author manuscript; available in PMC 2010 August 1.
NIH
-PA Author Manuscript
NIH
-PA Author Manuscript
NIH
-PA Author Manuscript
Figure 1. The 3’UTR plays a significant role in regulating Fus1 protein and mRNA expression levels(A–D) We cloned constructs expressing either Flag-tagged FUS1 without the 3’UTR (Flag-FUS1) or Flag-tagged FUS1 with the full length 3’UTR (Flag-FUS1-3’UTR). NCI-H1299 cellswere transfected for 48 h with either equal amounts (0.46 nM) of the above constructs, or weretreated with only transfection reagents (control). (A) The protein expression level of Fus1 wasdetected by Western blot using an anti-Flag antibody, with calnexin as a loading control. (B)Quantification results of the Fus1 protein level were from three independent experiments.(C) The mRNA level of FUS1 as detected by quantitative PCR. (D) The mRNA level of neoas detected by quantitative PCR. (E–G) Colony formation s a function of the presence orabsence of the FUS1 3’UTR. NCI-H1299 cells were transfected with equal amounts (0.46 nM)of either constructs expressing Flag-FUS1, Flag-FUS1-3’UTR or empty vector (control),respectively. Colonies were visualized by staining with 1% crystal violet (E). Quantificationof (F) number of colonies and (G) total area of colonies was from three independent colonyformation assays. (**, p<0.01; ***, p<0.001)
Du et al. Page 13
Mol Cancer Res. Author manuscript; available in PMC 2010 August 1.
NIH
-PA Author Manuscript
NIH
-PA Author Manuscript
NIH
-PA Author Manuscript
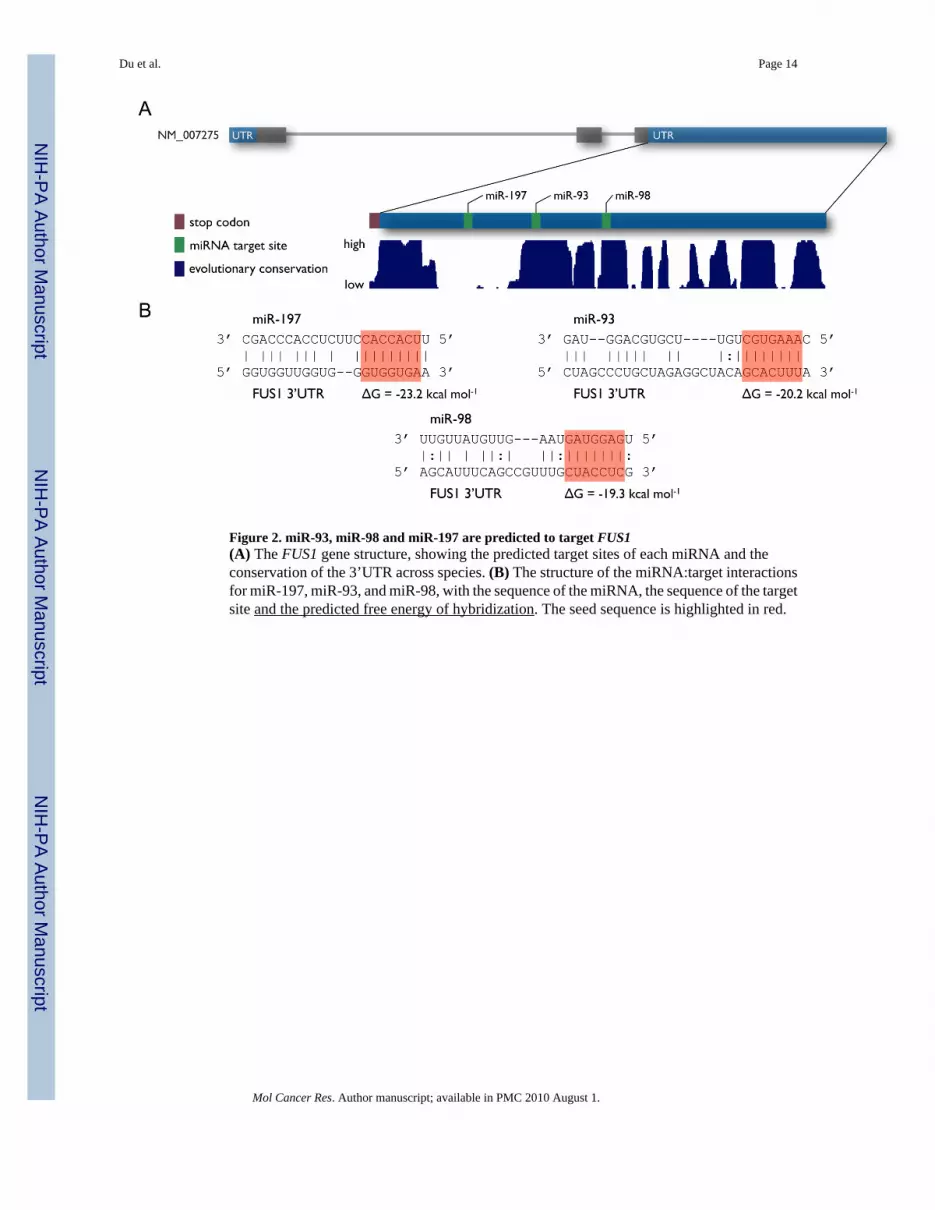
Figure 2. miR-93, miR-98 and miR-197 are predicted to target FUS1(A) The FUS1 gene structure, showing the predicted target sites of each miRNA and theconservation of the 3’UTR across species. (B) The structure of the miRNA:target interactionsfor miR-197, miR-93, and miR-98, with the sequence of the miRNA, the sequence of the targetsite and the predicted free energy of hybridization. The seed sequence is highlighted in red.
Du et al. Page 14
Mol Cancer Res. Author manuscript; available in PMC 2010 August 1.
NIH
-PA Author Manuscript
NIH
-PA Author Manuscript
NIH
-PA Author Manuscript
Du et al. Page 15
Mol Cancer Res. Author manuscript; available in PMC 2010 August 1.
NIH
-PA Author Manuscript
NIH
-PA Author Manuscript
NIH
-PA Author Manuscript
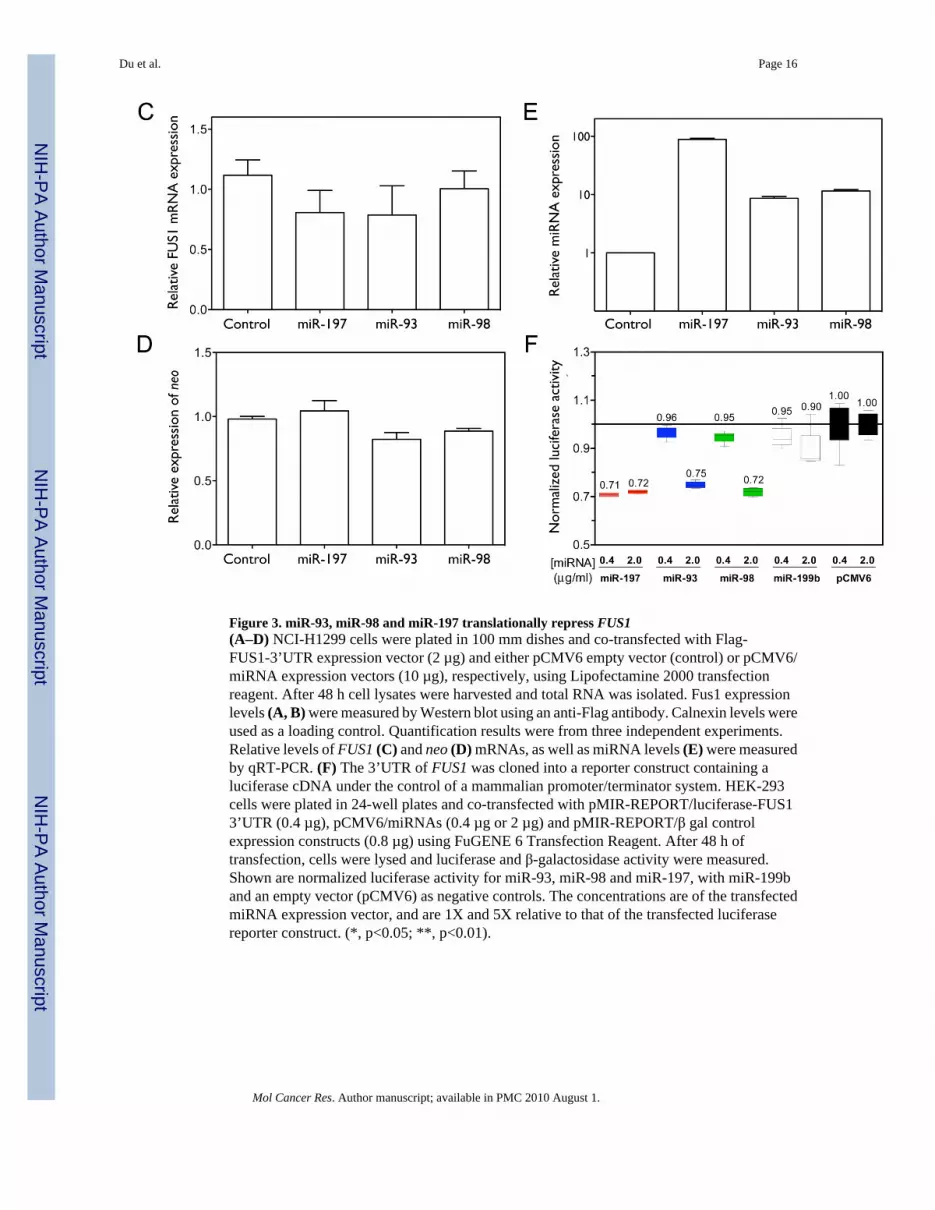
Figure 3. miR-93, miR-98 and miR-197 translationally repress FUS1(A–D) NCI-H1299 cells were plated in 100 mm dishes and co-transfected with Flag-FUS1-3’UTR expression vector (2 µg) and either pCMV6 empty vector (control) or pCMV6/miRNA expression vectors (10 µg), respectively, using Lipofectamine 2000 transfectionreagent. After 48 h cell lysates were harvested and total RNA was isolated. Fus1 expressionlevels (A, B) were measured by Western blot using an anti-Flag antibody. Calnexin levels wereused as a loading control. Quantification results were from three independent experiments.Relative levels of FUS1 (C) and neo (D) mRNAs, as well as miRNA levels (E) were measuredby qRT-PCR. (F) The 3’UTR of FUS1 was cloned into a reporter construct containing aluciferase cDNA under the control of a mammalian promoter/terminator system. HEK-293cells were plated in 24-well plates and co-transfected with pMIR-REPORT/luciferase-FUS13’UTR (0.4 µg), pCMV6/miRNAs (0.4 µg or 2 µg) and pMIR-REPORT/β gal controlexpression constructs (0.8 µg) using FuGENE 6 Transfection Reagent. After 48 h oftransfection, cells were lysed and luciferase and β-galactosidase activity were measured.Shown are normalized luciferase activity for miR-93, miR-98 and miR-197, with miR-199band an empty vector (pCMV6) as negative controls. The concentrations are of the transfectedmiRNA expression vector, and are 1X and 5X relative to that of the transfected luciferasereporter construct. (*, p<0.05; **, p<0.01).
Du et al. Page 16
Mol Cancer Res. Author manuscript; available in PMC 2010 August 1.
NIH
-PA Author Manuscript
NIH
-PA Author Manuscript
NIH
-PA Author Manuscript
Du et al. Page 17
Mol Cancer Res. Author manuscript; available in PMC 2010 August 1.
NIH
-PA Author Manuscript
NIH
-PA Author Manuscript
NIH
-PA Author Manuscript
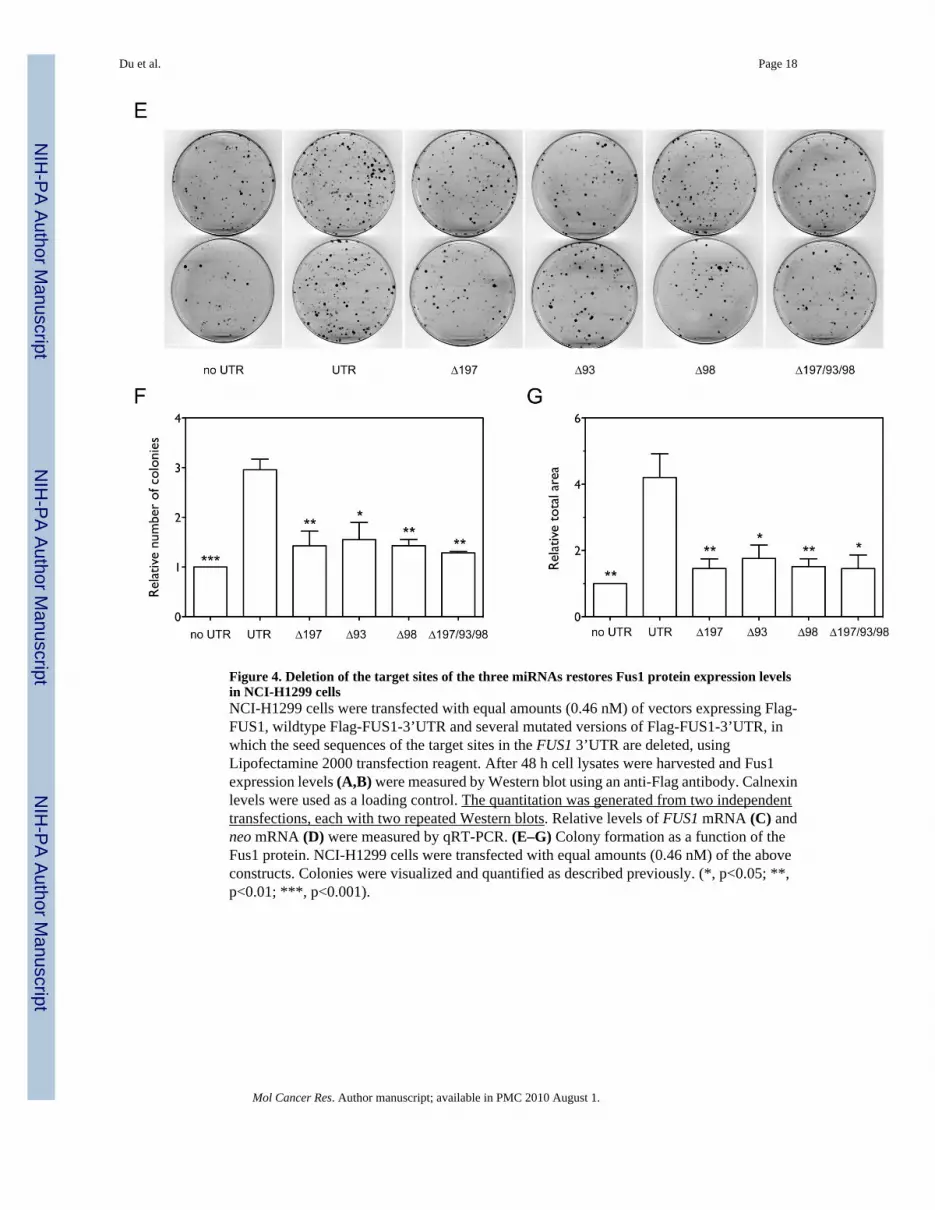
Figure 4. Deletion of the target sites of the three miRNAs restores Fus1 protein expression levelsin NCI-H1299 cellsNCI-H1299 cells were transfected with equal amounts (0.46 nM) of vectors expressing Flag-FUS1, wildtype Flag-FUS1-3’UTR and several mutated versions of Flag-FUS1-3’UTR, inwhich the seed sequences of the target sites in the FUS1 3’UTR are deleted, usingLipofectamine 2000 transfection reagent. After 48 h cell lysates were harvested and Fus1expression levels (A,B) were measured by Western blot using an anti-Flag antibody. Calnexinlevels were used as a loading control. The quantitation was generated from two independenttransfections, each with two repeated Western blots. Relative levels of FUS1 mRNA (C) andneo mRNA (D) were measured by qRT-PCR. (E–G) Colony formation as a function of theFus1 protein. NCI-H1299 cells were transfected with equal amounts (0.46 nM) of the aboveconstructs. Colonies were visualized and quantified as described previously. (*, p<0.05; **,p<0.01; ***, p<0.001).
Du et al. Page 18
Mol Cancer Res. Author manuscript; available in PMC 2010 August 1.
NIH
-PA Author Manuscript
NIH
-PA Author Manuscript
NIH
-PA Author Manuscript
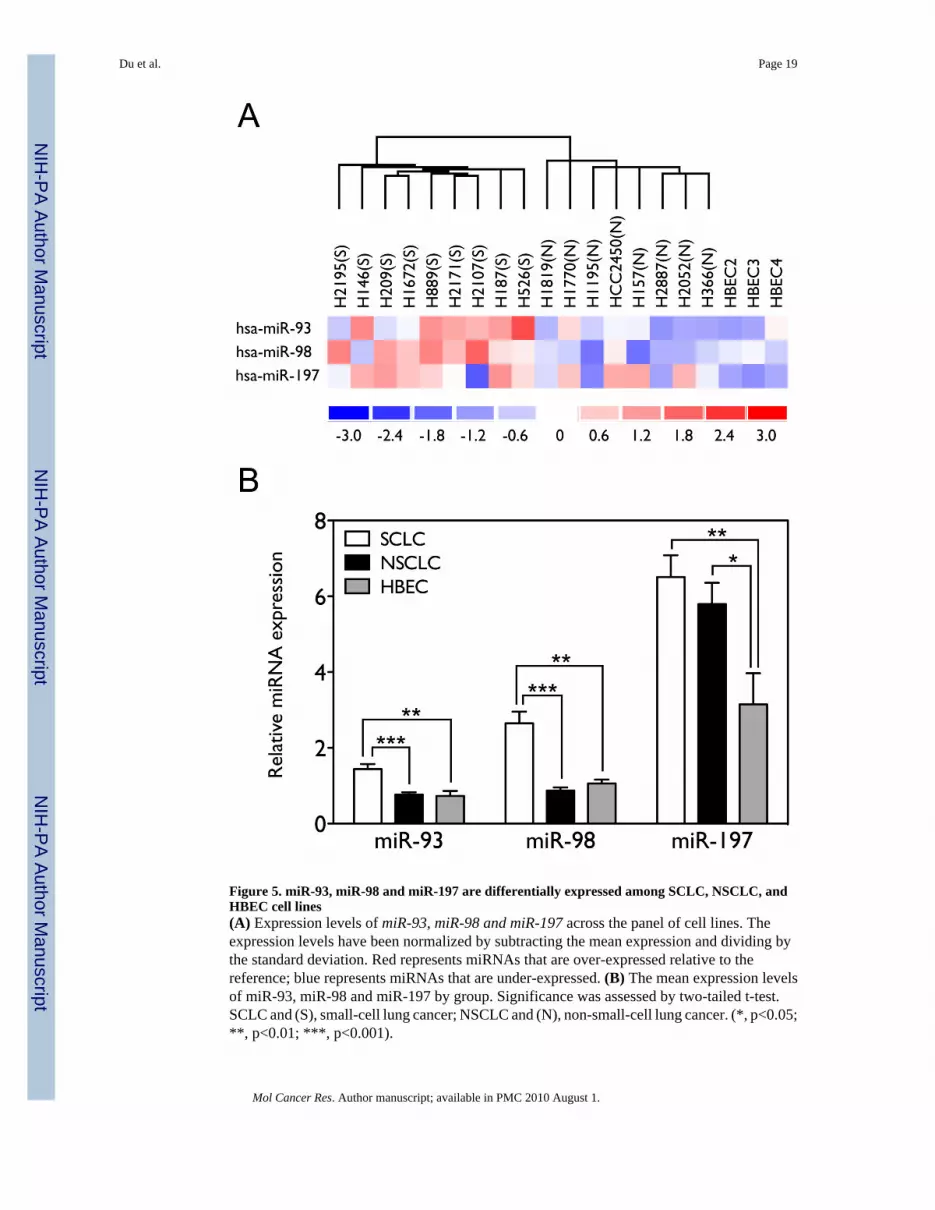
Figure 5. miR-93, miR-98 and miR-197 are differentially expressed among SCLC, NSCLC, andHBEC cell lines(A) Expression levels of miR-93, miR-98 and miR-197 across the panel of cell lines. Theexpression levels have been normalized by subtracting the mean expression and dividing bythe standard deviation. Red represents miRNAs that are over-expressed relative to thereference; blue represents miRNAs that are under-expressed. (B) The mean expression levelsof miR-93, miR-98 and miR-197 by group. Significance was assessed by two-tailed t-test.SCLC and (S), small-cell lung cancer; NSCLC and (N), non-small-cell lung cancer. (*, p<0.05;**, p<0.01; ***, p<0.001).
Du et al. Page 19
Mol Cancer Res. Author manuscript; available in PMC 2010 August 1.
NIH
-PA Author Manuscript
NIH
-PA Author Manuscript
NIH
-PA Author Manuscript
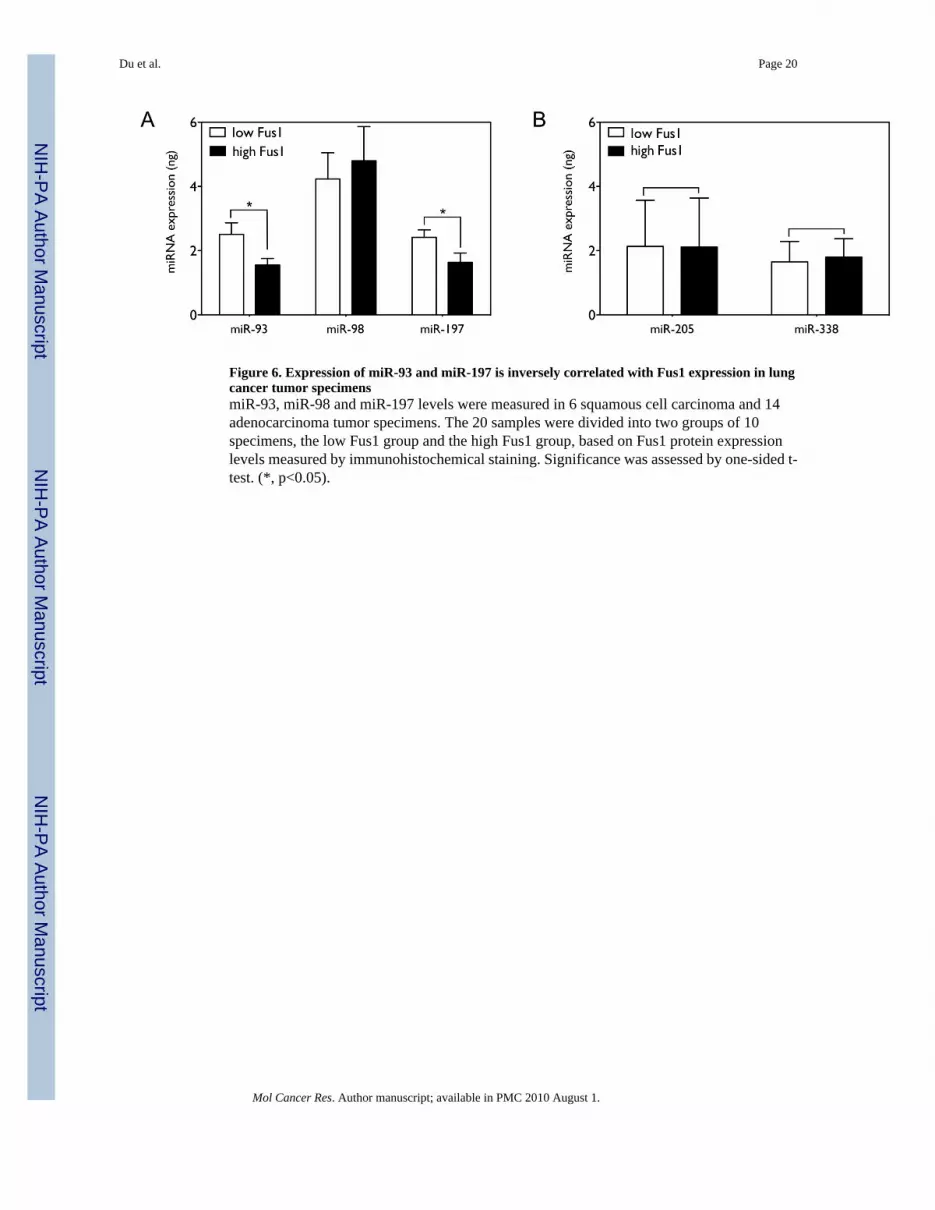
Figure 6. Expression of miR-93 and miR-197 is inversely correlated with Fus1 expression in lungcancer tumor specimensmiR-93, miR-98 and miR-197 levels were measured in 6 squamous cell carcinoma and 14adenocarcinoma tumor specimens. The 20 samples were divided into two groups of 10specimens, the low Fus1 group and the high Fus1 group, based on Fus1 protein expressionlevels measured by immunohistochemical staining. Significance was assessed by one-sided t-test. (*, p<0.05).
Du et al. Page 20
Mol Cancer Res. Author manuscript; available in PMC 2010 August 1.
NIH
-PA Author Manuscript
NIH
-PA Author Manuscript
NIH
-PA Author Manuscript