an hst search for supernovae accompanying x‐ray flashes
TRANSCRIPT

arX
iv:a
stro
-ph/
0502
553v
1 2
5 Fe
b 20
05Draft version February 2, 2008
Preprint typeset using LATEX style emulateapj
AN HST SEARCH FOR SUPERNOVAE ACCOMPANYING X-RAY FLASHES
A. M. Soderberg1, S. R. Kulkarni1, D. B. Fox1, E. Berger2,3,4, P. A. Price5, S. B.Cenko6, D. A. Howell7, A. Gal-Yam1,4, D. C. Leonard1,8, D. A. Frail9, D. Moon6, R. A.Chevalier10, M. Hamuy2, K. C. Hurley11, D. Kelson2, K. Koviak2, W. Krzeminski2, P.
Kumar12, A. MacFadyen1, P. J. McCarthy2, H. S. Park13, B. A. Peterson14, M. M.Phillips2, M. Rauch2, M. Roth2, B. P. Schmidt14, S. Shectman2
Draft version February 2, 2008
ABSTRACT
We present the results from an Hubble Space Telescope/ACS search for supernovae associated with X-ray flashes 020903, 040701, 040812 and 040916. We find strong evidence that XRF020903 (z = 0.25) wasassociated with a SN 1998bw-like supernova and confirm this using optical spectroscopy at t ∼ 25 days.We find no evidence, however, for SN1998bw-like supernovae associated with the other three events.In the case of XRF040701 (z = 0.21), we rule out even a faint supernova similar to SN2002ap, usingtemplate light-curves for several local Type Ic supernovae. For the two cases in which the redshift isnot known, XRFs 040812 and 040916, we derive robust redshift limits assuming they were accompaniedby supernovae similar to SN1998bw and compare these limits with photometric redshift constraintsprovided by their host galaxies. We supplement this analysis with results for three additional events(XRFs 011030, 020427 and 030723) and discuss the observed diversity of supernovae associated withX-ray flashes and gamma-ray bursts. We conclude that XRF-SNe exist, but can be significantly fainterthan SN1998bw, possibly consistent with the observed spread in local Type Ibc supernovae.
Subject headings: gamma rays: bursts - radiation mechanisms: nonthermal - supernova: individual
1. INTRODUCTION
Observational evidence for a connection betweengamma-ray bursts (GRBs) and supernovae (SNe) was firstestablished with the discovery of the highly luminous typeIc SN1998bw in spatial and temporal coincidence withGRB 980425 (Pian et al. 2000; Galama et al. 1998a).In the seven years since this extraordinary event, severalpossible GRB-SN associations have been reported basedon red “bumps” observed in optical afterglow light-curves(e.g. Bloom et al. 1999). Moreover, in two cases (GRBs030329 and 031203) there is unambiguous spectroscopicevidence of high velocity SN features (Hjorth et al. 2003;Stanek et al. 2003; Matheson et al. 2003; Malesani etal. 2004). These observations provide conclusive evidencethat at least some gamma-ray bursts are produced in theexplosions of massive stars.
In recent years, a new class of high energy transientshas been identified, characterized by an emission spectrum
peaking in the X-ray band, an order of magnitude softerthan the peak energies observed for GRBs (Heise et al.2001). These so-called X-ray flashes (XRFs) are thoughtto be related to GRBs since the two classes share sev-eral observational properties, including prompt emissionprofiles (Sakamoto et al. 2004, and references therein),broadband afterglows (Butler et al. 2004; Soderberg etal. 2004; Fynbo et al. 2004) and star-forming host galax-ies at cosmological distances (Bloom et al. 2003; Levan etal. 2002, 2004).
Several hypotheses on the physical connection betweenXRFs and GRBs have been proposed. One popular modelposits that XRFs are simply GRBs viewed away from thejet collimation axis (Yamazaki, Ioka & Nakamura 2003;Zhang, Woosley & Heger 2004; Granot, Ramirez-Ruiz &Perna 2005). In this scenario, the observed prompt emis-sion is dominated by the mildly relativistic material inthe “wings” of the jet, rather than the highly relativistic
1Division of Physics, Mathematics and Astronomy, 105-24, California Institute of Technology, Pasadena, CA 911252Observatories of the Carnegie Institution of Washington, 813 Santa Barbara St., Pasadena, CA 911013Department of Astrophysical Sciences, Princeton University, Princeton, NJ 085444Hubble Fellow5University of Hawaii, Institute of Astronomy, 2680 Woodlawn Drive, Honolulu, HI 96822-18976Space Radiation Laboratory 220-47, California Institute of Technology, Pasadena, CA 911257Department of Astronomy and Astrophysics, University of Toronto, 60 St. George Street, Toronto, ON M5S 3H8, Canada8NSF Astronomy and Astrophysics Postdoctoral Fellow9National Radio Astronomy Observatory, Socorro, NM 87801
10Department of Astronomy, University of Virginia, P.O. Box 3818, Charlottesville, VA 22903-081811University of California, Berkeley, Space Sciences Laboratory, Berkeley, CA 94720-745012Astronomy Department, University of Texas, Austin, TX 7873113Lawrence Livermore National Laboratory, 7000 East Avenue, Livermore, CA 9455014Research School of Astronomy and Astrophysics, The Australian National University, Weston Creek, ACT 2611, Australia
1

2
(Γ ∼> 100) ejecta beamed away from the line-of-sight. An-other popular model suggests that XRFs are produced in a“dirty fireball”, where the ejecta carry a more substantialbaryonic load (and hence less relativistic material) thantypical GRBs (Zhang, Woosley & Heger 2004). In bothscenarios XRFs are expected to be associated with SNe,whose properties and detectability should not be affectedby the viewing angle or baryonic load.
The discovery of a SN in association with an XRF wouldtherefore conclusively associate XRFs with the death ofmassive stars and hence GRBs. Motivated thus, we un-dertook a systematic search for SNe associated with XRFsusing the Hubble Space Telescope (HST). As part of ourXRF-SN analysis, we synthesized supernova light-curvesat various redshifts utilizing as templates the well-sampledoptical light-curves of several local SNe (§2). Comparisonof the synthesized SNe with our HST observations enabledus to study the diversity of XRF associated SNe. Detailson the individual HST targets and observations follow in§3. By including results from other XRF-SN searches, wecompile an extended sample of seven events (XRFs 011030,020427, 020903, 030723, 040701, 040812 and 040916), andpresent a global summary of XRF-SN detection limits in§4. A discussion on the observed spread in the peak opti-cal luminosities of GRB- and XRF-associated SNe followsas §5.
2. SUPERNOVA LIGHT-CURVE SYNTHESIS
In modeling the XRF-associated SNe, we adopted op-tical data for the local SNe 1994I, 1998bw and 2002apas templates. These three SNe were selected based ontheir well-sampled optical light-curves which represent anoverall spread in the observed properties of Type Ibc su-pernovae. To produce synthesized light-curves for each ofthese template SNe, we compiled optical UBV RI obser-vations from the literature and smoothed the extinction-corrected (foreground plus host galaxy) light-curves. Wethen redshifted the light-curves by interpolating over thephotometric spectrum and stretching the arrival time ofthe photons by a factor of (1 + z). Since observed spec-tra of local (d ∼< 100 Mpc) Type Ibc SNe show a steep
drop-off in flux blue-ward of ∼ 4000 A due to heavy line-blanketing and since good-quality UV data are currentlynot available below 3000 A we do not attempt to extrap-olate the rest-frame spectra blue-ward of the rest-frameU -band observations. This limits the synthesized light-curves to z ≤ 0.80 and z ≤ 1.20 for the observed R- andI-bands, respectively. Below we discuss the compiled op-tical datasets for each of the template SNe.
2.1. SN1998bw
The well-sampled UBV RI light-curves for SN1998bwwere taken from Galama et al. (1998a) and McKenzie& Schaefer (1999) and corrected for Galactic extinction(AV = 0.19; Schlegel, Finkbeiner & Davis 1998). We as-sume negligible host galaxy extinction, consistent with thespectroscopic analysis Patat et al. (2001). The broadbandoptical dataset spans a timescale from t ≈ 0.7 to 417 days.Here, the explosion time is set by the Beppo-SAX detectionof GRB 980425 on 1998 April 25.91 UT (Pian et al. 2000).
In calculating optical luminosities for SN1998bw, we as-sume a distance, dL ≈ 36.1 Mpc (H0 = 71 km/s/Mpc,ΩM = 0.27, ΩΛ = 0.73), based on the observed redshift tothe host galaxy, ESO 184-G82 (Galama et al. 1998b).
2.2. SN1994I
Richmond et al. (1996) provide a large compilation ofmulti-color light-curves for SN1994I. We adopt a largehost galaxy extinction of AV = 1.4 and negligible Galacticextinction as derived through the spectroscopic analysis(Richmond et al. 1996). Using an explosion date of 1994March 30 UT from radio light-curve modeling (Stockdaleet al. 2005), the BV RI data span from t ≈ 1.4 to 130days, while the U -band data extend only as far as t ≈ 47.4days. In an effort to extend the U -band light-curve, wescale the late-time linear decay of the B-band light-curveto match the last epoch of U -band observations and as-sume the U − B color is constant thereafter. We notethat this scaling introduces a source of uncertainty in ourlate-time [t ∼> 47(1 + z)] high−z synthesized light-curvesof SN1994I. In calculating optical luminosities, we adopta distance of dL ≈ 8.5 Mpc for host galaxy, M51, as givenby Richmond et al. (1996).
2.3. SN2002ap
UBV RI light-curves were taken from Foley et al. (2003)and scaled to an explosion date of 2002 January 28.9 UT(Mazzali et al. 2002). We adopt the spectroscopic de-rived total extinction (foreground plus host galaxy) ofAV = 0.26 (Foley et al. 2003). Data span t ≈ 1.3 to317.3 days after the explosion in BV RI filters while theU -band data extend only to t ∼ 35.2 days. In a man-ner similar to that for SN1994I, we extend the U -bandlight-curve by scaling the late-time B-band data and notethat this introduces uncertainty in the synthesized light-curves at high−z. We assume the distance to the hostgalaxy, M74, is dL ≈ 7.3 Mpc (Sharina, Karachentsev &Tikhonov 1996; Sohn & Davidge 1996).
We emphasize the striking differences between the threeSN light-curves when the extinction-corrected rest-frameV -band light-curves are compared. With regard to theluminosity at peak time, SN1998bw is a factor of ∼ 2.2more luminous than SN1994I and ∼ 6 times more lumi-nous than SN2002ap. Moreover, the time of V -band peakvary by a factor of two: while SN1998bw peaks at t ∼ 16days, SN1994I and SN2002ap both peak at just t ∼ 9days. Such early peak times present a challenge for GRB-SN searches, since the optical afterglow typically domi-nates on these timescales.
3. HUBBLE SPACE TELESCOPE XRF-SN SEARCH
Since the activation of our Cycle-13 HST program tostudy the supernovae associated with X-ray flashes andgamma-ray bursts (GO-10135; PI: Kulkarni), three XRFshave been discovered and localized by their afterglow emis-sion: XRFs 040701, 040812 and 040916. In an effort tostudy the SNe possibly associated with these XRFs, we ob-served each of these objects with HST at late-time, whenan associated supernova is most likely to dominate the op-tical emission. To supplement our sample of XRF observa-tions, we investigated archival HST images of XRF020903

3
(GO-9405; PI: Fruchter). We describe our data analysistechniques below.
Using the Wide-Field Camera (WFC) of the AdvancedCamera for Surveys (ACS) on-board HST, we imaged thefields of XRFs 040701, 040812 and 040916. For each tar-get we undertook observations at two epochs, t ∼ 30 and∼ 60 days, in order to search for optical emission associ-ated with an underlying supernova. Each epoch consistedof two orbits during which we imaged the field in two fil-ters, F625W and F775W, corresponding to SDSS r′- andi′- bands, respectively.
We retrieved archival images of XRF 020903 from theHST archive15. Similar to the other bursts in our sam-ple, the XRF 020903 data were obtained with HST/ACSusing WFC. We analyze the images from two epochs att ∼ 91 and ∼ 300 days to search for the signature of anassociated supernova. These data were taken in the broadV -band filter, F606W.
The HST data were processed using the multidrizzle
routine within the stsdas package of IRAF (Fruchter &Hook 2002). Images were drizzled using pixfrac=0.8 andpixscale=1.0 resulting in a final pixel scale of 0.05 arc-sec/pixel. Drizzled images were then registered to the firstepoch using the xregister package within IRAF.
To search for source variability, we used the ISISsubtraction routine by Alard (2000) which accounts fortemporal variations in the stellar PSF. Residual images(Epoch 1 − Epoch 2) were examined for positive sourcespositionally coincident with the afterglow error circle. Totest our efficiency at recovering transient sources, falsestars with a range of magnitudes were inserted into thefirst epoch images using IRAF task mkobject. An exam-ination of the false stellar residuals provided an estimateof the magnitude limit (3σ) to which we could reliablyrecover transients.
Photometry was performed on the residual sourceswithin a 0.5 arcsec aperture. We converted the photo-metric measurements to infinite aperture and calculatedthe corresponding AB magnitudes within the native HSTfilters using the aperture corrections and zero-points pro-vided by Sirianni et al. (2005). For comparison withground-based data, we also converted the photometricmeasurements to Johnson R- and I-band (Vega) magni-tudes using the transformation coefficients derived by Siri-anni et al. (2005) and assuming a flat Fν source spectrum.
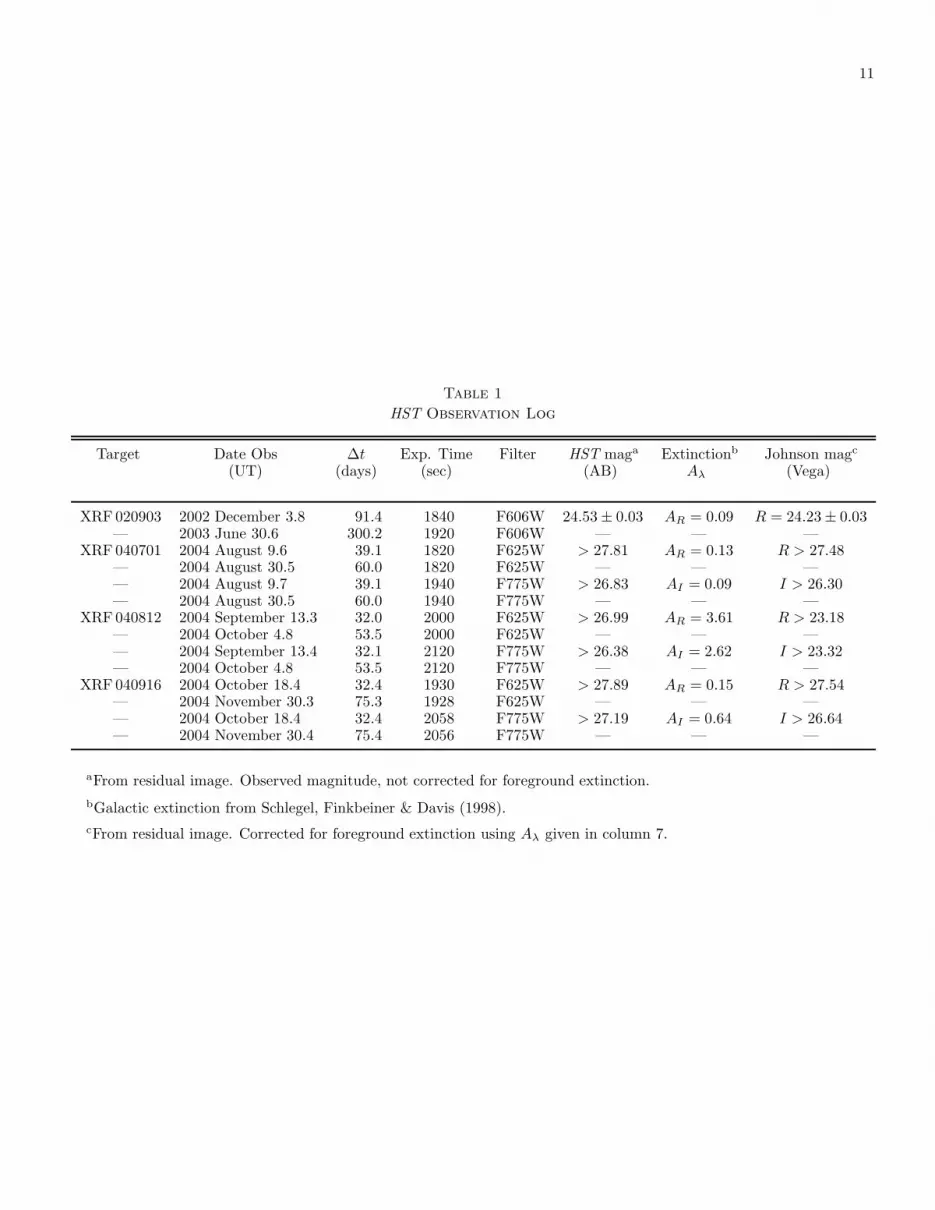
In the following sections we summarize the afterglowproperties for each of the targets and the photometry de-rived from our HST SN search. A log of the HST obser-vations for the four XRFs follows in Table 1.
3.1. XRF020903
3.1.1. Prompt Emission and Afterglow Properties
XRF020903 was detected by the Wide-Field X-rayMonitor (WXM) on-board the High Energy Transient Ex-plorer (HETE-2) satellite on 2002 September 3.421 UT.With a spectral energy distribution peaking below 5 keV,XRF 020903 is the softest burst detected during the life-time of the instrument (Sakamoto et al. 2004). De-spite the large 4 × 31 arcmin localization region, an op-
tical afterglow was discovered (Soderberg et al. 2004) atα = 22h48m42s.34, δ = −2046′09′′.3 (J2000). At t ≈ 0.9days, the afterglow had R ≈ 19.5 mag and continued tofade as Fopt ∝ t−1.1 until t ∼ 30 days when the decayflattened to a plateau. Optical spectroscopy showed thetransient source to be associated with a galaxy complex atz = 0.251 (Soderberg et al. 2002).
3.1.2. HST Observations
XRF 020903 was observed using HST/ACS on 2002 De-cember 3.79 and 2003 June 30.65 UT, corresponding tot ∼ 91 and 300 days after the burst. Imaging was carriedout in the broad F606W filter for total exposure times of1840 sec (Epoch 1) and 1920 sec (Epoch 2). Relative as-trometry was performed using an early-time (t ∼ 0.9 day)image from the Palomar 200-inch telescope (Soderberg etal. 2004). Using 42 unsaturated, unconfused stars in com-mon between the two images, we registered the HST datawith a systematic uncertainty of 0.12 arcsec (2σ).
The HST images reveal that the afterglow localizationcircle coincides with the southwest knot of the host galaxycomplex (Figure 1). Through image subtraction, we find apositive residual coincident with the optical afterglow po-sition at α = 22h48m42.293s, δ = −2046′08′′.47 (J2000).Photometry of the residual source gives F606W≈ 24.53 ±0.03 mag (R ≈ 24.32 ± 0.03 mag). Correcting for Galac-tic extinction (AR = 0.09; Schlegel, Finkbeiner & Davis1998), the true magnitude of the source is R ≈ 24.23±0.03mag. To estimate our photometric uncertainty, we placedrandom apertures near other galaxy residuals and calcu-lated the standard deviation of the resulting values.
Figure 2 shows the extinction-corrected HST photom-etry along with ground-based R-band data for the opti-cal afterglow associated with XRF020903. Ground-baseddata have been compiled from the GCNs (Covino et al.2002; Gorosabel et al. 2002) as well as from Table 1 ofSoderberg et al. (2004). We have numerically subtractedthe host galaxy contribution from the ground-based data,assuming an extinction-corrected host galaxy brightnessof R ≈ 20.90 mag based on late-time observations (Goros-abel et al. 2002; Levan et al. 2002). From the compiledR-band afterglow light-curve, it is evident that the tem-poral decay flattens significantly around t ∼ 30 days andsubsequently steepens toward the HST measurement att ∼ 91 days. This flattening (or plateau phase) occurson the same timescale that a SN 1998bw-like supernova atz = 0.25 would reach maximum light (see also Bersier etal. 2004).
3.1.3. Associated Supernova
Over-plotted in Figure 2 are the synthesized light-curvesof SNe 1998bw, 1994I and 2002ap at a redshift of z = 0.25.It is clear that an associated SN1998bw-like supernovawould be ∼ 1 magnitude brighter than the HST obser-vation at t ∼ 91 days, while SN1994I and SN2002ap-like light-curves are each fainter by 1.4 magnitudes. Bytaking the weighted average of the ground-based data be-tween t ∼ 20 − 40 days, we predict that the supernova
15http://archive.stsci.edu/hst/search.php

4
was 0.6± 0.5 magnitudes fainter than SN1998bw at max-imum light. We note that this uncertainty is dominatedby “aperture effects” (see Price et al. 2003) which causevariable contribution from the host galaxy complex in dif-ferent epochs.
We obtained optical spectroscopy of the transient sourceusing the Magellan 6.5-meter telescope equipped with theLow Dispersion Survey Spectrograph (LDSS2) on 2002September 28.06 UT (t ≈ 24.6 days), during the observedplateau phase. The data were reduced and calibrated us-ing standard techniques. The spectrum is characterized bya faint continuum dominated by narrow, bright emissionlines typical of star-forming galaxies (Figure 3; Soderberget al. 2002; Chornock & Filippenko 2002).
To search for high velocity SN features within the ob-served spectrum, we utilized the supernova classificationtechniques of Howell et al. (2005), designed for identifica-tion of SNe in the presence of host galaxy contamination.Host galaxy light must be subtracted from the observedspectrum to reveal the SN flux. We fit a range of star-burst host galaxy templates from Kinney et al. (1993),consistent with the continuum shape and narrow lines inthe observed spectrum. After sigma-clipping the narrowemission lines and subtracting the best-fit galaxy template(model SB1), the residual spectrum shows broad featuresresembling those of SN1998bw near maximum light. Fig-ure 3 presents a comparison of our galaxy subtracted spec-trum with SN1998bw at t ≈ 20.5 days (rest-frame; Patatet al. 2001), redshifted to z = 0.25 and dimmed by ∼ 0.3magnitudes. The resemblance is striking.
Taken together, the spectroscopic and photometric datastrongly suggest that XRF020903 was associated with asupernova that is ∼ 0.6 ± 0.5 magnitudes fainter thanSN 1998bw at maximum light. Moreover, the SN light-curve fades faster than SN1998bw, falling ∼ 1 mag be-low the synthesized SN1998bw light-curve at late-time. Adimmer, faster fading supernova was also interpreted forSN 2003dh/GRB030329 (Lipkin et al. 2004; Deng et al.2005; c.f. Matheson et al. 2003) and is consistent withthe luminosity-stretch relation for GRB-SNe (Bloom et al.2002; Stanek et al. 2005).
3.2. XRF040701
3.2.1. Prompt Emission and Afterglow Properties
XRF040701 was localized on 2004 July 1.542 UT by theHETE-2 WXM to an 8 arcmin radius error circle centeredat α = 20h47m46.3s, δ = −4014′13′′ (J2000; Barraud etal. 2004).
We observed the error circle with the Chandra X-rayObservatory (CXO) using the AXAF CCD Imaging Spec-trometer (ACIS) for 22.3 ksec beginning at 2004 July 9.32UT (t ≈ 7.9 days) and 20.4 ksec on 2004 July 18.05 (t ≈16.6 days). Comparison of the two epochs revealed themost variable source to be at position α = 20h48m16s.097,δ = −4011′08′′.83 (J2000), with an uncertainty of 0.5arcsec in each coordinate (2σ; Fox 2004) which we inter-pret as the X-ray afterglow. Assuming Galactic absorp-tion, the X-ray flux of the source was 7.75 × 10⁻¹⁴ and4.06×10−14 erg cm−2 s−1 (2−10 keV), in the first and sec-ond epochs, respectively. This implies a temporal decay,
FX ∼ tα with α = −1.15, between the two observations,comparable to the typical observed values of GRB X-rayafterglows, α ∼ −1.1 (Berger, Kulkarni & Frail 2003, andreferences therein).
Inspection of Digital Sky Survey (DSS) images revealedthat the X-ray afterglow is associated with a resolvedgalaxy complex whose redshift we determined to be z =0.2146 (Kelson et al. 2004). At this relatively low redshift,the X-ray afterglow is sensitive to absorption within thehost galaxy. We fit an absorbed power-law model to theafterglow spectrum where the column density, NH , was acombination of foreground and host galaxy extinction. Wefind that the column density within the host galaxy mustbe NH ∼< 5 × 1021 cm−2 (90% confidence) in order to re-
produce the observed low energy (< 1 keV) X-ray photons.Utilizing the NH to AV conversion of Predehl & Schmitt(1995), this limit corresponds to a rest-frame host galaxyextinction of AV,host ∼< 2.8 mag.
Despite deep searches, no optical afterglow candidatewas discovered through ground-based monitoring of theChandra error circle (de Ugarte Postigo et al. 2004; Bergeret al. 2004; Pian et al. 2004). This non-detection couldbe the result of the large host-galaxy extinction, consistentwith the observed X-ray afterglow absorption.
3.2.2. HST observations
HST/ACS imaging was carried out on 2004 August 9.66and 30.52 UT (t ≈ 39.1 and 60.0 days after the burst).Each epoch had a total exposure time of 1840 and 1920sec in the F625W and F775W filters, respectively. Weastrometrically tied the HST and Chandra images by firstregistering the X-ray source list to our I-band images fromthe Las Campanas Observatory (LCO) 40-inch telescope(Berger et al. 2004) using three sources in common. Wethen tied the LCO images to those from HST resulting ina final positional uncertainty of 1.06 arcsec (2σ).
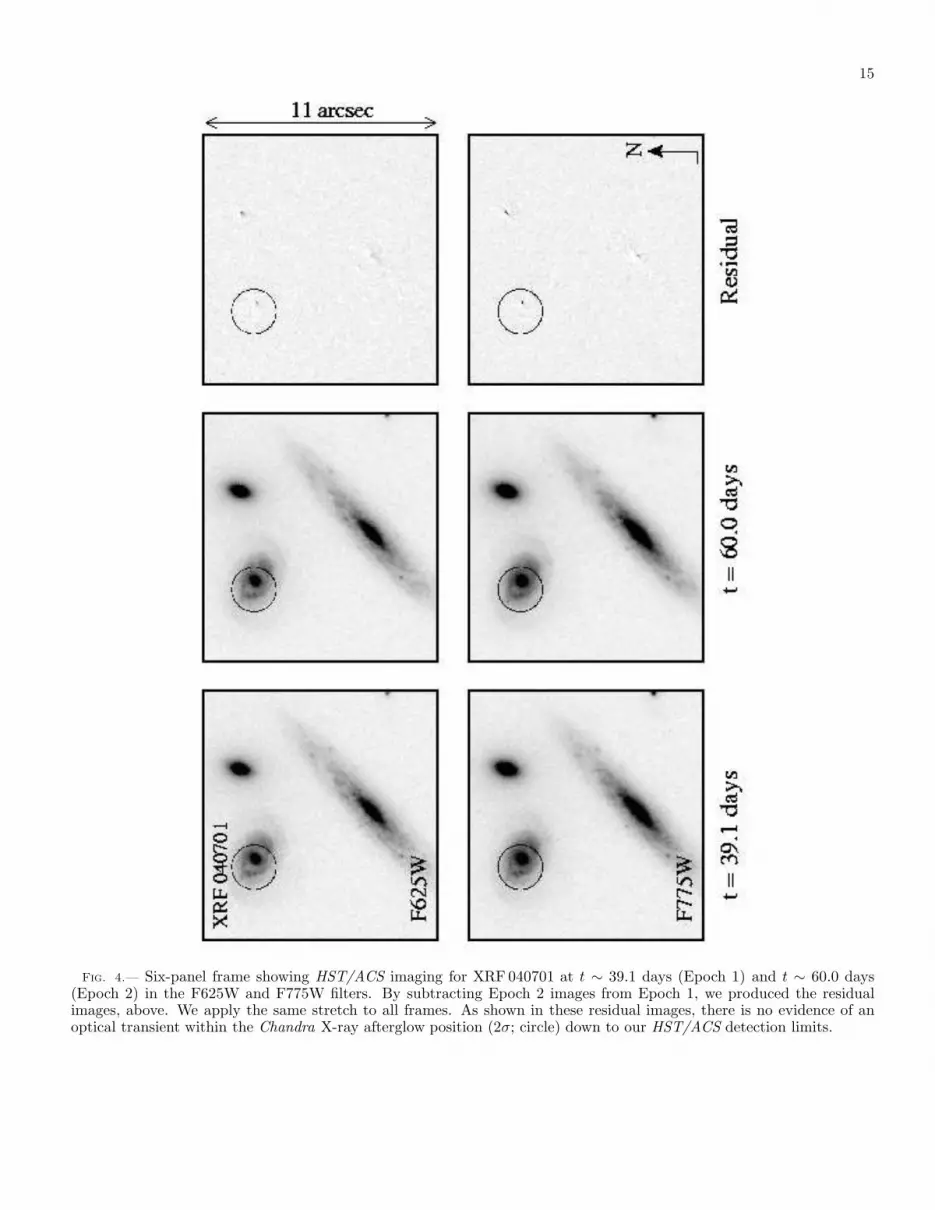
Our HST observations reveal that the afterglow errorcircle coincides with the northeast galaxy of the host com-plex. Inspection of the images reveals that there are notransient sources within this localization region. Figure 4shows the images from both epochs in addition to theresidual images produced from the subtraction routine.We found that the false stellar residuals recovered at ourdetection threshold correspond to limits of F625W > 27.8and F775W > 26.8 mag (R > 27.6 and I > 26.4 mag).Correcting for Galactic extinction (AR = 0.13; Schlegel,Finkbeiner & Davis 1998), the actual limits are R > 27.5and I > 26.3 mag. We note that the slightly elevated fluxof the bipolar galaxy residual are consistent with theselimits.
Figure 5 shows the HST limits along with early-timedata compiled from the GCNs (de Ugarte Postigo et al.2004; Pian et al. 2004), corrected for Galactic extinc-tion. To estimate the flux of the optical afterglow, weextrapolated the observed Chandra data to the R- and I-bands. Following Sari, Piran & Narayan (1998) for thecase of a constant denisty medium, the observed X-rayafterglow decay (FX ∝ t−1.15) implies that the electronenergy index (dN/dE ∝ E−p) is p ≈ 2.5 in the case wherethe synchrotron cooling frequency, νc, is above the X-rayband, and p ≈ 2.2, if it is below. We therefore extrapo-

5
late the observed X-ray flux by adopting a spectral index(Fν ∝ νβ) with β = −(p − 1)/2 ≈ −0.75 in the case ofνopt < νX < νc and β = −p/2 ≈ −1.1 for νc < νopt < νX .These two scenarios bracket the whole range of optical fluxvalues implied by the possible location of the νc at the timeof the CXO observations.
By extrapolating the predicted optical decay to the firstHST epoch, we conclude that the afterglow should havebeen ∼> 3.0 magnitudes brighter than our HST detectionlimit. Even in the most extreme scenario, a jet break oc-curred coincident with the second Chandra epoch, forcingthe temporal decay to steepen to Fν ∝ t−p (Sari, Piran& Halpern 1999). Still, the afterglow would have been
∼> 1.7 magnitudes brighter than the HST limit. Under theassumption that the observed X-ray flux was dominatedby synchrotron emission, these limits imply that there issignificant extinction from the host galaxy. However, in ascenario where the X-ray emission is dominated by otherprocesses (e.g. inverse Compton), this extrapolation over-predicts the brightness of the optical afterglow, therebyreducing the implied host galaxy extinction.
3.2.3. Supernova Limits
Over-plotted in Figure 5 are synthesized light-curves forSNe 1998bw, 1994I and 2002ap at z = 0.21. From thefigure, it is clear that a SN1998bw-like supernova wouldhave been ∼ 6 magnitudes brighter than our HST lim-its. A faint supernova similar to SN2002ap would stillbe ∼ 3.4 magnitudes above our detection threshold. Ourconstraints on the column density imply that host galaxyextinction cannot account for this difference; even in anextreme scenario, given by AV,host ≈ 2.8 mag, our limitsare still ∼ 3.2 magnitudes fainter than SN1998bw. Weconclude that an XRF 040701-associated supernova mustbe ∼ 3 mag fainter than SN1998bw, making it significantlyfainter than all GRB-SNe known to date.
3.3. XRF040812
3.3.1. Prompt Emission and Afterglow Properties
XRF040812 was discovered on 2004 August 12.251 UTby the Imager on Board the Integral Satellite (IBIS). Pre-liminary analysis indicated a spectrum that was X-rayrich. The event was localized to a 2-arcmin radius cir-cle centered at α = 16h26m05s, δ = −4442′32′′ (J2000;Gotz et al. 2004).
Patel et al. (2004a) observed the field of XRF 040812with Chandra/ACIS beginning on 2004 August 17.30 UT(t ≈ 5 days) and on 2004 August 22.41 UT (t ≈ 10days) for 10 ksec each. Comparison of the two epochsrevealed a variable source at position α = 16h26m2s.25,δ = −4443′49′′.4 (J2000) which faded as FX ∝ t−1.4 be-tween the observations (Patel et al. 2004b). The unab-sorbed flux in the first and second epochs was 2.53×10⁻¹³
and 9.30 × 10⁻¹⁴ erg cm−2 s−1 (0.5–10 keV), respectively(Campana & Moretti 2004a,b).
Due to high Galactic extinction in the direction of theburst (AR = 3.6 mag; Schlegel, Finkbeiner & Davis 1998)and the presence of an extremely bright star ∼ 20 arcsecfrom the CXO position, optical/IR campaigns could nei-ther observe the optical afterglow nor obtain spectroscopy
of the host galaxy (Berger 2004; Berger et al. 2004a; Cobb& Bailyn 2004; D’Avanzo et al. 2004). As a result, a spec-troscopic redshift is not available for XRF 040812.
3.3.2. HST Observations
HST/ACS imaging for XRF040812 was carried out on2004 September 13.4 and October 4.8 UT (t ≈ 32.1 and53.6 days after the burst). Each epoch had a total expo-sure time of 2000 and 2120 sec in the F625W and F775Wfilters, respectively. Observations were taken with ori-entation angles chosen to minimize contamination fromdiffraction spikes and saturated columns resulting fromthe bright foreground star. Using the Chandra source listprovided by Patel et al. (2004a), we identified five uncon-fused, unsaturated sources in common between the Chan-dra observations and our I-band Las Campanas Observa-tory (LCO) 40-inch observations (Berger et al. 2004a) andused these to tie the X-ray afterglow position to ground-based images. The LCO and HST images were then reg-istered, resulting in a final positional uncertainty of 0.91arcsec (2σ).
Through examination of the HST images, we find anextended source ∼ 0.33 arcsec (< 1σ) from the nomi-nal CXO position and interpret it as the host galaxy ofXRF040812. We find the galaxy to be relatively bright,F625W≈ 24.50± 0.06 mag, corresponding to R ≈ 20.68±0.05 mag after correcting for the large foreground extinc-tion. Comparison with the set of GRB host galaxy mag-nitudes compiled by Berger et al. (2005a) suggests thatXRF040812 is at a relatively low redshift, z ∼< 0.5. At thisredshift, the host galaxy extinction is constrained to beAV,host ∼< 6.1, (90% confidence) based on our independentanalysis of the lowest energy X-ray afterglow emission.
Image subtraction reveals no transient sources thatcould be attributed to an optical afterglow or associ-ated supernova within the CXO localization circle (Fig-ure 6). We find 3σ detection limits on the residual imageof F625W > 27.0 and F775W > 26.4 mag (R > 26.8 andI > 25.9 mag). Due to the large Galactic extinction, how-ever, the true limits are significantly shallower, R > 23.2and I > 23.3 mag.
Figure 7 displays the Galactic extinction-corrected HSTlimits along with the predicted optical afterglow extrapo-lated from the X-ray flux in a manner similar to that forXRF040701 (§3.2.2). Given the observed X-ray decay, weextrapolate with β ≈ −0.96 for p ≈ 2.92 and β ≈ −1.29for p ≈ 2.59. As evident from the figure, the HST I-band limit is 1.9 magnitudes fainter than the predictedoptical afterglow, assuming the flux continued evolving asFopt ∝ t−1.4 to the HST epoch. If, instead, a jet break oc-curred at the second Chandra epoch, the predicted opticalafterglow could be consistent with the HST non-detection.
3.3.3. Supernova Limits
Since the redshift of XRF040812 is not known, we over-plot synthesized light-curves for SNe 1998bw, 1994I and2002ap at the appropriate redshift such that the SN curvesmatch the residual image HST detection limit. Super-novae placed above these redshift limits would not bedetected. Due to the heavy foreground extinction to-ward XRF 040812, the I-band limits provide deeper con-

6
straints on an associated supernova. As shown in Fig-ure 7, a SN1998bw-like supernova is ruled out for z ∼< 0.90while SN1994I- and SN2002ap-like SNe are ruled out forz ∼< 0.34 and z ∼< 0.35, respectively. To be consistent withthe estimated low-z inferred from the host galaxy bright-ness, an associated SN must be significantly fainter thanSN 1998bw or suppressed due to host galaxy extinction.
3.4. XRF040916
3.4.1. Prompt Emission and Afterglow Properties
On 2004 September 16.002 UT the HETE-2 satellitediscovered XRF040916. Preliminary spectral analysis re-vealed a dearth of photons at ∼> 10 keV suggestive that
the event was an X-ray flash (Yamazaki et al. 2004a).The initial localization error region was 18 arcmin in ra-dius centered at α = 23h01m44s, δ = −0537′43′′ (J2000).A refined error box with half the original size (545 squarearcmin) was released later (Yamazaki et al. 2004b). Us-ing SuprimeCam mounted on the Suburu 8.2m telescope,Kosugi et al. (2004) discovered a faint optical afterglowat α = 23h00m55s.1, δ = −0538′43′′ (J2000) with a mag-nitude of Rc ≈ 22.3± 0.2 at t ≈ 0.23 days . The afterglowsubsequently decayed as Fopt ∝ t−1.0. In comparison toGRB optical afterglows compiled by Fox et al. (2003) andBerger et al. (2005b), XRF040916 is the faintest opticalafterglow ever detected on this timescale. We note thatno spectroscopic redshift has been reported for this event.
3.4.2. HST Observations
XRF040916 was imaged with HST/ACS on 2004 Oc-tober 18.38 and November 30.30 UT (t ≈ 32.4 and 75.3days after the burst) for a total exposure time of 1930(2058) sec in Epoch 1 and 1928 (2056) sec in Epoch 2 inthe F625W (F775W) filter. For astrometry, we used early-time (t ∼ 0.16 day) R- and I-band data from the PalomarRobotic 60-inch telescope (P60; Cenko et al., in prep) inwhich the optical afterglow is clearly detected. Twelvestars in common between the Palomar and HST imagesprovided an astrometric uncertainty of 0.29 arcsec (2σ).
Within the afterglow position error circle, we find afaint source near the detection limit of our first epochF625W and F775W images at α = 23h00m55.141s, δ =−0538′42′′.70 (J2000). Figure 8 shows the source is toofaint to be recovered in the residual images, implying it isjust below our 3σ detection threshold of F625 > 27.9 magand F775W > 27.2 mag (R > 27.7 and I > 26.7 mag).Correcting for Galactic extinction (AR = 0.15; Schlegel,Finkbeiner & Davis 1998), the true limits are R > 27.5and I > 26.6 mag.
In Figure 9 we show the HST limits along with early-time data from P60 and from the GCNs (Kosugi et al.2004; Klotz et al. 2004; Henden 2004), all corrected forGalactic extinction. The early data are well fit with aFopt ∝ t−1.0 decay. We note that the early detection byHenden (2004) is inconsistent with our I-band data. TheHST limits are consistent with the extrapolated opticalafterglow, assuming the flux decayed without steepeninguntil the epoch of HST observations.
3.4.3. Supernova Limits
Since the redshift of XRF040916 is not known, we over-plot synthesized light-curves for SNe 1994I and 2002apeach at the appropriate redshift such that the SN curvesmatch the residual image HST detection limit. Supernovaewith light-curves similar to SNe 1994I and 2002ap wouldnot be detected above z ≈ 1.02 and z ≈ 0.82, respec-tively. Synthesized light-curves for SN 1998bw at z = 0.8and z = 1.2 represent the limits to which we can con-fidently extrapolate the rest-frame SN spectrum. Theselight-curves are ∼ 3 and ∼ 1.5 magnitudes brighter thanthe observed HST limits in the R- and I- bands, and there-fore suggest that either XRF 040916 is at higher redshift(e.g. z > 1.2) or it is associated with a lower luminositySN.
We note that XRF040916 is the only event within ourHST survey for which we do not detect the host galaxy.Given our HST detection limit and the small foregroundextinction, this implies the host galaxy is fainter thanR ≈ 27.5 mag. We compare this limit with faint GRBhost galaxies; all of the GRB hosts with R > 26 magare at redshift z > 1.4 (Berger et al. 2005a). Assumingthe GRB host galaxy luminosity function also applies toXRFs, this implies that XRF040916 is at a similarly highredshift, far beyond the z ∼ 1.2 redshift limit out to whichwe can detect an associated SN.
4. A SUMMARY OF XRF-SN SEARCHES
We now present a global summary of all SN searchesin XRFs to date, including HST campaigns for XRFs011030, 020427, 020903, 040701, 040812, 040916 and adeep ground-based effort for XRF 030723. In compilingthese results, we also discuss the available constraints onhost galaxy extinction, which could suppress any emissionfrom an associated SN.
The only XRF for which we find evidence suggestiveof an accompanying supernova is XRF020903 (z = 0.25).Based on the observed flattening of the optical light-curvesat t ∼ 30 days, and the identification of broad features inthe optical spectrum, we propose that XRF 020903 wasassociated with a supernova up to ∼ 1 magnitude fainterthan SN 1998bw at maximum light.
In the case of XRF040701, our foreground extinction-corrected HST detection limit is ∼ 6 mag fainter thanSN1998bw at this redshift. Our analysis of the X-ray af-terglow spectra reveals that the rest-frame host galaxy ex-tinction is constrained to AV,host ∼< 2.8, implying a con-servative upper limit on the brightness of the associatedSN to be ∼ 3.2 mag fainter than SN 1998bw and fainterthan all of the GRB-SN studied to date. Taken together,XRFs 020903 and 040701 (the only two XRFs with red-shifts in our sample) imply that at least some of the XRF-associated SNe are considerably fainter than SN1998bw.
Due to the heavy foreground extinction towardXRF040812, our ability to detect a SN1998bw-like eventwould only be possible for z ∼< 0.7. In this case, analysis ofthe X-ray afterglow does not provide a strong constrainton the host galaxy extinction, since the lowest energy pho-tons are absorbed by the Galaxy. Our limits are more con-straining for the case of XRF040916, where we would be

7
sensitive to a SN 1998bw-like supernova beyond z ∼ 1.2.The lack of a SN detection, however, is consistent with ahigh redshift as possibly suggested by the faintness of thehost galaxy and optical afterglow.
Deeper constraints have previously been reported basedon HST/STIS data for two additional XRFs withoutknown redshifts, XRFs 011030 and 020427 (Levan et al.2004). Thanks to the broad throughput of the STIS Clearfilter, the sensitivity extends red-ward of I-band, therebyenabling SN detection to z ≈ 1.5 before UV blanketingsuppresses the observed emission. Levan et al. (2004)showed that a SN1998bw-like supernova would be de-tectable to z ∼ 1.5 for both XRFs 011030 and 020427.Using the X-ray afterglow data for these two bursts, Levanet al. (2004) estimated their host galaxy extinction to beAV ∼< 1.7 and AV ∼< 2.5, respectively, assuming a moder-ate redshift of z ∼ 0.5. At lower redshift, the host galaxyextinction required to suppress a SN1998bw-like super-nova is inconsistent with the X-ray limits, suggesting thatthese two bursts are either located at higher redshift orassociated with low luminosity SNe. We note that a firmredshift limit of z ∼< 2.3 has been reported for XRF 020427
based on the lack of Lyα absorption down to 3800 A withinthe optical spectrum (van Dokkum & Bloom 2003).
While there were no HST observations taken forXRF 030723, we utilize the deep ground-based afterglowobservations reported by Fynbo et al. (2004) to constrainthe emission from an underlying supernova. Despite claimsthat the optical rebrightening at t ∼ 10 days is due to anassociated supernova (Tominaga et al. 2004; Fynbo et al.2004), we conclude that the observed optical/NIR variabil-ity is dominated by afterglow emission since neither theR − K color nor the optical to X-ray spectral index varyon this timescale (Fox et al., in prep.; Butler et al. 2004).We therefore adopt the R-band afterglow light-curve as aneffective upper limit on the flux of an accompanying SN.We derive the most robust constraint from an observationat t = 24.78 days with R = 25.08 ± 0.09. This limit issufficiently deep to rule out a SN 1998bw-like supernovaat z ∼< 0.8. We note that while the redshift of XRF 030723is not known, the lack of Lyα absorption in optical spectralimits the redshift to z ∼< 2.3 (Fynbo et al. 2004).
We summarize the limits on XRF-associated supernovaefor these seven XRFs in Figure 10. Also shown are thepeak SN magnitudes (relative to SN1998bw) for limits(GRB 010921, Price et al. 2003) and secure detectionsof GRB-associated supernovae compiled from the liter-ature (GRBs 970228, 980703, 990712, 991208, 000911,011121, 020405, 021211 Zeh, Klose & Hartmann 2004;GRB 030329, Lipkin et al. 2004; Deng et al. 2005;GRB 031203, Malesani et al. 2004; GRB 041006, Staneket al. 2005). This figure highlights the spread of lumi-nosities implied for the supernovae associated with highenergy cosmic explosions. The GRB-SNe clearly show aspread in their peak brightness. Based on XRFs 020903and 040701, XRF-SNe appear to show a similar spread.Assuming a modest redshift of z ∼ 1 for the other fiveXRF-SNe implies an even larger spread and might suggestthan XRFs are associated with systematically fainter SNe.
5. DISCUSSION
We presented results from our HST/ACS search forthe supernovae associated with the XRFs 020903, 040701,040812, 040916 and extended this sample by includingpublished results for SN searches in XRFs 011030, 020427and 030723. We find strong evidence (photometric andspectroscopic) for a SN1998bw-like supernova (dimmed by
∼< 1 mag) in association with XRF 020903 (z = 0.25). Thisfinding conclusively associates XRFs with the death ofmassive stars for the first time. In the case of XRF040701(z = 0.21), our HST limit is ∼ 6 magnitudes fainter thanSN1998bw which cannot be accounted for by host galaxyextinction. Based on these two events (XRFs 020903 and040701), we conclude that at least some XRF-associatedSNe exist but can be significantly fainter than SN1998bw.
In Figure 11 we compile peak magnitudes for local TypeIbc supernovae and GRB-associated SNe. While the GRB-SN population tend to lie at the bright end of the local SNluminosity distribution there is a pronounced ∼ 2 magni-tude spread in their observed peak brightness which pro-duces significant overlap with the local SNe. We empha-size that the SN associated with XRF 020903 is consistentwith this observed spread, however, a supernova associ-ated with XRF 040701 would be considered faint even inthe context of the local SN population.
Since peak luminosity correlates roughly with the massof 56Ni synthesized in the explosion, these observationsimply a significant spread in the Nickel yield from GRBand XRF explosions. Most importantly, as revealed fromlow luminosity GRB/XRF SNe, engine-driven relativis-tic explosions do not necessarily produce more 56Ni thanlocal SNe Ibc, which are not associated with relativis-tic ejecta (Berger et al. 2003). This result is brack-eted by two extremes: events with a large Nickel out-put can be associated with weak engine-driven explosionsharboring only a small amount of relativistic ejecta (e.g.SN 1998bw/GRB980425), and those with a low Nickelyield can be produced in strong engine-driven explosionscharacterized by copious amounts of energy coupled tohighly relativistic jetted material. In conclusion, we findevidence that Nickel production and engine activity repre-sent independent parameters of the GRB/XRF explosionmechanism, each of which can be individually tuned.
The authors are grateful for support under the SpaceTelescope Science Institute grant HST-GO-10135. A.M.S.acknowledges support by the NASA Graduate Re-search Fellowship Program Research. E.B. is supportedby NASA through Hubble Fellowship grant HST-HF-01171.01 awarded by the STScI, which is operated bythe Association of Universities for Research in Astronomy,Inc., for NASA, under contract NAS 5-26555. A.G. ac-knowledges support by NASA through Hubble Fellowshipgrant #HST-HF-01158.01-A awarded by STScI. D.C.L. issupported by an NSF Astronomy and Astrophysics Post-doctoral Fellowship under award AST-0401479.

8
References
Alard, C. 2000, A&AS, 144, 363.
Barraud, C., Ricker, G., Atteia, J.-L., Kawai, N., Lamb, D., and Woosley, S. 2004, GRB Circular Network, 2620.
Benetti, S., Branch, D., Turatto, M., Cappellaro, E., Baron, E., Zampieri, L., Della Valle, M., and Pastorello, A. 2002,MNRAS, 336, 91.
Berger, E. 2004, GRB Circular Network, 2650.
Berger, E., Fox, D. B., Kulkarni, S. R., Krzeminski, W., and Hamuy, M. 2004a, GRB Circular Network, 2644.
Berger, E. et al. 2005b, ArXiv Astrophysics e-prints. astro-ph/0502468.
Berger, E., Gal-Yam, A., Fox, D. B., Thompson, I., Schmidt, B., McNaught, R., and Peterson, B. 2004b, GRB CircularNetwork, 2631.
Berger, E., Kulkarni, S. R., and Frail, D. A. 2003, ApJ, 590, 379.
Berger, E. et al. 2005a, in prep.
Berger, E., Kulkarni, S. R., Frail, D. A., and Soderberg, A. M. 2003, ApJ, 599, 408.
Bersier, D. et al. 2004, American Astronomical Society Meeting Abstracts, 205, .
Bloom, J. S., Fox, D., van Dokkum, P. G., Kulkarni, S. R., Berger, E., Djorgovski, S. G., and Frail, D. A. 2003, ApJ, 599,957.
Bloom, J. S. et al. 2002, ApJ, 572, L45.
Bloom, J. S. et al. 1999, Nature, 401, 453.
Butler, N. R. et al. 2004, ArXiv Astrophysics e-prints. astro-ph/0408453.
Campana, S. and Moretti, A. 2004a, GRB Circular Network, 2649.
Campana, S. and Moretti, A. 2004b, GRB Circular Network, 2656.
Chornock, R. and Filippenko, A. V. 2002, GRB Circular Network, 1609.
Clocchiatti, A. et al. 2000, ApJ, 529, 661.
Clocchiatti, A. et al. 2001, ApJ, 553, 886.
Clocchiatti, A., Wheeler, J. C., Benetti, S., and Frueh, M. 1996, ApJ, 459, 547.
Clocchiatti, A. et al. 1997, ApJ, 483, 675.
Cobb, B. E. and Bailyn, C. D. 2004, GRB Circular Network, 2642.
Covino, S. et al. 2002, GRB Circular Network, 1563.
D’Avanzo, P., Cucchiara, A., Tagliaferri, G., Malesani, D., Fugazza, D., Covino, S., and Campana, S. 2004, GRB CircularNetwork, 2651.
de Ugarte Postigo, A., Tristram, P., Sasaka, Gorosabel, J., Yock, P., and Castro-Tirado, A. J. 2004, GRB CircularNetwork, 2621.
Deng, J., Tominaga, N., Mazzali, P. A., Maeda, K., and Nomoto, K. 2005, ArXiv Astrophysics e-prints. astro-ph/0501670.
Filippenko, A. V., Porter, A. C., and Sargent, W. L. W. 1990, AJ, 100, 1575.
Foley, R. J. et al. 2003, PASP, 115, 1220.
Fox, D. B. 2004, GRB Circular Network, 2630.
Fox, D. W. et al. 2003, ApJ, 586, L5.
Fruchter, A. S. and Hook, R. N. 2002, PASP, 114, 144.

9
Fynbo, J. P. U. et al. 2004, ApJ, 609, 962.
Galama, T. J. et al. 1998a, IAU Circ., 6895, 1.
Galama, T. J. et al. 1998b, Nature, 395, 670.
Gorosabel, J., Hjorth, J., Pedersen, H., Jensen, B. L., Fynbo, J. P. U., Andersen, M., Castro Cern, J. M., and Castro-Tirado, A. J. 2002, GRB Circular Network, 1631.
Gotz, M., Mereghetti, S., Mowlavi, N., Beck, M., and Borkowsk, J. 2004, GRB Circular Network, 2640.
Granot, J., Ramirez-Ruiz, E., and Perna, R. 2005, ArXiv Astrophysics e-prints. astro-ph/0502300.
Hatano, K., Branch, D., Nomoto, K., Deng, J. S., Maeda, K., Nugent, P., and Aldering, G. 2001, Bulletin of the AmericanAstronomical Society, 33, 838.
Heise, J., in’t Zand, J., Kippen, R. M., and Woods, P. M. 2001, in Gamma-ray Bursts in the Afterglow Era, 16.
Henden, A. 2004, GRB Circular Network, 2727.
Hjorth, J. et al. 2003, Nature, 423, 847.
Howell, D. A. et al. 2005, ApJ. submitted.
Iwamoto, K. et al. 2000, ApJ, 534, 660.
Kelson, D. D., Koviak, K., Berger, E., and Fox, D. B. 2004, GRB Circular Network, 2627.
Kinney, A. L., Bohlin, R. C., Calzetti, D., Panagia, N., and Wyse, R. F. G. 1993, ApJS, 86, 5.
Klotz, A., Atteia, J. L., Sratta, G., and Bohr, M. 2004, GRB Circular Network, 2729.
Kosugi, G., Kawai, N., Tajitsu, A., and Furusawa, H. 2004, GRB Circular Network, 2726.
Levan, A., Fruchter, A., Strolger, L., Burud, I., and Rhodes, J. 2002, GRB Circular Network, 1761.
Levan, A. et al. 2004, ArXiv Astrophysics e-prints. astro-ph/0410560.
Lipkin, Y. M. et al. 2004, ApJ, 606, 381.
Malesani, D. et al. 2004, ApJ, 609, L5.
Matheson, T. et al. 2003, ApJ, 599, 394.
Mazzali, P. A. et al. 2002, ApJ, 572, L61.
McKenzie, E. H. and Schaefer, B. E. 1999, PASP, 111, 964.
Patat, F. et al. 2001, ApJ, 555, 900.
Patel, S. et al. 2004b, GRB Circular Network, 2655.
Patel, S. et al. 2004a, GRB Circular Network, 2648.
Pian, E. et al. 2000, ApJ, 536, 778.
Pian, E. et al. 2004, GRB Circular Network, 2638.
Predehl, P. and Schmitt, J. H. M. M. 1995, A&A, 293, 889.
Price, P. A. et al. 2003, ApJ, 584, 931.
Richmond, M. W. et al. 1996, AJ, 111, 327.
Sakamoto, T. et al. 2004a, ArXiv Astrophysics e-prints. astro-ph/0409128.
Sakamoto, T. et al. 2004b, ApJ, 602, 875.
Sari, R., Piran, T., and Halpern, J. P. 1999, ApJ, 519, L17.
Sari, R., Piran, T., and Narayan, R. 1998, ApJ, 497, L17+.

10
Schlegel, D. J., Finkbeiner, D. P., and Davis, M. 1998, ApJ, 500, 525.
Sharina, M. E., Karachentsev, I. D., and Tikhonov, N. A. 1996, A&AS, 119, 499.
Sirianni, M. et al. 2005, PASP. submitted.
Soderberg, A. M. et al. 2004, ApJ, 606, 994.
Soderberg, A. M. et al. 2002, GRB Circular Network, 1554.
Sohn, Y. and Davidge, T. J. 1996, AJ, 111, 2280.
Stanek, K. Z., Garnavich, P. M., Nutzman, P. A., Hartman, J. D., and Garg, A. 2005, ArXiv Astrophysics e-prints.astro-ph/0502319.
Stanek, K. Z. et al. 2003, ApJ, 591, L17.
Stockdale, C. J., Sramek, R. A., Weiler, K. W., Van Dyk, S. D., Panagia, N., Montes, M. J., and Rupen, M. P. 2005, inCosmic Explosions: On the 10th Anniversary of SN1993J (IAU Colloquium 192.
Stritzinger, M. et al. 2002, AJ, 124, 2100.
Tominaga, N., Deng, J., Mazzali, P. A., Maeda, K., Nomoto, K., Pian, E., Hjorth, J., and Fynbo, J. P. U. 2004, ApJ,612, L105.
Tsvetkov, D. Y. 1987, Soviet Astronomy Letters, 13, 376.
van Dokkum, P. G. and Bloom, J. S. 2003, GRB Circular Network, 2380.
Yamazaki, R., Ioka, K., and Nakamura, T. 2003, ApJ, 593, 941.
Yamazaki, T., Ricker, G., Atteia, J.-L., Kawai, N., Lamb, D., and Woosley, S. 2004a, GRB Circular Network, 2712.
Yamazaki, T., Ricker, G., Atteia, J.-L., Kawai, N., Lamb, D., and Woosley, S. 2004b, GRB Circular Network, 2713.
Zeh, A., Klose, S., and Hartmann, D. H. 2004, ApJ, 609, 952.
Zhang, W., Woosley, S. E., and Heger, A. 2004, ApJ, 608, 365.
11
Table 1
HST Observation Log
Target Date Obs ∆t Exp. Time Filter HST maga Extinctionb Johnson magc
(UT) (days) (sec) (AB) Aλ (Vega)
XRF 020903 2002 December 3.8 91.4 1840 F606W 24.53 ± 0.03 AR = 0.09 R = 24.23 ± 0.03— 2003 June 30.6 300.2 1920 F606W — — —
XRF 040701 2004 August 9.6 39.1 1820 F625W > 27.81 AR = 0.13 R > 27.48— 2004 August 30.5 60.0 1820 F625W — — —— 2004 August 9.7 39.1 1940 F775W > 26.83 AI = 0.09 I > 26.30— 2004 August 30.5 60.0 1940 F775W — — —
XRF 040812 2004 September 13.3 32.0 2000 F625W > 26.99 AR = 3.61 R > 23.18— 2004 October 4.8 53.5 2000 F625W — — —— 2004 September 13.4 32.1 2120 F775W > 26.38 AI = 2.62 I > 23.32— 2004 October 4.8 53.5 2120 F775W — — —
XRF 040916 2004 October 18.4 32.4 1930 F625W > 27.89 AR = 0.15 R > 27.54— 2004 November 30.3 75.3 1928 F625W — — —— 2004 October 18.4 32.4 2058 F775W > 27.19 AI = 0.64 I > 26.64— 2004 November 30.4 75.4 2056 F775W — — —
aFrom residual image. Observed magnitude, not corrected for foreground extinction.
bGalactic extinction from Schlegel, Finkbeiner & Davis (1998).
cFrom residual image. Corrected for foreground extinction using Aλ given in column 7.

12
Fig. 1.— Three-panel frame showing HST/ACS imaging for XRF020903 at t ∼ 91 days (Epoch 1) and t ∼ 300 days(Epoch 2) in the F606W filter. By subtracting the Epoch 2 image from Epoch 1, we produced the residual image, above.We apply the same stretch to all frames. As clearly shown in this residual image, a transient source is detected coincidentwith the 0.12 arcsec (2σ) optical afterglow position (circle), lying on the southwest knot of the host galaxy complex.

13
Fig. 2.— Constraints on a supernova associated with XRF 020903. Extinction corrected ground-based R-band obser-vations of the optical afterglow have been compiled from Soderberg et al. (2004) and the GCNs (Covino et al. 2002;Gorosabel et al. 2002), and are shown as diamonds and grey circles, respectively. The temporal decay of the (host galaxysubtracted) optical afterglow is described by t−1.1 (dashed grey line) at early time followed by a plateau phase at t ∼ 30days. The weighted mean of the points between t ∼ 20 − 40 days (black cross) indicates that at peak the supernova was0.6 ± 0.5 magnitudes fainter than the synthesized SN1998bw light-curve (thick line). At t ∼ 91 days, however, the HSTtransient (encircled dot) is ∼ 1 magnitude fainter than the synthesized curve, implying the supernova faded faster thanSN 1998bw. SN 1994I- and 2002ap-like supernovae (medium and thin lines, respectively) would be significantly fainterthan the HST residual.

14
Fig. 3.— Magellan/LDSS2 spectrum of XRF 020903, taken at t ≈ 24.6 days. Host galaxy emission lines were sigma-clipped (top) and we remove the host galaxy contribution using a starburst template (bottom; light grey). The galaxysubtracted spectrum has broad SN features, in clear resemblance to SN 1998bw at t ∼ 20 days (rest-frame), redshifted toz = 0.25 and dimmed by 0.3 magnitudes (bottom; black). The telluric band is marked with an encircled cross.
15
Fig. 4.— Six-panel frame showing HST/ACS imaging for XRF 040701 at t ∼ 39.1 days (Epoch 1) and t ∼ 60.0 days(Epoch 2) in the F625W and F775W filters. By subtracting Epoch 2 images from Epoch 1, we produced the residualimages, above. We apply the same stretch to all frames. As shown in these residual images, there is no evidence of anoptical transient within the Chandra X-ray afterglow position (2σ; circle) down to our HST/ACS detection limits.

16
Fig. 5.— Constraints on an optical transient associated with XRF 040701. Ground-based optical limits (grey circles)have been compiled from the GCNs (de Ugarte Postigo et al. 2004; Pian et al. 2004), corrected for Galactic extinctionand are plotted for the R- (upper panel) and I-band (lower panel). By extrapolating the observed X-ray afterglow to theoptical bands, we predict a range of magnitudes for the optical afterglow on these same timescales (dark shaded polygon).Assuming the temporal decay can be extrapolated outside the X-ray observation window produces the light shaded bands.Dashed lines represent the extreme case where a jet break occurs at the second Chandra epoch. Simulated SN light-curvesfor SNe 1998bw (thick line), 1994I (medium line) and 2002ap (thin line), redshifted to z = 0.21, are over-plotted. Imagesubtraction of our two HST/ACS epochs in F625W and F775W, provide deep limits on an associated SN at t ∼ 32.1 days(encircled dots).

17
Fig. 6.— Six-panel frame showing HST/ACS imaging for XRF 040812 at t ∼ 32.1 days (Epoch 1) and t ∼ 53.6 days(Epoch 2) in the F625W and F775W filters. Within the X-ray afterglow position (2σ; circle) a host galaxy is clearlydetected. By subtracting Epoch 2 images from Epoch 1, we produced the residual images, above. We apply the samestretch to all frames. As shown in the residual images, there is no evidence of an optical transient within the host galaxydown to our HST/ACS detection limits.

18
Fig. 7.— Constraints on a supernova associated with XRF040812 are shown for the R- and I-bands. By extrapolating theobserved X-ray afterglow to the optical bands, we predict a range of magnitudes for the optical afterglow on these sametimescales (dark shaded polygon). Assuming the temporal decay can be extrapolated outside the X-ray observation windowproduces the light shaded bands. Dashed lines represent the case where a jet break occurs at the second Chandra epoch.The marked arrows show the (Galactic extinction-corrected) HST constraints derived from image subtraction techniquesdescribed in Section 3.3.2. Synthesized light-curves for SNe 1998bw (thick), 1994I (medium) and 2002ap (thin), are showneach at the redshift limit to which they could be detected within our residual HST observations (encricled dots).

19
Fig. 8.— Six-panel frame showing HST/ACS imaging for XRF040916 at t ∼ 32.4 days (Epoch 1) and t ∼ 75.3 days inthe F625W and F775W filters. By subtracting Epoch 2 images from Epoch 1, we produced the residual images, above.We apply the same stretch to all frames. As shown in the residual images, a faint source is detected in Epoch 1, coincidentwith the astrometrically derived optical afterglow position (2σ; circle).

20
Fig. 9.— Constraints on a supernova associated with XRF040916. Extinction corrected measurement for the opticalafterglow include data from the robotic Palomar 60-inch telescope (diamonds) and from the GCNs (grey circles) and areplotted for the R- (upper panel) and I-band (lower panel). The temporal decay of the R-band afterglow is well fit byt−1.0 (grey dashed line) which we scale to fit the I-band Palomar 60-inch data as well. The observed magnitude of thefaint HST transient (encircled dot) is consistent with the extrapolated OT decay. Synthesized light-curves for SNe 1994I(medium line) and 2002ap (thin line) are shown at the redshift for which the SN brightness matches that of the residualsource. At z = 1.2 (the redshift limit for our I-band light-curve synthesis) SN1998bw (thick line) would still be ∼> 3
magnitudes brighter than the it HST residual source (encircled dot). We note this non-detection is consistent with ahigher redshift, as possibly suggested by the faintness of the optical afterglow and host galaxy (§3.4.3).

21
Fig. 10.— A compilation of constraints for SN1998bw-like supernovae associated with X-ray flashes. For each XRF weadopt the (Galactic extinction-corrected) HST limit for the brightness of an associated supernova. At a given redshift, thedifference between the observed HST limit and the synthesized SN 1998bw light-curve represents how faint the supernovamust be (with respect to SN1998bw) in order to go undetected in our images. We plot this magnitude difference againstredshift for the seven XRFs with deep, late-time observations. Results for XRFs 011030 and 020427 have been takenfrom Levan et al. (2004). For XRF 040701 we show the limit including negligible host galaxy extinction, but note thatthis could be as high as AV,host ∼ 3 magnitudes. For XRF020903 we plot the value based on late-time HST observationsbut note that the peak magnitude could be considerably brighter (see §3.1.3 and Fig. 2). Also shown are the confirmedGRB-SN detections compiled from the literature (see §4).

22
Fig. 11.— Histogram of peak optical magnitudes (rest frame MV ) for local Type Ibc supernovae (light grey) and GRBassociated SNe (dark grey). Locations of the SNe associated with XRFs 020903 and 040701 (with AV,host = 2.8 mag) aremarked with arrows. There is a significant spread in peak brightness demonstrated by the local SNe and the GRB-SNesamples. The SN associated with XRF020903 is consistent with this observed diversity. GRB-SNe have been compiledfrom the literature (see §4). Local SNe include SN1983N (Clocchiatti et al. 1996), SN1983V (Clocchiatti et al. 1997),SN 1984L (Tsvetkov 1987), SN1987M (Filippenko, Porter & Sargent 1990), SN1990B (Clocchiatti et al. 2001), SN1991D(Benetti et al. 2002), SN1992ar (Clocchiatti et al. 2000), SN1994I (Richmond et al. 1996), SN 1997ef (Iwamoto et al.2000), SN 1999as (Hatano et al. 2001), SN1999ex (Stritzinger et al. 2002), SN 2002ap (Foley et al. 2003), and SN2003L(Soderberg et al., in prep).