port sec3 0ieee-hst paper48
TRANSCRIPT
Michael D. Orosz, Ph.D., Jennifer Chen,1
Isaac Maya, Ph.D., Daniel Salazar, Ph.D.,
Samrat Chatterjee, Ph.D., Dan Wei, Ph.D.2
1 Information Sciences Institute, Marina del Rey, CA 90292 2 National Center for Risk and Economic Analysis of Terrorism
Events (CREATE), Los Angeles, CA, 90089
University of Southern California, USA
Protecting our Nation’s Ports with
the Port Security Risk Analysis and
Resource Allocation System
(PortSec 3.0)
Outline
• Problem, Context, & PortSec Need
• Previous work - PortSec 2.0
− Real data feeds
− Support for blue force tracking at POLA
• PortSec 3.0
− Ongoing model improvements – A new risk
framework
− Economic model
• PortSec Next Steps – POLB & Virtual Port
Research Support
This research is supported by the United
States Department of Homeland Security
(DHS) through the National Center for Risk
and Economic Analysis of Terrorism Events
(CREATE). However, any opinions, findings,
and conclusions or recommendations in this
presentation are those of the authors and do
not necessarily reflect views of the US DHS.
Problem – 3 Major Competing Needs
1) Protection of the ports: security
– Provide jobs (locally, regionally, and nationally)
– Support import/export business
– Critical component of US’s supply-chain
* Major terrorism targets
2) Economic viability: goods must flow
– Minimize business interruptions & cost of business ops
* Excessively costly/disruptive security -> economic harm to
US, satisfies terrorist aims
3) Environmental Impact Minimization: green ports
* Throughput delays (like those from security counter-
measures) impact the environment via vessel emissions
Goal: Improve port security, minimize costs to business & environment
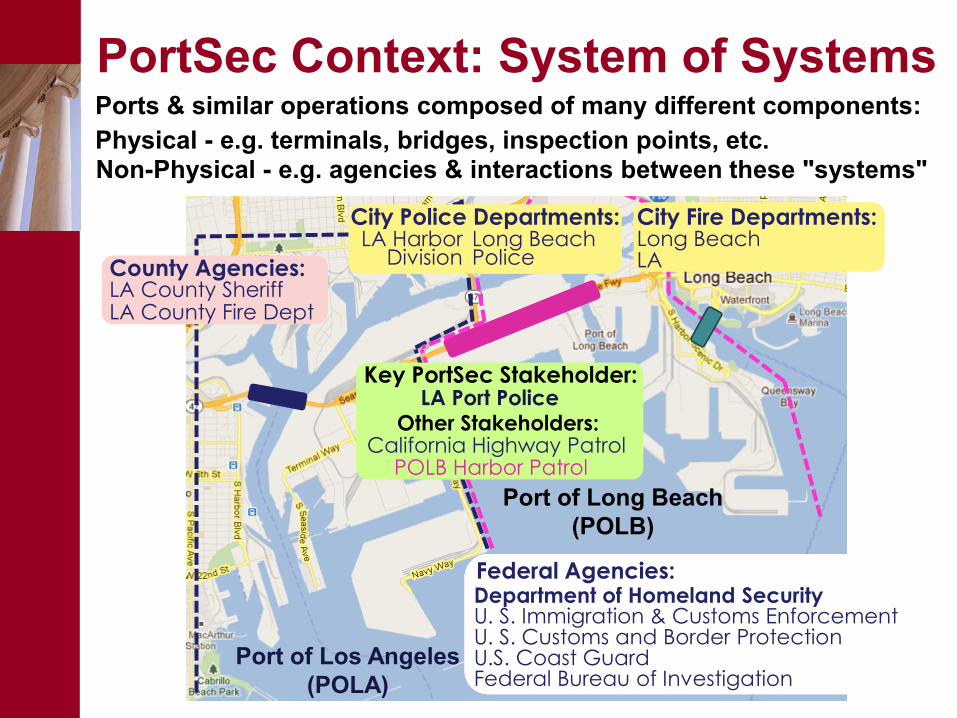
Port of Long Beach
(POLB)
Port of Los Angeles
(POLA)
County Agencies: LA County Sheriff LA County Fire Dept
City Fire Departments: Long Beach LA
LA Harbor Division
Long Beach Police
City Police Departments:
POLB Harbor Patrol California Highway Patrol
LA Port Police Key PortSec Stakeholder:
Other Stakeholders:
U.S. Coast Guard U. S. Customs and Border Protection U. S. Immigration & Customs Enforcement
Federal Bureau of Investigation
Federal Agencies: Department of Homeland Security
PortSec Context: System of Systems Ports & similar operations composed of many different components:
Physical - e.g. terminals, bridges, inspection points, etc.
Non-Physical - e.g. agencies & interactions between these "systems"
Need for PortSec • Dynamic operations:
Ports - dynamic "system of systems” constantly
changing, day-to-day & long-term.
• Complex dynamic infrastructure(s):
Difficult to model and analyze,
Even more difficult to understand without holistic
viewpoint.
• Focus on Port of LA:
Critical to national economy - in combination with
POLB processes over 40% of the nation’s container
traffic (7.9M TEU: CY 2011).
LA Seaports: Critical Element in the US/Global Economy
• Risk analysis decision-support system - help
inform users of resource allocation options that
reduce risk to port ops
• Initially geared to mitigate risk from terrorist-
based attacks
- Expanding to all-hazards platform to include natural
disasters, e.g. Superstorm Sandy’s at Ports of NY/NJ or
potential Tsunami in SoCal.
• Addresses trade-offs between maintaining
operations vs. minimizing port risk in tactical
day-to-day ops
PortSec - ConOps
Trade-offs: Minimize risk vs. port ops impact vs. environment
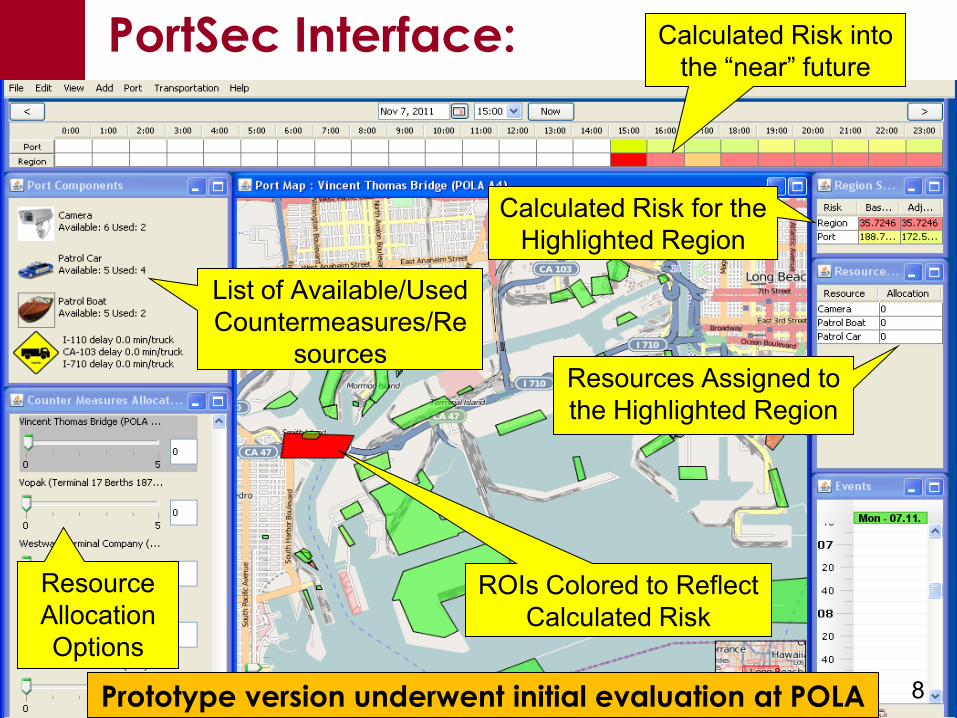
PortSec Interface:
List of Available/Used
Countermeasures/Re
sources
ROIs Colored to Reflect
Calculated Risk
Resource
Allocation
Options
Calculated Risk for the
Highlighted Region
Resources Assigned to
the Highlighted Region
8 Prototype version underwent initial evaluation at POLA
Calculated Risk into
the “near” future
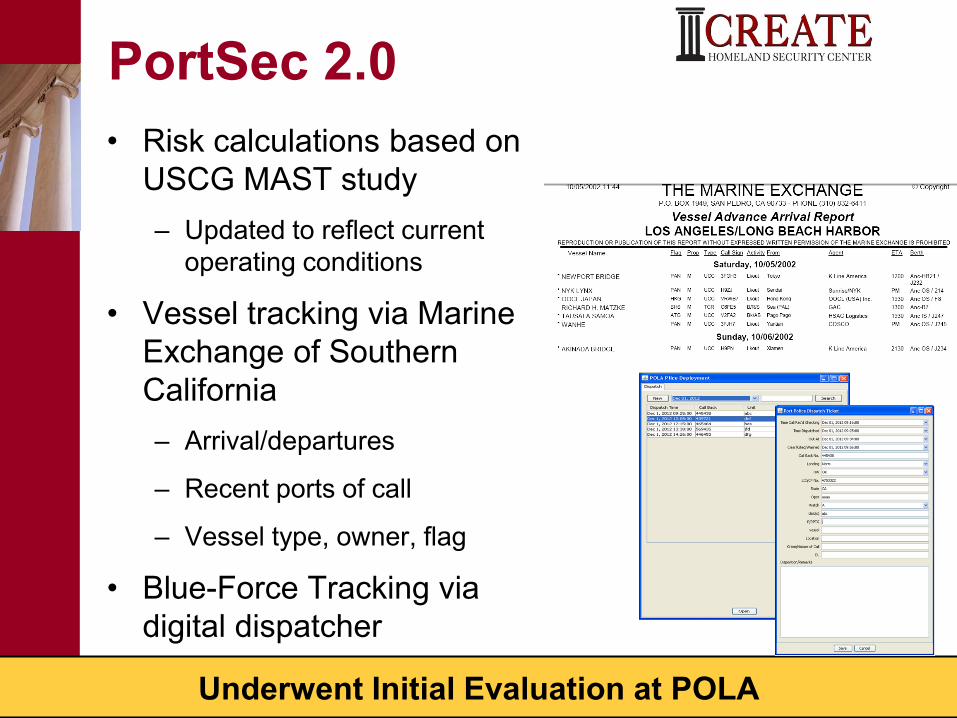
• Risk calculations based on
USCG MAST study
– Updated to reflect current
operating conditions
• Vessel tracking via Marine
Exchange of Southern
California
– Arrival/departures
– Recent ports of call
– Vessel type, owner, flag
• Blue-Force Tracking via
digital dispatcher
PortSec 2.0
Underwent Initial Evaluation at POLA
PortSec 2.0 - Challenges
PortSec 2.0: Proof-of-Concept Prototype
• Risk Model
– Did not consider real-world considerations associated with attack
delivery and propagation mechanisms
– Consequences associated with different attacks were represented
as dimensionless quantities.
– Relied on Risk = p(T ) X p(V) X p© model doesn’t take cross
dependencies into consideration
– Doesn’t support scenarios outside the USCG MAST study (e.g.,
drone attacks)
• Did not have an economic consequence model
• Doesn’t have a complete picture of the port operating
environment
– Vessel manifests
– SARs and other intelligent feeds
– Links to other security agencies
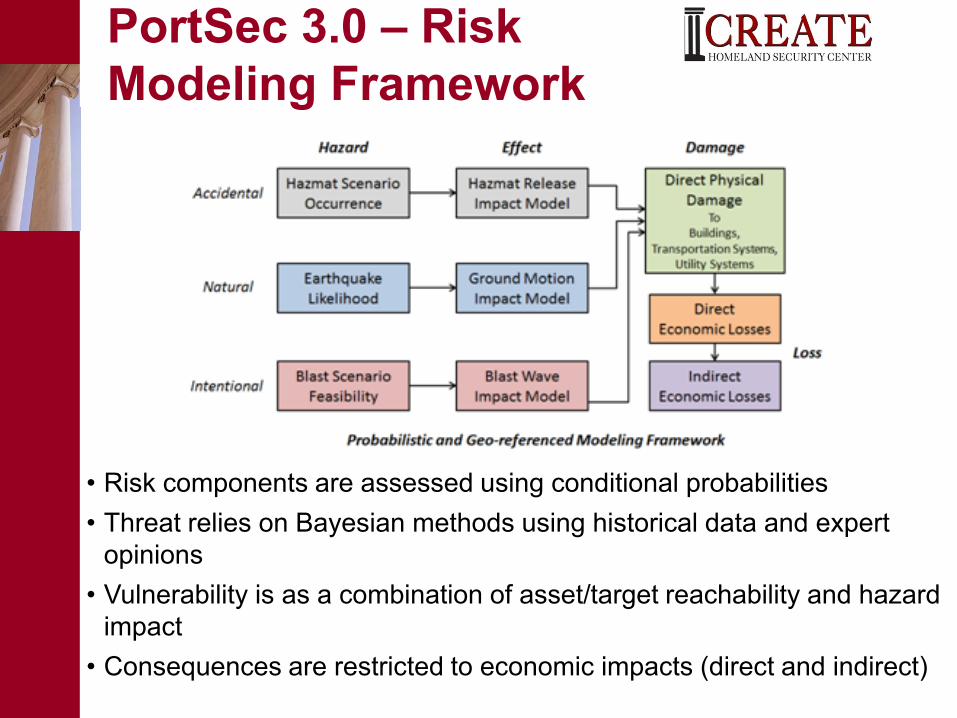
PortSec 3.0 – Risk
Modeling Framework
• Risk components are assessed using conditional probabilities
• Threat relies on Bayesian methods using historical data and expert
opinions
• Vulnerability is as a combination of asset/target reachability and hazard
impact
• Consequences are restricted to economic impacts (direct and indirect)
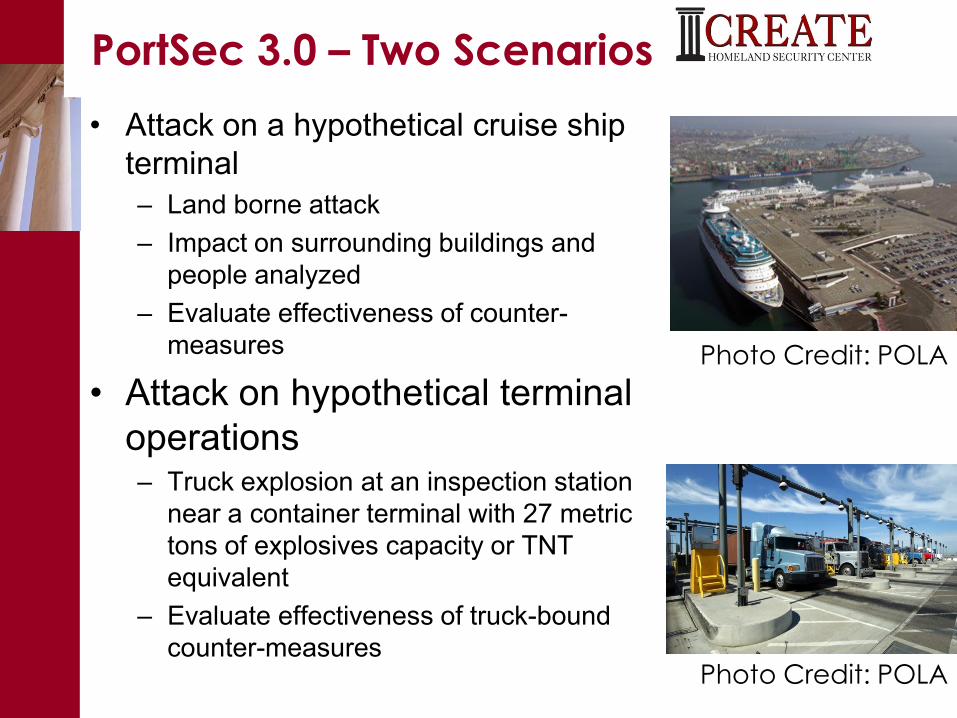
PortSec 3.0 – Two Scenarios
• Attack on a hypothetical cruise ship
terminal
– Land borne attack
– Impact on surrounding buildings and
people analyzed
– Evaluate effectiveness of counter-
measures
• Attack on hypothetical terminal
operations – Truck explosion at an inspection station
near a container terminal with 27 metric
tons of explosives capacity or TNT
equivalent
– Evaluate effectiveness of truck-bound
counter-measures
Photo Credit: POLA
Photo Credit: POLA
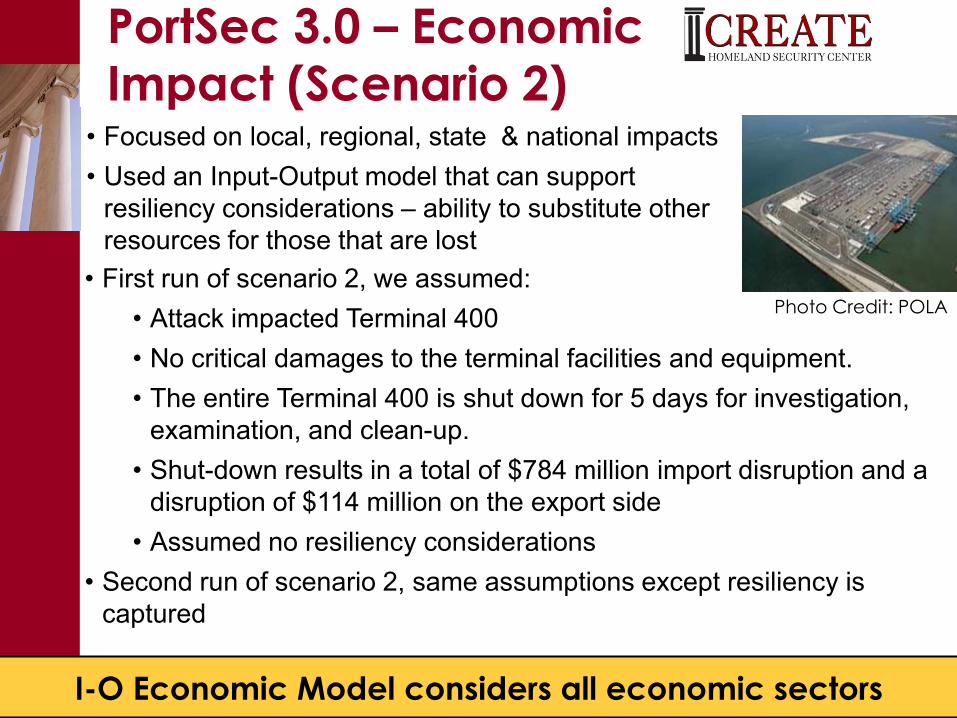
PortSec 3.0 – Economic
Impact (Scenario 2) • Focused on local, regional, state & national impacts
• Used an Input-Output model that can support
resiliency considerations – ability to substitute other
resources for those that are lost
• First run of scenario 2, we assumed:
• Attack impacted Terminal 400
• No critical damages to the terminal facilities and equipment.
• The entire Terminal 400 is shut down for 5 days for investigation,
examination, and clean-up.
• Shut-down results in a total of $784 million import disruption and a
disruption of $114 million on the export side
• Assumed no resiliency considerations
• Second run of scenario 2, same assumptions except resiliency is
captured
I-O Economic Model considers all economic sectors
Photo Credit: POLA
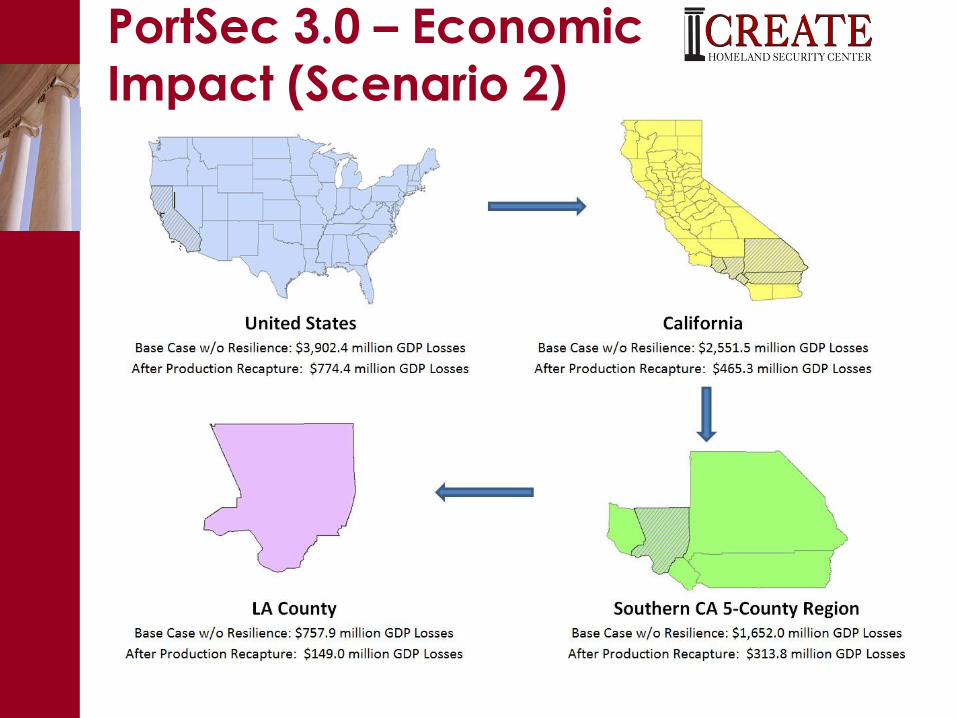
PortSec 3.0 – Economic
Impact (Scenario 2)
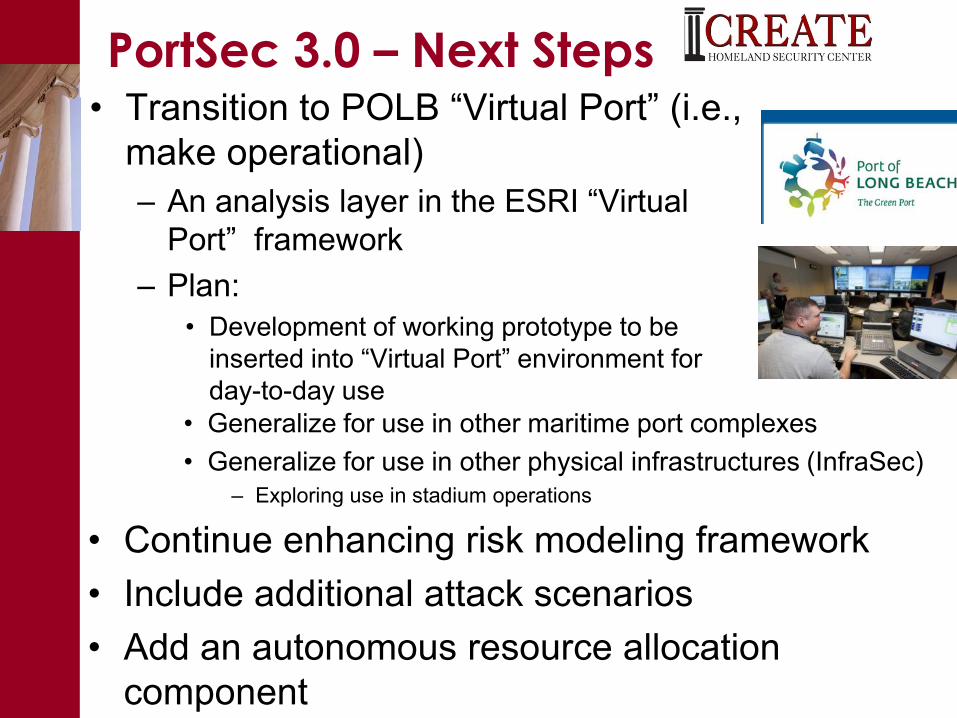
PortSec 3.0 – Next Steps • Transition to POLB “Virtual Port” (i.e.,
make operational)
– An analysis layer in the ESRI “Virtual
Port” framework
– Plan:
• Development of working prototype to be
inserted into “Virtual Port” environment for
day-to-day use
• Generalize for use in other maritime port complexes
• Generalize for use in other physical infrastructures (InfraSec)
– Exploring use in stadium operations
• Continue enhancing risk modeling framework
• Include additional attack scenarios
• Add an autonomous resource allocation
component
Questions ?
Photo Credit: POLA