hst/nicmos observations of the interacting system arp 299
TRANSCRIPT

NICMOS and the VLT
A New Era of High Resolution Near Infrared Imaging andSpectroscopy
An International Workshop held in Pula, Sardinia, ItalyMay 26-27, 1998
Edited by Wolfram Freudling and Richard HookPDF version by Norbert Pirzkal
ESO Conference and Workshop Proceedings No.55

EUROPEAN SOUTHERN OBSERVATORYKarl-Schwarzschild-Str. 2, D-85748 Garching, Germany
c Copyright 1998 by the European Southern ObservatoryISBN 3-923524-58-7
Cover Illustration:The background image used on the cover is taken from a photographby Bob Fosbury showing the bay in Sardinia close to where the conference took place.It is reproduced at far lower resolution than the original. The upper insert is one of theESO VLT firstlight images and is a true colour view of the core of the globular clusterMessier 4. It was constructed from 2 minute exposures taken on 22nd May 1998 andreaches a limiting B magnitude of about 24 in 0.53 arcsec seeing. More details of theVLT first light are given on page 2. The lower insert is taken from the paper of Peletieret al. (page 162) and shows multi-colour NICMOS/WFPC2 imaging of the bulges ofnearby galaxies. It is used by permission of the authors.

Contents iii
Contents
Preface . . . . . . . . . . . . . . . . . . . . . . . . . . . . . . . . . . . . . . viConference participants .. . . . . . . . . . . . . . . . . . . . . . . . . . . . viiConference photograph .. . . . . . . . . . . . . . . . . . . . . . . . . . . . x
Part 1. VLT Status and InstrumentsVLT First Light . . . . . . . . . . . . . . . . . . . . . . . . . . . . . . . . . . 2
ESO Representatives
Near IR Astronomy with the ESO VLT. . . . . . . . . . . . . . . . . . . . . . 6A. Moorwood
CONICA: The high resolution near-infrared camera for the ESO VLT. . . . . 10P. Bizenberger, R. Lenzen, H. Bellemann, C. Storz, A. Tusche, K. Wagner and R.Hofmann
Part 2. NICMOS Calibration and Analysis Software
The STScI NICMOS Calibration Pipeline . .. . . . . . . . . . . . . . . . . . 18H. Bushouse, C. Skinner, J. MacKenty, D. Axon and E. Stobie
Status and Goals of the NICMOS Calibration Plan . . . . . . . . . . . . . . . . 28L. Colina
Photometric Performance of NICMOS. . . . . . . . . . . . . . . . . . . . . . 36L. Colina, S. Holfeltz and C. Ritchie
The Photometric Performance of the NICMOS Grisms .. . . . . . . . . . . . 47W. Freudling and N. Pirzkal
ST-ECF Grism Spectrum Software for NICMOS Grism Data . . . . . . . . . . 54N. Pirzkal and W. Freudling
Imaging Polarimetry with NICMOS . . . . . . . . . . . . . . . . . . . . . . . 62D. C. Hines
Some Experiments with the Restoration of NICMOS Camera 2 Images of OMC-1 70R. N. Hook and S. R. Stolovy
NICMOS Software at the University of Arizona . . . . . . . . . . . . . . . . . 74E. Stobie, D. Lytle, I. Barg, and A. Ferro
STScI NICMOS Software. . . . . . . . . . . . . . . . . . . . . . . . . . . . . 82H. Bushouse
Part 3. NICMOS Science

Contents iv
NICMOS Coronagraphic Surveys-Preliminary Results . . . . . . . . . . . . . 86G. Schneider
A Coronagraphic Search for Substellar Companions to Young Stars. . . . . . . 94P. J. Lowrance, E. E. Becklin, G. Schneider, D. Hines, J. D. Kirkpatrick,D. Koerner, F. Low, D. McCarthy, R. Meier, M. Rieke, B. A. Smith, R. Terrile,R. Thompson, B. Zuckerman
The Stellar Population in the NICMOS Parallel Fields . .. . . . . . . . . . . . 100A. Pasquali, G. De Marchi and W. Freudling
The Evolution of Stars seen with ISOCAM - the Need for NICMOS and VLTFollow Up. . . . . . . . . . . . . . . . . . . . . . . . . . . . . . . . . 108
R. Siebenmorgen
Unusual H2 Emission near a Compact Source in Orion . . . . . . . . . . . . . 116M. Lindqvist and J. H. Black
HST NICMOS Observations of Circumstellar Matter Around CYG X-3 . . . . 121W. Schmutz, W. D. Vacca, L. Close, J. Rayner, T. R. Geballe, H. Schild andR. Walder
NICMOS Observes the Galactic Center . . . . . . . . . . . . . . . . . . . . . 131M. Rieke
NICMOS/HST H-band (F160W) Images of the 30 Dor Starburst Cluster . . . . 134H. Zinnecker and A. Moneti
The Formation and Evolution of LMC Rich Star Clusters: NGC 1818. . . . . 138R. A. Johnson, R. A. W. Elson, G. Gilmore, S. Beaulieu and N. R. Tanvir
A Color Analysis of NICMOS Parallel Observations . . . . . . . . . . . . . . 144M. R. Corbin, R. I. Thompson, E. Stobie and I. Barg
The Old Stellar Population of NGC 1569 from NICMOS data . . .. . . . . . . 152A. Aloisi, L. Origlia, M. Tosi, L. Greggio, M. Clampin, C. Leitherer, A. Nota andM. Sirianni
HST-NICMOS Observations of Galactic Bulges: Red Nuclei in Nearby Galaxies 159R. F. Peletier and M. Balcells
HST/NICMOS Observations of the Interacting System Arp 299 . . . . . . . . . 169A. Alonso-Herrero, M. J. Rieke and G. H. Rieke
NICMOS Camera 3 Parallel Imaging Observations: Number Counts, Sizes andRed Objects . . . . . . . . . . . . . . . . . . . . . . . . . . . . . . . . 178
P. McCarthy, L. Yan, L. Storrie-Lombardi and R. J. Weymann
The Structure and Composition of High Redshift Radio Galaxies .. . . . . . . 187R. A. E. Fosbury, J. Vernet, M. Villar-Mart´ın, M. H. Cohen, A. Cimatti, S. diSerego Alighieri, P. J. McCarthy
Investigating the Evolution of Quasar Host Galaxies with NICMOS . . . . . . 195M. J. Kukula, J. S. Dunlop, D. H. Hughes, L. Miller, C. P. O’Dea and S. A. Baum

Contents v
NICMOS Imaging of QSO Host Galaxies at 0.1< z< 4.4 . . . . . . . . . . . 203L. J. Storrie-Lombardi, R. J. Weymann, K. K. McLeod, G. H. Rieke, J. Hill, and V.Kulkarni
Limits on the Star Formation Rates ofz> 2 Damped Lyα Systems from Hα Spec-troscopy . . . . . . . . . . . . . . . . . . . . . . . . . . . . . . . . . . 204
A. J. Bunker, S. J. Warren, D. L. Clements, G. M. Williger and P. C. Hewett
Part 4. Future Technology
Design and Status of the NICMOS Cryocooler . . . . . . . . . . . . . . . . . . 210J. W. MacKenty and E. S. Cheng
2048 x 2048 HgCdTe Arrays for Astronomy at Visible and Infrared Wavelengths 218D. N. B. Hall
Author index . . . . . . . . . . . . . . . . . . . . . . . . . . . . . . . . . . . 230

vi
Preface
On May 26 & 27, 1998, about 50 participants met for the workshop “NICMOS andthe VLT” in Pula, Sardinia, Italy. The goal of the workshop was to review what hasbeen achieved with the Near Infrared and Multi Object Spectrograph (NICMOS) onboard of HST, what can be achieved in the remaining lifetime of the instrument, andhow NICMOS observations can be optimized taking into account the availability of IRimaging and spectroscopy on ESO’s Very Large Telescope (VLT) in the near future.The workshop took place at a time when the expected remaining lifetime of NICMOSwas about 7 months, and the first call for proposals for VLT was about 3 month away.The timeliness of the workshop was underlined by the fact that first light for the VLToccurred in the midst of this meeting, which has not been anticipated at the time the datefor the workshop was set. Also at the time of the workshop, the prospects for extendingthe lifetime of NICMOS through the installation of a cryo-cooler have improved enoughto warrant a serious consideration of this possibility. A technical expert presentation onthis topic was also given at the workshop and is published here.
Considerable NICMOS expertise was present through the participation of a largefraction of the the NICMOS IDT as well as the STScI and ST-ECF NICMOS groups.On the VLT side, the IR instrumentation was presented by the ESO head of IR instru-mentation and news of the VLT first light was brought directly from the ESO head-quarters in Garching. The presence of experts as well as the pleasant atmosphere of theworkshop fostered numerous discussions outside the formal program.
From the beginning, our plan was to publish proceedings of this workshop veryshortly after the workshop. The interesting and timely presentations given during themeeting strengthen the case for distributing them in written form as soon as possible.These proceedings will now be mailed less than two months after the workshop. Thisachievement was made possible by the cooperation of the authors who contributed tothis volume, the hard work of Britt Sjoeberg the workshop secretary, a fast cover designfrom Ed Janssen and help with the printing arrangements from Kurt Kj¨ar at ESO. TheAstronomical Society of the Pacific and Harry Payne at STScI also allowed us to usetheir LATEX style files and other software to ease the preparation of this volume. BobFosbury made available several beautiful high quality photographs of the meeting andits surroundings which appear within this volume and on the cover, although regret-tably in much poorer quality reproductions. Norbert Pirzkal provided invaluable helpin reformatting and checking some papers.
We would like to thank them all.
Garching, June 1998Wolfram Freudling (Workshop Chair) & Richard Hook (Principal Editor)

Participant List vii
Participant List
Alessandra Aloisi, Osservatorio Astronomico di Bologna, Via Zamboni 33, I-40126Bologna, Italy ([email protected])
Almudena Alonso-Herrero, University of Arizona, Steward Observatory, 933 N.Cherry Avenue, Tucson, AZ 85721, USA ([email protected])
Eric Becklin, University of California at Los Angeles, Astronomy and Astrophysics;Dept. of Physics, 405 Hilgard Ave., Los Angeles, CA 90095-1547, USA([email protected])
Piero Benvenuti, ST-ECF, Karl-Schwarzschild-Str. 2, D-85748 Garching, Germany([email protected])
Peter Bizenberger, Max-Planck-Institut f¨ur Astronomie, Konigstuhl 17, D-69117Heidelberg, Germany ([email protected])
John Black, Onsala Space Observatory, S-439 92 Onsala, Sweden([email protected])
Andrew Bunker, University of California at Berkeley, Department of Astronomy, 601Campbell Hall, Berkeley, CA 94720-3411, USA ([email protected])
Howard Bushouse, Space Telescope Science Institute, Science Software Group, 3700San Martin Drive, Baltimore, MD 21218, USA ([email protected])
Luis Colina, Space Telescope Science Institute, 3700 San Martin Drive, Baltimore,MD 21218, USA ([email protected])
Michael Corbin, University of Arizona, Steward Observatory, 933 N. Cherry Avenue,Tucson, AZ 85721-0065, USA ([email protected])
Guido De Marchi, European Southern Observatory, Science Office,Karl-Schwarzschild-Str. 2, D-85748 Garching, Germany ([email protected])
Nadine Dinshaw, University of California, Santa Cruz, Lick Observatory, Santa Cruz,CA 95064, USA ([email protected])
Christophe Dumas, Jet Propulsion Laboratory, MS 183-501, 4800 Oak Grove Drive,Pasadena, CA 91109, USA ([email protected])
Robert Fosbury, ST-ECF, Karl-Schwarzschild-Str. 2, D-85748 Garching, Germany([email protected])
Wolfram Freudling, ST-ECF, Karl-Schwarzschild-Str. 2, D-85748 Garching, Germany([email protected])
Donald Hall, University of Hawaii, Institute for Astronomy, 2680 Woodlawn Drive,Honolulu, HI 96822-1839, USA ([email protected])
John Hill, University of Arizona, Steward Observatory, 933 N. Cherry Avenue,Tucson, AZ 85721, USA ([email protected])
Dean C. Hines, University of Arizona, Steward Observatory, 933 N. Cherry Avenue,Tucson, AZ 85721, USA ([email protected])
Richard Hook, ST-ECF, Karl-Schwarzschild-Str. 2, D-85748 Garching, Germany([email protected])
Rachel Johnson, Institute of Astronomy, Madingley Road, Cambridge, CB3 0HA,United Kingdom ([email protected])
Marek Kukula, Space Telescope Science Institute, NICMOS / SSD, 3700 San MartinDrive, Baltimore, MD 21218, USA ([email protected])

Participant List viii
Michael Lindqvist, Onsala Space Observatory, S-439 92 Onsala, Sweden([email protected])
Patrick Lowrance, University of California at Los Angeles, Astronomy andAstrophysics; Dept. of Physics, 405 Hilgard Ave., Los Angeles, CA 90024,USA ([email protected])
John MacKenty, Space Telescope Science Institute, Science Support Division /NICMOS Group, 3700 San Martin Drive, Baltimore, MD 21218, USA([email protected])
Juan-Manuel Mart´ın-Fleitas, GTC Project, Via Lactea, s/n, E-38200 La Laguna, Spain([email protected])
Patrick McCarthy, Carnegie Institution of Washington, The Observatories, 813 SantaBarbara Street, Pasadena, CA 91101, USA ([email protected])
Roland Meier, University of Hawaii, Institute for Astronomy, 2680 Woodlawn Drive,Honolulu, HI 96822, USA ([email protected])
Alan Moorwood, European Southern Observatory, Infrared Instruments and Detectors,Karl-Schwarzschild-Str. 2, D-85748 Garching, Germany ([email protected])
Anna Pasquali, ST-ECF, Karl-Schwarzschild-Str. 2, D-85748 Garching, Germany([email protected])
Reynier Peletier, University of Durham, Department of Physics, South Road, Durham,DH1 3LE, United Kingdom ([email protected])
Norbert Pirzkal, ST-ECF, Karl-Schwarzschild-Str. 2, D-85748 Garching, Germany([email protected])
Marcia Rieke, University of Arizona, Steward Observatory, 933 N. Cherry Avenue,Tucson, AZ 85721, USA ([email protected])
Werner Schmutz, ETH Z¨urich, Institut fur Astronomie, CH-8092 Z¨urich, Switzerland([email protected])
Glenn Schneider, University of Arizona, Steward Observatory, 933 N. Cherry Avenue,Tucson, AZ 85721-0065, USA ([email protected])
Ethan Schreier, Space Telescope Science Institute, 3700 San Martin Drive, Baltimore,MD 21218, USA ([email protected])
Nick Scoville, California Institute of Technology, Astronomy 105-24, Pasadena, CA91125, USA ([email protected])
Ralf Siebenmorgen, ESA Satellite Tracking Station, Infrared Space Observatory,Villafranca del Castillo; P.O. Box 50727, E-28080 Madrid, Spain([email protected])
David Silva, European Southern Observatory, Data Management and Operations,Karl-Schwarzschild-Str. 2, D-85748 Garching, Germany ([email protected])
Bradford Smith, University of Hawaii, Institute for Astronomy, 82-6012 Pu’uhonuaRoad, Napo’opo’o, HI 96704-8226, USA ([email protected])
William Sparks, Space Telescope Science Institute, NICMOS / SSD, 3700 San MartinDrive, Baltimore, MD 21218, USA ([email protected])
Elizabeth Stobie, University of Arizona, Steward Observatory, 933 N. Cherry Avenue,Tucson, AZ 85721, USA ([email protected])
Susan Stolovy, University of Arizona, Steward Observatory, 933 N. Cherry Avenue,Tucson, AZ 85721, USA ([email protected])

Participant List ix
Lisa Storrie-Lombardi, Carnegie Observatories, 813 Santa Barbara St., Pasadena, CA91101, USA ([email protected])
Richard Terrile, Jet Propulsion Lab., Earth and Space Science, Mail Stop 183-501,Pasadena, CA 91109, USA ([email protected])
Rodger Thompson, University of Arizona, Steward Observatory, Tucson, AZ 85721,USA ([email protected])
Ray Weymann, Carnegie Institution, Observatories, 813 Santa Barbara Street,Pasadena, CA 91101, USA ([email protected])
Hans Zinnecker, Astrophysikalisches Institut Potsdam, An der Sternwarte 16,D-14482 Potsdam-Babelsberg, Germany ([email protected])

Conference Photographs x

Conference Photographs xi

Conference Photographs xii
Figure 1. Some of the participants enjoying the relaxed Mediterranean at-mosphere

Part 1. VLT Status and Instruments

NICMOSand theVLTPula, Sardinia, May 26-27th 1998Wolfram Freudling and Richard Hook, eds.
VLT First Light
Abstract. First light for the ESO VLT unit telescope 1 occurred during theworkshop. David Silva, head of the ESO user support, brought the news andassociated press release information directly from ESO headquarters in Garch-ing. Someof theESO pressreleaseswhich demonstrate theworking of theVLTUT1 are reprinted here.
1. Omega Centauri Tracking Test
Omega Centauri is the most luminous globular cluster in our Galaxy. As the name in-dicates, it is located in thesouthern constellation Centaurus and is therefore observableonly from the south.
The imageshown (Figure 1) herewasobtained with theVLT on May 16, 1998, inred light (R band), i.e. while the mirror was still uncoated. It is a10-minute exposureof the center of Omega Centauri and it demonstrates that the telescope is able to trackcontinuously with a very high precision and thus is able to take full advantage of thefrequent, very good atmospheric conditions at Paranal. Theimagesof thestarsareverysharp (full-width-at-half-maximum (FWHM) = 0.43 arcsec) and are perfectly round,everywhere in the field. This indicates that the tracking was accurate to better than0.001 arcsec/sec during this observation.
At adistance of about 17,000 light years, this cluster isbarely visible to thenakedeye as a very faint and small cloud. When OmegaCentauri is observed through a tele-scope, even a small one, it looks like a huge swarm of numerous stars, bound togetherby their mutual gravitational attraction.
Most globular clusters in our Galaxy have masses of the order of 100,000 timesthat of theSun. With atotal massequal to about 5million solar masses, OmegaCentauriis by far the most massive of its kind in our Galaxy.
2. Image Quality of theVLT
Superb image quality is the prime requirement for the VLT. The VLT should take fulladvantage of the exceptionally good “seeing” conditions of the Paranal site, i.e. mo-ments of a particularly stable atmosphere above the site, with a minimum of air turbu-lence.
In thisdiagram (Figure2), themeasured imagequality of theVLT UT1 astronom-ical images is plotted versus the “seeing”, as measured by the Seeing Monitor, a smalltelescope also located on top of the Paranal Mountain.
2

The ESO VLT First Light 3
Figure 1. Omega Centauri Tracking Test
The dashed line shows the image quality requirement, as specified for the VLT atFirst Light. The dotted line shows the specification for the image quality, three yearsafter First Light, when the VLT will be fully optimized. The fully drawn line representsthe physical limit, when no further image distortion is added by the telescope to thatintroduced by the atmosphere.
The diagram demonstrates that First Light specifications have been fully achievedand, impressively, that the actual VLT performance is sometimes already within themore stringent specifications expected to be fulfilled only three years from now.
Various effects contribute to degrade the image quality of a telescope as comparedto the local seeing, and must be kept to a minimum in order to achieve the best scientificresults. These include imperfections in the telescope optical mirrors and in the telescopemotion to compensate for Earth rotation during an exposure, as well as air turbulencegenerated by the telescope itself. The tight specifications shown in this figure translateinto very stringent requirements concerning the quality of all optical surfaces, the activecontrol of the 8.2-m mirror, the accuracy of the telescope motions, and, in the nearfuture, the fast “tip-tilt” compensations provided by the secondary mirror, and finallythe thermal control of the telescope and the entire enclosure.
The only way to achieve an image quality that is “better than that of the atmo-sphere” is by the use of Adaptive Optics devices that compensate for the atmosphericdistortions. One such device will be operative on the VLT by the year 2000, then al-lowing astronomers to obtain images as sharp as about 0.1 arcsec.

The ESO VLT First Light 4
In this diagram, both seeing and telescope image quality are measured as the full-width-at-half-maximum (FWHM) of the light-intensity profile of a point-like source.The uncertainty of the measurements is indicated by the cross in the lower right corner.
Figure 2. Image Quality of the VLT
3. Total Optical Control
The VLT active optics system fully controls the primary and secondary mirrors. Infigure 3, images of stars are shown that were obtained during tests in which the controlsystem forced the optical elements to produce three different image aberrations, namelytriangular, round (defocus) and linear (astigmatism). This is done by applying differentforces to each of the 150 individual active actuators on which the 8.2-m main mirrorrests and to the position of the secondary mirror. In the case of the triangular aberration,the mirror was made to resemble Napoleon’s hat. It is worth noting that the deviationof the mirror from its optimum shape is only 0.015 millimeters.
The great power of this system is demonstrated by the fact that the resulting stellarimages can take on (nearly) any desired form. The optical system is also consistentlybrought back to its optimal form, producing the sharp images of a real star, shown inthe lower row.

The ESO VLT First Light 5
Figure 3. Total Optical Control
The control of the two mirrors is such that no significant aberrations remain afterthe corrections are applied. The accuracy of the control of shape of the primary mirrorresults in an average error of order 0.00005 millimeters. The telescope is only limitedby the Earth’s atmosphere. In space, the optical quality of the mirrors under activecontrol could be diffraction limited.

NICMOS and the VLTPula, Sardinia, May 26-27th 1998Wolfram Freudling and Richard Hook, eds.
Near IR Astronomy with the ESO VLT
Alan MoorwoodEuropean Southern Observatory, Karl-Schwarzschild-Str. 2, D-85748Garching
Abstract. The ESO VLT situated on Cerro Paranal in Chile comprises four8.2m plus three 1.8m movable auxiliary telescopes providing 8 Nasmyth, 4Cassegrain, and 1 incoherent combined focus plus a variety of interferomet-ric options. First light was achieved with the first unit telescope (UT1) on 25thMay 1998 with results which fully demonstrate the quality of both the telescopeand the site. Six infrared instruments for the unit telescope foci plus three forinterferometry are at various phases of design and development. Together, theyprovide for direct imaging in wide fields; diffraction limited imaging with adap-tive optics and interferometry; polarimetry; long slit, multi-object and integralfield spectroscopy at resolving powers ranging from a few hundred to 105. Thestatus and expected capabilities of these instruments is summarized togetherwith a brief overview of the highest priority science goals which can be antici-pated now.
1. Introduction and Overview
ESO’s VLT situated on Cerro Paranal in Chile comprises four 8.2m plus three 1.8mmoveable auxiliary telescopes. In addition, the site will host a 2.5m wide field surveytelescope to be built by the Capodimonte Observatory, Naples and operated by ESO.The site is dry; photometric more than 80% of the time and delivers a median seeingof 0.65 arcsec. The small telescopes can be combined with each other optically toform the VISA interferometer or with the large telescopes to form VIMA. The largetelescopes can also be incoherently combined. Each of the large telescopes providestwo Nasmyth and a Cassegrain focus. Of these twelve foci, eleven are planned tobe equipped with ’common user’ instruments and one will be reserved for innovativevisitor instruments. UT1 will be equipped with a laser guide star system plus the NAOSShack-Hartman adaptive optics system used with CONICA and the MACAO curvaturesensing AO system to be used with SINFONI (and later interferometry and possiblyCRIRES). Of the main instruments, three (ISAAC,UVES and CRIRES) plus MACAOare being developed by ESO and the rest by consortia of mostly, but not exclusively(e.g Australia is producing a fibre positioning unit) European Institutes. In the caseof externally contracted instruments, ESO generally covers the capital cost while theInstitutes provide manpower and expertise in exchange for guaranteed observing time.Even in the case of the subcontracted instruments, however, ESO is usually involved inthe design and provides most of the detectors and part of the instrument control systems.
Current status of the project is that first light of the first 8.2m Unit Telescope wasachieved on 25th May 1998. The FWHM' 0.32” visible images obtained and shownat this Workshop clearly demonstrate the excellent quality of both the telescope andthe site. Science Verification with a visible test camera is planned for the second half
6

Near IR Astronomy with the ESO VLT 7
of August after which the first major instrument, FORS ( visible imaging, polarime-try, spectroscopy and MOS spectroscopy) will be installed. The first IR instrument,ISAAC (1-5µm imaging, polarimetry and spectroscopy), which has been built at ESO,will be installed in November 1998. Both of these instruments will be finally commis-sioned and used for Science Verification observations in early 1999 and made availableto visiting astronomers in April 1999. With regard to the regular operation of the VLTit should be noted that ESO is also developing a complete data flow system compris-ing instrument simulators, software for pre-preparing observation/instrument sequencesin the form of Observation Blocks, flexible scheduling software, data and calibrationpipelines and an archive. At the beginning it is expected that about 50% of the observ-ing will be performed by ESO in service mode and the rest with the visiting astronomerpresent at the Observatory.
For those interested, more comprehensive information on the VLT and its instru-ments can be found on ESO’s Web Site (http://www.eso.org/instruments/).
2. Infrared instruments for the VLT
2.1. Instrument Summary
The already approved infrared instruments for the VLT are:ISAAC: 1-5µm Infrared Spectrometer and Array Camera (P.I. A. Moorwood, ESO)which is currently undergoing final testing in Garching prior to shipment to Paranalin June for installation at UT1 in Nov 1998. A derivative 1-2.5µm instrument, SOFI,is already in operation at the 3.5m NTT telescope on La Silla (Moorwood, Cuby andLidman, 1998, The Messenger, 91,9).CONICA: Coude Near Infrared Camera (P.I. R. Lenzen, MPIA, Heidelberg) - an his-torical name as this instrument will be used for diffraction limited 1-5µm imaging,polarimetry and spectroscopy with the NAOS, Nasmyth Adaptive Optics System onUT1 (P.I. G. Rousset, ONERA ). The two systems will be integrated in Europe in late1999 and installed at the VLT in mid-2000.SINFONI: Single Far Object Near IR Investigation (P.I. N. Thatte, MPIE, Garching)which will be used with the ESO developed MACAO AO system (P.I. D. Bonaccini,ESO) for integral field spectroscopy. SINFONI will be used by the MPIE first at CalarAlto and then transferred to the VLT in 2001.NIRMOS: Near IR Multi-Object Spectrometer (P.I. O. Le F`evre, LAS. Marseille ) for1-1.8µm wide field imaging and spectroscopy at R' 2500 of up to 170 objects simul-taneously. This instrument is in the detailed design phase together with its twin visibleinstrument VIMOS. It will be installed in 2001.CRIRES: Cryogenic IR Echelle Spectrometer (P.I. G. Wiedemann, ESO) for very high(105) resolution IR spectroscopy, probably in combination with a MACAO type curva-ture sensing AO system. Is in detailed design phase and with aim of exploiting manyof the ISAAC technical developments. To be installed in 2002.VISIR: VLT Mid Infrared Imager Spectrometer (P.I. P.-O. Lagage, SAp, Saclay) for8-27µm imaging and spectroscopy.
A brief overview of the main instrumental modes is given in Table 1. Taken to-gether, they cover a large fraction of the spatial and spectral resolution phase space with

Near IR Astronomy with the ESO VLT 8
multi-object and integral field capabilities entering as major new modes opened up withthe development of large format IR array detectors.
Table 1. VLT Infrared Instrument Modes
Name λλµm Pixel(“) Field Spectroscopy MOS
ISAAC 1-5 0.07-0.5 2.5x2.5’ 300-5000 -CONICA 1-5 0.014 - 0.1 73” dia 300-1800 -NIRMOS 1-1.8 0.2 14x14’ 2500 170SINFONI 1-2.5 0.035-0.25 10” 2500/6000 int. fieldCRIRES 1-5 0.1 NA 105 noVISIR 8-27 0.075 - 0.2 1x1’ 100 - 2 104 no
In addition, three interferometric instruments are at the conceptual design stage -AMBER (1-2.5µm imaging/spectroscopy), MIDI(8-13µm) and PRIMA (2-5µm phasereferenced imaging and astrometry).
2.2. IR Detectors
The infrared detectors to be used in the different instruments are summarized below.
Rockwell 1-2.5µm 1024x1024 Hawaii (ISAAC, SINFONI)
Rockwell 1-2.5µm 2048x2048 funded by University of Hawaii, SUBARU andESO (4 in NIRMOS)
SBRC 1-5µm 256x256 (ISAAC)
SBRC 1-5µm 1024x1024 Aladdin (CONICA, ISAAC, 2-3 in CRIRES)
SBRC 8-27µm 240x340 (VISIR)In all cases, the IRACE acquisition system, developed by ESO initially for ISAAC
will probably be used. It is a modular (nominally 32 channel) high speed (20 Mpix/s),low noise (limited by detector) system employing a GByte/sec link and an Ultrasparcprocessor for image pre-processing (Meyer et al., 1997, The Messenger, 86, 14). Al-though most modes will be background limited, it is expected that some modes involv-ing the highest spatial and spectral resolution in the near infrared will reach the limitsset by the intrinsic detector noise and dark current which are now at the incredible levelof only a few e and around 20e/hour respectively as measured on Rockwell Hawaiiarrays with IRACE.
2.3. Performance
It is beyond the scope of this article to reproduce the expected performance of all theinstruments in all their modes. Typically, however, background limited imaging inthe near infrared is expected to reach point source 3σ limits in 1 hr of around J =25. H = 24 , Ks = 23 under the best seeing condition, and up to about 2 magnitudesfainter at the diffraction limit with AO. Continuum limits for medium resolution (R'3000) spectroscopy are expected to be in the range 20-22 mag. but strongly wavelength

Near IR Astronomy with the ESO VLT 9
dependent due to the OH sky lines. At this resolving power, however, a large fractionof the J and H bands can be observed between the strong OH lines allowing 1 hr lineflux limits of a few x 1018 erg cm2 s1.
3. Science
The combined instrument complement of the VLT provides for a wide range of visibleand infrared capabilities from deep imaging and spectroscopic surveys to high spa-tial and spectral resolution observations of individual objects using adaptive optics andinterferometry. Science objectives are therefore expected to embrace much of contem-porary astronomy and the following is only a brief summary of some of the currentlyenvisaged science areas in which infrared observations are expected to be of particularimportance.Large scale structure.Surveys for high z clusters and evolution of structures at z 3.Measurement of dynamics to constrain the formation epoch and distortions in the ex-pansion field to map dark matter and the total mass density of the Universe. (NIRMOS,ISAAC).Cosmological parameters.Distances from Cepheids and relative distances from fun-damental plane and Tully - Fisher scaling relations and supernovae. Time delay ingravitationally lensed quasars. Refine values for H0, q0 andΛ (CONICA, SINFONI,ISAAC).High redshift galaxies.Galaxy formation and evolution. Photometric redshift (in com-bination with visible) and emission line surveys (Lyα, Hα, [OII]) plus follow-up spec-troscopy to determine star formation rate as a function of z, size, morphology, mass(ISAAC, NIRMOS, CONICA, SINFONI).Gamma-ray bursts. Spectroscopy of optical counterparts (ISAAC, CONICA, SIN-FONI).Galaxy nuclei. Stellar populations/dynamics. Black hole masses. Test unified AGNtheories. Quasar host galaxies. (CONICA, SINFONI, VISIR, VLTI).Stars. Abundances, circumstellar shells, mass loss, magnetic fields (CRIRES, VISIR).Star formation. Measure IMF to lowest masses in star forming clusters. Outflows anddynamics of protostellar discs (ISAAC, CONICA, SINFONI, CRIRES, VISIR).Extrasolar planets. Direct detection by imaging and/or velocity modulation of plane-tary spectral features (CRIRES, CONICA, VISIR, VLTI).Protoplanetary systems.Thermal imaging of protoplanetary discs (VISIR, CONICA,VLTI).Solar system.Composition and dynamics of planetary atmospheres. Detection, chem-istry and mineralogy of faint outer solar system bodies (ISAAC, CONICA, SINFONI,VISIR).

NICMOS and the VLTPula, Sardinia, May 26-27th 1998Wolfram Freudling and Richard Hook, eds.
CONICA: The high resolution near-infrared camera for the ESOVLT
Peter Bizenberger, Rainer Lenzen, Heinrich Bellemann, Clemens Storz,Andreas Tusche, Karl Wagner
Max-Planck-Institut fur Astronomie Konigstuhl 17, 69117 Heidelberg,Germany
Reiner HofmannMax-Planck-Institut fur Extraterrestrische Physik Gießenbachstr., 85748Garching, Germany
Abstract. The high resolution near infrared camera (CONICA) for the firstVLT unit telescope is under development. It serves as a multi-mode instrumentfor the wavelength region between 1.0 and 5.0 microns, providing diffraction-limited spatial resolution when combined with the adaptive optic system NAOSof the VLT (Rosset et al. 1998). CONICA offers broad band, narrow bandand Fabry-Perot direct imaging capabilities, polarimetric modes using Wollas-ton prisms or wire-grid analyzers, as well as long-slit spectroscopy up to a spec-tral resolution of R 2400 per pixel. This paper describes the design and statusof CONICA, focusing on the cryo-mechanics and optical performance and theresulting observational capabilities.
1. Introduction
The CONICA infrared camera is being built for diffraction limited observations in thespectral range from 1 - 5µm. This camera is for use on the first unit of the VLT (ESO)and is built by a consortium of two institutes, the MPI f¨ur Astronomie (Heidelberg) andthe MPI fur Extraterrestrische Physik (Garching) with additional assistance from ESO.Combined with an adaptive optics system (NAOS) CONICA will offer diffraction-limited observing capabilities at an 8 m telescope. These capabilities include directimaging, imaging spectroscopy, long slit spectroscopy and imaging polarimetry. Theoptics and cryo-mechanics are designed for implementation of an ALADDIN 1024 x1024 InSb focal plan array (FPA). The imaging scale can be adapted for correct sam-pling of the wavelength dependent diffraction limited beam between about 14 and 55mas/pixel, corresponding to fields of view between 14x14 and 56x56 arcsec respec-tively. The instrument will be completely remote controlled. The general design ofCONICA has been presented in earlier publications (Lenzen & Hofmann 1995; Lenzenet al. 1998b), so this paper concentrates on the optical and cryo-mechanical design andthe resulting observational capabilities.
10

CONICA: The High Resolution Near-IR Camera for the VLT 11
Figure 1. Overview of all CONICA camera systems
2. Design of Imaging Optics
In order to provide an double-sampling over the wavelength band from 1 - 5µm, theimaging scale is designed to be variable. Three discrete image scales (13, 27 and 55mas/pixel) sample the wavelengths of interest. These optics are designed to illuminatea 1024 x 1024 array with 27µm pixel pitch without vignetting. A fourth set of cameraoptics is available for a larger pixel scale of about 110 mas/pixel which leads to a fieldof view of about 73 arcsec in diameter. For each scale (except the slowest camera)the camera systems are split in two wavelength regions, one for 1.0 - 2.5µm and a

CONICA: The High Resolution Near-IR Camera for the VLT 12
second for 2.0 - 5.0µm. Thus, there are seven imaging systems in total, all of whichcan be used within the K-band (Figure 1). The complete imaging optics are realizedas a re-imaging system. Inside the cryostat, just behind the plane-parallel CaF2 en-trance window, lies the instrument focal plane. A number of field-limiting masks, slits,coronographic masks or special stripe masks for Wollaston applications can be insertedhere. The beam is then collimated by an achromatic LiF/BaF2 doublet giving a wellcollimated beam and a pupil image all over the wavelength region. Residual chromaticerrors are compensated by the individual camera systems. Even though the whole opti-cal system is achromatic, the detector position in the back focal plane of the optics canbe remotely adjusted during operation.
3. Analyzing Optics
CONICA can take 40 filters (1 inch diameter), mounted close to the pupil position.A set of standard broad-band filters, as well as 15 individual narrow band filters areavailable. In addition, there is a set of blocking filters for the Fabry-Perot. All filters liebehind the pupil, so there is no shift of the pupil image due to different filter thickness.All filters are tilted by 6 degrees to avoid ghost images.
A cryogenic Fabry-Perot can be inserted into the collimated beam, giving spectro-scopic imaging for all available imaging scales at a spectral resolution R 1800 withinthe K-band.
At present, three grisms of medium resolution R 350 - 2400 per pixel allowlong-slit spectroscopy with diffraction limited spatial resolution. An additional grismis on order to cover the whole range of resolution for all wavelengths. Two of the grismsare direct ruled KRS5 for operation at longer wavelengths (up to 5µm). The remainingtwo grisms are replica grisms for the wavelength range from 1.0 - 2.5µm (Table 1)
For polarimetric applications two Wollaston prisms and four wire-grid analysersare mounted. Both types of analyzers are suitable for the whole wavelength range.
In front of the cooled camera, a tunable atmospheric dispersion compensator (TADC)at ambient temperature corrects the chromatic dispersion of the atmosphere for higherairmasses. Particularly for the J band a correction is essential, since the dispersion at anairmass of 2 is at the order of the diffraction limited FWHM at this wavelengths. Forlonger wavelengths, this effect is negligible, allowing the TADC to operate at ambienttemperature.
All these analyzing components have been tested in an instrument very similar toCONICA. Since autumn 1997, an infrared camera called Omega Cass (Lenzen et al.1998a) has been available at the 3.5 m telescope on Calar Alto in Spain. Omega Cass isequipped with the same capabilities as CONICA, including the adaptive optic systemALFA (Hippler et al. 1998). The only difference to CONICA is the smaller telescopeand the reduced operating wavelength range of 1.0 - 2.5µm of the HgCdTe detectorarray.
4. Cryo-mechanical Design
Since CONICA will be sensitive up to the thermal NIR region of 5.0µm the wholeimaging and analyzing optics are cooled below 80 K (except the TADC). The radiationshield and the internal cryogenic structure are thermally coupled to the first stage of a

CONICA: The High Resolution Near-IR Camera for the VLT 13
Figure 2. Overview of the CONICA cryo-mechanical design.

CONICA: The High Resolution Near-IR Camera for the VLT 14
Figure 3. CONICA and Mr. B¨ohm. The dewar is mounted on the interfaceflange to NAOS.

CONICA: The High Resolution Near-IR Camera for the VLT 15
Table 1. Wavelength ranges and resolution of the CONICA grisms. Data for the 55mas/pixel camera.
Grism No. Order λ0[µm] R @λ0 wavelength comment[1/pixel] range [µm]
1 2 3.25 349-975 1.72 - 4.80 direct ruled3 2.18 ” 1.16 - 3.21 KRS54 1.65 ” 0.90 - 2.42
2 1 4.00 1496 - 2460 3.04 - 5.00 direct ruled2 2.02 ” 1.54 - 2.51 KRS53 1.36 ” 1.04 - 1.69
3 2 2.30 1544 - 2426 1.80 - 2.5 replica3 1.56 ” 1.23 - 1.924 1.18 ” 0.93 - 1.45
4 1 1.80 416 - 1374 0.84 - 2.5 replica2 0.92 ” 0.44 - 1.41
two-stage Gifford-McMahon closed cycle cooler. As the environmental temperature ofthe detector array can determine instrumental sensitivity (particularly for spectral appli-cations), special care has been taken to reach temperatures below 80 K for all surfaceswhich are directly seen by the detector. Finite element analysis has been performed tocheck the expected temperature distributions.
The array itself is thermally coupled to the second stage of the closed cycle cooler.The operation temperature can be stabilized at any value between 30 K and 40 K. Theoptimum operating temperature for the InSb detector is expected to be 35 K. Thetypical cool down process has been tested and stabilized conditions can be reachedwithin less than 24 hours. This relatively short time is achieved by floating a tubesystem surrounding the radiation shield with liquid nitrogen.
CONICA uses a cold shutter for integration times shorter than the frame read timeof about 50 ms and for seeing selection in case bad seeing disrupts the NAOS imagequality during long integrations. For the shutter drive, a modified magnetic head driveof a hard disk unit is used. This system works at LN2 temperatures and allows beamswitching within a few milliseconds and repeat rates of more than 10 Hz. It is drivenby newly-developed electronics which are controlled by one command bit and producecurrent pulses to accelerate and decelerate the shutter arm. Figure 2 shows a schematicof the dewar and mounting flange. Figure 3 is an image of the first integration of thedewar and mounting flange with the head of our workshop as a scale.
5. Performance
Table 2 shows the calculated limiting magnitudes of point sources for 3σ in one hourintegration time, assuming a Strehl ratio of 70 % down to a wavelength of 2.0µmand a total efficiency of 65 % including telescope, optics, filter and detector. NAOSis calculated with 100 % throughput since no other numbers are known yet. The R =50 row in the table represents narrow band imaging. R = 500 is an indicator for thedetection limits in spectroscopy mode, but these numbers vary for other resolutions.The R = 1800 is for the Fabry-Perot mode which is only available in the K band.

CONICA: The High Resolution Near-IR Camera for the VLT 16
Table 2. Limiting magnitudes for CONICA.
Band J H K L MScale [mas/pixel] 13.6 13.6 27.2 27.2 54.6
BB imaging 26.9 25.7 25.0 19.9 16.7R = 50 25.2 24.3 23.3 18.5 15.6R = 500 23.7 22.8 21.7 17.2 14.5R = 1800 - - 19.7 - 18.8 - -
Acknowledgments. We are grateful to the ESO staff members who have been in-volved in developing components for CONICA.
References
Hippler S., Glindemann A., Rohloff R., Wagner K., “ALFA: The MPIA adaptive opticssystem with lasers for astronomy project”, in Infrared Detectors and Instrumen-tation for Astronomy, A.M. Fowler, ed. Proc. SPIE 3353-33, 1998
Lenzen R., Bizenberger P., Salm N., Storz C., “Omega Cass: A new multi-mode NIR-imager/spectrometer for Calar Alto”, in Infrared Detectors and Instrumentationfor Astronomy, A.M. Fowler, ed. Proc. SPIE 3354-33, 1998a
Lenzen R., Hoffmann R., “Status of the high resolution near infrared camera CONICAfor the VLT (ESO)”, in Infrared Detectors and Instrumentation for Astronomy,A.M. Fowler, ed. , Proc. SPIE 2475 pp. 268-278, 1995
Lenzen R., Hoffmann R., Bizenberger P., Tusche A., “CONICA: The high resolutionnear-infrared camera for the ESO VLT”, in Infrared Detectors and Instrumenta-tion for Astronomy, A.M. Fowler, ed. Proc. SPIE 3354-44, 1998b
Rosset G., Lacombe F., Puget P., Hubin N., Gendron E., Madec P., Rabud D., ConanJ., Mouillet D., Lagange A., Rigaut F., “Design of the Nasmyth adaptive op-tics system (NAOS) of the VLT”, in Infrared Detectors and Instrumentation forAstronomy, A.M. Fowler, ed. Proc. SPIE 3353-26, 1998

Part 2. NICMOS Calibration and Analysis Software

NICMOS and the VLTPula, Sardinia, May 26-27th 1998Wolfram Freudling and Richard Hook, eds.
The STScI NICMOS Calibration Pipeline
H. Bushouse, C. Skinner, J. MacKenty, and D. Axon
Space Telescope Science Institute, 3700 San Martin Drive, Baltimore, MD21218, Email: [email protected]
E. Stobie
U. of Arizona, Steward Observatory, Tucson, AZ 85721
Abstract. The Space Telescope Science Institute (STScI) data reduction andcalibration pipeline for the Near-Infrared Camera and Multi-Object Spectrom-eter (NICMOS) is composed of two major tasks, CALNICA and CALNICB.CALNICA applies instrumental calibration to all images, while CALNICB ap-plies specialized processing to sets of images associated with a single astronom-ical target. This paper describes some of the technical aspects of the NICMOSdata file formats, the CALNICA and CALNICB software, as well as details andexamples of the processing that these tasks perform.
1. Introduction
The STScI NICMOS calibration pipeline is composed of two major tasks, CALNICAand CALNICB. CALNICA applies instrumental calibration to all images and includesbasic corrections such as dark current subtraction, detector non-linearity correction,and flat-fielding. CALNICA operates on one image at a time. It takes as input theraw science data files produced by the Generic Conversion process in the STScI OPUSenvironment. Its outputs are fully calibrated files and, for MultiAccum observationsonly, an intermediate calibrated file.
CALNICB is only applied to associated NICMOS observations and is executedafter all images in an association have first been calibrated with CALNICA. CALNICBcombines images into mosaics and also removes background signal from the images. Itsinputs are an association table, which contains information about the images in the as-sociation, and the calibrated images produced by CALNICA. Its outputs are an updatedversion of the association table and background-subtracted mosaic images, producedby combining the associated input images.
2. CALNICA/CALNICB Common Features
Both CALNICA and CALNICB are built as host-level tasks and can therefore be ex-ecuted directly from the host operating system level (e.g. Unix or VMS), or they canbe executed from within the IRAF environment in the STSDAShst calib.nicmospackage. The tasks are completely data driven in that they derive all information thatis necessary to guide the processing from values of the input image header keywords
18

The STScI NICMOS Calibration Pipeline 19
and, in the case of CALNICB, the association table. Some user-setable parameters areavailable for tailoring reprocessing efforts. These parameters use default values whenoperating in the OPUS pipeline.
The run-time file format for all data I/O is FITS files with IMAGE and BINTABLEextensions. All NICMOS images are represented by five data arrays, stored as five IM-AGE extensions in a single FITS file. The group of five data arrays is known as animage set, or “imset”. MultiAccum-mode exposures, which produce multiple interme-diate detector readouts during the course of an exposure, have multiple imsets stored inthe FITS files. Each imset is comprised of the science image (extension name “SCI”),a statistical error image (“ERR”), a data quality flag array (“DQ”), an array giving thenumber of data samples at each pixel (“SAMP”), and an exposure time per pixel array(“TIME”).
All input and output files conform to the same file structure and organization,which allows output files to be reused as input if desired. All data processing stepsinvolving reference data (e.g. dark and flat-field images) propagate statistical uncer-tainties from the ERR arrays and data quality flags from the DQ arrays of the referencedata into the science data being processed. Furthermore, all steps involving imagecombination propagate the number of samples (SAMP) and their total exposure time(TIME) used to compute each resulting science (SCI) image value.
3. CALNICA Processing
The overall flow of CALNICA processing is shown in Figure 1. Included in this figureare the names of the image header keywords that are read by CALNICA to determinethe names of reference files (left column) and the names of the keyword “switches”used to turn each step on or off.
CALNICA applies basic instrumental calibrations to individual NICMOS obser-vations. For MultiAccum-mode observations, the processing steps are repeated foreach imset in the input file. The most significant calibration steps are the subtraction ofdark current, correction for non-linear photometric response, and correction for pixel-to-pixel gain variations (flat-fielding). MultiAccum-mode observations receive somespecialized processing, including correction for source signal present in the initial or“zeroth” detector readout, subtraction of the zeroth readout from all subsequent read-outs, and combination of the multiple readouts into a single image, which includescosmic-ray and bad pixel rejection. Details of some of these steps are discussed be-low. For details regarding all of the individual processing steps see Bushouse (1997a,1997b).
3.1. Dark Current Subtraction
The subtraction of dark current is a critical step in processing NICMOS data because itactually includes corrections for several instrumental effects (see Skinner, Bergeron, &Daou 1997; Bergeron & Skinner 1997). The actual detector dark current is quite smallfor all three NICMOS cameras, being at most 0.05 e/sec. There are two other muchlarger instrumental signatures superimposed on the darks. The first is a bias level orDC offset which exhibits a signal gradient across each quadrant of an image. This isthe so-called “shading”, which is a noiseless signal than can reach levels of tens or evenhundreds of DN (data numbers). The other effect is known as amp glow and appearsas an elevated signal in the corners of NICMOS images. This signal is due to a small

The STScI NICMOS Calibration Pipeline 20
BIASCORR
MASKCORR
NOISCALC
DARKCORR
NLINCORR
FLATCORR
UNITCORR
PHOTCALC
CalibratedOutput Files
KeywordSwitches
ProcessingSteps
InputFiles
Mask Bad Pixels
ZSIGCORR
Convert to Countrates
Flat Field Correction
Linearity Correction
Dark Current Subtraction
Compute Statistical Errors
Wrapped Pixel Correction
Photometric Calibration
Cosmic Ray Identification
SPT
PHOTTAB
NLINFILE
DARKFILE
NOISFILE
RAW Science Images
CAL
Predict Background
CRIDCALC
BACKTAB
ZOFFCORRSubtract Zero-Read Image
MASKFILE
FLATFILE
IMA
BACKCALC
User Warnings
Zero-Read Signal Correction
WARNCALC
Figure 1. CALNICA Processing Flow.
amount of IR radiation emitted by the readout amplifiers, which are situated near thedetector corners.

The STScI NICMOS Calibration Pipeline 21
Fortunately, both the shading and the amp glow signal levels are very repeatable,and depend variously upon the number of readouts and the time since the last detectorreset. Hence a proper subtraction can be achieved by applying dark current referenceimages having the exact same readout sequence and exposure times. CALNICA auto-matically selects the appropriate imset from the dark current reference file that has anexposure time matching that of the science data being processed.
3.2. Detector Non-Linearity
This step corrects for the non-linear response of the detectors. The response can beconveniently divided into three regimes. In the low signal regime, the detector responseis linear, hence no correction is applied. In the mid-level regime, the response deviatesfrom true linearity in a way that is correctable using a first-order polynomial of the form
SCI(corrected) = (c1+c2SCI)SCI (1)
wherec1 andc2 are the polynomial coefficients. The coefficients are stored, on a pixel-by-pixel basis, in the “COEF” and “ERR” image extensions in the NLINFILE referencefile. In the high signal regime, where pixels begin to saturate, no correction is appliedto the data, but a saturation flag value is set in the DQ image. The DN levels definingthe boundaries between the regimes are also stored on a pixel-by-pixel basis in two“NODE” image extensions in the NLINFILE. The linear regime typically extends up to14500 DN, and the non-linear regime to27500 DN, above which saturation beginsto occur.
3.3. MultiAccum Zeroth Read Signal
Because NICMOS does not have a shutter, signal from bright sources can accumulateduring the0.2 second long period that elapses between resetting the detector and tak-ing the initial, or zeroth, readout that begins an exposure. Any signal present in thezeroth read will be removed when the zeroth read image is subtracted from all subse-quent readouts by CALNICA, but this can lead to an error in the linearity correction thatis applied to a given pixel, since the linearity correction depends on the total amount ofcharge that accumulated in the pixel.
The ZSIGCORR step of CALNICA computes the count rate for each pixel by dif-ferencing the zeroth and first readouts from one another and then estimates the amountof signal that would have accumulated in the zeroth read during its 0.203 second effec-tive exposure time. This zeroth read signal is carried through to the NLINCORR step,where it is added back into the signal level for each pixel before determining its correc-tion. After applying the linearity correction, the zeroth read signal is again removed.
3.4. Combining MultiAccum Readouts
Once all the individual readouts of a MultiAccum observation have received all thenecessary instrumental calibration steps, they are combined into a single image, identi-fying and rejecting both cosmic-ray hits and bad pixels in the process. The accumulatedcounts as a function of increasing exposure time for each pixel are fitted with a first-order polynomial, using a standard weighted least-squares algorithm. Readouts alreadyflagged as bad in the DQ array (e.g. due to saturation) are not used in the fit. Thedistance of each readout value from the fit is computed and cosmic-rays are identifiedby their characteristic negative-to-positive residual transition from one readout to the

The STScI NICMOS Calibration Pipeline 22
Figure 2. MultiAccum Ramp Fitting Examples.
next. Readouts containing a hit are rejected and the fit is recomputed. This process isrepeated until no new hits are identified. The slope of the fit gives the final count ratefor the pixel. The total number of non-rejected readouts and their exposure time arerecorded in the SAMP and TIME arrays of the final output image.
Figure 2 shows some examples of the MultiAccum fitting process. The top panelshows the results for a pixel that had a cosmic-ray hit. The open circles are the originaldata values, while the filled circles are the result of removing the signal from the readoutcontaining the CR hit. The bottom panel shows a pixel that has the last two readoutsflagged as saturated and therefore not used in the fit.
4. CALNICB Processing
The overall flow of CALNICB processing is shown in Figure 3. CALNICB is usedexclusively for processing associated sets of images, all of which must have alreadybeen calibrated using CALNICA. A NICMOS image association is defined to be a

The STScI NICMOS Calibration Pipeline 23
ILLMCORR
CalibratedOutput Files
KeywordSwitches
ProcessingSteps
InputFiles
Read CAL Images
Create Mosaic(s)
2-D Background Subtraction
Scalar Background Subtraction
Identify Sources
Combine NUM_ITER Images
Determine Processing Parameters
Write ASC Table
ASN Table
ASC
Read ASN Table
CAL Science Images
ILLMFILE
MOS
Figure 3. CALNICB Processing Flow.
logical grouping of multiple observations of a single astronomical target. Associationsare typically used for:
making multiple exposures at a single sky position so that cosmic-ray rejectioncan be performed by later combining the images
dithering the telescope field of view to remove the effects of bad pixels or flatfield residuals
building image mosaics of large angular-size targets
chopping the field of view off of the target to measure the telescope thermalbackground signal

The STScI NICMOS Calibration Pipeline 24
To make it easier for observers to plan dithered and chopped sets of observations, STScIcreated several predefined observing patterns which automatically dither or chop thetelescope field of view through a grid of observing positions on the sky (see MacKentyet al. 1997, chapter 10).
The major processing steps of CALNICB include the combination of images takenat individual sky positions, the measurement and subtraction of the thermal backgroundsignal, and the mosaicing of images within an observing pattern. The following sec-tions describe some of these operations in a bit more detail. For more information, seeBushouse (1997a, 1997c).
4.1. Input Data
CALNICB, as run in the STScI pipeline, is completely data driven, getting all the infor-mation it needs to guide the processing from the association table that accompanies theindividual images, and from header keywords in the images themselves. Some user-setable task parameters are available in CALNICB versions 2.2 and later, for use whenrunning CALNICB interactively (see below). The association table (denoted “ASN”)is a FITS file with a BINTABLE extension containing the list of file names that makeup the association to be processed by CALNICB, as well as the file names of all outputmosaic image files (denoted “MOS”) to be produced. CALNICB determines whichnames in the list are input files and which are output files based on the MEMTYPEcolumn in the ASN table. Input files have a MEMTYPE prefix of “EXP” (exposure),while output files have a prefix of “PROD” (products). Furthermore, association mem-bers that are observations of the target of interest have a MEMTYPE suffix of “TARG”(target), while observations of sky background locations (which are only produced byusing chop patterns) have a suffix of “BCKn”, where n is the background region num-ber in the pattern (see Table 1). One MOS image will always be produced for the target,and chop patterns will result in one MOS image being produced for each backgroundregion observed.
Once CALNICB has determined the list of input images from the ASN table, itreads various keywords from the image headers to determine exactly what processingneeds to be performed. Certain keywords, such as PATTERN (pattern type), NUMPOS(number of pattern positions), and NUMITER (number of exposure iterations at eachposition) have the same value in all images and are therefore only read from the firstimage in the association. Others are image specific, such as PATTPOS (position num-ber of each image in the pattern) and World Coordinate System (WCS) keywords, haveunique values in each image and are therefore read from each image. From this infor-mation CALNICB determines what type of pattern was used, how many positions arein the pattern, how many images there are at each pattern position, the relative positionsof each image in the pattern, how many output MOS images need to be produced, andwhich input images go into which MOS image.
4.2. Combining NUMITER Images
If there is more than one image at each pattern position, CALNICB will combine theimages at each position into a single image. The offsets between each image at a givenposition are computed from their WCS information, using the first image at each pat-tern position as a reference. These offsets are then refined using a cross-correlationtechnique. The images are then aligned with their reference image, using bilinear in-terpolation, and then combined. The combining process computes the ERR-weighted

The STScI NICMOS Calibration Pipeline 25
mean for each SCI image value, with rejection of DQ-flagged pixels and iterative sigmaclipping. The number of non-rejected samples, and their total exposure time, are savedin the SAMP and TIME images.
4.3. Identifying Sources
This step flags (in the DQ images) pixels suspected of containing flux from a source.This is accomplished using a 3-stage process. First, pixels that are greater than 5 sigmaabove the median signal level in each image are identified as candidate source pixels.Second, in order to filter out spurious identifications, only those candidates having twoor more neighboring pixels also identified as containing a source are retained. Finally,the surviving pixels have their source DQ flags “grown” to their four immediate neigh-bors.
4.4. Scalar Background Subtraction
This step computes and subtracts a scalar (or “DC”) background signal from all imagesin the association. This is accomplished as follows. First, the median signal level ineach BCK image in the association is computed. The computation excludes bad andsource-flagged pixels and uses iterative sigma clipping to avoid any possible contamina-tion. If there are not any BCK images in the association (e.g. the observations are froma pure dither pattern), the same computation is performed on the target images. Theresulting background levels for each image are then averaged to compute the overallmean background level for the whole association. This overall mean is then subtractedfrom all images. The mean background level is recorded in the MEANBKG keywordin the output association (denoted “ASC”) table.
4.5. 2-D Background Subtraction
This step subtracts the ILLMFILE reference image from the associated images. It isintended to remove any spatial variations in the telescope background thermal pattern,but to date, little if any such spatial variations have been seen. Thus the ILLMFILEscurrently in use at STScI contain dummy data (constant zero values). CALNICB rec-ognizes that the files are dummy and skips the subtraction.
4.6. Creating Mosaics
This step performs the final combination of images to produce the output mosaics. Theprocess is very similar to the step that combines the NUMITER images at each patternposition. The relative offsets for each image in a given mosaic are first computed fromtheir WCS information, using the first image in each mosaic as a reference. The offsetsare refined using cross-correlation, and then the images are aligned using bilinear inter-polation and combined. The combining process computes the ERR-weighted mean ofoverlapping pixels, rejecting those with non-zero DQ values and applying an iterativesigma clipping. The number of non-rejected samples and their total exposure time aresaved in the output SAMP and TIME images of the MOS files.
4.7. Updating the Association Table
The final step of CALNICB creates a new association (ASC) table. The ASC table isa copy of the input ASN table, with four new columns of information appended. Anexample of an ASC table is shown in Table 1. The new columns are BCKIMAGE,

The STScI NICMOS Calibration Pipeline 26
MEANBCK, XOFFSET, and YOFFSET. The BCKIMAGE column indicates whether
Table 1. Example Association (ASC) Table.
MEMNAME MEMTYPE BCKIMAGE MEANBCK XOFFSET YOFFSET(DN/sec) (pixels) (pixels)
n3uw01a1r exp-targ no INDEF 0.00 0.00n3uw01a2r exp-targ no INDEF -0.15 0.00n3uw01a3r exp-bck1 yes 0.28 0.00 0.00n3uw01a4r exp-bck1 no INDEF 0.00 0.20n3uw01a5r exp-targ no INDEF 0.32 0.00n3uw01a6r exp-targ no INDEF 0.00 0.00n3uw01a7r exp-bck2 yes 0.26 0.00 0.00n3uw01a8r exp-bck2 no INDEF 0.00 0.00n3uw01a9r exp-targ no INDEF 0.00 0.00n3uw01a0r exp-targ no INDEF 0.00 -0.15n3uw01010 prod-targ no INDEF INDEF INDEFn3uw01011 prod-bck1 no INDEF INDEF INDEFn3uw01012 prod-bck2 no INDEF INDEF INDEF
or not a given image was used in the scalar background computation. The exampleshown in Table 1 is for a TWO-CHOP pattern, with NUMITER=2, and NUMPOS=5.So there are two images at each of the five pattern positions and two of the positionsare background (BCK) regions. Thus, in this example, only the images at the BCKpositions were used to compute the scalar background level. The MEANBCK columnrecords the background signal computed for each individual image. The XOFFSET andYOFFSET columns record the computed offsets for each image relative to its referenceimage.
4.8. CALNICB User Parameters
As mentioned above, beginning with CALNICB v2.2, there are a few parameters avail-able to interactive users for tailoring the CALNICB processing. Thesubbkg parameterallows you to turn the scalar background subtraction step on or off. Themeanbkg pa-rameter allows you to use the mean scalar background value of all images, or subtractthe value derived for each image from itself. Thereadbkg andreadoffsets param-eters allow you to use an ASC table as input to CALNICB and have it read eitherthe image background or offset (or both) values from the table, rather than computingthem. Thecrthresh parameter sets the cosmic-ray rejection threshold used duringimage combining, and thexcwin parameter sets the size of the cross-correlation searchwindow box.
References
Bergeron, L. E., & Skinner, C. J. 1997, in The 1997 HST Calibration Workshop,eds. S. Casertano, et al. (Baltimore: STScI), 2401
1http://icarus.stsci.edu/stefano/newcal97/pdf/bergeronl.pdf

The STScI NICMOS Calibration Pipeline 27
Bushouse, H. 1997a, in The 1997 HST Calibration Workshop, eds. S. Casertano, etal. (Baltimore: STScI), 2232
Bushouse, H. 1997b, Instrument Science Report NICMOS-97-028 (Baltimore: STScI)3
Bushouse, H. 1997c, Instrument Science Report NICMOS-97-029 (Baltimore: STScI)4
MacKenty, J. W., et al. 1997, NICMOS Instrument Handbook, Version 2.0 (Baltimore:STScI)5
Skinner, C. J., Bergeron, L. E., & Daou, D. 1997, in The 1997 HST Calibration Work-shop, eds. S. Casertano, et al. (Baltimore: STScI), 1716
2http://icarus.stsci.edu/stefano/newcal97/pdf/bushouseh.pdf
3http://www.stsci.edu/ftp/instrumentnews/nicmos/isreports/isr028.ps
4http://www.stsci.edu/ftp/instrumentnews/nicmos/isreports/isr029.ps
5http://www.stsci.edu/ftp/instrumentnews/nicmos/nicmosdoc handb.html
6http://icarus.stsci.edu/stefano/newcal97/pdf/skinnerc1.pdf

NICMOS and the VLTPula, Sardinia, May 26-27th 1998Wolfram Freudling and Richard Hook, eds.
Status and Goals of the NICMOS Calibration Plan
L. Colina1
Space Telescope Science Institute, 3700 San Martin Drive, Baltimore, MD21218, Email: [email protected]
Abstract.This document summarizes the goals and status of the various calibration
programs that form the basis of the NICMOS Cycle 7 calibration plan. Pointersto technical reports and/or WEB pages showing the results of the analysis andproviding detailed information are also given.
1. Introduction
Astronomers working with ground-based telescopes are used to get simultaneouslytheir calibrations (i.e. darks, flats, standards, etc) and scientific data. The extensionof this practice to satellites in general, and HST in particular, would make a very inef-ficient use of telescopes in orbit as the fraction of available observing time devoted tocalibrations would increase very dramatically.
The approach taken by STScI regarding the calibrations of HST instruments is thatSTScI is responsible for (a) the definition of the goals and objectives of the calibrations,(b) the implementation and execution of the calibration programs, (c) the analysis of thecalibration data, and (d) the delivery of the calibration products in the form of referencefiles and/or technical reports. This approach has two benefits, first, it saves a consid-erable amount of telescope time (about 10% of the total number of orbits allocated toa given instrument go into its calibration) and second, it generates an homogeneousdatabase of calibrations that would be difficult to create otherwise.
This document summarizes the content, goals and status of the Cycle 7 calibrationplan for NICMOS and also points to the WEB pages where detailed information onspecific topics of interest can be found.
2. Cycle 7 Calibration Plan. Overview and Goals
The NICMOS calibrations available during Cycle 7 are based on three distinct cali-bration activities. First, NICMOS was extensively tested on the ground. These testsincluded a limited amount of calibration, particularly during the System Level ThermalVacuum (SLTV) testing. Second, a period following the installation of NICMOS intoHST for testing and initial calibration was completed during the first three months on or-
1Affiliated with the Astrophysics Division, Space Science Department, ESA
28

Status and Goals of the NICMOS Calibration Plan 29
bit. This activity is known as the Servicing Mission Observatory Verification (SMOV).Finally, the routine Cycle 7 calibration plan is now underway.
It is important to distinguish between the various goals of these calibration ac-tivities. SLTV was intended to demonstrate the proper functioning of NICMOS andto obtain an initial calibration of a subset of its capabilities. SMOV was intended todemonstrate that the instrument is functioning as expected, based on the SLTV experi-ence, to characterize those parameters not measurable during SLTV (e.g. the thermalbackground generated by the HST optics), to establish necessary operation parameters(e.g. plate scale), and to begin the calibration of NICMOS. A complete calibration ofNICMOS various operating modes is conducted during Cycle 7 with SMOV being usedto demonstrate that the planned calibrations are in fact feasible.
As a consequence of the camera 3 (NIC3) defocus, the Cycle 7 calibration plan2
that went into operation in June 1997, did put the emphasis on the calibration of NIC1and NIC2 cameras executing only a limited number of calibration programs for NIC3.Revisions3 to the original cycle 7 calibration plan took place after experience with thedetectors was gained during the first 5 months of Cycle 7 (i.e. in November 1997),and most recently in March 1998. The first revision supplemented the original versionwith programs designed to cover the calibration of NIC3 during the first campaign.The second revision included programs aimed at the calibration of modes of operationnot covered in the previous versions. In this version, few additional programs werealso added to monitor the behaviour of the detectors during the warming-up phase ofNICMOS.
In its present form, the Cycle 7 calibration plan consists of several calibration pro-grams that are grouped in one of four different categories: special calibration programs,routine monitoring programs, NIC3 specific programs and Cycle 9 oriented programs(see Table 1):
Special Calibration programs. These programs are designed to obtain a detailedcharacterization of the detectors and knowledge of their different modes of op-eration, including imaging polarimetry and grism spectroscopy. The outputs ofthese programs provide the reference files and tables needed for the calibrationof data obtained with NICMOS.
Routine Monitoring Programs. These calibration programs are designed to mon-itor the status of the detectors and to follow the temporal evolution of their per-formance. Dark and flat-field exposures, as well as photometric and focus mea-surements for all three cameras are presently taken every four weeks.
NIC3 Specific Calibration Programs. Most programs requesting the NIC3 cam-era as prime have been scheduled during two observing campaigns (January andJune 1998) when the secondary mirror of HST was moved to get NIC3 in focus.The special calibration programs for NIC3, including plate scale, absolute pho-tometry measurements and the characterization of the grisms, have been executedduring these campaigns.
2http://www.stsci.edu/ftp/instrumentnews/NICMOS/nicmoscalprod.html
3http://www.stsci.edu/ftp/instrumentnews/NICMOS/nicmoscalprod.html

Status and Goals of the NICMOS Calibration Plan 30
Cycle 9 Oriented Calibration Programs. The installation of a cryocooler duringthe third servicing mission is presently under consideration. If the cryocooler isinstalled, NICMOS will resume observations in Cycle 9 although operating ata temperature higher than during Cycle 7. A small set of calibration programs,mostly darks and flats, will be executed during the warming-up phase of NIC-MOS at the end of its lifetime in Cycle 7. These programs will help to assess thebehaviour and performance of the detectors for Cycle 9 observations.
Table 1. NICMOS Cycle 7 Calibration Plan as of May 1998
ID Proposal Title Accuracy Status ResultsRoutine Monitoring Program
7596 Darks Monitoring 10 DN In progress Under analysis7607 Photometric Monitoring 2% Finished Available7608 Focus Monitoring 1 mm Finished Available7690 Flats Monitoring 1% In progress Under analysis7901 Focus Monitoring II 1 mm In progress Available7902 Photometric Monitoring II 2% In progress Available7903 Grism Dispersion Monitoring 0.01µm In progress Under analysis
Special Calibration Programs7039/40 Plate Scale Calibration 0.1% Finished Available7611 Thermal Background Finished Available7688 ACCUM Darks 10 DN Finished Under analysis7689 NIC2 Narrow-band Flats 1% Finished Available7690 Internal Lamp Flats 1% Finished Available7691 Photometric Zero Point 5% Finished Available7692 Polarizers 1% In progress Under analysis7693 Pupil Transfer Function 2% Finished Available7703-10 MULTIACCUM Darks: pre-fix 10 DN Finished Available7775 Earth Flats 5% Finished Under analysis7789,93-99 MULTIACCUM Darks: post-fix 10 DN Finished Available7904 Photometric Zero Point: red stars 5% Finished Under analysis7938 FOM-focus Test Finished Available7956 NIC1 Narrow-band Flats 1% Finished Under analysis7957 Lamp Flats II 1% To be executed Not available7958 Polarizers II 1% To be executed Not available7960 Persistence Test Finished Under analysis
NIC3 Specific Calibration Programs7695 GRISM Wavelength Cal. 0.01µm Finished Available7696 GRISM Abs. Sensitivity 20% Finished Available7806 GRISM Revalidation 0.01µm Finished Available7813 NIC3 HDF Darks Finished Not available7814 NIC3 Lamp Flats 1% Finished Available7815 NIC3 Earth Flats Finished Under analysis7816 NIC3 Photometric Zero Point 5% Finished Available7959 GRISM Calibration II 2nd campaign Not available
Cycle 9 Oriented Calibration Programs7961 Flats: Warming up To be executed Not available7962 Focus: Warming up To be executed Not available7963 Darks: Warming up To be executed Not available
The NICMOS calibration programs may each be examined by using their ID num-ber and the HST Program and Schedule Information page4. The reference calibrationfiles and tables created as a result of the various calibration programs are available on
4http://presto.stsci.edu/public/propinfo.html

Status and Goals of the NICMOS Calibration Plan 31
the NICMOS Reference Files List page5. Instrument science reports (ISR) and/or pub-lished conference papers presenting the latest calibration results can be found on theNICMOS Documentation WEB page6.
3. Cycle 7 Calibration Plan. Status of the Specific Programs
3.1. Detector Performance
All three detectors are being characterized to the same extent. High quality darks wereobtained for all available MULTIACCUM sequences during June and early July 1997(proposals ID 7703 to 7710). The mode of operation of the detectors was modifiedin August 1997 (amplifiers are now kept on all the times instead of keeping them off,and switching them on only when exposures start) and as a consequence a new set ofdarks were obtained (proposals ID 7789, 7793 to 7799). As a result, there are nowtwo separate set of dark references files that should be used for pre-fix7 data (i.e. dataobtained before August 22, 1997) and post-fix8 data (i.e. data obtained after August 21,1997), respectively.
Changes in the detectors darks are being monitored with a monthly periodicity(proposal ID 7596). These data are currently being analysed and show indicationsthat darks are changing with time. A strategy to create incremental darks is underinvestigation and will be provided in the future to users. Dark frames have also beenobtained for a limited subset of ACCUM exposure times (proposal ID 7688) but theanalysis has not yet been completed. Observers using ACCUMs with exposure timesdifferent than those provided by the calibration program will require to interpolate,producing therefore a less satisfactory calibration of their data.
3.2. Flat Fields
The pixel-to-pixel and the large scale responses of NICMOS filters are provided byhigh signal-to-noise flat-fields9 generated using internal lamp exposures. Flat-field ex-posures for all NIC1 and NIC2 polarizers, broad- and medium-band filters were ob-tained during July and August 1997 (proposal ID 7690). Flat-fields for all narrow-bandNIC1 and NIC2 filters were taken in May 1998 (proposal ID 7956) and February 1998(proposal ID 7689), respectively. Lamp flats for all NIC3 filters were taken separatelyin December 1997, just before the first NIC3 campaign (proposal ID 7814).
The temporal evolution of the pixel-to-pixel response as a function of camera andwavelength is being monitored on a monthly basis using a subset of filters in the threecameras (proposal ID 7690).
The operating temperature of NICMOS has been rising steadily during Cycle 7. Asa consequence, variations in the pixel-to-pixel and large scale sensitivity are expected.
5http://www.stsci.edu/ftp/instrumentnews/NICMOS/nicmosdoc cal list.html
6http://www.stsci.edu/ftp/instrumentnews/NICMOS/nicmosdoc.html
7http://www.stsci.edu/ftp/instrumentnews/NICMOS/nicmosdoc cal list.html#DRKMULPRE
8http://www.stsci.edu/ftp/instrumentnews/NICMOS/nicmosdoc cal list.html#DRKMULPOST
9http://www.stsci.edu/ftp/instrumentnews/NICMOS/nicmosdoc cal list.html#FLT

Status and Goals of the NICMOS Calibration Plan 32
A second set of internal lamp flat-field exposures (proposal ID 7957) will be taken inAugust/September 1998 for those filters for which the reference flats are based on datataken in July/August 1997, i.e. all medium- and broad-band NIC1 and NIC2 filters.
3.3. Image Anomalies
Several image anomalies have been found in NICMOS exposures. While in generalthe pipeline calibration appears to work well, on occasion one or more anomalies willoccur. Complete descriptions of these anomalies including work-arounds, if available,can be found on the NICMOS Image Anomalies WEB page10.
3.4. Focus Monitoring
The focus of all three cameras is being monitored throughout the entire Cycle 7. Duringthe first few months focus measurements were obtained every other week with the threecameras (proposal ID 7608). The frequency of this monitoring program decreased toonce a month after the first NIC3 campaign. In its present form, measurements ofNIC3 focus are obtained every month while the other two cameras are monitored on abimonthly basis (proposal ID 7901). The results of the focus monitoring program areposted regularly on the NICMOS focus WEB page11.
3.5. Point Spread Function
No calibration program aimed at measuring the point spread function of the three cam-eras as a function of wavelength and location was included in the Cycle 7 calibrationplan. Observers requiring PSFs in specific filters and/or locations within the field ofview, were advised to include these in their own program. NICMOS PSFs can also bemodeled using Tiny Tim V4.3. Tiny Tim software can be retrieved from the Tiny TimWEB site12.
3.6. Plate Scale
Plate scale measurements for all three cameras were performed early during the SMOVphase as part of the NICMOS aperture location (proposal ID 7039). Additional detailedmeasurements of plate scale and camera distortions were performed taking a series ofimages of the star cluster NGC 1850. In each camera 5 images were taken, displacedfrom each other without rotation (proposal ID 7040).
The results of the program 7040 are already available and have been presented in atechnical report by Cox and collaborators (OSG-CAL-97-0713). Additional informationregarding plate scale measurements can also be found on the NICMOS Plate ScaleWEB page14.
10http://www.stsci.edu/ftp/instrumentnews/NICMOS/nicmosanomalies.html
11http://www.stsci.edu/ftp/instrumentnews/NICMOS/nicmosdoc focus.html
12http://scivax.stsci.edu/krist/tinytim.html
13http://www.stsci.edu/ftp/instrumentnews/NICMOS/nicmosdoc isr.html
14http://www.stsci.edu/ftp/instrumentnews/NICMOS/nicmosdoc platescale.html

Status and Goals of the NICMOS Calibration Plan 33
3.7. Thermal Background
The absolute level and stability of the thermal background as seen by the NICMOScameras was already measured as part of the SMOV program. The Cycle 7 calibrationprogram extended the SMOV program with images obtained in the F237M (NIC2) andF222M (NIC3) filters (proposal ID 7611). Images were taken during June and July 1997as pointed parallel observations to map possible changes in the thermal background asa result of temperature changes in HST optics.
The analysis of these data is now complete and the results can be found in a recentinstrument science report (NICMOS-98-010) written by Daou & Calzetti15.
3.8. Photometry
The photometric characterization of NICMOS comprises various aspects covered bydifferent calibration programs. The absolute photometry for all available filter pluscamera combinations has been obtained by observing the two primary NICMOS ab-solute spectrophotometric standards, the white dwarf G191-B2B and the solar analogP330E (proposal ID 7691 for NIC1 and NIC2 and proposal ID 7816 for NIC3). Imagesof additional calibration standards (white dwarfs, solar analogs and red stars) have alsobeen taken to help defining the transformations between HST and ground-based JHKphotometric systems (proposal ID 7904 for NIC1 and NIC2 and proposal ID 7816 forNIC3).
The photometric stability of all three NICMOS cameras as a function of time andwavelength is being monitored on a monthly basis with observations of an absolutespectrophotometric standard (P330E) in a subset of filters covering the entire NICMOSwavelength range (proposal IDs 7607 and 7902).
Relative photometry as a function of the position in the detectors has been mea-sured for each camera using images of the solar analog P330E in a few filters. Thegrid used for this program consisted of 144 positions covering the entire field-of-viewin each camera (proposal ID 7693).
Results regarding NICMOS photometric performance can be found on the NIC-MOS Photometry Update page16.
3.9. Polarizers
The instrumental polarization and zero position angle of NIC1 and NIC2 polarizershave been measured taking images of two bright near-infrared polarized standards,HDE283812 and CHA-DC-F7. Changes in the polarization as a function of positionwithin the detectors will also be measured by moving one of the polarized targets in aspiral pattern across the detector. Additional images of the HST unpolarized standardsHD64299 and BD+32d3739 have also be taken (proposal IDs 7692 and 7958).
The analysis of these data is in progress but preliminary results can be found inthe contribution of Dines, Schmidt & Lytle to the 1997 HST Calibration Workshop17.
15http://www.stsci.edu/ftp/instrumentnews/NICMOS/nicmosdoc isr.html
16http://www.stsci.edu/ftp/instrumentnews/NICMOS/nicmosdoc phot.html
17http://www.stsci.edu/ftp/instrumentnews/NICMOS/nicmosdoc isr.html

Status and Goals of the NICMOS Calibration Plan 34
3.10. Coronograph
NICMOS coronograph consists of a laser-ablated hole in the NIC2 mirror on the fielddivider assembly (FDA). One of the effects of the dewar expansion and subsequent con-traction has been a change in the relative geometry of the NIC2 detector relative to theFDA. For the coronograph, this has caused the apparent location of the coronographichole to drift relative to the fixed acquisition aperture on NIC2. Because it is necessaryto center a star in the coronographic hole to within 1/4 pixel or better, a new addition tothe NICMOS onboard software has been implemented to locate the coronographic holeat the beginning of each observation.
The long term drift of the NIC2 coronographic hole has been continuously mon-itored during Cycle 7 using internal lamp flat exposures obtained as part of the focusmonitoring program (proposal IDs 7608 & 7901). The latest information on the statusof the coronograph can be found on the NICMOS Coronographic Hole page18.
3.11. Grisms
The wavelength dispersion solutions for all three NIC3 grisms have been computed us-ing the emission lines of the compact planetary nebulae HB12 during the first NIC3campaign (proposal ID 7695). The absolute sensitivities of the three grisms werederived using observations of the two primary NICMOS absolute spectrophotomet-ric standards ( G191-B2B and P330E; proposal ID 7696). A check on the stabilityof the wavelength and absolute sensitivity will be performed during the second NIC3campaign in June 1998 (proposal ID 7959). Finally, the stability of the wavelengthcalibration for grism G141 is measured on a by-monthly basis (proposal ID 7903).
The analysis of the calibration programs executed during the first NIC3 campaignhas been completed and the results can be found on the NICMOS ST-ECF WEB page19.
4. Summary
This paper has summarized the status of NICMOS Cycle 7 calibration plan as of May1998. The calibration of NICMOS is an ongoing effort that will continue long after thenitrogen is exhausted and Cycle 7 observations are finished. Calibration proposals willbe executed during the warming-up phase of NICMOS and will stop soon before theshut-down of the instrument.
The calibration of NICMOS detectors is not yet in a stable situation. Improve-ments in the calibration pipeline continue, new reference files are being delivered asthe analysis of the calibration data is completed and new technical reports presentingthe results of the calibration programs are posted continuously on the NICMOS WEBpage20.
18http://www.stsci.edu/ftp/instrumentnews/NICMOS/nicmosdoc coron.html
19http://ecf.hq.eso.org/nicmos/nic3calib/
20http://www.stsci.edu/ftp/instrumentnews/NICMOS/topnicmos.html

Status and Goals of the NICMOS Calibration Plan 35
Acknowledgments. The definition, implementation and analysis of all the calibra-tion programs that form part of the NICMOS Cycle 7 calibration plan has been a projectthat involving a large number of persons including members of the STScI NICMOSteam (D. Axon, E. Bergeron, D. Calzetti, D. Daou, D. Gilmore, S. Holfeltz, J. Mack-enty, J. Najita, K. Noll, C. Ritchie, A. Schultz, C. Skinner, W. Sparks, A. Storrs, A.Suchkov), the instrument definition team (R. Thompson, M. Rieke, G. Schneider andD. Hines), and the ST-ECF (W. Freudling and N. Pirzkal).
References
Auriere, M. 1995, in ASP Conf. Ser., Vol. 77, Astronomical Data Analysis Softwareand Systems IV, ed. R. A. Shaw, H. E. Payne & J. J. E. Hayes (San Francisco:ASP), 109
Canizares, C. R., Grindlay, J. E., Hiltner, W. A., Liller, W., & McClintock, J. E. 1978,ApJ, 224, 39
Djorgovski, S., & King, I. R. 1984, ApJ, 277, L49Hagiwara, K., & Zeppenfeld, D. 1986, Nucl.Phys., 274, 1Henon, M. 1961, Ann.d’Ap., 24, 369King, I. R. 1966, AJ, 71, 276King, I. R. 1975, in Dynamics of Stellar Systems, ed. A. Hayli (Dordrecht: Reidel), 99King, I. R., Hedemann, E., Hodge, S M., & White, R. E. 1968, AJ, 73, 456Kron, G. E., Hewitt, A. V., & Wasserman, L. H. 1984, PASP, 96, 198Lynden-Bell, D., & Wood, R. 1968, MNRAS, 138, 495Newell, E. B., & O’Neil, E. J. 1978, ApJS, 37, 27Ortolani, S., Rosino, L., & Sandage, A. 1985, AJ, 90, 473Peterson, C. J. 1976, AJ, 81, 617Spitzer, L. 1985, in Dynamics of Star Clusters, ed. J. Goodman & P. Hut (Dordrecht:
Reidel), 109

NICMOS and the VLTPula, Sardinia, May 26-27th 1998Wolfram Freudling and Richard Hook, eds.
Photometric Performance of NICMOS
L. Colina1, S. Holfeltz & C. Ritchie
Space Telescope Science Institute, 3700 San Martin Drive, Baltimore, MD21218, Email: [email protected], [email protected], [email protected]
Abstract. This review covers several aspects of NICMOS photometric perfor-mance including the selection of the primary spectrophotometric standards, theabsolute calibration of NICMOS detectors and their photometric stability. Spe-cial issues like relative photometry across the detectors, intra-pixel sensitivity,red leaks and transformations between the HST and ground-based photometricsystems are mentioned. Finally, a summary of the different sources of uncer-tainty when performing photometric measurements with NICMOS is presented.
1. Introduction
The near-infrared wavelength range was opened to HST with the installation of theNear-Infrared Camera and Multi-Object Spectrometer (NICMOS) in February 1997,during the second HST servicing mission. Unaffected by atmospheric absorption andemission, NICMOS covers the entire 0.8µm to 2.5µm wavelength range. Similarly,NICMOS, being above the atmosphere, is not forced to adopt filter bandpasses likethose used at ground-based observatories matching the near-infrared atmospheric win-dows. In practice NICMOS does not have a set of filters matching any of the standardground-based photometric bands and this poses a challenge when trying to achieve pre-cise absolute photometry. On the other hand, NICMOS absolute calibration requiresa set of faint spectrophotometric standards covering the entire 0.8µm 2.5µm wave-length range. Such a set of standards didn’t exist before and the selection and generationof NICMOS standards represented additional challenges.
This paper reviews several aspects of NICMOS photometric performance. Detailson NICMOS absolute spectrophotometric standards are given in section 2. Section 3discusses NICMOS absolute photometry. The photometric stability of the cameras andthe relative photometry across the detectors are mentioned in sections 4 and 5, respec-tively. Special issues like intra-pixel sensitivity, red leaks and transformations betweenHST and ground-based systems are treated in sections 6, 7 and 8, respectively. Finally,several sources of uncertainty when performing absolute calibration with NICMOS aresummarized in section 9. This paper does not mention the performance of NICMOSgrisms and polarizers as they will be the topic of separate contributions by W. Freudlingand D. Hines, respectively.
1Affiliated with the Astrophysics Division, Space Science Department, ESA
36

Photometric Performance of NICMOS 37
The reader is recommended to visit the NICMOS Photometry WEB page2 to checkfor the latest news regarding the photometric performance of NICMOS.
2. Absolute Spectrophotometric Standards
The absolute calibration of the ultraviolet and optical instruments onboard HST is basedon the existence of absolute flux calibrated spectra of a few pure hydrogen white dwarfs(WD) and hot stars, the so called HST set of absolute spectrophotometric standards(Colina & Bohlin 1994; Bohlin, Colina & Finley 1995; Bohlin 1996). The absolutecalibration of this set of HST absolute standards in the UV and optical is based ona detailed model spectrum of a hot pure hydrogen white dwarf standard (G191-B2B),transformed into an absolute flux scale using synthetic photometry techniques and accu-rate Landolt visual photometry (Bohlin, Colina & Finley 1995). This model spectrumcovers also the entire NICMOS wavelength range and therefore G191-B2B has beenselected as the primary NICMOS white dwarf standard.
An alternative method for calibrating NICMOS uses solar analogs (Campins et al.1985). Three faint solar analogs were selected by the NICMOS Instrument DefinitionTeam (IDT), and observed on the ground at JHK (E. Green and E. Persson, privatecommunication). Spectra of these three solar analogs were taken with the HST FaintObject Spectrograph (FOS) in the 0.2µm - 0.8µm wavelength range to study how ac-curately their spectral energy distribution matched that of the Sun (Colina & Bohlin1997). The absolute flux distribution of these three solar analogs covering the ultravio-let to near-infrared range was obtained combining a scaled version of an absolute fluxcalibrated solar reference spectrum (Colina, Bohlin & Castelli 1996a) with the FOSspectra (Colina & Bohlin 1997). In the near-infrared, the solar reference spectrum wasgenerated computing the energy output of a solar photospheric model using the mostrecent version of Kurucz ATLAS code (see Colina, Bohlin & Castelli 1996 for details).Of the three solar analogs, the star P330E shows an optical spectrum consistent, withinthe observational errors, with that of the Sun. P330E has therefore been selected as theprimary NICMOS solar analog standard.
3. Absolute Photometry
A preliminary on-orbit absolute photometric calibration of all three NICMOS cameraswas obtained in July 1997 soon after the end of the Servicing Mission Observatory Ver-ification (SMOV) phase. This preliminary update was based on on-orbit measurementsof a couple of standard stars in 4/5 filters per camera, covering the entire NICMOSwavelength range. The accuracy of the absolute calibration obtained in this way was10% - 15% for most filters (Colina & Rieke 1997).
An update to the NIC1 and NIC2 photometry, and corresponding photometric key-words that get populated during the calibration pipeline process, was delivered in March1998. This update is based on the complete NIC1 and NIC2 on-orbit absolute photom-etry calibration program executed in August 1997 (proposal ID 7691).
2http://www.stsci.edu/ftp/instrumentnews/NICMOS/nicmosdoc phot.html

Photometric Performance of NICMOS 38
Figure 1. Observed/predicted countrate ratios for stars G191-B2B (whitedwarf) and P330E (solar analog) in all NIC2 filters before corrections to thepre-launch predicted countrates were applied.
Images of G191-B2B and P330E were taken through all available NIC1 and NIC2narrow-, medium- and broad-band filters (32 in total). Independent measurements ofeach of the stars were taken at three separated positions around the center of the detec-tors.
Countrates (i.e. counts per second) were measured in the final calibrated imagesusing a 0.5 arcsec radius aperture in both cameras. The total countrates for a nomi-nal infinite aperture have been computed applying an aperture correction equivalent tomultiplying the 0.5 arcsec aperture countrates by 1.15, irrespectively of filter.
The observed total countrates obtained in this way were compared with the pre-launch predicted total countrates obtained using synthetic photometry (SYNPHOT) onthe spectra of the primary standards for all NIC1 and NIC2 filters (see figure 1 for NIC2results).
Images of G191-B2B and P330E were also taken with NIC3 during the first NIC3campaign in January 1998 (proposal ID 7816). To minimize pixelation effects, thecountrates were measured in the final calibrated images using a 1.0 arcsec radius. Thetotal countrates for a nominal infinite aperture have been computed applying an aper-ture correction equivalent to multiplying the 1.0 arcsec aperture countrates by 1.075,irrespectively of filter.
For each filter, the average of the observed/predicted countrates for each of the twostars was used to correct the pre-launch predicted countrates and match them with theobserved countrates. These corrections were applied in practice by renormalizing thefilter throughputs without changing their shape and without modifying the QE curve

Photometric Performance of NICMOS 39
Figure 2. Observed/predicted countrate ratios for the standard stars G191-B2B, GD153 (white dwarfs) and P33OE and P177D (solar analogs) in NIC2filters after corrections to the pre-launch predicted countrates were applied.
of the detectors. Once the corrections were in place (see figure 2 for NIC2 results),SYNPHOT was used to compute the updated photometric countrate to flux conversionfactors for all NIC1 and NIC2 filters.
The main results of the absolute photometry measurements are valid for all threecameras and can be summarized in the following points:
On average, the pre-launch predicted countrates were off by 10% and 25%in the 0.9 2.0µm and 2.0 2.5µm wavelength range, respectively.
The white dwarf and solar analog absolute photometric scales, as defined by thestars G191-B2B and P330E respectively, have a systematic difference of about2% in the 0.9 1.2 µm region and of about 4-5% for wavelengths longer than1.4µm.
Measurements of the two primary standards and two additional standards indicatethat absolute photometry to better than 5%, and as good as 2%-3% for brightsources can be achieved.
4. Photometric Stability
The long term photometric stability of all three NICMOS cameras is being monitoredduring Cycle 7 by taking images of a standard star (the solar analog P330E) every

Photometric Performance of NICMOS 40
Figure 3. Results of the on-going photometric monitoring program forcamera NIC1 and filter F160W.
four weeks. The standard star is observed through several filters spanning the entirewavelength range of NICMOS.
During the period already covered by the monitoring (May 1997 - April 1998), nosignificant deviations (i.e. larger than 2%) have been measured and the cameras havebeen photometrically stable to better than 2% (see figures 3 and 4 for an example of thestability of cameras NIC1 and NIC2 at 1.6µm).
The temperature of the detectors has been rising continuously since the beginningof Cycle 7 and will continue to do so during the next few months. As the temperatureincreases, the sensitivity of the detectors changes and this could eventually be reflectedin changes in the countrates, and therefore in the photometry. Updates with the newresults of the photometric monitoring program are posted on a monthly basis on theNICMOS Photometry WEB page.
5. Relative Photometry Across Detectors
Relative photometry across the detectors has been measured for a few filters in all threecameras. Images of the absolute standard P330E (solar analog) were taken at 144 dif-ferent detector positions using filter F160W for NIC1 and filters F110W and F222Mfor NIC2 and NIC3 (proposal ID 7693). Data with camera 3 were obtained during thefirst NIC3 campaign while this camera was in focus. All images were calibrated usingon-orbit darks and flats obtained with internal lamps.
The results show that relative photometry for cameras 1 and 2 is better than 2% inthe filters for which measurements are available (see figure 5 & 6 for the NIC2 results).Since the images obtained as part of this calibration program have been calibrated usingthe on-orbit darks and flats reference files available to the observers, there is no reason

Photometric Performance of NICMOS 41
Figure 4. Results of the on-going photometric monitoring program forcamera NIC2 and filter F160W.
to believe that a relative photometry at the 2% level, or better, can not be obtained forthe rest of the filters in these two cameras, if on-orbit flats are used in the calibration.
The results for camera 3 have to be treated with more caution. For the F110Wfilter, the one sigma deviation from the mean (11%) is dominated by intra-pixel sensi-tivity variations (see next section) and not by residuals in the large scale structure of theflats. The results for the F222M filter show that a differential photometry of better than2% can also be achieved in this camera.
6. Intra-pixel Sensitivity and NIC3 Photometry
As with many other array detectors, the sensitivity of NICMOS detectors is lower nearthe edges of the pixels than in their centers. It is as though there were small regions ofreduced sensitivity along the intra-pixel boundaries. In practical terms this effect meansthat for a source whose flux changes rapidly on a size comparable with or smaller thanthe pixel size, the measured countrate, and therefore flux, will depend on where thecenter of the source lies with respect to the center of the pixel. Because this position isnot known a priori, this effect introduces some uncertainty in the flux calibration for apoint source.
For NICMOS detectors, this uncertainty is largest for camera 3 at short wave-lengths, in which the PSF is largely undersampled. Calibration tests show that uncer-tainties are indeed largest (11%) in the blue filter (F110W; figure 7), decrease as thewavelength increases ( 6% for F160W) and are not measurable at long wavelengths(2 µm and beyond). The effect of the intra-pixel sensitivity on the photometry is lessimportant for observations of extended targets and outside the NIC3 campaigns whenthe camera is out of focus.

Photometric Performance of NICMOS 42
Figure 5. Results of the relative photometry test for filter F110W in cameraNIC2. Values indicate the deviations in % from the average.
Figure 6. Results of the relative photometry test for filter F222M in cameraNIC2. Values indicate the deviations in % from the average.

Photometric Performance of NICMOS 43
Figure 7. Results of the relative photometry test for filter F110W in cam-era NIC3. Values indicate the deviations in % from the average. The largedeviations observed in this filter are due to the intra-pixel sensitivity varia-tions at short wavelengths.
For high precision photometry and to compute the amount of photometric uncer-tainty in a given filter, in particular filters in the 1.0 1.8µm wavelength range, severalmeasurements with subpixel dithering are recommended.
A calibration program designed to quantify the impact of the intra-pixel sensitivityin the NIC3 photometry will be executed in June 1998 during the second NIC3 cam-paign. The results of this program will be available on the NICMOS photometry WEBpage soon after the analysis of the data is completed.
7. Red Leaks
Many very red targets will be observed with NICMOS at short wavelengths (i.e.1 µm). For these sources the flux at 2.2µm - 2.5µm could be orders of magnitudelarger than at 1.0µm and therefore exceptionally good out-of-band blocking wouldbe required. The filters for which red leaks might be a problem are F090M, F095N,F097N, F108N, F110M, F110W, and F113N. Images of a red star (Oph S1, JK 3) have been obtained as part of the Cycle 7 calibration plan, the analysis is underwayand the results will be posted on the NICMOS Web page. However, photometry ofa somewhat less red star (BRI0021, JK 1.3) show no indications of red leaks.Strategies involving observations in multiple filters to model the source spectral energydistribution would be required for very red stars, if red leaks were present.

Photometric Performance of NICMOS 44
8. HST versus Ground-based Photometric Systems
The standard HST JHK system is formed by the F110W, F160W and F222M filters.NICMOS images are calibrated in units ofJanskysand conversions to magnitudes areobtained defining the flux of a zero magnitude star in these filters. The spectrum of azero magnitude star is defined by the model spectrum of Vega (see Colina, Bohlin &Vastelli, 1996b for details), correcting its flux to match the observed fluxes (i.e multi-plying it by 1.05) and assuming Vega has a magnitude equal to 0.02 in all NICMOSbandpasses, as per calibration of Campins, Rieke & Lebofsky (1985).
The set of standard stars observed by HST (Table 1) contains blue stars (whitedwarfs), intermediate color stars (solar analogs) and very red stars, and covers a largerange in color (-0.2 JK 3.0). This set of standards, together with ground-basedmeasurements, will be used by the NICMOS Instrument Definition Team (M. Riekeand collaborators) to transform the HST magnitudes onto the CIT Arizona system.
Table 1. HST magnitudes for NICMOS standards.
Star Type F110W F160W F222M
G191-B2B white dwarf 12.49 12.71 12.83P330E solar analog 12.01 11.57 11.49GD153 white dwarf 14.04 14.23 14.36P177D solar analog 12.47 12.02 11.93
BRI0021 red standard 12.45 11.28 10.48OPH-S1 red standard 9.48 7.45 6.36CSKD21 red standard 12.26 9.73 8.61
9. NICMOS Photometry. Sources of Uncertainty
There are various sources of uncertainties when performing photometry with NICMOSthat could affect the final accuracy of the measurements. In the following, severalsystematic uncertainties and special cases are mentioned.
9.1. Absolute Spectrophotometric Standards
The white dwarf G191-B2B and the solar analog P330E are NICMOS primary spec-trophotometric standards. To assess the accuracy of the G191-B2B model in the near-infrared, two atmosphere flux distributions for exactly the same physical parameterswere computed independently by two different experts in this field. The largest dif-ferences in the continuum fluxes of the two independent models are 3.5% in the near-infrared at 2.5µm (Bohlin 1996).
The spectral energy distribution of P330E in the 0.4µm - 0.8µm range is the sameas the solar reference spectrum, within the uncertainties of the FOS measurements (Col-ina & Bohlin 1997). Also, the near-infrared spectrum of P330E, created by rescalingthe reference spectrum of the Sun (see Colina & Bohlin 1997 for details), agrees towithin 2% - 3% with ground-based near-infrared photometry.

Photometric Performance of NICMOS 45
In summary, the accuracy of the absolute spectral energy distribution of NICMOSprimary standards introduces a systematic uncertainty of about 2% 3% in the absolutecalibration of the filters.
9.2. Relative Photometry Across Detectors
The photometric values provided in the headers of the images are obtained from mea-surements of standard stars positioned in the central regions of the detectors. The resultsof the relative photometry characterization of NICMOS cameras (see section 5 above)indicate that relative photometry to better than 2% can be achieved for all filters incameras NIC1 and NIC2, and for long wavelength filters ( 2.0µm) in NIC3.
9.3. Intra-pixel Sensitivity Variations
No evidence of intra-pixel sensitivity effects has been observed in cameras NIC1 andNIC2. However, as mentioned already (see section 6), the intra-pixel sensitivity affectsNIC3 photometry in the 1.0 1.8µm wavelength range and errors as large as 10-20%can be present, if images are taken without a subpixel dithering strategy. Therefore,subpixel dithering is recommended for high precision photometry.
9.4. PSF Variations
Changes in focus are observed on an orbital timescale due mainly to thermal breath-ing of the telescope. In addition to this short term PSF variation there is an additionallong term NICMOS component, as the cryogen evaporates and the dewar relaxes. Thislast effect is critical for NIC3 images where the focus of the camera has changed sig-nificantly during Cycle 7. In addition, PSF changes as a function of position in thedetector. All these effects are believed to affect at the few percent level photometryobtained with small apertures. However, no quantitative measurements are availableand therefore Tiny Tim simulations are recommended to study these effects, if highprecision is required.
9.5. Aperture Corrections
The photometric conversion factors provided in the header of NICMOS images havebeen obtained by doing aperture photometry on standards using fixed radius apertures(see section 3 for details). It is often difficult to measure the total flux of a point sourceusing large apertures where the flux contribution from the extended wings of the PSF,diffraction spikes, and scattered light is also included. This is in particular true incrowded fields where the extended wings of well resolved sources could overlap witheach other. To take into account aperture correction effects it is advisable to use TinyTim PSFs to measure the encircled energy curve of growth as explained in the HSTData Handbook (Voit 1997).
9.6. Color Dependence of Flatfields
The strong wavelength dependence of NICMOS flat-fields limits the photometric accu-racy of sources with extreme colors observed in broad-band filters. Simulations with avery red source (J-K = 5 equivalent to a 700K black-body) indicates that these photo-metric errors are small, around 3% or less (MacKenty et al. 1997). Targets redder thanJ-K 5 could have photometric errors in excess of 3% for some of the filters.

Photometric Performance of NICMOS 46
9.7. Velocity shifts and Photometry with Narrow-band Filters
The photometric conversion factors for all NICMOS filters are obtained from observa-tions of continuum, emission line free, standards. The integrated flux inerg sec1 cm2
can be obtained as a function of the full width half maximum of the filter and the PHOT-FLAM parameter as explained in the HST Data Handbook (Voit 1997). However, if thetarget has large velocity shifts the emission line does not coincide with the peak trans-mission of the filter, the line flux will be in error (few to several percent, depending onthe filter and velocity shift) and a correction to account for the displacement is required.A method is indicated in the HST Data Handbook (Voit 1997).
Acknowledgments. One of us (L.C.) has benefited from several discussions withDr. R. Bohlin and Dr. M. Rieke regarding various photometric issues.
References
Bohlin, R.C. 1996, AJ 111, 1743Bohlin, R.C., Colina, L., & Finley, D.S. 1995, AJ 110, 1316Campins, H., Rieke, G.H., & Lebofsky, M.J. 1985, AJ 90, 896Colina, L., & Bohlin, R.C. 1994, AJ 108, 1931Colina, L., & Bohlin, R.C., & Castelli, F., 1996a, AJ 112, 307Colina, L., & Bohlin, R.C., & Castelli, F., 1996b, ISR CAL/SCS-008Colina, L., & Bohlin, R.C. 1997, AJ 113, 1138Colina, L., & Rieke, M. 1998, The 1997 HST Calibration Workshop, Ed. S. Casertano
et al. page 182MacKenty, J.W. et al. 1997, NICMOS Instrument Handbook, Version 2.0 (Baltimore:
STScI)Voit, M. 1997, HST Data Handbook, Version 3.0 (Baltimore: STScI)

NICMOS and the VLTPula, Sardinia, May 26-27th 1998Wolfram Freudling and Richard Hook, eds.
The Photometric Performance of the NICMOS Grisms
W. Freudling and N. Pirzkal
Space Telescope – European Coordinating FacilityEuropean Southern ObservatoryKarl-Schwarzschild-Str. 285748 GarchingGermanyEmails: [email protected], [email protected]
Abstract.In addition to broad band, medium band and wide band filter sets, the NIC-
MOS Camera 3 (NIC3) filter wheel contains three grisms. These grisms pro-vide low-resolution slitless spectroscopic capabilities. This article describes thewavelength and throughput calibration of the grisms and discusses the photo-metric performance of the NICMOS grism mode.
1. Introduction
The NICMOS grisms in camera 3 (NIC3) provide low-resolution slitless spectroscopiccapabilities. There are three grisms: G096 covering 0.8 to 1.2µ; G141 for 1.1 to 1.9µ and G206 for the 1.4 to 2.5µ region. The resolution of the first order spectra on allgrisms is about 200 per pixel. Second order spectra contain on the order of 1 to 2%of the total detected flux for each object on the grism images. In general, only part ofthe second order spectra are located on the detector. Since there are no slits, an imageof the same field through a matching wide-band filter is needed to obtain a zero pointfor wavelength calibration. A matching filter with similar throughput as the grism isavailable for each of the grisms. A standard procedure for the grism observations is tospend a small fraction of the total integration time to obtain the undispersed image.
The optimum focus position for NIC3 is beyond the reach of the PAM focusingmechanism, i.e. NIC3 can only be perfectly focused by moving the secondary mir-ror of HST. Since such a move prevents other HST instruments from being focused,it is carried out only during special NIC3 campaigns, the next one is planned for June1998. The optimum position of the focus has continuously been moved over the lastfew month to a more favorable location. Wavelength and throughput calibration obser-vations have been carried out both during and outside of NIC3 campaigns.
2. Extraction and Calibration of Spectra
A detailed description of the methods used to extract spectra from a grism image witha matching direct image is given in Pirzkal & Freudling (1998a, b and c). Here, we
47

The Photometric Performance of the NICMOS Grisms 48
1
1.5
1
1.5
1
1.5
1
1.5
1
1.5
1 1.5 2 2.5
1
1.5
(228,228)
(178,178)
(128,128)
(78,78)
(28,28)
Figure 1. Wavelength dependence of the pixel response for selected pixelson the NIC3 detector. The points are the values of the flat fields of the narrow-band flatfields for the indicated pixel location. The filters used are shown inthe bottom of the figure. It can be seen that the pixel response is stronglywavelength dependent and differs for different position on the detector.
briefly summarize the steps relevant for the discussion of the grism calibration givenbelow.
The first step in the extracting is the removal of the background from the locationcovered by the spectrum. All calibration observations were of sufficient s/n so that thebackground contribution to the spectrum is small and no differences were found usingdifferent background removal procedures.

The Photometric Performance of the NICMOS Grisms 49
1 1.5 2 2.5-200
-100
0
100
pre-launch
Vy 2-2 Nov 97
HB 12 Jan 98
G096
G206
G141
Figure 2. Wavelength as a function of the position within the spectra. Thepositions are relative to the position of the object on the direct image. Pre-launch measurements as well as in-orbit measurements within and outside ofone of the NIC3 campaigns are shown. For the first order spectra, two in-orbit measurement shown derived from 2 different calibration objects and at2 different epochs are shown, one before the first NIC3 campaign, and onewithin the first NIC3 campaign.
The flux Fl for a given wavelength binl is computed from the background sub-tracted grism image by summing the count ratesgx;y at pixel position(x;y)
Fl =∑ tx;y;l wx;y;l gx;y (1)
where the sum is over all pixels contributing to wavelength binl , wx;y;l is the weightfor a given wavelength and pixel position, andtx;y;l is the wavelength dependent inversesensitivity at a given position on the detector.
For the errors, the error estimate for each pixel is taken from the array ’err’ of theinput grism image. The error estimate for each wavelength is then the quadratic sumover the same region,
εl =q
∑(tx;y;l wx;y;l εi;l )2: (2)
The pixels included in the sums are determined by the position of the object on thedirect image, and the location of the spectra relative to the direct image. This relativelocation is parameterized as a shift and a rotation of the spectrum relative to the rows ofthe image which contains the object on the direct image. These parameters have beendetermined for each grism and separately for the first and second order.

The Photometric Performance of the NICMOS Grisms 50
Figure 3. Inverse sensitivity curves for G096 as measured during the firstNIC3 campaign in January 1998. For the first order, pre-flight estimates areshown for comparison as a dashed line. The errors are the rms of the differentextracted spectra divided by the square root of the number of spectra. Theintegrated flux in the second order is about 1.5% for a flat spectrum.
For the extraction of the calibration spectra, boxcar functions have been used forthe weights. For the flux calibration, fairly large apertures have been used to assure thatall the flux is contained in the box.
The inverse sensitivitytx;y;l can be written asil qx;y;l , where for a given wavelengthl , the functionqx;y presents an appropriate normalized monochromatic flatfield. Unfor-tunately, narrow-band flatfields for the NIC3 camera which can be used to approximatemonochromatic flatfields are available only for a very limited number of wavelengths.Figure 1 illustrates the situation. The wavelength dependence of the flatfield responseof individual pixels differs substantially over the detector. Currently, the only way toestimate the pixel response for a given wavelength is to use this limited data set andinterpolate between the wavelengths of the available filters. The limited measurementsof this response is a major contribution to our uncertainty in the flux calibration.
The purpose of the wavelength calibration is to find the relation between the pixelposition relative to the undispersed objectsl and the wavelengthλ(l). The purpose ofthe flux calibration is to find the inverse sensitivityi(λ) as a function of wavelength inmJy/DN/sec.
3. Wavelength Calibration of NICMOS Grisms
NICMOS has no internal lamps for wavelength calibration. Therefore, objects withstrong IR line emission must be used for in-orbit wavelength calibration. For slitlessspectroscopy, wavelength calibrators should be compact. The best wavelength calibra-tors for NICMOS seem to be compact planetary nebulae. The Planetary nebulae Vy

The Photometric Performance of the NICMOS Grisms 51
Figure 4. Inverse sensitivity curves for G141 as measured during the firstNIC3 campaign in January 1998. For the first order, pre-flight estimates areshown for comparison as a dashed line. Note the region in the second orderspectrum sensitivity without error bars. For that region, no measurementscould be carried out. The superimposed curve in that region is an interpo-lation. The total amount of flux in the second order is about 1.8% for a flatspectrum.
2-2 and HB12 have been used for that purpose. Currently, HB12 is routinely used formonitoring the wavelength dispersion.
The dispersion of the grisms, i.e. the wavelength as a function of position rela-tive to the coordinate of the object on the direct images, have been parameterized aslinear relations. Polynomials of higher order have been tried but did not result in bet-ter fits. The parameters of the the dispersion relation were determined by correlationof the extracted spectra with ground based spectra of Vy 2-2 provided by Hora et al.,1998. The in-orbit measurements of the dispersion relation are significantly differentfrom the pre-launch measurements, but no significant changes in the parameters of therelation have been observed in the repeated in-orbit measurements. As an illustration,the dispersion relations for 2 epochs are plotted in figure 2 and compared to the pre-launch measurements. The main uncertainty in the wavelength calibration is the exactlocation of the object on the direct image. The uncertainty for an individual spectrumis about 0.5 pixels. This translates into an uncertainty of the wavelength calibration ofless than 0.005µ. Within this uncertainty, no dependence of the dispersion relation onthe position on the NICMOS detector. Similarly, no systematic change in time has beendetected so far.

The Photometric Performance of the NICMOS Grisms 52
The dispersion relations of second order spectra were determined by cross-correlatingthe extracted spectra of both orders and using the calibration of the first order with theground-based data.
4. Throughput Calibration
The white dwarf G191-B2B and the solar analog P330 have been adopted as flux cal-ibrators for NICMOS. Each grism calibration observations consists of at least threedifferent direct image / grism image pairs, with the calibrator positioned at differentlocations on the NICMOS detector for each individual observation. The first orderspectrum from each pair of images was extracted in instrumental units (DN/sec).
For both calibrators, model spectra scaled to measurements at shorter wavelengthsare available, for details see Colina (1998, this workshop). The spectra as given byColina & Bohlin 1997 (for the solar analog P330), and Bohlin & Colina & Finley1995 and Bohlin 1996 (for the white dwarf G191-B2B) have been used for the grismcalibration.
Inverse sensitivity curves for first order spectra were derived by dividing the in-dividual spectra by the model spectrum of the respective calibrator and computing theaverage of all spectra from the two flux calibrators. Figures 3, 4 and 5 show the derivedsensitivities for G096, G141 and G206, respectively. The uncertainty for each pointin the sensitivity curves is the rms from all extracted spectra divided by the number ofspectra.
Inverse sensitivity curves for second order were derived from archive grism imagestaken for the public parallel program. Spectra were extracted for bright objects withboth first and second order spectra on single grism images. The relative extracted fluxfor both orders in combination with the first order sensitivity calibration was used toderive the sensitivity of the second order. Since the field of view of grism observationsdo not allow for both orders to be completely contained in single images, several imageshad to be used to derive the sensitivity for the whole wavelength range of grisms G098and G141. The available data did not allow to derive a calibration for the second orderof G206.
5. Photometric Accuracy of Extracted Spectra
The sensitivity curves for the first order spectra presented in the previous section havetypical uncertainties per point of about 5 to 10%. These errors have been estimated fromthe differences of individual extracted spectra. We have separated the inverse sensitivityby the calibrator used to derive them and found that integrated over the whole bandpasssystematic differences are smaller than 2%. Statistical error as computed from the errorarray of the grism images are also small compared to the errors shown above. Theorigin of the uncertainty in the sensitivities are differences in the spectra extracted atdifferent positions on the detector. Presumably, these differences are due to our lackof knowledge of the difference in the wavelength dependence of the individual pixelresponse. As mentioned in section 2., these differences are currently approximated bythe response of narrow-band flats which do not sample the full range of wavelength ofthe grisms very well. For that reason, the flux calibration of a single spectrum can beup to 20 to 30% uncertain. This is within the goal of the original calibration plan.

The Photometric Performance of the NICMOS Grisms 53
1.5 2 2.5
0
2000
4000
6000
8000
Figure 5. Inverse sensitivity curves for G206 as measured during the firstNIC3 campaign in January 1998. The pre-flight estimates are shown for com-parison as a dashed line.
6. Summary
We are carrying out wavelength and flux calibrations of the NICMOS grisms. The un-certainty in the flux calibration is about 5-10% for the first order spectra, the uncertaintyin the wavelength calibration is less than 0.005µ. Files with the most recent calibrationdata can be obtained from http://ecf.hq.eso.org/nicmos/. The monitoring of wavelengthand throughput calibration will continue until the end of 1998.
References
Bohlin & Colina & Finley 1995, AJ 110, 1316Bohlin 1996, AJ 111, 1743Colina, 1998, this proceedings.Colina & Bohlin 1997, 113, 1138Pirzkal, N., Freudling, W., this proceedings.Pirzkal, N., Freudling, W., 1998a, NICMOSlook manual, Version 2.1 (Garching: ST-
ECF)Pirzkal, N., Freudling, W., 1998b, Calnic C Manual, Version 2.1 (Garching: ST-ECF)Hora, Latter & Deutsch, 1998, in preparation

NICMOS and the VLTPula, Sardinia, May 26-27th 1998Wolfram Freudling and Richard Hook, eds.
ST-ECF Grism Spectrum Software for NICMOS Grism Data
N. Pirzkal & W. Freudling
Space Telescope - European Coordinating Facility, Karl-Schwarzschild-Str. 2,D-85748 Garching, Germany
Abstract. A unique capability of NICMOS is its grism mode which permitsslitless spectrometry at low resolution. Extracting spectra from a large numberof NICMOS grism images requires a convenient interactive tool which allowsa user to manipulate direct/grism image pairs. NICMOSlook and Calnic-C areIDL programs designed for that purpose at the Space Telescope – EuropeanCoordinating Facility1. NICMOSlook is a graphical interface driven versionof this extraction tool, while Calnic C is a program which performs the samefunctionality in a “pipeline“ approach.
1. NICMOSlook and Calnic C
NICMOSlook and Calnic-C are two programs that were designed to take advantage ofthe fact that the NICMOS grism mode typically consists of taking both a direct anda grism image. Both NICMOSlook and Calnic-C use the direct image to determinewhich objects are to be extracted, their location, size, and orientation. The programsallow the user to extract spectra using a range of extraction techniques.NICMOSlook, which has an IDL user interface based on STISlook from Terry Beck,is designed to allow a user to interactively and efficiently extract spectra from a smallbatch of data. The user maintains full control over the extraction process. NICMOSlookwas designed to be most useful to users who want to quickly examine data or fine tunethe extraction process.The stand-alone version, Calnic C, is meant to be used on larger sets of data and requiresonly a minimum amount of user input. Both programs can be fully configured andextended through the use of a few configuration and calibration files. Figure 1 presentsan overview of the spectral extraction process.
2. Features overview
2.1. Image Display
NICMOSlook provides a variety of display options to examine the direct and grismimages (Figure 2). These options include color tables, zoom factors, row/cut plots, andblinking between the two images. Some basic image filtering and processing capabili-
1http://ecf.hq.eso.org
54

ST-ECF Grism Spectrum Software for NICMOS Grism Data 55
ties are also available to facilitate the identification of objects.Calnic-C outputs Postscript finding charts which contain the direct and grism imageswith the objects and spectra clearly numbered and marked (Figures 4 and 5).
2.2. Object Identification
With NICMOSlook, objects can be identified automatically using either the DAOFINDalgorithm, by using a text file containing the objects coordinates, or can be providedinteractively by the user by marking specific objects in the direct image. NICMOSlookand Calnic-C account for the size and orientation of the objects when extracting theirspectrum (Figure 3).Calnic-C uses the more sophisticated SExtractor (Bertin 1996) program to automat-ically locate and determine the size and orientation of objects in the direct images.Calnic-C can also be made to extract only objects that are listed in an input list.With both programs, and if using an input object list, the RA and DEC of objects canbe used rather than simply the pixel coordinates of the objects in the direct image. Thisfeature requires that a WCS be available in both the direct and grism images FITSheaders.
2.3. Determination of the location of the spectrum
The positions of the objects are used in combination with the appropriate coordinatetransformation to determine the location and extend of spectra in the grism image. Thezeroth, first, and second spectral orders can be automatically located on the grism image(Figure 3). The direct and grism images do not need to have been taken with exactlythe same telescope pointing since NICMOSlook and Calnic-C can additionally makeuse of the WCS information to locate the spectra in the grism image.
2.4. Spectral Extraction
Weighted or unweighted spectral extractions can be performed. Objects can be ex-tracted as point sources (In which case, a Tiny Tim profile is used during the spectralextraction) or as extended objects (In which case a spectral profile is determined by firstcomputing the profile of the object in the direct image).
2.5. Background Subtraction
The programs estimate the amount of background light in a spectrum. A region contain-ing no spectrum is first identified in the vicinity of the spectrum of interest (Figure 6).This region is then either used to scale a pre-computed model background, or is linearlyinterpolated to estimate the level of the background were the spectrum is located.
2.6. Wavelength and Flux calibrations
A wavelength is assigned to each pixel of the spectrum in the grism image using theknowledge of where the object is located in the direct image and using the dispersionrelation of the grism used. A flatfield is then constructed by taking into account thatdifferent pixels in the grism image correspond to different wavelengths. NICMOSlookand Calnic-C compute the flatfield coefficient of a specific pixel at a specific wavelengthby interpolating the narrow band filter flatfield coefficients of the same pixel. Inversesensitivity curves are then applied to the extracted spectra to produce a final extractionproduct that is wavelength and flux calibrated (Figures 7 and 8).

ST-ECF Grism Spectrum Software for NICMOS Grism Data 56
2.7. Deblending
An attempt can be made to automatically remove the spectral contamination caused bythe presence of nearby objects. The only assumption made by the method used is thatthe shape of the object is not wavelength dependent.
2.8. Spectral lines search
Emission and absorption lines are automatically identified in the resulting spectra, andthe continuum emission is automatically determined.
2.9. Result Output
The final data products are plots on the screen (Figures 7 and 8), binary FITS tablesand postscript files with the spectra, error estimates, object parameters derived fromthe direct imaging, and details of the spectrum extraction process (Figure 9). Calnic-Cadditionally outputs finding charts to locate the objects and their spectra in the directand grism images
3. Supported platforms and availability
NICMOSlook is written entirely in IDL. It runs under either IDL 4.0 or IDL 5.0.
The “pipeline version” Calnic C shares most of the code of NICMOSlook butalso requires the successful compilation of SExtractor 1.0a (Bertin 1996) whichis written in C..
NICMOSlook, Calnic C, and their respective User’s Manual can be downloadedfrom http://ecf.hq.eso.org/nicmos
References
Bertin, E., Arnouts, S., 1996, A&A, 117, 393

ST-ECF Grism Spectrum Software for NICMOS Grism Data 57
Automatically determineobjects location and size
Read NICMOS direct and grism images
Use pre-defined objectslocation and size
Mark objects as stars or extended objects
Use pre-computedweights (TinyTim)
Compute object profile indirect image and compute
extraction weights
Determine the position of spectra in the grism image(Optional use of the WCS)
Scale and subtractpre-defined
spectralbackground
Determine the spectralbackgound by linearly
interpolatingthe grism image background
Apply weighted or unweighted extraction and apply the flatfield
Use narrow band filtersto contruct a flatfield
Construct a mosaic flatfieldusing Calnic-B output
Compensate the cases ofoverlapping spectra
Apply inverse sensitivity function to flux calibrate the spectra
Search for lines in extracted spectra
Update catalogs, output FITS files, PostScript files, and findingcharts (Calnic-C)
Point Source Extended Object
Figure 1. Overview of NICMOSlook and Calnic-C

ST-ECF Grism Spectrum Software for NICMOS Grism Data 58
Figure 2. The NICMOSlook user interface
Figure 3. Grism image displayed by NICMOSlook with the identified ob-jects marked. First order spectra are marked with full lines, second orderspectra are marked with dashed lines

ST-ECF Grism Spectrum Software for NICMOS Grism Data 59
$CNC_SPECOUT/field2_f110w.ps
0
1
2 3 4 5
6 7
8
9
10 11
Figure 4. Direct image Postscript finding chart output by Calnic-c
$CNC_SPECOUT/field2_g096.ps
0
1
2 3 4 5
6 7
8
9
10 11
1
2
4
6
3
5
7
8
9
11
Figure 5. Grism image Postscript finding chart output by Calnic-c

ST-ECF Grism Spectrum Software for NICMOS Grism Data 60
Figure 6. Display of the areas used to determine the background spectralcontamination
Figure 7. Result of a first order extraction of Vy-22

ST-ECF Grism Spectrum Software for NICMOS Grism Data 61
Figure 8. Result of a second order extraction of Vy-22
Figure 9. Postscript output of Calnic-C

NICMOS and the VLTPula, Sardinia, May 26-27th 1998Wolfram Freudling and Richard Hook, eds.
Imaging Polarimetry with NICMOS
D. C. Hines1
Steward Observatory, The University of Arizona, Tucson, AZ 85721
Abstract. The Near Infrared Camera and Multi-Object Spectrometer (NIC-MOS) contains optics which enable imaging polarimetry at 1 & 2 microns withunprecedented detail. The preflight Thermal Vacuum tests revealed that eachpolarizer has a unique polarizing efficiency, and that the position angle offsetsdiffer from the nominal positions of 0, 120 & 240. Therefore, to properly re-duce polarimetry data obtained with NICMOS, a new algorithm different fromthat needed for an ideal polarizer was developed. I discuss this new algorithm,its successful application to NICMOS observations, and its more general usefor data obtained with other instruments. I also present estimates of the NIC-MOS Instrumental Polarization, and discuss both the sensitivity of the Grismsto polarized light and the accuracy of NICMOS imaging polarimetry for faintand low polarization objects.
1. Introduction
Studies of polarized light have brought about profound changes in our understanding ofastronomical objects, especially within the last two decades with the advent of sensitive,large format imaging arrays such as optical CCDs and the NICMOS3 infrared arrays.Imaging of linearly polarized light from young stellar objects, bipolar nebulae, radiogalaxies and hyperluminous infrared galaxies has shown that disks of dusty gas play akey role in the birth and death of stars, and can strongly influence the appearance ofquasars and QSOs.
The Near Infrared Camera and Multi-Object Spectrometer (NICMOS) containsoptical elements which enable high spatial resolution, high sensitivity observations oflinearly polarized light from 0:82:1µm. The filter wheels for Camera 1 (NIC1) andCamera 2 (NIC2) each contain three polarizing elements sandwiched with band-passfilters. The design specifies that the position angle of the primary axis of each polarizer(as projected onto the detector) be offset by 120 from its neighbor, and that the polar-izers have identical efficiencies. While this clean concept was not strictly achieved, thereduction techniques described below permit accurate polarimetry using both the short-and long-wavelength cameras over their full fields of view.
1NICMOS Project, The University of Arizona
62

Imaging Polarimetry with NICMOS 63
2. Thermal Vacuum Tests
Preflight thermal vacuum tests on NICMOS included an extensive characterization ofthe polarimetry optics. We also measured the overall sensitivity of the non-polarimetryoptics to polarized light. A polarizing element attached to the CIRCE standard lightsource provided uniform illumination of the entire field of view with light of knownpolarization and position angle.
Polarizing efficiencies2 and absolute polarizer position angles (relative to the NIC-MOS entrance aperture) were derived for each polarizer in NIC1 and NIC2 from im-ages obtained at 20 increments of the calibration polarizer position angle. The samemethod, but without the NICMOS polarizers in place, was used to to evaluate the po-larization signature imparted by the mirrors which comprise the NICMOS imagingsystem, and to characterize the sensitivity of the NIC3 Grisms to polarized light.
The Thermal Vacuum tests showed that:
Each polarizer in each camera has a unique polarizing efficiency.
The offsets between the position angles of the polarizers within each filter wheeldiffer from their nominal values of 120.
The instrumental polarization caused by reflections off the mirrors in the NIC-MOS optical train is small (< 1%).
The Grisms are slightly sensitive to the orientation of incoming polarized light,with G206 showing the largest variation in intensity ( 5%) for completely polar-ized light. This effect scales with percentage polarization and will be negligiblefor the majority of astronomical situations.
3. The HSL Algorithm for Reducing NICMOS Polarimetry Observations
The “standard theory” polarimetry reduction algorithm outlined in the original NIC-MOS Manual (Axon et al. 1996) assumes that the polarizers have uniform and per-fect (100%) polarizing efficiencies, and that the position angles of the primary axis ofthe polarizers are offset by exactly 120. The thermal vacuum tests showed that theNICMOS polarizers are not ideal, so a more complex technique is required. The newalgorithm developed by Hines, Schmidt & Lytle (1997; hereafter HSL) is presentedbelow.
The observed signal from a polarized source of total intensityI and linear StokesparametersQ andU measured through thekth polarizer oriented with a position angle3
φk isSk = AkI + εk(BkQ+CkU); (1)
2Polarizer efficiency is defined asε = (SparSperp)=(Spar+Sperp), whereSpar andSperp are the respectivemeasured signals for a polarizer oriented parallel and perpendicular to the axis of a fully polarized beam.
3Polarizer position angle as measured from the NICMOS Aperture Offset Angle of 224:52, about theaperture center toward the +U3 axis.

Imaging Polarimetry with NICMOS 64
where
Ak =12
tk(1+ lk); Bk = Akcos2φk;Ck = Ak sin2φk;
andεk is the polarizing efficiency,tk is the fraction of light transmitted for a 100% polar-ized input aligned with the polarizer’s axis, andlk is the fraction transmitted (exclusiveof that involved intk) when the incoming light is perpendicular to the axis of the polar-izer (see Table 1). The values oftk were initially determined by the filter manufacturer,and were not accurately remeasured in thermal vacuum tests (HSL). However, recentobservations of unpolarized and polarized standard stars have allowed us to refine thesevalues.
Table (1) presents the properties of the individual polarizers as determined in pre-flight thermal vacuum tests and by the on-orbit standard star observations. Table (2)lists the coefficients derived from these parameters for use solving Eq. (1).
Table 1. Characteristics of the NICMOS Polarizers
Filter φka εk tk (on-orbit)b lk Comments
POL0S 1.42 0.9717 0.7660 0.0144 . . .POL120S 116.30 0.4771 0.5946 0.3540 Possible “ghost” imagesPOL240S 258.72 0.7682 0.7169 0.1311 . . .
POL0L 8.84 0.7313 0.8981 0.1552 . . .POL120L 131.42 0.6288 0.8551 0.2279 . . .POL240L 248.18 0.8738 0.9667 0.0673 . . .
aAs measured from the NICMOS aperture 224.52 about the +U3 axis.bDerived from on-orbit observations of the unpolarized standard BD 32 3739 (Schmidt, Elston & Lupie1992).
Table 2. Coefficients for Simultaneous Solution of Equation (1)a
Filter Ak εkBk εkCk
POL0S +0:3936 +0:3820 +0:0189POL120S +0:4025 0:1166 0:1526POL240S +0:4054 0:2876 +0:1195
POL0L +0:5187 +0:3614 +0:1152POL120L +0:5250 0:0411 0:3276POL240L +0:5159 0:3262 +0:3111
aBased on thermal vacuum data and the on-orbit determination of tk (Table 1).
After solving the system of equations (Eq. 1) to derive the Stokes parameters ateach pixel (I ;Q;U), the percentage polarization (p) and position angle (θ) at that pixelare calculated in the standard way:
p= 100%p
Q2+U2
I;θ =
12
tan1
UQ
:
[Note that the arc-tangent function is implemented differently on different systemsand programming environments, so care must be taken to ensure that the derived anglesplace the electric vector in the correct quadrant.]

Imaging Polarimetry with NICMOS 65
4. On-Orbit Calibration
Observations of a polarized star (CHA-DC-F7: Whittet et al. 1992) and an unpolarized(null) standard (BD 32 3739: Schmidt et al. 1992) were obtained with NIC1 and NIC2(Cycle 7 CAL 7692, 7958: Axon). The observations used a four position, “spiral-dither” pattern with 20.5 pixel offsets to improve sampling and alleviate the effects ofbad pixels, cosmic rays, some persistence, and other image artifacts. Two epochs werechosen such that the differential telescope roll between observations was 135.
Since the thermal vacuum tests showed that the imaging system had little effect onthe observed polarization, any measured polarization in the null standard was attributedthetk term in the HSL algorithm. Applying our refined coefficients to the polarized stardata yielded a measured percentage polarization within 0.3% of the published value.Table 3 presents the results.
Table 3. Polarization Measurements of CHA-DC-F7
Band p σpa θ σθ
a
(%) (%) () ()
J (ground)b 3.19 0.05 118 21µm (Epoch 1) 3.44 0.5 111 41µm (Epoch 2) 3.31 0.5 108 4
K (ground)b 1.19 0.01 126 42µm (Epoch 1) 0.97 0.2 119 62µm (Epoch 2) 1.00 0.2 119 6
aConservative upper limits for the uncertainties were estimated from the variation between results obtainedfrom individual “dither” positions in each epoch.
bWhittet et al. (1992)
5. On-Orbit Results
Polarimetry data were obtained for IRC +10216 and CRL 2688 with NIC1 and NIC2respectively as part of the Early Release Observations program. Descriptions of theobservations can be obtained on the STScI website via the Cycle 7 proposal number orPI name (ERO 7120: Skinner; ERO 7115: Hines). Overall, the NICMOS and ground-based polarimetry agree remarkably well, once the NICMOS polarimetric images havebeen binned to match the spatial resolution of the ground-based images.
5.1. NIC1 – IRC +10216
Figure 1 presents the NICMOS polarimetry results for IRC +10216 (Skinner et al.1997) compared with the ground-based data from Kastner & Weintraub (1994). Thepolarization map derived by processing the NICMOS data with the new HSL algorithm(center panel) agrees well with the ground based data. In contrast, polarization imagesderived by using the “standard theory” underestimate the polarization and lead to incor-rectly oriented electric vector position angles. Variations of the percentage polarizationin relatively uniform regions of the HSL-reduced IRC +10216 data suggest uncertain-ties σp;meas< 13% (in percentage polarization per pixel), and comparison with the

Imaging Polarimetry with NICMOS 66
Figure 1. (after HSL) J-Band Imaging Polarimetry of IRC +10216 ob-served from the ground (Kastner & Weintraub 1994), compared with dataobtained using NICMOS Camera 1 and reduced with the HSL and “standardtheory” algorithms. The data reduced with the HSL algorithm agree wellwith the ground based data. For clarity, the NICMOS polarization vectors areplotted for 55 pixel bins, and the faintest and brightest intensity contourshave been omitted.
ground-based data suggests an uncertainty in the position angles 2 in a 55 pixelbins (Fig. 1).
5.2. NIC2 – CRL 2688
Figure 2 presents the NICMOS polarimetry results for CRL 2688 compared with obser-vations obtained from the ground (Sahai et al. 1998). In this case the ground-based dataare of exceptional quality and allow a more detailed comparison than for IRC +10216.Overall, the NICMOS and ground-based data agree quite well and show centrosymmet-ric patterns of position angle within the polar lobes.
Other, more subtle, features of the polarization morphology that are seen in theground-based polarization map are reproduced precisely in the NICMOS map, confirm-ing that the NICMOS polarimetry is well calibrated. However, the superior resolutionof the NICMOS data reveals polarization features that are not apparent in the ground-based polarization map. In particular we note the very high polarizations ( 7080%)in the arcs and filamentary structures — features that are washed out (beam averaged) inthe ground-based images resulting in lower observed polarization. As for IRC +10216,

Imaging Polarimetry with NICMOS 67
Figure 2. (after HSL) 2µm Imaging Polarimetry of CRL 2688 (The EggNebula) using NICMOS Camera 2, and the Cryogenic Optical Bench (COB)attached to the 2.1m at Kitt Peak (courtesy of J. Kastner). For clarity, thevectors in the NICMOS and COB data are binned by 55 and 44 pixelsrespectively.
uncertainties in the spacecraft data are estimated to be 13% in percentage polar-ization, and 2 in the position angles.
6. NICMOS Imaging Polarimetry
As illustrated by the calibration data and EROs discussed above, the NICMOS systemis capable of producing accurate imaging polarimetry. The refined coefficients of theHSL algorithm enable investigation of polarization to lower limits than had originallybeen estimated by HSL.
Limiting Polarization: Because the errors for percentage polarization follow aRice distribution, precise polarimetry requires measurements such thatp=σp;meas> 4(Simmons & Stewart 1985). Therefore, uncertaintiesσp;meas 0.5-3% (per pixel) im-ply that objects should have minimum polarizations of at least 2-12% per pixel. Binningthe Stokes parameters before forming the percentage polarization (p) and the positionangles reduces the uncertainties by 1=
pN, whereN is the number of pixels in the
bin. Uncertainties as low as 0:2% should be achievable with bright objects.Limiting Brightness of the Target: In a perfect photon-counting system,σp;phot
p
2=E, whereE is the total number of photons counted. For CRL 2688, the signal

Imaging Polarimetry with NICMOS 68
strength even in regions of low intensity (e.g. the H2-emitting torus) should have pro-ducedσp;phot < 1%. We measureσp;meas 13%, which suggests the presence ofother noise sources (e.g. flat-field errors).
Figure 3. (after HSL) Fractional signal measured in each NICMOS po-larizer as a function of incident electric vector position angle (PA) for 20%polarized light. The lower curves are the differences in fractional signal be-tween images taken with successive polarizers. The vertical dashed lines inthe left panel (NIC1) represent the position angles of the incoming electricvector where these differences are all small, and thus produce the largest un-certainties in the polarization.
Position Angle of Incoming Polarization Relative to NICMOS Orientation:The non-optimum polarizer orientations and efficiencies cause the uncertainty in polar-ization to be a function of the position angle of the electric vector of the incoming light.For observations with low signal-to-noise ratios (per polarizer image), and targets withlower polarizations, the difference between the signals in the images from the three po-larizers becomes dominated by (photon) noise rather than analyzed polarization signal.Therefore, observations that place important incoming electric vectors at 45 and135 in the NICMOS aperture reference frame should be avoided in NIC1. No suchrestriction is necessary for NIC2.
7. Future Directions
Further analysis of the Cycle 7 calibration data, and comparisons between NICMOSand ground-based observations of GTO and GO targets should allow even more im-provements in the HSL coefficients. A detailed error analysis of the HSL algorithm isalso in progress.
We have demonstrated that NICMOS can produce highly accurate images in po-larized light despite its non-ideal polarimetry optics. The HSL algorithm may be usefulin processing data from other instruments that use polarimetry designs like NICMOS,such as the Faint Object Camera and the Advanced Camera for Surveys.

Imaging Polarimetry with NICMOS 69
Acknowledgments. It is a pleasure to thank B. Stobie, L. Bergeron and A. Evansfor assistance with the (non-polarimetric) data calibration. Special thanks to Joel Kast-ner for the use of his COB observations of CRL 2688 in advance of publication, and tothe late Chris Skinner for his initial processing of the IRC +10216 data. DCH acknowl-edges support from the NICMOS project under NASA grant NAG 5-3042.
References
Axon, D., Auer, R., Baggett, W., Blades, C., Daou, D., Gilliland, R., Kutina, R., Ritche,C., & Stevens, M., 1996, NICMOS Instrument Handbook Version 1,0, SpaceTelescope Institute
Hines, D.C., Schmidt, G.D. & Lytle, D., 1997 in The 1997HSTCalibration Workshop,ed. S. Casertano et al. (Baltimore: STScI) [HSL]
Kastner, J. & Weintraub, D. 1994, ApJ, 434, 719Sahai, R., Hines, D. C., Kastner, J. H., Weintraub, D. A., Trauger, J. T., Rieke, M. J.,
Thompson, R. I. & Schneider, G., 1997, ApJ, 492, L163Schmidt, G.D., Elston, R. & Lupie, O.L., 1992, AJ, 104, 1563Skinner, C.J., et al., 1997, in prep.Simmons, J.F.L. & Stewart, B.G, A&A, 1985, 142, 100Thompson, R. I, Rieke, M., Schneider, G., Hines, D.C., & Corbin, M.R., 1997, ApJ,
492, L95Whittet, D.C.B., Martin, P.G., Hough, J.H., Rouse, M.F., Bailey, J.A. & Axon, D.J.,1992, ApJ, 386, 562

NICMOS and the VLTPula, Sardinia, May 26-27th 1998Wolfram Freudling and Richard Hook, eds.
Some Experiments with the Restoration of NICMOS Camera 2Images of OMC-1
Richard N. HookSpace Telescope – European Coordinating Facility, European SouthernObservatory, Karl Schwarzschild Str-2, D-85748, Garching, Germany, e-mail:[email protected]
Susan R. Stolovy
University of Arizona, Steward Observatory, Tucson, AZ 85721, USA, e-mail:[email protected]
Abstract. Imaging of the core of the OMC-1 region using NICMOS cam-era 2 through the F212N and F215N filters shows a wide variety of interestingstructure on scales of 0.2” at a very high dynamic range (Stolovy et al. 1998).The application of image restoration techniques, including multi-channel vari-ants of the Richardson-Lucy technique, offers the chance to enhance structureon the finest scales and also to suppress the prominent and richly structuredpoint-spread functions of the many bright stars in the images. These methodsare described and some preliminary results are presented.
1. Introduction
The NICMOS cameras on HST at longer wavelengths allow well-sampled diffractionlimited imaging with a very high dynamic range which is achieved using multiple non-destructive readouts of the arrays. During the check-out phase, soon after NICMOS wasinstalled, images were taken of the OMC-1 region using the F212N and F215N narrow-band filters to isolate the 2.12µm molecular hydrogen line. These images formed partof the NICMOS early release (ERO) data and their scientific content has been describedin Stolovy et al. (1998).
The high dynamic range, good sampling, excellent signal-to-noise ratio and sta-ble point-spread function of these NICMOS images suggests that image restorationmethods may be able to significantly enhance them. It was hoped that such process-ing, which enhances contrast and resolution, could permit better study of the complexmorphology of the highly structured environment close to the BN object. A particularproblem with NICMOS images is that the point-spread functions exhibit rich structureas a result of the complex obscuration pattern in the pupil coming from both the HSTOTA and the cold mask in the NICMOS dewar. Also, for very bright sources such asBN, the diffraction spikes can cover the entire array. The second aim of this work wasto try to suppress PSF structure in these images so allow the underlying image to bebetter seen.
This work is currently in progress and the results presented must be regarded ashighly provisional.
70

The Restoration of NICMOS Images of OMC-1 71
2. Data Processing
The standard NICMOS data reduction was performed using a customized version ofthe CALNICA software developed at STScI. There were seven images at each positionon the target and these were combined to produce five processed images in each filter atdifferent pointings and orientations with significant overlaps. The five images throughthe F212N filter form the basis of the image restoration attempts. This filter includesboth the molecular hydrogen emission and the continuum and hence shows the mostdiffuse structure. It also allows us to simultaneously look for sharpening ofH2 featuresas they tend to be spatially anti-correlated with the continuum emission (see Figure 3of Stolovy et. al 1998).
The first phase of the image restoration was to obtain an adequate PSF. For thecentral frame which includes the very bright BN object a PSF from the Tiny Tim sim-ulator (Krist & Hook 1997) was used. The most recent version of this code containsresidual aberrations measured by phase retrieval as well facilities for defocus and com-pensation for cold-mask shifts in the pupil. For the outer frames a PSF extracted from astar in a relatively uncrowded region was extracted and scaled after suitable backgroundsubtraction. The empirical PSF matched the central structure somewhat better than theTiny Tim one but had inadequate signal in the outer parts to model the full PSF of theBN object and small errors in the background subtraction led to significant artifacts.
Standard image restoration in crowded fields with strong, varying, backgroundlead to artifacts around bright stars. These are typically circular dark rings centred onstars and were found to be very pronounced in this NICMOS data. Instead of taking adirect approach, a two channel variant of the Richardson-Lucy method was employed(Lucy 1994; Hook & Lucy 1994, Hook et al. 1994). This method used a list of positionsof known point-sources which have fixed positions in combination with a backgroundimage which is constrained to be smooth on a user-specified scale. As iterations proceedthe intensities of the points model the stars and the background is modelled in the otherchannel. This second background channel is constrained to be smooth by the additionof an entropic term in the objective function being maximised. In the original versionof this method (known as PLUCY) the points were represented as delta functions in animage and hence had to be centred in pixels. In a newer enhancement (CPLUCY) thisconstraint is removed and the stars can be assigned positions freely at a subpixel level.This method was found to effectively remove the outer parts of stars images althoughminor residuals are visible close to the centres.
In the very difficult case of the bright BN object the diffraction rings are largelycleaned up but there are residuals further out in the spider spikes. The two-channelrestoration of the central frame is shown in Figure 1. A bright point-source, approxi-mately 0.9 arcsecs to the NW of the BN object becomes apparent when the blobs in thediffraction pattern very close to the centre are suppressed. The exact nature of the pointis unclear but it does not appear to be a ghost image from the filter.
After these cleaned images were produced they were block replicated by a factorof two and then restored using the standard Richardson Lucy algorithm to sharpen upstructure in the background after the stars have been suppressed. The results were thenmosaiced using the drizzling task in IRAF and the result is shown in Figure 2. Someresiduals are apparent in places but are localized.

The Restoration of NICMOS Images of OMC-1 72
Figure 1. A two channel restoration of the central NICMOS 2 image ofthe BN object through the F212N filter.
3. Discussion
The application of image restoration allows many fine-scale structures in these imagesto be more clearly seen and less affected by the PSFs from bright stars. This has allowedthe region close to the BN object to be better studied than before and a point source 0.9arcsecs to the NW has been noted but its exact nature is unclear. It may be a bright blobof dust and gas reflecting light from BN or it could be a previously undiscovered star.There is also intriguing faint asymmetric diffuse structure close to BN. The restorationsare limited by the accuracy of the PSFs available. Tiny Tim does a good but not perfectjob in this case, presumably because of an incomplete knowledge of the geometricalparameters of the NICMOS camera - residual aberrations, cold-mask shifts and so forth.Empirical PSFs taken from the images do not have enough signal to map the outerspider diffraction features which are visible around the BN object.
This deconvolution technique was successful in enhancing details in the extendedmolecular hydrogen “fingers” and “bullets” (see Stolovy et al. 1998). The southern,illuminated edge of the continuum “Crescent” feature north of BN is also sharpened.
This work is in progress and will be extended to determining the best way togenerally deconvolve narrow-band emission line images from NICMOS. This effort iscomplicated by the fact that the line and continuum filters have different PSFs. In thiscase, the F215N image would normally be subtracted from the F212N image to producethe molecular hydrogen image.
References
Krist, J.E., Hook, R.N., 1997, “The Tiny Tim Users Guide (V4.4)”, October 1997Hook, R.N. & Lucy, L.B., “Image Restorations of High Photometric Quality. II. Exam-
ples”, in “The Restoration of HST Images and Spectra”, STScI, 86Hook, R.N., Lucy, L.B., Stockton, A. & Ridgway, S., 1994, ST-ECF Newsletter 21, 16

The Restoration of NICMOS Images of OMC-1 73
Figure2. A mosaic of thesharpened restorations of thefiveF212N imagesof OMC-1
Lucy, L.B., 1994, “ImageRestorations of High Photometric Quality”, in “TheRestora-tion of HST Images and Spectra”, STScI, 79
Stolovy et al., 1998, ApJ, 492, L151

NICMOS and the VLTPula, Sardinia, May 26-27th 1998Wolfram Freudling and Richard Hook, eds.
NICMOS Software at the University of Arizona
E. Stobie, D. Lytle, I. Barg, and A. Ferro
NICMOS Project, University of Arizona, Tucson, AZ 85721, E-mail:[email protected]
Abstract. The NICMOS Software Group at the University of Arizona has builta number of software tools for processing NICMOS data. These tools have beendeveloped entirely within IDL or have IDL interfaces to other existing software.We will describe each of these tools.
1. Introduction
The NICMOS Software Group at the University of Arizona has developed a numberof software tools in IDL1 in support of data calibration and analysis for the NICMOSInstrument Definition Team.
2. Software Group
The NICMOS Software Group at the University of Arizona is composed of four mem-bers:
Irene Barg - NICMOS database management
Anthony Ferro - system software
Dyer Lytle - science software
Elizabeth Stobie - science software
3. Programming Environment
Group members develop both batch programs and interactive programs with graphicaluser interfaces using IDL. In some cases, GUI’s are developed for pre-existing softwaredeveloped in other programming environments. All software is developed and testedunder the Solaris and Linux Operating Systems. Users may retrieve any of the softwarein one of two ways:
by FTP -ftp://nicmos.as.arizona.edu/pub/NICMOS/software
from website -http://nicmos/as.arizona.edu
1IDL (Interactive Data Language) is an interactive analysis and visualization program written by ResearchSystems, Inc..
74

NICMOS Software at the University of Arizona 75
4. Programs Available
The software tools developed within the software group at the University of Arizonamay be divided into six main categories: observation planning, calibration, editing,display, analysis, and general utilities.
4.1. Planning
Cntrate, a graphical user interface (GUI) layered on the IRAF/STSDAS countratetask which evaluates the countrate for a given target and observing mode.
HSTField, a procedure based on the IDL program, Overlay, developed by Eliot Malu-muth at Goddard Space Flight Center, but has been heavily modified to our purposes atthe University of Arizona. The program displays an image of the sky with an overlayof the Space Telescope apertures. The user may pick the prime aperture, orient thetelescope, mark guide stars, get RA and Dec as well as Ecliptic coordinates.
Simimage, an IDL GUI layered on the IRAF/STSDAS task “simimg”, which com-putes simulated images for the HST imaging instruments FOC, NICMOS, STIS, andWFPC2. Simimage allows a convenient mechanism for determining the necessary pa-rameters and provides a display of the final result as both an image and shaded surfaceplot. Simimage will also produce a group of dithered images across the object field.
4.2. Calibration
Buildref, an IDL program for building reference files from single FITS images bystitching together single-image FITS files into multi-extension FITS files. The userprovides a command file that specifies the input images to be combined, the method ofcombination, and any keyword additions or changes that should be made to the standardNICMOS header template files that are used. The outputs of the program are NICMOSstandard multi-extension FITS files that are compatible with calnica.
Calnica, an IDL replication of the calnica task in IRAF/STSDAS. Its single argu-ment is the list of files to process. The outputs are a calibrated image with associatedextensions and, in the case of multiaccum data, an intermediate file with each readoutfully calibrated excluding the cosmic ray rejection. If noIMA file is desired, the usermay include the command, ‘noima’ at the beginning of the list file.
Quad Edit, an interactive program for reviewing the bias levels from one quadrant ofa NICMOS image to another and adjusting the individual quadrants. The final resultmay be saved to a FITS file.
4.3. Editing
Cal Edit, an interactive program used to edit FITS header keywords in preparationfor re-calibrating NICMOS data with Calnica. The display consists of a list of thecalibration switch values and when appropriate their associated reference files. Bothcalibration switches and reference files may be modified easily using the action andradio buttons in the widget.

NICMOS Software at the University of Arizona 76
FHE, (FITS Header Editor ), an IDL program for editing headers of groups ofFITS files. It is particularly well suited to editing FITS files with multiple image ex-tensions. Any keyword in the primary header or any extension header (excluding thereserved FITS keywords) may be edited. Keywords may be modified, added, or deleted.
FPHE, (FITS Primary Header Editor ), an IDL program designed for editing theprimary headers of FITS files with image extensions. It is an optimized version of FHEwhich edits the headers in place and therefore will only modify the primary headers.Keywords may be modified, added, or deleted.
Maskedit, an interactive program used to edit bad pixel masks. The inputs are theFITS data image and the FITS mask image. There are various keywords that can beused on input to scale the image and to set the “good pixel” value for the mask. Theprogram displays the data image and marks the “bad” pixels based on values in themask image (bad pixels are circled). The user may then set or unset masked pixelsusing the mouse buttons. Finally, the new, edited, mask may be saved to a file.
4.4. Display
Multi Disp, an interactive program for creating a display of multiple sub-imagesfrom sections of one or more images where each sub-image has its own zoom fac-tor and image stretch. Each sub-image may have a single line caption. The user mayselect the number of sub-images per row and column with the default rowsize=4 andthe default colsize=6. Each of the individual sub-images may be saved to a FITS fileand the entire display may be saved and restored.
SDW, (Super Display Widget ), an interactive program designed to be a generalpurpose FITS image viewer. It allows general image display of multi-extension FITSfiles, zooming, bad pixel masking, log scaling, rudimentary pixel editing, min/max scal-ing, general IDL colormap adjustment, cursor readback, spread sheets of pixel values,header display, and access to all image extensions of a NICMOS multi-extension file.
Trucolor, a program for displaying and printing true color images by loading the threedisplay color tables, red, green, and blue with separate images and overlaying the result.Each color table can be scaled individually to obtain the desired “look”. The imagesmay also be log scaled to bring up background detail. This program works on systemswith 8-bit or 24-bit color display and produces appropriate output postscript files whenthe print button is pressed.
4.5. Analysis
FLC, (FITS List Calculator ), a program to process large groups of FITS filestogether by creating data lists. The program parser supports a simple command syn-tax including the ability to process pre-defined scripts, do-loops, and if-then-else con-structs as well as arithmetic operators, native IDL commands, and operating systemcommands. The program has an image scan feature to view a list of images in a movie-like format, a more detailed graphics display which includes the image header, fullimage, single quadrant or zoomed region of the image, and the image histogram. Thereare also windows for editing pixels in an image and for building lists. The programsupports four data types: lists, images, arrays, and scalars. The user may customize

NICMOS Software at the University of Arizona 77
the number of each data type by editing the user definitions file. Several mathematicalfunctions for lists are pre-defined for convenience including the computation of imagestatistics, pixel statistics, medians, means, and first differences. A sample display ofFLC appears in Figure 1.
Figure 1. Many of the display and text windows used by FLC.
IDP3, ( Image Display Paradigm #3 ), a program for manipulating data imagesemploying a powerful but easy-to-use graphical user interface. It allows the user towork with a collection of images and display one or more images in a graphics windowsimultaneously. Images may be individually moved, scaled, and rotated to bring imagefeatures into registration. Each image may be displayed by adding it to the compos-ite image in the display, by subtracting it from the composite image or by one of theother various image functions (divide, XOR, average, etc.). Idp3 provides a region-of-interest pop-up tool for intensive examination of sub-regions of the main display.There are cross-section plots, masks, surface plots, statistics, spreadsheets displays andother tools at the user’s disposal. Final combination images may be saved to FITS files.These output images contain descriptive headers detailing the settings in IDP3 at thetime the image was written. A sample display of IDP3 appears in Figure 2.
Lucy, a program that generates a deconvolved image from an input image and pointspread function (PSF) using the algorithm developed independently by Richardson

NICMOS Software at the University of Arizona 78
Figure 2. Many of the display and text windows used by IDP3.
(1972) and Lucy (1974). The widget is based on the original and accelerated algo-rithms with optional damping developed by White (1993) at STScI. The IDL programdisplays the original data as well as the result at the end of each iteration.
Niclook, a quick look analysis tool for NICMOS data. The widget contains threedisplay windows: full window, zoom window, and graphics window. Statistics may becomputed for the full or zoom window. World coordinates may be overlaid on the fullwindow and coordinates may be printed for any pixel in either the full or zoom window.Image arithmetic may be done on any of the five loaded images using arithmetic oper-ators or IDL functions. Two images may be blinked in the full window. All commandsare logged in a journal file.
Nicmosaic and Nicstikum, tools for mosaicing NICMOS images. The inputs for Nic-mosaic are a list of images to mosaic and, optionally, a table of position data previouslyoutput from “Nicmosaic”. If no table is given, the program attempts to line up the inputimages as best it can based on the world coordinate information in the image headers.Image rotation and fractional pixel shifts are used to accomplish this alignment. Once

NICMOS Software at the University of Arizona 79
the data are loaded, the user may select two of the images (called the primary and thesecondary images) and blink these two images. The user may then shift and rotate theselected primary image to improve the alignment using the buttons and value fieldsprovided. On exiting, a table of positions is written that can be used by the program“Nicstikum” to create a final, mosaic image.
Nicphot, an IDL graphical user interface wrapper for the DoPHOT stellar photometryprogram written by Mario Mateo, Abhijit Saha, and Paul Schechter. Nicphot providesfacilities for computing the FWHM of an object, determining the image background,editing the DoPhot parameter file, executing DoPHOT, and displaying the result withdetected objects removed. Since DoPHOT requires the image data as 16-bit integersNicphot will rescale the data and create a new FITS file with extension.FITSX if thedata are not 16-bit integers.
Polar and Polarplot, two programs that have been written for the analysis of NIC-MOS polarization data. “Polar” is a program that takes three images (one from eachpolarizer) as input, solves the linear equations, and produces as output the “I”, “Q”,“U”,“P”, and “ Θ” images. “Polarplot”, shown in Figure 3, allows the user to overlaythe polarization vectors on the intensity image. This program has many user adjustableparameters to customize the plot such as intensity image color table manipulation, axis,contour map, and polarization vector color manipulation, contour overlay, and thresh-olds for polarization intensity.
4.6. Utilities
Delread, a batch program to delete one or more readouts (imsets) from araw or imamultiaccum file.
Keydump, a batch program for printing select keywords from the headers of NIC-MOS data files. All keyword values are taken from the primary header of the file (raw,ima, cal, mos ). If the positions option is selected the target right ascension and
declination are printed in addition to the other header information. When the refilesoption is selected the values of the reference file keywords are printed.
Kwlist, a batch program to print a table of keyword values for the specified list offiles. The desired keywords are defined in a string array and the files to be read aredefined in an ASCII text file. The information is printed to the user’s screen and to thespecified output file.
Nic Help, an interactive tool for querying the help files of all IDT developed soft-ware. All programs are listed and as one is selected a single line description is given.The user may display or print the entire help file.
Simplefits, a batch program to separate the readouts (IMSETs) of NICMOS raw ( raw )or intermediate (ima ) multiaccum files into individual FITS files. The output filescontain a single header (merging the primary and science image extension headers)and the science image. All other image extensions (ERR, DQ, SAMP, andTIME) arediscarded.

NICMOS Software at the University of Arizona 80
Figure 3. Example Polarplot display, an intensity image is shown over-plotted with polarization vectors.
Unstitch, a batch process to separate the readouts (IMSETs ) of multiaccum files intodifferent files. Output files are named by replacing the last character of theIPPPSSOOTdesignation with the readout number. Readouts count from one to a maximum of 26 inforward time order (normal NICMOS files are in reverse time order). The inputs are anASCII text file of filenames and an optional path parameter.
5. Web Interface to NICMOS Archive
In order to support our geographically diverse team members, we have developed anumber of web based forms and scripts to allow them to search for and retrieve datasets. To minimize the network traffic, we have developed our own database system atthe University of Arizona, which includes NICMOS data to which we have access. Viathe web this database can be queried to locate specific data of interest. Authorized userscan then request copies of the data via the network.
Selected proposal types (GTO/NIC, CAL, PAR, ENG, and SMOV) are monitoreddaily and are downloaded to a database servers at Steward Observatory. The data storedlocally represents a small sub-set of the data in the HST data archive at the Space Tele-

NICMOS Software at the University of Arizona 81
scope Science Institute. In addition, a database of observed and simulated (generatedby the Tiny Tim program) NICMOS point spread functions (PSFs) is being developedfor team use. Information about the UofA NICMOS Databases may be obtained by fol-lowing the appropriate links from the web site:http://nicmos.as.arizona.edu/ .
Acknowledgments. We are grateful to the NICMOS Instrument Definition Teammembers and their Post Docs for their input and support in our software development.Their patience in testing software as it evolves is much appreciated.
References
Richardson, W.H., 1972, J. Opt Soc. AM 62, 55Lucy, L. B., AJ 79, 745White, R. W., 1993, Restoration, Newsletter of STScI’s Image Restoration Project, 11

NICMOS and the VLTPula, Sardinia, May 26-27th 1998Wolfram Freudling and Richard Hook, eds.
STScI NICMOS Software
H. BushouseSpace Telescope Science Institute, 3700 San Martin Drive, Baltimore, MD21218, Email: [email protected]
Abstract. The Space Telescope Science Institute (STScI) has various soft-ware tools available for calibrating and analyzing Near Infrared Camera andMulti-Object Spectrometer (NICMOS) datasets. These include the tasks usedin the STScI pipeline, tools to generate the reference files used by the calibrationpipeline tasks, and general image analysis, manipulation, and arithmetic tasks.
1. Introduction
All STScI NICMOS tasks can be run from within the IRAF/STSDAS environment andare written either in the native IRAF SPP language, the ANSI C language, or as IRAFcl scripts. The two main tasks used to calibrate and reduce NICMOS observations arecalnica , which applies instrumental calibrations, andcalnicb , which processes asso-ciated sets of observations. There are also several tools available for use in generatingthe calibration reference files needed bycalnica , such as bad pixel masks, detectorread noise images, detector non-linearity corrections, and dark current and flat fieldimages. Any existing IRAF and STSDAS tools can be used for the analysis of NIC-MOS datasets, but there are several that have been written specifically for the five dataarray grouping (known as image sets) that is used for storing NICMOS images. Thesetasks include tools for displaying images with overlayed data quality masks, image setarithmetic and statistics, and image set combining. There are also prototype tools formeasuring and removing residual DC offsets from calibrated NICMOS images. Briefdescriptions of these tasks are given in the following sections.
2. Calibration Pipeline Tasks
The two calibration pipeline tasks arecalnica andcalnicb . Calnica is used to ap-ply instrumental calibrations to individual datasets, whilecalnicb is used to processassociated sets of NICMOS images. The calibrations applied bycalnica include theremoval of standard instrumental signatures, such as dark current subtraction, detec-tor non-linearity correction, and flat fielding, as well as NICMOS-specific processing,such as subtraction of MultiAccum-mode zeroth read images, and the combining ofMultiAccum readouts into a single image.
Calnicb is applied to associated sets of NICMOS images, which must have al-ready been processed withcalnica . Major steps performed bycalnicb include thecombination of multiple images obtained at individual sky positions, calculation and
82

STScI NICMOS Software 83
subtraction of the HST thermal background signal, and mosaicing of images obtainedin a dither pattern.
See Bushouse et al. (this volume) for more details about the calibration pipelinetasks.
3. Reference File Tools
There are several tools available within the STSDAS packagehst calib.nicmos thatcan be used to generate some of the reference files used by thecalnica pipeline task.They are:
msbadpix - Detects bad pixels in NICMOS images and produces a bad pixel mask(MASKFILE reference file)
msreadnoise - Measures readout noise in NICMOS images and produces a read-noise image (NOISFILE reference file)
msstreakflat - Processes Earth “streak flat” images and produces a destreaked flatfield image (FLATFILE reference file)
ndark - Builds a NICMOS DARKFILE reference file from individual dark currentimages
nlincorr - Computes a polynomial fit to the non-linear NICMOS response andproduces a NLINFILE reference file
4. Image Analysis and Reduction
The STSDAS packageshst calib.nicmos and toolbox.imgtools.mstools con-tain the tasks listed below, which are useful for image analysis. The tasks with namesbeginning with the letters “ms” are set up to handle the five data array grouping ofNICMOS images, known as “image sets”.
markdq - Mark data quality (DQ) flags on a displayed image
ndisplay - Display an image and superimpose DQ flags
pstack - Plot a stack of pixel values from a MultiAccum image
msarith - Image arithmetic
mscombine - Combine images with rejection of outliers
msstatistics - Compute image statistics
5. Under Development
In addition to the software tasks listed above, which are all available in STSDAS v2.0.1,there are several tasks which, at the time of this writing, are still under development.

STScI NICMOS Software 84
The most notable of these are various tasks that measure and remove the quadrant-dependent DC offsets, often known as “pedestal”, which appear in some NICMOSimages. Two of these experimental tasks arenped andpedsky , both of which are cur-rently implemented as IRAF cl scripts. They estimate the pedestal level in each imagequadrant by attempting to minimize the flat-field residuals that get imposed on the im-age when the flat-field is applied to the constant pedestal level. Once the algorithms arecompletely developed, they will be rewritten and released as public STSDAS tasks.

Part 3. NICMOS Science

NICMOS and the VLTPula, Sardinia, May 26-27th 1998Wolfram Freudling and Richard Hook, eds.
NICMOS Coronagraphic Surveys-Preliminary Results
Glenn Schneider
University of Arizona, Tucson, AZ
Abstract. A search for previously unknown low-mass (giant planet and browndwarf) companions to stars in the solar neighborhood, and circumstellar dustdisks around main sequence stars by direct coronagraphic imaging has been un-dertaken by the NICMOS Instrument Definition Team (IDT). Observations ofa carefully selected candidate list of100 stars began on February 28, 1998,more than a year after the start of the NICMOS mission. Using a differen-tial imaging strategy, as originally demonstrated in the second Servicing Mis-sion/Observatory Verification (SMOV) program, we were able to achieve sta-tistically significant detections of substellar companions at 1.6µm with a ∆Hof 10 at separations as close as 0.5” (corresponding to 2.5 AU at 5 pc), withincreasingly better performance at increasing radii. With nearly two dozen can-didates now observed, and a better understanding of the focal plane stabilityand target acquisition precision we report on the efficacy of the program fordetecting transitional objects into the 3 to 5 Jupiter mass regime.
1. Introduction
A systematic survey of nearby stars for giant planet and brown dwarf companions, andcircumstellar (or protoplanetary) disks, is a cornerstone of the NICMOS IDT’s Environ-ments of Nearby Stars (EONS) program. In carrying out this survey we are attemptingto address some fundamental questions in the arena of stellar and planetary systemformation. We seek to learn if indeed there is there a continuity of objects across thesub-stellar mass spectrum bridging the main sequence to planetary objects. If so thenat what distances will such objects be found from their primaries and how might thisbe biased by the characteristics of their primaries or companion objects? What impli-cations will such discoveries have for our understanding of formation mechanisms?
Shedding light on these, and related questions, is a major element of the NASA’sOrigins initiative which contains at it’s core the establishment of scientific activitiesto investigate the birth and early evolution of stars and planets (Dressler, 1996). TheNICMOS IDT embraced this theme in the establishment and formulation of our EONSsearch program. From the ill-constrained low-mass end of the mass-luminosity func-tion (<0.2 solar masses) through the transitional regime of brown dwarfs (<0.08solar masses), and down into the realm of giant planets NICMOS provides a uniqueresource for exploration. The EONS search programs were designed to identify low-mass and sub-stellar companions and over two decades in the mass-spectrum as well as
86

NICMOS Coronagraphic Surveys–Preliminary Results 87
circumstellar disks which may be potential harbingers of planetary formation.
2. The EONS Coronagraphic Surveys
The design, fabrication, and incorporation of a coronagraph into NICMOS camera 2, asdiscussed in detail by Schneider, et al. (1998), allows us to push our investigations intopreviously and other-wise unreachable corners of the observational parameter spacesassociated with the close environments of stars. The NICMOS coronagraph is capableof providing detections of non-stellar companions as faint as H = 22, 10 to13 mag-nitudes fainter then their primaries at separations of 0.375” to3.0”, should they exist.The EONS programs concentrate on these astrophysically and dynamically interestingspatial regions of the search parameter space. For the stars in our sample this coversminimum physical separations of 1.2-50 AU at the inner spatial detection limit. Thelower mass limit depends on age, distance, and spectral type, but can be as low as 3 to 5MJupiter for many of our targets. The EONS surveys are segregated into three comple-mentary observing programs (designated 7226, 7227 and 7233 by STScI), delineatedprimarily by the principle characteristics of the candidate stars,which cover the full ac-cessible range of the observable sub-stellar search space.
The 7226 candidate list contains 43 very young main-sequence stars with meandistances of30 pc. The median age for the candidates with well established ages is<90 Myrs and contains at least 6 candidates with ages as young as<10 Myrs (seeFig. 1), including several members of the TW Hyd association. Because of the extremeyouth of these objects any low-mass brown dwarf and planetary companions will stillbe in a higher luminosity phase and thus easily detectable. For example, in its first 10Myrs a 10MJupiter brown dwarf would have a luminosity exceeding 104 solar lumi-nosities (Kulkarni, 1997). Typical separations observable with NICMOS are near theempirical maximum in the binary distribution of stars (20 to 40 AU), which also cor-responds to the mean distance of the giant planets in our own solar system.
The 7227 candidate list contains 31 M-dwarf stars which are (a) nearby (d<6pc) with spectral types later thanM3.5, (b) young (age<100 Myr) with (d<25pc), and (c) spectrally the latest known (i.e.,“ultra-cool” stars later thanM8.5), withsome overlaps (see Fig. 2). Because of the proximity of many of the stars in this sampleto the sun, companions as close as 1.2 AU from their primaries may be detected at theinner radius of our search space.
The 18 candidate stars in the search for circumstellar dust disks (7233) are primar-ily main sequence stars with IRAS IR excesses,τ(dust) > 103, and other indicatorsof the possible presence of disks. In addition to H-band imaging for the brighter starsin this program we are obtaining multi-spectral images at 1.71µm (HCO2+C2 con-tinuum), 2.04µm (methane band), and in the line spectra of Paschen-α (1.87µm) andBracket-γ (2.15µm).
Our EONS surveys are obtaining single-color coronagraphic images aimed at dis-covering sub-stellar companions utilizing the F160W filter (1.4 - 1.8µm) where theNICMOS coronagraphic performance is optimized. This wavelength band also corre-

NICMOS Coronagraphic Surveys–Preliminary Results 88
Figure 1. Distibution of stellar ages for the young stars candidates (7226)
Figure 2. M-dwarf candidate distances and spectral sub-types (7227).
sponds to the strong emission in GL 229B (Burrows, et. al, 1997), GD 165B (Zuck-erman & Becklin, 1992) and several of the DENIS survey candidate brown dwarfs(Delfosse, et. al, 1997), as well as to strong reflections in Jupiter and Titan. Puta-tive discoveries of brown dwarf and giant planet companions arising from the above

NICMOS Coronagraphic Surveys–Preliminary Results 89
single-epoch searches must be subsequently confirmed and the objects characterizedin follow-up second-epoch observations.Such follow-up observations are required tosort out field-objects from true companions by common proper motions and/or colorindices and to obtain multi-color imaging to establish luminosity ratios of such com-panions. All of the stars in the M-dwarf survey, and most of those in the young starsprogram, have sufficiently high proper motions to allow follow-up confirmatory obser-vations to be carried out in the shortened NICMOS lifetime. It is anticipated that forsome regimes of the search-space ground-based follow-up using facilities such as Keck,Lick, or VLT may be possible.
3. Anticipated and Current Coronagraphic Performance
An aggressive 17-orbit commissioning, performance verification, and calibrationpro-gram executed during SMOV allowed us to ascertain the true performance limits ofthe coronagraph (Schneider & Lowrance, 1997; Schneider, et. al, 1997) and opti-mize both its operation and our observing programs. Performance profiles for NIC-MOS camera 2 direct, coronagraphic, and differential imaging derived from that testprogram are shown in Figure 1 of Lowrance, et. al. (1998), elsewhere in these confer-ence Proceedings. By subtracting coronagraphic PSFs at different spacecraft roll anglesthe background diffracted and scattered energy in the unocculted PSF-wings of an oc-culted primary star can be reduced to approximately one-millionth the peak intensityof the star at a radial distance of 1”, or about 105 at 0.5”. This is an improvement ofmore than two orders of magnitude over the already low backgrounds afforded by thediffraction-limited, highly stable, PSF. This represents a very significant gain over thecurrent generation of AO ground-based coronagraphs (Sandler, 1997) and is unique toNICMOS+HST. The basic observational strategy, also described by Lowrence,et al., isillustrated in Fig. 3.
Due to a now recognized, and understood, deficiency in the target acquisition-process the anticipated performance levels of differential coronagraphic observations(as demonstrated in SMOV) have been somewhat compromised. As a result the lim-iting sensitivities, and ultimate detection limits for observations made in the first threemonths of the EONS programs have fallen short of their performance goals due to lo-cally increased backgrounds of two stellar magnitudes or more in a spatially dependentfashion. Corrective action for subsequent observations has been taken in the form ofan operational workaround, and a soon to be implemented flight software upgrade. Astrategy for recovery of these early coronagraphic data has been devised by the NIC-MOS IDT.
The first 34 coronagraphic target acquisitions in the EONS program exhibited large(up to1 pixel) pointing errors due to the above mentioned flight S/W problem. Acqui-sitions are done in pairs, approximately 20 minutes apart, in the same target visibilityperiod. The spacecraft is rolled 30o between acquisitions to obtain coronagraphic im-ages at two orientations. The origin of the graph in Fig. 4 is the desired placement ofthe target in the coronagraphic hole (the “low scatter point” of the coronagraph). Toachieve the detection limits and sensitivities required for the full search space of theEONS programs afforded by the coronagraph the maximum deviation from the low

NICMOS Coronagraphic Surveys–Preliminary Results 90
Figure 3. A candidate star is placed in the coronagraph and observed attwo orientations differing by 30o, by rolling the spacecraft. The corona-graphic PSF co-rotates with the detector, a companion rotates about the centerof the coronagraphic hole. The images are subtracted to remove theprimaryPSF, and the image conjugates (positive and negative residuals) are un-rotatedand coadded. Bi-cubic interpolative resampling is done only to show the re-covery of the first Airy ring for this low-mass companion star.
scatter point for an acquisition pair should be no more than 0.25 pixels, with a disper-sion for the two points in the pair of no more than 0.1 pixels.
To “recover” the observations targets with similar mis-pointings may bepaired andsubtracted after appropriate flux-scaling. In the absence of large spacecraft “breath-ing” excursions, the magnitude of the subtraction residuals is greatly reduced. This isdemonstrated in Fig. 5. The subtraction of two identically exposed and reduced, butdifferentially mis-pointed, coronagraphic images of the same target (805-06 in Fig. 4)is shown in the top left panel. The field was rotated 30 degrees about the target star be-tween observations. The differential pointing error resulted in a mis-registartion of thetarget in the coronagraphic hole by 0.16 pixel (with an absolute pointing error of1.3pixels).The panel on the top right shows the subtraction of the “positive roll” image ofthe same target (805) using a much better position-matched flux-scaled PSF (S62).Theregistration of the two PSF cores was three times better then the roll subtraction shownon the left. (The large dark spot below the target is a moderately bright field star inthe reference PSF image). The visually obvious improvement in the image subtractionis quantified in the histogram of subtraction residuals. Using a more closely positionmatched PSF the FWHM of the residual distribution function is reduced by a factor of4. Unfortunately, only a few such weii matched mis-pointing pairs exist for the alreadyobtained data. The NICMOS IDT is now designing a post S/W fix observing programto obtain reference/calibration coronagraphic PSFs to recover, to a large degree, theobservations already in hand.

NICMOS Coronagraphic Surveys–Preliminary Results 91
Figure 4. Pointing errors for the first 17 targets observed in the EONS pro-grams. Paired acquisitions should be< 0.1 pixels apart and centered within0.25 pixels of the low-scatter point (0,0) of the coronagraph. The geometricalradius of the coronagraphic hole is 4 pixels.
4. Summary
Due to the complexities of commissioning the camera 2 coronagraph the EONS searchprograms received a late start in the NICMOS mission. At this date approximately1/5 of the sub-stellar companion and circumstellar disk survey observations have beencompleted. The problem in the target acquisition process resulted in degraded pointingand target centration performance for these observations. None-the-less, the instrumen-tal performance levels of the coronagraph itself, as originally demonstrated in SMOV,continue to meet the needs of the EONS programs. Remedial actions have been takento mitigate the pointing problem for the remainder of the NICMOS lifetime, and aneffective strategy to recover the sensitivity and detection limits from observations takenin the first three months of the program has been developed. With these in place weareconfident that NICMOS will allow us to successfully probe the circumstellar environ-ments of nearby stars and address the fundamental questions related to theorigins ofstellar and planetary systems raised in our introductory comments.

NICMOS Coronagraphic Surveys–Preliminary Results 92
Figure 5. Significant degradation in performance (increase in PSF sub-traction residuals) results from small pointing errors. The improvement inperformance by subtracting a better position matched (flux-scaled) PSF is il-lustrated (right). The residual brightness gradient near the hole is due to thesmall remaining pointing offsets between the two differenced images.
5. Acknowledgments
We would like to thank both STScI and Goddard Space Flight Center’s Code 512 fortheir responsiveness in the consideration and implementation of corrective actions forthe augmented target acquisition pointing deficiencies.
This work is supported by the National Aeronautics and Space Administration un-der NASA grant NAG-5-3042.
References
Burrows,A., Hubbard,W., Lunine,J., Marley,M., Huillot,T., Saumon,D. & Friedman,R.,1997,APS Conf. Series 119, 9.
Delfosse,X., Tinney,C.G., Forveille,T., Epchtein,N., Bertin,E., Borsenberger,J., Copet,E.,deBatz,B., Fouque,P, Kimeswenger,S., Le Bertre,T., Lacombe,F., Rouan,D. &Tiphene,D., Astron. Astrophys. 327, L25.
Dressler,A., 1996, HST and Beyond: Exploration and the Search for Origins, AURAInc.
Kulkarni,S., 1997, Science 276, 1350.

NICMOS Coronagraphic Surveys–Preliminary Results 93
Lowrance,P.J., Becklin,E.E., Schneider,G., Hines,D., Kirkpatrick,D., Koerner,D., Low,F.,McCarthey,D., Meier,R., Rieke,M., Smith,B.A., Terille,R., Thompson,R., &Zuckerman,B.,1998, ESO Conference Proceedings (NICMOS and the VLT),in press.
Sandler,D., 1997, ASP Conf. Series 119, 175.Schneider,G. & Lowrance,P.J., 1997, SMOV/7052 Test Report,
(htt p : ==nicmosis:as:arizona:edu=gschneid=7052 PS=)Schneider,G., Smith,B.A, Terrile, R.J. & Meier, R., 1997, SMOV/7157 Test Report,
(htt p : ==nicmosis:as:arizona:edu=gschneid=7157 PS=)Schneider,G., Thompson,R.I., Smith,B.A. & Terrile,R.J., 1998, SPIE Conference Pro-
ceedings Series 3356, in press.Zuckerman,B. & Becklin,E.E., 1992, ApJ 386, 260.

NICMOS and the VLTPula, Sardinia, May 26-27th 1998Wolfram Freudling and Richard Hook, eds.
A Coronagraphic Search for Substellar Companions to Young Stars
P.J. Lowrance1, E.E. Becklin1, G. Schneider2, D. Hines2, J.D. Kirkpatrick3, D.Koerner4, F. Low,2 D. McCarthy,2 R. Meier5, M. Rieke,2 B.A. Smith5, R.Terrile,6 R. Thompson,2 B. Zuckerman1
1University of California, Los Angeles, CA2University of Arizona, Tucson, AZ3Infrared Processing and Analysis Center (IPAC), Pasadena, CA4University of Pennsylvania, Philadelphia, PA5Institute for Astronomy (IFA), University of Hawaii, Honolulu, HI6Jet Propulsion Laboratory (JPL), Pasadena, CA
Abstract.We are using NICMOS to search for very low-mass stellar and sub-stellar
companions around nearby, young, main-sequence stars. With the coronagraphon Camera 2 and the F160W filter (1.4-1.8µm), we search in the region 0.400-400
from the target star. To greatly reduce the scattered light near the hole, we imageat two roll angles centered on the star and separated by 30 degrees. The lowermass limit of a detectable companion depends on the mass, age, and distanceof the target star as well as the angular separation between star and companion.For several of our targets that are 10-50 Myr old, this lower mass limit could beas low as 10 Jupiter masses.
We display preliminary results using this technique. A stellar-like objectwith ∆H=5.3 was discovered 0.009 from HD 102982. From the distance andage of the primary, this companion is most likely a low-mass M star. Recentobservations demonstrate that we can obtain a S/N = 5 (clear detection) on asecondary with∆H=12 at a separation of 1”.
1. Introduction
Searches for sub-stellar companions to main sequence stars and white dwarfs beganabout a decade ago utilizing both infrared (photometric) and optical (radial velocity)techniques. Brown dwarfs are objects thought to form like stars, but with insufficientmass ( 0:08M = 80MJupiter) to sustain hydrogen (H) burning within their interior.In contrast, giant planets like those in our solar system are thought to form throughagglomeration of H and He around a rocky, icy core within a protoplanetary disk arounda star. Planets are usually split into Jovian (gaseous) and Terrestrial (rocky), but browndwarfs are more like Jovian planets than Jovian planets are like Terrestrial planets.Some have suggested brown dwarfs might be a third class of planets, since they shouldnot be classified as stars, as they do not have thermonuclear fusion in their cores.
94

Coronagraphic Search for Substellar Companions 95
The best brown dwarf candidate for several years was the companion to the whitedwarf GD 165 (Becklin& Zuckerman 1998, Zuckerman & Becklin 1992). For eightyears it had the coolest temperature (1800K) of any dwarf star, but it remained unclearif it was a very low-mass star or high-mass brown dwarf. Recent “all-sky” near-infraredsurveys (2MASS & DENIS) may soon clarify whether 1800K objects are minimum-mass stars or brown dwarfs. In 1995, the first undisputed brown dwarf was discoveredas a companion to the M1V star GL 229 (Nakajima et al. 1995). The methane feature inthe infrared spectrum of the companion clearly constrains its temperature below 1000K(Oppenheimer et al 1995), and models place its mass between 30 and 50MJ (Burrowset al 1997).
The last two years have brought many discoveries. Presently, we now have severalsuspected isolated brown dwarf objects in the Pleiades star cluster and solar neighbor-hood, and several planets around main-sequence stars. Yet, GD 165B and GL 229Bremain the only substellarcompanionsto have beendirectly imaged. Low-mass objectsare intrinsically faint and therefore hard to detect directly close to bright stars. With theresolution and current infrared capability of NICMOS on the Hubble Space Telescope,we can now attempt this daunting task.
1.1. Searching around young stars
Brown dwarfs and giant planets are more luminous when they are young, as they arestill at a large radius, gravitationally contracting, and hot. Models of substellar objects(Burrows et al 1997) show thatL t1:3M2:24 based on cooling curves derived fromatmospheric physics. If these models are correct, we can expect a brown dwarf/planetof 10MJ will be above 106L when it is 108 years old.
Numerous young stars within 50 pc of the sun have ages similar to the Pleiades( 108yrs). This is deduced via inter-comparison of lithium abundance, Hα emission,Ca H & K line emission, kinematics, X-ray emission, and rotational velocity. Ageestimates can be calibrated against samples of T Tauri stars and stars in young, nearbyclusters such as the Pleiades and the Hyades and distances can be determined fromparallax measurements. As part of our GTO program we have assembled a list of50stars thought to be young and close, with median age and distance of 0.1 Gyrs and 33pc,respectively.
The main problem with trying to image brown dwarfs or giant planets aroundmain-sequence stars is the overwhelming brightness of the primary. A substellar com-panion could be as much as 108 times fainter than the star it orbits. A brown dwarfmakes up some of this in the infrared, where it radiates most of its power, and is brighterwith youth, but the primary can still be 104 times brighter. The orbit of a high massplanet is thought to be rather close to the star, as well, so high resolution, achievablefrom space, is needed. We will conduct our imaging survey with the coronagraph onCamera 2 at 1.6µm (F160W), which corresponds roughly to the H-band filter on theground.
However, not all sources in the field of view around the primary will necessar-ily be companions. Background objects could be stars or galaxies. With the excellentresolution on NICMOS, galaxies are easy to distinguish since they appear extended.As for point sources, the ultimate determinant of companionship is common propermotion. The target stars have been chosen for location away from the galactic plane:j b j> 15. Therefore, we expect less than 0.02 background stars within 400 at H=22for each star (D.McCarthy, private comm). Detections will be followed up with addi-

Coronagraphic Search for Substellar Companions 96
tional direct imaging to confirm companionship. For a candidate close-in (< 400), forwhich the proper motion is enough (> 0:0008/yr), we will follow up with a later orbit onNICMOS. This will require giving up another object on our list. NICMOS has a limitedlifetime and will be unusable after Dec 98. If the candidate is farther from the target starthan 400, then ground-based follow-up will be possible to check proper motion. For closeobjects with smaller proper motions, or those we are unable to follow-up, we must waitfor Adaptive Optics (AO) at Keck or Lick observations for confirmation. Keck mighthave a workable AO system by the first part of 1999 (Larkin, private comm).
Because the coronagraph is in a corner of the detector, this survey will only fullysample 0:005 to 400 around the primary star. At the average distance of 30 pc, this corre-sponds to 15-120 AU. This will sample the empirical maximum in the binary distribu-tion of stars as well as the average distance of the giant planets in our own solar system(Duquennoy & Mayor 1991).
2. Observations with NICMOS
Our observational strategy places the target stars behind the coronagraph on Camera 2.The coronagraph is actually a hole in one of the mirrors of the optical path and com-bined with a Lyot stop, reduces the amount of light in the Airy rings of the point spreadfunction rather than merely blocking light. With the target behind the coronagraph, wereduce the amount of light at the edge of the coronagraph by a factor of 4-6 (figure1) compared to direct imaging. We have developed an observing strategy to go evendeeper, as explained below.
The Hubble Space Telescope has the ability to slew in three directions: x, y, andθ.In order to keep the target star in the same position behind the coronagraph, as well assimplify the removal of the stellar profile, we designed two observations of the star atdifferent spacecraft orientations (∆θ) separated by 30 degrees. Therefore, the observingstrategy is to place the young star behind the coronagraph, observe in the F160W filter(1.4-1.8µm) for about 700s, roll the telescope 30 degrees, and observe again for 700s.When we subtract the two images, the background from the star should subtract out(not quite completely due to some scattering) and if there are any additional objects inthe field, two images (positive and negative) of each should remain (see figure 2). In theOrbital Verification testing (SMOV) of the camera, we found that this strategy workedas expected.

Coronagraphic Search for Substellar Companions 97
Fig.1: Measured background as an azimuthal average relative to the central pixel of a unoc-culted image in F160W (H-band) on the NICMOS camera. The background flux is reducedby placing the star behind the coronagraph (dashed line), and reduced even more from the rollsubtraction of two images (dotted line). Results of SMOV test 7052 (Schneider & Lowrance,1997)
According to models (Burrows et al 1997), a 0.1 Gyr old, 20 MJ brown dwarf willhave an absolute H magnitude = 13.51 which corresponds to an apparent magnitudeof 16.10 at the typical distance of our targets (d=30pc). In figure 1, early observationsdemonstrated that the background is 105 less than the star at 0:005. With a background12 magnitudes fainter than our typical 6th magnitude target star, a 16.10 magnitudeobject should be easily detectable.
3. Preliminary Results
We present one of of first stars observed, HD 102982, a G3V star, mH=6.9, 42 parsecsfrom the Sun. The NICMOS images revealed a stellar object 0:009 away which is fainterat H by 5.3 magnitudes. If it is a companion, then MH=9.08 places it between M5 andM6 in photometric spectral class (Kirkpatrick & McCarthy 1994). The age of the starwas thought to be close to the Pleiades age (0.1 Gyr) from X-ray luminosity (Lamptonet al 1997) and Calcium H & K emission (Henry et al 1996). At this young age, thecompanion would be a candidate brown dwarf at the edge of 75 MJ. However, a recentfinding (Soderblom et al 1998) shows the primary to be a spectroscopic binary with aperiod less than one month. This suggests that the activity once thought to be a signatureof youth is more likely a product of a tidally-locked close binary system.

Coronagraphic Search for Substellar Companions 98
Fig.2: HD 102982 images with direct imaging (top panels) and with coronagraphic imaging(bottom panels). The direct images are from the acquisition with the F165M filter and arescaled to the F160W image. The far right panels are the subtraction of the two roll orienta-tions; thus a positive and negative image exist.
4. Summary
The observations of HD 102982 demonstrate our ability to detect substellar objects.The possible companion has a S/N1600 (it is visible in the 0.2s acquisition image)with the roll subtraction for a∆mag5. From these observations, we should expecta ∆mag12 for a S/N=5 (a clear detection) at this separation of 100. Around this star,that would be a brown dwarf, and around some of our youngest stars, this brightnesscorresponds to10MJ (age=15Myr). Clearly, we will be exploring down to the high-mass planet range with this survey.
To detect brown dwarfs or possible extra-solar giant planets, we are undertaking acoronagraphic imaging survey of young stars. We present images of a possible compan-ion, probably a low-mass M star, to the star HD102982 which demonstrates our abilityto detect substellar objects. Every substellar companion discovered with this surveywill add to the mere handful already known, and its spectrum would be of tremendousvalue in determining the physics of objects between 10-60MJ.
References:
Becklin,E.E. & Zuckerman,B. 1988, Nature 336, 656Burrows,A., Hubbard,W. Lunine,J., Marley,M., Huillot,T., Saumon,D., Friedman,R., 1997, ASPConf. Servies, 119, 9.

Coronagraphic Search for Substellar Companions 99
Duquennoy & Mayor 1991, A&A 248, 485Henry,T.J., Soderblom,D.R., Donahue,R.A., & Balinus,S.L. 1996, AJ 111, 439Kirkpatrick, J.D. & McCarthy,D.W.,Jr 1994, AJ 107, 333Lampton.M., Lieu,R., Schmitt,J.H.M.M., Bowyer,S., Voges,W., Lewis,J. & Wu,X. 1997, ApJS108, 545Larkin, J. 1998 (private communication)McCarthy,D.W.,Jr 1996 (private communication)Nakajima,T., Oppenheimer,B.R., Kulkarni,S.R., Golimowski,D.A., Matthews,K. & Durrance,S.T.1995, Nature 378, 464Oppenheimer,B., Kulkarni,S., Matthews,K., Nakajima,T. 1995, Science 207, 1478.Schneider,G. & Lowrance,P.J. SMOV/7052 Test Report
(http://nicmosis.as.arizona.edu/gschneid/7052PS/)Soderblom,D.R., King,J., Henry,T.J. 1998, AJ in pressZuckerman,B. & Becklin,E.E. 1992, ApJ 386, 260

NICMOS and the VLTPula, Sardinia, May 26-27th 1998Wolfram Freudling and Richard Hook, eds.
The Stellar Population in the NICMOS Parallel Fields
A. Pasquali, G. De Marchi and W. Freudling
ST European Coordination Facility - ESO, Karl-Schwarzschild-Strasse 2,Garching bei Munchen, Germany, D-85748, E-mail: [email protected]
Abstract. We present the preliminary results of the analysis of the NIC-MOS/GRISM parallel observations from programs #7811, 7922 and 7907. Im-ages and spectra have been reduced and calibrated through CALNICC and NIC-MOSLOOK. We have used the morphology and the radial profile of the objectsidentified by CALNICC on the direct images together with the SExtractor classparameter defined by CALNICC for each object to separate stars from galax-ies. We here discuss the stars/galaxies distributions in the J and H bands andtheir corresponding color-magnitude diagrams obtained from both imaging andspectroscopic data.
1. The NICMOS Parallel program
NICMOS Camera 3 is being used in parallel mode to observe galactic fields at bothhigh and low galactic latitudes. One of the scientific goals of the NICMOS campaign isto detect substellar objects, such as brown dwarfs and objects close to the stellar mass-cutoff. The astrophysical relevance of these stellar categories covers many issues, fromthe star formation mechanisms to the physics of stellar atmospheres, the nature of thedark matter and the galactic structure.
Parallel observations are mostly made in the J and H bands. For each telescopepointing, they comprise direct imaging through the F110W and the F160W filters andgrism spectroscopy with the G096 and G141 grisms. Acquisitions are typically of about250 s and 900 s for imaging and spectroscopy, respectively. The corresponding programIDs are 7811, 7907 and 7922.
The data are processed using the NICMOS pipeline; dithered exposures of thesame fields are associated and combined into one image, which is then the input forCALNICB. The direct and grism combined images are used for each pointing by CAL-NICC in order to identify the objects in the field, derive their J, H photometry fromthe direct image and extract and calibrate their low dispersion spectra from the grismacquisition.
2. Some Statistics
We have reduced and analysed so far the NIC3 data obtained for 52 independent fieldpointings. Out of these, only 13 fields have been observed through both F110W andF160W filters and G096 and G141 grisms; 22 have been imaged only in F160W andthe corresponding G141, and only 17 have been acquired through F110W and G096.
100

The Stellar Population in the NICMOS Parallel Fields 101
Figure 1. NICMOS parallel fields distribution in galactic latitude.
Most of the fields are at high galactic latitude; as Figure 1 shows, only 8 pointings arewithin jbj = 10o, i.e. the galactic disk. We have run CALNICC over the data in order toidentify the objects in each frame, measure their fluxes and CLASS parameter throughSExtractor, which has been implemented in CALNICC for object identification andphotometry. The CLASS parameter may be considered as a sort of ellipticity indicator,so that those objects having CLASS 0.85 may be classified as point sources. Sincethe CLASS parameter seems to be sensitive to variable sky background, we have alsotraced the radial profile for each identified object and given more weight to the latterto distinguish stars from galaxies. Figure 2 shows the distribution of the objects clas-sified either as stars or galaxies from their radial profiles as a function of their CLASSparameter. It is clear that there is an excellent agreement between the CLASS- andradial-profile- classifications in the case of galaxies, while there may be 30% con-tamination for the stars sample. We have classified a total of 418 stars and 546 galaxiesdown to the magnitude set by a detection limit of 5σ above the local background. It isthen interesting to correlate the number of stars and galaxies with the galactic latitudeof the analysed field pointings. The ratio of stars to galaxies has been plotted in Figure3 as a function of galactic latitude: a clear increase in the number of detected starsover galaxies is seen towards the galactic bulge and disk. The aperture fluxes measuredby SExtractor in CALNICC have been transformed into the HST instrumental magni-tudes for both stars and galaxies by reading the inverse sensitivity PHOTLAM fromthe images header and adopting a zero-point of 21.1 mag. Subsequently, the instru-mental F110W and F160 W magnitudes have been translated into the Vegamag systemmagnitudes by subtracting 2.3 mag and 3.7 mag, respectively. These magnitudes aremore similar, although not identical, to J and H in the Johnson - Cousin system. Since4 fields were observed several times through both filters, we have been able to esti-mate from them our photometric uncertainty, which turns out to be 0.1 mag in bothbands for magnitudes brighter than 19, while it increases up to 0.5 down to the limit-ing magnitude. Figure 4 describes the photometric properties of our samples: stars arecharacterized by a limiting magnitude of 23 in J and 22.5 in H. Their distribution peaksat about 20 in J and H with a bright tail extending up to 11.5 in J and 11 in H. Thelimiting magnitude for galaxies is somewhat fainter: 23.5 in J and 23 in H. Galaxiespeak at about 22 in J and 21 in H and can be as bright as 16 mag in J and 15 mag in H.

The Stellar Population in the NICMOS Parallel Fields 102
Figure 2. Histograms of stars and galaxies classified by their radial pro-file as a function of their CLASS parameter. The solid and the dotted linesrepresent objects detected in the F110W and F160W images, respectively.
These limiting magnitudes are of course set by the relatively short exposure times andalso by the fact that, at fainter magnitudes, galaxies are more easily detected than starsdue to their extended structure.
3. The Stellar Population
We have here restricted our analysis to the stellar sample. We have used the 13 fieldpointings observed in both F110W and F160W filters to construct the color-magnitudediagram in Figure 5, where the magnitudes are not dereddened. The distribution peaksaround (J-H) = 1, typical of late spectral types; it is however broadened between 0.5and 1.5 because of the photometric uncertainty, which becomes quite large ( 0.5 mag)for those stars close to the limiting magnitude. It is known that the (J-H) color is notparticularly sensitive in discriminating stars of different late spectral type and metallic-ity; to do this, at least a second color is required. To better understand the spectral typeof the objects in Figure 5, we have defined the color (I-J)’ as (I’ - J’), where I’ is themagnitude in a box filter between 0.8µm and 0.9µm and J’ covers the range 1.05µm to

The Stellar Population in the NICMOS Parallel Fields 103
Figure 3. The number ratio of stars to galaxies for the individual 52 point-ings as a function of galactic latitude.
Figure 4. The magnitude distributions of stars and galaxies in the J and Hbands.
1.15µm. We have measured the (I-J)’ color using the G096 grism spectra for all stars inthe 13 fields brighter than J = 20 which ensures a good spectral S/N ratio. We have alsocomputed the (I-J)’ color for stars of late spectral type in the BPGS library available in

The Stellar Population in the NICMOS Parallel Fields 104
(J - H)
Figure 5. The observed color-magnitude diagram of the stars detected in13 fields imaged through both F110W and F160W filters.
0.6 0.8 1 1.2
1
0.8
0.6
0.4
0.2
(J-H)
Figure 6. The observed two colors diagram of the stars detected in 13fields imaged through both F110W and F160W filters (black dots). Alsoplotted are the colors derived from the BPGS library spectra (open squares).
IRAF in order to build a comparison grid of known spectral types. The resulting twocolors diagram is shown in Figure 6, where the (I-J)’ and (J-H) colors of the detectedstars are not corrected for reddening. The comparison shows that the detected stars aremostly dwarfs of K and M spectral types.
We have also adopted an alternative approach to the problem of deriving stellarspectral types. In fact, we have been able to cross-identify 13 stars out of 418 with

The Stellar Population in the NICMOS Parallel Fields 105
the US Navy Observatory Catalogue which has provided us with photographic B andV magnitudes, subsequently scaled to the Johnson system. The typical B and V pho-tometric error is of 0.25 mag and 0.5 mag for stars at positive and negative galacticlatitude, respectively, and the cross-identification is uncertain by about 1 arcsec. Forthe 13 cross-identified stars we have estimated the reddening from the HI maps of Starket al. (1992), which give the HI column density for each position in the sky. HI columndensities have been transformed into E(B-V) through the relation of Diplas & Savage(1994): N(HI) = 4.93 1021E(B-V), and we have used the E(B-V) values derived inthis way to correct for reddening the available B, V, J and H magnitudes. We havebeen able at this point to trace the Spectral Energy Distribution (SED) for the 13 starsand match each of these to the SEDs derived from the BPGS spectra. The best fits areshown in Figures 7 and 8, where the errorbars are those of the USN Observatory Cat-alogue for the B and V bands, and are set to 0.1 mag for the NICMOS J and H bandsbeing brighter than 19 mag (cfr. Sect. 2). Although fits generally get worse at B and Vmagnitudes fainter than 18, we may conclude that they add a noticeable component ofG dwarfs to the previous population of K and M dwarfs (cfr. Figure 6).
We will extend the present analysis to the remaining data of the NIC3 ParallelCampaign and follow up this study by addressing two main astrophysical issues: thespatial distribution, the Luminosity Function (LF) and hence the Initial Mass Function(IMF)of galactic low mass stars.
Acknowledgments. We would like to thank Norbert Pirzkal for supporting the datareduction software during this work. We would also like to thank Luca Pasquini foruseful discussions.
References
Diplas, A., & Savage, B. D. 1994, ApJ, 427, 274Stark, A. A., Gammie, C. F., Wilson, R. W., Bally, J., Linke, R. A., Heiles, C., &
Hurwitz, M. 1992, ApJS, 79, 77

The Stellar Population in the NICMOS Parallel Fields 106
16
14
12
G2
18
16
14
G2
18
16 G8
20
18
F5
20
18
G2
0.5 1 1.5
20
18
G2
Figure 7. Fits to the observed, dereddened SEDs.

The Stellar Population in the NICMOS Parallel Fields 107
14
12
G8
18
16G5
20
18
16
G8
20
18
G8
22
20
18K1
20181614
K5
0.5 1 1.522
20
18
16
K1
Figure 8. Fits to the observed, dereddened SEDs.

NICMOS and the VLTPula, Sardinia, May 26-27th 1998Wolfram Freudling and Richard Hook, eds.
The Evolution of Stars seen with ISOCAM - the Need for NICMOSand VLT Follow Up.
R. Siebenmorgen
ISO Science Operations Centre, Astrophysics Division of ESA, Villafranca delCastillo, P.O. Box 50727, E-28080 Madrid
Abstract. Three examples are presented of how ISOCAM1 sees the process ofstellar evolution. i) Standard staring and coronographic observations with ISO-CAM towards BD+31 643 are presented. The morphology of the detected emis-sion is quite similar to a proto-planetary disk. ii) The class 0 object HH108MMSis detected at 15 mic. in absorption against the diffuse interstellar background.This detection confirms its protostellar nature. iii) A ring of organic matter is de-tected around the pre–main–sequence Herbig AeBe star HD97300. The imagesshow extended emission, an elliptical ring structure of size about 0.045x0.03 pcas well as two peaks of emission, separated by about 3” (240 AU). One of thetwo peaks coincides with the position of HD97300, while the other may be anembedded companion. The data show that the emission in this region is domi-nated by the infrared emission bands centered at 6.2, 7.7, 8.7, 11.3 and 12.5µm,with a very small contribution from continuum emission at longer wavelengths.The spectra are fit with a three component dust model which includes organicmolecules such as polycyclic aromatic hydrocarbons, very small graphite andvery small silicates, as well as large grains. The fit to the ISOCAM data is verygood if one applies a classical oscillator model for the infrared emission bands.The new fitting procedure allows to estimate the total mass of the ring, which is0.03M.
1. Introduction
The Infrared Space Observatory (ISO) completed its observations at 14:00 CET on 16thof May 1998. The targets of ISO had been all over in the Universe: in the Solar Sys-tem, towards Comets and the Zodiacal Light, Giant Molecular Clouds, ProtoplanetaryDisks, the Galaxy and still further away to Interacting Systems and QSO in distantCluster. The observatory performed a total of 40000 IR observations and successfullyexecuted as of end March 1998 a total of 26220 science observations. In this con-tribution I present three observations performed with the infrared camera ISOCAM(Cesarsky et al., 1996) on board of ISO (Kessler et al., 1996). Those observations arededicated to the process of stellar evolution. Together with L. Metcalfe and K. Oku-mura we observed in a coronographic mode a potential proto planetary disk system.
1Based on observations with ISO, an ESA project with instruments funded by ESA Member States (espe-cially the PI countries: France, Germany, the Netherlands and the United Kingdom) with the participationof ISAS and NASA.
108

The Evolution of Stars seen with ISOCAM 109
This experiment is somehow unique since no real coronograph was mounted on ISO.The second experiment, performed with E. Kr¨ugel and R. Chini, shows the detection ofa protostar in absorption against the diffuse background. I close discussing the natureof a ring detected around a Herbig Ae/Be star (Siebenmorgen, Natta, Kr¨ugel, Prusti,1998).
2. A Proto-Planetary Disk around BD+31 643 ?
Recently Kalas & Jewitt (1997) discovered a circumbinary disc in scattered light aroundBD+31 643 (B5 V) in the young cluster IC 348. The disk has quite a similar morphol-ogy as the scattering disk ofβ Pictoris. Although the disk around BD+31 643 is muchlarger.
Together with L. Metcalfe and K. Okumura we pointed with ISOCAM towardsthis target and detected at 15µmemission in a disk like structure, extending at least 45”or 15000AU at the distance of the star (300pc).
Further we employed a “coronographic” observing mode of ISOCAM and de-tected a disk like quite asymmetrical emission structure at 4.5µm. The “coronagraphic”ISOCAM mode rejects the light of the central source by causing it to fall off the edgeof the small Fabry-mirror and thus allowing for a high enough dynamic range to detectfaint emission nearby a bright target (Metcalfe, Siebenmorgen, Okumura, 1998).
3. The Protostellar Candidate HH108MMS
Although the definition of a protostar is debatable, the detection of such an object islikened to finding the holy grail. No wonder that numerous detections of protostarshave been claimed during the last two decades. However, with improving technicalequipment, all sources turned out to be more or less evolved young stellar objects.
A promising approach of searching for true protostars is to investigate regionsof ongoing star formation at mm/submm wavelengths. In a systematic investigationof all known Herbig Haro energy sources at mm/submm wavelengths which includesmapping of dark clouds at high spatial resolution with IRAM 30m, SEST, JCMT; anew class of young stellar objects (assigned to ”Class 0”) have been found. All ofthem are strong mm/submm sources and among them are the coldest and densest dustcondensations ever found (for instance, Chini et al. 1993, AA272,L5). Their knowncharacteristics are:
a) From spectral energy distributions (SED) between 350 and 1300 microns thetypical dust temperatures are about 10K.
b) Associated masses, as derived from the dust emission, are comparable or greaterthan the Jeans mass.
c) Molecular line data indicate that the molecules are partially frozen out.It was predicted that Class 0 are opaque enough to be detected in absorption against
the diffuse background (e.g. Buss & Yorke 1990; Fig. 10 in Siebenmorgen et al. 1992)The ISOCAM image I took in collaboration with E. Kr¨ugel and R. Chini towards
the Class 0 source HH108MMS (Chini et al. 1997) shows indeed this source in absorp-tion against the diffuse background (Figure 1).
Although there is blending with zodiacal light, one can derive from the absorptionfeature an optical depth at 15µmof about 4. This translates into a visual extinction of

The Evolution of Stars seen with ISOCAM 110
Figure 1. Profile at 15µmalong the major axis of the absorbing disk likestructure centered at the position of HH108MMS is shown as histogram inthe upper panel. The background flux is indicated as dashed line. The opticaldepth at 15µmshown in the lower panel is derived by taking the minimumsource flux as zero point.
Av more than 80mag. The direct measurement of dust extinction at this wavelengthallows to confine the dust properties in this object which are certainly modified in thecold and dense environment of the protostar (Kr¨ugel & Siebenmorgen 1994). The ISO-CAM image suggests that besides the core, we see in HH108MMS an extended diskin absorption against the diffuse interstellar background which makes this source evenmore remarkable (Siebenmorgen, Kr¨ugel, Chini, 1998).
4. A Ring of Organic Molecules around HD 97300.
Imaging spectroscopy of the pre-main–sequence star HD 97300, was obtained withISOCAM. Those data are from a program which aimed at investigating the nature ofthe mid-infrared emission associated to Herbig AeBe stars. They are discussed in moredetail by Siebenmorgen, Natta, Kr¨ugel, Prusti (1998) and some other “first” results aregiven by Siebenmorgen et al., 1997.
The young star HD 97300 is located in the Chamalion I cloud (Whittet et al. 1997),at distanceD 188 pc. We report the detection of an extended, ring-like structurearound HD 97300, whose emission is dominated by the infrared emission bands at 6.2,7.7, 8.7, 11.3 and 12.5µm, (hereafter IEBs), observed in our own and other galaxieswherever neutral matter is exposed to UV radiation (see the many papers presentingCVF and SWS spectra in the special issue ofAstronomy and Astrophysicson ISO pub-lished in November 1996).

The Evolution of Stars seen with ISOCAM 111
4.1. Results
Fig. 2 shows the images of HD 97300 obtained in the four CAM narrow-band filterscentered at 6.0µm (lw4), 6.8µm (lw5), 11.3µm (lw8) and 14.9µm (lw9). The mor-phology of the object is very similar in the four filters: we can see extended emissioncentered on the star and an elliptical ring of size503600 around it. This same mor-phology is also seen in the CVF images at all frequencies, with very similar character-istics.
The ring is not symmetric around the star, but is much more extended in the SEthan in the NW direction. The off-center location of the star with respect to the ringmay be the effect of a density gradient in the SE–NW direction in the outer region ofthe Chamalion I cloud where HD 97300 lies. The position of the star in our imagescoincides with the emission peaks seen near the center in lw4 and lw5, and with thesecondary peak of the emission seen in lw8, roughly at the same position. In the lw8and lw9 filters we detect a second peak of emission, about 300 (240 AU) north of thestar.
Fig. 3 shows CVF spectra between 5.8 and 13.8µm in 8 positions roughly alignedalong P.A. = 142:4o. This line intersects the star, as well as the emission minimum andthe ring seen in the SE direction. The location of the 8 positions is indicated in Fig. 2.In all positions, we detect strong IEBs over a weak continuum.
4.2. The IEBs Carriers
To acquire a better understanding the spectra of Fig. 3 are fit using the three componentdust model of Siebenmorgen and Kr¨ugel (1992). This model computes the emissionper unit mass of dust heated by radiation of known intensity and spectral distribution.We use T?=10700 K (Rydgren 1980) and luminosity L?=35 L(van den Ancker etal., 1997). The computed spectra are smoothed to the CVF spectral resolution. Weadjust the PAH parameters and vary the gas column densityNH until a satisfactory fit isobtained.
The simplest picture we can construct to model the band shapes is to considerthat the bands can be described by classical oscillators. The absorption coefficient (σν;Schutte et al. (1993)) of such a driven damped oscillator is a Lorentzian profile
σν =σ2π γ(ωω0)2+(γ=2)2
; (1)
whereω = 2πν.Note that an excited level in an atom has an average lifetimetL = A1, whereA
is the Einstein coefficient for spontaneous transition, the probability to find the atomthere decays likeeAt. Because of Heisenberg’s uncertainty principle∆E ∆t h, theenergy of the upper level is then only defined to an accuracy∆E = Ah. This leadsnaturally to a Lorentzian emission profile, andA may be identified with the dampingconstant,γ = A. In this picture, the line width is determined by the timescale∆t. ForPAH resonances with a width of' 0:1µm, the characteristic time∆t would be 1012 s.This would imply immense values forA (1012 s1) as well as for the associated dipolemomentµ 105 Debye becauseA ∝ µ2ω3. A way out of the dilemma would be toassume that the IEBs arise from a superposition of many narrow lines.

The Evolution of Stars seen with ISOCAM 112
Figure 2. Logarithmic grey scale images of HD 97300 of the four narrow-band filters. The images are re-sampled to 0.500 pixel scale. The numbers inthe lw5 image indicate the positions of the CVF spectra shown in Fig. 3.
4.3. Mass of Circumstellar Material
An interesting possibility opened with our model is to derive the mass of circumstellarmaterial from the observed intensity of the PAH features.

The Evolution of Stars seen with ISOCAM 113
Figure 3. CVF spectra of HD 97300 in the 8 positions shown in Fig. 2.Position 4 is closest to the star; Position 6 coincides roughly with the min-imum of emission seen in the images; position 7 with the ring. The back-ground emission has been measured in the upper-left corner of the imagedarea. Each spectrum has been measured over a single pixel, i.e., over an areaof 300300. The uncertainties are typically smaller than a few %. Data areshown by diamonds and the best-fit models by the full lines.
We know the geometry of the emitting region, i.e., the approximate distance of thegrains from the star. For a given distance and stellar luminosity, the integrated 6 to 14µmflux is directly proportional to the number of C atoms in PAHs. This is because thePAHs account for the total emission in this spectral region. The fraction of C atoms inPAHs is known to within a factor of three, so we can directly convert the carbon columndensityNC derived by fitting the feature intensities into a hydrogen column densityNH. The uncertainty onNH is probably comparable to the uncertainty that affects itsdetermination from sub-millimeter continuum observations (see, for example, Kr¨ugel& Siebenmorgen, 1994). The mass of gas and dust can then be computed from thevalues ofNH averaged over the region of interest.
We derive a total mass of the circumstellar material in a region of about 0.03 pcradius (3300) of about 0.07M of which 0.03M is in the elongated ring structure.
4.4. The Origin of the Ring
The presence of PAHs in the ring indicates that it is made of interstellar matter, ratherthan of matter ejected from the star. Its morphology suggests that the ring structure hasbeen created by the interaction of the star with the surrounding matter.
It is possible that the ring results from the interaction of a stellar wind with theenvironment. In this hypothesis, the material in the ring is swept-up gas and the ringcoincides with the inner wall of a three-dimensional cavity created by the wind. A

The Evolution of Stars seen with ISOCAM 114
second possibility is that the ring is due to the action of the radiation pressure from thestar working on the grains.
Finally, it is interesting that HD 97300 is not the only Herbig AeBe star with aring. A similar structure (although about 3.5 times larger) is seen in scattered light inthe younger and more deeply embedded star LkHα198 (Leinert et al. 1991). In thatcase also the ring has an elliptical shape and the exciting star is shifted from its center.
5. Summary
I presented three examples of the evolution of stars as seen with ISOCAM. All thosecases are again a good demonstration of the high sensitivity of ISO.
However, the hypothesis of a proto-planetary disk structure of BD+31 643 mustbe further confirmed and we want to know if there could be planets in the outer parts ofthe binary disc? Nearby IRAS18331-0035 and HH108MMS there are other absorbing“knots” visible in the ISOCAM images. One wants to uniquely resolve them. To unam-biguously measure the spectral energy distribution of the secondary peak of HD 97300one needs a higher spatial resolving power. One is wondering if we see a deeply em-bedded companion?
With these kind of questions we have an immediate response to the data presented:we need higher spatial resolving power. Some higher resolution observations are cer-tainly existing in the NICMOS data base but just in this moment becoming availablewith the first light of the VLT.
References
Boss A., and Yorke H., 1990, ApJ 353, 236Cesarsky D., Lequeux J., Abergel A. et al., 1996b, A&A 315, L305Chini R., Krugel E., Haslam H., et al. 1993, AA272,L5Chini R., Reipurth B., Sievers A., , Haslam H., et al. 1997, AAKessler M.F., Steinz J.A., Anderegg M.E. et al., 1996, A&A 315, L27Kalas, P., and Jewitt D., 1997, Nature 386, 52Krugel E., and Siebenmorgen R., 1994, AA 288, 929Leinert Ch., Haas M., Lenzen R., 1991, A&A 246, 180Metcalfe L., Siebenmorgen R., Okumura K., in prep.Rydgren A.E., 1980, AJ 85, 444Schutte W.A., Tielens A.G.G.M, Allamandola L.J., 1993, ApJ 415, 397Siebenmorgen R., Kr¨ugel E., 1992, A&A 259, 614Siebenmorgen R., Kr¨ugel E., Mathis J.S., 1992, A&A 266, 501Siebenmorgen R., Prusti T., Kr¨ugel E., Natta A., 1997, Proc. First ISO Workshop on
Analytical Spectroscopy, 6–8 October 1997 (ESA SP-419, December 1997).Siebenmorgen R., Natta A., Kr¨ugel E., Prusti T., 1998, A&A subm.Siebenmorgen R., Kr¨ugel E., Chini R., in prep.van den Ancker M.E., Th´e P.-S., Tjin A Djie H.R.E., Catala C., de Winter D., Blondel
P.F.C., and Waters L.B.F.M., 1997, AA 324, L33

The Evolution of Stars seen with ISOCAM 115
Whittet D.C.B., Prusti T., Franco G.A.P., Gerakines P.A., Kilkenny D., Larson K.A.,Wesselius P.R., 1997, A&A 327, 1194

NICMOS and the VLTPula, Sardinia, May 26-27th 1998Wolfram Freudling and Richard Hook, eds.
Unusual H2 Emission near a Compact Source in Orion
M. Lindqvist and J.H. Black
Onsala Space Observatory, S–439 92 Onsala, SwedenEmail: [email protected], [email protected]
Abstract.Preliminary results are reported for high-resolution imaging of parts of the
Orion Bar. Data have been obtained through a variety of filters with the Near-Infrared Camera and Multi-Object Spectrometer (NICMOS) on Hubble SpaceTelescope. One striking feature is a small source of almost pure H2 line emis-sion, which is located near one of the compact sources in Orion reported byO’Dell and collaborators (HST–18 = 203–504). We suggest how some physicalproperties may be inferred from narrow-band fluxes.
1. Introduction
Molecular hydrogen (H2) emits strong near-infrared lines, both in regions where it isthermally excited at high temperatures (T > 1000 K, e.g. in molecular shocks), and inthe illuminated boundaries of molecular clouds (photon-dominated regions or PDRs)where it is excited by UV pumping. In the case of UV fluorescence, when the illu-minating radiation is fairly uniform, observed fluctuations in the H2 line intensity willtrace fluctuations in density and column density in the boundary layer of the molecularcloud. This was one of our motivations in obtaining high-resolution images of H2 emis-sion in the Orion Bar with NICMOS. The Orion Bar is the visible ionization boundaryof the Orion Nebula, southeast of the Trapezium. It is a well studied example of aPhoton-Dominated Region (PDR) where the boundary of a molecular cloud is illumi-nated by intense ultraviolet radiation from hot stars (Hogerheijde et al. 1995, Jansen etal. 1995). Direct observations of the excited H2 emission with 0:001 resolution offerthe possibility to trace the small-scale structure of such a boundary region.
The Orion Bar region also harbors Herbig-Haro objects, notably H-H 203 and H-H 204 (also known as M42 H-H 3 and H-H 4, respectively) and some of the compactsources and proplyds identified by O’Dell and collaborators (O’Dell, Wen & Hu 1993;O’Dell & Wen 1994).
2. Observations
We obtained a series of images across the bright rim of the Orion Bar near the peaks ofmm-wave molecular line emission with NICMOS cameras 13 (NIC1, NIC2, NIC3)in several filters on 1998 February 18. Only preliminary results from NIC2 are dis-cussed here. The NIC2 camera has a field of view of 19:00219:002 and a plate scale of0:00076 pixel1 (Thompson et al. 1998). Images were obtained in two narrow-band (1%
116

UnusualH2 Emission near a Compact Source in Orion 117
resolution) filters, F212N (centered on the H2 v= 10 S(1) line) and F215N (line-freecontinuum for thermal emission), as well as in two medium-band filters, F171M, andF180M.
The data have been reduced through the pipeline processing with the CALNICAsoftware, which carries out the subtraction of dark current, flat-fielding, and linearitycorrections. Multiple exposures have been combined in a mosaic by further processingwith CALNICB software.
The full mosaic in filters F212N and F215N shows that the Bar region is threadedby a complicated pattern of thin filaments, clearly highlighted by their H2 line emission.When the excitation of the H2 vibration-rotation spectrum is near-thermal at high tem-peratures (T 1000 K), the contrast in flux between F212N and F215N images shouldbe quite high. When the excitation is caused by ultraviolet fluorescence at relativelylow densities (n(H2) 106 cm3), strong lines appear in both bands and the contrastis not so large (see §3 below). Where the extended emission shows up in both bands,it is likely that fluorescence makes a large contribution to the observed emission. Theappearance and interpretation of the extended emission will be discussed in more detailelsewhere.
We focus here on a very striking feature of the narrow-band images. There is avery compact source which shows up conspicuously in the F212N image but is nearlyundetected in the F215N image. It is located 1:006 from a much brighter stellar source,which has equal brightness in the two narrow-band filters. This stellar source coincideswith the compact source HST 18 discovered by O’Dell, Wen & Hu (1993) in theirWF/PC survey of the Orion Nebula region. Although many of the compact sources inthat work were identified as “proplyds” (= protoplanetary disks), this particular objectwas considered unlikely to be of the proplyd type, possibly an H-H object instead.In the subsequent study of proplyds (O’Dell & Wen 1994), this source was given thedesignation 203–504 and was listed as associated with a variable star, number 644(far-red magnitude I=13.5), in the catalogue of Jones and Walker (1988). The imagecontaining this star and our H2-emitting condensation is shown as a contour diagram inFig. 1. The infrared image of the star is evidently unresolved (0:002 diameter FWHM),while the H2 condensation is extended ( 0:0046 FWHM) in F212N. Close inspection ofa WF/PC narrow-band image in Hα shows that the H2 condensation coincides with asmall, dark area in the bright emission, but the contrast is not high. The fluxes of thestar in the two narrow-band filters are equal, approximately 7.0 mJy, which correspondsto a K magnitude of approximately 12.5. In F212N, the integrated flux corresponds toa surface brightness (over 0:0046) of I 2:4103 erg s1 cm2 sr1. The marginallydetected source at the position of the H2 condensation in F215N is consistent with apoint source at K=18.0 mag. The ratio of integrated fluxesf212= f215= 24. In F171M,we measure a weak source at the H2 position, which is not obviously extended. Theratio of integrated fluxes, corrected for bandwidth, isf212= f171= 4:6.
3. Discussion
Proplyds are seen as dark silhouettes in projection against the Orion Nebula and arebelieved to be circumstellar disks. NICMOS observations of several proplyds in Orionhave recently been discussed in several papers (Chen et al. 1998; McCaughrean et al.1998; Stolovy et al. 1998). Although O’Dell et al. 1993 suggested that HST 18 isprobably not of the proplyd form, it is interesting that it appears to be associated with

UnusualH2 Emission near a Compact Source in Orion 118
the compact source of H2 emission that we have found. The evidence of an associationconsists of (1) the small angular offset and (2) the extension of H2 emission contoursalong an axis directed away from the star HST 18. At the distance of Orion KL,d= 480pc (Genzel et al. 1981), the angular distance between the star and the H2 condensationcorresponds to 770 AU in projection on the sky. The angular extent of the H2 emission,0:0046, corresponds to 220 AU (3:31015 cm).
In fact, O’Dell and Wen (1994) proposed that HST 18 is an Herbig-Haro (H-H)object. H-H objects are collisionally excited nebulae produced by supersonic outflowsejected by young stellar objects (YSOs). Although HST 18 shows Hα and [N II] lineemission based on the WF/PC images, our infrared images of that source appear stel-lar. The suggestion of an H-H object does not seem compelling. It is impossible todecide whether the compact source of H2 emission nearby is excited by a shock or bysome other thermal process without a spectrum. However, the flux ratios in the narrow-band images can distinguish between pure fluorescent emission and some form of ther-mal excitation. We have computed thermal emission spectra of H2 at temperaturesT = 1000, 2000, and 3000 K, and convolved these with the NICMOS filter responsefunctions. The predicted flux ratios at these three temperatures aref212= f215 = 950,43, and 15, respectively. The flux ratio in a typical fluorescence spectrum (cf. Black& van Dishoeck 1987) isf212= f215 = 2:7. The observed ratio of integrated fluxes,f212= f215 24, is thus inconsistent with pure fluorescence; it would imply a tempera-tureT 2500 K for fully thermal emission. There is a large number of H2 lines withinthe bandpass of the F171M filter. The observed, bandwidth-corrected ratio of integratedfluxes f212= f171= 4:6 is in harmony with thermal emission at 1500< T < 2400 K. Thecorresponding value of the ratio predicted for pure fluorescence is 0.84. As shown bySternberg & Dalgarno (1989), UV-pumping of H2 emission produces a spectrum morelike the thermal spectrum, when the density is high enough that the excited H2 is partlyde-excited by collisions (i.e. partly thermalized). The position of our H2 condensationis close to one of the peaks of emission in the C 65α and C 91α recombination lines,which trace the density of the PDR that is maintained by the light of the Trapezium stars(Wyrowski et al. 1997). The ambient interstellar density in this direction is moderatelyhigh, (0:5 2:5) 105 cm5. Thus it is conceivable that the H2 emission arises inan even denser condensation in the PDR through partly thermalized UV fluorescence.Spectroscopy will be needed to decide definitively the nature of this source. Chen et al.1998 suggested that the H2 emission from their circumstellar disks (proplyds) cannotbe excited by a mechanism internal to the source; they concluded that it is more likelythat the H2 is excited by UV fluorescence from one of the hot stars nearby.
The observed flux ratios for our source are consistent with thermal emission atT 2000 K. The observed surface brightness of the H2 condensation requires a columndensity of moleculesN(H2) = 7:51018 cm2 thermalized at this temperature. Sucha column density spread over the small measured extent of the source corresponds toa total hydrogen mass of only 2:71026 g or 0.046 earth-masses. If nothing else, thisis an indication of the remarkable sensitivity of NICMOS to small amounts of excitedhydrogen.
Acknowledgments. We gratefully acknowledge the efforts of the NICMOS Sci-ence Team over the years and of the NICMOS project staff at NASA Goddard SpaceFlight Center and STScI. Our work is a part of the NICMOS/GTO science and has beengenerously supported by a contract through the University of Arizona.

UnusualH2 Emission near a Compact Source in Orion 119
Figure 1. The top panel shows the H2 emission (F212N) taken with NIC2.The bottom panel shows the adjacent “continuum” band (F215N). Note thelarge contrast between the H2 emission and the continuum emission in thesource at offsets (–24.8,–16.0).
References
Black J.H., van Dishoeck E., 1987, ApJ, 322, 412

UnusualH2 Emission near a Compact Source in Orion 120
Chen H., Bally J., O’Dell C.R., McCaughrean M.J., Thompson R.I., Rieke M., Schnei-der G., Young E.T., 1998, ApJ, 492, L173
Genzel, R., Reid, M.J., Moran, J.M., Downes, D., 1981, ApJ, 244, 884Hogerheijde, M., Jansen, D.J., van Dishoeck, E.F., 1995, A&A, 294, 792Jansen, D.J., Spaans, M., Hogerheijde, M.R., van Dishoeck, E.F., 1995, A&A, 303, 541Jones, B.F., Walker, M.F., 1988, AJ, 95, 1755McCaughrean M.J., Chen H., Bally J., Erickson E., Thompson R.I., Rieke M., Schnei-
der G., Stolovy S.R., Young E.T., 1998, ApJ, 492, L157O’Dell C.R., Wen Z., Hu X., 1993, ApJ, 410, 696O’Dell C.R., Wen Z., 1994, ApJ, 436, 194Sternberg, A., Dalgarno, A., 1989, ApJ, 338, 197Stolovy S.R., Burton M.G., Erickson E.F., Kaufman M.J., Chrysostomou A., Rieke M.,
Schneider G., 1998, ApJ, 492, L151Thompson R.I., Rieke M., Schneider G., Hines D.C., Corbin M.R., 1998, ApJ, 492,
L95Wyrowski, F., Schilke, P., Hofner, P., Walmsley, C.M. 1997, ApJ, 487, L171

NICMOS and the VLTPula, Sardinia, May 26-27th 1998Wolfram Freudling and Richard Hook, eds.
HST NICMOS Observations of Circumstellar Matter Around CYGX-3
W. Schmutz
Institute of Astronomy, ETH Zentrum, CH-8092 Zurich, Switzerland
W. D. Vacca, L. Close, and J. Rayner
Institute for Astronomy, Honolulu, Hl 96822
T. R. Geballe
Joint Astronomy Centre, Hilo, Hl 96720, USA
H. Schild and R. Walder
Institute of Astronomy, Zurich, Switzerland
Abstract. Models of the evolution of massive binaries predict that only a fewsuch objects should survive the common envelope phase and result in systemscontaining a compact object plus a Wolf-Rayet star (c+WR). According to thesemodels, a vast amount of stellar material is lost during the common envelopephase prior to the c+WR phase. We are attempting to test these models bysearching for the presence of such circumbinary material around the only knownc+WR object: Cyg X-3. Since the large reddening towards Cyg X-3 preventsany investigation in the optical, deep infrared exposures of Cyg X-3 with theNICMOS NIC-2 camera aboard HST and the Paα narrow band filter have beenused to image the system at high spatial resolution.1
The HST images have only recently been acquired and their analysis iscurrently underway. Here we report the possible detection of emission at adistance of about 0:003. This result is preliminary and needs confirmation byNIC-1 observations with its better sampling of the stellar profile.
1. Introduction
Cyg X-3 is one of the most luminous X-ray sources in the sky. On the basis of itsperiodic X-ray variability, it has been interpreted as a binary system in which substan-tial mass transfer occurs from a companion onto a collapsed object (Bonnet-Bidaud &Chardin 1988). Unfortunately, the enormous reddening toward Cyg X-3 (EBV > 5) ef-fectively prevents any optical studies of this system (V > 24,I 20,K 12). However,
1Based on observations with the NASA/ESA Hubble Space Telescope obtained at the Space TelescopeScience Institute, which is operated by the Association of Universities for Research in Astronomy, Inc.,under NASA contract NAS5-26555.
121

Observations of Circumstellar Matter Around CYG X-3 122
recent infrared observations of Cyg X-3 have provided important information regard-ing the nature of this object. The firstK-band spectrum of the system, obtained by vanKerkwijk et al. (1992), revealed strong and broad emission lines of HeI and HeII andit was suggested that the mass donor is a Wolf-Rayet (WR) star. Schmutz et al. (1996)found that theK-band emission lines exhibited periodic wavelength shifts, presumablydue to the orbital motion of the WR star around the compact companion. The massfunction for the system was found to be 2.3 and reasonable estimates of the mass of theWR star yielded a mass of the compact object of 17 M; thus, the compact objectis an excellent black hole candidate. These results strengthen the suggestion that CygX-3 is representative of the endpoint of massive binary evolution.
Despite theoretical predictions for the formation of systems composed of a WRstar and a compact companion (van den Heuvel & de Loore 1973), observational searchesfor such objects had yielded negative results (Willis et al. 1989; Moffat 1992; St-Louiset al. 1993) until the observation by van Kerkwijk et al. (1992). The evolutionary stepsfor the formation of such a system are O+O) RSG+O)WR+O) SN+O) c+O)c+RSG) c+WR, where c denotes a compact object. Numerical calculations (Iben &Livio 1993) indicate that the common envelope phase (c+RSG) is the critical phase inthe evolution, and few c+WR systems are expected to exist as a result of the completedisruption of the secondary during this phase. The fact that only one c+WR system hasbeen found to date indicates that it is indeed rare for a system to survive the commonenvelope phase. Thus Cyg X-3 provides an excellent and completely unique laboratoryfor testing the models of massive binary evolution.
2. Prediction of Circumbinary Material
It has been estimated that on the order of a few tens of solar masses of material waslost during the common envelope phase of Cyg X-3 and various models predict thatthe material should be concentrated in the orbital plane (Livio & Soker 1988; Termanet al. 1994). The current fast wind from the WR star should interact with this slowlyexpanding circumbinary material. This situation should lead to a “ring” of condensedmatter around the system, probably broken up into individual knots due to Rayleigh-Taylor and other instabilities (Garcia-Segura & Mac Low 1995), similar to the ringobserved around SN 1987A. This is demonstrated in Fig. 1, which presents predictionsfor the density contours resulting from a 2-D numerical simulation in which a faststellar wind collides with a slowly expanding shell (Folini & Walder 1998, personalcommunication; see also Walder & Folini 1998). Localized density enhancements suchas those seen in this figure would be observed as knots. The formation of high densityknots is even more pronounced if the time dependence of the cooling is taken intoaccount, as this leads to further compression and enhancement. The dense regions arerelatively cool (with low gas pressure) and the material is ionized by the X-ray emissionfrom the black hole and the strong Lyman continuum flux from the Wolf-Rayet star.Shock heated layers are expected to have fairly low density and therefore contributelittle to the emission measure of the the strong nebular recombination lines.
The size of the expected emission region should depend on the velocity of expan-sion of the shell of material expelled during the common envelope phase and on thetime since the common envelope phase. The expansion velocity in turn, is given by theaccumulated momentum from the wind that accelerated the shell’s mass. (The initialexpansion from the shell can probably be neglected.) For a typical duration of the WR

Observations of Circumstellar Matter Around CYG X-3 123
Figure 1. 2-D simulation of the collision of a fast wind with a slowly ex-panding shell. The developing Rayleigh-Taylor instabilities are traced bydensity contours. The rectangular grid outlines different levels of the adap-tive mesh refinement algorithm. This figure demonstrates that we shouldexpect many small regions with high density rather than a shell with uniformdensity. The concentration into high density knots is even more pronouncedwhen time-dependent cooling is included in the calculations.
phase, 3105 yr, and an assumed average expansion of 1 km s1, we estimate anextension of 0.3 pc. At 10 kpc, the commonly adopted distance of Cyg X-3 (Dickey1983), this corresponds to an angular separation of 600. This estimate is highly uncer-tain, and a search for nebular emission at both larger and smaller separations is alsonecessary. For example, typical sizes of WR ring nebulae are on the order of a few pc(Tutukov 1982), i.e. on the order of 2000 at a distance of Cyg X-3.
The morphology of the emission nebula can provide observational constraints forthe predictions of the common envelope mass loss and the nebular emission can beused to place constraints on the initial mass of the system. Contamination by sweptup interstellar material can be excluded as the source of any possible nebular emissiondetected relatively close to Cyg X-3 (i.e. anywhere within the field of view of the NIC-2 camera), because the predicted SN explosion prior to the common envelope phaseshould have cleared out this region. Detected nebular Paα emission would thereforeallow us to calculate the circumstellar mass and obtain an estimate of the lower limitfor the initial mass of the WR star. This assumes that most of the ionized material isdensity bounded. Alternatively, if the nebula is ionization bounded, then we can probethe far UV radiation field, especially if we detect the nebula in the light of HeI, [FeII ],and [SIII ]. In either case, an unambiguous detection of nebular emission close to CygX-3 would confirm the predicted common envelope phase with its dramatic mass loss.

Observations of Circumstellar Matter Around CYG X-3 124
X
Z
D
1
2
9
10
500
Figure 2. Left panel:H-band image of an 18” x 18” field around Cyg X-3, obtained with the Adaptive Optics system on the CFHT 3.6 m telescopeon 15 July 1997 (Vacca et al. 1998). North is up and East is to the left.The FWHM is approximately 0:005; the white cores of sources X and D havediameters approximately equal to the FWHM. Sources are labeled accord-ing to Joyce (1990) and Fender & Bell-Burnell (1996); X denotes Cyg X-3.Right panel: TheH-band image of the left panel after 300 iterations with the
algorithm of Lucy-Richardson, with the PSF made from Z and D. The stellarcores (white) now have a FWHM of about 0:002.
3. Previous Observations
There is observational evidence for extended nebular emission associated with the CygX-3 system. Spectroscopic observations of Cyg X-3, obtained with 100 seeing andslit sizes, reveal the presence of narrow emission lines superimposed on the broad WRemission features. An example of this emission can be seen in Figs. 3 and 4 of Schmutzet al. (1996). These narrow lines are much stronger than any variable emission featuresoften seen on top of the WR emission lines in the spectra of WR binary systems andattributed to the wind-wind collision zones (Moffat et al. 1996). Therefore, the narrowemissions in Cyg X-3 are probably not related to the WR wind but originate at largerdistances from the system.
We have recently obtained ground-based near-infrared images of Cyg X-3, usingadaptive optics (AO) techniques, which also seem to suggest that extended nebularemission may be present in this system. In Fig. 2 (from Vacca et al. 1998) we presentour H-band image, obtained with the University of Hawaii Adaptive Optics system onthe CFHT. The total integration time for this image was 600 sec. It was constructed byco-adding 20 individual frames, each with an exposure time of 30 sec. The FWHM ofthis image is about 0:005. Because the only suitable reference star that can be used tomake the AO wavefront corrections is 3000 away from Cyg X-3 and has a brightness ofonly V=15 (both values are at the limit of what can be used in current AO systems), ourexposure resulted in a PSF which is slightly elongated to the SE, in the direction of thisreference star. Nevertheless, this image indicated that wemayhave detected extendedemission to the west of Cyg X-3 in the region of object #2. Unfortunately the detection

Observations of Circumstellar Matter Around CYG X-3 125
is marginal because of problems with the flat-fielding and background sky subtraction.But it is sufficiently far from the point sources that we thought it might be real until wesaw the HST NICMOS images. In fact, it is an artifact resulting from the flat-fielding.
Recently, Ogley et al. (1997) have reported that Cyg X-3 appears to be slightlyextended in their deepK-band images and they suggested that a second point source,a factor of 11 fainter than the primary object, was located within 0:0056 of Cyg X-3.(Dilution by a second stellar object might also explain why the broad WR emissionlines seen in theK-band spectra have unusually small equivalent widths for a WR star(van Kerkwijk et al. 1992; van Kerkwijk 1993; Schmutz et al. 1996). However, our AOimages (Fig. 2; Vacca et al. 1998), do not confirm this suggestion. Despite the slightelongation of our PSF, a second point source with the claimed separation and brightnesswould be easily recognizable on our image. (We also do not find a second source in theK-band image). NICMOS images, with their much smaller PSF cores, easily settle thisquestion and place much stricter limits on the brightness and separation of any possibleadditional source.
4. NICMOS Observations
Cyg X-3 was observed with HST and NICMOS over 3 orbits on 1998 March 13. Weused the NIC-2 camera in combination with the narrow band filters F187N, centeredon Paα, and F190N, for the adjacent continuum region. For both filters we obtained 4dither positions with 200 step size. The total exposure times were 68 min and 34 min forthe filters F187, and F190N, respectively. For the analysis presented here we used themosaiced images as delivered by the standard STScI pipeline. The standard processingleaves a clearly visible offset in the bias levels of the four detector quadrants but oth-erwise, particularly in terms of image sharpness, the processing resulted in excellentimages.
In Fig. 3 we show the resulting image of the Cyg X-3 19001900 field. All previ-ously known sources in the field are clearly detected; a comparison with Fig. 2 showsthe presence of objects 1, 2, 9, and 10. In addition, there are about half a dozen newlydiscovered faint objects in the image.
5. Discussion
With the HST NICMOS observations we were searching for 4 types of emission:
1. nebular emission close (< 100) to Cyg X-3;
2. nebular emission in the vicinity of Cyg X-3 ( 500);
3. extended nebular emission in the general area of Cyg X-3;
4. continuum emission from a source at about 0:005 from Cyg X-3.
Each of these items corresponds to a possibility discussed in the Sects. 2 and 3. Theeasiest item to discuss is item #4. Ogley et al. (1997) suspected an object about 2.6 magfainter and 0:0056 to the west of the main object. In Fig. 4 we show the cores of thestellar images of the objects X, Z, and D. The lightest grey level represents emissionabout 4 mag fainter than the central pixel. We conclude that at the time of our HST

Observations of Circumstellar Matter Around CYG X-3 126
Figure 3. Mosaiced NIC-2 image of 417 min exposures through the Paαfilter F187N. The observation angle was 79:4
, i.e. north is approximately tothe right and east to the top. The field of view of one NIC-2 exposure is19:00219:002 and the mosaiced image has an extension of 286286 pixels or21:004521:0045. The strongest source near the center is Cyg X-3 and the nextbrightest object to the south-east is star Z. Star D is the object to the southof star Z about as bright as Z. The grey scale representation is chosen toenhance faint features just above the background. Due to this representationthe different bias offsets in the four detector quadrants are very obvious.
observation there was no object present with the brightness and distance suggested byOgley et al. (1997). Thus, we confirm the results of Vacca et al. (1998) based on AOimages.
We can also address item #2 relatively easily. Using the intensities of the starsD and Z we scale the image F190N with a factor of 0.97 to that of F187N and weproduce a difference image F187NF190N. An investigation of this difference image

Observations of Circumstellar Matter Around CYG X-3 127
X
DZ
0.500
Figure 4. As Fig. 3 but the grey scale representation chosen such that thecores of the stellar images are visible.
does not reveal any extended emission. The only signatures left above the backgroundare strong Paα emission at the location of Cyg X-3 and imperfect cancelations of thestellar images of star D and Z that leave paired positive and negative intensities. (Thenegative-positive residuals from stars D and Z integrate to zero intensity, of course,because we have used them to scale the continuum observation to that of the Paα.) Thestrength of the Paα excess emission of Cyg X-3 is 40% of the continuum. This valueagrees very well with the emission strength estimated from ground-based spectroscopyof Cyg X-3 (see Fig. 4 of Schmutz et al. 1996). In fact, the emission is not from Paα atall, but rather the broad HeII 6-8 stellar wind line.
With the difference image described above we have also addressed, in part, item#3. However, if there is a nebular structure like a ring nebulae around Wolf-Rayetstars then this would be outside the field of the NIC-2 camera. We also have Paαimages of NIC-1 and NIC-3 that are obtained in parallel with the NIC-2 exposures.With the parallel exposures we probe regions about 3000 and 8000 to the west of CygX-3. Although these images are not in focus they would still allow to detect extendednebular emission. In the difference images of NIC-1 and NIC-3 there is also no obviousnebular emission. Of course, with this parallel exposures we are only covering only asmall fraction of the total area out to, say, 10000. Thus, item #3 cannot be addressedconclusively with our HST NICMOS observations.
The only remaining issue is item # 1, nebular emission close (i.e.< 100) to CygX-3. The detection of such emission requires a deconvolution of the stellar image ofCyg X-3. As can be seen on Fig. 3 the point-spread function (PSF) of NICMOS isquite complicated. But the good news is that it is supposed to be very reproducible,apart for some “breathing” effects which change the focus during an orbit. The bestPSF template available for these observations is that of Cyg X-3 itself on the F190Nimage. The difference in wavelength is small so that the F190N PSF is only about1.6% more extended than that expected for the F187N image. For the preliminaryanalysis presented here we disregard this difference. In Fig. 5 we present the resultsof a deconvolution with the Lucy-Richardson restoration algorithm as implemented inMIDAS. In the left panel we see that our PSF agrees very well with the Paα image ofstar D; the deconvolution of this star has produced a diffraction limited point sourcewith no residual wings. On the other hand, the profile of the deconvolved image of CygX-3 is more extended than a pure point source. There is an extended structure to theeast and a less bright one to the west. Therefore, Cyg X-3 appears to be more extendedin Paα than it is in the continuum image. The number of iterations turned out to be

Observations of Circumstellar Matter Around CYG X-3 128
XD
1
100
Figure 5. Deconvolved NIC-2 F187N Paα image using the image restora-tion scheme by Lucy and Richardson as implemented in MIDAS. The resultshown is after 80 iterations; the results after 40 or 120 iterations look verysimilar. For the PSF the F190N image of Cyg X-3 was used. Left panel: The400400 region around star D. Right panel: The 400400 region around CygX-3. This region also includes star 1 (seen at the left).
non-critical because the basic result, the extended structures to the east and west, isrobust. The intensity in the east feature is comparable to that of star 1.
The extended nebular emission can also be detected in the original image. In Fig. 6we plot a west-east cut through the profiles of Cyg X-3 in the F187N and F190N images.The lines represents the average of the 5 central columns. The excess emission detectedby deconvolution algorithm in Fig. 5 can easily be seen 0:002–0:003 east of the main peak;there is also a difference between the two profiles, although less pronounced, to thewest. The uncertainties of the profiles at a level of 2 and 3 counts per second is 2%and 1%, respectively. (The total integration time was 4096 sec for the F187N exposureand 2048 sec in the F190N image.) Therefore, the difference between the two curveson the east side is at a level of about 10σ. Because the F190N image has been used asthe PSF template for the deconvolution, we also know that the Cyg X-3 F190N profileagrees well with that of star D and Z in the F187N exposure. Nevertheless, despitethe high confidence level, it is still possible that the emission detected close to Cyg X-3results simply from spatial and/or temporal variations of the PSF, and hence a mismatchbetween the true PSF for Cyg X-3 and the PSF used to perform the deconvolution.
6. Conclusions
In view of the importance of Cyg X-3 to the understanding of massive binary evolu-tion — as the only representative of the c+WR class — we have searched for nebularemission that would testify to the events during its previous evolutionary phase. Wesuspect that the previous phase was a common envelope phase which implies that thenon-degenerate star has lost a substantial fraction of its mass. This mass is expectedto be still around the system, probably in a ring. To date, there have been no clear

Observations of Circumstellar Matter Around CYG X-3 129
Figure 6. West-east crosscut, i.e. from bottom to top in Figs. 5, throughthe NIC-2 F187N image of Cyg X-3 (dashed) and of F190N (dotted). The5 central columns are averaged and the central intensity of the F190N cut isscaled to that of the F187N. Excess emission in the east wing of Cyg X-3 isvisible, at a distance of 0:002–0:003 from the center (1 pixel= 0:00075).
detections of emission around Cyg X-3. However, on the basis of the first part of ourHST observations, we report here thepossibledetection of matter close to Cyg X-3.Our result is preliminary and at this stage of the analysis it is still not clear whetherthe features seen are artifacts produced by subtle imperfections in our PSF. Clearly, weneed a better sampling of the profiles of the Cyg X-3 image and of the PSF. We hopeto achieve this in an upcoming HST observation with NIC-1 camera. If the extendednebular emission is confirmed, we will estimate the mass lost from the donor star dur-ing the common envelope phase. This result could have a profound impact on modelsof binary evolution.
Acknowledgments. WS is grateful to R. Hook and S. Stolovy for enlightening dis-cussions on the properties of NICMOS PSF. WDV is grateful to Alan Stockton for par-tial support. Support for this work was also provided by NASA through grant numberG)-07838.01-96A from the Space Telescope Science Institute, which is operated byAURA, Inc., under NASA contract NAS5-26555.
References
Bonnet-Bidaud, J.M., & Chardin, G. 1988, Physics Reports, 170, 325Dickey J.M. 1983, ApJ, 273, L71Fender, R.P., & Bell Burnell, S.J. 1996, A&A, 308, 497Garcia-Segura, G., & Mac Low M.-M. 1995, ApJ, 455, 160Iben I., & Livio M. 1993, PASP, 105, 1373Joyce, R.R. 1990, AJ, 99, 1891Livio M., & Soker N. 1988, ApJ, 329, 764

Observations of Circumstellar Matter Around CYG X-3 130
Moffat, A.F.J. 1992, A&A, 253, 425Moffat, A.F.J., Marchenko, S.V., & Bartzakos, P. 1996, RMxAAC, 5, 38Ogley, R.N., Bell Burnell, S.J., & Fender, R.P. 1997, Vist. Astron., 41, 65Schmutz, W., Geballe, T.R., & Schild, H. 1996, A&A 311, L25St-Louis, N. et al. 1993, A&A, 267, 447Terman, J.L., Taam, R.E., & Hernquist, L. 1994, ApJ, 422, 729Tutukov, A. 1982, IAU Symp. 99, 485Vacca, W., Schmutz, W., Close, L., & Geballe, T.R. 1998, AJ, submittedvan den Heuvel, E.P.J., de Loore, C. 1973, A&A, 25, 387van Kerkwijk, M.H. 1993, A&AL, 276, L9van Kerkwijk, M.H., Charles, P.A., Geballe, T.R., et al. 1992, Nature, 355, 703Walder, R., Folini, D. 1998, A&AL, 330, L21Willis, A.J. et al. 1989, A&AS, 77, 269

NICMOS and the VLTPula, Sardinia, May 26-27th 1998Wolfram Freudling and Richard Hook, eds.
NICMOS Observes the Galactic Center
Marcia Rieke
Steward Observatory, University of Arizona, Tucson, AZ 85721, USA
Abstract. The NICMOS team has devised a comprehensive program of ob-servations of the Galactic Center. The suite of observations include those aimedat measuring proper motions, at determining the spectral type at the tip of themain sequence from the last episode of star formation, at searching for vari-ability near SgrA, and at looking at the distribution of ionized gas. Data inhand give a first look at variability and a detailed look at the search for the tipof the main sequence will be discussed where NICMOS has demonstrated ade-quate sensitivity and photometric precision to identify likely O8-B1 stars at theGalactic Center.
1. Introduction
The crowding of stars at the Galactic Center and their heavy obscuration makes theGalactic Center a very attractive target for NICMOS observations. From groundbaseddata, we already know that the Galactic Center harbors a massive black hole (2106M) and that there are stars with ages significantly less than 50 106 years.The NICMOS instrument team has chosen to focus on projects that take advantage ofthe extremely stable point spread function which should permit both very accurate po-sition measurements and very accurate photometry, even at the shortest wavelengths.The presence of a Pα filter is also of interest for studying the ionized gas at the Galac-tic Center. Because much of the NICMOS data on the Galactic Center has been takenrecently with several projects still awaiting completion, this report will focus on de-scribing the observing strategies and some of the problems that will need to be solvedto extract the maximum return from the NICMOS data.
2. Proper Motion Studies
As originally planned, the NICMOS program to measure proper motions of GalacticCenter stars would have been executed over the projected five- year lifetime of NIC-MOS. Because of the thermal short which has reduced the lifetime to two years, thisprogram has had to change its observing strategy. The team had hoped to observewith the same stars always hitting the same pixels, but the desire to acquire a num-ber of repeated observations has necessitated relaxing this requirement. Groundbaseddata suggest that some velocities may be as high as 1000 km/sec, much higher thanthe 100 km/sec that the program was designed to measure and so NICMOS may stillcontribute to this area in spite of its shortened lifetime.
131

NICMOS Observes the Galactic Center 132
The observing strategy is based on a compromise between trying to achieve thehighest possible spatial resolution while still penetrating the dust that obscures theCenter. A filter with a modest width to avoid as many color problems in the astro-metric solutions was also desirable. The team has chosen the F145M filter with camera1 which as .042” pixels as the optimum choice. As a check against possible systematiceffects, a globular cluster, NGC4147, which lies at a distance which results in similarexposure times as for the Galactic Center, is also being observed. This cluster has avery small internal velocity dispersion so no proper motions should be seen. The firstepoch data were taken in June, 1997, as the first NICMOS guaranteed time program toexecute. The stars close to SgrA have S/N 50:1 in this data set. Four more sets ofdata will be taken before NICMOS exhausts its cryogen.
3. Variability Studies
Calibration programs with NICMOS are revealing that it is a very stable instrumentfrom a photometric point of view with monthly repeats of standards showing less than2% spread when flat fielded using NICMOS’ internal lamp (Colina, this conference).The stable point spread function also will contribute to the ability to make accurate andrepeatable measurements in crowded fields. The NICMOS team is looking for evidenceof stellar variability, possible light flashes or variations due to variable accretion intoSgrA, or variations due to micro-lensing. The data that have been obtained to date havenot been examined carefully but do not reveal variations at the level of 30% or morein exposures 8 minutes in length repeated for nearly an hour. Much longer timescaleswill be probed when the completed data set is available.
4. Observations of Pα
The central90” will be imaged using the Paschenα filter and its associated continuumfilter. The data already returned reveal a similarity to the 5 GHz radio maps, but the keycentral 10”10” remains to be observed.
5. Search for the Tip of the Main Sequence
This portion of the Galactic Center program is the only part where data collection iscomplete, but it is the program requiring the highest degree of confidence in the fluxcalibration and the understanding of the NICMOS photometric system. This projectis meant to probe the history of star formation at the Galactic Center. The presenceof M supergiants such as IRS7 and Wolf-Rayet and/or LBV stars such as the IRS 16stars strongly suggests that star formation has occurred recently. The strong and dis-tributed Pα flux also suggest the widespread presence of hot stars. If NICMOS can becalibrated to the goal of 2% accuracy and if the interstellar extinction law can also bedetermined with adequate precision along this line of sight, then multi-color photome-try with NICMOS can be used to deredden the stellar population and place the stars ona color magnitude diagram. The bluest stars representing the tip of the main sequencefrom the last epoch of star formation should be apparent – for example, O8-O9 starsshould have an apparent magnitude around K 1314. The difficulty will be in prov-

NICMOS Observes the Galactic Center 133
ing that the colors are well enough determined, especially at the shortest wavelengthswhere such stars will be about 7 magnitudes fainter in the F110M filter.
Preliminary analysis of the data reveals a color magnitude diagram with both aclump of blue stars with the correct properties to be the tip of the main sequence and aclump of red stars which are likely to be red giants, another population expected at theCenter. The stars closest to SgrA are all very blue, and only further work will resolvewhether they have unusual properties due to being close to a black hole or whether theircolors reflect their being ordinary O stars. This preliminary work has also shown thata careful determination of the extinction law in NICMOS filters will be required, withthe IRS 16 stars playing a key role in this determination since their spectral types andhence intrinsic colors are now well understood.
Acknowledgments.The U.S. National Aeronautics and Space Administration isthanked for the funding which permitted the construction and operation of NICMOS.

NICMOS and the VLTPula, Sardinia, May 26-27th 1998Wolfram Freudling and Richard Hook, eds.
NICMOS/HST H-band (F160W) Images of the 30 Dor StarburstCluster
H. Zinnecker
Astrophys. Inst. Potsdam, Germany
A. Moneti
ISO Science Operations Centre, Villafranca, Spain
1. Introduction
We have taken diffraction-limited ( 0.15”) near-infrared F160W (henceforth H-band,for convenience) images with NICMOS on HST of the center of the R136 cluster (age3.5 Myr) in the core of the 30 Dor giant HII region in the Large Magellanic Cloud.
The aim is to search for the low-mass (M < 2M) low-luminosity, pre-Main Se-quence stellar population and to determine the H-band luminosity function, and even-tually to determine whether the mass function is normal down to and below sub-solarmass stars, or whether there latter are missing. Note that the best available data so far(ground-based, Brandl et al. 1996, ApJ 466, 274) can sample onlyM > 2M, whileprevious V and I band HST images with WFPC2 (Hunter et al. 1995, ApJ. 448, 179)have reached down to masses3M and could not answer the question if the the IMFis truncated at lower masses. Our initial tests on the data show that we reach H 22.5,which corresponds to M=0.2M, according to pre-Main Sequence evolutionary mod-els, and it is not out of the question that we will be able to reach even deeper with somelater recalibration. On the other hand, the faintest stars measured in the crowded centralregion will be much much brighter than this limit.
The answer to the question of whether sub-solar mass stars have formed in theR136 cluster is key to determining whether it is a prototype young globular cluster, inwhich case it must have lots of them, and should clarify whether the IMF in starburstclusters and starburst galaxies, is deficient in low-mass stars. The absence of low-mass stars would have far-reaching consequences for the chemical, dynamical, andphotometric evolution of starburst galaxies (e.g. Charlot et al. 1993 ApJ. 419, L57).
2. Observations and Preliminary Analysis
The planned observations consisted of a 3x3 “core” mosaic centered on R136, two 3x1“wings” extending from two adjacent sides of the core mosaic, and several sky positionslocated between 10’ and 20’ mostly north of the cluster. At each position four ditheredimages were obtained in order to remove cosmic rays, bad pixels, and the coronographichole. The data were obtained in multiaccum mode, with SAMP-SEQ=STEP128, andusing NSAMP=16 which gave a maximum integration time of 896 sec. The wingswere planned in so that NIC-1 would cover the cluster core in one of the positions.Unfortunately a programming error caused the first wing to start at the wrong side andthus to move inward rather than outward, so that it resulted in an extra, and unnecessary
134

NICMOS H-band Images of the 30 Dor Starburst Cluster 135
Figure 1. Layout of the 30 Dor NIC2 observations, superimposed on a5x5’ SOFI near-infrared image of the region (Moorwood et al., The Messen-ger 91, title page)
image of the core, and missed the NIC-1 images of the core The second wing has notbeen executed to date. Figure 1 shows the NIC2 frames overlaid on an infrared imageof 30 Dor taken with SOFI.
All observations have been obtained after the August 97 fix, and no sign of the“pedestal” feature can be seen in our data. While the pedestal might be difficult to seeon the crowded source images, the sky fields contain very few objects, and especiallythere we see no sign of this effect.
The raw data were processed with the standard pipeline, specifically with calnica3.1, and various mosaics were constructed using calnicb 2.1.2. The maximum dynamicrange (peak of brightest star [about 2500 DN] divided by the rms noise [0.01 DN]) isover 250,000. Our first attempts at doing photometry on these images were performedwith DAOphot on selected single images and on selected 4-image mosaics of a singleposition; for these attempts we started with sky images and otherwise the least crowded

NICMOS H-band Images of the 30 Dor Starburst Cluster 136
regions of the cluster. In what follows we give a brief description of the images and ofthe problems encountered in running DAOphot.
The NIC-2 images are characterised primarily by an unusual PSF (by ground-based standards) consisting of (1) a central core which is close to Gaussian in shape,with a FWHM of about 1.75 pix, and with is thus somewhat undersampled, (2) a firstAiry ring with extends between r = 2”.4 and 3”.5, peaking at about 3”, and with a peakintensity of about 10% of the core, (3) a cloud of over twenty “dots” located between4” and 8” from the core, and with peak intensity about 0.15% of the maximum, and (4)12 long diffraction spikes, arranged in four groups of three, with changing intensity asa function of distance from the center. Secondly, the field is very crowded, and evenextremely crowded in the centre.
First of all, it is important to give proper values to the gain and readnoise param-eters (“epadu”, and “readnoi”): since the data values are count rates, the effective gainis the true gain multiplied by the integration time in sec. The latter is actually pixeldependent (only a few multiaccum readouts, and thus a short integration time, are usedon bright stars; we have used the full integration time. The read noise for a single readis about 30 electrons, but the effective read noise is lower since there are 16 reads onunsaturated pixels.
Determining the PSF with such high dynamic range and in a crowded region is amajor challenge: overall there are very few stars that sufficiently bright and sufficientlyaway from other bright stars that they can be used for PSF determination, and secondlythe “dots” around these stars are themselves identified as stars by the DAOfind algo-rithm, and even though they are often slightly elongated, the roundness and sharpnessparameters in DAOfind are less useful than one would like given the undersampling(and also because they are designed primarily for sources elongated along the pixels).So far we have found no very good method of telling DAOphot that the “dots” are fea-tures of the PSF, and not nearby stars. Ideally one would like to convolve the imagewith a kernel more suited to the NIC-2 PSF, rather than one suited to a Gaussian PSF;this go a long way toward avoiding picking up the “dots” as stars.
A second method is to use a synthetic PSF. We have simulated a polychromaticPSFs using John Krist’s Tiny Tim package, and using a 5000 K blackbody as the sourcespectrum. These PSFs have the advantage of not being contaminated by nearby stars,but in them they seem to leave somewhat higher residuals in PSF-subtracted imagesthan empirically derived PSFs.
The undersampling problem has already been mentioned in the context of theDAOfind algorithm. A second problem it causes is that the “fitrad” parameter needsto be exceedingly small, i.e. 1.85 pix at most, or the fit will extend to the Airy ring,with poor results. This means that very few pixels are used, and large residuals remainafter the fitting process. Note that so long as “fitrad” is small, the best fit analyticalfunction for the core of the PSF is a Gaussian; for larger “fitrad”, the fit extends intothe region where the Airy ring’s contribution is significant, and the best fit is given bythe “penny1” function. In order to avoid this, we have run DAOphot on an expanded,or magnified (by a factor of 2, and with spline interpolation) image, so that more pixelscan be used in the fit of the analytical core. The result showed a much better subtractionover the stellar cores.

NICMOS H-band Images of the 30 Dor Starburst Cluster 137
3. Preliminary Results
In order to get a first idea of the kind of results we could expect, we went ahead withallstar using an empirically determined PSF on one of the “core” mosaic corner images.The results indicate that the observed H-band luminosity function increases at least toH = 20th mag. Here a very rough calibration was performed using H = 11.5 for thestar Mk34, which was used as a reference (we have not yet compared this calibration tothe ”standard” calibration derived by STScI). Stars as faint as H = 22.5 were detected,but the effects of completeness have to be assessed before we can make any statementabout what really happens beyond 20th mag, i.e. below 2 M.
Acknowledgments. Our NICMOS 30 Dor team consists of B. Brandl, W. Brand-ner, A. Eckart, D. Hunter, R. Larson, M. McCaughrean, G. Meylan, A. Moneti, M.Rosa, N. Walborn, G. Weigelt, and H. Zinnecker (PI). We would like to thank theparticipants at this conference for fruitful discussions, in particular M. Rieke and S.Stolovy, G. de Marchi and R. Hook.

NICMOS and the VLTPula, Sardinia, May 26-27th 1998Wolfram Freudling and Richard Hook, eds.
The Formation and Evolution of LMC Rich Star Clusters: NGC1818
R.A.Johnson, R.A.W.Elson, G.Gilmore, S.Beaulieu, N.R.Tanvir
Institute of Astronomy, Cambridge, UK
B.Santiago
Universidade Federal do Rio Grande do Sul, Porto Alegre, Brazil
Abstract. The Large Magellanic Cloud (LMC) is uniquely suitable for thestudy of massive star clusters at all stages of evolution. By combining HSTobservations of these clusters with N-body models we hope to understand theorigin and evolution of rich star clusters in our own Galaxy, in the LMC, andbeyond. Here we give a brief overview of our large Cycle 7 HST project andpresent some preliminary results.
http://www.ast.cam.ac.uk/LMC
1. LMC Project Outline
Our LMC globular clusters sample contains 8 clusters. These are grouped into four agepairs, with ages of 1071010 yr. They are among the richest clusters in the LMC andhave masses 104M. Table 1 lists some important properties of the cluster sample.
Our observing strategy is to obtain HST images of two fields in each cluster, onefield at the cluster core and one at the half mass radius. HST images of both regionsare taken with WFPC2 (F555W and F814W) and NICMOS (F160W). STIS images arealso taken at the half mass radius. We obtained 95 orbits of Cycle 7 HST time (PID7307) and hope to have all the data by the end of the year.
Current N-body codes are now capable of modelling realistic systems with 104
stars. We aim to combine our HST observations with N-body models to understandthe formation and evolution of globular clusters. A detailed discussion of the aimsof this LMC project is given in Elson et al. (1998a). In brief, we will use the youngclusters to constrain the star formation timescale (see below for an example) and alsoto look for evidence of sequential star formation (e.g. did low mass stars form first?). Binaries play a crucial role in cluster evolution and we will be able to place firmobservational constraints on the binary fraction at various evolutionary stages. Usingour very deep STIS images we will construct initial mass functions (IMFs). If there isa universal IMF then a minimal expectation would be that the younger LMC clusters,with very little dynamical evolution, a wide range of stellar masses, and in some casesvery similar metallicities, should have indistinguishable mass functions.
138

Formation and Evolution of LMC Rich Star Clusters: NGC 1818 139
Table 1. The LMC globular cluster sample
Cluster log(age/yr) [Fe/H]1 Rg2 R00
c3 Recent CMD
NGC 1805 7.2 ... 3.7 ... ...NGC 1818 7.3 -0.8 3.4 9.4 Will et al. (1995)NGC 1831 8.7 -0.3 4.6 15.7 Mateo (1998)NGC 1868 8.8 -0.6 5.4 6.0 Corsi et al. (1994)NGC 2209 9.1 -1.0 5.7 18.8 Corsi et al. (1994)H14=SL506 9.2 ... 4.4 9.4 none availableNGC 2210 10.1 -2.2 5.0 6.8 Brocato et al. (1996)H11=SL868 10.1 -2.1 5.2 18.0 Mighell et al. (1996)
1The values of metallicity are quite uncertain; for many of the clusters widely differ-ing values are quoted in the literature
2Distance from the LMC centre
3Core radius
2. NGC 1818 Initial Results
NGC 1818 is one of the two youngest clusters in our sample. It has an age of 20-40 Myr(Hunter et al. 1997) and a metallicity of [Fe/H]=-0.8 (Will et al. 1995). We have usedWFPC2 (PC, F555W) and NICMOS (NIC2, F160W) observations of the centre of thiscluster to search for evidence of age spreads. The NICMOS observations were takenas part of this project. However, as our new WFPC2 observations have not yet beentaken we have used archive F555W data (PID 6277 PI J. Westphal). Unlike our ownWFPC2 observations, the archive data has no exposures short enough not to saturatethe brightest stars. Figure 1 shows the NIC2 F160W image.
The same procedure for obtaining the photometry was followed in the opticaland in the near-infrared. The IRAF package DAOPHOT was used. Firstly the taskDAOFIND was used to detect stars on the image, and aperture photometry was ob-tained for these stars. A point spread function (psf) was constructed from bright starsin the image. All the stars in the image were then fitted with the psf. The psf fittingdiagnostics (chi and sharpness) were used to exclude non-stellar objects to producethe final star list. To construct the colour-magnitude diagrams we have used aperturephotometry of this final star list.
The many diffraction spikes, especially in the NICMOS image, could be affectingthe magnitudes of some of the stars and introducing a scatter in the colours. All thestars in the final star list have therefore been visually inspected on both the images.Those that appear to be affected by the diffraction spikes of bright neighbours, or thatare very close to a bright star, have been removed.

Formation and Evolution of LMC Rich Star Clusters: NGC 1818 140
Figure 1. NIC2 F160W image of NGC 1818 central regions. Bad pixelsare white.
An estimate of the maximum error in the H160 magnitude of the bright stars dueto the varying underlying background showed that the psf fitting errors gave a goodestimate of the error. The V555 errors are poisson errors.
Figure 2 shows the V555 vs. V555-H160 colour-magnitude diagram for the centralregions of NGC 1818. Overplotted on the data are isochrones for [Fe/H]=-0.7 withages of 25, 40, 63 and 159 Myr. The isochrones are from Bertelli et al. (1994) withmagnitudes calculated for the HST passbands (Worthey 1998) and have been shifted toa distance modulus of 18.5 and reddened by E(B-V)=0.05. The H160 data have not beenphotometrically calibrated and so an arbitrary x-axis shift has been applied to align thedata with the isochrones. It can be seen from the position of the isochrones that agespreads in the cluster will be apparent for V555< 19. Figure 3 zooms in on this region.
Other possible causes of a spread in the colour magnitude diagram are backgroundfield star contamination and the presence of cluster binaries. From the background fieldpresented in Hunter et al. (1997) we estimate that one of the stars with V555<18, andone of the stars with 18< V555<19 could be background stars. For V555>19 it is not

Formation and Evolution of LMC Rich Star Clusters: NGC 1818 141
Figure 2. Colour magnitude diagram for NGC1818 central regions. Over-plotted are isochrones for ages between 25 and 169 Myr.
Figure 3. Colour magnitude diagram for NGC1818 central regions show-ing the area where age spreads are detectable.

Formation and Evolution of LMC Rich Star Clusters: NGC 1818 142
Figure 4. Position of equal mass binary sequence (dashed lines) for twoisochrones of ages 25 and 63 Myr
possible to estimate the background star contamination from Hunter et al. (1997). NGC1818 contains a binary star population (Elson et al. 1998b), with the majority of binarieshaving a secondary mass> 70% of the primary mass. In this case the observed binarysequence lies along the equal mass binary sequence. Figure 4 plots the position of anequal mass binary sequence for the 25Myr and 63 Myr isochrones. Although some ofthe spread in stars with V555 18 could be due to binaries, this is not the case for thebrighter stars.
Figure 3 contains three bright stars (V555<18) which lie to the right of the 63Myrisochrone. As mentioned above these stars have been inspected in both the V555 andH160 images for underlying diffraction spikes or neighbouring bright stars which maybe affecting their magnitudes. They lie close to the 169 Myr isochrone. This is muchto old for them to be cluster members. As mentioned above the background field starcontamination at these magnitudes should be negligible. However there is always thepossibility that we are unfortunate enough to be looking at a background clump of stars.Analysis of our own background fields and parallel data will enable us to place betterlimits on the expected number of background stars at each magnitude.
There are several stars with V555 around 19 which have very red colours. Again,it is possible that these are field stars and/or background galaxies.
The rest of the stars with V555 <18 appear to lie mostly within the 20-63 Myrisochrones. There is tentative evidence here for an age spread of some 40Myr. However,we need to run simulations to quantify how much of this spread is due to photometricerrors. The crossing time at the half mass radius of NGC181810Myr. If the 40Myrage spread is real then it is several times greater than the crossing time which has

Formation and Evolution of LMC Rich Star Clusters: NGC 1818 143
implications for the process of star formation in the progenitor cloud. We explore theseimplications further in a future paper.
3. Future Improvements
There were a few bright stars which were saturated on the archive WFPC2 observationsused here. Our own WFPC2 data will contain some very short observations which willallow us to place these bright stars on the CM diagram. Note that the brighter the starsthe greater the separation between isochrones of different ages, so even a few brightstars are an important age spread indicator. We hope to reduce the errors on the H160photometry by possible improvements in the NICMOS data reduction and also in thepoint spread fitting.
References
Bertelli, G., Bressan, A., Chiosi, C., Fagotto, F., Nasi, E. 1994, A&AS, 106, 275Brocato, E., Castellani, V., Ferraro, F., Piersimoni, A., Testa, V. 1996, MNRAS, 282,
614Corsi, C., Buonanno, R., Fusi Pecci, F., Ferraro, F., Testa, V., Greggio, L. 1994, MN-
RAS, 271, 385Elson, R. A. W., 1998a, in prep.Elson, R. A. W., Sigurdsson, S., Davies, M., Hurley, J., Gilmore, G. 1998b, MNRAS,
submittedHunter, D. A., Light, R. M., Holtzman, J. A., Lynds, R., O’Neil, Jr., E. J., Grillmair, C.
J. 1997, ApJ, 478, 123Mateo, M. 1998, ApJ, 331, 261Mighell, K. J., Rich, R. M., Shara, M., Fall, S. M. 1996, AJ, 111, 2314Will, J., Bomans, C., de Boer, K. 1995, A&A, 295, 54Worthey, G. A. 1998, priv. comm.

NICMOS and the VLTPula, Sardinia, May 26-27th 1998Wolfram Freudling and Richard Hook, eds.
A Color Analysis of NICMOS Parallel Observations
Michael R. Corbin, Rodger I. Thompson, Elizabeth Stobie, & Irene Barg
NICMOS Group, Steward Observatory, The University of Arizona, Tucson, AZ,85721, U.S.A.
Abstract. NICMOS observations made in parallel with the other HST instru-ments have produced an archive of over 2,000 images, covering a wide range ofGalactic latitudes. The images obtained through the end of 1997 were taken withall three cameras, using theJHK-analog filters and the Camera 3 grisms. Themaximum sensitivity of these images is approximately 0.1µJy, which shouldallow the detection of such astrophysically interesting sources as brown dwarfsin the solar neighborhood and star-forming galaxies out to z 3. Using modeland actual spectra, we have derived the colors of a variety of objects includingstars, brown dwarfs, and high-redshift galaxies in theJHK-analog filters. Wehave also developed software designed to perform batch photometry on NIC-MOS images and measure the associated object colors. Follow-up optical andinfrared spectroscopy of interesting sources can be obtained with 10-meter classtelescopes such as the VLT. In this contribution we describe the NICMOS par-allel images and our analysis software, and discuss our preliminary findings.
1. Introduction
An important benefit of the refurbishedHubble Space Telescopehas been the routineacquisition of images by the NICMOS cameras when either the WFPC2 or STIS in-struments are making pointed observations. These parallel observations are designedto supplement the NICMOS pointed observations, with the broad goals of probing thestellar population of the Galaxy and external galaxies, investigating regions of star for-mation, and assessing the distribution and evolution of galaxies and QSOs. To date,the volume of NICMOS observations released into the HST Archive exceeds two thou-sand images, with roughly double that amount expected by the end of Cycle 7. Such adatabase offers great potential for addressing the aforementioned issues, and we haveundertaken to analyze it as thoroughly as possible, with an emphasis on the classifica-tion of objects by their colors in the NICMOS filters.
2. The NICMOS Parallel Program
NICMOS parallel observations were begun in 1997 June using all three NICMOS cam-eras, with Cameras 1 and 2 selected as prime due to the focus problem with Camera 3.Camera 3 was selected as prime in 1997 November as it came into better focus, due toits larger field of view and the availability of its grisms. Parallel observations of a givenfield were made in theJHK-analog filters F110W, F160W, and F222M in Camera 2,
144

A Color Analysis of NICMOS Parallel Observations 145
while observations in Cameras 1 and 3 were limited to the F110W and F160W filters,and the G096 and G141 grisms in Camera 3. Integration times range from a minimumof 192s to a maximum of 1280s, with associated 5σ detection limits of approximately 1to 0.1µJy. Through 1997 December, the approximate total areas covered in the usableobservations of each camera were 23 arcmin2 (Camera 1), 70 arcmin2 (Camera 2), and174 arcmin2 (Camera 3). A small fraction of the images suffer blurring or streakingfrom spacecraft motion and contain no useful information, while a significant fractionof the images, particularly in Camera 1, contain no objects.
A sample set of Camera 2 parallel images in the F110W, F160W, and F222M filtersis shown in Figure 1. The F222M image shows strong Airy rings in the object PSFs,which can be treated to a limited degree in the photometry software. Fields observed atlow Galactic latitudes are often very rich, and a batch photometry approach is clearlynecessary.
3. Analysis
Our first step in the analysis of the parallel images has been to re-calibrate them, bymatching the raw images with the best available on-orbit dark current and flat-fieldframes. Comparison of the resulting images with those processed through the STScIcalibration pipeline indicates a maximum improvement of approximately 3% in photo-metric accuracy. This increased accuracy should also improve our color classificationsof the objects in the F110W, F160W, and F222M filters.
We have derived colors in these filters for a wide range of objects, including normalstars, brown dwarfs, young galaxies, ultraluminous infrared galaxies, and QSOs. Wehave found that in most cases there is a good separation of the different classes of objectin the plane of the (F110W - F160W), (F110W - F222M) color indices, which can bemeasured for the Camera 2 observations. These colors were derived using model andactual spectra of the objects (e.g., Kurucz model spectra of stars; Kurucz 1992). Thecolors were derived by convolving the filter transmission curves (factoring in detectorquantum efficiency) with these object spectra, and taking the ratio of the integratedfluxes of the resulting spectra. An illustration of this method is shown in Figure 2,which compares the Camera 2 F110W, F160W, and F222M filter transmission curveswith a composite spectrum of several hundred QSOs discovered in the Large BrightQuasar Survey (Francis et al. 1991). The composite spectrum has been redshifted to z= 6, and we have derived colors for this spectrum over the range 3 z 10. For activegalaxies at low redshift, we have used the interpolated nuclear spectrum of the highlyluminous Seyfert 2 galaxy Markarian 231 as a guide. Our efforts to derive object colorsare not yet complete, and in particular we are currently working on deriving the colorsof high-redshift supernovae using their optical and ultraviolet spectra.
Of particular current interest is the detection of brown dwarfs and very low-massstars, and the determination of their mass function and space density. Burrows et al.(1997) have generated model spectra of brown dwarfs in the infrared and determinedthe detection thresholds associated with current and planned infrared space missions.While Burrows et al. find that the spectra of brown dwarfs depend in a complex way ontheir age, mass and composition, the 0.1µJy sensitivity limit of the NICMOS parallelobservations should allow the detection of a certain range of them out to a distance ofapproximately 10 pc. The spatial resolution of NICMOS could also lead to the detection

A Color Analysis of NICMOS Parallel Observations 146
Figure 1. Sample NICMOS Camera 2 parallel images in the F110W,F160W, and F222M filters (clockwise from top left). The bright spot in theupper left of the F222M image is the coronagraphic hole, incompletely re-moved by the flat field frame.
of brown dwarfs in close binary systems such as Gl 229B, which is difficult from theground.
Figure 3 shows the color-color diagram for Camera 2, for the spectra of pointsources. The sensitivity limit of these observations should also allow the detection ofthe recently discovered population of young ( 1 Gyr) star-forming galaxies at z 3(Steidel et al. 1996), based on their K-band fluxes, as well as star-forming galaxiesat lower redshifts. In Figure 4 we show the Camera 2 color-color plot for a 1 Gyr-old galaxy over a wide range of redshifts, using the population synthesis model ofBruzual & Charlot (1993). While the detection of such galaxies out to z 10 in theseobservations is not possible under normal circumstances, lensing of such sources by aforeground galaxy cluster could raise their fluxes to the detection level. The limitationof the Camera 1 and 3 wide-band observations to the F110W and F160W filters should

A Color Analysis of NICMOS Parallel Observations 147
Figure 2. Comparison of NICMOS Camera 2 F110W, F160W, and F222Mfilter transmission curves (dotted lines) with the Large Bright Quasar Surveycomposite quasar spectrum, redshifted to z = 6. Flux units are arbitrary. Col-ors in this filter set were derived from the convolution of spectra such as thiswith the filter transmission curves.
still allow the identification of sources of interest such as infrared luminous galaxiesand young galaxies at very high redshift, which as may be seen from Figures 3 and 4have negative values of the (F110W - F160W) color index. Embedded young stellarobjects also have spectra which peak in the far infrared (Green & Lada 1996), and as aresult can also be identified by negative values of this index.
4. Software
We have developed an IDL-based interface for the batch photometry program DoPhot(Schechter, Mateo, & Saha 1993) designed specifically for the processing of NICMOSimages. Compared to other photometry packages, DoPhot offers the advantages ofbeing able to fit an empirical PSF, and has easily adjustable detection thresholds andaperture sizes. Our interface, called NICPHOT, operates on NICMOS images by firstmultiplying by the exposure time image to convert from adu/s, then allowing the inter-active measurement of image background levels and PSFs. The DoPhot programs arethen run, generating an output list of object positions, shape classifications, and instru-mental magnitudes. We are developing a separate IDL program, NICCAT, to take theseoutput files and determine object fluxes, colors (corrected for Galactic extinction), andthe associated classifications. By applying NICPHOT and NICCAT together to the par-allel images we expect to obtain fluxes and tentative classifications for all the objectsthey contain. The application of these programs is not limited to the parallel images,

A Color Analysis of NICMOS Parallel Observations 148
-1
-0.5
0
0.5
1
1.5
-0.4 -0.2 0 0.2 0.4 0.6
Camera 2 Colors
Brown Dwarfs (Burrows models)
Kurucz models, T = 4,000 - 60,000 K
z > 3 QSOs
MRK 231
Gl 406 (M6 V, T = 3,000 K)
HB 12 (compact PN)
F11
0W -
F22
2M
F110W - F160W
z = 10
z = 3
Figure 3. The expected color indices of point sources in theJHK-analogfilters in Camera 2. The color indices are defined as the log of the ratio offluxes in each filter. The points represent a combination of model and actualspectra, e.g. the values for the compact planetary nebula HB 12 were mea-sured from low-resolution spectra obtained with the NICMOS grisms. Forstars, Kurucz models were used due to their uninterrupted coverage throughthe near infrared. However, this region is poorly modeled at low tempera-tures, so we have used the near infrared spectrum of the M 6 star Gl 406 as aguide for such objects.

A Color Analysis of NICMOS Parallel Observations 149
-1
-0.5
0
0.5
1
1.5
-0.4 -0.2 0 0.2 0.4 0.6
Camera 2 Colors
Bruzual-Charlot, 1 Gyr, const. SFRF
110W
- F
222M
F110W - F160W
10
9
8
32 1
4
0
76
5
numbers denote redshift
Figure 4. The expected color indices in Camera 2 for a Bruzual & Charlotmodel galaxy spectrum. The model age is 1 Gyr and assumes a constant starformation rate.

A Color Analysis of NICMOS Parallel Observations 150
and we are making them available to the community. In particular, we encourage theirapplication to background sources in deep pointed observations with NICMOS to al-low the serendipitous discovery of interesting objects. NICPHOT does not treat grismimages; this is best done by using the routine NICMOSlook (Freudling 1998).
5. Scientific Objectives and Preliminary Findings
The parallel observations are in no sense complete, and because of the small area ofsky covered cannot be considered a survey from which reliable number counts can bemade (see, however, McCarthy et al. 1998). However, the detection ofany browndwarf and very high redshift galaxy and QSO candidates is important. Specifically,in the case of the former, more examples are required to allow detailed study throughfollow-up spectroscopy, which is possible with 10m-class telescopes such as the VLTand Keck. In the case of QSOs, any detection of objects above z 5 would run contraryto evidence that their space density above such redshifts drops nearly to zero (Shaver etal. 1996). The high angular resolution and dust penetration of NICMOS observationsin the Galactic plane also holds promise for refinement of stellar number counts andpopulation modeling towards the Galactic center. Finally, as with any observations ofthis type, there is always the possibility of detecting new classes of objects, and ourclassification algorithm is structured accordingly.
Full processing of the parallel images with the aforementioned software and thegeneration of a source catalog is expected to take several months. However, we haveto date inspected all of the parallel images taken through 1997 December. In additionto the aforementioned blank fields and blurred images, we have noticed few galaxiesrelative to point sources, and among these several interacting systems, which are likelyto be infrared-luminous. Inspection of the images also reveals a wide range in sourcedensity, ranging from the blank fields to fields at low Galactic latitude which are suffi-ciently rich that the photometry algorithm will be challenged to distinguish individualsources.
References
Bruzual, G., & Charlot, S. 1993, ApJ, 405, 538Burrows, A. et al. 1997, ApJ, 491, 856Francis, P.J., Hewett, P.C., Foltz, C.B., & Chaffee, F.M. 1991, ApJ, 373, 454Freudling, W. 1998, in 1997 HST Calibration Workshop, ed. S. Casertano, R. Jedrze-
jewski, C.D. Keyes, & M. Stevens (Baltimore:STScI), 407Green, T.P. & Lada, C.J. 1996, AJ, 112, 2186Kurucz, R.L. 1992, in IAU Symposium 149,The Stellar Populations of Galaxies, ed.
B. Barbuy & A. Renzini (Dordrecht:Kluwer), 225McCarthy, P. et al. 1998, these proceedingsShaver, P.A., Wall, J.V., Kellermann, K.I., Jackson, C.A., & Hawkins, M.R.S. 1996,
Nature, 384, 439Steidel, C.C., Giavalisco, M., Pettini, M., Dickinson, M., & Adelberger, K. 1996, ApJ,
462, L17

A Color Analysis of NICMOS Parallel Observations 151
Schechter, P.L., Mateo, M., & Saha, A. 1993, PASP, 105, 1342

NICMOS and the VLTPula, Sardinia, May 26-27th 1998Wolfram Freudling and Richard Hook, eds.
The Old Stellar Population of NGC 1569 from NICMOS data
A. AloisiDipartimento di Astronomia, Universita di Bologna, Bologna, I 40126, E-mail:[email protected]
L. Origlia and M. Tosi
Osservatorio Astronomico di Bologna, Bologna, I 40126
L. Greggio1
Dipartimento di Astronomia, Universita di Bologna, Bologna, I 40126
M. Clampin, C. Leitherer and A. Nota2
Space Telescope Science Institute, Baltimore, MD 21218
M. Sirianni
Dipartimento di Astronomia, Universita di Padova, Padova, I 40100
Abstract. To have a census of the old stellar populations of the dwarf irreg-ular galaxies NGC 1569 and NGC 1705 and to trace the major episodes of starformation over a Hubble time in these starbursting systems, we have applied forand obtained HST/NICMOS observations in the F110W and F160W bands withthe NIC2 camera. At the distance of these galaxies, the expected performancesof NIC2 camera should allow one to reach and resolve with the required accu-racy individual stars at the tip of the red giant branch (i.e. with an age spanningfrom 1 to 15 Gyr). NICMOS observations of NGC 1569 were already acquiredin February 1998, while NGC 1705 will be observed in October 1998. Here wepresent some preliminary results on the photometric reduction of the availableNICMOS data and some problems related to the use of this instrument.
1. Cosmological Background and Astrophysical Goals
Dwarf irregular galaxies (DIGs) and blue compact dwarf galaxies (BCDGs) are of cru-cial importance to understand galaxy formation and evolution. They are fundamentalingredients in common scenarios of galaxy formation, either as left-overs or as buildingblocks of the formation process (Silk 1987). They have also been suggested to be the
1Universitaets Sternwarte Muenchen, Muenchen, D 81679
2Affiliated with the Astrophysics Division, Space Science Department of the European Space Agency
152

The Old Stellar Population of NGC 1569 from NICMOS data 153
equivalent at early epochs (z1) of the faint blue galaxies responsible for the countexcess seen in deep photometric surveys.
Nearby galaxies of this type are ideal laboratories for such studies because theirproximity allows us to examine in detail issues which are important to interpret thegalaxy behavior with time, and therefore with redshift; among these the occurrence ofgalactic winds, the chemical enrichment of the interstellar medium and intergalacticmedium, the photometric evolution. Besides, their low level of evolution, as indicatedby the low metallicity and the high gas content, makes these systems the most similarto primeval galaxies, and thus the most useful to infer the primordial galaxy conditionsand Big-Bang nucleosynthesis products. Understanding how the star formation (SF)proceeds in blue compacts and irregulars is then fundamental for astrophysical andcosmological purposes.
A quantitative comparison between observations and chemical evolution modelshas evidenced that the SF in blue compacts proceeds in few short and intense bursts(e.g. Matteucci & Tosi 1985, Marconi et al. 1994). The analysis of the color-magnitudediagrams (CMDs) of dwarf irregulars in the Local Group indicates a SF activity in thelast 0.5 Gyr occurred in long episodes separated by long quiescent intervals (e.g. Tosi1994, Greggio 1995). On the other hand the analysis of the integrated light from giantirregulars is consistent with continuous, even constant SFR (Hunter & Gallagher 1985,1986). All these evidences are consistent with the theory of Stochastic Self PropagatingStar Formation (Gerola et al. 1980): the star formation level is directly related to thedimensions of the systems, the smallest ones having the longest quiescent phases andthe shortest bursts of SF. Anyway, the question is still far from being settled and requiresfurther studies of relatively nearby systems where it is possible to resolve single starsand study the stellar content with the required accuracy.
A crucial point to understand galaxy evolution is thus to check whether or notall the dwarf starburst galaxies contain an old stellar population, besides the youngestone, and trace back to early epochs the history of star formation. The best way tosearch for old stellar populations is to observe the resolvable galaxies in the infraredand construct the corresponding CMDs, where the old low mass stars on the red giantbranch evolutionary phase are more easily visible and distinguishable from the younger,more massive objects.
2. Why choose NGC 1569?
In order to evaluate the contribution of blue compact dwarf galaxies to the galaxy countsat high redshift it is necessary to know their SF history in a wide range of epochs.Systems which show high values of SFRs, as the so-called Blue Compacts and Star-bursting Dwarfs, should be the main contributors to galaxy counts at high redshift andNGC 1569 is the closest system of this type.
NGC 1569 is a blue dwarf irregular located at a distance of 2.2 Mpc, correspond-ing to a distance modulus (m-M)0=26.71. Its total mass and hydrogen content areM'3.3108 M and MH'1.3108 M respectively (Israel 1988). The averagemetallicity is Z'0.25 Z. We are then dealing with a gas-rich system in a relativelyearly stage of its chemical evolution. Furthermore, the intrinsic blue colors and the Hαmorphology, showing many filaments and arc-like structures, indicate that this galaxyis experiencing an intense SF process and related galactic winds.

The Old Stellar Population of NGC 1569 from NICMOS data 154
Figure 1. V vs (B–V) diagram of the stars detected in NGC 1569. Thediagram contains 2800 objects with photometric errorσ <0.2 mag in bothfilters. Superimposed on the observational data are the theoretical stellar evo-lution tracks from 0.6 to 120 M at Z=0.004 (Fagotto et al. 1994). As it isclear, with this diagram we are just able to sample the RSGs, but barely theAGB stars. We are not allowed at all to detect stars at the RGB tip.
Pre-Costar HST studies of the field population of NGC 1569 were done by O’Connellet al (1994) and Vallenari & Bomans (1996). These data have shown that the galaxycontains two so-called Super Star Clusters (SSCs), i.e. unresolved stellar systems sug-gested to be similar to globular clusters but of very young ages (a few Myr). With theirobserved I,(V–I) CMD Vallenari & Bomans reached a magnitude I22.5, sampling alook-back time of1.5 Gyr. Using the interpretative methods of isochrones and syn-thetic CMDs, they demonstrated that the galaxy has experienced a global burst of SFfrom 0.1 Gyr to 4 Myr ago. They found also some evidences of an older episode from1.5 Gyr to 0.15 Gyr with a significantly lower SFR.
3. NGC 1569 as observed in the Optical Bands of HST/WFPC2
NGC 1569 was observed by our group with the WFPC2 on board HST on January 1996(De Marchi et al. 1997, Greggio et al. 1998). Deep images were taken in the F555Wand F439W broadband filters, while less deep frames in the F380W filter (correspond-ing indicatively to the standard ground-based V,B,U bands). The photometric reductionproduced the V, (B–V) CMD plotted in Figure 1 for all objects with a photometric errorσ <0.2 in both bands (2800 stars).
At the distance of 2.2 Mpc the optical data in the B and V filters sample only starsas young as 0.15 Gyr (V,B<26). The theoretical interpretation of this observed CMDwith the method of synthetic diagrams has indicated a SF in the field stopped around 8Myr ago, but rather continuous over the whole look-back time sampled (with quiescentperiods no longer than 10 Myr) and 103 times higher than in the solar neighbourhood(Greggio et al. 1998). Thus in every respect this system has been a starburst galaxywith one of the highest estimated SFRs (420 M yr1 kpc2).

The Old Stellar Population of NGC 1569 from NICMOS data 155
4. The Need for Near-Infrared NICMOS Observations
The optical V, B-V CMD allows us to reconstruct the SF history of NGC 1569 onlyover the last 0.15 Gyr, giving an indication of a high SFR in this look-back time. Thehigh SFR, the relatively low abundances measured and the high gas content revealedfor this object seem to suggest that this galaxy is experiencing a strong SF activity justin recent epochs: its previous SFR should have been at a much lower level.
In their I vs (V–I) diagram sampling a look-back time of 1.5 Gyr, Vallenari & Bo-mans (1996) detected a well populated AGB, which indicates a previous episode of SFin NGC 1569 at intermediate ages (see their Figure 5), even if with a very low SFR.Recent measurements of the oxygen, nitrogen and helium abundances in the ISM ofNGC 1569 (Kobulnicky & Skillman 1997), when compared to predictions of chemi-cal evolution models for bursting dwarfs (Marconi et al. 1994), seem consistent withseveral bursts of SF, provided that strong galactic winds have occurred to loose partof the products of stellar nucleosynthesis. Considerations on the short gas exhaustiontimescales suggest that these previous bursts cannot be as strong as the last one.
In Figure 1 superimposed on the observational optical data are the theoretical stel-lar evolution tracks from 0.6 to 120 M at Z=0.004 (Fagotto et al. 1994). Due to theinstrumental limits, the optical data allow one to analyse in great detail the blue (young)stars and only the more massive red ones. This implies that with the V, (B–V) diagramwe are just able to sample the red supergiants (RSGs) but barely reach the asymptoticgiant branch (AGB) stars. Even using the I, (V–I) diagram we can at best reach thebrightest portion of the AGB (Vallenari & Bomans 1996).
In contrast, NIR CMDs are the best instrument to study properly not only thebrightest red stellar populations (RSGs, AGB) in the age range from a few Myr to 1 Gyr,but also the red giant branch (RGB) stars with ages from 1 to 15 Gyr: since the RGBtip is predicted by all stellar evolution theories to be located at a constant luminositylog(L/L)=3.4, the detection of objects in this phase would without doubts show theexistence of stars in the mass range 0.6-2 M, while the RGB tip color distribution willgive us the epochs of major SF episodes over a Hubble time. The absence of stars atthe RGB tip will definitely show that the parent galaxy has been forming stars only inepochs more recent than 1 Gyr.
5. NICMOS Data in the Central Region of NGC 1569
We observed the field around the two SSCs of NGC 1569 with the NICMOS in-frared detector in February 1998. Ten different frames with a spiral pattern ditheringand a MULTIACCUM readout mode in the two F110W and F160W broadband filters(roughly J and H bands) were taken on NIC2 camera for a 19001900 field of view, aresolution of 000.075 per pixel and a total integration time of 5,100 s in each filter (4orbits in total). The RGB tip in NGC 1569 is expected at J23, as inferred from itsposition at V26 in our optical diagram of Figure 1 and from the typical color of redgiants (V-J3). With the exposure times used NIC2 should be able to reach J,H=2425with a S/N10 and allow us to perform photometry 12 mag below the RGB tip.
All frames were calibrated through the standard STScI pipeline which for ditheredimages makes use of the two different stages CALNICA (for instrumental calibrationand cosmic ray rejection on each single frame) and CALNICB (for the reconstruc-tion of the mosaic). The photometric reduction was performed using the PSF-fitting

The Old Stellar Population of NGC 1569 from NICMOS data 156
DAOPHOT package on a 2 pixel aperture: all parameters involved were set at the val-ues deduced from the HST Data Handbook (see Voit 1997 for more details) and froma statistical analysis of images. Instrumental magnitudes were then converted into theHST VEGAMAG system following the prescription of the Handbook.
The crowding of the infrared field and the difficulty in finding isolated stars toconstruct a good PSF brought us to try the simulation of theoretical PSFs with theTinyTim software (Krist & Hook 1997), but we encountered some difficulties in generatingpolychromatic PSFs. We thus searched for datasets of some calibration programs inorder to build a template PSF in each filter for the reduction of our frames.
Figure 2 shows the mosaicked image in the F160W band with sumperimposedthe coordinates of all stars fitted in both bands and plotted in the infrared CMDs ofFigure 3 (a total of1330 objects). These diagrams show few main sequence starsaround (J–H)0 and a large number of post-main sequence red stars.
6. How can we reach our Scientific Goal?
From a rapid analysis of our NIR CMDs it is immediately clear that however we choosethe values of the parameters involved in the procedure of photometric reduction, we arenot able to reach the predicted magnitude limits in J,H of 2425: we remain 23mag brighter and1 mag above the RGB tip. An inspection of the position of starsfitted in the F160W image of Figure 2 indicates that the stars measured are only thebrightest objects; there are fainter objects which appear resolved by eye but the standardphotometric reduction seems unable to recognize and fit them.
The problem is not attributable to the estimate of the necessary exposure time.It could be instead that NICMOS performances have been somehow overestimated orthat the instrumental calibration and frame combination of the associated images in thestandard pipeline have not been appropriate. The complex procedures used yield alsoto a difficult estimate of parameters (asgain and readout noise) involved in the pho-tometric reduction of the final mosaicked images. As these parameters are of primaryimportance in the detection of stars above a certain threshold and in the estimate ofphotometric errors and fit goodness, an erroneous value can lead to an incorrect resultand to the difficulty in finding, fitting and retaining faint stars. This difficulty in fittingfaint stars seems not due to the PSF used, as we tried with two different solutions: aPSF constructed with three quite isolated stars in our frames and a template obtainedfrom the calibration program frames. On the other hand, we should also consider theextreme crowding of our central regions, which requires a very fine tuning of all thereduction parameters to resolve the fainter stars.
The CMDs in Figure 3 represent at the moment the best result we are able to obtainwith the standard calibration pipeline and photometric reduction. They are clearly in-sufficient to reach the RGB tip at J23. At this preliminary stage, we can conclude thatnon standardprocedures for the data reduction appear to be necessary (and hopefullysufficient) to reach our scientific goal.
Acknowledgments. A.A. thanks the organizing committee of this workshop for thefinancial support.

The Old Stellar Population of NGC 1569 from NICMOS data 157
Figure 2. Deep combined image of NGC 1569 in the NICMOS F160Wfilter for a total exposure time of5,100 s. The inner region of the galaxy iscentered in the NIC2 field of view corresponding to19001900 and yieldingan effective plate scale of 000.075 per pixel. The ten dithered frames werecombined into the mosaicked image for a total field of1900:71900.6. Ori-entation is indicated in the figure. Superimposed to the image (white points)are the positions of all stars fitted in both NIR bands with the standard pho-tometric reduction. An inspection of the figure clearly indicates that the starsmeasured are only the brightest ones: there are fainter objects which appearresolved by eye but that the procedure is unable to recognize and fit.
References
De Marchi, G., Clampin, M., Greggio, L., Leitherer, C., Nota, A., & Tosi, M. 1997,ApJ, 479, L27
Fagotto, F., Bressan, A., Bertelli, G., & Chiosi, C. 1994, A&AS, 105, 29Gerola, H., Seiden, P. E., & Schulman, I. S. 1980, ApJ, 242, 517Greggio, L. 1995, in The Local Group: Comparative and Global Properties, ed. J. Storm,
A. Layden & C. Smith (Garching: ESO), 72

The Old Stellar Population of NGC 1569 from NICMOS data 158
Figure 3. Infrared CMDs of the1330 stars detected in the NIC2 field ofNGC 1569: J vs (J–H) (left panel) and H vs (J–H) (right panel). By eye itis clear that the standard photometric reduction has not allowed us to samplestars at the RGB tip around J23: we are1 mag brighter.
Greggio, L., Tosi, M., Clampin, M., De Marchi, G., Leitherer, C., Nota, A., & Sirianni,M. 1998, ApJ, in press
Kobulnicky, H. A., & Skillman, E. D. 1997, ApJ, 489, 636Hunter, D. A., & Gallagher III, J. S. 1985, AJ, 90, 80Hunter, D. A., & Gallagher III, J. S. 1986, PASP, 98, 5Israel, F. P. 1988, A&A, 194, 24Krist, J., & Hook, R. 1997, The Tiny Tim User’s Manual, Ver. 4.4Marconi, G., Matteucci, F., & Tosi, M. 1994, MNRAS, 270, 35Matteucci, F., & Tosi, M. 1985, MNRAS, 217, 391O’Connell, R. W., Gallagher III, J. S., & Hunter, D. A. 1994, ApJ, 433, 65Silk, J. 1987, in High Redshift and Primeval Galaxies, ed. J. Bergeron, D. Kunth,
B. Rocca-Volmerange & J. Tran Than Van (Gif-sur-Yvette; Editions Frontieres),301
Tosi, M. 1994, in Dwarf Galaxies, ed. G. Meylan & P. Prugniel (Garching: ESO), 465Vallenari, A., & Bomans, D. J. 1996, A&A, 313, 713Voit, M. 1997, HST Data Handbook (Baltimore: STScI)

NICMOS and the VLTPula, Sardinia, May 26-27th 1998Wolfram Freudling and Richard Hook, eds.
HST-NICMOS Observations of Galactic Bulges: Red Nuclei inNearby Galaxies
Reynier F. Peletier1
1Dept. of Physics, University of Durham, South Road, Durham, DH1 3LE, UK,E-mail: [email protected]
Marc Balcells2
2Instituto de Astrofısica de Canarias, Via Lactea, s/n, 38200 La Laguna,Tenerife, Spain. E-mail: [email protected]
Abstract. We describe multi-color observations with NICMOS andWFPC2 of 20 nuclei of nearby galactic bulges of types S0-Sbc. We find thatthe centers of 19 out of 20 bulges are found to be dusty, with average extinctionAV between 0.6 and 0.9 mag. Our second result is that the stellar populationsof galactic bulges of type S0-Sb show a very tightB I vs. I H relation, sug-gesting that the age spread among bulges of early-type spirals is small (at mostabout 2-3 Gyr).
1. Introduction
Bulges of spiral galaxies are generally seen as small elliptical galaxies in the center ofa large spiral. For example, bulges fall on the fundamental plane of elliptical galaxies(Djorgovski & Davies 1987, Bender et al. 1992). Dynamically, bulges are hotter thandisks, while colder than giant ellipticals. Their surface brightness profiles fall off asµ(r)∝ r1=n (Andredakis et al. 1995), withn getting smaller towards later morphologicaltypes. In a series of papers (Balcells & Peletier 1994, Peletier & Balcells 1996, 1997)we have studied the stellar populations of bulges by taking a sample of highly inclinedearly-type spirals (type S0-Sbc), and analyzing optical and near-infrared colors of theside of the minor axis which is not obscured by the disk. This method avoids the needto address extinction corrections, which are very uncertain in inclined galaxies. Thatour minor axis color profiles are smooth suggests that dust effects are indeed minimal.
We found that dustfree colors of bulges are never redder than ellipticals of the sameluminosity. This implies that their metallicities are lower than those of giant ellipticals.In addition we found that the colors of bulges are very similar to those of the inner disk,both for blue optical and for optical-infrared colors. Color differences from galaxy togalaxy are much larger than the differences between bulge and disk of the same galaxy.This implies that the inner disk (at 2 scale lengths) must have formed at most 3 Gyrafter the bulge.
HST allows us to investigate the centers of bulges with a ten fold increase in spatialresolution. HST-based information on the colors of galaxy centers at scales of tens ofparsecs is scarce. Colors contain useful information on the stellar populations of the
159

HST-NICMOS Observations of Galactic Bulges 160
galaxy centers. They also give clues about the amount of internal extinction due todust. For ellipticals, unsharp masking techniques show that patchy dust is very common(van Dokkum & Franx 1995). Dust may affect the shapes of surface brightness profilesobserved by eg. Lauer et al. (1995).
Here we show first results of a color study of the centers of galactic bulges. Sincewe are interested in disentangling the effects of extinction, metallicity and age, we havechosen to observe a sample of galaxies in 3 bands covering a large wavelength baseline.We observed in the NICMOS F160W band (H-band), F814W (I ) and in F450W, awider version of theB-band. With these three bands we can make the redI H color,primarily sensitive to extinction by dust and old stellar population gradients, and theB I color, especially sensitive to recent star formation. Examples of how these colorscan be used are shown in e.g. Knapen et al. (1995). This is the first study of colors ofearly-type galaxies based on NICMOS data. In a following paper, the surface brightnessprofiles are presented inH, I andB, showing the effects of dust on the surface brightnessprofiles of bulges.
2. Sample and Observations
20 galaxies were observed with HST in Cycle 7 (Summer 1997) with WFPC2 (F450Wand F814W) and NICMOS (F160W). They all are part of the original sample of Balcells& Peletier (1994), which is a complete, magnitude-limited sample inB of early-typespirals (type S0-Sbc) with inclinations larger than 50o. The galaxies observed withHST are all objects for which one side of the minor axis is more or less featurelessas seen from the ground. We assume that this means that extinction by dust there isnegligible (in general less than AB = 0.05 mag). The subsample was chosen to includegalaxies from all types S0-Sbc, excluding galaxies that are exactly edge-on, and isbiased towards the nearest objects.
To reduce the optical data the normal HST-pipeline reduction was used. ForNGC 7457 theI -band observations were taken from the HST Archive. For theH-bandtwo MULTIACCUM NIC2-exposures of in total 256 s were taken, offset from eachother by 100. The normal STSDAS CALNICA reduction package was used, after whicha small fraction of the flatfield was subtracted from the reduced images, to account fora non-zero pedestal level in the raw image. This fraction was determined by requiringthat the final image was smooth. Applying this step is only important for the lowestflux levels, but it improves the image considerably. The final sky background level wasdetermined by comparing the image with the ground-based image in the same band.For theH-band a small correction was applied to theK-band image (a fit to Worthey(1994)’s models):
HK = 0:105(I K) 0:0471
The images were calibrated to the STMAG system using Holtzmann et al. (1995),using a constant shift of 0.10 mag to correct to infinite aperture. After this, the samepaper was used to iteratively account for the color term in the F450W filter. The colorswere corrected for galactic extinction using the new dust maps of Schlegel et al. (1998),and the Galactic extinction law (Rieke & Lebofsky 1985). After this the bands wereredshift-corrected. This small correction (from Persson et al. 1979) was∆B = -5z, ∆I =–z and∆H = 0.
To account for the difference in Point Spread Functions (PSF) when determiningthe X – Y color profile, theX-band image was convolved with theY-band PSF, and

HST-NICMOS Observations of Galactic Bulges 161
NGC 5326
NGC 5854
NGC 6504
NGC 5389 NGC 5443
NGC 5689
NGC 7331 NGC 7457 NGC 7537
NGC 5879 NGC 5965 NGC 6010
NGC 5707 NGC 5719 NGC 5746 NGC 5838
NGC 5587NGC 5577NGC 5475
NGC 5422
Figure 1. Real color images of the galaxies. The size of the images isabout 2000 2000

HST-NICMOS Observations of Galactic Bulges 162
5326
5854
6504
5389 5443
5689
7331 7457 7537
5879 5965 6010
5707 5719 5746 5838
558755775475
5422
Figure 2. I H color maps of the galaxies on the same scale as Fig. 1.Superimposed areH-band contours.

HST-NICMOS Observations of Galactic Bulges 163
Figure 3. Color-color diagram for the 20 galaxies. Displayed are the po-sitions of the center (filled) and 1 bulge effective radius on the minor axis(open circles). Also indicated is a reddening vector for a reddening ofAV =0.5 mag.
theY-band image with theX-band PSF. These PSFs were determined with the TinyTim package (Krist 1992). We then determined minor axis profiles in wedges of 22.5o,centered on theH-band nucleus, and subtracted these wedges to get color profiles.Finally the color profiles were combined with the ground-based color profiles, to coverthe whole range of the bulge, shifting the ground-based profile on top of the HST-profile. In this way absolute and relative accuracies of a few percent can be expected(Colina 1998). Real-color images of the galaxies are shown in Fig. 1.
3. TheB I vs. I H color-color diagram
3.1. Dust in Nuclei of Galactic Bulges
In Fig. 2 we show theIH color maps of the 20 galaxies, superimposed on theH-bandcontour maps. The maps indicate the position of dustlanes. Comparing these imageswith those of Fig. 1 it is clear that many, maybe all, galaxies have red nuclei. Wenow try to estimate how much extinction they contain. In Fig. 3 we show the colors atthe center and at one bulge effective radius in aB I vs. I H color-color diagram.The Figure shows indeed that in all cases the center is redder, by sometimes very largeamounts. Since the vector indicating reddening by dust is almost parallel to the thevector indicating changes in metallicity (see Fig. 4), it is not possible to say exactlyhow much of the reddening is due to extinction. Lower and upper limits to the internalextinction may be estimated as follows.

HST-NICMOS Observations of Galactic Bulges 164
We see in Fig. 3 that three blue galaxies in the bottom left corner of the diagramshow small color differences. These are NGC 7457, NGC 5854 and NGC 5577. NGC5577 is an Sbc galaxy with much lower surface brightness than the rest of the galaxies,with patches of dust and star formation everywhere in its central areas, clearly differentfrom most other galaxies in the sample. For the other two galaxies, both semi-minoraxis color profiles are smooth. A plausibleupper limit to the reddening is derived bytaking these profiles to be representative of the population-induced color gradients inour sample; assuming that the colors at one effective radius are dustfree, one obtainsthat the centralI H colors are reddened by on the average 0.29 0.05 mag, andthe B I colors by 0.58 0.10 mag. Alower limit to the reddening can be foundif one assumes that the stellar populations are never redder than those of the centralVirgo galaxy NGC 4472. Studies by e.g. Balcells & Peletier (1994) have shown thatdustfree bulge colors at re/2 are never redder than ellipticals of the same size, makingthis assumption very likely. Using hereB I = 2.30 andI H = 1.85, we find that inthis case theI H colors would be reddened by on the average 0.37 0.06 mag andB I by 0.44 0.10 mag. Using the Galactic extinction law (Rieke & Lebofsky 1985)these numbers correspond to an average internal extinction AV between 0.69 and 0.89mag, if I H is used, and between 0.60 and 0.80 mag when one usesB I .
For those galaxies for which no dust lanes or patches were found, we tried a moresensitive method, by carefully analyzing the isophote shapes. Dust generally causespatchy structures, which means that the galaxy isophotes are not symmetric any more,and that the third order Fourier terms C3 and S3 (Carter 1978) will be non-zero, andgenerally increasing when going to the blue. No dust lanes or patches were found forNGC 5475, 5854, 6504 and 7457. However, S3 and C3 inB and I were found to besignificantly non-zero in all of these, except for NGC 7457.
3.2. Stellar Populations
Apart from providing high resolution, HST also has the advantage that the photometricconditions are very stable, so that accurate colors can be determined. For this reason wecan use the color-color diagram to infer information about the age-spread in the sample,and about the cause of the stellar population gradients. In Fig. 4 our galaxies are plottedtogether with Single Stellar Population (SSP) models of Vazdekis et al. (1996). We seethat for I H < 2.1, in the region where reddening is not necessarily important, thecolor-color diagram is extraordinarily tight. Only NGC 5577, an Sbc galaxy, with muchlower surface brightness than the rest, is much bluer inB I than the other galaxies.For a givenIH the scatter inB I is 0.05 mag atIH = 1.9 and 0.08 mag atIH= 1.7. Independent of the amount of extinction, the tightness of the relation shows thatthe average age of the stars is very similar from bulge to bulge. According to the modelthe age-spread would be about 2-3 Gyr, although the ages in the outer parts of the bulgeare somewhat younger than further inwards. An average age of about 8 Gyr is found.One should however keep in mind that this kind of stellar population model is generallynot very good at determining absolute ages. No type-dependence of this result is found,except that for the latest type (Sbc)B I tends to be bluer for a givenI H, showingthat the Sbc bulges are generally younger than earlier-type bulges.
4. Discussion
In the previous section we have shown that

HST-NICMOS Observations of Galactic Bulges 165
Z=0.05
Z=0.02
Z=0.008
Figure 4. Individual color profiles for the sample galaxies. Each galaxy isrepresented by a line from the center to the point where the bulge contributionis as large as that of the disk. Superimposed are SSP models by Vazdekis et al.(1996). Drawn fat lines are lines of constant metallicity, dashed-dotted linesare loci of constant age. Also indicated is a reddening vector for a reddeningof AV = 0.5 mag. The two filled squares indicate the colors of knots A and Cin the jet of M 87.
1. Centers of bulges of early-type spirals are generally dusty. We find that AV on theaverage lies between 0.6 and 0.9 mag, which implies that AH should be between0.1 and 0.2 mag.
2. Galactic bulges show a very tightB I vs. I H relation, implying that the agespread among bulges of early-type spirals is small (at most about 2-3 Gyr).
The first conclusion shows one more similarity between bulges of early-type spi-rals and ellipticals. Van Dokkum & Franx, analyzing WFPC data of elliptical galaxies,give an average dust mass of 4 103 M. For the bulges analyzed here we find anaverage dust mass of 104 M, i.e. a slightly larger number. We should however notethat van Dokkum & Franx determined their dust masses only from oneV-band image,so their numbers are very rough. If we assume a Galactic gas to dust ratio of 130 (seevan Dokkum & Franx 1995) we find the galaxies analyzed in this paper have an aver-age of 106 M of interstellar material in their nuclear regions. This is generally muchsmaller than the stellar mass in these areas. Note that the amount of ISM in the galaxiesoutside the nuclear area in general is much larger, as shown by the large dustlanes etc.
Several of our bulges have central features which resemble the inner disk in thegiant elliptical NGC 4261 (Jaffe et al. 1996). Examples are NGC 5326, NGC 5587,

HST-NICMOS Observations of Galactic Bulges 166
NGC 5838
B - I I - H
Figure 5. Color maps of the inner 2000 2000 of NGC 5838. White indi-cates redder colors.
and NGC 5838. NGC 4261 has a LINER spectrum in the center, and it is argued byJaffe et al. that this inner disk might provide the fuel for the AGN. The objects studiedin our paper however are not known to be active, and also their colors are consistentwith being from stellar origin, extincted by dust. As a comparison, we have plotted thecolors of two knots of the jet in M 87 in Fig. 4, for which the emission is thought to bedue to synchrotron radiation (see Stiavelli et al. 1997). They are much bluer inB Ithan the nuclei of the bulges. We conclude that in general the material to fuel an AGNin our bulges is present, although it is not clear whether black holes are present. Anindication that they are could be the fact that many bright nearby S0 galaxies harborfaint radio sources in their centers (Sadler et al. 1989).
The largest nuclear disk that we observe, in NGC 5838, shows another interestingfeature.B I andI H color maps are shown in Fig. 5. Two dust lanes are visible, theouter having a diameter of 1 kpc. The central dust lane, very prominent in theI Hmap, is rather weak in theB I map. Furthermore, in theB I map several darkerareas are seen, i.e. of bluer color. The fact that these features are only seen in a bluecolor indicates that we are seeing the presence of young stars being formed in the innerdisk. This explains also why the inner dust lane is less strong inB I . Although it isclear that the main body of the galaxy is old, we see that even at present the galaxy isforming stars, although at a very low rate. For the other galaxies unfortunately we don’thave the resolution to detect the presence of young stars in this way, but it is likely thatthe dust and gas, which has been found in a large fraction of ellipticals and early-typespirals, is a suitable environment for the formation of young stars, and that galaxies,even early-types, are still forming stars in their nuclei right now.
In a recent series of papers Carollo and coworkers (Carollo et al. 1997b) dividebulges in three categories, on the basis of theirR-band surface brightness profiles: theClassical R1=4 bulges, small exponential, and dominant exponential bulges. Of thewhole sample discussed here, only one galaxy, NGC 5577, would not fall into the

HST-NICMOS Observations of Galactic Bulges 167
category of R1=4 bulges: Surface brightness profiles in the inner regions are very similarto ellipticals. This result supports the view that early type bulges have R1=4 profiles,while late types have profiles which approach the exponential shape (Andredakis et al.1995). Comparing color profiles is somewhat more difficult. The only paper presentinga reasonable sample of ellipticals is Carollo et al. (1997a), presenting V and I profilesof 15 galaxies observed with the refurbished WFPC2. It seems that the color gradientsare similar, although they are difficult to compare, since Carollo et al. (1997a) maskedout dusty areas before obtaining the color profiles.
The fact that the ages are all so similar indicates that there has been a major episodeof star formation in the universe, in which most of these bulges were formed. This couldbe in agreement with the star formation history predicted by Madau et al. (1996) on thebasis of data of the Hubble Deep Field, which shows a maximum betweenz = 1 and3. Note that the objects studied here are generally field objects, which means that theydo not necessarily have to have similar ages as galaxies in clusters, which must haveformed beyondz= 3 (Ellis et al. 1997).
Acknowledgments. The authors acknowledge very useful support from Luis Col-ina, Massimo Stiavelli and Doris Daou at the STScI, and useful discussions with IanSmail.
References
Andredakis, Y., Peletier, R.F. & Balcells, M., 1995, MNRAS, 275, 874Balcells, M. & Peletier, R.F., 1994, AJ, 107, 135Bender, R., Burstein, D. & Faber, S.M., 1992, ApJ, 399, 462Carollo, C.M., Franx, M., Illingworth, G.D. & Forbes, D., 1997a, ApJ, 481, 710Carollo, C.M., Stiavelli, M., de Zeeuw, P.T. & Mack, J., 1997b, AJ, 114, 2366Carter, D., 1978, MNRAS, 182, 797Colina 1998, this conferenceDjorgovski, S. & Davis, M., 1987, ApJ, 313, 59Ellis, R., Smail, I., Dressler, A., et al., 1997, ApJ, 483, 582Holtzmann, J.A., Burrows, C.J., Casertano, S., Hester, J.J., Trauger, J.T., Watson, A.M.
& Worthey, G., 1995, PASP, 107, 1065Jaffe, W., Ford, H., Ferrarese, L., van den Bosch, F. & O’Connell, R.W., 1996, ApJ,
460, 214Knapen, J.H., Beckman, J.E., Shlosman, I., Peletier, R.F., Heller, C.H. & de Jong, R.S.,
1995, ApJ, 443, L73Krist, J. 1992, Tinytim v2.1 User’s Manual (STScI)Lauer, T. R., et al. 1995, AJ, 110, 2622Madau, P., Ferguson, H.C., Dickinson, M. et al., 1996, MNRAS, 283, 1388Peletier, R.F. & Balcells, M., 1996, AJ, 111, 2238Peletier, R.F. & Balcells, M., 1997, NewA, 1, 349Rieke, G. & Lebofsky, M.J., 1985, ApJ, 288, 618Sadler, E.M., Jenkins, C.R. & Kotanyi, C.G., 1989, MNRAS, 240, 591Schlegel, D.J, Finkbeiner, D.P. & Davis, M., 1998, ApJ, in press

HST-NICMOS Observations of Galactic Bulges 168
Stiavelli, M., Peletier, R.F. & Carollo, C.M., 1997, MNRAS, 285, 181van Dokkum, P.G. & Franx, M., 1995, AJ, 110, 2027Vazdekis, A., Casuso, E., Peletier, R.F. & Beckman, J.E., 1996, ApJS, 106, 307Worthey, G., 1994, ApJS, 95, 107

NICMOS and the VLTPula, Sardinia, May 26-27th 1998Wolfram Freudling and Richard Hook, eds.
HST/NICMOS Observations of the Interacting System Arp 299
Almudena Alonso-Herrero, Marcia J. Rieke, and George H. Rieke
Steward Observatory, the University of Arizona, Tucson, AZ 85721, E-mail:[email protected], [email protected], [email protected]
Abstract.Arp 299 (IC 694 + NGC 3690) is one of the nearest examples of interact-
ing galaxies with a high infrared (IR) luminosity (LIR = 5:41011L, for theassumed distanceD= 42Mpc), close to the limiting value for ultraluminous IRgalaxies. We presentHST/NICMOS observations taken with all three cameras.We concentrate on the data reduction and analysis of the images taken with cam-era 3 through the narrow-band filters F164N and F166N. The [FeII ]1:644µmmorphology and properties are described in detail. The relative ages of the burstof star formation together with the supernova rate for the bright sources in theinteracting system are derived.
1. Introduction
The existence of luminous and ultraluminous IR galaxies has long been known (Rieke& Low 1972), but it was with the launch of the IR satelliteIRASthat this class of galax-ies was detected in large numbers. Since then an intense debate started as to whetherthere is an evolutionary link between luminous IR galaxies, ultraluminous galaxies andoptically selected quasars (see Sanders & Mirabel 1996 for a recent review). Amongthe ultraluminous IR class (LIR > 1012L, IR luminosity between 8 and 1000µm), alarge percentage is found to be interacting/merging systems containing active galac-tic nuclei. Sanders et al. (1988) proposed that the IR luminous phase is the initialstage for the appearance of a quasar. In this context the interacting system Arp 299(NGC 3690+IC 694 or Mrk 171) is an interesting study case by itself, not only becauseof its high IR luminosity (LIR = 5:41011L), close to the limiting value for ultra-luminous IR galaxies, but also because it is one of the nearest examples of interactingstarburst galaxies (distanceD = 42Mpc forH0 = 75km s1 Mpc1).
A number of bright IR and radio sources have been detected from ground-basedobservations (see Gehrz et al. 1983, Wynn-Williams et al. 1991 and references therein).Following the notation introduced by Gehrz et al. (1983) for the interacting pair ofgalaxies Arp 299, the nucleus of IC 694 (eastern component) is referred to as sourceA, and the sources in NGC 3690 (western component) are called B1, B2, C and C0 (seeFigure 1). One of the most remarkable characteristics of this interacting system (andother luminous IR galaxies) is the high concentration of molecular hydrogen within rel-atively small regions. From CO maps, Sargent & Scoville (1991) estimated the densityof molecular gas' 8105 M pc2 in IC 694,' 3104M pc2 in components B1and B2 of NGC 3690 and' 2104M pc2 at the interface of both galaxies, regionC+C’. Numerical simulations of collisions between gas-rich galaxies (see Barnes &
169

HST/NICMOS Observations of Arp 299 170
Hernquist 1996 and references therein) show that collisions are very efficient at trans-porting large quantities of molecular gas into the centers of galaxies; such large quanti-ties are similar to those observed in IC 694 and other ultraluminous IR galaxies.
HST NICMOS images of the system together with MMT optical and IR spec-troscopy are analyzed to derive the star formation properties of the system.
2. Observations
NICMOS on theHST observations of the interacting galaxy Arp 299 were obtainedon November 4 1997 using all three cameras. Images were taken with the followingfilters and cameras: NIC1 F110M; NIC2 F160W, F222M, F237M, F187N, F190N,F212N and F215N; NIC3 F164N and F166N. The pixel sizes for NIC1, NIC2 and NIC3are 0.045 arcsec pixel1, 0.076 arcsec pixel1 and 0.20 arcsec pixel1 respectively. Inthis paper we will concentrate on the data reduction and data analysis of the camera 3narrow-band filter images. The observational strategy consisted of taking a spiral ditherwith a 5.5 pixel spacing, with two, three or four positions. The orientation of the imagesis PA = 90 degree. The FWMH of the point sources in the fully-reduced NIC3 F164Nimage is 0.2900. It is important to note that the NIC3 images were not taken during theNIC3 observing campaign. Nevertheless the quality of the images is remarkable andmost suitable for scientific purposes.
2.1. Reduction of narrow-band filter images taken with NIC3
The field of view of NIC3 (' 51:200 51:200) is large enough to cover both galaxiesin the interacting system. Four images (spiral dither with a 100 separation) with a totalintegration time of 1,024 seconds were taken through filters F164N and F166N respec-tively.
Part of the reduction of the NICMOS images was performed with routines of thepackage NicRed (McLeod 1997). This data reduction package works within theIRAF
environment. Darks with exposure times corresponding to those of our observationswere obtained from other proposals close in time. Usually between 10 and 20 darkswere averaged together for a given sample sequence after the subtraction of the firstreadout. The flatfields for the filters NIC3 F164N and F166N are in-flight flats kindlyreduced by Dr. Rodger Thompson. The first steps in the data reduction (done withthe tasknicfast within Nicred) involve subtraction of the first readout, dark currentsubtraction on a readout basis, correction for linearity and cosmic ray rejection (usingfullfit), and flatfielding. Since our NICMOS images were obtained after August 1997,no correction for the pedestal effect was necessary. The background was measured onblank regions of the flatfielded images and subtracted from each image.
As a first try to produce the final [FeII ]1:644µm line emission image, the ditheredgalaxy images for a given filter were registered to a common position using fractionalpixel offsets and cubic spline interpolation, and combined to produce the final imagesthrough filters F164N and F166N. Once the images were combined, the flux calibrationwas performed using the conversion factors based on measurements of the standardstar P330-E during SMOV (Marcia Rieke 1997 private communication), which are:6:43 105Jy ADU1 and 6:66 105Jy ADU1 for NIC3 F164N and F166N re-spectively. The combined continuum and line+continuum images were again shiftedto a common position and finally the F164N was subtracted from the F166N to pro-duce the [FeII ]1:644µm line emission image (note that at the redshift of Arp 299 the

HST/NICMOS Observations of Arp 299 171
E
N
A
B1
B2
C
C’
Figure 1. NIC3 F164N contour plot on a logarithmic scale of Arp 299. Forthe redshift of this galaxy the filter F164N contains the continuum adjacent tothe [FeII ]1:644µm line. The field of view is 51:20051:200. The first contourcorresponds to 0.08 mJy and the last contour to 0.64 mJy.
[FeII ]1:644µm line gets shifted into the F166N filter). The resulting image showedsome residuals produced by both the under-sampling of the point spread function (PSF)and the variation of the shape of PSF with wavelength. In addition it appears that forpoint-like sources and camera 3 there is a significant variation of the shape of the PSFdepending on the position along the pixel.
To solve some of these problems we used a different strategy when subtractingthe continuum images from the line+continuum images. Instead of combining all theimages together prior to the continuum subtraction, we realigned both the F164N andF166N individual images for a given position (usually by less than a few tenths of apixel), and subtracted the F164N individual images from the F166N individual images.

HST/NICMOS Observations of Arp 299 172
Figure 2. Gray-scale image (on a logarithmic scale) of Arp 299 takenthrough the NIC3 F166N filter. The image has been continuum subtractedto show the [FeII ]1:64µm emission. The size is the same as in Figure 1.
The resulting individual continuum-subtracted F166N images were then shifted to acommon position (using the offsets computed with the F166N images before contin-uum subtraction) and combined to the final line emission image. Even though we firstdithered the images for a given filter and then changed filters, this method yielded bet-ter results. This is because the pointing of theHSTis very accurate, and therefore afterchanging filter, the telescope goes back to the initial point of the dither sequence witha precision of less than one tenth of a pixel. The method described here would produceeven better results for those cases in which for a given position both the continuum andthe continuum+line images were taken before moving the telescope to the next position.
Finally we would like to point out that we performed a straight subtraction usingthe continuum at 1:64µm, i.e., the continuum has not been converted to 1:66µm, wave-

HST/NICMOS Observations of Arp 299 173
Figure 3. The grey-scale map is the F164N continuum image on a log-arithmic scale. The contours are the continuum-subtracted [FeII ]1:64µmemission on a linear scale. The field of view is the same as in Figure 1.
length of the underlying continuum of the [FeII ] line in Arp 299. For sources in whichobscuration is patchy or/and very high, a better approach would be to fit the continuumbetween two different wavelengths, and construct an image in which the continuum hasbeen interpolated to the line wavelength.
3. Morphology of the [FeII ] emission
In Figure 1 we show a contour plot of the interacting galaxy Arp 299 through the NIC3F164N filter which contains the continuum adjacent to the [FeII ]1:644µm emissionline. Figure 2 is a grey scale map of the [FeII ]1:644µm line emission (continuum-

HST/NICMOS Observations of Arp 299 174
subtracted NIC3 F166N filter), and in Figure 3 we overlay the line emission contourson the grey scale map of the continuum emission (NIC3 F164N) for clarity.
The NIC3 F164N continuum image (Figure 1) of the system clearly shows notonly the emission from the brightest sources (i.e., A, B1, B2, C and C’) already knownfrom ground-based images, but also reveals the spiral nature of IC 694 with a numberof H II regions along the spiral arms, along with some compact sources in NGC 3690surrounding B1, B2, and located south-west of C. In the large scales (better seen in Fig-ure 3) Arp 299 shows the characteristic tidal tails common to interacting pairs extendingsouth and west of NGC 3690.
Most of the [FeII ]1:644µm line emission (Figure 2) originates from three regions,that is, source A (nucleus of IC 694), B1 in NGC 3690 and C+C’ at the interfaceof both galaxies. These three regions are not compact but quite extended with linearprojected sizes of about 1 kpc. In addition sources B1 and C show structure. It isremarkable that very little or no emission seems to be coming from source B2 (thebrightest source at visible wavelengths). The same result was found by Fisher, Smith& Glaccum (1991) from their ground-based Brγ images. In addition to the emissionfrom the bright sources the [FeII ] image traces the emission from HII regions locatedin the spiral arms south-east of IC 694. There is a number of HII regions northwest ofB1, and east of C extending all the way to source C’, and east of C. The resemblancein morphology with the our NIC2 Paα (λrest= 1:875µm) images (not shown here, seeAlonso-Herrero et al. 1998) is remarkable, although some differences are found. The[FeII ] emission is more extended in A, B1 and C than the Paα emission. If mostof the [FeII ] emission is excited by shocks in supernova remnants (SNR) in the star-forming regions, then it is expected that the [FeII ] emission would be more extendedas the shocks propagate outwards the HII regions, whereas the Paα emission will tendto be more concentrated toward the center where the young ionizing stars are located.The [FeII ]1:644µm to Paα line ratio is found to vary radially within the star-formingregions, increasing by at least a factor of five for increasing radial distances. In addition,age effects will also contribute to differing line ratios (see next section). In contrast theH2 morphology of Arp 299 is quite different with point-like emission originating fromB1 and C in NGC 3690, whereas the nucleus of IC 694 is very bright in H2 and showssome diffuse emission with a beautiful butterfly-like shape (see Alonso-Herrero et al.1998). The lack of resemblance between the [FeII ] and the H2 emission suggests thatthe scenario in which both emissions have a common origin may not be that simple,perhaps indicating that the nature of the shocks producing both emissions is different.
4. Discussion
We have measured both the [FeII ]1:644µm and Paα line fluxes from five differentregions in the interacting system through a 1 arcsec-diameter aperture (' 200pc for theassumed distance) to try to isolate the star-forming regions as much as possible. TheBrγ fluxes were computed by assumingf (Brγ)= f (Paα) = 0:082 for easy comparisonwith values of f ([FeII ]1:644µm)/ f (Brγ) usually reported in the literature. Results aregiven in Table 1, where thef ([FeII ]1:644µm)/ f (Brγ) ratios have not been correctedfor extinction (see below). By HII we refer to the HII regions located north-west ofB1.
So far we have not discussed the effects of extinction. From the optical and near-infrared spectroscopy obtained for all the bright sources in the system, we have esti-

HST/NICMOS Observations of Arp 299 175
mated the extinction using hydrogen recombination line ratios. However, the values ofthe extinction to the gas are quite dependent on the wavelength of the lines involved, thehighest values obtained when using thef (Brγ)= f (Paα) line ratio (indicating that someof the hydrogen lines may be still optically thick in the near-infrared). The observedf ([FeII ]1:644µm)/ f (Paα) line ratios have to be corrected for extinction by a factor (as-suming a simple model of foreground dust screen): 100:40:04AV where the term 0.04accounts for the differential extinction between 1:6µm and 1:9µm. Note that we an-alytically fit the extinction curve of Rieke & Lebofsky (1985) for near-infrared wave-lengths. The values of the extinction derived for the bright components are betweenAV = 10mag and at leastAV = 17mag (assuming a foreground dust screen model).
Table 1. [FeII ]1:644µm line fluxes, [FeII ]1:644µm to Brγ line ratios and supernovarates for different components in Arp 299.
Component f ([FeII ]) f [FeII ]/ f (Brγ) (SNr)(erg cm2 s1) (yr1)
A 1:581014 1.08 0:131:86B1 8:451015 1.33 0:110:53C 6:351015 0.56 0:0910:95C’ 2:211015 0.58 0:0200:21H II 6:351016 0.59 3103
Note. — Fluxes and line ratios for circular 1 arcsec-diameter apertures. The super-nova rates correspond to 4 arcsec-diameter apertures for A, B1, C and C’.
In Alonso-Herrero et al. (1997) we showed that thef ([FeII ]1:644µm)/ f (Brγ)line ratio in starburst galaxies is understood as transition from pure HII region (suchas the Orion Nebula) to an increasing rˆole of shock excitation by supernova remnants.The extinction-corrected values of this ratio are well apart from the typical value forpure ionization for all the sources indicating that an important fraction of the [FeII ]emission is produced by supernova remnants. Moreover, as the starburst ages thef ([FeII ]1:644µm)/ f (Brγ) ratio will increase as the number of SNR grows and the ion-ization from very young stars decreases, making this line ratio a good age indicator.From the predictions of the models presented in Vanzi, Alonso-Herrero & Rieke (1998)we can estimate that the relative difference in ages between the bursts in both compo-nents A and B1, and components C and C’ is approximately 3 million years assuminga Gaussian burst with FWMH= 1Myr. From these models we derive an age (mea-sured from the peak of star-formation) as young as 4 Myr for components C and C’ inNGC 3690, indicating that the most recent star-formation is occurring at the interfaceof the two galaxies. A more detailed discussion of the star-forming properties of thissystem will be presented in Alonso-Herrero et al. (1998).
Finally the total [FeII ]1:644µm fluxes can used to derive the supernova rate (SNr)using the calibration for M82 derived in Vanzi & Rieke (1996). For the (SNr) we

HST/NICMOS Observations of Arp 299 176
measure the [FeII ]1:644µm fluxes through a 4 arcsec-diameter aperture, except for theH II regions north-west of B1 for which we use the flux through the 1 arcsec-diameteraperture. The values of the supernova rate are presented in the last column of Table 1.The two values correspond to the supernova rates obtained from the [FeII ]1:644µmfluxes not-corrected and corrected for extinction. Gehrz et al. (1983) estimated thesupernova rate from their 20 cm radio measurements with a 5 arcsec beam. Their valuesare 4.2, 2.5, 1.9 and 0.9 yr1 for components A, B1+B2, C and C’. Taking into accountthe uncertainty in the calibration for M82 for the (SNr) in terms of the [FeII ]1:644µmflux (a factor of 2, Vanzi & Rieke 1996), the agreement between the two independentestimates is quite good for components A and C. The largest discrepancy occurs forB1. Given the fact that source B2 shows no [FeII ] emission it is possible that theradio emission from B2 is not related to SNR, but still included in Gehrz et al. (1983)calculations.
5. Conclusions
We have presentedHST/NICMOS observations of the interacting system Arp 299 (IC 694+ NGC 3690). A detailed description of the reduction and analysis of narrow-bandfilters images taken with camera 3 (F164N and F166N) is given, demonstrating thatalthough the NIC3 images were not taken during the NIC3 observing campaign, theyare most suitable for science.
Most of the [FeII ]1:644µm line emission is found to be originating from threebright sources, A (nucleus of IC 694) and B1 and C+C’ in NGC 3690. Little or noemission is coming from B2 (the brightest source at visible wavelengths). The re-semblance between the [FeII ]1:644µm and Paα emission is remarkable, although the[FeII ]1:644µm emission is extended to larger scales. The [FeII ]1:644µm to Paα lineratio is a good age indicator, since as the starburst ages the number of SNR growswhereas the flux from young ionizing stars decreases. We find that the region C+C’at the interface of the two galaxies is undergoing the youngest star-formation process.Finally the [FeII ]1:644µm fluxes are used to compute the supernova rate for each com-ponent.
Acknowledgments. During the course of this work AA-H was supported by theNational Aeronautics and Space Administration on grant NAG 5-3042 through the Uni-versity of Arizona. The work was also partially supported by the National ScienceFoundation under grant AST-95-29190.
References
Alonso-Herrero, A., Rieke, M. J., Rieke, G. H., & Ruiz, M. 1997, ApJ, 482, 747Alonso-Herrero, A., Rieke, M. J., & Rieke, G. H. 1998, ApJ, in preparationBarnes, J. E., & Hernquist, L. 1996, ApJ, 471, 115Fischer, J., Smith, H. A., & Glaccum, W. 1991, in ASP Conf. Ser. Vol. 14 (San
Francisco: ASP), p63Gehrz, R. D., Sramek, R. A., & Weedman, D. W. 1983, ApJ, 267, 551McLeod, B. 1997 in HST Calibration Workshop, ed. S. Casertano et al.Sanders, D. B. et al. 1988, ApJ, 325, 74

HST/NICMOS Observations of Arp 299 177
Sanders, D. B., Mirabel, I. F. 1996, ARA&A, 34, 749Sargent, A., & Scoville, N. 1991, ApJ, 366, L1Rieke, G. H., & Low, F. J. 1972, ApJ, 176, L95Rieke, G. H., & Lebofsky, M. J. 1985, ApJ, 288, 618Vanzi, L., & Rieke, G. H. 1996, ApJ, 479, 694Vanzi, L., Alonso-Herrero, A., & Rieke, G. H. 1998, ApJ, 503 (in press)Wynn-Williams, C. G. et al. 1991, ApJ, 377, 426

NICMOS and the VLTPula, Sardinia, May 26-27th 1998Wolfram Freudling and Richard Hook, eds.
NICMOS Camera 3 Parallel Imaging Observations: NumberCounts, Sizes and Red Objects
P. McCarthy, L. Yan, L. Storrie-Lombardi, and R. J. Weymann
Carnegie Observatories, 813 Santa Barbara St.Pasadena, CA, 91101 Email: [email protected]
Abstract.We present results from our analysis of F160W images obtained with NIC-
MOS Camera 3 operating in the parallel mode. Despite the less than optimal fo-cus, we achieve depths that are very close to the nominal performance. With ex-posure times of 2,000 to 13,000 seconds we reach 3σ depths of H= 24:325:5.We derive the galaxy number counts in an area of roughly 9 square arc-minutes.The slope of the counts fainter than H= 20 is 0.31, and the integrated surfacedensity to H 24:75 is 4105 galaxies per square degree. We transform thedeepest K-band counts to our system and find good agreement. At H = 24:5 theobserved surface density is roughly twice that predicted by non-evolving mod-els. The half-light radii of the galaxies declines steeply with apparent magnitudeand reaches our resolution limit of 0:0020 at H = 23:5. Deep ground-based VRIimaging of one NICMOS field has revealed a very red galaxy with H = 18:8 andR - H= 6.
1. Introduction
One of the key results to come from deep WFPC2 imaging was the realization thatgalaxies have very sub-arcsecond angular sizes at faint apparent magnitudes (e.g. Grif-fiths et al. 1994). The small sizes and, consequently high surface brightnesses, makespace-based observations of faint galaxies, even with the relatively small aperture ofHST, equally or more sensitive than similar observations with large collecting areas onthe ground.
The large reduction in background achieved at wavelengths of 0.8 to 1.9µ and it’shigh angular resolution make NICMOS a very fast imaging device in the broad-band1µ and 1:6µ filters. In the minimum background bandpass, F160W, the on-orbit back-ground is more than 7 magnitudes fainter than what is typically achieved on the ground.NICMOS faces two challenges in surveying the population of faint field galaxies: itssmall field of view and finite lifetime. Observations made in parallel with one of theother science instruments offer a means of surveying significant areas at faint magni-tudes while maximizing the use of the limited on-board cryogen.
The simplest analysis of deep imaging observations is the number magnitude rela-tion. Galaxy counts as a function of apparent magnitude probe both the geometry of theUniverse and the dynamical and luminosity evolution of galaxies. Evolutionary effectsdominate the departures of the counts from the Euclidean expectation. The near-IR
178

NICMOS Camera 3 Parallel Imaging Observations 179
pass-bands, however, are particularly well suited to galaxy count studies as they areonly mildly sensitive to extinction and uncertainties in the K-correction.
2. Observations
2.1. NICMOS Imaging
The deformations of the NICMOS internal optical configuration resulted in poor imagesin camera 3 for much of 1997. As a result the parallel observations that were carriedout before November 1997 were done with cameras 1 and 2. These cameras have smallfields of view and their small pixel sizes lead to significant contributions from readnoise. Teplitz et al. (1998) and Corbin (these proceedings) describe early results fromexaminations of these data. We have concentrated on the images obtained with Camera3 after the movement of the field offset mirror to removed the vignetting associatedwith distortions of the optical bench. With the pupil adjustment mirror set to its extremeposition camera 3 now yields images that are quite close to the performance achievedwith a refocusing of the HST secondary mirror. Each camera 3 image covers 3/4 of onesquare arc-minute with pixels that are 0:
00
2 on a side. The FWHM that we realize fromour dithered nominal focus images is 0:
00
25.We have reduced the deepest F160W parallel images obtained in the period from
November 1997 to January 1998. The approach that we have taken to the process-ing of the multiaccums data is independent of the STScI pipeline and relies heavilyon McLeod’s NICREDv1.5 package (McLeod 1997). We formed observed sky+darkframes for each read in the multiaccums sequence by computing the median of all of theindependent high galactic latitude fields available at that time. These median sky+darkimages were subtracted from each read and each pixel was then corrected for nonlin-earities and cosmic ray events. The individual linearized and cleaned images were thencorrected for the flat field response, block replicated to a 22 finer scale, shifted byinteger (0:
00
1) pixel shifts and combined with a final 3-σ cosmic ray rejection applied.The deepest of our camera 3 parallel images reaches a 1σ surface brightness limit of 26H magnitudes per square arcsecond. The 3σ point-source detection limits for our fieldsrange from H= 24:3 to 25:5
2.2. Ground-based Optical Imaging
We have obtained optical follow-up imaging of several of our fields using the 2.5m duPont telescope at the Las Campanas Observatory. The observations were made usinga SITE 2048 2048 CCD, Johnson V & R filters and a Cousin’s I filter. The pixelscale of the SITE CCD at the Cassegrain focus of the 2.5m is 0:
00
278. The observationswere made in February of 1998 and the seeing ranged from 0:
00
60:00
8 FWHM. Theexposure times were typically 6000 seconds in each filter, although one field, 0457-0456 was only observed for 3600 seconds in R. The telescope was offset several tensof arc seconds between each exposure and standard techniques were used to calibrateand reduce the images. These images allow us to to determine colors of objects in theNICMOS images with a factor of 3 range in wavelength.

NICMOS Camera 3 Parallel Imaging Observations 180
Figure 1. A NICMOS Camera 3 F160W parallel field. The field shown is52
00 5000
3. Results and Discussion
In Figure 1 we show a typical image from the parallel program. It contains 4500 sec-onds of integration in two dither positions and reaches a 1σ surface brightness limit ofH = 25:7. Our deepest field to date, 1120+1300 is shown in Yan et al. (1998) and hasan additional 0.5 magnitudes of depth. We carried out the object detection and photom-etry with SExtractor version 1.2b10b (Bertin & Arnout 1996) using a photometric zeropoint for camera3/F160W provided by M. Rieke (priv. comm). The uncertainty in thezero-point is roughly 5%. The object detection was performed with a gaussian kernelwith FWHM = 0:3
00
and a 2.0σ detection threshold. The softer images delivered bycamera 3 at the nominal telescope focus actually improve the reliability of the objectdetection algorithm and the photometric precision for small objects, at the cost of someloss of sensitivity. The isophotal magnitudes were measured to an isophotal level equalto 1σ above the global sky noise.
We define the total magnitude in a manner similar to those used by Smail et al.(1995) and Djorgovski et al. (1995). The philosophy is to measure isophotal magni-tudes where possible and to correct these to 2
00
aperture magnitudes using an aperturecorrection that is a function of the isophotal magnitude. For the faintest and smallestobjects the isophotal sizes are smaller than the 0:
00
6 primary photometry aperture and

NICMOS Camera 3 Parallel Imaging Observations 181
Figure 2. Raw and corrected galaxy counts. The raw counts are shown asopen symbols, the corrected counts as filled. The error bars are derived fromthe variance within each bin averaged over all fields.
isophotal magnitudes are subject to large uncertainties. For these objects we apply anaperture correction to convert the 0:
00
6 magnitudes to a 200
aperture. The magnitude ofthis correction was determined from the average profile of 20 faint galaxies and wasfound to be indistinguishable from that derived from stars with H 18. The details ofthe aperture correction for galaxies with isophotal sizes larger than 0:
00
6 are given inYan et al. (1998).
3.1. Incompleteness Modeling
The principal sources of systematic error in deriving galaxy number counts are the aper-ture correction and the incompleteness and false detection corrections. The aperturecorrections, described above, where chosen to be robust in the face of low signal-to-noise ratio and under-sampled data. More sophisticate approaches are possible (e.g.Petrosian 1998) but generally require high quality data. The completeness determina-tion, however, must be tailored to the specific data set. In our data we suffer from lowspatial frequency errors in the dark+bias corrections that impact the detection efficiencylocally. This source of uncertainty operates in addition to the effects of crowding andPoisson noise. Yan et al. (1998) carried out an extensive series of simulations to quan-tify the incompleteness effects. We adopt a 50% completeness level as our cutoff andthe simulations show that this corresponds to depths of H= 23:8 to 24.8 for our chosenfields. As described in Yan et al. the rate of false detections is of the order of 5%.
In Figure 2 we plot our raw and corrected galaxy counts. The error bars repre-sent the statistical uncertainty in each magnitude bin, averaged over all the fields thatcontribute to that bin. The slope of the differential counts is 0:310:02. This slope is

NICMOS Camera 3 Parallel Imaging Observations 182
Figure 3. The derived half-light radii for all of the detected objects in 12high latitude fields, plotted as crosses. The median sizes are plotted withheavy filled symbols, the locus of stellar points are shown as filled triangles.
quite close to the observed slope in the K-band counts for K> 18 (Gardner et al. 1993;Djorgovski et al. 1995; Moustakas et al. 1997).
3.2. Object Sizes
We characterize the size of the detected objects in terms of their half-light radii. Theimage of each object was extracted and regrided with 10 finer sampling. The enclosedflux was then computed in half pixel steps until 50% of the total flux was enclosed, thetotal flux being derived from the total magnitude as described above. We used the samealgorithm as that used by Smail et al. (1995). In Figure 3 we plot the derived half-lightradii for all of the objects detected in 12 high galactic latitude fields. We also plot themedian size in one or half magnitude bins. The filled triangles are the results of thesame analysis applied to a globular cluster field over the magnitude range 16<H < 23.
4. Implications of the Galaxy Counts
Because the near-IR counts are, in comparison to the visible-band counts, less sensitiveto uncertainties in the K- and evolutionary corrections they have attracted considerableattention in recent years. There have been suggestions that the K-band counts can beused to discriminate between various world models (e.g. large or small qo, zero or non-zeroΛo) as well as some well considered cautions to such goals (e.g. Djorgovski et al.1995). Nevertheless, it is fair to say that until recently no clear evidence of departurefrom non-evolving models had been seen in the K-band counts (e.g. Metcalf et al.1995). Recently Bershady et al. (1998) presented evidence for significant excesses

NICMOS Camera 3 Parallel Imaging Observations 183
Figure 4. NICMOS F160W counts compared to Keck K counts and mod-els. The K-band counts are from Bershady et al. and Djorgovski et al.and have been transformed to F160W by applying F160W = K + 1.1. Thecurves are non-evolving models from Gronwall & Koo (1995) transformed toF160W as above.
over the Gronwall & Koo (1995) no evolution models for K magnitudes fainter than 23.
We would like to be able to directly compare our F160W counts to those observedat K. To do this we use the transformation given by Gardner (1998). In the magnituderange of interest this transformation is well approximated by a simple offset of 1.1magnitudes. In Figure 4 we plot our counts along with those of Bershady et al. (1998),Djorgovski et al. (1995), and the Gronwall & Koo (1995) models, with the latter datasets transformed to F160W as described above. Our counts fall midway between theBershady et al. and Djorgovski et al. counts.
The counts shown in Figure 4 show a departure from the low density zeroΛo no-evolution model of Gronwall & Koo. Averaging our counts with Bershady’s yields afactor of 2 excess over no evolution at H= 24. The run of half-light radii versus mag-nitude displayed in Figure 3 shows that this excess of counts is dominated by objectswith angular sizes<0:
00
25. As our detection efficiency at faint magnitudes is clearly im-pacted by our surface brightness limits, our number counts at these magnitudes shouldbe treated as lower limits. Like Bershady et al.’s K-band counts, our F160W counts aresystematically higher than the counts reported by Djorgovski et al. (1995), after allow-ing for the transformation from K to F160W. Bershady et al. attribute this discrepancyto differing approaches to the aperture corrections. Our methodology in deriving andapplying the aperture corrections is very similar to that used by Djorgovski et al., theprimary difference being that our primary measurement aperture size, 0:
00
6 is larger, interms of the instrumental response FWHM, than that used by Djorgovski et al.. The

NICMOS Camera 3 Parallel Imaging Observations 184
differences in the various counts may reflect field-to-field variations rather than differ-ences in the photometry. In all but the last magnitude bin (24:25< H < 24:75) ourmeasurements cover an area 6 larger than that covered in either the Bershady et al.or Djorgovski et al. studies. The slopes derived from all three programs are in closeagreement.
5. Extremely Red Objects
Near-IR images of high latitude fields by a number of groups have revealed a popula-tion of objects with colors that are as red or redder than evolved extinction-free stellarpopulations at plausible redshifts (e.g. McCarthy, Persson, & West 1992; Hu & Ridg-way 1994 etc.). These Extremely Red Objects (EROs) begin to appear at K magnitudesof approximately 17 (see Ellis 1997, Figure 5b) and are usually defined by R - K> 6,although some authors use a more strict criterion. The nature of these objects remainsunclear at this time. Hu & Ridgway argued that they were 10L ellipticals atz 2on the basis of their spectral energy distributions. Graham & Dey (1996) obtained aredshift for one of the red Hu & Ridgway objects and argued that it was a dusty star-forming object. The recent sub-mm detection of this object by Cimatti et al. (1998)strongly supports the starburst model for this particular object. NICMOS offers the po-tential for high resolution imaging of such objects. The difficulty is that in the absenceof pointed observations one must cover substantial area to detect such objects. Ourground-based visible-light imaging of the NICMOS parallel fields has revealed onesuch object and a small number of similar objects are within the camera 2 or camera3 images of distant radio galaxies and quasars. In Figure 5 we show a set of 4 imagesof a sub-portion of the field shown in Figure 1. The ERO is clearly visible and is wellresolved. With an H-band magnitude of 18.8 it is well detected and its morphologyis fairly concentrated, in contrast to the distorted morphology reported for HR10 byGraham & Dey. The spectral energy distribution of this object can be fit with a dust-free galaxy model, but it requires both a large redshift and age. Similar objects in theradio galaxy fields can be fit with less extreme models and these may well represent apopulation ofz> 1 ellipticals with old stellar populations.
6. Summary
We have analyzed a modest fraction of the NICMOS camera 3 imaging parallels.These data offer a unique combination of depth and resolution at wavelengths that wereheretofore unavailable from space. These low-cost low-impact images already probeas deep or deeper than the deepest K-band images obtained with large apertures on theground. We have shown that the galaxy counts continue with a slope of 0.31 to H 25and that there is a likely excess of counts above non-evolving models. This excess isdominated by objects with small angular sizes. Ground-based followup imaging hasrevealed a number of extremely red objects and has provided our first high-resolutionimages of the ERO population at wavelengths beyond 1µ.

NICMOS Camera 3 Parallel Imaging Observations 185
Figure 5. V,I, F110W, & F160W images of a portion of the field shown inFigure 1. Each image is 20
003000
in size. The very red object near the centerhas H= 18:8.
7. Acknowledgments
We thank the staff of the Space Telescope Science Institute, and J. Mackenty in partic-ular, for their efforts in making this parallel program possible. We acknowledge usefuldiscussions with J. Gardner, H. Teplitz, R. Thompson, & M. Rieke. B. McLeod andI. Smail are thanked for generously allowing the use of their software for the data re-

NICMOS Camera 3 Parallel Imaging Observations 186
duction and scale length measurements. This research was supported, in part, by grantsfrom the Space Telescope Science Institute, GO-7498.01-96A and P423101.
References
Bershady, M., Koo, D. C., & Lowenthal, J. 1998, ApJ, in pressBertin, E., & Arnouts, S. 1996, A&AS, 117, 393Cimatti, A., Andreani, P., Rottgering, H., & Tilanus, R. 1998, Nature, 392, 895Djorgovski, S., et al. ApJ, 438, L13Ellis, R. 1997, ARA&A, 35, 389Gardner, J. P. 1998, PASP, 110, 291Gardner, J.P., Cowie, L.L., & Wainscoat, R.J. 1993, ApJ, 415, 9Graham, J. R., & Dey, A. 1996, ApJ, 471, 720Griffiths, R. et al. 1994, ApJ, 435, L19Gronwall, C., & Koo, D. C. 1995, ApJ, 440, L1Hu, E., & Ridgway, S. E. 1994, AJ, 107, 1303McCarthy, P. J., Persson, S. E., & West, S. 1992, ApJ, 386, 52McLeod, B. 1997, proceedings of the 1997 HST Calibration Workshop, eds. S. Caser-
tano, R. Jedrzejewski, C. D., Keyes, & M. Stevens (STScI), 281Metcalf, N., Shanks, T., Campos, A., Fong, R. & Gardner, J. P. 1995, Nature, 383, 236Moustakas, L. A. , Davis, M. , Graham, J. R. , Silk, J. , Peterson, B. , Yoshii, Y. 1997,
ApJ, 475, 445Petrosian, V. 1998, ApJ, submittedSmail I., Hogg D.W., Yan L. & Cohen, J.G. 1995, ApJ, 449, L105Teplitz, H. Gardner, J. P., & Heap, S. 1998, ApJ, submittedYan, L., McCarthy, P. J., Storrie-Lombardi, L. J., & Weymann, R. J. 1998, ApJ, in press

NICMOS and the VLTPula, Sardinia, May 26-27th 1998Wolfram Freudling and Richard Hook, eds.
The Structure and Composition of High Redshift Radio Galaxies
R. A. E. Fosbury1
ST-ECF, Garching bei Munchen, Germany, ([email protected])
J. Vernet
ESO, Garching bei Munchen, Germany
M. Villar-Mart ın
Department of Physics & Astronomy, University of Sheffield, UK
M. H. Cohen
Astronomy Department, California Institute of Technology, Pasadena, USA
A. Cimatti, S. di Serego Alighieri
Osservatorio Astrofisico di Arcetri, Firenze, Italy
P. J. McCarthy
The Observatories of the Carnegie Institution, Pasadena, USA
Abstract. Keck spectropolarimetry, giving spectral coverage from Ly-α tobeyond CIII], and HST imaging of a sample of powerful radio galaxies withz2:5 has been obtained. These data are giving us a clear picture of the nature ofthe ‘alignment effect’ and are revealing new correlations between polarizationand emission line ratios which may be interpreted in the context of the stellarevolutionary histories of these massive galaxies. In particular, we see the 2200Adust absorption feature in the radio galaxy continua and a large variation inthe NV/CIV line ratio amongst objects having a similar ionization level. VLTinfrared spectroscopy of this and similar samples will give us a view of a periodof galaxy history during which rapid chemical evolution was taking place.
1. Introduction
This is a short progress report on a rather extensive programme we are carrying outto study the structure and composition of high redshift radio galaxies (HzRG) — and,by implication, the host galaxies of radio quasars — using observations in the optical,IR and mm bands. A separation of the stellar and the AGN-related components is
1Affiliated to the Astrophysics Division, Space Science Department, European Space Agency
187

Structure and Composition of High Redshift Radio Galaxies 188
made using a combination of Keck spectropolarimetry and high resolution WFPC 2imaging in the rest-frame UV (below the 4000A break), NICMOS imaging in the rest-frame optical, and photometric measurements of cool dust thermal emission at longerwavelengths. The relevance to this meeting is the use of NICMOS to image the evolvedstellar population in these galaxies (see the following talk by McCarthy) during theepoch when powerful AGN were most common. In addition, we plan to use VLT(ISAAC) IR-spectroscopy to measure the rest-frame optical emission line spectrum,allowing us to perform the kind of detailed ionization/composition analysis which hasalready been carried out on local objects.
2. The Sample
We have selected RG withz 2:5 which allow us to study the strong UV emission linesfrom Ly-α to CIII], the UV continuum, resonance absorption lines and the 2200A dustfeature in the optical band and to straddle the 4000A break in the 1–2mµregion.
Our principal sample consists of eight objects (six of which have already beenanalysed) with 2:3< z< 2:9 and this is supplemented by three sources from the litera-ture having similar quality data but extending the redshift range to 1:8< z< 3:8. Moredata are currently being obtained on sources withz> 3.
3. Observations
The Keck spectropolarimetric observations for the first two sources in the programmeare described in Cimatti et al. (1998). Four more sources have been observed andreduced and three further objects were observed during the period of this Workshop.An example of the spectropolarimetry is shown in Figure 1. The HST WFPC 2 andNICMOS images, where available, were taken from the public archive at the ST-ECFand from the McCarthy et al. program (ID 7498). An example of the NICMOS andWFPC 2 imaging is shown in Figure 2. Some deep groundbased imaging data havebeen taken from the literature to complement the higher resolution but shallower HSTimages.
4. Principal Results
Here we summarise the principal results to date. These will be described more fully inpapers in preparation.
All sources show a strong ‘alignment effect’ between their UV and radio mor-phologies although the structures are complex. One case, 4C 23.56 (Knopp &Chambers 1997), shows a beautiful ‘ionization cone’ in Ly-α. The brightest UVemission is extended and does not necessarily coincide with the nucleus (radiocore).
The continuum colours are remarkably similar to one another and can be fittedby a power law absorbed by a standard Galactic (in the RG rest-frame) extinctionlaw with EBV 0:1, which corresponds toτ 1 at 1500A. Example fits to threeof the sources are shown in Figure 3.
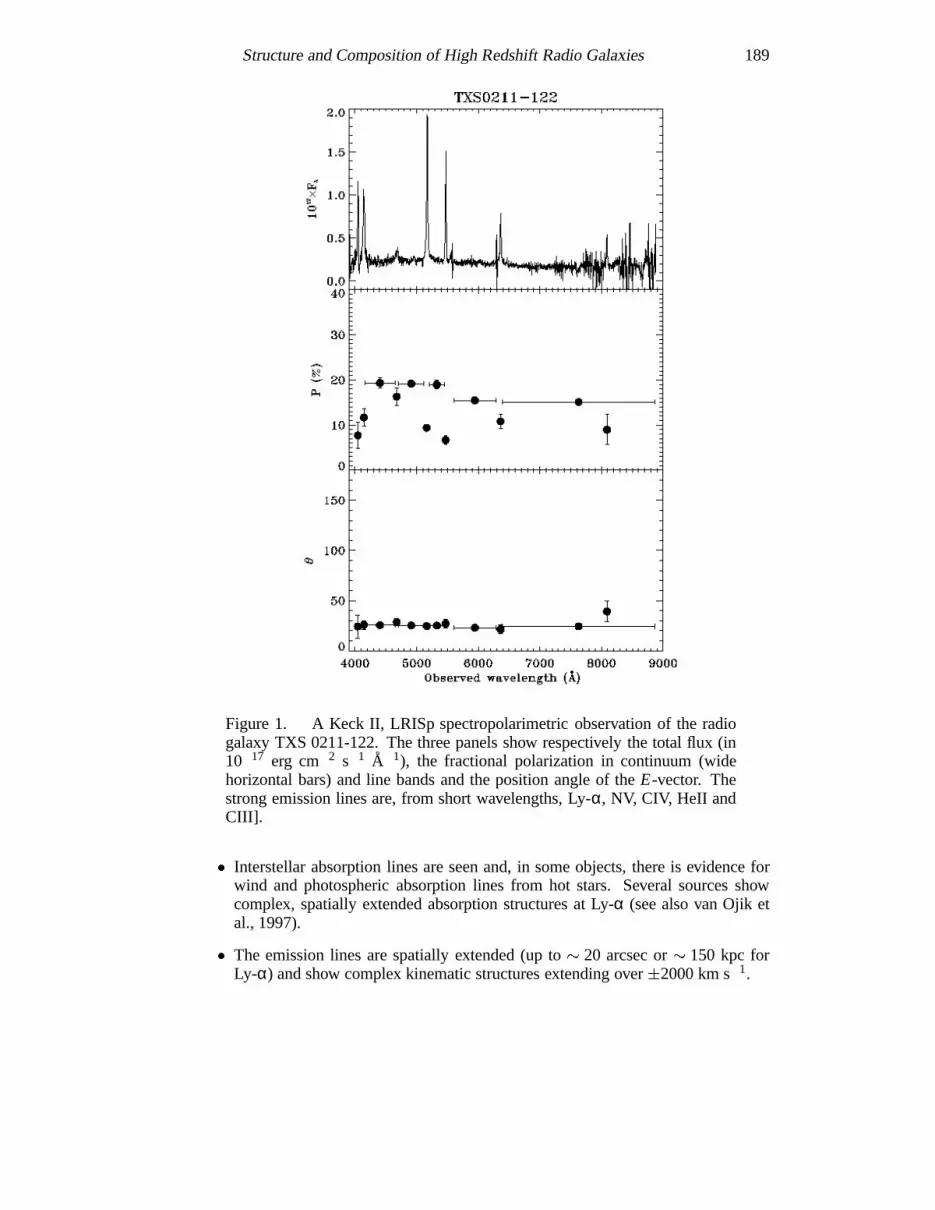
Structure and Composition of High Redshift Radio Galaxies 189
Figure 1. A Keck II, LRISp spectropolarimetric observation of the radiogalaxy TXS 0211-122. The three panels show respectively the total flux (in1017 erg cm2 s1 A1), the fractional polarization in continuum (widehorizontal bars) and line bands and the position angle of theE-vector. Thestrong emission lines are, from short wavelengths, Ly-α, NV, CIV, HeII andCIII].
Interstellar absorption lines are seen and, in some objects, there is evidence forwind and photospheric absorption lines from hot stars. Several sources showcomplex, spatially extended absorption structures at Ly-α (see also van Ojik etal., 1997).
The emission lines are spatially extended (up to 20 arcsec or 150 kpc forLy-α) and show complex kinematic structures extending over2000 km s1.

Structure and Composition of High Redshift Radio Galaxies 190
Figure 2. Images from NICMOS/F160W and WFPC 2/F702W of thez=2:93 radio galaxy MRC 0943-242 represented at the same scale. This objecthas an aligned component which still dominates in the H-band. Althoughbluer than the underlying galaxy, the aligned light is somewhat redder thanusual in these objects although the range in UV colours is small (see text).There is a prominent Ly-α absorption component.
The continuum linear polarization, measured just longward of Ly-α/NV, rangesfrom< 3% to 20%. TheE-vector is perpendicular to the UV extension as seenat HST resolution (but not necessarily precisely to the radio axis).

Structure and Composition of High Redshift Radio Galaxies 191
The emission line spectra indicate a rather constant level of ionization with asmall range in the observed CIII]/CIV and HeII/CIV line ratios.
Amongst the spatially integrated properties, the strongest correlations, shown inFigure 4, are observed to be:
1. between continuum polarization,P, and the Ly-α/CIV emission line ratio(anticorrelation)
2. betweenP and the NV/CIV ratio
5. Discussion
The conclusions we are drawing from these studies can be summarised as follows:
Powerful radio galaxies contain (hidden) QSO nuclei whose EUV emission ion-izes the extended gas along the radio axis and whose FUV emission we see scat-tered by extended dust structures.
The scattered component can — but does not always — dominate the observedUV continuum and there is evidence for an unpolarized hot stellar componentin addition to a nebular continuum contribution from the emission line gas. Thepresence of an old, red stellar population becomes apparent above the 4000Abreak, although this does not always dominate the observed flux in the infraredbands.
There is a direct connection between the scattering mechanism (which producesthe polarization) and the destruction of Ly-α photons. This could simply resultfrom the abundance and spatial distribution of dust, although orientation effectsmay be important as well.
The continuum exhibits dust extinction signatures in the form of the 2200A dipand a peak at the position of the extinction minimum around 1400A. Some of theextinction may arise in an extended halo outside the regions which see the QSOradiation field directly. This would be consistent with the absence of the 2000Adip in radio quasars.
There appears to be strong connection between the dominance of scattered light(dust abundance and/or intrinsic quasar luminosity) and nitrogen/carbon ratio.The behaviour of the NV/CIV, NV/HeII diagram indicates that the effect is dueto nitrogen abundance variations and not to carbon depletion. This may be relatedto the suggestion of a relative overabundance of nitrogen in high redshift QSOs(Hamann & Ferland 1993).
These objects are telling us the story of the formation of massive galaxies andtheir quasar nuclei during the epoch when AGN had their maximum space density. TheUV emission lines can give us some clues to the chemical composition of the extendednebulosity but to make inferences with more confidence, we need to measure the opticalforbidden line spectrum in the infrared with ISAAC at the VLT.

Structure and Composition of High Redshift Radio Galaxies 192
Acknowledgments. We thank Laura Pentericci for making available to us the re-ductions of the NICMOS images. We are grateful to Bob Goodrich for frequent helpwith the polarimetric observations and many discussions. Our Keck programme is sup-ported by NATO Collaborative Research Grant number 971115. This paper is basedpartially on observations made with the NASA/ESA Hubble Space Telescope, obtainedat the Space Telescope Science Institute, which is operated by the Association of Uni-versities for Research in Astronomy, Inc., under NASA contract NAS 5-26555.
References
Cimatti, A., di Serego Alighieri, S., Vernet, J., Cohen, M. H. & Fosbury, R. A. E. 1998,ApJ, 499, L21
Hamann, F. & Ferland, G. 1993, ApJ, 418, 11Knopp, G. P. & Chambers, K. C. 1997, ApJS, 109, 367van Ojik, R., Rottgering, H. J. A., Miley, G. K. & Hunstead, R. W. 1997, A&A, 317,
358

Structure and Composition of High Redshift Radio Galaxies 193
Figure 3. Total flux spectra of three of the radio galaxies scaled to show thecontinuum. The crosses mark continuum bins chosen to be free of emissionlines and atmospheric absorption features with the vertical bars representingone sigma statistical errors. The fitted curves are two parameter fits of apower law (with indexβ in Fλ) absorbed by a Galactic extinction curve in therest-frame of the RG. The derived values from 1=σ2 weighted fits are shownin the labels.

Structure and Composition of High Redshift Radio Galaxies 194
Figure 4. Plots of the fractional continuum polarization against (a) the Ly-α/CIV emission line ratio and, (b) the NV/CIV ratio. The sources in theplots are: 4C 23.56 (components a and b,z= 2:482), 4C -00.54 (z= 2:366),TXS 0211-122 (z = 2:338), B3 0731+438 (z = 2:429), USS 0828+193(z= 2:572) and MRC 0943-242 (z= 2:93) from our own observations and4C 41.17 (z= 3:798), MRC 2025-218 (z= 2:63) and 3C 256 (z= 1:824)from the literature.

NICMOS and the VLTPula, Sardinia, May 26-27th 1998Wolfram Freudling and Richard Hook, eds.
Investigating the Evolution of Quasar Host Galaxies with NICMOS
Marek J. Kukula1
Space Telescope Science Institute, 3700 San Martin Drive, Baltimore, MD21218, USA
James S. Dunlop and David H. Hughes
Institute for Astronomy, University of Edinburgh, Royal Observatory,Edinburgh EH9 3HJ, UK
Lance MillerNuclear and Astrophysics Laboratory, University of Oxford, Keble Road,Oxford OX1 3RH, UK
Christopher P. O’Dea and Stefi A. Baum
Space Telescope Science Institute, 3700 San Martin Drive, Baltimore, MD21218, USA
Abstract.We present the preliminary results of our Cycle 7 program to study the
evolution of the host galaxies of radio-loud and radio-quiet quasars out to aredshift of 2. By careful choice of filters, and careful quasar sample selectionwe have ensured that (1) we sample the same spectral region at all redshifts(2) our images consist purely of starlight, uncontaminated by emission lines,and (3) our results are not biased by quasar luminosity correlating with redshift.With this data we can investigate the cosmological evolution of the luminosity,scale-length, and degree of disturbance in quasar hosts and thus obtain insightsinto several key questions about quasar activity including the mechanism behindthe dramatic evolution in the quasar luminosity function. An initial, very crudeanalysis of our NICMOS images shows that we are detecting the hosts out to aredshift of 2. The estimated galaxy luminosities are consistent with the valuesobtained for low-zquasars of the same luminosity.
1. Introduction
In recent years the study of quasar host galaxies has become increasingly importantand it is now recognized that an understanding of their properties and evolution has thepotential to resolve some long-standing mysteries concerning nuclear activity in galax-ies. Conversely, quasar surveys provide an easy method of locating galaxies at large
1on leave from the Institute for Astronomy, University of Edinburgh
195

Evolution of Quasar Host Galaxies with NICMOS 196
redshifts, so knowledge of the properties of quasar hosts offers a means of investigatingthe history and evolution of galaxies themselves.
The problems inherent in observing quasar host galaxies from the ground are toowell-known to require detailed explanation but considering the enormous difficultiesinvolved in separating faint, diffuse galaxy light from the point spread function (PSF)of a bright quasar, it is perhaps surprising that so much progress has been made todate using ground-based techniques. Although such studies are effectively limited toz 0:3, at these low redshifts a combination of ground-based and HST programs isbeginning to piece together a clear picture of the properties of quasar hosts in the localuniverse.
However, the local universe is not the most representative region in which to studythe quasar population: arguably the epoch of greatest importance to quasar researchoccurred at a redshift of 2, when quasars were 100 times more numerous than theyare today. Although simulations show that it is impossible to derive the properties ofquasar hosts at such highz from the ground with any degree of confidence, numerousattempts have been made with - not surprisingly - confusing results.
In this paper we describe the preliminary results of a project designed to exploitthe unique capabilities of the HST+WFPC2+NICMOS combination. Coupled withrigorous sample selection our HST data should enable us to study how the luminosities,sizes and morphologies of the hosts of both RLQs and RQQs have evolved from the‘golden era’ of quasar activity atz 2 to the present day.
2. Previous work
The advent of NICMOS offers the first realistic hope of determining the propertiesof quasar hosts at high redshifts, and so a brief summary of the current state of ourknowledge of host galaxies at low and highz is perhaps worthwhile at this point. Sincethe subject of this paper is our own NICMOS program we will focus on work which weourselves have carried out, and of which our NICMOS study is the natural extension.However this is not to diminish the impact of the many other ground-based and HSTstudies which have been carried out in recent years.
2.1. The host galaxies of low-z quasars
At low z, attention has been focused on determining the luminosities, scalelengths,morphologies and interaction histories of the host galaxies, and investigating the extentto which these properties are correlated to the optical and radio luminosity of the quasar(Veron-Cetty & Woltjer 1990; Dunlop et al. 1993; McLeod & Rieke 1994a,b; Bahcall,Kirhakos & Schneider 1995; Hutchings & Morris 1995; Disney et al. 1995; Bahcallet al. 1996). For example, it has long been known that low-luminosity AGN displaymarked preferences in terms of host type, with (radio-quiet) Seyferts favoring spiralhosts whilst (radio-loud) Radio Galaxies are found exclusively in massive ellipticals,but the evidence for or against such a distinction for the hosts of radio-loud and radio-quietquasarshas until recently been unclear.
In our own ground-basedK-band study of RLQ and RQQ hosts atz'0:2 we foundthat almost half of the RQQs, as well as all of the RLQs, lie in spheroidal galaxies ratherthan exponential discs (Dunlop et al. 1993, Taylor et al. 1996). We also found that allof the host galaxies are large, with half-light radii 10 kpc, luminous, withL L? at

Evolution of Quasar Host Galaxies with NICMOS 197
K, and display aµ1=2 r1=2 (surface brightness - half-light radius) relation identical inboth slope and normalization to that displayed by the brightest cluster galaxies.
Through a follow-up program of off-nuclear spectroscopy (Kukula et al. 1997;Hughes et al. 1998) we have also shown that the SEDs of these host galaxies can bedescribed by a two-component spectrum, consisting of a well-behaved, old stellar pop-ulation and a strong blue component which can be interpreted as an ongoing starburst,scattered quasar light from the nucleus or some combination of both. But the resultmost relevant to our HST program is that, longwards of the 4000A break, our spec-troscopy demonstrates that the host galaxy spectrum is almost entirely dominated bylight from the passive, underlying stellar population -i.e. directly related to the galaxyitself rather than to processes which might be linked to the active nucleus.
2.2. R-band imaging of low-zquasar hosts with WFPC2
It was this fact which persuaded us to chooseR-band (F675W) for a WFPC2 host galaxyimaging proposal in Cycle 6. With matched RLQ and RQQ samples covering the red-shift range 0:1 z 0:25 the F675W filter samples the starlight from the host galaxieslongward of the 4000A break, whilst simultaneously avoiding strong emission linessuch as [OIII ] and Hα (impossible to achieve with a wider filter). As a result, com-pared to previous HST studies of quasar hosts, our WFPC2 observations are uniquelysensitive to thestellar continuumof the host and exclude many contaminating sourcesof emission which may have caused confusion in the past.
At the time of writing our low-zWFPC2 observing program is half complete. Thedata obtained so far are of extremely high quality, and we have been able to follow thehost galaxy light to within 100 of the quasar, and thus to place tight constraints onthe luminosity of the galaxy. When the observations are complete we will be able torigorously examine the relationship between quasar optical luminosity/radio-loudnessand the properties of the host at redshifts of' 0:2.
However, in the context of our Cycle 7 NICMOS study these Cycle 6 WFPC2observations will allow us to determine therest-frame R-band luminosities, scalelengthsand morphologies of thestarlight in low-redshift quasar hosts. We can therefore usethem to establish a crucial ‘here-and-now’ baseline against which to judge the resultsof our near-infrared observations at higher redshifts.
2.3. High-redshift quasars.
Given that the host galaxies of low-redshift quasars have properties consistent with theproducts of successive galaxy mergers, and given the dramatic cosmological evolutionseen in the quasar population (see below) one of the key aims of new quasar researchmust be to investigate the cosmological evolution of their hosts. In particular we wouldlike to determine how the luminosities, scalelengths, and the degree of morphologicaldisturbance seen in quasar host galaxies varies with cosmological epoch between thepeak of quasar activity atz' 2 and the present day, and whether the hosts of radio-loudand radio-quiet quasars differ in their luminosity/morphological evolution.
However, the difficulties involved in such studies are far more formidable than atlow zand this is reflected in the current state of confusion surrounding the interpretationof recent ground-based attempts to observe quasar hosts atz' 2.
Several groups have attempted such observations and have succeeded in detectingextensions around high-redshift quasars (Hintzen, Romanishin & Valdes 1991; Heck-man et al. 1991; Lehnert et al. 1992; Aretxaga, Boyle & Terlevich 1995). These

Evolution of Quasar Host Galaxies with NICMOS 198
studies suggest that the host galaxies of quasars atz' 2 are 2:5 to 3 magnitudesbrighter than those of low-redshift quasars, a result which is at least consistent withcommon scenarios for elliptical galaxy evolution. However, the usefulness of any suchdirect comparison is hampered by the fact that these high-redshift quasars are typically5 magnitudes more luminous than the low-redshift objects studied to date. In addition,the situation is somewhat confused since other workers have failed to detect extendedemission around high-redshift RQQs (Lowenthal et al. 1995). Hutchings (1995) alsoconcludes that the hosts of RQQs are considerably fainter than those of RLQs at highredshift, a result which may simply indicate that much of the light detected aroundhigh-redshift RLQs may not be due to stars, but rather to processes associated with theextreme radio activity (as is found for high-z radio galaxies (Tadhunter et al. 1992),and for low-z RLQs (Stockton & MacKenty 1987). This emphasizes the importance ofavoiding emission lines and sampling the spectrum longwards of the 4000A break.
3. Motivation: host galaxies and quasar evolution
One of the main motivating factors in the study of quasar hosts at high redshifts is thehope that a knowledge of these galaxies might help to us to understand the physicalorigin of quasar evolution.
The strong cosmological evolution in comoving space density of quasars of a givenluminosity has been known quantitatively for 30 years. However, although much workhas gone into empirical fits of the evolution (Schmidt & Green 1983; Boyle, Shanks& Peterson 1988; Hewett, Foltz & Chaffee 1993; Goldschmidt et al. 1998) its causesremain a mystery. Hierarchical growth models such as CDM may be able to explain therapid rise in QSO numbers with time at early epochs (z> 4) as a consequence of therate of galaxy mergers, but as yet they cannot account for the decline by a factor 100in quasar numbers fromz= 2 to the present day without invoking some ratherad hocassumptions (Carlberg 1990; Haenhelt & Rees 1993).
Clearly more observational evidence is required. Host galaxy studies are currentlyone of the most promising avenues of inquiry since they hold out the hope of linkingquasars into the latest models of galaxy formation and evolution. At low redshiftsthere does appear to be a link between quasar luminosity and galaxy mass, at least forAGN in the luminosity range20> MH >26, in the sense that there appears to be alower limit to the host luminosity which increases with quasar luminosity (MacLeod &Rieke 1994a,b; 1995). With HST/NICMOS it will be possible for the first time to studyquasar hosts at the key epoch of quasar activity:z= 2, the period at which the rate atwhich quasars were being created was overtaken by the rate at which quasars fade ordisappear.
There is one crucial question to be answered: is the decline in quasar numberscaused by a form of luminosity evolution (LE) of long-lived quasars, or does it in factreflect a more complicated balance between birth and death of short-lived quasars whichis a function of quasar luminosity (luminosity-dependent density evolution, LDDE)?
Host galaxies offer a means of distinguishing between these two hypotheses. Inthe LE model, individual quasars decrease in luminosity with time. If we create testsamples covering a narrow range of quasar luminosity over the range of redshifts fromz= 2 to the present epoch, we should see quasars of a fixed luminosity occupying aprogressively wider range in mass of host galaxy.

Evolution of Quasar Host Galaxies with NICMOS 199
In the LDDE model with short-lived quasars, quasar evolution has implicitly littleto do with the physics of the active nucleus, and is linked to cosmological evolution ofmassive structures. We expect that there should be no redshift-dependence of quasarhost luminosity (other than passive evolution) for quasars of a given luminosity. Thisresult would tell us that quasar evolution is indeed directly linked to galaxy forma-tion and the subsequent merger and interaction probabilities. It would tell us that theepochz= 2 was a key epoch forgalaxies, not just active galaxies, and we can use N-body simulations of galaxy formation and hierarchical merging to test whether differentgalaxy-formation models can explain the observed quasar evolution.
By comparing the hosts of RLQs and RQQs and the way in which they evolve withtime we will also gain insights into the way in which environment and history influencethe ‘radio loudness’ of quasars.
4. This project: studying host galaxy evolution with WFPC2 and NICMOS
The potential rewards of a program to determine the properties of quasar hosts fromredshifts ofz' 0:2 out to the peak in the quasar number density atz' 2 are clearlyquite far reaching and provided the impetus for our Cycle 7 study. However, the lessonof previous ground-based attempts has clearly shown that the only way to succeed insuch an endeavor is to adopt a thorough and carefully thought-out approach.
Our Cycle 7 program therefore relies heavily on our previous experience withground-based and Cycle 6 HST studies of low-z quasar hosts, and uses many of thesame strategies in order to avoid potential problems. Fundamental to this approachis the selection of appropriate quasar samples and the use of carefully chosen filter-redshift combinations to maximize the chances of detecting starlight from the hostgalaxies.
4.1. Sample Design
We therefore now list and explain the selection criteria which we have used to define thesamples of RQQs and RLQs for our Cycle 7 study of host-galaxy evolution. We stressthat such sample control isessentialif the aim is to obtain clean, meaningful resultsand advance our understanding of the cosmological evolution of the hosts of RQQs andRLQs.
From simulated images of quasars and their hosts it is clear that it is essential,particularly at high-redshift, to confine our study to quasars of moderate-lowoptical luminosity if we are to derive reliable luminosities and scalelengths fortheir host galaxies (see Taylor et al. 1996). Accordingly we have confined ourselection of high-redshift quasars to absolute magnitudes24> MV >25.
Having defined the luminosity bin at high redshift, it is vital to break the flux-density–redshift correlation which inevitably arises in flux limited samples, andto make sure we sample a comparable range of luminosities at all intermediateredshifts. In our Cycle 6 study of quasar hosts atz 0:2 (using the F675W filterin WFPC2) there are 5 RQQs and 5 RLQs with24> MV > 25. These 10objects form the lowzbaseline against which we will test the results of our high-zobservations. Thus we will be able to compare the host galaxies of quasars of thesameintrinsic optical luminosityfrom z 0:2 to 2.

Evolution of Quasar Host Galaxies with NICMOS 200
To ensure that we detectstarlight from the host galaxies at all redshifts it is neces-sary to make sure that, as in our Cycle 6 WFPC2 study atz' 0:2, the spectrum ofthe host galaxy is always observed atλrest > 4000A and yet is uncontaminatedby either [OIII] or Hα line emission. This cannot be done with the somewhatmore sensitive ‘Wide’ filters such as F110W and F160W on NICMOS, but can beachieved over a wide range of redshifts by using the F814W filter (for WFPC2),and the F110M and F165M filters in NICMOS Camera 1, provided the quasarredshifts are restricted to lie within the following redshift bins: 0:32< z< 0:43,0:83< z< 1:00, 1:36< z< 1:69 and 1:67< z< 2:09.
In order to perform a clean comparison of the hosts of RLQs and RQQs ateach epoch it is necessary to ensure that the RLQs are genuinely radio-loud(P5GHz > 1025WHz1sr1), that the RQQs are genuinely radio quiet (P5GHz <
1024:5WHz1sr1), and that within each redshift bin their optical luminosity dis-tributions are well-matched. This is not a trivial task. It requires that we selectonly RQQs which have been observed and have not been detected with sufficientsensitivity at the VLA, and requires that we confine our RLQ sample to steep-spectrum objects whose intrinsic radio luminosity cannot be artificially boostedby relativistic beaming.
The simultaneous application of these 4 constraints is sufficiently stringent that theresulting quasar sample, illustrated in Figure 1, is virtually unique (primarily becausethere are relatively few optically-faint steep-spectrum RLQs, and because relativelyfew RQQs have been observed with sufficient sensitivity in the radio). Also shown inFigure 1 is the low-redshift (z 0:2) sample from our Cycle 6 WFPC2 program. Itcan be seen that this low-zsample spans almost 3 magnitudes in optical luminosity in anarrow redshift range whereas the samples selected for the Cycle 7 study are confinedto only 1 magnitude in luminosity but span the bulk of the history of the Universe.This figure thus emphasizes how these two complementary samples will allow us tounambiguously separate the effects of cosmological epoch from any relation betweenhost galaxy properties and quasar luminosity.
4.2. PSF determination
Accurate knowledge of the form of the PSF is essential in order to decouple the quasarcontribution from that of its host. Synthetic PSFs, though often an excellent match tothe inner regions of the profile, sometimes fail to reproduce the shape of the PSF atlarger radii and this can be disastrous for the detection of host galaxy light.
We therefore devoted two entire orbits of our Cycle 7 allocation to obtaining em-pirical PSFs using our chosen filter/camera combinations (F110M and F165M withNICMOS Camera 1). Two different stars were used, to safeguard against the possibil-ity that one of them might possess Vega-like dust shells which would compromise thePSF, and by using a sequence of exposures inMULTIACCUM mode we were able toobtain deep, unsaturated images of very high dynamic range.
5. Preliminary NICMOS results
The acquisition of NICMOS data for our Cycle 7 program was completed in February1998, and the remaining WFPC2 F814W observations of objects in ourz 0:4 sub-sample are currently scheduled for the first half of 1999.

Evolution of Quasar Host Galaxies with NICMOS 201
Cycle 6
Z
Abso
lute
Mag
nitu
de M
v
R I J H
WFP
C2
WFP
C2
NICM
OS
NICM
OS
Cycle 7
Figure 1. Redshift regimes in the current sample of RQQs (filled circles)and RLQs (open circles), with the appropriate NICMOS/WFPC2 filters indi-cated. Also shown are the quasars from our Cycle 6 WFPC2 F675W imagingstudy, to emphasize that these objects will provide the low-zbaseline againstwhich to measure any cosmological evolution in the current sample. Eachredshift-filter combination samples the same region of the galaxy’s restframespectrum (roughly restframeR-band) and avoids both Hα and [OIII ]λ5007emission.
Pedestal removal and recalibration using the most recent reference files have re-sulted in significant improvements in image quality, although several problems, suchas CR persistence, remain to be dealt with. Full 2-D modeling of the images would bepremature at this stage. However, we have been able to carry out a preliminary analysisof the data, the results of which we describe here.
We have limited ourselves to an aperture 20 pixels (0.86 arcsec) across, centeredon the quasar. By comparing the total flux within this region with that of an appropri-ately scaled empirical PSF we have been able to estimate the contributions of the quasarand its host to the light within a radius of 4 kpc of the quasar. This method is ex-tremely crude and inevitably leads to an underestimation of the total galaxy luminosity.However, the initial results are extremely encouraging:

Evolution of Quasar Host Galaxies with NICMOS 202
The measured J and H magnitudes of the quasars in ourz 1 (F110M) andz 2(F165M) samples are close to the predicted values.
In almost every case we detect a significant excess flux with respect to the empiri-cal PSF, which we attribute to the host galaxy. This component typically accountsfor 25% of the light in our 0.87-arcsec aperture. This implies quasar:host ratiosand galaxy luminosities which are consistent with the values obtained for low-zobjects, although the uncertainties are currently too large to allow the testing ofspecific models of galaxy evolution.
We are therefore confident that, as the remaining issues of image processing areresolved, our NICMOS images will begin to provide the first clean measurements ofhost galaxy sizes and luminosities for quasars spanning a large fraction of the historyof the Universe.
References
Aretxaga, Boyle & Terlevich, 1995, MNRAS, 275, L27Bahcall, Kirhakos & Schneider, 1995, ApJ, 450, 486Bahcall et al., 1996, ApJ, 457, 557Boyle, Shanks & Peterson 1988 MNRAS, 235, 935Carlberg, 1990, ApJ, 350, 505Disney et al., 1995, Nat, 376, 150Dunlop, Taylor, Hughes & Robson, 1993, MNRAS, 264, 455Goldschmidt, Kukula, Miller & Dunlop, 1998, ApJ, in pressHaenhelt & Rees, 1993, MNRAS, 263, 168Heckman et al., 1991, ApJ, 370, 78Hewett, Foltz & Chaffee, 1993, ApJ, 340, L5Hintzen, Romanishin & Valdes, 1991, ApJ, 366, 7Hughes, Kukula, Dunlop & Boroson, 1998, in preparationHutchings, 1995, AJ, 110, 994Hutchings & Morris, 1995, AJ, 109, 1541Kukula, Dunlop, Hughes, Taylor & Boroson, 1997, in ‘Quasar Hosts’, Clements &
Perez-Fournon eds, p177Lehnert et al., 1992, ApJ, 393, 68Lowenthal et al., 1995, ApJ, 439, 588McLeod & Rieke, 1994a, ApJ, 420, 58McLeod & Rieke, 1994b, ApJ, 431, 137McLeod & Rieke, 1995, ApJ, 441, 96Schmidt & Green, 1983, ApJ, 269, 352Stockton & MacKenty, 1987, ApJ, 316, 584Tadhunter et al., 1992, MNRAS, 256, 53PTaylor, Dunlop, Hughes & Robson, 1996, MNRAS, 283, 930Veron-Cetty & Woltjer, 1990, A&A, 236, 69

NICMOS and the VLTPula, Sardinia, May 26-27th 1998Wolfram Freudling and Richard Hook, eds.
NICMOS Imaging of QSO Host Galaxies at 0.1< z< 4.4
L. J. Storrie-Lombardi and R. J. Weymann
Carnegie Observatories, Pasadena, CA 91101, email: [email protected]
K. K. McLeod
Wellesley College, Wellesley, MA 02181
G. H. Rieke, J. Hill, and V. Kulkarni
Steward Observatory, Tucson, AZ 85719
Abstract.We present preliminary results from two programs to image the host galax-
ies of radio-quiet quasars in 1.6 micron light using NICMOS camera 2 on HST.The high redshift program consists of QSOs covering the redshift range 0.8< z< 4.4 and a range of QSO luminosities. Of the six objects for which data havebeen obtained the results range from no host galaxy detected, to an obviousgalaxy with an interacting companion, to a possible high redshift galaxy cluster.The low redshift program covers QSOs with 0.1< z < 0.4. A host galaxy isdetected in all 12 objects for which data have been obtained.
203

NICMOS and the VLTPula, Sardinia, May 26-27th 1998Wolfram Freudling and Richard Hook, eds.
Limits on the Star Formation Rates ofz> 2 Damped Lyα Systemsfrom H α Spectroscopy
Andrew J. Bunker1
Department of Astrophysics, University of Oxford, OX1 3RH, UK
Stephen J. Warren
Imperial College, Department of Physics, Blackett Laboratory, Prince ConsortRoad, London SW7 2BZ, UK
D. L. ClementsInstitut d’Astrophysique Spatiale, Batiment 121, Universite Paris XI, F-91405Orsay CEDEX, France
Gerard M. Williger
NASA Goddard Space Flight Center, Code 681, Greenbelt, Maryland 20771,USA
Paul C. Hewett
Institute of Astronomy, Madingley Road, Cambridge CB3 0HA, UK
Abstract. We present the results of a long-slitK-band spectroscopic searchwith CGS4 on UKIRT for Hα emission from the objects responsible for high-redshift (z> 2) damped Lyα absorption systems. The objective was to mea-sure the star-formation rates in these systems. However, no Hα emission wasdetected above our 3σ limits of f < 1019 W m2, corresponding to star for-mation rates< 10h2M yr1 (q0 = 0:5). These upper limits are more mean-ingful than those from searches for Lyα emission because the Hα line is unaf-fected by resonant scattering. Forq0 = 0:5 our limits are in conflict with thestar formation rates predicted under the assumption that the high-z DLAs arethe fully-formed galactic-disk counterparts of today’s massive spiral galaxies.Deeper spectroscopy is needed to test this picture forq0 = 0:0. A programme ofNICMOS imaging observations currently underway, combined with VLT spec-troscopy, will provide a detailed picture of the link between DLAs and younggalaxies.
1Present address:NICMOS Postdoctoral Researcher, Department of Astronomy, University of Californiaat Berkeley, 601 Campbell Hall, Berkeley CA 94720, USAemail: [email protected]
204

Star Formation Rates ofz> 2 Damped Lyα Systems 205
1. Introduction
The history of star formation in the Universe is a topic of enormous current interest (e.g.,Madauet al. 1996). The damped Lyα absorption systems (DLAs, Wolfeet al. 1986)contain most of the neutral gas in the Universe, and from their redshift distribution, andthe measured column densities, the evolution in the co-moving density of neutral gasΩg can be measured (e.g., Lanzettaet al.1991). Then the analysis of the variation ofΩgwith redshift allows the measurement of the history of star formation in the Universe(Pei & Fall 1995) provided the consequences of dust obscuration are accounted for.
This approach to the history of star formation unfortunately tells us nothing abouthow galaxies are assembled. One school of thought has DLAs being the (large) pro-genitors of massive spiral disks (e.g., Lanzettaet al. 1991; Prochaska & Wolfe 1997).However, Møller & Warren (1998) have recently shown that the impact parameters ofthe few detected galaxy counterparts of high-redshift DLAs are small (in the context ofthis debate) and that the space density of the DLAs at high-redshift is probably muchhigher than the space density of spiral galaxies today.
2. Searches for Star Formation in Damped Systems
Here we present the results of a spectroscopic survey for Hα λ 656.3 nm emission from8 damped absorption systems at 2:0< z< 2:6, along the line-of-sight to 6 high-redshiftquasars. At these redshifts Hα appears in the near-infraredK-window. The results arerelevant to the debate on the nature of the DLAs, for if the DLAs are the counterpartsof today’s spiral galaxies the associated Hα emission should be detectable. The rateof depletion of the cosmic density of neutral gas can be used to compute a universalstar formation rate. The average star formation rate in each DLA depends then on theirspace density, so that high measured rates of star formation would provide support forthe view that the DLAs are massive galaxies already in place at high-z. A low mea-sured star formation rate on the other hand would be in agreement with the hierarchicalpicture.
There have been extensive searches for Lyαλ 121.6 nm emission from DLAs butwith limited success (e.g., Smithet al.1989; Hunstead, Pettini & Fletcher 1990; Lowen-thal et al.1995). This is generally thought to be due to the fact that resonant scatteringgreatly extends the path length of Lyα photons escaping through a cloud of neutral hy-drogen so that even very small quantities of dust can extinguish the line (Charlot & Fall1991). Because the effective extinction can be extremely large this has the consequencethat non-detections do not provide any useful information on the star formation ratesin the DLAs. The Hα line, although intrinsically weaker by a factor 10, lies at alonger wavelength where the extinction is smaller, and is not resonantly scattered. Inconsequence a search for Hα emission from DLAs may be more efficient than a searchfor Lyα.
3. Our Near-IR Spectroscopic Survey
With the CGS4 spectrograph on the 3.8-m UK Infrared Telescope (UKIRT) we have un-dertaken a search for line emission from 8 high-redshift DLAs (2:0< z< 2:6) near theexpected wavelength of Hα. The observations and data reduction are detailed in Bunker

Star Formation Rates ofz> 2 Damped Lyα Systems 206
Figure 1. The measured 3σ upper limits to the SFRs in M yr1 for thesample of 8 DLAs forq = 0:5. The curves are the predicted survey-averagedSFRs from the closed-box models of Pei & Fall (1995), under the assumptionthat the DLAs are the progenitors of present-day spiral galaxy disks. The pre-dictions of the hierarchical picture will lie below these curves in proportion tothe ratio of the space density of galaxy sub-units at any redshift to the spacedensity of spiral galaxies today.
(1996). No lines were detected at> 3σ significance above the quasar continuum. Ourlong-slit K-band spectra were typically 1-hour each and used the 2.5-arcsec wide slit(10h1 kpc atz 2:3, q0 = 0:5 & h= H0=100kms1Mpc1 throughout). With a 3-arcsec extraction width, the 3σ upper-limits lie in the range(1:01:6)1019 W m2
for spectrally-unresolved line emission. The resolution of CGS4 in this configurationis 650kms1 FWHM.
We use the upper limits on Hα line luminosities to constrain the star formationrates in these systems, based on the prescription of Kennicutt (1983), where a star for-mation rate (SFR) of 1M yr1 generates a line luminosity in Hα of 11:21033 W. The

Star Formation Rates ofz> 2 Damped Lyα Systems 207
limits to the SFRs lie in the range(8:418)h2 M yr1, although the conversion be-tween Hα line luminosity and SFR is somewhat uncertain and depends on the assumedIMF.
4. Testing the Large Disk Hypothesis
We compare the measured upper limits to the star formation rates in our sample againstpredictions based on the assumption that DLAs are the progenitors of today’s spiralgalaxies. We begin with the analysis by Pei & Fall (1995) of the observed rate ofdecline of the cosmic density of neutral gasΩg(obs) measured from surveys for DLAs.At any redshiftΩg(obs) will be an underestimate of the true cosmic densityΩg(true)because quasars lying behind DLAs will suffer extinction, and may therefore drop outof the samples of bright quasars used to find the DLAs. Pei & Fall correct for thisbias, accounting in a self-consistent manner for the increasing obscuration as the gasis consumed and polluted as star formation progresses. In this way they determine theevolution ofΩg(true), and so the SFR per unit volume.
Although the analysis of Pei & Fall provides the SFR per unit volume at anyredshift, it gives no information on the SFR in individual galaxies. For the hypothesisof large disks of constant co-moving space density, assuming that the SFR in a DLAis proportional to the present-day galaxy luminosityL(0), we can predict the SFRs inthe population of DLAs at any redshift. Figure 1 plots the results of this calculation,showing the predicted survey-averaged star formation rate for a sample of DLAs forq = 0:5. Seven of the eight DLAs lie below the curve in this plot. The significance ofthis result is reduced by the fact that the solid angle over which we have searched forHα emission is smaller than the expected solid angle of the large disks. Despite thiswe would still have expected to detect 2 or 3 systems with average SFRs twice as largeas our upper limits. These results then provide support for the hierarchical picture. Forq = 0:0 deeper limits are required to distinguish between the two pictures. A moredetailed treatment of this survey and its implications is given in Bunkeret al. (1998).
5. Future Work
A decisive test can be made with the latest generation of near-IR instrumentation. DeepH-band imaging with HST/NICMOS (Warrenet al., GO-7824) will reveal whetherthe galaxies responsible for damped absorption are indeed in sub-L pieces, and theopportunities afforded by the largest ground-based telescopes such as the VLT shouldenable the accurate measurement of star formation rates in these systems. Combinedwith spectroscopy of metal lines, in this way we will build up a picture of the history ofassembly, gas depletion, and chemical evolution in the population of damped absorbers.
Acknowledgments. We would like to thank the Organizing Committee of the “NIC-MOS & the VLT” Sardinia meeting. We are grateful for the excellent support we re-ceived while observing at UKIRT. We thank Mike Fall, Palle Møller & Hy Spinrad foruseful discussions, and Max Pettini & Richard McMahon for details of some of thedamped systems included in our survey. AJB was supported by a PPARC studentshipwhile at Oxford, and a NICMOS-IDT postdoctoral position at U.C. Berkeley.

Star Formation Rates ofz> 2 Damped Lyα Systems 208
References
Bunker A. J. 1996, D. Phil. Thesis, University of Oxford,“Searches for Distant Galaxies”,WWW addresshttp://astro.berkeley.edu/˜ bunker/thesis.html
Bunker A. J., Warren S. J., Clements D. L., Williger G. M., Hewett P. C. 1998, MNRAS,submitted
Charlot S., Fall S. M. 1991, ApJ, 378, 471Hunstead R. W., Pettini M., Fletcher A. B. 1990, ApJ, 365, 23Kennicutt R. C. 1983, ApJ, 272, 54Lanzetta K. M., Wolfe A. M., Turnshek, D. A., Lu L., McMahon R. G., Hazard C.
1991, ApJS, 77, 1Lowenthal J. D., Hogan C. J., Green R. F., Woodgate B. E., Caulet A., Brown L.,
Bechtold J. 1995, ApJ, 451, 484Madau P., Ferguson H. C., Dickinson M. E., Giavalisco M., Steidel C. C., Fruchter A.
1996, MNRAS, 283, 1388Møller P., Warren S. J. 1998, MNRAS,in press(astro-ph/9804205)Pei Y. C., Fall S. M. 1995, ApJ, 454, 69Prochaska J. X., Wolfe A. M. 1997, ApJ, 487, 73Smith H. E., Cohen R. D., Burns J. E., Moore D. J., Uchida B. A. 1989, ApJ, 347, 87Wolfe A. M., Turnshek D. A., Smith H. E., Cohen R. D. 1986, ApJS, 61, 249

Part 4. Future Technology

NICMOS and the VLTPula, Sardinia, May 26-27th 1998Wolfram Freudling and Richard Hook, eds.
Design and Status of the NICMOS Cryocooler
John W. MacKenty
Space Telescope Science Institute, Baltimore MD 21210 USAEmail: [email protected]
Edward S. Cheng
NASA Goddard Space Flight Center, Greenbelt MD 20771 USAEmail: [email protected]
Abstract.NASA is developing the NICMOS Cooling System (NCS) to provide op-
eration of NICMOS beyond the exhaustion of its stored solid nitrogen cryogen.It is planned that the NCS will be installed into HST in early 2000 during theThird HST Servicing Mission (SM3). This development was motivated by thedevelopment of a thermal short within the NICMOS dewar which has reducedthe cryogen lifetime from a planned 4.5+ years to slightly less than 2 years.While the acceleration of the the NICMOS observing program and the selectionof a second round of General Observer proposals will permit NICMOS to obtainup to 70 percent of its originally anticipated observations, the extension of theNICMOS operational period will both enable additional science programs andprovide HST with a near infrared capability potentially until the end of the HSTmission.
The NCS combines an external radiator identical in design to the ACS/STISAft Shroud Cooling System (ASCS) planned for SM3, a Creare, Inc. reverse-Brayton cycle turbine cooler, and an EVA installed neon loop to the NICMOSdewar’s cooling coil. This system has been assembled and is undergoing sys-tem level testing in May 1998. A validation flight on the HOST pallet onboardSTS-95 in October 1998 is planned. We discuss the design of the NCS and theexpected post-SM3 performance of NICMOS with the NCS.
1. Motivations
1.1. Extending the NICMOS Lifetime
The Near Infrared Camera and Multi-Object Spectrometer (NICMOS) was installedon board the Hubble Space Telescope (HST) by NASA during the Second HST Ser-vicing Mission to provide a near infrared capability. Scientifically useful operation ofNICMOS requires that its HgCdTe focal plane detector arrays (FPAs) be maintainedat temperatures below approximately 80K. By design, the NICMOS FPAs are operatedbetween 58 and 62 Kelvins with cooling provided by an expendable supply of solid ni-trogen. The dewar containing the FPAs and solid nitrogen supply was designed for anon-orbit of lifetime of 4.5 to 5 years with the exhaustion of the nitrogen cryogen being
210

Design and Status of the NICMOS Cryocooler 211
the limiting factor. Unfortunately, internal stresses in the dewar caused physical mo-tions shortly following the deployment of NICMOS into HST. These motions resultedin direct contact developing between baffles on the innermost cold solid nitrogen dewarand its surrounding cooled shell. The planned long lifetime of the nitrogen supply wasto be achieved by a series of well isolated cold shells placed in hard vacuum aroundthe inner nitrogen container. The innermost shell was cooled by the vented nitrogengas and provided the cooling for the filters and spectral dispersing elements. This va-por cooled shell is known as the VCS. (The outer two shells are cooled using thermalelectric coolers.)
The result of this physical contact between the inner dewar and the VCS was athermal short which approximately doubles the heat flux into the solid nitrogen cryogen.The anticipated on-orbit lifetime of NICMOS was thereby reduced to approximately22 months. Considering the initial commissioning period, this will reduce the period ofNICMOS science observations to about one third of the original goal.
With the advice of outside committees, NASA and STScI have accomplished apartial recovery of the NICMOS science opportunity by accelerating the NICMOSobserving program at the expense of observations with other science instruments onHST. By assigning NICMOS 40-50 percent of the total HST time available until mid-November 1998, STScI will be able to complete all GTO, and GO Cycle 7 and 7-NICMOS TAC approved programs. This, with the inclusion of the additional Cycle7-NICMOS Call for Proposals, will result in the acquisition of 60-70 percent of origi-nally anticipated NICMOS science return.
1.2. Other Considerations
Beyond the recovery of the NICMOS capability, the addition of the NICMOS coolingsystem and its associated aft-shroud cooling system provides two other benefits.
First, the HST aft-shroud thermal situation will limit simultaneous Science Instru-ment operations starting in the 2001 timeframe. This is the result of increasing powerdemands of the new generations of instruments (e.g. STIS and ACS) and the normalaging of the outer surfaces of the spacecraft. A second radiator of the same designadopted for NICMOS and a shared control electronics subsystem provides a means ofdirectly cooling ACS, STIS, and potentially COS together with the ASCS itself.
Second, the NCS permits a flight demonstration of long life cryocooler systemwhich is desirable for future space missions. For example, the Creare cryocooler sys-tem within NCS is the leading technology candidate to provide the Next GenerationSpace Telescope (NGST) with sufficient cooling to support a mid-infrared (thermal) IRinstrument.
2. Expected NICMOS Performance after HST Servicing Mission 3
In general, the NCS is expected to restore NICMOS approximately its condition priorto the exhaustion of the nitrogen cryogen. The temperature at the FPA detectors willbe 72-75 Kelvins (compared to 61 Kelvins in June 1998). This will increase the darkcurrent from 0.05 e-/s to 0.5 or 1.0 e-/s. Even for fairly long exposures, the readout noiseof approximately 30 electrons will dominate the dark current. Only very long narrowband exposures at wavelengths shorter than 1.8 microns have a significant potentialloss in performance. As a minor benefit, the quantum efficiency of the detectors atshort wavelength will increase by perhaps one third. The filters, which are viewed by

Design and Status of the NICMOS Cryocooler 212
the entire wavelength response of the detectors, are expected to be cooled below 160Kelvins (which is actually closer to their original design temperature than their present100 Kelvins). Therefore, background from filters is expected to remain undetectable.
Image quality is expected to be equivalent to that obtained during late 1997 and1998 (with Camera 3 remaining several mm out of focus). Although considerable un-certainties regarding the behavior and state of the dewar structure remain, it appearsvery unlikely that Camera 3 will be recovered into the internal focus adjustment rangeof the NICMOS pupil alignment mechanism (PAM). Therefore additional “NIC3 cam-paigns” in which the telescope focus is shifted may still be required to obtain the verybest possible image quality in NICMOS Camera 3.
During NCS operation, the temperature stability of the detectors will be an im-portant parameter. The goal is stability of 0.05K during one orbit and 0.2K long term.Temperature variations will create bias shifts (similar to the pedestal effect) and mayrequire similar calibration efforts. Although the NCS requires consider power to oper-ate (equivalent to approximately 1.5 science instruments), present indications are thatfull time operation will be possible until at least 2003 (at Servicing Mission 4) andpotentially beyond although NICMOS+NCS campaigns may be required.
3. NICMOS Cooling System Design
The NCS Requires 5 distinct elements: (1) a flexible neon loop connection between theNICMOS dewar cooling coil and the NCS heat exchanger, (2) the Creare Cryocooler,(3) the Power Conversion Electronics, (4) the Electronics Support Module, and (5) twoexternally mounted radiators. Figure 1 shows the main elements as they will be installedinside HST.
3.1. Flex Lines
The actual cooling of the interior of the NICMOS dewar is accomplished by circulating65 to 70 Kelvins neon gas through the cooling coil at the aft end of the dewar. This coilwas originally used to solidify the nitrogen cryogen within the dewar by passing coldHelium gas through it during ground assembly of NICMOS. This coil is accessible viatwo bayonet fittings on the side of NICMOS to which the “flex Lines” will be attachedby an astronaut during SM3. The requirement on the cooling system is to provide 400milliwatts of cooling power into the dewar.
3.2. Creare Cryocooler
The Creare, Inc. mechanical cryocooler system uses a reverse-Brayton cycle turbinedesign which provides several major advantages for this application. First, this closedloop system operates with extremely high speed –7 kHz– turbines so the potential formechanical coupling to the HST is very small. Since HST has very demanding point-ing requirements (7 milliarcseconds with actual performance frequently better than 3milliarcseconds), avoiding disturbances is crucial. Second, this system can provide thedegree of cooling required. Since the parasitic losses within the astronaut installed flexlines and the bayonet couplings are rather large, delivering 400 mW into the NICMOSdewar is expected to require 7 to 8 Watts from the cooler. Third, the Creare design issufficiently compact in physical size to fit within presently unused space between theaft end of the NICMOS instrument’s enclosure and the aft bulkhead of the HST.

Design and Status of the NICMOS Cryocooler 213
Figure 1. Cutaway view of the NICMOS Cryocooler and ASCS showingthe various modules and their interconnections.
The Creare cryocooler is connected to the flex lines cooling loop by means ofa heat exchanger operating at 62 Kelvins. It is contained in the NICMOS CryoCooler(NCC) enclosure together with gas storage bottles to purge, pressurize, and –if necessary–re-pressurize the external neon loop. A cutaway view of the NCC is shown in Figure 2and the assembled unit (minus its external thermal blankets is shown in Figure 3. Notethe MLI blanket encased flex lines extending from the box on the left side.
3.3. Power Conversion Electronics
The Power Conversion Electronics (PCE) is required to produce the AC power requiredby the Creare cryocooler and is located within the same enclosure as the Creare cooler(the NCC box). The cooler will require up to 400W during the initial cooldown phase.
3.4. Electronics Support Module
The Electronics Support Module (ESM) contains a microprocessor to control both theNCS and the Aft-Shroud Cooling System (ASCS). This system is commanded via anHST remote interface unit (RIU), the same path used by each science instrument. Evenin the absence of the NCS, the ESM would be required to control the ASCS coolingsupport for ACS and STIS.
3.5. Aft-Shroud Cooling System
The Aft-Shroud Cooling System (ASCS) consists of two externally mounted radiatorsas illustrated in Figure 4. One is dedicated to NICMOS+NCS while the other supportsall other SIs and the ESM. Heat is transferred to these radiators by Capillary PumpedLoop (CPL) lines to be installed by the astronauts. Heat flow along CPL lines is reg-

Design and Status of the NICMOS Cryocooler 214
Figure 2. NICMOS CryoCooler Enclosure
ulated by the ESM by means of heaters attached to each end of a CPL line. The CPLlines are connected to the ACS and STIS instruments at interface plates. A view of theNICMOS radiator under construction is shown in Figure 5
4. Testing and Reviews Prior to Flight on Servicing Mission 3
The NCS poses several challenges for the HST Servicing process. First, the entiresystem is not available for testing since NICMOS is presently installed in HST. Second,the time available for the development of the NCS is very short (ar the start of the NCSdevelopment effort in mid-1997 SM3 was scheduled for November 1999 – it is nowscheduled for May 2000 due to events external to the HST project). And third, theCreare cryocooler system has not yet been tested under zero gravity conditions.

Design and Status of the NICMOS Cryocooler 215
Figure 3. Assembled NICMOS Cryocooler
Figure 4. Schematic view of the ASCS Radiators installed on HST
To address these factors, the NCS development process includes plans to test theflight-NCS in space during STS-95 as part of the Hubble Orbital System Test (HOST)payload. This space shuttle flight is currently scheduled for October 1998. A thermalsimulator of the NICMOS dewar with a high fidelity replica of the cooling coil and

Design and Status of the NICMOS Cryocooler 216
Figure 5. ASCS NICMOS Radiator under construction at GSFC
its interface plate has been constructed to support this testing both on the ground andduring the HOST flight.
Previous testing of the Creare cryocooler has demonstrated operation for morethan 1.5 years with the most critical turbine component having over 13 years of lifetesting. During the first half of 1998, the NCS flight components have been integratedand are presently undergoing testing in thermal vacuum chambers at Goddard SpaceFlight Center (Figure 6). The development of the NCS and the ongoing evaluation ofthe technical and scientific performance of NICMOS has been, and will continue tobe, reviewed by an Independent Science Review board. The final decision to proceedwith installation of the NCS into HST will depend upon the outcome of the ground andHOST mission testing and the findings of this review board.

Design and Status of the NICMOS Cryocooler 217
Figure 6. The placement of the NCS and the NICMOS thermal simulatorinto a thermal vacuum chamber at GSFC in early May 1998 is shown. Thelarge diameter tubes connecting the two boxes are the flex lines.

NICMOS and the VLTPula, Sardinia, May 26-27th 1998Wolfram Freudling and Richard Hook, eds.
2048 x 2048 HgCdTe Arrays for Astronomy at Visible and InfraredWavelengths
Donald N.B. Hall
Institute for Astronomy, University of Hawaii
Abstract. In collaboration with the European Southern Observatory and theSubaru project, the University of Hawaii Institute for Astronomy has enteredinto a partnership with Rockwell International Science Center to develop 2048x 2048 format HAWAII-2 HgCdTe arrays for low background ground basedastronomical applications. Present plans call for production of 2048 x 2048multiplexers late in 1998 and hybrid arrays utilizing 2.5µm PACE HgCdTe in1999.
However Rockwell has recently achieved a breakthrough in HgCdTe ma-terial quality through use of new detector growth technologies which utilize p/ndouble layer planar heterostructure arrays grown by MBE on lattice matchedCdZnTe substrates. Initial tests of this material have demonstrated near theoret-ical dark current as a function of temperature and cutoff wavelength.
UH IfA and Rockwell plan to evaluate arrays utilizing this new materialfor use in the Next Generation Space Telescope. The primary goal would be todirectly compare the performance ofλc = 5µm cut off wavelength 2048 x 2048HgCdTe arrays with that of 1024 x 1024 InSb arrays. However HgCdTe offersthe advantage thatλc can be tailored to any value from 1.2 to 17µm; a secondgoal of the investigation would be to fabricate, test and demonstrate 2048 x 2048HgCdTe arrays withλc values of 1.8 and 2.5µm Although the investigationwould focus primarily on 1 - 5µm detectors, the same multiplexers could alsobe hybridized to Si PIN diode arrays, providing sensitivity down through thevisible into the ultraviolet.
These large format arrays offer potential advantages for both space andground based applications.
1. Introduction
Over the last two decades, dramatic improvements in the performance of 1 - 5µminfrared detector materials combined with the leap from single detectors to million pixelarrays have led to a billion-fold improvement in our ability to observe astronomicalsources at these wavelengths. These advances, along with those in lightweight mirrorand adaptive optics technologies, have already revolutionized ground based infraredastronomy and now pave the way for the science program of NGST.
InSb has long been the detector material of choice for ground based astronomicalobservations spanning the 1 - 5µm region and also has space heritage as the detectormaterial chosen for ISO and SIRTF. However HgCdTe is now an attractive alternate
218

2048 2048 HgCdTe Arrays for Astronomy 219
technology which offers very significant advantages as a detector in the 1 - 5µm re-gion. 2048 x 2048 format arrays - over four million pixels (Mpxl) - are now underdevelopment and the first are scheduled for delivery in the last quarter of 1998. Newmolecular beam epitaxial (MBE) HgCdTe material offers potentially superior detectorperformance to InSb along with the additional flexibility to tailor the band-gap to setthe long wavelength cutoff (λc) to any value from 1.2 to 17µm. This is particularlyvaluable under low background conditions as the theoretical dark current is reduced bymore than an order of magnitude for each 10% reduction inλc; diode capacitance andhence read noise is also reduced withλc.
Over the last decade the University of Hawaii (UH) Institute for Astronomy (IfA)and Rockwell International Science Center (Rockwell) have collaborated in a series ofprograms to develop large format HgCdTe arrays optimized for low background astro-nomical applications. UH now has three years of experience operating 1024 x 1024format, 2.5µm HAWAII arrays at telescopes on Mauna Kea. Rockwell has alreadydelivered 30 pairs of engineering and science grade HAWAII arrays to other customersand is in the process of filling orders for a similar number. Read noises of 12e, re-duced to 3ewith multiple reads, and dark currents below 1eper minute have beendemonstrated for these HAWAII arrays.
Rockwell has recently achieved a breakthrough in HgCdTe material quality throughuse of new detector growth technologies which involve p/n double layer planar het-erostructure arrays grown by MBE on lattice matched CdZnTe substrates. Initial testsof 256 x 256 arrays of this material have demonstrated near theoretical dark current asa function of temperature and cutoff wavelength (Figure 2). The new material is latticematched to the CdZnTe substrate, eliminating the lattice defects of earlier PACE mate-rial which are thought to be responsible for both its reduced quantum efficiency at shortwavelengths and also image persistence effects. In contrast to the low index sapphiresubstrate used in PACE material, the refractive index of CdZnTe is well matched to theHgCdTe detector material; the exposed surface of the CdZnTe substrate can thus readilybe anti reflection coated and Rockwell is now routinely achieving quantum efficienciesin excess of 80% with this technology.
In November 1997, IfA entered into a contract with Rockwell for the developmentof a 2048 x 2048 format, 18µm pitch, low noise HAWAII-2 multiplexer (mux) basedon the proven HAWAII technology; the European Southern Observatory and the Sub-aru Telescope have also joined this effort. The first run of this 4 Mpxl mux will takeplace late summer in the same Rockwell production foundry where high yields of theHAWAII muxes have been consistently achieved. This contract specifies early 1999delivery of two science grade arrays to UH; they will consist of the 4 Mpxl muxes hy-bridized to traditional 2.5µm PACE HgCdTe. Rockwell intends to subsequently offerarrays utilizing this mux to the broad astronomical community. The 37 mm physicaldimensions of the 4 Mpxl HgCdTe arrays are only fractionally (one third) larger thanthe corresponding 27mm of the 1024 x 1024 ALADDIN InSb arrays and the 18µmpixel size reduces the rate of ionizing events per pixel by better than a factor of two.
The same muxes can also be readily hybridized to both to Si diode arrays andto MBE HgCdTe material with cutoff wavelengths as long as17µm, thus providing the

2048 2048 HgCdTe Arrays for Astronomy 220
option of wavelength coverage from the ultraviolet through much of the MIR. For manyapplications this offers the flexibility of extended wavelength coverage with the opera-tional simplicity of using the same multiplexers at the same operating temperature..
The planed NGST investigation would consist of the following tasks:
1. Fabricate 2048 x 2048 muxes for this program by augmenting the silicon foundryruns already planned under the HAWAII-2 subcontract.
2. Produceλc = 1.8, 2.5 and 5µm HgCdTe wafers utilizing p/n double layer planarheterostructure MBE material on CdZnTe substrates.
3. Initially hybridize 256 x 256 HgCdTe sub arrays with these three cutoff wave-lengths to high quality sections of engineering grade 2048 x 2048 muxes. Laterin the program full 2048 x 2048 hybrid devices would be produced.
4. Test and demonstrate the performance of these arrays as they relate to NGSTrequirements down to a temperature of 30 K. The performance of theλc = 5µmdevices will be specifically characterized relative to available 1024 x 1024 InSbdevices. Initial measurements at Rockwell will be followed up with detailedevaluation in the laboratory and at the telescope in Hawaii.
5. Evaluate the visible wavelength sensitivity of thinned HgCdTe at temperatures of30 - 50 K relative to available data on thinned InSb and demonstrate the perfor-mance of 2048 x 2048 HAWAII-2 muxes hybridized to Si PIN diode sub-arrays.
6. Evaluate, and subject to availability of funding, demonstrate incorporation ofthese arrays into mosaic focal planes.
7. Assess the resources needed to deliver significant numbers of these arrays.
2. Multiplexer
The HAWAII-2 mux represents only a modest jump from the 1024 x 1024 HAWAIImux developed under a similar contract in late 1993 and early 1994. The HAWAIIdevices have been characterized in great detail and continue to provide unparalleledresults in astronomical applications worldwide.
Although the 2048 x 2048 device will be, by a factor of four, the largest deviceyet fabricated in deep submicron CMOS technology, Rockwell extrapolates high yieldsbased on previous experience with their world-class foundry. The yield of the HAWAIImuxes has increased 400% over the last two years and, on the basis of ongoing improve-ments driven by worldwide competition, we anticipate a defect free yield approaching30% for the larger muxes.
Operation at the 30K temperature of the NGST focal plane represents a significantextrapolation of the 60 - 77K temperatures at which HAWAII muxes have been oper-ated. The lower operating temperature was not anticipated to be a problem and we haveconfirmed that two critical parameters, gain and read noise, for an engineering gradeHAWAII array show no significant change between 78 and 30 K. The results, shown

2048 2048 HgCdTe Arrays for Astronomy 221
Figure 1. Noise squared vs. signal shows no discernable change between78 and 30 K.
in Figure 1, demonstrate a change of less than 1.5% in mux gain and no measurablechange in read noise (23 vs. 22.7 electrons). The performance of both muxes and hy-brid arrays at temperatures down to 30k will be fully evaluated during the proposedinvestigation as described in Section 5..
3. 1 - 5µm HgCdTe Detector Material
Rockwell will utilize molecular beam epitaxy (MBE), the highest performanceHgCdTe detector growth technology available, to fabricate the 2048 x 2048 ar-rays. Based on this proven, flexible and highly reproducible technology, we expect thatthe focal plane arrays produced will provide excellent performance and operability. Thekey attributes of MBE HgCdTe detectors are:
low dark current consistent with theoretical diffusion-limited operation
high uniformity of key characteristics, particularly breakdown voltage and 1/fnoise
sharp, well-defined spectral characteristics
elimination of image persistence and poor short wave quantum efficiency seenin earlier PACE material through lattice matching of the HgCdTe to the CdZnTesubstrate
the opportunity to anti reflection coat the surface of the CdZnTe substrate toachieve high quantum efficiency
Rockwell’s MBE technology has been shown to produce the best HgCdTeFPA’s in the industry spanning cutoff wavelengths from 1.85 to 17.3µm.

2048 2048 HgCdTe Arrays for Astronomy 222
Figure 2. The measured temperature dependence of dark current of MBEHgCdTe withλc’s near 2.2, 5 and 10µm tracks theoretical predictions farbetter than traditional PACE material.
Tailoringλc to shorter wavelengths also improves read noise as the junction capac-itance decreases withλc. Figure 3 shows the modeled junction capacitance plus inputcapacitance vs.λc for an HgCdTe/CdZnTe MBE double layer planar heterostructure(DLPH) diode. The figure shows that the junction + input capacitance is reduced from37 to 32 fF asλc is reduced from 5 to 2.5µm and that there is no change in read noisefrom 78 to 30K.
4. Hybridization of 2048 x 2048 Arrays
The hybrid mating of the 2048 x 2048 NGST FPA will be based on techniques provenin the fabrication of the 1024 x 1024 HAWAII devices. The proposed layout of the

2048 2048 HgCdTe Arrays for Astronomy 223
Figure 3. Modeled junction capacitance vs. cut-off wavelengthλc.
2048 x 2048 hybrid is basically a 4X scale-up of the 1024 x 1024 arrays, with verysimilar pixel size (18 vs. 18.5µm) and the same interconnect dimensions. The use ofCdZnTe as the detector substrate should enhance hybridization as the material is easierto polish than the sapphire substrate of the PACE material used in the HAWAII FPAsand produces flatter detector die.
The main challenge in scaling up the hybrid mating method is the need to applyfour times the force to the hybrid components to produce a robust indium intercon-nect bond. Rockwell’s current mating machine is capable of mounting and aligning thelarger die of the 2048 x 2048 device, but is not designed to apply the required loads. Ourplan for hybridization of the HAWAII-2 arrays is to use this mating machine to alignand attach the hybrid components at the load currently used for the 1024 x 1024 arrays,then transfer the hybrid to a very rigid air gimbal in a load frame. Such a compressiveapparatus can be made much more rigid than a mating machine, since there is no need toaccurately control the movement and orientation of the mounting surfaces. The hybridswill then be compressed to the final load, with the air gimbal ensuring that the load isevenly distributed. The air gimbal and other components for this mating method are inhouse at Rockwell: the first 2048 x 2048 hybrids are scheduled for fabrication under theHAWAII-2 program late in 1998. Mask sets have also been procured for the fabricationof 2048 x 2048 test structures. The 2048 x 2048 hybrid mating technology should berelatively mature and have been fully demonstrated under the HAWAII-2 program well

2048 2048 HgCdTe Arrays for Astronomy 224
Figure 4. The BCS design compresses the mux to match the thermal con-traction of the detector without bending the FPA.
before 2048 x 2048 arrays would be required for the NGST program.
The difference in thermal expansion between the detector and the silicon mux hasthe potential to create large thermally induced stresses on the indium interconnects andthe detector material. With repeated thermal cycling this can result in failure of theinterconnects or lead to damage to the detector pixels. Rockwell has developed theBalanced Composite Structure (BCS) design to produce reliable hybrids and appliedit to a variety of FPA designs, including the 1024 x 1024 HAWAII FPA. This designrelieves the stress at the hybrid interface by compressing the mux to match the thermalexpansion of the detector material. The thickness and composition of the compressivelayer is adjusted to produce the desired compression of the multiplexer. A balancinglayer below the compressing layer prevents bending of the FPA (Figure 4) The BCSdesign has been successfully applied to a number of FPA’s with CdZnTe-substrate de-tectors and Rockwell does not anticipate the need for any modifications in going to the2048 x 2048 format hybrids.
5. Test and Evaluation of Performance Down to 30 K
Both Rockwell and the IfA have existing test facilities capable of characterization offocal plane arrays down to 30 K. We propose to utilize these facilities for initial screen-ing and evaluation of muxes and arrays produced under the proposed investigation.However the verification of full device performance at read noise levels of 2 e and darkcurrents as low as 4 e / Ksec will require a specialized ultra-low background test facility.
We plan to carry out initial characterization of HAWAII-2 engineering grade muxeshybridized to 256 x 256 sub arrays of 5.0, 2.5 and 1.8µm MBE HgCdTe material onlattice matched CdZnTe substrates and to Si PIN diode arrays. Later we intend todemonstrate and characterize full scale 2048 x 2048 array technology. By that timethere will exist a substantial body of data on HAWAII-2 muxes hybridized to tradi-tional PACE material.

2048 2048 HgCdTe Arrays for Astronomy 225
6. Options for Extension to Visible Wavelengths
The sensitivity of the proposed 2048 x 2048 devices can be extended through visiblewavelengths either by thinning the CdZnTe substrate or by hybridizing an array of SiPIN diodes to the same multiplexer.
Typical HgCdTe FPA’s are not sensitive to visible wavelengths due to absorptionin the CdZnTe substrate layer short of 0.8µm. It is possible to achieve detector responsecomparable to InSb in the visible by removing the CdZnTe substrate with a selectiveetch. At least two standard etches are available that remove the CdZnTe substrate butdo not affect the layer containing Hg. This process would remove the entire CdZnTesubstrate leaving only the very thin active layer of HgCdTe hybridized to the multi-plexer. This material would be sensitive to visible wavelengths.
Several issues would need to be addressed in this approach:
1. The hybrid gap must be back filled with an epoxy or similar material to supportthe thin HgCdTe layer, but the backfill material must resist the etch
2. The multiplexer, including the exposed wirebond pads, must resist the etch
3. The exposed HgCdTe surface must be passivated to avoid large leakage currents.
Rockwell has established technologies which would address all of these issues.
However, the alternate of hybridizing a back-illuminated Si PIN diode array to the2048 x 2048 mux appears far more attractive. By utilizing this hybrid focal plane arrayapproach, it is possible to produce a visible imager which will operate at 30K with acombination of performance and other features not attainable with either HgCdTe orInSb in the visible. In this hybrid approach, the detector will be independently opti-mized for visible quantum efficiency, speed and dark current outside of the standardCMOS process, but will use standard high-volume silicon processing techniques. Dueto the maturity of silicon and the available material quality, the cosmetic quality of thisdevice should be very high. The fully-depleted architecture provides low cross-talk andreduces any resistivity variations to improve uniformity of response. This hybrid ap-proach allows for a fill factor of nearly 100%; with an anti-reflection coating of SiO2tailored to the appropriate thickness, quantum efficiencies exceeding 80% throughoutthe visible should be achievable. If lower dark current than the thinned wafer approachis required, a bonded-wafer approach in which a thin (10 - 75µm) silicon layer is trans-ferred to the multiplexer through bump-bonding with the later removal of the thickerbonded substrate can be employed. In this approach dark currents at the levels of CCD’sare attainable, while providing the advantages of operation at 30K, utilization of thesame 2048 x 2048 multiplexer and non destructive readout.
7. Mosaic Focal Planes
Although the primary goal of the proposed investigation is the demonstration of 2048x 2048 FPAs optimized for NGST core program 1 - 5µm requirements, with potential

2048 2048 HgCdTe Arrays for Astronomy 226
Figure 5. The proposed package for the HAWAII-2 arrays.
extension through visible wavelengths, the eventual NGST goal is an 8 k x 8 k mosaicimager. This will require the assembly of sixteen 2048 x 2048 FPAs with precisionpackaging designed to minimize the dead space between the arrays. Both Rockwelland UH have extensive experience with such mosaic focal plane technology.
At UH Gerald Luppino has pioneered the development of several generations ofCCD mosaic focal planes for wide field visible imaging. He has extensive experience inthe packaging for large CCD focal planes and has developed the first 8192 x 8192 CCDmosaiced from eight 2048 x 4096, three side buttable, devices; similar mosaics arenow in routine astronomical use and have been widely duplicated. They utilize an Alu-minum Nitride (AlN) ceramic which is an ideal thermal expansion match to silicon andis also a superb thermal conductor. The same techniques are readily applicable to IRarray mosaics and involve technology very comparable to the proposed NGST mosaics.
Rockwell has extensive experience mounting large FPAs in the pin grid arraycommonly used to package large microprocessors. These packages connect to zeroinsertion-force (ZIF) sockets through an array of pins on the back surface, eliminatingthe need to clamp the package from the front or sides. This approach lends itself tocloser acking of the FPAs in the mosaic.
Figure 5 shows the package designed for the HAWAII-2 2048 x 2048 FPA. Thispackage provides a 46mm well for mounting the FPA and 128 electrical connectionsthat are routed to probe pads on the outer edges and also to the outer two rows of pinson the backside. The central pins in the pin grid array are dedicated to thermal contacts.Rockwell proposes to utilize these packages in the fabrication of initial NGST FPA’s.

2048 2048 HgCdTe Arrays for Astronomy 227
Figure 6. Conceptual design for a PGA package optimized for assemblyof a mosaic array.
The budget constraints of the current program require us to utilize existing toolingavailable from the package vendor to minimize cost and is therefore not fully optimizedfor assembly of a close packed mosaic array. The outer edges of the PGA packages are57 x 57 mm, resulting in a gap of approximately 20 mm between active areas. Thepackage could be optimized by shrinking the well and outer edges of the package to theminimum dimensions shown in Figure 6, allowing the dead space between arrays to bereduced to 7 mm (most of this gap would be occupied by wirebond pads on both themux and package). A single custom ZIF socket for all sixteen FPAs would allow exactpositioning of the arrays and provide denser packing of the arrays by eliminating thesome of the gap due to butting of the socket perimeters.
8. Production Approaches
8.1. MBE HgCdTe Capability at Rockwell Science Center
The science objectives of the NGST program require near-theoretical performance fromvery large arrays. This means that only a single array can be processed on each standard4 cm substrate. This requires detectors that are not only very high performance but arealso high yield so as to be produced in relatively large numbers. Rockwell is confidentthat these requirements can be met utilizing MBE technology.
The ability to fabricate MBE HgCdTe with a variety ofλc’s matched to the sciencerequirements is a key advantage of HgCdTE over fixed band-gap materials. An impor-tant attribute of Rockwell’s process is the ability to precisely control the band-gap forany run and to rapidly modify it from one run to another. This is illustrated in Figure 7which documents the growth of a series of LWIR, MWIR and SWIR layers which weregrown sequentially demanding the high composition control flexibility inherent to thistechnology.
Rockwell is currently using MBE processes to produce many arrays. These in-clude all LWIR FPA’s (λc up to 17.3µm), key MWIR deliverables for operation at

2048 2048 HgCdTe Arrays for Astronomy 228
Figure 7. An important attribute of Rockwell’s MBE growth technologyis the ability to rapidly modify the composition of the Hg1-x Cdx Te mate-rial. The figure illustrates this capability where a series of LWIR, MWIR andSWIR layers were grown sequentially.
elevated temperatures and all NIR (1.8 to 2.3µm) prototypes. The performance bene-fits of the DLPH MBE HgCdTe detector technology are illustrated by the dark currentdensity data shown in Figure 2 for recent devices withλc from 2.2 to 16µm. The MBEdark current is far superior to traditional PACE material and is in good agreement withthe theoretical limit for conventional (unthinned) p/n HgCdTe detectors.
9. Conclusion
In the next several years we expect to develop and evaluate visible and infrared 2048 x2048 hybrid focal plane arrays optimized for extremely low background astronomicalapplications. They will be specifically optimized for the Next Generation Space Tele-scope. However Rockwell intends to make these arrays available to the broad astro-nomical community. They offer major opportunities for large ground based telescopessuch as the VLT, particularly in spectroscopic applications.
10. Acknowledgements
The author wishes to acknowledge the substantial contributions of K. W. Hodapp and G.Luppino at the University of Hawaii Institute for Astronomy and K.Vural, J.T. Montroy

2048 2048 HgCdTe Arrays for Astronomy 229
and L. J. Kozlowski at Rockwell International Science Center to the planning of thisproject.

Author Index
Aloisi, A., 152Alonso-Herrero, A., 169Axon, D., 18
Balcells, M., 159Barg, I., 76, 144Baum, S.A., 195Beaulieu, S., 138Becklin, E.E., 94Bellemann, H., 10Bizenberger, P., 10Black, J.H., 116Bunker, A.J., 204Bushouse, H., 18, 82
Cheng, E.S., 210Cimatti, A., 187Clampin, M., 152Clements, D.L., 204Close, L., 121Cohen. M.H., 187Colina, L., 28, 36Corbin, M.R., 144
DeMarchi, G., 100di Serego Alighieri, S., 187Dunlop, J.S., 195
Elson, R.A.W., 138
Ferro, A., 74Fosbury, R.A.E., 187Freudling, W., 47, 54, 100
Geballe, T.R., 121Gilmore, G., 138Greggio, L., 152
Hall, D.N.B., 218Hewett, P.C., 204Hill , J., 203Hines, D.C., 62, 94Hofmann, R., 10Holfeltz, S., 36Hook, R.N., 70Hughes, D.H., 195
Johnson, R.A., 138
Kirkpatrick, J.D., 94Koerner, D., 94Kukula, M.J., 195Kulkarni, V., 203
Leitherer, C., 152Lenzen, R., 10Lindqvist, M., 116Low, F., 94Lowrance, P.J., 94Lytle, D., 74
MacKenty, J.W., 18, 210McCarthy, D., 94McCarthy, P., 178, 187McLeod, K.K., 203Meier, R., 94Miller, L., 195Moneti, A., 134Moorwood, A., 6
Nota, A., 152
O’Dea, C.P., 195Origlia, L., 152
Pasquali, A., 100Peletier, R.F., 159Pirzkal, N., 47, 54
Rayner, J., 121Rieke, G., 169, 203Rieke, M., 94, 131, 169Ritchie, C., 36
Santiago, B., 138Schild, H., 121Schmutz, W., 121Schneider, G., 86, 94Siebenmorgen, R., 108Sirianni, M., 152Skinner, C., 18Smith, B.A., 94Stobie, E., 18, 74, 144Stolovy, S.R., 70Storrie-Lombardi, L.J., 178, 203Storz, C., 10
230

Author Index 231
Tanvir, N.R., 138Terrile, R., 94Thompson, R., 94, 144Tosi, M., 152Tusche, A., 10
Vacca, W.D., 121Vernet, J., 187Villar-Martın, M., 187
Wagner, K., 10Walder, R., 121Warren, S.J., 204Weymann, R.J., 178, 203Williger, G.M., 204
Yan, L., 178
Zinnecker, H., 134Zuckerman, B., 94