probing the dust-enshrouded regions of the interacting galaxy system arp 299:a near-infrared study
TRANSCRIPT
THE ASTROPHYSICAL JOURNAL, 516 :704È715, 1999 May 101999. The American Astronomical Society. All rights reserved. Printed in U.S.A.(
PROBING THE DUST-ENSHROUDED REGIONS OF THE INTERACTING GALAXY SYSTEM ARP 299 :A NEAR-INFRARED STUDY
S. SATYAPAL,1 D. M. WATSON, W. J. FORREST, AND J. L. PIPHER
Department of Physics and Astronomy, University of Rochester, Rochester, NY 14627 ; satyapal=stars.gsfc.nasa.gov
J. FISCHER
Remote Sensing Division, Naval Research Laboratory, Code 7600, 4555 Overlook Avenue, Washington, DC 20375
M. A. GREENHOUSE
Goddard Space Flight Center, Code 685, Greenbelt, MD 20771
H. A. SMITH
Harvard-Smithsonian Center for Astrophysics, 60 Garden Street, Cambridge, MA 02138
AND
CHARLES E. WOODWARD2Department of Physics and Astronomy, University of Wyoming, Laramie, WY 82701-3905
Received 1998 June 16 ; accepted 1998 December 10
ABSTRACTWe present high spectral resolution (j/dj + 103) Pab(1.28 km) and Brc(2.17 km), 3.29 km dust feature,
and near-infrared broadband images of the Arp 299\NGC 3690/IC 694 galaxy system. The emission isfound to be concentrated at the positions of three active regions, known as sources A, B, and C. Fromour Brc/Pab Ñux ratio we Ðnd the visual extinction toward the ionized gas in A, B, and C is D6, 6, and2 magnitudes, respectively, assuming case B recombination and a foreground screen geometry for theobscuring material. Our observations can be explained entirely by a starburst model for the Arp 299system. The putative active galactic nucleus (AGN) in source A does not dominate the properties of thissource. We see no evidence of broad recombination lines. In addition, the ratio of the 3.29 km dustfeature to total luminosity, a tracer of starburst activity, is consistent in each source with that seen inM82 and other starburst galaxies. Also, our imaging observations reveal that the dust feature emission isconcentrated in the nucleus of source A, contrary to the extended annular distribution of the featureemission seen surrounding the nucleus of the more distant Seyfert galaxy NGC 7469. In this galaxy, theabsence of the feature emission in the nucleus has been attributed to the destruction of the dust carriersin the hard radiation Ðeld surrounding the AGN. Our observations suggest that all of the active regionsin Arp 299 are characterized by starburst episodes. The observed CO indices and Brc equivalent widthsimply that source B is older than source A and source C is the youngest star-forming region. Althoughthese regions are probably complex physical systems not necessarily characterized by a single coevalpopulation of stars, we have compared our observations with an instantaneous starburst model with aSalpeter initial mass function. Using this simple model, we Ðnd starburst ages of D6 ] 106, 8] 106, and4 ] 106 for sources A, B, and C, respectively.Subject headings : galaxies : individual (Arp 299) È galaxies : nuclei È infrared : galaxies È
infrared : ISM: lines and bands
1. INTRODUCTION
Infrared luminous galaxies are an important class ofextragalactic objects. In addition to being the dominantpopulation of extragalactic objects in the local universe atthe most extreme luminosities (L [ 1012 Sanders &L
_;
Mirabel 1996), infrared luminous galaxies appear to belinked to a number of scientiÐc research areas of fundamen-tal importance, including globular cluster formation, theformation of elliptical galaxies, and the formation ofquasars. Also, since infrared bright galaxies are thought tobe local analogs of protogalaxies (Stark 1997), a detailedunderstanding of these objects will provide important infor-mation for future high-z studies and galaxy formationmodels.
1 Current address : Goddard Space Flight Center, Code 685, Greenbelt,MD 20771.
2 NSF Presendential Faculty Fellow.
An order of magnitude more luminous than the prototy-pical starburst galaxy M82 and half as luminous as thegalaxy Arp 220, Arp 299 bridges the gap between nearbywell-studied starburst galaxies and the more enigmaticultraluminous galaxies. Study of this system therefore pro-vides us with the unique opportunity to investigate the dif-ferences and possible connections between local starburstsand higher luminosity systems. With a far-infrared lumi-nosity of 5.2 ] 1011 (Soifer et al. 1987), Arp 299 consistsL
_of the two galaxies NGC 3690 and IC 694. An interactionbetween two gas-rich spiral galaxies is suggested by thevisible knots and Ðlaments observed in the system (de Vau-couleurs & de Vaucouleurs 1967). However, the lack oflarge-scale tails, which are often associated with evolvedinteracting galaxy systems (see, e.g., Toomre & Toomre1972), suggests that Arp 299 is a young interacting system(Bushouse & Gallagher 1984). The measured radial velocityof 3159 km s~1 (Sanders & Mirabel 1985) corresponds to a
704
ARP 299 705
distance of 42 Mpc for a Hubble constant of 75 km s~1Mpc~1. CO observations show that the system contains alarge mass of molecular hydrogen (D3 ] 109 M
_,
assuming a Galactic molecular gas conversion factor ;Sargent et al. 1987). Gehrz, Sramek, & Weedman (1983,hereafter GSW) found strong 10 km, radio, and Ha emis-sion from Arp 299, which suggests the presence of severalsites of vigorous star formation activity.
In this article, we carry out a detailed near-infrared studyof Arp 299. High spatial resolution spectroscopic andbroadband observations are used to constrain and comparethe starburst properties in each of the active regions in thissystem.
2. OBSERVATIONS AND DATA REDUCTION
2.1. Near-Infrared Broadband ImagesBroadband observations of Arp 299 were made with the
University of RochesterÏs 58] 62 InSb infrared arraycamera at the Mount Lemmon Observing Facility (MLOF)60 inch (1.5 m) telescope. Observations at J(1.23 km), H(1.65km), and K(2.23 km) were carried out in 1992 January. Allimages were linearized, background-subtracted, divided bymorning sky Ñats at the same wavelength, spatially regis-tered and aligned using a cross correlation procedure, andco-added. Flux calibration was achieved using the standardstar HD 7721 (Elias et al. 1982). The estimated uncertaintyin these broadband measurements is 15%. The Ðnal imagesat each wavelength have a plate scale of 0.089 pixel~1.
2.2. 3.3 Micron Narrowband Images of Arp 299Narrowband 3.3 km imaging of Arp 299 was carried out
in 1995 June at the Wyoming Infrared Observatory(WIRO) 2.34 m telescope with the University of RochesterThird Generation Array Camera and a 1.85% bandwidthCVF (equivalent width resulting from the convolution ofthe Gaussian CVF proÐle with 0.8% resolution and a circu-lar Lyot-stop proÐle). Images with 1 s integration times and128 co-adds were taken at 3.158 and 3.326 km (redshiftedline-center). The data set consisted of 16 on-line images and16 continuum frames. On-chip nodding was carried out inall observations to double our efficiency. The spatialresolution of our data was All images were linearized,1A.2.background-subtracted, and divided by sky Ñat Ðelds at thesame wavelength. The standard star p Cyg was(m
K\ 3.795)
used for calibration. Spatial registration and co-additionwas carried out using the same methods that were appliedto the broadband data. Since the instrumental width iscomparable to the width of the 3.29 km dust, feature, thefeature Ñux was calculated by assuming that the 3.29 kmfeature proÐle in Arp 299 is the same as that obtained forthe inner of M82 from Tokunaga et al. (1991). Assuming2A.6an equivalent width for the feature of 0.05 km, and usingour instrumental equivalent width of 0.065 km, the 3.158km continuum image was subtracted from the line centerimage and the result was multiplied by the equivalent widthcorresponding to the convolution of the instrumental anddust feature widths (0.082 km).
2.3. Arp 299 Recombination-L ine ImagesHydrogen recombination-line observations of Arp 299
were made at WIRO with the University of RochesterThird Generation Array Camera and the NASM/NRLFabry-Perot interferometer (FPI) systems (see Satyapal et
al. 1995 ; Greenhouse et al. 1997). Images at a total of sevendi†erent FPI cavity positions (z), at 100 s integration timeper image, centered on the redshifted Pab line (v\ 3159 kms~1) were obtained on 1994 May 11. The on-line pointspacing was 1/3 and the o†-line continuum(dj)FWHM,images were at from line center. Four such^5(dj)FWHMdata sets were recorded. The Brc observations wereobtained on 1994 May 16. This data set consisted of imagesat nine di†erent z positions, again with on-line pointspacing of 1/3 and o†-line point spacing of(dj)FWHMTwo such data sets were obtained. Early^5(dzj)FWHM.morning sky frames at each of the wavelengths were againused as Ñat Ðelds. The images were calibrated using thestandard star BS 4550 (G8 V; Alignment andm
K\ 4.385).
spatial registration of the images was again accomplishedusing the same cross-correlation procedure. Wavelengthcalibration was obtained by observing argon and kryptonlamp lines closely bracketing the hydrogen recombinationlines. Finally, nonlinear Ðtting to an Airy function and cor-rection for the dispersion in the peak wavelength of trans-mission across the array (see Cole 1996 ; Greenhouse et al.1997) allowed us to extract images of the total line Ñux,observed line wavelengths, line widths, and the continuumÑux density.
3. RESULTS
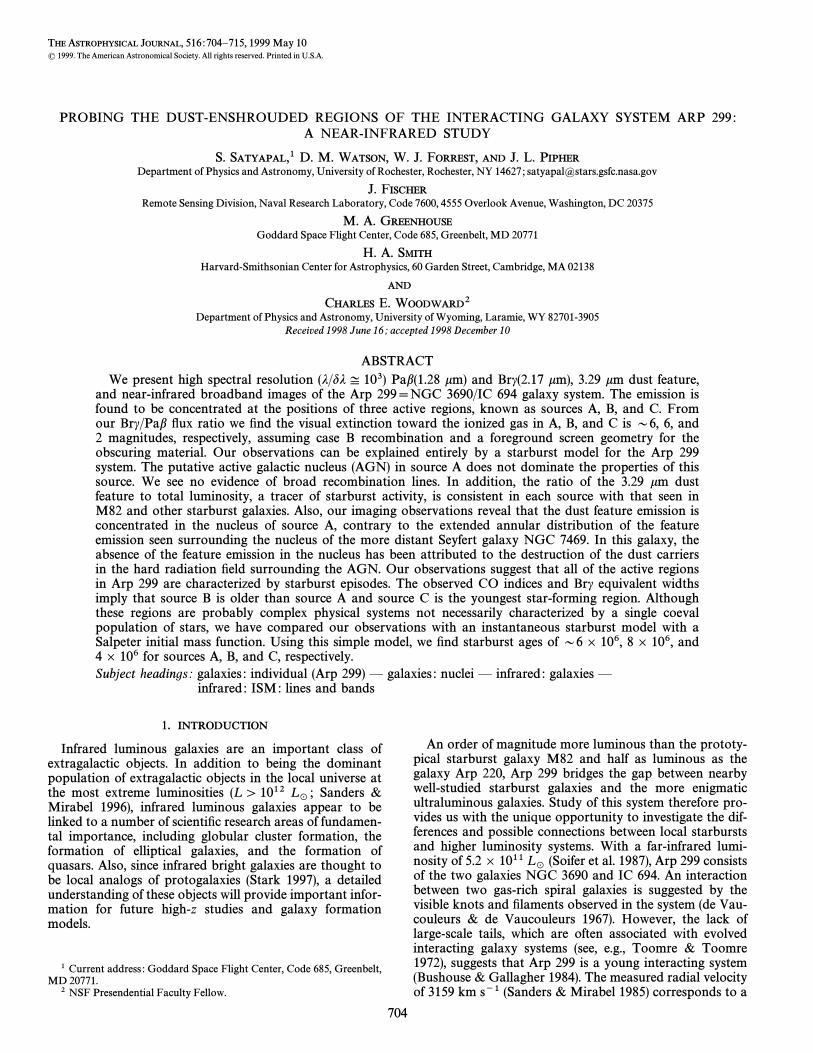
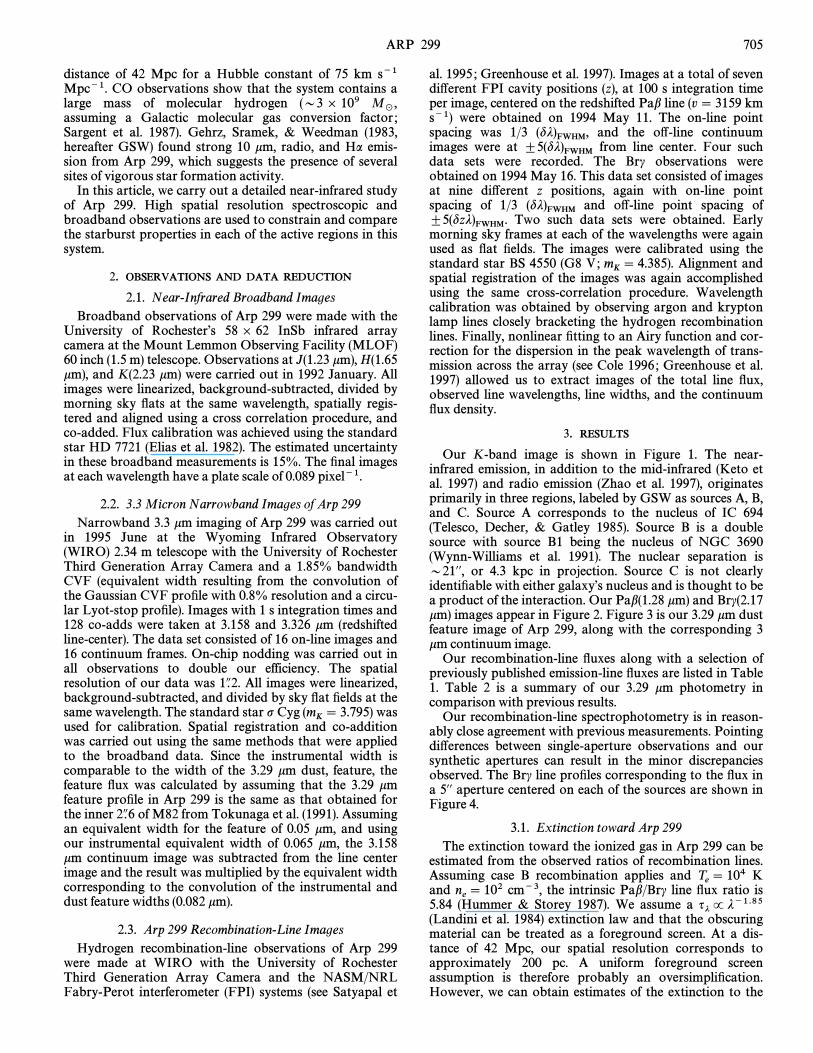
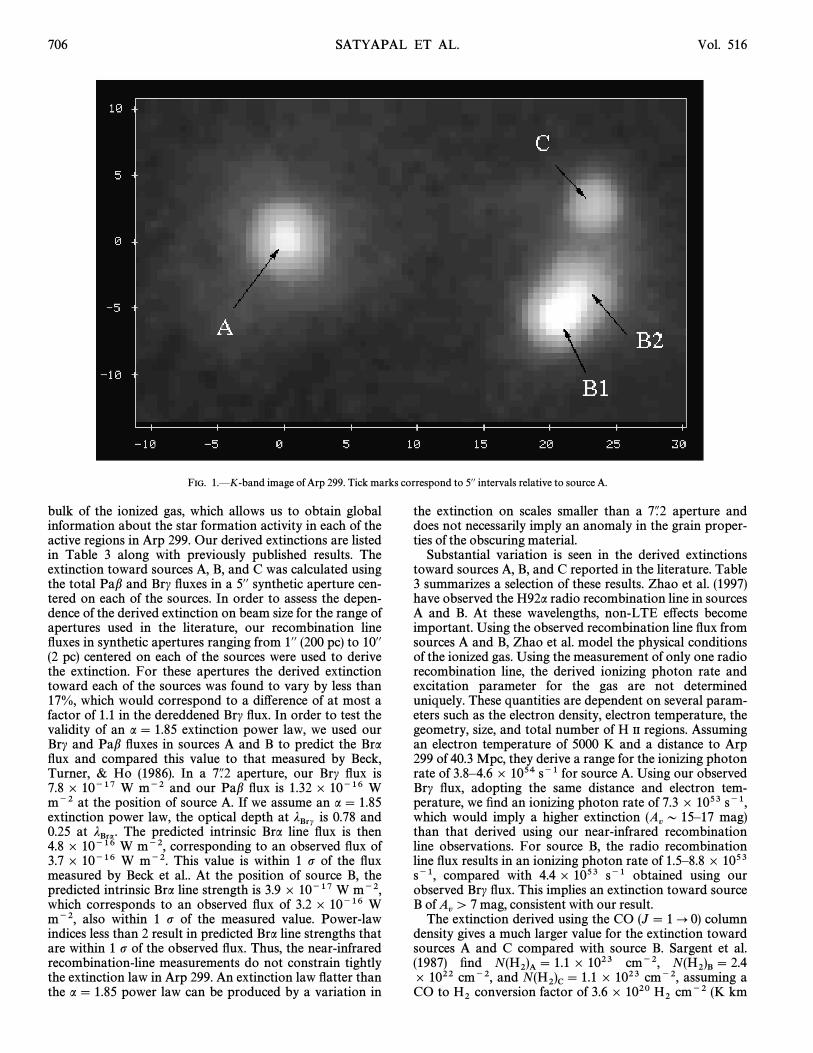
Our K-band image is shown in Figure 1. The near-infrared emission, in addition to the mid-infrared (Keto etal. 1997) and radio emission (Zhao et al. 1997), originatesprimarily in three regions, labeled by GSW as sources A, B,and C. Source A corresponds to the nucleus of IC 694(Telesco, Decher, & Gatley 1985). Source B is a doublesource with source B1 being the nucleus of NGC 3690(Wynn-Williams et al. 1991). The nuclear separation isD21@@, or 4.3 kpc in projection. Source C is not clearlyidentiÐable with either galaxyÏs nucleus and is thought to bea product of the interaction. Our Pab(1.28 km) and Brc(2.17km) images appear in Figure 2. Figure 3 is our 3.29 km dustfeature image of Arp 299, along with the corresponding 3km continuum image.
Our recombination-line Ñuxes along with a selection ofpreviously published emission-line Ñuxes are listed in Table1. Table 2 is a summary of our 3.29 km photometry incomparison with previous results.
Our recombination-line spectrophotometry is in reason-ably close agreement with previous measurements. Pointingdi†erences between single-aperture observations and oursynthetic apertures can result in the minor discrepanciesobserved. The Brc line proÐles corresponding to the Ñux ina 5@@ aperture centered on each of the sources are shown inFigure 4.
3.1. Extinction toward Arp 299The extinction toward the ionized gas in Arp 299 can be
estimated from the observed ratios of recombination lines.Assuming case B recombination applies and KT
e\ 104
and cm~3, the intrinsic Pab/Brc line Ñux ratio isne\ 102
5.84 (Hummer & Storey 1987). We assume a qj P j~1.85(Landini et al. 1984) extinction law and that the obscuringmaterial can be treated as a foreground screen. At a dis-tance of 42 Mpc, our spatial resolution corresponds toapproximately 200 pc. A uniform foreground screenassumption is therefore probably an oversimpliÐcation.However, we can obtain estimates of the extinction to the
706 SATYAPAL ET AL. Vol. 516
FIG. 1.ÈK-band image of Arp 299. Tick marks correspond to 5@@ intervals relative to source A.
bulk of the ionized gas, which allows us to obtain globalinformation about the star formation activity in each of theactive regions in Arp 299. Our derived extinctions are listedin Table 3 along with previously published results. Theextinction toward sources A, B, and C was calculated usingthe total Pab and Brc Ñuxes in a 5@@ synthetic aperture cen-tered on each of the sources. In order to assess the depen-dence of the derived extinction on beam size for the range ofapertures used in the literature, our recombination lineÑuxes in synthetic apertures ranging from 1@@ (200 pc) to 10@@(2 pc) centered on each of the sources were used to derivethe extinction. For these apertures the derived extinctiontoward each of the sources was found to vary by less than17%, which would correspond to a di†erence of at most afactor of 1.1 in the dereddened Brc Ñux. In order to test thevalidity of an a \ 1.85 extinction power law, we used ourBrc and Pab Ñuxes in sources A and B to predict the BraÑux and compared this value to that measured by Beck,Turner, & Ho (1986). In a aperture, our Brc Ñux is7A.27.8] 10~17 W m~2 and our Pab Ñux is 1.32] 10~16 Wm~2 at the position of source A. If we assume an a \ 1.85extinction power law, the optical depth at is 0.78 andjBrc0.25 at The predicted intrinsic Bra line Ñux is thenjBra.4.8] 10~16 W m~2, corresponding to an observed Ñux of3.7] 10~16 W m~2. This value is within 1 p of the Ñuxmeasured by Beck et al.. At the position of source B, thepredicted intrinsic Bra line strength is 3.9 ] 10~17 W m~2,which corresponds to an observed Ñux of 3.2 ] 10~16 Wm~2, also within 1 p of the measured value. Power-lawindices less than 2 result in predicted Bra line strengths thatare within 1 p of the observed Ñux. Thus, the near-infraredrecombination-line measurements do not constrain tightlythe extinction law in Arp 299. An extinction law Ñatter thanthe a \ 1.85 power law can be produced by a variation in
the extinction on scales smaller than a aperture and7A.2does not necessarily imply an anomaly in the grain proper-ties of the obscuring material.
Substantial variation is seen in the derived extinctionstoward sources A, B, and C reported in the literature. Table3 summarizes a selection of these results. Zhao et al. (1997)have observed the H92a radio recombination line in sourcesA and B. At these wavelengths, non-LTE e†ects becomeimportant. Using the observed recombination line Ñux fromsources A and B, Zhao et al. model the physical conditionsof the ionized gas. Using the measurement of only one radiorecombination line, the derived ionizing photon rate andexcitation parameter for the gas are not determineduniquely. These quantities are dependent on several param-eters such as the electron density, electron temperature, thegeometry, size, and total number of H II regions. Assumingan electron temperature of 5000 K and a distance to Arp299 of 40.3 Mpc, they derive a range for the ionizing photonrate of 3.8È4.6] 1054 s~1 for source A. Using our observedBrc Ñux, adopting the same distance and electron tem-perature, we Ðnd an ionizing photon rate of 7.3 ] 1053 s~1,which would imply a higher extinction mag)(A
vD 15È17
than that derived using our near-infrared recombinationline observations. For source B, the radio recombinationline Ñux results in an ionizing photon rate of 1.5È8.8] 1053s~1, compared with 4.4] 1053 s~1 obtained using ourobserved Brc Ñux. This implies an extinction toward sourceB of mag, consistent with our result.A
v[ 7
The extinction derived using the CO (J \ 1 ] 0) columndensity gives a much larger value for the extinction towardsources A and C compared with source B. Sargent et al.(1987) Ðnd cm~2,N(H2)A \ 1.1] 1023 N(H2)B\ 2.4] 1022 cm~2, and cm~2, assuming aN(H2)C\ 1.1 ] 1023CO to conversion factor of 3.6] 1020 cm~2 (K kmH2 H2
No. 2, 1999 ARP 299 707
FIG. 2.ÈHydrogen recombination-line images of Arp 299. T op : Brcimage contoured from 2 ] 10~18 to 4 ] 10~18 W M~2 arcsec~2 in inter-vals of 5 ] 10~19 W m~2 arcsec~2. Bottom : Pab image contoured from5 ] 10~18 to 2 ] 10~17 W m~2 arcsec~2 in intervals of 2 ] 10~18 W m~2arcsec~2.
s~1)~1. For N(H andI)\ 2N(H2) N(H)/AK
\ 1.89] 1022cm~2 (Draine 1989), Uncer-A
VA\ 58, A
VB\ 13, A
VC\ 58.
tainties in the column density ratio, the CO lineCO/H2optical depth, the gas to dust ratio, and the fraction of COcolumn density that is in front of the ionized gas in sourcesA, B, and C, makes comparisons between these values andthose obtained using the recombination-line measurementsquestionable. Shier, Rieke, & Rieke (1994) have used obser-vations of the 2.3 km absorption bands of CO to derive adynamical mass within the central region of IC 694 (sourceA). This mass is 4È10 times less than the mass deter-H2mined from the observed CO (J \ 1È0) Ñuxes and the stan-dard molecular gas conversion factor, which would reducethe estimates of the extinction derived from the CO columndensity. If the molecular gas conversion factor is the same inall three sources, and the gas to dust ratio is also the same, alarge fraction of molecular material is behind the ionizedgas in sources A and C, in contrast to B, for a simple screenmodel.
Nakagawa et al. (1989) measured the S(1) andH2 l\ 1È0l\ 1È0 Q(3) lines in a 5@@ aperture centered on source A.Since these lines arise from the same upper state, their ratiois independent of temperature and density and can thus beused to determine the extinction. The intrinsic ratio is 0.7and the observed ratio is 0.5 in source A, indicating A
v\
8.5 mag, consistent with our result.
3.2. T he 3.29 Micron Dust Feature Emission in Arp 299
As can be seen in Figure 3, the 3.29 km dust featureemission is detected in sources A, B1, and C. The 3.29 kmfeature emission has been found to be well correlated withthe FIR luminosity in a number of starburst galaxies (e.g.,Dennefeld & Desert 1990 ; Mouri et al. 1990). We havecalculated the 3.29 km feature to total FIR luminosity ratioin each of the sources in Arp 299 and compared them withthe value in M82 (Satyapal et al. 1995) ; the results appear inTable 4. The far-infrared luminosities of the sources wereestimated using the far-infrared luminosity of 5.2 ] 1011 L
_measured by IRAS (Soifer et al. 1987) and the higher spatialresolution 50 and 100 km observations by Joy et al. (1989),which showed that 60% of the total FIR luminosity fromArp 299 comes from source A.
The extinction-corrected dust feature Ñux values werecalculated as follows. The uncorrected Ñux in a 5@@ aperturecentered on source A was subtracted from the total uncor-rected Ñux in a 20@@ aperture centered on this source. Theresulting Ñux was then added to the extinction-corrected 5@@Ñux, using the extinction derived from the recombination-line data. This was taken to represent the total, extinction-corrected Ñux from source A. It should be noted that this isprobably a lower limit to the total feature Ñux since we havenot applied an extinction correction to the low-level, di†use3.29 km feature emission outside the region probed by therecombination-line data. A similar procedure was appliedto the Ñuxes from sources B and C; in this case, the 3.29 kmÑux from each source was dereddened separately, using theextinction corresponding to each source. As can be seen inTable 4, the extinction-corrected FIR to 3.29 km luminosityratio is somewhat higher in Arp 299 than in M82, althoughit should be pointed out that this ratio is less accurate inArp 299, where the assumptions used to correct for extinc-tion are less reliable. It is interesting to note that the 3.29km dust feature emission appears to be a better indicator ofthe FIR luminosity in the Arp 299 system than is the hydro-gen recombination-line emission. The extinction-correctedFIR to Brc luminosity ratio is 7.0 ] 104 in source A and2.6] 104 in sources B and C combined. Since the dustfeature carriers can be excited by ionizing and lower energyphotons while the Brc emission requires ionizing photons,this feature is not as sensitive to the radiation Ðeld of thestarburst and is thus a better indicator of the FIR lumi-nosity.
As can be seen from Table 4, the 3.29 km feature to totalFIR luminosity ratio in Arp 299 is comparable to that seenin the prototypical starburst, M82, which suggests that anAGN does not dominate the properties of any of the activeregions. Furthermore, the centrally condensed 3.29 kmfeature emission observed from each source is also contraryto the existence of a prominent AGN in Arp 299. TheSeyfert galaxy NGC 7469, known to possess circumnuclearstar formation activity and an AGN, shows an extendedannular region of 3.29 km (Mazzarella et al. 1994 ; Nelson etal. 1999) and 11.3 km (Miles, Houck, & Hayward 1994) dustfeature emission around the nucleus. In this galaxy, theabsence of the feature emission in the nucleus has beenattributed to the destruction of the dust carriers in the hardradiation Ðeld surrounding the AGN. The annulus of 3.29km dust feature emission in NGC 7469 has an inner radiusof 2@@ east-west by D1@@ north-south, and an outer radius of
north-south by east-west (Nelson et al.). If Arp 2993A.7 4A.6
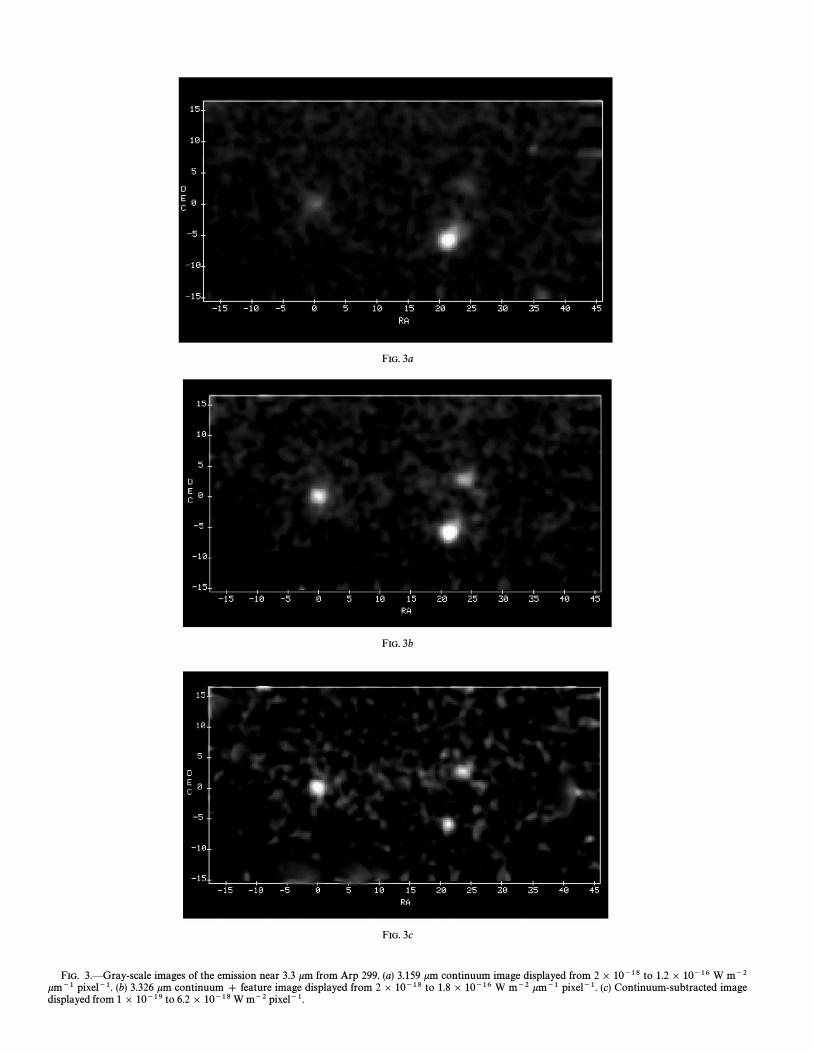
FIG. 3a
FIG. 3b
FIG. 3c
FIG. 3.ÈGray-scale images of the emission near 3.3 km from Arp 299. (a) 3.159 km continuum image displayed from 2 ] 10~18 to 1.2] 10~16 W m~2km~1 pixel~1. (b) 3.326 km continuum ] feature image displayed from 2 ] 10~18 to 1.8 ] 10~16 W m~2 km~1 pixel~1. (c) Continuum-subtracted imagedisplayed from 1] 10~19 to 6.2 ] 10~18 W m~2 pixel~1.
ARP 299 709
TABLE 1
SELECTION OF EMISSION-LINE MEASUREMENTS IN ARP 299
j Aperture Observed FluxaLine (km) Diameter (arcsec) Position (10~17 W m~2) Reference
Hb . . . . . . 0.486 3.6 A \7 1B 7.9 1C 22 1
Ha . . . . . . . 0.656 3.6 A \20 1B 50 1C 120 1
Pab . . . . . . 1.282 7.2 A 13.2 2B 17.4 2
5 A 11.7 25 B 8.6 25 C 21.4 2
Brc . . . . . . 2.167 7.2 A 6.1^ 1.6 3B \4.6 3A 7.8 2B 7.6 2
5.5] 5.5 A 4.1^ 0.7 45.5] 7.0 B 3.2^ 0.4 44.7] 4.7 C 4.1^ 0.4 4
5 A 5.02 25 B 4.03 25 C 4.77 22.7 A 1.9 ^ 0.7 5
B \1.7 5C 4.1 ^ 1.2 5
2.7 A 3.42 2B 2.01 2C 2.97 2
Bra . . . . . . 4.051 7.2 A 48^ 11 3B 40^ 11 3
a We estimate a 20% uncertainty in our spectrophotometry.REFERENCES.È(1) GSW; (2) this work ; (3) Beck et al. 1986 ; (4) Fischer et al. 1990 ; (5)
Nakagawa et al. 1989.
contains an AGN comparable to the one in the moredistant galaxy NGC 7469 (d D 65 Mpc), a similar annuluswould have been revealed by our D1@@ spatial resolutionobservations.
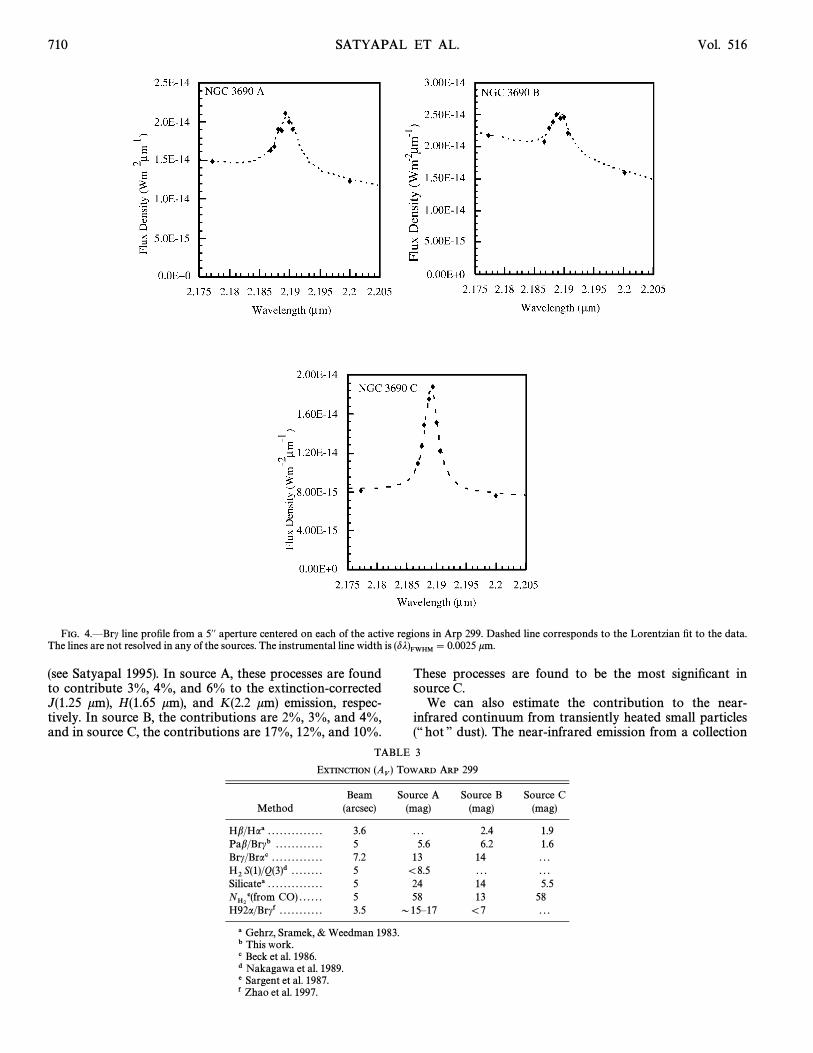
3.3. Near-Infrared Broadband EmissionThe observed near-infrared colors of the three sources are
quite di†erent from one another, as can be seen in Figure 5.We have plotted the observed colors obtained from thetotal near-infrared Ñuxes in 5@@ apertures centered on eachsource. Also plotted are the colors of normal stars
(Koornneef 1983) and the reddening vector indicating thee†ect of foreground extinction. Applying the extinctionderived from the recombination-line measurements to thenear-infrared emission is probably an oversimpliÐcation ;the extinction toward the ionized gas is not necessarilyapplicable to the near-infrared broadband emission in Arp299. Also, the foreground screen assumption is also notnecessarily realistic in this case. All three sources havecolors that deviate substantially from the colors of normalstars. We have also calculated the contribution to the near-infrared continuum from free-free and free-bound processes
TABLE 2
PHOTOMETRY FOR THE 3.291 MICRON FEATURE IN ARP 299
Aperturea S3.159 F3.326Author (arcsec) Position [W m~2 km~1 (]10~15)]b [W m~2 (]10~16)]
Dennefeld & Desert 1990 . . . . . . . . . . . . . . 2.7 A 5 5.0^ 0.9Mizutani, Suto, & Maihara 1994 . . . . . . 5.4 ] 7.3 A 8 5.8^ 1.6
B 20 7.4^ 1.5C 7 4.3^ 1.5
This workc . . . . . . . . . . . . . . . . . . . . . . . . . . . . . . . 2.7 A 2.50 3.237.1 A 7.05 8.537.1 B 18.7 2.697.1 C 4.37 6.33
a Our photometry was done with circular apertures with speciÐed diameter.b The continuum level was estimated from the information provided in the indicated reference.c We estimate a 15% error in our photometry.
710 SATYAPAL ET AL. Vol. 516
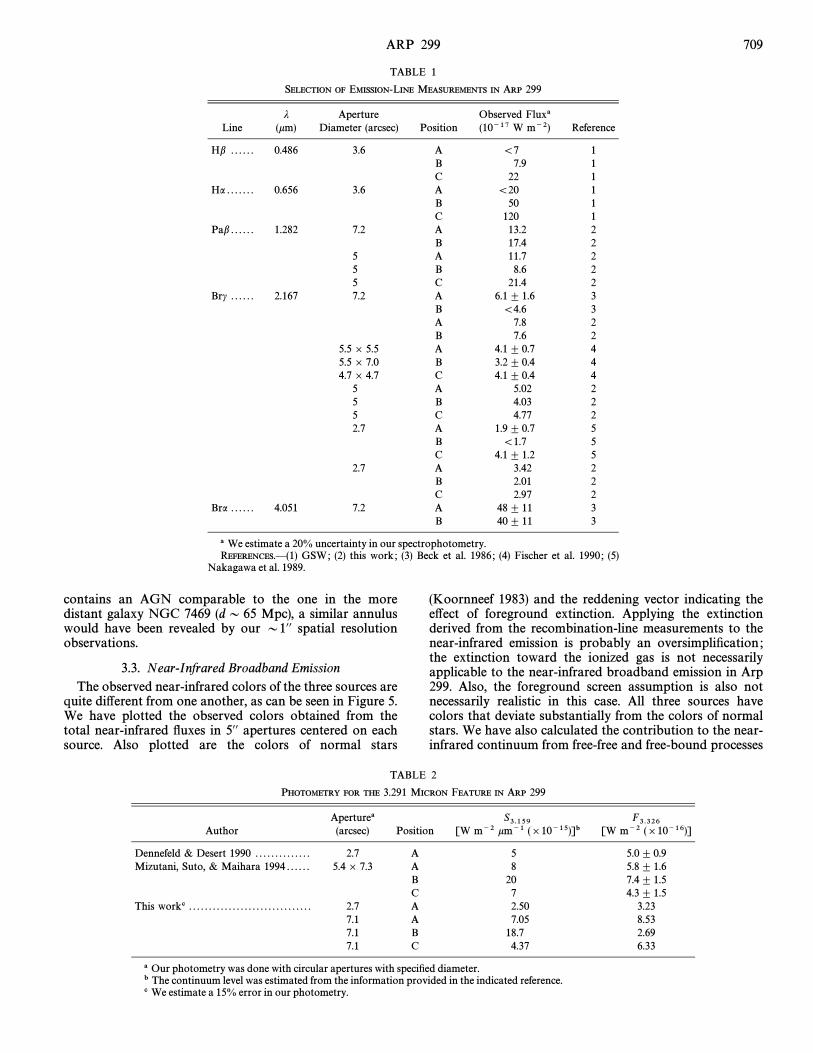
FIG. 4.ÈBrc line proÐle from a 5@@ aperture centered on each of the active regions in Arp 299. Dashed line corresponds to the Lorentzian Ðt to the data.The lines are not resolved in any of the sources. The instrumental line width is km.(dj)FWHM \ 0.0025
(see Satyapal 1995). In source A, these processes are foundto contribute 3%, 4%, and 6% to the extinction-correctedJ(1.25 km), H(1.65 km), and K(2.2 km) emission, respec-tively. In source B, the contributions are 2%, 3%, and 4%,and in source C, the contributions are 17%, 12%, and 10%.
These processes are found to be the most signiÐcant insource C.
We can also estimate the contribution to the near-infrared continuum from transiently heated small particles(““ hot ÏÏ dust). The near-infrared emission from a collection
TABLE 3
EXTINCTION TOWARD ARP 299(AV)
Beam Source A Source B Source CMethod (arcsec) (mag) (mag) (mag)
Hb/Haa . . . . . . . . . . . . . . 3.6 . . . 2.4 1.9Pab/Brcb . . . . . . . . . . . . 5 5.6 6.2 1.6Brc/Brac . . . . . . . . . . . . . 7.2 13 14 . . .H2 S(1)/Q(3)d . . . . . . . . 5 \8.5 . . . . . .Silicatea . . . . . . . . . . . . . . 5 24 14 5.5NH2
e(from CO) . . . . . . 5 58 13 58H92a/Brcf . . . . . . . . . . . 3.5 D15È17 \7 . . .
a Gehrz, Sramek, & Weedman 1983.b This work.c Beck et al. 1986.d Nakagawa et al. 1989.e Sargent et al. 1987.f Zhao et al. 1997.
No. 2, 1999 ARP 299 711
TABLE 4
THE 3.29 MICRON DUST FEATURE EMISSION AND THE FIR EMISSION IN ARP 299 :COMPARISON WITH M82
M82Source (30@@ aperture centered on
Luminosity Position A Position B ] C nucleus)
L FIR(1011 L_
) . . . . . . 3.3 1.9 0.44L 3.3(108 L
_) . . . . . . . 1.01 1.15 0.26
L 3.3corr(108 L_
) . . . . . . 1.80 1.23 0.33L FIR/L 3.3 . . . . . . . . . . . 3280 1650 1690(L FIR/L 3.3)corr . . . . . . 1840 1550 1340(L FIR/L Brc)corr . . . . . . 7.0] 104 2.6] 104 1.38] 104
of small particles transiently heated by the absorption ofultraviolet and visible photons resembles that of a graybodywith color temperature 1000 K (see, e.g., Sellgren, Werner,& Dinerstein 1983). Sellgren et al. have shown that the3.29 km line to continuum ratio is roughly constant (D6) atseveral locations in a number of reÑection nebulae. Usingthe extinction-corrected 3.29 km feature Ñuxes in a 5@@ aper-ture centered on sources A, B, and C (FA3.3corr \ 8.38] 10~16W m~2 ; W m~2 ;FB3.3corr \ 4.85 ] 10~16 FC3.3corr \ 5.68] 10~16 W m~2), and assuming a feature to continuumratio of D6, the extinction-corrected emission due to hotdust at 3.3 km can be obtained W(FA3.3dustcorr \ 1.64] 10~15m~2 ; W m~2 ;FB3.3dustcorr \ 9.62] 10~16 FC3.3dustcorr \ 1.13] 10~15 W m~2). Assuming that the hot dust continuumcan be approximated by a 1000 K graybody, the extinction-corrected J, H, and K Ñux densities can be obtained. Hotdust emission is found to contribute 0%, 2%, and 7% to theextinction-corrected J, H, and K emission, respectively, insource A. In source B, the contributions are 0%, 1%, and3%, and in source C, the contributions are 1%, 6%, and12%. It should be pointed out that the feature to continuumratio used may not be applicable in Arp 299 ; therefore,these estimates for the hot dust emission should be viewedwith some caution.
FIG. 5.ÈTwo-color diagram for the Arp 299 system. The colors ofdwarf, giant, and supergiant stars are plotted with the symbols indicatedon the Ðgure. Filled symbols represent the colors of sources A, B, and C,and the corresponding open symbols represent the positions after anextinction correction has been applied and the nebular continuum sub-tracted. The nebular continuum is the estimated free-free, free-bound, and““ hot ÏÏ dust emission from each source. The length of the reddening vectorcorresponds to A
V\ 2.
The positions of the compact sources in Arp 299 on atwo-color diagram (Fig. 5) are signiÐcantly di†erent fromthose of normal stars. Sources A and B have foreground-extinction-corrected colors similar to those of the pointlikesources in M82 (Satyapal et al. 1997). These colors caneasily be moved to the positions of normal stars with aslight change in the assumed dust geometry (see Satyapal etal. 1997). Source C, however, has a very unusual color thatcannot be ascribed to extinction from any assumed dustgeometry. There is a possible detection of Wolf-Rayet fea-tures in a broad emission band near 4660 from this sourceA�but not from sources A and B (Armus, Heckman, & Miley1989). Wolf-Rayet stars in our Galaxy are observed to havecolors very similar to those of source C (Williams, Van derHucht, & The 1987), which suggests that the colors ofsource C can be understood as the combined e†ects of apopulation of Wolf-Rayet stars, normal stars, and dustemission. We have not estimated the contribution to thenear-infrared continuum from warm dust emission. If the 12km emission provides some indication of the warm dustcomponent, comparing the 12 km to K Ñux ratio mayprovide some indication of the relative importance of warmdust emission to the near-infrared colors in sources A, B,and C. This ratio is D25, 30, and 18 in sources A, B, and C,respectively (inferred using the 4@@ 12.5 km observationsfrom Keto et al. 1997). Assuming that the 12 km emissiondoes correlate with the warm dust emission, it would appearthat the unusual colors of source C cannot be explained bythe thermal emission from warm dust alone.
3.4. Comparisons between Each of the Compact SourcesEach of the compact sources in Arp 299 exhibits signiÐ-
cantly di†erent observed properties, as can be seen in Table5. The spatial distribution and temperature of the dustappear to be peculiar in Arp 299. As previously mentioned,source A has the largest FIR luminosity even though theBrackett line Ñuxes (and extinction) are comparable insources A and B. Source A also has the highest 3.29 km dustfeature Ñux. The 10 km Ñux density from B, on the otherhand, is a factor of 2 larger than that from A (GSW).Finally, the relative positions of each of the sources on atwo-color diagram (Fig. 5) is suggestive of an increase in thecontribution of near-infrared dust emission in source Bcompared with A and in source C compared with B.
Ridgway, Wynn-Williams, & Becklin (1994) have mea-sured the CO *l\ 2 bandhead strength in sources A, B,and C. Each of the sources is found to have substantiallydi†erent absorption depths. The 2.3 km CO absorptionfeature, observed from the atmospheres of late-type stars, is
712 SATYAPAL ET AL. Vol. 516
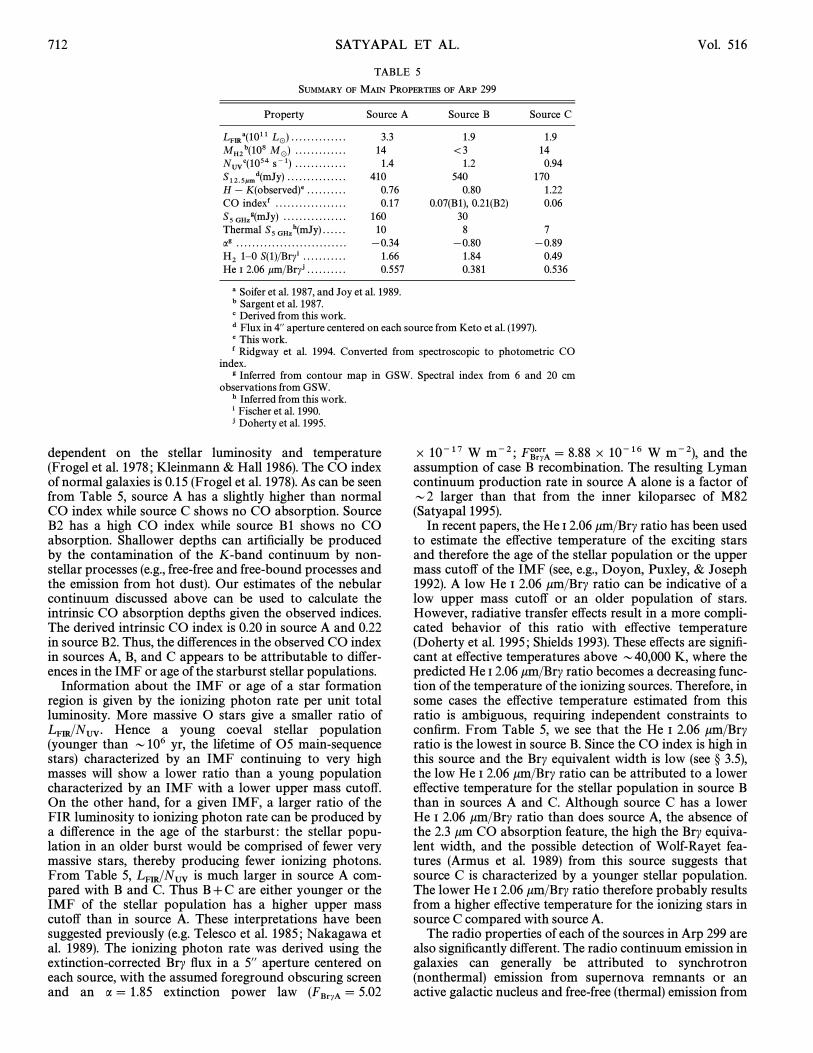
TABLE 5
SUMMARY OF MAIN PROPERTIES OF ARP 299
Property Source A Source B Source C
L FIRa(1011 L_
) . . . . . . . . . . . . . . 3.3 1.9 1.9MH2b(108 M
_) . . . . . . . . . . . . . 14 \3 14
NUVc(1054 s~1) . . . . . . . . . . . . . 1.4 1.2 0.94S12.5kmd(mJy) . . . . . . . . . . . . . . . 410 540 170H [ K(observed)e . . . . . . . . . . 0.76 0.80 1.22CO indexf . . . . . . . . . . . . . . . . . . 0.17 0.07(B1), 0.21(B2) 0.06S5 GHzg(mJy) . . . . . . . . . . . . . . . . 160 30Thermal S5 GHzh(mJy) . . . . . . 10 8 7ag . . . . . . . . . . . . . . . . . . . . . . . . . . . . [0.34 [0.80 [0.89H2 1È0 S(1)/Brci . . . . . . . . . . . 1.66 1.84 0.49He I 2.06 km/Brcj . . . . . . . . . . 0.557 0.381 0.536
a Soifer et al. 1987, and Joy et al. 1989.b Sargent et al. 1987.c Derived from this work.d Flux in 4@@ aperture centered on each source from Keto et al. (1997).e This work.f Ridgway et al. 1994. Converted from spectroscopic to photometric CO
index.g Inferred from contour map in GSW. Spectral index from 6 and 20 cm
observations from GSW.h Inferred from this work.i Fischer et al. 1990.j Doherty et al. 1995.
dependent on the stellar luminosity and temperature(Frogel et al. 1978 ; Kleinmann & Hall 1986). The CO indexof normal galaxies is 0.15 (Frogel et al. 1978). As can be seenfrom Table 5, source A has a slightly higher than normalCO index while source C shows no CO absorption. SourceB2 has a high CO index while source B1 shows no COabsorption. Shallower depths can artiÐcially be producedby the contamination of the K-band continuum by non-stellar processes (e.g., free-free and free-bound processes andthe emission from hot dust). Our estimates of the nebularcontinuum discussed above can be used to calculate theintrinsic CO absorption depths given the observed indices.The derived intrinsic CO index is 0.20 in source A and 0.22in source B2. Thus, the di†erences in the observed CO indexin sources A, B, and C appears to be attributable to di†er-ences in the IMF or age of the starburst stellar populations.
Information about the IMF or age of a star formationregion is given by the ionizing photon rate per unit totalluminosity. More massive O stars give a smaller ratio of
Hence a young coeval stellar populationL FIR/NUV.(younger than D106 yr, the lifetime of O5 main-sequencestars) characterized by an IMF continuing to very highmasses will show a lower ratio than a young populationcharacterized by an IMF with a lower upper mass cuto†.On the other hand, for a given IMF, a larger ratio of theFIR luminosity to ionizing photon rate can be produced bya di†erence in the age of the starburst : the stellar popu-lation in an older burst would be comprised of fewer verymassive stars, thereby producing fewer ionizing photons.From Table 5, is much larger in source A com-L FIR/NUVpared with B and C. Thus B]C are either younger or theIMF of the stellar population has a higher upper masscuto† than in source A. These interpretations have beensuggested previously (e.g. Telesco et al. 1985 ; Nakagawa etal. 1989). The ionizing photon rate was derived using theextinction-corrected Brc Ñux in a 5@@ aperture centered oneach source, with the assumed foreground obscuring screenand an a \ 1.85 extinction power law (FBrcA\ 5.02
] 10~17 W m~2 ; W m~2), and theFBrcAcorr \ 8.88] 10~16assumption of case B recombination. The resulting Lymancontinuum production rate in source A alone is a factor ofD2 larger than that from the inner kiloparsec of M82(Satyapal 1995).
In recent papers, the He I 2.06 km/Brc ratio has been usedto estimate the e†ective temperature of the exciting starsand therefore the age of the stellar population or the uppermass cuto† of the IMF (see, e.g., Doyon, Puxley, & Joseph1992). A low He I 2.06 km/Brc ratio can be indicative of alow upper mass cuto† or an older population of stars.However, radiative transfer e†ects result in a more compli-cated behavior of this ratio with e†ective temperature(Doherty et al. 1995 ; Shields 1993). These e†ects are signiÐ-cant at e†ective temperatures above D40,000 K, where thepredicted He I 2.06 km/Brc ratio becomes a decreasing func-tion of the temperature of the ionizing sources. Therefore, insome cases the e†ective temperature estimated from thisratio is ambiguous, requiring independent constraints toconÐrm. From Table 5, we see that the He I 2.06 km/Brcratio is the lowest in source B. Since the CO index is high inthis source and the Brc equivalent width is low (see ° 3.5),the low He I 2.06 km/Brc ratio can be attributed to a lowere†ective temperature for the stellar population in source Bthan in sources A and C. Although source C has a lowerHe I 2.06 km/Brc ratio than does source A, the absence ofthe 2.3 km CO absorption feature, the high the Brc equiva-lent width, and the possible detection of Wolf-Rayet fea-tures (Armus et al. 1989) from this source suggests thatsource C is characterized by a younger stellar population.The lower He I 2.06 km/Brc ratio therefore probably resultsfrom a higher e†ective temperature for the ionizing stars insource C compared with source A.
The radio properties of each of the sources in Arp 299 arealso signiÐcantly di†erent. The radio continuum emission ingalaxies can generally be attributed to synchrotron(nonthermal) emission from supernova remnants or anactive galactic nucleus and free-free (thermal) emission from
No. 2, 1999 ARP 299 713
ionized gas. The radio emission from supernova remnantsare observed to have power-law spectra with spectralindices in the range [0.1 to [1.0 (Green 1984). The non-thermal radio emission from active galactic nuclei on theother hand, often show Ñat or inverted spectra (see, e.g.,Condon et al. 1982), which is generally attributed to syn-chrotron self-absorption in the dense, compact core. Opti-cally thin free-free emission produces a aff\ [0.1continuum spectrum at radio frequencies. We have used ourrecombination-line spectrophotometry to predict thethermal component of the 5 GH continuum. Assuming caseB recombination and K, the intrinsic Brc lineT
e\ 104
strength is related to the free-free continuum at 5 GHz bythe relation :
F5GHz(Jy)\ 1.13] 1014FBrc(W m~2) ;
(derived from Condon 1992). As can be seen from Table 5,the thermal contribution to the observed 5 GHz Ñux densityis small in all sources, being the smallest in source A. Therelatively Ñat radio spectrum in source A can therefore notbe produced by free-free emission from ionized gas. It iscompact, with a size of 60 pc as seen from recent VLAobservations (Carral, Turner, & Ho 1990 ; Zhao et al. 1997),which suggests the possible presence of an active galacticnucleus. However, we see no evidence of broad near-infrared recombination line emission (see Fig. 4) and therecombination line ratios are consistent with case B recom-bination and extinction. In addition, source A has a large3.29 km feature Ñux, and the ratio of feature to far-infraredluminosity is consistent with that observed in most star-burst galaxies, which suggests the dominance of starburstactivity in this source. Sources B and C have resolved radiocomponents and have spectral indices that can be easilyexplained by the combined e†ects of thermal emission fromionized gas and nonthermal emission from supernova rem-nants.
3.5. A Starburst Model of Arp 299The results presented in this paper suggest a starburst
origin for the observed activity in Arp 299. This galaxyappears to be undergoing an intense burst of star formation,similar to but more energetic than the one taking place inthe prototypical starburst, M82. We have also shown thatthe observations suggest a di†erence in age or IMF at the
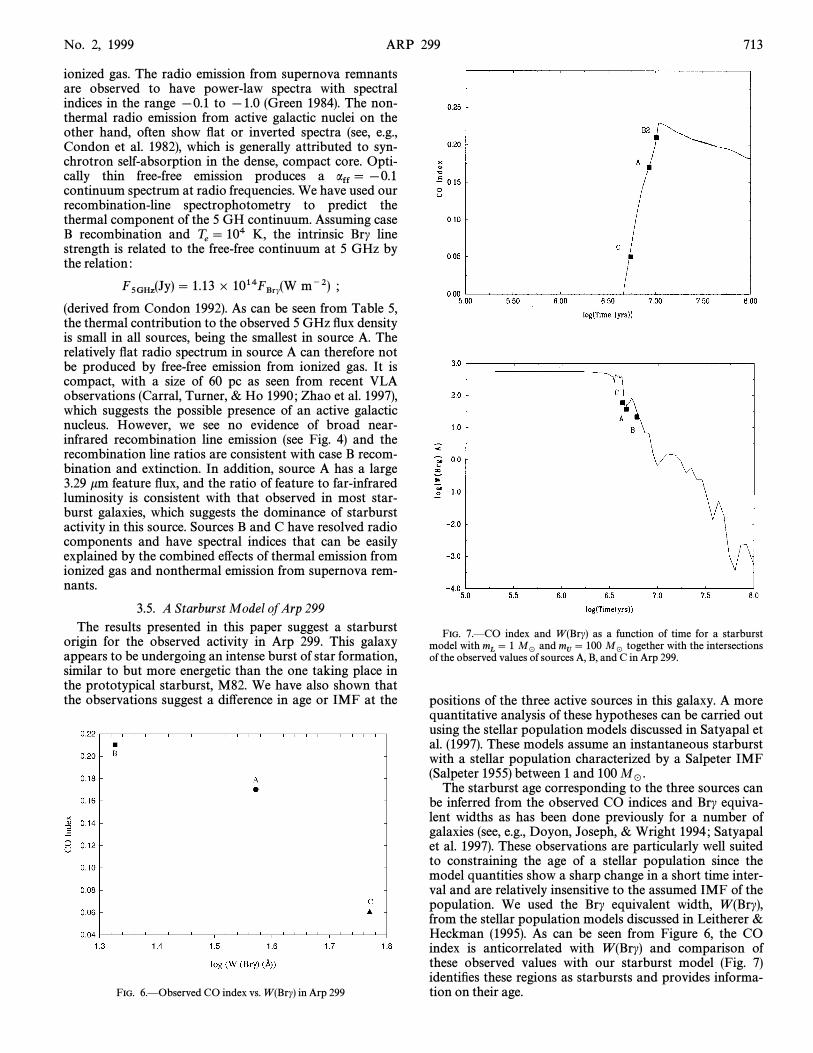
FIG. 6.ÈObserved CO index vs. W (Brc) in Arp 299
FIG. 7.ÈCO index and W (Brc) as a function of time for a starburstmodel with and together with the intersectionsm
L\ 1 M
_m
U\ 100 M
_of the observed values of sources A, B, and C in Arp 299.
positions of the three active sources in this galaxy. A morequantitative analysis of these hypotheses can be carried outusing the stellar population models discussed in Satyapal etal. (1997). These models assume an instantaneous starburstwith a stellar population characterized by a Salpeter IMF(Salpeter 1955) between 1 and 100 M
_.
The starburst age corresponding to the three sources canbe inferred from the observed CO indices and Brc equiva-lent widths as has been done previously for a number ofgalaxies (see, e.g., Doyon, Joseph, & Wright 1994 ; Satyapalet al. 1997). These observations are particularly well suitedto constraining the age of a stellar population since themodel quantities show a sharp change in a short time inter-val and are relatively insensitive to the assumed IMF of thepopulation. We used the Brc equivalent width, W (Brc),from the stellar population models discussed in Leitherer &Heckman (1995). As can be seen from Figure 6, the COindex is anticorrelated with W (Brc) and comparison ofthese observed values with our starburst model (Fig. 7)identiÐes these regions as starbursts and provides informa-tion on their age.
714 SATYAPAL ET AL. Vol. 516
The observed CO indices imply ages of D6 ] 106,8 ] 106, and 4 ] 106 for sources A, B, and C, respectively,very similar to those inferred from the observed Brc equiva-lent widths (5] 106,7] 106, and 4 ] 106). These ages aretypical of the inferred ages for the 12 pointlike sources inM82 (Satyapal et al. 1997) and for starburst galaxies ingeneral. The observed CO indices and Brc equivalentwidths imply that source B is older than source A andsource C is the youngest star forming region. In the pre-vious section we have outlined the various observationsthat suggest that source C is the youngest starburst. SourceA, however, has the largest ratio of far-infrared luminosityto ionizing Ñux (see Table 5), which has led several authorsto suggest that the starburst taking place in this source isthe oldest (see, e.g., Telesco et al. 1985) or that a large frac-tion of the far-infrared luminosity in this source is poweredby an active galactic nucleus (see Lonsdale & Smith 1995).However, we have detected emission from the 3.29 km dustfeature from this source, and the ratio of feature to far-infrared luminosity is consistent with that observed in moststarburst galaxies. Furthermore, we have found no evidencefor broad hydrogen recombination lines from this source.Using the starburst parameters derived for source A, theimplied supernova rate in this source is D0.6 yr~1. We canestimate the resulting nonthermal radio Ñux density fromsource A and compare it to the observed value listed inTable 5. Using the expression deduced from Huang et al.(1994) from observations of M82.
lSNR(yr~1)\ 3.4] 10~6F5GHz(mJy)DMpc2 ,
where is the nonthermal radio Ñux density at 5F5GHz(mJy)GHz for a galaxy at distance D in megaparsecs, we Ðnd thatthe derived radio Ñux density from supernova remnants insource A is D100 mJy, comparable to the nonthermal com-ponent of the observed 5 GHz Ñux density. Thus, our datasuggest that the existence of an AGN is not necessary toexplain both the radio properties of source A and the bulkof the far-infrared luminosity. Our observations suggestinstead that the upper mass cuto† in source A is smallerthan it is in source B. Fewer massive stars would reduce theionizing Ñux without necessarily decreasing the total far-infrared luminosity.
Thus our simple starburst model suggests that sources A,B, and C are all undergoing intense starburst episodes. Thestarburst in source B is older than that in source A andsource C is the youngest starburst region. Source A appearsto have a smaller upper mass-cuto† than source B, whichexplains the larger ratio of far-infrared luminosity to ion-izing Ñux observed from this source.
4. SUMMARY
In this paper, we have presented the results of our near-infrared Brc and Pab Fabry-Perot, near-infrared broad-band, and 3.29 km dust feature imaging observations of theArp 299 system. These data have been used to show thefollowing :
1. The near-infrared hydrogen recombination line, the3.29 km dust feature, and the near-infrared broadbandemission is concentrated at the positions of three activeregions, known as sources A, B, and C. This morphology isconsistent with that at 10 km and 6 cm and can be under-stood as the combined e†ects of young massive stars, apopulation of supergiants, and supernova remnants.
2. Assuming a foreground screen geometry, the extinc-
tion, toward the ionized gas in sources A, B, and C isAV,
D6, 6, and 2 mag, respectively. This was derived using theBrc/Pab Ñux ratio and the assumption of case B recombi-nation.
3. Emission from the 3.29 km dust feature has beendetected from each of the three sources. The ratio of thetotal far-infrared luminosity to the extinction-correctedfeature luminosity is found to be consistent with that foundin M82 and many other starburst galaxies. In source A,
is 3280 using the observed feature Ñux and 1840L FIR/L 3.3using the extinction-corrected Ñux. In sources B and C com-bined, is 1650 using the observed feature Ñux andL FIR/L 3.31550 after correcting for extinction. The extinction-corrected value in M82 is 1340. The 3.29 km dust feature isa better indicator of the far-infrared luminosity in Arp 299than Brc. The extinction-corrected far-infrared to Brc lumi-nosity ratio is 7.0 ] 104 in source A and 2.6 ] 104 insources B and C combined, compared to the value of1.4] 104 in M82.
4. Our recombination-line images were used to estimateseparately the contribution to the near-infrared continuumbandpasses from nebular emission. These sources of emis-sion are found to be most signiÐcant in source C but do notcontribute appreciably to the total near-infrared continuumin any of the sources.
5. The near-infrared colors of sources A and B are verysimilar to those found in the M82 starburst complex, andstarburst galaxies in general. These colors can be ascribedto a normal population of stars and some assumed dustgeometry. Source C, however, has a very unusual color thatcannot be ascribed to extinction from any assumed dustgeometry. The unusual color of this source may be theresult of a population of Wolf-Rayet stars. The dustgeometry in Arp 299 is probably more complicated than itis in, e.g., M82 ; a foreground screen geometry will mostlikely result in less reliable estimates for the extinctiontoward the broadband emission.
6. When compared with our starburst models, theobserved CO indices and Brc equivalent widths of thesesources imply ages similar to those inferred for the M82starburst complex and starburst galaxies in general.
7. Comparison of our simple starburst model with obser-vations suggests that sources A, B, and C are all undergoingintense starburst episodes. The starburst in source B is olderthan that in source A and source C is the youngest starburstregion. Source A appears to have a smaller upper mass-cuto† than source B, which explains the larger ratio of far-infrared luminosity to ionizing Ñux observed from thissource.
8. Our observations can be explained entirely by a star-burst model for the Arp 299 system. The putative AGN insource A does not dominate the properties of this source.We see no evidence of broad recombination lines. In addi-tion, the ratio of feature to far-infrared luminosity is consis-tent with that observed in most starburst galaxies, whichsuggests that the large far-infrared luminosity from thissource can be completely attributable to starburst activity.
The authors would like to acknowledge the support ofthe Smithsonian Garber Fellowship program, the NationalResearch Council, the Office of Naval Research, NASA, andNSF. We are also very grateful for the insightful discussionswith Larry Helfer and Mark Wardle, and the helpful com-ments from the anonymous referee.
No. 2, 1999 ARP 299 715
REFERENCESArmus, L., Heckman, T. M., & Miley, G. K. 1989, ApJ, 347, 727Beck, S. C., Turner, J. L., & Ho, P. T. P. 1986, ApJ, 309, 70Bushouse, H. A., & Gallagher, J. S. I. 1984, PASP, 96, 273Carral, P., Turner, J. L., & Ho, P. T. P. 1990, ApJ, 362, 434Cole, L. J. 1996, M.S. thesis, Univ. WyomingCondon, J. J., Condon, M. A., Gisler, G., & Puschell, J. J. 1982, ApJ, 252,
102Condon, J. J. 1992, ARA&A, 575Dennefeld, M., & Desert, F. X. 1990, A&A, 227, 379de Vaucouleurs, A., & de Vaucouleurs, G. 1967, AJ, 72, 730Doherty, R. M., Puxley, P. J., Lumsden, S. L., & Doyon, R. 1995, MNRAS,
277, 577Doyon, R., Joseph, R. D., & Wright, G. S. 1994, ApJ, 421, 101Doyon, R., Puxley, P. J., & Joseph, R. D. 1992, ApJ, 397, 117Draine, B. T. 1989, in Infrared Spectroscopy in Astronomy, ed. B. H.
Kaldeich (Noordwijk : ESTEC), 93Elias, J. H., Frogel, J. A., Matthews, K., & Neugebauer, G. 1982, AJ, 87,
1029Fischer, J., Smith, H. A., & Glaccum, W. 1990, in ASP Conf. Ser. 14,
Astrophysics with Infrared Arrays, ed. R. Elston (San Francisco : ASP),63
Frogel, J. A., Persson, S. E., Aarson, M., & Matthews, K. 1978, ApJ, 220, 75Gehrz, R. D., Sramek, R. A., & Weedman, D. W. 1983, ApJ, 267, 551 GSWGreen, D. A. 1984, MNRAS, 209, 449Greenhouse, M. A., et al. 1997, ApJ, 476, 105Huang, Z. P., Thuan, T. X., Chevalier, R. A., Condon, J. J., & Yin, Q. F.
1994, ApJ, 424, 114Hummer, D. G., & Storey, P. J. 1987, MNRAS, 224, 801Joy, M., Lester, D. F., Harvey, P. M., Telesco, C. M., Decher, R., Rickard,
L. J., & Bushouse, H. 1989, ApJ, 339, 100Keto, E., et al. 1997, ApJ, 485, 598Kleinmann, S. G., & Hall, D. N. B. 1986, ApJS, 62, 501Koornneef, J. 1983, A&A, 128, 84Landini, M., Natta, A., Oliva, E., Salinari, P., & Moorwood, A. F. M. 1984,
A&A, 134, 384Leitherer, C., & Heckman, T. M. 1995, ApJS, 96, 9
Lonsdale, C. J., & Smith, H. E. 1995, ApJ, 438, 632Mazzarella, J. M., Voigt, G. M., Soifer, B. T., Matthews, K., Graham, J. R.,
Armus, L., & Shupe, D. 1994, AJ, 107, 1274Miles, J. W., Houck, J. R., & Hayward, T. L. 1994, ApJ, 425, L37Mizutani, K., Suto, H., & Maihara, T. 1989, ApJ, 346, 675ÈÈÈ. 1994, ApJ, 421, 475Mouri, H., Kawara, K., Taniguchi, Y., & Nishida, M. 1990, ApJ, 356, L39Nelson, K., et al. 1999, in preparationNakagawa, T., Nagata, T., Geballe, T. R., Okuda, H., Shibai, H., & Matsu-
hara, H. 1989, ApJ, 340, 729Ridgway, S. E., Wynn-Williams, C. G., & Becklin, E. E. 1994, ApJ, 428, 609Salpeter, E. E. 1955, ApJ, 121, 161Sanders, D. B., & Mirabel, I. F. 1985, ApJ, 298, L31ÈÈÈ. 1996, ARA&A, 34, 749Sargent, A. I., Sanders, D. B., Scoville, N. V., & Soifer, B. T. 1987, ApJ, 312,
L35Satyapal, S. 1995, Ph.D. thesis, Univ. Rochester, RochesterSatyapal, S., et al. 1995, ApJ, 483, 148Satyapal, S., Watson, D. M., Pipher, J. L., Forrest, W. J., Greenhouse,
M. A., Smith, H. A., Fischer, J., & Woodward, C. E. 1997, ApJ, 448, 611Sellgren, K., Werner, M. W., & Dinerstein, H. L. 1983, ApJ, 271, L13Shields, J. C. 1993, ApJ, 419, 181Shier, L. M., Rieke, M. J., & Rieke, G. H. 1994, ApJ, 433, L9Soifer, B. T., Sanders, D. B., Madore, B. F., Neugebauer, G., Danielson,
G. E., Elias, J. H., Lonsdale, C., & Rice, W. L. 1987, ApJ, 320, 238Stark, A. A. 1997, ApJ, 481, 587Telesco, C. M., Decher, R., & Gatley, I. 1985, ApJ, 299, 896Tokunaga, A. T., Sellgren, K., Smith, R. G., Nagata, T., Sakata, A., &
Nakada, Y. 1991, ApJ, 380, 452Toomre, A., & Toomre, J. 1972, ApJ, 178, 623Williams, P. M., Van der Hucht, K. A., & The, P. S. 1987, A&A, 182, 9LWynn-Williams, C. G., Hodapp, K.-W., Joseph, R. D., Eales, S. A., Becklin,
E. E., McLean, I. S., Simons, D. A., & Wright, G. S. 1991, ApJ, 377, 426Zhao, J.-H., Anantharamaiah, K. R., Goss, W. M., & Viallefond, F. 1997,
ApJ, 482, 186