probing intracellular response to nanoparticle therapy
TRANSCRIPT

Florida State University LibrariesElectronic Theses, Treatises and Dissertations The Graduate School
2018
Nano-Biosensors: Probing IntracellularResponse to Nanoparticle TherapyKatelyn Jo Fredrickson Carnevale
Follow this and additional works at the DigiNole: FSU's Digital Repository. For more information, please contact [email protected]

FLORIDA STATE UNIVERSITY
COLLEGE OF ARTS AND SCIENCES
NANO-BIOSENSORS: PROBING INTRACELLULAR RESPONSE
TO NANOPARTICLE THERAPY
By
KATELYN JO FREDRICKSON CARNEVALE
A Dissertation submitted to the
Department of Chemistry and Biochemistry
in partial fulfillment of the
requirements for the degree of
Doctor of Philosophy
2018

ii
Katelyn Jo Fredrickson Carnevale defended this dissertation on July 11, 2018.
The members of the supervisory committee were:
Geoffrey F. Strouse
Professor Directing Dissertation
Cathy W. Levenson
University Representative
Joseph Schlenoff
Committee Member
Wei Yang
Committee Member
The Graduate School has verified and approved the above-named committee members, and
certifies that the dissertation has been approved in accordance with university requirements.

iii
For my Lily --
You can have it all!

iv
ACKNOWLEDGMENTS
I would like acknowledge the Grace of God in faithfully bringing me through this
program, as well as the invaluable support, encouragement, and guidance of my family, friends,
coworkers, collaborators, and – certainly not least – my PI. Dr. Strouse, thank you for your
infectious curiosity and excitement to answer big questions and always dig deeper, and thank
you for your well-timed pep-talks that kept me going on days when my science was being
anything but cooperative. To Dr. Dave Carnevale, thank you for always supporting me and
pushing me to reach my full potential, as well as for always being a sounding board for my ideas;
and thank you for being a wonderful husband and father to our daughter, especially during these
last few months as I have been finishing my dissertation! To my parents and in-laws, thank you
for your unwavering love, support, and confidence in my abilities! To Dr. Megan Muroski, thank
you for your patience in teaching me how to be a graduate student and scientist, and for the many
important lessons of science and life that you have taught me; I would not be the scientist I am
today without your mentorship. To Dr. Cathy Levenson, Dr. Tom Morgan and Dr. Diego Zorio
thank you for your help on our collaborations and for all of the things each one of you have
taught me! To Dr. Megan Foley, thank you for always being willing to help me out and for your
contagiously happy disposition, I am glad to know you! To Dr. Ryan Riskowski, thank you for
deep conversations and your valuable contributions to our collaborations. To Dr. Bridgett
Ashley, thank you for all of your help with the Matlab software, and for being a genuinely
enjoyable human being to be around! To Dr. Parth Vakil, it’s been a crazy ride, and I am grateful
to have had you as a colleague and friend throughout this process (also, thank you for the
measurements and materials you have made for me)! To David Hardy, thank you for your help
with various synthesis and measurements, and for taking over many of the “lab manager”
responsibilities, so I could graduate! To all the rest of my lab mates, collaborators, and friends
thank you very much for wonderful conversations, lunches, and your contributions to my
development as a scientist, and equally importantly, for keeping me sane throughout grad school.
“Why am I discouraged? Why is my heart so sad? I will put my hope in God! I will praise him
again — my Savior and my God!”
Psalm 42:5

v
TABLE OF CONTENTS
List of Tables ................................................................................................................................ vii
List of Figures .............................................................................................................................. viii
Abstract ..........................................................................................................................................xv
1. INTRODUCTION ......................................................................................................................1
1.1 Background of Nanomaterials for Biological Applications.................................................1
1.2 Characterization of Nanomaterial-Bioconjugates ..............................................................12
1.3 Nanomaterials in Cellular Applications .............................................................................19
1.4 Thesis Outline ....................................................................................................................27
2. SURFACE COUPLING CONTROLLED INTRACELLUAR CARGO RELEASE OF
THIOL AND AMINE MODIFIED DNA FROM A GOLD NANOPARTICLE..........................30
2.1 Introduction ........................................................................................................................30
2.2 Materials and Methods ........................................................................................................32
2.3 Results and Discussion ........................................................................................................36
2.4 Conclusion ..........................................................................................................................50
3. A GOLD NANOPARTICLE BIO-OPTICAL TRANSPONDER TO DYNAMICALLY
MONITOR INTRACELLULAR pH .............................................................................................52
3.1 Introduction ........................................................................................................................52
3.2 Materials and Methods .......................................................................................................56
3.3 Results and Discussion ......................................................................................................60
3.4 Conclusion .........................................................................................................................80
4. DIFFERENTIAL UPTAKE OF CELL PENETRATING PEPTIDE LOADED
MULTISHELL QUANTUM DOTS IN DRUG RESISTANT CANCER CELLS .......................81
4.1 Introduction ........................................................................................................................81
4.2 Materials and Methods .......................................................................................................83
4.3 Results and Discussion ......................................................................................................86
4.4 Conclusion .......................................................................................................................101
5. OPTICAL AND MAGNETIC MEASUREMENT OF NANOTHERAPEUTIC DELIVERY
INTO CANCER CELLS USING PEPTIDE CONJUGATED MAGNETIC GOLD
(FE3O4@AU) NANOPARTICLES ............................................................................................103
5.1 Introduction ......................................................................................................................103
5.2 Materials and Methods .....................................................................................................105
5.3 Results and Discussion ....................................................................................................109
5.4 Conclusion .......................................................................................................................121

vi
6. SUMMARY AND FUTURE OUTLOOK..............................................................................123
APPENDICES .............................................................................................................................126
A. ABBREVIATIONS AND ACRONYMS ...............................................................................126
References ....................................................................................................................................127
Biographical Sketch .....................................................................................................................150

vii
LIST OF TABLES
Table 2.1 Intracellular DNA cargo release kinetics from 6nm AuNP for monothiol (AuNP-SX-
DNA and AuNP-TSX-plasmid), dual thiol (AuNP-SS-DNA and AuNP-TSS-plasmid), and thiol
plus amine (AuNP-SN-DNA and AuNP-TSN-plasmid) attachment, for short DNA
oligonucleotides and linearized plasmids, respectively .................................................................48
Table 4.1 Table of selected Cell Penetrating Peptides, displaying numerical designation, CPP
name, sequence and length, charge and isoelectric point (Pi) at pH 7.4, molecular weight in
Daltons, and percentage of hydrophobic residues (L%). CPP origin is denoted by ⸸ for synthetic,
† for viral proteins, and ‡ for non-viral proteins. (*cysteine mutation, not present in the original
sequence.).......................................................................................................................................88
Table 4.2 Optical properties of CPP functionalized QDs, showing CPP-dependent Quantum
Yield (Φ), First Exciton Absorption Wavelength (λAbs), and Maximum Photoluminescence
Wavelength (λPL) ..........................................................................................................................90
Table 4.3 Calculated peptide properties and loading level on the 4 nm diameter QD (surface area
~12.5 nm2), based on the PEP-FOLD generated CPP structures, displaying folded peptide height
and diameter given in Angstroms (Å), binding footprint in square nanometers (nm2), and the
maximum number of peptides a 4 nm QD could accommodate for single peptide loading (100%),
and ratioed peptide loading (90% & 10%) for CAAKA:CPPX.. ................................................100

viii
LIST OF FIGURES
Figure 1.1 Comparative scale of common biologically relevant objects, molecules, and
nanoparticles, versus punctuation. ...................................................................................................1
Figure 1.2 (A) General schematic of multi-biofunctionalized nanoparticle (NP) for diagnostic
and therapeutic cellular applications with appended peptide for cellular targeting, and diagnostic
or therapeutic fluorescent dye-labelled drug and nucleic acid molecules. (B) General pathway of
NP cellular uptake and processing, showing endosomal encapsulation, processing, escape and
disassembly of the NP construct to recover dye fluorescence, and potential exocytosis. ...............2
Figure 1.3 (A) Nano-gold and -silver embedded glass of the Lycurgus Cup (c. 4th century AD)
under room light (i) and illuminated from within (ii) showing the unique optical properties of
metal nanoparticles (Image: Public access from Trustees of the British Museum). (B) Schematic
of the local surface plasmon resonance of a metallic nanoparticle depicting the sea of electrons
oscillating in the electromagnetic field. And (C) visible light absorbance spectroscopy of gold
nanoparticles with radii of 8.5 nm (light grey), 4 nm (dark grey), 3.3 nm (pink), 2.15 nm (red),
1.5 nm (green), and 0.95 nm (gold), showing the optical effect of NP size, plotted as molar
extinction coefficient versus wavelength. ........................................................................................5
Figure 1.4 Schematic diagram of semiconductor materials and their energy levels in (A)
macroscopic “bulk” semiconductor crystals with continuous energy bands. And quantized energy
levels of nanometer sized semiconductor nanocrystals showing (B) 6-4 nm diameter with red
emission, (C) 4-2 nm diameter with green emission, and (D) 2-1 nm diameter with blue
emission, for CdS quantum dots. .....................................................................................................7
Figure 1.5 Alignment of magnetic dipole moments in magnetic crystals from superparamagnetic
and single-domain nanoparticles to multi-domain bulk sized magnets. ..........................................8
Figure 1.6 Schematic representation of Surface Energy Transfer, where the 6 nm AuNP is able
to non-radiatively quench emission from the excited fluorophore (fluorescein amidite: FAM)
appended to a DNA molecule at the 35th base pair away from the synthetic 5’ thiol attachment to
the AuNP surface, a distance specifically chosen to correlate with the D0 of 160 Å for the
AuNP6nm–FITC pair. ......................................................................................................................11
Figure 1.7 (A) Schematic of principles for gel electrophoresis, showing applied current from
negative above the wells, to repel negatively charged molecules, to positive at the bottom to
attract molecules through the gel matrix, as well as representative post-run pattern of (i) as-
synthesized aqueous AuNPs with tight band, (ii) stable large appended biomolecules with single
broad band, (iii) stable smaller appended biomolecules with single broad band, and (iv) unstable
appendage with biomolecule removal by the gel matrix displaying a continuous smear. (B)
Photograph of AuNP-bioconjugates with stable (i) for as-synthesized passivating ligand, (ii)
mono-thiol, (ii) dual thiol, (iii) thiol plus amine bidentate attachment of 30mer DNA, and
unstable (iv) dual amine, and (v) mono-amine attachment of 30mer DNA. .................................16
ix
Figure 1.8 Original schematics of (A) Beckman DU spectrophotometer c. 1954,1,2 and (B)
Amnco-Bowman spectrophotofluormeter (Images: Public access from the NIH
Archive)3 ........................................................................................................................................17
Figure 1.9 Cellular uptake and processing of exogenous material showing (A) different
mechanisms of endocytosis (Image: adapted from Sandvig, and van Deurs 2002)4 and (B) endo-
lysosomal maturation of encapsulated agent from uptake, transport to early endosome (EE), late
endosome (LE) and fusion with lysosome (LY), with corresponding pH gradients (red: pH 7.4 to
blue: pH 4.5), followed by cellular elimination via exocytosis (Image: adapted from Carnevale
2018).5 ...........................................................................................................................................21
Figure 1.10 (A) Schematic of Green Fluorescent Protein secondary structure and reaction path
for central amino acid residues to chromophore formation (Image: adapted from Frommer,
Davidson and Campbell 2009).6 (B) Photograph of agar plate containing E.coli transformed to
express Enhanced Blue Fluorescent Protein (blue), Enhanced Cyan Fluorescent Protein (cyan),
Enhanced Green Fluorescent Protein (green), Yellow “Citrine” Fluorescent Protein (green-
yellow), mHoneydew (yellow-green), mBanana (yellow), mOrange (orange), and mCherry
(pink) (Image: adapted from Tsien 2010).7....................................................................................24
Figure 1.11 (A) Schematic of an inverted confocal fluorescent microscope, showing light path
from laser to cell sample and back to photomultiplier tube (PMT) detectors with digitally
converted signal on computer display. (B) Representative live-cell confocal fluorescent
microscope image of Chinese hamster ovary cells stained for cell membrane with AF594 dye-
labelled wheat germ agglutinin (red), nucleus with DAPI cell permeable dye (blue), and showing
FAM dye-labelled DNA release from AuNP after 12 h of incubation (green). ............................25
Figure 2.1 Scheme of AuNP-DNA coupling strategy, showing mono-thiol (SX), dual thiol (SS)
and thiol plus amine (SN) with corresponding anticipated release times: t1, t2, and t3,
respectively. Cellular uptake is monitored by constant Dylight (DL) 700 emission, release from
is monitored by turn on of DL488, according to SET theory, and gene expression is observed by
emission of the fluorescent protein, tdTomato. .............................................................................36
Figure 2.2 Characterization of the McSET-BOT AuNP showing (A) TEM (scale bar = 100 nm)
and size distribution (inset) of the 6 nm diameter AuNP, prior to biofunctionalization; and (B)
agarose gel electrophoresis of the as-synthesized AuNP (lane 1), monothiol DNA appended
AuNP (lane 2), bidentate thiol appended DNA AuNP (lane 3), and bidentate thiol plus amine
DNA appended AuNP (lane 4). .....................................................................................................38
Figure 2.3 Dynamic light scattering intensity as a measure of the hydrodynamic diameters for
(A) AuNP-bSPP of ~14.2 nm, (B) AuNP-sdDNA of ~36.4 nm, and (C) AuNP-plasmid of ~166.7
nm. Mean values are shown as green filled bars and size distributions are shown in red unfilled
bars. ................................................................................................................................................38
Figure 2.4 Cyanide etching of the McSET-BOT. Dissolution of the AuNP is observed by loss of
the 525 nm plasmon in the absorbance spectra (A) and release the DL488 and DL700 dye-
labelled DNA is evidenced by the recovery in the fluorescence spectra (B) of DL488 at 520 nm.

x
Absorbance of the dyes is shown at a 50x magnification of the absorbance intensity (inset). The
DL700 emission at 700 nm is relatively unaffected due to non-SET behavior (C) .......................39
Figure 2.5 Live cell fluorescence microscopy of A375 cells incubated with (A) AuNP-SX, (B)
AuNP-SS, and (C) AuNP-SN over 48 h. DL700 denotes uptake and particle tracking, DL488
shows DNA release, DIC shows normal cell morphology, and overlay shows localization. Scale
bar: 50 µm ......................................................................................................................................41
Figure 2.6 Analysis of colocalization for DL488 and DL700 fluorescence, expressed in Cross
correlation functions (CCF) for AuNP-SX/SS/SN-DNA (A, C, E and G, I, K) and AuNP-
TSX/TSS/TSN-Genes (B, D, F and H, J, L) at 12 h and 24 h post transfection, respectively. Best
Gaussian fit is shown in blue .........................................................................................................45
Figure 2.7 Kinetic data of AuNP uptake (A & C) and cargo release (B & D) for the short duplex
DNA (open shapes) and plasmid gene (filled shapes) coupled to the AuNP by monothiol “SX”
(black circle), dual thiol “SS” (red triangle) and thiol plus amine “SN” (blue square),
respectively. Uptake is monitored by cellular fluorescence of DL700 and Release by DL488,
normalized to cell counts. Trend lines reflect sigmoidal fits .........................................................47
Figure 2.8 (A) Live cell fluorescent microscopy images of the tdTomato fluorescent protein
gene expression from 24-72 h post transfection, as delivered by the AuNP via mono thiol (TSX),
dual thiol (TSS) or thiol plus amine (TSN) DNA linkage. Scale bar is 50 μm. (B) Quantification
of cellular gene expression from 24-72 h post transfection for the AuNP-TSX, AuNP-TSS, and
AuNP-TSN attachment strategies, along with the circular plasmid and a linearized plasmid
functionalized with dithiol protected dual thiol modifications, as controls. ..................................49
Figure 3.1 Schematic representations of (A) the endo-lysosomal pathway for nanoparticle
cellular uptake, showing thermal plot of pH processing, starting with endocytosis and transport
inside a trafficking vesicle at near neutral pH (red) to (i) the Early Endosomal (EE) at a pH
between 7-6 (red-orange), before processing to (ii & iii) a Late Endosome (LE) acidifying from
pH 6-5 (yellow-green), and finally trafficking to (iv) the Lysosome (LY) for acidic degradation
at pH 5-4.5 (blue-purple), with potential exocytosis of recycled materials at pH 7 and above
(red). And (B) the 3-color pH-BOT probe, displaying 6.6 nm diameter gold nanoparticle
(AuNP), with appended thiol-modified 45mer oligonucleotide possessing dye-labels of an
unquenched DL700 at the 45th bp (uptake sensor), a SET quenched & weakly pH-sensitive
DL405 at the 32nd bp (release sensor), and a SET quenched & highly pH-sensitive FAM at the
11th bp (pH sensor). ........................................................................................................................53
Figure 3.2 Nano-bioconjugate characterization showing (A) TEM of as-synthesized spherical
AuNPs with (B) Gaussian fit to the size distribution of 6.6 ± 1.0 nm. (C) 1% agarose gel
electrophoresis of the AuNP pH-BOT probe (i), versus as-synthesized AuNP with protected RS-
S-DNA (ii), and as-synthesized AuNP with no DNA (iii). Retention of the AuNP pH-BOT probe
versus controls demonstrates reduced thiol facilitated DNA binding to the AuNP. (D)
Absorbance spectra of sodium cyanide etching of the AuNP away from the pH-BOT probe, with
loss of the AuNP plasmon at 525nm indicating cyanide dissolution of the AuNP and liberation of
the previously bound duplex DNA strands, and (inset) 50x zoom of post cyanide absorption

xi
showing DL405, FAM and DL700. Absorption of AuNP displays a concentration of 0.01 µM
(ɛ525=1.97x10⁷ M-1 cm-1) prior to cyanide treatment, and the duplex pH-BOT DNA gives a
concentration of 0.19 µM (ɛ260=7.3x10⁵ M-1 cm-1) after cyanide ...................................................62
Figure 3.3 (A) Emission spectra and schematic of AuNP-bound (i) and released (ii) DNA
labeled with the dyes DL405, FAM, and DL700 of the pH-BOT probe. Excitation wavelengths
of 390nm, 480nm, and 670nm, for each dye, respectively. Sodium cyanide dissolution of the
AuNP gives rise to the fluorescence recovery of the previously quenched DL405 and FAM,
whereas the unquenched DL700 maintains fluorescence. (B) pH dependent fluorescence
intensity spectra of DL405, FAM, and DL700 from pH 4 to pH 8, with schematic of DNA-bound
dye fluorescence changes in basic (i) versus acidic (ii) conditions. (C) pH dependent ratio of
FAM:DL405 with sigmoidal fit (red curve) giving the pH calibration equation. (D) The
fluorescence intensity ratio of DL405:DL700 displaying pH independence between pH 5-8. Error
bars indicate standard error ............................................................................................................64
Figure 3.4 Confocal z-stack images of CellMask Orange® plasma membrane stained CHO cells
at 2h (A) and 6h (B) post-transfection with the pH-BOT. Arrows show cellular internalization of
the pH-BOT, as the pH-BOT fluorescence is observed most clearly at the focal plane
corresponing to center of the cell (ii), as opposed to the outter membrane (i) where the signal is
out of focus. Some punctate fluorescent packages are observed to even localize within the base
of the cells (iii) ...............................................................................................................................66
Figure 3.5 (A) Fluorescence images of the cellular uptake and processing of pH-BOT probe in
CHO cells from 1.5 to 24 hours, following Lipofectamine2000® transfection and media washing
at 1.5h. Grey (DIC) images allow for visualization of cell morphology, blue (DL405) reports
DNA release from AuNP, green (FAM) indicates intracellular pH after DNA release, red
(DL700) shows pH-BOT construct tracking throughout the experiment, and the composite
(Overlay) image illustrates colocalization of fluoresce signals within the cells. (B) Pseudo-
colored thermal plots of the ratiometric fluorescence of FAM/DL405 indicates intracellular pH
(4.5 = purple to 7.5 = red) throughout cellular processing of the pH-BOT. Scale bar: 25 µm ......67
Figure 3.6 Cell uptake and processing of the pH-BOT probe shown in DIC overlay images of
the 3 color confocal fluorescence images with DL405 (blue), FAM (green), and DL700 (red).
Scale bar: 10 µm ............................................................................................................................68
Figure 3.7 Cell uptake and processing of the pH-BOT probe shown in DIC overlay images of
thermally colored Ratio map of FAM:DL405 fluorenscence intensities, with warm colors
representing more basic pH environments experienced by the probe and cool colors representing
more acidic pH environments (i.e. red to blue = 7.4 to 4.5). Scale bar: 10 µm. ............................69
Figure 3.8 Average microscope fluorescence intensity ratios of (A) the change in intracellular
DL700 intensity from initial intensity, showing little change over time, and (B) the relationship
of intracellular FAM to DL700 intensity, showing decreasing FAM intensity and consistent
DL700 intensity over the 24 h time course of the experiment. ......................................................70

xii
Figure 3.9 (A) pH-BOT DNA release rate from AuNP core as assessed by the fluorescence
intensity ratio of DL405 (SET quenched) to DL700 (unquenched), over the 24 h experiment.
Initial release kinetics (▲) plotted to a sigmoidal function curve (red fit) from 0 to 10.5 h.
Fluorescence ratio decline (▼) plotted to a linear decay (blue fit) from 11 to 24 h. (B) Calculated
average endosomal pH experienced by the AuNP pH-BOT probe during 24 hour cellular
processing following Lipofectamine2000® transfection and media washing at 1.5 hours (black
line). Shaded boxes represent typical pH values of early endosomes (red: pH 7.4-6), late
endosomes (yellow: pH 6-5), and lysosomes (blue: pH 5-4.5). Error bars represent standard
deviation. (C) Populations of endosomes at given pH values for selected timepoints over the
course of the experiment. Shaded boxes represent typical pH values of early endosomes (EE, red:
pH 7.4-6), late endosomes (LE, yellow: pH 6-5), and lysosomes (LY, blue: pH 5-4.5). ..............71
Figure 3.10 Cuvette studies of pH-BOT buffering and release in McIlvaine’s buffer and CHO
cell lysate. (A) pH-BOT calculated pH from the fluorescence ratio of FAM to DL405 at 0h (blue
diamonds) and 24h (red squares) after RT incubation with pH 3.9-7.4 McIlvaine’s buffer
solutions. (B) And calculated pH reponse of the pH-BOT in CHO cell lysate, pH 5 and 7, at 0h
(blue open circle), 12h (purple closed triangle), and 24 h (red banded square) incubated at 37°C.
(C) Nano-cargo release of the pH-BOT DNA from the AuNP in (C) McIlvaine’s buffer at pH 7.4
and 5.1, and in (D) CHO cell lysate at pH 7 and pH 5, both incubated at 37°C for 24 h. .............74
Figure 3.11 Endo-lysosomal pathway colocalization analysis depicting (A-F) the cross-
correlation functions of DL700, from pH-BOT, with RFP trackers, for early endosomes “EE”
Rab5-RFP (A & D), late endosomes “LE” Rab7-RFP (B & E), and for lysosomes “LY”
LysoTrackerTM DND-99 (C & F), at 2 and 6 hours post transfection, respectively. Average
Manders’ colocalization coefficients for the fraction of DL700 colocalizing with RFP for each
vesicle type were found to be 0.035, 0.071, and 0.059 for EE, LE and LY at 2 h, respectively;
and at 6 h were found to be 0.068, 0.097, and 0.061, respectively. (G) Chromagraphic legend of
colocalization between FAM and DL405, from pH-BOT, and RFP from vesicle trackers; and (H)
colocalization from digitally zoomed single-cell merged confocal fluorescence microscopy
images of CHO cells with the pH-BOT probe and RFP vesicle trackers of either (EE), (LE) and
(LY), collected at 6 h post transfection. Arrows indicate vesicles with colocalization of RFP
trackers with the pH-BOT in EE (i-iii), LE (iv-vi), and LY (vii-ix), with variation in color due to
differences in fluorescent intensities of each fluorophore per endosome. The FAM:DL405
emission ratio gave the following pH values: 6.50 (i), 6.50 (ii), and 6.50 (iii), in EE; 6.04 (iv),
6.25 (v), and 6.39 (vi), in LE; and 6.28 (vii), 5.96 (viii), and 6.33 (ix), in LY, for the selected
vesicles at 6 h post transfection. White cell outlines for cells of interest were traced from
transmitted light images. Scale bar: 10 µm. ...................................................................................77
Figure 4.1 (A) Schematic diagram of CdTe@CdSe@CdS@ZnS multishell QD showing peptide
functionalization with CAAKA and hCT(9-32). (B) Graphic of QD:CPP cellular uptake,
showing cellular membrane association (i), internalization (ii), and endosomal entrapment (iii)
versus cytosolic distribution (iv). ...................................................................................................82
Figure 4.2 Characterization of the multishell QDs with (A) TEM of CdTeSe cores (i), CdS
shelled (ii), and ZnS capped (iii) QDs. (B) Size distributions for CdTeSe cores (i), CdS shelled

xiii
(ii), and ZnS capped (iii) QDs. And (C) absorption and emission spectra for CdTeSe cores (i),
CdS shelled (ii), and ZnS capped (iii) QDs. ..................................................................................89
Figure 4.3 Passivation of CdTe@CdSe@CdS@ZnS multishell QDs biofunctionalized with cell
penetrating peptides (CAAKA, HSV1-VP22, HIV-TAT, HIV-gp41, Ku-70, Hct(9-32), Integrin
β3, and K-FGF). Schematic (A) shows exchange of organic ligands, TOP and TDPA (i), for 10%
CPP-X and 90% CAAKA (ii). Image (B) displays QD solution before and after phase exchange
in room light (i & iv) and under fluorescence excitation (ii & iii). The absorbance (C) and
emission (D) spectra for each QD-peptide sample demonstrate slight changes in the surface
environment per peptide ................................................................................................................91
Figure 4.4 Fluorescence images of QD-CPP uptake in rat gliosarcoma (9L) and drug resistant
(9L-R), human patient drug resistant gliosarcoma (LN18 & U87), human melanoma (A375) and
drug resistant (A375-R), and human mesothelioma (MSTO) and drug resistant (MSTO-R), fixed
at 24 h with DAPI nuclear stain. Scale bar:100 µm .......................................................................93
Figure 4.5 Uptake profiles of the studied QD-CPP constructs in (A) human melanoma (A375)
and drug resistant (A375-R), (B) human mesothelioma (MSTO) and drug resistant (MSTO-R),
(C) rat gliosarcoma (9L) and drug resistant (9L-R), and (D) human patient drug resistant
glioblastoma (LN18 & U87), fixed at 24 h, measured by microscopic fluorescence intensity,
corrected for the quantum yield of each peptide-QD conjugate, and normalized for cell number
by DAPI nuclear stain counting. Displaying statistical differences of p ≤ 0.5, 0.1, 0.001, and
0.0001 as *, **, ***, and ****, respectively, for uptake in comparison to 100% CAAKA loaded
QDs (black), and drug resistant versus drug naive cell lines (red, in parentheses) .......................95
Figure 4.6 (A) Confocal fluorescent z-stack images of intracellular localization for QD-CPP
constructs displaying more punctate endosomal fluorescence for QD-CAAKA (i) and more
diffuse cytosolic localization for QD-hCT(9-32) (ii) in 9L cells. (B) Quantification of QD-CPP
endosomal versus cytosolic localization by area of punctate fluorescence, showing mostly mixed
endosomal (10 µm2 single endosome) and cytosolic (900 µm2 whole cell) localization for naïve
and drug resistant human melanoma (A375 & A375-R), human mesothelioma (MSTO & MSTO-
R), rat gliosarcoma (9L & 9L-R) and human glioblastoma (LN18 & U87), with (ii-v) endosomal
area range for CAAKA versus the best performers: HSV1-VP22, Ku-70, and hCT(9-32),
respectively ....................................................................................................................................97
Figure 4.7 PEP-FOLD generated secondary structures of the studied CPPs as possible folding
orientations of peptides bound to the QD surface via the N-terminal cysteine thiol .....................99
Figure 5.1 Schematic diagram of a multi-functional “Magnetic Gold” Fe3O4@Au Nanoparticle
(MGP), displaying optical and magnetic utility from the Au shell and Fe3O4 core,
respectively ..................................................................................................................................103
Figure 5.2 Characterization of the Fe3O4 cores (black) and Fe3O4@Au “Magnetic Gold
Particles” (red), showing TEM (A & C) and size distributions (B & D), as well as UV-Vis
absorption (E), pXRD patterns (F), and SQUID magnetometry (G). Reference pXRD powder
patterns in (F) are for bulk Au (garnet) and Fe3O4 (gray) ............................................................110

xiv
Figure 5.3 Ligand exchange characterization of MGPs with various cell penetrating peptides and
the small molecule DHLA (A) showing structures; MGP (B-i) organic vs. (B-ii) aqueous
solubility, before and after ligand exchange, respectively; and (C) absorption profiles for water
soluble biofunctionalized-MGPs .................................................................................................112
Figure 5.4 Magnetic resonance imaging analysis of cellular uptake for MGP-CPPs and MGP-
DHLA (transfected using Lipofectamine2000®) constructs, prepared in agarose gel tissue
mimic. Quantification and imaging of T1 Relaxation (A & D), T2 Relaxation (B & E), and T2*
Relaxation (C & F), as well as 3-D model of MGP localization in the tissue mimic (G) ...........114
Figure 5.5 Optical functionalization of best performers, MGP-TAT and MGP-DHLA with
fluorescein isothiocyanate (FITC) and Nile Blue690 (NB), respectively. Showing absorbance of
(A) MGPs before (OA/OA) and after biofunctionalization with DHLA, C*TAT and H6*TAT, as
well as (B) before and after coupling NB to DHLA. Additionally, for the SET quenched FITC,
treatment with sodium cyanide to etch the Au shell show changes the (C) absorbance and (D)
photoluminescence profiles after 5 minutes and full Au dissolution and loss of the Au plasmon as
well as FITC fluoresce recovery by 2h ........................................................................................116
Figure 5.6 Fluorescence microscopy images of A375 melanoma cells at 2, 4, 8, 12, and 24 h
post-transfection with (A) MGP-TAT-FITC and (B) MGP-DHLA-NB. Differential interference
contrast (DIC), fluorescence, and composite overlay images are shown for each time point.
Scalebar: 100 μm .........................................................................................................................118
Figure 5.7 Analysis of A375 cellular internalization of the MGP-bioconjugates via microscope
fluorescence for MGP-DHLA-NB (red ○) and MGP-H6*TAT-FITC (green ●) as total intensity
per cell, over the 24 h experiment. Corresponding sigmoidal fits indicated by solid lines for the
MGP-DHLA-NB (red) and MGP-H6*TAT-FITC (green) data points, respectively ...................119
Figure 5.8 Superconducting Quantum Interference Device (SQUID) measurements of magnetic
moment saturation for collected A375 cell pellets (1 million cells) at 24 h post transfection with
MGP-C*TAT (♦) and MGP-DHLAlipo (□). The “M” on the y-axis represents magnetic moment
and the “H” on the x-axis represents magnetic field strength ......................................................120

xv
ABSTRACT
Nanoparticle based cellular therapies hold great promise for clinical applications and
medicinal use in human patients by allowing for targeted delivery of a personalized medicine
payload to specific cells and tissues in a variety of disease states. The large surface to volume
ratio of solid inorganic nanoparticles and the availability of facile surface functionalization
chemistries with gold, gold-coated, and semi-conductor nanoparticles enables the design of
delivery agents which can simultaneously carry a targeting molecule, such as an antibody or cell
penetrating peptide (CPP), a short oligonucleotide for RNA interference or intracellular sensing,
and a full gene for genetic therapy to correct aberrant protein function or cause apoptosis of
cancer cells. The scope of applicability for nano-therapy technology is incalculable, however
current understanding of the intracellular uptake and processing of nanomaterials-based
therapeutics is limited and many facets of the cellular response to nanoparticle therapy are still in
need of investigation. The goal of this dissertation work has been to elucidate the effects of
nanoparticle-based therapeutics to ascertain the intracellular fate and processing of model
nanomedicines by designing nanoparticle-bioconjugates capable of spatiotemporally reporting
live intracellular uptake and processing events using fluorescence microscopy, and magnetic
detection. The first chapter gives an introduction to nanoparticles and their use in biological
applications, as well as detailing how they can be used as intracellular sensors. The second
chapter investigates the ability to control therapeutic DNA cargo release from a gold
nanoparticle in live cells using different appendage chemistries. The third chapter probes the
intracellular environment experienced by the nanotherapeutic and discusses nano-induced effects
to the intracellular environment. The fourth chapter investigates nanotherapy cellular uptake
targeting using cell penetrating peptides, as probed by fluorescent quantum dots, to determine
outcomes for a variety of naïve and drug resistant mammalian cell lines, include human lung,
skin and brain cancers as well as rodent cancer model cell lines. The fifth chapter combines
optical and magnetic analysis techniques to investigate multiplexed sensing with gold shelled
iron oxide nanoparticles to investigate cellular uptake. And the last chapter summarizes the work
and provides a discussion of the outlook for the work.

1
CHAPTER 1
INTRODUCTION
1.1 Background of Nanomaterials for Biological Applications
Since the beginning of time, humans have been motivated, both by curiosity and the need
for survival, to learn from and manipulate the world around them. Through this, mankind has
honed the skills needed to recognize patterns, design tools, and concoct medicines to improve
quality of life and expand the collective human intellect. Today those same skills are used in the
pursuit of scientific insights. Driven by the fundamental desire to more deeply understand the
physical world and to put that knowledge to practical use, scientific inquiry has led to great
advances in knowledge, technology, and medicine.8,9 One of the most noteworthy fields of
advancement, which spans all three categories, is the development and study of nanomaterials
for biological and medical application.
Figure 1.1 Comparative scale of common biologically relevant objects, molecules, and
nanoparticles, versus punctuation.
Materials fabricated at the nanometer scale have unique size-dependent physical
properties and have the added advantage of being similar in size to biologically relevant objects
and molecules (Figure 1.1). The term “nano” is used as the shorthand for the unit nanometer,

2
where nano- is the Greek prefix that denotes a unit one that is billion times smaller than the root
unit of meter, when referring to size. Objects on the nanometer scale are at least 100 times
smaller than the width of a human hair (~100 µm), and in the field of nanoscience, it is
convention that a true nanoparticle is between 1-100 nm in diameter. This makes nanomaterials
similar in size to biological macromolecules such as proteins and nucleic acids, as well as small
cell structures, like ribosomes, while still being smaller than the smallest animal organelle, the
mitochondria (~500 nm) (Figure 1.1). Added to the utility of the nanometer size regime, is the
unique collection of physical phenomenon that occur in materials solely at the nanometer size
scale.10 These properties include unique interaction with electromagnetic radiation, in the form of
enhanced photoluminescence, absorption, and magnetization -- depending on the material; as
well as otherwise uncommon shape morphologies (not seen in the bulk-scale material) that can
allow for catalytic activity and reactive surfaces for appending molecules of biological
interest.11–13 Nanosized materials also have large surface to volume ratios which provide
optimum area for functionalization with biologically useful molecules.14,15 For these reasons
nanometer sized materials are particularly valuable for interacting with individual living cells
and directly delivering therapeutic or sensing agents for treatments and diagnostic purposes
(Figure 1.2).
Figure 1.2 (A) General schematic of multi-biofunctionalized nanoparticle (NP) for diagnostic
and therapeutic cellular applications with appended peptide for cellular targeting, and diagnostic
or therapeutic fluorescent dye-labelled drug and nucleic acid molecules. (B) General pathway of
NP cellular uptake and processing, showing endosomal encapsulation, processing, escape and
disassembly of the NP construct to recover dye fluorescence, and potential exocytosis.

3
Gaining better understanding and more control over nanomaterials’ surface functionalization
chemistry, as well as insights into cellular uptake and processing will provide new mechanisms
for specifically tailoring nanomaterials for individualized therapeutic approaches. Eventually
leading to the design of materials with the ability to diagnose intracellular conditions as
indicators of disease, deliver therapeutic cargo to treat or reprogram unhealthy cells, or target and
specifically destroy nuisance cells, like cancers. The overarching goal of bio-nanomaterials
research is to develop and deploy an army of “smart” nano-medicines which are able to infiltrate
cells of interest, reconnoiter health status, and complete therapeutic missions to benefit patients,
at the cellular level. A major benefit of the eventual realization of these nanotherapeutic
technologies will be a cessation of the dreaded pharmaceutical “side-effects” that are so
prevalent in modern medicinal approaches which use small molecule drugs that are systemically
delivered to circulate the whole body, as they often have numerous non-target interactions,
causing cascading needs for additional drugs to combat unwanted symptoms.16,17 Thus, the ideal
utilization of nanomedicine will take healthcare to the next level of sophistication and improve
quality of life for all mankind. The first step to actualizing this utopic goal is to fully understand
the physical and biological implications of these nanomaterials, as well as to recognize what
tools are available to control and optimize their efficacy.
1.1.1 Nanomaterials: History, Composition, and Physical Properties
Millions of years before humans could fathom designing or using nanomaterials, nature
had engineered nanometer-sized structures into the scales of butterfly wings, the pads of lizard
feet, and the surfaces of lotus leaves and shark skin, for their optical, adhesive, and
antifouling/antimicrobial properties.18,19 In the last few thousand years humans took note of
substances that possessed these advantageous properties and began to inadvertently use
nanomaterials in decorative paints, the coloring of glass, and as homeopathic elixirs, due to their
vivid colors and healing effects.20 It has only been in the last century that scientific technology
has advanced to the state that nanoparticles can thoroughly be investigated.
The Chemist and 1925 Nobel Prize in Chemistry winner, Richard Adolf Zsigmondy, was
the first person to be able to understand the mechanism of how gold salts, when heated,
incorporated into molten glass to yield red “ruby” or “cranberry” glass, which gains its signature

4
color from the gold nanoparticles suspended in the glass matrix.21 Zsigmondy was able to
determine that small colloids of gold were responsible for the red color of “ruby” glass though
analysis using the ultramicroscopy technique he developed, where incident light is scattered by
the nanoparticles embedded in the glass. This was one of the first demonstrations of the ability to
characterize materials at the nanoscale.8 And evidence that nanometer sized materials could
possess vastly different properties from the bulk and atomic material, as bulk gold and ionic gold
salt are both golden-yellow in color, in contrast to the gold nanoparticles which clearly interacted
with light in a much different way to yield its brilliant red appearance.
Another stunning and ancient example of colloidal nanoparticles providing unique
aesthetics to glass can be seen in the Lycurgus Cup (Figure 1.3A)22 which was made with gold
and silver NP-embedded glass around the fourth century; the combination of these metallic
nanoparticles give the appearance of green glass when illuminated from the outside but
iridescent red glass when illuminated from within. The reason metallic nanoparticles (those
composed of gold, silver, copper, etc.) can have such striking iridescence and vivid coloring is
because at the nanoscale these metals develop a phenomenal property called local surface
plasmon resonance (LSPR), where the large number of surface metal atoms that loosely hold
their valence electrons, relative to the number of internal core metal atoms of the nanoparticle,
gives rise to a so called “sea of electrons” that freely oscillate in an electromagnetic field and
generate these unique interactions with visible light (Figure 1.3B).23 Complimentarily, the LSPR
of the metal nanoparticles also create unique light absorption profiles for each metal particle,
giving a signature plasmonic peak with some ability to discern even the approximate size of the
particle based on breadth of the peaks relative to its maxima when plotted as a function of the
molar absorptivity (ɛ), also known as the extinction coefficient (Figure 1.3C).24–26 This is due to
the resonant frequency of the plasmon being determined by the elemental composition of metal
nanoparticle, but the intensity being related to the overall number of aligned surface atoms able
to resonate constructively in the electromagnetic field, which decreases with decreasing particle
size due to the curvature of the surface becoming more severe as well as there being a larger
proportion of surface defects present at smaller nanoparticle sizes.
A more complete understanding of such insights has only recently been made possible
due to advances in technology and the instrumentation necessary to observe these physical

5
A
B
C
Figure 1.3 (A) Nano-gold and -silver embedded glass of the Lycurgus Cup (c. 4th century AD)
under room light (i) and illuminated from within (ii) showing the unique optical properties of
metal nanoparticles (Image: Public access from Trustees of the British Museum). (B) Schematic
of the local surface plasmon resonance of a metallic nanoparticle depicting the sea of electrons
oscillating in the electromagnetic field. And (C) visible light absorbance spectroscopy of gold
nanoparticles with radii of 8.5 nm (light grey), 4 nm (dark grey), 3.3 nm (pink), 2.15 nm (red),
1.5 nm (green), and 0.95 nm (gold), showing the optical effect of NP size, plotted as molar
extinction coefficient versus wavelength.

6
phenomenon, only seen in nanomaterials, and to test and validate the theory behind their unique
behavior. The most important analytical technique to allow nanomaterials research to be
validated has been electron microscopy, and particularly transmission electron microscopy
(TEM), invented in 1931 by Max Knoll and Ernst Ruska.27 TEM allows for imaging of
nanomaterials down to 2 nm in diameter, for elements with a large Z-number (or the number of
protons in the nucleus) which determines how much X-ray radiation will be reflected to produce
the negative image of nanoscale materials for the determination of their size, shape and
elemental composition. Similarly, dynamic light scattering (DLS) allows for detection of the
hydrodynamic radii of the NP and the surface charge can be measured by collecting the zeta-
potential, allowing for more information to be collected about the nanoparticle including its
hydrocarbon surface coating ligands (responsible for much of the functionality as well as the
colloidal stability of the nanomaterial), which are not visible to TEM due to their low Z-number.
Despite the discovery of the leading principle of DLS, Brownian motion, in 1920, the
commercial instrumentation was not available until after the invention of the laser in the 1960s,
which allowed for precise scattering of light calculations to be performed.28–30 In addition to the
innovation of the analytical tools needed to probe the physical properties of nanomaterials,
interest in the investigation of nanomaterials and nano-specific phenomenon for the development
of new technologies and medicines was ignited by a series of scientific philosophers in the mid-
to-late twentieth century. The first and most noteworthy of which was Richard Feynman, when
in 1959, he gave his historic invitation entitled “There’s Plenty of Room at the Bottom” which
challenged scientists with the notation that useful nanometer-sized structures and machines could
be purposefully created through the direct manipulation of atoms. He also went a step further and
charged innovators to translate this philosophical discourse into reality by promising a large
monetary prize from his own resources to the first person to make a rotating electric motor
smaller 1/64 inch cubed or write a page of a book on a pin head, with an optimism that it could
be accomplished in short order.31 Both undertakings were completed in his lifetime.32,33 Others,
such as Norio Taniguchi and Eric Drexler, also caught the vision that Feynman had and helped to
solidify the term “Nanotechnology” (in 1974 and 1986, respectively) to be defined as the field of
research and innovation devoted to creating and utilizing materials at the nano-scale.32,34,35
Also in the 1980s, a similarly crucial leap in the development of nanomaterials science
was made with the discovery and demonstration of the quantum confinement effect experienced

7
by semiconductor nanocrystals, termed quantum dots, by L.E. Brus.36 Brus discovered the band
gap energies of aqueous CdS crystallites was dependent upon the particle size, where the bulk
semiconductor (Figure 1.4A) displayed a distinctively smaller band gap energy (and thus lower
energy photophysical properties) as opposed to nanometer sized semiconductor crystals, which
demonstrate higher energy band gaps as the particles become smaller in diameter (Figure 1.4B-
D), due to the quantized energy levels being pinned by the particle size as it nears the exciton
Bohr radius.
Figure 1.4 Schematic diagram of semiconductor materials and their energy levels in (A)
macroscopic “bulk” semiconductor crystals with continuous energy bands. And quantized energy
levels of nanometer sized semiconductor nanocrystals showing (B) 6-4 nm diameter with red
emission, (C) 4-2 nm diameter with green emission, and (D) 2-1 nm diameter with blue
emission, for CdS quantum dots.

8
This means that the small physical parameters of the crystal lattice at the nanometer size scale
cause limitations for the separation distance of an excited electron and its counterpart “hole,”
thus predetermining the possible energy released by the recombination of the exciton (electron-
hole pair) for a particular size of QD, making the wavelength of emitted light dependent on size.
These quantum confinement effects can be explained as a three-dimensional “particle in a box”
model.36 Due to the discrete energy pinning quantum confinement effect, quantum dots possess
very narrow emission profiles with large absorption cross-sections.37,38 Paired with their high
photostability compared to organic dye fluorophores, QDs are ideal colorful multiplexable
photoluminescent agents for biological investigation, such as labels for fluorescent microscopy
and as indicators in diagnostic applications.39–41
In addition to metallic and semiconducting nanocrystals, which possess unique optical
interactions with electromagnetic radiation, investigation of nanoscale magnetic materials, such
as iron oxide, nickel, and cobalt, have led to great innovation in the utility of nanomaterials for
diverse applications in medicine and technology.42 The physical founding of magnetic materials
results from the atoms of magnetic materials possessing unpaired valence electrons which
generates a net “spin” direction, or polarity, for the electrons of each atom, known as the
magnetic dipole moment.43 For bulk magnetic materials, the larger number of atoms in the solid
crystal lattice allows for the formation of multiple regions or “domains” of atoms that align their
magnetic dipole moments in the same direction, in the absence of an external magnetic field. The
ability to form multiple magnetic domains is due to the majority of magnetic materials
possessing a magnetic “single-domain” size in the nanometer size-regime, which is much smaller
than the bulk crystal.44 However, all bulk magnetic materials possess some degree of disorder,
thus there is non-uniform orientation of the multiple magnetic domains, with some fraction of the
magnetic dipole moments partially or completely cancelling one another out, and the net effect is
diminished total magnetic moment observed for the material (Figure 1.5). Thus, magnetic effects
can be enhanced for nanoparticles of the single-domain size for the magnetic material, over the
bulk, due to the unity of magnetic spins aligning in a single direction. One such example of
magnetic enhancement at the nanoscale is the generation of superparamagnetic iron oxide (SPIO)
nanoparticles, where due to the quantum confinement of their surface spins, they are able to
respond to a magnetic field, despite net magnetic moment not being observed in the bulk
material (i.e. rust).45

9
Figure 1.5 Alignment of magnetic dipole moments in magnetic crystals from superparamagnetic
and single-domain nanoparticles to multi-domain bulk sized magnets.
For the abovementioned reasons, the prevalence of nanoparticle use has recently
exploded, not only for the study of their unique physical properties, but also for the creation of
enhanced materials, as well as for diagnostic and therapeutic biomedical applications.
1.1.2 Nanomaterials for Biological Sensing & Therapeutic Applications
Since the first herbal remedy for an illness was prepared in ancient times, the medicinal
community has been relentlessly in search of more effective compounds, drugs, and therapy
agents to treat the specific ailments of patients. In modern times this effort has been rebranded as
a search for “personalized medicine,” which would treat each illness of each patient on an
individual level. The goal of which being to forego problematic secondary interactions of
therapeutic molecules, or their necessary emulsifiers and binding agents, with non-target
biological elements which give rise to the dreaded “side effects” for which current
pharmaceuticals are infamous.16 In most cases the majority of modern pharmaceutical side
effects can be minor, such as binding a non-target receptor and causing headache, nausea, etc.;
but in some severe cases, especially those where an allergic reaction occurs, the side effects can

10
be life threatening anaphylaxis, paralysis, or irreversible neurological damage.46 Thus, the need
for innovation of new biomedical treatment and diagnostic approaches is highly needed.
Currently, many forms of biomedically interesting nanometer sized particles exist, from
both natural and anthropogenic origins, including viral particles made primarily of nucleic acids
and proteins, and synthesized nano-aggregates composed of lipids, polymers, biomolecules or
combinations thereof.47–49 However, the field of synthetic inorganic nanoparticles (composed of
metals, metal-oxides and semiconductor nanocrystals) holds numerous biological and
commercial advantages over these other systems, which do not possess the same threshold of
engineered control over therapeutic or diagnostic utility, and lack the toolbelt of tunable physical
properties that inorganic nanomaterials possess.15 Examples of these include the enhanced
optical and electronic properties of metal nanoparticles, sharp photoluminescent properties of
semiconductor quantum dots made biologically useful with a zinc sulfide capping layer, and
superparamagnetic iron oxide (SPIO) nanomaterials which can be made biologically compatible
with an inert gold shell. These nanomaterials not only easily bind biologically relevant molecules
to their surface for efficient therapeutic delivery, but also each possess unique visualization and
analysis capabilities, not available in other delivery platforms, which allow them to be
superlative biological sensors and probes of intracellular nano-therapeutic delivery.
Due to the strong plasmonic properties of gold nanoparticles (AuNP) they are not only
able to absorb large amounts of energy which has applications in directed ration therapy50 and
cavitation51 via local heating for anti-cancer therapies, but AuNPs are also able to energetically
couple to fluorescent dipoles (i.e. fluorophores) and non-radiatively absorb the energy of their
excited state relaxations, effectively “quenching” their fluorescence at distances described by
Surface Energy Transfer (SET) theory (Figure 1.6)26,52,53 expressed by Eqn. 1.
𝐸𝑆𝐸𝑇 = 1
1+(𝑑
𝑑0)4
(Equation 1)
where E is the efficiency of Surface Energy Transfer (with 1 signifying 100% quenching and 0
signifying unquenched dye emission), d is the distance between the AuNP surface and
fluorophore, and d0 is the distance at which point 50% of the fluorophore’s energy is transferred
to the AuNP non-radiatively.

11
Application of this theory allows for dye labelling of therapeutic cargo attached to the
surface of an AuNP in order to monitor cargo release as well as to design and assess aptamers for
binding molecules of biological analytes, in complex environments.54–57 Additionally, the use of
multiple fluorophores with different photoluminescent profiles allows for the creation of
coordinated sensing responses to analytes and events using Multicolor SET (McSET),56,58 which
can be used to dynamically track the delivery of differentially coupled short DNA and linearized
plasmids into human cancer cells. The use of SET and McSET AuNP cellular nano-deliver
agents provides information about the release rate dynamics and spatial location of the
therapeutic cargo during the entire transfection process when monitored by fluorescence
microscopy or similar techniques.
Figure 1.6 Schematic representation of Surface Energy Transfer, where the 6 nm AuNP is able
to non-radiatively quench emission from the excited fluorophore (fluorescein amidite: FAM)
appended to a DNA molecule at the 35th base pair away from the synthetic 5’ thiol attachment to
the AuNP surface, a distance specifically chosen to correlate with the D0 of 160 Å for the
AuNP6nm–FITC pair.
When dye labelling of the therapeutic cargo is not feasible, due to potential chemical
interactions or loss of therapeutic efficacy, the ability to use a luminescent nanoparticle delivery
agent, such as a semiconductor QD, is invaluable. Additionally, a complimentary non-radiative
energy transfer technique employable by QDs and other fluorophores is Förster’s Resonant
Energy Transfer (FRET), which describes the coupling of two or more fluorescent dipoles,
where a lower energy emitting fluorophore acts as a non-radiative energy acceptor from a higher

12
energy emitting donor fluorophore while the molecules are within close proximity. Thus,
luminescent QDs have been used in a variety of delivery and sensing applications, as well as
finding a place as diagnostic indicators.59–63
Magnetic nanoparticles find their nitch in their unique ability to act as facilitators of
magnetic transfection and cell sorting, along with being useful for anti-cancer therapy, as well as
contrast agents for magnetic resonance imaging (MRI) to trace NP location and processing in a
live organism.64 In the former, cells can be transfected with a magnetic nanoparticle construct
and internalization of the magnetic material can be augmented by application of a gentle
magnetic field to physically direct the nanoparticles into the cells of interest, and once taken-up
the magnetic particles can facilitate the translocation of the entire cell which is physically drawn
toward the applied magnet by the ingested magnetic particles; alternatively specific antibodies
can be attached to the MNP surface to allow for sorting without internalization. This technology
has applications in cell culturing and genetic transformation technologies, where traditional
transfection and cell sorting techniques are not as straightforward.65 In clinical applications,
cancer cells permeated with MNPs can be subjected to an oscillating magnetic field, which
causes physical movement of the particles and thus damage to cancerous cells.66 Less invasive
studies utilizing MNP therapeutics, where light cannot penetrate tissues or optical signals are not
detectable above the background, utilize MRI to quantify uptake and identify the biodistribution
and fate of nano-therapeutics.67,68
Thus, the creation of nanoparticle-based therapeutic, imaging, and sensing materials for
biological and biomedical application holds great promise. Investigation into the fundamental
interactions of nano-bioconjugates with biological systems will lead to insight and innovation in
the design of better nano-therapeutic agents, leading to better healthcare options for future
generations.
1.2 Characterization of Nanomaterial-Bioconjugates
In order to assess the properties and efficacy of nanomaterials for therapeutic
applications, the synthesis of nanomaterial-bioconjugate agents must be followed by strict
scrutiny of quality, uniformity, and physical properties as assessed by physical characterization
techniques. Determining the physical properties of materials at the nanoscale present unique
challenges in that their size regime is far below the threshold of human senses, and they are even

13
too small to be visualized at the highest magnification of a light microscope, due to being smaller
than the average wavelength of visible light (~500 nm). Residing between the molecular scale
and bulk matter, nanomaterials require unique approaches to determine their size, shape, and
electromagnetic properties. For these reasons special characterization techniques have been
developed to assess the nature of the synthesized nanomaterials and evaluate the success of the
attempted bioconjugations.
1.2.1 Size and Shape Analysis
The unique properties of materials at the nanoscale are greatly dependent on the size and
shape of the nanoparticle. For instance, semiconductor materials at the nanoscale are termed
quantum dots (QDs) due to the differences observed in their optical properties as compared to
the bulk materials which are due to quantum confinement of their semiconductor band gap. This
quantum effect that takes place at the nanoscale, creates unique absorbance and emission profiles
based on particle diameter, even for materials with the same chemical composition.69
Additionally, gold nanoparticles (AuNP) have a molar absorptivity, also known as the extinction
coefficient (ɛ), that scales with the volume of the particle, as well as local surface plasmon
resonance (LSPR) that is highly dependent on shape, with different absorbance maxima profiles
for spheres versus rods and star shapes, giving these shapes unique heating profiles under
infrared (IR) radiation illumination.70 Gold has even been observed to show emissive behavior
when restricted to the size of molecular clusters.71 Magnetic nanoparticles (MNP) have specific
single domain sizes, which can enhance or hinder the magnetism of particles of sizes at, above,
or below the single domain size.44 Shape variations in MNPs can cause anisotropic, or
orientation-dependent, effects on the interaction of the nanomaterial with a magnetic field.72 The
shape of particles can not only have effects on particle heating rates, and electromagnetic
properties, but can also effect therapeutic and sensor cargo loading levels and cellular uptake of
nanoparticles.73,74 Additionally, the uniformity of nanomaterial preparations can greatly affect
the ability to collect meaningful ensemble averages from optical, magnetic, and mass based
measurements in cellular and animal model experiments. Thus, accurate characterization of
nanomaterials after synthesis and functionalization is paramount for application reproducibility
and proper interpretation of experimental findings.

14
The ability to visualize matter that is smaller than the wavelength of visible light (i.e. less
than 0.5 µm in diameter), is of paramount importance to the field of Nanoscience and allows for
the elucidation of previously invisible phenomenon, such as the growth pattern, structure, and
composition of nanomaterials at fixed points in time. In 1931 the first Transmission Electron
Microscope was designed by Max Knoll and Ernst Ruska, with commercial implementation
taking place by the 1940s.27 Transmission Electron Microscopy (TEM), allows for this
visualization at the nanoscale because, rather than the typical white light illumination of a
traditional light microscope, TEMs use a columnated beam of electrons to illuminate materials.
Since the de Broglie wavelength of an electron beam (found by the equation: λ= h/p, where λ is
wavelength, h is Planks constant and p is the momentum of the electron wave) is ~0.01 nm,
being three orders of magnitude smaller than visible light (500 nm), it provides near atomic
resolution of nanosized structures. Additionally, the principles of diffraction can be applied to
assess the elemental identity of the sample using electron diffraction spectroscopy (EDS), so that
sample size and composition can be obtained with the same technique.
Some limitations exist for TEM, such as the preference for a large atomic z-number or
multiple layers of atoms in order to provide good contrast against the background grid, typically
composed of a carbon mesh. The importance of this is increased at very small particle sizes,
making the effective limit of detection on most TEMs around 2-5 nm in diameter. TEM also
suffers from a lack of dimensionality in the images generated, which can lead to
misidentification of nanomaterial structures that are not imaged from multiple orientations, i.e.
plate-like nanomaterials could be misinterpreted to be spheres, or nanoparticles with non-
uniform projections may appear to have a smaller or larger average size than is truly
representative. To help combat this limitation, Scanning Electron microscopy was developed in
1938 by Manfred von Ardenne.75 Although these techniques are powerful for NP analysis, they
are still limited to visualizing elements with large nuclear proton densities that are capable of
scattering the electron beam in a detectable pattern.
The physics of particle diffusion in a solution was first observed by Robert Brown in
1827,76 shortly before his discovery of the cellular nucleus in 1833, and has come to be known as
the phenomenon of Brownian Motion. Brown observed that where larger objects tumble in a
solution, they do so at a slower rate than smaller particles in the same solution (with the same

15
viscosity). Later Albert Einstein further developed the “Quantitative Theory of Brownian
Motion” in 1905 in order to mathematically represent the nature of particulate diffusion (Eqn. 2):
𝑃 = 𝑒−𝑥2/4𝐷𝑡
2√𝜋𝐷𝑡 (Equation 2)
Here P is the probability density for a particle, moving a certain distance, x, in a given time, t. D
is the coefficient of diffusion for the solution, and is equal to one-half the average of the squared
displacement in the x-direction.
Additionally, nanomaterials passivated with coordinating ligands (biologically relevant
surface coating molecules, DNA, peptides, etc.) of various size and charge profiles can also be
analyzed by utilizing a dense matrix, such as agarose or polyacrylamide gel made in an isotonic
buffer, and applying an electrical current across the gel field to propel the loaded bioconjugated
nanomaterial of interest through the matrix gel as a function of size and relative charge. Gel
electrophoresis is an indispensable biochemical analysis tool and has been used extensively in
the study of DNA, RNA and proteins for more than half a century. The technique was originally
developed by Oliver Smithies in 1955 to study protein size.77 In the case of biologically coated
nanomaterials, an important characteristic that can be determined by electrophoresis is the
relative retention of the NP in the gel as an indicator of covalent or dative ligand attachment, as
opposed to electrostatic ligand association with the surface of the NP. A mobility limited or
retained bioconjugated NP (as compared to the as-synthesized NP counterpart) is indicative of a
larger total particle size, including ligands, that cannot move through the gel matrix as easily as a
more compact counterpart. Since the NP core size and net charge is not expected to change under
ambient conditions, the increased gel retention is attributed to the increase in size and number of
biological passivating ligands. Electrostatically bound ligands, on the other hand, are not able to
maintain their association with the NP surface in the presence of an electric field and thus are
said to “rip” off the surface of the NP, causing a loss of aqueous solubility of the NP, and no
movement beyond the loading well for the NP. Alternatively, ligands and biomolecules with
limited stability may be removed by the gel matrix at an unpredictable rate causing a smear of
the bio-nanocomplex with differentially decomposed complexes being represented at near
continuous size intervals, this is opposed to stably bound biomolecules on a nanocomplex that

16
may display a broad but single band, with broadness due to inhomogeneity of the number of
bound ligands (Figure 1.7).
Figure 1.7 (A) Schematic of principles for gel electrophoresis, showing applied current from
negative above the wells, to repel negatively charged molecules, to positive at the bottom to
attract molecules through the gel matrix, as well as representative post-run pattern of (i) as-
synthesized aqueous AuNPs with tight band, (ii) stable large appended biomolecules with single
broad band, (iii) stable smaller appended biomolecules with single broad band, and (iv) unstable
appendage with biomolecule removal by the gel matrix displaying a continuous smear. (B)
Photograph of AuNP-bioconjugates with stable (i) for as-synthesized passivating ligand, (ii)
mono-thiol, (ii) dual thiol, (iii) thiol plus amine bidentate attachment of 30mer DNA, and
unstable (iv) dual amine, and (v) mono-amine attachment of 30mer DNA.
1.2.2 Physical Properties of Nanomaterials Assessed by Spectroscopy
As introduced previously, nanoparticles exhibit unique behavior in the presence of
electromagnetic radiation, including the strong absorption profile and proximal dipole quenching
from the plasmonic resonance of metal NPs, as well as the band gap size-dependent
photoluminescence profiles of semiconductor quantum dot nanocrystals. For these reasons, some
of the most useful characterization of nanomaterials can be accomplished using Ultraviolet-
Visible (UV-Vis) absorption spectroscopy and Photoluminescence (PL) emission spectroscopy.
These analytical tools have been well utilized for decades in a variety of chemical systems, with
the very first spectrophotometer being invented by Arnold O. Beckman and his colleagues at
National Technologies Laboratories (later the Beckman Instrument Company) in 1940,1 and the
first spectrophotofluorimeter being invented in 1956 by Robert Bowman at the National

17
A
B
Figure 1.8 Original schematics of (A) Beckman DU spectrophotometer c. 1954,1,2 and (B)
Amnco-Bowman spectrophotofluormeter (Images: Public access from the NIH Archive.)3

18
Institutes of Health.78 Despite the relatively simple design of these instruments, (using light,
mirrors and gratings which can be seen in the schematics in Figure 1.8), UV-Vis and PL
spectrophotometers can provide a wealth of information about nanoparticle solubility, size or
shape uniformity, proximity to passivating ligands, and of course, concentration according to
Beer’s Law (Eqn 3).
𝐴λ = 𝜀λ𝑏𝐶 (Equation 3)
Where A is the absorbance at a given wavelength (λ), ε is the molar absorptivity, or “extinction
coefficient,” at the chosen wavelength (λ), b is the pathlength that the light travels (i.e. the
diameter of the cuvette), and C is the concentration. This can be especially important for
biologically conjugated nanomaterials as they are often prepared in small aliquots due to the high
price or complexity associated with obtaining certain biological molecules.
Another useful spectroscopic method of investigation for ascertaining information about
ligand binding to nanoparticle surfaces is Infrared (IR) absorption spectroscopy, which probes
the vibrations of chemical bonds. The absorption of infrared (IR) radiation is most apparent in
the stretching and bending vibrations of molecular bonds, making IR, or more commonly Fourier
transformed (FT-IR) spectroscopy useful to determine bonding and covalent attachment of
ligands and appended biomolecules to the nanoparticle surface or to attached anchoring groups
that have been pre-tethered to the nanoparticle surface. Complimentarily, Nuclear Magnetic
Resonance (NMR) spectroscopy measures the magnetic relaxation of the atomic nucleus after
being pulsed by a radio frequency, which is affected by the electronic environment of the atoms
and gives information about the atomic neighbors of a given atomic nucleus, indicating what
binding environments are present. Additionally, since the rate of hydrogen exchange for
deuterium in primary amines is quite rapid,79 it can also be ascertained that a primary nitrogen is
bound to a sterically hindering NP surface if the resonance peak of a primary amine is recovered
upon addition of the NP to the compound or biomolecule.
1.2.3 Magnetic Characterization
Bioconjugated nanomaterials with a magnetic dipole moment can be characterized using
unique analytical technology of a Superconducting Quantum Interference Device (SQUID),
developed for bulk materials as recently as the 1960s and applied to nanomaterials just in the last

19
few decades.45 This instrument can be used to measure the magnetic moment of a material per
mass when exposed to a magnetic field, as well as thermal and magnetic field strength
dependence of the nanomaterial. In this way, biological ligand binding and biocompatible gold-
shelling of magnetic nanomaterials can be assessed for their effects on the magnetism and
downstream applications of magneto-nano-bioconjugates.
1.3 Nanomaterials in Cellular Applications
The ability of nanometer sized materials to interact with biological systems at the cellular
level is unparalleled above the molecular scale. This gives nanoparticle-based cellular diagnostic
and therapeutic technologies a unique niche to allow for multiplexing of sensors, therapies and
cellular manipulation tools housed in a single entity, while still being small enough to enter,
probe, deliver, and alter health conditions at the individual cell level. With the near limitless
potential of nanoparticle-based cellular therapeutics and sensors, several design considerations
become paramount to the creation of functional probes and delivery agents. The first of which is
the mode and mechanism of cellular entry, as no intracellular sensor or therapeutic agent will be
effective if denied access to the intracellular space, which is the prime occupation of the plasma
membrane. Thus, understanding cellular uptake and processing, as well as equipping NP agents
with adequate cellular targeting and transduction tools is the most necessary and first step to
successful nano-biosensor and nanotherapeutic design.
An equally important design consideration involves assessing realistic versus idealistic
treatment and sensing goals. Although a nanoparticle can theoretically accommodate numerous
different types of molecules simultaneously, sensor analysis is dictated by the ability to detect
and resolve the signal over the background, regardless of methodology (fluorescence, mass,
magnetism, etc.), limiting the number of analytes or intracellular conditions that can be reliably
detected in a single pass. Similarly, therapeutic approaches must overcome cellular defense
mechanisms to be effective. Thus, loading particles with several redundant sensor or medicinal
molecules becomes advantageous to optimize detectability and efficacy, so contemplation on
what specific tasks the NP agent is to perform and what limitations will be faced by the therapy
or analysis approaches of the sensor is crucial.
Finally, the fate and elimination of the NP agent must be considered, as the end-goal of
nanotherapeutic and diagnostic technologies predominantly envisions use in patients or live cell

20
samples, where bioaccumulation and material toxicity become vital factors. Thus, agents must be
small enough to escape cells and cleared by the renal system, and/or non-toxic and able to be
broken down and used or excreted by biochemical pathways.
1.3.1 Cellular Uptake and Nanomaterial Trafficking
In order for any therapeutic to be effective, the biologically active agent needs to be able
to access the intracellular target that it is designed to act upon. For bio-active nanomaterials this
means that the NP must not only be loaded with the therapeutic molecule but must also be
equipped with agents that assist in rudimentary cellular targeting and facilitate entry into the cells
requiring treatment. A few studies of peptide and protein functionalized nanomaterials have
reported direct cytosolic delivery, but the mechanisms of this process are not well understood.80–
82 The majority of known NP cellular-uptake mechanisms involve some form of endocytosis,
where the bio-nanomaterial construction is encapsulated by a portion of the cellular plasma
membrane prior to entering into the intracellular space within the endo-lysosomal pathway
(Figure 1.9A).83 The endo-lysosomal pathway provides cells with an innate defense against
pathogens, such as viruses, as well as provides a mechanism for cellular digestion of foreign
materials and transport of nutrients throughout and then outside of the cell via exocytosis. As
understood from decades of research into cellular biology, the typical progression and processing
of exogenous material by cells (Figure 1.9B) follows the path of membrane association (which
may be mediated by cell surface receptors or electrostatic interactions with sticky glycoproteins),
followed by encapsulation of the foreign matter (via clathrin or caveolin mediated, or
independent invagination of the phospholipid membrane).84 Once the transfected material is
packaged within the cell it is trafficked to an early endosome (pH ~7-6), which acidifies to a late
endosome (pH ~6-5) through membrane fusion events with acid and enzyme containing vesicles,
and finally the endosome fuses with a lysosome (pH ~5-4.5) in order to be fully degraded.85 Any
molecular building blocks are recycled to the endoplasmic reticulum and Golgi network and
unusable molecular debris is transported out of the cell.
As one can imagine, if a therapeutic agent never leaves this pathway, there would be no
way for it to interact with its cellular target and accomplish its designed function. Thus, the need
for analysis and understanding of how nanomaterial therapeutics are taken into cells, processed
through the endo-lysosomal pathway, and escape prior to degradation, in order to fulfill their

21
designed beneficial purpose, is vital to the successful design and delivery of functional and
effective cellular treatments.
Figure 1.9 Cellular uptake and processing of exogenous material showing (A) different
mechanisms of endocytosis (Image: adapted from Sandvig, and van Deurs 2002)4 and (B) endo-
lysosomal maturation of encapsulated agent from uptake, transport to early endosome (EE), late
endosome (LE) and fusion with lysosome (LY), with corresponding pH gradients (red: pH 7.4 to
blue: pH 4.5), followed by cellular elimination via exocytosis (Image: adapted from Carnevale
2018).5
1.3.2 Cell Penetrating Peptides & Other Transfection Agents
The delivery of therapeutics for cellular treatments that improve disease states, or
performance of preliminary experimental analysis of the benefits and risks of such therapeutics,
requires that the materials must first be able to incorporate into the cells of interest. This may
seem like a straightforward problem to solve, but millennia of cellular evolution have made cell
membranes very effective at keeping large, polar, non-nutritive molecules and compounds safely
outside of the cell, to avoid disruption of cellular function. In order for the cell to take in what it
needs, the membrane has developed selective and semi-selective membrane pores, ion channels,
and receptor-mediated cellular eating and drinking, known as phagocytosis and macro
pinocytosis, respectively.86,87 Thus, in order to achieve cellular uptake of the designed
nanomaterials, some amount of trickery is required to get the cells to recognize an obviously

22
foreign entity as something desirable for internalization. This can be accomplished by
encapsulating the nanomaterials in lipid or polymeric coatings which hide the true nature of the
nanoparticles from the cell and often allow for direct membrane fusing or endocytic
encapsulation, as with cationic lipid transfection agents, such as the Lipofectamine® and
JetPRIME® families of compounds.88 These commercially available transfection agents are
proprietary concoctions of multiple amine-modified long-chain lipids which bind
electrostatically with the anionic phosphate head groups of the cell membrane. Alternatively, cell
transfection of nanoparticles has commonly been accomplished with methods that utilize various
types of blunt force, in the form of electroporation, micro-injection, and nano-guns, which are
disadvantageous for reproducibility, effective transfection, and overall viability of the cells.89
In recent decades the discovery of cell penetrating peptides (CPPs) isolated from short
transduction sequences of viral sheath and native transporter proteins, and, later, synthetic
derivative sequences, have opened up a new and potentially more effective and less damaging
path for cellular transfection of nanomaterials.90,91 Here, instead of coating particles in gooey
polymers or lipids, which potentially interfere with cellular processing and the intracellular
delivery of the nanotherapeutics, or subjecting individual cells to undue stress using clinically
non-transferrable technology, therapeutic nanoparticle complexes can be coloaded with short
peptides that allow for the potential to not only provide entry into cells of interest, but also to
provide selectivity with peptide moieties that have affinity for specific cell types.92,93
Designing nanoparticle-based transfection platforms that are able to selectively target
human cells of interest using CPPs to deliver therapeutic cargo, and simultaneously report the
location, rates of delivery and processing, as well as intracellular conditions that the
nanoparticle’s cargo encounter, is a transformative goal.
1.3.3 Gene Therapy & DNA Sensors on Nanoparticles
The human genome was fully mapped on April 14, 2003 and has opened the door
to exportation of the genetic origin of disease.94 This combined with the discovery of small
interfering RNA (siRNA) as a defense mechanism in cells to destroy specific RNA sequences
prior to translation into proteins, by Andrew Fire and Craig Mello in 1998,95 has led to great
interest as well as many novel approaches to cancer, autoimmune, and genetic disorder
treatments, as well as for some degenerative and infectious diseases.96–98 A major hurdle of gene

23
therapy is the packaging of medicinal nucleic acids for safe delivery into the target cells, in order
to correct or replace aberrant protein expression (as in the case of cystic fibrosis), or terminate
cells which have lost their apoptotic response factors (as in the case of cancers). The current state
of the art is to use pathogenically inactivated or engineered viral particles,98 which have been
shown to trigger immune response for repeat doses.99 A better platform for genetic medicines
delivery is that of inorganic nanoparticles as they have been shown to protect their sensitive
cargo from degradation and provide the ability to multiplex treatment factors as well as load
targeting agents on a single particle.100–102 For this reason, many researchers have devoted their
efforts to helping to establish non-viral gene therapy approaches.103–110 However, since these
technologies have only just started to be investigated in the last few decades, little is known
about the cellular response to the delivered therapeutics or about the potential efficacy of these
agents. Thus, the use of genetically encoded fluorescent proteins has become a standard model
system for gene therapy, as successful transfection of the delivered gene sequence, followed by
cargo escape from the endo-lysosomal pathway, and proper cellular processing of the delivered
genetic information is required for fluorescent protein turn-on, the method allows for easy
evaluation of success by fluorescence detection.111 Fluorescent proteins are unique fluorophores
in that they are not comprised of a single conjugated ring system, as are most organic dyes, nor
do they behave like photoluminescent semiconductors; instead their unique protein sequences
form secondary structures called beta-barrels, which allow for the exclusion of water molecules
from accessing the internal amino acid residues at the center of the barrel’s center (which would
quench fluorescence) and simultaneously position residues in conformational alignment so that
chromophore producing residues (Ser65, Tyr66, Gly67) are able to be enzymatically oxidized to
form a conjugated system capable of fluorescence upon excitation and relaxation (Figure
1.10A).112 Additionally, after the discovery of green fluorescent protein (GFP) in the jellyfish,
Aequorea victoria, development of all colors (Figure 1.10B), enhancement of brightness, and
ability to detect analytes has also been made possible.6,113,114 In addition to genetic expression as
an indicator of successful delivery, DNA sequences can also be chemically labelled with
fluorophores to assess intracellular location, the cellular environment experienced by the nucleic
acid cargo, and various molecular interactions, as well as probing these questions utilizing the
inherent properties of the NP delivery agents to be used as sensors of the cellular condition post
transfection with nanomaterial bioconjugates.56,57,61,115–119

24
Figure 1.10 (A) Schematic of Green Fluorescent Protein secondary structure and reaction path
for central amino acid residues to chromophore formation (Image: adapted from Frommer,
Davidson and Campbell 2009).6 (B) Photograph of agar plate containing E.coli transformed to
express Enhanced Blue Fluorescent Protein (blue), Enhanced Cyan Fluorescent Protein (cyan),
Enhanced Green Fluorescent Protein (green), Yellow “Citrine” Fluorescent Protein (green-
yellow), mHoneydew (yellow-green), mBanana (yellow), mOrange (orange), and mCherry
(pink) (Image: adapted from Tsien 2010).7
1.3.4 Analysis of Nano-Bioconjugates in Cellular Applications
Visualization of intracellular events has been made possible by the advent of the optical
microscope, also known as the light microscope, which was first built by Anton van
Leeuwenhoek in the late 17th century, and allows for the bending of light through series of
various curved lenses (the combination of which is also known as an objective) to attain
magnification up to 1000 times the original sample size.120 The discovery and development of
this technology has revolutionized, and continues to revolutionize, the study of life at the cellular
scale, a realm invisible to the human eye. Centuries after the initial design was fabricated,
laudable advancements in both the physical mechanics and electronic technology of microscopy
have led to engineering of phase contrast121 and fluorescent microscopic techniques,122 along
with computer software improvement of image quality, as well as automation in collection and
analysis.123 Similar to a spectrophotofluorometer, a fluorescent microscope uses laser or selected
wavelength of light, bounced around mirrors and through optic to excite the fluorophores of
interest, the difference in sample (i.e. complex cell instead of a clean quartz cuvette) necessitates
a sharper collection angle than the 90° used in a spectrophotofluorometer, and in fact, fluorescent
light is collected back along the light path using a series of cut off filters and dichroic mirrors

25
(Figure 1.11A). The ability to detect fluorescent agents within complex cell environments allows
for more in depth investigation of cellular biology through the use of cell-structure specific
labelling technologies and multichannel and overlay image collection. Here the cellular nucleus
and plasma membrane can be stained with a fluorescently labelled affinity probes, and cellular
events can be resolved with differentially labelled fluorescent dyes and emissive QD agents
(Figure 1.11B). Additionally, the use of the live-cell chamber (which provides physiological
temperature, humidity and CO2 atmosphere directly on the microscope stage), has allowed for
real-time spatiotemporal profiling of live intracellular events following nanoparticle transfection
to be observed. This paired with the ability to quantify relative fluorescence intensities of nano-
bioconjugate materials over the course of the cell experiment has led to important discoveries
concerning how cells process nano-therapeutics and given insights into therapeutic outcomes for
cells exposed to nano-agents.56,101,102
Figure 1.11 (A) Schematic of an inverted confocal fluorescent microscope, showing light path
from laser to cell sample and back to photomultiplier tube (PMT) detectors with digitally
converted signal on computer display. (B) Representative live-cell confocal fluorescent
microscope image of Chinese hamster ovary cells stained for cell membrane with AF594 dye-
labelled wheat germ agglutinin (red), nucleus with DAPI cell permeable dye (blue), and showing
FAM dye-labelled DNA release from AuNP after 12 h of incubation (green).

26
In sum, these advances have established cellular microscopy as a preeminent tool for
probing cellular phenomena, especially with regards to nanotherapeutic processing, when
fluorescent labelled or photoluminescent QDs are employed. However, some limitations do exist
and include the potential for poor detectability of dilute fluorophores and, coincidingly, potential
phototoxicity for cells exposed to excitation light for too lengthy of collection time or too
frequent intervals of collection.
For high density, non-emissive nano-therapeutics (i.e. 20nm or larger AuNP and others),
cryogenic electron microscopy (Cryo-EM) can be employed to assess nanoparticle cellular
internalization and localization, where cells are processed by flash-freezing with liquid nitrogen
prior to exposure to the electron beam in order to protect sensitive cell structures from immediate
ablation in the beam.124 However, as with any fixed cell analysis technique, Cyro-EM does not
allow for dynamic imaging of cellular events as they unfold.
A complimentary technique for analysis of gene expression or other whole-cell labeling
methodologies include the use of flow cytometry, also known as flow cytometry assisted cell
sorting (FACS), which incorporates microfluidic engineering to rapidly push suspended cells
through a laser beam to quickly collect binary fluorescence information. The advantages of the
technique is high throughput and large statistical sampling; however, the technique is limited by
the inability to visually monitor events in cells, and by the analysis artifacts created by punctate
or multichannel fluorescence experiments.125
Magnetic nanomaterials have the unique ability to act as cell sorting labels and as
magnetic contrast agents. In the former, cells which have internalized the magnetic materials
would be able to be drawn by an external magnetic field to quickly distinguish transfected versus
non-transfected cellular populations, and transfected cells can further be quantified using a
SQUID which measures the magnetic moment of a material relative to its mass. Thus, SQUID
measurements can be used to convert the magnetic moment of similarly sized magnetic
nanoparticles within cell pellets of uniform mass or cell number, in order to evaluate the quantity
of magnetic particles with the various cell samples. Complimentarily, the use of Magnetic
Resonance Imaging (MRI) enables the determination of the density of magnetic particles versus
the non-magnetic background tissue to create a “magnetic contrast agent” within live tissues or
resected cell samples, thus the magnetic particles can be visualized ex vivo or in vivo non-
invasively, and can be used to identify the fate and distribution of particles within a patient

27
model or to quantify the number of particles that have been internalized by different cell or tissue
samples.
Additionally, cell destructive methods such as spectroscopic analysis of cell lysates or
inductively coupled mass spectrometry (ICP-MS) of dissolved cell samples exist to determine
the potential nanoparticle content within transfected and collected cell populations. For
spectroscopic methods, the presence of transfected or expressed fluorophores can be examined;
limitations exist in signal detectability due to high levels of noise from biomolecules and
potential degradation of the target fluorophores from release of damaging cellular components
during the lysis process. ICP-MS of cell samples dissolved in strong acid allows for
quantification of nanomaterials by atomic abundance within the cell sample to assess the level of
cellular uptake of nanoparticles.126 This technique is best used for larger nanomaterials
composed of a minimal number of different elements, preferably with a high z-number, to aid in
signal-to-noise ratios over the carbon-heavy cellular background, combined with the relatively
small number of atoms contained in a single nanoparticle, due to their small size. For the above
mentioned reasons, the ICP-MS technique is ideal for solid metal nanoparticles such as gold,
silver, or platinum nano-constructions.127,128
1.4 Thesis Overview
The work described in this thesis explores the fundamental science behind nanomaterials-
bioconjugation and intracellular responses to nanomaterials probes and therapeutics as proof of
concept. This work takes full advantage of the molecular beacon toolbelt and the nano-specific
optical properties of gold, gold shelled, and semiconducting nanomaterials as assessed by various
spectroscopic and microscopic techniques. This work also capitalizes on peptide and cationic
liposome transfection methodologies as a means of cellular internalization for various
bioconjugated nano-probes.
Chapter two details a study of gold nanoparticles (AuNPs) used as delivery platforms for
DNA oligonucleotides and genes with various appendage strategies. Investigating control over
the attachment chemistry and thus the release rate of DNA therapeutic cargos to set the
foundation for personalized nanomedicine. This work compares common mono-thiol and mono-
amine conjugation strategies for DNA attachments to AuNPs versus dual thiol, dual amine and
thiol plus amine bidentate conjugation schemes to determine the rates of intracellular processing

28
and therapeutic release for each coupling method. The use of live-cell fluorescence microscopy
allows for the direct visualization of the timing of release through fluorescence “turn on” of dye-
labels on the DNA that are quenched by the AuNP while the DNA is bound to the particle within
the nanometal’s Surface Energy Transfer (SET) diameter. The intracellular rates of DNA release
from the AuNP surface in A375 human melanoma cells were found to follow the binding activity
series: dual thiol > thiol plus amine > mono thiol > dual amine ≈ mono amine, for the
investigated DNA- AuNP coupling routes.
Chapter three focuses on the simultaneous monitoring of the timing of cargo release from
a nanotherapeutic AuNP as well as elucidating the intracellular pH experienced by the cargo
during cell processing. This was accomplished using a triple dye-labeled duplex DNA appended
to an AuNP. Utilizing the environmentally sensitive dye, pH-responsive fluorescein, paired with
another Surface Energy Transfer coupled dye, DyLight405, the pH at and after cargo release was
ratiometrically determined. Additionally, a non-energy-coupled dye, DyLight700, was used for
nanoparticle tracking throughout the experiment. The Multicolor Surface Energy Transfer
(McSET) beacon of the cargo uptake, release, and processing was visualized using live-cell
fluorescent microscopy, and it was observed that the nanotherapeutic packaging of labeled DNA
provides a protective effect against lysosomal degradation in acidic organelles as noted by cargo
experiencing an average intracellular pH near 6.
Chapter four investigates the role of drug resistance status in cancer cells on the targeting
and therapeutic delivery of nano-cargo, by assessing cellular uptake of fluorescent quantum dots
functionalized with various cell penetrating peptides (CPPs). The QD-CPP nano-bioconjugation
creates a labelled delivery package to investigate the nuances and difficulties of drug transport
into multidrug resistant (MDR) cancer cells for potential future clinical applications of diverse
nanoparticle therapeutic delivery strategies. In this study, eight distinct cell penetrating peptides
(CAAKA, VP-22, HIV-TAT, HIV-gp41, Ku-70, and hCT(9-32), integrin-β3, and K-FGF) were
used to study the different cellular uptake profiles in cancer versus drug resistant melanoma
(A375 & A375-R), mesothelioma (MSTO & MSTO-R), and glioma (rat 9L & 9L-R, and human
U87 & LN18), cell lines. The results demonstrate that cell penetrating peptide uptake varies with
the amount of drug resistance and cell type, likely due to changes in cell surface markers. This
study provides insight to developing functional nanoplatform delivery systems in drug resistant
cancer models.

29
Chapter five contains a collection of analytical tools employable for evaluating nano-
therapy in cells transfected with gold shelled magnetic nanomaterials, termed “magnetic gold
particle” (MGP). These particles contain a magnetic iron oxide core, able to be evaluated for
magnetic moment and resonance via SQUID and MRI, respectively; with the added advantages
of a gold shell to allow for good biocompatibility, easy biofunctionalization with cell penetrating
peptides, as well as plasmonic functionality via SET to visualize intracellular therapeutic
delivery using fluorescent microscopy. This multiplex sensor brings the best aspects of magnetic
and gold nanoparticles into one useful platform to answer questions of therapeutic targeting and
uptake with cell penetrating peptides in cancer cell lines.

30
CHAPTER 2
SURFACE COUPLING CONTROLLED INTRACELLUAR CARGO RELEASE OF
THIOL AND AMINE MODIFIED DNA FROM A GOLD NANOPARTICLE
2.1 Introduction
Research into micro- and nano-biological phenomenon has skyrocketed in the last few
decades due to technological advances in instrumentation and new methodologies for cellular
and molecular visualization. Some of the most advantageous innovations in this field include
live-cell confocal fluorescence microscopy and Surface Energy Transfer (SET) based
nanoparticle beacons.55,56,129–131 The pairing of these techniques allows for spatiotemporal
tracking of intracellular phenomena in real time, such as the delivery of nano-therapeutic cargo
into human and relevant-model cell lines.101,132 The ability of nanomaterials to load multiple
therapeutic agents has been established for a variety of nanoparticle constructions.102,133–135 But
the ability to control the timing of release of nano-cargo within a live cell – without external
interventions that would not be possible in a true patient care model – has not been
demonstrated. Further investigation of the intracellular processing of nano-delivered therapeutic
cargo will lead to insights relevant to biomedical applications, such as controlled drug delivery
and coordinated gene therapy approaches the for improved treatment and prevention of disease.
For the multiplexing of therapeutic cargo delivery from a nanomaterial to be truly
advantageous, the ability to control the timing and location of delivered drugs or genes inside of
target cells, such as cancers or diseased tissue, must be realized. Some studies have been
performed which evaluate the use of external signals such as chemical activation or using
electromagnetic radiation to heat and melt the particle to induce therapeutic cargo
release,109,136,137 which while effective in cell culture complicate a realistic treatment approach in
a living patient, where systemic interactions are possible and direct observation of the cells being
treated is not. A more practical approach to controlled therapeutic release lies in utilizing surface
appendage chemistry to control the dynamics of nanoparticle release in cellular environments. It
is widely known that AuNPs bind to sulfur groups effectively,138,139 and that mono-thiol groups
readily disassemble in the cellular environment.102,132,140 An earlier study revealed the release of
short DNA versus plasmid from a nanoparticle surface could be manipulated by use of a thiol
linkage.132 Studies using SET probes and gold nanoparticle-DNA hybridization have also

31
demonstrated that greater stability is achieved by multidentate binding.55 The mechanism and
cellular metabolites that control release of assembled cargo on a gold nanoparticle, once
endocytosed into a cell, is not well understood, although cellular reducing agents are thought to
play a role.126,140,141 Additionally, studies on the differences between various members of the
most common mono- and bi-dentate thiol ligands have been conducted, predominantly coupled
to bulky molecules or synthetic polymer chains to aide in colloidal stability under physiological
conditions,142–146 which result is particles with large hydrodynamic radii. These modifications
may cause unknown interactions with cellular processing and elimination of the nano-cargo by
likely effecting release of therapy molecules, thus convoluting any cellular uptake and release
studies. Correlating the intracellular dynamics for cargo release with the functional coupling
chemistry for nucleic acids bound to a AuNP could enhance our understanding of the potential
for nanoparticle-nucleic acid therapeutic agents.
In the current work, the control of intracellular release of nucleic acids cargoes covalently
coupled through mono- and bi-dentate thiol and amine functional groups at the surface of a 6 nm
AuNP is investigated. The study employs a multicolor surface energy transfer (SET) bio-optical
transponder (BOT) to monitor uptake and release of a Dylight 488 (DL488)/ Dylight700
(DL700) labeled short, 39 base pair (bp) DNA, as well as a dye labelled 6 kbp plasmid designed
to initiate production of fluorescent protein, tdTomato, following transcription. The nucleic acid
cargoes are bound to the surface of the gold by appending a functionalized C6 spacer from
phosphate backbone (DNA-PO3O-C6H12-NH2 or DNA-PO3O-C6H12-SH). Functionalization of
the 3’ and complimentary 5’ end of the DNA allows incorporation of a mono-thiol (3’ -SH only),
a dual-thiol (3’ -SH and comp 5’ -SH) and thiol plus amine coupling (3’ -SH and comp 5’ -NH2).
It is hypothesized that the strength of covalent attachment of the therapeutic cargo to the AuNP
will follow: bidentate thiol (SS) > bidentate thiol plus amine (SN) > monodentate thiol (SX),
followed by the weak coordination of bidentate and monodentate amines, (NN) and (NX).
Elucidating the release kinetics of these simple coupling strategies will allow for control over the
timing of therapeutic release from the AuNP surface in order to create coordinated treatments,
which often rely on sequential delivery of therapeutics, especially in drug resistant cancer cells,
such as melanoma. Understanding and utilizing AuNP surface chemistry that is able to produce
controllable, self-terminating conjugation of biologically active cargo to the nano-delivery agent

32
will allow for tunable release of therapeutics in the intracellular environment. Realization of this
goal advances nanotherapeutics one step closer to personalized medicine.
2.2 Materials & Methods
2.2.1 Materials
Water soluble, spherical 6.0 nm AuNP were synthesized by standard literature protocols
for aqueous AuNP citrate nanoparticles.11 Briefly, a sparged aqueous solution of tetrachloroauric
acid hydrate (Strem Chemicals) was reduced in the presence of citric acid and tannic acid
(Sigma) at 60˚C with rapid stirring at a ratio of 1:4:0.5 mL of each 1% m/v solution in 100 mL
H2O total volume. The prepared AuNPs were exchanged with bis-(p-sulfonatophenyl)
phenylphosphine (bSPP) (Sigma) as the protecting group. Stoichiometric displacement of the
coordinated BSPP passivation layer was accomplished by thiol place exchange reactions using 5’
thiol terminated DNA sequences, as described previously.147 The synthetic DNA sequences were
purchased from Midland Oligos and are listed below:
CATG-DL700-39mer-SH
5’- CATGCGACTGT(DL700)GACAATCTTAGCTGCCGATAGAGTAGTC(C6-SH) -3’
CATG-39mer-NH2
5’- CATGCGACTGTGACAATCTTAGCTGCCGATAGAGTAGTC(C7-NH2) -3’
SH-DL488-comp
5’- (SH-C6)GACTACT(DL488)CTATCGGCAGCTAAGATTGTCACAGTCG -3’
NH2-DL488-comp
5'- (NH2-C6)GACTACT(DL488)CTATCGGCAGCTAAGATTGTCACAGTCG -3’
X-DL488-comp
5’- GACTACT(D4L88)CTATCGGCAGCTAAGATTGTCACAGTCG -3’
2.2.2 Preparation of AuNP-SX/SS/SN-DNA
AuNP-SX-DNA was prepared by complete thiol place exchange of the BSPP passivation
layer using a 5’-C6 thiol with or without a 3’ C6 thiol or amine terminated short duplex DNA, to
give the SX (mono-thiol), SS (dual-thiol), and SN (thiol and amine) linkages. The DNA
consisted of a synthetic 35 bp sequence containing a 5’-C6 thiol and an internal DL488 dye label
incorporated at the 10th bp and a complimentary strand with 3’-C6 thiol (SS) or amine (SN)

33
modification, or unmodified 3’ (SX), with an internal DL700 dye label incorporated at the 30th
bp. Dyes were incorporated through internal modification of the dT base. The exchange was
carried out in a 20:1 mole ratio of DNA to AuNP, in the presence of reducing agent, tris(2-
carboxyethyl)phosphine (Sigma), resulting in displacement of ~20 passivating sites on the AuNP
surface. The loading of the DNA was confirmed by gel electrophoresis (1% agarose) indicated a
single red band that was retained stronger than the AuNP-BSPP, consistent with formation of
AuNP-DNA.
2.2.3 Preparation of AuNP-TSX/TSS/TSN-plasmid constructs
The AuNP--TSX/TSS/TSN-plasmid constructs were prepared by initial assembly of a
linearized plasmid, appended to the SX/SS/SN linker sequences (with DL488 and DL700
internal labeling), to the AuNP surface by thiol place exchange, in the presence of reducing
agent, tris(2-carboxyethyl)phosphine (Sigma). The dye labels for each sequence were located on
the 30th bp from the terminal thiol modification via an internal labeling of the T base.
The linker modified plasmid was prepared using the commercially available tdTomato-
C1 plasmid (Clontech) digested with PCII (New England Biolabs (NEB)) following the
manufacturer’s protocol. The plasmid contained a CMV promoter to ensure over expression of
the fluorescent protein within the cell following the translation of the delivered plasmid. The
digested plasmid (single cut site) was analyzed on a 1% agarose gel to validate digestion. The
synthetic SX/SS/SN-DNA linker strands (35/39 bp) contained a 4 bp overhang and was ligated to
the linearized plasmid by standard T4 ligation methods (NEB) to create tdTomato plasmids with
protected 5’-C6 thiol modification with or without (TSX) a complimentary 3’-C6 protected thiol
(TSS) or amine (TSN) modification to the phosphate backbone. The sequences are available in
Supporting Information. The ligated plasmids containing the chemically protected functional
spacers were precipitated by addition of EtOH and stored at 4˚C. Isolation of the linearized DNA
was verified by UV-Vis analysis of the 260nm absorption for DNA.
The protected thiol plasmid was appended to the AuNP through formation of an AuNP-
sulfur bond (AuNP-TSX-plasmid), dual AuNP-sulfur bonds (AuNP-TSS-plasmid), or AuNP-
sulfur and AuNP-amine bonds (AuNP-TSN-plasmid), following TCEP reduction (20 mM, 2 h,
RT) for de-protection of the linking functional groups, at a ratio of 1:1 plasmid to AuNP.
Coupling of the plasmid to the AuNP surface was carried out by addition of the de-protected

34
plasmid to a solution containing the AuNP and allowed to place exchange for 48 h. The
assembled AuNP-TSX/TSS/TSN-plasmids were pelleted out of solution by ethanol precipitation
followed by centrifugation at 3000 rpm to remove unbound plasmid. Gel electrophoresis (1%
agarose) of the AuNP-plasmid construct confirmed assembly and showed < 1% free AuNP
present.
2.2.4 Transfection Agent
The AuNP transfection construct was prepared by encapsulating AuNP-SX-DNA, -SS-
DNA, -SN-DNA, -TSX-plasmid, -TSS-plasmid, -TSN-plasmid into Lipofectamine2000® (Life
Technologies). Lipofectamine2000® encapsulation of the AuNP constructs (AuNP was carried
out at a concentration of 3 pmol of AuNP, as determined by the AuNP absorption plasmon at
525nm, to 10 µL of Lipofectamine2000®. The loading level of constructs into the liposome was
chosen to be consistent with concentrations utilized in the protocol for a standard plasmid
transfection in Lipofectamine2000®.8 Dynamic Light Scattering (DLS) data (DynaPro-Titan) was
obtained at 20% laser power and used to analyze the size of the transfection packages. The
hydrodynamic radius is calculated by averaging six replicates each containing 10 measurements
with an acquisition time of 1 s, with the complexes suspended in nanopure water.
2.2.5 Cell Transfection
A375 human melanoma cells, cultured at 37˚C with 5% CO2 in Dubelco’s Modified
Eagle’s Medium (DMEM-7777) (Sigma) supplemented with addition of 10% fetal bovine serum
(Sigma) were plated at 30,000/cm2 in 0.33cm2 wells of a glass bottom 96-well plate or with 1.5
coverglass treated with poly-L-lysine (MatTek Corp). Cellular transfection was carried out 24 h
after plating. Media was exchanged after 48 h of transfection to remove any unreacted AuNP
complex. Cell viability was verified using Trypan blue exclusion test of cell viability after 24 h,
in addition to visual conformation on the microscope to assess the cell health. No evidence of
chromosomal condensation or changes in cell morphology was observed following transfection,
indicative of no cytotoxicity at the transfection agent concentrations employed in this study.
Trypan blue assays confirmed cell viability was maintained at 90% following transfection for all
experiments relative to control cells. Cell division was occurring over the time span of the
experiment, with a doubling rate of 2% per hour resulting in confluence at 48 h. Due to over-

35
confluence affecting cell growth behavior, the experimental data was limited to 48h for the
uptake and release study and 72 h for the gene expression measurements. Experiments were
conducted in triplicate.
2.2.6 Optical Microscopy
Confocal microscopy images were obtained on a Nikon Eclipse Ti Inverted Microscope
at 20X magnification. Samples were excited using a Yokogawa automated 5000 rpm Spinning
Disk Confocal equipped with lasers to excite the DyLight700 (640 nm, 900 ms exposure),
DyLight488 (488 nm, 500 ms exposure), and tdTomato (561 nm, 400 ms exposure). Images were
collected by an Andor Clara high resolution CCD at 20X magnification. Measurements were
taken at 30 min intervals for 48 h while incubated in a stage mounted live-cell chamber, kept in
focus by a Nikon Perfect Focus system. An additional measurement for gene expression was
taken at 72 h post transfection. Images were analyzed for total intensity and cell number by
ImageJ software. Intracellular uptake and release kinetics were monitored by tracking
DyLight700 and DyLight488 intensities, respectively, normalized to cell count. Gene expression
was assessed by the red fluorescent protein emission intensity from tdTomato.
2.2.7 Image Analysis
The kinetics of the images were analyzed with ImageJ software, using a standard rolling
ball radius of 50 pixels to subtract the background to remove any cellular autofluorescence and
the total intensity of each image was measured per time frame. The resulting intensity was
corrected for cell count and plotted to an exponential one-phase model, to fit the first order
association kinetics of the release of the sdDNA and plasmid from the surface of the AuNP,
plotted with standard deviation of the samples. Each experimental trial was imaged in three
separate regions per well in a 96-well plate per time point, with n = 3 per sample. The plots were
analyzed for differences using the student’s unpaired t-test, to determine statistical differences in
the samples. Protein expression was analyzed with ImageJ and measured fluorescence was
corrected to cell count per time fame. Colocalization of the DL700 and DL488 was analyzed
using the JACoP148 plugin for ImageJ to assess the van Steensel Cross Correlation Function
(CCF)149 for red versus green channels, with best gaussian fit per sample calculated for the 12
and 24 h time points.

36
2.3 Results and Discussion
2.3.1 AuNP-DNA Constructs
The McSET-BOT incorporates two dye labels on a single duplex DNA to allow the
cellular uptake (DL700) and subsequent intracellular disassembly (DL488) of the nucleic acid
cargo appended to the 6 nm AuNP to be visualized. In Figure 2.1, the design of the McSET-BOT
is shown for the 39 bp duplex DNA sequences, with the green DL488 “release sensor” appended
to the DNA via a modified thymine (T) base at the 7th position from the AuNP surface; as well as
the red DL700 “uptake sensor” appended at the 30th bp (Figure 2.1).
Figure 2.1 Scheme of AuNP-DNA coupling strategy, showing mono-thiol (SX), dual thiol (SS)
and thiol plus amine (SN) with corresponding anticipated release times: t1, t2, and t3,
respectively. Cellular uptake is monitored by constant Dylight (DL) 700 emission, release from
is monitored by turn on of DL488, according to SET theory, and gene expression is observed by
emission of the fluorescent protein, tdTomato.
Although not explicit in Figure 2.1, ligation of a 6 kbp linearized plasmid, containing the gene
for the fluorescent protein (FP) tdTomato, to the labeled 39-mer DNA duplex McSET-BOT
probe allows for the reporting of uptake, timing of release, and correlation with gene expression

37
rates. For the McSET-BOT, the DL700 provides a constant fluorescent marker of the AuNP
cargo’s location, since it is not proximally quenched by the 6 nm diameter AuNP, and thus, is
emissive even when bound to the AuNP surface. The DL488 operates as a fluorescence “turn-
on” beacon to report the timing of intracellular release for the nucleic acid cargo from the AuNP
surface. When the DNA is appended to the AuNP surface, the contact distance is within the
>90% non-radiative energy coupling distance. The “turn-on” signal occurs at the moment of
release due to a loss of the SET non-radiative energy coupling between the 6 nm AuNP surface
and the excited state of DL488, once the DL488 is no longer bound to the AuNP and begins to
diffuse away from the AuNP surface. Thus, as intracellular processing of the McSET-BOT
results in nano-cargo release, and “turn-on” of the fluorescent marker allows for the kinetics of
intracellular uptake and processing to be analyzed for each coupling strategy in real time, via live
cell fluorescence microscopy.
The AuNP is prepared by the citrate reduction method. The citrate passivation layer is
exchanged for bis-(sulfonatophenyl)phenyl phosphine(bSPP)56 prior to coordination of the
functionalized nucleic acid sequences to aide in NP stability, by way of the more stable binding
phosphine compared to carboxylates of citric acid. The bSPP also facilitates better DNA surface
packing on the particle by providing a bulky tri-phenyl spacer molecule to prevent the DNA
backbone from interacting with the surface of the AuNP, which would cause the DNA to lay flat
rather than project perpendicularly to the AuNP surface, as is necessary for properly predicting
SET behavior. TEM and size distributions of the as-synthesized AuNPs are shown in Figure
2.2A. The functionalized C6 -thiol (SH) and C6 -amine (NH2) modified DNA sequences were
synthesized commercially with DL488 and DL700 internal base labels on separate strands, with
a 4 bp overhang to allow for ligation to the linearized plasmid containing the tdTomato gene and
a cytomegalovirus (CMV) promotor to drive overexpression150 of the tandem dimer RFP within
the cell. The McSET-BOT DNA sequence was duplexed by slow-cooled annealing procedures to
produce nucleic acid sequences with monothiol (SX), dual thiol (SS), and thiol/amine (SN)
binding moieties. For ease of reference, the McSET-BOT ligated to the tdTomato plasmid is
abbreviated as TSX, TSS, and TSN, respectively.
In order to append the DNA to the AuNP, reduction of the synthetic dithiol protecting
groups was accomplished by incubation in 5 mM tris(2-carboxyethyl)phosphine (TCEP), after
which the synthetic DNA was added directly to the AuNP at a 20:1 DNA to AuNP ratio, with a

38
24-48h mixing period to allow for DNA attachment. The successful coupling of the DNA to the
AuNP was evaluated by 1% agarose gel electrophoresis, which demonstrated retention of the
AuNP-DNA complexes compared to the AuNP-bSPP due to the increased molecular weight of
the attached DNA (Figure 2.2B).
Figure 2.2 Characterization of the McSET-BOT AuNP showing (A) TEM (scale bar = 100 nm)
and size distribution (inset) of the 6 nm diameter AuNP, prior to biofunctionalization; and (B)
agarose gel electrophoresis of the as-synthesized AuNP (lane 1), monothiol DNA appended
AuNP (lane 2), bidentate thiol appended DNA AuNP (lane 3), and bidentate thiol plus amine
DNA appended AuNP (lane 4).
Figure 2.3 Dynamic light scattering intensity as a measure of the hydrodynamic diameters for
(A) AuNP-bSPP of ~14.2 nm, (B) AuNP-sdDNA of ~36.4 nm, and (C) AuNP-plasmid of ~166.7

39
nm. Mean values are shown as green filled bars and size distributions are shown in red unfilled
bars.
Additionally, dynamic light scattering (DLS) was used to determine the change in
hydrodynamic radii for AuNP-bSPP versus AuNP-sdDNA and AuNP-plasmid (Figure 2.3),
showing an increase in size from AuNP-bSPP<AuNP-sdDNA<AuNP-plasmid, as is expected for
successfully assembled constructs. Measured hydrodynamic diameters were found to be 14.2 nm,
36.4 nm, and 166.7 nm, respectively (Figure 2.3).
Figure 2.4 Cyanide etching of the McSET-BOT. Dissolution of the AuNP is observed by loss of
the 525 nm plasmon in the absorbance spectra (A) and release the DL488 and DL700 dye-
labelled DNA is evidenced by the recovery in the fluorescence spectra (B) of DL488 at 520 nm.
Absorbance of the dyes is shown at a 50x magnification of the absorbance intensity (inset). The
DL700 emission at 700 nm is relatively unaffected due to non-SET behavior (C).

40
Verification of SET activity for the BOT constructs was performed by exposing
assembled complexes to cyanide etching with a 0.1 M NaCN solution which was able to dissolve
the AuNP, liberating the bound DNA and allowing for fluorescence recovery of the attached
fluorophores. Dissolution of the AuNP can be seen by the loss of the AuNP absorption plasmon
at 525nm (Figure 2.4A), which releases the attached DNA to recover fluorescence of the
quenched DL488 (Figure 2.4B). The DL700 signal was unaffected, demonstrating the
unquenched non-SET relationship between the DL700 and the 6 nm AuNP, as expected since the
DL700 emission is lower in energy than the AuNP plasmon and thus non-energetically coupled
at the distance it is placed from the AuNP surface on the attached DNA strand (Figure 2.4C).
2.3.2 Cell Transfection and Imaging
The impact of the surface binding functionality (SX, SS, SN) on the dynamics of intracellular
McSET-BOT nanoparticle uptake and nucleic acid release was analyzed in Human melanoma
cells, A375. The A375 cells were plated in 96-well plates with glass bottoms for optimum
fluorescence light collection. A375 cells were transfected 24 h after plating with AuNP-
SX/SS/SN-DNA and AuNP-TSX/TSS/TSN-plasmid complexes using Lipofectamine2000®
transfecting reagent, following media exchange. Cells were incubated at 37°C using a live cell
chamber mounted on the microscope stage, and live cell fluorescence images were collected
every 30 min for 48 h. From the selected time points displayed in Figure 2.5, it can be seen that
the DL700 fluorescence signal is continuous throughout the experiment, demonstrating no SET
quenching and allowing for visualization of the location of the AuNP-DNA throughout the
experiment. Conversely, the DL488 fluorescence is “off” at early time points and gains
brightness over time as more DNA is released from the surface of the AuNPs, making apparent
the slight differences in the time evolution of release for each construct. It is observed in Figure
2.5 that at early time points, fluorescent packages are seen with punctate patterning inside of the
cells, indicating endosomal packaging, as is expected with the use of the cationic liposome
Lipofectamine2000® transfection reagent. At later time points, more cells display diffuse
fluorescence intensity throughout, indicating endosomal escape of the dye-labeled DNA and
diffusion into the cytosol. Inspection of the intensity patterns in Figure 2.5 reveal the order of
release follows the expected behavior for binding affinity SX>SN>SS, reflecting the number of
chelates to the AuNP surface and the binding strength of an amine relative to a thiol.

41
Figure 2.5 Live cell fluorescence microscopy of A375 cells incubated with (A) AuNP-SX, (B)
AuNP-SS, and (C) AuNP-SN over 48 h. DL700 denotes uptake and particle tracking, DL488
shows DNA release, DIC shows normal cell morphology, and overlay shows localization. Scale
bar: 50 µm.

42
Figure 2.5 - continued

43
Figure 2.5 - continued

44
2.3.3 Cellular Colocalization Analysis of DL488 and DL700
To assess the stability of the McSET-BOT constructions and ensure no degradation of
nucleic acids occurred during the experimental time frame, analysis of the colocalization of the
DL488 and DL700 fluorescent labels was conducted. Assessment of the cross correlation
function (CCF),149 as described by van Steensel and coworkers, provides the most unbiased
measure of colocalization for fluorophores with punctate fluorescence patterns, especially when
the fluorophores possess differential fluorescence quantum efficiencies and detector sensitivities
for their emission windows.140 In CCF the Pearson’s correlation coefficient of colocalization (rP,
Eqn. 2.1) is calculated for and compared between two potentially colocalizing fluorescence
channels, “A” (DL700), versus “B” (DL488), as they are laterally shifted by 20 pixel increments.
rp = ∑(𝐴𝑖−𝑎)𝑥(𝐵𝑖−𝑏)
√∑(𝐴𝑖−𝑎)2𝑥 ∑(𝐵𝑖−𝑏)2 (Equation 2.1)
Where i denotes intensity values for a given pixel, and a & b denote the intensity averages over
the whole image per channel, A and B.151 The best Gaussian fit of the plot created by this lateral
pixel shifting of the fluorescence images versus the calculated effect on the Pearson’s correlation
coefficient gives the CCF.149,152 Conclusions about the colocalization are drawn from the overall
shape and amplitude of the CCF plot, where maxima at the 0 pixel shift position indicates the
presence of colocalization, and the amplitude (0-1) indicates the degree of spectral intensity
matching between the channels.149,152
CCF analysis of the DL488 and DL700 fluorescence channels for each McSET-BOT
construct is shown in Figure 2.6 at 12 h and 24 h after transfection, for the short DNA and
plasmid genes attached to the AuNP by the various coupling strategies. It can be seen that all the
coupling strategies for both short and full plasmid DNA show remarkable colocalization at the
12 h and 24 h time points (Figure 2.6A-F and G-L), with strong Gausian distributions for the
CCF of all samples, indicating no separation of fluorophores due to nuclease cleavage of the
DNA strands.
2.3.4 Uptake and Release Kinetics
In Figure 2.7, a plot of the time dependent change in red and green fluorescence intensity
is shown. The change in intensity is a measure of the kinetics of uptake (via DL700 intensity)

45
Figure 2.6 Analysis of colocalization for DL488 and DL700 fluorescence, expressed in Cross
correlation functions (CCF) for AuNP-SX/SS/SN-DNA (A, C, E and G, I, K) and AuNP-
TSX/TSS/TSN-Genes (B, D, F and H, J, L) at 12 h and 24 h post transfection, respectively. Best
Gaussian fit is shown in blue.

46
Figure 2.6 - continued

47
and release (via DL488 intensity) for the labelled DNA. Images were processed in FIJI153 ImageJ
software to collect total fluorescence for each channel, and the kinetics were calculated in Igor
software, according to the sigmoidal plot function. The calculated intracellular release kinetics
for the AuNP-SX/SS/SN-DNA and AuNP-TSX/TSS/TSN-plasmid coupling strategies are
displayed below (Table 2.1).
Figure 2.7 Kinetic data of AuNP uptake (A & C) and cargo release (B & D) for the short duplex
DNA (open shapes) and plasmid gene (filled shapes) coupled to the AuNP by monothiol “SX”
(black circle), dual thiol “SS” (red triangle) and thiol plus amine “SN” (blue square),
respectively. Uptake is monitored by cellular fluorescence of DL700 and Release by DL488,
normalized to cell counts. Trend lines reflect sigmoidal fits.

48
The timing of release for each DNA sequence follows SX>SN>SS for the speed of intracellular
disassembly. Changes in uptake patterns between the different assembly strategies, while
unanticipated, may reflect differences in overall DNA loading onto the AuNP surface and related
charge density affects within the cationic liposome formation, creating differentially sized
liposomes which may experiences non-uniform rates of cellular internalization due slower
diffusion of larger liposome towards the cellular surface.
Table 2.1 Intracellular DNA cargo release kinetics from 6nm AuNP for monothiol (AuNP-SX-
DNA and AuNP-TSX-plasmid), dual thiol (AuNP-SS-DNA and AuNP-TSS-plasmid), and thiol
plus amine (AuNP-SN-DNA and AuNP-TSN-plasmid) attachment, for short DNA
oligonucleotides and linearized plasmids, respectively.
AuNP-Construct Bond half-life (h) Release Rate (%•h-1)
SX-sdDNA 7.9 ± 4.9 6.33
SS-sdDNA 15.9 ± 1.5 3.15
SN-sdDNA 12.2 ± 2.0 4.10
TSX-plasmid 8.0 ± 4.9 6.25
TSS-plasmid 15.4 ± 1.5 3.25
TSN-plasmid 10.6 ± 1.9 4.72
Interestingly, in the A375 cells the release dynamics for short DNA versus the plasmid is
nearly identical. Based on earlier studies, it was expected that the timing of release would vary
between the DNA lengths due to the added molecular weight and charge density of the large
plasmid compared to the short DNA oligonucleotide.56 This was not observed, most likely due
to a reduction of the DNA loading levels in these studies.
2.3.4 Coupling Influence of Timing of Fluorescent Protein Gene Expression
To analyze the surface coupling dependent release and the effect on the timing and extent
of gene expression of the TSX, TSS, and TSN linearized plasmid bound onto the AuNP was
compared to lipofectamine delivered circular plasmid and the TSS linearized plasmid in the
absence of a AuNP (Figure 2.8). The nano-delivered plasmid carries the gene for the fluorescent
protein tdTomato as a model of a therapeutic gene. Specifically, tdTomato was chosen for its
brightness, as it is a tandem dimer of the mCherry fluorescent protein and thus twice as
luminous, making it highly detectable via fluorescence microscopy.113

49
Figure 2.8 (A) Live cell fluorescent microscopy images of the tdTomato fluorescent protein
gene expression from 24-72 h post transfection, as delivered by the AuNP via mono thiol (TSX),
dual thiol (TSS) or thiol plus amine (TSN) DNA linkage. Scale bar is 50 μm. (B) Quantification
of cellular gene expression from 24-72 h post transfection for the AuNP-TSX, AuNP-TSS, and
AuNP-TSN attachment strategies, along with the circular plasmid and a linearized plasmid
functionalized with dithiol protected dual thiol modifications, as controls.

50
Expression of the tdTomato gene is signaled by whole-cell red turn-on, as the protein is
cytosolically overexpressed by the CMV promotor, built into the plasmid backbone. In Figure
2.8A, the progression of fluorescent protein expression can be seen for the various AuNP
delivery constructs from 24 to 72 h. From the microscope images, TSX is observed to maintain a
somewhat constant expression level after 36 h, whereas both TSS and TSN exhibit a steady
increase in tdTomato brightness in time.
The delay in expression is longest for the TSS sequence consistent with the delayed
intracellular release observed in Figure 2.5, and consistent with the expected binding strength of
the dual thiol linkage chemistry. Quantification of the expression rates versus circular plasmid
and linearized plasmid (TSS) further emphasizes the differences in expression rate for the AuNP-
TSX, -TSS, and -TSN, where for AuNP-TSS the level of expression is significantly greater at 72
h than observed at 36 h, in contrast to the single thiol and thiol plus amine, as well as the circular
or linearized plasmids without AuNPs (Figure 2.8B).
2.4 Conclusion
This study demonstrates that by utilizing differential surface appendage strategies for
coupling therapeutic cargo, such as short DNA oligonucleotides and linearized plasmids, to 6 nm
AuNPs, distinct release kinetics can be achieved for thiol versus amine and monodentate versus
bidentate. It was found that the monothiol linkage to AuNP releases fastest, followed by thiol
plus amine attachment, with dual thiol attachment being the most stable and taking the longest to
release. This is believed to be due to the availability of π-orbitals which can engage in back
bonding with the surface of the AuNP. Interestingly, mono amine and dual amine attachment
strategies were not found to be chemically stable for DNA attachment to the AuNP and readily
dissociated during clean up and characterization (data not shown).
It was also found that the length of the attached DNA did not factor into the release rates
for the cell line observed, where the large molecular weight (6 kbp) plasmid did not take longer
to release in comparison to the short (35 bp) oligonucleotide, as was expected, but rather the
general trend of release was found to be: SX/TSX>SS/TSS>SN/TSN, which was consistent for
both sizes of DNA cargo.
Understanding and utilizing AuNP surface chemistry that is able to produce controllable
conjugation of therapeutics to the nano-medicine allows for tunable release of medicine in the

51
cellular environment, getting one step closer to personalized medicine. Ideally, the modulation of
nano-cargo release for gene therapy applications would allow for a greater than 12 h time
differential between one cargo release event and the next, to give ample time for the first gene in
the therapeutic sequence to release, express, and build up sufficient intracellular concentration
prior to the second therapeutic agent’s release (~12 to 24 h delayed). Possessing these tools will
open the possibility for coordinated therapies, such as in the treatment of multi-drug resistant
cancers. For example, a gene for efflux pump knock-down could be delivered, followed by an
apoptotic gene and chemotherapeutic drug delivery, in order to disable the cancer cell’s native
defense mechanisms and specifically destroy the cancer cells, with no non-target side effect, as
are so common with modern pharmaceutical approaches.

52
CHAPTER 3
A GOLD NANOPARTICLE BIO-OPTICAL TRANSPONDER TO ACTIVELY
MONITOR INTRACELLULAR pH
Adapted with permission from Carnevale KJF, Riskowski RA, Strouse GF. A Gold Nanoparticle
Bio-Optical Transponder To Actively Monitor Intracellular pH. ACS Nano, 2018, 12 (6), 5956–
5968 DOI: 10.1021/acsnano.8b02200 Copyright (2018) American Chemical Society.
3.1 Introduction
The interfacing of gold nanoparticles (AuNP) with surface appended biological polymers
(DNA, RNA, protein, antibodies) has led to the design of probes capable of reporting subtle
structural perturbations in biological systems,54,58,131,154,155 detecting analytes in complex
media.57,156–162 Most notably, bioconjugated AuNPs have been employed as bio-optical
transponders (BOTs) that report the intracellular level of reactive oxygen species (ROS) in
endosomes,163 the timing of therapeutic nucleic acid (NA) payload release following
transfection,132 changes in metabolite levels within cells,156,160,164 and to even allow dynamic
monitoring of coordinated cellular responses.74,101,102,132,165–170 While the gold nanoparticle BOT
technology has developed rapidly, the observations that therapeutic nucleic acid sequences
(siRNA, antisense DNA, genes) delivered on a gold BOT may disrupt endosomal maturation,
exhibit resistance to enzymatic degradation, and experience enhanced activity, are not well
understood.100,171,172 Exploring the intracellular processing and fate of nano-delivery agents is a
necessity for intelligent nanomedicine development, as the nano-agent must be able to
successfully and effectively deliver its therapeutic cargo to the intended intracellular target.
In this chapter, a live-cell pH-BOT is developed, capable of dynamically reporting the
evolving intracellular pH of the endo-lysosomal pathway following transfection with a duplex
DNA functionalized 6.6 nm AuNP, enabling temporal resolution that is unachievable in fixed
cell samples. The pH-BOT sensor reports the NP uptake, DNA cargo release, and the
intracellular pH experienced by the cargo, using automatically collected live-cell confocal
fluorescence microscopy imaging (Figure 3.1). The pH-BOT sensor operates by utilizing a
three-dye Multi-color Surface Energy Transfer (McSET)53,58,130,173 probe design which provides
a barcoded optical response from three spectrally distinct fluorophores. NP uptake is reported by
DyLight 700 (DL700) a non-SET dye, while DNA cargo release following endosomal packaging
and cellular processing is reported by the fluorescence turn-on of a pair of SET-active dyes,

53
Figure 3.1 Schematic representations of (A) the endo-lysosomal pathway for nanoparticle
cellular uptake, showing thermal plot of pH processing, starting with endocytosis and transport
inside a trafficking vesicle at near neutral pH (red) to (i) the Early Endosomal (EE) at a pH
between 7-6 (red-orange), before processing to (ii & iii) a Late Endosome (LE) acidifying from
pH 6-5 (yellow-green), and finally trafficking to (iv) the Lysosome (LY) for acidic degradation
at pH 5-4.5 (blue-purple), with potential exocytosis of recycled materials at pH 7 and above
(red). And (B) the 3-color pH-BOT probe, displaying 6.6 nm diameter gold nanoparticle
(AuNP), with appended thiol-modified 45mer oligonucleotide possessing dye-labels of an
unquenched DL700 at the 45th bp (uptake sensor), a SET quenched & weakly pH-sensitive
DL405 at the 32nd bp (release sensor), and a SET quenched & highly pH-sensitive FAM at the
11th bp (pH sensor).

54
fluorescein amidite (FAM) and DyLight 405 (DL405). The pH-BOT probe design is based on
surface energy transfer (SET) methods to access the advantages of using a gold nanoparticle as
an energy acceptor and to simulate gold nanoparticle therapeutic delivery into cells. SET based
optical ruler methods are enhanced over traditional Förster’s Resonance Energy Transfer (FRET)
techniques, whether molecular or quantum dot based, due to the efficiency of quenching of
dyes26, which greatly reduce the rates of laser-induced dye bleaching in multi-hour live-cell
experiments. Additionally, the greater distance of energy coupling achievable in SET allows for
dye-labelled nucleic acid molecules to be utilized as therapeutic mimics to more accurately
investigate the processing of nanotherapeutic delivery systems. And functionally, the large
optical cross section for a 6.6nm AuNP (~105 for a fluorophore, as compared to ~109 for 6 nm
diameter AuNPs), coupled to the sharp drop in absorption strength for AuNPs at wavelengths
longer the plasmon peak (i.e. fluorescence quenching does not affect fluorophores red of the
AuNP plasmon), allow the AuNP to possess band-pass like behavior. The combination of these
features is essential to the function of the pH-BOT and allows the on/off quenching of the
broadly emitting pH-cassette (DL405-FAM), while permitting the unmodified emission of the
tracer dye (DL700). SET calculations determined that synthesized 6.6 nm diameter gold
nanoparticles fall within the ideal NP size range that would completely quench the pH responsive
dye cassette (consisting of FAM at bp 11, and DL405 at bp 32 relative to the particle surface),
while leaving the tracer emission unquenched (DL700 at bp 45).
The rapid development of therapeutic methods utilizing a plethora of nanoparticle
delivery vehicles has resulted in the appearance of several pH based nanosensors, or pH-
triggered nano-delivery agents, incorporating FRET based dye labels onto mesoporous silica and
graphene nanoparticles,109,174–177 squarine dyes on CdSe@ZnS quantum dots,178,179 dye labelled
hyperbranched polymers,180–182 upconversion nanoparticles,183,184 and nanoparticle-aptamer
systems.115,185 These breakthrough studies established the ability to use and identify pH via
ratiometric measurements and recently have been applied to cell environments, although no
dynamic live cell imaging coupled to monitoring of therapeutic delivery of a nucleic acid via a
gold nanoparticle has been demonstrated. The development of a AuNP-based pH sensor capable
of correlating the delivery and processing of nucleic acid agents entering a cell will answer
questions pertaining to the fate and transport of nucleic acid therapeutic, once transfected into a
cell. Creation of this environmentally responsive nucleic acid therapeutic probe requires the

55
reporter dye labels to be co-assembled onto NA sequences that mimic therapeutic nucleic acids
models, such as siRNA delivery.102,186 Such studies are highly relevant in response to the rise of
gold nanoparticle based anti-cancer nanotherapeutics already advanced through Phase I clinical
trials (Aurimune®).187
Utilizing insights gleaned from explorations in the field of cellular biology, particularly
endo-lysosomal maturation and acidification progression, an investigation of the effects AuNP
therapeutic transfection and cellular processing versus the normal cell cycle is possible. The SET
based gold nanoparticle pH-BOT provides a dynamic assessment of the evolution of endosomal
pH as the endosome matures from early to late, and then to a lysosome, by reporting the
ratiometric intensity of FAM to DL405. The experimental results support a model where the
nanotherapeutic is endosomally encapsulated in <1 h of transfection, with release of the DNA
duplex cargo with a half-life of 1.5 h. As the endosome matures, acidification occurs but there is
an observed asymptote at pH 6.0 for up to 24 h, suggesting a stalling at the late endosome stage.
Image analysis of stained early and late endosomes, and lysosome packages reveal that although
the pH appears to be buffered, colocalization of the pH-BOT is observed in all components of
the endo-lysosomal pathway. It is believed the asymptotic behavior reflects a pH buffering effect
attributed to the protonation of the alkyl thiolates (pKa > 10) used to couple the DNA to the gold
surface once released following endosomal packaging.188,189 The effect of pH buffering may
explain the earlier reports of enhanced functionality of the nucleic acid cargoes and enhanced
stability due to reduction of NA degradation pathways.100,102,132,190 The study provides further
insights into endosomal maturation and the cellular processing of nanotherapeutics. While
maturation of endosomes carrying pH-BOT is slowed significantly, finding that pH-BOT is
distributed throughout the endo-lysosomal system while remaining at an average pH of ~6
indicates that a slow, but persistent maturation continues to occur. This observed decoupling of
endosomal maturation from acidification lends support to those models which propose that pH
alone is not sufficient to explain endosomal maturation and the progressive exchange of Rab
proteins.39,41
The developed pH-BOT will open doors for diverse cell delivery inquires and generate
greater insight into our understanding of the fundamental processes of biology. Being able to
monitor the pH evolution will allow for design of nanotherapeutic agents to ensure escape of the
cargo from endosomes before full acidification occurs which is known to lead to NA damage

56
through depurination of NAs at low pH.190 The results of the study indicate the pH-BOT can
actively monitor the pH during delivery of NA therapeutic cargos. The pH-BOT incorporates dye
labelled-dsDNA on an AuNP as a mimic of therapeutic AuNP@NA delivery systems common in
biomedical research and similar to other reported NP@NA formulations.56,102,191–197 By attaching
the reporter fluorophores directly to the delivered NA the progress of NA cargo can be tracked
through the endo-lysosomal system, allowing for a more comparable study of NA delivery from
the AuNP than afforded by similar efforts in the literature focused on tracking nanotherapeutic
delivery of small-molecules and endosomal sorting after uptake.174,180,181,191,198,199 The pH-BOT
models NA delivery and fate explicitly, while providing reporting of cellular uptake and the
moment of release from the AuNP, as well as monitoring the location of the NA cargo within the
cells not only spatially but also in identifying the containing endosome by the stage of
endosomal maturation, to better elucidate NA cellular processing when delivered from AuNPs.
In contrast to other studies using pH-sensitive dye-cassettes to monitor endo-lysosomal
maturation, the pH-BOT uses SET to generate a ratiometric pH cassette that only turns ‘on’ after
AuNP release; allowing for the tracking the endosomal state beginning at the moment of cargo
release, followed by sorting and escape into the cytosol.200–203 Additional inclusion of the
‘always-on’ dye, DL700, which does not experience AuNP quenching from a SET interaction,
enables tracking of uptake, sorting, and NA integrity; while simultaneously providing a means to
measure DNA cargo release rates ratiometrically.
3.2 Materials and Methods
All chemicals were purchased through MilliporeSigma, unless otherwise noted.
3.2.1 AuNP Synthesis
Spherical 6.6 nm diameter AuNPs were synthesized by the citrate method according to
published protocols.204 Briefly, a sparged aqueous solution of tetrachloroauric acid hydrate
(Strem Chemicals) was reduced in the presence of citric acid and tannic acid at 60 °C with rapid
stirring at a ratio of 1:4:0.5 mL of each 1% (by mass) solution in 100 mL of H2O, total volume.
The prepared AuNPs were exchanged with bis(p-sulfonatophenyl)phenylphosphine (BSPP) as
the protecting group. Particle size and shape analysis was conducted using a JEM-ARM200cF
Transmission Electron Microscope for imaging and ImageJ for manual measurement of the

57
diameters of 100 particles. Size distribution and Gaussian fit of 6.6±1.0 nm were calculated in
Igor software. DNA biofunctionalization of the AuNP was conducted by stable displacement of
the coordinated BSPP passivation layer through thiol place exchange reactions using thiol-
terminated DNA sequences. The synthetic DNA probe sequences are given below.
3.2.2 DNA Probes
Oligonucleotide sequences were designed to avoid FRET interactions of the dyes with
one another, as well as produce optimal SET interactions for specific turn on of the release and
pH probes and continuous fluorescence (non-SET coupling) for the uptake probe. The
oligonucleotides were purchased from Midland Oligos (Midland, TX), with the sequences given
below (modified bases are underlined).
Uptake probe strand: 5'-(thiol-C6)CGA GGT TGG CAA GAG TAA CAC GGA ATT
CAG TAT GCA CAC GGA ACG(DyLight 700)-3'
pH/release probe strand: 5’-CGT TCC GTG TGC A(DyLight405)TA CTG AAT TCC
GTG TTA CTC T(FAM)TG CCA ACC TCG-3’
A calibration curve awas created to measure the ratiometric absorbance and fluorescence
response of the dye-labeled DNA senor to changes in pH from 4-9 using McIlvaine’s buffer,205
via a Cary Bio 50 UV-Vis spectrophotometer (data not shown) and a Cary Eclipse fluorometer.
3.2.3 Synthesis and Characterization of the 3-color pH-BOT Probe
As previously described,102,132 the thiolated duplexed DNA probe sequence was appended
to the AuNP via thiol place exchange with the aid of 5 mM tris(2-carboxyethyl) phosphine
(TCEP) to reduce the protected dithiol on the synthesized DNA, followed by 24 h reaction of the
DNA and AuNP in a 20:1 ratio at RT. After which the complex was isolated by centrifugation in
ethanol and resuspended in Nanopure™ H2O. The complex was then characterized by 1%
agarose gel electrophoresis. The amount of dye-labeled DNA was quantified by UV-Vis
absorption spectroscopy and the amount of SET quenching was quantified by cyanide
etching142,206 of the AuNP to determine fluorescence recovery.

58
3.2.4 Investigation of pH-BOT Probe Buffering and Release in Cuvette
The pH-BOT probe was incubated at RT or 37ºC in McIlvane’s buffer solutions ranging
from pH 3.9 to 7.4 and CHO cell lysate solutions at pH 5 and 7, and fluorescence response was
measured using a Cary Eclipse spectrophotofluorometer over 24 h. CHO cell lysate was prepared
by three-fold rapid freeze-thaw lysis of ~1 million CHO cells in phenol red-free culture medium,
followed by addition of 0.5 M EDTA to impair nuclease activity. The cell lysate was then
subjected to a 0.2 μm syringe filtration to remove cell membrane aggregates, and pH adjusted
with 1 M HCl or NaOH. Calculated pH values were obtained from the integrated fluorescence
intensities ratios of FAM (excitation 480 nm) to DL405 (excitation 390 nm) using the calibration
equation, computed in MATLAB (MathWorks®).
3.2.5 Cell Culture and Transfection
Chinese hamster ovary (CHO) cells acquired from ATCC were cultured at 37°C and 5%
CO2 with 50% humidity were grown in Dubelco’s modified Eagle’s medium (DMEM 2902)
supplemented with non-essential amino acids, 10% cosmic calf serum (CCS) and antibiotics
(Gibco), and were plated at 30,000 cells/cm2 in glass bottom 96-well plates (MatTek) 24 h prior
to experimental transfection. McSET pH probe complexes were encapsulated in
Lipofectamine2000® (Life Technologies) according to optimized manufacturer instructions,
briefly 1 µL of Lipofectamine® reagent was used per 2 pmol of pH-BOT in a total volume of 60
µL of serum free FluoroBrite imaging media (Life Technologies), incubated together at room
temperature for 20 mins immediately prior to transfection, of which 20 µL was added to fresh
serum containing FluoroBrite imaging media per well. Endo-lysosomal vesicle tracking was
conducted by treating cells with CellLight™ Early Endosomes-RFP, BacMam 2.0 (Molecular
Probes), CellLight™ Late Endosomes-RFP, BacMam 2.0 (Molecular Probes), or LysoTracker
DND-99 (Molecular Probes), prior to transfection with the pH-BOT probe according to
manufacturer instructions.
Fixed cell slides were prepared at 2 and 6 h post transfection with CellMaskTM Orange
membrane stain (Molecular Probes) to assess internalization of the pH-BOT, according to the
manufacturers protocol.

59
3.2.6 Optical Microscopy
Confocal fluorescence images were collected using a Nikon Eclipse Ti inverted
microscope at 40x and 20x magnification. Samples were excited using a Yokogawa automated
5000 RPM spinning disk confocal microscope equipped with lasers to excite the DL405 (405
nm, 900 ms exposure), FAM (488 nm, 500 ms exposure), and DL700 (640 nm, 900 ms
exposure). Images were collected by an Andor Clara interline CCD high resolution camera.
Measurements were taken at 30 min intervals for 24 h while incubated in a stage-mounted live
cell chamber (kept at 37 °C, 5% CO2 and 50% relative humidity). Focus was maintained
throughout the time course of the experiment using a Nikon Perfect Focus system.
Membrane-stained fixed cells were imaged using a Zeiss LSM 880 inverted confocal
microscope. Fluorophores were excited with 405 nm (DL405), 488 nm (FAM), 543 nm
(CellMaskTM Orange),and 633 nm (DL700) lasers, using a Plan-Apochromat 63x/1.40 Oil DIC
M27 objective.
3.2.7 Image Analysis
Images were analyzed for fluorescence intensity and cell number by ImageJ and Nikon
Elements software, with construct tracking of DL700 intensity and intra-endosomal pH at the
time of release and during cell processing monitored by tracking the FAM to DyLight405 ratio
of intensities, for punctate fluorescence regions of interest.
Automated image analysis was carried out in ImageJ software, utilizing the thresholding
function to isolate endosomal fluorescence signals from the background intensities. Analysis of
the intensity ratios of DL405 to DL700 gave rise to the rate of release from the NP surface over
time. Analysis of the FAM to DL405 ratios showed the effect of changing endosomal pH on the
pH-sensitive FAM over time. Experimental N of 5 replicates, with 3 imaging fields per replicate.
Analysis of the endosomal populations was performed using Nikon Elements Analyst
software. Individual endosomes were selected using a region of interest tool, and ratios of FAM
to DL405 were extracted for each individual endosome. Experimental N of 4 experimental fields,
with analysis conducted on approximately 250-500 individual endosomes per time point.
Fluorescence intensity ratios were converted to pH according to the calibration equation
(Eqn. 3.1) for the pH-BOT probe, using MatLab software. Histograms of endosomal pH

60
populations were calculated in Igor software, as were sigmoidal and linear fits for the calibration
curve and DNA release kinetics.
3.2.8 Endo-Lysosomal Tracking Colocalization Analysis
Fluorescence images were deconvoluted to remove background fluorescence noise
contamination with the rolling ball background subtraction of 50 pixels in ImageJ.
Colocalization was assessed by comparison of the RFP channel for CellLightTM RFP-Rab or
LysoTrackerTM DND-99 for each vesicle with the DL700 channel for the pH-BOT probe via
JACoP (ImageJ plugin)152 to assess the cross-correlation function and Manders’ colocalization
coefficient for each image set. Thresholds were set for each image and channel individually.
Averages and standard deviation were calculated in Microsoft Excel.TM
3.3 Results and Discussion
3.3.1 Nanotherapeutics in the Endo-Lysosomal Pathway
Trafficking of therapeutic cargo delivered by a gold BOT into a cell typically occurs via
the mechanism of endocytosis, resulting in rapid cellular packaging and processing through the
endo-lysosomal pathway (Figure 3.1).207 The endo-lysosomal cellular defense response is
marked by a rapid acidification of encapsulated foreign material through upregulation of V-
ATPase proton pump activity as maturation of the endosome from early endosomes (EEs), to late
endosomes (LEs), and finally lysosomes (LYs) occurs.85 The EE has a typical pH of
approximately 7-6, as well as a membrane containing Rab5 proteins85,208 (Figure 3.1A i). As the
endosome and its contents are processed by the cell, membrane fusion and fission events occur
which allow for gradual acidification of the endosome and replacement of the Rab5 proteins for
Rab7 proteins, which engender the more mature endosome to have the classification of LE, also
referred to as a multi-vesicular body, with a pH of approximately 6-5 (Figure 3.1A ii & iii).209,210
LEs eventually acidify and fuse with LY which are capable of acidifying to a pH of 5-4.5 (Figure
3.1A iv). The maturation of the endosome represents one of the primary cellular defense
mechanism against viruses and other pathogens, thus the maturation of the endosome leads to
efficient nucleic acid degradation and thereby the loss of therapeutic potency for gene
therapeutics.211
For siRNA, antisense DNA, or other gene therapeutics to realize their full therapeutic

61
benefit, the intact nucleic acid sequences must depart the endo-lysosomal pathway prior to full
acidification of the late endosome and subsequent fusion with the lysosome, where exogenous
material is broken down into its rudimentary amino acid and nucleotide building blocks, if no
previous escape or shunting transport has occurred.
3.3.2 Design of the pH-BOT Probe
To report the pH experienced by the nanotherapeutic agent once transfected into Chinese
hamster ovary (CHO) cells, a live-cell bio-optical transponder was designed to actively report the
pH (pH-BOT) following release of an AuNP delivered NA cargo within the endo-lysosomal
package. The pH and nanotherapeutic location is monitored by a fluorescent dye cassette chosen
specifically to provide spatial and temporal information by colocalization reporting. The pH-
BOT is designed around a spherical AuNP, with a diameter of 6.6 nm, that has been
biofunctionalized with ~20 DNA per AuNP (Figure 3.1B). The remaining sites are passivated by
bis(p-sulfonatophenyl)phenylphosphine (BSPP). The 45 basepair (bp) duplex DNA is
synthetically prepared to couple three dyes: DyLight (DL) 405 as an internal base modification
of the thymine (T) at the 32nd bp, fluorescein amidite (FAM) as an internal T base modification
at the 11th bp, and DL700 as a 5’ phosphate appendage at the 45th bp relative to the AuNP
surface. The DL405 and FAM are on the same single strand of DNA, while the DL700 is bound
to the complimentary strand, to monitor duplex denaturation and DNA degradation. The three
dyes are coupled through C6 spacers and are chosen to continuously monitor cellular processing
and ensure colocalization analysis can be performed to eliminate errors from nuclease
degradation of the pH-BOT. Transmission electron microscopy (TEM) images confirm the
AuNP size of 6.6 nm with a spherical morphology (Figure 3.2 A & B). Confirmation of binding
is provided by gel mobility studies using 1% agarose gel electrophoresis (Figure 3.2C).
Indicative of DNA binding to the AuNP via the reduced thiol linkage, the gel shows the pH-BOT
is retained relative to the as-synthesized AuNP, and AuNP in the presence of protected dithiol
DNA (RS-S-DNA). Upon binding the tri-labelled duplex DNA to the AuNP surface, the
emission from FAM and DL405 is observed to be quenched, while the emission intensity for
DL700 is unchanged (Figure 3.3A). Further evidence of coupling is demonstrated by sodium
cyanide etching of the AuNP to release the duplex DNA, resulting in immediate turn-on of the

62
FAM and DL405 emission signatures (Figure 3.3A), and dissolution of the AuNP can be seen by
the loss of the plasmon at 525 nm in the absorbance spectra (Figure 3.2D).
Figure 3.2 Nano-bioconjugate characterization showing (A) TEM of as-synthesized spherical
AuNPs with (B) Gaussian fit to the size distribution of 6.6 ± 1.0 nm. (C) 1% agarose gel
electrophoresis of the AuNP pH-BOT probe (i), versus as-synthesized AuNP with protected RS-
S-DNA (ii), and as-synthesized AuNP with no DNA (iii). Retention of the AuNP pH-BOT probe
versus controls demonstrates reduced thiol facilitated DNA binding to the AuNP. (D)
Absorbance spectra of sodium cyanide etching of the AuNP away from the pH-BOT probe, with
loss of the AuNP plasmon at 525nm indicating cyanide dissolution of the AuNP and liberation of
the previously bound duplex DNA strands, and (inset) 50x zoom of post cyanide absorption
showing DL405, FAM and DL700. Absorption of AuNP displays a concentration of 0.01 µM
(ɛ525=1.97x10⁷ M-1 cm-1) prior to cyanide treatment, and the duplex pH-BOT DNA gives a
concentration of 0.19 µM (ɛ260=7.3x10⁵ M-1 cm-1) after cyanide.

63
3.3.3 Optical Response of the pH-BOT
The DL700, DL405 and FAM labels provide three functions: i) tracking cellular uptake of the
pH-BOT, ii) spectrally reporting release of the DNA from the AuNP surface by a
photoluminescence turn-on event due to loss of SET quenching as the DNA diffuses away from
the AuNP surface, and iii) providing an active pH reporter by ratiometric analysis of FAM to
DL405 fluorescence intensities, reflecting the pH sensitivity of FAM and near insensitivity of
DL405 for the physiologically relevant pH range of the endo-lysosomal pathway (pH 7.5 to 4.5).
FAM is highly pH sensitive due to its three protonatable oxygens providing pKa points at 2.2,
4.3, and 6.7.212 In comparison, DL405 is weakly sensitive to pH, making it a good ratiometer for
measuring intracellular pH (Figure 3.3B).200 Optical tracking of the pH-BOT from uptake to
endo-lysosomal processing is achieved by monitoring the emission of DL700. DL700
photoluminescence is not quenched in the presence of the AuNP allowing its intensity to provide
a continuous monitor of the cellular location and packaging of the pH-BOT. Since DL700 is
relatively pH insensitive over the physiologically relevant range (Figure 3.3B), it provides an
internal intensity standard for analysis of the integrity and concentration of active pH-BOT.
Observation of colocalization of DL700, with DL405 and FAM emission, as well as constant
intensity of DL700 during the experimental measurements, signal the absence of nuclease
induced DNA degradation or acidic depurination of the DNA. As observed in cuvette studies,
the ratio of DL405 to DL700 remains relatively unchanged between pH 5-7.5, and can be used as
a ratiometric measure of intracellular DNA release (Figure 3.3D).
The release of the DNA cargo from the AuNP surface and pH of the environment
experienced by the cargo is reported by the emission profile of FAM and DL405. DL405 and
FAM are quenched when bound to the gold surface through surface energy transfer (SET)
mechanisms.53,130 Following the scission of the Au-thiolate bond as the endosome acidifies, the
release of the duplex DNA into the endosomal lumen is reported by the ratiometric turn-on of
emission for FAM to DL405. In Figure 3.3A, the optical response of the DNA release event is
calibrated in cuvette studies wherein the dye-labeled DNA is liberated from the AuNP by
cyanide dissolution causing fluorescence recovery of the quenched FAM and DL405.
The pH environment of the pH transponder DNA duplex is reported ratiometrically by
the intensity ratio of FAM relative to DL405. A calibration curve was generated by plotting the
response of the pH-responsive DNA sequence in the absence of the AuNP in various pH buffers

64
Figure 3.3 (A) Emission spectra and schematic of AuNP-bound (i) and released (ii) DNA
labeled with the dyes DL405, FAM, and DL700 of the pH-BOT probe. Excitation wavelengths
of 390nm, 480nm, and 670nm, for each dye, respectively. Sodium cyanide dissolution of the
AuNP gives rise to the fluorescence recovery of the previously quenched DL405 and FAM,
whereas the unquenched DL700 maintains fluorescence. (B) pH dependent fluorescence
intensity spectra of DL405, FAM, and DL700 from pH 4 to pH 8, with schematic of DNA-bound
dye fluorescence changes in basic (i) versus acidic (ii) conditions. (C) pH dependent ratio of
FAM:DL405 with sigmoidal fit (red curve) giving the pH calibration equation. (D) The
fluorescence intensity ratio of DL405:DL700 displaying pH independence between pH 5-8. Error
bars indicate standard error.

65
with constant ionic strength (150 mM K+) (Figure 3.3B). The sigmodal pH calibration curve
generated from the photoluminescence from pH 4 to 8 is shown in Figure 3.3C. From the graph
of fluorescent intensity ratios versus pH, the standard curve is plotted in Figure 3.3C and the pH
calibration equation is generated (Eqn. 3.1):
𝐼 𝐹𝐴𝑀
𝐷𝐿405
=0.35+1.71÷[1+𝑒(6.38−𝑝𝐻𝑖
0.41)] (Equation 3.1)
Where IFAM/DL405 is the fluorescence intensity ratio of FAM to DL405, and pHi is the
intracellular pH.
3.3.4 Dynamic Monitoring of Intracellular pH
Dynamic monitoring of the cellular uptake and endo-lysosomal processing of the pH-
BOT probe was investigated using Lipofectamine2000® assisted transfection of CHO cells
following literature procedures.132 The CHO cells were grown at 37°C in 10% CO2 using low
glucose media with 10% serum, plated at a seeding density of 30,000 cells per cm2 in glass
bottom 96-well optical plates that were coated with poly-D-lysine for enhanced cellular
adhesion. Cells were grown to ~60% confluence and the culture media was exchanged with
FluoroBrite® imaging media prior to transfection of the CHO cells with 2.6 nM pH-BOT. The
cells were incubated with the transfecting material for 1.5 hours at 37°C in 10% CO2 prior to
media washing, to remove any unincorporated material. This step was carried out to ensure that
continuous uptake events did not convolute the observations of the kinetics of the DNA release
event and the active reporting of intracellular pH by the pH-BOT.
Cellular internalization of the pH-BOT was verified by collection of high resolution
confocal z-stack images of transfected cells, fixed at 2 and 6 h time points with CellMaskTM
Orange plasma membrane stain. It can be seen in Supporting Figure 3.4 that the pH-BOT
fluorescence is localized within the plasma membrane boundary, verifying that the fluorescence
response of the pH-BOT can indeed be correlated to the intracellular pH experienced by the
probe, and is not an artifact of membrane aggregation.
In Figure 3.5, the dynamic events of endosomal uptake and maturation are monitored by
measuring the time dependent changes (1.5 h to 24 h) to the emission spectra for DL405 (blue),
FAM (green), and DL700 (red), using live cell confocal fluorescent microscopy. Cellular health
and morphology, as well as relative localization of the pH-BOT, are observed by referencing the
differential interference contrast (DIC) images. The dye labels are observed to be colocalized in

66
Figure 3.4 Confocal z-stack images of CellMask Orange® plasma membrane stained CHO cells
at 2h (A) and 6h (B) post-transfection with the pH-BOT. Arrows show cellular internalization of
the pH-BOT, as the pH-BOT fluorescence is observed most clearly at the focal plane
corresponing to center of the cell (ii), as opposed to the outter membrane (i) where the signal is
out of focus. Some punctate fluorescent packages are observed to even localize within the base
of the cells (iii).
punctate packages indicative of endosomal encapsulation following transfection. The DIC
channel allows for the visualization of cell morphology, showing no significant impact on cell
health throughout the experiment, as well as apparent uptake of dark, AuNP containing,
liposome packages. Inspection of the time dependent changes in the blue, green, and red
fluorescence channels show the intracellular processing of the pH-BOT in time.
The intensities of the dyes observed in the selected images (Figure 3.5) and observed
though continuous imaging via the tiled overlay images (Figure 3.6 fluorescence and DIC
composite images and Figure 3.7 ratio map with DIC overlay images) report on the pH-BOT
location and pH evolution, allowing a correlation with the endosomal maturation process. The
red channel (DL700) is not quenched by the appended AuNP. A plot of the intensity as a
function of time is extracted from images collected every 0.5 h to reveal the DL700 intensity is

67
Figure 3.5 (A) Fluorescence images of the cellular uptake and processing of pH-BOT probe in
CHO cells from 1.5 to 24 hours, following Lipofectamine2000® transfection and media washing
at 1.5h. Grey (DIC) images allow for visualization of cell morphology, blue (DL405) reports
DNA release from AuNP, green (FAM) indicates intracellular pH after DNA release, red
(DL700) shows pH-BOT construct tracking throughout the experiment, and the composite
(Overlay) image illustrates colocalization of fluoresce signals within the cells. (B) Pseudo-
colored thermal plots of the ratiometric fluorescence of FAM/DL405 indicates intracellular pH
(4.5 = purple to 7.5 = red) throughout cellular processing of the pH-BOT. Scale bar: 25 µm.

68
Figure 3.6 Cell uptake and processing of the pH-BOT probe shown in DIC overlay images of
the 3 color confocal fluorescence images with DL405 (blue), FAM (green), and DL700 (red).
Scale bar: 10 µm.

69
Figure 3.7 Cell uptake and processing of the pH-BOT probe shown in DIC overlay images of
thermally colored Ratio map of FAM:DL405 fluorenscence intensities, with warm colors
representing more basic pH environments experienced by the probe and cool colors representing
more acidic pH environments (i.e. red to blue = 7.4 to 4.5). Scale bar: 10 µm.

70
nearly time independent (Figure 3.8A). The observation of nearly continuous DL700 intensity
indicates efficient endosomal packaging of the transfected pH-BOT occurs with minimal
exocytosis of the packages during the experimental measurements.
Figure 3.8 Average microscope fluorescence intensity ratios of (A) the change in intracellular
DL700 intensity from initial intenisity, showing little change over time, and (B) the relationship
of intracellular FAM to DL700 intensity, showing decreasing FAM intensity and consistent
DL700 intensity over the 24 h time course of the experiment.
The blue (DL405) and green (FAM), relative to red (DL700), fluorescence channels
report the cleavage of the pH transponder DNA duplex from the AuNP surface and the evolving
pH in the endosomal package as the endosome matures. The release event is signaled by the
turn-on of emission for FAM and DL405 caused by loss of the effective SET proximity
quenching of the fluorophores’ emission when bound to the AuNP. The turn-on event follows
cargo release as the DNA duplex and appended fluorophores diffuses away from the AuNP
surface. As observed in the composite image tiles, correlated turn-on of the green and blue
emission is observed simultaneously in the cell, which indicates duplex DNA release is occurring
within the earliest image frame.
A plot of the intensity of DL405 relative to DL700 (Figure 3.9A) allows the dynamics of
the DNA release from the AuNP to be measured. The half-life for release is 1.5 h (red sigmoidal
curve in Figure 3.9A) with an observed slow depletion of DL405 intensity (blue line) due to
endosomal leakage of the duplex DNA from the endosomal packages.

71
Figure 3.9 (A) pH-BOT DNA release rate from AuNP core as assessed by the fluorescence
intensity ratio of DL405 (SET quenched) to DL700 (unquenched), over the 24 h experiment.
Initial release kinetics (▲) plotted to a sigmoidal function curve (red fit) from 0 to 10.5 h.
Fluorescence ratio decline (▼) plotted to a linear decay (blue fit) from 11 to 24 h. (B) Calculated
average endosomal pH experienced by the AuNP pH-BOT probe during 24 hour cellular
processing following Lipofectamine2000® transfection and media washing at 1.5 hours (black
line). Shaded boxes represent typical pH values of early endosomes (red: pH 7.4-6), late
endosomes (yellow: pH 6-5), and lysosomes (blue: pH 5-4.5). Error bars represent standard
deviation. (C) Populations of endosomes at given pH values for selected timepoints over the
course of the experiment. Shaded boxes represent typical pH values of early endosomes (EE, red:
pH 7.4-6), late endosomes (LE, yellow: pH 6-5), and lysosomes (LY, blue: pH 5-4.5).
After 10 h post transfection, the ratio of DL405 to DL700 begins to slowly decay for the
remainder of the experiment with a loss of approximately one fluorescence unit per minute, with
a linear decay slope of -0.0177 I/h. Similar results were observed for DNA therapeutic delivery
from an AuNP into live cells in an earlier publication.132 Since the red DL700 channel depicts
the location of the pH-BOT throughout the experiment, the observed colocalization of the DL405
and FAM with DL700 implies the lack of DNA damage from enzymatic cleavage of the duplex

72
DNA strand during the active visualization of trafficking of the labelled DNA probe sequence in
the cell over the course of the experiment.
When evaluating the ratiometric intensities of the pH-BOT relative to its “always on”
DL700, it is important to note that within the cell, the intensities of DL405, FAM and DL700 are
dependent on the state of the pH-BOT (whether DNA is bound or released), its cellular location
(whether endosomally encapsulated or cytosolically diffused), the endosomal environment (EE
versus LE, or neutral versus acidic pH), and the microscope’s detector sensitivity for each dye.
To understand the ratio of DL405 (𝑰405) to DL700 (𝑰700), the fraction of bound (a) to released
(b) DNA must be considered. In addition, the fraction of endosomally encapsulated vs
cytosolically diffuse must also be taken into account. For instance, when m molecules of labeled
DNA escape from the endosome, both the DL405 intensity (𝑰405) and DL700 (𝑰700) are reduced
from detectability by m number of fluorophores due to cytosolic dilution as the DNA diffuses
out of the endosome and becomes no longer detectable. However, for the fraction of bound DNA
molecules (a), only DL700 is emissive (a𝑰𝑏𝑜𝑢𝑛𝑑700 ), while DL405 (𝑰𝑏𝑜𝑢𝑛𝑑
𝐷𝐿405 ) and FAM (𝑰𝑏𝑜𝑢𝑛𝑑𝐹𝐴𝑀 )
fluorescence are both quenched by the proximity to the gold nanoparticle and therefore
undetectable. Thus, one can predict that as the dye-labelled DNA escapes from the endo-
lysosomal system, the ratio of fluorescence intensity for DL405/DL700 will decrease as
described in Eqn. 1
Endosomal Entrapment Endosomal Escape
𝐼𝑜𝑏𝑠𝑒𝑟𝑣𝑒𝑑405/700
=b𝑰𝑟𝑒𝑙𝑒𝑎𝑠𝑒𝑑
405
a𝑰𝑏𝑜𝑢𝑛𝑑700 +b𝑰𝑟𝑒𝑙𝑒𝑎𝑠𝑒𝑑
700 > b𝑰𝑟𝑒𝑙𝑒𝑎𝑠𝑒𝑑
405 −m𝑰𝑒𝑠𝑐𝑎𝑝𝑒𝑑405
(a𝑰𝑏𝑜𝑢𝑛𝑑700 +b𝑰𝑟𝑒𝑙𝑒𝑎𝑠𝑒𝑑
700 )−m𝑰𝑒𝑠𝑐𝑎𝑝𝑒𝑑700 (Equation 1)
Where a is the number of DNA molecules thiol-bound to the AuNPs in an endosome, b is the
number of DNA released from the particle surface but remaining in the endosome/lysosome.
And m is the number of labeled DNA molecules that have escaped into the cytosol. Based on
Eqn. 1, as the DNA is released from the gold nanoparticle surface, it is expected that the escape
of each labeled NA molecule from the endosome reduces the intensity of DL405 and DL700 in a
linear relationship for one molecular unit of fluorescence intensity at a time, due to the limit of
detection of cytosolically dilute fluorophores. If one extends the above relationship to be time-
dependent, it becomes apparent that a negative slope is anticipated to arise whenever the rate of

73
escape exceeds the rate of release, and is linear whenever the rates are constant. Indicating that
for the observed data, rates of release dominate for times less than 4 h, but after 12 h the rates of
escape dominate (Figure 4A). Between ~4 to 12 h post-transfection the changing rates of release
and escape make it difficult to determine if there is a true equilibrium at any particular time.
Comparison of the FAM channel to the DL405 indicates that a decrease in the intensity of FAM
occurs in time. The decrease is also observed relative to the DL700 (Figure 3.8B). As expected
the decrease in FAM intensity relative to DL700 is sharper than the decrease of DL405 relative
to DL700 because of the greater pH-sensitivity of FAM. Plotting the decrease in intensity of
FAM relative to DL405 can therefore be interpreted in terms of the pH of the endosome using
the calibration curve from Figure 3.3C. A quantitative measure of the intracellular pH
experienced by the pH-BOT can be assessed by calculation of the endosomal pH from the
ratiometric fluorophore intensities extracted from the live-cell fluorescent microscopy images
collected every 0.5 h (Figure 3.6). In Figure 3.9B, the average endosomal pH in time is plotted
and assigned to values correlated with reported pH ranges for EE, LE and LY environments.
From the time-averaged plot it can be seen that the ensemble average endosomal pH experienced
by the probe duplex DNA does not acidify to the typical classification of a LY (pH 5.0-4.5) over
the course of 24 h, as expected, but rather appears to stall at a pH hovering between early and
late endosomes, near pH 6 (Figure 3.9B). An attempt to replicate the potential pH altering effect
of the pH-BOT construct, outside of the endosome, was conducted in cuvette using buffers and
cell lysate. Room temperature McIlvaine’s buffer in a pH range from 3.9-7.4 showed no
significant buffering effect when exposed to the pH-BOT construct over 24 h (Figure 3.10A). To
more closely replicate cellular conditions, CHO cell lysate was extracted, and pH adjusted to 5
and 7, prior to exposure to the pH-BOT and incubation the physiological temperature of 37ºC. A
slight alkalizing effect was observed for the cell lysate solution at neutral pH, where a solution of
pH 7.0 cell lysate gave an average measured pH response of 7.61 ± 0.15, over the course of 24 h
at 37ºC. But this effect seemed to be overcome at higher acid concentrations, where a solution of
cell lysate acidified to pH 5.0 gave an average measurement of 5.07 ± 0.21 in the presence of the
pH-BOT, over the 24 h experimental time frame, (Figure 3.10B). Additionally, the DNA release
from the pH-BOT was investigated in cuvette in buffer versus extracted cell lysate, and both
conditions demonstrated a much slower rate of release than observed in the live cell experiment
(Figure 3.10C&D versus Figure 3.9A) where only about 50% of full release was observed within

74
Figure 3.10 Cuvette studies of pH-BOT buffering and release in McIlvaine’s buffer and CHO
cell lysate. (A) pH-BOT calculated pH from the fluorescence ratio of FAM to DL405 at 0h (blue
diamonds) and 24h (red squares) after RT incubation with pH 3.9-7.4 McIlvaine’s buffer
solutions. (B) And calculated pH reponse of the pH-BOT in CHO cell lysate, pH 5 and 7, at 0h
(blue open circle), 12h (purple closed triangle), and 24 h (red banded square) incubated at 37°C.
(C) Nano-cargo release of the pH-BOT DNA from the AuNP in (C) McIlvaine’s buffer at pH 7.4
and 5.1, and in (D) CHO cell lysate at pH 7 and pH 5, both incubated at 37°C for 24 h.
24 h at 37 ºC, demonstrating that buffer and cell lysate do not adequately recreate the endosomal
conditions that promote nano-cargo release. Interestingly, Figure 3.10D shows the pH-BOT
experienced slower release within the cell lysate solution at low pH, implying that pH is not the
driving factor for nano-cargo release inside cells, and may support theories of thiol-containing

75
cellular proteins and peptides aiding in the displacement of the thiolate-AuNP bond.213,214 This
further establishes the complexity of the endosomal microenvironment experienced by the pH-
BOT and the need for in vitro analysis of NP therapeutic fate and processing.
Microscope images of the time dependent pH response, represented as a pseudo-colored
thermal map in Figure 3.5B, reveals the expected cellular heterogeneity of the pH-BOT
encapsulated in vesicles at various points of maturation within each cell. In Figure 3.5B the red
punctate spots indicated an approximate endosomal pH near 7.5, with gradation down to blue
spots which represent acidic pH values near 4.5. While the range of colors (pH values) are
visible at each time point, early time points are dominated by more neutral (red) endosomes, and
later time points show an increased population of lightly acidic (orange-green) endosomes,
comparatively. Inspection of Figure 3.5B shows the expected acidification of the endosomes as
they mature from early to late (Figure 3.1).
3.3.5 pH Population and Packaging Distribution
The average pH experienced by the pH-BOT can be deconvoluted to report the
distribution of endo-lysosomal populations in time. In Figure 3.9C, the peak distributions are
predominantly observed to proceed from near neutral pH ~6.8 at early time points towards more
classical EE and LE pH values at 6 to 5.5, with relatively few endosomes maturing to LY (pH 5-
4.5), and the overall distribution maintaining an average pH near 6. The observed population
statistics in Figure 3.9C show the endosomal population distributions are not Gaussian.
Observation of the non-statistically uniform population profile paired with the asymptotic
behavior for the average pH over a 24 h period suggests the possible occurrence of endosomal
stalling. Endosomal stalling has been observed for transfection by polymeric and other ionizable
transfection agents and been attributed to buffering inside the endosome.172,215 Previously, it was
suggested that such a behavior may explain the long-term effectiveness of siRNA delivery from
an AuNP surface, since siRNA is known to degrade rapidly in endosomes when delivered by a
non-protecting transfection agent alone.100 The buffering of the endosome does not imply an
absence of maturation for the EE to LE and LY, but rather only that the average pH is affected
within the endosomes. Alternatively, the observation of secondary populations of higher pH
endosomes may represent distributions of packages which have begun to be processed into
recycling endosomes for exocytosis. In addition, it is possible that since DNA release continues

76
to occur up to 3 h post transfection, the reported distribution of pH values may be affected by the
presence of unreleased DNA-bound fluorophores within the endosomes, or that the freed DNA
cargo is escaping the endosomal pathway prior to LY packaging, convoluting live pH reporting.
3.3.6 pH-BOT Endo-Lysosomal Colocalization
In order to evaluate the state of endosomal maturation and determine the intracellular
localization of the pH-BOT probe before and after maximal DNA release (2 h and 6 h,
respectively), analysis of fluorescence intensity colocalization of the unquenched DL700 from
the pH-BOT probe was preformed using commercially available endosomal and lysosomal
tracking labels. Endosomal trackers consisted of red fluorescent protein (RFP) conjugates to
Rab5 (EE membrane protein) and Rab7 (LE membrane protein), and the lysosomal tracker used
was LysoTrackerTM DND-99, purchased from Molecular Probes.
Figure 3.11 (A-F) displays the cross-correlation functions (CCF) of colocalization for the RFP
fluorescence channel versus the DL700 fluorescence channel averaged over five image fields for
each time point and tracker, to give a clear picture of the overall colocalization of the pH-BOT
with each vesicular component of the endo-lysosomal pathway, before and after complete release
of the DNA from the AuNP. The van Steensel CCF is defined by the best Gaussian fit of the plot
created by laterally shifting the image pixels in one fluorescence intensity channel “A” (DL700),
versus another potentially colocalizing fluorescence intensity channel “B” (RFP) and comparing
the effect of the pixel shift on the Pearson’s correlation coefficient (rp = ∑(𝐴𝑖−𝑎)𝑥(𝐵𝑖−𝑏)
√∑(𝐴𝑖−𝑎)2𝑥 ∑(𝐵𝑖−𝑏)2
where i denotes intensity values for a given pixel, and a & b denote the intensity averages over
the whole image per channel, A and B) for each image overlap position.149,152 Here the
observation of maxima at the 0 pixel-shift position indicates colocalization of the pH-BOT probe
with the EE, LE and LY trackers (Figure 3.11A-F). Slight lateral favoring of maxima away from
0 pixel-shift, for EE and LE trackers indicate a slight degree of partial colocalization, which is
most likely due to the slightly larger and more heterogeneous morphologies of EEs and LEs, as
compared to LYs.216 This in contrast to an observation of minima at 0 shift, a sign of
delocalization, which is not seen for any of the tracker labels compared with the DL700.149 This
indicates that the pH- BOT probe is found in all components of the endo-lysosomal pathway at 2
and 6 h after transfection.

77
Figure 3.11 Endo-lysosomal pathway colocalization analysis depicting (A-F) the cross-
correlation functions of DL700, from pH-BOT, with RFP trackers, for early endosomes “EE”
Rab5-RFP (A & D), late endosomes “LE” Rab7-RFP (B & E), and for lysosomes “LY”
LysoTrackerTM DND-99 (C & F), at 2 and 6 hours post transfection, respectively. Average
Manders’ colocalization coefficients for the fraction of DL700 colocalizing with RFP for each
vesicle type were found to be 0.035, 0.071, and 0.059 for EE, LE and LY at 2 h, respectively;
and at 6 h were found to be 0.068, 0.097, and 0.061, respectively. (G) Chromagraphic legend of
colocalization between FAM and DL405, from pH-BOT, and RFP from vesicle trackers; and (H)
colocalization from digitally zoomed single-cell merged confocal fluorescence microscopy
images of CHO cells with the pH-BOT probe and RFP vesicle trackers of either (EE), (LE) and
(LY), collected at 6 h post transfection. Arrows indicate vesicles with colocalization of RFP
trackers with the pH-BOT in EE (i-iii), LE (iv-vi), and LY (vii-ix), with variation in color due to
differences in fluorescent intensities of each fluorophore per endosome. The FAM:DL405
emission ratio gave the following pH values: 6.50 (i), 6.50 (ii), and 6.50 (iii), in EE; 6.04 (iv),
6.25 (v), and 6.39 (vi), in LE; and 6.28 (vii), 5.96 (viii), and 6.33 (ix), in LY, for the selected
vesicles at 6 h post transfection. White cell outlines for cells of interest were traced from
transmitted light images. Scale bar: 10 µm.

78
Traditional use of rp alone to determine the degree of colocalization in a fluorescent
microscope image is limited by a necessity to have similar intensity values for each fluorescence
channel, where an rp value of 1 would lend to complete one-for-one intensity matching at each
pixel, 0 would be the absence of any colocalization, and -1 would mean opposite intensity
matching. Thus rp values between 1 and 0 are difficult to interpret for most non-ideal systems
(i.e. microscope images with background noise, differential quantum efficiencies of fluorescent
molecules, or non-homogeneous labeling). In the case of commercially available vesicle trackers,
it is not possible to ensure 100% detectable labeling of all vesicles in all cells. This can be seen
by the more Gaussian shape of the CCF for the LY tracker (Figure 3.11C (2h) and 3.11F (6h)),
which is due to the nature of the dye-based vesicle labeling as compared to the EE (Figure 3.11A
& D) and LE (Figure 3.11B & E) trackers which are fluorescent protein-fusion labeled. The EE
and LE trackers have RFP constructs that require uptake of a viral transfection agent (BacMam
2.0), cell processing and expression of the RFP-Rab fusion proteins, followed by subsequent
successful incorporation into the early and late endosomal membranes. Being a non-trivial
process, these trackers give less homogeneous labeling and emission profiles per cell, due to the
potential for differential expression in cells based on agent uptake and processing factors, as
compared to the LysoTrackerTM, which is an organic dye that readily crosses the plasma
membrane of all cells and fluoresces relatively evenly in the acidic organelles of the cells. This
difference in labeling combined with the naturally lower quantum efficiency217 of a far-red or
near IR dye, DL700, give rise to the overall low amplitude of the rp observed in the CCF plots,
and could otherwise be interpreted as an absence of colocalization, if not for consideration of the
factors discussed, and the CCF analysis.
Comparison of relative amounts of colocalization of the pH-BOT between vesicle types
was conducted by calculation of the Manders’ colocalization coefficients (M1 = ∑ 𝐴𝑖(𝑤ℎ𝑒𝑛 𝐵𝑖 > 0)
∑ 𝐴𝑖 )
for the fraction of DL700 fluorescent intensity colocalizing with the fluorescent intensity of each
RFP tracker (Figure 3.9 caption).151 Although the use of Manders’ colocalization analysis suffers
from similar limitations as rp with sensitivity to labeling efficiency and intensity matching, it can
still be used as an additional relative comparison of colocalization as it mathematically dampens
noise of intensity variation. From this measure, it can be said that at 2 h post transfection the pH-
BOT probe has predominant colocalization with the LE trackers with an M1 value of 0.071 for

79
LE, followed by LYs with an M1 of 0.059, versus 0.035 for EE. At 6 h, the colocalization with
EEs and LYs shifts to M1 values of 0.068 and 0.061, respectively, but the colocalization with
LEs remains high with an M1 value of 0.097. The shift towards higher colocalization with EEs at
the later time point may indicate a repackaging event of the pH-BOT agent. Comparing the
observed colocalization of the DL700 with the RFP trackers and the measured pH values for
endosome populations in Figure 3.9C, a disparity is seen between the expected pH values for
those vesicles, as the distributions of pH values would be expected to be more acidic, with the
majority of the pH-BOT probes localizing into LEs and LYs. To probe for evidence of a
potential pH buffering effect, the colocalization of the EE, LE and LY trackers’ RFP
fluorescence intensity was compared to the released pH-BOT probe’s FAM and DL405
fluorescence intensities, in order to measure the pH of the colocalized vesicles after full DNA
release at 6 h. It can be seen in Figure 3.11H that the oligonucleotide cargo of the AuNP is
present in EEs, LEs, and LYs, at 6 h after transfection, as indicated by the colocalization of
fluorescent RFP tags on Rab5 and Rab7 proteins for EEs and LEs, respectively, and
LysoTrackerTM DND-99 for LYs, with the fluorescence of the FAM and DL405 dyes from the
pH-BOT. However, the pH measured by the pH-BOT probe dyes are found to be 6.50 in EEs,
6.04, 6.25, 6.39 in LEs, 6.28, 5.96, 6.33 in LYs, for the selected vesicles (Figure 3.11H). This
supports the notion that the pH-BOT probe provides its cargo with some protective effect against
lysosomal acidification, as measured LE and LY pH values more closely resemble those
expected for EEs or “early” LEs.85,208,209
In all, the fate and processing of the pH-BOT appears to be mostly retained in LEs
implying a delay in endosomal maturation for the delivered AuNP pH-BOT. The lack of full
maturation is reflected in the ensemble average pH being observed to be above pH 6, which is
indicative of release and storage only within early endosomes. Upon analysis of the
colocalization of the pH-BOT probe with the stains for each vesicle type, it can be seen that the
pH-BOT probe is distributed to all vesicular compartments of the endo-lysosomal pathway. The
incongruency is likely due to possible pH buffering effects of the reactive thiolate once liberated
from the AuNP surface, potentially paired with a protective effect of the AuNP-DNA packing.
The appearance of potential buffering has been observed and debated in other nano-transfection
systems, in particular PEI delivery vehicles.172,218 The pH-BOT analysis confirms the buffering

80
effects which may explain the enhanced stability of nucleic acid therapeutic agents delivered by
AuNPs.100,102
3.4 Conclusion
Nanomaterials-based therapeutics, targeting the systematic manipulation of cellular
metabolites, have been at the forefront of biomedical research for the last few decades.219 For
therapeutics utilizing nucleic acids (DNA, siRNA, shRNA) understanding the pH evolution
during endo-lysosomal processing is critical for therapy design. The study shows that the
coupling of AuNPs to dye labelled DNA can allow McSET methods to be employed as a real
time active reporter of intracellular events. For pH detection the ratiometric measurement of
FAM to DL405 intensity demonstrates that the therapeutic cargo is observed in all stages of the
endo-lysosomal pathway, the pH appears to be buffered, and the DNA is not degraded over the
24 h experimental timeframe. The observed buffering is believed to be due to protonation of the
freed thiolate following cleavage of the Au-DNA thiolate bond. The release event was observed
to mitigate the acidification of early and late endosomes and stall the average endosomal pH near
6. The pH buffering of the evolving endosome may provide a protective environment for the
DNA cargo, which released with a 1.5 h half-life at pH 6.5. Colocalization analysis of
fluorescently labelled vesicles showed no interruption to the maturation of the endo-lysosomal
pathway, only buffering of the endosomal pH (Figure 3.11). Since pH buffering is observed,
these findings have important ramifications for medicinal uses of AuNP delivery agents,
particularly with respect to therapeutic designs that require acidic activation of an attached
medicine or acid-based cleavage of an attached cargo to allow therapy release from the
nanocarrier. Being aware of the intracellular conditions which promote cargo release and affect
therapeutic efficacy will lead to better nanotherapeutic design and the eventual creation of more
effective, dynamic nanomedicines to meet the needs of the individual patient.

81
CHAPTER 4
DIFFERENTIAL UPTAKE OF CELL PENETRATING PEPTIDE LOADED
MULTISHELL QUANTUM DOTS IN DRUG RESISTANT CANCER CELLS
4.1 Introduction
Despite improvements in therapeutic approaches for many types of cancer, the
development of multidrug resistance (MDR) remains a significant barrier to improving survival
time in patients with many types of aggressive cancers. The 5-year survival rate for melanoma
(<20%), mesothelioma (<5%), and gliosarcoma (<10%) are all unfavorable, particularly when
diagnosed at late stages.220–222 Although these aggressive cancers are often resected, in addition
to treatment with various chemotherapeutic agents, the remaining cells inevitably develop
chemoresistance resulting in the regrowth of highly aggressive, metastatic cancers.223–227
Therapies that increase drug delivery to tumors, while circumventing drug efflux and
other mechanisms responsible for chemoresistance, are critically needed to improve patient
outcomes. Recent studies have suggested the acquired drug resistance is coupled to both changes
in the surface markers and metabolic pathways within the cells.228–231 Unfortunately, initial
targeting of cancer surface markers with antibodies to overcome drug uptake difficulties, while
effective, has not translated into improved treatments, largely due to changes in surface markers
with the evolution of acquired drug resistance.232,233 While attempts to overcome the metabolic
changes using viral vectors to deliver therapeutics are potentially useful in late stage patients, the
immune response induced by viral vectors severely limits their usefulness.234,235
Non-viral approaches to overcoming drug resistant pathways include the use of cell penetrating
peptides (CPP) coupled to nanoparticles to effectively act as a transfection carrier of
chemotherapeutics.236 CPPs are derived from small sequence fragments of the protein
transduction domain of viral sheath proteins, or human carrier proteins. Packaging of CPPs onto
the surface of nanoparticles is an important focus area for packaging of therapeutics into non-
viral transfection methodologies.237–240 When the nanoparticle – loaded with a therapeutic agent
– is combined with a CPP, cellular uptake and delivery of the therapeutic agent can be enhanced.
Nano-therapeutic delivery agents have also been shown to enhance the survivability and
therefore effectiveness of the delivered nucleic acid agent due to reduced nuclease activity,
continuous agent release, and pH clamping of the endosomal package.56,140,241

82
There are reports suggesting that CPPs exhibit selectivity for different cell types.92,242–246
Thus, we have hypothesized that CPPs may also exhibit specificity for chemoresistance in
different cancer cells and have designed an approach to screen CPPs for nanocarrier uptake in a
cancer cell types with and without chemoresistance.
A
B
Figure 4.1 (A) Schematic diagram of CdTe@CdSe@CdS@ZnS multishell QD showing peptide
functionalization with CAAKA and hCT(9-32). (B) Graphic of QD-CPP cellular uptake,
showing cellular membrane association (i), internalization (ii), and endosomal entrapment (iii)
versus cytosolic distribution (iv).
This study investigates the cellular uptake of various CPP coated 4 nm multi-shelled
CdTe@CdSe@CdS@ZnS quantum dots (QDs) (Figure 4.1) and the effective enhancement of
cellular internalization in a series cancer cell lines of human melanoma (A375), human
mesothelioma (MSTO), and human (LN18, U87) and rat glioma (9L), along with drug resistant

83
sub-clones. QDs are used for this study as they are ideal optical probes for molecular tracking in
cell uptake studies owing to their brightness and resistance to photo-bleaching, and for their
comparability to other clinically relevant, non-emissive, nanomaterials. Although the heavy
metals that comprise QDs and allow for the unique optical properties, such as cadmium and
tellurium, are potentially cytotoxic and therefore not applicable to potential clinical treatments,
the use of a non-therapeutic photoluminescent multi-shelled quantum dot (QD), composed of
CdTe@CdSe@CdS@ZnS, allows for quantification of nano-package cellular uptake.through
fluorescence microscopy. The studied CPPs are appended to the QD surface via the N-terminal
cysteine which allows for bidentate coordination using the thiol and amine of cysteine to bind
onto the ZnS outermost QD shell. A biphasic ligand exchange allows the displacement of the
weakly coordinated organic passivating ligands from the as-synthesized QDs, and replacement
by the aqueous CPPs. The results of the study easily translate to clinically applicable
nanomaterials such as polymer nanoparticles, nanooxides, nanometals, or other nanocarriers.
4.2 Materials and Methods
4.2.1 Multi-shelled QD Synthesis
Spherical 4.3 nm multi-shelled CdTe@CdSe@CdS@ZnS quantum dots (QD) were
prepared using a multistep step core-shell synthesis where the Cd stock solution (0.05 M) was
prepared by dissolving CdO in tetradecyl phosphonic acid (0.125M) and octadecene (ODE) at
300˚C under N2. The 0.1 M Te stock solution was prepared by dissolving Te in tri-octyl
phosphine (TOP) and dilution by an equal volume of ODE. Similarly, 0.1 M solutions of
TOP/ODE:Se, TOP/ODE:Cd(acetate), TOP/ODE:S, and TOP/ODE:ZDC (zinc
diethyldithiocarbamate) were prepared as multi-shelling precursors. As a special note, the ZDC
precursor decomposes at 70°C which acted as both the zinc and sulfur source for the final ZnS
shell. For this reason, care must be used during preparation and storage of the precursor, and the
powder was dissolved by sonication in an ice bath.
The core CdTe was prepared by microwave heating of the Cd stock (4 mL, 0.05 M) to
220˚C at 300 W under N2, followed by rapid injection of the above mentioned Te stock (2 mL,
0.1 M). The solution was maintained at 220˚C (300 W) for 2 min resulting in formation of the
3.4 nm CdTe core. Formation of a CdSe interface layer was accomplished in a step-wise SILAR
approach, without isolation of the CdTe core by addition of 1 mL TOP/ODE:Se (0.1 M) at 150˚C

84
(300 W) for 2 min, followed by precipitation using toluene and methanol, and centrifugation to
isolate the CdTe@CdSe QD. The final two shell layers for the multilayer QD were added by
dissolution of the CdTe@CdSe QD into ODE followed by heating to 150˚C in the MW cavity
(300W), rapid injection of 0.1 M cadmium acetate in TOP/ODE followed by 0.1 M sulfur
powder in TOP/ODE. The reaction was cooled to 135˚C, and 0.1M zinc diethyldithiocarbamate
in TOP/ODE was added and allowed to react for 15 min with a final annealing step at 180˚C for
15 min. The multi-shelled QD was isolated by precipitation through the addition of MeOH,
washed three times by toluene/MeOH, and centrifuged to isolate a free-flowing powder.
The isolated QDs were analyzed by Transmission Electron Microscopy (TEM) using a
JEOL-2010 microscope operated at 200 kV. The samples were dispersed on 400 mesh holey
carbon grids (Electron Microscopy Sciences) from a toluene solution. The core of the QD
consisted of a ~3.4 nm diameter CdTe nanosphere, with half monolayer of CdSe, one monolayer
of CdS, and one monolayer of ZnS. The as-prepared QDs were passivated by Tri-octyl
phosphine (TOP). The resulting multi-shelled QD had a 5% size dispersity based on TEM
analysis. The first exciton for the QD was found to be at 606 nm with the band-edge emission
observed at 665 nm (FWHM = 24 nm) with a QY of 33.7%.
4.2.2 Peptide Surface Passivation
Biphasic place exchange reactions were carried out to replace the organic soluble TOP
passivating molecules with the hydrophilic peptides through formation of a bidentate
coordination to the N-terminal cysteine of the CPPs, as described previously.101 The purified N-
terminus cysteine modified CPP sequences were purchased from RS Synthesis (Louisville, KY).
The sequences are available in Table 4.1. The biphasic ligand exchange was accomplished using
phase transfer from tetrachloroethylene (TCE) into water, by dissolution of the QD (5 mg, 2 µM)
in 2 mL TCE at 60˚C. A N2 sparged, aqueous solution (2 mL) containing 2 M peptide and 0.05
M TCEP was added to the TCE solution of QDs. The biphasic reaction was stirred at 60˚C for
10 min, followed by dropwise addition of 100 µL of tetraethylammonium hydroxide (20% wt) to
deprotonate the terminal carboxylic acid and provide better aqueous solubility in DI H2O, every
10 min until the QDs were fully exchanged, typically within 1 h. Afterwards, the reaction was
allowed to phase separate and the water solubilized QD fraction was removed and stored at 4˚C.
Prior to use, the CPP- QDs were isolated by two successive ethanol precipitations, or by three

85
successive solvent exchanges of 0.2 µM filtered H2O using a 3k molecular weight cutoff spin
filter (VWR), and resuspended in 0.2 µM filtered H2O.
4.2.3 Human Cell Lines and Culture
The human cancer cell lines used in this report were obtained from the American Type
Culture Collection (ATCC). The human mesothelioma cell line MSTO-211H (CRL-2081) and
the human malignant melanoma cell line A-375 (CRL-1619) A375 skin cancer cells were
acquired from ATCC and cultured at 37°C and 5% CO2 in RPMI 1640 medium (Sigma
Chemical Co., St. Louis, MO) supplemented with 10% fetal bovine serum (Sigma) and
penicillin/streptomycin (Gibco). Drug resistant cells lines were established as described
previously.247 Additionally, human drug resistant glioblastoma lines U-87 MG (ATCC HTB-14)
and LN-18 (ATCC CRL-2610) were acquired and cultured at 37˚C and 5% CO2 in Dubelco’s
Modified Eagles Medium (DMEM 7777, Sigma), with 10% FBS (Sigma),
penicillin/streptomycin/amphotericin B (Sigma) and gentamicin (Gibco).
4.2.4 Rat Gliosarcoma Cell Lines and Culture
Rat gliosarcoma cells (9L) were acquired from the neurotissue bank at the University of
California, San Francisco. Sub-cultures of 9L cells were expanded in 75 cm2 plastic flasks (T-75
cm2, Nunc) with DMEM (D7777 Sigma Chemical Co., St Louis, MO), supplemented with 2
mM L-glutamine, 100 μg/mL gentamicin, 0.1% pen/strep and 10% fetal bovine serum (HyClone)
generating DMEM complete medium. The cultures were incubated at 37°C in a humidified
atmosphere containing 5% CO2. The 9L cells were split into 4 identical flasks. Control, BCNU-
sensitive 9L cells (9L) were grown as described above. BCNU-resistant 9L cells (9L-R) were
created by challenging 9L cells with increasing concentrations of BCNU (10-225 µM) over time.
Surviving cells were grown to confluence and then split into new flasks, allowed to reach 80%
confluence, and treated again with complete media or complete media containing BCNU.
Responsiveness of 9L and 9L-R sub-cultures to chemotherapeutics was determined using
the In Vitro Toxicology Assay Kit (Sigma-Aldrich TOX-6) based on the sulforhodamine blue
(SRB) method for monitoring cell viability. Briefly, cells were plated in 96-well plates, in
triplicate, at a density of 1x10⁵ cells/mL and treated for 72 h using the range of indicated
concentrations of drugs. After 72 h, cells were fixed by adding 50 µL of ice cold 50%

86
trichloroacetic acid (TCA) per well for 1 h at 4oC. After washing, plates were air dried before
addition of 100 µL of 0.4% sulforhodamine blue. The plates were then washed with 1% acetic
acid and air dried. The incorporated dye was solubilized by the addition of 200 µL of 10 mM
Tris buffer per well. Absorbance was read on a BioRad Benchmark Microplate reader at 490-
530 nm to characterize protein concentration in each well.
4.2.5 Cellular Uptake Studies and Fluorescent Microscopy
For each cancer cell line, cells were plated at 30% confluence (~30,000 cells/cm2) on 1.0
coverglass in 24-well plates (Corning), and grown for 24 h at 37˚C in 5% CO2 prior to
transfection with 2 pmol of QD-CPP per well (1 nM). After 24 h incubation with the QD-CPPs at
37˚C in 5% CO2 the media was removed and the cells were rinsed with prewarmed PBS, fixed
with 4% paraformaldehyde (PFA) (Sigma), stained with DAPI nuclear stain (Life Technologies),
and mounted to slides with Fluorogel anti-fade mounting media (Electron Microscopy Sciences),
according to the manufacturers’ instructions. Fixed slides were stored at 4˚C in the dark when
not under microscopic observation.
Cellular uptake of QD-CPPs were analyzed under fluorescent microscopy using a Nikon Eclipse
TE2000 inverted microscope. Excitation of QD-CPPs were performed using the Texas Red filter
cube (Nikon) with a 500 ms exposure time. The DAPI nuclear stain was used to correct QD
fluorescence per cell number, and was excited with a DAPI filter cube (Nikon) for 300 ms of
exposure. Differential interference contrast (DIC) images were collected to visualize the cell
boundaries, with 35 ms of light exposure. All images were analyzed in ImageJ software153 for the
total QD fluorescence intensity corrected for cell number and quantum yield differences between
QD-CPPs, as observed during photoluminescence characterization in cuvette.
4.3 Results and Discussion
4.3.1 Cell penetrating peptides and uptake
The ability of CPP-labelled nanoparticles to utilize endocytotic pathways and bypass
multidrug resistance efflux pumps make them an attractive choice for drug delivery.242,243,248,249
Figure 4.1 shows a schematic of the CPP labelled multi-shelled QD used to assess the cellular
uptake dependence for drug resistant cells relative to drug naive cells. The selected protein
derived cell penetrating peptides sequences (Table 4.1) were selected from literature and

87
modified to have a cysteine at the N-terminus for functional attachment to the ZnS surface of the
multi-shelled QD, and to allow for biphasic ligand exchange with the as-synthesized organic
capping ligands. As shown previously, the cysteine strongly coordinates to the surface through a
metal ligand bond.101
The general cellular uptake mechanism of CPPs is highly debated and appears to be
sequence and cell-surface specific, with no verified predictability established in the
literature.92,250,251 The CPPs in Table 4.1 were chosen to explore the uptake behavior and
selectivity for drug resistant versus naive cell lines for high charged peptides using Herpes VP22
(+6) and HIV-1 TAT (+9), compared to the low and neutral charges found in the CPP sequence
for hCT(9-32) (+1), K-FGF (+1), Ku70 (+0), integrin ß3 (+0), and HIV-1 gp41 (+0). The CPPs
are co-loaded onto the QD surface at a 9:1 ratio with a short synthetic peptide sequence,
CAAKA, which acts as a space filling peptide to better passivate the QD surface while
maintaining loose packing of the target CPP sequences, thanks to the short sequence length of
CAAKA versus the other CPPs of Table 4.1. The looser packing of co-loading also allows the
target CPP sequence to have more visibility to the cell, allowing for better sequence recognition
at the cell surface, as well as reducing the overall surface charge that leads to insolubility with
the highly charged peptides.252
Three of the selected peptides in Table 4.1, HSV1-VP22, HIV-TAT, and HIV-gp41
(Table 4.1), are derived from segments of viral proteins that have an added cysteine mutation at
the N-terminus. VP22 is a truncation of the tegument protein, viral protein 22 (VP22) found in
herpes simplex virus (HSV-1).253–255 HIV-TAT and HIV-gp41 are derived from subunits of viral
capsid proteins of the human immunodeficiency virus type-1 (HIV-1). HIV-TAT is a fragment
of the transactivator of transcription (TAT) protein and HIV-gp41 is derived from the HIV
glycoprotein 41 (gp-41).30, 38 These three viral peptides have successfully been utilized to
transport cargo across the cell membrane in various cell lines.90,254,258–261 Although the exact
mechanism of internalization for these viral CPPs is still contested, it is thought that the peptides
enter through one of the mechanisms of endocytosis.262 The remaining CPPs are based on
cysteine modified peptide fragments from proteins identified from the literature that induce
cellular uptake. Ku-70 is derived from the Bax-binding domain of the protein Ku-70, which acts
in DNA repair inside the nucleus.263 The excised Ku-70 peptide sequence is also known as a
Bax-inhibiting peptide (Bip), and has demonstrated low toxicity in cells, but the internalization

88
mechanism is also undetermined.264 hCT(9-32) is derived from the C-terminal fragment of the
human calcitonin protein hormone, and is also thought to internalize through a mechanism of
endocytosis; however, it is suggested that high concentrations are needed to facilitate membrane
disruption.265–267
The CPPs integrin β3 and K-FGF both derived from fragments of signal sequences of proteins.
The integrin β3 peptide sequence is derived from the hydrophobic region of the signal sequence
of human integrin β3 protein.268 Similarly, the K-FGF peptide sequence originates from the
signal sequences of fibroblast growth factor found in Kaposi’s sarcoma cells.269,270 Integrin β3
and K-FGF peptide sequences have been observed to enter cells by means of endocytosis, but it
is believed that direct translocation across the membrane may also be possible for such highly
hydrophobic molecules.271–274
Table 4.1 Table of selected Cell Penetrating Peptides, displaying numerical designation, CPP
name, sequence and length, charge and isoelectric point (Pi) at pH 7.4, molecular weight in
Daltons, and percentage of hydrophobic residues (L%). CPP origin is denoted by ⸸ for synthetic,
† for viral proteins, and ‡ for non-viral proteins. (*cysteine mutation, not present in the original
sequence.)
CPP Sequence & Origin Length Charge,
pH 7.4 Pi
MW,
Da
L
%
CAAKA CAAKA ⸸ 5 +1 8.97 462.6 75
HSV1-
VP22
C*DAATATRGRSAASRPTERPRAPA
RSASRPRRPVD † 35 +6 12.3 3748.2 40
HIV-TAT C*YGRKKRRQRRR † 12 +8 12.4 1663.0 0
HIV-gp41 C*GALFLGWLGAAGSTMGA † 18 +0 5.33 1683.0 56
Ku-70 C*PMLKE ‡ 6 +0 6.28 719.9 60
hCT(9-32) C*LGTYTQDFNKFHTFPQTAIGVGA
P ‡ 25 +1 7.1 2714.1 40
integrin ß3 C*VTVLALGALAGVGVG ‡ 16 +0 5.33 1399.7 63
K-FGF C*AAVALLPAVLLAHLLAP ‡ 18 +1 7.15 4533.1 94

89
4.3.2 Synthesis & Biofunctionalization of Multishelled Quantum Dots
The multishelled QD (CdTe@CdSe@CdS@ZnS) structure was chosen to provide the
targeted color of the QD (λem = 606 nm (full width half maximum 24 nm) and increased
stability of the QD in biological media due to the hetero-layering.257,265 Figure 4.1 shows a
schematic of the multishelled QD used in this study along with the two example peptides
attached to the surface through the N-terminal cysteines.
Figure 4.2 Characterization of the multishell QDs with (A) TEM of CdTeSe cores (i), CdS
shelled (ii), and ZnS capped (iii) QDs. (B) Size distributions for CdTeSe cores (i), CdS shelled
(ii), and ZnS capped (iii) QDs. And (C) absorption and emission spectra for CdTeSe cores (i),
CdS shelled (ii), and ZnS capped (iii) QDs.

90
Briefly, the core CdTe@CdSe particles show absorption and emission features at 562nm
and 579nm, respectively. As a shell of CdS is added to the particles, there is a red shift to 568nm
and 584nm. Finally, the CdTe@CdSe@CdS@ZnS particles showed an absorption and emission
of 601nm and 606nm, respectively. TEM images are shown at each stage of shell addition, along
with size distribution as evidenced in Figure 4.2. The UV-VIS shows a strong first excitonic
peak 601 nm with an emission peak at 606 nm with a full width half max of 24 nm, displaying a
sharp emission profile (Figure 4.2). In addition, the size of the particle (4.2 nm) was chosen to be
resolvable from autofluorescence and to allow crossover into downstream studies, as particles
under 5.5 nm are able to be cleared in vivo by the renal system.275,276 In addition, the thickness of
the ZnS shell aides in shielding the cell from potential toxic leeching of the CdTe core as well as
providing a stable outer layer for peptide assembly.
Table 4.2 Optical properties of CPP functionalized QDs, showing CPP-dependent Quantum
Yield (Φ), First Exciton Absorption Wavelength (λAbs), and Maximum Photoluminescence
Wavelength (λPL).
QD-CPP Φ (%) λAbs (nm) λPL (nm)
CAAKA 11.3 644 670
HSV1-VP22 7.4 644 668
HIV-TAT 37.0 632 658
HIV-gp41 8.3 643 664
Ku-70 2.3 644 674
hCT(9-32) 2.4 648 670
integrin ß3 18.4 643 658
K-FGF 12.4 639 664
Aqueous functionalization of the phosphine passivated QDs, which were organically soluble as-
synthesized, required biphasic ligand exchange (Figure 4.3). The selected CPPs (Table 4.1) were
coupled to the QD at a loading ratio of 9:1 CPP-X to CAAKA (CPP1), used as a synthetic spacer
peptide, to allow for the longer CPPs to avoid tightly packing on the QD surface, as this may
hinder sequence recognition by the target cells. A molar excess of 1000:1 peptides to QDs was
used to drive the aqueous transfer of the previously organically soluble QDs.

91
Figure 4.3 Passivation of CdTe@CdSe@CdS@ZnS multishell QDs biofunctionalized with cell
penetrating peptides (CAAKA, HSV1-VP22, HIV-TAT, HIV-gp41, Ku-70, Hct(9-32), Integrin
β3, and K-FGF). Schematic (A) shows exchange of organic ligands, TOP and TDPA (i), for 10%
CPP-X and 90% CAAKA (ii). Image (B) displays QD solution before and after phase exchange
in room light (i & iv) and under fluorescence excitation (ii & iii). The absorbance (C) and
emission (D) spectra for each QD-peptide sample demonstrate slight changes in the surface
environment per peptide.

92
In a typical biphasic exchange the QD, dissolved in TCE, was observed to transfer to the upper
aqueous, peptide-containing layer within 1 h. By increasing the alkalinity of the aqueous phase
(pH > 8.0, peptide NH2 pKa ~ 8), the peptide is deprotonated and transports the QD from the
organic to the aqueous layer. Neutralization of the aqueous layer and back extraction yielded
water-soluble QDs, capable of use in the biological application. The selected screen of CPPs,
selected from literature sources (Table 4.1), were intentionally mutated to contain N-terminal
cysteine residues to provide an amine and thiol bidentate binding motif to passivate the ZnS
outer shell of the QDs. Since luminescence of the QD is directly related to the electronic
environment of the semiconducting elements of the material, changes to the surface passivation
chemistry led to observable changes in the optical properties of the QDs. Thus, it was seen that
passivation with the selected screen of CPPs shifted the absorbance and emission peaks closer to
640 and 660 nm, respectively, with slight variations due to sequence differences of the CPPs
(Figure 4.3C & D). As shown in Figure 4.3, the exchange of the peptide onto the QD surface is
evidenced by aqueous solubility and a shift in the absorption and emission properties. The
absorbance and emission spectral profiles of the QD-CPPs are observed to shift slightly with the
changing molecular environment at the surface of the QD due to the unique chemical properties
of the loaded CPPs (Figure 4.3C & D). Relatedly, the quantum yields (Ф) for the aqueous QDs is
dependent on the identity of the peptide coating as well. The experimental data is tabulated in
Table 4.2. The spectral shift and quantum yield is accounted for in the cell studies to allow for
more accurate quantification of cellular uptake.
4.3.3 Cellular Uptake Studies
The QD-CPP constructs were used to challenge the drug resistant and naive cancer cell
lines for a 24 h incubation period and were then washed with PBS, fixed and co-labelled with
DAPI nuclear stain, as described above. Fixed cells were imaged using a widefield inverted
fluorescence microscope for each QD-CPP treatment (Figure 4.4). Figure 4.4 displays
fluorescence images of the blue DAPI nuclear stain and red intracellular QD emission. As well
as overlays with the DIC channel to visualize cellular morphology. All cell lines appear healthy
at the time of fixation, indicating no toxic effect from the 24 h QD incubation. Red
photoluminescence of the QDs within each cell line is visible at varying intensities, depending

93
Figure 4.4 Fluorescence images of QD-CPP uptake in rat gliosarcoma (9L) and drug resistant
(9L-R), human patient drug resistant gliosarcoma (LN18 & U87), human melanoma (A375) and
drug resistant (A375-R), and human mesothelioma (MSTO) and drug resistant (MSTO-R), fixed
at 24 h with DAPI nuclear stain. Scale bar:100 µm.

94
on the peptide functionalization and cell line, which is indicative of differential cellular uptake
and processing of the QDs being correlated with the identity of the covalently attached CPP.
In addition to uptake differences being peptide specific, individual cell types presented
unique QD-CPP fluorescence profiles. This may potentially indicate an effect from differential
phenotypic expression of cell membrane surface components between various tissue types and
MDR status on the interactions of the CPPs, leading to increased or decreased cellular
internalization of the QD-CPP agents. Additionally, the morphological patterns of intracellular
QD photoluminescence were observed for each QD-CPP per cell line (Figure 4.4). Small
punctate patterns are indicative of endosomal encapsulation of the QD-CPP construct, whereas
the observation of diffuse, evenly distributed intensity throughout the cell represents cytosolic
localization of the QD-CPP agents.
To quantify QD-CPP cellular uptake and localization in endosomes versus cytosol, the
intensity levels of red photoluminescence within the cells were analyzed using Nikon Elements
and ImageJ Software. Images were background subtracted and normalized to maximum intensity
per cell number, and the extracted fluorescence values were corrected for relative differences in
quantum efficiency for each QD-CPP construct, to allow for accurate comparison of cellular
uptake. In Figure 4.5, the corrected cellular uptake of each QD-CPP construct is displayed in
comparison to naive and resistant cell lines, for melanoma skin cancer (Figure 4.5A),
mesothelioma lung cancer (Figure 4.5B), and rat gliosarcoma brain cancer (Figure 4.5C), as well
as for both human patient excised MDR gliosarcoma cell lines (Figure 4.5D).
Uptake profiles plotted from analysis of the QD intensity in the microscopy data reveals cellular
uptake selectivity for the CPPs that are cell line specific. HSV1-VP22, Ku-70, and hCT(9-32)
exhibit preferential cellular uptake in the drug resistant A375-R line versus the naive A375 line,
with a statistical significance of p ≤ 0.05 for HSV1-VP22 and hCT(9-32), and p ≤ 0.01 for Ku-70
(Figure 4.5A). A similar trend was observed for hCT(9-32) and HIV-gp41 in the 9L rat
gliosarcoma drug resistant line versus the drug naive cells, with a statistical significance of p ≤
0.0001 and p ≤ 0.01, respectively (Figure 4.5C). And although no direct comparison with drug
naive human gliosarcoma cells was able to be obtained for this study, both human MDR
gliosarcoma cell lines displayed the highest uptake for Ku-70 and hCT(9-32) (Figure 4.5D).
Interestingly, contrasting results were observed for the mesothelioma cell lines where the naive
MSTO cell lines showed the opposite trend in uptake compared to the drug resistant line, and

95
experienced higher QD-CPP uptake of Ku-70 and hCT(9-32), versus the drug resistant line
(Figure 4.5B), highlighting the complexity of the CPP-cell surface interaction.
Figure 4.5 Uptake profiles of the studied QD-CPP constructs in (A) human melanoma (A375)
and drug resistant (A375-R), (B) human mesothelioma (MSTO) and drug resistant (MSTO-R),
(C) rat gliosarcoma (9L) and drug resistant (9L-R), and (D) human patient drug resistant
glioblastoma (LN18 & U87), fixed at 24 h, measured by microscopic fluorescence intensity,
corrected for the quantum yield of each peptide-QD conjugate, and normalized for cell number
by DAPI nuclear stain counting. Displaying statistical differences of p ≤ 0.5, 0.1, 0.001, and
0.0001 as *, **, ***, and ****, respectively, for uptake in comparison to 100% CAAKA loaded
QDs (black), and drug resistant versus drug naive cell lines (red, in parentheses).

96
Further studies are underway to understand the nature of the cell-CPP interactions leading
to the observed results. Since the QDs were loaded with CPPs at a ratio of 9:1 with the CAAKA
short synthetic peptide spacer, occupying 90% of the QD surface sites, to allow for better
visibility of the literature-sourced sequences in Table 4.1 to be accessible by the cell surface,
analysis of QD-CPP cellular uptake versus the 100% CAAKA loaded QD was performed as a
control. It was found that for all cell lines, QDs with 10% loading with Ku-70 and hCT(9-32)
showed improved uptake versus CAAKA alone, giving the statistical significance of p ≤ 0. 0001
for all lines except A375 (hCT(9-32) p ≤ 0.001), MSTO (Ku-70 p ≤ 0.001 and hCT(9-32) p ≤
0.01), and MSTO-R, the latter of which did not show statistical significance above the 100%
CAAKA-QD sample for any of the tested constructs (Figure 4.5). Additionally, the Herpes virus
derived peptide, HSV1-VP22, showed significant uptake over the 100% CAAKA loaded QDs in
9L & 9L-R (p ≤ 0.001), U87 (p ≤ 0.01), and A375-R (p ≤ 0.5) (Figure 4.5). These data
emphasize the complex and somewhat ambiguous nature of CPP cellular targeting and stress the
need for a more comprehensive understanding of design considerations for cell-specific CPP
targeting approaches to be fully realized.
Much of the recent literature suggests that cellular uptake of CPPs is highly dependent on
electrostatic interactions of cell surface markers in addition to the positive charge of the
peptide.262 Although the set of peptides tested was not exhaustive, this data indicates that uptake
of the CPPs could rely more heavily on cellular surface markers than previously anticipated.
Drug resistant cancer cell lines are known to express different surface markers depending on the
amount of resistance to the chemotherapeutics, however, as most research indicates that CPPs
gain access to the intracellular lumen through various endocytic pathways,92 these results suggest
that CPPs are not only sensitive to cell type, but potentially to changes in the cellular membrane,
the surface receptors as well.
4.3.4 Cellular Localization Analysis
The CPP modified QDs were analyzed for intracellular particle localization, to probe the
question of whether an endosomal versus cytosolic fate for the QD-CPPs is a cell- or CPP-
dependent phenomenon. In Figure 4.6A, high resolution confocal z-stack images display cellular
localization of internalized QD-CPPs in three-dimensional space, with an example of more
endosomal punctate

97
Figure 4.6 (A) Confocal fluorescent z-stack images of intracellular localization for QD-CPP
constructs displaying more punctate endosomal fluorescence for QD-CAAKA (i) and more
diffuse cytosolic localization for QD-hCT(9-32) (ii) in 9L cells. (B) Quantification of QD-CPP
endosomal versus cytosolic localization by area of punctate fluorescence, showing mostly mixed
endosomal (10 µm2 single endosome) and cytosolic (900 µm2 whole cell) localization for naïve
and drug resistant human melanoma (A375 & A375-R), human mesothelioma (MSTO & MSTO-
R), rat gliosarcoma (9L & 9L-R) and human glioblastoma (LN18 & U87), with (ii-v) endosomal
area range for CAAKA versus the best performers: HSV1-VP22, Ku-70, and hCT(9-32),
respectively.

98
fluorescence shown in for the 100% CAAKA loaded QD control (Figure 4.6A-i), and more
cytosolic diffuse localization for 10% hCT(9-32) loaded QDs (Figure 4.6A-ii), at 24 h post
transfection with the QD-CPP constructs. From these and previous cell images, it can be seen
that all of the QD-CPP constructs display varying proportions of both punctate and diffuse
fluorescence indicating different packing and escape profiles for each cell line that do not seem
to be entirely CPP-dependent (Figures 4.6A and 4.4).
In order to assess cytosolic versus endosomal localization of the QD-CPP packages
within cells, two-dimensional cell images were analyzed for the average fluorescence area, with
small punctate fluorescence areas indicating endosomal localization and large diffuse
fluorescence areas indicating cytosolic QD-CPP distribution (Figure 4.6B). Comparing the
results of Figure 4.6B to the average 2D area of a whole cell (~900 µm2) versus that of a single
endosome (~10 µm2), it is observed that most of the internalized QD-CPPs were at least partially
confined to endosomes with some QD-CPPs having been cytosolically delivered or having begun
to diffuse into the cytosol by the 24 h time point, as the average package size for all CPPs and
cell types is well below the “whole cell” or fully cytosolic value of 900 µm2. Taking a closer
look at the average fluorescence package sizes of QD-CAAKA versus the best uptake
performers, HSV1-VP22, Ku-70 and hCT(9-32), it can be seen that the localization profiles seem
to be very cell type dependent (Figure 4.6Bii-iv). The A375 and A375-R skin cancer cells show
greater than 10 µm2 average package sizes for all peptides, although package sizes of 20-30 µm2
could be indicative of small endosomal agglomerates. The MSTO and MSTO-R lung cancer
cells show greater cytosolic localization profiles for CAAKA (near 80 µm2 or 84±42 and 72±18
µm2, respectively) as well as the best performers (~60-130 µm2). This in comparison to glioma
cell lines which more distinctively show endosomal entrapment for the QD-CAAKA samples
(near or below 10 µm2), with HSV1-VP22, Ku-70 and hCT(9-32) each showing more cytosolic
(average size greater than 30 µm2) for one or more glioma cell lines (Figure 4.6Bii-iv). The
experimental observation is an interesting finding as it has previously been assumed that
nanoparticle delivery constructs disassemble during packaging in the endo-lysosomal pathway
allowing escape of the cargo with only the NP being trafficked out of the cell via exocytosis.277–
280 Determination of the amount of cytosolic delivery versus endosomal escape in the cell, and
what cellular uptake mechanisms may be involved with each of the cell penetrating peptides will
require future studies.

99
4.3.5 Computed CPP Orientation and Packing Analysis
Much of the recent literature suggests that cellular uptake of CPPs is highly dependent on
electrostatic interactions of cell surface markers in addition to the positive charge of the
peptide.262 Although the set of peptides tested was not exhaustive, the data in Figures 4.4–4.6
suggests that uptake of the CPPs could rely more heavily on CPP interactions with cellular
surface markers than previously anticipated. Most research indicates that CPPs gain access to the
intracellular lumen through various endocytic pathways,92 many of which require receptor
mediated binding as an initiation step.
Figure 4.7 PEP-FOLD generated secondary structures of the studied CPPs as possible folding
orientations of peptides bound to the QD surface via the N-terminal cysteine thiol.
Since acquisition of drug resistant status in cancer cell lines is known to cause a change in
membrane composition and expression of different surface markers281 – depending on the

100
amount of resistance to the chemotherapeutics – these results may suggest that ability and
efficiency of CPP cellular uptake is not only sensitive to membrane surface markers available per
cell type, but also potentially to changes in the cellular membrane structure, and prevalence or
identity of surface receptors within tissue classes as well. To further understand the peptide
dependent uptake behavior, the nature of the potential packing and orientations of the appended
peptides on the surface of the QD was analyzed using the PEP-FOLD structure predicting
software service,282 to assess the most energetically favorable structural conformations for the
CPP sequences under physiological conditions. The generated results were further filtered to
select the most plausible QD-bound secondary structure, which allowed for unhindered access of
the thiol from the N-terminal cysteine to bind to the QD surface.
In Figure 4.7 it can be seen that each peptide adopts a different degree of ordered
secondary structure. These differences lead to unique structural morphologies which do not trend
with the properties of the primary sequences, for instance longer sequence length peptides do not
always display a proportionally greater height from the QD surface than shorter sequence
peptides (Table 4.3). Also, the folding orientations alter each peptide’s effective footprint, or the
amount of “floorspace” that the peptide occupies on the QD surface, impacting CPP packing
efficiency and loading level on the QDs (Table 4.3). Both the factors of CPP orientation and
Table 4.3 Calculated peptide properties and loading level on the 4 nm diameter QD (surface area
~12.5 nm2), based on the PEP-FOLD generated CPP structures, displaying folded peptide height
and diameter given in Angstroms (Å), binding footprint in square nanometers (nm2), and the
maximum number of peptides a 4 nm QD could accommodate for single peptide loading (100%),
and ratioed peptide loading (90% & 10%) for CAAKA:CPPX.
CPP Height
(Å)
Diameter
(Å)
Footprint
(nm2)
100%
Loading
(# per QD)
90%
CAAKA
(# per QD)
10% CPPX
(# per QD)
CAAKA 15.1 9.0 0.6 79.0 -- --
HSV1-
VP22
31.5 26.7 5.6 9.0 39.9 4.4
HIV-TAT 27.6 25.6 5.1 9.8 41.6 4.6
HIV-gp41 31.7 15.2 1.8 27.7 60.0 6.7
Ku-70 22.8 13.1 1.3 37.3 64.0 7.1
hCT(9-32) 28.1 16.6 2.2 23.2 57.3 6.4
Integrin β3 23.1 9.8 0.8 66.6 69.8 7.8
K-FGF 25.6 19.2 2.9 17.4 52.5 5.8

101
packing play an important role in the ability of the transduction sequences of the peptides to
access and interact with the cellular membrane to promote cellular entry. The maximum possible
numbers of peptides able to spatially fit on the QD surface (ignoring more complex steric or
repulsive molecular interactions) can be seen in Table 4.3 for 100% loading and 10% loading
versus CAAKA. Notably, the co-loading of the short CAAKA filer sequence not only has the
ability to aid in visibility of the target CPPs, giving a calculated ~7-16 Å of head clearance
(depending on CPP), but may also aid in QD stability by increasing the surface passivation and
allowing for more binding sites on the QD to be occupied than if loaded with the target
sequences alone (Table 4.3).
4.4 Conclusion
The selectivity of the various CPPs for drug-resistant cancer cell lines was analyzed and
compared to the drug-naive cancer lines. The results of the study indicate that the uptake
behavior is highly dependent on the cell type and its level of acquired resistance, as well as the
CPP. The studied CPPs were selected from reported viral or signal protein sequences that have
been demonstrated to cross cell membranes. The CPP sequences studies were modified with a
N-terminal cysteine appended to truncated fragments of highly charged viral capsid proteins
(HIV-TAT and HSV1-VP22)255,257 and protein transduction domains with low charge (hCT(9-
32), Ku-70, and K-FGF),264,266,283 and neutral transduction sequences (HIV-gp41 and integrin-
β3).259,268 The CPPs co-loaded onto the multi-shelled QDs at a 1:9 molar ratio versus the short
synthetic peptide CAAKA. As indicated in the PEP-FOLD analysis (Figure 4.7) co-loading
increases the target CPP availability to the cell surface and potentially enhance recognition of the
CPP sequence with the cell surface, by mitigating close packing of the CPP backbones around
the QD delivery vector. The results indicate each CPP exhibits cell-specific uptake profiles with
unique responses being observed for each cell line and peptide (Figure 4.4 & 4.5). Despite these
cell-specific variations, significant uptake is observed for the hCT(9-32), Ku-70 and HSV1-
VP22 peptides for the majority of the selected screen of cell lines, with significant increases
being observed for the drug resistant human melanoma and rat gliosarcoma cells (p < 0.05 and
0.0001, respectively), which may be due to changes in membrane protein expression as cancer
cells acquire drug resistance. Inspection of the sequences reveals the uptake profiles do not
appear to be dependent on the peptide charge, length, or secondary structure; although peptide

102
packing on the QD surface may affect cellular uptake. This work highlights the utility of multi-
shelled QDs for effective CPP-mediated uptake screening in multiple cell lines using fluorescent
microscopy, as well as demonstrates the non-trivial considerations involved in designing targeted
nanotherapeutics for drug resistant cancer treatment.
This work demonstrates that for the selected cells lines, differences in QD-CPP cellular
uptake is dependent on the drug resistance status as well as the specific CPP used. Results from
this study provide insight into the use of CPPs in cancer lines, as the CPPs can have variable
transfection efficiency depending on cell type and drug resistance status of the cells. This is
important for future use of drug delivery designs, as targeting a cancer in vivo does not have a
“one-size-fits-all” solution, and different CPPs might be needed depending on the drug resistant
status of the cells at the time of delivery. It is also observed that the QD does not cause toxicity
and provides valuable insights into cell-specific uptake profiles. Future studies are needed to
assess the effects of co-appending a drug to the surface of the QD to determine the outcomes of a
multi-biofunctional multi-shelled QD-CPP, within these cell lines, in order to better understand
the utility of CPP conjugated nanoparticles as a viable therapeutic for drug delivery.

103
CHAPTER 5
OPTICAL AND MAGNETIC MEASUREMENT OF NANOTHERAPEUTIC DELIVERY
INTO CANCER CELLS USING PEPTIDE CONJUGATED MAGNETIC GOLD
(FE3O4@AU) NANOPARTICLES
5.1 Introduction
Utilization of magnetic materials at the nano-scale has found diverse applications in
medicine and technology, with superparamagnetic iron oxide (SPIO) being the most abundant
and cost effective.49,72,284 Complimentarily, nanoscale gold is relatively nontoxic, easily
biofunctionalized, and has a strong surface plasmon resonance able to interact with fluorophore
for sensing applications.58,140,285,286 Layering the advantageous attributes of a magnetic
nanoparticle with the biostable and functional surface of a gold nanoparticle, produces an
effective "magnetic-gold particle" (MGP) (Figure 5.1).
Figure 5.1 Schematic diagram of a multi-functional “Magnetic Gold” Fe3O4@Au Nanoparticle
(MGP), displaying optical and magnetic utility from the Au shell and Fe3O4 core, respectively.

104
Combining the utility of magnetic and gold nanomaterials, these superparamagnetic gold-shelled
iron oxide nanoparticles have numerous biological applications in magnetic and x-ray contrast
agents, diagnostics, hyperthermia, and drug delivery.49,67,287–289 Thus, the scope of therapeutic
applications for MGPs is near limitless, with function being determined by design of their bio-
conjugation cocktail (small molecule drugs/ligands, proteins/peptides/antibodies, and/or nucleic
acids). Additionally, many stabilizing agents bind securely to the surface of gold, and when the
Fe3O4 is shelled by the Au top layer, the gold is able to protect not only the biological
environment from Fe leeching, but also help mitigate magnetic aggregation, which is a common
problem in magnetic nanomaterials.290
Superparamagnetic gold-shelled iron oxide nanoparticles have numerous biological
applications in magnetic and x-ray contrast agents, diagnostics, hyperthermia, and drug delivery.
Thus, the scope of therapeutic applications for MGPs is near limitless, with function being
determined by design of their bio-conjugation cocktail (small molecule drugs/ligands,
proteins/peptides/antibodies, and/or nucleic acids). Additionally, therapeutic strategies requiring
intracellular delivery (such as pharmaceutical or genetic therapy approaches) predicate a need for
quantification of nano-therapeutic cellular uptake to determine the efficacy of the treatment.
Future clinical applications will also necessitate the ability to track nano-therapy biodistributions
in live patients. Utilizing the dual magnetic- and optically-responsive MGP platform allows for
analysis of uptake through magnetic measurement as well as via microscopy. This two-fold
sensing tool finds great purpose in the diagnosis and treatment of cancers, as some cancers are
inherently more accessible for biopsy and visible observation (such as more superficial
melanoma), versus others (such as gliosarcoma) which can present deep within delicate tissue,
making excision and direct observation a near-impossibility. However, the use of a
multifunctional MGP could allow for multiple modes of visualization and treatment, benefitting
countless patients.
In order to be a successful diagnostic and treatment platform, the MGP must be able to be
efficiently and specifically taken up by the target cells and tissues. Facilitation of efficient
cellular internalization can be accomplished though appendage of cell penetrating peptides
(CPPs) which have been isolated from a variety of sources, including protein transduction
domains of viral (HIV-TAT: the transactivator of transcription for the human immunodeficient
virus)258 and signaling (Ku-70: a Bax inhibiting peptide)264 proteins, as well as peptide hormones

105
(hCT: the human calcitonin peptide),291 to name a few.292 An added advantage of CPP co-
assembly is their observed cell-selective internalization, which could allow for cell-type specific
targeting. Direct delivery of therapeutics to tumors is of great need since most existing anticancer
agents demonstrate systemic distribution that limits their therapeutic efficacy and generate
undesirable side effects.17,46 The implementation of MGP-CPPs as efficient and specific
therapeutic carriers in medicine could reduce the systemic dispersal of cytotoxic anticancer
drugs, and reduce the dosage required through more localized targeting – all while providing a
multi-traceable delivery agent to track therapeutic delivery and bioaccumulation – overall
improving patient health and quality of life.
In this study MGPs were synthesized and bio-functionalized with a small molecule as
drug mimics, as well as a small screen of cell penetrating peptides (CAAKA, HIV-TAT, Ku70,
and hCT), and observed in human melanoma (A375) and rat gliosarcoma (9L) cancer cell lines
via optical microscopy, superconducting quantum interferometry, and magnetic resonant
imaging in a tissue mimic. Moreover, with the help of the CPPs cellular targeting and
internalization was accomplished. Cellular uptake was quantified and compared across the
magnetic and optical methods and it was determined that MGP biofunctionalization with HIV1-
TAT yielded the best cellular uptake, from this small CPP screen. The insights provided by this
work have potential impacts on the design and optimization of intracellular therapeutic
nanoparticle delivery and monitoring for diverse cargos by cell penetration.
5.2 Materials & Methods
5.2.1 Materials
All chemicals used in the synthesis and functionalization of the MGPs were purchased
through Sigma-Aldrich unless otherwise noted.
Peptides were purchased through RS Synthesis the sequences are as listed below:
CAAKA: NH2-CAAKA-COOH
Cys-TAT: NH2-C*YGRKKRRQRRR-COOH
His6-TAT-FITC: NH2-HHHHHH*YGRKKRRQRRR(FITC)-COOH
Cys-Ku70: NH2-C*PMLKE-COOH
Cys-hCT(9-32): NH2-C*LGTYTQDFNKFHTFPQTAIGVGAP-COOH

106
Cell culture supplies were purchased from Life Technologies, including: RPMI1640
media, Fetal Bovine Serum (FBS), Antibiotics/Antimycotics, Lipofectamine2000®, and T-25
culture flasks. Optical dishes consisted of 10 cm2, 1.5 glass bottom, poly-L-lysine coated circular
dishes that were purchased from MatTek Corp.
5.2.2 Synthesis of 6nm Fe3O4 Cores
Iron oxides nanoparticles were synthesized through the coprecipitation of Fe2+ and Fe3+
aqueous salt solutions by the supplement of a base, according to modified literature protocols.287
Briefly, 2 mmol Fe(acac)3, 10 mmol 1,2-dodecanediol, 6 mmol oleic acid (purity 90%), 6 mmol
oleylamine (purity >70%), and 20 mL benzyl ether were stirred under inert N2 atmosphere. The
solution was heated to 200°C for 2 h then, refluxed at 300°C for 1 h. Formation of the Fe3O4
nanocores was evidenced by the solution turning black. At which time the nanocores then slowly
cooled to room temperature, and precipitated with toluene and methanol. The iron oxide
nanoparticles isolated using magnetic separation and resuspended in chloroform for the gold
shelling step.
5.2.3 Synthesis of MGP by Gold Shelling of Iron Oxide Cores
A solution consisting of 85 mg of HAuCl3 and 10 mL of chloroform was prepared by
sonication and kept at 4ºC for the addition process. The gold salt solution was added to the iron
oxide solution at 1 mL per 30 min intervals at room temperature. After complete addition of the
gold salt, 100 mg of sodium borohydride was added to the solution to help further reduce the Au
on the surface of the Fe3O4 core particles to form a contiguous Au shell. After 30 min of
sonication, the MGPs were precipitated with toluene and methanol. The MGPs were isolated by
magnet separation and dried for the ligand exchange step.
5.2.4 Phase Transfer and Aqueous Bio-Functionalization of MGPs
Approximately 5 mg of MGPs were dissolved in 1 mL of chloroform mixed with 20 mg
of thioctic acid (or dihydrolipoic acid: DHLA), deprotonated using tetraethyl ammonium
hydroxide and reduced using tris(2-carboxyethyl)phosphine hydrochloride (TCEP), in 1 mL
sparged H2O. The solution was heated to 50ºC and stirred for 15 min to allow for phase transfer
of the MGP from the organic to aqueous upper layer. Similarly, 2 mg of peptides were dissolved

107
in 1 mL sparged water and reduced with 50 mM TCEP at 10% volume for 15 min prior to
addition to the MGPs. Peptides were appended to the MGP surface by stirring for 30 min to 24 h
(variation in timing due to the physical properties of the ligand/peptides, such as charge and
MW), with the aide of 300 μL of TEA-OH to deprotonate the carboxylic acids of the peptide and
promote better phase transfer. After each reaction, water soluble MGPs were isolated from the
top layer and were precipitated with ethanol, followed by centrifugation and magnetic separation.
Dye-labeling of the DHLA and CPP coated MGPs was performed by N-(3-
Dimethylaminopropyl)-N′-ethylcarbodiimide hydrochloride (EDC) and N-Hydroxysuccinimide
(NHS) coupling of the primary amine containing dye, Nile Blue 690, and the carboxylic acid
containing MGP-DHLA, according to the manufacturer’s instructions. All samples were cleaned
up by ethanol precipitation and magnetic separation.
5.2.5 MGP Characterization
Synthesis of the Fe3O4 cores and MGPs were characterized by JEM-ARM200cF
Transmission Electron Microscope (TEM) for shape, size dispersity and shell uniformity.
Crystallinity was confirmed using a Rigaku Ultima3 Powder X-Ray Diffractometer (pXRD).
Ligand exchange and aqueous functionalization were verified using Varian Cary 50 Bio
Ultraviolet-Visible Spectrophotometer (UV-Vis), Varian Cary Eclipse Spectrophotofluorometer
(PL), and a Bruker ALPHA Fourier-Transformed Infrared Spectrometer (FTIR). Magnetic
moment and susceptibility were measured by Quantum Design MPMS Superconducting
Quantum Interference Device (SQUID) Magnetometer.
5.2.6 Cell Culture and Transfection
A375 skin cancer cells (gifted by Dr. Diego Zorio) and 9L rat glioscarcoma cells (ATCC)
were grown at 37°C with 5% CO2 in RPMI1640 and DMEM7777, respectively, with 10% FBS
and streptomycin/penicillin (Gibco). Cells were plated at 10,000 cell/cm2 into 10 cm2 optical
dishes, or T-25 flasks for cell pellet SQUID measurements, 24 hours prior to transfection. The
MGPs were transfected into A375 skin cancer cells by addition of 6.0 pmol/cm2 (2 mM or 6.7
µg/cm2) MGP. A control transfection was performed with the MGP-DHLA using
Lipfectamine2000®, as a commercial standard to compare uptake as measured by cellular
magnetic susceptibility after transfection versus peptide coated MGP. Lipofectamine2000®

108
encapsulation of the MGP-DHLA was carried out using a concentration of 150 pmol MGPD-
HLA in 10 µL Lipofectamine, per T-25 flask.
5.2.7 Fluorescent Microscopy Cell Imaging
A375 cells were imaged live at 0.5, 2, 4, 8, 12, and 24 h after transfection on a Nikon
TE2000 inverted fluorescence microscope. The MGP-DHLA-NB690 was visualized using a
Cy5.5 filter cube with exposure time of 900 ms. The MGP-His6-TAT-FITC and MGP-45FITC
were visualized using a FITC filter cube with exposure time of 400 ms. Differential interference
contrast (DIC) images were acquired at 100 ms exposure time for visualization of cell boundaries
and health. All images were acquired at 40x magnification with a Plan APO short working
distance 0.14 numerical aperture objective.
5.2.8 SQUID Measurement of Transfected Cells
MGP transfected cell pellets were prepared for SQUID analysis by collection 24 hours
after MGP transfection. Transfection media was removed, cells were washed with TBS three
times, prior to treatment with TrypLE (Gibco) for enzymatic cleavage of the adherent cells from
the culture dish, with 2 minutes incubation at 37ºC. Cells detachment, noted by increased cellular
circularity, was visualized under a phase contrast microscope and TrypLE was quenched by
addition of a known volume of serum containing medium. Any cells remaining attached were
then lifted by gentle rinsing with culture media. Cells were counted and assessed for viability via
trypan blue staining using a CEDEX cell counter. Cell solutions of 5 million cells were then
centrifuged for 5 minutes at 5K RCF until a dark (MGP-filled) cell pellet was observed. The
supernatant was removed the cell pellet was collected and dried in pre-massed high throughput
NMR tubes (VWR), for SQUID analysis. Field-dependent studies were recorded at 300 K, with
the applied field varying from zero to one Tesla.
5.2.9 MRI Imaging of MGP Uptake in a Tissue Mimic
9L rat glioma cells were transfected 100 pmol of MGP-CPP or MGP-DHLA per well of a
6-well plate. 24 h after transfection, cells were collected resuspended in low melting 2% agarose
to create a tissue mimic. Briefly, suspended cells were layered with 150,000 cells per layer with

109
1% agarose used in between each cell layer, in an NMR tube (VWR). Tissue mimic samples
were analyzed using a Bruker MRI at the Nation High Field Magnetic Laboratory.
5.2.10 Optical and Magnetic Analysis
Optical images were analyzed in FIJI ImageJ software153 where the total fluorescent
intensity was measured in triplicate at each time point and values were corrected for cell number.
Curve fitting was performed in the Igor software program to determine uptake kinetics.
Magnetic data was plotted in Microsoft® Excel as magnetic moment per cell versus field
strength. Saturation moment was calibrated for each transfection construct and used to calculate
relative cellular uptake.
5.3 Results and Discussion
5.3.1 Synthesis of Magnetic Gold Particles
Magnetic gold nanoparticles (MGPs) were engineered by lyothermal synthesis of the
Fe3O4 magnetic core with diameter of 6.5 nm, followed by subsequent reduction of
HAuCl4•3H2O salt onto the surface by slow addition in the presence of the reducing agent
oleylamine, and finalized by treatment with the strong reducing agent NaBH4 to encourage a
contiguous Au outer shell. Physical characterization of the Fe3O4 cores and Fe3O4@Au MGPs is
shown in Figure 5.2. From the TEM and size distributions (Figure 5.2A-D) it can be seen that the
MGP has approximately 0.4 nm of continuous Au shell, indicative of ~1 atomic layer of Au (unit
cell: 407.8 pm)293 protecting the Fe3O4 core. However, the UV-visible absorption and pXRD data
observed display nontrivial indications of an Au shell in the form of the appearance of a plasmon
near 520 nm (Figure 5.2E), additional large peaks in the X-ray diffraction matching the Au
standard (Figure 5.2F), and reduction of the magnetic moment per sample mass (from 48.1
emu/g to 25.1 emu/g) due to the addition of the heavy and non-magnetic Au shell (Figure 5.2G).
This may possibly indicate that the Au reduction onto the Fe3O4 core does not simply add to the
net diameter but may, in actuality, etch away layers of the Fe3O4 to allow for a thicker Au shell
without greatly increasing the overall NP diameter. Similar atomic exchange phenomenon have
been seen previously in other nanomaterial synthesis strategies.294

110
Figure 5.2 Characterization of the Fe3O4 cores (black) and Fe3O4@Au “Magnetic Gold
Particles” (red), showing TEM (A & C) and size distributions (B & D), as well as UV-Vis
absorption (E), pXRD patterns (F), and SQUID magnetometry (G). Reference pXRD powder
patterns in (F) are for bulk Au (garnet) and Fe3O4 (gray).

111
5.3.2 Biofunctionalization of Magnetic Gold Particles
Cell penetrating peptides (CPP) have been observed to facilitate cellular entry for
a variety of nano- and molecular-cargos.90 As mentioned in the previous chapter, the presentation
and packing of the CPPs on a the NP surface has been proposed as an explanation for the
observed selectivity of CPPs for various cell lines. Selection of known CPP sequences from the
literature such as the human calcitonin peptide hormone (hCT), the transduction fragment of the
Bax inhibiting protein Ku70, and, the transactivator of transcription for the human
immunodeficiency virus-1 (HIV1-TAT) were chosen to provide a small representative screen of
large (hCT: 24 residues, +1 charge), small (Ku70: 5 residues, +1 charge), and highly charged
(TAT: 11 residues, +6 charge) CPPs known to induce cellular internalization. In addition, the
sequences were mutated to contain N-terminal cysteine modifications (denoted as C*) to
facilitate thiol binding to the Au surface of the MGP, and co-loaded at a 1:9 ratio with the small
synthetic peptide, CAAKA, in order to optimize packing and sequence presentation on the MGP
surface. Additional appendage chemistries exist including the amine-based hexa-Histidine (H6)
coordination, which allows for six consecutive N-terminal histidine residues to bind to the
surface of thee inorganic NP, though dative bond formation with the imidazole rings of the
histidine.
In Figure 5.3A, it can be seen that while short peptides (CAAKA and C*Ku70) are not
likely to generate notable secondary structure on the MGP surface, the most energetically
favorable orientations of the larger peptides (C*hCT and C*TAT) entail formation of some
degree of secondary structure with an overall reduction in the total “height” of the CPP from the
MGP surface, as compared to the primary amino acid sequence, which may play a role in cell
surface binding and ultimately in cellular internalization efficiency. As a comparator and small
molecule drug mimic, dihydrolipoic acid (DHLA) – the reduced form of the vitamin α-lipoic
acid, known to mitigate oxidative cellular stress295 – was also used in this study (Figure 5.3A).
The addition of the biologically useful CPPs and the small-molecule drug-mimic to the surface
of the MGP was accomplished by biphasic ligand exchange, where the as-synthesized
organically soluble MGPs were dispersed in CHCl3 and layered with a basic (pH 10) aqueous
solution of reduced cysteine-modified (C*) CPPs or dihydrolipoic acid (DHLA) to provide
reactive thiols for binding the Au surface coating of the MGP (Figure 5.3A & B).

112
Figure 5.3 Ligand exchange characterization of MGPs with various cell penetrating peptides and
the small molecule DHLA (A) showing structures; MGP (B-i) organic vs. (B-ii) aqueous
solubility, before and after ligand exchange, respectively; and (C) absorption profiles for water
soluble biofunctionalized-MGPs.

113
The reactions proceeded rapidly at 50ºC, between 10 and 60 min, with an apparent positive
correlation between the time to completion and the molecular weight, compounded by charge, of
the appending aqueous molecule (trxn: DHLA<CAAKA<C*Ku-70<C*hCT<C*TAT).
Notably, place exchange reactions allowed to proceed longer than 8 hours yielded aggregated
MGPs, most evident with the highly charged C*TAT peptide (+6). This may be due to possible
weakening of the Au shell from bombardment with reactive thiols over long time spans, allowing
for fusing of the unprotected magnetic cores, or potentially due to peptide-peptide interactions
inducing conglomeration of the particles. However, the shorter reaction times, yielded water-
soluble MGPs with visible surface plasmon resonance near 525 nm (Figure 5.3C). For the shorter
peptide functionalization (CAAKA and C*Ku70) the plasmon is not as pronounced as for MGPs
with the larger peptides (C*hCT and C*TAT) as well as for the DHLA, likely due to differences
in the local electronic environment induced by the differences in peptide and small molecule
electronegativity and hydrophobicity. Additionally, some broad absorbance due to possible MGP
agglomeration is evident for the highly charged C*TAT and the large C*hCT in the ~600 nm
region, not evident in the MGP-CAAKA, MGP-C*Ku70 and MGP-DHLA samples, likely due to
bio-ligand size and charge.
5.3.3 Magnetic Resonance Imaging of MGP-CPPs in a Tissue Mimic for Gliosarcoma
The ability to assess uptake and localization of therapeutic materials, to determine
therapeutic efficacy, in clinical settings can present a challenge for certain cancers, such as
glioblastoma, which are not easily visibly accessible without invasive procedures. However, the
magnetic core of the MGP allows for visualization via Magnetic Resonance Imaging (MRI),296
as the MGP acts as a magnetic contrast agent versus the mostly water-filled cell and tissue
volume. Here, CPP and DHLA coated MGPs were used as therapeutic analogs, transfected into
cultured 9L rat gliosarcoma cells, and were able to be imaged via MRI in a tissue mimic
composed of cell layers suspended in an agarose gel matrix (Figure 5.4). The CPP loaded MGPs
were transfected without the aid of any commercial transfecting agent, but the MGP-DHLA,
which is unable to act as a membrane penetrant, was encapsulated using Lipofectamine2000®
(denoted as MGP-DHLAlipo) to facilitate cellular entry into the 9L cells. The quantification of
cellular uptake for the MGP constructs was performed by assessing the relative relaxation rates
for the MGP treated cells versus the agarose background. The T1 recovery relaxation time is a

114
measure of the ability of the sample to recover its spin orientation with the applied magnetic field
after being exposed to a transverse magnetization pulse of radio frequency radiation. Figure 5.3A
shows that all of the MGP-CPP and MGP-DHLAlipo samples display indistinguishable T1
relaxations from the agarose control. T1 relaxation describes the rate of the redistributions of the
nuclear spin state populations as they become representative of the thermal equilibrium, of which
the signal here is dominated by the water background.297 The T2 decay relaxation, however, is a
measure of the amount of time needed for the effects of the transverse magnetization radio pulse
to dissipate, or how susceptible the sample is to “forgetting” the transverse magnetization pulse
in the presence of the applied field, which will inherently be shorter for a magnetic material.
Figure 5.4 Magnetic resonance imaging analysis of cellular uptake for MGP-CPPs and MGP-
DHLA (transfected using Lipofectamine2000®) constructs, prepared in agarose gel tissue
mimic. Quantification and imaging of T1 Relaxation (A & D), T2 Relaxation (B & E), and T2*
Relaxation (C & F), as well as 3-D model of MGP localization in the tissue mimic (G).

115
Here, stronger differences are seen between the T2 of the MGPs and the agarose (Figure 5.4B),
and upon inspection of the T2* decay relaxation, which takes into account inhomogeneities of
the magnetic field, it can be seen that the shorter relaxation times of MGP-C*TAT and MGP-
DHLAlipo indicate a higher degree of magnetization (i.e. a larger number MGPs) compared to the
other samples, and that all of the MGP samples are significantly different from the control
agarose (Figure 5.4C).Correlating MRI visual inspection of the MGP-CPPs and MGP-DHLAlipo
cellular uptake in the agarose tissue mimic, T1, T2 and T2* weighted images are observed to
corroborate the computed uptake data, with the MGP-C*TAT and MGP-DHLA displaying the
darkest contrast in the T2 and T2* weighted images (Figure 5.4E & F), and the T1 image
showing no strong differences between samples (Figure 5.4C). The three-dimensional MRI
image (Figure 5.4G) displays granulated areas of high contrast for all of the MGP samples,
indicating possible clustering of transfected cells due to magnetic-attraction of the MGP-
containing cells during the process of suspending in agarose, following the 24 h incubation with
the MGP samples.
5.3.4 Optical Functionalization of the MGPs with FITC and Nile Blue690
The multi-functionality of the MGP as a magnetic contrast agent in the difficult-to-
visualize deep-tissue gliosarcoma tumor mimic led to the finding that the MGP-C*TAT and
MGP-DHLA in Lipofectamine® displayed the highest intracellular concentrations of magnetic
particles. However, since the resolution of MRI does not allow for individual cell-level
information to be obtained, investigation of the utility of the plasmonic Au shell of the multi-
functional MGPs was conducted. A375 human skin cancer cells were cultured as a model of an
accessible cancer type, melanoma, where a biopsy could be easily collected and cultured to
assess MGP therapeutic efficacy using fluorescence microscopy. When electing for the use
fluorophores to functionalize a MGP for fluorescent analysis applications, one must consider the
plasmonic Surface Energy Transfer (SET) quenching behavior of solid AuNPs of similar size.130
Since the 6 nm MGP will have similar quenching behavior to a solid 6 nm diameter AuNP,
fluorophores blue of the plasmon at 525 nm will experience quenching dependent on their
emission wavelength and distance from the MGP surface. Conversely, fluorophores red of the
525 nm plasmon will not engage in SET coupling and will remain fully “on.”52,130

116
Figure 5.5 Optical functionalization of best performers, MGP-TAT and MGP-DHLA with
fluorescein isothiocyanate (FITC) and Nile Blue690 (NB), respectively. Showing absorbance of
(A) MGPs before (OA/OA) and after biofunctionalization with DHLA, C*TAT and H6*TAT, as
well as (B) before and after coupling NB to DHLA. Additionally, for the SET quenched FITC,
treatment with sodium cyanide to etch the Au shell show changes the (C) absorbance and (D)
photoluminescence profiles after 5 minutes and full Au dissolution and loss of the Au plasmon as
well as FITC fluoresce recovery by 2h.
For this reason, the two fluorescent dyes selected to functionalize the MGPs were fluorescein
isothiocyanate (FITC: λEXC 495 nm, λEM 519 nm)298 and Nile Blue690 (NB: λEXC 635 nm, λEM
674 nm).299 For the fluorescent microscopy studies, the best performers, TAT and DHLA, were
fluorescently labeled. FITC labeled TAT, mutated with an N-terminal hexa-histidine sequence
(H6*TAT-FITC), was purchased due to the less stable nature of imidazole coordination with the
Au shell, from the histidine residues, as compared to the strong thiol-Au bond formed by the N-
terminal cysteine used previously. The stability of the peptide-MGP bond becomes important for
the decoupling of the SET quenching of the FITC, as a strong peptide-MGP bond will not be
conducive to peptide release from the MGP surface, and thus fluorescence recovery and

117
subsequent detection would not be possible. The NB was appended to the free carboxylic acid of
the DHLA using EDC coupling chemistry. Due to the short distance of the DHLA as a spacer
from the Au shell, and the strength of dual thiol-Au bonds, a red dye was used to ensure
detectability. Figure 5.5 displays the absorbance characterization data for the MGP-H6*TAT-
FITC (A) and MGP-DHLA-NB (B), comparing MGPs before and after dye labeling. The
absorbance profiles of the FITC and NB dyes can be seen in the final coupled products (Figure
5.5A & B). Additionally, since the FITC is quenched by the Au shell of the MGP, the use of
cyanide to dissolve the Au shell was employed to test fluorescence recovery of the FITC after
binding to the MGP, where both the absorbance spectra display a loss of the Au shell plasmon,
and the emission profiles display a gain in FITC intensity within 5 minutes, and full recovery
after 2 h (Figure 5.5C & D).
After successful dye-functionalization, the labeled MGPs were incubated with A375
melanoma cells for 24 h. Live cell fluorescence microscopy allowed for the MGP-H6*TAT-FITC
and MGP-DHLA-NB transfection progressions to be imaged over the 24 h experiment. Figure
5.6 depicts the health of the cells following transfection via the differential interference contrast
(DIC) images (gray), as well as the change fluorescence intensity and cellular localization of the
FITC (green) and NB (red), in the fluorescence and overlay channels, respectively (Figure 5.6).
As expected from the predicted quenching behavior of the Au shell, the FITC shows a gradual
increase in fluorescence intensity over time, as H6*TAT-FITC is released from the MGP surface,
reaching full intensity at 8 to 12 h post transfection (Figure 5.6A). Alternately, the NB
fluorescence intensity is observed to be fully “on” at the earliest time point, as can be seen in the
2 h images (Figure 5.6B). Also worth noting, the fluorescence pattern of the TAT facilitated
MGP uptake displays a more punctate pattern at early time points, indicative of endosomal
entrapment, followed by whole cell diffuse fluorescence at later time points, indicating cytosolic
escape of the fluorescent cargo. Whereas, the MGP-DHLA in Lipofectamine2000 shows a higher
degree of cytosolic localization at earlier time points, possibly pointing to an advantageous
ability of DHLA modified particles to avoid or escape endosomal entrapment even when
delivered in a cationic liposome. Extraction of the fluorescence intensity values for the FITC and
NB channels over time yields the uptake plot shown in Figure 5.7. Here it can be seen that the
NB (red) intensity is strongly observed from the earliest time points, with the slight delay in full

118
Figure 5.6 Fluorescence microscopy images of A375 melanoma cells at 2, 4, 8, 12, and 24 h
post-transfection with (A) MGP-TAT-FITC and (B) MGP-DHLA-NB. Differential interference
contrast (DIC), fluorescence, and composite overlay images are shown for each time point.
Scalebar: 100 μm.
emission being likely due to the settling of liposomes onto cells and the time needed for cellular
internalization, to enter the focal plane under observation (Figure 5.7). Additionally, the NB
maintains a relatively constant emission profile throughout the experiment, with only slight
decreases in intensity per cell occurring due to changes in cell growth over time and no
additional supplementation of MGP-DHLA-NB (Figure 5.7). The FITC intensity, on the other
hand, is observed to follow a much more gradual sigmoidal turn-on, which reaches its maximal
value at 8 h post transfection, and remains constant despite changes in cell growth, indicating
potential continued slow release of the H6*TAT-FITC from the MGP (Figure 5.6). Concurrently,
the fluorescence turn-on half-life for the MGP-DHLA-NB was found to be ~30 min, as
compared to the half-life of FITC which was found to be ~3 h. Previous work with DNA shows
similar cargo release kinetics from a solid AuNP.56
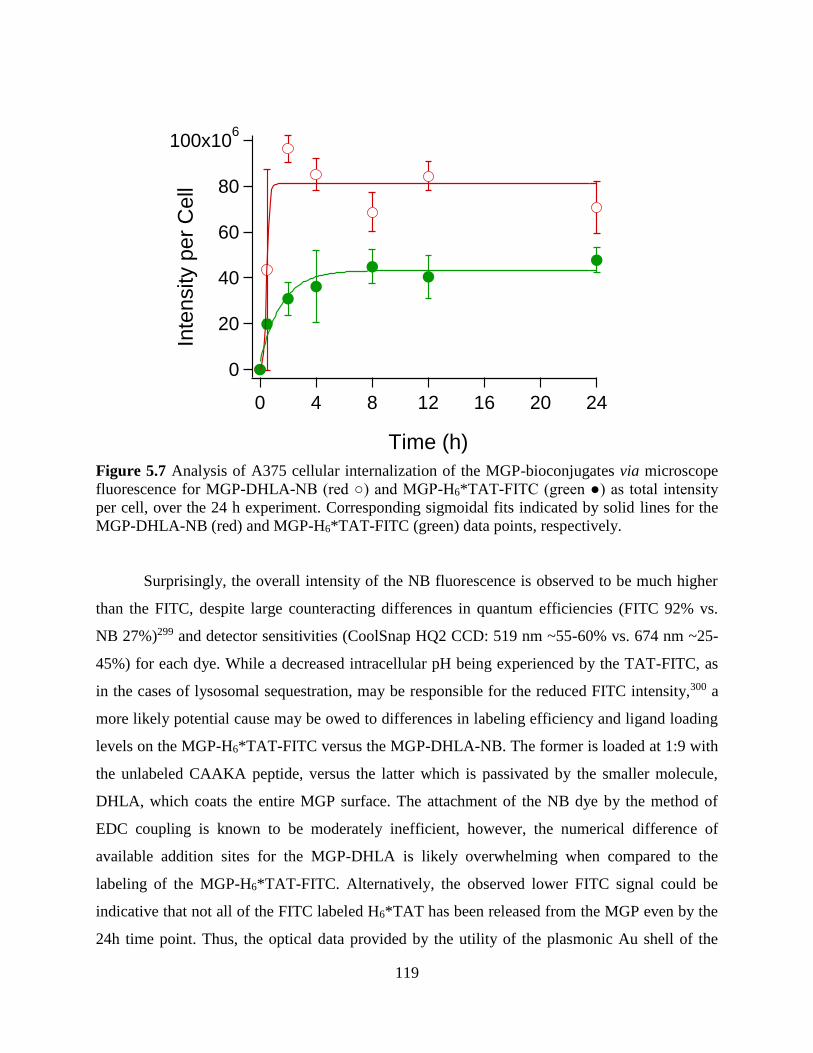
119
Figure 5.7 Analysis of A375 cellular internalization of the MGP-bioconjugates via microscope
fluorescence for MGP-DHLA-NB (red ○) and MGP-H6*TAT-FITC (green ●) as total intensity
per cell, over the 24 h experiment. Corresponding sigmoidal fits indicated by solid lines for the
MGP-DHLA-NB (red) and MGP-H6*TAT-FITC (green) data points, respectively.
Surprisingly, the overall intensity of the NB fluorescence is observed to be much higher
than the FITC, despite large counteracting differences in quantum efficiencies (FITC 92% vs.
NB 27%)299 and detector sensitivities (CoolSnap HQ2 CCD: 519 nm ~55-60% vs. 674 nm ~25-
45%) for each dye. While a decreased intracellular pH being experienced by the TAT-FITC, as
in the cases of lysosomal sequestration, may be responsible for the reduced FITC intensity,300 a
more likely potential cause may be owed to differences in labeling efficiency and ligand loading
levels on the MGP-H6*TAT-FITC versus the MGP-DHLA-NB. The former is loaded at 1:9 with
the unlabeled CAAKA peptide, versus the latter which is passivated by the smaller molecule,
DHLA, which coats the entire MGP surface. The attachment of the NB dye by the method of
EDC coupling is known to be moderately inefficient, however, the numerical difference of
available addition sites for the MGP-DHLA is likely overwhelming when compared to the
labeling of the MGP-H6*TAT-FITC. Alternatively, the observed lower FITC signal could be
indicative that not all of the FITC labeled H6*TAT has been released from the MGP even by the
24h time point. Thus, the optical data provided by the utility of the plasmonic Au shell of the
100x106
80
60
40
20
0
Inte
nsity p
er
Ce
ll
24201612840
Time (h)

120
MGP can provide insights on the localization and kinetics of intracellular delivery, but may not
be able to accurately quantify cellular uptake due to potential convolution with differential
labeling or incomplete cargo release.
5.3.5 MGP Cellular Uptake Assessed by Magnetometry
In an attempt to better assess and more accurately quantify the number of MGP taken up
by the A375 melanoma cells, for the TAT versus DHLA bio-functionalization approaches, which
gave the best performance in the MRI study, analysis of isolated cell pellets was performed 24 h
after transfection using a Superconducting Quantum Interference Device to measure magnetic
moment saturation compared to the number of cells. In Figure 5.8 it can be seen that the MGP-
C*TAT shows more than twice the magnetic moment as compared to the MGP-DHLAlipo for a
sample of five million cells, respectively. This gives an approximate value of 3.40x10⁻⁸ emu/cell
for the MGP-C*TAT as compared to 1.48x10⁻⁸ emu/cell for the MGP-DHLAlipo, which signifies
an increase of 2.3:1 in MGP uptake for the CPP loaded versus the small molecule loaded MGP
(transfected using lipofection) (Figure 5.8).
Figure 5.8 Superconducting Quantum Interference Device (SQUID) measurements of magnetic
moment saturation for collected A375 cell pellets (5 million cells) at 24 h post transfection with
MGP-C*TAT (♦) and MGP-DHLAlipo (□). The “M” on the y-axis represents magnetic moment
and the “H” on the x-axis represents magnetic field strength.

121
Comparison to the calculated magnetic moment per particle (~5.9x10⁻¹⁷ emu/MGP), as
corrected for approximately 45% ligand mass and assumed to be relatively unaffected by particle
size distributions, led to the finding that the MGP-C*TAT experienced an average cellular
uptake of approximately 580 million particles per cell, whereas the MGP-DHLAlipo facilitates
internalization of 250 million particles per cell. This demonstrates the efficiency of MGP uptake
to be greater when using the CPP TAT versus the commercially available cationic lipid
transfection methodology, with approximately 80.3% of transfected particles entering cells for
MGP-C*TAT, and approximately 35.0% of MGP-DHLA entering cells with the assistance of the
lipofectamine transfection reagent.
Analysis of the other MGP-CPP constructions gave undetectable magnetic moment signal
over the background when assessed with the large mass of the cell pellets. Differences in CPP-
dependent uptake patterns from previous work on semiconducting quantum dots may be due to
changes in the achieved loading level or CPP packing on the Au shell versus the ZnS shell of the
QD, emphasizing the need for individual material analyses.
5.4 Conclusion
In summary, the synthesis and bioconjugation of multi-function magnetic gold
nanoparticles from Fe3O4 cores coated with a Au shell, followed by appendage of modified CPPs
and DHLA, as a small molecule drug mimic, has been demonstrated. Investigation of MGP-CPP
and MGP-DHLAlipo uptake in 9L rat gliosarcoma was assess in a layered agarose tissue mimic
by MRI; and it was found that the MGP-C*TAT and MGP-DHLA (transfected by lipofection)
showed the highest T2 and T2* contrast, indicating greater cellular uptake versus the CAAKA,
Ku70 and hCT peptides. Utilization of the plasmonic Au shell of the MGP allowed for
assessment of the cellular localization and uptake kinetics for the best performers of MGP-TAT
and MGP-DHLA in a melanoma biopsy model of A375 skin cancer cells. More rapid and intense
fluorescence was observed by the MGP-DHLA-NBlipo as compared to the MGP-H6*TAT-FITC
which had a half life of ~3 h versus 0.5 h for NB. This difference maybe partially due to the
“always on” emission of the NB, since it is red of the Au plasmon and not energetically coupled
by SET quenching, versus the SET quenched FITC appended to the MGP-H6*TAT which
required release of the coordinated imidazoles of the hexa-histidine anchoring group, prior to
FITC emission recovery. Further quantification of MGP uptake was assess via SQUID

122
measurements of magnetic moment saturation per cell which found that the MGP-C*TAT
outcompeted the MGP-DHLAlipo for cellular uptake in A375 cells by 2.3:1 with 80.3% and
35.0% uptake efficacy, respectively.
The findings of this work not only establish MGPs as a multi-utility bio-functional
platform for cellular transfection, treatment, and diagnostic applications, but also demonstrate
multiple magnetic- and plasmonic-analysis approaches for probing clinically relevant nano-
therapeutic questions of intracellular fate and internalization efficacy. In all, the bio-conjugated
MGP has been shown to have great potential as a clinically-valuable nanotechnology.
123
CHAPTER 6
SUMMARY AND FUTURE OUTLOOK
The body of this work described the design, fabrication, implementation, and analysis of
several unique applications for nanomaterials as biological sensors in living cells, used as models
for nanoparticle-based therapeutic approaches. Utilizing the molecular beacon toolbelt, the nano-
specific optical and magnetic properties, and the benefits of peptide-mediated cellular targeting
and entry, spectroscopic and microscopic analysis of cellular uptake, processing, and fate was
accomplished. The fundamental science explored herein helped to elucidate important factors
involved in nanomaterials-bioconjugation as well as those pertaining to intracellular processing
of nano-probes and nano-therapeutics.
In chapter two, the study of gold nanoparticles (AuNPs) used as delivery platforms for
DNA oligonucleotides and genes with various appendage strategies revealed the ability to
engineer control over the attachment chemistry and thus the release rate of DNA therapeutic
cargos. Here the common mono-thiol oligonucleotide-AuNP conjugation strategy was compared
to dual thiol, dual amine, and thiol plus amine bidentate conjugation schemes as well as mono-
amine conjugation and it was determined that differential rates of intracellular processing and
therapeutic release could be accomplished for each coupling method. The use of live-cell
fluorescence microscopy allowed for the direct visualization of the timing of release through
fluorescence “turn on” of the dye-labels on the DNA that were quenched by the AuNP while the
DNA was bound to the particle within the nanometal’s Surface Energy Transfer (SET)52,53,130
diameter. The intracellular rates of DNA release from the AuNP surface in A375 human
melanoma cells were found to follow the binding activity series: dual thiol > thiol plus amine >
mono thiol > dual amine ≈ mono amine, for the investigated DNA- AuNP coupling routes. And
similar trends were observed for gene expression of a linearized plasmid containing a fluorescent
protein (FP) gene appended by the same strategies. Future endeavors to expand this work will be
able to implement active therapeutics such as a gene for a short hairpin RNA which will
continuously knock-down expression of a delinquent protein, such as the P-glycoprotein efflux
pump which is known to be upregulated in multi-drug resistant cancers,281,301 followed by a
secondary release event to deliver small molecule drug, or suicide gene to terminate the treated

124
cancer cell, from the same AuNP. These experiments could also be assessed by live-cell
fluorescent microscopy using a FP gene fusion, or via other cell viability assays.
In chapter three, the simultaneous monitoring of the timing of cargo release from the
nanotherapeutic AuNP as well as measurement of the evolving intracellular pH experienced by
the cargo during cell processing was elucidated. This was accomplished using a triple dye-
labeled duplex DNA appended to the AuNP that employed the environmentally sensitive and
pH-responsive dye, fluorescein, paired with DyLight405, to act as ratiomers in measuring
intracellular pH, at and after cargo release; as well as DyLight700, which was not energetically-
coupled to the AuNP, as a measure of uptake and localization throughout the experiment.
Through visualization via live-cell fluorescent microscopy, it was observed that the
nanotherapeutic packaging of labeled DNA provides a protective effect against lysosomal
degradation in acidic organelles as noted by cargo experiencing an average intracellular pH near
6. Future expansion of this sensor platform may encompass multiple spectrally resolved sensing
dyes, appended to as single AuNP, to multiplex intracellular analyte detection and better
elucidate the complete picture of the cellular environment experienced by the nanoparticle,
including the presence and abundance of reactive oxygen species, and reducing agents
encountered by the nano-therapeutic.
In chapter four, the role of drug resistance status in cancer cells was probed by the
targeted therapeutic delivery of emissive quantum dots (QDs) biofunctionalized with cell
penetrating peptide (CPP). The QD-CPP nano-bioconjugation created a labelled delivery
package to investigate the nuances and difficulties of drug transport into multidrug resistant
(MDR) cancer cells for potential future clinical applications of diverse nanoparticle therapeutic
delivery strategies. The eight distinct CPPs used were CAAKA, VP-22, HIV-TAT, HIV-gp41,
Ku-70, and hCT(9-32), integrin-β3, and K-FGF. Differential cellular uptake profiles were
observed in cancer versus drug resistant melanoma (A375 & A375-R), mesothelioma (MSTO &
MSTO-R), and glioma (rat 9L & 9L-R, and human U87 & LN18), cell lines, with hCT being the
best performer for most cell lines, and showing stronger affinity in drug-resistant melanoma and
gliosarcoma. The results also demonstrated that cell penetrating peptide uptake varies with the
amount of drug resistance and cell type, likely due to changes in cell surface markers. This study
provided insight into developing functional nanoplatform delivery systems in drug resistant
cancer models. Future expansion of this sensing platform will include delivery of

125
chemotherapeutic and anticancer genes to assess how uptake and release rates for the nano-
therapeutic payload are affected by co-assembly with the CPPs.
In chapter five, the collection of analytical methodologies available for evaluating nano-
therapy in cells transfected with gold shelled magnetic nanomaterials, termed “magnetic gold
particle” (MGP), was demonstrated. Analysis of the MGPs’ magnetic iron oxide core, enabled
evaluation of magnetic moment and resonance via SQUID and MRI, respectively, to determine
MGP-CPP uptake levels in a deep tissue MRI model, as well as magnetometry of an extracted
cell pellet to allow multipoint analysis of NP internalization. The added advantages of a gold
shell allowed for good biocompatibility, easy biofunctionalization with the CPPs, and
visualization of intracellular therapeutic delivery and kinetics using fluorescent microscopy for
optically functionalized MGPs with fluorophores possessing SET and non-SET behavior. This
multiplex sensor demonstrated the best aspects of magnetic and gold nanoparticles in one useful
platform, and addressed questions of therapeutic targeting and uptake with cell penetrating
peptides in clinically relevant cancer cell models. Future exploration of the full utility of the
MGP may include implementation into in vivo clinical models, such as brain and skin cancer
tumors, expressed in mice, as well as employment of functional therapeutics to co-append with
the CPPs to drive therapeutic benefit of the MGP platform to the next level.
In all, this work has set an important foundation for the future, and present, clinical
development of nanotherapeutics for personalized cellular medicinal approaches. Understanding
how, where, and why nanoparticle-bioconjugate constructions are processed by individual cells
is paramount to the success of nanomedicine. Being aware of potential perils, such as lysosomal
degradation of the nano-cargo, as well as being able to utilize advantageous outcomes of
intracellular processing of nanomaterials, such as control over cargo-release and cell targeting,
will drive better design and multifunctionality to be engineered into the next evolution of
medicine.

126
APPENDIX A
ABBREVIATIONS AND ACRONYMS
AuNP, gold nanoparticle
BOT, Bio-optical Transponder
CCF, cross-correlation function
DNA, deoxyribonucleic acid
DL, dylight
EE, early endosome
FAM, fluorescein amidite
LE, late endosome
LY, lysosome
M1, Manders’ colocalization coefficient.
McSET, multicolor Surface Energy Transfer
NP, nanoparticle
NA, nucleic acid
rp, Pearson’s correlation coefficient
RFP, red fluorescent protein
SET, Surface Energy Transfer

127
REFERENCES
(1) Simoni, R. D., Hill, R. L., Vaughan, M., and Tabor, H. (2003) The Beckman DU
Spectrophotometer and Its Inventor, Arnold O . Beckman. J. Biol. Chem. 278, 79–81.
(2) (1954) Beckman Instruments Instruction Manual : The Beckman Model DU
Spectrophotometer and Accessories. Beckman Instruments, Inc., Fullerton, CA.
(3) NIH Science Archive: Spectrophotofluorometer. Natl. Institutes Heal.
(4) Sandvig, K., and van Deurs, B. (2002) Transport of protein toxins into cells: pathways used
by ricin, cholera toxin and Shiga toxin. FEBS Lett. 529, 49–53.
(5) Carnevale, K. J. F., Riskowski, R. A., and Strouse, G. F. (2018) A Gold Nanoparticle Bio-
Optical Transponder to Dynamically Monitor Intracellular pH. ACS Nano 12, 5956–5968.
(6) Frommer, W. B., Davidson, M. W., and Campbell, R. E. (2009) Genetically encoded
biosensors based on engineered fluorescent proteins. Chem. Soc. Rev. 38, 2833.
(7) Tsien, R. Y. (2010) Nobel lecture: constructing and exploiting the fluorescent protein
paintbox. Integr. Biol. 2, 77.
(8) Ede, A., and Cormack, L. B. (2016) A History of Science in Society: From Philosophy to
Utility Third. University of Toronto Press, Higher Education Division, Toronto.
(9) Faulkner, N. (2017) A visual history of science and technology. The Rosen Publishing
Group, Inc, 96 p.
(10) Khan, I., Saeed, K., and Khan, I. (2017) Nanoparticles: Properties, applications and
toxicities. Arabian J. of Chem. https://doi.org/10.1016/j.arabjc.2017.05.011
(11) Khitrov, G. A. (2003) Synthesis , Characterization and Formation Mechanisms of Inorganic
Nanomaterials . 1–161.
(12) Cao-Milán, R., He, L. D., Shorkey, S., Tonga, G. Y., Wang, L.-S., Zhang, X., Uddin, I.,
Das, R., Sulak, M., and Rotello, V. M. (2017) Modulating the catalytic activity of enzyme-like
nanoparticles through their surface functionalization. Mol. Syst. Des. Eng. 2, 624–628.
(13) He, X., Gao, L., and Ma, N. (2013) One-Step Instant Synthesis of Protein-Conjugated
Quantum Dots at Room Temperature. Sci. Rep. 3, 2825.
(14) Falagan-Lotsch, P., Grzincic, E. M., and Murphy, C. J. (2017) New Advances in
Nanotechnology-Based Diagnosis and Therapeutics for Breast Cancer: An Assessment of
Active-Targeting Inorganic Nanoplatforms. Bioconjug. Chem. 28, 135–152.
(15) Giner-Casares, J. J., Henriksen-Lacey, M., Coronado-Puchau, M., and Liz-Marzán, L. M.
(2016) Inorganic nanoparticles for biomedicine: Where materials scientists meet medical
research. Mater. Today 19, 19–28.

128
(16) Smith, R. G., and Burtner, A. P. (1994) Oral side-effects of the most frequently prescribed
drugs. Spec. Care Dent. 14, 96–102.
(17) Csoka, A. B., and Szyf, M. Epigenetic side-effects of common pharmaceuticals: A potential
new field in medicine and pharmacology. Med. Hypotheses 73, 770–780.
(18) Bixler, G. D., and Bhushan, B. (2012) Bioinspired rice leaf and butterfly wing surface
structures combining shark skin and lotus effects. Soft Matter 8, 11271.
(19) Ho, A. Y. Y., Yeo, L. P., Lam, Y. C., and Rodriguez, I. (2011) Fabrication and Analysis of
Gecko-Inspired Hierarchical Polymer Nanosetae. ACS Nano 5, 1897–1906.
(20) Heiligtag, F. J., and Niederberger, M. (2013) The fascinating world of nanoparticle research.
Mater. Today 16, 262–271.
(21) Zsigmondy, R. (1902) Composition for Ruby Glass. U.S. Patent Office.
(22) Jarett A. Lobell. (2013) Seen and Unseen: How an ancient artifact is changing the way we
practice science. Archaeology 66, 34–37.
(23) Wooten, F. (1972) Optical properties of solids. Academic Press.
(24) Zhou, F., Li, Z.-Y., Liu, Y., and Xia, Y. (2008) Quantitative Analysis of Dipole and
Quadrupole Excitation in the Surface Plasmon Resonance of Metal Nanoparticles. J. Phys.
Chem. C 112, 20233–20240.
(25) Amendola, V., Bakr, O. M., and Stellacci, F. (2010) A Study of the Surface Plasmon
Resonance of Silver Nanoparticles by the Discrete Dipole Approximation Method: Effect of
Shape, Size, Structure, and Assembly. Plasmonics 5 (1), 85-97.
(26) Breshike, C. J., Riskowski, R. A., and Strouse, G. F. (2013) Leaving FRET Behind, Size-
Enhanced Energy Coupling Between a Metal Nanoparticle and an Emitting Dipole. J. Phys.
Chem. C 117, 23942–23949.
(27) Ruska, E. (1986) The emergence of the electron microscope: Connection between
Realization and First Patent Application, Documents of an Invention. J. Ultrastruct. Mol. Struct.
Res. 95, 3–28.
(28) Woods, K. E., Perera, Y. R., Davidson, M. B., Wilks, C. A., Yadav, D. K., and Fitzkee, N.
C. (2016) Understanding Protein Structure Deformation on the Surface of Gold Nanoparticles of
Varying Size. J. Phys. Chem. C 120, 27944–27953.
(29) Jans, H., Liu, X., Austin, L., Maes, G., and Huo, Q. (2009) Dynamic light scattering as a
powerful tool for gold nanoparticle bioconjugation and biomolecular binding studies. Anal Chem
81, 9425–9432.
(30) Schmitz, K. S. (1990) An introduction to dynamic light scattering by macromolecules.
Academic Press.

129
(31) Richard P. Feynman. (1960) There’s Plenty of Room at the Bottom. Eng. Sci. 23, 22–36.
(32) Drexler, K. E. (1986) Engines of creation. Anchor Press/Doubleday.
(33) Brown, N. (2017) The limits of fabrication materials science, materialist poetics. Fordham
University Press, New York.
(34) Taniguchi, N. (1974) On the Basic Concept of Nanotechnology. Proc. Int. Conf. Prod. Eng.
Tokyo 18–23.
(35) Shew, A. (2008) Nanotech’s History An Interesting, Interdisciplinary, Ideological Split.
Bulletin of Science, Technology & Society, 28 (5), 390-399.
(36) Brus, L. E. (1984) Electron–electron and electron‐hole interactions in small semiconductor
crystallites: The size dependence of the lowest excited electronic state. J. Chem. Phys. 80, 4403–
4409.
(37) Bruchez M., J., Moronne, M., Gin, P., Weiss, S., and Alivisatos, A. P. (1998)
Semiconductor nanocrystals as fluorescent biological labels. Science (80-. ). 281, 2013–2016.
(38) Washington, A. L., Foley, M. E., Cheong, S., Quffa, L., Breshike, C. J., Watt, J., Tilley, R.
D., and Strouse, G. F. (2012) Ostwald’s Rule of Stages and Its Role in CdSe Quantum Dot
Crystallization. J Am Chem Soc 134, 17046–17052.
(39) Alivisatos, A. P., Gu, W., and Larabell, C. (2005) Quantum dots as cellular probes. Annu
Rev Biomed Eng 7, 55–76.
(40) Ballou, B. (2005) Quantum dot surfaces for use in vivo and in vitro. Curr Top Dev Biol 70,
103–120.
(41) Yu Lee, J., Heon Nam, D., Hwa Oh, M., Kim, Y., Seok Choi, H., Young Jeon, D., Beum
Park, C., and Sung Nam, Y. (2014) Serum-stable quantum dot--protein hybrid nanocapsules for
optical bio-imaging. Nanotechnology 25, 175702.
(42) Lu, A.-H., Salabas, E. L., and Schüth, F. (2007) Magnetic Nanoparticles: Synthesis,
Protection, Functionalization, and Application. Angew. Chemie Int. Ed. 46, 1222–1244.
(43) Spaldin, N. A. (2003) Magnetic Materials: Fundamentals and Device Applications.
Cambridge University Press, New York. ISBN: 978-0521016582.
(44) Kneller, E. F., and Luborsky, F. E. (1963) Particle Size Dependence of Coercivity and
Remanence of Single‐Domain Particles. J. Appl. Phys. 34, 656–658.
(45) Mcbride, A. A., Price, D. N., Lamoureux, L. R., Elmaoued, A. A., Vargas, J. M., Adolphi,
N. L., and Muttil, P. (2013) Preparation and Characterization of Novel Magnetic Nano-in-
Microparticles for Site-Specific Pulmonary Drug Delivery. Mol. Pharm. 10, 3574–3581.
(46) Johnson, J. A., and Bootman, J. L. (1995) Drug-related morbidity and mortality. A cost-of-

130
illness model. Arch. Intern. Med. 155, 1949–56.
(47) Steinmetz, N. F., and Manchester, M. (2009) PEGylated Viral Nanoparticles for
Biomedicine: The Impact of PEG Chain Length on VNP Cell Interactions In Vitro and Ex Vivo.
Biomacromolecules 10, 784–792.
(48) Cho, S. K., and Kwon, Y. J. (2012) Synthetically engineered viruses: Can synthetic
chemistry tame the nature? Curr. Opin. Solid State Mater. Sci. 16, 276–286.
(49) Ciofani, G. (2018) Smart Nanoparticles for Biomedicine. Elsevier. ISBN: 9780128141571.
(50) Haume, K., Rosa, S., Grellet, S., Śmiałek, M. A., Butterworth, K. T., Solov ’yov, A. V,
Prise, K. M., Golding, J., and Mason, N. J. Gold nanoparticles for cancer radiotherapy: a review.
Cancer Nanotechnol. 7, 8.
(51) Lachaine, R., Boutopoulos, C., Lajoie, P.-Y., Tienne Boulais, É., and Meunier, M. Rational
Design of Plasmonic Nanoparticles for Enhanced Cavitation and Cell Perforation. Nano Lett. 16
(5), 3187-94.
(52) Jennings, T. L., Singh, M. P., and Strouse, G. F. (2006) Fluorescent lifetime quenching near
d = 1.5 nm gold nanoparticles: probing NSET validity. J Am Chem Soc 128, 5462–5467.
(53) Jennings, T. L., Schlatterer, J. C., Singh, M. P., Greenbaum, N. L., and Strouse, G. F. (2006)
NSET molecular beacon analysis of hammerhead RNA substrate binding and catalysis. Nano
Lett. 6, 1318–1324.
(54) Zhang, J., Liu, B., Liu, H., Zhang, X., and Tan, W. (2013) Aptamer-conjugated gold
nanoparticles for bioanalysis. Nanomedicine 8, 983–993.
(55) Armstrong, R. E., and Strouse, G. F. (2014) Rationally Manipulating Aptamer Binding
Affinities in a Stem-Loop Molecular Beacon. Bioconjug. Chem. 25, 1769–1776.
(56) Muroski, M. E., Carnevale, K. J. F., Riskowski, R. A., and Strouse, G. F. (2015) Plasmid
transfection in mammalian cells spatiotemporally tracked by a gold nanoparticle. ACS Nano 9,
124–133.
(57) Prigodich, A. E., Randeria, P. S., Briley, W. E., Kim, N. J., Daniel, W. L., Giljohann, D. A.,
and Mirkin, C. A. (2012) Multiplexed Nanoflares: mRNA Detection in Live Cells. Anal. Chem.
84, 2062–2066.
(58) Riskowski, R. A., Armstrong, R. E., Greenbaum, N. L., and Strouse, G. F. (2016)
Triangulating Nucleic Acid Conformations Using Multicolor Surface Energy Transfer. ACS
Nano 10, 1926–1938.
(59) Hildebrandt, N., Spillmann, C. M., Algar, W. R., Pons, T., Stewart, M. H., Oh, E., Susumu,
K., Díaz, S. A., Delehanty, J. B., and Medintz, I. L. (2017) Energy Transfer with Semiconductor
Quantum Dot Bioconjugates: A Versatile Platform for Biosensing, Energy Harvesting, and Other
Developing Applications. Chem. Rev. 117, 536–711.

131
(60) Jiang, W., Singhal, A., Kim, B., Zheng, J., Rutka, J., Wang, C., and Chan, W. (2008)
Assessing Near-Infrared Quantum Dots for Deep Tissue, Organ, and Animal Imaging
Applications. J. Assoc. Lab. Autom. 13, 6–12.
(61) Dennis, A. M., and Bao, G. (2010) Quantum dot-fluorescent protein pair as ratiometric pH
sensor, in Proceedings of SPIE, p 75750C.
(62) Pinaud, F., Clarke, S., Sittner, A., and Dahan, M. (2010) Probing cellular events, one
quantum dot at a time. Nat. Methods 7, 275–285.
(63) Radenkovic, D., Kobayashi, H., Remsey-Semmelweis, E., and Seifalian, A. M. (2016)
Quantum dot nanoparticle for optimization of breast cancer diagnostics and therapy in a clinical
setting. Nanomedicine Nanotechnology, Biol. Med. 12, 1581–1592.
(64) Pankhurst, Q. A., Connolly, J., and Jones, S. K. (2003) Applications of magnetic
nanoparticles in biomedicine. J. Phys. D. Appl. Phys. 36, R167–R181.
(65) Tomlinson, M. J., Tomlinson, S., Yang, X. B., and Kirkham, J. (2013) Cell separation:
Terminology and practical considerations. J. Tissue Eng. 4, 2041731412472690.
(66) Cheng, K., Malliaras, K., Li, T.-S., Sun, B., Houde, C., Galang, G., Smith, J., Matsushita,
N., and Marbán, E. (2012) Magnetic Enhancement of Cell Retention, Engraftment, and
Functional Benefit after Intracoronary Delivery of Cardiac-Derived Stem Cells in a Rat Model of
Ischemia/Reperfusion. Cell Transplant. 21, 1121–1135.
(67) Medarova, Z., Pham, W., Farrar, C., Petkova, V., and Moore, A. (2007) In vivo imaging of
siRNA delivery and silencing in tumors. Nat. Med. 13, 372–377.
(68) Yeh, C.-Y., Hsiao, J.-K., Wang, Y.-P., Lan, C.-H., and Wu, H.-C. (2016) Peptide-
conjugated nanoparticles for targeted imaging and therapy of prostate cancer. Biomaterials 99,
1–15.
(69) Washington, A. L., and Strouse, G. F. (2009) Microwave Synthetic Route for Highly
Emissive TOP/TOP-S Passivated CdS Quantum Dots. Chem. Mater. 21, 3586–3592.
(70) Nehl, C. L., and Hafner, J. H. (2008) Shape-dependent plasmon resonances of gold
nanoparticles. J. Mater. Chem. 8 (21), 2415-2419.
(71) Lei, Z., Zhang, J.-Y., Guan, Z.-J., and Wang, Q.-M. (2017) Intensely luminescent gold( i )
phosphinopyridyl clusters: visualization of unsupported aurophilic interactions in solution.
Chem. Commun. 53, 10902–10905.
(72) Lisjak, D., and Mertelj, A. (2018) Anisotropic magnetic nanoparticles: A review of their
properties, syntheses and potential applications. Prog. Mater. Sci. 95, 286–328.
(73) Qin, Z., Wang, Y., Randrianalisoa, J., Raeesi, V., Chan, W. C. W., Lipiński, W., and

132
Bischof, J. C. (2016) Quantitative Comparison of Photothermal Heat Generation between Gold
Nanospheres and Nanorods. Sci. Rep. 6, 29836.
(74) Yue, J., Feliciano, T. J., Li, W., Lee, A., and Odom, T. W. (2017) Gold Nanoparticle Size
and Shape Effects on Cellular Uptake and Intracellular Distribution of siRNA Nanoconstructs.
Bioconjug. Chem. 28, 1791–1800.
(75) Bogner, A., Jouneau, P.-H., Thollet, G., Basset, D., and Gauthier, C. A history of scanning
electron microscopy developments: Towards “‘wet-STEM’” imaging. Micron 38 (4), 390-401.
(76) Brown, R. (1828) XXVII. A brief account of microscopical observations made in the
months of June, July and August 1827, on the particles contained in the pollen of plants; and on
the general existence of active molecules in organic and inorganic bodies. Philos. Mag. Ser. 2 4,
161–173.
(77) Smithies, O. (1955) Zone electrophoresis in starch gels: group variations in the serum
proteins of normal human adults. Biochem. J. 61, 629–41.
(78) Udenfriend, S. (1995) Development of the spectrophotofluorometer and its
commercialization*. Protein Sci. 4, 542–551.
(79) Jansson, E. T., Lai, Y.-H., Santiago, J. G., and Zare, R. N. Rapid Hydrogen−Deuterium
Exchange in Liquid Droplets.
(80) Boeneman, K., Delehanty, J. B., Blanco-Canosa, J. B., Susumu, K., Stewart, M. H., Oh, E.,
Huston, A. L., Dawson, G., Ingale, S., Walters, R., Domowicz, M., Deschamps, J. R., Algar, W.
R., Dimaggio, S., Manono, J., Spillmann, C. M., Thompson, D., Jennings, T. L., Dawson, P. E.,
and Medintz, I. L. (2013) Selecting improved peptidyl motifs for cytosolic delivery of disparate
protein and nanoparticle materials. ACS Nano 7, 3778–3796.
(81) Safi, M., Domitrovic, T., Kapur, A., Zhan, N., Aldeek, F., Johnson, J. E., and Mattoussi, H.
(2017) Intracellular Delivery of Luminescent Quantum Dots Mediated by a Virus-Derived Lytic
Peptide. Bioconjug. Chem. 28, 64–74.
(82) Mout, R., Ray, M., Tay, T., Sasaki, K., Yesilbag Tonga, G., and Rotello, V. M. (2017)
General Strategy for Direct Cytosolic Protein Delivery via Protein–Nanoparticle Co-engineering.
ACS Nano 11, 6416–6421.
(83) Canton, I., and Battaglia, G. (2012) Endocytosis at the nanoscale. Chem. Soc. Rev. 41.
(84) Hansen, C. G., and Nichols, B. J. (2009) Molecular mechanisms of clathrin-independent
endocytosis. J. Cell Sci. 122, 1713–21.
(85) Huotari, J., and Helenius, A. (2011) Endosome maturation. EMBO J. 30, 3481–3500.
(86) Mukherjee, S., Ghosh, R. N., and Maxfield, F. R. (1997) Endocytosis. Physiol. Rev. 77,
759–803.

133
(87) Kou, L., Jin, S., Yinglei, Z., and Zhonggui, H. (2013) The endocytosis and intracellular fate
of nanomedicines: Implication for rational design. Asian J. Pharm. Sci. 8, 1–10.
(88) Felgner, P. L., Gadek, T. R., Holm, M., Roman, R., Chan, H. W., Wenz, M., Northrop, J. P.,
Ringold, G. M., and Danielsen. (1987) Lipofection: a highly efficient, lipid-mediated DNA-
transfection procedure. PNAS 84 (21), 7413-7.
(89) Kyung Kim, T., and Eberwine, J. H. (2010) Mammalian cell transfection: the present and
the future. Anal. Bioanal. Chem. 397(8), 3173–3178.
(90) Koren, E., and Torchilin, V. P. (2012) Cell-penetrating peptides: breaking through to the
other side. Trends Mol. Med. 18, 385–393.
(91) He, B., Yang, D., Qin, M., Zhang, Y., He, B., Dai, W., Wang, X., Zhang, Q., Zhang, H., and
Yin, C. (2017) Increased cellular uptake of peptide-modified PEGylated gold nanoparticles.
Biochem. Biophys. Res. Commun. 494, 339–345.
(92) Mueller, J., Kretzschmar, I., Volkmer, R., and Boisguerin, P. (2008) Comparison of cellular
uptake using 22 CPPs in 4 different cell lines. Bioconjug. Chem. 19, 2363–2374.
(93) Guidotti, G., Brambilla, L., and Rossi, D. (2017) Cell-Penetrating Peptides: From Basic
Research to Clinics. Trends Pharmacol. Sci. 38(4), 406-424.
(94) Collins, F. S., Morgan, M., and Patrinos, A. (2003) The Human Genome Project: lessons
from large-scale biology. Science 300, 286–90.
(95) Fire, A., Xu, S., Montgomery, M. K., Kostas, S. A., Driver, S. E., and Mello, C. C. (1998)
Potent and specific genetic interference by double-stranded RNA in Caenorhabditis elegans.
Nature 391, 806–811.
(96) Collins, F. S., and McKusick, V. A. (2001) Implications of the Human Genome Project for
Medical Science. JAMA 285, 540.
(97) Consortium, T. E. P. (2012) An integrated encyclopedia of DNA elements in the human
genome. Nature 489, 57–74.
(98) Ginn, S. L., Amaya, A. K., Alexander, I. E., Edelstein, M., and Abedi, M. R. (2018) Gene
therapy clinical trials worldwide to 2017: An update. J. Gene Med. 20, e3015.
(99) Nayak, S., and Herzog, R. W. (2010) Progress and prospects: immune responses to viral
vectors. Gene Ther. 17, 295–304.
(100) Barnaby, S. N., Lee, A., and Mirkin, C. A. (2014) Probing the inherent stability of siRNA
immobilized on nanoparticle constructs. Proc. Natl. Acad. Sci. 111, 9739–9744.
(101) Muroski, M. E., Morgan, T. J. T. J., Levenson, C. W., and Strouse, G. F. (2014) A Gold
Nanoparticle Pentapeptide: Gene Fusion To Induce Therapeutic Gene Expression in
Mesenchymal Stem Cells. J. Am. Chem. Soc. 136, 14763–14771.

134
(102) Muroski, M. E., Kogot, J. M., and Strouse, G. F. (2012) Bimodal Gold Nanoparticle
Therapeutics for Manipulating Exogenous and Endogenous Protein Levels in Mammalian Cells.
J. Am. Chem. Soc. 134, 19722–19730.
(103) Liu, F., and Huang, L. (2002) Development of non-viral vectors for systemic gene
delivery. J Control Release 78, 259–266.
(104) Glover, D. J., Lipps, H. J., and Jans, D. A. (2005) Towards safe, non-viral therapeutic gene
expression in humans. Nat Rev Genet 6, 299–310.
(105) Dobson, J. (2006) Gene therapy progress and prospects: magnetic nanoparticle-based gene
delivery. Gene Ther. 13, 283–287.
(106) Zhang, Y., Satterlee, A., and Huang, L. (2012) In Vivo Gene Delivery by Nonviral
Vectors: Overcoming Hurdles? Mol Ther. 20 (7), 1298-304.
(107) Yin, H., Kanasty, R. L., Eltoukhy, A. A., Vegas, A. J., Dorkin, J. R., and Anderson, D. G.
(2014) Non-viral vectors for gene-based therapy. Nat. Rev. Genet. 15, 541–555.
(108) Jin, S., and Ye, K. (2007) Nanoparticle-mediated drug delivery and gene therapy.
Biotechnol Prog 23, 32–41.
(109) Karimi, M., Ghasemi, A., Sahandi Zangabad, P., Rahighi, R., Moosavi Basri, S. M.,
Mirshekari, H., Amiri, M., Shafaei Pishabad, Z., Aslani, A., Bozorgomid, M., Ghosh, D.,
Beyzavi, A., Vaseghi, A., Aref, A. R., Haghani, L., Bahrami, S., and Hamblin, M. R. (2016)
Smart micro/nanoparticles in stimulus-responsive drug/gene delivery systems. Chem. Soc. Rev.
45, 1457–1501.
(110) Giljohann, D. A. A., Seferos, D. S. S., Daniel, W. L. L., Massich, M. D. D., Patel, P. C. C.,
and Mirkin, C. A. A. (2010) Gold nanoparticles for biology and medicine. Angew. Chemie - Int.
Ed. 49, 3280–3294.
(111) Tsien, R. Y. (1998) The Green Fluorescent Protein. Annu. Rev. Biochem. 67, 509–544.
(112) Chalfie, M. (1995) Green Fluorescent Protein. Photochem. Photobiol. 62, 651–656.
(113) Shaner, N. C., Steinbach, P. A., and Tsien, R. Y. (2005) A guide to choosing fluorescent
proteins. Nat Methods 2, 905–909.
(114) Shaner, N. C., Campbell, R. E., Steinbach, P. A., Giepmans, B. N. G., Palmer, A. E., and
Tsien, R. Y. (2004) Improved monomeric red, orange and yellow fluorescent proteins derived
from Discosoma sp. red fluorescent protein. Nat Biotechnol 22, 1567–1572.
(115) Huang, J., Ying, L., Yang, X., Yang, Y., Quan, K., Wang, H., Xie, N., Ou, M., Zhou, Q.,
and Wang, K. (2015) Ratiometric Fluorescent Sensing of pH Values in Living Cells by Dual-
Fluorophore-Labeled i-Motif Nanoprobes. Anal. Chem. 87, 8724–8731.

135
(116) Buck, S. M., Lee Koo, Y.-E., Park, E., Xu, H., Philbert, M. A., Brasuel, M. A., Kopelman,
R., Renato Zenobi, by, and Regnier, F. (2004) Optochemical nanosensor PEBBLEs: photonic
explorers for bioanalysis with biologically localized embedding This review comes from a
themed section on Analytical techniques Edited. Curr. Opin. Chem. Biol. 8, 540–546.
(117) Zhang, Y., Chu, W., Foroushani, A. D., Wang, H., Li, D., Liu, J., Barrow, C. J., Wang, X.,
and Yang, W. (2014) New gold nanostructures for sensor applications: A review. Materials
(Basel). 7, 5169–5201.
(118) Bagalkot, V., Zhang, L., Levy-Nissenbaum, E., Jon, S., Kantoff, P. W., Langer, R., and
Farokhzad, O. C. (2007) Quantum dot-aptamer conjugates for synchronous cancer imaging,
therapy, and sensing of drug delivery based on bi-fluorescence resonance energy transfer. Nano
Lett 7, 3065–3070.
(119) Liang, H., Zhang, X.-B., Lv, Y., Gong, L., Wang, R., Zhu, X., Yang, R., and Tan, W.
(2014) Functional DNA-containing nanomaterials: cellular applications in biosensing, imaging,
and targeted therapy. Acc. Chem. Res. 47, 1891–901.
(120) Snyder, L. J. (2015) Eye of the beholder : Johannes Vermeer, Antoni van Leeuwenhoek,
and the reinvention of seeing. ISBN 978-0-393-07746-9
(121) Murphy, D. B., Oldfield, R., Schwartz, S., and Davidson, M. W. Introduction to Phase
Contrast Microscopy | MicroscopyU. NIKON.
(122) Combs, C. A. (2010) Fluorescence microscopy: a concise guide to current imaging
methods. Curr. Protoc. Neurosci. Chapter 2, Unit2.1.
(123) Rueden, C. T., Schindelin, J., Hiner, M. C., DeZonia, B. E., Walter, A. E., Arena, E. T.,
and Eliceiri, K. W. (2017) ImageJ2: ImageJ for the next generation of scientific image data.
BMC Bioinformatics 18, 529.
(124) Lengyel, J. S., Milne, J. L. S., and Subramaniam, S. (2008) Electron tomography in
nanoparticle imaging and analysis. Nanomedicine (Lond). 3, 125–31.
(125) Roederer, M. (2001) Spectral compensation for flow cytometry: Visualization artifacts,
limitations, and caveats. Cytometry 45, 194–205.
(126) Zhu, Z. J., Tang, R., Yeh, Y. C., Miranda, O. R., Rotello, V. M., and Vachet, R. W. (2012)
Determination of the Intracellular Stability of Gold Nanoparticle Monolayers Using Mass
Spectrometry. Anal. Chem. 84, 4321–4326.
(127) Tang, Y., Jiao, X., Liu, R., Wu, L., Wu, L., Hou, X., and Lv, Y. (2011) Inductively
coupled plasma mass spectrometry for determination of total urinary protein with CdTe quantum
dots label. J. Anal. At. Spectrom. 26, 2493.
(128) Fernández-Iglesias, N., and Bettmer, J. (2015) Complementary mass spectrometric

136
techniques for the quantification of the protein corona: a case study on gold nanoparticles and
human serum proteins. Nanoscale 7, 14324–31.
(129) Seferos, D. S., Giljohann, D. A., Hill, H. D., Prigodich, A. E., and Mirkin, C. A. (2007)
Nano-flares: probes for transfection and mRNA detection in living cells. J Am Chem Soc 129,
15477–15479.
(130) Breshike, C. J., Riskowski, R. A., and Strouse, G. F. (2013) Leaving Forster Resonance
Energy Transfer Behind: Nanometal Surface Energy Transfer Predicts the Size-Enhanced Energy
Coupling between a Metal Nanoparticle and an Emitting Dipole. J. Phys. Chem. C 117, 23942–
23949.
(131) Armstrong, R. E., Riskowski, R. A., and Strouse, G. F. (2015) Nanometal Surface Energy
Transfer Optical Ruler for Measuring a Human Telomere Structure. Photochem. Photobiol. 91,
732–738.
(132) Muroski, M. E., Carnevale, K. J. F., Riskowski, R. A., and Strouse, G. F. (2015) Plasmid
transfection in Mammalian cells spatiotemporally tracked by a gold nanoparticle. ACS Nano 9,
124–133.
(133) Cheng, Y., a, M. R., Brenda, A., L., T. A., and S., L. M. (2014) Multifunctional
nanoparticles for brain tumor imaging and therapy. Adv. Drug Deliv. Rev. 66, 42–57.
(134) Medarova, Z., Kumar, M., Ng, S. W., and Moore, A. (2009) Development and application
of a dual-purpose nanoparticle platform for delivery and imaging of siRNA in tumors. Methods
Mol Biol 555, 1–13.
(135) Cheon, J., and Lee, J. H. (2008) Synergistically integrated nanoparticles as multimodal
probes for nanobiotechnology. Acc. Chem. Res. 41, 1630–1640.
(136) de Puig, H., Cifuentes Rius, A., Flemister, D., Baxamusa, S. H., and Hamad-Schifferli, K.
(2013) Selective Light-Triggered Release of DNA from Gold Nanorods Switches Blood Clotting
On and Off. PLoS One (Antopolsky, M., Ed.) 8, e68511.
(137) Hong, R., Gang Han, Fernández, J. M., Kim, B., Forbes, N. S., and Rotello, V. M. (2006)
Glutathione-Mediated Delivery and Release Using Monolayer Protected Nanoparticle Carriers.
J. Am. Chem. Soc. 128, 1078–1079.
(138) Li, Z. (2002) Multiple thiol-anchor capped DNA-gold nanoparticle conjugates. Nucleic
Acids Res. 30, 1558–1562.
(139) Li, F., Zhang, H., Dever, B., Li, X.-F., and Le, X. C. (2013) Thermal Stability of DNA
Functionalized Gold Nanoparticles. Bioconjug. Chem. 24, 1790–1797.
(140) Carnevale, K. J. F., Riskowski, R. A., and Strouse, G. F. (2018) A Gold Nanoparticle Bio-
Optical Transponder to Dynamically Monitor Intracellular pH. ACS Nano 12 (6), 5956–5968.
(141) Li, D., Li, G., Guo, W., Li, P., Wang, E., and Wang, J. (2008) Glutathione-mediated

137
release of functional plasmid DNA from positively charged quantum dots. Biomaterials 29,
2776–2782.
(142) Mei, B. C., Oh, E., Susumu, K., Farrell, D., Mountziaris, T. J., and Mattoussi, H. (2009)
Effects of ligand coordination number and surface curvature on the stability of gold
nanoparticles in aqueous solutions. Langmuir 25, 10604–10611.
(143) Susumu, K., Oh, E., Delehanty, J. B., Blanco-Canosa, J. B., Johnson, B. J., Jain, V.,
Hervey, W. J., Algar, W. R., Boeneman, K., Dawson, P. E., and Medintz, I. L. (2011)
Multifunctional Compact Zwitterionic Ligands for Preparing Robust Biocompatible
Semiconductor Quantum Dots and Gold Nanoparticles. 133 (24), 9480–9496.
(144) Li, Z., Jin, R., Mirkin, C. A., and Letsinger, R. L. (2002) Multiple thiol-anchor capped
DNA-gold nanoparticle conjugates. Nucleic Acids Res. 30, 1558–62.
(145) Liu, C., Leng, W., and Vikesland, P. J. (2018) Controlled Evaluation of the Impacts of
Surface Coatings on Silver Nanoparticle Dissolution Rates. Environ. Sci. Technol. 52, 2726–
2734.
(146) Hinterwirth, H., Kappel, S., Waitz, T., Prohaska, T., Lindner, W., and Lämmerhofer, M.
(2013) Quantifying Thiol Ligand Density of Self-Assembled Monolayers on Gold Nanoparticles
by Inductively Coupled Plasma–Mass Spectrometry. ACS Nano 7, 1129–1136.
(147) Kogot, J. M. (2008) Surface Assembly and Intracellular Delivery of Biomolecule
Conjugated Nanomaterials.
(148) Cordelieres, F. P., and Bolte, S. JACoP v2.0: improving the user experience with co-
localization studies.
(149) van Steensel, B., Brink, M., van der Meulen, K., van Binnendijk, E. P., Wansink, D. G., de
Jong, L., de Kloet, E. R., and van Driel, R. (1995) Localization of the glucocorticoid receptor in
discrete clusters in the cell nucleus. J. Cell Sci. 108 ( Pt 9), 3003–11.
(150) Tang, D.-C., Jennelle, R. S., Shi, Z., Garver, R. I., Carbone, D. P., Loya, F., Chang, C.-H.,
and Curiel, D. T. (1997) Overexpression of Adenovirus-Encoded Transgenes from the
Cytomegalovirus Immediate Early Promoter in Irradiated Tumor Cells. Hum. Gene Ther. 8,
2117–2124.
(151) Manders, E. M. M., Verbeek, F. J., and Aten, J. A. (1993) Measurement of co‐localization
of objects in dual‐colour confocal images. J. Microsc. 169, 375–382.
(152) Bolte, S., and Cordelieres, F. P. (2006) A guided tour into subcellular colocalization
analysis in light microscopy. J. Microsc. 224, 213–232.
(153) Schindelin, J., Arganda-Carreras, I., Frise, E., Kaynig, V., Longair, M., Pietzsch, T.,
Preibisch, S., Rueden, C., Saalfeld, S., Schmid, B., Tinevez, J.-Y., White, D. J., Hartenstein, V.,
Eliceiri, K., Tomancak, P., and Cardona, A. (2012) Fiji: an open-source platform for biological-
image analysis. Nat. Methods 9, 676–682.

138
(154) Panikkanvalappil, S. R., Hira, S. M., and El-Sayed, M. A. (2016) Elucidation of ultraviolet
radiation-induced cell responses and intracellular biomolecular dynamics in mammalian cells
using surface-enhanced Raman spectroscopy. Chem. Sci. 7, 1133–1141.
(155) Zhang, K., Hao, L., Hurst, S. J., and Mirkin, C. A. (2012) Antibody-linked spherical
nucleic acids for cellular targeting. J. Am. Chem. Soc. 134, 16488–16491.
(156) Das, K., Sarkar, S., and Das, P. K. (2016) Fluorescent Indicator Displacement Assay:
Ultrasensitive Detection of Glutathione and Selective Cancer Cell Imaging. ACS Appl. Mater.
Interfaces 8, 25691–25701.
(157) Lin, X., Ivanov, A. P., and Edel, J. B. (2017) Selective single molecule nanopore sensing
of proteins using DNA aptamer-functionalised gold nanoparticles. Chem. Sci. 8, 3905–3912.
(158) Yun, C. S., Khitrov, G. A., Vergona, D. E., Reich, N. O., and Strouse, G. F. (2002)
Enzymatic manipulation of DNA-nanomaterial constructs. J. Am. Chem. Soc. 124, 7644–7645.
(159) Kapur, A., Aldeek, F., Ji, X., Safi, M., Wang, W., Del Cid, A., Steinbock, O., and
Mattoussi, H. (2017) Self-Assembled Gold Nanoparticle–Fluorescent Protein Conjugates as
Platforms for Sensing Thiolate Compounds via Modulation of Energy Transfer Quenching.
Bioconjug. Chem. 28, 678–687.
(160) Unak, G., Ozkaya, F., Ilker Medine, E., Kozgus, O., Sakarya, S., Bekis, R., Unak, P., and
Timur, S. (2011) Gold nanoparticle probes: Design and in vitro applications in cancer cell
culture. Colloids Surf., B 90, 217–226.
(161) Zheng, D., Seferos, D. S., Giljohann, D. A., Patel, P. C., and Mirkin, C. A. (2009) Aptamer
nano-flares for molecular detection in living cells. Nano Lett. 9, 3258–3261.
(162) Kim, J., Mohamed, M. A. A., Zagorovsky, K., and Chan, W. C. W. (2017) State of
diagnosing infectious pathogens using colloidal nanomaterials. Biomaterials 146, 97–114.
(163) Chompoosor, A., Saha, K., Ghosh, P. S., Macarthy, D. J., Miranda, O. R., Zhu, Z.-J.,
Arcaro, K. F., and Rotello, V. M. (2010) The Role of Surface Functionality on Acute
Cytotoxicity, ROS Generation and DNA Damage by Cationic Gold Nanoparticles. Small 6,
2246–2249.
(164) Tang, J., Ma, D., Pecic, S., Huang, C., Zheng, J., Li, J., and Yang, R. (2017) Noninvasive
and Highly Selective Monitoring of Intracellular Glucose via a Two-Step Recognition-Based
Nanokit. Anal. Chem. 89, 8319–8327.
(165) Han, G., Ghosh, P., and Rotello, V. M. (2007) Functionalized gold nanoparticles for drug
delivery. Nanomedicine (Lond) 2, 113–123.
(166) Sperling, R. A., Gil, P. R., Zhang, F., Zanella, M., and Parak, W. J. (2008) Biological
applications of gold nanoparticles. Chem. Soc. Rev. 37, 1896–1908.

139
(167) Pelaz, B., Alexiou, C., Alvarez-Puebla, R. A., Alves, F., Andrews, A. M., Ashraf, S.,
Balogh, L. P., Ballerini, L., Bestetti, A., Brendel, C., Bosi, S., Carril, M., Chan, W. C. W., Chen,
C., Chen, X., Chen, X., Cheng, Z., Cui, D., Du, J., Dullin, C., Escudero, A., Feliu, N., Gao, M.,
George, M., Gogotsi, Y., Grünweller, A., Gu, Z., Halas, N. J., Hampp, N., Hartmann, R. K.,
Hersam, M. C., Hunziker, P., Jian, J., Jiang, X., Jungebluth, P., Kadhiresan, P., Kataoka, K.,
Khademhosseini, A., Kopeček, J., Kotov, N. A., Krug, H. F., Lee, D. S., Lehr, C.-M., Leong, K.
W., Liang, X.-J., Ling Lim, M., Liz-Marzán, L. M., Ma, X., Macchiarini, P., Meng, H.,
Möhwald, H., Mulvaney, P., Nel, A. E., Nie, S., Nordlander, P., Okano, T., Oliveira, J., Park, T.
H., Penner, R. M., Prato, M., Puntes, V., Rotello, V. M., Samarakoon, A., Schaak, R. E., Shen,
Y., Sjöqvist, S., Skirtach, A. G., Soliman, M. G., Stevens, M. M., Sung, H.-W., Tang, B. Z.,
Tietze, R., Udugama, B. N., VanEpps, J. S., Weil, T., Weiss, P. S., Willner, I., Wu, Y., Yang, L.,
Yue, Z., Zhang, Q., Zhang, Q., Zhang, X.-E., Zhao, Y., Zhou, X., and Parak, W. J. (2017)
Diverse Applications of Nanomedicine. ACS Nano 11, 2313–2381.
(168) Yang, J. A., Lohse, S. E., and Murphy, C. J. (2014) Tuning cellular response to
nanoparticles via surface chemistry and aggregation. Small 10, 1642–1651.
(169) Kim, C. S., Li, X., Jiang, Y., Yan, B., Tonga, G. Y., Ray, M., Solfiell, D. J., and Rotello,
V. M. (2015) Cellular imaging of endosome entrapped small gold nanoparticles. MethodsX 2,
306–315.
(170) Saha, K., Agasti, S. S., Kim, C., Li, X., and Rotello, V. M. (2012) Gold nanoparticles in
chemical and biological sensing. Chem Rev 112, 2739–2779.
(171) Verderio, P., Avvakumova, S., Alessio, G., Bellini, M., Colombo, M., Galbiati, E.,
Mazzucchelli, S., Avila, J. P., Santini, B., and Prosperi, D. (2014) Delivering Colloidal
Nanoparticles to Mammalian Cells: A Nano-Bio Interface Perspective. Adv. Healthc. Mater. 3,
957–976.
(172) Akinc, A., Thomas, M., Klibanov, A. M., and Langer, R. (2005) Exploring
polyethylenimine-mediated DNA transfection and the proton sponge hypothesis. J. Gene Med. 7,
657–663.
(173) Singh, M. P., Jennings, T. L., and Strouse, G. F. (2009) Tracking spatial disorder in an
optical ruler by time-resolved NSET. J. Phys. Chem. B 113, 552–558.
(174) Zheng, F.-F., Zhang, P.-H., Xi, Y., Chen, J.-J., Li, L.-L., and Zhu, J.-J. (2015)
Aptamer/Graphene Quantum Dots Nanocomposite Capped Fluorescent Mesoporous Silica
Nanoparticles for Intracellular Drug Delivery and Real-Time Monitoring of Drug Release. Anal.
Chem. 87, 11739–11745.
(175) Wu, S. Q., Li, Z., Han, J. H., and Han, S. F. (2011) Dual colored mesoporous silica
nanoparticles with pH activable rhodamine-lactam for ratiometric sensing of lysosomal acidity.
Chem. Commun. 47, 11276–11278.
(176) Rosenholm, J. M., Sahlgren, C., and Lindén, M. (2010) Towards multifunctional, targeted

140
drug delivery systems using mesoporous silica nanoparticles – opportunities & challenges.
Nanoscale 2, 1870.
(177) Park, C., Oh, K., Lee, S. C., and Kim, C. (2007) Controlled Release of Guest Molecules
from Mesoporous Silica Particles Based on a pH-Responsive Polypseudorotaxane Motif. Angew.
Chemie Int. Ed. 46, 1455–1457.
(178) Snee, P. T., Somers, R. C., Nair, G., Zimmer, J. P., Bawendi, M. G., and Nocera, D. G.
(2006) A ratiometric CdSe/ZnS nanocrystal pH sensor. J. Am. Chem. Soc. 128, 13320–13321.
(179) Somers, R. C., Lanning, R. M., Snee, P. T., Greytak, A. B., Jain, R. K., Bawendi, M. G.,
and Nocera, D. G. (2012) A nanocrystal-based ratiometric pH sensor for natural pH ranges.
Chem. Sci. 3, 2980.
(180) Bao, Y., De Keersmaecker, H., Corneillie, S., Yu, F., Mizuno, H., Zhang, G., Hofkens, J.,
Mendrek, B., Kowalczuk, A., and Smet, M. (2015) Tunable Ratiometric Fluorescence Sensing of
Intracellular pH by Aggregation-Induced Emission-Active Hyperbranched Polymer
Nanoparticles. Chem. Mater. 27, 3450–3455.
(181) Benjaminsen, R. V, Sun, H., Henriksen, J. R., Christensen, N. M., Almdal, K., and
Andresen, T. L. (2011) Evaluating nanoparticle sensor design for intracellular pH measurements,
in ACS Nano, pp 5864–5873.
(182) Näreoja, T., Deguchi, T., Christ, S., Peltomaa, R., Prabhakar, N., Fazeli, E., Perälä, N.,
Rosenholm, J. M., Arppe, R., Soukka, T., and Schäferling, M. (2017) Ratiometric Sensing and
Imaging of Intracellular pH Using Polyethylenimine-Coated Photon Upconversion Nanoprobes.
Anal. Chem. 89, 1501–1508.
(183) Wang, N., Yu, X., Zhang, K., Mirkin, C. A., and Li, J. (2017) Upconversion Nanoprobes
for the Ratiometric Luminescent Sensing of Nitric Oxide. J. Am. Chem. Soc. 139, 12354–12357.
(184) Li, C., Zuo, J., Zhang, L., Chang, Y., Zhang, Y., Tu, L., Liu, X., Xue, B., Li, Q., Zhao, H.,
Zhang, H., and Kong, X. (2016) Accurate Quantitative Sensing of Intracellular pH based on Self-
ratiometric Upconversion Luminescent Nanoprobe. Sci. Rep. 6, 38617.
(185) Wang, C., Du, Y., Wu, Q., Xuan, S., Zhou, J., Song, J., Shao, F., and Duan, H. (2013)
Stimuli-responsive plasmonic core–satellite assemblies: i-motif DNA linker enabled intracellular
pH sensing. Chem. Commun. 49, 5739.
(186) Barnaby, S. N., Perelman, G. A., Kohlstedt, K. L., Chinen, A. B., Schatz, G. C., and
Mirkin, C. A. (2016) Design Considerations for RNA Spherical Nucleic Acids (SNAs).
Bioconjug. Chem. 27, 2124–2131.
(187) Libutti, S. K., Paciotti, G. F., Byrnes, A. A., Alexander, H. R., Gannon, W. E., Walker, M.,
Seidel, G. D., Yuldasheva, N., and Tamarkin, L. (2010) Phase I and pharmacokinetic studies of
CYT-6091, a novel PEGylated colloidal gold-rhTNF nanomedicine. Clin. Cancer Res. 16, 6139–
6149.

141
(188) Danehy, J. P., and Parameswaran, K. N. (1968) Acidic Dissociation Constants of Thiols. J.
Chem. Eng. Data 13, 386–389.
(189) Poole, L. B. (2015) The basics of thiols and cysteines in redox biology and chemistry. Free
Radic. Biol. Med.
(190) An, R., Jia, Y., Wan, B., Zhang, Y., Dong, P., Li, J., and Liang, X. (2014) Non-enzymatic
depurination of nucleic acids: Factors and mechanisms. PLoS One (Bhaumik, S. R., Ed.) 9,
e115950.
(191) Wu, X. A., Choi, C. H. J., Zhang, C., Hao, L., and Mirkin, C. A. (2014) Intracellular fate
of spherical nucleic acid nanoparticle conjugates. J. Am. Chem. Soc. 136 (21), 7726–7733.
(192) Nemati, H., Ghahramani, M.-H., Faridi-Majidi, R., Izadi, B., Bahrami, G., Madani, S.-H.,
and Tavoosidana, G. (2017) Using siRNA-based spherical nucleic acid nanoparticle conjugates
for gene regulation in psoriasis. J. Control. Release 268, 259–268.
(193) Kawakami, S., Higuchi, Y., and Hashida, M. (2008) Nonviral approaches for targeted
delivery of plasmid DNA and oligonucleotide. J. Pharm. Sci. 97, 726–745.
(194) Tokatlian, T., and Segura, T. (2010) siRNA applications in nanomedicine. Wiley
Interdiscip. Rev. Nanomedicine Nanobiotechnology 2, 305–315.
(195) Moschos, S. A., Williams, A. E., and Lindsay, M. A. (2007) Cell-penetrating-peptide-
mediated siRNA lung delivery. Biochem. Soc. Trans. 35, 807–810.
(196) Hofland, H. E. J., Shephard, L., Sullivan, S. M., and Baldeschwieler, J. D. (1996)
Formation of stable cationic lipid/DNA complexes for gene transfer. Med. Sci. 93, 7305–7309.
(197) Vijayanathan, V., Thomas, T., and Thomas, T. J. (2002) DNA nanoparticles and
development of DNA delivery vehicles for gene therapy. Biochemistry 41, 14085–14094.
(198) Shete, H. K., Prabhu, R. H., and Patravale, V. B. (2014) Endosomal Escape: A Bottleneck
in Intracellular Delivery. J. Nanosci. Nanotechnol. 14, 460–474.
(199) Modi, S., M. G., S., Goswami, D., Gupta, G. D., Mayor, S., Krishnan, Y., M, G. S.,
Goswami, D., Gupta, G. D., Mayor, S., Krishnan, Y., M G, S., Goswami, D., Gupta, G. D.,
Mayor, S., and Krishnan, Y. (2009) A DNA nanomachine that maps spatial and temporal pH
changes inside living cells. Nat. Nanotechnol. 4, 325–330.
(200) Søndergaard, R. V., Christensen, N. M., Henriksen, J. R., Kumar, E. K. P., Almdal, K., and
Andresen, T. L. (2015) Facing the design challenges of particle-based nanosensors for metabolite
quantification in living cells. Chem. Rev. 115, 8344–8378.
(201) Marcotte, N., and Brouwer, A. M. (2005) Carboxy SNARF-4F as a fluorescent pH probe
for ensemble and fluorescence correlation spectroscopies. J. Phys. Chem. B 109, 11819–11828.
(202) Dennis, A. M., Rhee, W. J., Sotto, D., Dublin, S. N., and Bao, G. (2012) Quantum Dot-

142
Fluorescent Protein FRET Probes for Sensing Intracellular pH. ACS Nano 6, 2917–2924.
(203) Ge, F. Y., and Chen, L. G. (2008) pH fluorescent probes: Chlorinated fluoresceins. J.
Fluoresc. 18, 741–747.
(204) Hayat, M. A. (1989) Colloidal gold : principles, methods, and applications. Academic
Press, New York.
(205) McIlvaine, T. C. (1921) A buffer solution for colorimetric comparison. J. Biol. Chem. 49,
183–186.
(206) Maclaurin, R. C. (1893) The dissolution of gold in a solution of potassium cyanide. J.
Chem. Soc. Trans. 63, 724–738.
(207) Conner, S. D., and Schmid, S. L. (2003) Regulated portals of enrty into the cell. Nature
422, 37–43.
(208) Maxfield, F. R., and Yamashiro, D. J. (1987) Endosome Acidification and the Pathways of
Receptor-Mediated Endocytosis. Adv. Exp. Med. Biol. 225, 189–98.
(209) Poteryaev, D., Datta, S., Ackema, K., Zerial, M., and Spang, A. (2010) Identification of the
switch in early-to-late endosome transition. Cell 141, 497–508.
(210) Rink, J., Ghigo, E., Kalaidzidis, Y., and Zerial, M. (2005) Rab Conversion as a Mechanism
of Progression from Early to Late Endosomes. Cell 122, 735–749.
(211) Hu, Y. B., Dammer, E. B., Ren, R. J., and Wang, G. (2015) The endosomal-lysosomal
system: From acidification and cargo sorting to neurodegeneration. Transl. Neurodegener. 4, 1–
10.
(212) Smith, S. A., and Pretorius, W. A. (2002) Spectrophotometric determination of pKa values
for fluorescein using activity coefficient corrections. Water SA 28, 395–402.
(213) Chompoosor, A., Han, G., and Rotello, V. M. (2008) Charge Dependence of Ligand
Release and Monolayer Stability of Gold Nanoparticles by Biogenic Thiols. Bioconjug. Chem.
19, 1342–1345.
(214) Cheng, R., Feng, F., Meng, F. H., Deng, C., Feijen, J., and Zhong, Z. Y. (2011)
Glutathione-responsive nano-vehicles as a promising platform for targeted intracellular drug and
gene delivery. J Control Release 152, 2–12.
(215) Richard, I., Thibault, M., De Crescenzo, G., Buschmann, M. D., and Lavertu, M. (2013)
Ionization behavior of chitosan and chitosan-DNA polyplexes indicate that chitosan has a similar
capability to induce a proton-sponge effect as PEI. Biomacromolecules 14, 1732–1740.
(216) Padari, K., Säälik, P., Hansen, M., Koppel, K., Raid, R., Langel, Ü., and Pooga, M. (2005)

143
Cell transduction pathways of transportans. Bioconjug. Chem. 16, 1399–1410.
(217) Resch-Genger, U., Grabolle, M., Cavaliere-Jaricot, S., Nitschke, R., and Nann, T. (2008)
Quantum dots versus organic dyes as fluorescent labels. Nat Methods 5, 763–775.
(218) Benjaminsen, R. V, Mattebjerg, M. A., Henriksen, J. R., Moghimi, S. M., and Andresen, T.
L. (2013) The possible "proton sponge " effect of polyethylenimine (PEI) does not include
change in lysosomal pH. Mol. Ther. 21, 149–157.
(219) Caruso, F., Hyeon, T., and Rotello, V. M. (2012) Nanomedicine. Chem Soc Rev 41, 2537–
2538.
(220) Siegel, R. L., Miller, K. D., and Jemal, A. (2016) Cancer statistics, 2016. CA. Cancer J.
Clin. 66, 7–30.
(221) Ma, X., Yafeng, L., Jia, L., Donghai, W., Qibing, H., Xinyu, W., Gang, L., Shujun, X., and
Xingang, L. (2009) Survival analysis of 205 patients with glioblastoma multiforme: clinical
characteristics, treatment and prognosis in China. J. Clin. Neurosci. 16, 1595–1598.
(222) Pichlmeier, U., Andrea, B., Gabriele, S., and Walter, S. (2008) Resection and survival in
glioblastoma multiforme: an RTOG recursive partitioning analysis of ALA study patients.
Neuro. Oncol. 10, 1025–1034.
(223) R, M. H. R. & C. (2008) Resistance to Chemotherapy in Cancer: A Complex and
Integrated Cellular Response. Pharmacology 81, 275–300.
(224) C, R. M. & M. (2013) Molecular aspects of cancer cell resistance to chemotherapy.
Biochem. Pharmacol. 85, 1219–1226.
(225) Farrell, A. (2011) A close look at cancer. Nat. Med. 17, 262–265.
(226) Bondy, M. L., E., S. M., Beatrice, M., and Barnhol. (2008) Brain tumor epidemiology:
consensus from the Brain Tumor Epidemiology Consortium. Cancer 113, 1953–1968.
(227) Fisher, J., Schwartzbaum, J., Wrensch, M., and Wiemels, J. L. (2007) Epidemiology of
Brain Tumors. Neurol. Clincs 25, 867–890.
(228) Beier, D., Peter, H., Martin, P., Annette, L., rg, W. J., J., O. P., Ludwig, A., Alexander, B.,
Ulrich, B., and P., B. C. (2007) CD133+ and CD133- glioblastoma-derived cancer stem cells
show differential growth characteristics and molecular profiles. Cancer Res. 67, 4010–4015.
(229) Persano, L., Elena, R., Giuseppe, B., and Giampietro, V. (2013) Glioblastoma cancer stem
cells: Role of the microenvironment and therapeutic targeting. Biochem. Pharmacol. 85, 612–
622.
(230) Zahreddine, H., and Borden, K. L. B. (2013) Mechanisms and insights into drug resistance
in cancer. Front. Pharmacol. 14, 28.

144
(231) Gottesman, M. M., Fojo, T., and Bates, S. E. (2002) Multidrug Resistance in Cancer: Role
of ATP-Dependent Transporters. Nat. Rev. Cancer 2, 48–58.
(232) Dean, M., Tito, F., and Susan, B. (2005) Tumour stem cells and drug resistance. Nat. Rev.
Cancer 5, 275–284.
(233) Haar, C. P., Hebbar, P., Wallace, G. C. th, Das, A., Vandergrift W. A., 3rd, Smith, J. A.,
Giglio, P., Patel, S. J., Ray, S. K., and Banik, N. L. (2012) Drug resistance in glioblastoma: a
mini review. Neurochem Res 37, 1192–1200.
(234) Kasala, D., Yoon, A.-R., Hong, J., Kim, S. W., and Yun, C.-O. (2016) Evolving lessons on
nanomaterial-coated viral vectors for local and systemic gene therapy. Nanomedicine (Lond). 11,
1689–713.
(235) Wold, W. S. M., and Toth, K. (2013) Adenovirus vectors for gene therapy, vaccination and
cancer gene therapy. Curr. Gene Ther. 13, 421–33.
(236) Chugh, A., Eudes, F., and Shim, Y. S. (2010) Cell-penetrating peptides: Nanocarrier for
macromolecule delivery in living cells. IUBMB Life 62, 183–193.
(237) Margus, H., Padari, K., and Pooga, M. (2012) Cell-penetrating peptides as versatile
vehicles for oligonucleotide delivery. Mol Ther 20, 525–533.
(238) Moschos, S. A., Jones, S. W., Perry, M. M., Williams, A. E., Erjefalt, J. S., Turner, J. J.,
Barnes, P. J., Sproat, B. S., Gait, M. J., and Lindsay, M. A. (2007) Lung delivery studies using
siRNA conjugated to TAT(48-60) and penetratin reveal peptide induced reduction in gene
expression and induction of innate immunity. Bioconjug Chem 18, 1450–1459.
(239) Rahmat, D., Khan, M. I., Shahnaz, G., Sakloetsakun, D., Perera, G., and Bernkop-
Schnurch, A. (2012) Synergistic effects of conjugating cell penetrating peptides and thiomers on
non-viral transfection efficiency. Biomaterials 33, 2321–2326.
(240) Lee, J. Y., Choi, Y. S., Suh, J. S., Kwon, Y. M., Yang, V. C., Lee, S. J., Chung, C. P., and
Park, Y. J. (2011) Cell-penetrating chitosan/doxorubicin/TAT conjugates for efficient cancer
therapy. Int J Cancer 128, 2470–2480.
(241) Gupta, A., Moyano, D. F., Parnsubsakul, A., Papadopoulos, A., Wang, L. S., Landis, R. F.,
Das, R., and Rotello, V. M. (2016) Ultrastable and Biofunctionalizable Gold Nanoparticles. ACS
Appl. Mater. Interfaces 8, 14096–14101.
(242) Chen, B., Liu, Q., Zhang, Y., Xu, L., and Fang, X. (2008) Transmembrane delivery of the
cell-penetrating peptide conjugated semiconductor quantum dots. Langmuir 24, 11866–11871.
(243) Fonseca S. B., P. M. P. & K. S. O., Fonseca, S. B., Pereira, M. P., and Kelley, S. O. (2009)
Recent advances in the use of cell-penetrating peptides for medical and biological applications.
Adv. Drug Deliv. Rev. 61, 953–964.
(244) Chen, N. T., Cheng, S. H., Liu, C. P., Souris, J. S., Chen, C. T., Mou, C. Y., and Lo, L. W.

145
(2012) Recent Advances in Nanoparticle-Based Forster Resonance Energy Transfer for
Biosensing, Molecular Imaging and Drug Release Profiling. Int. J. Mol. Sci. 13, 16598–16623.
(245) Ezzat, K., Zaghloul, E. M., El Andaloussi, S., Lehto, T., El-Sayed, R., Magdy, T., Smith,
C. I., and Langel, U. (2012) Solid formulation of cell-penetrating peptide nanocomplexes with
siRNA and their stability in simulated gastric conditions. J. Control. Release 162, 1–8.
(246) Copolovici, D. M., Langel, K., Eriste, E., and Langel, Ü. (2014) Cell-penetrating peptides:
Design, synthesis, and applications. ACS Nano 8, 1972–1994.
(247) Kenworthy, R., Bosco, D. B., DeLigio, J. T., and Zorio, D. A. R. (2018) Micro-RNA149
confers taxane resistance to malignant mesothelioma cells via regulation of P-glycoprotein
expression. Cancer Biol. Ther. 19, 181–187.
(248) Liu, B. R., Huang, Y. W., Chiang, H. J., and Lee, H. J. (2010) Cell-penetrating peptide-
functionalized quantum dots for intracellular delivery. J Nanosci Nanotechnol 10, 7897–7905.
(249) Cheng, Y., Dai, Q., Morshed, R. A., Fan, X., Wegscheid, M. L., Wainwright, D. A., Han,
Y. Y., Zhang, L., Auffinger, B., Tobias, A. L., Rincón, E., Thaci, B., Ahmed, A. U., Warnke, P.
C., He, C., and Lesniak, M. S. (2014) Blood-Brain Barrier Permeable Gold Nanoparticles: An
Efficient Delivery Platform for Enhanced Malignant Glioma Therapy and Imaging. Small 10,
5137–5150.
(250) Keller, A. A., Mussbach, F., Breitling, R., Hemmerich, P., Schaefer, B., Lorkowski, S., and
Reissmann, S. (2013) Relationships between cargo, cell penetrating peptides and cell type for
uptake of non-covalent complexes into live cells. Pharmaceuticals 6, 184–203.
(251) Jobin, M. L., Blanchet, M., Henry, S., Chaignepain, S., Manigand, C., Castano, S.,
Lecomte, S., Burlina, F., Sagan, S., and Alves, I. D. (2015) The role of tryptophans on the
cellular uptake and membrane interaction of arginine-rich cell penetrating peptides. Biochim.
Biophys. Acta - Biomembr. 1848, 593–602.
(252) Milletti, F. (2012) Cell-penetrating peptides: classes, origin, and current landscape. Drug
Discov. Today 17, 850–860.
(253) Normand, N., van Leeuwen, H., and O’Hare, P. (2001) Particle formation by a conserved
domain of the herpes simplex virus protein VP22 facilitating protein and nucleic acid delivery. J.
Biol. Chem. 276, 15042–50.
(254) Zender, L., Kühnel, F., Köck, R., Manns, M., and Kubicka, S. (2002) VP22-mediated
intercellular transport of p53 in hepatoma cells in vitro and in vivo. Cancer Gene Ther. 9, 489–
96.
(255) Elliott, G., and O’Hare, P. (1997) Intercellular trafficking and protein delivery by a
herpesvirus structural protein. Cell 88, 223–233.
(256) Frankel, A. D., and Pabo, C. O. (1988) Cellular uptake of the tat protein from human
immunodeficiency virus. Cell 55, 1189–1193.
146
(257) Green, M., and Loewenstein, P. M. (1988) Autonomous functional domains of chemically
synthesized human immunodeficiency virus tat trans-activator protein. Cell 55, 1179–1188.
(258) Vives, E., Brodin, P., and Lebleu, B. (1997) A truncated HIV-1 Tat protein basic domain
rapidly translocates through the plasma membrane and accumulates in the cell nucleus. J. Biol.
Chem. 272, 16010–16017.
(259) Morris, M. C., Vidal, P., Chaloin, L., Heotz, F., and Divita, G. (1997) A new peptide
vector for efficient delivery of oligonucleotide into nontransformed mammalian cells. Nucleic
Acid Res. 25, 2730–2736.
(260) Wybranietz, W. A., Prinz, F., Spiegel, M., Schenk, A., Bitzer, M., Gregor, M., and Lauer,
U. M. (1999) Quantification of VP22-GFP spread by direct fluorescence in 15 commonly used
cell lines. J. Gene Med. 1, 265–274.
(261) Murakami, T., and Freed, E. O. (2000) The long cytoplasmic tail of gp41 is required in a
cell type-dependent manner for HIV-1 envelope glycoprotein incorporation into virions. Proc.
Natl. Acad. Sci. U. S. A. 97, 343–8.
(262) Falanga, A., Galdiero, M., and Galdiero, S. (2015) Membranotropic Cell Penetrating
Peptides: The Outstanding Journey. Int. J. Mol. Sci. Int. J. Mol. Sci 16, 25323–25337.
(263) Walker, J. R., Corpina, R. A., and Goldberg, J. (2001) Structure of the Ku heterodimer
bound to DNA and its implications for double-strand break repair. Nature 412, 607–614.
(264) Gomez, J. A., Gama, V., Yoshida, T., Sun, W., Hayes, P., Leskov, K., Boothman, D., and
Matsuyama, S. (2007) Bax-inhibiting peptides derived from Ku70 and cell-penetrating
pentapeptides. Biochem. Soc. Trans. 35, 797–801.
(265) Krauss, U., Kratz, F., and Beck-Sickinger, A. G. (2003) Novel daunorubicin-carrier
peptide conjugates derived from human calcitonin segments. J. Mol. Recognit. 16, 280–287.
(266) Machova, Z., Muhle, C., Krauss, U., Trehin, R., Koch, A., Merkle, H. P., and Beck-
Sickinger, A. G. (2002) Cellular internalization of enhanced green fluorescent protein ligated to a
human calcitonin-based carrier peptide. Chembiochem 3, 672–677.
(267) Wagner, K., Van Mau, N., Boichot, S., Kajava, A. V, Krauss, U., Le Grimellec, C., Beck-
Sickinger, A., and Heitz, F. (2004) Interactions of the human calcitonin fragment 9-32 with
phospholipids: a monolayer study. Biophys. J. 87, 386–395.
(268) Liu, X. Y., Timmons, S., Lin, Y. Z., and Hawiger, J. (1996) Identification of a functionally
important sequence in the cytoplasmic tail of integrin beta 3 by using cell-permeable peptide
analogs. Proc. Natl. Acad. Sci. U. S. A. 93, 11819–24.
(269) Bovi, P. D., Curatola, A. M., Kern, F. G., Greco, A., Ittmann, M., and Basilico, C. (1987)
An oncogene isolated by transfection of Kaposi’s sarcoma DNA encodes a growth factor that is a
member of the FGF family. Cell 50, 729–737.

147
(270) Ray, P. E., Al-Attar, A., Liu, X. H., Das, J. R., Tassi, E., and Wellstein, A. (2014)
Expression of a secreted fibroblast growth factor binding protein-1 (FGFBP1) in
Angioproliferative Kaposi Sarcoma. J. AIDS Clin. Res. 5, 309.
(271) Yang, N. J., and Hinner, M. J. (2015) Getting across the cell membrane: an overview for
small molecules, peptides, and proteins. Methods Mol. Biol. 1266, 29–53.
(272) Chakrabarti, A. C. (1994) Permeability of membranes to amino acids and modified amino
acids: mechanisms involved in translocation. Amino Acids 6, 213–29.
(273) Sawada, M., Hayes, P., and Matsuyama, S. (2003) Cytoprotective membrane-permeable
peptides designed from the Bax-binding domain of Ku70. Nat. Cell Biol. 5, 352–357.
(274) Marks, J. R., Placone, J., Hristova, K., and Wimley, W. C. (2011) Spontaneous membrane-
translocating peptides by orthogonal high-throughput screening. J. Am. Chem. Soc. 133, 8995–
9004.
(275) Kamaly, N., He, J. C., Ausiello, D. A., and Farokhzad, O. C. (2016) Nanomedicines for
renal disease: current status and future applications. Nat. Rev. Nephrol. 12, 738–753.
(276) Liang, X., Wang, H., Zhu, Y., Zhang, R., Cogger, V. C., Liu, X., Xu, Z. P., Grice, J. E.,
and Roberts, M. S. (2016) Short- and Long-Term Tracking of Anionic Ultrasmall Nanoparticles
in Kidney. ACS Nano 10, 387–395.
(277) Chithrani, B. D., and Chan, W. C. W. (2007) Elucidating the mechanism of cellular uptake
and removal of protein-coated gold nanoparticles of different sizes and shapes. Nano Lett. 7,
1542–1550.
(278) Oh, N., and Park, J. H. (2014) Surface chemistry of gold nanoparticles mediates their
exocytosis in macrophages. ACS Nano 8, 6232–6241.
(279) Dombu, C. Y., Kroubi, M., Zibouche, R., Matran, R., and Betbeder, D. (2010)
Characterization of endocytosis and exocytosis of cationic nanoparticles in airway epithelium
cells. Nanotechnology 21, 355102.
(280) Jiang, X., Röcker, C., Hafner, M., Brandholt, S., Dörlich, R. M., and Nienhaus, G. U.
(2010) Endo- and Exocytosis of Zwitterionic Quantum Dot Nanoparticles by Live HeLa Cells.
ACS Nano 4, 6787–6797.
(281) Lavie, Y., and Liscovitch, M. (2000) Changes in lipid and protein constituents of rafts and
caveolae in multidrug resistant cancer cells and their functional consequences. Glycoconj. J. 17,
253–259.
(282) Shen, Y., Maupetit, J., Derreumaux, P., and Tufféry, P. (2014) Improved PEP-FOLD
approach for peptide and miniprotein structure prediction. J. Chem. Theory Comput. 10, 4745–
4758.
(283) Manceur, A., Wu, A., and Audet, J. (2007) Flow cytometric screening of cell-penetrating

148
peptides for their uptake into embryonic and adult stem cells. Anal. Biochem. 364, 51–59.
(284) Shen, Z., Wu, A., and Chen, X. (2017) Iron Oxide Nanoparticle Based Contrast Agents for
Magnetic Resonance Imaging. Mol. Pharm. 14, 1352–1364.
(285) Dykman, L., and Khlebtsov, N. (2012) Gold nanoparticles in biomedical applications:
recent advances and perspectives. Chem Soc Rev 41, 2256–2282.
(286) Fratoddi, I., Venditti, I., Cametti, C., and Russo, M. V. (2015) How toxic are gold
nanoparticles? The state-of-the-art. Nano Res. 8 (6), 1771–1799.
(287) Salihov, S. V., Ivanenkov, Y. A., Krechetov, S. P., Veselov, M. S., Sviridenkova, N. V.,
Savchenko, A. G., Klyachko, N. L., Golovin, Y. I., Chufarova, N. V., Beloglazkina, E. K., and
Majouga, A. G. (2015) Recent advances in the synthesis of Fe3O4@AU core/shell nanoparticles.
J. Magn. Magn. Mater. 394, 173–178.
(288) Salado, J., Insausti, M., Lezama, L., Gil de Muro, I., Moros, M., Pelaz, B., Grazu, V., de la
Fuente, J. M., and Rojo, T. (2012) Functionalized Fe 3 O 4 @Au superparamagnetic
nanoparticles: in vitro bioactivity. Nanotechnology 23, 315102.
(289) Kedziorek, D. A., and Kraitchman, D. L. (2010) Superparamagnetic iron oxide labeling of
stem cells for MRI tracking and delivery in cardiovascular disease. Methods Mol Biol 660, 171–
183.
(290) Petosa, A. R., Jaisi, D. P., Quevedo, I. R., Elimelech, M., and Tufenkji, N. (2010)
Aggregation and Deposition of Engineered Nanomaterials in Aquatic Environments: Role of
Physicochemical Interactions. Environ. Sci. Technol. 44, 6532–6549.
(291) Schmidt, M. C., Rothen-Rutishauser, B., Rist, B., Beck-Sickinger, A., Wunderli-
Allenspach, H., Rubas, W., Sadée, W., and Merkle, H. P. (1998) Translocation of human
calcitonin in respiratory nasal epithelium is associated with self-assembly in lipid membrane.
Biochemistry 37, 16582–16590.
(292) Bechara, C., and Sagan, S. (2013) Cell-penetrating peptides: 20 years later, where do we
stand? FEBS Lett. 587(12), 1693-1702.
(293) Davey, W. P. (1925) Lattice Constants of Twelve Common Metals: Precision
Measurements of the Lattice Constants of Twelve Common Metals. Phys. Rev. 25, 753.
(294) Caruso, F., Caruso, R. A., and Mohwald, H. (1998) Nanoengineering of Inorganic and
Hybrid Hollow Spheres by Colloidal Templating. Science (80). 282, 1111–1114.
(295) Packer, L. (1998) alpha-Lipoic acid: a metabolic antioxidant which regulates NF-kappa B
signal transduction and protects against oxidative injury. Drug Metab Rev 30, 245–275.
(296) Minati, L., We, W. P., and Glarz, ˛. (2007) Physical Foundations, Models, and Methods of
Diffusion Magnetic Resonance Imaging of the Brain: A Review. Concepts Magn Reson Part A
Concepts Magn. Reson. Part A 30, 278–307.

149
(297) Krynicki, K. (1966) Proton spin-lattice relaxation in pure water between 0°C and 100°C.
Physica 32, 167–178.
(298) Sjoback, R., Nygren, J., and Kubista, M. (1995) Absorption and Fluorescence Properties of
Fluorescein. Spectrochim. Acta Part a-Molecular Biomol. Spectrosc. 51, L7–L21.
(299) Jose, J., and Burgess, K. (2006) Benzophenoxazine-based fluorescent dyes for labeling
biomolecules. Tetrahedron 62, 11021–11037.
(300) Martin, M. M., and Lindqvist, L. (1975) PH-DEPENDENCE OF FLUORESCEIN
FLUORESCENCE. J. Lumin. 10, 381–390.
(301) Li, F., Zhou, X., Zhou, H., Jia, J., Li, L., Zhai, S., and Yan, B. (2016) Reducing Both Pgp
Overexpression and Drug Efflux with Anti-Cancer Gold-Paclitaxel Nanoconjugates. PLoS One
(Santos, H. A., Ed.) 11, e0160042.

150
BIOGRAPHICAL SKETCH
Katelyn Jo Fredrickson [Carnevale] was born in Twenty-nine Palms, CA in 1988 and
attended high school in Jacksonville, FL from 2002-2006, graduating in the top 3 of her class
from Seacoast Christian Academy, with a 4.1 GPA due to weighted dual enrollment courses
taken at Florida State College at Jacksonville (FSCJ) . Kate got her Associates degree from FSCJ
in 2009, where she was presented with the “Outstanding Student in Chemistry” Award. Kate
went on to earn dual Bachelor degrees in Biology and Chemistry in 2012 from the University of
North Florida (UNF), in Jacksonville, FL, where she received her second “Outstanding Student
in Chemistry” Award. During her undergraduate career, Kate was worked as a Certified
Pharmacy Technician from 2008-2012. Kate also conducted undergraduate research in the
Chemistry Department at the UNF with Prof. Amy Lane, assaying and isolating novel antibiotic
compounds from marine fungi samples.
In August of 2012, Kate enrolled at Florida State University (FSU) in the Department of
Chemistry & Biochemistry in the Biochemistry Graduate program and joined the laboratory of
Prof. Geoffrey F. Strouse. She began working in the field of nano-biomedicine under the
mentorship of Megan Muroski (now Ph.D.). During her time in the Strouse research group, Kate
worked at synthesizing and bio-functionalizing nanomaterials for intracellular uptake and gene
delivery studies, and assessed nanomaterial behaviors within mammalian cells via optical
fluorescence microscopy imaging of emissive and SET nanomaterials, as well as quantification
of uptake of magnetic nanomaterials via MRI and SQUID analysis. She was awarded the Joseph
M. Schor Fellowship in Biochemistry in 2015 in recognition of her graduate work. Kate has also
presented her work at local, regional, and national meetings at: the FSU Life Sciences Research
Symposia (2013 & 2015 in Tallahassee, FL), the FSU Natural Sciences Graduate Research
Symposium (2014 in Tallahassee, FL), the Southeastern Regional Meeting of the American
Chemical Society (2015 in Memphis, TN & 2016 in Columbia, SC), and the National Meeting of
the American Chemical Society (2015 in Boston, MA & 2018 in New Orleans, LA). And her
work has been published in the Journal ACS Nano (2015 and 2018).
Kate has been involved in her scientific community as is a current member of the
American Chemical Society (ACS) since 2011, and the Association of Women in Science
(AWIS) since 2018. Kate was also the Founder and President of the FSU ChemiNole Graduate
Student Association (CGSA) from 2016-2017, and President of the FSU Graduate Women in

151
Science Student Organization (GWIS) from 2015-2016, as well as President of the UNF Student
Chapter of American Chemical Society (ACS) from 2011-2012.
Kate has also served the Department of Chemistry & Biochemistry as the Chair of the
Graduate Student Recruitment Committee (2015-2017) and Department Representative for the
FSU Program for Instructional Excellence (PIE) (2015-2016), along with her many years as a
Graduate Teaching Assistant for General Chemistry, Organic Chemistry, and Biochemistry
(2012-2018).
Kate is also very active in her faith community as a Sunday School Teacher, Children’s
Ministry Facilitator, and Adult Small Group Leader (2008-2018). And has participated in events
to benefit several local charities that serve single mothers (Making Miracles Group Home), and
low-income families (Habitat for Humanity), as well as abandoned and abused animals
(Jacksonville No More Homeless Pets). Kate also supports several national and international
charities that serve the needs of orphans and children in poverty (Convoy of Hope, Stella’s
House, One Child Matters, and Compassion International).