fluorescence probing of albumin–surfactant interaction
TRANSCRIPT
ate (SDS),ee broadt binding toce of anies indicate
l to BSA.and energynts. Thetegories of
Journal of Colloid and Interface Science 285 (2005) 562–573www.elsevier.com/locate/jcis
Fluorescence probing of albumin–surfactant interaction
Swati De∗, Agnishwar Girigoswami, Susmita Das
Department of Chemistry, University of Kalyani, Kalyani 741235, India
Received 17 May 2004; accepted 1 December 2004
Available online 2 March 2005
Abstract
Protein–surfactant interactions were studied using bovine serum albumin (BSA) and the three surfactants sodium dodecyl sulfcetyltrimethylammonium bromide (CTAB), and poly(oxyethylene)isooctyl phenyl ether (TX-100). The surfactants used belong to thrclasses, i.e., anionic, cationic, and nonionic. These categories of surfactants were used to elucidate the mechanism of surfactanBSA, at pH 7. The interactions were followed fluorimetrically using both intrinsic tryptophan (Trp) fluorescence and the fluorescenexternal label. The aggregation behavior of the surfactants were studied in the presence of BSA. Steady-state fluorescence studthat all three surfactants bind to BSA in a cooperative manner. This cooperative binding affects the binding of the external labeAll these effects are also manifested in time-resolved fluorescence studies. The effects of surfactants on acrylamide quenchingtransfer from Trp in BSA to bound dye provided valuable insights into the structural modification of BSA in presence of surfactasurfactant-induced conformational change of BSA was also confirmed by circular dichroism studies. However, among the three casurfactants, the nonionic surfactant shows the least interaction with BSA. 2004 Elsevier Inc. All rights reserved.
uenc
ntsal-
in,the
itesforand
ro-w-
usedteintein
in-ter--ep-ntantbed
tryce
Totioneen
enres-l foree of
Keywords:Protein; Surfactant; Cooperative binding; Energy transfer; Q
1. Introduction
This study probes the interaction of common surfactawith the protein bovine serum albumin (BSA). Serumbumins are transport proteins found in blood plasma[1,2].They can bind a wide variety of ligands, e.g., bilirubfatty acids, hematin, and drugs, to name a few. Thus,main function of serum albumin is to transport metabolin blood. BSA is one protein that is commonly usedresearch purposes due to its stability, water solubility,versatile binding capacity[1].
The study of specific and nonspecific interactions of pteins with surfactants is fundamental both from the viepoint of understanding and application. Surfactants areto extract proteins from cell membranes. Surfactant–prointeractions are comparable to some extent to lipid–prointeractions in the membranes of living cells[3,4] and canaccount for the transport of metabolites in body fluids[1–3].
* Corresponding author. Fax : +91-33-25828282.E-mail address:[email protected](S. De).
0021-9797/$ – see front matter 2004 Elsevier Inc. All rights reserved.doi:10.1016/j.jcis.2004.12.022
hing
Technical applications of surfactant–protein interactionclude drug delivery, cosmetic preparation, and often degent action[5]. One important application is in the SDSPAGE electrophoresis technique to determine the polyptide composition of proteins[6]. This study was undertakeagainst this backdrop of the literature on protein–surfacinteractions. Surfactant binding to proteins has been proin the past mainly by dialysis and titration calorime[7–12]. Only a few workers have employed fluorescenmethods to monitor protein–surfactant interactions[13–19].But most of the earlier work involved anionic surfactants.our knowledge, there are very few reports where interacof a protein with cationic and nonionic surfactants has bstudied in detail by spectroscopic methods.
In this work protein–surfactant interactions have bestudied mainly by the fluorescence method. The fluocence probe method has emerged as an important toobiomembrane research. Its advantages are its high degr
sensitivity and low degree of membrane perturbation. Thefluorescence probe ANS (1-anilino-8-naphthalene sulfonate)is most usually used in biomembrane research[20–29].
nd In
ce iac-tes.lso
cee ore-deneu-S tolly
d byeened b
sul-sur-0),o-re-ou-
and
h a) in-600d ana-n-
er. Tw
xci-be-.liedtheand
lapre
vel-
teinof
sur-y be-uslyNSbyin-
ant
r
ssase
oras
eak
tive,-NSthetionc-tioner-
gose-cu ets-ined
y-andgh
ffer,
er,AC
fer.reins,
behis,
S. De et al. / Journal of Colloid a
Here, ANS has been used as an extrinsic fluorophore (sinbinds noncovalently to many proteins) to study how surftant binding to the protein can alter the probe binding siThe intrinsic tryptophan (Trp) fluorescence of BSA has abeen monitored.
It is well known that ANS exhibits a large fluorescenenhancement on binding to proteins either in the nativdenatured form[13,14,20–29]. The fluorescence enhancment can be explained on the basis of the polarity-depenTICT concept[26–29]. When ANS molecules bind to thnonpolar interior of proteins, TICT is hindered and thus florescence enhancement is observed. The binding of ANBSA in presence of surfactants is explored fluorimetricaso as to detect structural alterations in the protein inducesurfactants. Both ionic and nonionic surfactants have bused. The fluorescence studies have been complementcircular dichroism studies.
2. Experimental section
Bovine serum albumin and 8-anilino-1-naphthalenefonate obtained from Fluka were used as received. Thefactants poly(oxyethylene)isooctyl phenyl ether (TX-10cetyltrimethylammonium bromide (CTAB), and sodium ddecyl sulfate (SDS) obtained from Aldrich were used asceived. Urea was purchased from E. Merck, Germany. Dbly distilled water was used for all these experimentsphosphate buffer was used to maintain the pH at 7.
The UV–vis absorption spectra were measured witShimadzu UV2401 PC spectrophotometer (Kyoto, Japana 1-cm quartz cuvette. CD was measured with a Jasco Jspectropolarimeter in a 1-cm cuvette (250–320 nm) an0.1-cm cuvette (200–250 nm). The CD spectra were alyzed by the curve-fitting method based on the work of Adrade et al.[30]. A Perkin–Elmer LS 50B spectrofluorimetwas used to record the steady-state fluorescence spectraexcitation wavelengths were used—295 nm for direct etation of Trp and 355 nm for direct excitation of the proANS. Absolute quantum yields (φf ) were determined using quinine sulfate in 0.5 M H2SO4 (φf = 0.5) as standardFor lifetime measurements, a pulsed nitrogen lamp (AppPhotophysics), pulse width 1.5 ns, was used to excitesolutions. The fluorescence decays were deconvolutedfit using standard software to obtain lifetimes. The overintegral for the ANS–BSA system in various media wedetermined by numerical integration using a program deoped by us.
3. Results and discussion
3.1. Aggregation of surfactants in presence of BSA
Before venturing into a detailed study of surfactant–protein interactions, it was worthwhile to note how the mi-
terface Science 285 (2005) 562–573 563
t
t
y
o
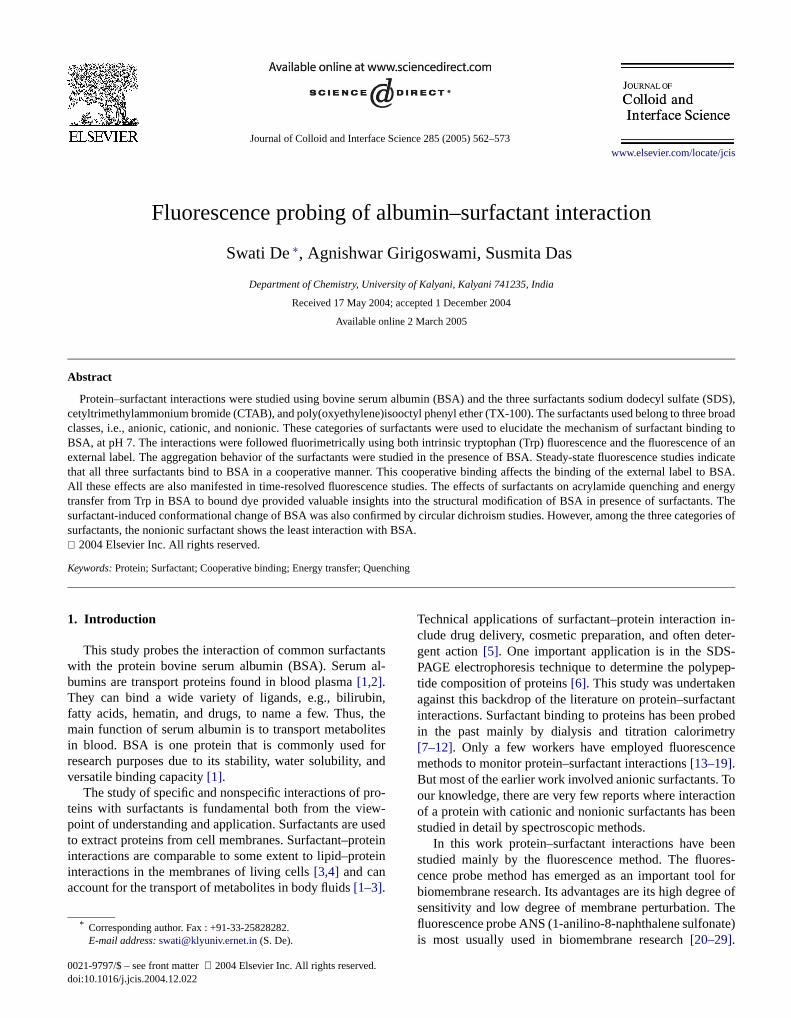
cellization of the surfactants was affected by the proBSA. In the presence of 30 µM protein, fluorescence20 µM ANS decreases with increasing concentration offactant. The decrease of ANS fluorescence occurs mainlcause surfactant binding to the protein dislodges previobound ANS from the protein surface. These dislodged Amolecules now reside within the micellar clusters formedsurfactant molecules bound to protein. Previous literaturedicates formation of such micelle-like clusters of surfactmolecules in the presence of protein[31–33]. Fluorescencequantum yield (φf ) of ANS bound to BSA is much highe(0.7) than that in micelles (0.2). Thusφf of protein-boundANS decreases in the presence of surfactant, sinceφf ofANS residing within the micelle-like clusters is much lethanφf of ANS bound to protein. The fluorescence decreis similar for the ionic surfactants SDS and CTAB (Figs. 1aand 1b). Griffiths et al.[34] obtained a similar decrease fthe ANS/gelatin/SDS system at high [SDS] values. It wfound in this study that in the presence of protein, the brpoint in a semilog plot ofI f versus [surf] (Figs. 1a–1c)occurs at concentrations very different from the respecCMCs of the three surfactants[15,31]. The values are 0.60.4, and 0.2 mM (Fig. 1) for SDS, CTAB, and TX-100 respectively.Fig. 1 shows the fluorescence decrease of Aas a function of the total surfactant concentration, notfree surfactant concentration. The threshold concentrarequired for the formation of micelle-like clusters of surfatant on the protein surface is called the critical aggregaconcentration (CAC), which for most surfactants is genally lower than the CMC[10]. The actual CAC values givinthe amount of bound surfactant may be lower than threported above, sinceFig. 1shows the variation of ANS fluorescence versus total surfactant concentration. Vasilesal. [32] obtained CAC at 1 mM total SDS for SDS/BSA sytem by the fluorescence method. However, CAC determby the fluorescence method can be overestimated[32] due tocontribution of ANS fluorescence coming from different hdrophobic domains, i.e., hydrophobic sites on proteinsthe hydrophobic cores of micelle-like aggregates. Althouthe CMC of surfactants is often largely decreased in bue.g., by a factor of 10 for SDS[32], here the CAC for CTABand TX-100 is not much lower than the CMC. Howevhere, too, the free concentration of surfactant at the Cwill be lowered due to the presence of ions from the bufThe CAC values obtained for SDS and CTAB in BSA aclose to the values obtained in presence of other protei.e., gelatin and lysozyme[10].
3.2. Surfactant binding to BSA—binding isotherms andScatchard analysis
The nature of the protein–surfactant interaction canwell understood in terms of the binding isotherms. For t
the intrinsic tryptophan (Trp) fluorescence (λex = 295 nm)has been monitored. The binding isotherms have been de-termined by plotting the average number of surfactant mole-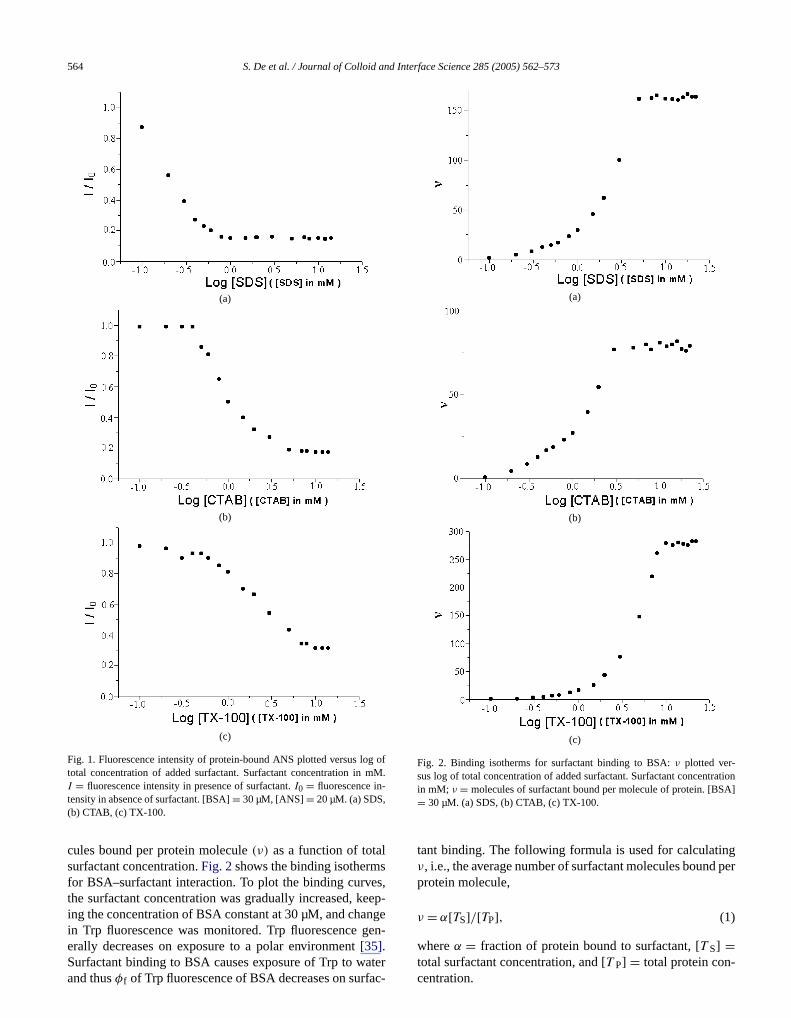
nd In
g ofmM.
lses,eepngeen-
ationA]
ngd per
564 S. De et al. / Journal of Colloid a
(a)
(b)
(c)
Fig. 1. Fluorescence intensity of protein-bound ANS plotted versus lototal concentration of added surfactant. Surfactant concentration inI = fluorescence intensity in presence of surfactant.I0 = fluorescence in-tensity in absence of surfactant. [BSA]= 30 µM, [ANS]= 20 µM. (a) SDS,(b) CTAB, (c) TX-100.
cules bound per protein molecule(ν) as a function of totasurfactant concentration.Fig. 2shows the binding isothermfor BSA–surfactant interaction. To plot the binding curvthe surfactant concentration was gradually increased, king the concentration of BSA constant at 30 µM, and chain Trp fluorescence was monitored. Trp fluorescence g
erally decreases on exposure to a polar environment[35].Surfactant binding to BSA causes exposure of Trp to waterand thusφf of Trp fluorescence of BSA decreases on surfac-terface Science 285 (2005) 562–573
-
(a)
(b)
(c)
Fig. 2. Binding isotherms for surfactant binding to BSA:ν plotted ver-sus log of total concentration of added surfactant. Surfactant concentrin mM; ν = molecules of surfactant bound per molecule of protein. [BS= 30 µM. (a) SDS, (b) CTAB, (c) TX-100.
tant binding. The following formula is used for calculatiν, i.e., the average number of surfactant molecules bounprotein molecule,
(1)ν = α[TS]/[TP],
whereα = fraction of protein bound to surfactant, [T S] =total surfactant concentration, and [T P] = total protein con-centration.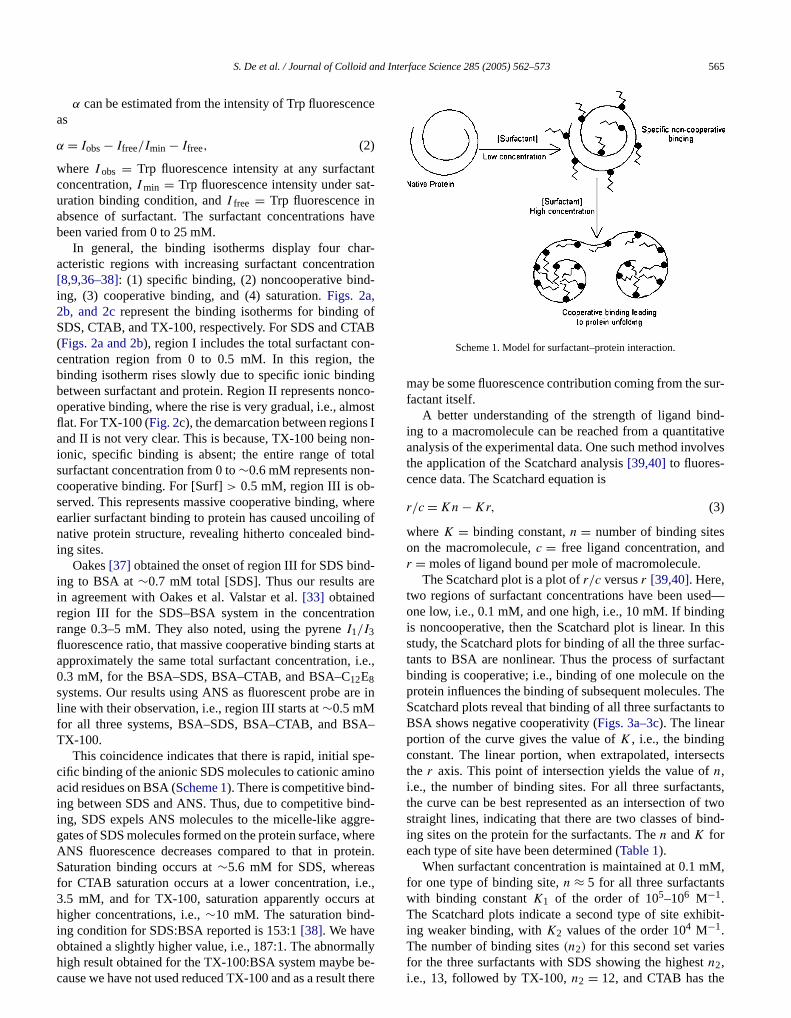
nd In
nce
ntt-
have
ar-tiond-
ofABn-hengncoosts Ion-tal-
hereg ofind-
d-re
ion
rts ai.e.,
re in
A–
pe-ino-ind-re-hereteins.e.,
at-
sur-
d-tivelves
d
ed—ngthisfac-tanttheThets to
ects
nts,f twoind-
M,s
ibit-
S. De et al. / Journal of Colloid a
α can be estimated from the intensity of Trp fluoresceas
(2)α = Iobs− Ifree/Imin − Ifree,
whereI obs = Trp fluorescence intensity at any surfactaconcentration,Imin = Trp fluorescence intensity under sauration binding condition, andI free = Trp fluorescence inabsence of surfactant. The surfactant concentrationsbeen varied from 0 to 25 mM.
In general, the binding isotherms display four chacteristic regions with increasing surfactant concentra[8,9,36–38]: (1) specific binding, (2) noncooperative bining, (3) cooperative binding, and (4) saturation.Figs. 2a,2b, and 2crepresent the binding isotherms for bindingSDS, CTAB, and TX-100, respectively. For SDS and CT(Figs. 2a and 2b), region I includes the total surfactant cocentration region from 0 to 0.5 mM. In this region, tbinding isotherm rises slowly due to specific ionic bindibetween surfactant and protein. Region II represents nooperative binding, where the rise is very gradual, i.e., almflat. For TX-100 (Fig. 2c), the demarcation between regionand II is not very clear. This is because, TX-100 being nionic, specific binding is absent; the entire range of tosurfactant concentration from 0 to∼0.6 mM represents noncooperative binding. For [Surf]> 0.5 mM, region III is ob-served. This represents massive cooperative binding, wearlier surfactant binding to protein has caused uncoilinnative protein structure, revealing hitherto concealed bing sites.
Oakes[37] obtained the onset of region III for SDS bining to BSA at∼0.7 mM total [SDS]. Thus our results ain agreement with Oakes et al. Valstar et al.[33] obtainedregion III for the SDS–BSA system in the concentratrange 0.3–5 mM. They also noted, using the pyreneI1/I3fluorescence ratio, that massive cooperative binding staapproximately the same total surfactant concentration,0.3 mM, for the BSA–SDS, BSA–CTAB, and BSA–C12E8systems. Our results using ANS as fluorescent probe aline with their observation, i.e., region III starts at∼0.5 mMfor all three systems, BSA–SDS, BSA–CTAB, and BSTX-100.
This coincidence indicates that there is rapid, initial scific binding of the anionic SDS molecules to cationic amacid residues on BSA (Scheme 1). There is competitive binding between SDS and ANS. Thus, due to competitive bing, SDS expels ANS molecules to the micelle-like agggates of SDS molecules formed on the protein surface, wANS fluorescence decreases compared to that in proSaturation binding occurs at∼5.6 mM for SDS, whereafor CTAB saturation occurs at a lower concentration, i3.5 mM, and for TX-100, saturation apparently occurshigher concentrations, i.e.,∼10 mM. The saturation binding condition for SDS:BSA reported is 153:1[38]. We have
obtained a slightly higher value, i.e., 187:1. The abnormallyhigh result obtained for the TX-100:BSA system maybe be-cause we have not used reduced TX-100 and as a result therterface Science 285 (2005) 562–573 565
-
t
.
Scheme 1. Model for surfactant–protein interaction.
may be some fluorescence contribution coming from thefactant itself.
A better understanding of the strength of ligand bining to a macromolecule can be reached from a quantitaanalysis of the experimental data. One such method invothe application of the Scatchard analysis[39,40] to fluores-cence data. The Scatchard equation is
(3)r/c = Kn − Kr,
whereK = binding constant,n = number of binding siteson the macromolecule,c = free ligand concentration, anr = moles of ligand bound per mole of macromolecule.
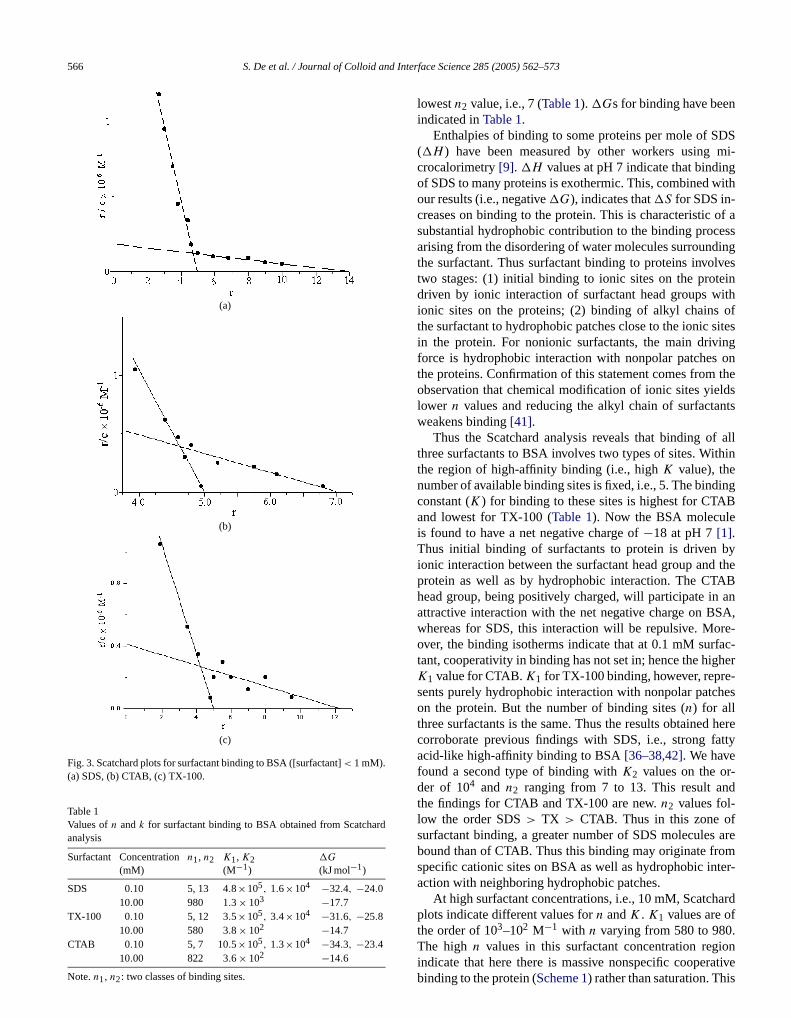
The Scatchard plot is a plot ofr/c versusr [39,40]. Here,two regions of surfactant concentrations have been usone low, i.e., 0.1 mM, and one high, i.e., 10 mM. If bindiis noncooperative, then the Scatchard plot is linear. Instudy, the Scatchard plots for binding of all the three surtants to BSA are nonlinear. Thus the process of surfacbinding is cooperative; i.e., binding of one molecule onprotein influences the binding of subsequent molecules.Scatchard plots reveal that binding of all three surfactanBSA shows negative cooperativity (Figs. 3a–3c). The linearportion of the curve gives the value ofK , i.e., the bindingconstant. The linear portion, when extrapolated, intersthe r axis. This point of intersection yields the value ofn,i.e., the number of binding sites. For all three surfactathe curve can be best represented as an intersection ostraight lines, indicating that there are two classes of bing sites on the protein for the surfactants. Then andK foreach type of site have been determined (Table 1).
When surfactant concentration is maintained at 0.1 mfor one type of binding site,n ≈ 5 for all three surfactantwith binding constantK1 of the order of 105–106 M−1.The Scatchard plots indicate a second type of site exhing weaker binding, withK2 values of the order 104 M−1.
e
The number of binding sites(n2) for this second set variesfor the three surfactants with SDS showing the highestn2,i.e., 13, followed by TX-100,n2 = 12, and CTAB has the
n
DSmi-gith
of aessing
lvesinithof
sitesingontheldsnts
f allhin
ingB
bythe
ABan
SA,re-ac-her-hes
heretty
-d
farem
ter-
ard
.
566 S. De et al. / Journal of Colloid and Interface Science 285 (2005) 562–573
(a)
(b)
(c)
Fig. 3. Scatchard plots for surfactant binding to BSA ([surfactant]< 1 mM).(a) SDS, (b) CTAB, (c) TX-100.
Table 1Values ofn andk for surfactant binding to BSA obtained from Scatchardanalysis
Surfactant Concentration(mM)
n1, n2 K1, K2(M−1)
�G
(kJ mol−1)
SDS 0.10 5, 13 4.8×10⁵, 1.6×10⁴ −32.4, −24.010.00 980 1.3× 10³ −17.7
TX-100 0.10 5, 12 3.5×10⁵, 3.4×10⁴ −31.6, −25.810.00 580 3.8× 10² −14.7
CTAB 0.10 5, 7 10.5×10⁵, 1.3×10⁴ −34.3, −23.4
lowestn2 value, i.e., 7 (Table 1). �Gs for binding have beeindicated inTable 1.
Enthalpies of binding to some proteins per mole of S(�H ) have been measured by other workers usingcrocalorimetry[9]. �H values at pH 7 indicate that bindinof SDS to many proteins is exothermic. This, combined wour results (i.e., negative�G), indicates that�S for SDS in-creases on binding to the protein. This is characteristicsubstantial hydrophobic contribution to the binding procarising from the disordering of water molecules surroundthe surfactant. Thus surfactant binding to proteins invotwo stages: (1) initial binding to ionic sites on the protedriven by ionic interaction of surfactant head groups wionic sites on the proteins; (2) binding of alkyl chainsthe surfactant to hydrophobic patches close to the ionicin the protein. For nonionic surfactants, the main drivforce is hydrophobic interaction with nonpolar patchesthe proteins. Confirmation of this statement comes fromobservation that chemical modification of ionic sites yielower n values and reducing the alkyl chain of surfactaweakens binding[41].
Thus the Scatchard analysis reveals that binding othree surfactants to BSA involves two types of sites. Witthe region of high-affinity binding (i.e., highK value), thenumber of available binding sites is fixed, i.e., 5. The bindconstant (K) for binding to these sites is highest for CTAand lowest for TX-100 (Table 1). Now the BSA moleculeis found to have a net negative charge of−18 at pH 7[1].Thus initial binding of surfactants to protein is drivenionic interaction between the surfactant head group andprotein as well as by hydrophobic interaction. The CThead group, being positively charged, will participate inattractive interaction with the net negative charge on Bwhereas for SDS, this interaction will be repulsive. Moover, the binding isotherms indicate that at 0.1 mM surftant, cooperativity in binding has not set in; hence the higK1 value for CTAB.K1 for TX-100 binding, however, represents purely hydrophobic interaction with nonpolar patcon the protein. But the number of binding sites (n) for allthree surfactants is the same. Thus the results obtainedcorroborate previous findings with SDS, i.e., strong faacid-like high-affinity binding to BSA[36–38,42]. We havefound a second type of binding withK2 values on the order of 104 and n2 ranging from 7 to 13. This result anthe findings for CTAB and TX-100 are new.n2 values fol-low the order SDS> TX > CTAB. Thus in this zone osurfactant binding, a greater number of SDS moleculesbound than of CTAB. Thus this binding may originate frospecific cationic sites on BSA as well as hydrophobic inaction with neighboring hydrophobic patches.
At high surfactant concentrations, i.e., 10 mM, Scatchplots indicate different values forn andK . K1 values are ofthe order of 103–102 M−1 with n varying from 580 to 980
10.00 822 3.6× 10² −14.6
Note.n1, n2: two classes of binding sites.
The high n values in this surfactant concentration regionindicate that here there is massive nonspecific cooperativebinding to the protein (Scheme 1) rather than saturation. This
nd In
thetideof
ac-andruc-tiveex-
S.vity.thethatandn tos toon-
DS
isWents,he-ur-n
r-ibbs
ow-thanhy-ev-exem-e-rical
rmshy-ary
uo-s-rnater-
ab-plouo-
b-
by-in.
ench
s isB)),co-),
fac-nt-
asd toidenal
gic.asbyinwn
tero-ino
owundto
reinggesho-000
S. De et al. / Journal of Colloid a
cooperative binding is accompanied by an unfolding ofprotein. Although the disulfide bridges prevent the pepchain from unfolding completely, a substantial amountunfolding can occur. Large amounts of bound ionic surftant can both break the intrachain hydrophobic bondingprovide electrostatic repulsion favoring an extended stture. In this region of surfactant concentration, cooperaeffects are observed from the binding curve. Here, SDShibits the strongest binding effect withK ∼ 103 M−1 (Ta-ble 1). The number of binding sites, too, is largest for SDMassive protein uncoiling leads to large scale cooperatiThus Scatchard data in this region reflect the ability ofsurfactants to cause protein unfolding. It is to be notedat the working pH, 7, BSA bears a net negative chargethus there can be no net or overall coulombic contributiobinding energy of SDS. Nevertheless, binding of anionhigh-affinity sites occurs. This may derive a coulombic ctribution from binding near local positive charges.
Hydrodynamic and optical properties of the BSA–Scomplex indicate a major conformational change[11] fromthe native form. The protein in a protein–SDS complexnot globular but rather an exerted polypeptide chain.have shown that, even for cationic and nonionic surfactaconformational modifications of the protein can occur. Tlargely negative�G values (Table 1) indicate the spontaneity of the binding process. It also seen that binding at [sfactant]≈ 0.1 mM is thermodynamically more favored thabinding at [surfactant]≈ 10 mM. The Gibbs energies of sufactant binding at saturation are comparable to the Genergies of micelle formation[43]. Both micellization andprotein–surfactant binding are cooperative processes. Hever, the protein–surfactant complexes are more stablemicelles, since the protein presents a complementarydrophobic surface on which the surfactant can bind. Seral models have been proposed for protein–SDS compl[9,36–38]. The most popular model for the SDS–BSA coplex is the “pearl necklace” model in which the flexible dnatured polypeptide chain of the protein has small sphemicelles clustered around it[8,9,31–33,36–38]. The locationof SDS molecules is such that the sulfate head group foa salt bridge with cationic amino acid residues and thedrocarbon tails make hydrophobic contact with the tertistructure.
3.3. ANS binding to protein
To monitor the protein–surfactant binding process flrimetrically, not only has the intrinsic tryptophan fluorecence been followed but also the fluorescence of an extelabel, i.e., ANS has been studied. The binding characistics of ANS to BSA have been studied both in thesence and in the presence of surfactants. The Scatchardhave been obtained using data from studies of ANS fl
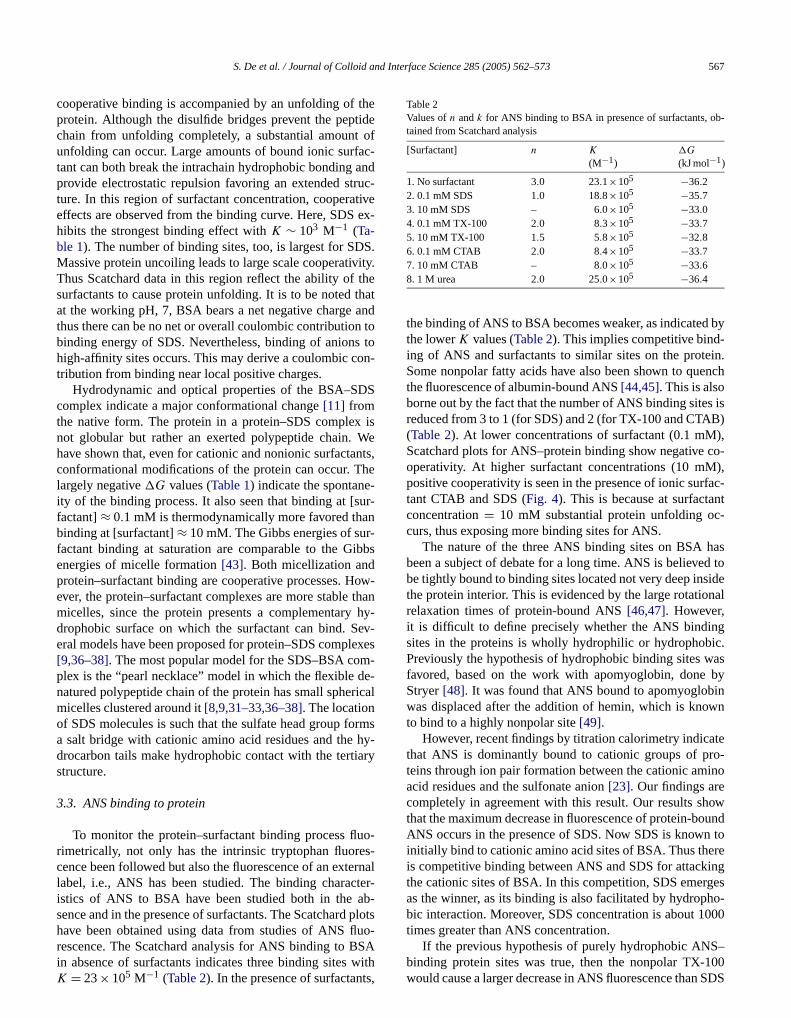
rescence. The Scatchard analysis for ANS binding to BSAin absence of surfactants indicates three binding sites withK = 23× 105 M−1 (Table 2). In the presence of surfactants,terface Science 285 (2005) 562–573 567
s
l
ts
Table 2Values ofn andk for ANS binding to BSA in presence of surfactants, otained from Scatchard analysis
[Surfactant] n K
(M−1)�G
(kJ mol−1)
1. No surfactant 3.0 23.1×10⁵ −36.22. 0.1 mM SDS 1.0 18.8×10⁵ −35.73. 10 mM SDS – 6.0×10⁵ −33.04. 0.1 mM TX-100 2.0 8.3×10⁵ −33.75. 10 mM TX-100 1.5 5.8×10⁵ −32.86. 0.1 mM CTAB 2.0 8.4×10⁵ −33.77. 10 mM CTAB – 8.0×10⁵ −33.68. 1 M urea 2.0 25.0×10⁵ −36.4
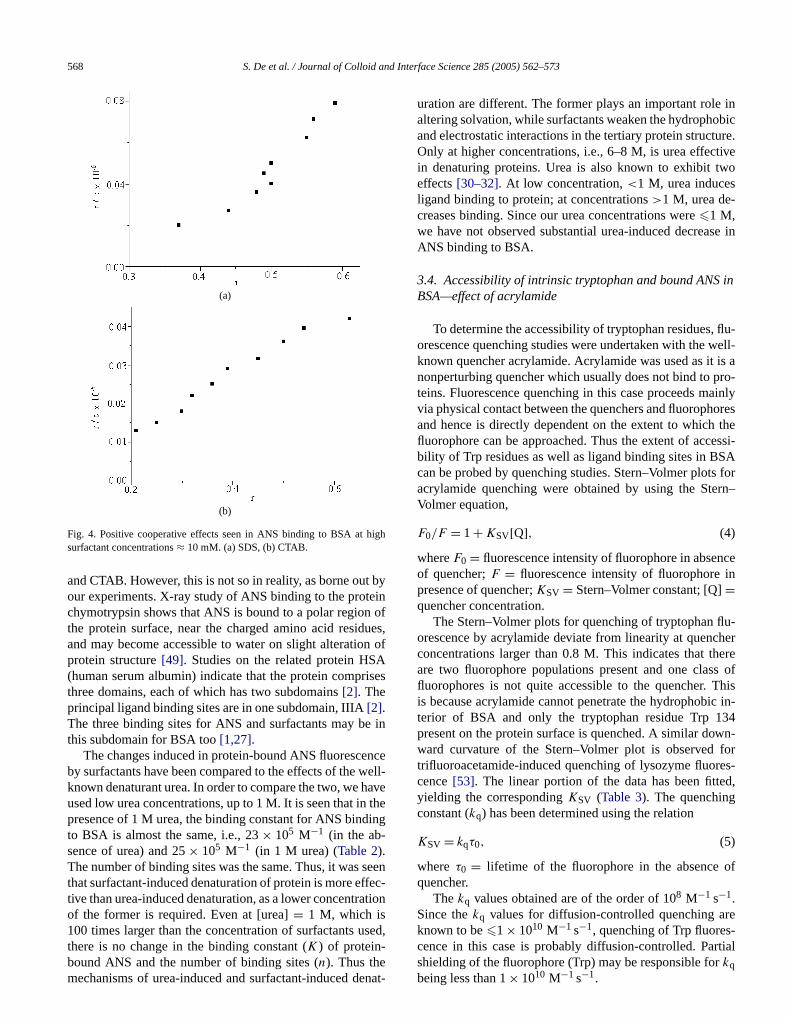
the binding of ANS to BSA becomes weaker, as indicatedthe lowerK values (Table 2). This implies competitive binding of ANS and surfactants to similar sites on the proteSome nonpolar fatty acids have also been shown to quthe fluorescence of albumin-bound ANS[44,45]. This is alsoborne out by the fact that the number of ANS binding sitereduced from 3 to 1 (for SDS) and 2 (for TX-100 and CTA(Table 2). At lower concentrations of surfactant (0.1 mMScatchard plots for ANS–protein binding show negativeoperativity. At higher surfactant concentrations (10 mMpositive cooperativity is seen in the presence of ionic surtant CTAB and SDS (Fig. 4). This is because at surfactaconcentration= 10 mM substantial protein unfolding occurs, thus exposing more binding sites for ANS.
The nature of the three ANS binding sites on BSA hbeen a subject of debate for a long time. ANS is believebe tightly bound to binding sites located not very deep insthe protein interior. This is evidenced by the large rotatiorelaxation times of protein-bound ANS[46,47]. However,it is difficult to define precisely whether the ANS bindinsites in the proteins is wholly hydrophilic or hydrophobPreviously the hypothesis of hydrophobic binding sites wfavored, based on the work with apomyoglobin, doneStryer[48]. It was found that ANS bound to apomyoglobwas displaced after the addition of hemin, which is knoto bind to a highly nonpolar site[49].
However, recent findings by titration calorimetry indicathat ANS is dominantly bound to cationic groups of pteins through ion pair formation between the cationic amacid residues and the sulfonate anion[23]. Our findings arecompletely in agreement with this result. Our results shthat the maximum decrease in fluorescence of protein-boANS occurs in the presence of SDS. Now SDS is knowninitially bind to cationic amino acid sites of BSA. Thus theis competitive binding between ANS and SDS for attackthe cationic sites of BSA. In this competition, SDS emeras the winner, as its binding is also facilitated by hydropbic interaction. Moreover, SDS concentration is about 1times greater than ANS concentration.
If the previous hypothesis of purely hydrophobic ANS–binding protein sites was true, then the nonpolar TX-100would cause a larger decrease in ANS fluorescence than SDS
nd In
igh
byinofuesn ofAises
e in
ncewell-avetheing
seenfec-ation
sed
inbic
ure.tivewo
se in
in
flu-well-is aro-
ainlyoresthe
essi-A
s forrn–
cein
u-hereres ofThisic in-34wn-fores-
ed,
of
re-
568 S. De et al. / Journal of Colloid a
(a)
(b)
Fig. 4. Positive cooperative effects seen in ANS binding to BSA at hsurfactant concentrations≈ 10 mM. (a) SDS, (b) CTAB.
and CTAB. However, this is not so in reality, as borne outour experiments. X-ray study of ANS binding to the protechymotrypsin shows that ANS is bound to a polar regionthe protein surface, near the charged amino acid residand may become accessible to water on slight alteratioprotein structure[49]. Studies on the related protein HS(human serum albumin) indicate that the protein comprthree domains, each of which has two subdomains[2]. Theprincipal ligand binding sites are in one subdomain, IIIA[2].The three binding sites for ANS and surfactants may bthis subdomain for BSA too[1,27].
The changes induced in protein-bound ANS fluoresceby surfactants have been compared to the effects of theknown denaturant urea. In order to compare the two, we hused low urea concentrations, up to 1 M. It is seen that inpresence of 1 M urea, the binding constant for ANS bindto BSA is almost the same, i.e., 23× 105 M−1 (in the ab-sence of urea) and 25× 105 M−1 (in 1 M urea) (Table 2).The number of binding sites was the same. Thus, it wasthat surfactant-induced denaturation of protein is more eftive than urea-induced denaturation, as a lower concentrof the former is required. Even at [urea]= 1 M, which is100 times larger than the concentration of surfactants u
there is no change in the binding constant (K) of protein-bound ANS and the number of binding sites (n). Thus themechanisms of urea-induced and surfactant-induced denatterface Science 285 (2005) 562–573
,
,
uration are different. The former plays an important rolealtering solvation, while surfactants weaken the hydrophoand electrostatic interactions in the tertiary protein structOnly at higher concentrations, i.e., 6–8 M, is urea effecin denaturing proteins. Urea is also known to exhibit teffects[30–32]. At low concentration,<1 M, urea inducesligand binding to protein; at concentrations>1 M, urea de-creases binding. Since our urea concentrations were�1 M,we have not observed substantial urea-induced decreaANS binding to BSA.
3.4. Accessibility of intrinsic tryptophan and bound ANSBSA—effect of acrylamide
To determine the accessibility of tryptophan residues,orescence quenching studies were undertaken with theknown quencher acrylamide. Acrylamide was used as itnonperturbing quencher which usually does not bind to pteins. Fluorescence quenching in this case proceeds mvia physical contact between the quenchers and fluorophand hence is directly dependent on the extent to whichfluorophore can be approached. Thus the extent of accbility of Trp residues as well as ligand binding sites in BScan be probed by quenching studies. Stern–Volmer plotacrylamide quenching were obtained by using the SteVolmer equation,
(4)F0/F = 1+ KSV[Q],whereF0 = fluorescence intensity of fluorophore in absenof quencher;F = fluorescence intensity of fluorophorepresence of quencher;KSV = Stern–Volmer constant; [Q]=quencher concentration.
The Stern–Volmer plots for quenching of tryptophan florescence by acrylamide deviate from linearity at quencconcentrations larger than 0.8 M. This indicates that thare two fluorophore populations present and one clasfluorophores is not quite accessible to the quencher.is because acrylamide cannot penetrate the hydrophobterior of BSA and only the tryptophan residue Trp 1present on the protein surface is quenched. A similar doward curvature of the Stern–Volmer plot is observedtrifluoroacetamide-induced quenching of lysozyme fluorcence[53]. The linear portion of the data has been fittyielding the correspondingKSV (Table 3). The quenchingconstant (kq) has been determined using the relation
(5)KSV = kqτ0,
where τ0 = lifetime of the fluorophore in the absencequencher.
Thekq values obtained are of the order of 108 M−1 s−1.Since thekq values for diffusion-controlled quenching aknown to be�1× 10¹⁰ M−1 s−1, quenching of Trp fluores
-
cence in this case is probably diffusion-controlled. Partialshielding of the fluorophore (Trp) may be responsible forkqbeing less than 1× 10¹⁰ M−1 s−1.

S. De et al. / Journal of Colloid and Interface Science 285 (2005) 562–573 569
Table 3Acrylamide quenching in the absence and presence of surfactants ([acrylamide]= 0–2 M)
Medium KTrpSV
(M−1)
KANSSV
(M−1)
kTrpq
(M−1 s−1)
kANSq
(M−1 s−1)
τ0Trp
(ns)
τ0ANS
(ns)
1. 20 µM ANS+ 30 µM BSA+ acrylamide
2.65 0.45 6.2×10⁸ 0.25×10⁸ 4.3 17.8
2. (a) 20 µM ANS+ 30 µM BSA+ 0.1 mM SDS+ acrylamide
2.31 0.50 4.8×10⁸ 0.45×10⁸ 4.8 11.0
(b) 20 µM ANS+ 30 µM BSA+ 10 mM SDS+ acrylamide
2.29 0.93 3.9×10⁸ 1.82×10⁸ 5.9 5.1
3. (a) 20 µM ANS+ 30 µM BSA+ 0.1 mM TX-100+ acrylamide
2.76 0.50 6.3×10⁸ 0.38×10⁸ 4.4 13.1
(b) 20 µM ANS+ 30 µM BSA+ 10 mM TX-100+ acrylamide
0.55 0.68 1.4×10⁸ 0.59×10⁸ 3.8 11.5
4. (a) 20 µM ANS+ 30 µM BSA+ 0.1 mM CTAB+ acrylamide
2.29 0.45 5.7×10⁸ 0.33×10⁸ 4.0 13.6
(b) 20 µM ANS+ 30 µM BSA+ 10 mM CTAB+ acrylamide
2.79 0.29 7.2×10⁸ 0.57×10⁸ 3.9 5.1
ura-s toave
is is
ants
auseatu-i.e.,r, beucedtionicel-ry-
sut inatcen
be
thausehusding
insenal
e ef
s
ay.d
-e
5. 20 µM ANS+ 30 µM BSA+ 1 M urea+ acrylamide
2.59 0.50
We were interested in studying how surfactant denattion of proteins can affect the accessibility of Trp residuequencher. On increasing acrylamide concentration, we hobserved a red shift of Trp fluorescence to 348 nm. Thattributed to the quenched residues.Table 3indicates thatthe k
Trpq values decrease in the presence of the surfact
TheKTrpSV values are almost unchanged. This may be bec
surfactant binding to BSA causes its denaturation. Denration generally exposes previously buried Trp residues,residues 212, and acrylamide, being a surface quenchecomes an active quencher. In this case, surfactant-indprotein denaturation is accompanied by micelle formawhereby the exposed Trp residues face a hydrophobic mlar environment. In this situation, the polar quencher aclamide will not be able to access the Trp residues.Thukqvalues remain unchanged or at most may decrease. B1 M urea,kq values remain unchanged. It is well known ththe denaturating effect of urea starts at much higher contrations, i.e.,>6 M [51,52].
However, the quenching studies with the extrinsic proANS show the opposite effect. Here, interestingly,kANS
q in-creases in the presence of surfactant. This indicatessurfactant-induced conformational changes of BSA caexposure of the ANS binding sites to the quencher. TANS fluorescence gets quenched easily. Thus ANS binsites on BSA are different from the Trp sites. But eventhis case, 1 M urea does not cause an appreciable increakANS
q . This once again proves that as far as conformatiochange of the protein is concerned, surfactants are morfective than urea at low concentrations.
3.5. Time-resolved fluorescence studies
Fluorescence decays for both Trp and ANS emissionwere determined. The lifetime values have been listed inTa-
5.5×10⁸ 0.28×10⁸ 4.7 17.6
.
-
-
t
in
-
Table 4Lifetimes of tryptophan (a) and ANS (b) in BSA in presence of additive
Medium τ1(ns)
a1 τ2(ns)
a2 χ2
(a)1. 30 µM BSA 3.4 0.90 11.4 0.10 1.02. 30 µM BSA+ 0.1 mM SDS 3.6 0.90 17.2 0.10 1.13. 30 µM BSA+ 10 mM SDS 2.9 0.80 13.7 0.20 0.94. 30 µM BSA+ 0.1 mM TX-100 3.4 0.90 11.5 0.10 1.05. 30 µM BSA+ 10 mM TX-100 3.3 0.90 11.5 0.10 1.16. 30 µM BSA+ 0.1 mM CTAB 3.7 0.90 14.5 0.10 1.17. 30 µM BSA+ 10 mM CTAB 3.1 0.85 16.9 0.15 1.18. 30 µM BSA+ 1.0 M urea 3.4 0.90 13.3 0.10 1.1
(b)1. 20 µM ANS+ 30 µM BSA 14.5 1.0 – – 1.12. 20 µM ANS+ 30 µM BSA
+ 0.1 mM SDS2.9 0.2 17.9 0.8 1.2
3. 20 µM ANS+ 30 µM BSA+ 10 mM SDS
3.1 0.8 13.4 0.2 1.0
4. 20 µM ANS+ 30 µM BSA+ 0.1 mM TX-100
2.3 0.2 18.9 0.8 1.3
5. 20 µM ANS+ 30 µM BSA+ 10 mM TX-100
2.5 0.4 17.3 0.6 1.3
6. 20 µM ANS+ 30 µM BSA+ 0.1 mM CTAB
2.0 0.1 19.8 0.9 1.4
7. 20 µM ANS+ 30 µM BSA+ 10 mM CTAB
4.4 0.9 10.8 0.1 1.1
8. 20 µM ANS+ 30 µM BSA+ 1.0 M urea
1.9 0.1 18.8 0.9 1.3
ble 4. The Trp emission could be fit to a biexponential decIn BSA, the biexponential fit yielded lifetimes of 3.4 an11.4 ns (Table 4a). The shorter lifetime(τ1) has been assigned to buried Trp, i.e., Trp-212, while the longer lifetim
(τ2) is due to the solvent-exposed residue, i.e., Trp-134[54].Table 4a indicates that the dominant contribution to the life-time of Trp comes from Trp-212 (sincea1 > a2). However,
nd In
the
the
bi-tolikeSle-
DSec-
dingus
oo,of
sur-
o-not
on-ary
the,
pe-igh(on
d, a
trumen-onorwellter-
feren-
theand
ted inislmosttoo,elysingrgy
g-(
sruc-eins theated
570 S. De et al. / Journal of Colloid a
in the presence of 10 mM SDS and CTAB,a2 increases, in-dicating that Trp becomes more solvent-exposed. Amongsurfactants, TX-100 does not change theτ values much. In1 M urea, too,τ values remain almost unchanged.
The ANS lifetimes were also determined by excitingsolutions at 337 nm withλem= 465 nm. For ANS in 30 µMBSA, the decay was exponential with aτ value of 14.5 ns(Table 4b). In surfactants, the BSA-bound ANS decay isexponential. The lower ANSτ values can be assignedthose ANS molecules that are solubilized in the micelle-clusters. The largerτ value resembles the lifetime of ANin relatively nonpolar media and is due to those ANS mocules bound to hydrophobic sites on BSA. At lower Sconcentration, the dominant contribution is from the sond type of bound ANS with longτ2, i.e., 17 ns. At highconcentrations of SDS, the shorter componentτ1 becomesdominant. This indicates that SDS causes protein unfolmore effectively at higher concentration, i.e., 10 mM, thmaking bound ANS more exposed to water. For CTAB, tthe same trend is seen. But for TX-100 the contributionthe longer component is always dominant even at higherfactant concentrations; only its magnitude, i.e.,a2 decreasesslightly. Thus TX-100 is not as effective in inducing prtein unfolding as the other surfactants. Urea at 1 M doeschange theτ value much. This indicates that urea at this ccentration, 1 M, has no effect on the tertiary or secondstructure of BSA.
In the presence of surfactants at low concentrationcontribution ofτ2, the longer lifetime component of ANSa2, is high. At higher concentration of surfactants, escially SDS and CTAB,a2 decreases. Thus surfactants at hconcentrations cause exposure of the ANS binding sitesBSA) to solvent. As far as the Trp emission is concerne
longer lifetime is generally associated with the more solvent-5. 30 µM BSA+ 20 µM ANS+ 1.0 M urea
0.043 0.56 7.98×10⁻¹⁵
terface Science 285 (2005) 562–573
phan residues to the solvent, since the values ofτ2 anda2increase in the presence of SDS and CTAB.
3.6. Resonance energy transfer (RET) from Trp to ANS
Due to the good overlap between the emission specof Trp and the absorption spectra of ANS, nonradiativeergy transfer between them is possible. Trp acts as the din this case. The theory of the energy transfer has beenstudied[55,56]. The energy transfer can be studied by demining certain parameters—energy transfer efficiency(E),Forster distance(R0), and rate constant for energy trans(kET). These have been defined by Förster’s theory ofergy transfer[56]. The energy-transfer parameters forTrp–ANS system have been evaluated in the absencepresence of surfactants and urea. These have been lisTable 5. The efficiency of energy transfer from Trp to ANSdecreased in the presence of surfactants, whereas it is aunaffected by 1 M urea. Thus energy-transfer studies,indicate that surfactants can bind to BSA and can effectivexpose both donor and acceptor to solvent, thus increathe D–A distance and decreasing the probability of enetransfer.
The Forster distances(R0) have been determined usinthe overlap integralsJ (λ) obtained by numerical integration. From theR0 values, the donor–acceptor distancer)has been determined.r for Trp–ANS is∼19 Å, which agreesquite well with the literature value of 23 Å[57]. In the pres-ence of all the three surfactants, ther value increases. This icaused by alteration of protein secondary and tertiary stture. However, 1 M urea has no effect on tertiary protstructure and thus has no effect on energy transfer. Thuenergy transfer efficiency in various media can be correlquite well with the donor–acceptor distance. ThekET values
8 −1
are of the order of 10s , decreasing in the order BSA>g
exposed tryptophan residue[54]. Our observations indicatethat the presence of ionic surfactants exposes buried trypto-(BSA + 1 M urea)> (BSA + TX-100) > (BSA + CTAB)> (BSA + SDS). The capabilities of proteins for bindin
Table 5Calculation of energy transfer parameters
Medium φDf E J(λ)
(M−1 cm3)R0(Å)
r
(Å)〈τ0
D〉(ns)
kET(s−1)
〈τ0A〉
(ns)
1. 30 µM BSA+ 20 µM ANS 0.044 0.58 7.54×10⁻¹⁵ 19.8 18.8 4.3 3.17×10⁸ 17.82. 30 µM BSA+ 20 µM ANS
+ 0.1 mM SDS0.038 0.32 1.3× 10⁻¹⁴ 21.2 24.0 4.8 0.99×10⁸ 11.01
3. 30 µM BSA+ 20 µM ANS+ 10 mM SDS
0.026 0.39 8.4× 10⁻¹⁵ 18.5 19.9 5.9 1.09×10⁸ 5.1
4. 30 µM BSA+ 20 µM ANS+ 0.1 mM TX-100
0.039 0.45 1.04×10⁻¹⁴ 20.4 21.1 4.0 2.04×10⁸ 13.6
5. 30 µM BSA+ 20 µM ANS+ 10 mM TX-100
0.037 0.43 1.11×10⁻¹⁴ 20.5 21.5 3.9 2.09×10⁸ 11.5
6. 30 µM BSA+ 20 µM ANS+ 0.1 mM CTAB
0.041 0.37 7.9× 10⁻¹⁵ 19.7 21.5 4.4 1.34×10⁸ 13.1
7. 30 µM BSA+ 20 µM ANS+ 10 mM CTAB
0.017 0.36 9.1× 10⁻¹⁵ 17.4 19.2 3.8 1.46×10⁸ 5.1
19.9 19.1 4.7 2.72×10⁸ 17.6

nd In
Trp
fecttrucer-tail,00–
e at
tage
ctralthe
e oflt
heuc-ctsc-ede-ase-
t
fer-g ofhus
truc-n thede
osedsesofnifi-
sec-SA-
gion
hantruc-andues.res-y ofS.
letetud-
fluo-ale re-and
S. De et al. / Journal of Colloid a
Table 6Circular dichroism studies of the effect of additives on BSA structure
Sample % ofα-helix
1. 3 µM BSA 56.002. 3 µM BSA+ 0.1 mM SDS 54.003. 3 µM BSA+ 10 mM SDS 47.004. 3 µM BSA+ 0.1 mM TX-100 56.005. 3 µM BSA+ 10 mM TX-100 55.006. 3 µM BSA+ 0.1 mM CTAB 55.007. 3 µM BSA+ 10 mM CTAB 51.008. 3 µM BSA+ 1.0 M urea 56.00
with ANS can be correlated with the decrease in theirfluorescence due to energy transfer to ANS.
3.7. Circular dichroism studies
To confirm the above conclusions regarding the efof surfactants and urea on the tertiary and secondary sture of BSA, circular dichroism (CD) studies were undtaken. To examine the protein secondary structure in dethe spectra were scanned in the wavelength region 2250 nm to probe the backbone amide transitions. Theα-helixis characterized by negative peaks of similar magnitud222 and 208 nm. The standard method[33,34] was usedto fit the spectral data and thus determine the percenof α-helicity [58]. These have been listed inTable 6. Thesurfactants do not present any CD signal in the sperange 200–250 nm; thus the observed CD is due toprotein alone. It is seen that the protein in the absencany additives has anα-helix content of 56%. This resuis in agreement with the literature value of 55%α-helix.In the presence of surfactants, there is a change in thelicity, indicating a change in the protein secondary strture (Fig. 5a). A general trend is observed in the effeof all three surfactants on helicity of BSA. At low surfatant concentrations,�0.1 mM, there is little change in thhelicity, but at higher surfactant concentrations, helicitycreases (Fig. 5a). However, urea at concentration 1 M hno effect on the helicity of BSA. Our findings are in agrement with the studies of Moriyama et al.[50] and Sen eal. [51]. They found that on addition of [SDS]� 6 mM,helicity decreases. At high surfactant concentration, preential adsorption on the protein surface leads to a swellinthe protein, which exposes the hydrophobic residues. Tα-helices are broken to give a more open disordered sture. Surfactant addition also has a considerable effect opercentage ofβ-sheet and random coil. Thus we concluthat surfactants at higher concentrations disrupt theα-helicalnetwork and lead to a more open, random, solvent-expprotein structure. Here, again, we find that TX-100 cauno change in the helicity of BSA. The aromatic regionthe protein spectrum, i.e., 250–320 nm, also shows sig
cant alterations in the presence of surfactants (Fig. 5b). TheUV–CD spectra of BSA around 250–320 nm show signif-icant perturbation in the presence of the surfactants. Thisterface Science 285 (2005) 562–573 571
-
-
(a)
(b)
Fig. 5. (a) Circular dichroism spectra of the effect of surfactants onondary structure of BSA in the wavelength region 200–250 nm: (i) B(30 µM); (ii) BSA (30 µM)+ 10 mM SDS. (b) Circular dichroism spectra of the effect of surfactants on structure of BSA in the wavelength re250–320 nm: (i) BSA (30 µM), (ii) BSA (30 µM)+ 10 mM SDS.
indicates significant perturbation of the surface tryptopand tyrosyl residues. Thus the surfactants perturb the sture of the protein surface, mediating the water layermicroenvironment around the superficial aromatic residThis conclusion is also reached from the fact that the pence of surfactants leads to a lower quenching efficiencacrylamide and a perturbation of the specific ligand ANThus the results obtained from CD studies are in compagreement with earlier observations from fluorescence sies.
4. Conclusions
Protein–surfactant interactions have been examinedrimetrically by following the intrinsic Trp as well as externlabel (ANS) fluorescence. The steady-state fluorescencsults have been corroborated by time-resolved studies
circular dichroism spectra. The most important conclusionis that although the overall nature of protein–surfactant inter-actions is specific ionic interaction, followed by nonspecific
nd In
endhers aeM).wa-Forctro-er-vi-
tantd byteinM).s in-tantoil-NSr-ter-ontan
de-pedgene o
ac-ganduch
itstivengnts,al-
ffi-. O34,the
p inteinopecry-ng,and
hetantsp)–tra-
ntstions
DScednce,X-
andightpo-
em-gr aff offorentof
re-
y,
.M.iumer
d-
. 5,
ys.
02.736.
ryya,
Bio-
15
ys.
ys.
572 S. De et al. / Journal of Colloid a
hydrophobic interaction, the details of the process depon the type of surfactant. It is important to note from tabove study that surfactant denaturation of proteins occusurfactant concentrations (∼10 mM) much lower than thosrequired for the commonly used denaturant, urea (6–8For the latter, denaturing action depends on its effect onter structure and weakening of hydrophobic interactions.surfactants, on the other hand, the driving forces are elestatic interactions with amino acid residues followed by thmodynamically favorable hydrophobic interactions (as edenced by negative binding free energies). At low surfacconcentration, binding to BSA is strong, as characterizehigh K values. However, CD spectra suggest that prois not denatured at low surfactant concentration (0.1 mBut at high surfactant concentration, the Scatchard plotdicate a considerable role of cooperative effects in surfacbinding to protein and there is considerable protein uncing, leading to quenching of fluorescence of bound Aand decrease inα-helicity. Among the three types of sufactants, the nonionic surfactant TX-100 shows less inaction with BSA than the ionic surfactants. The commmodel suggested by SANS studies for the protein–surfaccomplex is a pearl necklace model in which the flexiblenatured polypeptide has spherical micellar clusters wraparound its backbone. Protein–surfactant complexes areerally more stable than surfactant micelles. The presencan external marker for BSA (ANS) and the effect of surftant on its fluorescence are used to characterize the libinding sites. For ANS binding to BSA, there are three ssites. Surfactants have been found to displace ANS frombinding sites. This indicates that the binding is competiin nature. Fluorimetric study of such competitive bindican be used to detect and quantify the binding of nutriedrugs, and other physiologically important compounds tobumin.
It has been found that the acrylamide quenching eciency for Trp decreases in the presence of surfactantsthe two Trp residues in BSA, the one on loop 3, i.e., Trp 1is more exposed than the one on loop 4 (Trp 212). Thusquenching studies reflect the effect of acrylamide on Trloop 3. In the presence of surfactants, although the prouncoils, the Trp is surrounded by a hydrophobic enveloffered by the surfactant. This hinders the approach of alamide. However, with surfactant-induced protein uncoilithe ANS binding sites become more exposed to solventkANS
q increases.The efficiency of RET from Trp to ANS decreases in t
presence of surfactants, reiterating the fact that surfacinduce protein uncoiling, thus increasing the donor (Tracceptor (ANS) distance. However, urea at low concentions, i.e., 1 M, has no effect on RET.
The circular dichroism studies indicate that large amouof the adsorbed surfactants CTAB and SDS at concentra
�10 mM cause substantial uncoiling, as evidenced by theCD spectra. The surfactants break intrachain hydrophobicbonding and favor an extended structure due to electrostaterface Science 285 (2005) 562–573
t
t
-f
f
tic repulsion. Thus the ionic surfactants CTAB and Scan perturb the structure of BSA significantly, as evidenby our studies—steady-state and time-resolved fluoresceacrylamide quenching, and CD studies. The effect of T100 on BSA structure is not as marked as that of CTABSDS. This study is expected to provide an important insinto the interaction of serum proteins with polar and nonlar molecules in the biological system.
Acknowledgments
The authors thank the authorities of the Physical Chistry department of IACS for providing facilities for studyinfluorescence lifetimes. SD thanks CSIR, New Delhi, fogenerous grant of Scheme 01(1819)/02/EMR-II. The stathe PD division of the Bose Institute is acknowledgedhelp regarding the CD spectra. The head of the Departmof Biochemistry and Biophysics is acknowledged for usethe fluorimeter. AG thanks the CSIR for the award of asearch fellowship.
References
[1] T. Peters Jr., Adv. Protein Chem. 37 (1985) 161.[2] X.M. He, D.C. Carter, Nature 358 (1992) 209.[3] S.J. Singer, G.L. Nicolson, Science 175 (1972) 720.[4] A.L. Lehninger, D.L. Nelson, M.M. Cox, Principles of Biochemistr
CBS Publications, New Delhi, 1987.[5] B. Lindman, G. Karlström, Polymer Surfactant Systems, in: D
Bloor, E. Wyn-jones (Eds.), The Structure, Dynamics and EquilibrProperties of Colloidal Systems, NATO ASI Ser. C, vol. 324, KluwAcademic, Dordrecht, 1990.
[6] K. Weber, M. Osborn, J. Biol. Chem. 244 (1969) 4406.[7] J. Steinhardt, J.A. Reynolds, Multiple Equilibrium in Proteins, Aca
emic Press, New York, 1969.[8] M.N. Jones, Biological Interfaces, Elsevier, Amsterdam, 1975, ch
p. 101.[9] M.N. Jones, Chem. Soc. Rev. (1992) 127.
[10] A. Chatterjee, S.P. Moulik, P.R. Majhi, S.K. Sanyal, BiophChem. 98 (2002) 313.
[11] J.A. Reynolds, C. Tanford, Proc. Natl. Acad. Sci. USA 66 (1970) 10[12] M.N. Jones, P. Manley, J. Chem. Soc. Faraday Trans. I 75 (1979) 1[13] P.D. Dutta, P. Sen, A. Halder, S. Mukherjee, S. Sen, K. Bhattacha
Chem. Phys. Lett. 377 (2003) 299.[14] P. Hazra, D. Chakrabarty, A. Chakrabarty, N. Sarkar, Biochem.
phys. Res. Commun. 314 (2004) 543.[15] M. Vasilescu, D. Angelescu, M. Almgren, A. Valstar, Langmuir
(1999) 2635.[16] R. Das, D. Guha, S. Mitra, S. Kar, S. Lahiri, S. Mukherjee, J. Ph
Chem. A 101 (1997) 4042.[17] E. Gelamo, C.H. Silva, H. Imasato, M. Tabak, Biochim. Bioph
Acta 1594 (2002) 84.[18] E. Gelamo, M. Tabak, Spectrochim. Acta Part A 56 (2000) 2255.[19] A. Valstar, W. Brown, M. Almgren, Langmuir 15 (1999) 2366.[20] L. Stryer, J. Mol. Biol. 13 (1965) 482.[21] E. Daniel, G. Weber, Biochemistry 5 (1966) 1893.[22] W.O. Maclure, L.M. Edelman, Biochemistry 5 (1966) 1908.
-
[23] D. Matulis, R. Lovrien, Biophys. J. 74 (1998) 422.[24] D. Matulis, C.G. Baumann, V.A. Bloomfield, R.E. Lovrien, Biopoly-
mers 49 (1999) 451.

nd In
. 13
s. 89
93)
27.15
0)
g-
ed.,
ng-
Sur-, FL,
654.71)
47
2)
m-
m-
hys.
5.s.
.ed.,
em.
S. De et al. / Journal of Colloid a
[25] L.S. Chang, E.Y. Wen, J.J. Huang, C.C. Chang, J. Protein Chem(1994) 635.
[26] J. Slavik, Biochim. Biophys. Acta 694 (1982) 1.[27] M.K. Pal, S.K. Patra, Indian J. Biochem. Biophys. 31 (1994) 109.[28] K. Das, N. Sarkar, K. Bhattacharyya, J. Chem. Soc. Faraday Tran
(1993) 1959.[29] A. Nag, K. Bhattacharyya, Chem. Phys. Lett. 169 (1990) 12.[30] M.A. Andrade, P. Chacon, J.J. Merelo, F. Moran, Protein Eng. 6 (19
383.[31] K.S. Birdi, H.N. Sing, S.U. Dalsager, J. Phys. Chem. 80 (1979) 21[32] M. Vasilescu, D. Angelescu, M. Almgren, A. Valstar, Langmuir
(1999) 2635.[33] A. Valstar, M. Almgren, W. Brown, M. Vasilescu, Langmuir 16 (200
922.[34] P.C. Griffiths, J.A. Roe, B.L. Bales, A.R. Pitt, A.M. Howe, Lan
muir 16 (2000) 8248.[35] J.R. Lakowicz, Principles of Fluorescence Spectroscopy, second
Plenum, New York, 1999, ch. 16.[36] N.J. Turro, X.G. Lei, K.P. Ananthapadmanabhan, M. Aronson, La
muir 11 (1995) 2525.[37] J. Oakes, J. Chem. Soc. Faraday Trans. I 70 (1974) 2200.[38] E.D. Goddard, K.P. Ananthapadmanabhan (Eds.), Interactions of
factants with Polymers and Proteins, CRC Press, Boca Raton1993.
[39] G. Scatchard, Ann. N.Y. Acad. Sci. 51 (1994) 660.
[40] A. Ray, J.A. Reynolds, H. Polet, J. Steinhardt, Biochemistry 5 (1966)2606.
terface Science 285 (2005) 562–573 573
[41] M.N. Jones, P. Manley, J. Chem. Soc. Faraday Trans. I 76 (1980)[42] A.A. Spector, J.E. Fletcher, J.D. Ashbrook, Biochemistry 10 (19
3229.[43] M.N. Jones, P. Manley, Int. J. Biol. Macromol. 4 (1982) 201.[44] D.V. Naik, W.L. Paul, R.M. Thraelte, S.G. Schulman, Anal. Chem.
(1975) 267.[45] E.C. Santos, A.A. Spector, Biochemistry 11 (1972) 2299.[46] J. Slavik, J. Horak, L. Rihova, A. Kotyk, J. Membrane Biol. 64 (198
175.[47] J.D. Johnson, M.A. El-Bayoumi, L.D. Weber, A. Tulinsky, Bioche
istry 18 (1979) 1292.[48] L. Stryer, Science 162 (1968) 526.[49] L.D. Weber, A. Tulinsky, J.D. Johnson, M.A. El-Bayoumi, Bioche
istry 18 (1979) 1297.[50] Y. Moriyama, K. Takeda, Langmuir 15 (1999) 2003.[51] P. Sen, D. Roy, K. Sahu, S.K. Mondal, K. Bhattacharyya, Chem. P
Lett. 395 (2004) 58.[52] B. Nerli, G. Pico, Arch. Int. Physiol. Biochim. Biophys. 102 (1994)[53] P. Midoux, P. Wahl, J.C. Auchet, M. Monsigny, Biochim. Biophy
Acta 801 (1984) 16.[54] A. Grinvald, I.J. Steinberg, Biochim. Biophys. Acta 427 (1976) 663[55] J.R. Lakowicz, Principles of Fluorescence Spectroscopy, second
Plenum, New York, 1999, ch. 13.[56] Th. Forster, Ann. Phys. 2 (1948) 55.[57] J.R. Brockle, R.B. Freedman, D.J. Hancock, G.K. Radda, Bioch
J. 116 (1970) 721.[58] Y.H. Chan, J.J. Yang, K.H. Chan, Biochemistry 13 (1994) 3350.