albumin binding onto synthetic vesicles
TRANSCRIPT

Dynamic Article LinksC<Soft Matter
Cite this: Soft Matter, 2012, 8, 9669
www.rsc.org/softmatter PAPER
Dow
nloa
ded
by U
nive
rsita
' di R
oma
La
Sapi
enza
on
21 S
epte
mbe
r 20
12Pu
blis
hed
on 0
9 A
ugus
t 201
2 on
http
://pu
bs.r
sc.o
rg |
doi:1
0.10
39/C
2SM
2626
0FView Online / Journal Homepage / Table of Contents for this issue
Albumin binding onto synthetic vesicles
Carlotta Pucci, Anita Scipioni and Camillo La Mesa*
Received 20th January 2012, Accepted 4th July 2012
DOI: 10.1039/c2sm26260f
Vesicular entities were obtained by mixing didodecyldimethylammonium bromide and sodium
dodecylsulfate in non-stoichiometric ratios. The vesicles bear a positive surface charge, due to the
cationic species being in excess, and adsorb significant amounts of protein, presumably by electrostatic
interactions. We modulated the net charge of bovine serum albumin by pH and observed its binding
onto the above vesicles. Binding is controlled by the net charge of vesicles and albumin: it is substantial
when albumin has negative charges in excess and is negligible, or non-existent, below its iso-electric
point. For pH values >6.0, the binding efficiency increases in proportion to protein charge. Surface
coverage changes in proportion to pH when the number of charges neutralized upon binding remains
the same. The size of protein–vesicle lipo-plexes was inferred by dynamic light scattering and their
charge by z-potential. The structure of albumin was evaluated by circular dichroism spectroscopy and
estimates of a-helix, b-strand and random coil contents were achieved. Increasing the b-strand and
random coil contents subsequent to binding suggests a significant interaction between vesicles and
albumin. Attempts to determine the binding efficiency were made by elaborating z-potential values.
The results were interpreted in terms of a Gibbs adsorption isotherm. Accordingly, it is possible to
estimate the binding energy under different pH conditions.
1. Introduction
Efforts were devoted to mimic the interaction processes occur-
ring between biopolymers and cells in vivo, and relevant points
were clarified in this regard.1–5 It is accepted nowadays that
biopolymers adsorb onto cells, or vesicular analogues, by elec-
trostatic, depletion, osmotic, hydrophobic effects and combina-
tions thereof. However, the relative weight of the above
contributions is both membrane- and biopolymer-dependent.
Generally, fibrous proteins enter vesicle bi-layers to minimize
hydrophobic interactions with water.1,6 Small globular proteins
or long, highly charged DNA, conversely, hardly enter the
membranes and adsorb on them by electrostatic interactions. For
instance, surface adsorption holds in lysozyme7 and DNA8–10
binding to synthetic vesicles has been observed. Some aspects of
these processes, however, were not investigated in detail.
Controlling pH, ionic strength and/or temperature may help
clarify the details of the binding process. In this paper results on
the pH-dependent binding of bovine serum albumin onto
synthetic cat-anionic vesicles11–13 are reported. Under the inves-
tigated pH conditions the protein charge and conformation
change while the vesicle state is practically unmodified.
The interactions between proteins and phospholipids-based
vesicles are hardly determined, since the charge of both entities is
pH-dependent.14 This fact has unfavourable consequences in
Dept. of Chemistry, La Sapienza University, Cannizzaro Building, P.le A.Moro 5, I-00185 Rome, Italy. E-mail: [email protected]; Fax:+39-06-490631; Tel: +39-06-49913707
This journal is ª The Royal Society of Chemistry 2012
determining protein adsorption onto lipid-based vesicular enti-
ties. In addition, the sizes of the latter vesicles are much higher
than those pertinent to cat-anionic systems,14,15 on which we
focus our attention. Such drawbacks hardly allow the use of
dynamic light scattering and z-potential analyses, on the results
of which this contribution relies.
The system reported here does not have the above disadvan-
tages, since pH affects only the protein charge. The vesicle state of
charge is immaterial, since the vesicles are made from strong elec-
trolytes. Minor effects, due to changes in the electrical double-layer
thickness around them, are present, but the role played by such
contribution can be quantified.16,17 These facts offer the opportu-
nity to mimic protein–vesicle interactions in conditions where only
the state of charge of the adsorbing species is modified.Modulating
the electrostatic terms due the binding species allows determination
of whether hydrophobic, osmotic, depletion and other contribu-
tions are relevant in the process. Support comes from ionic
conductivity, dynamic light scattering, DLS, and z-potential
measurements. It is strengthened by circular dichroism, CD, which
gives an indication of the protein conformation.
2. Experimental section
2.1. Materials
Bovine serum albumin, BSA, Sigma-Aldrich, was dialyzed and
lyophilized. Its solution properties were checked by measure-
ments of ionic conductivity, z-potential, density, viscosity and
dielectric relaxation; they are equivalent to previous data.18–20
Soft Matter, 2012, 8, 9669–9675 | 9669
Dow
nloa
ded
by U
nive
rsita
' di R
oma
La
Sapi
enza
on
21 S
epte
mbe
r 20
12Pu
blis
hed
on 0
9 A
ugus
t 201
2 on
http
://pu
bs.r
sc.o
rg |
doi:1
0.10
39/C
2SM
2626
0F
View Online
Sodium dodecylsulfate, SDS, and didodecyldimethylammo-
nium bromide, DDAB, were from Sigma Aldrich. The former
was dissolved in hot ethanol, filtered, precipitated by cold
acetone, and vacuum dried at 70 �C. Its purity was checked by
ionic conductivity and surface tension. Its critical micellar
concentration, CMC, is close to that of previous data.21 DDAB
was purified by the same procedure, vacuum dried and used as
such. Purity was confirmed by determining its CMC.22
Salts and solvents were from Sigma and were used as such.
Water was distilled over alkaline KMnO4 and bubbled by N2 to
reduce the presence of CO2 in the medium. Its ionic conductance,
c, is less than 1 � 10�7 U�1 cm�1 at 25 �C.
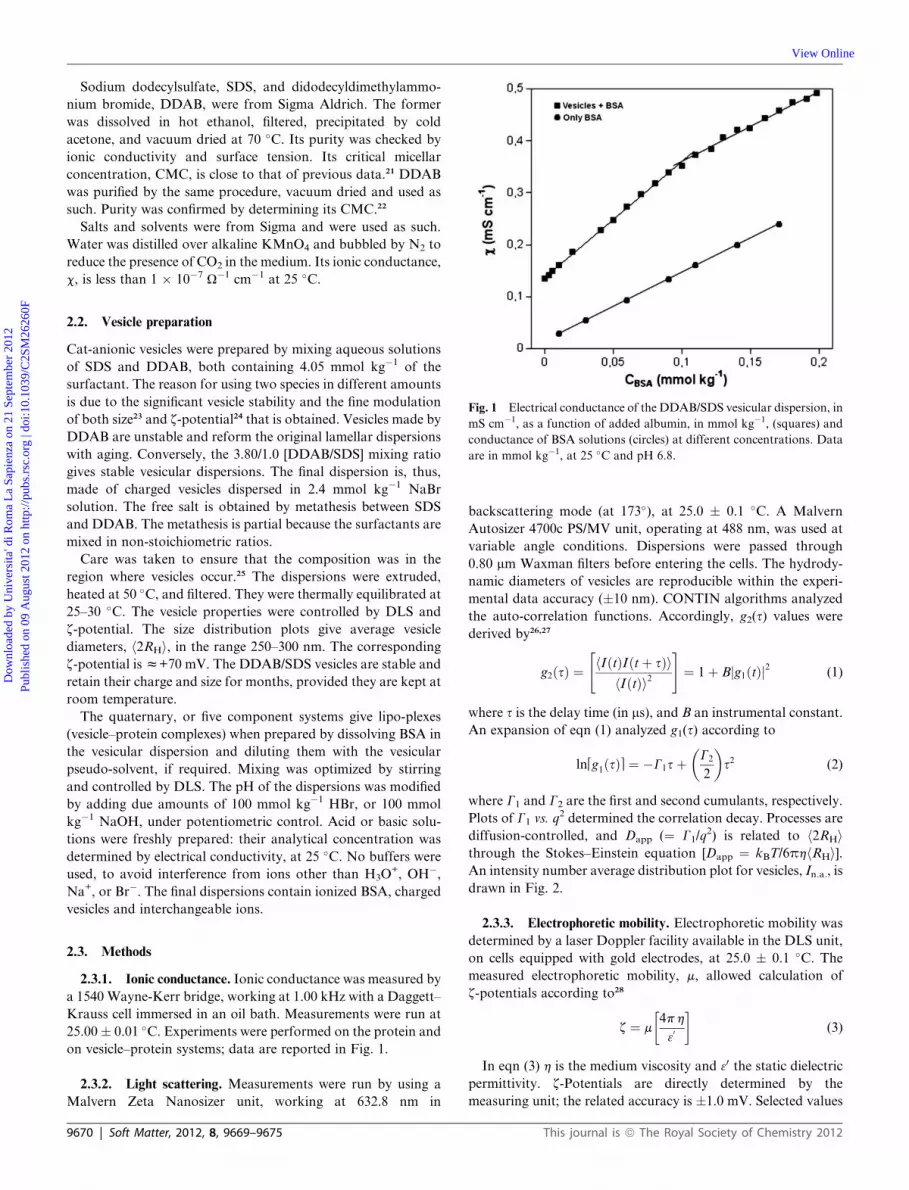
Fig. 1 Electrical conductance of the DDAB/SDS vesicular dispersion, in
mS cm�1, as a function of added albumin, in mmol kg�1, (squares) and
conductance of BSA solutions (circles) at different concentrations. Data
are in mmol kg�1, at 25 �C and pH 6.8.
2.2. Vesicle preparation
Cat-anionic vesicles were prepared by mixing aqueous solutions
of SDS and DDAB, both containing 4.05 mmol kg�1 of the
surfactant. The reason for using two species in different amounts
is due to the significant vesicle stability and the fine modulation
of both size23 and z-potential24 that is obtained. Vesicles made by
DDAB are unstable and reform the original lamellar dispersions
with aging. Conversely, the 3.80/1.0 [DDAB/SDS] mixing ratio
gives stable vesicular dispersions. The final dispersion is, thus,
made of charged vesicles dispersed in 2.4 mmol kg�1 NaBr
solution. The free salt is obtained by metathesis between SDS
and DDAB. The metathesis is partial because the surfactants are
mixed in non-stoichiometric ratios.
Care was taken to ensure that the composition was in the
region where vesicles occur.25 The dispersions were extruded,
heated at 50 �C, and filtered. They were thermally equilibrated at
25–30 �C. The vesicle properties were controlled by DLS and
z-potential. The size distribution plots give average vesicle
diameters, h2RHi, in the range 250–300 nm. The corresponding
z-potential isz+70 mV. The DDAB/SDS vesicles are stable and
retain their charge and size for months, provided they are kept at
room temperature.
The quaternary, or five component systems give lipo-plexes
(vesicle–protein complexes) when prepared by dissolving BSA in
the vesicular dispersion and diluting them with the vesicular
pseudo-solvent, if required. Mixing was optimized by stirring
and controlled by DLS. The pH of the dispersions was modified
by adding due amounts of 100 mmol kg�1 HBr, or 100 mmol
kg�1 NaOH, under potentiometric control. Acid or basic solu-
tions were freshly prepared: their analytical concentration was
determined by electrical conductivity, at 25 �C. No buffers were
used, to avoid interference from ions other than H3O+, OH�,
Na+, or Br�. The final dispersions contain ionized BSA, charged
vesicles and interchangeable ions.
2.3. Methods
2.3.1. Ionic conductance. Ionic conductance was measured by
a 1540 Wayne-Kerr bridge, working at 1.00 kHz with a Daggett–
Krauss cell immersed in an oil bath. Measurements were run at
25.00� 0.01 �C. Experiments were performed on the protein and
on vesicle–protein systems; data are reported in Fig. 1.
2.3.2. Light scattering. Measurements were run by using a
Malvern Zeta Nanosizer unit, working at 632.8 nm in
9670 | Soft Matter, 2012, 8, 9669–9675
backscattering mode (at 173�), at 25.0 � 0.1 �C. A Malvern
Autosizer 4700c PS/MV unit, operating at 488 nm, was used at
variable angle conditions. Dispersions were passed through
0.80 mm Waxman filters before entering the cells. The hydrody-
namic diameters of vesicles are reproducible within the experi-
mental data accuracy (�10 nm). CONTIN algorithms analyzed
the auto-correlation functions. Accordingly, g2(s) values were
derived by26,27
g2ðsÞ ¼"hIðtÞIðtþ sÞi
hIðtÞi2#¼ 1þ Bjg1ðtÞj2 (1)
where s is the delay time (in ms), and B an instrumental constant.
An expansion of eqn (1) analyzed g1(s) according to
lnQg1ðsÞS ¼ �G1sþ�G2
2
�s2 (2)
where G1 and G2 are the first and second cumulants, respectively.
Plots of G1 vs. q2 determined the correlation decay. Processes are
diffusion-controlled, and Dapp (¼ G1/q2) is related to h2RHi
through the Stokes–Einstein equation [Dapp ¼ kBT/6phhRHi].An intensity number average distribution plot for vesicles, In.a., is
drawn in Fig. 2.
2.3.3. Electrophoretic mobility. Electrophoretic mobility was
determined by a laser Doppler facility available in the DLS unit,
on cells equipped with gold electrodes, at 25.0 � 0.1 �C. Themeasured electrophoretic mobility, m, allowed calculation of
z-potentials according to28
z ¼ m
�4ph
30
�(3)
In eqn (3) h is the medium viscosity and 30 the static dielectricpermittivity. z-Potentials are directly determined by the
measuring unit; the related accuracy is �1.0 mV. Selected values
This journal is ª The Royal Society of Chemistry 2012

Fig. 2 Intensity-based distribution plot of vesicle sizes before, large
figure, and after filtration (inset at the top). Note the disappearance of the
peak at large h2RHi values. Data refer to compositions and mole ratios
indicated in the text, at 25 �C.
Dow
nloa
ded
by U
nive
rsita
' di R
oma
La
Sapi
enza
on
21 S
epte
mbe
r 20
12Pu
blis
hed
on 0
9 A
ugus
t 201
2 on
http
://pu
bs.r
sc.o
rg |
doi:1
0.10
39/C
2SM
2626
0F
View Online
are reported in Fig. 3. z-Potentials can be related to the surface
charge density of vesicles and lipo-plexes, s, according to7
0�30z
4p
�¼�s
k
�(3)
where 1/k is the Debye screening length (1/k ¼ d). d depends on
the medium ionic strength and, to a lesser extent, on pH.
z-Potentials can be related to electric moment calculated as the
product of average distance between charges on the vesicle and
adsorbing species per unit area.
To achieve estimates of the medium ionic strength and its role
in determining the double layer thickness, a Br� ion selective
electrode was used. According to experiments, the amount of
bromide ions is in the range 3.1 � 0.2 mmol kg�1. The double
layer thickness around vesicles, d, is controlled by ionic strength,
and, apparently, does not depend on the BSA content. Estimates
based on dielectric relaxation indicate d to be in the 2.0–5.0 nm
size range.29 Accordingly, d is about two orders of magnitude
Fig. 3 z-Potential values, in mV, as a function of added protein, in mmol
kg�1, under different pH conditions, at 25 �C. Note the inflection points
in the curves relative to pH 6.8 and 10.0, respectively.
This journal is ª The Royal Society of Chemistry 2012
lower than vesicle size (250–300 nm), and Smoluchowski’s
approximation30 holds (see below for details).
2.3.4. Circular dichroism. Circular dichroism spectra were
obtained on a Jasco J-715 spectropolarimeter, equipped with a
Xenon lamp, operating at 1.0 nm resolution. Accurately cleaned
quartz cells of 0.100 or 0.010 cm path length were used. Spectra
are the average of at least four runs, performed in the range 190–
250 nm. They are expressed as mean residue ellipticity, [q], in deg
cm2 dmol�1. Estimates of a-helix, b-strand and random coil
contents were performed by the program K2D3,31 using the 240–
190 nm wavelength range as data input.
3. Results
The system was investigated at pH 4.0,6.8, and 10.0, respectively,
at 25 �C. The BSA charge varies with pH: at pH 10.0 the nominal
number of charges is�18, at 6.8z�8; at 4.0 is about +2.32 If the
interactions are modulated by the protein state of charge and
hydrophobic contributions, it is possible to determine their
relative weights by changing the pH.
At pH 4.0 the protein is slightly, but positively, charged.
According to DLS data, formation of large lipo-plexes therein is
speculative, although BSA may eventually bind. Apparently, no
significant interactions occur. At such pH values, the size of
colloid entities in the bulk is constant and does not depend on
added albumin. The above statement is supported by visual
observation, turbidity and DLS. The dependence of h2RHi valueson added BSA, under different pH conditions, is reported in
Fig. 4. At pH 4.0, h2RHi values relative to vesicles or lipo-plexes
are close to 300 nm and do not substantially change with albumin
content. This fact indicates moderate vesicle–protein
interactions.
Fig. 4 Dependence of average lipo-plex size, h2RHi (in nm), on the
concentration of added albumin, in mmol kg�1, at 25 �C. The pH
conditions are indicated in the figure. The black and grey vertical bars
indicate the range in which the dispersions are turbid and DLS
measurements could not be performed. The onset of such regions is
considered the surface saturation threshold for vesicles. It is anticipated
at pH 10.0 because of a substantially higher negative charge on the
protein.
Soft Matter, 2012, 8, 9669–9675 | 9671

Table 1 Percentage of a, b and random coil contents for BSA indifferent systems, at pH 6.8 and 25 �C. Evaluation of the secondarystructure from CD was made by the K2D3 program [ref. 31]
Albumin content(in mmol kg�1)
a-Helix(%)
b-Helix(%)
Random coil(%)
0.01 43 13 440.01 + Vesicles 25 23 520.02 34 17 490.02 + Vesicles 14 29 570.0015 50 11 39
Dow
nloa
ded
by U
nive
rsita
' di R
oma
La
Sapi
enza
on
21 S
epte
mbe
r 20
12Pu
blis
hed
on 0
9 A
ugus
t 201
2 on
http
://pu
bs.r
sc.o
rg |
doi:1
0.10
39/C
2SM
2626
0F
View Online
The aggregation processes occurring at high pH, Fig. 4, indi-
cate the electrostatic nature of the interactions taking place
between vesicles and charge-modulated BSA. The higher the
nominal number of negative charges on the protein, the lower the
saturation threshold. Accordingly, the amount of BSA required
for surface saturation and aggregation into large entities is
inversely related to its nominal charge.
The size of lipo-plexes is high in the proximity of the turbid
region and indicates the formation of large objects. The elec-
trostatic repulsion between lipo-plexes is substantially reduced
compared to bare vesicles, and bridging between coated vesicles
and/or lipo-plexes is possible. The combination of two such
effects controls aggregation. The lower limits of turbid areas in
Fig. 4 are related to surface saturation of lipo-plexes. Support to
this statement comes from the nearly constant z-potential values
above that limit, as indicated in Fig. 3.
Similar results were inferred from ionic conductivity
measurements. Note that the lower limit of the turbid area in
Fig. 4 is equivalent to the one observed in conductivity
measurements, Fig. 1. In addition, the slope of the conductivity
curve for albumin is the same as that above saturation.
That is, adsorption is limited and no binding takes place above
saturation, because there is no more room for adsorption. This is
a consequence of the electrostatic and steric repulsions between
protein molecules adsorbing onto vesicles.
Further addition of BSA results in a significant reduction in
the size of the lipo-plexes. When the protein content is higher
than the value required for surface coverage, there is no more
room for binding. In such conditions, presumably, lipo-plexes
are destroyed by the action of osmotic gradients and electrostatic
repulsions.
Very presumably, the BSA in solution is partially self-associ-
ated. At pH 10.0 its conformation is more extended than under
spontaneous pH conditions.32 The binding efficiency is higher
compared to pH 6.8, and albumin occupies a large surface area,
Fig. 4. The compromise between such effects is responsible for
the observed behaviour.
Fig. 5 Normalized CD spectra of bovine serum albumin in water and in
the vesicular pseudo-solvent, at pH 6.8 and 25 �C. The concentrations
indicated in the figure are in mmol L�1. At higher protein contents the
quality of spectra becomes poorer.
9672 | Soft Matter, 2012, 8, 9669–9675
Evaluation of the conformational behaviour of BSA in solu-
tion was obtained by CD spectroscopy at different concentra-
tions, and in vesicular dispersions as well. CD spectra obtained at
pH 6.8 are shown in Fig. 5; the relative contents of the a-helix,
b-strand and random coil were estimated by the programK2D331
and are reported in Table 1.
The percentage of BSA secondary structure in very dilute
regimes is also reported for comparison. The b-strand and
random coil contents increased with protein concentration,
probably because of self-association. Such behaviour is empha-
sized in the vesicular dispersion. Presumably, vesicles bind to the
polypeptide chain, partially destroying the hydrogen bond
network. The contemporary presence of BSA aggregates and
BSA–vesicle association complexes cannot be ruled out ‘‘a pri-
ori’’. At pH 10.0, the effect is similar to that formerly reported,
although the signal intensity is lower.
4. Discussion
In this investigation we chose a system made of oppositely
charged surfactants, namely SDS and DDAB, forming cat-
anionic vesicles upon mixing.11–13 Such vesicles are dispersed in
aqueous NaBr, obtained by partial metathesis of sodium with
didodecyldimethylammonium ion, and of bromide with dode-
cylsulfate, respectively. The reasons for using cat-anionic species
arise from the fact that their state is not pH-dependent, being
vesicles formed by strong electrolytes. Cat-anionic vesicular
matrices, thus, circumvent most drawbacks inherent to phos-
pholipids-based vesicles in studying protein binding.14,15
In addition, in cat-anionic systems, the affinity of cationic, or
anionic, surfactants towards proteins is much lower than in the
reciprocal ones. Wennerstr€om et al.33 stated that ‘‘the most
favourable interaction is between oppositely charged surfactant
ions, despite the strong binding known to lysozyme, in case of
dodecylsulfate’’. In the above system dodecyltrimethy-
lammonium extracted the anionic species from poorly soluble
lysozyme–dodecylsulfate precipitates. The two surfactants
formed cat-anionic precipitates when the mole ratio was close to
unity, and, in sequence, cat-anionic vesicles and mixed micelles.
According to these results, the interaction strength between
surfactants in the vesicles and proteins is much lower than that
between amphiphilic species in the vesicles. Such statements are
supported by independent studies.34 Thus, the uptake of surfac-
tants from vesicles and the formation of protein–surfactant
complexes in the bulk are hardly conceivable.
Albumin charge plays a substantial role in binding efficiency.
In double-layer theories, ion binding and distribution around
This journal is ª The Royal Society of Chemistry 2012

Fig. 6 Surface coverage, w, as a function of added albumin, CBSA (in
mmol kg�1). Data refer to pH 6.8, and 25.0 �C. The upper limit of surface
coverage is indicated by a horizontal black line.
Dow
nloa
ded
by U
nive
rsita
' di R
oma
La
Sapi
enza
on
21 S
epte
mbe
r 20
12Pu
blis
hed
on 0
9 A
ugus
t 201
2 on
http
://pu
bs.r
sc.o
rg |
doi:1
0.10
39/C
2SM
2626
0F
View Online
particles are controlled by an exponential term in the Poisson–
Boltzmann equation.35–38 To quantify binding efficiency, a model
based on a Gibbs adsorption isotherm was introduced. The
reason for replacing Langmuir’s relation with the Gibbs-based
one arises from the need to account for excluded volume effects,39
more precisely for ‘‘excluded surface’’ terms. When BSA binds,
further adsorption reduces, because of surface saturation and
repulsive interactions between molecules adsorbing onto vesicles.
The overall behaviour is controlled by the overlapping of such
effects. It is accounted for by introducing a Boltzmann distri-
bution in Langmuir’s isotherm.
Usually, Langmuir’s adsorption equation is expressed as40
K0ð½L�Þ ¼�
w
1� w
�(4)
where K0 is the binding constant, [L] the concentration of
adsorbing species in the bulk and w the fraction of occupied
surface sites. Eqn (4) applies to point-like entities, or for low
binding degrees onto fixed, identical, and independent loci. For
large and highly charged entities lateral interactions between the
adsorbing species must be accounted for. For this purpose,
Chatelier and Minton41 and, more recently, Zuckermann and
Heimburg2 rewrote Langmuir’s equation for protein adsorption
onto planar surfaces according to2
K0ð½L�Þ ¼�
w
1� w
�exp
w
1� w� 3þ 3
ð1� wÞ2!
(5)
where w is as before and the exponential modulates the surface
saturation terms. The value of 3 in eqn (5) is related to the shape
of particles being adsorbed.2,41 We imposed it to be 1.0, as
assumed for planar projections of identical, spherical objects.
Binding processes were determined when the size of lipo-plexes
did not substantially change, that is in the pre-saturation region
in Fig. 4. In such regimes, the area available for binding is
constant, with a good approximation. The same holds for the
double layer thickness.
To clarify the latter point in more detail, some considerations
are required. The bulk contains about 2.4 mmol kg�1 NaBr,
obtained by ionic metathesis, albumin (and its counter-ions),
plus molecular dodecylsulfate and didodecyldimethylammonium
ions. Estimates of the CMC of cat-anionic systems42 indicate
their concentration in the molecular form to be�0.1 mmol kg�1.
That is why we shall not consider such contributions in the
following. The contribution due to the protein, however, should
be accounted for. At pH 6.8, when BSA has 8 negative charges in
excess, addition of 0.1 mmol kg�1 of protein may imply an
increase in the ionic strength up to 6–7 mmol kg�1. The effective
contribution that BSA plays, perhaps, is hardly quantified.
d values were calculated by defining the ionic strength, I, as the
sum of two contributions
I ¼�1
2
�XciZi
2z
�1
2
�hcNaBr
�ZNa
2 þ ZBr2�
þcBSA
�ZBSA
2 þ kZBSA;count2i
(6)
where k is the number of albumin counter-ions at the given pH. d
values calculated according to eqn (6) are in the 2 nm size range.
This journal is ª The Royal Society of Chemistry 2012
They are lower than those due to NaBr only and the ones inferred
by dielectric relaxation30 and by independent estimates relative to
similar systems.43 It is inferred, thus, that albumin only partially
contributes to the medium ionic strength. The reasons for this are
many: in turn, BSA is partitioned onto vesicles, may associate, or
counter-ions condense onto it. At present, the role of each
contribution is undetermined.
In the following, we assume that the surface charge density of
lipo-plexes, s, is proportional to coverage and is expressed as
s ¼�1� Zw
N
�e
A0
� �(7)
where Z is protein charge at the given pH, N the number of
binding sites onto vesicles, w the surface coverage, e the unit
charge and A0 the area per binding site. N is the ratio of vesicle/
protein areas: the uncertainty of such values can be as high as 5%.
The quantity (e/A0) in eqn (7) is the surface charge density per
binding site (the area is equivalent to that of a BSA molecule, at
different pH values) and is rewritten as s0. Rearrangement leads
to
0w ¼�1� s
s0
��N
Z
�(7)
Data elaboration based on eqn (70) provides the surface
coverage as a function of albumin concentration, Fig. 6. The
vesicle area is known as well as the protein area and charge,
under different pH conditions. Note that the number of N values
in eqn (7) and (70) depends on pH, since the area of BSA changes
accordingly.
Values below the saturation threshold, inferred by DLS, were
considered. Under such conditions, w increases in proportion to
added BSA, and levels off at high protein contents. That is,
surface saturation holds. The effect is controlled by pH; at pH
10.0, w is considerably lower than at pH 6.8, because the area
covered by a single protein is larger. At pH 6.8, Fig. 6, the surface
coverage is about 0.60 and the intrinsic binding constant per site
can be expressed as
Soft Matter, 2012, 8, 9669–9675 | 9673
Dow
nloa
ded
by U
nive
rsita
' di R
oma
La
Sapi
enza
on
21 S
epte
mbe
r 20
12Pu
blis
hed
on 0
9 A
ugus
t 201
2 on
http
://pu
bs.r
sc.o
rg |
doi:1
0.10
39/C
2SM
2626
0F
View Online
K0 ¼ 0:5½X���1� Zw
N
��2Z
(8)
where [X�] is the concentration of counter-ions released from
vesicles and other symbols are as before. Combination of eqn (8)
and (7) allows us to estimate the Gibbs energy associated with the
process, since DG� ¼ �RTln K0. Estimates based on data relative
to pH 6.8 (Z ¼ �8) and 0.1 surface coverage indicate that the
Gibbs energy is in the range –(15 � 3) kJ per binding site.
Vesicle or lipo-plex sizes by DLS are significantly higher than
in all other species, and it is possible to consider the observed
behaviour in terms of binding of small poly-ions onto large,
oppositely charged surfaces. Albumin charge depends on pH and
its interactions are effective, provided measurements are run
above its iso-electric point. In such cases there is a clear-cut
relation between pH and net protein charge. We do not consider,
in this context, the possibility of vesicle growth. The observed
growth in size, thus, is related to protein-assisted aggregation.
Classical electrostatics holds for protein distribution in the
diffuse double-layer around vesicles. Presumably, the effective
protein charge is considerably lower than its nominal value,
because of ion condensation.44 The albumin distribution around
vesicles was evaluated in terms of classical theories,45,46 to fore-
cast its average distance from the vesicle surface charges. The
distribution around vesicles of radius r was calculated by an
approximation estimating ion location, according to28
jðrÞ ¼�Ze
30r
�exp�kr (9)
where j(r) is the r-dependent potential around vesicles, and other
symbols are as before. From the second derivative of j with
respect to r we get
0V2jðrÞ ¼ k2 sinh
�Zej
kBT
�(9)
Estimates based on eqn (90) determined albumin location in the
double layer. They are based on the approximation of point-like
charged entities binding onto large surfaces.28 Eqn (90) indicatesthat 1/k substantially reduces from 2.0 to 1.4 nm (about 30%)
when pH rises from 6.8 to 10.0. We do not know what the
numerical accuracy is; however, data are self-consistent and in
agreement with experiments. Accordingly, the higher the net
charge of albumin, the closer its location on the vesicle surface.
This hypothesis is reasonable, and is consistent with the decrease
in the z-potential values formerly reported in Fig. 3.
5. Conclusion
The purpose of this research was to determine the role played by
protein charge in binding onto synthetic vesicles. We applied a
pre-existing model41 to account for binding and repulsive inter-
actions between species adsorbing onto charged vesicles. The
results indicate that binding is effective, depends on pH, and that
the area covered by protein molecules is controlled by the state of
charge. At pH 10.0, the area covered by albumin is two–three
times higher than at pH 6.8. That is, the number of neutralized
surface sites scales with protein charge. This effect is consistent
with the essentially electrostatic nature of the interactions
9674 | Soft Matter, 2012, 8, 9669–9675
between albumin and vesicles. Such conclusions are consistent
with information from electrophoretic mobility, CD and DLS.
The biomimetic of this system is noteworthy. It indicates the
substantial role played by the state of charge, charge distribution
and lipo-plex sizes in the observed behaviour. An extension to
lipid-based vesicles is possible. The physical meaning of the
present approach is relevant, given its simplicity; it can be applied
to protein–lipid systems and may be relevant for further
advances in the field.
Acknowledgements
Thanks to F. Tardani (Dept. of Chemistry, La Sapienza) and G.
Risuleo (Dept. of Biology & Biotechnol., La Sapienza) for dis-
cussing some aspects of the manuscript. Thanks to A. Bonin-
contro (Dept. of Physics, La Sapienza) for agreeing to give
preliminary information on d values inferred from dielectric
relaxation. Financial support comes from La Sapienza Univer-
sity funding grants.
References
1 T. Heimburg and D. Marsh, Biophys. J., 1995, 68, 536–546.2 M. J. Zuckermann and T. Heimburg, Biophys. J., 2001, 81, 2458–2472.
3 R. W. Malone, P. L. Felgner and I. M. Verma, Proc. Natl. Acad. Sci.U. S. A., 1989, 86, 6077–6081.
4 P. L. Felgner and G. Rhodes, Nature, 1991, 349, 351–352.5 X. Yan, Q. He, K. Wang, L. Duan, Y. Cui and J. Li, Angew. Chem.,2007, 119, 2483–2486.
6 T. Friedman, Sci. Am., 1997, 276, 96–101.7 C. Letizia, P. Andreozzi, A. Scipioni, C. La Mesa, A. Bonincontroand E. Spigone, J. Phys. Chem. B, 2007, 111, 898–908.
8 A. Bonincontro, C. La Mesa, C. Proietti and G. Risuleo,Biomacromolecules, 2007, 8, 1824–1829.
9 A. Bonincontro, M. Falivene, C. La Mesa, G. Risuleo and M. RuizPena, Langmuir, 2008, 24, 1973–1978.
10 E. F. Marques, O. Regev, A. Khan, M. da Graca Miguel andB. Lindman, J. Phys. Chem. B, 1999, 103, 8353–8363.
11 E. F. Marques and A. Khan, Prog. Colloid Polym. Sci., 2002, 120, 83–91.
12 B. F. B. Silva, E. F. Marques and U. Olsson, Langmuir, 2008, 24,10746–10754.
13 M. Youssry, L. Coppola, E. F. Marques and I. Nicotera, J. ColloidInterface Sci., 2008, 324, 192–198.
14 N. Lozano, A. Pinazo, C. La Mesa, L. Perez, P. Andreozzi andR. Pons, J. Phys. Chem. B, 2009, 113, 6321–6327.
15 J. Born�e, T. Nylander and A. Khan, Langmuir, 2001, 17, 7742–7751.16 L. Guldbrand, B. J€onsson, H. Wennerstr€om and P. Linse, J. Chem.
Phys., 1984, 80, 2221–2228.17 J. M. Campina, A. Martins and F. Silva, J. Phys. Chem. C, 2009, 113,
2405–2416.18 K. Monkos, Biochim. Biophys. Acta, Protein Struct. Mol. Enzymol.,
1997, 1339, 304–310.19 A. L. Valdivieso, J. L. Reyes Bahena, S. Song and R. Herrera Urbina,
J. Colloid Interface Sci., 2006, 298, 1–5.20 A. Bonincontro, G. Briganti, A. Giansanti, F. Pedone andG. Risuleo,
Colloids Surf., B, 1996, 6, 219–226.21 C. La Mesa, J. Phys. Chem., 1990, 94, 323–326.22 H. Kunieda and K. Shinoda, J. Phys. Chem., 1984, 88, 5126–5129.23 P. Andreozzi, S. S. Funari, C. La Mesa, P. Mariani, M. G. Ortore,
R. Sinibaldi and F. Spinozzi, J. Phys. Chem. B, 2010, 114, 8056–8060.24 A. Barbetta, C. Pucci, F. Tardani, P. Andreozzi and C. La Mesa,
J. Phys. Chem. B, 2011, 115, 12751–12758.25 E. F. Marques, O. Regev, A. Khan,M.M. da Graca and B. Lindman,
J. Phys. Chem. B, 1998, 102, 6746–6758.26 S. W. Provencher, Comput. Phys. Commun., 1982, 27, 213–227.27 A. A. D’Archivio, L. Galantini, A. Panatta and E. Tettamanti,
J. Chem. Phys., 2004, 120, 4800–4807.
This journal is ª The Royal Society of Chemistry 2012

Dow
nloa
ded
by U
nive
rsita
' di R
oma
La
Sapi
enza
on
21 S
epte
mbe
r 20
12Pu
blis
hed
on 0
9 A
ugus
t 201
2 on
http
://pu
bs.r
sc.o
rg |
doi:1
0.10
39/C
2SM
2626
0F
View Online
28 A. W. Adamson, Physical Chemistry of Surfaces, Wiley, New York,ch. 5, 5th edn, 1990, pp. 218–226.
29 Data refer to the same vesicular media used in this work. The doublelayer thickness inferred by dielectric relaxation is in the range 3–5 nm,at 25 �C. (A. Bonincontro, C. Pucci, and C. LaMesa, in preparation.)For details of the calculations estimating the double layer thicknessfrom dielectric methods, see P. Andreozzi, A. Bonincontro andC. La Mesa, J. Phys. Chem. B, 2008, 112, 3339–3345, see also ref. 36
30 A. V. Popov, N. Agmon, I. V. Gopich and A. Szabo, J. Chem. Phys.,2004, 120, 6111–6116.
31 C. Louis-Jeune, M. A. Andrade-Navarro and C. Perez-Iratxeta,Proteins: Struct., Funct., Bioinf., 2012, 80, 374–381.
32 M. Y. Khan, Biochem. J., 1986, 236, 307–310.33 A. Stenstam, A. Khan and H. Wennerstr€om, Langmuir, 2004, 20,
7760–7765.34 S. M. Mel’nikov, R. Dias, Y. S. Mel’nikova, E. F. Marques,
M. G. Miguel and B. Lindman, FEBS Lett., 1999, 453, 113–118.35 I. S. Zuhorn, W. H. Visser, U. Bakowsky and J. B. F. N. Engberts,
Biochim. Biophys. Acta, Biomembr., 2002, 1560, 25–36.36 R. Barchini and R. Pottel, J. Phys. Chem., 1994, 98, 7899–7905.37 S. I. Imai, M. Shiokawa and T. Shikata, J. Phys. Chem. B, 2001, 105,
4495–4502.
This journal is ª The Royal Society of Chemistry 2012
38 B. J€onsson, H. Wennerstr€om and B. Halle, J. Phys. Chem., 1980, 84,2179–2185.
39 (a) Y. Mao, M. E. Cates and H. N. W. Lekkerkerker, Phys. A, 1995,222, 10–24; (b) Y. Mao, M. E. Cates and N. H. W. Lekkerkerker,Phys. Rev. Lett., 1995, 75, 4548–4551.
40 M. Finessi, P. Sinha, I. Szilagyi, I. Popa, P. Maroni andM. Borkovec,J. Phys. Chem. B, 2011, 115, 9098–9105.
41 R. C. Chatelier and A. P. Minton, Biophys. J., 1996, 71, 2367–2374.
42 Y. Moroi, Micelles. Theoretical and Applied Aspects, Plenum Press,New York, ch. 5, 1992, pp. 183–194, In estimating CMC data forthe SDS-DDAB system we used the same interaction parameter asthe one reported for sodium alkylsulfate-alkyltrimethylammoniumbromide mixtures.
43 H. Aranda-Espinoza, Y. Chen, N. Dan, T. C. Lubensky, P. Nelson,L. Ramos and D. A. Weitz, Science, 1999, 285, 394–397.
44 K. S. Schmitz, Macroions in Solution and Colloidal Suspension, VHC,New York, 1993.
45 G. S. Manning, in Polyelectrolytes, ed. E. S�el�egny, M. Mandel andU. P. Strauss, D. Reidel Publishing Company, Dordrecht, 1974, pp.9–34.
46 G. S. Manning, Q. Rev. Biophys., 1978, 11, 179–246.
Soft Matter, 2012, 8, 9669–9675 | 9675