formation of a tidal dwarf galaxy in the interacting system arp 245 (ngc 2992/93)
TRANSCRIPT

arX
iv:a
stro
-ph/
0006
038v
1 2
Jun
200
0
Revised version, 19/05/2000
Formation of a tidal dwarf galaxy in the interacting system Arp 245
(NGC 2992/93)
P.–A. Duc1,2, E. Brinks3, V. Springel4,5, B. Pichardo6, P. Weilbacher7 and I.F. Mirabel8,9
ABSTRACT
Among the various phenomena observed in interacting galaxies is the ejection due
to tidal forces of stellar and gaseous material into the intergalactic medium and its
subsequent rearranging which can lead to the formation of self–gravitating tidal dwarf
galaxies (TDGs). We investigate this process with a detailed multiwavelength study of
the interacting system Arp 245 and a numerical model of the collision computed with a
Tree–SPH code. Our observations consist of optical/near–infrared broad band imaging,
Hα imaging, optical spectroscopy, H I VLA cartography and CO line mapping. The
system, composed of the two spiral galaxies NGC 2992 and NGC 2993, is observed at an
early stage of the interaction, about 100 Myr after perigalacticon, though at a time when
tidal tails have already developed. The VLA observations disclose a third partner to the
interaction: an edge–on, flat galaxy, FGC 0938, which looks strikingly undisturbed and
might just be falling towards the NGC 2992/93 system. Our H I map shows prominent
counterparts to the optical tails. Whereas the stellar and gaseous components of the
plume that originates from NGC 2992 match, the stellar and H I tails emanating from
NGC 2993 have a different morphology. In particular, the H I forms a ring, a feature
that has been successfully reproduced by our numerical simulations. The H I emission
in the system as a whole peaks at the tip of the NGC 2992 tail where a gas reservoir of
about 109 M⊙, about 60% of the H I towards NGC 2992, coincides with a star–forming
1CNRS URA 2052 and CEA–Saclay, DSM, DAPNIA, Service d’Astrophysique, 91191 Gif–sur–Yvette Cedex,
France; email: [email protected]
2University of Cambridge, Institute of Astronomy, Madingley Road, Cambridge, CB3 0HA, UK
3Departamento de Astronomıa, Apdo. Postal 144, Guanajuato, Gto. 36000, Mexico
4Max–Planck–Institut fur Astrophysik, Karl–Schwarzschild–Strasse 1, 85740 Garching bei Munchen, Germany
5Harvard Smithsonian Center for Astrophysics, 60 Garden Street, MS51, Cambridge, MA 02138, USA
6Instituto de Astronomıa, UNAM, Mexico
7Universitatssternwarte, Geismarlandstr. 11, D–37083 Gottingen, Germany
8CEA–Saclay, DSM, DAPNIA, Service d’Astrophysique, 91191 Gif–sur–Yvette Cedex, France
9IAFE, cc 67, snc 28 (1948), Buenos Aires, Argentina

– 2 –
optical condensation, A245N. The latter tidal object exhibits properties ranging between
those of dwarf irregular galaxies (structural parameters, gas content, star formation
rate) and those of spiral disks (metallicity, star formation efficiency, stellar population).
Although it is likely, based on our analysis of the HI and model datacube, that A245N
might become an independent dwarf galaxy, the dynamical evidence is still open to
debate. Prompted by the questions raised for this particular object, we discuss some
issues related to the definition and identification of TDGs and highlight some specific
conditions which seem required to form them. We finally outline what is needed in
terms of future numerical simulations in order to further our understanding of these
objects.
Subject headings: galaxies:interactions — galaxies: individual (Arp 245, NGC 2992,
NGC 2993, FGC 0938) — methods: numerical
1. Introduction
Research activity in the field of interacting galaxies has increased quite dramatically over the
last thirty years (see the recent very comprehensive review by Struck 1999). Galactic collisions
trigger a number of phenomena, such as inward–transportation of gas from distances of up to
kiloparsecs to the nucleus which is thought to be an efficient means to fuel a central starburst or
nuclear activity. The inverse process is the ejection of material into the intergalactic medium by
tidal forces. The prominent tidal tails and bridges that emanate from interacting galaxies have
proved to be important tools to study the interaction, constraining the orbital parameters (Toomre
& Toomre 1972) of the collision. Recently, attempts have even been made to use the formation
of tidal tails as a diagnostic of the mass distribution of halos within the framework of Cold Dark
Matter cosmologies (Dubinski et al. 1996, Springel & White 1999). Much less attention has been
paid to what goes on within these tidal features (see for instance Schombert et al. 1990, Wallin
1990, Hibbard et al. 2000).
Detailed H I maps of a number of interacting systems (e.g., Hibbard & van Gorkom 1996,
Kaufman et al. 1997, and references therein) have shown that a large fraction of the gaseous
component of colliding galaxies can be expelled into the galactic halos or even into the intergalactic
medium as a result of tidal forces. In some systems, up to 90% of the atomic hydrogen is observed
outside the optical disk (like in Arp 105, Duc et al. 1997). Even if part of this gas falls back
towards its progenitors (Hibbard & Mihos 1995), a significant amount of gas will be lost for the
merger remnant for time scales of at least 1–10 Gyr. The stellar/gaseous tidal debris might be
dispersed in the intergalactic/intracluster medium where the stellar component then contributes
to the diffuse background light observed in clusters (Gregg & West 1998) or recondense within
the halo of the merger and form a new generation of galaxies: the so–called tidal dwarf galaxies
(TDGs; see the review by Duc & Mirabel 1999). TDGs are typically found at the tip of tidal

– 3 –
tails at distances between 20 and 100 kpc from the merging objects, of which at least one should
be a gas–rich galaxy. They are gas–rich objects that can be as massive as the Magellanic Clouds,
form stars at a rate which might be as high as in blue compact dwarf galaxies (BCDGs) and seem
dynamically independent from their parent galaxies. Although the observational evidence for the
existence of recycled galaxies has been well established by now, their formation process is as yet
not well understood. In particular it is not known when and under which conditions TDGs form
during the interaction. This is one of the topics of the current paper.
Dating events is a general problem in extragalactic astronomy that may however be more
easily achieved for interacting systems via numerical simulations. The comparison of morpholog-
ical and/or kinematical features with predictions based on numerical simulations provides strong
indications on the age of the collision and therefore sets a constraint on the formation history of
TDGs. Interacting galaxies observed just after the first perigalacticon are particularly attractive.
Whereas they have already developed long tails and bridges, their disks are still clearly separated
and hence their intrinsic properties (i.e., orientation, sense and amplitude of their rotation, which
are key input parameters to the numerical models) can be well defined. In contrast, galaxies on
course for their first interaction do not show strong perturbations before reaching perigalacticon
and hence do not provide a simple handle on any time scale. On the other hand, evolved mergers
have lost all memory of the initial properties.
Arp 245, an interacting system consisting of two spiral galaxies, NGC 2992 and NGC 2993,
appears to be an interesting testcase as it can be fairly easily modelled. Moreover, it is a relatively
nearby system, at an adopted distance of 31 Mpc10. Its prominent tidal tails host a tidal dwarf
galaxy candidate which, because of its proximity, can be studied in detail. Finally Arp 245 has
already been well studied. NGC 2992, in particular, has been the object of numerous articles
focusing mostly on its active, Seyfert 1.9 nucleus. Radio continuum maps have revealed a striking
pair of loops near the nucleus with a “Figure–8” shape (Ulvestad & Wilson 1984) which has later
on been detected at other wavelengths as well (Wehrle & Morris 1988, Chapman et al. 2000).
Glass (1997) has monitored the AGN in the near–infrared and has reported an outburst. Durret
& Bergeron (1987), Durret & Bergeron (1988), Colbert et al. (1996) and Allen et al. (1999) have
studied the ionization cone extending from the AGN and the surrounding extended emission line
regions. Evidence for outflow has been claimed by Colbert et al. (1996) and Marquez et al. (1998).
NGC 2992 has been observed at many wavelengths from the X–ray regime, where it is a strong
emitter (Marshall et al. 1981, Gilli et al. 2000), to the centimetre wavelengths (Condon et al. 1982).
Single dish H I (Mirabel & Wilson 1984) and CO (Sanders & Mirabel 1985) data are also available.
NGC 2993 is mentioned in several catalogs of starburst galaxies but has not yet been the subject
of any individual study. Surprisingly, the fact that both galaxies are partaking in a spectacular
interaction has largely been ignored, apart from the photometric work by Schombert et al. (1990).
10We use in this paper H0 = 75 km s−1 Mpc−1= 100 h km s−1 Mpc−1. At the distance of Arp 245, 1′ corresponds
to 9 kpc

– 4 –
We decided to subject Arp 245 to a comprehensive multiwavelength study. In this first paper,
we detail the observations, present in particular the first complete H I map of the system, and assess
the status of the interaction with the help of numerical N–body/hydrodynamical simulations. We
then focus on the tidal features, emphasizing the properties of the tidal dwarf galaxy candidate.
Based on these results, and of similar such systems from the literature, we attempt to better under-
stand the formation process of TDGs. In a second paper (Paper II, in prep.), we will concentrate
on the internal properties of NGC 2992, and study in particular its Active Galactic Nucleus (AGN)
and the ionization filaments.
2. Observations
Table 1 and 2 summarize our multi–wavelength observations11 of Arp 245 and lists technical
details. In the next sections we will discuss these observations in turn.
2.1. Optical and near–infrared broad–band imaging
Optical broad band BVR images of Arp 245 have been collected in February 1995 with the
3.5–m NTT at la Silla observatory. The red arm of EMMI has been used. The weather conditions
were photometric and the seeing varied between 0.′′9 and 1.′′2. The 9.′2×8.′7 field of view of the
R–band image covered the entire interacting system including the tidal features whereas the B12
and V band images were somewhat offset and missed a small part of the southern tail. However,
B and V images of this part of the system had been previously taken with the PUMA camera on
the CFHT13 in February 1992. The weather conditions at CFHT were poor and the seeing was 1′′.
Finally BVR images of a field situated to the South-West of NGC 2993 were obtained in January
2000 with the ESO 3.6m telescope. The weather conditions were photometric and the seeing was
1′′. Images from the three telescopes were eventually combined. Landolt fields of photometric
standard stars (Landolt 1992) were observed for flux calibration.
Near–infrared JHK′ images of NGC 2992 were obtained in February 1996 with the IRAC2B
camera installed on the MPG/ESO 2.2m. The field of view of each individual image was 2.′1×2.′1.
Sky images were taken of adjacent fields offset by 2′. The entire field of NGC 2992, including the
tidal tail, was covered with a mosaic technique. The highest effective integration time was reached
towards the tail which was observed for a total of 15 min in J, 12 min in H and 13 min in K′.
11Partly carried out at the European Southern Observatory, La Silla, Chile (ESO No 54.A–0606, 56.A–0757, 64.N–
0163 and 64.N–0361)
12The B–like filter, Bb, optimized for the red arm of EMMI, has actually been used.
13The Canada–France–Hawaii Telescope is operated by the National Research Council of Canada, the Centre
National de la Recherche Scientifique de France and the University of Hawaii.

– 5 –
Several photometric standard stars from the list of UKIRT faint IR standards (Casali & Hawarden
1992) were observed under photometric conditions. The seeing varied between 1.′′3 and 1.′′5.
The reduction of the optical/NIR data has been performed within IRAF with standard tasks
from the ccdred package complemented by self–written scripts which perform a semi–automatic
processing of the NIR data set. An astrometric correction achieving a precision of ∼ 0.′′3 was
performed to each optical/NIR image using the positions of several tens of stars from the USNO A1.0
astrometric catalog (Monet 1996) queried via the ESO skycat browser. The frames were corrected
for distortions during this process. They were registered, PSF–matched and combined to produce
color maps. An optical “true color” image of the system was constructed from the combination of
the NTT/CFHT/3.6m B, V, and R images. It is shown in Figure 1. The monochromatic V–band
image is displayed in Figure 2.
Photometry was carried out on the registered images with the digiphot package in IRAF.
Polygonal apertures were chosen to enclose respectively the disks of NGC 2992 and NGC 2993,
their outer regions only, the bridge between both systems, the tidal tails, and the tidal dwarf
galaxy. Because of the complex geometry of the system, the sky level was measured manually and
averaged at numerous positions surrounding the objects. This procedure was chosen so as to ensure
that sky contamination by stars or galaxies would be minimal. The photometric accuracies take
into account variations in the sky background as well as photon noise. The magnitudes, corrected
for Galactic extinction are listed in Tables 3, 4, and 5. Circular aperture photometry of both
NGC 2992 and NGC 2993 was performed as well, for comparison purposes. In the optical, our V
and R magnitudes differ by less than 0.05 mag with data in the literature (Prugniel & Heraudeau
1998) whereas in the B–band, the agreement is not as good. The B magnitudes were systematically
too faint by 0.1 mag. A scatter in the color terms in the blue is expected since the EMMI Bb
filter which we have used slightly differs from a Bessel B filter. As the system does not show large
variations in color, we have applied to all B–band magnitudes a correction corresponding to an
offset of 0.1 mag. This post–calibration has been later on validated using the B–band photometric
measurements obtained in January 2000. In the near–infrared, comparisons are more difficult due
to the intrinsic variability of the nuclear flux. Glass (1997) monitored the AGN and measured
excursions of the central K–band flux of up to 0.6 mag due to outbursts. Colors appear to be less
affected though and our J–H and H–K′ colors are within 0.1 mag of those of Alonso-Herrero et al.
(1998). On average our optical/NIR photometry might be affected by systematic errors of up to
0.1 mag. Note that the instrumental errors quoted in Tables 4 and 5 do not take this into account.
2.2. Hα imaging
An image with a narrow–band filter centered on the redshifted Hα line has been obtained with
EMMI during the NTT run. The filter which has a width (FWHM) of 66A includes light from
Hα and [NII] . The image covers all of NGC 2992, including its tidal plume and bridge, and the
disk of NGC 2993 with part of its tidal tail. Only the southern most region has been missed. The

– 6 –
exposure time was 15 min. The continuum was obtained by using a similar narrow–band filter but
offset in wavelength. A halftone Hα image is displayed in Figure 3 and intensity contours of the
line emission towards NGC 2993 and towards the northern tidal tail are shown in Figure 4 and
Figure 17, respectively. A contour map towards NGC 2992 will be presented in Paper II. Our Hα
image shows a number of structures not seen in the maps previously published (see e.g. Colbert
et al. 1996, Allen et al. 1999, for some recent ones), such as long ionization filaments outside the disk
of NGC 2992 and H ii regions at the tip of the northern tidal plume. Flux calibration was achieved
by observing a spectroscopic standard star from the list of Hamuy et al. (1992) observed with same
setup. Our integrated flux towards NGC 2992 agrees to within 20% with the flux measured by
Colbert et al. (1996).
2.3. Optical spectroscopy
Longslit spectroscopic observations were carried out in February 1995 with the NTT and
EMMI. The grism used has an intrinsic resolution of 9A. Coupled with the red–arm CCD, it covers
the wavelength range 3800–8400 A. Two spectra were obtained along an axis roughly parallel to the
morphological axis of NGC 2992. The position angles were −18◦ and −20.2◦. The 1.′′5 wide slits
encompassed the western regions of NGC 2992 and two of the brightest clumps of the tidal dwarf
galaxy at the tip of the plume. The total integration time was 45 min divided in three exposures.
The spectra of several spectroscopic standard stars from the list of Hamuy et al. (1992) were
measured through a wide slit. Weather conditions were photometric. A spectroscopic follow–up
was performed in January 2000 with the EFOSC2 instrument installed on the ESO 3.6m telescope.
The MOS mode offered by punched masks was used to obtain the optical spectra of several extended
objects near NGC 2992 as well as some new condensations in its tidal dwarf. The grism used had
a wider wavelength coverage but a slightly lower spectral resolution. Five exposures were obtained
and the total integration time was 100 min.
Data reduction, wavelength and flux calibrations were performed with the twodspec package
within IRAF following standard procedures. Line fluxes and errors were measured with the IRAF
splot task. Data were corrected for extinction using the formula:
I(λ)
I(Hβ)=
F (λ)
F (Hβ)∗ 10c∗f(λ)
where F (λ) is the observed line flux, f(λ), the reddening function taken from Torres-Peimbert et al.
(1989) and c the logarithmic reddening correction at Hβ obtained from a constant Hα/Hβ Balmer
decrement of 2.85. The lines were not corrected for underlying stellar absorption. Table 6 displays
the values of c, the absolute flux and equivalent width of the Hβ line and the observed/corrected
fluxes relative to Hβ of the principal lines. The accuracy of the absolute flux calibration has been
checked using our Hα narrow–band image. The integrated Hα fluxes of several emission line regions
extracted from the Hα image and from the slit spectra agree to within 5% to 15%.

– 7 –
2.4. VLA H I observations
We obtained observations with the Very Large Array (VLA)14 of Arp 245 in the 21–cm line of
neutral hydrogen (H I) in September 1997, using the CS–array15. We used the calibrator 1331+305
for absolute flux calibration and 0902–142 as secondary calibrator. We determined a flux density
for 0902–142 of 2.89 ± 0.01 Jy. The data were taken in correlator mode 4 with two passbands
(or IFs) measuring both right and left hand polarization. Each band contained 32 channels, and
we used an 8–channel overlap between the bands. The first and last three channels of each band
were discarded because of the decreasing gain toward the edges of the bandpass. Full details of the
observations are presented in Table 2.
Data reduction and calibration were performed using the Astronomical Image Processing Sys-
tem (aips) package, following standard procedures. The uv–data from each of the two IFs were
calibrated separately. The visibilities were inspected and bad data points due to interference were
removed. Because of the presence of strong solar interference at the lowest spatial frequencies,
we excluded baselines shorter than 1 kλ (or about 210 m) in the calibration. After the standard
amplitude and phase calibration we went through one cycle of self–calibration (phase only), im-
proving the final quality of the images. As reference source we used the bright nuclear emission of
NGC 2992 which has a flux density of 190 ± 2 mJy.
For each IF we generated “dirty” data cubes of line plus continuum emission. After running
several tests we decided that the best maps were those made with the task imagr using the default
values for the robust weighting scheme and including the entire observed uv–range. The first
15 and the last 15 channels of IF1 and IF2 respectively, were found to be free of line emission.
From each corresponding IF the average of those line–free channels was subtracted to construct
data cubes with line emission only. An average of all line free channels from both IFs was used
to construct a map of the continuum emission. This map, after cleaning, is shown in Figure 6.
Besides the nuclear emission due to NGC 2992 we see emission corresponding to the nucleus of
NGC 2993. This emission is resolved and measures 12.2′′ × 9.4′′ at a position angle of 58◦. Its peak
flux corresponds to 49 mJy.
After continuum subtraction the maps were inspected and cleaned, and the two IFs were
appropriately merged. In order to isolate the H I emission in the maps from the noise, the cube,
which has originally a resolution of 19.4′′ × 14.4′′ was convolved to a circular beam of 35′′. We
clipped this cube at a level of twice the rms noise. We inspected all features in this cube, retaining
only those regions which show emission in at least five consecutive channels. We then went back
14The VLA is operated by the National Radio Astronomy Observatory, a facility of the National Science Foundation
operated under cooperative agreement by Associated Universities, Inc.
15This configuration results in a resolution equivalent to that of C–array, but has some antennae placed at locations
usually employed for D–array, with the aim to provide sufficient short spacing information so that separate D–array
observations are not necessary.
– 8 –
to the original, high resolution cube and applied conditional blanking, retaining emission in the
high resolution cube from only those regions which were preserved in the processed 35′′ cube. As
a fringe benefit this process removed most if not all traces of solar interference. Besides emission,
H I absorption is seen towards the strong nuclear source in NGC 2992. We ensured that this was
preserved in the conditional blanking process. In addition to a blanked cube at the highest resolution
(19.4′′ × 14.4′′) we produced lower resolution cubes as well, such as at 25′′ × 25′′ and 30′′ × 30′′.
As a last step we obtained the moments of the cubes. The conversion factors from mJybeam−1 to
Kelvin brightness temperatures are listed in Table 2.
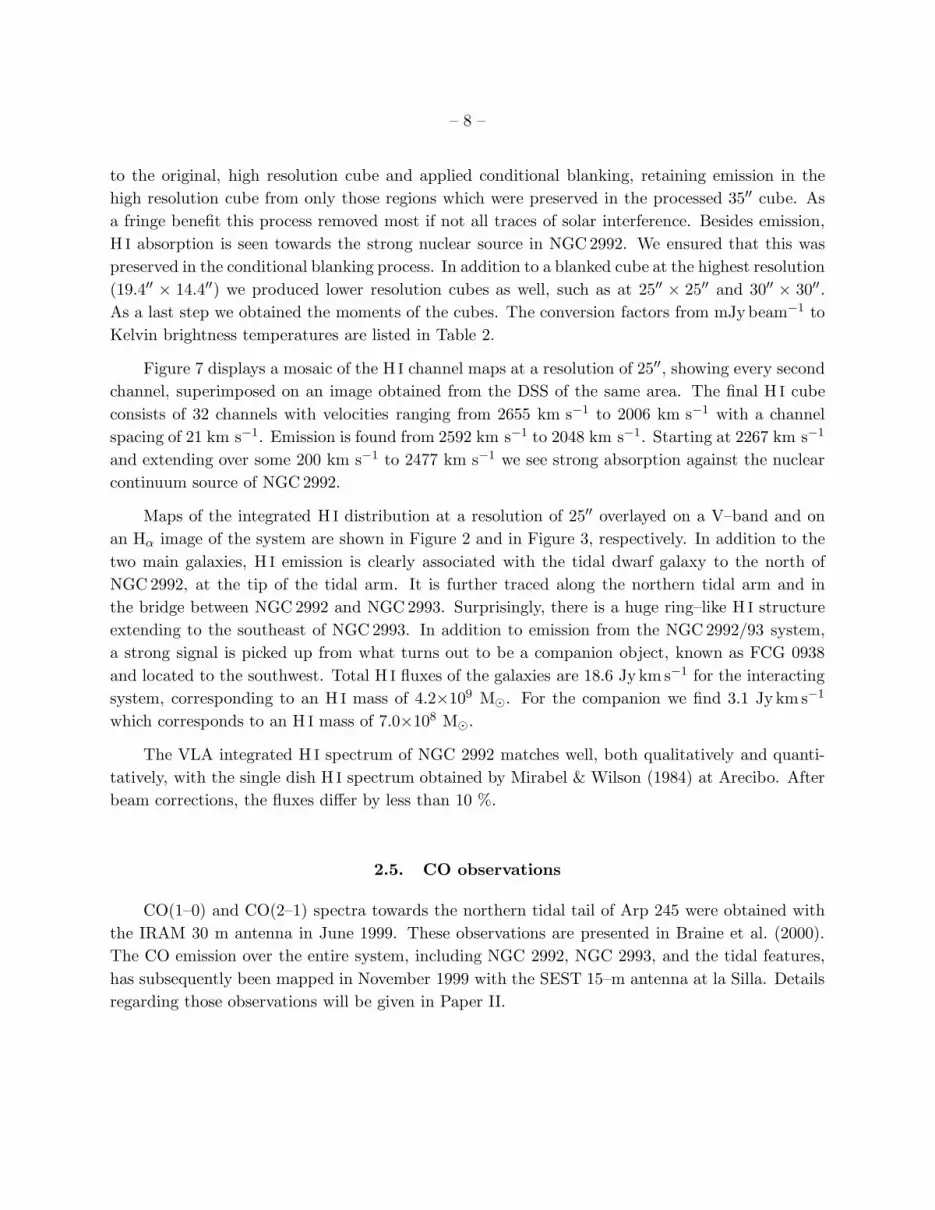
Figure 7 displays a mosaic of the H I channel maps at a resolution of 25′′, showing every second
channel, superimposed on an image obtained from the DSS of the same area. The final H I cube
consists of 32 channels with velocities ranging from 2655 km s−1 to 2006 km s−1 with a channel
spacing of 21 km s−1. Emission is found from 2592 km s−1 to 2048 km s−1. Starting at 2267 km s−1
and extending over some 200 km s−1 to 2477 km s−1 we see strong absorption against the nuclear
continuum source of NGC 2992.
Maps of the integrated H I distribution at a resolution of 25′′ overlayed on a V–band and on
an Hα image of the system are shown in Figure 2 and in Figure 3, respectively. In addition to the
two main galaxies, H I emission is clearly associated with the tidal dwarf galaxy to the north of
NGC 2992, at the tip of the tidal arm. It is further traced along the northern tidal arm and in
the bridge between NGC 2992 and NGC 2993. Surprisingly, there is a huge ring–like H I structure
extending to the southeast of NGC 2993. In addition to emission from the NGC 2992/93 system,
a strong signal is picked up from what turns out to be a companion object, known as FCG 0938
and located to the southwest. Total H I fluxes of the galaxies are 18.6 Jy km s−1 for the interacting
system, corresponding to an H I mass of 4.2×10⁹ M⊙. For the companion we find 3.1 Jy km s−1
which corresponds to an H I mass of 7.0×10⁸ M⊙.
The VLA integrated H I spectrum of NGC 2992 matches well, both qualitatively and quanti-
tatively, with the single dish H I spectrum obtained by Mirabel & Wilson (1984) at Arecibo. After
beam corrections, the fluxes differ by less than 10 %.
2.5. CO observations
CO(1–0) and CO(2–1) spectra towards the northern tidal tail of Arp 245 were obtained with
the IRAM 30 m antenna in June 1999. These observations are presented in Braine et al. (2000).
The CO emission over the entire system, including NGC 2992, NGC 2993, and the tidal features,
has subsequently been mapped in November 1999 with the SEST 15–m antenna at la Silla. Details
regarding those observations will be given in Paper II.

– 9 –
3. Results
3.1. Status of the interaction
3.1.1. The galaxies involved
Table 3 summarizes the global properties of all members of the system involved in the inter-
action: the two spirals of moderate luminosity, NGC 2992 and NGC 2993, and the dwarf galaxy
FGC 0938.
The two galaxies NGC 2992 and NGC 2993 have radial velocities which differ by less than
100 km s−1 and suffer a strong tidal interaction. NGC 2992 is a disturbed Sa spiral seen nearly
edge–on at an inclination of 70◦. On top of having an active Seyfert 1.9 nucleus and a perturbed
morphology due to the interaction, NGC 2992 shows a number of peculiarities. A prominent dust
lane crosses most of the galaxy from the North–East to the South–West (see Fig. 1). It could be the
remnant of a past merger. The H I distribution is rather complex. On top of the expected rotating
disk, fast–moving clouds are observed. Finally, the galaxy exhibits several ionization filaments that
are located well beyond the ionization cone associated with the AGN. They can be seen in Figure 3.
Their kinematics is highly suggestive of outflows. Paper II will be devoted to the study of these
phenomena which are likely more directly related to the nuclear activity than to the interaction.
NGC 2993, a face–on Sab, is situated at about 3′(27 kpc) to the South–East. On a true color
image (see Fig. 1), NGC 2993 appears much bluer than its companion. Its blue color index (B − V=
0.3 mag) and its rather high far–infrared to blue luminosity ratio (LFIR/LB= 1.7) is suggestive of an
active starburst. The H2 content is however rather low (Sofue et al. 1993) and the far–infrared to
H2 mass — a measure of the star formation efficiency — is much higher than in classical starburst
galaxies (Sanders & Mirabel 1985). Active star–forming regions, as traced by Hα, are present all
over the galaxy (see Fig. 4), but are more concentrated in the clumpy inner regions where the
H I peaks as well. Some, red unresolved stellar clumps can be seen in the outskirts of the galaxy,
especially to the North. They might be old globular clusters.
Our VLA map (Fig. 2) disclosed a third partner at roughly the same velocity, lying to the
south–west which is listed in the Catalog of Flat Galaxies (Karachentsev et al. 1993) as FGC 0938.
On our CCD image (Fig. 5), it appears as an almost undisturbed edge–on disk with an ellipticity
of 0.83, consistent with an inclination of 80◦. With MB = −15.5, FGC 0938 has the absolute blue
magnitude of a dwarf galaxy. Its projected blue central surface brightness is 22.5 mag arcsec−2.
Its rotating H I disk looks regular apart from perhaps a small extension to the West. The peak
rotational velocity is of order 60 km s−1, corroborating its classification as a dwarf galaxy. Despite
their different environments, FGC 0938 has many properties in common with the superthin galaxy
UGC 7321 recently studied by Matthews et al. (1999). It would be remarkable if a galaxy involved
in a tidal interaction would manage to keep a flat disk. This is a strong indication that FGC 0938
is presently heading for its first encounter, falling towards the NGC 2992/93 system.

– 10 –
3.1.2. The tidal features
Arp 245 features three major tidal structures resulting from the interaction between NGC 2992
and NGC 2993: two long tidal tails escaping from both spiral galaxies and a bridge between them.
Their properties are summarized in Table 4. The northern tail associated with NGC 2992 is about
16 kpc long, a rather modest extent compared to the 100–kpc long antennae in the prototypical
interacting systems NGC 4038/39 and NGC 7252. This might be due to the smaller size and earlier
morphological type of the progenitor and to the fact that the interaction is witnessed in its early
phase when the tails did not have time to fully develop. The northern tail has roughly the same
distribution and extent in both its stellar (optical) and gaseous (H I) components. The optical tail
looks like a plume, spreading at its tip where the H I peaks at a column density of 2×1021 cm−2.
This sub–structure, detected in all optical and near–infrared bands, suggests the formation of a
tidal dwarf galaxy. It hosts several star–forming regions, clearly visible in the Hα map (see Fig. 17)
at the location of the H I clump. The integrated colors of the tail as a whole (B − V= 0.57, V − K=
0.42) are similar to the colors of the outer regions of NGC 2992 (B − V= 0.62, V − K= 0.43). Some
slightly bluer colors by 0.1 mag are measured within the H ii regions. The stellar population of the
tail is hence dominated by old stars pulled out from the parent galaxy with some weak contribution
from young stars born in situ in the tidal object. The TDG candidate will be studied in more detail
in Sect. 3.3.
A diffuse stellar bridge, with a maximum V surface brightness of 24 mag arcsec−2, connects the
two spiral galaxies. The orientation of its H I counterpart seems to be slightly twisted. No stellar
clusters no H ii regions or H I substructures are found there. Instances of star–forming bridges do
exist (e.g., NGC 6845; Rodrigues et al. 1999) but are in general quite rare among interacting
systems.
The tail emanating from NGC 2993 to the East is highly curved in the plane of the sky. This is
particularly visible in its H I component which shapes like a ring. The projected total extent of the
NGC 2993 tail is 30 kpc. The optical tail appears sharp edged at its base and more diffuse further
out. The southern and western parts of the H I ring–like structure have no optical counterparts
up to a limit of µV=25 mag arcsec−2. No obvious H ii regions are found along the tail, at least
over the area covered by our Hα image. Further out, the absence of bright optical condensations in
the broad band images strongly suggests that star formation, if any, is very weak there, contrary
to the NGC 2992 tail. The main difference between the two tidal features is their respective H I
column density which turns out to be much lower in the NGC 2993 tail. The few H I condensations
scattered over the ring have all peak column densities lower than 3×1020 cm−2. Surprisingly, the
gobal color of this quiescient tidal feature (B − V = 0.39) is bluer than that of the northern star–
forming tail and similar to that of the outskirts of its parent galaxy, NGC 2993, a starburst spiral.
The blue color of the tidal tail might therefore reflect the past star–forming activity in the parent
galaxy.
Our VLA map revealed one more feature with, perhaps, a tidal origin and lying east of the

– 11 –
NGC 2993 ring, a detached H I cloud with a mass of 6.5×10⁷ M⊙. This object, visible in several
VLA channels, and therefore likely real, has no optical counterpart.
In total the H I in tidal features contributes to about 45% of the total H I mass measured in
Arp 245. The H I mass of the northern tail is about 60% of that of NGC 299216 whereas the H I
mass of the southern ring is 80% of that of NGC 2993. Such large values are typical of gas–rich
interacting systems where the contribution of the tails may reach 90% (such as in Arp 105; Duc
et al. 1997). On the other hand the tidal features contain a much weaker proportion of stars. The
tail associated with NGC 2992 and NGC 2993 contains respectively 17% and 13% of their stellar
luminous population. Such values have been determined from the V–band luminosities, assuming
that the M/L ratio is the same for all objects.
The 2D kinematics of the southern tail derived from the H I datacube is quite smooth (see the
channel map in Fig. 7 and the velocity map in Fig. 11). The ring shows a coherent velocity field
which is matched by our simulations (see below), as does the northern tail just south of the tidal
dwarf. We will show in Sect. 3.3.6 that the kinematics of the TDG itself is probably decoupled
from that of its host tail.
3.1.3. Other unrelated objects
Weedman (1971) reported the presence of a blue stellar object, Weedman 2 or [BOB94] 0943-
1403 (Bowen et al. 1994), near the tip of the tidal plume of NGC 2992. Based on low resolution
spectroscopic data, Burbidge et al. (1972) claimed that it could be a QSO somehow “associated”
with NGC 2992. We obtained in January 2000 with EFOSC2 at the ESO 3.6m telescope a spec-
trum of this object. It turns out to be a star. During the same run, we measured the red-
shifts of two uncatalogued background galaxies that are situated North of NGC 2992 at resp.
α = 09h45m45.55s, δ = −14◦16′23.7′′ and α = 09h45m51.14s, δ = −14◦15′43.8′′ (J2000). Both lie at
a redshift of z = 0.111.
3.2. A numerical model of the interaction
In this paper, we are mainly interested in a first, approximate model of the NGC 2992/93
system, capturing its essential features while not necessarily providing a perfect fit to all its details.
In a future paper, we plan to systematically refine this model and improve on its ability to fit the
finer features of the system. The model developed here is particularly useful to date the various
phenomena observed in Arp 245, to reconstruct its history and to predict its ultimate fate.
16The mass of the HI clouds seen in absorption towards the nucleus of NGC 2992 has not been included

– 12 –
3.2.1. Parameters of the collision
The first encounter models based on restricted N–body simulations date from almost thirty
years ago when Toomre & Toomre (1972) were able to approximately match the morphology of
four well–studied interacting systems. Since then, numerical methods have become much more
sophisticated but the number of interacting systems with tidal tails that have been modeled in
a self–consistent way with numerical simulations is still small (see e.g., Salo & Laurikainen 1993,
Thomasson & Donner 1993, Mihos et al. 1993, Hibbard & Mihos 1995). The main reason for that
is the huge parameter space spanned by the numerous free parameters of any such model (for
instance, those defining the orbital plane), precluding simple methods to find a matching solution
for an observed system. Moreover the parameters describing the structure of the colliding galaxies
might not be well constrained by the observations. In that respect, Arp 245 appears as a particularly
attractive system to model. The morphology and dynamics of each of the interacting partners are
indeed fairly well known. The large parameter space of possible collision scenarios can thus be
reduced drastically by making reasonable assumptions and “educated guesses” about the colliding
galaxies.
A sketch of the adopted geometry for our simulations is shown in Figure 8. Coordinates where
the orbital plane coincides with the xy–plane have been used while the orientations of the spin
vectors of the two disk galaxies have been specified in terms of ordinary spherical coordinates
(θ, φ).
The nearly face–on orientation of the disk of NGC 2993, within 20◦, and the orientation of
its tidal arm emanating in the north–west suggest that its spin vector points into the plane of the
sky. We have therefore identified the plane of the sky with the plane of the disk of NGC 2993,
i.e., the observer is located in the opposite direction of the spin vector of NGC 2993. The disk of
NGC 2992 is seen about 70◦ inclined to the plane of the sky with the upper east side being closer
to the observer (Chapman et al. 2000). Hence we have assumed that the spin vectors of the disks
of NGC 2992 and NGC 2993 enclose exactly an angle of 70◦ with each other. The prominence of
both tidal tails suggests a largely prograde encounter of the two galaxies, with the vector of the
orbital angular momentum presumably lying somewhere within the cone spanned by the two spin
vectors, or at least relatively near to it. To further simplify things, we have here assumed that the
orbital angular momentum lies in the plane spanned by the two spin vectors.
The velocity field shows that the center of NGC 2992 and its northern tail is blue–shifted with
respect to NGC 2993. Also note that the well–developed tails of the two galaxies indicate that
the system is seen after its first encounter (as will be confirmed below). In this phase, NGC 2992
and its tail can be expected to move towards the negative y–axes. The tidal response of the stellar
disk of NGC 2993 seems relatively weak compared to that of NGC 2992 which is in the process
of forming a dwarf galaxy out of its tidal debris. This suggests that NGC 2992 is colliding almost
fully prograde. Finally, we have restricted ourselves to parabolic, zero–energy encounters. The
angular momentum of the orbit has been expressed in terms of the minimum separation b of a

– 13 –
corresponding Keplerian collision.
The galaxies themselves were modeled with a massive and extended dark halo with an adia-
batically modified NFW–profile, an embedded exponential stellar disk, a stellar bulge, and a gas
distribution in the disk (see details on the numerical representations of these models in Springel &
White 1999). Note that in many observed disk galaxies the H I gas is substantially more extended
than the exponentially distributed stars. To be able to follow the gas at large radii, we have split
the available gas into two components of equal mass, one distributed just like the stars and one
forming a more extended component with a constant surface mass density.
3.2.2. Numerical simulations
Using fully self–consistent simulations carried out with the Tree–SPH code GADGET, we
have coarsely explored the parameter space remaining under the above assumptions until a best–
matching solution was found. More specifically, the numerical model presented below is specified
by the following parameters. The virial velocities of the two galaxies were set to Vc = 120 km s−1,
i.e. each of them has a total mass of 4.0× 10¹¹h−1M⊙. We have assumed that a fraction md = 0.05
of the total mass resides in the disk, 30% of it in the form of gas, the rest as collisionless stars. A
fraction mb = 0.016 of the total mass has been put into a central stellar bulge. Adopting a spin
parameter17 of λ = 0.06, the resulting exponential scale length of the disks is Rd = 2.7h−1kpc.
Half of the gas has been distributed in the disk like the stars, and the other half in a disk of radius
8Rd with constant surface mass density. For the orbit of the collision, we adopted the parameters
θ1 = 50◦, φ1 = 90◦, θ2 = 20◦, φ2 = 270◦, and b = 4h−1kpc (see Fig. 8). The numerical simulation
shown here used 60000 particles for the dark matter, 40000 for the stellar disk, 10000 for the stellar
bulge, and 40000 for the gas. Cooling of gas, star formation and supernova feedback were modeled
as in Springel (2000). The cooling function used to describe radiative dissipation effectively cuts off
at 104 K, when the gas becomes neutral. Some of the gas can reach somewhat lower temperatures
by adiabatic expansion. Star formation is assumed to convert gas into collisionless stellar material
at a rate given by a simple Schmidt-type law, and supernovae feedback is modeled by an effective
turbulent pressure term. A full description of the thermodynamic properties of this model is given
in Springel (2000).
The simulation begins when the galaxies’ dark halos just start to touch, i.e., at a separation
of 240h−1kpc. It then takes about 1h−1Gyr to reach the perigalacticon for the first time, when
strong tidal forces eject stars and gas out of the disks. This material forms the pronounced bridges
and tails in Arp 245 when the galaxies separate again. Eventually, they fall back together for a
second encounter, which takes place about 700h−1Myr after the first collision. One hundred Myr
17The spin parameter λ is defined as λ = L|E|1/2
GM5/2, where L is the angular momentum, E the total energy, and M
the mass of the galaxy.

– 14 –
later the galaxies completely coalesce and form a single merger remnant. This time evolution of
the system is shown in Figure 9.
From Figure 9, it is clear that we observe the system NGC 2992/93 at a time between the first
and second encounter. In this phase of the collision, the tidal features are very well defined, whereas
they are going to be much more diffuse at later stages of the collision, which is a general result from
simulations of other systems. Our numerical simulation provides the best match for the morphology
of the system at a time of around 100h−1Myr after the first encounter, i.e. 1.1h−1Gyr after the
start of the simulation18. Figure 10 shows the face–on projection of the numerical model at this
time. After matching the morphology it becomes of course interesting to study the velocity field
of the gas distribution at this moment of the interaction. As Figure 11 shows, the overall pattern
of gas flow is well reproduced by our model. Also, the striking ring of gas around NGC 2993 has
nicely formed in our model. Most of this gas is simply stemming from the long tail which is pulled
from the extended HI disk. The inclination of the disk relative to the orbital plane helps to curl up
the tail in projection to an almost closed ring. There is actually some shocked gas from the region
of the bridge that helps closing the ring.
3.2.3. Limitations of the model
The simulation shown in this paper corresponds to the model which so far provided the best
match to the morphology of the encounter. While we are confident that the orbital geometry
is reasonably well determined in this model, the internal structure of the galaxies is less well
defined and may be subject to revision when we refine the model using more detailed comparisons
between the simulation and the observational data. In particular, we have here assumed that the
two colliding galaxies have the same mass and the same internal structure, an assumption that is
unlikely to hold in reality.
Besides, the dwarf galaxy FGC 0938 has not been taken into account. Having preserved a
flat disk, this galaxy is most probably plunging into the system and has not yet faced its first
encounter with NGC 2992/93. Therefore, this intruder has not yet affected the interaction between
the two spirals much. Later on, this galaxy might however slightly perturb the merging history of
the system.
Perhaps the main shortcoming of the present model is that it does not form the tidal dwarf
galaxy seen in the northern tail of NGC 2992 although there is at least some gaseous overdensity at
about the right place. It remains to be seen whether the tidal dwarf can be produced by a simple
encounter model like the one examined here or whether additional physics or more sophisticated
collision scenarios have to be invoked.
18Near perigalacticon the timestep in our adaptive timestep code is of order 0.05 h−1Myr.

– 15 –
3.3. The tidal dwarf galaxy candidate, A245N
In this section we will study in detail the properties of the tidal object observed at the tip of
the northern tail of Arp 245. We will henceforth refer to it as A245N.
3.3.1. Morphology and structural parameters
Identifying a tidal dwarf in its host tail is obviously a difficult task. Such a problem which
raises the basic question of the definition of a tidal dwarf galaxy will be addressed in Sect. 4.1.1.
In a first approach, we have isolated the TDG candidate based on a morphological criterium. We
have considered as belonging to A245N all stellar and gaseous material in the tail located inside the
isophote µB=24.5 mag arcsec−2, north of δ = −14◦18′ (see Fig. 2). This region contains the bulk of
the atomic and ionized gas and appears to be “detached” in optical images (see Fig. 1). Table 5 lists
the main properties of A245N. Figure 12 presents images of A245N at different wavelengths from
the optical to the near–infrared. The tidal object has been detected in all BVRJHK′ bands. With
an absolute blue magnitude of MB = −17.2, A245N belongs to the bright end of the dwarf galaxy
population. It is actually as luminous and as extended as the LMC. Its surface brightness profile,
shown in Figure 13, has been computed in the B and R bands following Papaderos et al. (1996a,b).
It is exponential up to a radial distance of 25′′ (3.7 kpc) and drops beyond. The extrapolated
central surface brightness in the B band is 22.4 mag arcsec−2 and the exponential scale length of
the disk is 19′′ or 2.8 kpc. Put on the archetypal absolute magnitude vs. surface brightness and
scale length diagrams, A245N occupies the locus of low surface brightness dwarf irregular galaxies
(see Fig. 9 and Fig. 10 in Patterson & Thuan 1996).
3.3.2. Stellar populations
Tidal tails contain two basic types of stellar populations. The first category includes stars
older than the age of the interaction. They were originally formed in the parent galaxy from which
they have been pulled out. Numerical simulations indicate that the stars now found at the tip of
the tidal tails, i.e., in the TDGs, initially belonged to the outskirts of the parent disk. The second
category is made of stars younger than the interaction formed in situ in the tails after the collapse
of tidally expelled H I material. For nearby systems, deep color–magnitude diagrams would be the
ideal tool to disentangle the first and second generation stars. At the distance of Arp 245, the
galaxy can unfortunately not be resolved into stars. One has to rely on techniques based on the
comparison of integrated broad–band photometric data with predictions of evolutionary synthesis
models.
As a first step towards determining the age of the populations of A245N, we have compared its
optical color with that of its parent galaxy. The B–R profile of both objects are displayed together

– 16 –
in Figure 15. The external region of NGC 2992, beyound r = 30′′ (4.5 kpc) appears to have the
same color as the tidal object except in its inner 10′′. Their spectral energy distributions remain
similar over a larger wavelength range, as shown in Figure 16 which presents the SEDs of A245N
and of the outskirts of NGC 2992 (r > 30′′). Each color index differs by less than 0.1 mag, within
the photometric errors. Note that the data have not been corrected for internal extinction as this
is highly uncertain (see Sect. 3.3.3). Hence, it is clear that the stellar population of A245N is
currently dominated by stars pulled out from the disk of the parent galaxy.
When analyzed in detail however, the stellar population of A245N does not appear to be
completely uniform. First, the object hosts several stellar clusters showing a range of colors (see
Fig. 12). Their faintness and the large photometric errors prevent us from deriving from this color
spread differences in ages or metallicities for the individual clusters19. Moreover, our spectroscopic
data indicate that OB stars are present in A245N and therefore that the tidal object is currently
forming stars. Figure 17a displays the Hα map towards A245N. Several individual clumps are
concentrated in the northern region where the H I emission peaks. Two of the five brightest have
counterparts in the broad–band images (see Fig. 12) and could be associated with older star clusters.
The current star formation episode weakly affects the global photometry of the galaxy. The V − K
color map shown in Figure 12 (where the Hα contours have been superimposed) indicates that star–
forming regions are bluer by about 0.1 mag with respect to quiescient regions where no ionized gas
is detected. This variation appears to be very small compared to predictions of photometric models.
For a pure instantaneous starburst, the V − K index might change in the first 100 Myr by 1 to 3
mag, depending on the metallicity (Leitherer & Heckman 1995). Taking into account the old stellar
component, one would get however a smaller color evolution.
We have estimated quantitatively the relative contribution of young to “old” stars using an
evolutionary population synthesis model developed at the Gottingen observatory (Kruger et al.
1991). This code has been updated to include the bimodal star formation history of tidal dwarfs
(see details in Weilbacher et al. 2000). We have only considered solar metallicities and a Scalo
IMF. We have first reproduced the spectral energy distribution (SED) of the underlying population
of A245N, assuming that it is similar to the SED of the external regions of its parent galaxy,
NGC 2992. The best fit, shown in Figure 16, was obtained by a template for an Sb galaxy with
a characteristic age of 5 Gyr. Note that this result, which is valid for the outer disk of the spiral,
is consistent with the global morphological type of the galaxy being classified as an Sa. The effect
of extinction is indicated in the figure. We have then simulated an additional burst, varying its
shape, strength and duration and tried to fit the SED of the TDG candidate. Taking into account
the photometric errors and the dispersion between the observed SED and the best model, we found
19Obvious bright Galactic stars have been subtracted from the images. However, some faint foreground stars could
have been mistaken for stellar clusters. The brightest blue clump in the B–band image, for which we could obtain a
deep optical spectrum, does not exhibit the strong emission lines expected for an H ii region. However the detection
of faint absorption lines (in particular, Ca H&K λλ 3924,3968) at the right velocity confirms that it is a genuine star
cluster in the TDG.

– 17 –
that stars younger than 100 Myr, i.e., stars formed in situ in the tail, cannot contribute for more
than 2% to the overall stellar mass of the tidal object that we estimated from our model to be
3×10⁹ M⊙. With such a low burst strength, A245N differs from most of the tidal dwarf galaxies
studied so far. In particular, the southern TDG in the Arp 105 system appears much bluer than
its parent galaxy; young stars could amount in this object to about 25% (Fritze-v. Alvensleben &
Duc 1998) of the stellar mass. The very blue tidal dwarfs in the NGC 5291 system also seem to
be completely dominated by stars formed in situ in an H I tail (Duc & Mirabel 1998). A possible
explanation for the difference between those systems and Arp 245 might be that the latter object
suffered its first encounter only 100 Myr ago, which might not have been a long enough time span
to go through multiple bursts of star formation in order for the young population to dominate the
old one.
3.3.3. Current star formation and extinction
We have obtained longslit spectra of some of the Hα condensations of A245N. Our two slit
positions were roughly aligned along the knots labeled TDG 1 and TDG 4 (see Fig. 17a). A third
spectrum, of TDG 3, was obtained during our MOS run at the ESO 3.6m. The spectra of TDG 3
and TDG 4 are shown in Figure 17b and the spectrophotometric data corresponding to the knots
with the highest signal to noise are listed in Table 6. The detected emission lines have relative fluxes
typical of H ii regions ionized by young OB stars. There is no doubt that the Hα map towards the
tidal dwarf traces regions of star–formation. Despite the strong contribution from stars older than
100 Myr noted before, no absorption lines are visible in the spectra. The low surface brightness of
this stellar component might account for this result.
A Balmer decrement Hα/Hβ of 5.7 ± 1 has been derived from the spectrum of TDG 4. It implies
an intrinsic extinction of about AB = 2.6 ± 0.6 mag, or E(B–V)=0.6, a value much higher than
the typical E(B–V)=0.1 of irregular galaxies (Hunter 1982) and about twice the value towards
30 Doradus in the LMC (Greve et al. 1991). The discrepancy could suggest a very localized
obscuration in the H ii regions and hence a clumpy dust distribution. Slightly higher absorptions
have been derived in TDG 1 and TDG 3, albeit with a much larger uncertainty. Besides, H ii
regions in spiral disks also show comparable values of E(B–V) (Dufour et al. 1980).
The equivalent width of the Hβ line in TDG 4, about 12 ± 2 A, is consistent with a starburst
age of 5–7 Myr, according to the models by Cervino & Mas-Hesse (1994) for which an instantaneous
burst with no underlying old component and a solar metallicity have been assumed. Given the age
of the interaction, these newly formed stars were born in situ in the tidal tail.
We have estimated the star formation rate of the TDG from the total line emission extracted
from the narrow–band Hα image. The fluxes have been decontaminated for [NII] emission using
the mean [NII]/Hα line ratio measured along our long–slit spectra. The calibration of Kennicutt
(1998) has been used to derive the SFR from the Hα luminosity corrected for galactic extinction. It
– 18 –
assumes a Salpeter IMF (0.1–100 M⊙) and solar metallicity. We obtain an estimate of 0.03 M⊙/yr.
Taking into account the intrinsic extinction derived in the optical from the Balmer decrement, one
would get a SFR of 0.13 M⊙/yr. The star formation rate per unit area (in kpc−2), log(SFR/A),
is -3.1 (-2.5 after correction for extinction). The normalized SFR derived by Hunter (1997) for a
sample of Im galaxies covers a large range of 4 dex, between -5 and -1, with a relative peak at
-3.5. The SFR we find for A245N is somewhat higher than this and is comparable to that of the
LMC/SMC (Kennicutt & Hodge 1986). But despite these similarities, A245N appears much redder
than star–forming Irrs and more typical of a spiral. The simple fact that the global photometry of
the tidal dwarf does not seem to be much affected by the episode of in situ star formation implies
that the latter cannot have lasted long with a constant SFR of ∼ 0.1 M⊙/yr. Given the short time
scale available — less than 100 Myr, a constraint set by the simulations — it is likely that the
starburst started only late, perhaps less than 10 Myr ago, as suggested by the equivalent width of
the Hβ line.
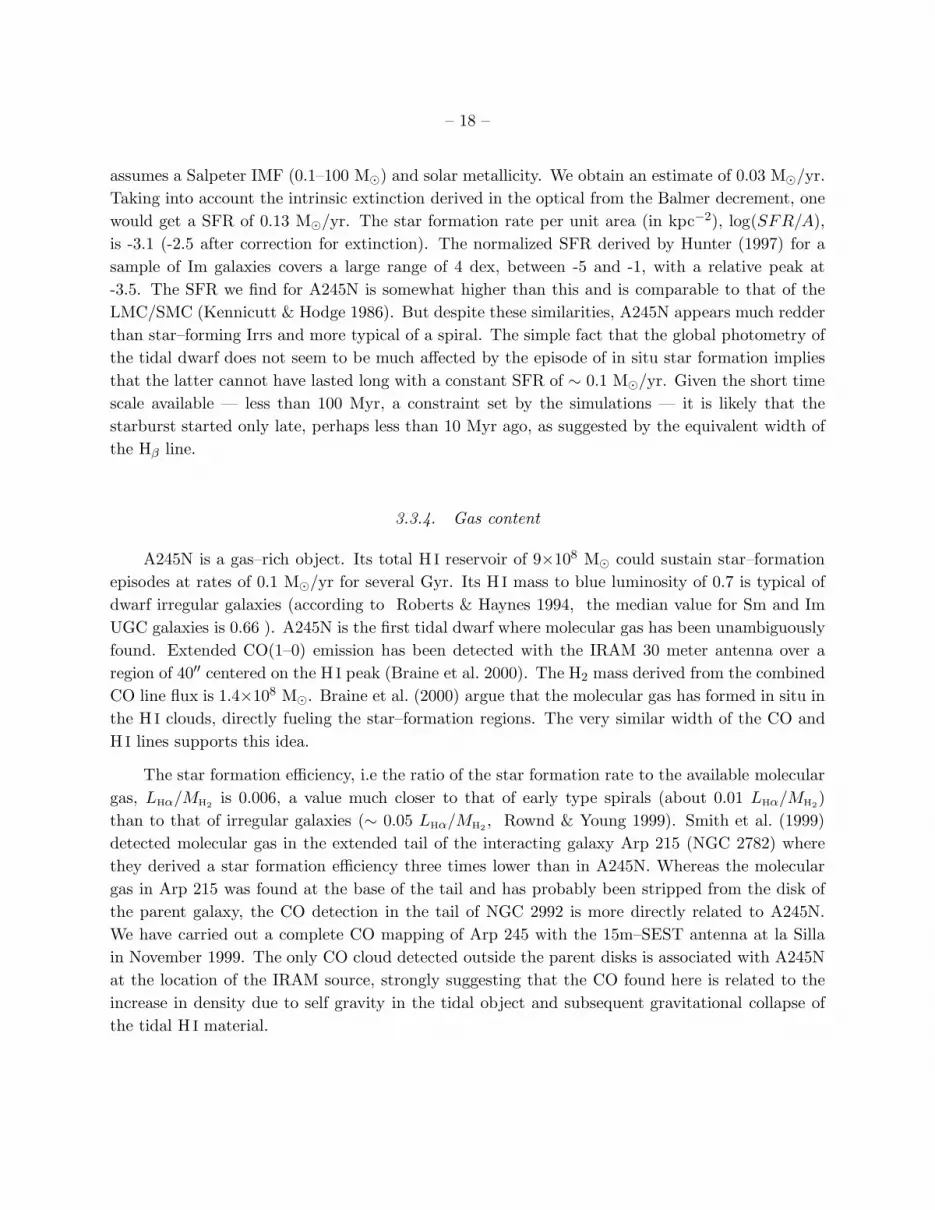
3.3.4. Gas content
A245N is a gas–rich object. Its total H I reservoir of 9×10⁸ M⊙ could sustain star–formation
episodes at rates of 0.1 M⊙/yr for several Gyr. Its H I mass to blue luminosity of 0.7 is typical of
dwarf irregular galaxies (according to Roberts & Haynes 1994, the median value for Sm and Im
UGC galaxies is 0.66 ). A245N is the first tidal dwarf where molecular gas has been unambiguously
found. Extended CO(1–0) emission has been detected with the IRAM 30 meter antenna over a
region of 40′′ centered on the H I peak (Braine et al. 2000). The H2 mass derived from the combined
CO line flux is 1.4×10⁸ M⊙. Braine et al. (2000) argue that the molecular gas has formed in situ in
the H I clouds, directly fueling the star–formation regions. The very similar width of the CO and
H I lines supports this idea.
The star formation efficiency, i.e the ratio of the star formation rate to the available molecular
gas, LHα/MH2is 0.006, a value much closer to that of early type spirals (about 0.01 LHα/MH2
)
than to that of irregular galaxies (∼ 0.05 LHα/MH2, Rownd & Young 1999). Smith et al. (1999)
detected molecular gas in the extended tail of the interacting galaxy Arp 215 (NGC 2782) where
they derived a star formation efficiency three times lower than in A245N. Whereas the molecular
gas in Arp 215 was found at the base of the tail and has probably been stripped from the disk of
the parent galaxy, the CO detection in the tail of NGC 2992 is more directly related to A245N.
We have carried out a complete CO mapping of Arp 245 with the 15m–SEST antenna at la Silla
in November 1999. The only CO cloud detected outside the parent disks is associated with A245N
at the location of the IRAM source, strongly suggesting that the CO found here is related to the
increase in density due to self gravity in the tidal object and subsequent gravitational collapse of
the tidal H I material.
– 19 –
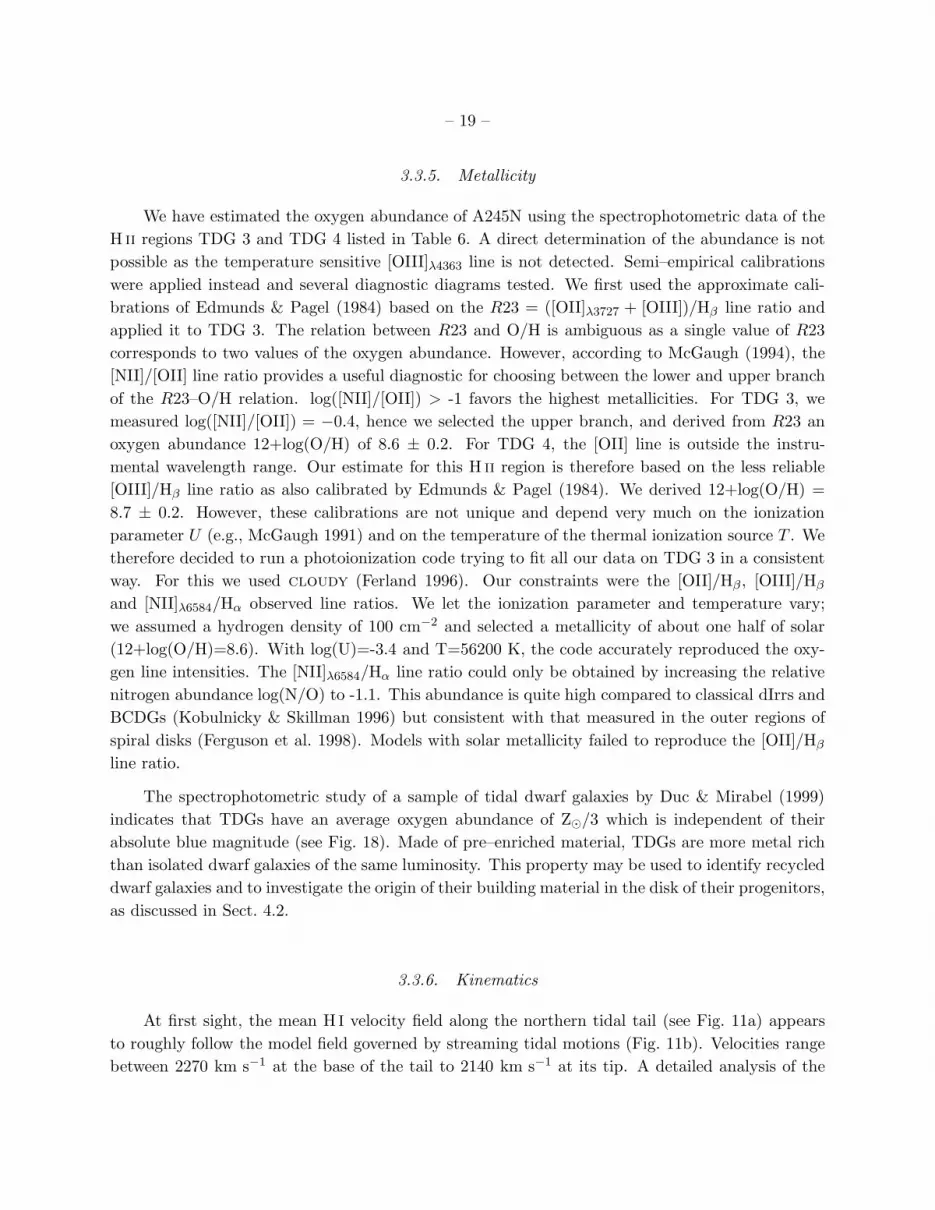
3.3.5. Metallicity
We have estimated the oxygen abundance of A245N using the spectrophotometric data of the
H ii regions TDG 3 and TDG 4 listed in Table 6. A direct determination of the abundance is not
possible as the temperature sensitive [OIII]λ4363 line is not detected. Semi–empirical calibrations
were applied instead and several diagnostic diagrams tested. We first used the approximate cali-
brations of Edmunds & Pagel (1984) based on the R23 = ([OII]λ3727 + [OIII])/Hβ line ratio and
applied it to TDG 3. The relation between R23 and O/H is ambiguous as a single value of R23
corresponds to two values of the oxygen abundance. However, according to McGaugh (1994), the
[NII]/[OII] line ratio provides a useful diagnostic for choosing between the lower and upper branch
of the R23–O/H relation. log([NII]/[OII]) > -1 favors the highest metallicities. For TDG 3, we
measured log([NII]/[OII]) = −0.4, hence we selected the upper branch, and derived from R23 an
oxygen abundance 12+log(O/H) of 8.6 ± 0.2. For TDG 4, the [OII] line is outside the instru-
mental wavelength range. Our estimate for this H ii region is therefore based on the less reliable
[OIII]/Hβ line ratio as also calibrated by Edmunds & Pagel (1984). We derived 12+log(O/H) =
8.7 ± 0.2. However, these calibrations are not unique and depend very much on the ionization
parameter U (e.g., McGaugh 1991) and on the temperature of the thermal ionization source T . We
therefore decided to run a photoionization code trying to fit all our data on TDG 3 in a consistent
way. For this we used cloudy (Ferland 1996). Our constraints were the [OII]/Hβ , [OIII]/Hβ
and [NII]λ6584/Hα observed line ratios. We let the ionization parameter and temperature vary;
we assumed a hydrogen density of 100 cm−2 and selected a metallicity of about one half of solar
(12+log(O/H)=8.6). With log(U)=-3.4 and T=56200 K, the code accurately reproduced the oxy-
gen line intensities. The [NII]λ6584/Hα line ratio could only be obtained by increasing the relative
nitrogen abundance log(N/O) to -1.1. This abundance is quite high compared to classical dIrrs and
BCDGs (Kobulnicky & Skillman 1996) but consistent with that measured in the outer regions of
spiral disks (Ferguson et al. 1998). Models with solar metallicity failed to reproduce the [OII]/Hβ
line ratio.
The spectrophotometric study of a sample of tidal dwarf galaxies by Duc & Mirabel (1999)
indicates that TDGs have an average oxygen abundance of Z⊙/3 which is independent of their
absolute blue magnitude (see Fig. 18). Made of pre–enriched material, TDGs are more metal rich
than isolated dwarf galaxies of the same luminosity. This property may be used to identify recycled
dwarf galaxies and to investigate the origin of their building material in the disk of their progenitors,
as discussed in Sect. 4.2.
3.3.6. Kinematics
At first sight, the mean H I velocity field along the northern tidal tail (see Fig. 11a) appears
to roughly follow the model field governed by streaming tidal motions (Fig. 11b). Velocities range
between 2270 km s−1 at the base of the tail to 2140 km s−1 at its tip. A detailed analysis of the

– 20 –
H I datacube shows however a possible evidence for a sub–structure associated with A245N which
is visible in position–velocity (PV) diagrams. This is best seen after rotating the HI datacube
(α, δ,VHel) clockwise by 15 degrees so that the tidal tail points upwards. Figure 19 presents three
PV–diagrams taken along a direction perpendicular to the tail axis. One cut is taken through the
optical center of A245N, the other two are offset along the tail by 45′′. The cut through the tidal
object shows a velocity gradient of ∼ 65 km s−1, peak to peak extending over almost 50′′ spatially.
This might suggest that part of the tidal H I is kinematically decoupled from its host tail showing
some evidence for solid body rotation with its kinematical major axis roughly perpendicular to the
tail. This component contains the bulk of the H I in the tail (more than 60%) and corresponds
spatially to the optical tidal object. Due the scarcity of H ii regions in the tail, we could not
determine, based on our longslit data, any velocity profile in the ionized gas component.
Based on our low resolution H I data only we estimate a lower limit for its dynamical – virial –
mass (i.e. uncorrected for inclination) of 9×10⁸M⊙, identical within the errors to the H I mass and
three times smaller than the estimated stellar mass. This could indicate that a large fraction of
the old stellar population present in A245N does not belong to the kinematically decoupled region
of the galaxy. If reliable, our low value of the dynamical mass would be consistent with a very low
dark matter content, as expected for TDGs (Barnes & Hernquist 1992).
The H I velocity dispersion towards the TDG candidate, 25–30 km s−1, is much higher than in
a quiescent disk. The turbulence is hence dynamically important.
3.3.7. Conclusions on the properties of A245N
Our detailed study of A245N indicates that the tidal object has apparently properties ranging
between those of dwarf irregular galaxies (structural parameters, gas content, star formation rate)
and those of spiral disks (metallicity, extinction, star formation efficiency, stellar population). A
straightforward explanation would be the intrinsic hybrid nature of the galaxy which is made of
disk material but results from the collapse of gaseous clouds that have masses and characteristics
of dwarf galaxies.
4. Discussion
Tidal dwarf galaxies candidates have now been found in a variety of interacting galaxies, i.e., in
disk–disk systems (e.g., NGC 4038/39, Mirabel et al. 1992), disk–spheroid systems (e.g., Arp 105,
Duc & Mirabel 1994), gas–rich spheroid–spheroid systems (e.g., NGC 5291, Duc & Mirabel 1998)
and advanced mergers (e.g., NGC 7252, Hibbard et al. 1994). These interacting systems have
a variety of environments: field (e.g., NGC 4038/39), compact groups (e.g., the Hickson groups,
Hunsberger et al. 1996) and clusters (e.g., Arp 105, NGC 5291). On the other hand, not all
interacting systems with gaseous tails form dwarf galaxies, as recently shown by Hibbard & Yun

– 21 –
(1999). Together with the overall properties of the parent galaxies and history of the collision, the
environment — i.e., density of companion galaxies, density of the intergalactic medium and strength
of the associated ram–pressure — might play a role in the formation and more significantly in the
evolution and survival time of tidal dwarf galaxies. The exact contribution of each process is not
yet known. In that respect, Arp 245 is a simple system situated in a relatively poor environment.
It may hence give us some clues about the required minimum conditions for the creation of such
objects. Incorporating our data on Arp 245N with data from the literature on similar such systems,
we will in the following review some of the outstanding questions regarding TDGs, starting with a
proper definition.
4.1. Identifying Tidal Dwarf Galaxies in tidal features
4.1.1. A working definition of a Tidal Dwarf Galaxy
Luminous, star–forming knots are commonly found along the tidal features of interacting
systems. Will all of them become independent from their parent galaxies and hence become true
galaxies ? Given their particular environments, one may doubt whether all of them will manage
to survive for more than one Gyr. Therefore, in order to distinguish between such a short–lived
object and a true “Tidal Dwarf Galaxy” we need a stricter definition. We propose as a working
definition for a “Tidal Dwarf Galaxy” an object which is a self–gravitating entity, formed out of the
debris of a gravitational interaction.
This restrictive definition ensures that TDGs are not simply agglomerated debris of collisions
but that they are active objects that have their own dynamics and a potential well that is strong
enough to sustain themselves against internal or external disruption for at least 1 Gyr. Such
kinematically decoupled tidal objects and associated rotating gas clouds have been found in the
interacting systems Arp 105 (Duc et al. 1997) and NGC 5291 (Duc et al. 1997).
4.1.2. Possible mis-identification of TDGs
Under the definition given above, a TDG should be considered a separate entity based on
dynamical rather than morphological criteria. Tidal objects may not always look as “detached”
or appear as contrasted entities in optical images, nor should they always have very distinct colors
if they have not yet formed a substantial proportion of luminous young stars. The true optical
morphology of the galaxy might hence be hidden by an old unbound stellar component pulled out
from the disk of the parent galaxy. Computing the integrated properties of a TDG, one should in
principle only consider bound tidal material corresponding to the kinematically detached part of
the tail. In practice, this is difficult since it would require two–dimensional high–resolution velocity
data. The integrated properties of a tidal object might hence well be contaminated.

– 22 –
Moreover, projection effects should be taken into account. Tidal tails are generally curved (see
Fig. 10) and seen edge-on, they exhibit at their apparent tip superimposed material from the near
and back side. The resulting projected structure might be as luminous as a dwarf galaxy and hence
be mistaken as a single object. Even the streaming motions of an expending tail could mimic at
its projected bend the dynamical signature of a rotating TDG (Duc et al. 1997). We could see
there a range of velocities due to the contribution of several velocity vectors at different angles. It
is however expected that, if this is the case, the resulting velocity field should be asymmetric.
Besides, some TDGs could, in principle, be mistaken with dwarf galaxies preexisting the col-
lision, and the tail linking them to a parent galaxy would then be a bridge.
4.1.3. Is A245N a tidal dwarf galaxy ?
Several observational facts are inconsistent with the hypothesis that A245N is a preexisting
dwarf galaxy. First of all, its high metallicity is a clear sign of a recycled origin. Its colors are
remarkably similar to those of the parent’s outside disk. Finally our numerical simulations show
that no third body is required to reproduce the morphology of the interacting system.
The only massive tidal object in Arp 245 is found at the tip of an almost edge–on tail, a
case for which projection effects might be important. However the H I, Hα, and CO lines peak at
the same location in A245N and have similar velocities. The projection hypothesis would require
that all these components are rather uniformly distributed along the tails which is not seen in the
face–on eastern tail, at least for the H I gas. Besides, as discussed in Sect. 4.3.2, ionized gas is
only observed above a critical H I column density. The Hα/H I coincidence is a strong indication
that both phases of the gas are physically linked. It is hence more likely that the various gaseous
components towards A245N form, at our spatial and velocity resolution, a single entity. The surface
brightness profile of A245N, which is very well fit by an exponential profile (see Fig. 13), might
suggest the presence of a stellar disk. However, the profile expected for a pure tidal tail without
bound objects in it is not yet well known. In our low resolution simulations, the SBP at the tip of
the numerical tail seems to diverge from an exponential profile (see Fig. 14). Note however that the
SBP measured towards A245N corresponds to that of the old stellar component pulled out from
the disk of its parent galaxy. Given the young age of the interaction and the non–dissipative nature
of stars, it would be surprising that the stellar population is already relaxed and bound with the
gaseous entity.
The kinematical independence of A245N is yet difficult to assess. H I position–velocity diagrams
show a fairly localized symmetric velocity gradient reminiscent of solid–body rotation with an axis
perpendicular to the tail (see Sect. 3.3.6). But this is at the limits of the spatial and velocity
resolution of our VLA observations. Besides, position–velocity diagrams of the simulated system
computed at the same locations as the H I ones appear strikingly similar (see Fig. 19 and Fig. 20).
Therefore, either a kinematically decoupled tidal object has already formed in our simulations, or

– 23 –
the H I PV–diagrams mostly reflect streaming tidal motions. Clearly higher resolution numerical
simulations and H I observations will shed more light on this. On the other hand, the high velocity
dispersion measured in the H I component of A245N indicates that turbulence is almost as important
dynamically as the putative rotation.
Most probably, A245N is a tidal dwarf galaxy observed in the early phases of its formation. Its
gas might just be becoming self–gravitating, overcoming turbulence and streaming tidal motions.
This would be consistent with the young age of the interaction.
4.2. Origin of the TDG building material
TDGs consist of material that has been pulled out from parent galaxies. But where exactly do
the tidally expelled stars and gas clouds come from? Numerical simulations by Hibbard & Mihos
(1995) show that particles found at the end of the simulated tidal tails where TDGs are usually
observed once belonged to the outermost regions of the parent disk. This is confirmed by our
numerical simulations of Arp 245 (see Fig. 10). The gas particles towards the tip of the TDG were
originally in the outer gas disk, at a radius of about eight times the exponential scale length of the
stellar disk. The simulations show however that the inner parts of the tail come from regions at
smaller radii in the disk.
The prediction of the simulations can be observationally checked by noting that the metallicity
of TDGs reflects that of the region where their building material has come from and been pre–
enriched. Spiral galaxies show strong metallicity gradients, from above solar in the core to one
tenth of solar in the outer regions beyond the optical disk (Ferguson et al. 1998). An oxygen
abundance of one third solar, the median metallicity of the ionized gas in TDGs (see Fig. 18),
roughly corresponds to a radius of R25. The slightly higher metallicity of TDG A245N suggests an
even smaller galactic radius.
Hence, it is improbable that most TDGs are made up of material from much further out,
unless a strong local enrichment has occured or unless the parent galaxy had an unusual metallicity
distribution prior to the collision. Enrichment of the ionized gas by a burst of star formation within
a time scale of 100 Myr or less – the maximum age of the TDG A245N as determined from numerical
simulations – is unlikely. Studies of classical metal poor dIIrs and BCDGs have indeed shown that
enrichment of the ionized gas does not seem to be efficient in low mass galaxies even over longer
periods. Parent galaxies with perturbed metallicity gradients, e.g. higher than normal, might
be found in the class of Seyfert galaxies to which NGC 2992 belongs. Their active nucleus could
pollute the interstellar medium via large–scale outflows. Whereas the absence of a steep abundance
gradient has been reported by Evans & Dopita (1987) in the prototype Seyfert 2 galaxy NGC 1068,
this property was not found in other Seyfert galaxies (Schmitt et al. 1994, Storchi-Bergmann et al.
1996). Statistical data are so far missing to link any anomalous metallicity gradient distributions
with the nuclear activity and related ejection phenomena.

– 24 –
Clearly, precise measurements of the metallicity distribution in the parent galaxies 20 and more
detailed numerical simulations of interacting systems would be required to further investigate the
origin of the building material of TDGs.
4.3. Required conditions for the formation of a TDG
4.3.1. Location of TDGs in the tail
Numerical simulations by Barnes & Hernquist (1992), Elmegreen et al. (1993) suggest that
TDGs should form from gravitational instabilities that grow in the debris of the collision. These ob-
jects appear as bound condensations distributed all along the tidal features. Some tails of interact-
ing systems indeed host numerous faint blue knots showing signs of star formation (Schombert et al.
1990, Weilbacher et al. 2000). One of the two most spectacular objects of that kind are NGC 4676,
the Mice, (Hibbard & van Gorkom 1996, Sotnikova & Reshetnikov 1998) and IRAS 19254–7245,
the Superantennae (Mirabel et al. 1991, Mihos & Bothun 1998). However, systems containing
substructures that comply with our definition of a TDG generally show the star formation being
concentrated in a single object located at the tip of the stellar tail, such as TDG A105N (Duc et al.
1997). And this is also, of course, the case for A245N, which is located at the end of the tidal
plume stemming from NGC 2992.
So, why is there only one single massive star forming clump as soon as a TDG has been formed
and why is it located at the tip of the tidal tail ?
Excluding the projection effects that could lead to a mis–identification of a TDG at the tip
of the tail, part of the explanation might have to do with the timescale for tidal material to fall
back to the merger. This rate scales as t−5
3 (Hibbard & Mihos 1995) and is highest shortly after
perigalacticon. Therefore, bound objects that might have formed at the base of the tail would have
already fallen back towards their progenitor, leaving as the only viable region for the formation
of a TDG the tips of tails. Modeling the prototype merger NGC 7252 with N–body simulations,
Hibbard & Mihos (1995) have found that about half of the tidal material situated at the base of the
already formed tail (130 Myr after periapse) falls back within 130 Myr. Arp 245 is observed about
100 Myr after perigalacticon and only about 50 Myr after the tails have developed (see Fig.9).
Over a time scale of 50 Myr, about one fourth of the initial tidal material might have fallen back
already. A more precise study of the temporal evolution of the return of both gaseous and stellar
material, based on our own numerical simulations of Arp 245, will be studied elsewhere.
Another hypothesis could be that the initial clumps, proto–TDGs, might have merged. De-
tailed high resolution simulations could test whether the formation of TDGs proceeds in a hierarchi-
20This study is extremely difficult to do in NGC 2992 because of the absence of H ii regions in its disk. Metallicity
measurements are very uncertain in the ELRs of active galaxies.

– 25 –
cal way. If true, short–lived tidal features would not offer a suitable environment for the formation
and survival of TDGs. In particular, tails that have a life expectancy greater than 1 Gyr are more
likely to generate TDGs than bridges which only last for about ∼ 108 yr (Struck 1999). Another
obstacle faced by tidal bridges, illustrated for instance by Arp 245, is their intrinsic low surface
density, a critical parameter as we will show in the next section.
4.3.2. Conditions for star formation
The fact that all observed tidal dwarfs, i.e., kinematically independent objects in tidal features,
are star–forming objects is partly a selection effect: TDG candidates have generally been selected
for their brightness and blue color. On the other hand no bound tidal gas cloud is yet known which
is not associated with a stellar counterpart. So the question raised in the previous section — where
do TDGs form? — could be addressed by answering another one: what conditions are necessary
for star formation (SF) to commence in tidal debris?
H I maps of interacting systems give some clues: all TDGs are found in H I tails and are roughly
adjacent to local peaks in the H I column density map. This fact is not specific to TDGs, of course,
and actually applies to SF regions in all types of galaxies, from spirals to dwarf irregulars, and
might simply reflect the fact that H I is the raw material for any SF event. However, not every
H I clump hosts a SF region. The onset of star formation apparently depends on an H I column
density threshold, as first noted by Davies et al. (1976) for the LMC. Further studies of dwarf
irregulars (Gallagher & Hunter 1984, Skillman 1987, Taylor et al. 1994) and low–surface brightness
galaxies (van der Hulst et al. 1993, van Zee et al. 1997) suggest that this threshold is about 0.5 –
1 ×1021cm−2.
Neither the universality of this threshold, nor the underlying physics is known. It would
be surprising if it would be the same in spiral disks, in dwarf galaxies, and in the more chaotic
environment of interacting galaxies. And a word of caution, when making comparisons, one should
aim for comparable linear resolution as the peak H I column density, because of beam dilution,
decreases with decreasing resolution.
In the case of Arp 245 both tidal tails show a clumpy H I structure. Star formation occurs only
in the TDG above densities of 2 ×1021cm−2. All condensations in the southern tail have their peak
below 5×1020 cm−2 (see Fig. 3) and no SF is associated with this tail. In turn, towards the spiral
NGC 2993 ionized gas is observed above our sensitivity limit of 0.4×10⁻¹⁶ erg s−1 cm−2 arcsec−2
at those locations where the H I density exceeds 1021 cm−2. The threshold hence appears to be two
times higher in the tidal dwarf than in the spiral disk. The connection between Hα and H I in the
other spiral, NGC 2992, is more difficult to assess. Some ionization filaments are observed at large
galactic radii where the H I has column densities well below 5×1020 cm−2. However this apparent
decoupling between the two phases of the gas is mainly due to the very nature of the ionizing
source, probably hard UV radiation from the central AGN or from a shock induced process (Allen

– 26 –
et al. 1999, Paper II).
As mentioned, the physical origin for the empirical H I threshold is not well understood (see
review by Skillman 1996). One possible explanation is a gravitational instability, as elaborated by
Kennicutt (1989) in the case of spiral disks. Because of the limited resolution and the obviously
strong tidal forces, it is not possible to test the validity of this explanation for TDGs.
Alternatively, the threshold in NHI might correspond to a minimum required column density
of dust to shield the gas from the UV radiation field (Federman et al. 1979, Skillman 1987). Given
sufficient shielding, a molecular cloud can form from the H I allowing star formation to proceed.
This critical density should be metallicity dependent since the dust–to–gas ratio varies with the
element abundance (Franco & Cox 1986). It is then expected that recycled tidal dwarfs should have
an NHI threshold lower than that of isolated metal–poor dwarf galaxies and similar to that of spiral
disks. Table 7 lists the H I column density data available in the literature for several star–forming
TDGs. Column 1 shows the peak NHI — or a range of values in case several TDGs are present
— and column 2 the linear resolution. The majority of the TDGs so far studied have a column
density of 2 – 3 ×1020cm−2, indeed three times lower than in dIrrs (Skillman 1987, Taylor et al.
1994). However, the metal rich, CO rich, and presumably dusty TDG belonging to Arp 245 has its
H ii clustered in the central core of the H I cloud where the NHI exceeds 2×1021cm−2. Rather than
stating that Arp 245N is the exception, one should perhaps rather question the low star formation
thresholds in the other TDGs, noting that beam dilution for the other TDGs, which were observed
at much lower resolution, could partly account for this large difference.
4.4. Models and numerical simulations of TDGs
Several theoretical models for the formation of TDGs have been proposed. Elmegreen et al.
(1993) suggest that massive H I clouds form first in the outer disk of interacting galaxies. According
to the Jeans criterion, the local high velocity dispersion induced by the collision allows the formation
of clouds with masses much higher than in a quieter environment, up to 108 M⊙. These clouds are
then tidally expelled into the IGM where they collapse. Wallin (1990) put forward a geometrical
torsion of the tail leading to a local density enhancement. Barnes & Hernquist (1992) propose a
local amplification of pre–existing stochastic clumps in the tidal tails that start accreting low σ
material — in particular gas — and become gravitationally bound. The collected material will
then collapse until rotation takes over.
Numerical simulations that might help selecting between these different theories of the forma-
tion of TDGs should also take into account the observed properties of these objects, and explain:
(a) knots, perhaps star forming, but not necessarily leading to TDGs, along the tidal tails;
(b) star–formation whenever the H I clumps reach some critical column density, the origin of which
could either be a gravitational instability within the tidally ejected gas, or shielding from the
UV–radiation field once clumps get dense enough; (c) that in most systems eventually only one

– 27 –
massive object per tail forms, located at the end of it; (d) the possible merging between individual
preexisting clumps; (e) the time scale for the formation of a TDG — this can be quite short: in
Arp 245, a TDG developed in less than 100 Myr; (f) the about 1/3 of Solar metallicity in the
TDGs; (g) the formation of TDGs in pure H I tails which is the case when the interaction involves
gas–rich early type galaxies from which stars are much less efficiently pulled out than the gas (e.g.,
in NGC 5291, Duc & Mirabel 1998).
5. Conclusions
We have presented a multi–wavelength study of the interacting system Arp 245 (NGC 2992/93)
and a preliminary numerical simulation of the collision. From our observations and models, we
obtain the following results:
a) The system is observed at an early stage of the interaction, 100Myr after first perigalacticon
and 700 Myr before the final merger. At the current time two long tidal tails and a bridge have
developed. N–body/SPH simulations reproduce fairly well both the optical and H I features, in
particular the ring–like structure observed in the gaseous component. The VLA map reveals a
third member to the interacting system: an H I rich dwarf galaxy, seen almost edge–on and looking
unperturbed. This object is hence probably falling into the group.
b) H I in emission is found all along the two optical tidal tails where it accounts for respectively
60% and 80% of the H I of their progenitors, NGC 2992 and NGC 2993. The H I shows a peak
at the end of the NGC 2992 tail where a gas reservoir of 109 M⊙ supplies a star–forming, tidal
object, A245N. H I is seen in absorption towards the active nucleus of NGC 2992. Star formation,
as traced by Hα, occurs in the main body of NGC 2993. In the tidal features, it is restricted to
the tip of the northern tail at the location of the TDG A245N, where the H I column density is at
least 1.5–2 ×1021 cm−2.
c) The global properties of A245N range between those of dwarf irregular galaxies as far as its
structural parameters, gas content and star formation rate are concerned, and those of spiral disks
as for its metallicity, extinction, star formation efficiency and stellar population. In particular,
although the object is actively forming stars, and has a large atomic and molecular gas reservoir,
the bulk of its stellar population is still dominated by the old component pulled out from the parent
galaxy. Whereas A245N appears to be a self–gravitating entity, our data lack spatial resolution to
probe its proper dynamics. Most probably, A245N is a tidal dwarf galaxy that is still in the process
of formation.
We are grateful to the support astronomers and night assistants from the 2p2, NTT and
3p6 teams which have helped us during our different observing runs at la Silla. Special thanks
to Pierre Leisy for his precious support, to Vassilis Charmandaris who did the CO observations
at SEST and to Polychronis Papaderos who has computed the surface brightness profiles of our
objects. This work has greatly benefited from discussions with Jonathan Braine, Uta Fritze–

– 28 –
v.Alvensleben, Simon White and from the very useful comments of the referee, Curtis J. Struck.
P.–A. D. acknowledges support from the network Formation and Evolution of Galaxies set up
by he European Commission under contract ERB FMRX–CT96086 of its TMR program. I.F. M.
acknowledges support from CONICET/Argentina. This research has made use of the Lyon–Meudon
Extragalactic Database (LEDA) supplied by the LEDA team at the CRAL–Observatoire de Lyon
(France), as well as of the NASA/IPAC Extragalactic Database (NED) which is operated by the
Jet Propulsion Laboratory, California Institute of Technology, under contract with the National
Aeronautics and Space Administration.
REFERENCES
Allen, M. G., Dopita, M. A., Tsvetanov, Z. I., & Sutherland, R. S. 1999, ApJ, 511, 686
Alonso-Herrero, A., Simpson, C., Ward, M. J., & Wilson, A. S. 1998, ApJ, 495, 196
Barnes, J. E. & Hernquist, L. 1992, Nature, 360, 715
Bowen, D. V., Osmer, S. J., Blades, J. C., Tytler, D., Cottrell, L., Fan, X. M., & Lanzetta, K. M.
1994, AJ, 107, 461
Braine, J., Lisenfeld, U., Duc, P.-A., & Leon, S. 2000, Nature, in press (astro-ph/0002177)
Burbidge, E. M., Strittmatter, P. A., Smith, H. E., & Spinrad, H. 1972, ApJ, 178, L43
Casali, M. & Hawarden, T. 1992, JCMT-UKIRT Newsletter, 3, 33
Cervino, M. & Mas-Hesse, J. M. 1994, A&A, 284, 749
Chapman, S., Morris, S., Alonso-Herrero, A., & Falcke, H. 2000, MNRAS in press, (astro-
ph/9908222)
Colbert, E. J. M., Baum, S. A., Gallimore, J. F., O’Dea, C. P., Lehnert, M. D., Tsvetanov, Z. I.,
Mulchaey, J. S., & Caganoff, S. 1996, ApJS, 105, 75
Condon, J. J., Condon, M. A., Gisler, G., & Puschell, J. J. 1982, ApJ, 252, 102
Davies, R. D., Elliot, K. H., & Meaburn, J. 1976, MmRAS, 81, 89
Dubinski, J., Mihos, J. C., & Hernquist, L. 1996, ApJ, 462, 576
Duc, P.-A. 1995, PhD thesis, Universite Paris VI
Duc, P.-A., Brinks, E., Wink, J. E., & Mirabel, I. F. 1997, A&A,, 326, 537
Duc, P.-A. & Mirabel, I. F. 1994, A&A, 289, 83
Duc, P.-A. & Mirabel, I. F. 1998, A&A, 333, 813

– 29 –
Duc, P.-A. & Mirabel, I. F. 1999, in IAUS 186: Galaxy Interactions at Low and High Redshift, ed.
J. E. Barnes & D. B. Sanders, Kluwer: Dordrecht, 61
Dufour, R. J., Talbort, R. J., J., Jensen, E. B., & Shields, G. A. 1980, ApJ, 236, 119
Durret, F. & Bergeron, J. 1987, A&A, 173, 219
Durret, F. & Bergeron, J. 1988, A&AS, 75, 273
Edmunds, M. G. & Pagel, B. E. J. 1984, MNRAS, 211, 50
Elmegreen, B. G., Kaufman, M., & Thomasson, M. 1993, ApJ, 412, 90
Evans, I. N. & Dopita, M. A. 1987, ApJ, 319, 662
Federman, S. R., Glassgold, A. E., & Kwan, J. 1979, ApJ, 227, 466
Ferguson, A. M. N., Gallagher, J. S., & Wyse, R. F. G. 1998, AJ, 116, 673
Ferland, G. 1996, Hazy, a Brief Introduction to Cloudy, Tech. rep., University of Kentucky, De-
partment of physics and astronomy
Franco, J. & Cox, D. P. 1986, PASP, 98, 1076
Fritze-v. Alvensleben, U. & Duc, P. A. 1998, in The Magellanic Clouds and Other Dwarf Galaxies,
Proceedings of the Bonn/Bochum-Graduiertenkolleg Workshop, ed. T. Richtler & B. J.M.,
Shaker Verlag, Aachen, 141
Gallagher, J. & Hunter, D. 1984, ARA&A, 22, 37
Gilli, R., Maiolino, R., Marconi, A., Risaliti, G., Dadina, M., Weaver, K., & E.J.M., C. 2000, A&A
in press, (astro-ph/0001107)
Glass, I. S. 1997, MNRAS, 292, L50
Gregg, M. D. & West, M. J. 1998, Nature, 396, 549
Greve, A., Castles, J., & McKeith, C. D. 1991, A&A, 251, 575
Hamuy, M., Walker, A. R., Suntzeff, N. B., Gigoux, P., Heathcote, S. R., & Phillips, M. M. 1992,
PASP, 104, 533
Hibbard, J. E., Guhathakurta, P., van Gorkom, J. H., & Schweizer, F. 1994, AJ, 107, 67
Hibbard, J. E. & Mihos, J. C. 1995, AJ, 110, 140
Hibbard, J. E., Vacca, W. D., & Yun, M. S. 2000, AJ in press, (astro-ph/9912411)
Hibbard, J. E. & van Gorkom, J. H. 1996, AJ, 111, 655

– 30 –
Hibbard, J. E. & Yun, M. S. 1999, AJ, 118, 162
Hunsberger, S. D., Charlton, J. C., & Zaritsky, D. 1996, ApJ, 462, 50
Hunter, D. A. 1982, ApJ, 260, 81
—. 1997, PASP, 109, 937
Karachentsev, I. D., Karachentseva, V. E., & Parnovskij, S. L. 1993, Astronomische Nachrichten,
314, 97
Kaufman, M., Brinks, E., Elmegreen, D. M., Thomasson, M., Elmegreen, B. G., Struck, C., &
Klaric, M. 1997, AJ, 114, 2323
Kennicutt, R. C., J. 1989, ApJ, 344, 685
Kennicutt, R. C., J. 1998, ARA&A, 36, 189
Kennicutt, R. C., J. & Hodge, P. W. 1986, ApJ, 306, 130
Kobulnicky, H. A. & Skillman, E. D. 1996, ApJ, 471, 211
Kruger, H., Fritze-v. Alvensleben, U., Loose, H., & Fricke, K. J. 1991, A&A, 242, 343
Landolt, A. U. 1992, AJ, 104, 340
Leitherer, C. & Heckman, T. M. 1995, ApJS, 96, 9
Malphrus, B., Simpson, C., Gottesman, S., & Hawarden, T. G. 1997, AJ, 114, 1427
Marquez, I., Boisson, C., Durret, F., & Petitjean, P. 1998, A&A, 333, 459
Marshall, N., Warwick, R. S., & Pounds, K. A. 1981, MNRAS, 194, 987
Matthews, L. D., Gallagher, J. S., I., & Van Driel, W. 1999, AJ, 118, 2751
McGaugh, S. S. 1991, ApJ, 380, 140
—. 1994, ApJ, 426, 135
Mihos, J. C. & Bothun, G. D. 1998, ApJ, 500, 619
Mihos, J. C., Bothun, G. D., & Richstone, D. O. 1993, ApJ, 418, 82
Mirabel, I. F., Dottori, H., & Lutz, D. 1992, A&A, 256, L19
Mirabel, I. F., Lutz, D., & Maza, J. 1991, A&A, 243, 367
Mirabel, I. F. & Wilson, A. S. 1984, ApJ, 277, 92

– 31 –
Monet, D. 1996, in BAAS, Vol. 188, 5404
Papaderos, P., Loose, H. H., Fricke, K. J., & Thuan, T. X. 1996a, A&A, 314, 59
Papaderos, P., Loose, H. H., Thuan, T. X., & Fricke, K. J. 1996b, A&AS, 120, 207
Patterson, R. J. & Thuan, T. X. 1996, ApJS, 107, 103
Prugniel, P. & Heraudeau, P. 1998, A&AS, 128, 299
Roberts, M. S. & Haynes, M. P. 1994, ARA&A, 32, 115
Rodrigues, I., Dottori, H., Brinks, E., & Mirabel, I. F. 1999, AJ, 117, 2695
Rownd, B. K. & Young, J. S. 1999, AJ, 118, 670
Salo, H. & Laurikainen, E. 1993, ApJ, 410, 586
Sanders, D. B. & Mirabel, I. F. 1985, ApJ, 298, L31
Schmitt, H. R., Storchi-Bergmann, T., & Baldwin, J. A. 1994, ApJ, 423, 237
Schombert, J. M., Wallin, J. F., & Struck-Marcell, C. 1990, AJ, 99, 497
Skillman, E. 1996, in The Minnesota Lectures on Extragalactic Neutral Hydrogen, ed. E. Skillman
(ASP conferences series, 106), 208
Skillman, E. D. 1987, in Star Formation in Galaxies, ed. C. J. Lonsdale & C. J. Persson (Washington
D.C., NASA), 263
Smith, B. J., Struck, C., Kenney, J. D. P., & Jogee, S. 1999, AJ, 117, 1237
Sofue, Y., Wakamatsu, K. I., Taniguchi, Y., & Nakai, N. 1993, PASJ, 45, 43
Sotnikova, N. Y. & Reshetnikov, V. P. 1998, Pis ma Astronomicheskii Zhurnal, 24, 97
Springel, V. 2000, MNRAS, 312, 859
Springel, V. & White, S. D. M. 1999, MNRAS, 307, 162
Storchi-Bergmann, T., Rodriguez-Ardila, A., Schmitt, H. R., Wilson, A. S., & Baldwin, J. A. 1996,
ApJ, 472, 83
Struck, C. 1999, Physics Reports, 321, 1
Taylor, C. L., Brinks, E., Pogge, R. W., & Skillman, E. D. 1994, AJ, 107, 971
Thomasson, M. & Donner, K. J. 1993, A&A, 272, 153
Toomre, A. & Toomre, J. 1972, ApJ, 178, 623

– 32 –
Torres-Peimbert, S., Peimbert, M., & Fierro, J. 1989, ApJ, 345, 186
Ulvestad, J. S. & Wilson, A. S. 1984, ApJ, 285, 439
van der Hulst, J. M. 1979, A&A, 71, 131
van der Hulst, J. M., Skillman, E. D., Smith, T. R., Bothun, G. D., McGaugh, S. S., & De Blok,
W. J. G. 1993, AJ, 106, 548
van Zee, L., Haynes, M. P., Salzer, J. J., & Broeils, A. H. 1997, AJ, 113, 1618
Wallin, J. F. 1990, AJ, 100, 1477
Weedman, D. W. 1971, Astrophys. Lett., 9, 49
Wehrle, A. E. & Morris, M. 1988, AJ, 95, 1689
Weilbacher, P., Duc, P.-A., Fritze-v. Alvensleben, U., & Fricke, K. J. 2000, A&A, submitted
This preprint was prepared with the AAS LATEX macros v5.0.
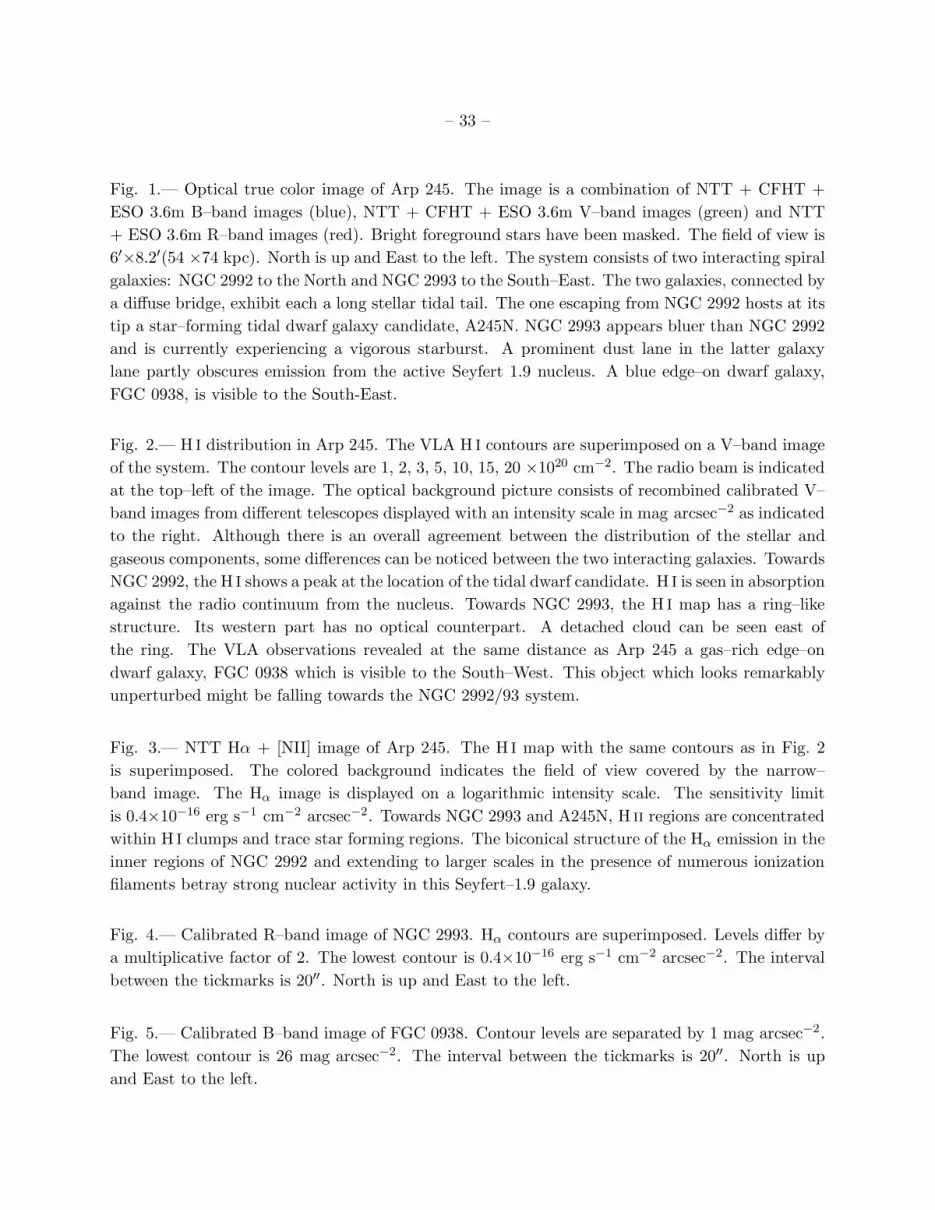
– 33 –
Fig. 1.— Optical true color image of Arp 245. The image is a combination of NTT + CFHT +
ESO 3.6m B–band images (blue), NTT + CFHT + ESO 3.6m V–band images (green) and NTT
+ ESO 3.6m R–band images (red). Bright foreground stars have been masked. The field of view is
6′×8.2′(54 ×74 kpc). North is up and East to the left. The system consists of two interacting spiral
galaxies: NGC 2992 to the North and NGC 2993 to the South–East. The two galaxies, connected by
a diffuse bridge, exhibit each a long stellar tidal tail. The one escaping from NGC 2992 hosts at its
tip a star–forming tidal dwarf galaxy candidate, A245N. NGC 2993 appears bluer than NGC 2992
and is currently experiencing a vigorous starburst. A prominent dust lane in the latter galaxy
lane partly obscures emission from the active Seyfert 1.9 nucleus. A blue edge–on dwarf galaxy,
FGC 0938, is visible to the South-East.
Fig. 2.— H I distribution in Arp 245. The VLA H I contours are superimposed on a V–band image
of the system. The contour levels are 1, 2, 3, 5, 10, 15, 20 ×1020 cm−2. The radio beam is indicated
at the top–left of the image. The optical background picture consists of recombined calibrated V–
band images from different telescopes displayed with an intensity scale in mag arcsec−2 as indicated
to the right. Although there is an overall agreement between the distribution of the stellar and
gaseous components, some differences can be noticed between the two interacting galaxies. Towards
NGC 2992, the H I shows a peak at the location of the tidal dwarf candidate. H I is seen in absorption
against the radio continuum from the nucleus. Towards NGC 2993, the H I map has a ring–like
structure. Its western part has no optical counterpart. A detached cloud can be seen east of
the ring. The VLA observations revealed at the same distance as Arp 245 a gas–rich edge–on
dwarf galaxy, FGC 0938 which is visible to the South–West. This object which looks remarkably
unperturbed might be falling towards the NGC 2992/93 system.
Fig. 3.— NTT Hα + [NII] image of Arp 245. The H I map with the same contours as in Fig. 2
is superimposed. The colored background indicates the field of view covered by the narrow–
band image. The Hα image is displayed on a logarithmic intensity scale. The sensitivity limit
is 0.4×10⁻¹⁶ erg s−1 cm−2 arcsec−2. Towards NGC 2993 and A245N, H ii regions are concentrated
within H I clumps and trace star forming regions. The biconical structure of the Hα emission in the
inner regions of NGC 2992 and extending to larger scales in the presence of numerous ionization
filaments betray strong nuclear activity in this Seyfert–1.9 galaxy.
Fig. 4.— Calibrated R–band image of NGC 2993. Hα contours are superimposed. Levels differ by
a multiplicative factor of 2. The lowest contour is 0.4×10⁻¹⁶ erg s−1 cm−2 arcsec−2. The interval
between the tickmarks is 20′′. North is up and East to the left.
Fig. 5.— Calibrated B–band image of FGC 0938. Contour levels are separated by 1 mag arcsec−2.
The lowest contour is 26 mag arcsec−2. The interval between the tickmarks is 20′′. North is up
and East to the left.

– 34 –
Fig. 6.— 20–cm radio continuum map superimposed on the R–band image of Arp 245. Levels are
1.8, 3.5, 6.8, 13.2, 25.7, 50.1, 97.3, and 189 mJy beam−1 .
Fig. 7.— H I channel maps of Arp 245. The contours in each channel are superimposed on an
optical DSS image of the system. Black contours correspond to H I seen in emission and white
contours H I seen in absorption. The lowest level is ± 0.8 mJy beam−1 and the interval is 1.8
mJy beam−1. The velocity of each channel in km s−1 is indicated at the bottom of each frame.
The VLA beam size is indicated in the upper left hand corner.
Fig. 8.— Sketch of the adopted orbital geometry for our simulations of the system Arp 245. We
set up the collision in such a way that the orbital angular momentum is parallel to the z–axes. The
initial galaxy positions are chosen such that the galaxies would reach their minimum separation
on the x–axis, if they were point masses moving on Keplerian orbits. The orientations of the spin
vectors of the two disks are specified in terms of ordinary spherical coordinates (θ1, φ1), and (θ2, φ2),
respectively. We shall assume that NGC 2993 is seen exactly face–on and is rotating clock–wise;
then the line of sight is along the spin vector of NGC 2993.
Fig. 9.— Time evolution of our numerical model of the system Arp 245. In each panel, we show the
projected distribution of the stars (color–scale) and that of the gas (green contours). Each panel
is 140h−1kpc on a side, and the labels give the elapsed time after the start of the simulation in
units of 0.1 Hubble times (or 0.98h−1Gyr). The model is shown in the plane of the sky and the
orientation is the same as in Fig. 2.
Fig. 10.— Face–on projection of the numerical model of NGC 2992 at T=0.6 and T=1.1. The 5%
gas particles that are at the edge of the unperturbed disk at T=0.6 are shown in red. At T=1.1
they concentrate at the end of the tidal tail at the location of the TDG.
Fig. 11.— Velocity map of Arp 245. (a) H I velocity map with optical contours superimposed.
(b) Velocity field of our numerical simulation. The contours indicate the distribution of the stellar
component. The simulation is shown at a time when it best matches the observed morphology and
velocity field of Arp 245. This point of time is 100h−1Myr after first passage through pericenter,
and 1.1h−1Gyr after the start of the simulation. The color scale gives the line–of–sight velocity of
the gas relative to the systemic velocity of the system.
Fig. 12.— Smoothed calibrated BRJ images and V-K′ color map of A245N. The surface brightness
ranges in mag arcsec−2 are indicated at the bottom of each image. Black contours are separated
by 0.5 mag arcsec−2. The Hα contours are superimposed in white. Levels are 10, 30, 50, 70, 90%
of the peak flux (4.0×10⁻¹⁶ erg s−1 cm−2 arcsec−2). Tickmarks are separated by 10′′. Some stellar
clumps associated with H ii regions are clearly visible. Foreground stars have been subtracted from
the images.

– 35 –
Fig. 13.— Surface brightness profile of A245N in the B (filled squares) and R (open squares) bands.
Fig. 14.— Azimuthally averaged surface brightness profile at the tip of the simulated tail at T=1.1.
The exact center is indicated in the surface brightness map.
Fig. 15.— B–R color profile of A245N (filled squares) and of its parent galaxy NGC 2992 (open
circles). The radius r = 0 corresponds to the optical center of each object.
Fig. 16.— Spectral energy distribution of A245N. The y–axis is the B-X color index in mag and
the x–axis the wavelength in A. The SED averaged over the entire TDG is traced with the thick
red line. The SEDs of the two brightest H ii regions in A245N are indicated with the thin yellow
lines. The blue thin line corresponds to the SED of the bright blue stellar clump in A245N. The
SED of a region in the tail outside the H ii regions is indicated with a thick black line. The purple
stars correspond to the SED of the outskirts of NGC 2992. Finally the red dashed line is our best
model for the underlying stellar population of A245N. The bars at the bottom correspond to an
extinction of AB=0.5 mag. All magnitudes are corrected for Galactic extinction.
Fig. 17.— (a) Hα map towards A245N. The contour levels are 10, 30, 50, 70, 90% of the peak flux
(4.0×10⁻¹⁶ erg s−1 cm−2 arcsec−2). The principal condensations are labeled. The interval between
the tickmarks is 10′′ . (b) Optical spectra of the clumps TDG 3 (arbitrary units) and TDG 4 (the
units are erg cm−2 s−1 A−1 ). The spectra, typical of H ii regions, show that the TDG is actively
forming stars.
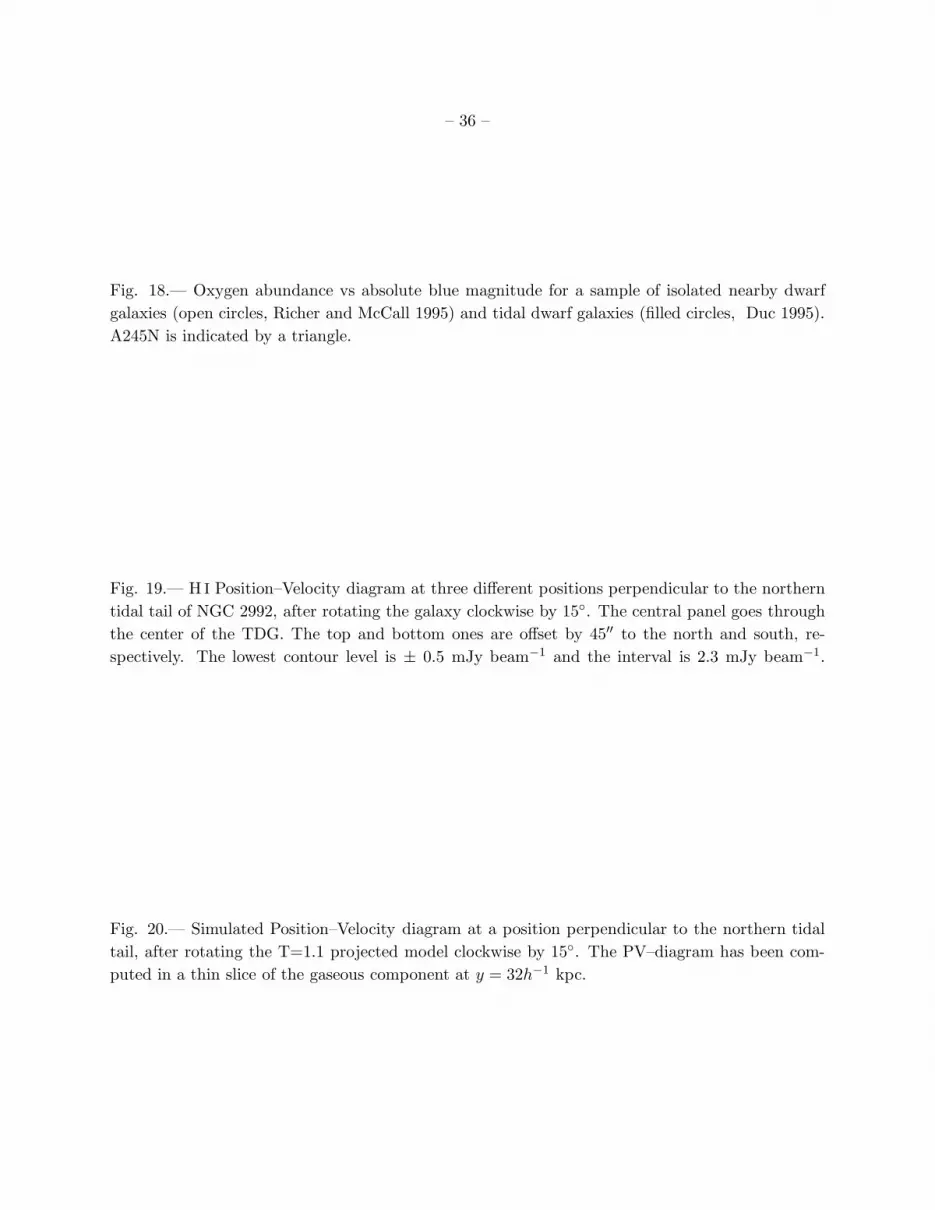
– 36 –
Fig. 18.— Oxygen abundance vs absolute blue magnitude for a sample of isolated nearby dwarf
galaxies (open circles, Richer and McCall 1995) and tidal dwarf galaxies (filled circles, Duc 1995).
A245N is indicated by a triangle.
Fig. 19.— H I Position–Velocity diagram at three different positions perpendicular to the northern
tidal tail of NGC 2992, after rotating the galaxy clockwise by 15◦. The central panel goes through
the center of the TDG. The top and bottom ones are offset by 45′′ to the north and south, re-
spectively. The lowest contour level is ± 0.5 mJy beam−1 and the interval is 2.3 mJy beam−1.
Fig. 20.— Simulated Position–Velocity diagram at a position perpendicular to the northern tidal
tail, after rotating the T=1.1 projected model clockwise by 15◦. The PV–diagram has been com-
puted in a thin slice of the gaseous component at y = 32h−1 kpc.

– 37 –
Table 1: Observing log.
Date Telescope/Instrument Technical details
Optical imaging Feb. 1992 CFHT/PUMA1K SAIC1 CCD; 0.34′′ pixel−1;
B,V filters
Feb. 1995 NTT/EMMI2K Tektronix CCD; 0.27′′ pixel−1;
Bb,V,R filters (red arm)
Jan. 2000 ESO 3.6m/EFOSC22K Loral CCD; 0.31′′ pixel−1 (2×2
binning); B,V,R filters
Near–infrared imaging Feb. 1996 MPG–ESO 2.2m/IRAC2BNICMOS3 IR array; 0.5′′ pixel−1;
J,H,K′ filters
Hα imaging Feb. 1995 NTT/EMMI2K Tektronix CCD; 0.27′′ pixel−1;
HA/3,HA/0 filters
Long–slit spectroscopy Feb. 1995 NTT/EMMI
2K Tektronix CCD; 0.27′′ pixel−1
1.5′′ wide longslit, grism #3 (360
g mm−1)
MOS spectroscopy Jan. 2000 ESO 3.6m/EFOSC21.7′′ wide slits; grism #11 (300
g mm−1)
H I line map Sept. 1997 VLA/CS–array details in Table 2
CO line observations Jun. 1999 IRAM 30mCO(1-0) beam: 22′′
details in Braine et al. (2000)
Nov. 1999 SESTCO(1-0) beam: 44′′
details in Paper II

– 38 –
Table 2: VLA Observing Parameters.
Parameter Value
Object NGC 2992/93 (Arp 245)
Instrument Very Large Array (VLA)
Configuration CS–array
Observation date 1997 September 7
Total observing time 5.7 hours
Number of antennas 27
Field center (α, δ)J2000 09h45m42s,−14◦19′35′′
Flux/bandpass calibrator 1331+305
Phase calibrator 0902–142
Central velocity (Vheliocentric) 2341 km s−1
Observed baselines (min–max) 0.05 – 3.4 km
FWHP of primary beam 32′
System temperature 35 K
Correlator mode 4
Total bandwidth per IF 3.125 Mhz (650 km s−1)
Number of channels per IF 32
Channel spacing 21 km s−1
FWHM velocity resolution 21 km s−1
RMS noise per channel 0.4 mJy beam−1
Smoothing applied None Gaussian
FWHP of synthesized beam 19′′ × 14′′ 35′′ × 35′′
Conversion factor 2.18 0.495
TB(K)/S(mJy beam−1)
Conversion factor 3.97 × 10¹⁸ 9.02 × 10¹⁷
NHI(cm−2) /NHI(mJy beam−1 km s−1)

– 39 –
Table 3: Properties of the interacting partners.
NGC 2992 NGC 2993 FGC 0938
α (J2000) 09h45m42.0s 09h45m48.3s 09h45m34.4s
δ (J2000) −14◦19′35′′ −14◦22′05′′ −14◦24′16′′
Heliocentric systemic velocity (km s−1) 2330 2420 2500
inclination (deg) 70 20 80
Morphological type Sa pec Sab Scd
Corrected Blue total magnitude 12.23 12.51 16.95
Absolute blue magnitude -20.23 -19.95 -15.51
Blue luminosity (1010 L⊙) 1.92 1.49 0.02
FIR luminosity (1010 L⊙) 1.80 2.54 –
H I mass (109 M⊙) 1.97 1.05 0.70
H2 mass (109 M⊙) 1.19 0.39 –
Hα+[NII] luminosity (1040 erg/s) 17 28 –
20 cm emission (mJy) 180 45 –
B-V color index (total,outskirts) 0.79, 0.62 0.33, 0.40 0.46, –
V-R color index (total,outskirts) 0.51, 0.43 0.40, 0.39 0.30, –
V-K′ color index (total,outskirts) 3.60, 3.03 –,– –,–
J-H color index (total,outskirts) 0.64, 0.41 –,– –,–
H-K′ color index (total,outskirts) 0.46, 0.47 –,– –,–
Sources: NED (positions, FIR fluxes), LEDA (morphology, corrected blue magnitudes). The other
data are from this paper. The velocity of FGC 0938 is the HI velocity. All optical magnitudes have
been corrected for Galactic extinction. The magnitudes labeled “outskirts” have been measured
with a polygonal aperture that encompassed the outermost regions of NGC 2992/93, at a minimum
radial distance of 30′′ from the nucleus and avoiding the prominent dust lane.

– 40 –
Table 4: Properties of the tidal features.
NGC 2992 tail NGC 2993 tail Bridge
Optical extent (kpc) 15.5 26.6 14.4
B magnitude a 14.63 ±0.01 15.22 ±0.01 15.51 ±0.1
B-V a 0.57 ±0.02 0.39 ±0.02 0.50: ±0.2
V-R a 0.42 ±0.02 0.45 ±0.02 0.45: ±0.2
H I mass (108 M⊙) 11.6 8.5 3.7
Peak H I column densities (1021 cm−2) 2.3 0.4 0.65
V–band max Surface brightness (mag arcsec−2) 22.1 23.3 24.0
a Corrected for Galactic extinction

– 41 –
Table 5: Properties of the tidal object A245N.
α (J2000) 09h45m44.2s
δ (J2000) −14◦17′29.1′′
Heliocentric H I velocity 2175 km s−1
Mean optical velocity 2240 km s−1
Distance to progenitor 19.2 kpc
Size (D24.5) 5.0 ×10.5 kpc
Blue magnitude a 15.21 ±0.01
Absolute blue magnitude a -17.25 ±0.01
Blue luminosity a 12.3 ×10⁸ L⊙
Blue central surface brightness a 22.4 mag arcsec−2
Optical/NIR colors a B-V=0.55 ±0.01
V-R=0.41 ±0.02, V-K′=3.14 ±0.02
J-H=0.32 ±0.03, H-K′=0.51 ±0.03
H I mass 8.9 ×10⁸ M⊙
H2 mass 1.4 ×10⁸ M⊙
Hα+[NII] luminosity LHα= 0.74 ×1040 erg s−1
Star Formation Rate b 0.03 (0.13) M⊙ yr−1
Intrinsic extinction c AB= 2.6 mag
a Corrected for Galactic extinction b Corrected for Galactic and total
extinction (values in parentheses) c Derived from the Balmer decrement
towards TDG 4

– 42 –
Table 6: Spectrophotometry of A245N.
TDG 1a TDG 3a TDG 4a
[OII] 3727 –,– 183±23, 401±50 –,–
Hβ 4861.3 100±37, 100±37 100±18, 100±18 100±17, 100±17
[OIII] 5006.9 35±28, 32±26 74±8, 68±7 88±17, 82±15
[NII] 6548.1 125±61, 51±25 –,– 80±18, 37±8
Hα 6562.8 705±172, 285±70 785±80, 285±29 622±64, 285±29
[NII] 6583.4 338±93, 135±37 290±33, 104±12 291±33, 132±15
[SII] 6716.4 200±68, 74±25 –,– 143±25, 60±11
[SII] 6730.8 101±41, 37±15 –,– 79±16, 33±7
Reddening Correction Factor (c) 1.17: 1.31 1.01
Hβ Equivalent Width (A) 6 ±2 9 ±2 13 ±2
a First values correspond to the observed fluxes relative to Hβ=100; second values correspond to
the extinction–corrected relative intensities.

– 43 –
Table 7: H I peak column densities in TDGs.
Object NHI Resolution Source
1020cm−2 kpcbeam−1
NGC 2992/93 23 2.9 ×2.1 this paper
NGC 5291 2.2–12.6 7.3 ×4.2 Malphrus et al (1997)
NGC 7252 3.2–5.5 8.1 ×4.8 Hibbard et al (1994)
NGC 4038/39 2.3 4.9 ×16.0 van der Hulst (1979)
Arp 105 3.2–9.6 13 ×11.7 Duc et al. (1997)

This figure "Duc.fig1.gif" is available in "gif" format from:
http://arXiv.org/ps/astro-ph/0006038v1

This figure "Duc.fig2.gif" is available in "gif" format from:
http://arXiv.org/ps/astro-ph/0006038v1

This figure "Duc.fig3.gif" is available in "gif" format from:
http://arXiv.org/ps/astro-ph/0006038v1

This figure "Duc.fig4.gif" is available in "gif" format from:
http://arXiv.org/ps/astro-ph/0006038v1

This figure "Duc.fig5.gif" is available in "gif" format from:
http://arXiv.org/ps/astro-ph/0006038v1

This figure "Duc.fig6.gif" is available in "gif" format from:
http://arXiv.org/ps/astro-ph/0006038v1

This figure "Duc.fig7.gif" is available in "gif" format from:
http://arXiv.org/ps/astro-ph/0006038v1

b
x
y
z
orbital planeN2993
N2992
to observer
�1 �2�2�1

This figure "Duc.fig9.gif" is available in "gif" format from:
http://arXiv.org/ps/astro-ph/0006038v1

This figure "Duc.fig10.gif" is available in "gif" format from:
http://arXiv.org/ps/astro-ph/0006038v1

This figure "Duc.fig11.gif" is available in "gif" format from:
http://arXiv.org/ps/astro-ph/0006038v1

This figure "Duc.fig12.gif" is available in "gif" format from:
http://arXiv.org/ps/astro-ph/0006038v1


2 4 6 8 10 12 14 16R [ h-1 kpc ]
0.0001
0.0010
0.0100
surf
ace
brig
htne
ss


This figure "Duc.fig17.gif" is available in "gif" format from:
http://arXiv.org/ps/astro-ph/0006038v1

