guam agricultural experiment station
TRANSCRIPT

GUAM AGRICULTURAL EXPERIMENT STATION University of Guam Annual Report 1986

FROM THE DIRECTOR
In 1986, collaborative research programs with the International Research Sites Network for Agrotechnology Transfer (IBSN AT) and the International Potato center (CIP) were continued.
Research facilities for ornamentals were completed.
The stations has expanded its stations to Yigo and Barrigada in addition to Inarajan and Ija. The additional sites will provide opportunities to experiment in different soils of the Northern, Central and Southern parts of the island.
AES faculties were involved with FAO and UNDP with travels to the Maldives for biological control of the giant African snail survey of insects including training of local personnel to survey, recognize and collect insects, respectively.
Experiment station personnel were heavily involved in the College of Agriculture and Life Sciences' planning efforts. It is anticipated that research projects henceforth be much more integrated.
In 1986, Dr. Muniappan elected to do full time research. Dr. Demeterio was appointed in December as Associate Director for AES.
WILFRED P. LEON GUERRERO DEAN/DIRECTOR

The cover designed by Cecilia A. Perez features several photographs depciting the work of the beneficial insect Pareuchaetes pseudoinsulata in controlling the pest weed Chromolaena odorata. Photos by: Dr. R. Muniappan,
Professor of Entomology
BOARD OF REGENTS
J.U. Torres (Chairman)
Gorgonio E. Cabot (Vice Chairman)
John M. Phillips (Treasurer)
Joseph E. Hosie (Member)
Eloy Q. Benavente (Member)
Elizabeth F. Lujan ·(Member)
Jesus S. Quinata (Member)
James F. Wang (Member)
Andrew L. Orsini (Student Regent)
UNIVERSITY PRESIDENT
Dr. Jose Q. Cruz
AGRICULTURAL EXPERIMENT STATION
STAFF
Wilfred P. Leon Guerrero, Ed.D.
R. Muniappan, Ph.D.
Dean/Director
Associate Director
Assistant Director
Associate Professor, Soils
Associate Profesor, Vegetable Horticulture
Research Associate, Horticulture
Associate Professor, Ornamental Horticulture
Research Associate, Horticulture
Professor, Animal Science
Assistant Professor, Pomology
Instructor, Agricultural Engineering
Assistant Professor, Entomology
Assistant Professor, Agricultural Economics
Research Associate, Entomology
Associate Professor of Entomology, Extension
Extension Agent II, Agronomy
Editor, Assistant Professor, Media
Associate Professor, Marine Biology (Research Affiliate)
Edith R. Blankenfeld
Jefren L. Demeterio, Ph.D.
Chin-Tian Lee, Ph.D.
Mari Marutani, Ph.D.
James McConnell, Ph.D.
Donald M. Nafus, Ph.D.
Anastacio L. Palafox, Ph.D.
R. Rajendran, Ph.D.
Calvin A. Saruwatari, M.S.
Ilse H. Schreiner, Ph.D.
Margarita M. Weidman, Ph.D.
Thomas Seibert, M.S.
Claron Bjork, Ph.D.
Jose A. Cruz, M.S.
Silas E. Gould, M.A.
Stephen G. Nelson, Ph.D.
Kenneth Carriveau, Ph.D.
Chu-Tak Tseng, Ph.D.
Joan Perry, M.A., MAPA
Fred Young, B.S.
Ncnita Dumaliang, B.S.
Rosenilda Marasigan, B.S.
Rudolfo Paulino, B.S.
Diana Ventura, B.S.
Perry A. Perez, B.F.A.
Cecilia C.T. Perez, B.A.
Edna M. Eclavea
AnnaMaria Garcia
Patrick E.Q. Perez
Anthony Meno, B.A.
Amanda Arceo
Associate Professor, Library Science (Research Affiliate)
Assistant Professor, Physics (Research Affiliate)
Resource Conservationist, SCS, USDA
Resource Conservationist, SCS, USDA
Biologist II
Chemist II
Chemist II
Chemist II
Extension Agent I, Graphic Designer/Illustrator
Media Technician
Secretary
Secretary
Secretary
Accountant II
Accountant Technician

Agricultural Engineering
Aquaculture
Crop Models
Database
Entomology - Biological Control
CONTENTS
Entomology - Biological Control of Chromolaena odorata
Entomology - Pest Management
Entomology - Pest Management and Biological Control
Horticulture - Fruit Crops
Horticulture - Ornamental Crops
Horticulture - Vegetable Crops (Potato)
Horticulture- Vegetable Crops (Winged Bean, Tomatoes)
Pesticides
Soil Science
1
2
4
5
8
12
14
19
24
27
34
44
51
55

AGRICULTURAL ENGINEERING
Calvin A. Saruwatari and Chin-tian Lee
Introduction
Research continued in agricultural engineering to study the application of micro-irrigation to vegetable crops on Guam. Field trials were carried out to determine the water requirement under micro-irrigation for cucumber on a private farm field. Domestic water was used.
Description of Experiment
A continuous function design with five water treatments and three replications was initiated on cucumber (Market King). Treatments 1 to 5 were set at 1.0 hours, 1.5 hours, 2.0 hours, 2.5 hours, and 3 hours per day, respectively. The discharge rate of the RIS Biwall was approximately one gallon per minute (224 liters per hour) per 100-foot (30-meters) lateral with a 18-inch (46-centimeter) spacing. Rainfall was measured on site and totaled approximately 9.43 inches (23.9 centimeters). Preplant fertilizer was applied at a rate of 10 pounds per 100 feet (22 kg per 30 meters) of 10-30-10 fertilizer and a side dress was applied at the same rate of 21-0-0-fertilizer. Insects problems and plant diseases were noted and treated with Dibrom, Tribasic Copper Sulfate, Sevin, and Dithane M-22 as part of the general spraying program. The irrigation system was not turned on during weekends and on days following rainfall measuring more than 0.5 inches ( 13 millimeters).
Results and Discussions
Analysis of the data collected showed no significant difference in the number of fruits formed between the treatments. No significant difference was found between the treatments.
Conclusions
Based on the results of this experiment, irrigating at least one hour per day in the absence of rainfall is sufficient for growing cucumbers on this particular soil type (Guam variant). Since the total applied water in Treatment 1 of one gallon per minute (224 liters per hour) per 100 feet (30 meters) is equivalent to an application of0.32 inches (0.85 centimeters), the irrigation system need not be turned on if the rainfall exceeds 0.5 inches (13 millimeters). Additional irrigation will not increase yield.
The recommended harvest length for this variety of cucumber (Market King) is about 8 to 9 inches (20 to 23 centimeters) in length and a one inch (2.5 centimeter) diameter with harvesting taking place just prior to seed formation in the cucumber. It was found that the local preference was for a cucumber of 10 to 12 inches (25 to 30 centimeters) in length and at least an inch and a quarter (3.2 centimeters) in diameter.
1

AQUACULTURE
Stephen G. Nelson
This year our studies focused primarily on the feeding biology of rabbitfishes (siganidae) and included work on assimilation efficiencies and food preferences of the fish.
Siganids are one of several groups of herbivorous fishes commonly found in tropical coral ref and mangrove habitats. They are among few such fishes with characteristics which render them suitable for aquaculture. A particularly desirable feature of the group in this regard is that, in nature, siganids feed almost exclusively on a variety of filamentous and fleshy macroalgae. The abilities of these fishes to utilize macroalgal diets has stimulated interest in the development of algal-based, siganid culture systems within the tropical Pacific.
We were particularly interested in Sieanus areenteus, a common species which has been suggested for culture within the region. Examples of the results of our work with this species are shown in Tables 1, 2 and 3. Tables 1 and 2 display the results of the compositional analyses of diets and corresponding agesta for fish fed in the laboratory and fish which had been recently feeding in their natural environment. Table 3 compares the assimilation efficiencies of juvenile siganids which were either fed mono-algal diets or had been recently feeding on the naturally occurring alage of the reef-flats. An interesting point from this data was that the wild-caught fish had stomach contents which were higher in nitrogn content than found in any of the experimental algal diets. This suggests that the fish either supplemnet their diet with non-algal high-protein sources or that they can select high-protein thalli or portions thereof. We intend to further explore this issue. Studies of the feeding preferences of siganids were also intiated.
In addition to the work with siganids, analyses of the data concerning the physiology of agarophytes of the genus Gracilaria were completed. These seaweeds are often sold in fresh vegetable markets on Guam and may be usefully incorporated into brackfish or marine culture systems here.
Table 1. Organic and nitrogen contents (%) of algal diets and corresponding egesta of juvenile rabbitfish Sieanus areenteus. The values represent means of three anlysis.
Ingested Egested ------------------------------------ -------------------------------------
Diet Organic Nitrogen Organic Nitrogen
Enteromomha 81.62±0.88 2.72±0.36 66.84±0.23 1.06±0.05 Gracilaria 94.20±0.57 3.66±0.14 81.16±1.18 1.88±0.25 Hypnea 81.38±1.25 3.23±0.30 69.66±2.35 2.30±0.20 Saq~assum 87.10±1.60 2.36±0.46 77.00±2.83 1.47±0.13
2
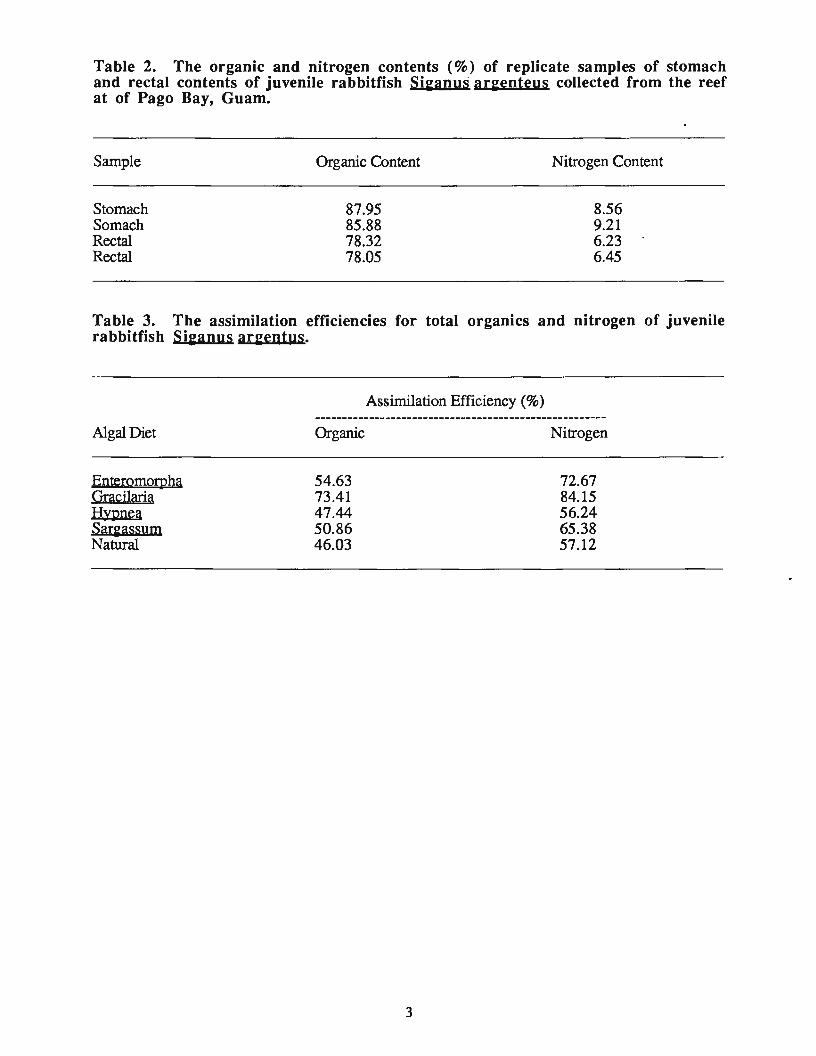
Table 2. The organic and nitrogen contents (%) of replicate samples of stomach and rectal contents of juvenile rabbitfish Si~anuS ar~enteus collected from the reef at of Pago Bay, Guam.
Sample Organic Content Nitrogen Content
Stomach 87.95 8.56 Somach 85.88 9.21 Rectal 78.32 6.23 Rectal 78.05 6.45
Table 3. The assimilation efficiencies for total organics and nitrogen of juvenile rabbitfish Si~anus ar~entus.
Assimilation Efficiency (%)
Algal Diet Organic Nitrogen
Ent~rQmor,uha 54.63 72.67 Gracilaria 73.41 84.15 Hypnea 47.44 56.24 Sargassum 50.86 65.38 Natural 46.03 57.12
3

CROP MODELS
T.C. Tseng
Introduction
The rapid introduction of new agrotechnologies to Guam and the Micronesian islands in the past two decades requires a better understanding of the complex inter-relations among soil, weather, irrigation, fertilization, and the growth of crops for farm management. The limited technical manpower and the high costs of collecting reliable data make it difficult to carry out comprehensive field analyses of crop growth and crop production on Guam. Computer crop models have been used to alleviate some of the problems by simulating crop growth and crop yields under various environment conditions. The objective of this project is to develop integrated models for cash crops cassava, corn and papaya. The models are based on the general grain model CEREAL and the perennial crop model EPIC developed in the United States; and adapted to the weather and soil components of the Western Pacific tropical environment of Guam and the Micronesia islands. Interactive microcomputer version of the models with extensive prompts for options and input parameters makes them more portable and easier accessible to the general users.
Results
Impact to Date or Expected
Adaptation of the CEREAL model developed by C.A. Jones et al., of the USDA Agricultural Research Service, Temple, Texas to Guam's environment has basically completed. Major changes from the Texas model are the climatological equations. These equations were simplified from the general ones applicable to the four-season temperate zones, to those applicable only to the wet-dry periods of the tropical zones. In particular because of the relative stable patterns of weather in the Micronesian islands, a set of more detailed estimations on the seasonal variations of sunshine hours, solar radiation, heat unit, relative humidity and potential evapotranspiration rates were introduced into the model; and the snow and frost components were deleted. In addition, a microcomputer-base interactive version, again adapted from the Texas' micro-version, has also been completed in this phase of project. The adapted microcomputer version emphasizes user-friendliness by extensively employing menus and comments on computer screen to prompt users to enter the relevant cultivar-specific parameters from the keyboard. It also prompts the user to select weather, soil, and fertilizer data-set names. The adapted interactive model includes further two subroutines: a subroutine for conversion of units for the input data, and subroutine for interpolation of missing data that are needed by the model. Missing data are common in field measurements and large data sets that involve keeping records over long periods of time, such as those of weather, soil, and fertilizer components. The adapted model for Guam environment is now in the validation stage. Com data gathered by Dr. Cope and Dr. Demeterio at the University of Guam's Inarajan Experiment Station in 1985 and 1986 respectively, were used for validation. Using the cultivar-specific parameters provided by Dr. Jones for his Texas model and the Inarajan field data, both the Texas and the Guam-adapted models predicted higher com yields than those actually harvested. The difference between the prediction and the observation may be due to the tropical environment, which may affect the physiology of the cultivars that were developed in the temperate U.S. mainland but planted on Guam. A fine-tuning of the parameters for these cultivars with the Inarajan data by nonlinear steepest-descend method is now in progress.
4

DATABASE
K.L. Carriveau
Introduction
The Micronesian Area Tropical Agriculture Database Center began in 1982 as a cooperative venture of the College of Agriculture & Life Sciences and the Robert F. Kennedy Memorial Library. The goal of the project was to gather in one location all published and unpublished documents produced in or about Micronesia concerning tropical agriculture and related subjects, and to provide bibliographic information retrieval and document dissemination services. Although the federal funding will end in June of 1987, the University of Guam has committed resources to insure continuance of the life sciences database. In 1986, the Micronesian Area Research Center assumed responsibility for the project and for the ultimate expansion of the model into a topically comprehensive access tool.
Objectives and Accomplishments
One major problem facing researchers in Micronesia used to be the access to information about agricultural research on a timely basis. The problem has been largely resolved as a result of this project. Its objectives and accomplishments may be summarized as follows:
1) Identifying sources of materials being published and making arrangement for automatic deposit of such materials with the center.
The major producers of agricultural documents in the Micronesian region have been identified and memoranda of understanding for automatic deposit have been negotiated with and signed by the governors and/or ministries of the Commonwealth of the Northern Mariana Islands, the Federated States of Micronesia, the Republic of Belau, and the Republic of the Marshall Islands. Bibliographic databases such as AGRICOLA and BIOSIS are searched routinely for the identification of published materials about Micronesia as the basis for future acquisitions.
2) Identifying and providing bibliographic access to information currently available as sections of books, journals, reports etc.
Computerized access to bibliographic information is provided to agriculturists both in inquiry and batch modes. The center uses IBM's SQL!Data System as the bibliographic information management system. The system's Interactive Structured Query Language was specifically designed for people who have little or no knowledge of computers. The Micronesian Area Tropical Agriculture Database (MATADB) was designed to provide timely access to comprehensive bibliographic information, and is intended to supplement rather than supplant existing resources, e.g., AGRICOLA. Each record is composed of six columns, i.e., AUTHOR, TITLE, SOURCE, DOCNO (document number), CALLNO (call number) and KWI (key word index/abstract). The key word abstract is a composite of fixed language subject headings taken from the Thesaurus of Key Words and natural language key words abstracted from the text of the document itself. A user can request a bibliography of references by author, by words within a title, by source, or by subject. More sophisticated searches can be done by using Boolean logic search strategies.
3) Provide services to collect, abstract, index and store materials produced in or concerning the Micronesian area in fields related to tropical agriculture.
5

The acquisition of materials is done through purchases, site visitations and automatic deposits . Once acquired, each item is indexed and abstracted for entry into MATADB. Monographs and serials are cataloged and incorporate into either MARC's Pacific Collection or the main library's collection for storage. Offprints, reprints and unpublished materials are stored on specially designated shelves in the Micronesian Area Research Center.
4) Maintain profiles of scientist working in the Micronesian area in terms of ongoing projects and long-term interests.
A database called Agriculture Registry (AGREG) was developed to keep track of project participants. Its scope is similar to USDA's Current Research Information System (CRIS) and makes provision for the recording of a person's name, title, address, phone number, interests, and projects. The database is updated annually and serves as a reference for identifying potential publications and for identifying appropriate audiences for the Selectiye Dissemination of Information serivces.
5) Provide Se,lective Dissemination of Information Services
A user's guide to SDI Services was published and mailed to all project participants in order to facilitate the dissemination of information. The guide indicates how to formulate appropriate search strategies and provides the requisite forms for document photoduplication services. Once a search request is received, a "quick bibliography" is generated and is sent not only to the requester but also to project participants who have a similar interest profile registered in AGREG. Beginning this year, a "quick bibliography" of what has been published within the past year will be generated and will be sent to all participating agencies in Micronesia.
6) Provide reference service to scientists working in the field throughout Micronesia in terms of being able to produce bibliographies and photoreproductions of documents on demand.
Reference services are available. However, requests for such services have been few. As in previous years a mini-workshop was conducted in 1986 in order to advertise the center's service capabilities. The workshop was open ot the public and was presented as a Micronesian Area Research Center Seminar. Scientists have been guaranteed the tailor-made bibliographies can be produced within 24 hours for off-line search requests or instantaneously through on-line searching.
7) To be able to exchange bibliographic data and copies of publications with similar tropical agriculture centers in Hawaii, Fiji, and elsewhere.
. The center is now able to exchange bibliographic data with similar institutions either on tape or in hard copy. Informal working relationships have been made with the University of Hawaii's Pacific Collection, the Pacific Basin Development Council, the Institute of Pacific Islands Forestry, the University. of the South Pacific's Pacific Information Center and the South Pacific Commission to share bibliographic data and/or publications. More formal working relationships have been established through memoranda of understanding with the Ministry of Agriculture & Lands, Solomon Island Government, the Department Resources Development, Kiribati, and the Institute of Natural resources, University of South Pacific. Interest in this area would seem to indicate that a Pacific region bibliographic network is feasable, but actualization of such a network may take some time to accomplish.
6

Future Prospects
On the whole, the Micronesian Area Tropical Agriculture Database project has been very successful. The initial problems of identifying and appropriate application program and of hiring research assistants have been resolved. In short, the project's goal has been accomplished in large part, and the University of Guam has committed resources to continue the work even when the federal funding ends. The Micronesian Area Research Center recognizes the applicability of the model to other disciplines and has already committed funds to expand MATADB's scope to include all life sciences. Grant applications have been submitted to the National Endowment for the Humanities and to the National Institutes of Health in order to continue the database's·expansion.
7

ENTOMOLOGY- Biological Control
Donald N afus
In 1986, studies were concentrated on the following topics: the establishment and effectiveness of Ganaspidium hunteri on the leafminer, Liriomyza trifolii; an evaluation of significance and natural enemy complex associated with the wooly whitefly, Aleurothrixus floccosus; and the biology and biological control of the mango shoot caterpillar, Penicillaria jocosatrix.
Status of release of Ganaspidium Hunteri
The release of Ganaspidium hunteri has continued to be monitored. Although additional recoveries of G. hunteri have been made, the parasite is uncommon and has had little impact on L. trifolii populations to date.
Biological Control of the Wooly Whitefly, Aleurothrixus Floccosus
A) Parasite Survey
The wooly whitefly was first noticed on Guam in 1984 and was causing serious problems on guava and citrus. In 1986, a survey program was initiated to determine if there were any parasites attacking the whitefly and if parasites should be imported for release. In addition, the population levels of the whitefly were monitored on different types of citrus.
Methods
Survey sites were set up in five villages. Two tangerine trees in each village were sampled each month beginning in March. On each tree, ten mature leaves were randomly collected. The number of whitefly nymphs and pupae, eclosed adults and dead whiteflies with exit holes of parasites were counted. All leaves were held and emerged parasites were collected for identification.
Results
Wooly whitefly populations were high in March but declined rapidly thereafter (Figure 1). A parasite, Eremzocerus sp. was found parasitizing the whitefly. About 40% of the whiteflies were parasitized in the initial sample. This percentage increased to about 60% in subsequent samples and has remained relatively constant since then. Whitefly numbers are currently not causing economic damage.
B) Survey of parasites on different citrus types
Lemon, lime, pomelo, tangerine, and calamansi were checked to see if there were differences in the population levels of wooly whitefly and in the rates of parasitization.
Methods
The study was conducted in an orchard in Yigo. Five trees each of lemon, lime, pomelo, tangerine, and calamansi were sampled every 3 months. On each tree, ten mature leaves were randomly collected. The number of whitefly nymphs and pupae, eclosed adults, and dead whiteflies with exit holes of parasites were counted. All leaves were held for parasites and wooly whitefly emergence.
8

Results
Tangerine had the highest populations of wooly whitefly. Parasitization rates were similar on all types of citrus (Table 1).
Biological Control of the Mango Shoot Caterpillar, P. ]ocosatrix
A) Impact of caterpillar on fruit and leaf production
Studies of the impact of P. jocosatrix on mango were conducted to assess the impact of the caterpillar on flower and fruit production.
Methods
The studies used the same methods as reported in 1985. Two sties were selected for study, Agat and Barrigada. At each sites, 8 trees were selected, 4 treated and 4 were left as an untreated check. On each tree, 20 buds were randomly selected and tagged. The number of caterpillars, flushing leaves, and flowers produced were recorded for each of these buds.
Results
Caterpillar populations were low in 1986 (Figures 2 and 3) and study trees sustained little damage compared to the trees studied in 1985. New shoots suffered little defoliation and both treated and untreated trees had one major flush and little flush thereafter. Flower and fruit production was similar on untreated and treated trees.
B) Basic biology of the caterpillar
The basic biology of the mango shoot caterpillar was studied to provide needed information for pest management and for initiation of biological control.
Methods
The studies were conducted under field conditions in Barrigada. Individual shoots on a mango tree were randomly selected as the buds began to break. All shoots on each branch were followed. Each day the shoots were searched for eggs and larvae. The location of the eggs were recorded. All larvae were marked with india ink on the head capsule. The location, head capsule size, body length were measured daily. A daily record of the size and age of the leaves on each shoot were kept.
Results
Eggs were laid on breaking buds and young leaves until about 11 days after budbreak. The eggs hatched in 2-3 days and the caterpillar went through 5 instars. Development was extremely rapid with the caterpillar going through an instar a day (Table 2). The feeding period lasted 5-6 days before the caterpillars left the leaves to search for pupation sites in cracks or crevices in the bark or in the soil at the base of the tree.
The larva fed only on the new growth. First instars feeding on leaves which were older than 10 days suffered high mortality. Older instars consumed leaves up to 13 days old, at which point the leaves changed from brown to green and became tougher. After this time the leaves were not suitable as a food source.
C) Natural enemy survey and release of biological control agents
Eggs, larvae, and pupae were surveyed for local parasitoids. No parasitoids were found attacking any of the life stages. Predatory wasps, 3 species of Delta, were observed removing the caterpillars from the trees. The impact of the predators is unknown at this point.
9

The wasp, Aleoides sp. near circumscriptus, is being released as a potential control agent for the caterpillar. It is a solitary larval parasite which attacks the first 3 instars. Shipments of about 150 Mummies have been found on the release trees the week after release, and in one case on an adjacent trees three weeks after release. Surveys are continuing.
. Trichogramma platneri was released but has not been recovered from the mango shoot
caterpillar to date.
Releases of other parasites will be made in 1987.
Table 1. Parasitization of the wooly whitefly on various types of citrus.
Host plant
Calamansi Lemon Lime Pomelo Tangerine
Table 2. caterpillar.
Life stage
Egg Caterpillar
Pupa
Duration and
Ins tar
1 2 3 4 5
%Parasitized wooly whiteflies
46 64 41 41 49
Number wooly whiteflies/10 leaves
8.0 6.9 9.7
17.0 36.0
sizes of life stages and instars of the mango
Duration Head capsule Body length (in Days) (mm) (mm)
2-3 0.2 2-4 1 0.5 4-7 1 1.0 8-11 1 1.5 11-17 2-3(1-2 feeding) 2.5 17-22 11-12
10
shoot

1/)
.~ -2 :.c ~ >. 0 0 ~ -0 ..... Q) .0 E ::::> z
1/) Q)
> rd ~
0
..... Q)
a.
2 0 0
..r:::. 1/)
0 N .._
~ Q)
~ 0
;;= ..... 0 1/) Q) .c 1/)
~ 0 z
160
140
120
100 -o 100 Q) N
80 80 :;:::; 1/)
~ 60 60 rd
a.
40 40 c Q)
20 20 u ..... Q)
a... 0
Mar Apr May Jun Jul Aug Sept
Figure 1. Changes in the population or wooly whiteflies in relation to the percent parasited
0 Flowers 1 0 5
.; 1/)
9 ··.
~ 0 ::
::, Flushes 0 8 ::: :;
.
4 .c .; 1/)
7 ~i~ 1 0
6 1 3 N
5 :~~ 'i~i 1/)
:~: .;;: .... 4 :~: 2 ~
·~ ·a.. 3 ....
Q)
2 1 cu u
1 0
0 0 z 18 31 14 25 15 27 10 25 10 22 11 22 1 9 Mar Apr May Jun Jul Aug Sep
Figure 2. Number or flowers and flushes in relation to populations of the mango shoot caterpillar in 1986: untreated trees.
2 0
D 0 .c Flowers 1/) 1 0 5
0 9 2 N
~ Flushes 0 .._ 8 4 0 .
.c 1/) 1/) .... Q) 7 0 ~ .g 6 3 N
.._ ..... 5 1/) 0 ....
4 2 rd 1/) -Q)
3 ·a.. ..r:::. ..... 1/) Q)
::::> 2 cu ;;= u 0 1 0 z 0 0 z
18 31 14 25 15 27 10 25 10 22 1 1 22 19
Mar Apr May Jun Jul Aug Sep
Figure 3. Number of flowers and flushes in relation to populations of the mango shoot caterpillar in '986: treated trees.
11

ENTOMOLOGY- Biological Control of Chromolaena odorata
T.F. Seibert
Introduction
In 1985 Pareuchaetes pseudoinsulata established and was doing widespread defoliation of Chromolaena odorata on Guam. This year the project concentrated on follow-up information on the extent of the damage caused by Pareuchaetes and any effects a reduced population of the weed may have on the insect. Introductions to the Northern Mariana islands of Rota and Tinian were made. Additionally, an additional year of funding was obtained so that efforts to-get Mescinia sp near parvula (Pyralidae) and Melanagromyza eupatoriella (Agromyzidae) from Trinidad could be made.
Pareuchaetes pseudoinsulata
Pareuchaetes pseudoinsulata introductions that have failed or succeeded in the past both lack follow-up studies to determine why they failed or what the impact was on the Chromolaena population. The follow-up needs to be continued for a number of years if establishment occurs so that the rate of impact can be evaluated and the dynamics of the decline or recovery can be understood.
Impact of Defoliation on C. odorata Density
Data on control through 1986 showed that Pareuchaetes can have a significant impact on the weed, however, the local Chromolaena population growth characteristics may influence the success of the insect. The best results by Pareuchaetes appear to be obtained in open fields that are heavily infested by the weed. Under these conditions movements by the insects are unrestricted and a continuum of the weed or local Chromolaena refuges from the original allows for maintenance of a local insect population despite reduced plant availability after the initial defoliation. Changes in field site plant density six months and one year following colonization by Pareuchaetes are shown in Fig.l for three sites. It can be seen that heavy mortality was inflicted on the Chromolaena popuJations. The insects must maintain a population in the area to inflict the continuous damage necessary to cause plant mortality by resource drain. Roadside and patchily distributed populations of the weed appear to recover to a greater extent than field populations because of local extinctions of Pareuchaetes before refoliation from the root crown occurs and food availability is'Tenewed. Despite this mortality and the significant reduction in seed weight and germination reported last year, some plants will eventually recover and new individuals will develop from seeds in the soil. Therefore it is important that further follow-up studies on the progress of Chromolaena recovery be conducted to determine what the ultimate impact Pareuchaetes has on the Chromolaena population.
Pareuchaetes Releases - Rota & Tinian
In February releases of P. pseudoinsulata were made on Rota, CNMI. The first release consisted of approximately 1000 adults, the second of approximately 500 adults, both field collected on Guam the night prior to their release. The first shipment was released approximately one half mile west of the airport, the second approximately one quarter mile east of the airport.
A follow-up survey conducted in November revealed the insects were widely defoliating at virtually all locations at lower elevations on the island. The local farmers apparently took a great interest in the work of the insects and transported truckloads of the caterpillars on uprooted Chromolaena at the front of the infestation to their farms. Only the east and west ends of the island and the fields on the central mountain appeared to not yet have the insect.
12

One shipment of approximately 500 insects was released in early October on Tinian approximately 2 miles north of the airport. No follow-up has yet been conducted. Mescinia and Melanagromyza.
As mentioned above, long term control of Chromolaena by Pareuchaetes is still uncertain. Particular concern results from the poor colonization ability of Pareuchaetes. Because of this, efforts to import the stem borers Mescinia sp near parvula and Melanagromyza eupatoriella were initiated. These insects are hoped to be complimentary to the damage done by Pareuchaetes by stunting the elongating growth of the stems that overgrow native vegetation. This stem elongation is what I consider to be the most aggressive character of the plant in its takeover of adjacent vegetation. Additionally, Melanagromyza is an excellent colonizer of patches as I found on a visit to the native range of the weed in Trinidad. Virtually, every patch of the weed had some stems attacked by this agromyzid fly.
Permits were obtained for both species and the first shipments from the Commonwealth Institute of Biological were received in December. Unfortunately, these insects have not been successfully bred in captivity and thus those received were field rele~ ... ~d after screening for parasites in quarantine. The small number released in the field lessens the chances of establishment however currently there is no alternative. Only 21Mescinia adults emerged and were released, while only 26 Melanagromyza were released.
Conclusions
The damage done thus far by Pareuchaetes is very encouraging. Chromolaena numbers have been greatly reduce in field habitat and the weeds appear to have been largely replaced by other vegetation. Time will be necessary to determine whether the weed can recover from this significant damage. One consideration that must be made is whether the vegetation replacing the Chromolaena is more desirable than the weed itself. Both weedy and desirable species have been replacing Chromolaena. Some form of pasture management is going to be necessary both to prevent easy recolonization of overgrazed pastures by Chromolaena and to ensure that the species in the community replacing the weed are desirable.
Stem borers are an attractive addition to Pareuchaetes because of their damage and in the case of Melanagromyza because of its colonizing ability. The next year will concentrate on establishing stem borers and following the recovery of Chromolaena, if any.
13

ENTOMOLOGY - Pest Management
lise Schreiner
Eggplant
Eggplants (var.B-1) were transplanted July 9, 1986. Rows of twelve plants each, spaced 2 ft. apart were either mulched with black plastic, or left unmulched. The rows were 5 ft. apart. The insecticide tested was Sevin, applied at the rate of 2 tablespoons per gallon (2lbs/ 100 gallons). The treatment was applied weekly throughout the growing cycle. The mulch and the insecticide treatments and the untreated control were each replicated 4 times. Counts of the insects present were done on three occasions. On the first occasion, the numbers of fleabeetles (Epitrix hirtipennis) and fleahoppers (Halticus tibialis) were estimated by counting the number of two leaves on each of 12 plants. More species of arthropods appeared later in the season. Leafhoppers (Sundapterix biguttula) and mealybugs (Ferrisia virgata) were estimated by counting the number of adults and nymphs on 4 leaves large leaves on each of 10 plants. The number of spider mites (Tetranychus sp.poss. cinnabarinus) and aphids (Aphis gossypii ) were counted on the first fully expanded leaf on one shoot of each of ten plants.
Results
The insecticide treatment significantly reduced the numbers of most of the insect species (Table 1 ). However, the number of spider mites was significantly higher in the plots treated with Sevin. The yield was variable due to the heterogeneity of the field (which was on a slope) but a two way analysis of variance with position in the field and treatment as the two factors showed a significantly higher yield in the insecticide treated plots. Untreated plots appeared burned due to leafhopper damage by the later part of the growing cycle and most of the difference in yield can probably be attributed to control of the leafhopper. The mulched plots did not differ significantly in any way from the untreated plots.
Beans
A trial was run to compare several spray regimes for the leafminer, with no treatment for leafminer, but control of other pests. Beans were planted Feb 7, 1986. Plots consisted of two 6 m rows, 1.2 m apart. The rows were separated by rows of sweet com to minimize insecticide drift. The treatments consisted of:
1) spraying once a week with Pydrin for the whole growing season; 2) spraying Pydrin weekly until the beans flowered and then spraying with Dibrom to control
pod borers only; 3) spraying Cygon early for control of beanfly, and then spraying Pydrin weekly once
flowering began; and 4) spraying Cygon for bean fly control and Dibrom for pod borers.
The number of leafminers per plot was estimated by counting the number of mines on 40 mature leaves in each plot. Yield was the total yield for both rows.
Results
The various spray regimes had no effect on leafminer numbers, and thus there were no differences in yield (Table 2). There was a slight but non-significant reduction in the percent pods damaged by borers if the Pydrin was used after flowering. Previous trials had shown Pydrin to be highly effective against leafminers and pod borers on beans. It is thought that the insecticide had become ineffective due to being stored for three years in a rather hot shed.
14

Cucumbers
Cucumbers (var.Slice Master) was planted Oct. 20, 1986. The plants were grown on trellises, in rows 5ft apart. Black plastic mulch was laid on all the rows, and they were fertiiized with 16-16-16 at the rate of 100 lbs N/acre. To determine whether cucumber beetles (Aulacophora simi/is) could be controlled with insecticides applied in the soil, granular diazinon was applied to half the rows, whereas the other half were untreated. Each row was then split into three foliar treatment: either Sevin or Dipel applied weekly or no treatment. Cucumber beetles were collected from parts of Guam where they were abundant, and released into the fields on several occasions. Diaphania indica (melon worm) numbers were estimated by counting the number of caterpillars per leaf on each of 20 mature leaves per subplot. All yield was picked and weighed.
Results
Despite the attempts to colonize cucumber beetles, the number of beetles in the field remained very low and no damage due to them could be observed. The number of melon worms was significantly reduced in the subplots being sprayed with insecticides (Table 3). The number and total weight of cucubers was not affected by the soil treatment, but was significantly higher in the subplots treated with insecticides than in the control plot .
Mango
Control of Blotch Miner
To determine if Sevin, which is effective as a chemical to control mango shoot caterpillar was also effective in controlling the number of blotch mines on mango trees, the following experiment was set up. Each of four mango trees in Agat and Barrigada was sprayed weekly anytime that new leaves were observed on the trees. The trees were checked once a week to determine if new leaves were present. The same number of similar close-by trees served as control. When new leaves were present, they were sampled twice a week for blotch miners, by randomly choosing 20 shoots, and counting the number of blotch mines on one leaf of each shoot.
Results
The overall mean number of blotch mines per leaf was 6.1± 3.3 on the treated trees, and 6.0± 3.0 on the untreated trees. There was no significant difference in these two numbers (t=0.093; P=0.928). It is Pfobable that checking the trees only once week resulted in spraying the trees to late, even supposing that Sevin might be effective. The blotch miners appear to attack only very young leaves. Once the blotch miners have attacked a leaf, the lesion remains whether or not the larva is killed by the insecticide. However, the mean number of mines per leaf was quite low, and it is unlikely that that number of blotch miners is damaging. Occasional susceptible trees may require control of the miner.
Populations of the Blotch Miner
The seasonal importance of blotch miner number was assessed in two separate samples. In the first sample, eight trees in Agat and eight trees in Barrigada were monitored. Twenty shoots were marked at the beginning of the year and every two weeks the marked shoots were observed to determine whether they had produced new leaves or flowers since the previous sample. At the same time, one leaf from each of 20 new shoots/tree (not necessarily those marked) were examined, and the number of blotch mines on the leaf was counted. If twenty shoots were not available, then the sample consisted of the number of leaves that were available at that time.
Because often the marked trees were lacking new leaves, so that sample sizes were small, a second monitoring program was begun. Once a month, four trees with many new leaves were examined in each of four villages (Merizo, Agat, Barrigada and Yigo). Numbers of blotch mines was recorded in a manner similar to the above.
15

Results
The population trends of the blotch miner in relation to the amount of the tree flushing can be seen in Figure 1. There does not appear to be a correlation between the amount of new leaves and the number of blotch miners. The population trend of the leafminers on heavily leafed trees in the four villages can be seen in Figure 2. Two full years of data will be required before it can be determined if there is a difference in seasonal incidence.
Table 1. Number of insects per sample and yield of eggplant.
Treatment
Sevin 4.4 lbs AI/acre Black plastic mulch Control
Fleabeetles Halticus Fleabeetles Halticus Empoasca Tetranychus Aphis July 23 July 23 Sept. 4 Sept. 4 Sept. 4 Sept. 4 Sept. 4
0.08a 0.72b 0.52b
0.7a 2.5b 1.9b
0.18a 0.48a 0.32a
0.3a l.Oa l.la
0.03a 0.4a 0.5a
22.7a 0.4b 0.4b
0.1a l.Ob 0.6ab
----------------------------------------------------------------------------------------------------------------------Empoasca Mealybugs Tetranychus Aphis Number Yield/row
Treatment Oct. 28 Oct. 28 Oct. 28 Oct. 28 eggplants (kg)
Sevin 3.0a 0.1a 15.5a O.Oa 319 19.0 Black plastic mulch 20.8b 2.3a 0.2b 2.5b 139 11.4 Control 26.4b 2.2a 0.1b 1.4ab 169 9.8
Table 2. Effect of several spray regimes on leafminer numbers and yield in yard-long beans.
Mean number Yield/row Percent pod Treatment leafrniners/leaf Kg borer damage
Pydrin every week 16.6 14.1 2.9 Pydrin until flowering 15.2 11.3 4.3 Pydrin after flowering 17.4 12.3 3.7 No Pydrin 17.8 11.4 4.6
16

No. flushing per20 branches
8
7
6
5
4
3
2
18 31 Mar
I Number flushed
D Number flowered
Blotch miners
:·.
No new leaves found
-"""'111'"'-&_,lt---t--•·-'\: ... :~~,;~\1....,,::"'' .... '''(-·''' ~ .... =.-~-·-· \ 14 25 15 27 10 22 11 22 19 30 15 3 12 28 29
Apr May J ul Aug Sep Oct Nov Dec
30
25 Number
20 blotch mines
15 per
10 leaf
5
0
Figure 1. Number of branches flushing and flowering, and number of blotch miners per leaf on the continuous survey trees in Agat and Barrigada.
40
35
30 Number
25 blotch mines 20 per 15 leaf
10
5
0 Sep Oct Nov Dec
Figure 2. Number of blotch miners per leaf in the monthly survey of four villages.
17
.,._ Agat
-o- Barrigada
...... Merizo
-a- Yigo
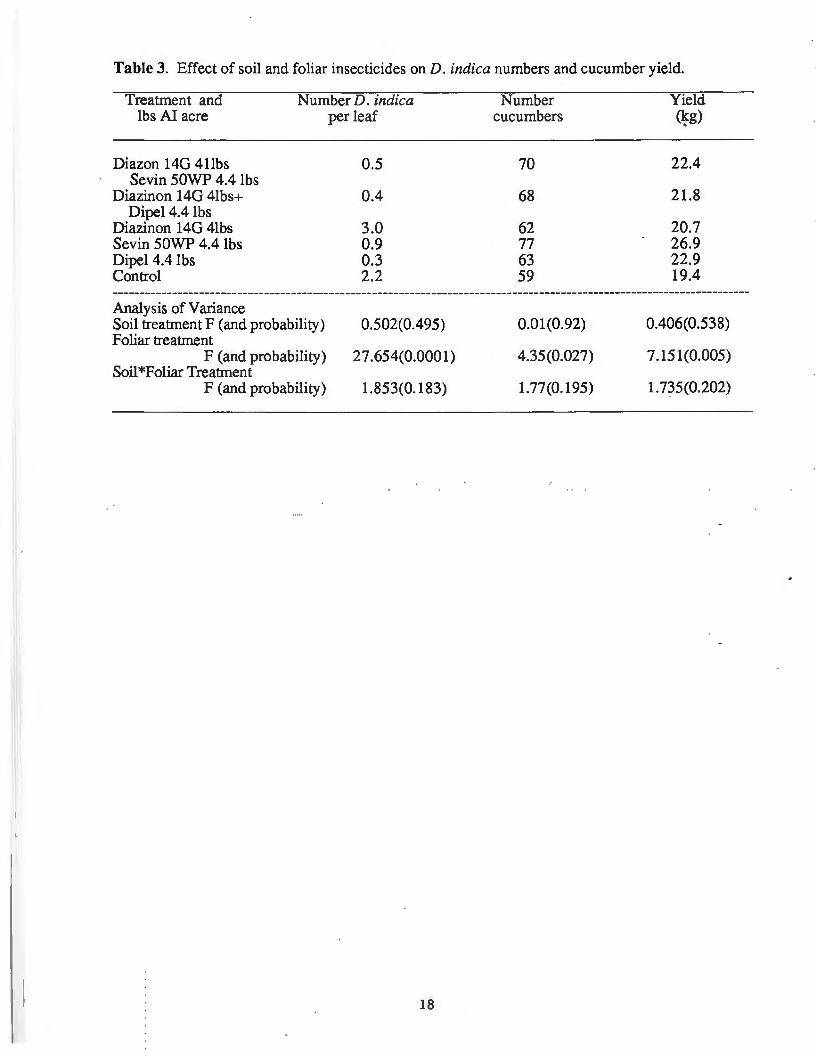
Table 3. Effect of soil and foliar insecticides on D. indica numbers and cucumber yield.
Treatment and Number D. indica Number Yield lbs AI acre per leaf cucumbers ~g)
Diazon 140 41lbs 0.5 70 22.4 Sevin 50WP 4.4 lbs
Diazinon 140 4lbs+ 0.4 68 21.8 Dipel 4.4 lbs
Diazinon 140 4lbs 3.0 62 20.7 Sevin 50WP 4.4 lbs 0 .9 77 26.9 Dipel 4.4 lbs 0.3 63 22.9 Control 2.2 59 19.4
Analysis of Variance Soil treatment F (and probability) 0.502(0.495) 0.01(0.92) 0.406(0.538) Foliar treatment
F (and probability) 27 .654(0.000 1) 4.35(0.027) 7.151(0.005) Soil*Foliar Treatment
F (and probability) 1.853(0.183) 1.77(0.195) 1.735(0.202)
18

ENTOMOLOGY -Pest Management -and Biological Control
lise Schreiner and Donald Nafus
Corn
Two trials were set up to determine whether tillage methods affected the number of predators feeding on com borers on sweet com plants, and if this would affect yield. The first trial was planted April 25, 1986 with Hawaiians Supersweet #9 seed. The no-till plots were treated with Round-up (glyphosate)before planting and with 2,4 D (Weed-B-Oone) after planting. The tilled plots were tilled preplant, and hand-weeded and rototilled later. The plots were 4.5 m (15ft) wide and 18.3 m (60ft) long, with com rows planted 90 em (3 ft) apart. The main plots were subdivided later in the season into 4 treatments, and treated with combinations of detasselling at the pollen-shed stage and/or weekly Dipel treatments. Ants were sampled with 4X10 em index cards soaked in vegetable oil. Cards were either placed on the ground and sampled 20 minutes later to determine the number of ants of what species had been recruited, or clipped to the stalks of com plants at about the level of the developing ear and sampled after 3 hours. Eight cards were used for each plot for each sample. The number of com borers per plant was determined by dissecting 5 plants/subplot the week after detasselling. The yield was determined for the whole plot, and all ears were peeled to determine if they were damaged by com borers.
For the second trial, the plots were made bigger, 17X17 m each. The same com variety was used, planted on July 16, 1986. The main plots were subdivided into 6 treatments, which were treated with weekly with Lannate, Dipel or nothing and either detasselled at pollen shed or not. The various samples were done as above, except that because of the low number of corn borers present, 10 plants per subplot were dissected to determine the number of corn borers per plant. Yield was determined by randomly choosing 50 plants per subplot and collecting all yield from these plants.
Results
Pitfall traps set out during the first trial did not reveal any ground dwelling predators other than ants, which were more conveniently sampled with the-oil soaked cards than with pitfall traps. The tillage method had no effect on ant numbers in Trial 1 (Figure 1). Three species of ants recruited to oil-soaked cards on the ground, So/enopsis geminata rufa (F.), Monomorium minutum Mayr and Tetramorium tonganum Mayr (identifications tentative pending confirmation by a taxonomist). Two of these, S. geminata and M. minutum, recruited to oil-soaked cards placed on the stems of the com plants and were occasionally observed feeding on com borer egg masses. S. geminata was also frequently found in the stalk cavities made by older com borer larvae, and appeared to be consuming pupae. The ant Technomyrmex albipes Fr. Smith was common on corn plants but could only be attracted to sugar bait. This ant was generally observed in association with the com delphacid Peregrinus maidis, and was not observed to be a predator on com borers.
The second trial took place during a period of extremely rainy weather, and ant activity was very low during the.whole experiment. Despite the much larger plot size in the second trial, there was still no difference in ant activity in the till and no-till plots (Figure 2).
Given the lack of difference in predator activity between the tilled and untilled plots, if was not surprising to find no significant differences in the number of corn borers per plot between treatments in either the first or the second trial (Table 1). The yield of undamaged ears was also not significantly different between the two treatments in either trial.
19

35 25 30 Soleno:Qsis
Soleno:Qsis on the ground 20 Ave. 25
no. 20 15
ants/ 15 10 card 10
5 5
0 0 10 15 20 25 30 4 9 14 19 24 3 5 7 9 111315171921
May June June
25
Ave. 20 Tetramorium on ground • no till
no. 15 ants/ 10
0 till card
5
0 10 15 20 25 30 4 9 14 19 24
May June
35 25 30 Monomorium on ground
20 Monomorium Ave. 25 on leaves no. 20 15 ants/ 15 10 card 10
5 5
0 0 10 15 20 25 30 4 9 14 19 24 3 5 7 9 111315171921
May June June
Figure 1. Number of ants attracted to oil-bait cards over the growing season in triall.
20

3.5 0.2 3 Solenogsis
Ave. 2.5 Solenopsis on ground
0.15 2
no. 1 5 0.1 ants/ · card 1 0.05
0.5 0 0 12 22 11 21 11 16 21 26
August September September
7
6 Ave. 5 Tetramorium on ground no. 4 • no till ants/ 3 card 0 till
2 1 0 12 22 11 21
August September
7 10 6 Monomorium Monomorium
Ave. 8 5 on ground on leaves no. 4 6
ants/ 3 card 4 2
2
0 0 12 22 11 21 11 16 21 26
August September September
Figure 2. Number of ants attracted to oil-bait cards over the growing season in trial2.
21

The number of corn borers was significantly reduced in the detasselled plots as compared to the plots which were not de tasselled ( Table 1 ). The insecticides had no effect on com borer numbers. This may be because of the rainy weather which prevented scheduled sprays. Frequently, it also rained very soon after the fields were sprayed. In the first trial, neither the insecticide not the detasselling had any significant effect on yield. In the second trail, detasselling significantly increased yield. In both trials, the percent damaged ears was very high, despite the low numbers of com borers found at the tasselling stage compared to previous trials.
New Insect Identifications
Beginning with 1985 all insect identified as being new on Guam or Micronesia are included in the annual report to provide an informal record. All insects identified in 1986 are listed in Table 2.
Biological Control Organisms Shipped Off-Island
In 1986, a parasite Encarsia haitiensis and a ladybeetle Nephaspis amnicola were shipped to Belau for control of the, spiraling whitefly Aleurodicus dispersus. Casual observation in Belau late in 1986 showed that the beetle had apparently not established, but the parasite had controlled the problem in Koror as very few whiteflies could be found and those pupae seen had parasite exit holes. The whitefly was still a problem on some of the other islands of the group such as Malakal.
Table 1. Effectiveness of tillage method, detasselling and insecticide use on corn borer numbers.
Number of com borers per plant Number of undamaged ears harvested (Percent damage in parenthesis)
Treatment Till Notill
Trial 1 Dipel 7.7 6.1 Dipel + detasselled 4. 7 3. 7 Control 11.6 7.6 Control+ detasselled 3.6 5.2
Trial 2 Dipel 5.3 3.0 Dipel + detasselled 2. 7 2.0 Lannate 3. 7 4.3 Lannate + detasselled 2.5 2.4 Control· 3.9 4.4 Control + detasselled 2.6 2. 7
Analysis of Variance
Trial 1 Tillage treatment F Plant treatment F Interaction-plant*tillage f Contrast-tassel vs. detassel F
0.01 (df=1,6;p=0.93) 2.18 (df=3,l8;P=0.13) 1.53 (df=3,18;P=0.21) 8.65 (df=1,18;P=0.01)
Trial 2 Tillage treatment F Plant treatment F Interaction-plant*tillage f Contrast-tassel vs. detassel F
0.12 (df=1,6;p=0.89) 1.18 (df=5,26;P=0.35) 0.59 (df=5,26;P=0.71) 7.70 (df=1,26;P=0.02)
22
Till Notill
39(46) 29(46) 54(37) 37(40) 42(51) 34(40) 34(41) 37(43)
5(92) 22(61) 11(82) 16(72) 13(78) 8(86) 15(75) 18(70) 13(78) 16(74) 14(76) 22(63)
1.4(df= 1 ,6;P=0.28) 1.18 (df=3,18;P=0.34) 0.87 (df=3,18;P=0.48) 0.93 (df=1,18;P=0.5)
3.13(df=1,6;P=0.12) 0.73 (df=5,26;P=0.61) 1.55 (df=5,26;P=0.21) 6.82 (df=1,26;P=0.02)

Table 2. Insects identified in 1986 as being recent _arrivals on Guam or other islands in Micronesia.
Species
Guam Bemisia tabaci (Gennadius)
Delta circinalis (F.)
Delta campaniformis gracilis (Saussure) Stenocatantops spendens (Thunberg)
Mecopoda elongata (L.) Genosula mundata zonocera (Navas) Batrachedra sp.
Eretmocerus sp. Hippotion celerio (L.) Praestochrysis lusca (F.)
Chrysis fuscipennis Brulle' Kallitaxilia crini (Matsumara)
Other areas of Micronesia Oxya japonica japonica (Thunberg) Aleurodicus dispersus Russell Thrips palmi Karny
Order
Homoptera
Hymenoptera
Hymenoptera Orthoptera
Orthopetra Orthoptera Lepidoptera
Hymenoptera Lepidoptera Hymenoptera
Hymenoptera Homoptera
Orthopera Aleyrodidae Thripidae
23
Comments
Previously recorded from Saipan, prob on Guam for many years Similar to Delta pyriforme but darker. Present here since 1970s? · Also on Tinian, Belau First collected in 1984-grasshopper pest of vegetables Present at least since 1970's Present at least since 1970's Webs betel nut flowers
Parasitizing wooly whitefly Present for many years, post-war arrival Present for many years-parasite of cocooned moth pupae
Present for many years-parasite of mud daubers Present for many years common on many plants
Tinian and Saipan Pohnpei Belau
HORTICULTURE -Fruit Crops
R. Rajendran
Fruit Crop Survey and Accession
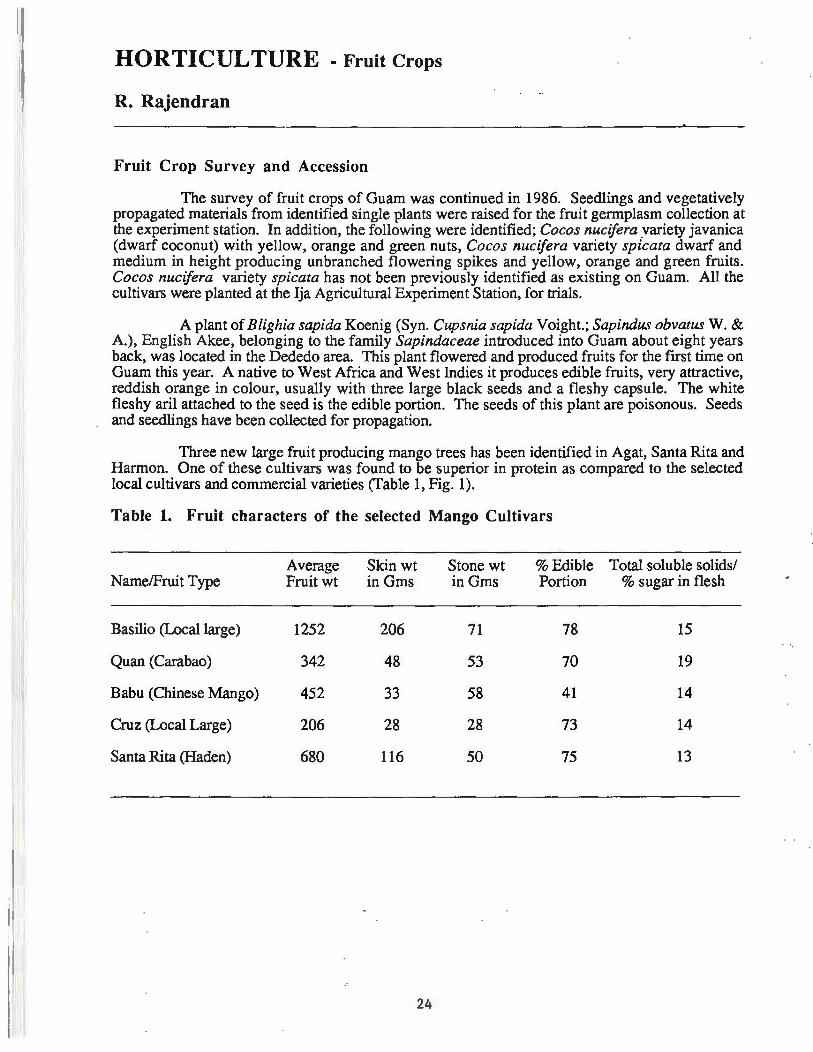
The survey of fruit crops of Guam was continued in 1986. Seedlings and vegetatively propagated materials from identified single plants were raised for the fruit germplasm collection at the experiment station. In addition, the following were identified; Cocos nucifera _variety javanica (dwarf coconut) with yellow, orange and green nuts, Cocos nucifera variety spicata dwarf and medium in height producing unbranched flowering spikes and yellow, orange and green fruits. Cocos nucifera variety spicata has not been previously identified as existing on Guam. All the cultivars were planted at the Ija Agricultural Experiment Station, for trials.
A plant of Blighia sapida Koenig (Syn. Cupsnia sapida Voight.; Sapindus obvatus W. & A.), English Akee, belonging to the family Sapindaceae introduced into Guam about eight years back, was located in the Dededo area. This plant flowered and produced fruits for the first time on Guam this year. A native to West Africa and West Indies it produces edible fruits, very attractive, reddish orange in colour, usually with three large black seeds and a fleshy capsule.. The white fleshy aril attached to the seed is the edible portion. The seeds of this plant are poisonous. Seeds and seedlings have been collected for propagation.
Three new large fruit producing mango trees has been identified in Agat, Santa Rita and Harmon. One of these cultivars was found to be superior in protein as compared to the selected local cultivars and commercial varieties (Table 1, Fig. 1).
Table 1. Fruit characters of the selected Mango Cultivars
Average Skin wt Stone wt %Edible Total soluble solids/ N arne/Fruit Type Fruit wt inGms inGms Portion % sugar in flesh
Basilio (Local large) 1252 206 71 78 15
Quan (Carabao) 342 48 53 70 19
Babu (Chinese Mango) 452 33 58 41 14
Cruz (Local Large) 206 28 28 73 14
Santa Rita (Haden) 680 116 50 75 13
24

Banana
The analysis of the third leaf from the top in the banana cultivars Williams hybrid, Lacatan and the variety Valary were done and are presented in Table 2. Marked difference in the nitrogen, phosphorus and mineral contents in the leaf indicate variation in the fertilizer requ.irements of the cultivars. Further studies will be taken up to confirm the same.
Table 2. Banana Leaf Analysis
ppm ppm ppm ppm %N %P %K %Na %Ca %Mg Zn Fe Mn . Cu
Williams 3.85 0.26 0.03 4.61 0.45 0.59 18 66.6 251.6 16.6
Lacatan 3.28 0.22 0.03 5.31 0.60 0.34 15 79.1 167.2 11.1
Valery 3.47 0.26 0.03 5.31 0.45 0.31 13 66.6 312.5 11.1
Mango
Potassium Nitrate at the rate of 10 g in a liter of distilled water was sprayed in the selected mango trees. Effect was more dramatic in the cultivar Carabao. In treatments on varieties where no results were observed the spray was repeated at 15 day intervals. Results are shown on Table 3. It was observed that the trees which received fertilizer and irrigation responded better to the spray. Studies with other nitrates are in progress.
Table 3. Induction of flowering mango using 10 g of potassium nitrate dissolved in a liter of distilled water.
Village Variety Flower
Inarajan Pi co XX
Haden
X
Pairi X
Carabao XXX
Local Seedling XX
Yigo Saipan X
Seedling Govt. Hill Haden X
Barrigada Haden Saipan XX
Seedlings Carabao XXX
Anigua Pi co Carabao XX
Haden
xxx - Profuse 80% or more xx - Over 50% of the shoots
x - 25 to 30% of the shoots
Result Leaf No effect
X
X
X
X
X
X
X
X
X
X
25
Number of sprays at 15 day intervals
1 1 2 3 1 1
1 1
1 3 1
1 2 1 2

7 6.5
6 5.5
5
~ 4.5
0
4 c "(ii
3.5 0 a:: 3 2.5
2 1.5
1 .5 0
Basilio Quan Babu Mean Protein % in the 5
Cruz Cultivers
Santa Rita H
Figure 1. Bar chart of mean of nine replicated measures of protein in the five mango cultivars from Table 1.
Fertilizer Experiment
Fertilizer experiments on mango and guava seedlings are in progress at Ija, Agricultural Experiment Station.
Papaya Trials
Papaya yield trials in the clay soils of Southern Guam are in the second year of growth. In an experiment on total soluble solids, with four cultivars of papaya, it was observed that the total soluble solids (fSS) remained at 4% level up to 110 days from the flower opening. Between 110 to 125 days there was a steep increase in the TSS; after this the steep increase continued up to 140 days in the "Solo", and 145 days in the "UOG Dwarf' papaya, whereas in the cultivars "Local" and the "Truk" the rate of increase was slower. After 140 days in the "Solo", "Local", "Truk" cultivars and after 145 days in the "UOG Dwarf," there was a steep fall in the TSS of the fruit. The rate of fall in TSS was less in the UOG Dwarf as compared to the other cultivars tested as shown in Fig. 2.
II)
:2 0 en Q)
::0 :J 0 Cf)
(ij 0 1-·o ~ 0
Variations In TSS During Fruit Development .A UOG Dwarf V Solo Yellow Flesh X Local
CTruck 14
12
1 0
8
6
4. ·-·
2L-~--~----~------~~~~~~~~~~~~~~~~ 95 100 110 115 120 125 130 135 140 145 150 155 160 165
Fruit Development Days Alter Anthesls
Figure 2. Change in sugar (TSS) content in the developing fruit of papaya
26

HORTICULTURE -Ornamental Crops
J. McConnell
The emphasis of the program has been to evaluate and select specific ornamental plants for their potential as commercial crops in Guam and to determine the cultural methods for optimum production in the tropics. Current research has concentrated on commercial cut flower production. The production aspects have been broken into tthree areas: cultivar evaluation, propagation, and crop management. Cultivars of orchid genera and anthuriums have been chosen _for advance testing. Cultivars of other species that have been collected for further evaluation are bird of paradise, heliconias, gingers and ferns (for use as cut foliage).
In 1986, an ornamental research facility was constructed on the campus of University of Guam. Databases on ornamentals and on orchid literature were developed. The experiments conducted this year included media/fertilizer studies with vandas and dendrobiums, and a propagation experiment with anthuriums. Cultivar evaluations were continued on vandas, dendrobiums and anthuriums.
Construction of an Ornamental Research Facility
Much effort this year was devoted to the development and construction of a facility to do ornamental research. The facility was developed on the campus of the University of Guam. Several sturctures were constructed to make it possible to compare the culture of ornamentals under different conditions. A fiberglass-covered structure was constructed for propagation and acclimatizing orchid seedlings removed from flask. The solid covering was necessary to control the amount of water applied to the plant material. A shade house was constructed and covered with three different densities of shade cloth. This allows plants to be grown at four different light intensities: full sun, 70%, 40%, and 10%. The structure was designed to be constructed at low cost. The support structure is of pipes and ropes. The shade cloth is attached so that in the event of a severe storm the shade cloth can be removed. The pipes are attached together to allow for further expansion.
An automatic irrigation system was installed and is controlled by a solar powered time clock. A collected of different sprinklers were installed for further evaluation. The irrigation system was based on a design recommended by the Soil Conservation Service.
A tissue culture lab was constructed for the propagation of the plant material. The lab consists of three sections: a medium preparation area, an aseptic flasking room and an aseptic culture room.
Computerized Database of Ornamentals to Grow in Guam
A database of ornamental plants was entered into a computer. The program used was developed to allow the database to be accessed by individuals with little training in computers. Plants can be searched by scientific name, common name, growing habit, final height, and by their desired growing conditions. The database supplies information on culture and propagation.
A computerized database of orchid literature is under development. The database will include references of American Orchid Society Bulletins from 1946 to current. Searches are currently possible on genera, species, authors and keywords.
27

Vandas
Yandaceous Cultivars under evaluation
Seedlings of 15 vandaceous cultivars have been collected and are being grown to. flowering for further evaluation. The cultivars are listed in Table 1. The cultivars will be evaluated for their potential as commercial cut flowers. The plants are beginning to flower and will be evaluated for the following characteristics: number of racemes per plant, number of flowers per raceme, percentage bud drop, quality of the flower (size, color, and substance), quality of the raceme (Upright, stiff raceme, distribution of the flowers), and the cut shelf life of the racemes and flowers.
Table 1. Vandaceous Hybrids and Cultivars
Aranda Wendy Scott x E. Sanderiana
Vanda
Ascda. Medasand x Ascda. Inferno Rhy. Gigantia x Rhy. Gigantia 'white' Rhyn. Gigantea 'Red Giant' Y. Josephine x Y. Jarungrak Y. Josephine x Y. Kasem's Delight Y. Josephine x Y. Pimsai Y. Keeree x (Y. Gordon x Y. Coerulea) Y. Nancy Rodillas x Y. Sanderiana Y. Pimsai-Kasem's Delight x Y. Jarungrak Y. Rasri Gold x Y. Rasri Alba Y. Rasri x Y. Kultana Gold Y. Rothschildiana Y. Ruby Prince x Y. Rev. Masao Yamada Y. Woodlawn Glory x Y. Nancy Rodilky
Media-Fertilizer Study--tissue analysis
The objective of this study was to evaluate crushed coral aggregate and coconut husk as growing media for Yanda X Miss Joaquim and to obtain basic information on the effect of fertilizer on the nutrient levels in the vegetative portions of the plants. Coconut husk is commonly used in Guam as a medium for growing Yanda Miss Joaquim.
Coconut husk has several undesirable characteristics. It decomposes quickly, is quickly invaded by weeds, and is not available in large quantities. Crushed coral is available in abundant quantities at low cost, does not need to be replaced or replenished, and weeds do not establish readily.
Generally Y. X Miss Joaquim is fertilized little in Guam. Two different forms of fertilizer were applied to see if there was any response to fertilizer application and whether the form of fertilizer made a difference. A slow release fertilizer applied at three month intervals was compared with weekly applications of a liquid fertilizer.
Material and Methods
The plants were established in a randomized complete block design consisting of two media treatments and three fertilizer treatments with three replications. The plants were grown in either coconut husk or crushed coral aggregate. The fertilizer treatments were Foliar 60 (applied weekly), Osmocote (applied monthly) and the control (no fertilizer application).
28
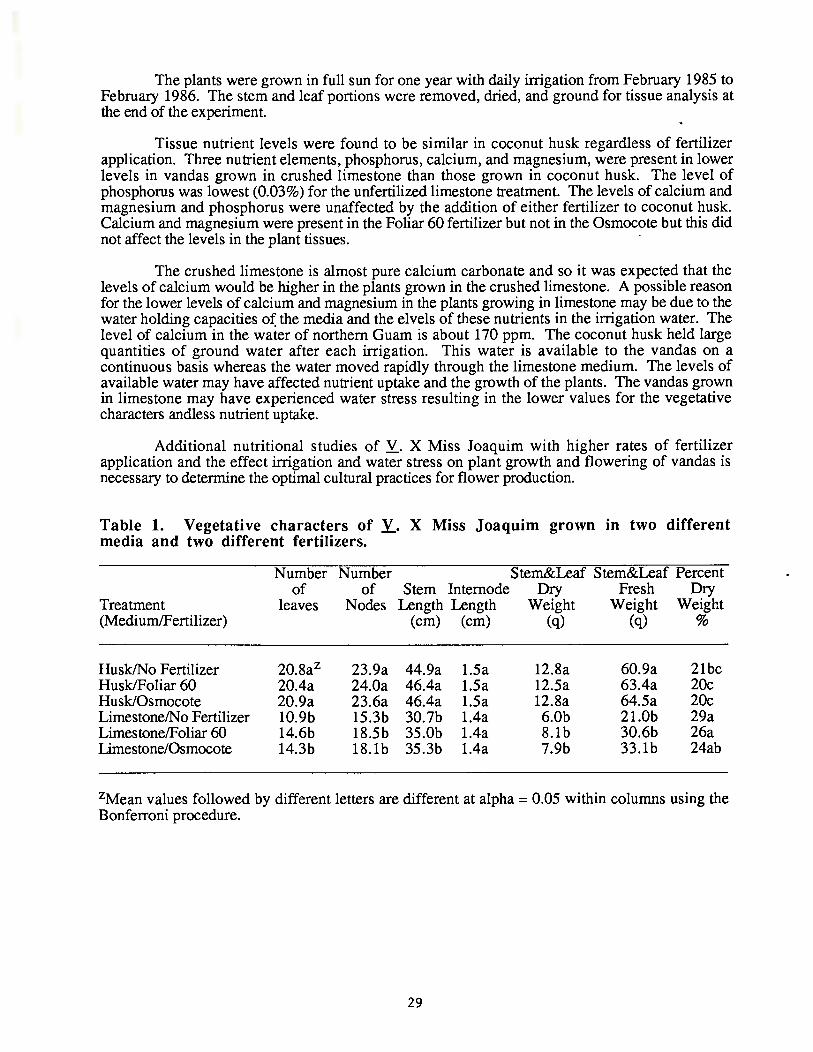
The plants were grown in full sun for one year with daily irrigation from February 1985 to February 1986. The stem and leaf portions were removed, dried, and ground for tissue analysis at the end of the experiment.
Tissue nutrient levels were found to be similar in coconut husk regardless of fertilizer application. Three nutrient elements, phosphorus, calcium, and magnesium, were present in lower levels in vandas grown in crushed limestone than those grown in coconut husk. The level of phosphorus was lowest (0.03%) for the unfertilized limestone treatment. The levels of calcium and magnesium and phosphorus were unaffected by the addition of either fertilizer to coconut husk. Calcium and magnesium were present in the Foliar 60 fertilizer but not in the Osmocote but this did not affect the levels in the plant tissues. ·
The crushed limestone is almost pure calcium carbonate and so it was expected that the levels of calcium would be higher in the plants grown in the crushed limestone. A possible reason for the lower levels of calcium and magnesium in the plants growing in limestone may be due to the water holding capacities of the media and the elvels of these nutrients in the irrigation water. The level of calcium in the water of northern Guam is about 170 ppm. The coconut husk held large quantities of ground water after each irrigation. This water is available to the vandas on a continuous basis whereas the water moved rapidly through the limestone medium. The levels of available water may have affected nutrient uptake and the growth of the plants. The vandas grown in limestone may have experienced water stress resulting in the lower values for the vegetative characters andless nutrient uptake.
Additional nutritional studies of V. X Miss Joaquim with higher rates of fertilizer application and the effect irrigation and water stress on plant growth and flowering of vandas is necessary to determine the optimal cultural practices for flower production.
Table 1. Vegetative characters of Y.. X Miss Joaquim grown in two different media and two different fertilizers.
Number Number Stem&Leaf Stem&Leaf Percent of of Stem Internode Dry Fresh Dry
Treatment leaves Nodes Length Length Weight Weight Weight (Medium/Fertilizer) (em) (em) (q) (q) %
Husk/No Fertilizer 20.8az 23.9a 44.9a 1.5a 12.8a 60.9a 21bc Husk/Foliar 60 20.4a 24.0a 46.4a 1.5a 12.5a 63.4a 20c Husk/Osmocote 20.9a 23.6a 46.4a 1.5a 12.8a 64.5a 20c Limestone/No Fertilizer 10.9b 15.3b 30.7b 1.4a 6.0b 2l.Ob 29a Limestone/Foliar 60 14.6b 18.5b 35.0b 1.4a 8.1b 30.6b 26a Limestone/Osmocote 14.3b 18.1b 35.3b 1.4a 7.9b 33.1b 24ab
zMean values followed by different letters are different at alpha = 0.05 within columns using the Bonferroni procedure.
29

Table 2. Tissue analysis of V. X Miss Joaquim in two different media and two different fertilizers.
N p K Ca Mg Zn Fe Mn Cu Treatment (%) (%) (%) (%) (%) (ppm) (ppm) (ppm)· (ppm)
Husk/No Fertilizer 0.44az 0.07ab 0.46a 3.57a 0.48az 25.6a 43.5a 22.1a 13.3a Husk/Foliar 60 0.59a 0.09a 0.40a 3.16ab 0.45a 26.0a 48.6a 22.2a 11.4a Husk/Osmocote 0.63a 0.08a 0.42a 4.40a 0.50a 27.8a 48.6a 21.9a 14.2a Limestone/No Fertilizer 0.34a 0.03c 0.41a175c 0.21b 23.4a 51.4a 20.8a 10.2a Limestone/Foliar 60 0.45a 0.05bc 0.47a 2.31bc 0.28b 33.1a 55.4a 24.3a 10.8a Limestone/Osmocote 0.41a 0.05bc 0.48a 2.16bc 0.22b 23.5a 47.2a 21.7a 13.9a
ZMean values followed by different letters are different at alpha = 0.05 within columns using the Bonferroni procedure.
Dendrobiums
Cultivar evaluation
A collection of dendrobium cultivars has been established for evaluation as commercial cut flowers or potted plants. The plants are beginning to flower and will be evaluated for the following characteristics:number of racemes per plant, number of flowers per raceme, percentage bud drop, quality of the flower (size, color, and substance), quality of the raceme (Upright, stiff raceme, distribution of the flowers), and the cut shelf life of the racemes and flowers. The cultivars that have been collected are listed in:
Table 4.Dendrobium cultivars currently under evaluation.
D. X Alice Noda D. X Antenatum D. X Autumn Lace D. X biggibum D. X Bobby Mesuia 'Hilo' D. X Booncho Gold D. canalictum D. X Dahil Sayo D. X Dream City D. X Easter Bunny 'Brian' D. X Florence Sucita x D. X Wendell Sucita D. X Janet Moi 'Aoki' D. X Kaneohe Beauty D. X Lim Theong Hin 'Waipalm' AM/HOS D. X Mae. Teramoto x D. X Mae Teramoto D. X Macro big x D. biggibum D. X Mini pearl 'Elaine Fuchigami' D. X Momi Cummins 'Blue' x D. Jester D. phal. 'Kangal' x (D. phal (Extra) x self) D. X Robsam 'Waimea' D. samoense D. X Sanda Kusuon 'Larry' D. X Satin Lace 'Alii' D. X Snow Elf
30

D. X spectable D. X Spellbound 'Superclone' D. X Sri Siam D. strebloceras (Taberium) D. X Ted Takiguchi 'gouldii' X D. Cindy Stripe D. X Tokiko Inaki D. troucolacaum x D. X Formosum D. X Tsuruyo x D. X Kamarots D. X Waterest/D. Hickam 'Deb' AM AOS x D. X Kathy Sargaret D. X Gamet Beauty 'Suzuki' x Q2. X Betty Ho x D. X Stacee Ohashi) D. XBendum D. X Kaneohe Beauty 'Kim' D. XMaryMak D. X Troy Mitami 'Gilbert' D. X Walter Omae
Banana Media Experiment
Dendrobium and vanda orchids seeds are generally germinated in aseptic conditions. The medium commonly used is Modified Vacin and Went. A modification to the medium is the addition
of green William's Hybrid banana. In Guam it is difficult to grow William's Hybrid due the the disease bunchy top. Cooking bananas appear to be more tolerant of the disease and are available in Guam. This experiment was undertaken to evaluate whether a locally available cooking banana (Samma) is usable in germinating medium for orchids.
Material and Methods
Seedlings of D. Jaquelyn Thomas 'Uniwai Supreme' were transferred to sterilized Vacin and Went media containing either green Williams' Hybrid bananas or Samma cookings bananas. 30 seedlings were placed in each flask. The treatments were replicated three times. After the seedlings were approximately 2.5 em, the 10 largest seedling from three different flasks of each treatment were removed and measured. The characters measured were shoot length, root length, number of roots, fresh weight, and dry weight.
Results and DiScussion
The results are presented in Table 5. There was no significant difference between the treatments for shoot length, root length, and number of roots. The treatments did produce significant differences in fresh and dry weight. Cooking bananas generally do not have as high a sugar content as eating bananas and it is suspected that the differences noted could be due to different sugar levels available in the media. It was concluded that the type of banana can effect the growth of orchid seedlings and the cultivar of banana is a factor to consider when germinating orchid seedlings. Seedlings that were transplanted from the flask are still being evaluated to see if the type of banana affects the seedlings after they are removed from flask.
3 1

Table 5. Mean Values of vegetative characteristics of dendrobium seedling in banana media study
Leaf Root Fresh Dry Length Length Number Weight Weight
Banana (em) (em) of Roots (g) (g)
William's Hybrid 2.88z 2.43 4.0 1.00** 0.08
Samma Cooking 2.60 1.51 3.1 0.81 0.04
zMean values were compared in columns. * indicates significance at p=0.05, ** indicates significance at p=O.Ol.
Anthuriums - Anthurium cultivar evaluation
The anthurium cut flower cultivars listed in Table 6 were collected from Hawaii to be evaluated for their potential as cut flowers in Guam. The plants are established are yield data is being recorded. The flowers will also be evaluated for their color and cut shelf life.
Table 6. Anthurium Cultivars Collected
Calypso Deweese Diamond Jubilee Kaumana Kozohara Manoa Mist Marian Seefurth
Cutting Experiment
Marian Seefurth Nitta Nitta Ozaki Paradise Pink Trinidad Asahi
A common problem in developing a new crop is to have a sufficient supply of plant material for commercial production. This experiment was done to evaluate the feasibility of buying node cuttings from Hawaii for propagation in Guam. Node cuttings are sections of the anthurium stem with all leaves removed. The node cuttings are relatively inexpensive and readily survive in a box during the shipping to Guam. This form of cutting would also lessen the chance of introducing new pests that would normally be found on the leaves or flowers.
32

Material and Methods
The stem pieces were left intact and planted in a completely randomized design. The stem pieces were planted in mixture of peatmoss, fir bark and vermiculite (2:2: 1) in open benche.s with screen to contain the medium. The benches were placed under a fiberglass house to shade and control the moisture. Eight months after planting sprouted seedling were removed from the stems and the seedlings were planted individually. The stem pieces were replanted for further propagation. The number of plants per cultivar was tabulated and the cost per seedling was calculated.
Results and Discussion
The results are presents in Table 7 and Figure 1. Stem pieces of Kaumana were the most productive with 42.5% of the nodes producing seedlings in 8 months. Ozaki and Kozohara produced the least number of seedlings. The estimated cost per Kaumana seedling was $1.18 and was $2.78 per seedling for Ozaki. Additional seedlings are being produced by the replanted stem pieces.
This method of propagation was a relatively slow method of acquiring plant material. cultivars vary in the number of seedlings produced.
Table 7. Percentage seedlings produced from node cuttings and estimated cost per seedling.
Cultivars Ozaki Kozohara Nitta Kaumana
%Seedlings produced 1 8.0% 19.0% 28.5% 42.5%
Cost per Seedling $2.78 $2.63 $1.75 $1.18
Figure 1. Comparison of seedling production by node cutting of four anthurium cultivars.
0 .45 0 .4
0 .35
0 .3 %Nodes 0.25
with 0.2
Growths 0 .15
0 .1
0.05 0
Ozaki Kozohara Nitta Kaumana Cultivars
33

HORTICULTURE -Vegetable Crops (Potato)
M. Marutani
Introduction
Four field experiments were conducted during the 1985-1986 dry season at Barrigada, Guam which had the soil classified at Pulantat series, clayey, montmorillonitic, isohyperthermic, shallow Udic Haplustalf with pH of 6. 75. In the first experiment, two cultivar trials were carried out to identify suitable potato varieties in Guam. In the second experiment field performance of locally stored seed tubers was tested. Tubers were stored for 8 months from March 1985 to November 1985 in three different storage methods; cold storage, air-conditioned room and a diffuse light structure. The third experiment, planting date experiment, was conducted by using three planting dates with an interval of four weeks (November 18, 1985, December 16, 1985 and January 13, 1986). Three varieties, Kennebec, Red Pontiac and Sequoia, were selected for this trial. The fourth experiment was conducted as a collaboration of IBSNAT program to observe phenological events of growing a cultivar 'Kennebec' under a white plastic mulch. A portable weather station was installed at the site of experiment to take climatological data. After harvesting tubers from the field, a similar storage experiment was repeated to confirm the result of previous experiment to identify the best storage methods of locally harvested tubers for a subsequent planting in a dry season. In-vitro culture of potato plantlets have been successfully maintained in a tissue culture lab by using a modified MS medium.
Weather Data
Weather data taken at the site of experiment from November 19, 1985 to April 24, 1986 is shown in Table 1. The average daily temperature was lowest during the third and fourth weeks of February. Air temperature, solar radiation, and relative humidity during the growing season averaged 26.6 C, 19.1 MJ/day, and 75.8%, respectively. Rainfall was lowest during the last two weeks of January recording 11.8 mm for this driest period and there was the longest dry period from March 16 to April24, 1986. A total rainfall of the entire growing season was 585.2 mm.
Experiment I: Evaluation of Potato (Solanum spp.) Culivars on Guam During 1985-1986 Dry Season
Two varietal trials were done. In the first trial, a total of 10 cultivars were tested while in the second trial nine were evaluated for their field performance. Three cultivars, Kennebec, Red Pontiac and Sequoia were included in both trials, however because of a mechanical failure of storage facility seed tubers of the three cultivars were not at best condition at planting in the second trial.
Materials and Methods
The first trial was conducted from November 22, 1985 to February 13, 1986. Cultivars tested were Kennebec, Red Pontiac and Sequoia from Australia and 7 cultivars, MS35.22, DT0-28, BR112-113, 720088, Cosima, LT-2 and LT-5 from the International Potato Center in the Philippines. In the second trial, in addition to Kennebec, Red Pontiac and Sequoia, 6 cultivars, Norchip, Desiree, Katahdin, C14-343, C1-884, and LT-1 from Cornell University were examined from December 23, 1985 to March 24, 1986. A randomized complete block design with 4 replications was used in both trials. Tubers were planted at a spacing of 5 tubers/m in double lines within a single row. Twenty tubers per 4 m row and 15 tubers per 3m row were planted as one replication of one variety in Trial 1 and 2, respectively. The distance between rows was 1 min both trials. Before planting a complete fertilizer of 10-30-10 was applied at the rate of 1110 kg and was incorporated in soil. Additional N fertilizer (Urea; 46-0-0) was side-dressed or injected through irrigation system at the rate of 120 kg/ha at around 30 and 50 DAP (days after planting).
34

Several pesticides were used to control insect pests and disease problems. A drip system was used to irrigate the field.
Parameters to compare plant development were emergence date, the percentage of emergence, the number of stem per plant and canopy cover. At harvest, yield, the percentage of harvest, the number of tuber per plant, the average weight of tuber, specific gravity of tuber and tuber size distribution were examined. The emergence date was determined by the date when 50% of plant emerged. As leaf miner damage became apparent to some cultivars, the degree of leaf miner damage was estimated by measuring infected leaf area at 64 DAP in Triall.
Results
Trial 1
Table 2 shows the results of ten cultivars evaluating at harvest. Kennebec had the highest yield of 29.2 t/h. Red Pontiac and Sequoia followed closely with 27.1 t/h. MS35.22 and a CIP cultivar, DT0-28 produced 23.9 t/h and 21.4 t/h, respectively. Yield of other five cultivars ranged from 18.8 t/h to 10.5 t/h, LT-5 being the lowest yielder. US cultivars such as Kenenbec, Red Pontiac, Sequoia and MS 35.22 yielded high. The three highest yielders were grwon from larger seed tubers and about 85% of population was harvested. An Argentine clone, 720088, had the lowest survival rate (35% harvested). BR112.113 and Cosima were characterized by producing many small tubers, in contrast LT-5, LT-2 and 720088 had fewer number of tubers per plant than other cultivars. The average tuber weight was heaviest with 53.9 gram of Kennebec, followed by Sequoia with 53.7 gram. Red Pontiac, DT0-28 and LT-2 produced an average tuber of about 50 gram.
Table 3 presents data on emergence, leaf miner damage, canopy cover, number of stem and number of branch of main stem. LT-5 emerged extremely late (31 DAP), while Kennebec, Red Pontiac, MS35.22 and BR112.113 emerged in less than 11 days after planting. Canopy cover were measured at 62 DAP, 69 DAP and 76 DAP. DT0-28 retained more than 50% canopy cover even at 76 DAP. Leaf miner infestation was least with DTO-s28. The number of stem and the number of branch of the main stem was measured at 66 DAP. LT-5 was characterized having the lowest number of stem of 1.1. DT0-28 developed more branches than any other cultivars (average of 16.3).
Trial 2
The harvest result of Trial 2 is presented in Table 4. Norchip (produced the highest yield of 20.2 t/h, followed by Desiree, Katahdin, C14-343, Kennebec, C1-884, Red Pontiac, LT-1. Sequoia yielded the lowest at 9.9 t/h. The average weight of a tuber ranged from 55.9 g (Norchip) to 25.9 g (Red Pontiac). Unlike Trial 1, the overall yield in Trial 2 was very low. Especially Kennebec, Red Pontiac and Sequoia which yielded high in Trial 1 produced less than half of yield obtained from Trial 1. The poor performance of those three cultivars was mainly caused by planting physiologically old seed tubers and insufficient water. Application Sequoia survived least, having only 55% harvested.
Comparisons of plant development among 9 cultivars are shown in Table 5. Kennebec and Red Pontiac emerged in less than 10 days after planting while C1-884 and Sequoia took 14 days to emerge. The low emergence rate of Sequoia (66.5%) indicated that this cultivar had bad seed tubers and many tubers rotted before any stems emerged. Other cultivars had emergency rate of over 88%. Canopy cover was highest with 45% of Kennebec at 31 DAP which was much lower than the maximum canopy this cultivar could achieve. From 38 DAP to 80 DAP Norchip showed the highest canopy cover and did not have distinct increase or decrease during the growing period. In general, canopy cover dropped after 60 DAP. Poorer plant development in Trial 2 was probably due to under irrigation and heaver infestation of mealy bugs, mites and thrips than Trial1.
35
Discussion
In spite of the high temperature which provided unfavorable condition for growing potatoes, the traditional varieties, Kennebec, Red Pontiac and Sequoia showed to have potential in Guam under proper cultural management. MS35.22, DT0-28 and Norchip produced relatively high yield. Among four CIP clones (DT0-28, LT-1, LT-2 and LT-5), DT0-28 was the best yielder while LT series did not perform well in the two trials. Norchip, Desiree, Katahdin and two neo-tuberosum types (C14-343 and C1-884) which were developed at Cornell University could have produced higher yield if irrigation and disease problems had been overcome in Trial 2. It is worth reevaluating these cultivars again.
Experiment 2: Influence of Storage Methods in Subsequent Field Performance of Three Potato Cultivars
Self-maintenance of local planting materials is important in order for farmers to have seed tubers readily available in production of potatotes on the island of Guam. In highland tropics, inexpensive diffuse light structures are used to store seed tubers between planting seasons. Seed tubers should be physiological young at planting time after a long storing period. In this experiment, locally harvested seed tubers were stored in three different methods for eight months and field performance of those tubers was tested in next dry season.
Materials and Methods
Three storage methods were used; cold storage, air-conditioned room, and diffuse light storage. The condition of three storage methods were described in AES Annual Report, 1985. All tubers remained from the storage experiment from March to November, 1985 were planted on December 13, 1985. Three cultivars, Kennebec, Sequoia and LT-2 were used and each cultivar was labeled separately by location of harvest. Treatments were replicated three times in a randomized complete design. The number of tubers planted varied from three to fifteen depending on cultivar and storage method. Data on emergenc, harvest and size distribution of tuber were expressed by percentage and yield was calculated by per plant. The number of stem was expressed by per hill. For data analysis each cultivar from two locations were pooled because there was no significant difference among locations.
Results
Table 6 shows the result of influence of storage methods on subsequent field performance. The percentage of emergence was poorest for three cultivars stored in diffuse light structure. In cold storage and air-conditioned room, LT-2 hadess emergence percentage (about 60%) than Kennebec and Sequoia (95-1 00% ). At harvest, an influence of storage methods was more apparent where Kennebec and Sequoia in cold storage had 98% and 97% of harvest percentage, respectively while the same two cultivars in air-conditioned room had 87% of hills harvested and in diffuse light structure the harvest percentage were 36% for Kennebec and 27% for Sequoia. The harvest percentages of LT-2 from three three storage were 43 for cold storage, 56% for air-conditioned room and 16% for diffuse light structure. The yield was highest with 378 g/plant for Sequoia in cold storage and second with 300 g/plant for Kennebec in cold storage. LT-2 in diffuse light structure had the lowest yield of 85 g/plant. Seed tubers stored in cold storage produced more tubers than those from air-conditioned room and diffuse light structure. The number of tuber per hill was highest with 8.2 of Kennebec in cold storage and the lowest with 2.0 of LT -2 in diffuse light structure. The size distribution of tuber showed that Sequoia had more large tubers than two other cultivars.
Discussion
Cold storage was the best method to keep seed tubers physiologically young and to have better yield than storing in air-conditioned room or diffuse light structure. A cultivar, LT-2 was poorer than both Kennebec and Sequoia in all storage methods and it was especially poorest in diffuse light structure. Storing seed tubers for eight months at an ambient temperature in diffuse
36

structure made them physiologically very old and the percentage of emergency, plant development and harvest yield were very low. Although diffuse light structure is less expensive and it could be used as a short term storing place, it is not suitable for a long term storage. In the environment of lowland tropics, cold storage is the best method to keep seed tubers at the best condition for the subsequent field planting for eight months. ·
Experiment 3: Influence of Planting Dates and Storability of Seed Tubers in Field Performance of Three Cultivars
Studies on planting potatoes in lowland tropics from the Philippines have indicated that the best season for planting potatoes is cooler months of a year from November to January. Because of the shorter day length during these months tuberization occurs early and so growing period is shortened. On Guam where it has similar climate as the lowland in the Philippines, potatoes are planted during these three months. It is, however, of interest which month is the best of all in production of potatoes. In this experiment three planting dates were chosen with the interval of four weeks and plant development was compared. Unfortunately because of lack of good facility to store seed tubers, the results of the experiment were affected not only by dates of planting (weather conditions) but also by the condition of seed tubers at planting. This experiment presents confounding effect of planting dates and storability of three cultivars before planting.
Materials and Methods
Kennebec, Red Pontiac and sequoia were planted at three planting dates of November 18, 1985, December 16, 1985 and January 13, 1986. Thirty tubers per row and three rows per plot were used. The distance between rows was 0. 9 meter and the length of row was 9 meter. At each planting date, treatments (cultivars) were replicated three times and within each replication treatments were randomly arranged. The growing seasons were a little less than three months and harvest dates of three tirals were February 10, 1986, March 11, 1986, and April 8, 1987.
Until planting, seed tubers were stored in an air-.::onditioned room and in a case of power outage they were kept in diffuse light structure which was not the best method to maintain seed tubers at the best condition.
During growing season, application of pesticides such as fungicides and insecticides were done when necessary and additional N fertilizer was side-dressed two times during growing period. Various parameters on plant development and final yield were compared and analyzed.
Results and Discussion
Table 7 showed the result of Experiment 3. Although planting dates were the original main treatment in the experiment, the result was greatly affected by tuber conditions at planting. In general, the January planting performed poorest for all cultivars while yield of November planting was highest. Sequoia showed the poorer storability and faster degeneration of tubers than Kennebec and Red Pontiac before planting. There were no harvests of Sequoia from the January planting. Kennebec had the highest emergence percentage in all three planting date trials. Kennebec had better storability of tubers prior to planting and therefore the cultivar seemed to have an advantage to withstand drier conditions in March and April which was the period when plant and tuber development took place for January planting trial.
This experiment should be repeated by using seed tubers with similar physiological condition to test influence the planting as seen in the result of Experiment 2.
Experiment 4: Observation of Canopy Cover and Tuber Development of a Cultivar "Kennebec" During Dry Season.
As a collaborator of ffiSNAT project at the University of Hawaii, the growth of a cultivar "Kennebec" was closely studied and important phenological stages were recorded.
37

Materials and Methods
One hundred sixty tubers were planted in a plot. A plot had 8 rows and 20 tubers were planted in each row. The distance between rows was 90 centimeter and the distance between plants in a row was 25 centimeter. A plot was repeated three times. Seed tubers were planted on January 31, 1986. Before planting, a complete fertilizer of 10-30-10 was applied and incorporated in soil. Additional N fertilizer (Urea, 46-0-0) was applied at 24 DAP, 40 DAP and 55 DAP through irrigation lines. Insecticides and fungicides were sprayed weekly to control pests. A white plastic mulch was placed to control weeds.
Canopy cover was measured weekly. At stages of T1 (date when tuber initiation was observed= 33 DAP) and T2 (T1+2 weeks= 47 DAP) and T3 (T1+4 weeks= 63 DAP), 8 plants were sampled to measure various parameters of plant development. On other sampling times such as 42 DAP, 54 DAP and 66 DAP four plants were studied. The total tuber weight, average weight of tuber, fresh leaf weight and stem were compared. All tubers were harvested on April24, 1986 (83 DAP).
Result and Discussjon
Emergence date was recorded on February 12, 1986 (12 DAP) when there were more than 50% of plants with some part visible at soil surface. Tuber initiation was observed at 33 days after planting seed tubers. Figure 1 shows changes in plant development of Kennebec from planting to harvest. Canopy cover reached a maximum of 79% at 47 DAP and declined afterward. The weight of fresh leaf was heaviest at 54 DAP. The length of main stem increased rapidly after emergence and the growth seemed to cease at around 60 DAP. At 63 DAP the length of main stem was 54.2 em.
The increases in total tuber weight and the average weight of tuber during plant development were also shown in Figure 1. At harvest the total tuber yield per plant was 494.5 gram and the average tuber weight was 56.8 gram.
In addition to data mentioned above, the minimal data set indicated by IBSNAT was collected and was sent to Dr. L. Manrique in Hawaii to calculate the growth rate of Kennebec on Guam. Table 8 shows estimated growth rates at T2 and T3 stages. The partitioning coefficient (tuber growth rate/total growth rate) is very low which is in agreement with other experimental evidences indicating that partioning coefficient is low with high temperature. The negative value of tuber growth rate at T3 stage may be due to tuber respiration losses and losses of tuber caused by tuber rots. Tuber rots became a serious problem around 60 DAP and it affected the data set at especially late part of the growing period.
38

Table 1. Temperature, rainfall, solar radiation and relative humidity at the experimental field during the growing period.
T~m~ratur~ (C) Rainfall SQlar RadiatiQn CMllda:L) Relative Humiditt (%) Period Min Max Average (mm) Min Max Average Min Max Average
11/19 - 11130 60.9 12/1 - 12113 107.8 12/14- 12/31 23.9 31.5 26.7 84.7 76.3 88.6 83.7 1/1 - 1/15/86 23.8 31.0 26.7 27.5 14.9 20.8 18.0 73.4 91.9 83.6 1/16-1/31 22.9 30.5 26.1 11.8 13.6 21.8 17.9 70.5 86.1 80.5 2/1- 2/15 22.9 29.8 25.8 45.0 11.8 19.8 15.7 62.1 82.8 73.8 2/16- 2/28 20.7 29.4 24.7 116.4 14.4 23.6 17.7 67.2 81.9 75.5 3/1 - 3/15 22.7 28.8 25.3 59.8 10.0 22.7 17.2 60.0 75.7 67.7 3/16- 3/31 24.3 30.4 27.0 27.3 10.3 25.2 22.6 68.0 83.1 76.2 4/1- 4/15 24.3 29.9 27.0 22.4 17.2 26.0 22.2 64.1 79.1 72.4 4/16/- 4/24 23.6 30.2 26.6 21.6 12.6 26.0 21.6 62.2 75.8 69.1
Average 23.5 30.2 26.3 13.1 23.3 19.1 67.1 82.8 75.8
Total 585.2
Table 2. Results of 10 cultivar evaluation in Trail! conducted from Nov. 22, 1985 to Feb. 13,1986 in Experiment 1.
Variety Yield Yield Harvested No. of Ave. tuber Siz~ distribJJtiQn (b:L wei~ht) Specific (g/plant) (tlh) % tuber per wt. (gram) % small % medium % large gravity
hill ( <3cm) (3cm-5cm) (>5cm)
Kennebec 5~4 29.2 84 11.1 53.9 4.5 54.8 40.8 1.058 R. Pontiac 542 27.1 85 10.9 50.1 4.3 55.0 41.0 1.053 Sequoia 542 27.1 84 10.3 53.7 2.5 42.8 54.0 1.063 MS35.22 477 23.9 65 12.0 39.8 6.5 78.8 15.0 1.056 DT0-28 428 21.4 76 8.4 50.7 4.0 46.8 49.0 1.061 LT-2 376 18.8 53 7.5 50.4 4.8 54.0 41.3 1.064 BR112.113 318 15.9 71 15.7 20.4 16.3 79.3 4.5 1.062 720088 313 15.6 35 7.4 41.0 7.3 65.5 27.5 1.065 Cosima 294 14.7 61 12.0 24.3 14.3 81.3 5.0 1.071 LT-5 210 10.5 81 5.1 40.7 4.5 73.3 22.0 1.073
Mean 408.3 20.4 69.5 10.0 42.5 6.9 63.1 30.0 1.063
CV(%) 20.2 20.2 10.7 17.3 15.6 34.5 18.2 38.2 0.7 LSD(0.05) 120 6.0 10.8 2.5 9.6 3.4 16.6 16.6 0.010
39

Table 3. Growth and development of 10 cultivars in Trial! conducted from Nov. 22, 1985 to Feb. 13, 1986 in Exp.l.
Variety Emergence Emergence Leaf miner CanQp~ cover(%) No. of No. of DateDAP* % damage(%) 62 DAP 69 DAP 76 DAP stem branch
(at64DAP) /plant main stem
Kennebec <11 99 85 49 15 7 6.8 9.0 R. Pontiac <11 100 86 35 24 10 5.0 9.0 Sequoia 11 93 73 67 29 17 2.9 7.4 MS35.22 <11 86 68 71 27 5 4.6 8.3 DT0-28 12 79 14 89 65 52 3.0 16.3 LT-2 18 69 50 24 23 19 2.0 5.4 BR112.113 <11 83 85 14 17 11 4.6 8.1 720088 15 51 75 14 8 12 2.5 5.4 Cosima 12 71 78 50 25 8 5.0 7.8 LT-5 31 76 30 34 27 22 1.1 6.3
Mean 80.7 64.3 44.7 26.0 16.4 3.8 8.3
CV(%) 9.3 15.7 41.1 42.9 48.2 27.3 32.3 LSD(0.05) 11 15 27 16 11 1.5 3.9
* DAP = days after planting
Table 4. Results of 9 cultivar evaluation at harvest in Trial 2 conducted from Dec. 23, 1985 to March 24, 1986 in Exp. 1.
Variety Yield Yield Harvested No. of Ave. wt. Siz~ distributiQn (b~ w~ii!htl Specific (g/plant) (t/h) % tuber of tuber (g) % Small % Medium %Large gravity
per hill (<3cm) (3cm-5cm) (>5cm)
Norchip 404 20.2 95 7.3 55.9 3.8 40.6 55.6 1.065 Desiree 358 17.9 88 9.9 36.3 9.5 62.0 28.5 1.051 Katahdin 334 16.7 93 6.6 51.1 5.2 46.4 48.4 1.064 C14-343 268 13.4 82 8.8 30.5 15.5 67.4 17.1 1.069 Kennebec 263 13.1 93 8.3 32.6 20.3 76.4 3.3 1.062 Cl-884 252 12.6 85 8.7 29.9 13.6 71.0 15.4 1.070 R. Pontiac 223 11.1 90 8.7 25.8 11.9 78.9 9.2 1.057 LT-1 215 10.8 82 5.0 43.0 9.0 78.1 12.9 1.070 Sequioa 198 9.9 55 5.6 35.8 12.5 68.0 19.5 1.084 Mean 279.4 14.0 84.8 7.7 37.9 11.3 65.4 23.3 1.066 CV(%) 19.1 19.1 13.1 20.4 16.3 49.4 13.6 51.2 1.0 LSD(0.05) 78 3.9 16.2 2.3 9.0 14.7 13.0 17.4 0.016
40

Table 5. Plant development of 9 cultivars in Trial 2 conducted from Dec. 23, 1985 to March 24, 1986 in Exp.l. ·
Variety Emerg. Date Emergence No. of Stem CanoQ:y Cover(%) DAP* % per hill 31 38 45 59 66 72 80
DAP* DAP DAP DAP DAP DAP DAP
Norchip 12 96.5 2.6 29 32 35 39 39 36 32 Desiree 12 91.5 2.7 30 29 30 34 32 24 32 Katahdin 11 98.3 2.6 29 22 28 33 29 17 13 C14-343 12 91.8 2.3 25 21 27 31 30 23 21 Kennebec < 10 100.0 3.8 45 29 35 38 30 3 1 C1-884 14 88.3 2.1 20 14 20 24 22 19 16 R. Pontiac <10 100.0 2.8 38 26 32 30 29 14 12 LT-1 12 90.0 2.4 25 28 31 33 30 19 10 Sequioa 14 66.5 2.1 18 14 19 20 16 6 4
Mean 91.4 2.6 28.8 23.8 28.6 31.2 28.4 17.9 15.7
CV(%) 5.7 20.8 23.0 28.3 22.8 17.2 17.1 51.7 56.0 LSD(0.05) 7.6 0.8 9.7 9.8 9.5 7.8 7.1 13.5 12.8
*DAP = days after planting
41

Table 6. Influence of storage methods on subsequent field performance in Experiment 2. .
Storage Variety Emergency Harvest Yield No. of Size di:;tribution (%) methods % % g/plant tuber per Small Medium Large
hill ( <3CIJ1) (3-5cm) (>5cm)
Cold storage Kennebec 99 98 300 8.2 8 82 10 (CS) Sequoia 100 97 378 8.0 4 57 39
LT-2 61 43 212 7.8 14 76 0
Air-conditoned Kennebec 96 87 252 5.8 7 73 20 room (AC) Sequoia 95 87 248 4.5 4 46 50
LT-2 62 56 198 5.8 15 62 23
Diffuse light Kennebec 51 36 184 4.8 18 73 9 structure Sequoia 33 27 130 4.0 6 81 13 (DLS) LT-2 19 16 85 2.0 6 92 0 ------------------------------------------------------------------------------------------------------------------------------Storage mean cs 86.7 79.3 296.7 8.0 8.7 71.7 16.3
AC 84.3 76.7 232.7 5.4 8.7 60.3 31.0 DLS 34.3 26.3 133.0 3.6 10.7 82.0 7.3
Cultivar mean Kennebec 82.0 73.7 245.3 6.3 11.0 76.0 13.0 Sequoia 76.0 70.3 252.0 5.5 4.7 61.3 34.0 LT-2 47.3 38.3 165.0 5.2 12.3 76.7 7.6
------------------------------------------------------------------------------------------------------------------------------CV(%) Storage method 30.6 29.2 35.0 39.4
Cultivar 27.1 30.7 28.0 30.3
LSD(5%) Storage method 13.7 11.6 53.1 1.5 Cultivar 11.2 11.2 38.9 1.1
42

Table 7. Influence of planting dates and storability of three cultivars on plant growth and yield in Experiment 3.
Planting Cultivar Emergence Emergence No. of stem Harvest Yield No. oftuber date Date (days % per plant % (g/plant) per plant
from planting)
Nov. 18, Kennebec 10 96 4.2 96 578 9.3 1985 Red Pontiac 12 94 5.2 88 420 7.0
Sequoia 15 92 2.1 58 465 9.4
Dec. 16, Kennebec 10 96 3.9 88 350 6.5 1985 Red Pontiac 12 95 5.7 90 358 10.0
Sequoia 12 54 1.6 58 242 5.2
Jan. 13, Kennebec 10 55 3.0 43 269 4.4 1986 Red Pontiac 11 20 2.8 7 160 2.7
Sequoia 16 7 1.2 0 0 NA ------------------------------------------------------------------------------------------------------------------------------Planting Date Mean
Nov. 18, 1985 12.3 94.0 3.8 80.7 487.7 8.6 Dec. 16, 1985 11.3 81.7 3.7 78.7 316.7 7.4 Jan. 13, 1986 12.3 27.3 2.3 16.7 143.0
Cultivar Mean Kennebec 10.0 82.3 3.7 75.7 399.0 6.7 Red Pontiac 11.7 69.7 4.6 61.7 312.7 6.6 Sequoia 14.3 51.0 1.6 38.7 235.7
------------------------------------------------------------------------------------------------------------------------------CV(%) Planting date 4.0 11.0 1.8 47.3 15.8
Cultivar 8.6 19.9 2.4 33.5 20.4 LSD (5%) Planting date 3.0 0.5 7.6 195.5 1.3
Cultivar 5.1 0.7 6.6 NS 1.3
Table 8. Estimated growth rates and partitioning coefficient for a cultivar, Kennebec, in Experiment 4.
Parameter Growth Stage
Total growth rate
Tuber growth rate
T2
16.13
9.59
Partitioning coefficient* 0.59
*Calculated by tuber growth rate divided by total growth rate.
43
T3
15.03
-1.04
•
HORTICULTURE- Vegetable Crops (Winged Bean, Tomatoes)
C.T. Lee
Horticulture research work on vegetable crops in 1986 continued to study the effect of exogenous growth regulators on growth, yield and quality of solanaceous and cucurbit crops. The vegetable crops studied under this project were tomato and eggplant. A new project to study promoting flowing and drawfing of winged bean with plant growth regulators was conducted. Another projel~ t to study the response of trickle irrigation was in cooperation with agricultural nginccring personneL ·
L Promote Flowering and Dwarfing of Winged Bean with Plant Growth Regulator
It has been shown that naturally occurring plant hormones play an important role in the process of flower bud induction and control of plant size. Synthetic plant growth regulators have been developed that will induce flowering at desired times and reduce plant size in many agricultural crops. No work has been reported on the application of plant growth regulators for the flower induction and dwarfing on winged bean.
The objectives of this project are: (a) to assess the possibility of year round production on winged bean through flower induction, and increasing of the number of flowers, and pod sets by the application of growth regulators; (b) to evaluate the use of plant growth regulators on dwarfing to reduce labor and material costs of staking in the production of winged bean; and (c) to study the effect of plant growth regulators on the quality of winged bean pods and seeds.
Materials and Methods
This experiment was conducted at the Guam Agricultural Experiment Station from May through December, 1986. The soil was clay, low in available nitrogen and phosphate and moderate in available potassium. The pH was 8.0.
Seeds of winged bean cultivar "Chimbu" were sown directly in the field. A randomized complete block design with three replications was used. Treatments consisted of seven growth regulators at the normal concentration plus the controJ, namely: 2,3,5 - triiodobenzoic acid (15 ppm), B-naphthoxy acetic acid (50 ppm), succinic acid -2-2-dimethyl hydrazine (100 ppm), 2,4-dichlorophenoxy acetic acid (100 ppm), 4-chlorophenoxy acetic acid (40 ppm), (2-chloroethyl) trimethyl ammonium choride (500 ppm) and spray-n-grow (2500 ppm). The growth regulators were applied at 3, 4, and 5-leaf stages.
Each experimental plot was three rows of 4.57 meters long. The spacing adopted was 1.22 meters between rows and 0.46 meters within rows. Side-dressing with a 10-20-20 fertilizer at 387 kg/ha was done four weeks after sowing the seed. A preventive spraying program was followed once weekly to reduce possible insect damage. Kelthane and Malathion 50 were used. A rotary tiller and garden hoe were used to control weeds. Sprinkles irrigation was utilized when watering was needed.
The plant was supported with a trellis constructed of tangantangan (leucaena) stakes and plastic nets. The data on plant height were collected on June 27, July 5, July 15, July 25, August 5, and August 12, 1986. Other collected data were pod weight, number of pods per plant, marketable pod yield and unmarketable pod yield.
Results and Discussions
Table 1 shows the effect of the seven selected growth regulators on plant height. There was a significant difference in plant height from the treatment of growth regulators especially in the early stage of vegetative growth. Treatment of 2, 4-dichlorophenoxy acetic acid and
44

4-chlorophenoxy acetic acid with an average plant height of 16.2 em (measured on June 27, 1986) was significantly shorter than the rest of seven treatments. The application of succinic acid-2-2-dimethyl hydrazine and (2-chloroethyl) trimelhyl ammonium chloride were the next shortest in plant height. Treatment of spray-n-grow did not affect plant height. Treatment of 2, 4-dichlorophenoxy acetic acid and 4-chlorophenoxy acetic acid were the only two effective growth regulators in the control of plant height measured from July 5 through August 12, 1986.
Fresh pod weight with an average of 23.8g was not significantly affected by the application of growth regulators. There was also no significant difference in the unmarketable fresh pod yield between treated and untreated plants. Treatment of B-naphthoxy acetic acid, (2-chloroethyl) trimethyl ammonium chloride, and spray-n-grow with an average of 72.28 pods per plant was the highest in the number of pods produced per plant in comparison to the rest of th_e treatments. Treatment of B-naphtoxy acetic acid, (2-chloroethyl) trimethyl ammonium chloride, and spray-n-grow also produced the highest marketable fresh pod (with an average of 29.34 MT/ha). Next highest in the marketable fresh pod yield was 2,3,5-triidobenzoic acid. There was no significant difference from the treatment of succinic acid-2-2-dimethyl hydrazine, 2, 4-dichlorophenoxy acetic acid, and 4-chlorophenoxy acetic acid in the production of marketable fresh pod. The number of pods per plant is one of the major factors affecting the yield on winged bean.
Conclusions
The experiment was to study the effect of plant growth regulators on the flowering and growth of winged bean. Seven growth regulators, namely: 2, 3, 5-triiodobenzoic acid (15 ppm), B-naphthoxy acetic acid (50 ppm), succinic acid-2-2-dimethyl hydrazine (100 ppm), 2,4-dichlorophenoxy acetic acid (100 ppm), 4-chlorophenoxy acetic acid (40 ppm), (2-chloroethyl) trimethyl ammonium chloride (50 ppm) and spray-n-grow (2,500 ppm). The experiment was started on May 21, 1986. The growth regulators were applied at 3, 4, and 5-leaf stage.
The plant height was significantly reduced by the application of 2, 4-dichlorophenoxy acetic acid and 4-chlorophenoxy acetic acid. There was a significant difference in the number of fresh pods and yield of fresh pod from the treatment of 2, 3, 5-triidobenzoic acid, B-naphthoxy acetic acid, (2-chloroethyl) trimethyl ammonium chloride and spray-n-grow. There was no difference in fresh pod weight between treated and untreated plants.
II. Effect of Exogenous Growth Regulators on Growth, Yield and Quality of Solanaceous and Cucurbit Crops
Ila. The effect of the 4-Chlorophenoxy Acetic Acid on Eggplants
This experiment was to study the effect of 4-chlorophenoxy acetic acid on the growth and production of eggplants during both dry and wet seasons.
Materials and Methods
The eggplant cultivar "Millionaire" was used in this experiment. Seeds were sown in Jiffy-7 pellets and one-month old seedlings were transplanted to the field. Treatments consisted of six concentrations (0, 10, 20, 30, 40 and 50 ppm) of 4-chlorophenoxy acetic acid. The spray solution was applied at a ten-day interval to the flowering blooms. The experiment design was randomized complete block with three replications. Each experimental plot consisted of three rows of 5.03 meters long. A spacing of 1.22 meters between rows and 0.46 meters was adopted.
Fertilizer (10-20-20) at the rate of 448 kg/ha was broadcast and incorporated into the soil before transplanting. Side-dressing with the same fertilizer at the same rate was done four weeks after transplanting. A preventive spraying schedule was followed twice weekly to control possible insect and disease damage by using Malathion 50, Ethion, Diazinon Ag 500 EC, Dithane M-45 and Tribasic Coppers. Sprinklers were used for irrigation whenever watering was needed. A rotary tiller and garden hoe were used to control weeds.
45

Results and Discussion
a) During the Dry Season .
The results of the effect of 4-chlorophenoxy acetic acid on some horticultural characteristics and production of eggplants during the wet season. There was no significant difference in fruit weight between treated and untreated plants during the wet season. All plants treated with 4-chlorophenoxy acetic acid at the concentration of 30, 40, and 50 ppm significantly increased the number of fruits per plant and marketable fruit yield. However, the only treatment increased unmarketable fruit yield was at 30 ppm.
lib. The effect of the 8-Naphthoxy Acetic Acid on Eggplant
This experiment was to study the effect of the B-naphthoxy acetic acid on the growth and production of eggplants during both dry and wet seasons.
Materials and Methods
The eggplant cultivas "Millionaire" was used again in this experiment. The planting method, pest and weed control, irrigation system and experiment design were the same as in experiment IIA except for the treatment. Treatments for this experiment consisted of five concentrations (0, 25, 50, 75, and 100 ppm) of B-naphthoxy acetic acid applied to eggplant flowers at a ten-day interval.
Results and Discussion
a) During the Dry Season
The results of the effect of B-naphthoxy acetic acid on some horticultural characteristics and production of eggplants during the dry season are shown in Table 5. The application of B-naphthoxy acetic acid did not affect fruit weight and unmarketable fruit yield. B-naphthoxy acetic acid at the concentration of 75 and 100 ppm gave a significant increase on the number of fruits per plant and marketable fruit yield.
b) During the Wet Season
Table 6 indicates the results of the effect of B-naphthoxy acetic acid on some horticultural characteristics and production of eggplants during the wet season. There was no significant difference in fruit weight and unmarketable fruit yield between the treated and untreated plant. The number of fruits per plant and marketable fruit yield were increased from the application of B-naphthoxy acetic acid at the concentration of75 and 100 ppm.
Conclusion
Several experiments were conducted to study the effect of two growth regulators ( 4-chlorophenoxy acetic acid and B-naphthoxy acetic acid) on the growth and production of eggplants during the dry and wet seasons. The cultivag "Millionaire" was used for these experiments. Treatments were six concentrations (0, 10, 20, 30, 40, and 50 ppm) of B-naphthoxy acetic acid. The spray solution was applied at a 10-day interval to the flowering blooms. It was found that the spraying on the leaf and growing point should be avoided as much as possible otherwise would damage to the plant.
During the dry and wet seasons, 4-chlorophenoxy acetic acid at the concentration of 30, 40 and 50 ppm gave a significant increase in the number of fruits per plant and marketable yield on eggplants. Application of B-naphthoxy acetic acid at the concentration of 75 and 100 ppm; increase in the number of fruits per plant and yield on eggplants. However, there was no significant difference in fruit weight between treated and untreated plants from the application of these two growth regulators.
46

Table 1. The effect of different growth regulators on plant height of winged bean (planted on May 21, 1986).
n1ant height (six months) Treatment June 27 July 5 July 15 July 25 Aug.5 Aug. 12
1986 1986 1986 1986 1986 1986
2,3,5-triiodobenzoic acid (15 ppm) 27.7c * 34.5b 47.1b 66.4b lOl.Ob 140.1b
B-naphthoxy acetic acid (50 ppm) 27.8c 28.1b 48.2b 65.9b 99.2b 143.9b
succinic acid-2-2 -dimethyl hydrazine (100 ppm) 25.5bc 36.4b 54.9b 70.7b 100.9b 146.2b
2,4-dichlorophenoxy acetic acid (100 ppm) 15.2a 21.9a 35.5a 50.1a 74.4a 110.4a
4-chlorophenoxy acetic acid ( 40 ppm) 17.1a 22.9a 32.8a 52.0a 75.3a 121.1a
(2-chloroethy 1) trimethy 1 ammonium chloride (500 ppm) 22.3b 34.2b 46.5b 64.2b 93.7b 142.0b
Spray-N-grow (2,500 ppm) 33.6d 39.6b 48.8b 64.1b 101.8b 147.7b
Control 31.7d 37.8b 54.2b 73.3b 110.0b 155.5b
* Means followed by the same letter within same measurement in a column do not differ significantly at the five percent probability level using Ducan's Multiple Test.
47

Table 2. The effect of different growth regulators on some horticultural characteristics and production of winged bean (planted on May 21, 1986).
Fresh pod Number of Unmarketable Marketable weight pods/plant fresh pod fresh pod
Treatment (g) yield (MT/ha) yield (MT/ha)
2,3,5-triiodobenzoic acid (15 ppm) 23.4a 66.91bc 1.52a 27.2 o be
B-naphthoxy acetic acid (50 ppm) 24.7a 70.61c 1.43a 28.62c
Succinic acid-2-2 -dimethyl hydrazine (100 ppm) 24.2a 62.10ab 1.47a 25.17ab
4-dichlorophenoxy acetic acid ( 100 ppm) 23.0a 57.6o a 1.41a 23.51a
(2-chloroethyl) trimethyl ammonium chloride (500 ppm) 24.0a 72.3ba 1.48a 29.30c
Spray-N-grow (2,500 ppm) 24.1a 73.88c 1.60a 29.91c
Control 23.5a 59.07a l.Sla 24.05a
* Means followed by the same letter within same measurement in a column do not differ significantly at the five percent probability lelvel using Ducan's Multiple Test.
Table 3. The effect of 4-chlorophenoxy acetic acid on some horticultural characteristics and production of eggplant during the dry season.
Fruit weight
Treatment (g)
Oppm 96.la*
lOppm 94.5a
20ppm 97.0a
30ppm 96.8a
40ppm 99.1a
50 ppm 98.2a
Number of fruits/plant
12.1a*
12.9a
14.9b
15.7b
14.8b
14.6b
Unmarketable fruit yield (MT/ha)
1.2a
1.3a
l.la
1.2a
l.la
1.2a
Marketable fruit yield (MT/ha)
18.5a
19.9a
22.9bc
24.2c
22.8b
22.4b
*Means followed by the same letter within same measurement in a column do not differ significantly at the 5% probability level using Ducan's Multiple Range Test.
48

Table 4. The effect of 4-chlorophenoxy acetic acid on some horticultural characteristics and production of eggplant during the wet season.
Fruit Number of Unmarketable Marketable weight fruits/plant fruit yield fruit yield
Treatment (g) (MT/ha) (MT/ha)
Oppm 91.5a* 6.7a 0.7a 10.7a
lOppm 90.2a 7.3ab 0.8ab 11.5a
20ppm 89.5a 7.0a 0.8ab ll.la
30ppm 92.2a 8.3bc 0.9b 13.2b
40ppm 90.5a 8.1b 0.7a 12.9b
50 ppm 9l.la 8.0b 0.8ab 13.0b
*Means followed by the same letter within same measurement in a column do not differ significantly at the 5% probability level using Ducan's Multiple Range Test.
Table 5. The effect of B-naphthoxy acetic acid on some horticultural characteristics and production of eggplants during the dry season.
Fruit Number of Unmarketable Marketable weight fruits/plant fruit yield fruit yield
Treatment (g) (MT/ha) (MT/ha)
Oppm 94.7a* 11.8a l.la 18.2a
25ppm 95.2a 12.3a 1.2a 19.0a
50 ppm 96.1a 12.4a 1.2a 19.2a
75ppm 94.3a 14.8b l.la 22.9b
lOOppm 97.8a 14.5b l.la 22.1b
*Means followed by the same letter within same measurement in a column do not differ significantly at the 5% probability level using Ducan's Multiple Range Test.
49

Table 6. The effect of 8-naphthoxy acetic acid on some horticultural characteristics and production of eggplants during the wet season.
Fruit Number of Unmarketable Marketable weight fruits/plant fruit yield fruit yield
Treatment (g) (MT/ha) (MT/ha)
Oppm 90.la* 6.5a 1.4a 10.3a
25ppm 89.3a 6.9a 1.5a ll.Oa
50 ppm 88.4a 6.8a 1.6a 10.8a
75ppm 91.2a 8.0b 1.4a 12.8b
100 ppm 92.5a 7.7b 1.5a 12.3b
*Means followed by the same letter within same measurement in a column do not differ significantly at the 5% probability level using Ducan's Multiple Range Test.
50
PESTICIDES
C. Bjork
Impact of Insecticides on Yields of Head Cabbage
Research was conducted on head cababage, KK cross, August to December1985-1986 at the Agricultural Experiment Station in Inarajan, Guam. It was designed to test the effectiveness of two common insecticides and their combination in increasing yield by controlling the caterpillar pests of head cabbage.
I. Insecticide Trials 1985
Materials and Methods
A field trial using KK cross variety of head cabbage was conducted at Inarajan, Guam. The plants were grown in flats and transplanted as seedling into the experimental rows. Each plot consisted of three rows with individual plants planted one foot apart in the rows and one and a half feet apart between rows. Each row consisted of twelve plants or thirty-six plants/plot. The plots or pesticide treatments were replicated four times. The treatments were Control, Pounce at four ounces/acre, Dipel+ at one pound/acre and Pounce and Dipel+ combined at four ounces/acre Pounce and one pound/acre of Dipel+. The plots were sprayed twice a week. The insecticides were applied with a Solo Backpack sprayer-425 twice a week. Triton B-1956 was used as a sticker at the rate of one tablespoon/three gallons. The high amount of sticker was applied because of the high rainfall during the time of the experiment. Dithane M-22 and Tribasic Copper Sulfate was added to all treatments at the rate of one pound/acre of Dithane M-22 and three pounds of Tribasic Copper Sulfate. The insects of the first ten heads of the center rows of the three row group were counted in all plots. All heads were harvested, weighed, measured vertically and horizontally, assessed and rated as to insect damage and damage due to disease. There was a staggered yield with the heads being harvested when they were firm and mature. The fertilizer rate of eight pounds of 10:20:20/100 rows was applied preplant and tilled in. Each treatment was sidedressed twice during the season with 46:0:0 applied through the drip line at the rate of two pounds/100 feet of row.
Results and Discussion
In Table1 is shown the total weight harvested per plot. There were 78 pounds harvested in the Control plot, 107 pounds in the Dipel, 162 pounds in the Pounce plot and 148 pounds in the Pounce and Dipel plot. The Pounce plot yields twice as much weight as the Control plot, but if you look at the total marketable weight in Tablel you will see that ratios change with twice as much marketable weight as was produced in the Dipel plot than in the control plot, seven times more in the Pounce plot than in the control plots and almost seven times as much in the Pounce and Dipel plots than in the control plot. The use of Dipel did increase the marketable yield by two times as much, but was not nearly as effective as Pounce.
II. Insecticide Trials 1986
Materials and Methods
A field trial using KK cross variety of head cabbage was conducted at Inarajan, Guam, The plants were grown and transplanted from flats of seedling into the experimental rows. Each plot consisted of three rows with individual plants planted one foot apart in the rows and one and a half feet apart between rows. Each row consisted of twelve plants or thirty-six plants/plot. The plots or pesticide treatments were replicated four times. The treatments were Control, Pounce and
51

Dipel+ (combined at four ounces/acre Pounce and one pound/acre ofDipel+). Lannate + Dipel Plus combined at the rate of four pints Lannate one/acre + one pound/acre Dipel Plus. Dibrom + Dipel Plus combined at the rate of two pints Dibrom/acre + one pound of Dipel Plus/acre. The plots were sprayed twice a week. The insecticides were applied with a Solo Backpack sprayer-425 twice a week Triton B-1956 was used as a sticker at the rate of one tablespoon/three gallons . . Dithane M-22 and Tribasic Copper Sulfate was added to all treatments at the rate of one pound/acre for Dithane M-22 and three pounds/acre for Tribasic Copper Sulfate. There was a staggered yield with the heads being harvested when the heads were firm and mature. The fertilizer rate of fifteen pounds of 16:16:16 /row was applied preplant and tilled in. This was almost twice the recommended dosage due to a miss calibration of a new backpack fertilizer spreader. This caused a burning of at least two of the outer leaves for the first two weeks. Each treatment was sidedressed twice during the season with 46:0:0 applied through the drip line at the rate of two pounds/100 feet of row and sprayed Foliar-60 once a week for the first six weeks at the rate of one tablespoon/gal.
Results
During 1986 the head cabbage had at least 30% less insects and a higher yield in both the Control and the Pounce plots than in 1985. In the northern part of Guam the major caterpillar pest of cabbage is the diamond- back moth, Plutella xylostella. This insect is rarely present in the experimental or farms in the southern part of Guam. The pests of cabbage in the northern part of Guam are mainly leaf eatters while the pests in the southern part of the island are more borers. The Control plots had a higher yield than in 1985 because with fewer insects, posssibly due to the fact that less com was being grown at the experiment station and in the southern part of the island which had similar pests and using more fertilizer more of the heads made it to maturity whereas in 1985 several plots did not have one marketable head. The Pounce + Dipel Plus plots in 1987 averaged over 2700 more pounds of cabbage than during the 1985 experiment, thought to be largely due to the high fertilizer rate applied and the increased size of the head. Statistically there was not a significant difference between the Control plot and any of the spray plots. In practicality the Pounce + Dipel Plus plot would have produced over 18,000 more pounds of marketable head cabbage/acre than the Control plot
Table 1
Treatment
Control Dipel Pounce Pounce
&Dipel
Total Weight Harvested/ Treatment
79 lbs. 107 lbs. 162 lbs. 148 lbs.
Total Marketable Weight/Treatment
52
22lbs. 40 lbs. 142 lbs. 136 lbs.
Marketable Weight/ Acre*
6,749 lbs. 12,194 lbs. 42,948 lbs. 41,253 lbs.

Table 2
Treatment
Control Dipel Pounce Pounce
&Dipel
Table 3
Treatment
Control Dipel Pounce Pounce
&Dipel
Total Heads Harvested/ Treatment
136 129 137 140
Mean Total Marketable
Weight/Treatment
5.56a** 11.41a 33.09b 33.16b
Total Marketable Heads/Treatment
20 31 116 114
Marketable Heads/ Acre*
13.2% 21.5% 80.5% 79.2%
Mean Total Marketable
Heads/Treatment
4.75c 7.75bc
30.0a 27.75ab
*The treatment plots were 144 square feet or 1/302.5 part of an acre. To change total weight/treatment into weight/acre the total was multiplied by 302.5.
** Numbers followed by the same letter are not significantly different at the 5% level (LSD).
Table 4
Total Weight Harvested/ Total Marketable Marketable
Treatment Treatment Weight/Treatment' Weight/Acre*
Control 124 lbs. 93 lbs. 28,072 Lannate + 141lbs. 126lbs. 38,143 Dipel+ Pounce+ 157lbs. 151lbs. 45,678 Dipel+ Dibrom+ 140 lbs. 134lbs. 40,535 Dipel+
53

Table 5
Treatment
Control Lannate + Dipel + Pounce+ Dipel+ Dibrom+ Dipel+
Table 6
Treatment
Control Lannate + Dipel + Dibrom + Dipel+ Pounce + Dipel +
Total Heads Harvested/ Treatment
Total Marketable Headsffreatment
111 141
134
139
Mean Total Marketable
Weight Treatment
23a** 31.75a 33.5a 37.75
78 125
125
131
Percent Marketable
Heads/Treatment
54.2% 86.8%
86.8%
91.0%
Mean Total Marketable
Heads/Treatment
19.25a 31.25a 32.75a 31.25a
**Numbers followed by the same letter are not significantly different at the 5% level (LSD).
54

SOIL SCIENCE
J.L. ])euneterio
NPK Response Studies in Ponape
The response of field com (San Miguel variety) to varied NPK levels was conducted in the Ponape Agricultural Experiment Station in collaboration with Dr. R.S. Dayrit. The field was located one hundred yards off the soil pit which was dug by the Soil Conservation Service in their Soil Survey of Ponape. The soils were the Umpump series with the taxonomic class - clayey, oxidic, isohyperthermica, shallow, Typic Arorthox. This particular field was a gravelly silty clay loam (35.6% clay, 25.32% silt, and 39.08% sand).
The soil test levels were as follows:
pH 5.90 6.8 ppm P 29.5 ppmK 1150.0 ppm Ca 85.0ppmMg 117.6 ppmNa 7.3% Organic Matter
Based on soil test test levels, a response toP and K application is expected. With a 7.5% organic level, addition of nitrogen which is based on crop known needs for N and organic matter content, the addition of 100 kgm N should be sufficient.
Individualized plot size was 4x4 meters replicated four times. The middle two rows were used to determine yields. Fertilizer was banded within the furrow, which was covered with 2-3" of soil and the seeds placed directly on top of the fertilizer band and covered with 1-2" of soil. Normal pesticide spraying was done and the com was allowed to mature before harvesting. Field layout was a Randomized Complete Block Design.
Two croppings were made (January-March, 1986 and December 1986- February 1987) while maintaining the sample plots for the same treatments. A rototiller and manual hoeing was done to preserve plot integrity.
Treatnlents and yield results are shown on Table 1. Treatment 1, 2, 3 and 4 tests the response to N fertilization; 5, 6, 7 and 3 for P; and 8, 9, 10, and 3 for K. The first field experiment was significant at the 1% probability level with a coefficient of variation of 18.68%. The second experiment was significant at the 5% level with a coefficient of variation of 25.35%. Although similar agronomic practices were followed in both experiments, the seeds for Experiment 2 were obtained from another source and the purity was questionable. In Experiment 1 yield ranged from 2308 kgm to 6899 kgms, and in Experiment 2 the range was from 2500 to 6034 kgrnlha. In both experiments the lowest yield was observed when no nitrogen was added.
The response to added nitrogen is shown in Table 2. The response trend in both experiments are similar with highest response obtained in the 100-300-100 treatment. The increased in yield in the first experiment ranged from 160.4 to 167.7%. Top yield increase in the second experiment was 141.4% over the control. It should be noted here that N application was done only once during planting.
The response to added phosphorus is shown in Table 3. Although yield was higher in the first experiment (average of 6286 to 4579 kgrnlha in the second experiment) the trend was the same. There was DQ significant increase due to phosphorus addition. The initial Olsen P level of 6.8 ppm is apparently adequate.
55

The response to potassiulll is shown in Table 4. In the first experiment yield increase ranged from 15.4 to 30.5%. The top yield of 6899 kgm at the 100-300-150 treatment is a yield increase of 1611 kgm which is just over the LSD.05 value of 1539. A more pronounced increase is observed at the 100-300-100 treatment of 66.2% (6034 as compared to 3630 kgm at the 100-300-0 treatment) in the second experiment. Although increase in yield due to K addition is observed in both experiment, there is no trend observed.
In summary, Umpump soils responded well to nitrogen addition while exibiting a moderate response to K. Umpump soils did not respond to phosphorus appiication.
Table 1. Corn grain yield (air-dried) at harvest in kilograms per hectare.
Treatment
0-300-100 50-300-100
100-300-100
150-300-100 100- 0-100 100- 75-100 100-150-100 100-300- 0 100-300- 50 100-300-150
c.v. LSP.01 LSD.05
Experiment 1 Yield**
2308 6010 6178
5024 6226 6226 6515 5288 6106 6899
18.68% 2079 1539
*Significant at the 1% probability level **Significant at the 5% probability level
Table 2. Response to Nitrogen
Experiment 1
Treatment
0-300-100 50-300-100
100-300-100 150-300-100
Yield kgmlha
2308 6010 6178 5024
%of yield Response
160.4 167.7 117.7
56
Experiment 2 Yield*
2500 4543 6034
4423 4591 4495 4808 3630 4351 4639
25.35% 2186 1619
Experiment 2
Yield kgm/ha
2500 4543 6034 4423
%of Yield Response
81.7 141.4 76.9

Table 3. Response to Phosphorus
Experiment 1
Treatment
100- 0-100 100- 75-100 100-150-100 100-300-100
Yield kgmlha
6226 6226 6515 6178
Table 4. Response to Potassium
%of yield Response
0 4.6
-7.7
Experiment 1
Treatment
100- 30-100 100-300- 50 100-300-100 100-300-150
Yield kgmlha
5288 6106 6178 6899
% ofyield Response
15.4 16.8 30.5
57
Experiment 2
Yield kgrnlha
4591 4495 4808 4423
%of Yield Response
-2.1 4.9
-3.7
Experiment 2
Yield kgrnlha
3630 4351 6034 4639
%of Yield Response
19.9 66.2 27.8

Population Density Effect on Kernel Yield of Guam White Field Corn
This study was conducted in collaboration with ffiSNA T's Patrick Ching who helped in designing and laying out of the experiment. A randomized complete block design tested 4 population densities. Nitrogen was blanket applied at 200 kgm N using urea. Individual plots were 4 x 15 meters. Normal pesticide spraying was done with water supplied by a drip irrigation system. The study was conducted at the Inarajan AES on Saipan soils.
Results of the experiment significant at the 5% probability level are shown in Table 1 and 2. Highest total kernel and biomass yield are observed in the 80,000 population density level. Kernel yield ranged from 1.478 to 2.525 tons/ha. Total biomass yield ranged from 4.346- 8.094 metric tonslha. If the target is silage com, the 80,000 density level offers the maximum yield.
Table 1. Corn kernel yield (at 15.5% moisture) response of Guam white field corn in metric tons/ha as ofposted by population densities.
Population Densities plantslha
80,000 40,000 20,000 10,000
c.v. = 13.70%
I
2.749 2.335 2.231 1.240
Replications II III Mean
2.288 .935
1.932 1.137
2.537 2.525 2.607 2.292 1.889 2.017 2.057 1.478 LSD.01 .862
Table 2. Total biomass yield (leaves, stalks, roots, husks, cobs, and kernels oven dried at 70°C) of Guam white field corn planted at different population densities, in metric tons/ha.
Population Densities plantslha
80,000 40,000 20,000 10,000
C.V. = 17.45%
Replications I II III Mean
8.507 8.487 6.438 4.634 5.439 4.491 4.531 3.328
58
7.287 8.094 7.388 6.153 3.708 4.546 5.178 4.436 LSD.01 3.058

Guam White Corn Yield Response to Varied Nitrogen Rates and Timing of Application
The response of Guam white com yield to varying nitrogen rates and timing of application was carried out on Saipan soils, fine, oxidic, isohyperthermic Oxic Paleustalf at the Inarajan Agricultural Experiment Station. The experimental design was a split-plot with nitrogen rates as the main plot, with the sub-plot as timing of N application. Nitrogen was applied all at planting and one half at planting, the other half at onset of tasseling. Drip irrigation and normal pests control was practiced to maturity. Individual plot size was 5x4 meters with the middle 3 rows as the harvest rows.
Main plot results are shown in Table 1. The letters following the mean yield are Duncans multiple range t-test values. The 200 kgmN/ha treatment yielded the highest. Application of 400 kgm N actually reduced yield as compared to the 200 kgn N level. The response was a typical growth curve where addition of nitrogen increased yield up to a certain amount where yield starts to decrease.
Subplots results significant at the 5% probability level are shown in Table 2. A single aplication of Na yielded 3.544 in comparison to a lower yield response of 3.057 tons per hectare where nitrogen application was split. The results confirmed an earlier study (Annual Report 1985) where splitting N did not increase yield as compared to a single application.
Table 1. Corn kernel yield response in tons per two hectares of Guam white field corn to varying nitrogen rates.
Nitrogen Rates
0 50
100 200 400
c.v. = 24.47 ** Significant at the 1% probability level
I
2.602 3.680 4.795 9.489 7.487
Replications II III
3.808 6.480 5.524
10.213 9.863
2.948 6.779 6.994 7.831 7.202
IV
5.834 4.947 7.258
10.147 8.085
Mean
3.798C 5.472bc 6.143abc 9.420a 8.159ab
Table 2. Guam white field corn response in tons/ha kernels to timing of N application.
Nitrogen Rates All at Planting Split Applied
0 2.195 1.603 50 3.228 2.243
100 3.582 2.561 200 4.804 4.617 400 3.913 4.261
Mean 3.544 3.057
59

The Guam Agricultural Experiment Station is an equal opportunity employer. All information gained through its research program is available to anyone
without regard to race, color, religion, sex, age or national origin.
Trade names of products are used to simplify the information. No endorsement of named products is intended.