single-station sigma
TRANSCRIPT
446
Bulletin of the Seismological Society of America, Vol. 96, No. 2, pp. 446–455, April 2006, doi: 10.1785/0120050137
Single-Station Sigma
by Gail M. Atkinson
Abstract Is the random variability of ground motions for a single station less thanthat obtained by regression analyses of ground-motion data recorded over a broadnetwork of sites? This question has important implications for seismic design ofcritical facilities because of the influence of this variability (commonly referred toas “sigma”) on probabilistic seismic-hazard computations at low probabilities. I ad-dress this question using ShakeMap data recorded at a group of 21 stations, all inthe Los Angeles region, for which the shear-wave velocity in the upper 30 m (V30)is known. Ground-motion prediction equations are derived from a database of site-corrected amplitudes compiled for the group of stations as a whole. The standarddeviation of residuals (sigma) for the regression of the entire database is then com-pared with the standard deviation of residuals at individual stations. Regressions ofsingle-station databases are also performed.
The sigma for an individual station is less than the overall sigma. The results ofthis study suggest that when computing hazard at a specific site for which the siteamplification has been estimated based on either an empirical correction or on V30,the site sigma can be taken as 90% of the corresponding sigma for the applicableground-motion prediction equation, if the problem under consideration is one ofmultiple earthquake sources. If hazard from a single source at a fixed azimuth isconsidered (such as a single fault), the site sigma is 60% of the corresponding sigmafor regional ground-motion relations. Further study with additional datasets is war-ranted to determine whether these results apply to hazard computations in a generalsense, beyond the limited range of conditions studied here.
Introduction
The random variability of ground motions, commonlydescribed by “sigma,” the standard deviation of residualsabout a median ground-motion prediction equation, is animportant parameter in seismic-hazard analysis. The proba-bility of exceeding any specified ground-motion value in-creases with increasing sigma, especially at low probabilitylevels. The strong dependence of earthquake hazard esti-mates on sigma arises from the combination of the log-normal distribution of ground-motion amplitudes with theGutenberg-Richter earthquake frequency distribution. Theconsequence of this combination is that the number of smallearthquakes that might produce higher-than-median groundmotions, due to random variability, outweigh the lesser num-ber of large earthquakes that might contribute lower-than-median ground motions (e.g., EERI, 1989). The larger thevariability about the ground-motion prediction equation is,the larger the expected ground motion at any given proba-bility level is, with the effect being most pronounced at lowprobabilities. Thus the “sigma” of ground-motion relations,and any physical limits that may affect sigma, has becomea topic of particular importance in the evaluation of desig-ning ground motions for critical facilities such as nuclear
power plants, dams, and long-term hazardous waste depos-itory sites (Bommer et al., 2004). Typical sigma values forregional empirical ground-motion relations, derived fromCalifornia strong-motion datasets, are in the range of rreg �0.22 to 0.35 log units (e.g., Abrahamson and Silva, 1997;Boore et al., 1997), representing about a factor of two vari-ability in amplitude for one standard deviation.
It has been suggested that probabilistic seismic-hazardanalysis overestimates expected ground motions at moderateto low probabilities, based on observations of precariously-balanced rocks in southern California that appear to be in-
compatible with the large ground motions that are forecastfor long observation periods, for the sites where the unstablerocks are found (Brune, 1996). Anderson and Brune (1999a,b) and Anderson et al. (2000) have suggested that one reasonwhy probabilistic hazard estimates may be overstated is be-cause of a mixing of random variability (aleatory uncer-tainty) with model uncertainty (epistemic uncertainty). In thedevelopment of ground-motion prediction equations, thereis inevitably some mixing of epistemic uncertainty into themodel of aleatory variability, leading to a larger sigma thanmay be physically justified (Anderson et al., 2000). A sig-
Single-Station Sigma 447
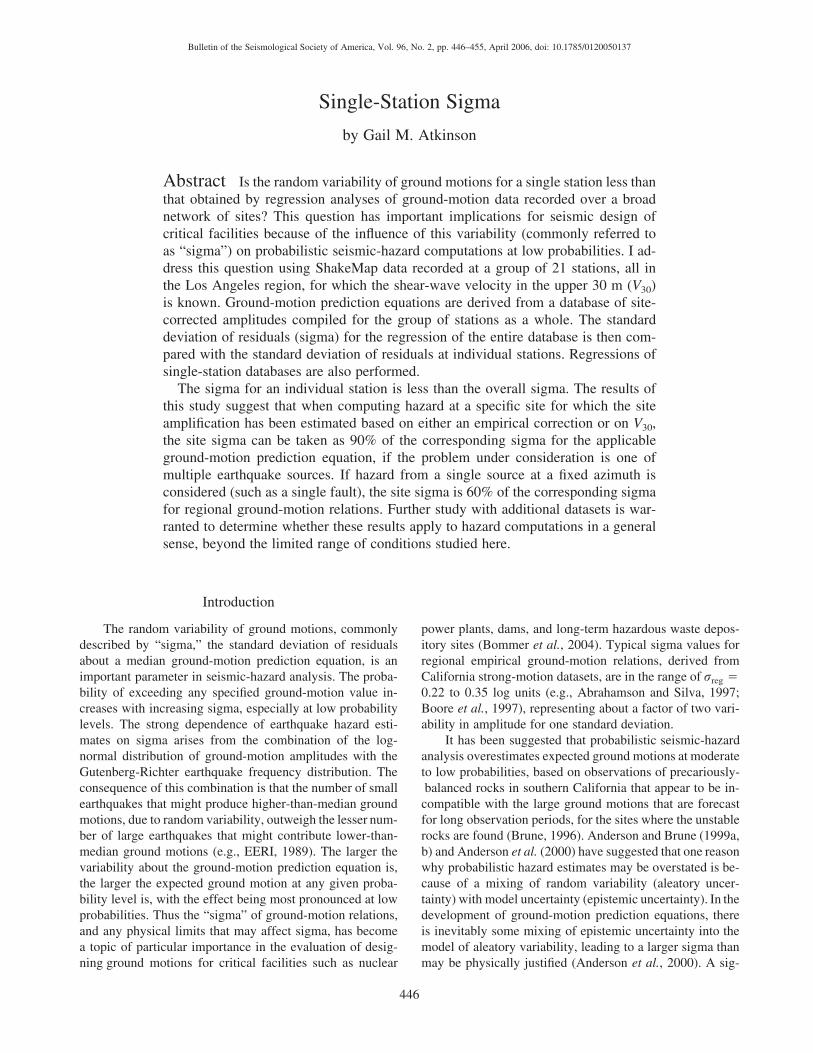
Figure 1. Study events (ShakeMap archived events to May 2005) and stations. Thelocation of the Osito Adit station (OSI), discussed in the text, is indicated. Location ofLanders fault also indicated.
nificant example is the use of ground-motion records frommany sites, often from diverse regions, in the developmentof a single set of ground-motion prediction equations thatare then applied to all sites in the computation of hazard.There is some correction for gross site effects, in that theequations typically use V30 (average shear-wave velocityover the top 30 m) or some similar measure to include thesite condition as a predictive variable (e.g., Boore et al.,1997). However, this is a crude tool for a phenomenon ascomplex as site response; it may be that the resulting ground-motion prediction equations overstate the actual variabilityof motions at a particular site (in addition to having a po-tential bias for a particular site). Thus, for any given site, therandom variability (aleatory uncertainty) may be less thanindicated by typical empirical sigma values, as some of itshould be recast as epistemic uncertainty, arising from smallbiases that differ from site to site.
In this note, I examine whether random variability ofground motions for a single station (ri) is less than that fora region (rreg). The analysis is based on ShakeMap data re-corded by TriNet (Wald et al., 1999) at a group of 21 sta-tions, all in the Los Angeles region, for which the shear-wave velocity in the upper 30 m is known (Tinsley et al.,2004). The dataset is selected based on the availability ofhundreds of recorded events on multiple stations with knownsite conditions, all within a geographically limited area. Fig-ure 1 shows the location of study events and the stationswith V30-listed by Tinsley et al. (2004). Note that the sitesare affected by a variety of earthquake sources throughoutthe region, as is the case for a typical seismic-hazard prob-lem. This makes a good base from which to examine whethersingle-station variability due to regional earthquake sources
(ri) differs from the variability of site-corrected motionsfrom the area as a whole (rreg, combining all stations). Fur-thermore, the abundance of data from the Landers fault al-lows an examination of sigma for the case of a single siteinfluenced by a single source (rie).
Data Analysis and Results
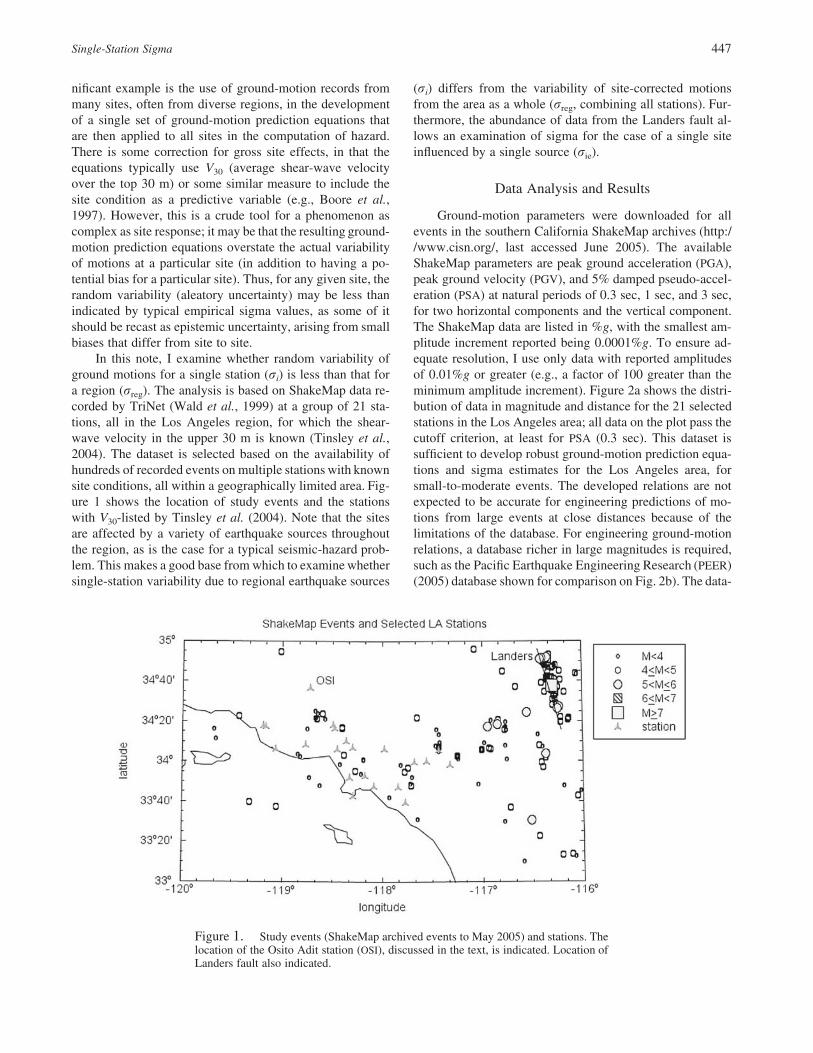
Ground-motion parameters were downloaded for allevents in the southern California ShakeMap archives (http://www.cisn.org/, last accessed June 2005). The availableShakeMap parameters are peak ground acceleration (PGA),peak ground velocity (PGV), and 5% damped pseudo-accel-eration (PSA) at natural periods of 0.3 sec, 1 sec, and 3 sec,for two horizontal components and the vertical component.The ShakeMap data are listed in %g, with the smallest am-plitude increment reported being 0.0001%g. To ensure ad-equate resolution, I use only data with reported amplitudesof 0.01%g or greater (e.g., a factor of 100 greater than theminimum amplitude increment). Figure 2a shows the distri-bution of data in magnitude and distance for the 21 selectedstations in the Los Angeles area; all data on the plot pass thecutoff criterion, at least for PSA (0.3 sec). This dataset issufficient to develop robust ground-motion prediction equa-tions and sigma estimates for the Los Angeles area, forsmall-to-moderate events. The developed relations are notexpected to be accurate for engineering predictions of mo-tions from large events at close distances because of thelimitations of the database. For engineering ground-motionrelations, a database richer in large magnitudes is required,such as the Pacific Earthquake Engineering Research (PEER)(2005) database shown for comparison on Fig. 2b). The data-
448 G. M. Atkinson
Figure 2. (a) Distribution of database forregression analysis of this study in magnitudeand distance (for PSA (0.3 sec). (b) Distributionof ground-motion data available through PEER(2005).
base limitations are not crucial for this application, becauseit is the relative variability about the predictions for sitesversus the region that is of interest, not the predicted groundmotions themselves.
The horizontal-component data for each ground-motionparameter, Y (PGA, PGV, PSA [0.3 sec], PSA (1 sec], PSA (3sec]) are fit to an equation of the form:
2log Y � c0 � c1(M � 5) � c2(M � 5)� c3 log R � c4 R � S , (1)i
where R � Z (d2 � h2), with d, distance and h, a pseudo-depth parameter, set at h � 5 km (from Boore et al., 1997).Si is the site term for each of the stations. The distance metric(d) provided by ShakeMap for southern California is gen-erally epicentral distance, except for large events for whicha finite fault is known, in which case it is the Joyner-Booredistance (surface distance to the fault) (V. Quitoriano, per-
sonal comm., 2005). A standard linear regression to this sim-ple form is sufficient for the comparative purposes of thisstudy, and facilitates comparisons using regressions of dif-ferent types of datasets, including single-station datasets.Possible complications to the functional form due to effectssuch as a magnitude-dependent shape (Anderson and Quaas,1988) are not important here because of the small sourcesize of most study events. In addition to the low-amplitudecutoff of 0.01 %g that is imposed on the data as describedpreviously, I restrict the regression to distances less than 300km to provide a robust regression dataset that is well dis-tributed in distance-amplitude space. Both horizontal com-ponents are used.
The site term is considered in two alternative ways. Tin-sley et al. (2004) provide empirical site amplification factors,Si (Tinsley), for PSA at each of the sites, based on observa-tional data from many earthquakes; these terms are compa-rable with the more common site-correction factors derived
Single-Station Sigma 449
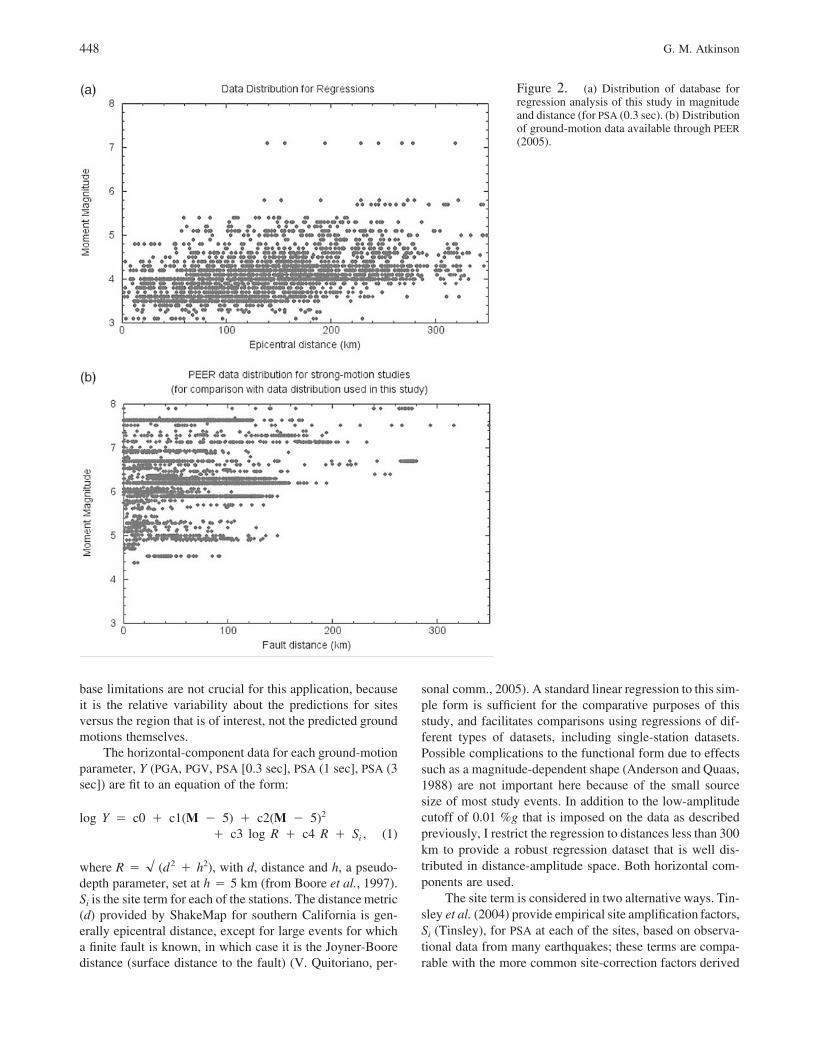
Table 1Regression Coefficients for BJF-v760 Corrected Amplitudes (equation 1)
Parameter c0 c1 c2 c3 c4 Sigma (BJF) Sigma (emp-amp) Sigma (NoSiteCorr)
PGA 2.007 0.567 0.0311 �1.472 0.00000 0.309 0.307 0.305PSA (0.3 sec) 2.121 0.699 0.0138 �1.283 �0.00115 0.325 0.323 0.333PSA (1 sec) 0.545 0.731 0.0553 �0.884 0.00000 0.290 0.288 0.295PSA (3 sec) �1.439 0.341 0.1758 �0.221 0.00000 0.279 0.317 0.274PGV 1.141 0.701 0.0838 �1.155 0.00000 0.296 0.323 0.300
Sigma values (rreg) are for the regional ground-motion relations including all sites. BJF, Boore-Joyner-Fumal; emp-amp, empirical-amplification;NoSiteCorr, no site correction.
for magnitude estimates by looking at average magnituderesiduals by site over many earthquakes. These factors canbe used directly in equation (1) (e.g., the independent vari-able is then [log Y � Si(Tinsley)]). For PGA, it is assumedthat the factor for 0.3 sec applies, whereas for PGV the factorfor 1 sec is applied. (Note: For PGV, 1 sec is the periodcommonly associated with the peak motion; for PGA, thedominant period is typically about 0.2 sec but a factor for0.2 sec is not available.) These values (log Y � Si(Tinsley))are referred to as “empirically corrected amplitudes.”
As an alternative, Boore et al. (1997) provide empiricalamplification factors as a continuous function of V30. Thesefactors can be used to correct all observations to a commonreference value of V30, referred to as Vref; the reference V30
value of Vref � 760 m/sec (National Earthquakes HazardsReduction Program B/C boundary) is arbitrarily selected. Inthis case, the independent variable for regression is (log Y� SBJF [V30] � SBJF [Vref]), where SBJF (V30) is the Boore etal. log amplification for the site V30 value, and SBJF (Vref) isthe Boore et al log amplification for the reference velocityof 760 m/sec. These values are referred to as “Boore-Joyner-Fumal (BJF)-corrected amplitudes.”
The results of the regressions to equation (1) are shownin Table 1. The coefficients are given for the regression ofthe BJF-corrected dataset, along with the standard deviationof residuals for regressions of both the BJF-corrected andempirically corrected datasets. (Note that these sigma values,rreg, include both the interevent and intraevent componentsof variability.) As a comparison, the sigma for regressionwhen NO site corrections are applied is also listed, to pro-vide an indication of the value of site corrections. Perhapssurprisingly, the standard deviations are not much largerwhen no site corrections are applied. In some cases (e.g.,PSA [3 sec]), the sigma is actually slightly smaller when nosite corrections are used. This could be because complex siteresponse in the LA Basin may not be amenable to correctionwith simple factors. However, it does cast doubt on the gen-eral value of site corrections as a tool to reducing variancein empirical ground-motion predictions, an intriguing issuediscussed at length by Field et al. (2000). Molas and Ya-mazaki (1995) and Ni et al. (2000) also concluded that sys-tematic site effects in ground-motion data are less significantthan might be expected, while Choi and Stewart (2005)found that a nonlinear V30-based model can lead to reduc-
tions in intraevent sigma for sites with low V30. The BJFcorrection based on V30 provides a similar (i.e., minor) re-duction of variance to that provided by an empirical sitecorrection based on observations.
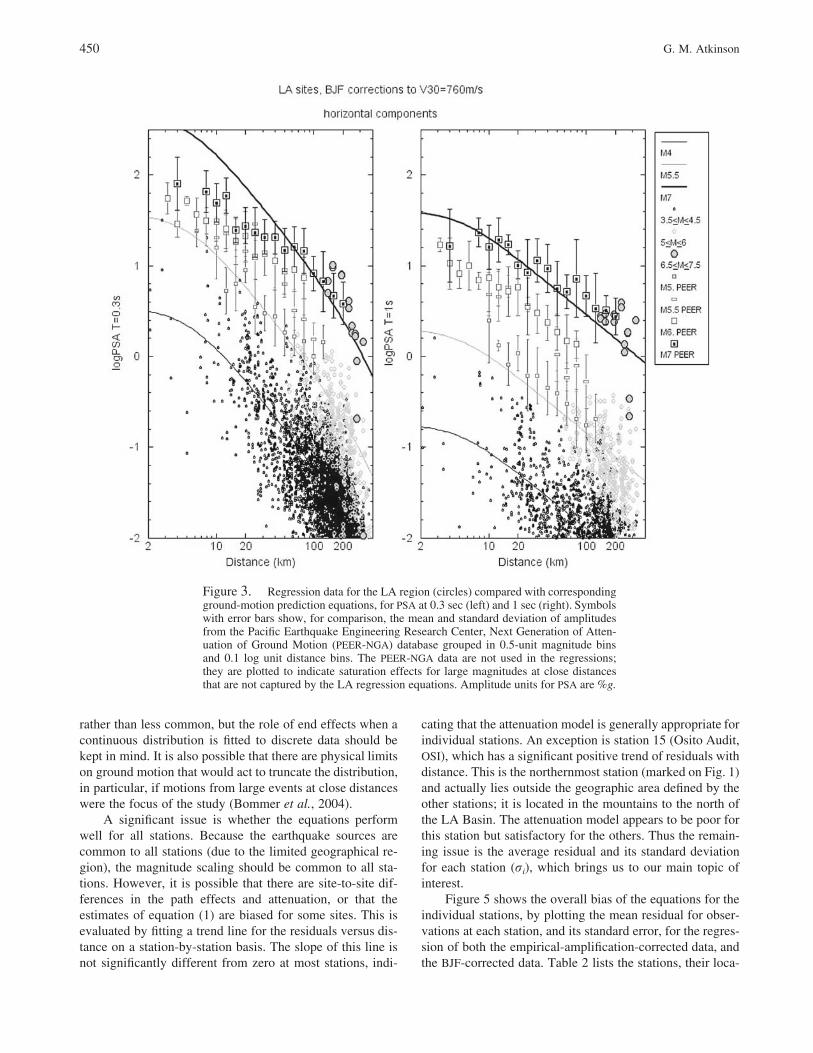
Figure 3 shows the overall performance of the equationslisted in Table 1. The plot suggests that the prediction equa-tions are a reasonable description of the LA ShakeMap data.As a matter of general interest, the performance of the equa-tions in relation to data from larger, nearer events of moredirect engineering interest is also indicated on Figure 3, byincluding the mean and standard deviation of ground mo-tions, grouped in 0.5 unit magnitude and 0.1 log unit dis-tance bins, from the PEER strong-motion database shown inFigure 2b (PEER, 2005). These motions were also correctedusing the BJF factors to V30 � 760 m sec. Note that thePEER data are from diverse regions. The PEER database is,of course, superior in its capabilities to describe motionsfrom large events at close distances, in particular, saturationeffects, while the LA dataset used in this study is actuallysuperior in its coverage of small-to-moderate events (M�5.5). This comparison shows that the equations of Table1 provide reasonable predictions over most magnitude anddistance ranges, but would overestimate short-period mo-tions from large events at close distances. Therefore, I stressagain that the equations are not intended for engineeringapplications; the focus here is on variability issues.
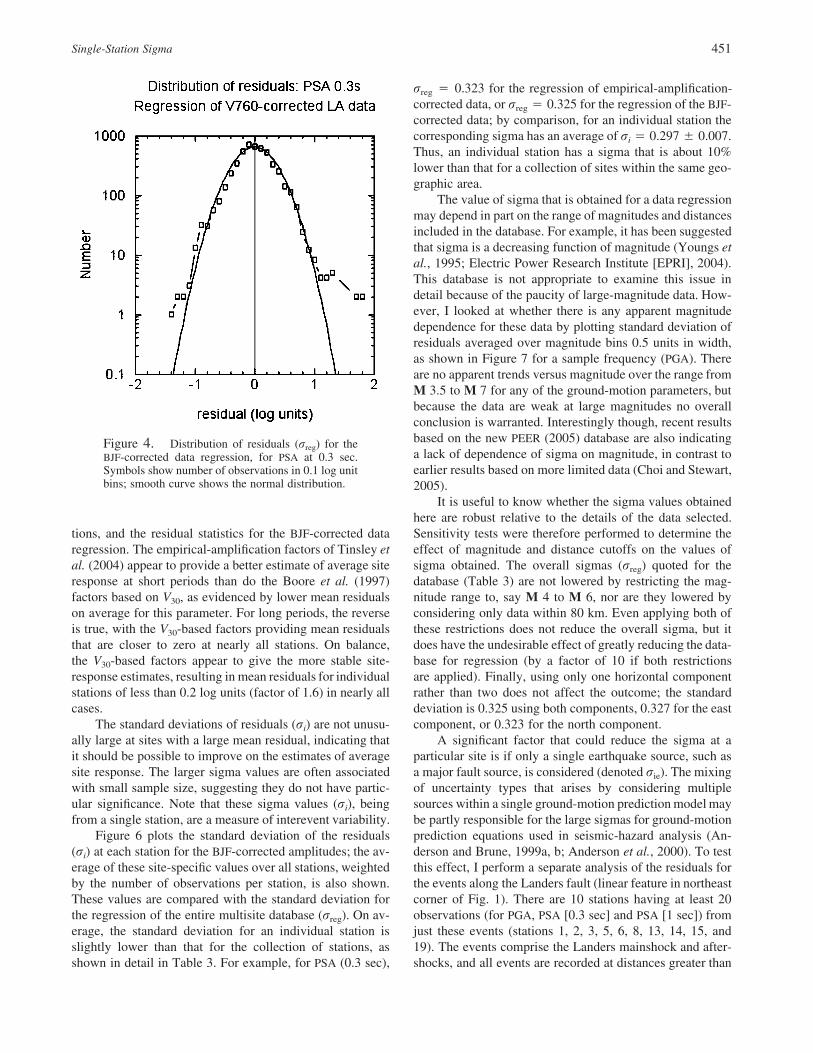
Figure 4 shows the overall distribution of residuals forthe regression of the BJF-corrected data, in comparison to anormal distribution. Note that a log scale is used for they axis; this is unconventional, but allows the outliers at lownumbers of observations to be clearly seen. The (log) resid-uals follow the normal distribution in general, but the datashow a greater number of large-residual observations thanwould be predicted from a normal distribution. These high-residual data points correspond mostly to a single smallevent (M 3.24 on 22 February 2000) recorded at distancesover 100 km. Strasser and Bommer (2004) also noted thatfor typical empirical ground-motion relations, the high re-siduals tend to be associated with low-amplitude data. Highresiduals for low-amplitude data are not of practical impor-tance in themselves, but note that there is no evidence of a“cutoff” of observations, out to more than 3 standard devi-ations. Thus it appears that large positive residuals may bemore common than expected from a normal distribution,
450 G. M. Atkinson
Figure 3. Regression data for the LA region (circles) compared with correspondingground-motion prediction equations, for PSA at 0.3 sec (left) and 1 sec (right). Symbolswith error bars show, for comparison, the mean and standard deviation of amplitudesfrom the Pacific Earthquake Engineering Research Center, Next Generation of Atten-uation of Ground Motion (PEER-NGA) database grouped in 0.5-unit magnitude binsand 0.1 log unit distance bins. The PEER-NGA data are not used in the regressions;they are plotted to indicate saturation effects for large magnitudes at close distancesthat are not captured by the LA regression equations. Amplitude units for PSA are %g.
rather than less common, but the role of end effects when acontinuous distribution is fitted to discrete data should bekept in mind. It is also possible that there are physical limitson ground motion that would act to truncate the distribution,in particular, if motions from large events at close distanceswere the focus of the study (Bommer et al., 2004).
A significant issue is whether the equations performwell for all stations. Because the earthquake sources arecommon to all stations (due to the limited geographical re-gion), the magnitude scaling should be common to all sta-tions. However, it is possible that there are site-to-site dif-ferences in the path effects and attenuation, or that theestimates of equation (1) are biased for some sites. This isevaluated by fitting a trend line for the residuals versus dis-tance on a station-by-station basis. The slope of this line isnot significantly different from zero at most stations, indi-
cating that the attenuation model is generally appropriate forindividual stations. An exception is station 15 (Osito Audit,OSI), which has a significant positive trend of residuals withdistance. This is the northernmost station (marked on Fig. 1)and actually lies outside the geographic area defined by theother stations; it is located in the mountains to the north ofthe LA Basin. The attenuation model appears to be poor forthis station but satisfactory for the others. Thus the remain-ing issue is the average residual and its standard deviationfor each station (ri), which brings us to our main topic ofinterest.
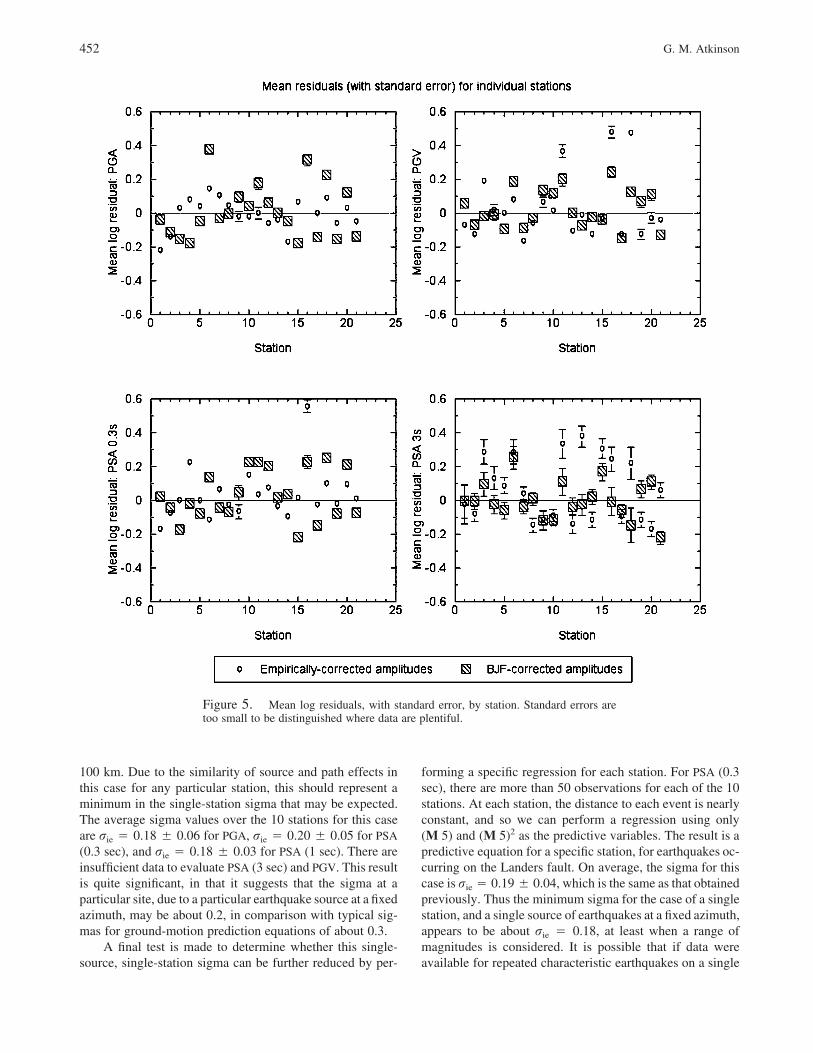
Figure 5 shows the overall bias of the equations for theindividual stations, by plotting the mean residual for obser-vations at each station, and its standard error, for the regres-sion of both the empirical-amplification-corrected data, andthe BJF-corrected data. Table 2 lists the stations, their loca-
Single-Station Sigma 451
Figure 4. Distribution of residuals (rreg) for theBJF-corrected data regression, for PSA at 0.3 sec.Symbols show number of observations in 0.1 log unitbins; smooth curve shows the normal distribution.
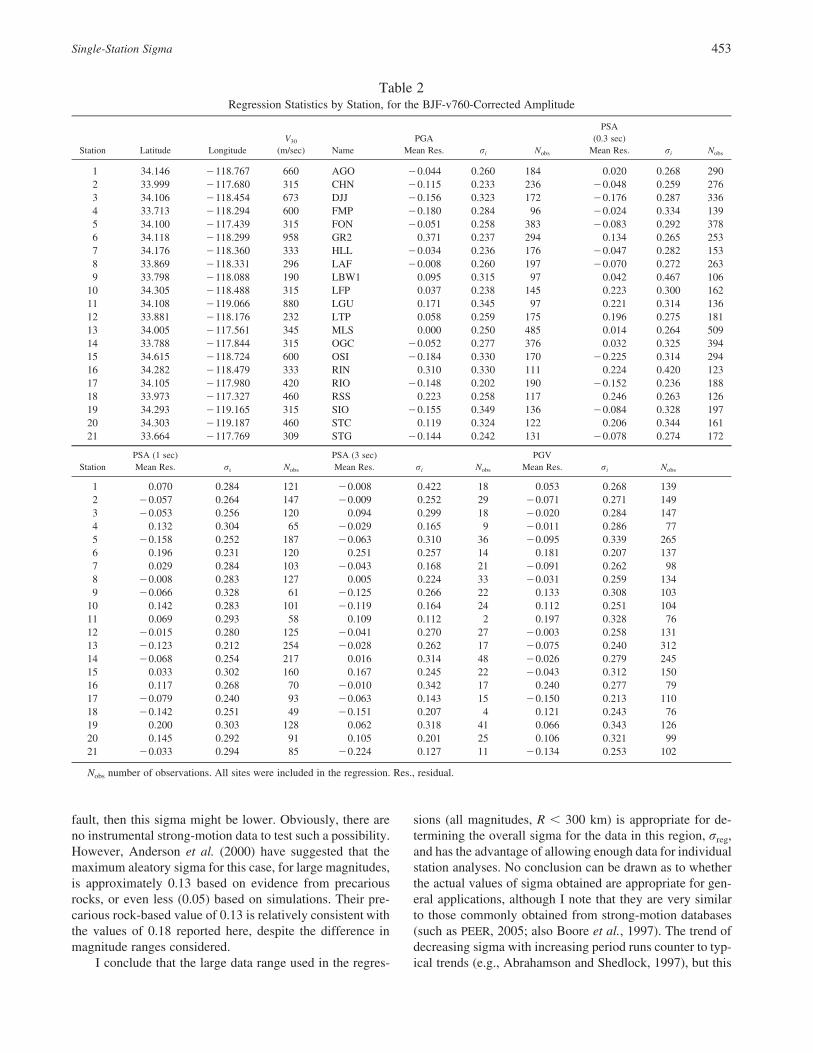
tions, and the residual statistics for the BJF-corrected dataregression. The empirical-amplification factors of Tinsley etal. (2004) appear to provide a better estimate of average siteresponse at short periods than do the Boore et al. (1997)factors based on V30, as evidenced by lower mean residualson average for this parameter. For long periods, the reverseis true, with the V30-based factors providing mean residualsthat are closer to zero at nearly all stations. On balance,the V30-based factors appear to give the more stable site-response estimates, resulting in mean residuals for individualstations of less than 0.2 log units (factor of 1.6) in nearly allcases.
The standard deviations of residuals (ri) are not unusu-ally large at sites with a large mean residual, indicating thatit should be possible to improve on the estimates of averagesite response. The larger sigma values are often associatedwith small sample size, suggesting they do not have partic-ular significance. Note that these sigma values (ri), beingfrom a single station, are a measure of interevent variability.
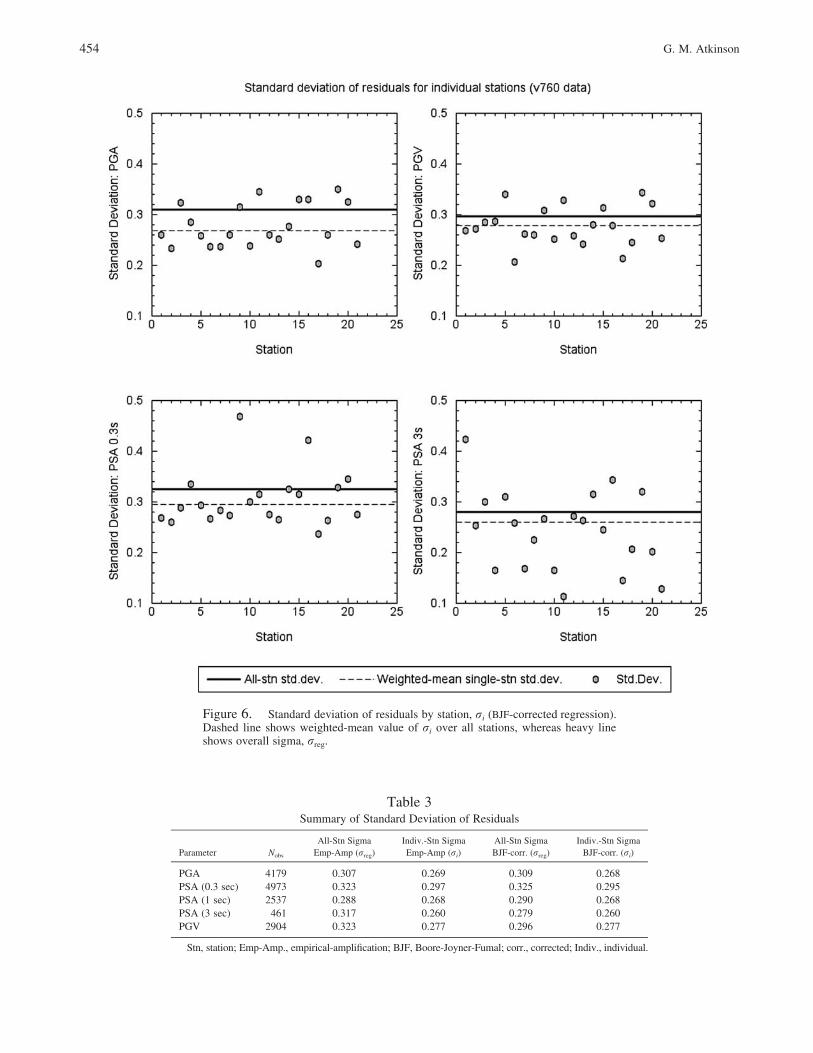
Figure 6 plots the standard deviation of the residuals(ri) at each station for the BJF-corrected amplitudes; the av-erage of these site-specific values over all stations, weightedby the number of observations per station, is also shown.These values are compared with the standard deviation forthe regression of the entire multisite database (rreg). On av-erage, the standard deviation for an individual station isslightly lower than that for the collection of stations, asshown in detail in Table 3. For example, for PSA (0.3 sec),
rreg � 0.323 for the regression of empirical-amplification-corrected data, or rreg � 0.325 for the regression of the BJF-corrected data; by comparison, for an individual station thecorresponding sigma has an average of ri � 0.297 � 0.007.Thus, an individual station has a sigma that is about 10%lower than that for a collection of sites within the same geo-graphic area.
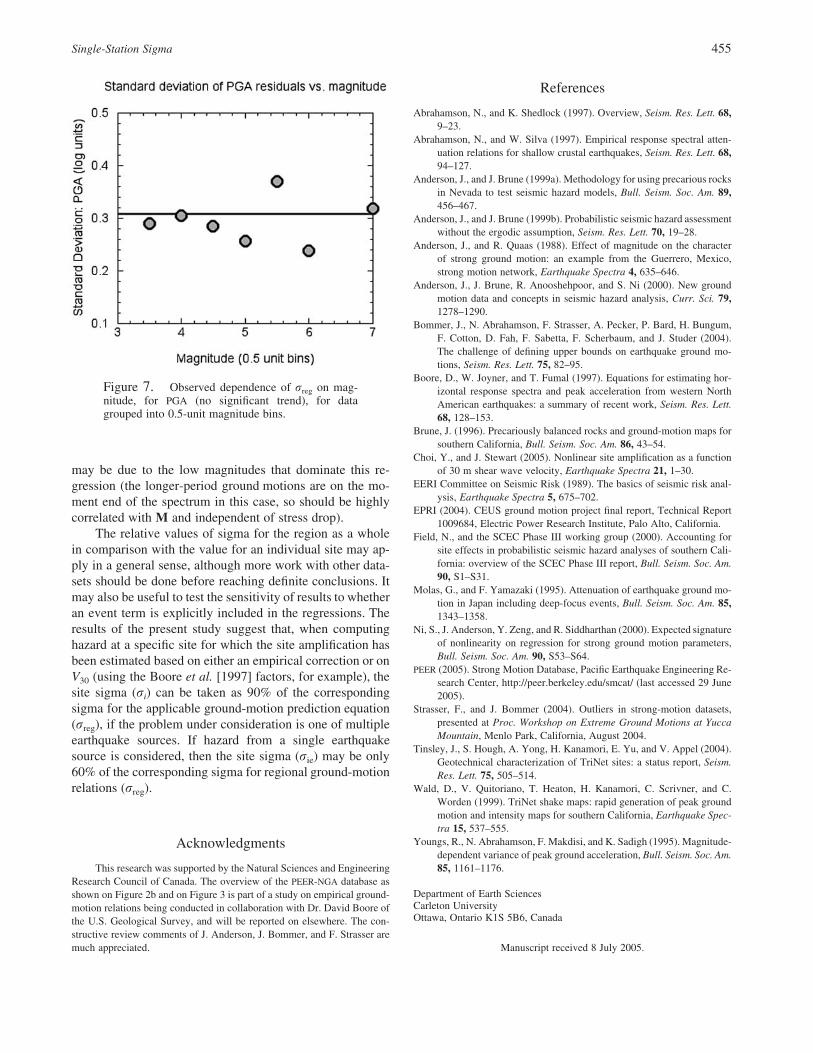
The value of sigma that is obtained for a data regressionmay depend in part on the range of magnitudes and distancesincluded in the database. For example, it has been suggestedthat sigma is a decreasing function of magnitude (Youngs etal., 1995; Electric Power Research Institute [EPRI], 2004).This database is not appropriate to examine this issue indetail because of the paucity of large-magnitude data. How-ever, I looked at whether there is any apparent magnitudedependence for these data by plotting standard deviation ofresiduals averaged over magnitude bins 0.5 units in width,as shown in Figure 7 for a sample frequency (PGA). Thereare no apparent trends versus magnitude over the range fromM 3.5 to M 7 for any of the ground-motion parameters, butbecause the data are weak at large magnitudes no overallconclusion is warranted. Interestingly though, recent resultsbased on the new PEER (2005) database are also indicatinga lack of dependence of sigma on magnitude, in contrast toearlier results based on more limited data (Choi and Stewart,2005).
It is useful to know whether the sigma values obtainedhere are robust relative to the details of the data selected.Sensitivity tests were therefore performed to determine theeffect of magnitude and distance cutoffs on the values ofsigma obtained. The overall sigmas (rreg) quoted for thedatabase (Table 3) are not lowered by restricting the mag-nitude range to, say M 4 to M 6, nor are they lowered byconsidering only data within 80 km. Even applying both ofthese restrictions does not reduce the overall sigma, but itdoes have the undesirable effect of greatly reducing the data-base for regression (by a factor of 10 if both restrictionsare applied). Finally, using only one horizontal componentrather than two does not affect the outcome; the standarddeviation is 0.325 using both components, 0.327 for the eastcomponent, or 0.323 for the north component.
A significant factor that could reduce the sigma at aparticular site is if only a single earthquake source, such asa major fault source, is considered (denoted rie). The mixingof uncertainty types that arises by considering multiplesources within a single ground-motion prediction model maybe partly responsible for the large sigmas for ground-motionprediction equations used in seismic-hazard analysis (An-derson and Brune, 1999a, b; Anderson et al., 2000). To testthis effect, I perform a separate analysis of the residuals forthe events along the Landers fault (linear feature in northeastcorner of Fig. 1). There are 10 stations having at least 20observations (for PGA, PSA [0.3 sec] and PSA [1 sec]) fromjust these events (stations 1, 2, 3, 5, 6, 8, 13, 14, 15, and19). The events comprise the Landers mainshock and after-shocks, and all events are recorded at distances greater than
452 G. M. Atkinson
Figure 5. Mean log residuals, with standard error, by station. Standard errors aretoo small to be distinguished where data are plentiful.
100 km. Due to the similarity of source and path effects inthis case for any particular station, this should represent aminimum in the single-station sigma that may be expected.The average sigma values over the 10 stations for this caseare rie � 0.18 � 0.06 for PGA, rie � 0.20 � 0.05 for PSA(0.3 sec), and rie � 0.18 � 0.03 for PSA (1 sec). There areinsufficient data to evaluate PSA (3 sec) and PGV. This resultis quite significant, in that it suggests that the sigma at aparticular site, due to a particular earthquake source at a fixedazimuth, may be about 0.2, in comparison with typical sig-mas for ground-motion prediction equations of about 0.3.
A final test is made to determine whether this single-source, single-station sigma can be further reduced by per-
forming a specific regression for each station. For PSA (0.3sec), there are more than 50 observations for each of the 10stations. At each station, the distance to each event is nearlyconstant, and so we can perform a regression using only(M 5) and (M 5)2 as the predictive variables. The result is apredictive equation for a specific station, for earthquakes oc-curring on the Landers fault. On average, the sigma for thiscase is rie � 0.19 � 0.04, which is the same as that obtainedpreviously. Thus the minimum sigma for the case of a singlestation, and a single source of earthquakes at a fixed azimuth,appears to be about rie � 0.18, at least when a range ofmagnitudes is considered. It is possible that if data wereavailable for repeated characteristic earthquakes on a single
Single-Station Sigma 453
Table 2Regression Statistics by Station, for the BJF-v760-Corrected Amplitude
Station Latitude LongitudeV30
(m/sec) NamePGA
Mean Res. ri Nobs
PSA(0.3 sec)
Mean Res. ri Nobs
1 34.146 �118.767 660 AGO �0.044 0.260 184 0.020 0.268 2902 33.999 �117.680 315 CHN �0.115 0.233 236 �0.048 0.259 2763 34.106 �118.454 673 DJJ �0.156 0.323 172 �0.176 0.287 3364 33.713 �118.294 600 FMP �0.180 0.284 96 �0.024 0.334 1395 34.100 �117.439 315 FON �0.051 0.258 383 �0.083 0.292 3786 34.118 �118.299 958 GR2 0.371 0.237 294 0.134 0.265 2537 34.176 �118.360 333 HLL �0.034 0.236 176 �0.047 0.282 1538 33.869 �118.331 296 LAF �0.008 0.260 197 �0.070 0.272 2639 33.798 �118.088 190 LBW1 0.095 0.315 97 0.042 0.467 106
10 34.305 �118.488 315 LFP 0.037 0.238 145 0.223 0.300 16211 34.108 �119.066 880 LGU 0.171 0.345 97 0.221 0.314 13612 33.881 �118.176 232 LTP 0.058 0.259 175 0.196 0.275 18113 34.005 �117.561 345 MLS 0.000 0.250 485 0.014 0.264 50914 33.788 �117.844 315 OGC �0.052 0.277 376 0.032 0.325 39415 34.615 �118.724 600 OSI �0.184 0.330 170 �0.225 0.314 29416 34.282 �118.479 333 RIN 0.310 0.330 111 0.224 0.420 12317 34.105 �117.980 420 RIO �0.148 0.202 190 �0.152 0.236 18818 33.973 �117.327 460 RSS 0.223 0.258 117 0.246 0.263 12619 34.293 �119.165 315 SIO �0.155 0.349 136 �0.084 0.328 19720 34.303 �119.187 460 STC 0.119 0.324 122 0.206 0.344 16121 33.664 �117.769 309 STG �0.144 0.242 131 �0.078 0.274 172
StationPSA (1 sec)Mean Res. ri Nobs
PSA (3 sec)Mean Res. ri Nobs
PGVMean Res. ri Nobs
1 0.070 0.284 121 �0.008 0.422 18 0.053 0.268 1392 �0.057 0.264 147 �0.009 0.252 29 �0.071 0.271 1493 �0.053 0.256 120 0.094 0.299 18 �0.020 0.284 1474 0.132 0.304 65 �0.029 0.165 9 �0.011 0.286 775 �0.158 0.252 187 �0.063 0.310 36 �0.095 0.339 2656 0.196 0.231 120 0.251 0.257 14 0.181 0.207 1377 0.029 0.284 103 �0.043 0.168 21 �0.091 0.262 988 �0.008 0.283 127 0.005 0.224 33 �0.031 0.259 1349 �0.066 0.328 61 �0.125 0.266 22 0.133 0.308 103
10 0.142 0.283 101 �0.119 0.164 24 0.112 0.251 10411 0.069 0.293 58 0.109 0.112 2 0.197 0.328 7612 �0.015 0.280 125 �0.041 0.270 27 �0.003 0.258 13113 �0.123 0.212 254 �0.028 0.262 17 �0.075 0.240 31214 �0.068 0.254 217 0.016 0.314 48 �0.026 0.279 24515 0.033 0.302 160 0.167 0.245 22 �0.043 0.312 15016 0.117 0.268 70 �0.010 0.342 17 0.240 0.277 7917 �0.079 0.240 93 �0.063 0.143 15 �0.150 0.213 11018 �0.142 0.251 49 �0.151 0.207 4 0.121 0.243 7619 0.200 0.303 128 0.062 0.318 41 0.066 0.343 12620 0.145 0.292 91 0.105 0.201 25 0.106 0.321 9921 �0.033 0.294 85 �0.224 0.127 11 �0.134 0.253 102
Nobs number of observations. All sites were included in the regression. Res., residual.
fault, then this sigma might be lower. Obviously, there areno instrumental strong-motion data to test such a possibility.However, Anderson et al. (2000) have suggested that themaximum aleatory sigma for this case, for large magnitudes,is approximately 0.13 based on evidence from precariousrocks, or even less (0.05) based on simulations. Their pre-carious rock-based value of 0.13 is relatively consistent withthe values of 0.18 reported here, despite the difference inmagnitude ranges considered.
I conclude that the large data range used in the regres-
sions (all magnitudes, R � 300 km) is appropriate for de-termining the overall sigma for the data in this region, rreg,and has the advantage of allowing enough data for individualstation analyses. No conclusion can be drawn as to whetherthe actual values of sigma obtained are appropriate for gen-eral applications, although I note that they are very similarto those commonly obtained from strong-motion databases(such as PEER, 2005; also Boore et al., 1997). The trend ofdecreasing sigma with increasing period runs counter to typ-ical trends (e.g., Abrahamson and Shedlock, 1997), but this
454 G. M. Atkinson
Figure 6. Standard deviation of residuals by station, ri (BJF-corrected regression).Dashed line shows weighted-mean value of ri over all stations, whereas heavy lineshows overall sigma, rreg.
Table 3Summary of Standard Deviation of Residuals
Parameter Nobs
All-Stn SigmaEmp-Amp (rreg)
Indiv.-Stn SigmaEmp-Amp (ri)
All-Stn SigmaBJF-corr. (rreg)
Indiv.-Stn SigmaBJF-corr. (ri)
PGA 4179 0.307 0.269 0.309 0.268PSA (0.3 sec) 4973 0.323 0.297 0.325 0.295PSA (1 sec) 2537 0.288 0.268 0.290 0.268PSA (3 sec) 461 0.317 0.260 0.279 0.260PGV 2904 0.323 0.277 0.296 0.277
Stn, station; Emp-Amp., empirical-amplification; BJF, Boore-Joyner-Fumal; corr., corrected; Indiv., individual.
Single-Station Sigma 455
Figure 7. Observed dependence of rreg on mag-nitude, for PGA (no significant trend), for datagrouped into 0.5-unit magnitude bins.
may be due to the low magnitudes that dominate this re-gression (the longer-period ground motions are on the mo-ment end of the spectrum in this case, so should be highlycorrelated with M and independent of stress drop).
The relative values of sigma for the region as a wholein comparison with the value for an individual site may ap-ply in a general sense, although more work with other data-sets should be done before reaching definite conclusions. Itmay also be useful to test the sensitivity of results to whetheran event term is explicitly included in the regressions. Theresults of the present study suggest that, when computinghazard at a specific site for which the site amplification hasbeen estimated based on either an empirical correction or onV30 (using the Boore et al. [1997] factors, for example), thesite sigma (ri) can be taken as 90% of the correspondingsigma for the applicable ground-motion prediction equation(rreg), if the problem under consideration is one of multipleearthquake sources. If hazard from a single earthquakesource is considered, then the site sigma (rie) may be only60% of the corresponding sigma for regional ground-motionrelations (rreg).
Acknowledgments
This research was supported by the Natural Sciences and EngineeringResearch Council of Canada. The overview of the PEER-NGA database asshown on Figure 2b and on Figure 3 is part of a study on empirical ground-motion relations being conducted in collaboration with Dr. David Boore ofthe U.S. Geological Survey, and will be reported on elsewhere. The con-structive review comments of J. Anderson, J. Bommer, and F. Strasser aremuch appreciated.
References
Abrahamson, N., and K. Shedlock (1997). Overview, Seism. Res. Lett. 68,9–23.
Abrahamson, N., and W. Silva (1997). Empirical response spectral atten-uation relations for shallow crustal earthquakes, Seism. Res. Lett. 68,94–127.
Anderson, J., and J. Brune (1999a). Methodology for using precarious rocksin Nevada to test seismic hazard models, Bull. Seism. Soc. Am. 89,456–467.
Anderson, J., and J. Brune (1999b). Probabilistic seismic hazard assessmentwithout the ergodic assumption, Seism. Res. Lett. 70, 19–28.
Anderson, J., and R. Quaas (1988). Effect of magnitude on the characterof strong ground motion: an example from the Guerrero, Mexico,strong motion network, Earthquake Spectra 4, 635–646.
Anderson, J., J. Brune, R. Anooshehpoor, and S. Ni (2000). New groundmotion data and concepts in seismic hazard analysis, Curr. Sci. 79,1278–1290.
Bommer, J., N. Abrahamson, F. Strasser, A. Pecker, P. Bard, H. Bungum,F. Cotton, D. Fah, F. Sabetta, F. Scherbaum, and J. Studer (2004).The challenge of defining upper bounds on earthquake ground mo-tions, Seism. Res. Lett. 75, 82–95.
Boore, D., W. Joyner, and T. Fumal (1997). Equations for estimating hor-izontal response spectra and peak acceleration from western NorthAmerican earthquakes: a summary of recent work, Seism. Res. Lett.68, 128–153.
Brune, J. (1996). Precariously balanced rocks and ground-motion maps forsouthern California, Bull. Seism. Soc. Am. 86, 43–54.
Choi, Y., and J. Stewart (2005). Nonlinear site amplification as a functionof 30 m shear wave velocity, Earthquake Spectra 21, 1–30.
EERI Committee on Seismic Risk (1989). The basics of seismic risk anal-ysis, Earthquake Spectra 5, 675–702.
EPRI (2004). CEUS ground motion project final report, Technical Report1009684, Electric Power Research Institute, Palo Alto, California.
Field, N., and the SCEC Phase III working group (2000). Accounting forsite effects in probabilistic seismic hazard analyses of southern Cali-fornia: overview of the SCEC Phase III report, Bull. Seism. Soc. Am.90, S1–S31.
Molas, G., and F. Yamazaki (1995). Attenuation of earthquake ground mo-tion in Japan including deep-focus events, Bull. Seism. Soc. Am. 85,1343–1358.
Ni, S., J. Anderson, Y. Zeng, and R. Siddharthan (2000). Expected signatureof nonlinearity on regression for strong ground motion parameters,Bull. Seism. Soc. Am. 90, S53–S64.
PEER (2005). Strong Motion Database, Pacific Earthquake Engineering Re-search Center, http://peer.berkeley.edu/smcat/ (last accessed 29 June2005).
Strasser, F., and J. Bommer (2004). Outliers in strong-motion datasets,presented at Proc. Workshop on Extreme Ground Motions at YuccaMountain, Menlo Park, California, August 2004.
Tinsley, J., S. Hough, A. Yong, H. Kanamori, E. Yu, and V. Appel (2004).Geotechnical characterization of TriNet sites: a status report, Seism.Res. Lett. 75, 505–514.
Wald, D., V. Quitoriano, T. Heaton, H. Kanamori, C. Scrivner, and C.Worden (1999). TriNet shake maps: rapid generation of peak groundmotion and intensity maps for southern California, Earthquake Spec-tra 15, 537–555.
Youngs, R., N. Abrahamson, F. Makdisi, and K. Sadigh (1995). Magnitude-dependent variance of peak ground acceleration, Bull. Seism. Soc. Am.85, 1161–1176.
Department of Earth SciencesCarleton UniversityOttawa, Ontario K1S 5B6, Canada
Manuscript received 8 July 2005.