fire research station
TRANSCRIPT
''''"'''~ ... ~'lI.,.. ~r'" .......... ..--• ...,. .•- .. - ~l., __ u • •• , _ ._=" "-"_.~._~ __
Fire Research NoteNo.959
PRELIMINARY -EXPERIMENTS ON THE USE OFWATER ADDITIVES FOR FRIC TION REDUC TIONIN FIRE HOSE
by
P F THORNE and K JORDAN
February 1973
FIRERESEARCHSTATION
© BRE Trust (UK) Permission is granted for personal noncommercial research use. Citation of the work is allowed and encouraged.
•
F.R. Note No. 959
February, 1973.
PRELIMINARY EXPERIMENTS ON THE USE OF WATER ADDITIVESFOR FRICTION REIDCTION IN FIRE HOSE
by
*P F Thorne and K Jordan
SUMMARY
Measurements have been made of the Fanning friction factor (r) for
,19 mm hose-reel hose and 70 mm non-percolating fire hose for plain water and
dilute (10 to 50 ppm) solutions of Polyethylene Oxide Polymer (PEa).Friction factors were reduced by about 50 per cent by the addition of PEe
to the water. Passage of the dilute solutions through a small transportable
fire pump destroyed the friction-reducing phenomenon. The presence of
PEa in the water enhanced the coherence of water jets, contributing to
increased 'throw'. The scope for the application of PEO in practical fire
fighting operations is discussed.
* The measurements described in this note were made by Mr K Jordan during
a period (March to August 1970) of industrial training, spent at the Fire
Research Station, which formed part of a degree course in Chemical Engineering
at Bradford University.
"
KEY WORm, Hose, Friction factor, Drag reduction.
Crown copyright
This report has not been published andshould be considered as advance researchinformation. No reference should be madeto it in any publication without the writtenconsent of the Head of Fire Research Station
DEPARTMENT OF THE ENVIRONMENT AND FIRE OFFICES COMMITTEE
JOINT FIRE RESEARCH ORGANIZATION
CONTENTS
ii
Section Item
List of symbols used
Applicatiorsto fire fighting
Recommendations
Acknowledgment
References
Introduction
Theoretical considerations
Ex:perimental
Results and observations
Discussion
•
1:
2._.
7
910
15
19
19
19
21
25~
29~
27
1•
2.
3.
4.
5.6.
7.8.
9·Appendix 1
Appendix 2
Appendix 3
Tables
Figures
Friction factor correlations
Preparation of solutions
Estimate of annual usage of PEO
,
i
LIST OF SYMBOLS USED
Fanning's fr~ction factor
radial distance from pipe wall
2..1::<: ~2
Newtonian flow
non-Newtonian flow"""
fluid viscosity
gross volumetric flow rate
function describing mcdification to wall velocity profile,defined by equation (25)
pressure drop due to friction
Reynolds number ..
length of pipe (hose)
fluid density
shear stress (L:
roughness ~~ction for
dimensionless roughness factor, "roughnesstf
velocity at pipe (hose) axis )
shear veloci.ty =1~ I . {(~)o ~ r~:
thickness of lamina!' or viscous sub-layer
local velocity
are numerical constants, the values of which are specificto particular drag reducing additives
internal diameter of pipe (hose)
roughness height = e u;\'- ('./"'-
(?J ~
.r:characteristic relaxation time for polymer molecule
average velocity
dimensionless roughness height
d
e
e*
e/d
f
FN
F
I
Re
t 1
u
u
umax
u*
y
Q
Ll
-,'
LH'
d.be'L
,;u-,d. IX, ('xz O(~
I , J
-ii
F.R. Note No. 959
February, 1973.
PRELIMINARY EXPERIMENTS ON THE USE OF WATER ADDITIVESFOR FRICTION REDUCTIOr" IN FIHE HOSE
by
P FThorne and K Jordan
• 1 •
by
INTRODUCTION
Drag reduction by dilute polymer solutions was first reported in 19481
Toms , and is consequently often known as the "Toms phenomenon".
•
Frictional drag occurring during the turbulent flow of liquids can be
significantly reduced by the addition to the liquid of relatively small
quantities of both soluble and insoluble substances. Suitable soluble
substances include long chain, high molecular weight polymers such as
polyethylene oxide ,polyacrylamide , polyisobutylene and polymethyl methacrylate,
guar gum (a natural material) and certain soaps. Calf thymus DNA 2, a coiled
long chain material and certain fish slimes24 also exhibit the effect.
Insoluble materials capable of reducing frictional drag include asbestos
fibres 3 and certain algae4•
Current practical applications are mainly limited to oil-well drilling
operations. Further applications have been proposed and are being
investigated, e.g. sewer systems, long crude petroleum pipelines, sprinkler
irrigation and ship drag. One of the more obvious and valuable applications
is in fire fighting operations, and trials have been made by the New York
Fire Department5,6 •
Laboratory experiments reported in the technical literature have been mainly
concerned with the Toms phenomenon in hydrodynamically smooth pipes. Since
many practical applications are concerned with pipes of finite roughness,
it is essential to know how the Toms phenomenon is modified by the presence
of roughness on the pipe wall. Only a few workers have reported investigations
(summarised in section 2.6) into drag reduction in rough pipes and these have
been exclusively concerned with artificially roughened pipes, either by
internal threading or lining with sandpaper.
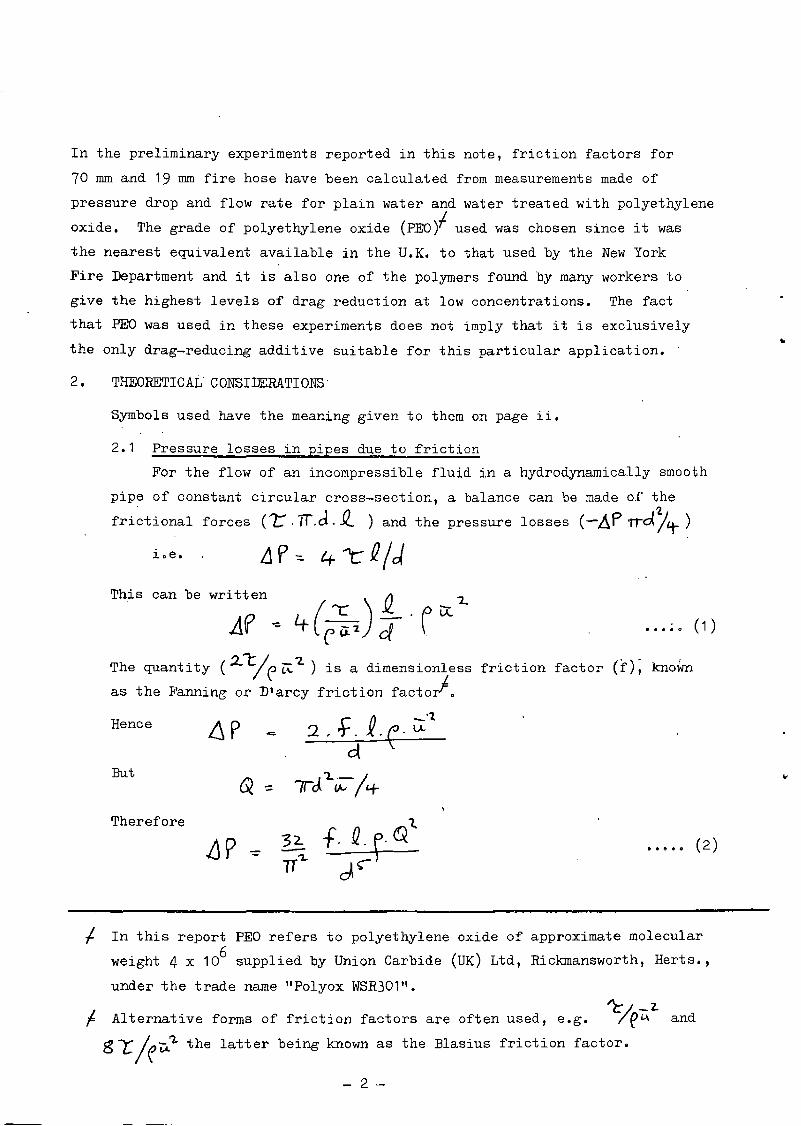
In the preliminary experiments reported in this note, friction factors for
70 mm and 19 mm fire hose have been calculated from measurements made of
pressure drop and flow rate for plain water and water treated with polyethylene
oxide. The grade of polyethylene oxide (PEO)f used was chosen since it was
the nearest equivalent available in the U.K. to that used by the New York
Fire Department and it is also one of the polymers found by many workers to
give the highest levels of drag reduction at low concentrations. The fact
that PEa was used in these experiments does not imply that it is exclusively
the only drag-reducing additive suitable for this particular application•.
2. THEORETICAL CONSITIERATIONS"
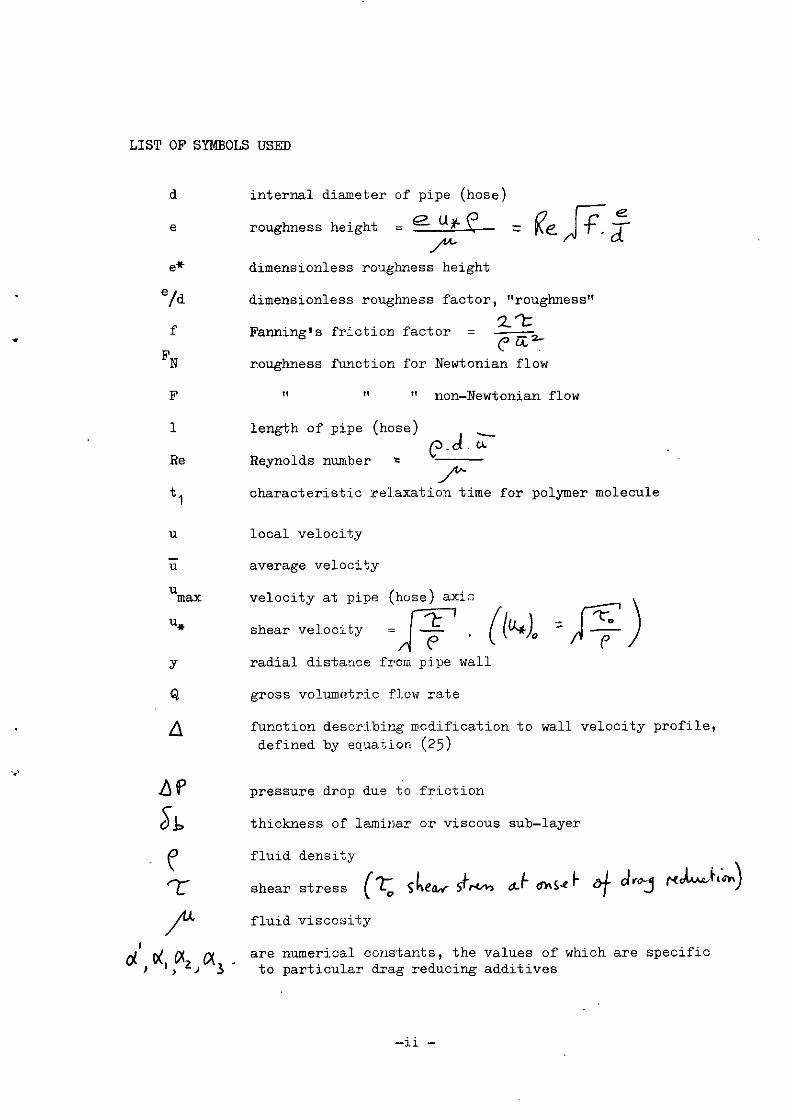
Symbols used have the meaning given to them on page ii.
2.1 Pressure losses in pipes due to friction
For the flow of an incompressible fluid in a hydrodynamically smooth
pipe of constant circular cross-section, a balance can be made of the
frictional forces (7:. 'iT.d. t ) and the pressure losses (-,AP rrd/~ )i.e.
This can be written Q-e It(,~,) d ('
The quantity (2.'"t/e~L) is a dimensionless friction factor (i'); known
as the Fanning or Dtarcy friction facto~.
(1)
Hence
But
Therefore
• • • •• (2)
I In this report PEO refers to polyethylene oxide of approximate molecular
weight 4 x 10⁶ supplied by Union Carbide (UK) Ltd, Rickmansworth, Herts.,
under the trade name "Po'Lyox WSR301".
I '1:/_2.F Alternative forms of friction factors are often used, e.g. /e~ and
glr;l~~~ the latter being known as the Blasius friction factor.
- 2
• • • •• (4)
•
•
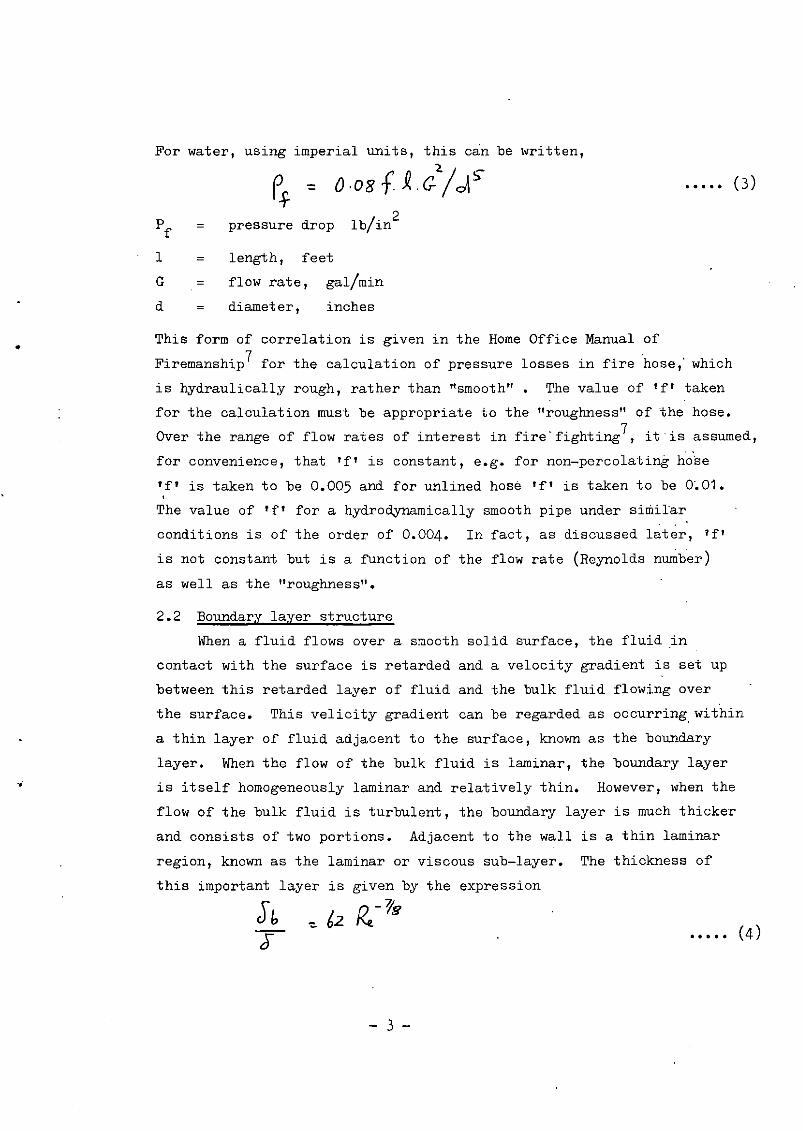
For water, using imperial units, this can be written,
Pi- ~ 0,08 f ~ e-"2./diS- ..... (3)
Pf
drop lb/in2
pressure
I length, feet
G flow rate, gal/min
d diameter, inches
This form of correlation is given in the Home Office Manual of
Firemanship7 for the calculation of pressure losses in fire hose; which
is hydraulically rough, rather than "smoot h" The value of 'f' taken
for the calculation must be appropriate to the "roughness" of the hose.
Over the range of flow rates of interest in fire'fighting7, it is assumed,
for convenience, that 'f' is constant, e.g. for non-percolating hose
'f' is taken to be 0.005 and for unlined hose If' is taken to be 0~01.
The value of 'f' for a hydrodynamically smooth pipe under similar
conditions is of the order of 0.004. In fact, as discussed later, 'f'
is not constant but is a function of the flow rate (Reynolds number)
as well as the "roughness".
2.2 Boundary layer structure
When a fluid flows over a smooth solid surface, the fluid in
contact with the surface is retarded and a velocity gradient is set up
between this retarded layer of fluid and the bulk fluid flowing over
the surface. This velicity gradient can be regarded as occurring, within
a thin layer of fluid adjacent to the surface, known as the boundary
layer. When the flow of the bulk fluid is laminar, the boundary layer
is itself homogeneously laminar and relatively thin. However, when the
flow of the bulk fluid is turbulent, the boundary layer is much thicker
and consists of two portions. Adjacent to the wall is a thin laminar
region, known as the laminar or viscous sub-layer. The thickness of
this important layer is given by the expression
Sb e. 62 ~-7jg
T
- 3 -
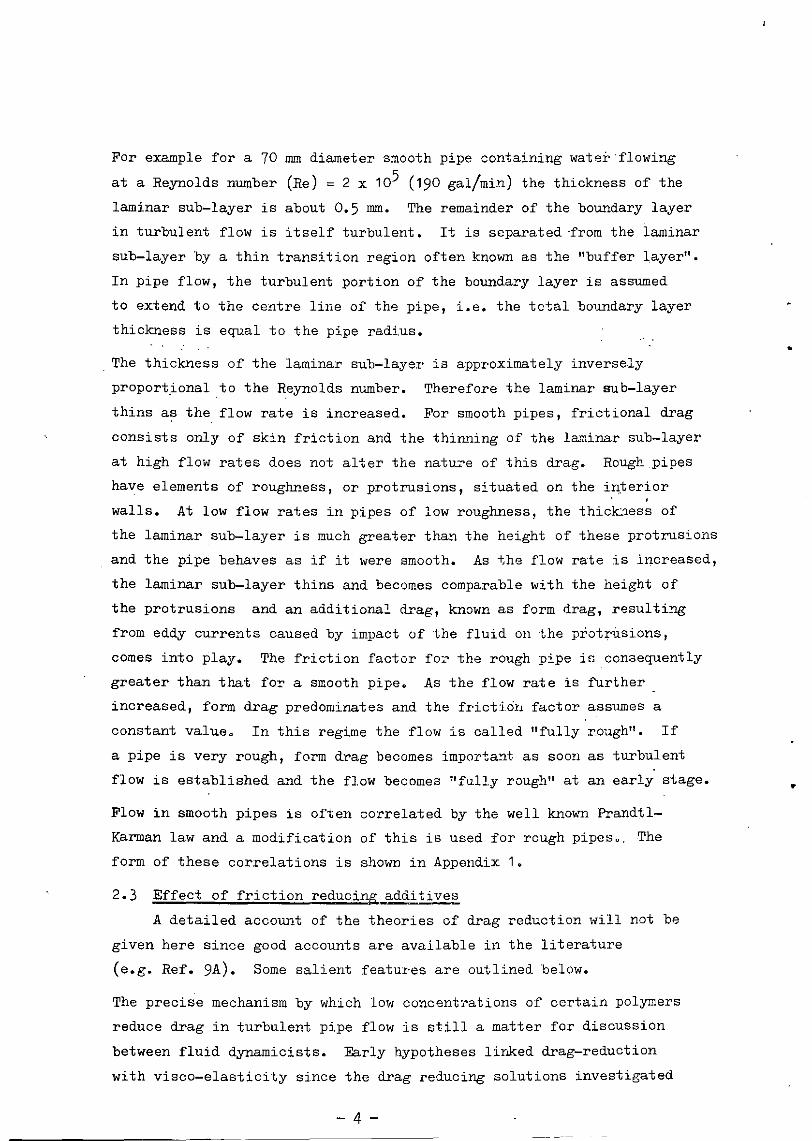
For example for a 70 mID diameter smooth pipe containing water 'flowing
at a Reynolds number (Re) = 2 x 10⁵ (190 gal/min) the thickness of the
laminar sub-layer is about 0.5 mID. The remainder of the boundary layer
in turbulent flow is itself turbulent. It is separated 'from the laminar
sUb-layer by a thin transition region often known as the "buffer layer".
In pipe flow, the turbulent portion of the boundary layer is assumed
to extend to the centre line of the pipe, i.e. the total boundary layer
thickness is equal to the pipe radius.
, The thickness of the laminar sub-layer is approximately inversely
proportional to the Reynolds number. Therefore the laminar sub-layer
thins as the flow rate is increased. For smooth pipes, frictional drag
consists only of skin friction and the thinning of the laminar sub-layer
at high flow rates does not alter the nature of this drag. Rough pipes
have elements of roughness, or protrusions, situated on the interior
walls. At low flow rates in pipes of low roughness, the thick:1ess of
the laminar sUb-layer is much greater than the height of these protrusions
and the pipe behaves as if it were smooth. As the flow rate is increased,
the laminar SUb-layer thins and becomes comparable with the height of
the protrusions and an additional drag, known as form drag, resulting
from eddy currents caused by impact of the fluid on the protrusions,
comes into play. The friction factor fo~ the rough pipe is consequently
greater than tp~t for a smooth pipe. As the flow rate is further
increased, form drag predominates and the f'r-Lc t i.on factor assumes a
constant value. In this regime the flow is called "fully rough". If
a pipe is very rough, form drag becomes important as soon as turbulent
flow is established and the flow becomes "fully rough" at an early stage.
Flow in smooth pipes is often correlated by the well known Prandtl
Karman law and a modification of this is used for rough pipes •. ~he
form of these correlations is shown in Appendix 1.
2.3 Effect of friction reducing additives
A detailed accoilllt of the theories of drag reduction will not be
given here since good accounts are available in the literature
(e.g. Ref. 9A). Some salient featuY'es are outlined below.
The precise mechanism by which low concentI'ations of certain polymers
reduce drag in turbulent pipe flow is still a matter for discussion
between fluid dynamicists. Early hypotheses lir~ed drag-reduction
with visco-elasticity since the drag reducing solutions investigated
- 4 -
•
•
•
were comparatively concentrated (typically 0.1 to 0.5 per cent)-and
possessed marked visco-elastic properties. Solutions of some polymers
currently available (e.g. PEa) do not possess visco-elastic properties
at the very low concentrations (e.g. 10 ppm to 50 ppm) at which they
are effective. They do, however, still possess a characteristic
{_. !D0lecular relaxation time (t1
)_, and this is used in a hypothesis- "
which proposes that the coiled macromolecules interact, possibly by
stretching, with turbulent eddies over the whole pipe cross-section.
An extension of this hypothesis is focussed in the wall region; this
proposes that interference with the generation and dissipation of
eddies occurS near the edge of the laminar (viscous) sub-layer. This
is thought of either as a thickening of the laminar sub-layer itself,
as in the correlations of Elata10 and Mayer11
, used later, or as a
modification and extension of the buffer layer, the laminar sub-layer
remaining unchanged, as proposed by Virk18 , 19. Virk renamed the
modified buffer layer the "elastic sub-layer!'. Byron et a1 20 present
evidence that absorption of PEO occurs on pipe walls leading.to a
thickening of the laminar sub-layer. In all these hypotheses
concerned with the wall region, the thickening of the viscous and/or
buffer (elastic) layer is a consequence of the interaction between
macromolecules and turbulent eddies, and is not itself the primary
cause of drag reduction in smooth pipe flow. No explanation has been
published for the effect of pipe roughness on Toms phenomenon, but
the following type of explanation seems likely. Following the onset
of drag reduction the turbulent flow of drag-reducing solutions in
rough pipes enters a regime in which behaviour is identical to that of
the same solution flowing in a smooth pipe of the same internal diameter.
This behaviour is analagous to the "smooth" behaviour of a rough pipe
with plain fluids below a certain value of Reynolds number (as discussed
previously). Since a thickened laminar/buffer layer is present due to
-the drag reducing processes occurring in both smooth and rough pipes,
the "smooth" behaviour of rough pipes is prolonged since the combined
laminar/buffer layer will not become thin enough to become comparable
to the height of the protrusions on the pipe walls until larger
Reynolds numbers are reached. When this condition is reached, form
drag begins to compete with the normal drag reducing processes and
.ultimately predominates. The effect of dilute drag-reducing solutions
- 5 -
on form drag has not been extensively studied, although White16
records
the observation that 30 ppm PEa increased the drag of a falling sphere
at Reynolds numbers greater than 2 x 10⁵ and James and _Gupta28 measured
increased drag on cylinders~t Reynolds numbers less than 300. ,The. role
of form drag in the ,flow of ~~g-reducing ~olutions, through rough pipes
is a topic which requires further investigation. ~t can be visualised
that at high enough Reynolds numbers all the drag-reducing eff~ct is
lost and this could be, an important limitation on the use of,drag
reducing additives i~ practical applications.
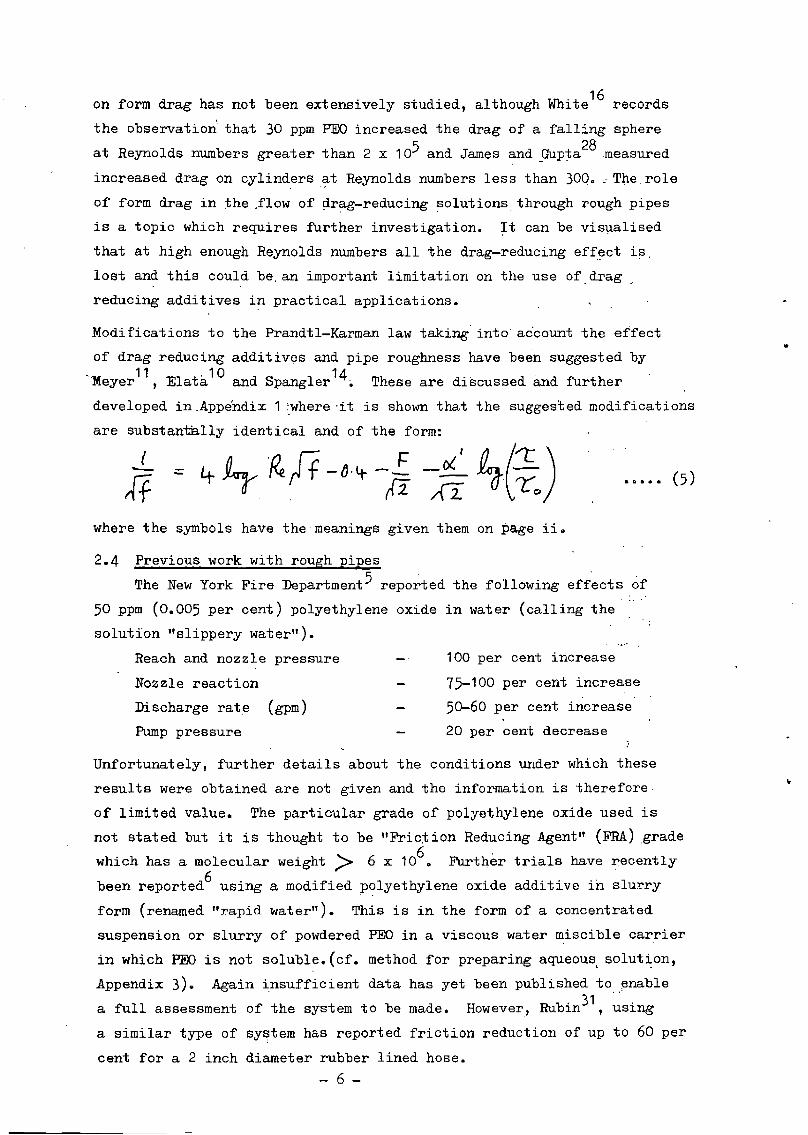
Modifications to the Prandtl-Karman law taking' into' account the effect
of drag reducing additives and pipe roughness have been suggested by.'V 11 .10 I 14 .illeyer ,Elata and Spang er ~ These are discussed and further
developed in Appe'ndir. 1 :.where -it is shown that the suggested modifications
are sUbstantally identical and of the form:
..
(-If ••••• (5)
where the symbols have the meanings given them on page ii.
2.4 Previous work with rough pipes
The New York Fire ~partment5 repo;ted the folloWing effects of....
50 ppm (0.005 per cent) polyethylene oxide in water (calling the
solution "slippery water").
Reach and nozzle pressure
Nozzle reaction
Discharge rate (gpm)
Pump pressure
100 per cent increase
75-100 per cent increase
50-60 per cent increase
20 per cent decrease
Unfortunately, further details about the conditions Ullder which these
results were obtained are not given and the information is therefore
of limited value. The particular grade of polyethylene oxide used is
not stated but it is thought to be "Fric:tion Reducing Agent" (FRA),grade
which has a molecular weight;> 6 x 10⁶• Further trials have recently
been reported6 using a modified polyethylene oxide additive in slurry
form (renamed "rapid water"). This is in the form of a concentrated
suspension or slurry of powdered PEO in a viscous water miscible carrier
in which PEO is not soluble.(cf. method for preparing aqueous, solut~on,
Appendix 3). Again insufficient data has yet been published to ~nable
a full assessment of the system to be made. However, Rubin31, uai.ng'
a similar type of sy~tem has reported friction reduction of up to 60 per
cent for a 2 inch diameter rubber lined hose.
- 6 -
There are three papers available in the literature to date in which
drag reduction in rough tubes has been investigated in some detai1 14,16, 17.
The conditions obtained in these experiments are summarised in Table 1.·
A common feature found by each investigator i~ the the tendency with
increasing Reynolds number (flow rate) for friction factor initially
to be reduced to a minimum value then for it to increase. towards the
value of ·friction fiictor for the pure solvent. The drag reducing effect.,
after reaching a maximum, tended to disappear~ very high flow rates.
Spangler14 demonstrated that this decrease in drag reduction was not
due, in the test rig used, to degradation of the polymer and was ther~
fore due to some other modification of the Toms phenomenon by the tube
roughness at high flow rates. White16 showed that guar gum had no , .drag reducing effect in rough pipes although PEa had. ·He also experimented
with jets of PEa solution discharing into tanks of the same solution
and noted a damping of small scale, high frequency turbulence by PEa
but not by guar gum. Virk17 used small bore (d,= 8.6 mm) pipes which
yielded results with the polymers used at or near the· maximum drag
reduction asymptote. White16 has pointed out that for PEa, a minimum
tube diameter of about 10 mm is necessary if reliable data for scale-up
purposes is required.
The results of these three workers are summarised in Figs 6 and 7 in
which friction factor (f) is plotted against Reynolds number (Re) on
the usual friction factor diagram.
3. EXPERIMENTAL
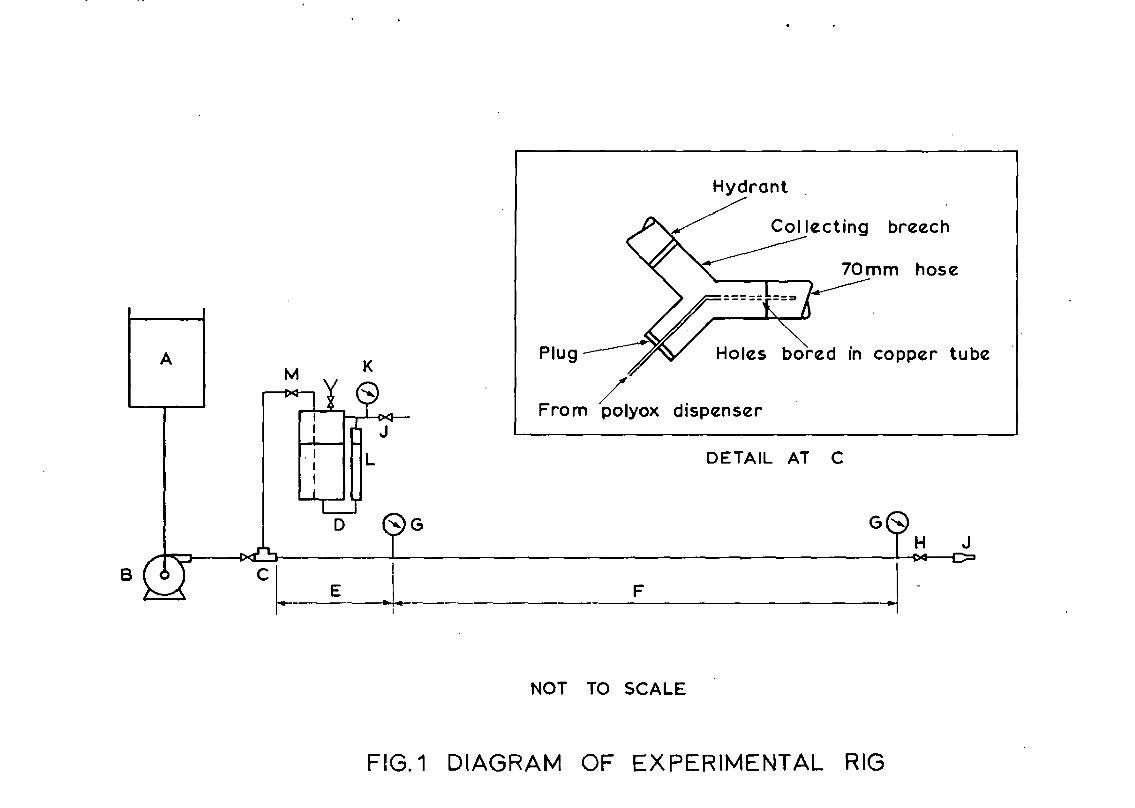
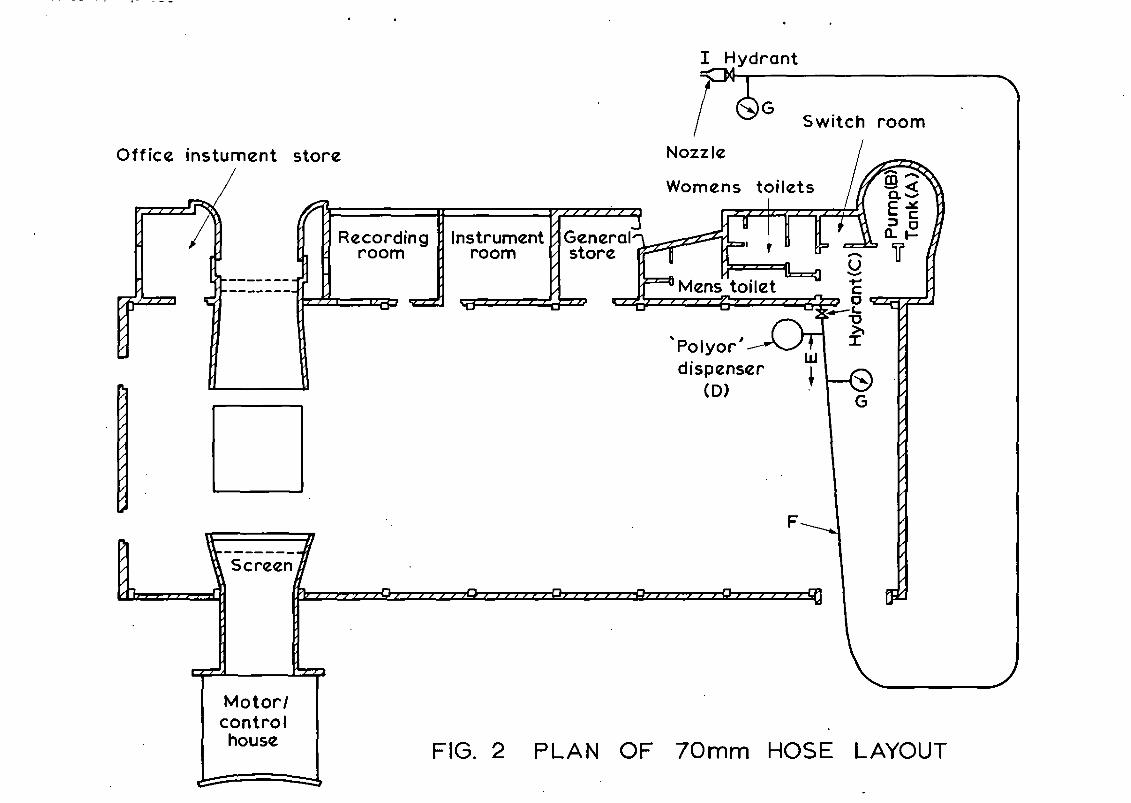
The equipment used in the present experiments is shown diagrammatically
in Figs 1 and 2. Water from a 27,300 dm3 (6000 gal) overhead storage tank,
(a) was pumped by a ·37 kW (50 H,P.) centrifugal pump (E) to a valved hydrant (C)
int~ which was plugged one inlet arm of a collecting breech. Concentrated
'Polyox' solution was fed from the polyox dispenser (D) into the mixing
length of hose (E) through a perforated copper tube (6.4 mm (0.25 inch)
diameter) introduced into the hose via the other inlet arm of the collecting
breech and held concentric with the outlet arm. The arrangement is shown
in· more detail in the inset in Fig. 1. The pressure drop across the test
length of hose (F) was measured by two pressure gauges (a), The flow rate
could be controlled either by the hydrant valve (C) or a valve (H) situated
at the end of the test length of hose. A nozzle (1) could be attached to
the end of the 70 mm hose for observing the effect of Polyox on water jets.
- 7 -
Flow rate was measured for the 70 mm hose by the fall in level of water in3the overhead tank. It was determined experimentally that 10 mm = 8.92 dm
(1 inch ~ 49.8 gal). For the 19mm hose, flow rates were measured by
collection in a 227 dm3 (50 gal) tank. For this tank 10 mm = 3.65'dm3
(1 inch = 2.04 ,gal).
The pressure drop across the test length of 70 mm hose was measured by2 . ,
means of two 0-1380 kN/m (0-200 psi) pressure gauges (G) connected to
pressure tappings made in special hose couplings. The couplings consisted
of a 200 mm (8 inch) length of 70 mm I.D. brass pipe to the ends of which
were welded standard hose couplings. The gauges were throttled to reduce
needle vibration. The pressure drop across the test length of 19 mm hose
was measured on two 0-413 kN/m2
(0-60 psi) gauges connected to "Tee"
connections at each end of the hose.
The,mixing length of 70 mm hose was 2.43 m (8 ft)long, equivalent to 35 pipe
diameters. The 19 mm hose test length was 16.5 m (54 feet) 870 diameters
and the 70 mm hose test length was 75.3 m (247 feet), 1008 diameters.
Concentrated PEa solutions were made up according to the method described
in Appendix 2 and held in the dispenser D. The concentration for experiments
with 19 mm hose was 0.02 per cent by weight and with 70 mm hose was 0.2 per
cent by weight. Compressed air was introduced at a constant pressure into
the dispenser via the valve (J) and the pressure was measured on the gauge (K).
The level of concentrated PEa solution could be measured by means of the
external level gauge (L). The flow rate of PEa was measured by level
difference. For the dispenser 10 mm =,0.365 dm3 (1 inch = 0.204 gal).
The flow rate was controlled by the valve (M). The water temperature
was 10oC.
Sone experiments were made in which a premixed solution ,of PEa in water
(at 30 ppm) was pumped through the test length of 70 mm hose using a small
transportable fire pump. A 1 per cent solution was made up as described
in Appendix 2 and this was diluted to 30 ppm in a 900 I (200 gal) tank
with gentle stirring. The diluted solution was fed to the pump from this
tank via suction hose.
- 8 -
•
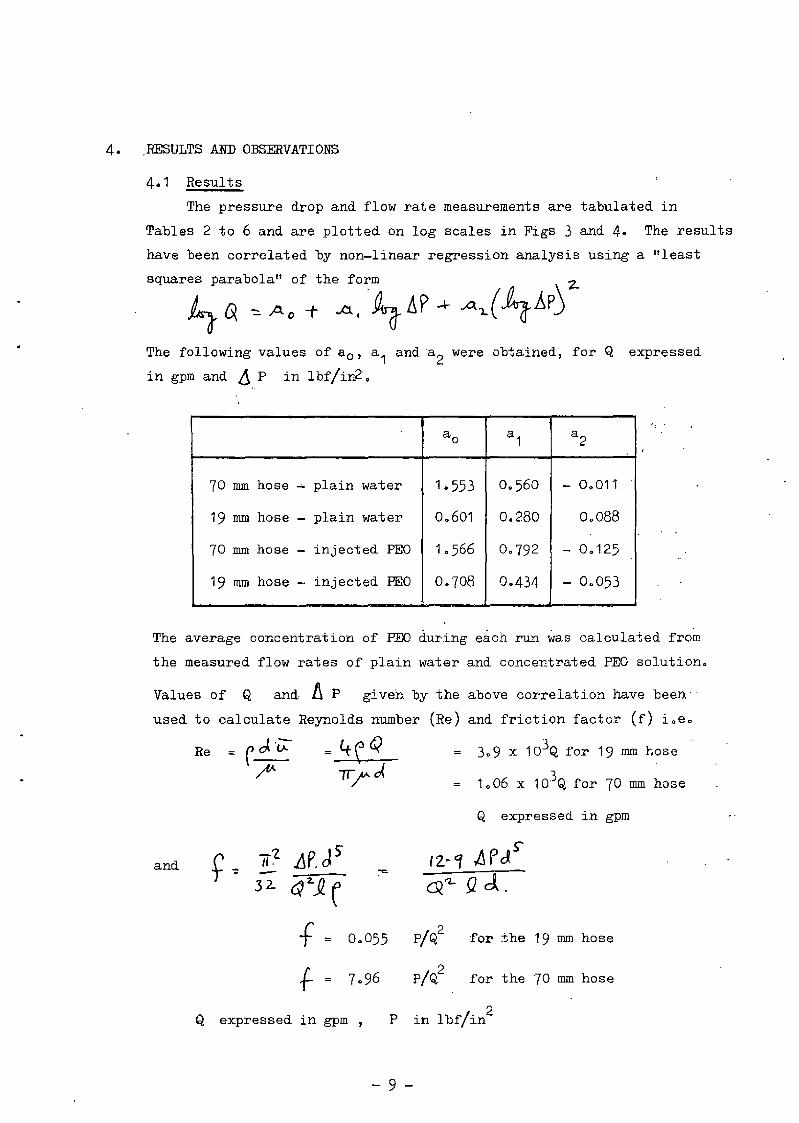
4. RESULTS AND OBSERVATIONS
4.1 Results
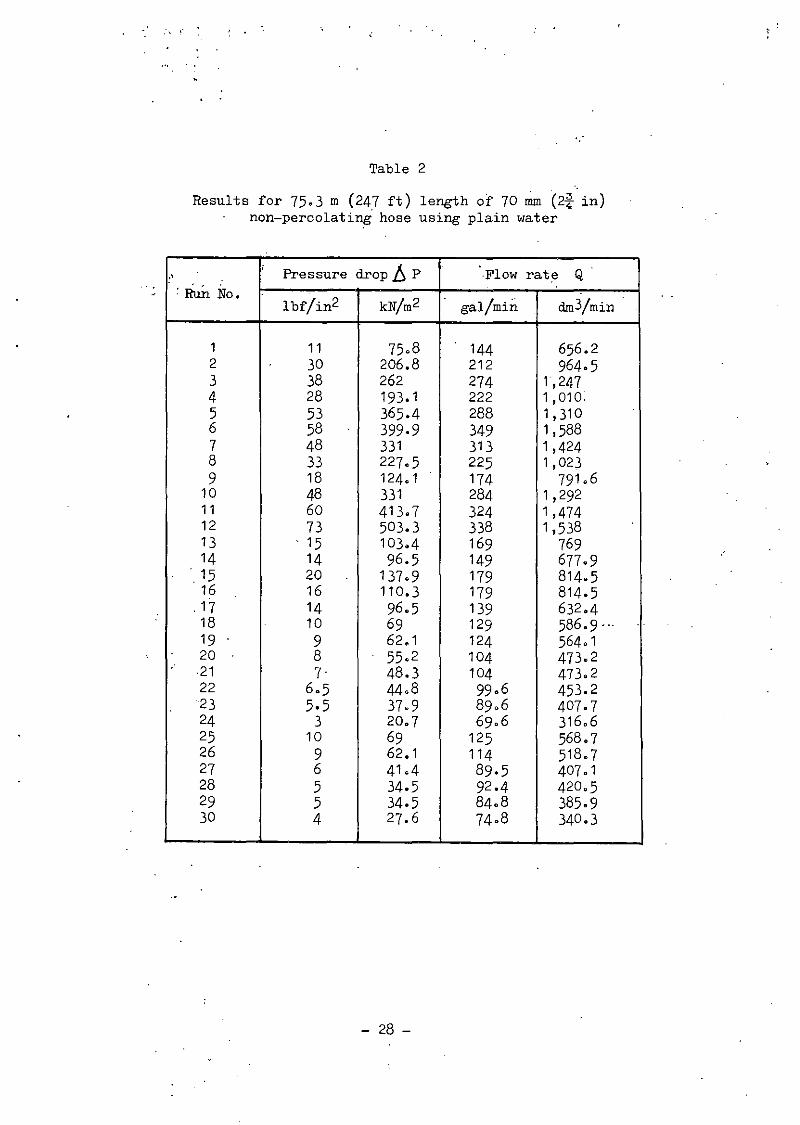
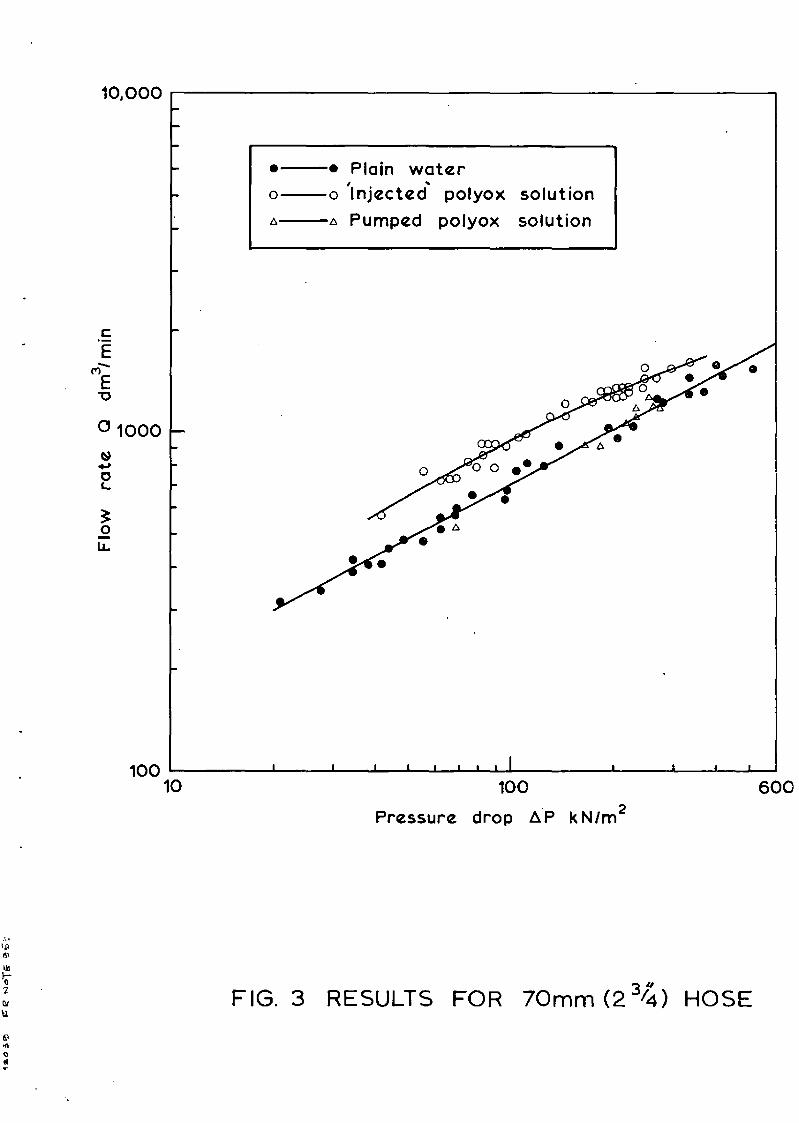
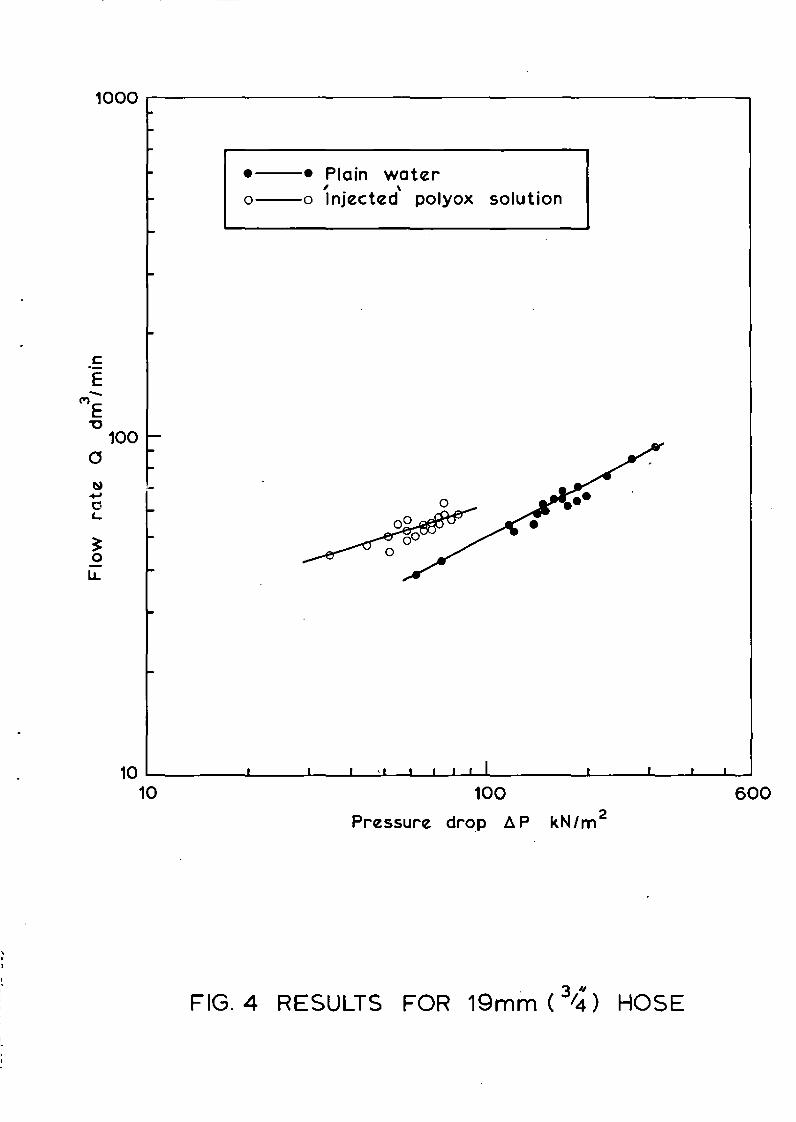
The pressure drop and flow rate measurements are tabulated in
Tables 2 to 6 and are plotted on log scales in Figs 3 and 4. The results
have been correlated by non-linear regression analysis using a "least
squares parabola" of the form 2-
~ Q, ~)to -t ..et.~ I1P -+ A,.(J,-AP)The following values of a o , a
1anda
2were obtained, for Q expressed
in gpm and ~ P in Ibf/in2 •
a o a1
a 2
70 mm hose -- plain water 1.553 0.560 - 0.011
19 mm hose - plain water 0.601 0.280 0.088
70 mm hose - injected PEO 1.566 0.792 - 0.'125
19 mID hose - injected PEO 0.708 0.434 - 0.053
': .
The average concentration of PEG during each run was calculated from
the measured flow rates of plain water and concectrated PEG solution.
Values of Q and 11 P given by the above correlation have been'
used to calculate Reynolds number (Re) and friction factor (f) i.e.
Re '"' rd. '~~
3.9 x 10³Q for 19 mID hose
1 0 06 x 103Q for 70 mID hose
Q expressed in gpm
and AP. dS'
~2.Jl. ff 0: 0.055
f 7.96
Q expressed in gpm ,
p/Q2 for :the 19 mm hose
p/Q2
for the 70 mrn hose
p in lbf/in2
- 9 -
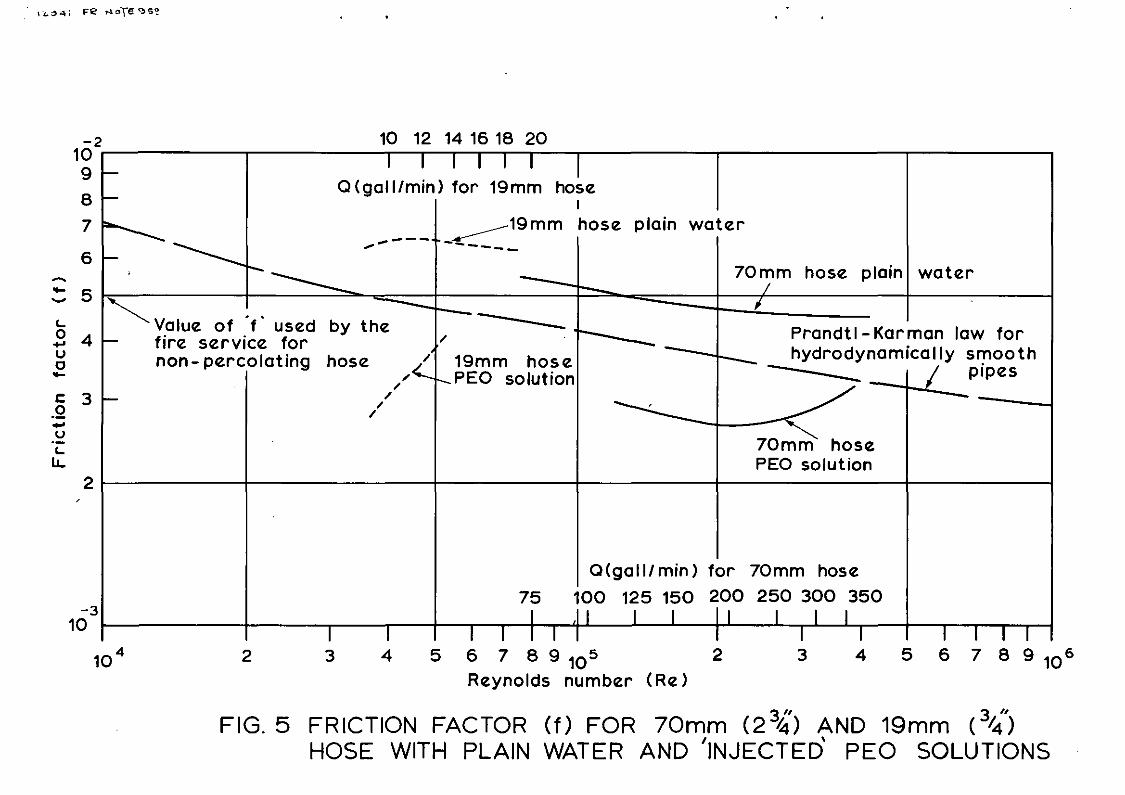
Friction factor (f) is plotted against Reynolds number (Re) in the
conventional friction-factor chart form in Fig. 5. Also included for
comparison are cufves for hydraulically smooth pipes and for pipes of
roughness ejd = 0.0006 taken from a Moody friction factor chart.
4.2 Observations
TIuring this work some incidental observations were made of'the
effect of PEa on the appearance of the water jet discharging from
a 19 mm (i inch) nozzle attached to the end of the 70 mm hose test
section. With plain water the jet had a white, opaque appearance and
produced a loud "hissing" noise. Break-up of the jet commenced between
0.5 and 1.0 m from the nozzle. When PEO,was added to the water at the
same flow rate, the jet became translucent (semi-transparent) enabling
objects held close to the jet to be distinguished on looking through
the jet. The noise level was much reduced and jet break-up was delayed
by several metres.
An observation was made similar to that reported by the Fire Department
of New York5• When PEO was added to plain water being pumped through
the 70 mm hose, the upstream pressure always fell and the pressure at
the end 'of the hose increased. It was therefore possible to increase
the upstream pressure to its original value, thus concentrating the
benefit of drag reduction in the form of increased pressure at the end
of the hose.
5. DISCUSSION
In these experiments the method used for injecting the "concentrated"
(0.2 per cent) PEa solution into the water flowing through the hose did not
allow exact adjustment of the final concentration. Although a final
concentration of 30 ppm was aimed for, the range of concentrations measured
in the experiments with 70 mm hose was approximately 10-50 ppm with an
average value of 23 ppm, the range and average value for the 19 mm hose
were 10-60 ppm and 33 ppm respectively. Within the ranges of concentration
used, there appears to be no correlation between reduction in friction
factor, PEa concentration and Reynolds number.
The readings of flow rate and pressure drop obtained are shown in Figs 3 and
4 together with the correlating curves obtained as described in Section 4.The results obtained in experiments where premixed PEa solution at a
concentration of 10-50 ppm was pumped through the 70 mm hose are shown in
- 10 -
Fig. 3. It can be seen that these results fallon the correlation for the
plain water results. It is clear from these results that under the conditions
in these experiments, the pump degraded the PEa solution sufficiently that
no subsequent friction reduction effect could be detected in 70 mm hose.
Two types of degradation are possible. Mechanical rupture of the long chain
molecules is possible due to the high shearing forces in the pump, thus
reducing the effective molecular weight of the polymer. It -has also been
suggested that degradation of the long chain molecule occurs by oxidation
which is accelerated by high intensities of turbulence, and that such
oxidative degradation can be countered by a suitable anti-oxidant additive.
Whatever the cause of the degradation, it is clear that at the present time
it presents serious operational limitations on the use of premixed PEa
solutions. For example, it would be convenient for some applications to
pump premixed PEa solutions from a 400 gal water tender. IUe to degradation
in the pump, this does not appear to be possible.
Figure 5 shows the correlated results for both hose sizes plotted as friction
factor (f) against Reynolds number (Re), on logarithmic scales. It can be
seen that friction factor is not constant, but varies with water flow rate.
Over the range of flow rates used the friction factor for 70 mm hose with
plain-water varies between 0.0054 (at 75 gal/min) to 0.0045 (at 350 gal/min).
The value given7, for non-percolating hose with plain water is 0.005. The
value of friction factor for 19 mm hose with plain water varied between 0.0062
and 0.0066. This higher level of friction factor is probably explained by
the different method of wall construction of 19. mm hose-reel hose. The
Prandtl-Karman correlation for hydrodynamically smooth pipes with Newtonian
fluids, e.g. plain water, has been included in Fig. 5 for comparison.
The range of flow rates used in these tests was not wide enough to reveal
the full extent of the variation of friction factor with Reyr.olds number
for the dilute PEa solutions. There are a number of features of drag
reduction, found by other workers, using both smooth and rough pipes, which
have not been measured in this investigation. Some of these features hold
important implications for the practical use of dilute PEa solutions in
fire fighting. These are:
1) A minimum shear stress (~) is required for the onset of drag. -
reduction. Below ~o , the behaviar of the solution is identical to that
of the solvent. In general the onset shear stress is inversely proportional
to the concentration and is also a function of certain properties of the
polymer, e.g. molecular weight. For a given polymer solution, the larger
11 -
the pipe diameter, the higher the Reynolds number at onset.
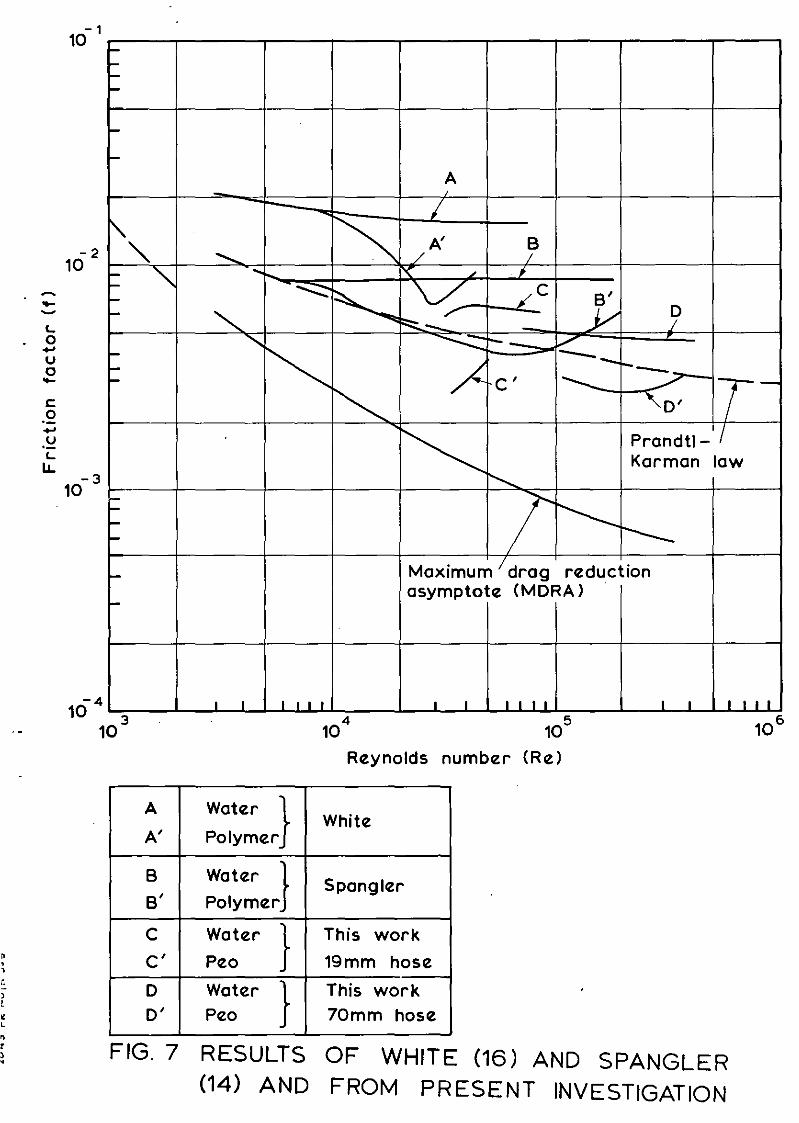
The results of White and Spangler for rough pipes are shown in Fig. 7,
together with the results of the present investigation. White's results
show onset occurring at a Reynolds number of 8 x 10³• Spangler's results,
for different experimental conditions, show onset at Re ~ 7 x 10³• Some
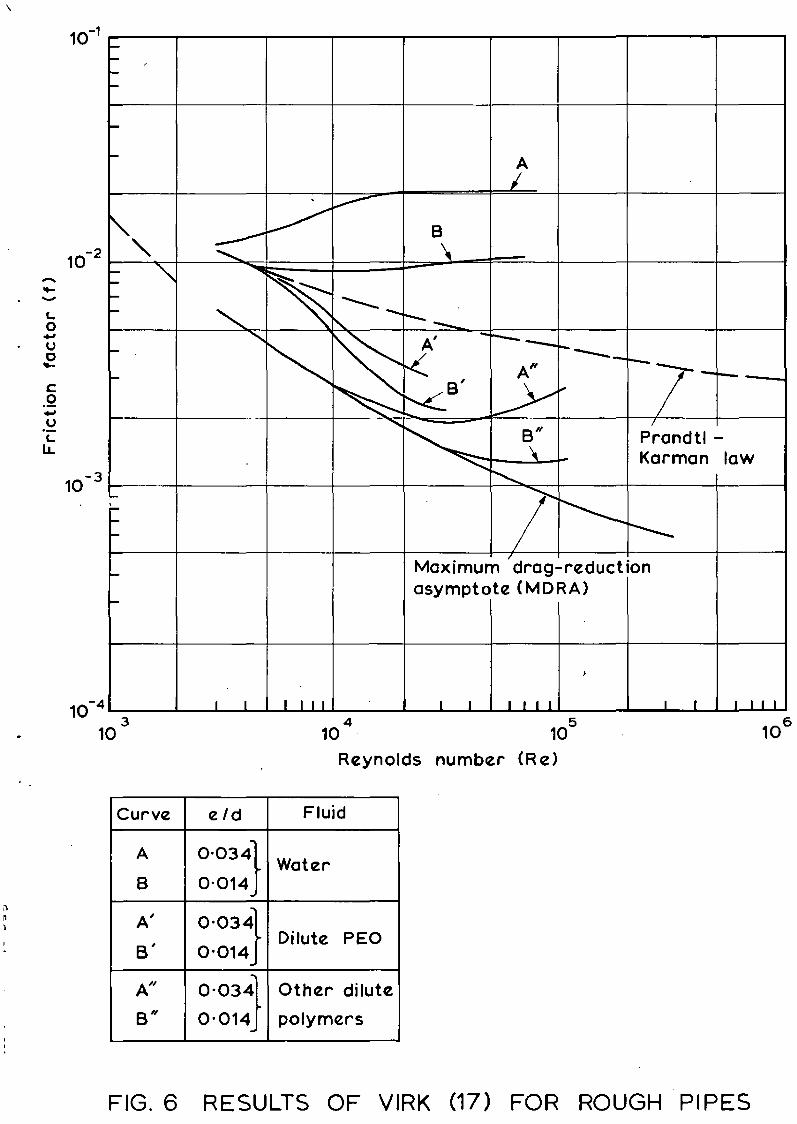
of Virk's results are summarised in Fig. 6. Virk's tube diameters were
small enough for ~ to be exceeded as soon as or soon after turbulent
flow was established (Re > 2000). Curves A and B are for water, AI and
B' for dilute PEO solutions and An Bn for other polymer systems which
yielded results partly coincident with the maximum drag reduction asymptote
(see below).
For dilute PEO solutions, Virk18,19 gives Ito as 7 dynes/cm2 which
corresponds to Re ~ 3.4 x 10⁴ (Q ~ 32 gal/min) for 70 mm hose and
Re ~ 7 x 10³ (Q ~ 2 gal/min) for 19 mm hose. Practical flow rates used in
hoses are such that it is almost certain that Reynolds number would be
beyond onset conditions for both hose sizes.
2) The Maximum Drag Reduction Asymptote (MDRA) represents the minimum
friction factor achievable under any conditions. Maximum drag reduction
is achieved only by the most effective polymers in small diameter pipes of
relatively short length. For smooth pipes the MDRA continues with a negative
slope (as shown in Fig. 6) as far as experimentation has yet been taken.
Virk shows that for rough pipes, the friction factor follows the MDRA for a
while before flattening and departing from the MDRA, at a point dependent
upon pipe roughness. It subsequently increases. (curves An, B" Fig. 6).
3) The existence of a minimum value of friction factor for the rough pipe
flow of dilute polymer solutions is an important feature of drag reduction.
A minimum value of friction factor for smooth pipe flow has been reported
only by Paterson and Abernathy25 who used relatively long (1700 diameters)
pipes of 0.248 inches internal diameter. They showed that degradation of
the polymer molecules occurred during turbulent flow in smooth pipes and
that the extent of this degradation was a function of both the wall shear
stress ( ) and the residence time in the wall region (distance along the
pipe). Other reported measurements with smooth pipes have been made with. . 27 . 26much shorter p1pes, e.g. V1rk (165 d1ameters) and Goren and Norbury
(420 diameters). In neither case was degradation observed, nor has
degradation occurred in other smooth pipe experiments in which the pipe
length has not been reported.
- 12 -
Reported experiments with "rough pipes" have all yielded a minimum value for
friction factor and extrapolation of the curves shown in Figs. 6 and 7 suggest
that at high enough Reynolds numbers, the drag reducing effect would no longer
operate. For the 70 mm hose this would occur at a Reynolds number of about
5 or 6 x 10⁵ (Q 500 gal/min), and about 7 or 8 x 10⁴ for 19 mm hose
(Q:::: 20 gal/min). This would present a limitation for 70 mm hose only at very
high pumping rates. The maximum operational flow rate used with 19 mm hose-reel
hose is of the order 25 gal/min. It can be seen, from Fig. 5, that the friction
factor for PEa treated water, with 19 mm hose, increases with flow rate over
the useful range and, if the results are extrapolated, becomes identical to
that for plain water before the maximum rate is reached. Thus there appears
to be a limitation to the usefulness of PEa when used with 19 mm hose-reel hose.
It is clear that two factors contribute to the increase in rough pipes of friction
factor at high Reynolds numbers. The predominant factor is the pipe roughness
itself and this mechanism has been discussed in Section 2.4. This factor
operates in all rough pipes, but in addition in pipes of high length/diameter
ratio, the possibility exists of polymer degradation. Paterson and Abernathy
demonstrated that if the wall shear stress (~) and residence time (length/
diameter ratio) are appropriate, polymer degradation can occur during
turbulent flow, even in hydrodynamically smooth pipes. Since, for a given
Reynolds number, the wall shear stress (It) is higher in a rough pipe than
in a smooth pipe, polymer degradation can be expected to be a feature of
turbulent flow in rough pipes. The results of Paterson and Abernathy indicate
that significant degradation did not occur below a wall shear stress of the
order of 50 to 100 dynes/cm2 for smooth pipes of lid ratio 670 and 1700.
In the 70 mm hose (l/d ratio 1008) a wall shear stress of 50 dJn1e/cm2
correqvnds to a Reynolds number of 1.3 x 10⁵ and a value of 100 dyne/cm2
to 1.9 x 10⁵• Although no attempt was made in the experiments to measure
the extent of any degradation, it can be expected that some degradation did
occur during flow through the hose.
As indicated above in Section 2.3 a correlation has been established between
the friction factor (f) and Reynolds number (Re) for the turbulent flow of
drag reducing solutions in rough pipes which takes into account the roughness
of the pipe and certain properties of the solute. The factors can be
combined in a function delta (~) which represents the modification to the
Prandtl-Karman correlation by pipe roughness and a drag-reducing solute.
- 13 -
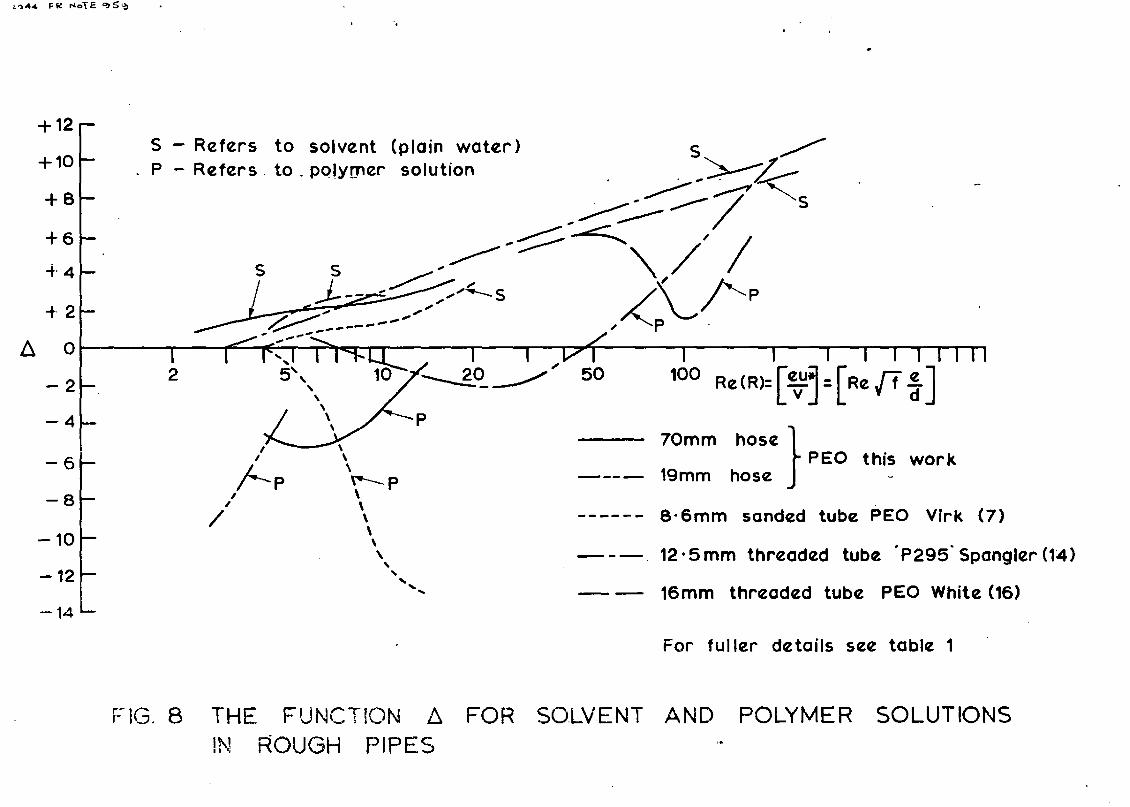
The function!J is derived in Appendix 1 and is defined by the following
equations,I
It ••••• (6)
'"
I L (~_)..L\ :: F - 0< -.a- L ...
where the symbols have the meaning given them on page ii.
The function.6 has been calculated and is shown plotted versus the
dimensionless roughness height e* or roughrless Reynolds number (Re(R) )
(= ReFe/d) in Fig. 8 •
: Ll has also been calculated from the results given by Virk17, White16 and
Spangler14 and their results, expressed in this way, are also shown in Fig. 8.
In this graph curves for plain water are seen t'o lie close together. If
the physical nature of the different pipe r-oughnessee had been identical it
is to be expected that the curves would have been coincidental. For plain
water the function 11 is identical to the Newtonian roughness function, ,FN'(see Section 2.3.2). neparture from the plain water curves towards lower
values of .6 indicate a decrease in drag. A value of •Ll = a corresponds
to an hydraulically smooth pipe. Negative values of .d indicate drag
lower than that shown by an hydr-au.l.t.caLly smooth pipe. The range of
conditions investigated was not wide enough to ,show the full range of
variation of 11 with Re(R), but the graph underlines the features discussed
above in connection with Figs. 6 and 7;
It is clear that further detailed study (see Section 7) over a wider range
of conditions is necessary in order to explore fully the ranges of applic
ability and the limitations of PEa in practical fire-fighting. As well as
further laboratory studies, similar to those described herein, experience
needs to be gained in the use of PEO with operational fire fighting equip
ment. As explained above, the direct pumping of dilute premixed PEO
solutions does not appear feasible at least under the conditions of these
experiments. Some means is required for introducing concentrated, PEO
solutions or suspensions directly into fire hose downstream of a pump.
This would involve a flow sensing device, contributing negligible
pressure loss, situated in the hose and coupled to some means of injecting
the concentl>ted PEa "pro rata" into the hose. The development of such
equipment is a priority requirement if a meaningful operational assessment
of PEO is to be made.
- 14 -
The observations made of the apparent reduction in turbulence in a water
jet with PEa additive are in line with those of White16 who used a
19 mm (~ inch)jet to demonstrate that certain polymers, including PEa,
suppress small scale high frequency turbulence in jetso In water jets, it
is clear that PEa tends to reduce turbulence, at least in the surface layers
of the jet. The opaque appearance' of the jet is due to the rippling and. .' \
distortion 'of the surface of the, jet by small fluid "part:lcles -moving r';'d~ailY
by turbulent diffusiono Indeed many of the fluid particles penetrate the
surface to form a mist of fine droplets which can be observed surrounding
the jet. As soon as a deformation appears in the jet surface, it will tend
to be accentuated due to air resist~~ceo This is an accelerating phenomenon
and the jet will become unstable and break upo Clearly, a reduction in
turbulence will attenuate the disturbance of the jet surface arid enhance
the coherence of the jeto This aspect of the use of friction reducing
additives requires further investigation.
6. APPLICATIONS TO FIRE FlGmING
Fabula23 has discussed the benefits which might result from the use of
friction reducing additives in fire fighting operationso His predictions
are based upon Virk's 18 Maximum Drag Reduction Asymptote (MDRA)o The
present work has shown that friction factors for fire hose do not approach
the low levels of the MDRA and therefore any predictions based on the MDRA
will tend to overestimate the effects of fricti.on reducing additiveso
Although little has so far been published on the Fire Department of New
York trials, the implication of the data available is that friction factors
for 1t inch rubber lined hose can be reduced to 0.002 or belowo
The results reported in this note show that under the flow conditions reported,
the friction factor of 70 mm non-percolating fire hose is reduced from
0.005 to 0,0027, a reduction of 46 per cent. Further tests are expected
to show similar benefits for other hoses and improved injection techniques
may well bring further improvement. Important limitations on the amount
of benefit gained at very high flow rates have become apparent, but assuming
that reductions of this order can be achieved with all hose and other types
of pipe work used by Fire Brigades, some idea of the advantages of PEa,
or similar substances, for practical fire-fighting use can 'be obtainedo
- 15 -
Assuming that further friction reduction will be possible by the use of
improved techniques, the following estimations are conservative.
In general, PEO will be of use in situations where the desired effect,
usually the "throw" of a water jet or flow rate of water pumped, is limited
'by large pressure losses due to friction in the hose or pipe. Particular
examples are the pumping of water through open ended hose or large bore
monitor operation. Particular examples can now be given.
6.1 Water relaying
The Manual of Firemanship7 gives values of the optimum distance
over level gr~und for a pump working at a pressure of 100 lbf/in2
and'discharging 350 gpm. 'The optimum distances for water treated with
PEa have been calculated and are shown for comparison below.
Pumping distance (ft) Per cent, Hose arrangement increase
Plain water PEa treated water in distance
Single ~ in non-percolating 350 650 864
Twin " '" " " 1 ,400 2,600 86
It is therefore possible to pump PEO-treated water a given distance using
only one pump where it would be necessary to use two pumps with plain
water. Alternatively, it would have required a higher pump pressure of
185 Ibf/in2• Since pumping PEa solutions destroys the friction-reducing
effect, it is not possible to use two pumps in relay with PEO-treated
water unless more PEa is added after the second pump.
6.2 The Glasgow "Scoosher"
This appliance uses 2 inch copper pipe, 45 ft on the chassis and
37 ft on the boom, a total of 82 ft. The pump pressure is 100 lbf/in2
and the water flow rate approximately 200 gpm. Copper pipe of plumbing
quality is almost hydraulically "smooth" and therefore has a friction
factor (f) of 0.0037 at this flow rate (see Fig. 3).
Using equation (3) the pressure drop due to friction is 32 lbf/in2•
If the boom is in the vertical position, there will be an additional
pressure loss due to static head equal to 16 lbf/in2•
The total
pressure drop is 48 lbf/in2 and the nozzle pressure is therefore
52 lbf/in2• If PEa were added to the water, the friction factor may be
- 16 -
loss of
resulting in aleast to 0.002 and probably lower,, 2 '
loss of' 17 Ibf/in , making a total
expected to fall at
frictional pressure, '2
33 Ibf/in. The nozzle pressure, if pump pressure is maintained at
100 psig, would be 67 Ibf/in2', which is an increase of .about 30 per cent.
has
pump performance when added either'
the water supply from the primary
the :friction factor of 4,inch suction hoseJ' • .. ',.' • • ~
It is difficult, therefore, at this stage, to
6:3 ~jector pumps.
t" ,,:';;;,;":T!lEl';~frect '-of PEa. on:.' ~ ~_1:,..::....~:t( .~.l/.Y::';, -:; .'. I:' ".,: riot':ye-t~'beim determined.
~ ". .,predict the effect of PEa or ejector
'[ ~.
tq'the water to be remov~d and/or to
The addition of PEO to the water
p~~mary pump may be advantageous
pump",' .
If the suction lift is 20 ft and the barrier height is 5 ft then the
',tdt'ai :pressure' drop to be overcome is about 9 Ibf/in2 over the suction
, he'~ghi and 2 1bf/in2, over the barrier24• If the pump is removing,
wat~rCat a rate of 100 gpm then assuming a friction factor of 0.02
,for,4 inch suction hose with plain water, the pressure drop due to
fr:iction.~s, about:0.3 Ibf/in2• This is not significant when compared
with ~he'pressure loss due to the head of water and no significant.. .advantage, could be gained by adding PEa to the water to be removedo
supplied to the ejector pump by the
if the primary pump 'has to be positioned
s6me' considerable distance from the 'ejector pump, in that a higher
pr~;s~re and hence suction may be attainedo
.6'~,4 'Fire ,nozzle performance
The vertical height reached by the main body of a fire fighting'. 29
, wate~:, ?et was first measured by Freeman • He expressed his results as
",.~ ,-, ...,
'......." "
H ..... (8)
,"", ".' '.:. .
,.' ~:.
" -. } :'-~. ~," 1-1 • ~. ..,
H is the height of the jet in feet
P' is the nozzle pressure in Ib/in2
N
~ , is the nozzle diameter in inches
K' is a fac~or in the range 0.65 to 1.0 depending upon PN
-17-
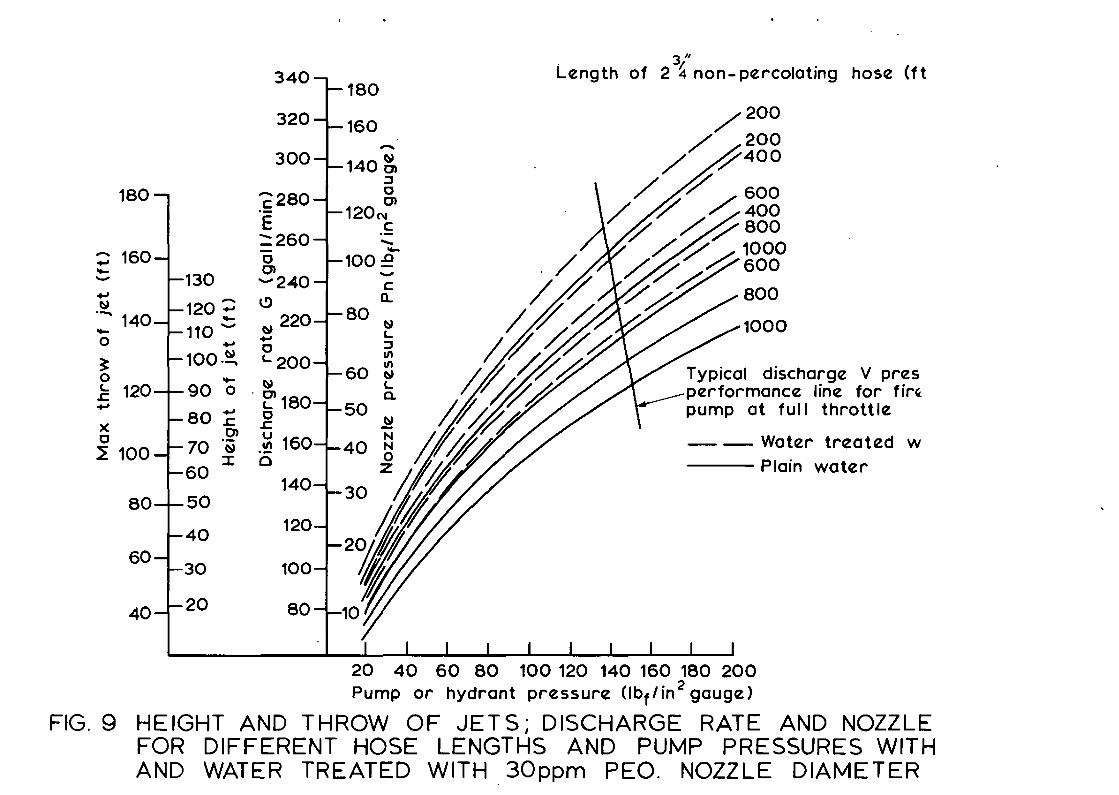
The formula given in the Manual of Firemanship7for calculating the
height of fire fighting je+'s is identical to Freeman's but with a
value of 0.67 for K However, the data used in the following
illustrations of the effects of friction reducing additives on nozzle
and pump pressures, height and range of jets is based on the work of
Blair30• Blair measured both the height and range of jets and his
results are shown in graphical form. This data has been used because
it appears to be the only relatively recent measurements of both
height and range using nozzles similar to those in current use in the
Fire Service. Blair's results for a one inch diameter nozzle correspond
to a value of 0.85 for K in Freeman's formula. The illustrative data
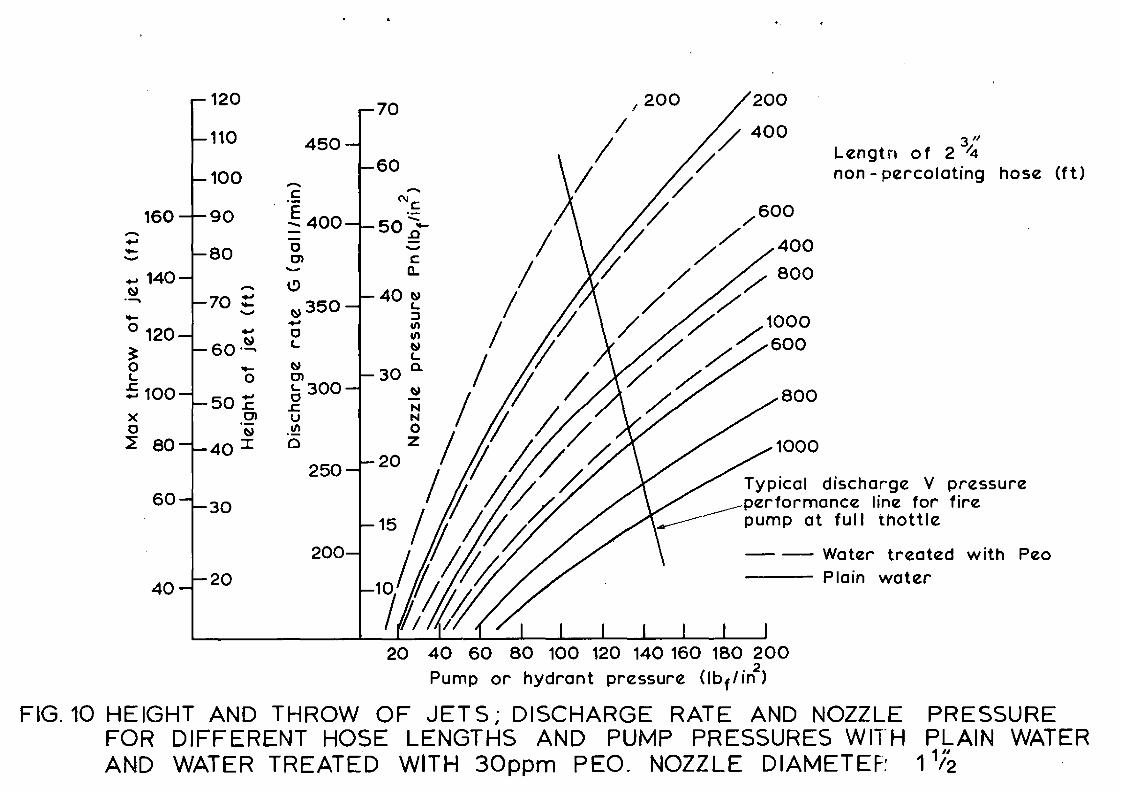
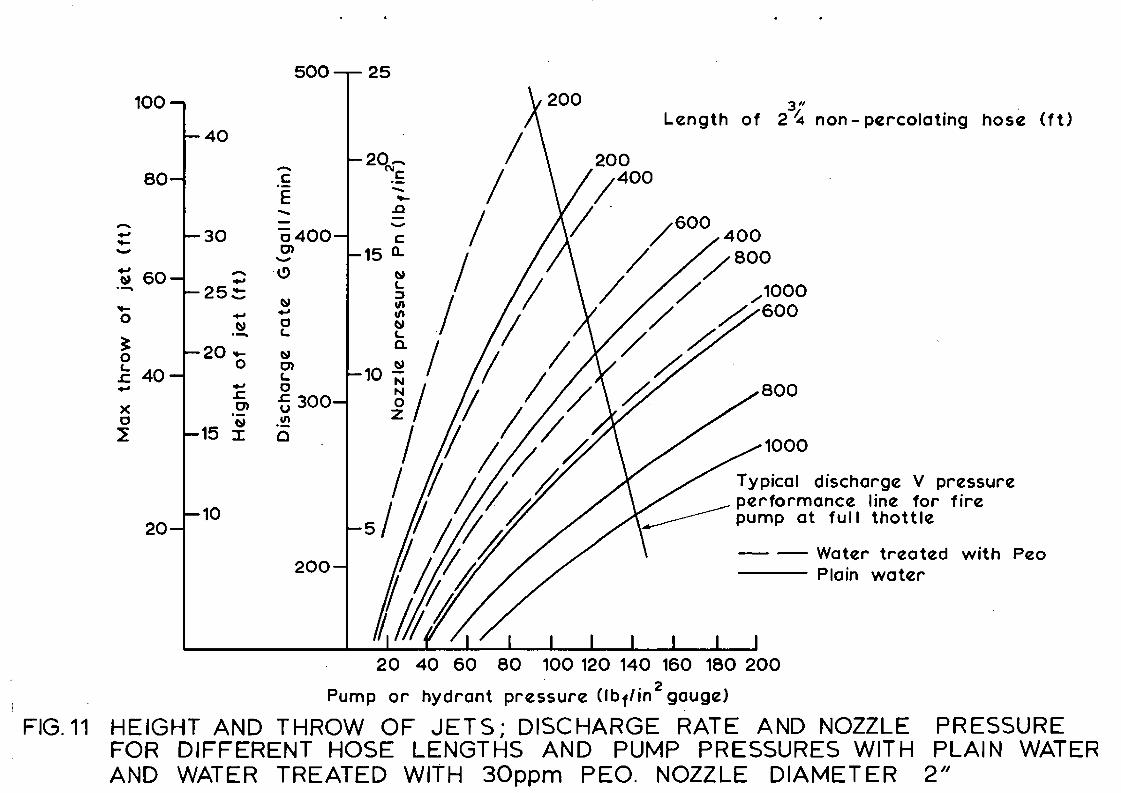
is shown iiI Figs 9,' JO a."ld 11, for 1, 1t and 2 inch diameter nozzles
respectively. The effect is shown of 70 mm non-percolating hose in
lengths of between 200 and 1000 ft at pump pressures up to 200 Ibf/in2
on nozzle pressure, discharge rate, height and ra."lge of jets, for
both plain water and water treated with 30 ppm of PEa. Co~stant value
for friction factor for the hose of 0.005 and 0.0027 for plain and
treated water respectively have been used in the calculations. Super
imposed on the figures is a discharge rate v. outlet pressure operating
line for a typical centrifugal fire pump at full throttle setting.
For example, in Fig. 9 , it is seen that a pump operating at 150 Ibf/in2
can pump 190 gal/min of plain water through 1000 ft of 70 mm hose?
ending in a one inch nozzle. The nozzle pressure would be 58 lb/in-.
The height of a vertical jet would be 92 feet and the maximum range
112 feet. With 30 ppm PEa in the water the flow rate would rise to
218 gal/min, the nozzle pressure would increase to 75 Ib/in2• The
height of a vertical jet would increase by 20 fee+' to 112 feet (equiv
alent to increase in reach of two storeys). The maximum range of a
jet would increase by 16 feet to 138 feet. The pump pressure would
decrease by 10 Ib/in2 to 140 Ib/in2• If the pump had not been operating
at full throttle, this could have been increased to restore the pump
pressure to 150 Ib/in2
; the discharge rate, nozzle pressure, jet height
and maximum range would have then increased further. Further examples
can be worked out in a similar manner' using Figs 9, 10 and 11.
- 18 -
7• mx:: OMMENllATI ONS
In view of the results obtained in these preliminary experiments,
the following items need further investigation.
1) Measurement of friction factor for 70 mm non-percolating fire hose
beyond the range of Reynolds numbers so far encountered, i.e.
down to 104 and up to 106•
2) Further measurements of friction factor with 19 mm hose-reel hose.
3) Measurement of friction factor for other types of hose, e.g.
unlined hose, suction hose, 45 mID (1~ inch) and 85 mm (~ inch) hose.
4) The effect of method of introduction of the concentrated PEO
solution into fire hose, i.e. whether at hose axis or at the
walls and the determination of the length of hose required for
complete mixing of the PEa solution with the water.
5) The effect of PEa on the production of sprays and fogs from
jet/spray branches and fog nozzles.
6) The effect of PEa on the coherence of water jets.
7) The effectof hose length on the performance of PEO, i.e. polymer
degradation during turbulent flow in the hose.
8) The development of a system for introducing PEa into fire hose
on the fire ground.
9) Alternative friction-reduci!lg additives.
8. ACKNOWLEllGMENT
Mr R Proberts assisted in the experimental work.
9. REFERENCES
1. TOMS, B A. 1948 Proc 1st Int. Congress on Rheology. Vol 2, P 135,
North-Holland Publishing Co., Amsterdam.
2. HANJl, J A and WILLIAMS, M C. Nature, 227 (1970) 369.
3. ELLIS, H D. Nature, 226 (1970) 352.
4. HAWKRITIGE, H R J and GATID, G E. Natu r-e , 230 (1971) 253.
5. Fire Engineering 122 (1969) 48 and BRODY, M. Fire Interr~tional (No 27) 23.
6. BRODY, M. Fire Chief Magazine, Feb 1971. 19.
7. Manual of Firemanship, Part 3. Home Office (Fire Department). HMSO (1968).
8. SCHLICHTING, H. Boundary layer theory. McGraw Hill, 1960.
9. COULSON, C A and RICHARDSON, J F. Chern. Engr-, Vol 1. Pergamon Press.
9A. WELLS, C S (ed) Viscous drag reduction. Plenary Press, 1969.
- 19 -
10. ELATA, C, LEHREV, J and KAHANOVITS, A. Israel J. Tech. i (1966) 84.
11. MEYER, WA. A.I.Ch.E.J. ~ (1966) 863.
12. :ROTIRIGUEZ, J M, ZAKIN J L and PATTERSON, G K. Soc. Petro Eng, J. I(1967) 125.
13.13A.
14.
SEYER, F A and METZNER, A B. Can. J. Chern. Eng. 12 (1967) 121.
GORDON, R J. The Chemical Engineering Journal ~ (2) 1971, page 137.
SPANGLER, J G. in Viscous drag reduction. Ed. Wells, C S. Plenum
Press (1969) p 131.
15. HERSHEY, H C et al. Chern. Eng. Sci. 22 (1967) 1847.
16. WHITE, A. in Viscous drag reduction. Ed. Wells, C S. Plenum Press
1969. p 297.
17. VIRK, P S. J. Fluid Mech. i2 (2) (1971) 225.
18. VIRK, P S, MICKLEY H S and SMITH, K A. Trans. A.S.M.E. (J. Appl.
Mech.) 1I (2) (1970) 488.
19. VIRK, P S. J. Fluid Mech. i2 (3) (1971) 417.
20. BRYSON, A W, ARUNACHALAM V R and FULFORD, G D. J. Fluid,Mech. 1971 il(2) 209.
21. NASH, P. Inst. Fire Engrs ~art. April/June 1958. p 2.
22. FRY, J F and LUSTIG, R E. Fire Research Note 492 (1963)
23. FABULA, A G. Trans. A.S.M.E. (J. Basic Engineering) 1971. 93 (3)
453-5·
24. ROSEN, M Wand CORNFORD, N E. Nature 234 (5323) 1971. 49.
25· PATERSON, R Wand ABERNATHY, F H. J. Fluid Mech. (1970).il (part 4)
pp 689-710.
26. GOREN, Y and NORBURY, J F. Trans. A.S.M.E. (J. Basic Engng) Paper 67-WA/
Feb 1967.
27. VIRK, P S, MICKLEY, H S and SMITH K A. Trans. A.S.M.E. (J. Appl. Mech.)
37 (2) June 1970 p 488.
28. JANES, D F and GUPTA, 0 P. Drag reduction. Chern. Eng. Progress
Symposium. Series No 111 Volume 67 1971. page 62.
29. FREEMAN, J R. Experiments relating to hydraulics of fire streams.
Trans. Amer. Soc. Civ. Engrs Vol 21 (1889) 303.
Inst. Civ. Engrs
Collected papers
Journ.BLAIR, J S. Characteristics of fire jets.
12 (8) 1941 354-80 reprinted by Inst. Fire Engrs.
Vol 3 Part 2.
31. RUBIN, H. Drag reduction application in fire fighting systems.
Journ. of Sanitary Engineering Division. Proc. Amer. Soc. Civil Engrs.
30.
Feb 1972.- 20 -
APPENIJIX 1
FRICTION FACTOR CORRELATIONS
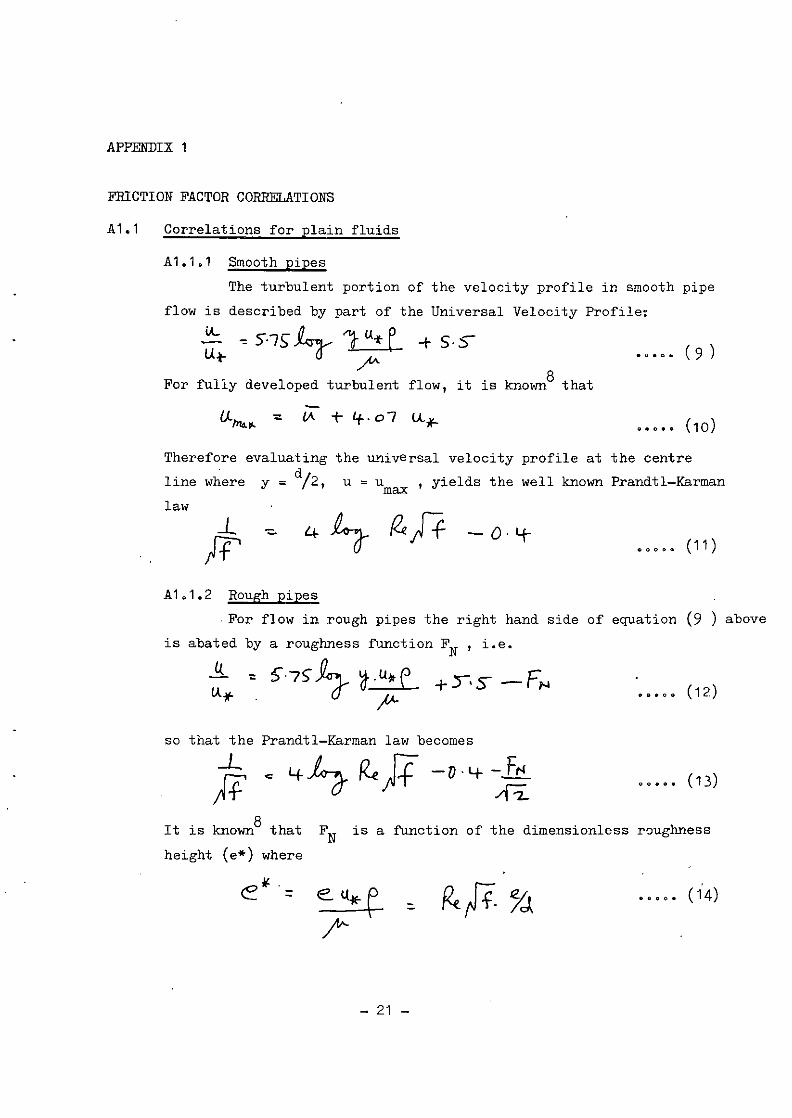
A1.1 Correlations for plain fluids
A1.1.1 Smooth pipes
The turbulent portion of the velocity profile in smooth pipe
flow is described by part of the Universal Velocity Profile:
~ -= 5-75 Q- . ') (.Ii- ~ + 5-S-u... ~a ~
For fully developed turbulent flow, it is known8 that
Therefore evaluating the universal velocity profile at the centre
line where y = d/2, u = u ,yields the well known Prandtl-Karmanmax
law
4~ ~)f -O-lf-..... (11)
A1.1.2 Rough pipes
For flow in rough pipes the right hand side of equation (9 ) above
is abated by a roughness function FN ' i.e.
'" 5.7S"~ ~-lI*e +Y.s -F~)/--
so that the Prandtl-Karman law becomes
( 12)
00 ••• (13)
It is known8 that FN is a function of the dimensionless roughness
height (e*) where
=-
- 21 -
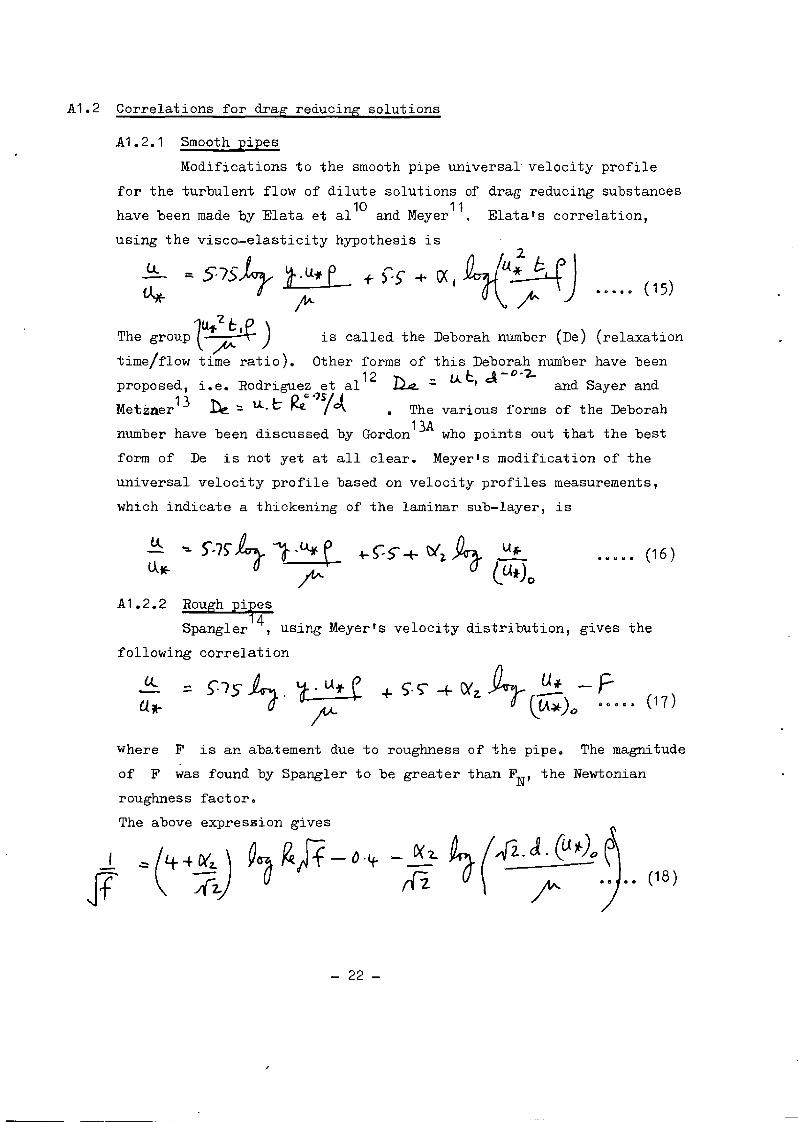
A1.2 Correlations for drag reducing solutions
A1.2.1 Smooth pipes
Modifications to the smooth pipe universal velocity profile
for the turbulent flow of dilute solutions of drag reducing substances10 11
have been made by Elata et al and Meyer . Elata's correlation,
using the visco-elasticity hypothesis is2
~ 5-75 L ~~"L f- r" ... rx I L,1~;1)~ /¥v;v j_ ~ /_ ••••• (15)
The grouplU~{) is called the Deborah number (De) (relaxation
time/flow time ratio). Other forms of this Deborah number have been12 r-, :::. lA.t
l&-0-2-
proposed, i.e. Rodriguez et al ~ and Sayer and13 ",; u.. L- 0 «os] ,
Metzner ~ \,. N. f 0\ The various forms of the Deborah
number have been discussed by Gordon 13A who points out that the best
form of De is not yet at all clear. Meyer's modification of the
universal velocity profile based on velocity profiles measurements,
which indicate a thickening of the laminar sUb-layer, is
••••• (16)
A1.2.2 Rough PiT~s
Spangler ,usir~ Meyer's velocity distribution, gives the
following correlation
•• (18)
Where F is an abatement due to roughness of the pipe. The magnitude
of F was found by Spangler to be greater than FN, the Newtonian
roughness factor.
The above expression gives
I
IF
- 22 -
/
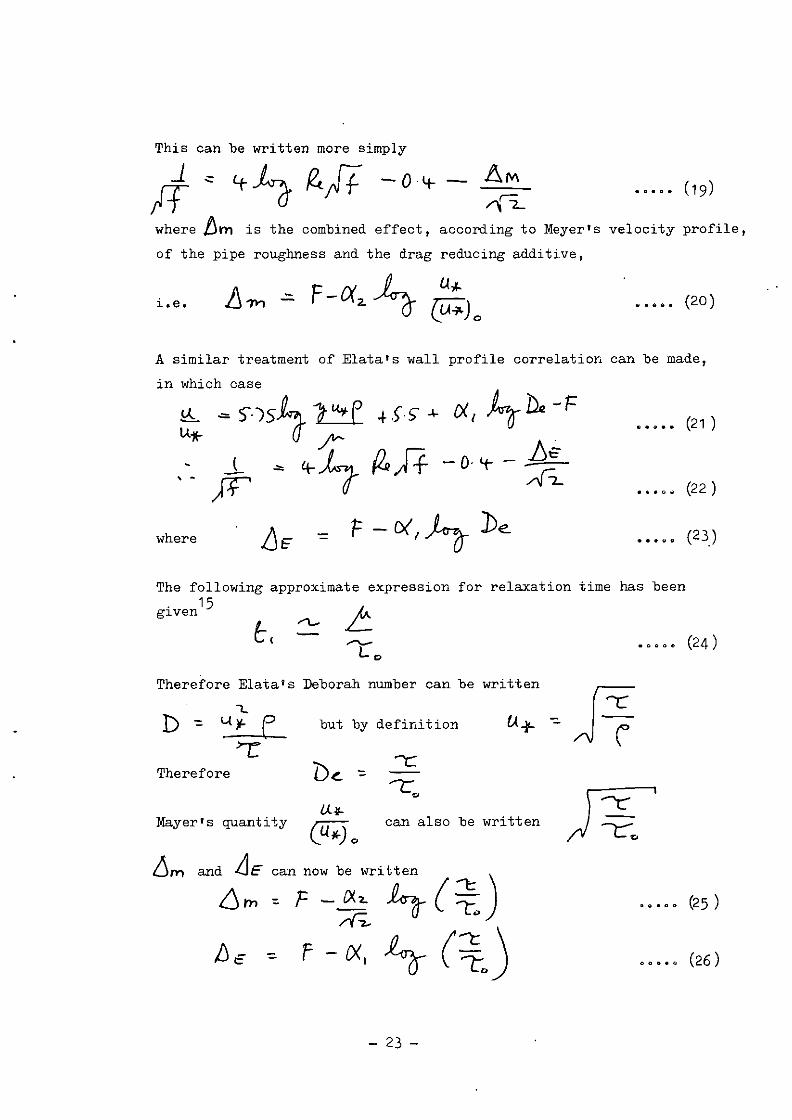
This can be written more simply
J .-::rrwhere fJm is the combined effect, according to Meyer's velocity profile,
of the pipe roughness and the drag reducing additive,
i.e. • •••• (20)
A similar treatment of Elata's wall profile correlation can be made,
, .
where
The following approximate. 15
g~ven
• • • •• (21)
(22 )
(23)
expression for relaxation time has been
••• •• (24)
Therefore Elata's neborah number can be written
...b -= ~ but by definition (Ai'-
-r --CTherefore b~ -=
'"1:'",
can also be written
• • • •• (25)
•• ••• (26)
- 23 -
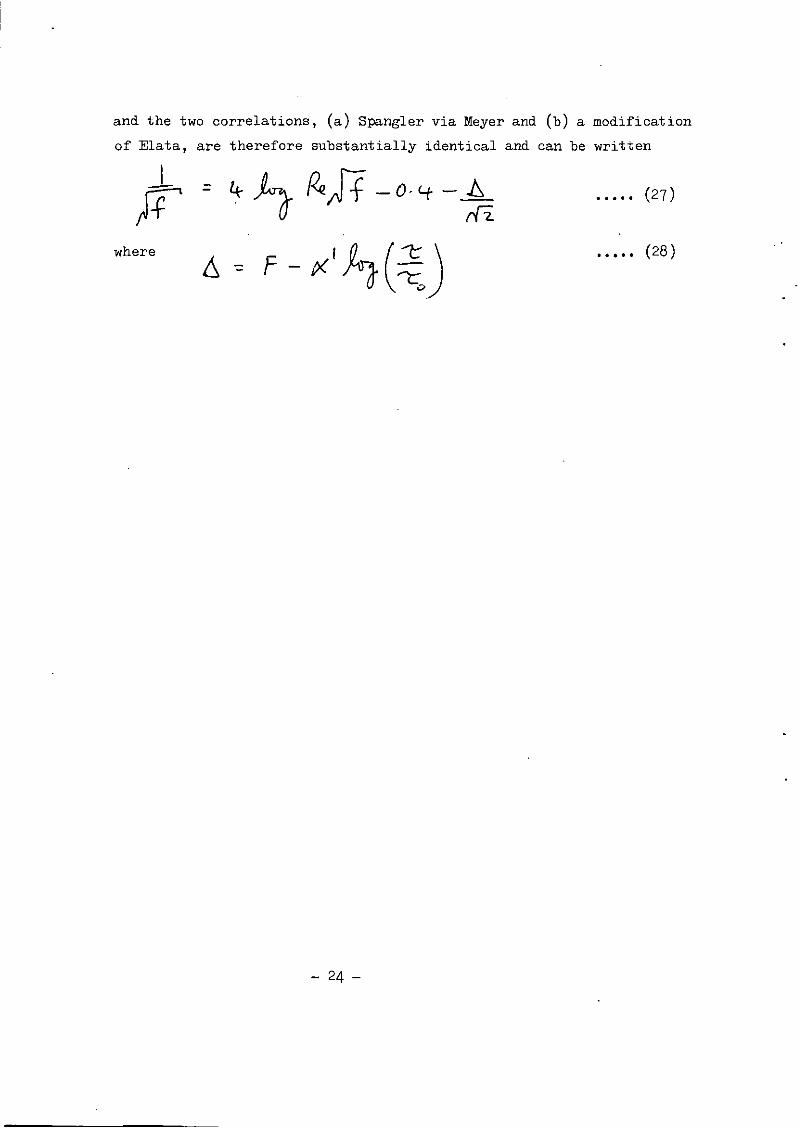
and the two correlations, (a) Spangler via Meyer and (b) a modification
of Elata, are therefore substantially identical and can be written
= ••• ,. (27)
where
- 24 -
• • • •• (28)
APPENDIX 2
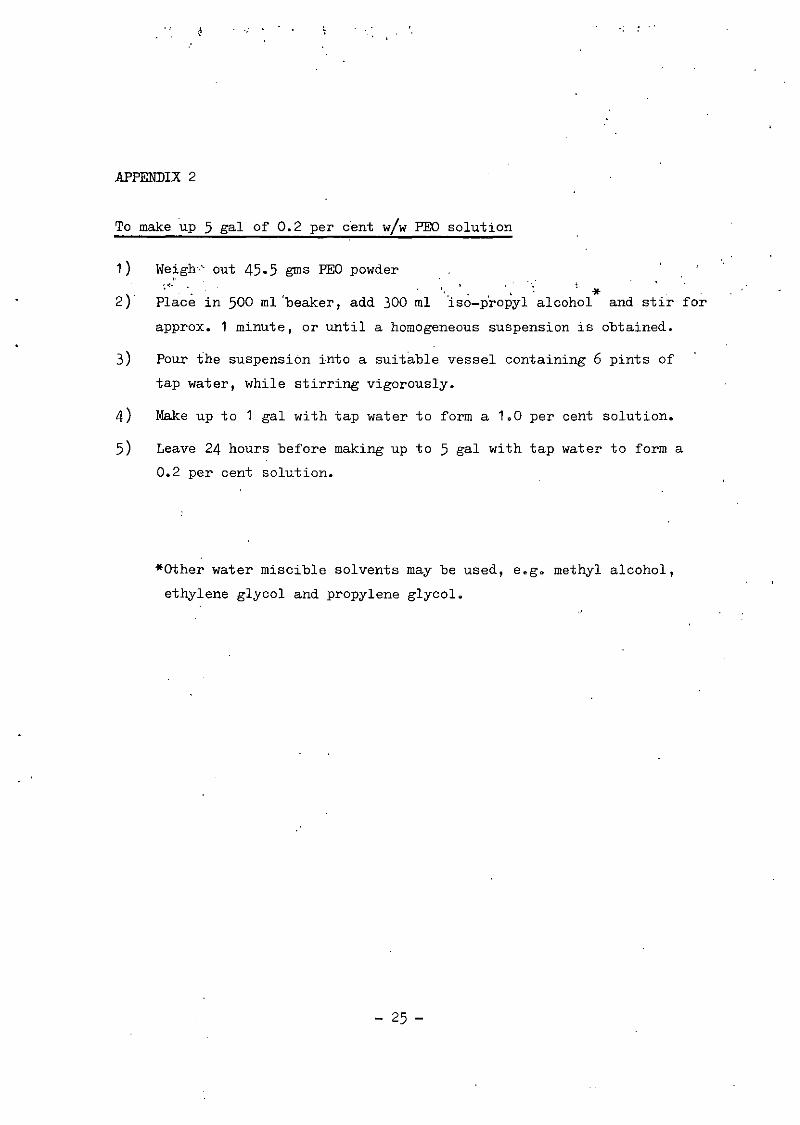
To make up 5 gal of 0.2 per cent w/w PEa solution
1)
2)
We~gh" out 45.5 gms PEO powder~~. .
Place in 500 ml 'beaker, add 300 ml.. , .: *iso-propyl alcohol and stir for
approx. 1 minute, or until a homogeneous suspension is obtained.
3) Pour the suspension into a suitable vessel containing 6 pints of
tap water, while stirring vigorously.
4) Make up to 1 gal with tap water to form a 1.0 per cent solution.
5) Leave 24 hours before making up to 5 gal with tap water to form a
0.2 per cent solution.
*other water miscible solvents may be used, e.g. methyl alcohol,
ethylene glycol and propylene glycol.
- 25 -
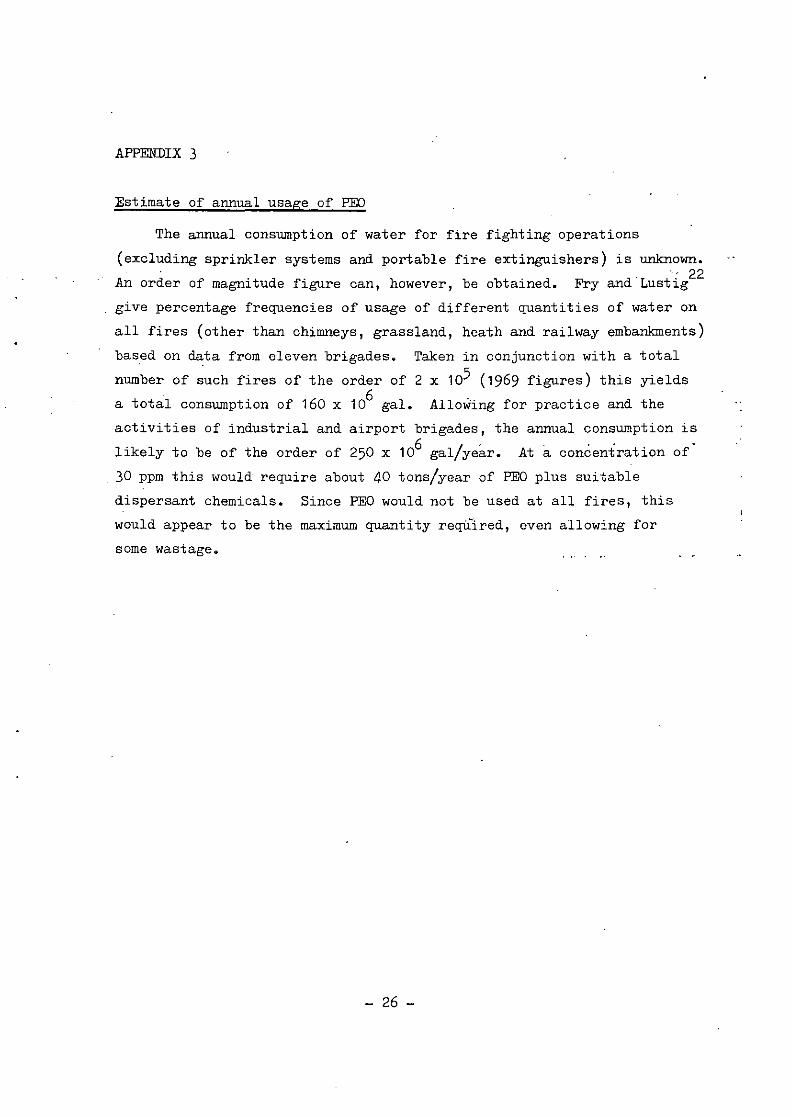
APPENDIX 3
Estimate of annual usage of PEa
The annual consumption of water for fire fighting operations
(excluding sprinkler systems and portable fire extinguishers) is unknown., 22
An order of magnitude figure can, however, be obtained. Fry and "Lustig
give percentage frequencies of usage of different quantities of water on
all fires (other than chimneys, grassland, heath and railway embankments)
based on data from eleven brigades. Taken in conjunction with a total
number of such fires of the order of 2 x 10⁵ (1969 figures) this yields
a total consumption of 160 x 106 gal. Allowing for practice and the
activities of industrial and airport brigades, the annual consumption is
likely to be of the order of 250 x 106 gal/year. At a concentration of
30 ppm this would require about 40 tons/year of PEa plus suitable
dispersant chemicals. Since PEO would not be used at all fires, this
would appear to be the maximum quantity reqUlred, even allowing for
some wastage.
- 26 -
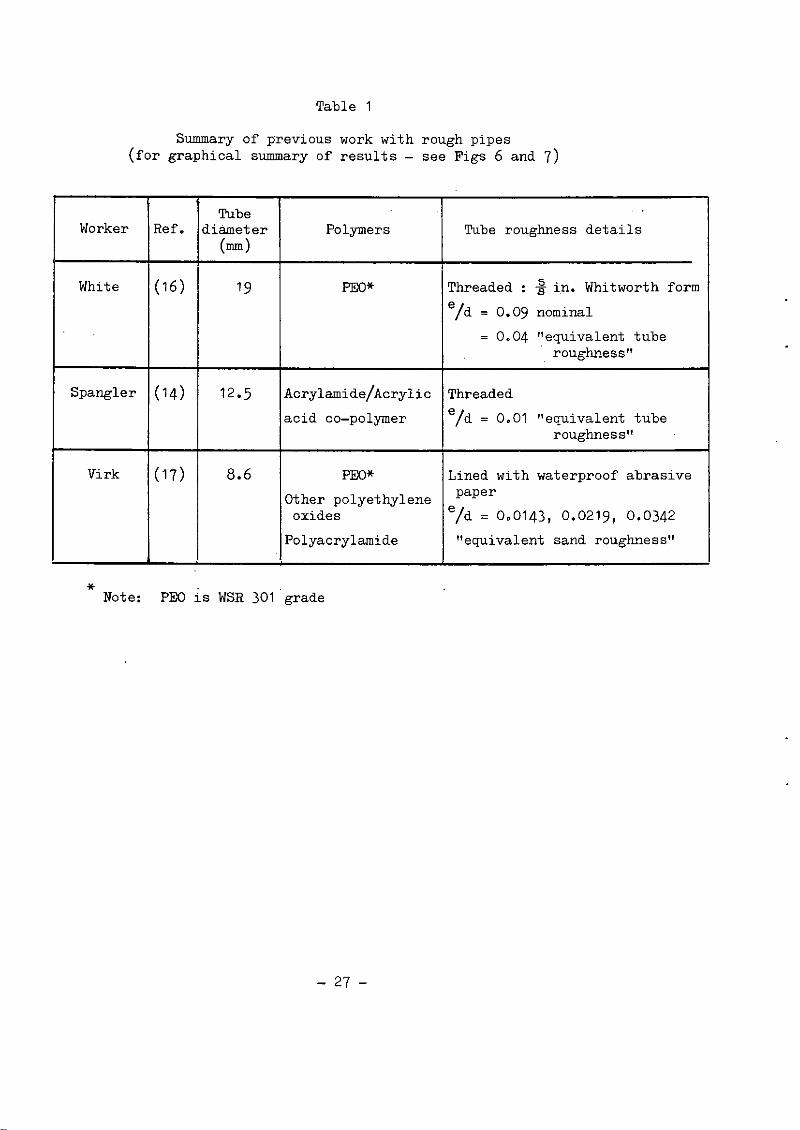
Table 1
Summary of previous work with rough pipes(for graphical summary of results - see Figs 6 and 7)
TubeWorker Ref. diameter Polymers Tube roughness details
(mm )
White (16 ) 19 PEO* Threaded: ~ in. Whitworth form
ejd = 0.09 nominal
= 0.04 "equivalent tuberoughness"
Spangler ( 14) 12·5 AcrylamidejAcrylic Threaded
acid co-polymer ejd = 0.01 "equivalent tuberoughness"
Virk (17) 8.6 PEO* Lined with waterproof abrasive
Other polyethylene paper
oxides ejd = 000143, 0. 0219, 0.0342
Polyacrylamide "equivalent sand r-oughnes s"
* Note: PEO is WSR 301 grade
- 27 -
:' ," , .
Table 2'.
Results for 75.3 m (247 ft) length of 70 mm (2~ in)non-percolating hose using plain water
to •
;Pressure drop b P ,Flow rate Q'.'
: Run No.lbf/in2 kN/m2 gal/min dm3/ mi n
1 11 75.8 144 656.22 30 206.8 212 964.53 38 262 274 1,2474 28 193.1 222 1,010.5 53 365.4 288 1,3106 58 399·9 349 1,5887 48 331 313 1,4248 33 227.5 225 1,0239 18 124.1 174 791.6
10 48 331 284 1,29211 60 413.7 324 1,47412 73 503.3 338 1,53813 " 15 103.4 169 76914 14 96.5 149 677.9
'. 15 20 137.9 179 814.516 16 110.3 179 814.517 14 96.5 139 632.418 10 69 129 586.9 ..19 9 62.1 124 564.120 8 55.2 104 473.2·21 7· 48.3 104 473.222 6.5 44.8 99·6 453.223 5.5 37.9 89.6 407.724 3 20.7 69.6 316.625 10 69 125 568.726 9 62.1 114 518.727 6 41.4 89.5 407.128 5 34.5 92.4 420.529 5 34.5 84.8 385.930 4 27.6 74.8 340.3
- 28 -
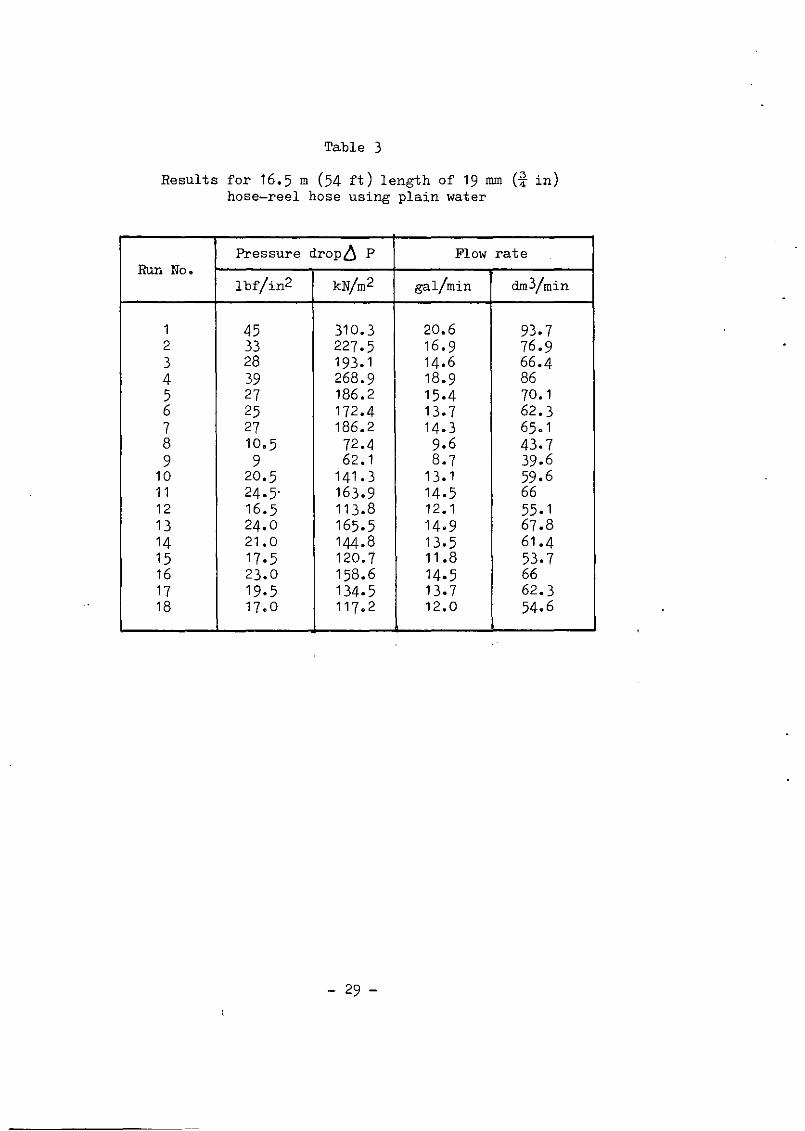
Table 3
Results for 16.5 m (54 ft) length of 19 mm (i in)hose-reel hose using plain water
Pressure dropD P Flow rateRun No.
lbf/in2 kN/m2 gal/min dm3/mi n
1 45 310.3 20.6 93.72 33 227.5 16.9 76.93 28 193.1 14.6 66.44 39 268.9 18.9 865 27 186.2 15.4 70.16 25 172.4 13.7 62.37 27 186.2 14·3 65.18 10.5 72.4 9.6 43.79 9 62.1 8.7 39.6
10 20.5 141.3 13.1 59.611 24·5- 163.9 14.5 6612 16.5 113.8 12.1 55.113 24.0 165.5 14·9 67.814 21.0 144.8 13.5 61.415 17·5 120.7 11.8 53.716 23.0 158.6 14·5 6617 19.5 134.5 13.7 62.318 17 .0 117.2 12.0 54.6
- 29 -
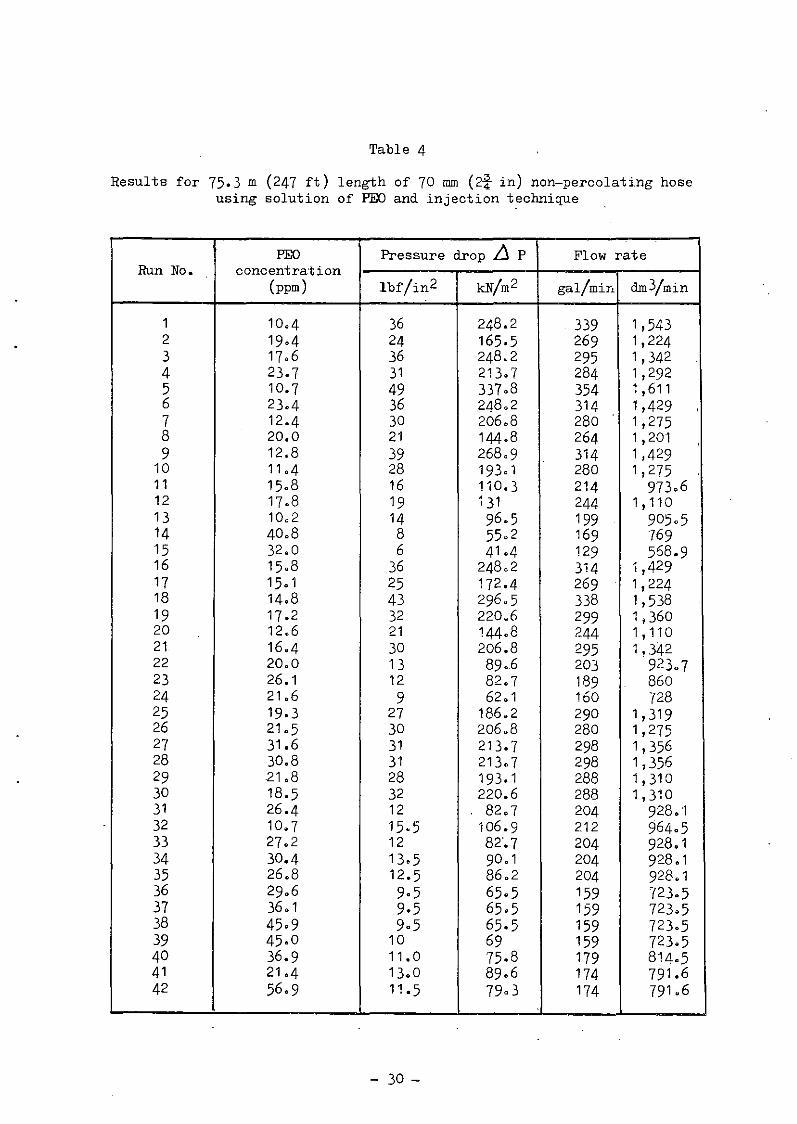
Table 4
Results for 75.3 m (247 ft) length of 70 mm (2i in) non-percolating hoseusing solution of PEa and injection technique
PEa Pressure drop ~ P Flow rateRun No. concentration
(ppm) lbf/in2 kN/m2 gal/mir, dm3/min
1 10.4 36 248.2 339 1,5432 19·4 24 165.5 269 1,2243 17.6 36 248.2 295 1,3424 23.7 31 213.7 284 1,2925 10.7 49 337.8 354 1,6116 23.4 36 248.2 314 1,4297 12.4 30 206.8 280 1,2758 20.0 21 144.8 264 1,2019 12.8 39 268.9 314 1,429
10 11.4 28 193.1 280 1,27511 15.8 16 110.3 214 973.612 17.8 19 131 244 1,11013 10.2 14 96.5 199 905.514 40.8 8 55.2 169 76915 32.0 6 41.4 129 568.916 15.8 36 248.2 314 1,42917 15.1 25 172.4 269 1,22418 14.8 43 296.5 338 1,53819 17.2 32 220.6 299 1,36020 12.6 21 144.8 244 1.11021 16.4 30 206.8 295 1,34222 20.0 13 89.6 203 923.723 26.1 12 82.7 189 86024 21.6 9 62.1 160 72825 19·3 27 186.2 290 1,31926 2105 30 206.8 280 1,27527 31.6 31 213.7 298 1,35628 30.8 31 213.7 298 1,35629 21.8 28 193.1 288 1,31030 18.5 32 220.6 288 1.31031 26.4 12 82.7 204 928.132 10.7 15· 5 106.9 212 964.533 27.2 12 82".7 204 928.134 30.4 13·5 90.1 204 928.135 26.8 12.5 86.2 204 928.136 29.6 9·5 65.5 159 723·537 36.1 9.5 65.5 159 723.538 45.9 9·5 65.5 159 723.539 45·0 10 69 159 723.540 36.9 11.0 75.8 179 814.541 21.4 13.0 89.6 174 791.642 56.9 11·5 79.3 174 791.6
- 30 -
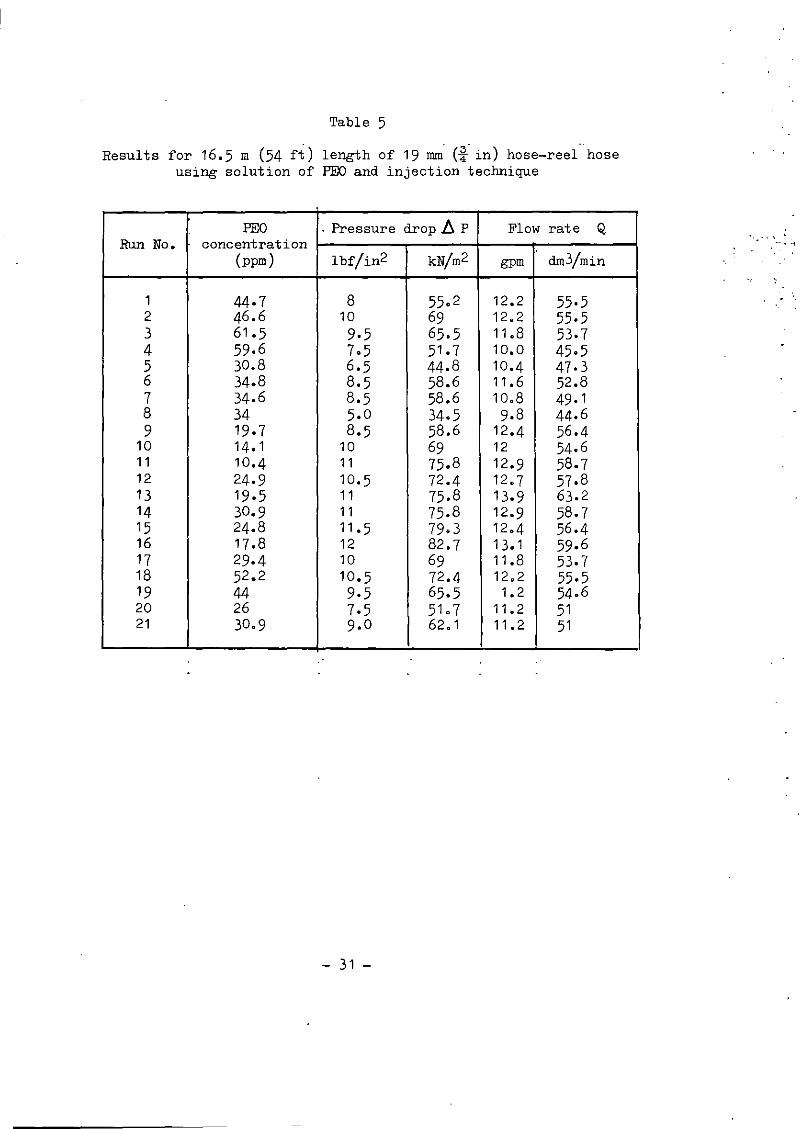
Table 5
Results for 16.5 m (54 ft) length of 19 mm' (~. in) hose-reel' hoseusing solution of PEa and injection technique
PEO . Pressure drop h P Flow rate QRun No. concentration
(ppm) lbf/in2 kN/m2 gpm dm3/min
1 44·7 8 55. 2 12.2 55·52 46.6 10 69 12.2 55·53 61.5 9·5 65.5 11.8 53.74 59.6 7.5 51.7 10.0 45·55 30.8 6.5 44.8 10.4 47·36 34.8 8.5 58.6 11.6 52.87 34.6 8.5 58.6 10.8 49·18 34 5·0 34.5 9.8 44.69 19.7 8.5 58.6 12.4 56.4
10 14.1 10 69 12 54.611 10.4 11 75.8 12.9 58.712 24.9 10·5 72.4 12.7 57.813 19·5 11 75.8 13·9 63.214 30.9 11 75.8 12·9 58.715 24.8 11.5 79.3 12·4 56.416 17.8 12 82.7 13.1 59.617 29.4 10 69 11.8 53.718 52.2 10.5 72.4 12.2 55·519 44 9·5 65.5 1.2 54.620 26 7·5 51.7 11.2 5121 30.9 9.0 62.1 11.2 51
- 31 -
.-. ",
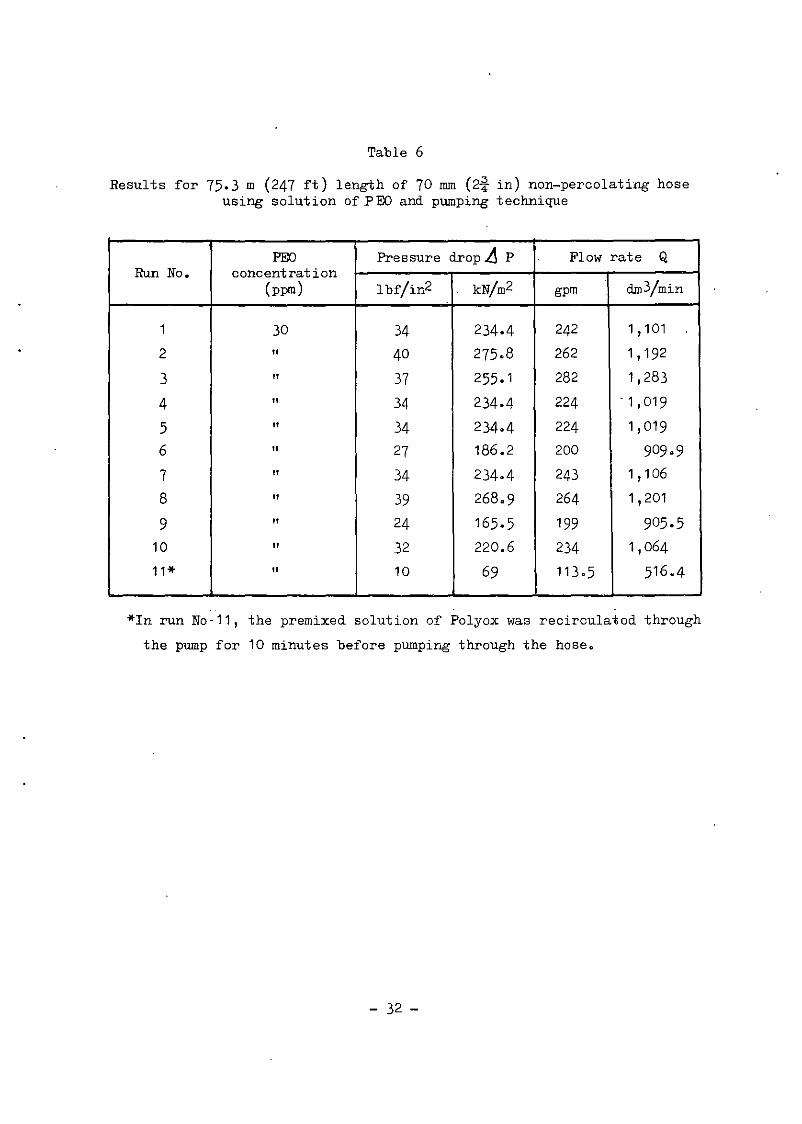
Table 6
Results for 75.3 m (247 ft) length of 70 mm (2i in) non-percolating hoseusing solution of PED and pumping technique
PEa Pressure dropA P Flow rate QRun No. concentration
(ppm) lbf/in2 kN/m2 gpm dm3/min
1 30 34 234.4 242 1,101
2 " 40 275.8 262 1,192
3 " 37 255.1 282 1,283
4 " 34 234.4 224 . 1,019
5 " 34 234.4 224 1,019
6 " 27 186.2 200 909.9
7 " 34 234.4 243 1,106
8 " 39 268.9 264 1,201
9 " 24 165.5 199 905.5
10 " 32 220.6 234 1,064
11* " 10 69 113·5 516.4
*In run No-11, the premixed solution of Polyox was recirculated through
the pump for 10 minutes before pumpir~ through the hose.
- 32 -
Hydrant
breech
in copper tube
70mm hose~
F
DETAIL AT C
G
Plug Holes
/From polyox dispenser
K
D
ECI_..~.~ __
A
B
NOT TO SCALE
FIG.1 DIAGRAM OF EXPERIMENTAL RIG
I Hydrant
GSwitch room
Office instument store
G
'Potyor 'dispenser
(0)
Womens toilets
Nozzle
Recording Instrumentroom room
F
Screen
Motorlcontrolhouse FIG. 2 PLAN OF 70mm HOSE LAYOUT
10,000 r-----------------------------,
• • Plain waterI ..
o 0 Injected polyox solution
D. b. Pumped polyox solution
°1000~~
CL.
~ou,
600100
Pressure drop f1"p k N/m 2
100 L..- ..........__..I....----.lL..--..........--.L---L-............L...I. ..L...-_--I --J.._-'--~
10
FIG. 3 RESULTS FOR 70mm (2 3/4) HOSE
1000 ,.--..--------------------------,
• • Plain water, \
o 0 1njected polyox solution
c"-
~ou,
E-MEu
100a
600100
Pressure drop ~ P kN/m 2
10 L...-.. -L-_-..I_---L.~.L.__L..._...L...._L.....L......L._ __L__...I..__..I...._...........---l
10
FIG. 4 RESULTS FOR 19mm ( 3/~) HOSE
10 12 14 16 18 20
f-I I I I I I I
f-Q(gall/min) for 19mm hose
I
~ ._____19mm hose plain water
---- ----.... ------f-
, r- ____ - 70mm hose plain water/
~value of of' used
,-by the - I-. Prandtl- Karman law forr- fire service for / -- hydrodynamically smoothnon- percolating hose .It... 19mm hose - - _ _ I pipesr-- PEO solution/
f- /.I r
/
70mm hosePEO solution
Q(gail/min) for 70mm hose
75 100 125 150 200 250 300 350I .I I I I I I I I I
I I I I I I I I I I I I I I
-2109
8
7
-310
6......-5.....L-0 4+'u0-e 3.2+'uL-u,
2
2 3 4 5 6 7 8 9 105 2Reynolds number (Re )
3 4 5 6 7 8 9 10 6
FIG. 5 FRICTION FACTOR (1) FOR 70mm (2 34'> AND 19mm (3;';)HOSE WITH PLAIN WATER AND 'INJECTED' PEO SOLUTIONS
i\~
I
10- 2
---C-o+IU0-c.2...u--C-u,
10-3
"'""f- ,r-r-
-- A
/. V--
"',,- ~.> B
\- <,
~-- ----- <, ----i\..
<,
~A' -1-- __
- <, !""'---~, '--7-r- A" r-- -
~kB .>:io"
........
~B"
I
Prandtl -
" ~ Karman law<;<,
,-
I ~',...~
-----~
- Maximum I drag-reductionasymptote (MDRA)-
I
I I I I I I I I I I I I I I I I I I
104
105
Reynolds number (Re)
Curve 'lId Fluid
A 0'034} WaterB 0-014
A'0'
0 31B'
Dilute PEO0-014
A"0'
0 31Other dilute
B" 0-014 polymers
FIG_ 6 RESULTS OF VIRK (17) FOR ROUGH PIPES
1010
number (Re)
104
Reynolds
l-I-l-I-
-I-
A,
I~ ~ A' ~-, <; /
~ ... I'< ~ "I- -,I- -.......;;::
~ \/ .(C B'-i- 9- <, ~
<, -.....;..::::-1--_ 1/I- <. ~ --I--I-
C' I .......... IT-I-
r-, '0'
r-. Prandtl- '/Korman low
r-,3
= 1 I'--....l-I---~
I- Maximum7 drag reductionasymptote (MORA)-
I I I , I I I I I I I I I I I I I I4
5 6
-210
-110
-10 3
10
c.2...u.-I..u,
10
I..o...uo....
"),•c•r),
A Water } WhiteA' Polymer
B Water } SpanglerB' Polymer
C Water } This work
C' Peo 19mm hose
0 Water } This work0' Peo 70mm hose
FIG. 7 RESULTS OF WHITE (16) AND SPANGLER
(14) AND FROM PRESENT INVESTIGATION
.,
5 - Refers to solvent (plain water)P - Refers. to . PQIYrJ1er solution
100 Re(R)= [VJ =[Re Jf ~ ]
70mm hose}PEO this work
19mm hose -
e'6mm sanded tube PEO Virk (7)
12·5mm threaded tube 'P295" Spangler (14)
16mm threaded tube PEO White (16)
sJ---
----~\
\\t---- P\\\\\\ ,,
' ......
5
IIr-p
II
/
+12
+10
+8
+6
+4
+2
6- 0
-2
-4
-6
-8
-10
-12
-14
For fuller de tails see table 1
r.: IG. 8 THE FUNCTION ~ FOR SOLVENT AND POLYMER SOLUTIONSIN KOUGH PIPES
340180
3"Length of 2 ~ non- percolating hose (t t
80 10
1000
Typical discharge V presperformance line for fir~
pump at full throttle
- - Water treated w--- Plain water
-cQ.
-160
80~(..
::JlI\
60 ~(..
Cl
140 ~::JoQ)
120~c
50
--100 :e
140
120
320
100
300
£280E:::260o0)
-240~
~ 220...o(..200~
. ~180o.c.~ 160o
20
-90 0
80 :cQ)
70 .~
J:60
50
40
30
130
120 c-110 -...100.~
40
60
xo~ 100
180
80
~o1: 120...
c 160--...~
"-.. 140-o
20 40 60 80 100 120 140 160 180 200Pump or hydrant pressure C1bf lin
2 gauge)
FIG. 9 HEIGHT AND THROW OF JETS; DISCHARGE RATE AND NOZZLEFOR DIFFERENT HOSE LENGTHS AND PUMP PRESSURES WITHAND WATER TREATED WITH 30ppm PEO. NOZZLE DIAMETER
12070 /200 200
110/
450 / 3"Lengtn of 2 '4
10060
/ non - percolating hose eft)-e: -.- Ne:160 90 ~400 .-
50 -..-- - .0... - -- 80 0 -- 0) e:... 140 - Q.
~ - ..,40 ~'- 70 ~ ~350 l..- :J-0 120
...'"... 0 '"~ l.. ~
~ 60'- l..0 - ~ 30 a.l.. 0 0)
:5100 L 300 ~ 80050 :E 0.c N
X 0) U N0 .-
.~ 0~
~ 80 40 I 0 z
250Typical discharge V pressure
60 30 ._______performance line for fire_____ pump at full tnot tle
200 - - Water treated with Peo
20 Plain water40
20 40 60 80 100 120 140 160 180 200Pump or hydrant pressure (lb flin
2)
FIG. 10 HEIGHT AND THROW OF JETS; DISCHARGE RATE AND NOZZLE PRESSUREFOR DIFFERENT HOSE LENGTHS AND PUMP PRESSURES WITH PLAIN WATERAND WATER TREATED WITH 30ppm PEa. NOZZLE DIAMETEF: 1 1;2
1000
800
- - Water treated with Peo--- Plain water
3"Length of 2 ~ non - percolating hose (t t)
Typical discharge V pressure,r performance line for fire.----- pump at full thottle
200
1020
500 25
100
40
- 2q\l_80 C e"-
E --- .c- -- -- 30 0400 c-- C)) 15 a.--60 - .\!)~
~ - L."- 25~~
:J- II'0 - - '"~ 0 ~
~ "- L. L
20 - ~0
.E 400 C))
L- - 0.c s: 300x Ol"-
V0 ~ .!!!~ 15 J: 0
FIG. 11
20 40 60 80 100 120 140 160 180 200
Pump or hydrant pressure C1bflin2
gauge)
HEIGHT AND THROW OF JETS; DISCHARGE RATE AND NOZZLEFOR DIFFERENT HOSE LENGTHS AND PUMP PRESSURES WITHAND WATER TREATED WITH 30ppm PEO. NOZZLE DIAMETER
PRESSUREPLAIN WATER
2/1