in-flight performance of sileye-2 experiment and cosmic ray abundances inside the mir space station
TRANSCRIPT

arX
iv:a
stro
-ph/
0107
128v
1 6
Jul
200
1
In-flight performances of SilEye-2 Experiment and
cosmic ray abundances inside space station Mir.
V Bidoli†, M Casolino†††, E De Grandis†, M P De
Pascale†, G Furano†, A Morselli†, L Narici†, P Picozza†, E
Reali†, R Sparvoli†, A Galper‡, A Khodarovich‡, M
Korotkov‡, A Popov‡, N Vavilov‡, G Mazzenga§, M Ricci§,
G Castellini‖, S Avdeev¶, M Boezio+, W Bonvicini+, A
Vacchi+, N Zampa+, P Papini∗, P Spillantini∗, P Carlson♯and C Fuglesang§§.
† INFN ROMA2 and University of Roma Tor Vergata, Italy‡ Moscow Engineering and Physics Institute, Moscow, Russia§ LNF - INFN, Frascati (Rome), Italy‖ IROE of CNR, Florence, Italy¶Russian Space Corporation ”Energia”, Korolev, Moscow region, Russia+ University of Trieste and INFN Sezione Trieste, Italy.∗ University of Firenze and INFN Sezione Firenze, Italy♯ Royal Institute of technoloy, Stockholm, Sweden§§ European Astronaut Centre, ESA, Cologne, Germany.
E-mail: [email protected]
Abstract. Cosmic ray measurements performed with the instrument SilEye-2on Mir space station are presented. SilEye-2 is a silicon detector telescope forthe study of the causes of Light Flashes perception by astronauts. As a stand-alone device, it monitors in the short and long term the radiation compositioninside Mir. The cosmic ray detector consists of an array of 6 active silicon stripdetectors which allow nuclear identification of cosmic rays up to Iron. The devicewas operational for more than 1000 hours in the years 1998-2000, measuring alsoseveral Solar Particle Events. In this work we present the in-flight performance ofthe instrument and nuclear abundance data from Boron to Silicon above ≃ 150MeV/n inside Mir.
PACS numbers: 96.40-z, 95.55.-n
Submitted to: J. Phys. G: Nucl. Phys.
††Corresponding author: Dept. of Physics - University of Roma Tor Vergata, Via della RicercaScientifica 1 - 00133 Roma, ITALIA

Cosmic ray abundances inside Mir with SilEye-2 experiment 2
1. Introduction
A detailed study and understanding of the radiation environment in space and itseffects on human physiology has a growing importance in light of work on theInternational Space Station (ISS) and of a future mission to Mars. Radiation inorbit comes from cosmic rays of different energies and origins. In addition to thegalactic component - which is modulated by the solar activity at low energies - thereare also solar energetic particles associated with transient phenomena such as solarflares and coronal mass ejections. Inside Earth’s magnetosphere there is also thesignificant contribution of trapped particles: to the well-known proton and electronbelts, recent studies have shown a more complex nuclear composition, for instance,with trapped components of anomalous cosmic rays [1]. For Low Earth Orbits suchas those of Mir, ISS or Shuttle (altitude of 300-400 km, inclination of 51.6o) the effectof trapped radiation is most evident in the South Atlantic Anomaly (SAA). This is aregion located between South America and Africa were the geomagnetic field is lowerand particle flux increases. It is also important to study Z > 1 cosmic ray componentfor its high quality factor which - even with a low flux - can give a non-negligiblecontribution to the dose absorbed by astronauts.In addition to the effects of radiation, there are also other processes that need to bestudied in order to have a more complete knowledge of the human response to spaceenvironment. One of these phenomena is the “Light Flashes” (LF) effect, originallypredicted in [2, 3] and reported for the first time in 1969 by the Apollo-11 missionto the Moon. Subsequently, LF were observed by astronauts in the Apollo, Skylab,Shuttle and Mir missions [4, 5, 7]. The SilEye- 1 and 2 experiments were designed tostudy this phenomenon and the radiation environment on board Space Station Mir. Inorder to correlate LF observations by the cosmonaut with cosmic rays it is necessaryto measure charge, energy deposition and direction of the incoming particles in realtime. The use of active silicon detectors [8, 9] is necessary to meet these requirementswith the limitations of mass, size and power consumption. SilEye-1 was operationalon Mir between December 1995 and December 1997[10, 11]. It performed the first LFobservations on Mir and carried the prototype of the silicon detector. SilEye-2[12, 13]was first turned on in August 1998 with systematic observations starting in October1998. It was operational in various periods until August, 28, 1999. When the lastcrew reached Mir in March 2000, SilEye-2 was used again during the mission (untilJune 2000).In this work we discuss the in-flight performances of the detector and particlecomposition on board space station Mir using data gathered between August 1998and August 1999. This data set consists of 93 sessions, 17 of which were devoted toLight Flashes observations. More than 107 particle events have been acquired in 1068hours of observation time: during these observations 7 Solar Particle Events (SPEs)were also detected. The latest data set (year 2000) is currently under analysis. LFresults are presented in [14].
2. The experimental device
SilEye-2 consists of a silicon detector telescope, shown in Figure 1, housed in analuminum box, coupled to an “helmet” with an eye mask, and worn by the cosmonaut.The device is connected to a laptop computer equipped with a data acquisition cardand a joystick. The detector is small (maximum dimension: 26.4 cm, mass 5.5 kg),

Cosmic ray abundances inside Mir with SilEye-2 experiment 3
robust and easy to handle. A computer based control software performs data handlingand storage. To carry out LF observations, the astronaut wears the helmet which holdsthe detector box and presses the joystick button when he observes LF. Data come,therefore, from two independent sources: the particle track recorded by the silicondetector and the observation of the LF by the astronaut. The helmet has a mask thatshields the astronaut’s eyes from light; three internal LEDs allow to cross-check thecorrect position of the detector, verify the dark adaptation of the observer and measurehis reaction time to normalize measurements performed by different astronauts.The device can also be operated as a stand-alone cosmic ray detector without thepresence of the cosmonaut; in this acquisition mode a monitoring of the environmentalradiation inside Mir is performed. Each event (cosmic ray or LF observation) has atime stamp (50 ms precision) to correlate it with the orbital position of Mir. A particleevent is defined by the energetic and topological information coming from the stripshit by incoming particle(s); an LF event consists of the time of clicking the joystickbutton.The particle detector telescope is made of a series of six silicon active wafer, originallydeveloped in the construction of NINA-1 and 2 cosmic ray space telescopes [15, 16].The device structure is shown in Figure 2. The detector is positioned on the templeof the cosmonaut in order to cover the maximum angle for cosmic rays impingingon the eye. In stand-alone mode for cosmic ray measurements it is placed on a in aspecific location on Mir. The position of the device is recorded each session in orderto reconstruct its orientation in respect to the station. Each of the six silicon wafershas an active area of 60 × 60 mm2, divided in 16 strips 3.6 mm wide; the thickness is380± 15 µm. Two wafers, orthogonally glued back to back, constitute a plane. Threeplanes are used together, for a total number of 96 strips and an active thickness of 2.28mm. The distance between the silicon planes is 15 mm; the geometrical factor is 85 cm2
sr if particles hitting the detector from both sides are considered. The silicon strips aredepleted by a DC voltage of 36 V, supplied by batteries insulated from the rest of thecircuit board. The outermost strips of plane 1 (1 and 16) are disconnected while thoseof planes 2 and 3 are connected to the same readout channel. The readout channelssaved in this way are used for housekeeping information. Among the housekeepingvalues are the inverse currents of each silicon plane. In addition, there are two AnalogLow Rate Meters (which measure incident rate on plane 1, view X and Y, up to 400Hz) and three Analog High Rate Meters (one per plane) which measure particle rateup to 20 kHz. We therefore have 88 physics and 8 housekeeping channels for a totalof 96 readouts per event.Two passive absorbers (1 mm iron each) are inserted between the position-sensitiveplanes to extend the energy range. For single track events, the particle trajectory isdetermined with an angular accuracy of 5 degrees. Each analog signal comes into theRead-out board, which performs the tasks of Analog-to-Digital Conversion (ADC),trigger and calibration. For each trigger, data are converted by a 12 bit ADC andsent to FIFO (First in, first out) for acquisition by the read out card. The ADChas a dynamic range up to 12.2 pC of injected charge: thus SilEye-2 can measureparticle energy losses per strip from 0.25 MeV (0.69 keV/µm) to about 300 MeV(830 keV/µm) and then determine nuclear species. The analogic sum of the signalsfrom the strips of each view is used as a input for the trigger system, performed bya PAL (Programmable Array Logic) unit mounted on the Read-out board. DenotingXi and Yi the views of the plane i and Pi the analogic OR (Pi = Pi,x + Pi,y) of the

Cosmic ray abundances inside Mir with SilEye-2 experiment 4
two views x and y of Plane i, we have the following main trigger:
((X1 AND P3) AND (Y1 OR P2)) (1)
The threshold is set at 0.69 keV/µm. Particles are therefore required to cross thedetector in order to have a trigger to read the event. The minimum energy tohave a trigger - determined with Montecarlo simulations - is shown in Table 1. The0.69 keV/µm trigger threshold, necessary to optimize the detector for high Z nucleiobservation (of higher interest for LF), reduces proton detection efficiency at highenergies (above 100-200 MeV). As energy increases the energy deposited decreasesand reduces trigger probability: above 400 MeV the efficiency is ≃ 7%. Particlesfrom both sides of the detector are read: however the material crossed is different inthe two cases, since particles cross the 0.2 mm Cu window on one side (closer to thecosmonaut’s head) and ≃ 2 cm of electronics on the other. This requires a correctionin the energetic spectrum of low energy particles coming from this direction, but -aside from nuclear fragmentation in the interposed material - does not appreciablyaffect nuclear composition.
Data from the FIFO are then sent - through an interface board - to a PCMCIADigital Acquisition Board housed in the laptop. The interface board also handlesdata coming from the cosmonaut joystick and the LEDs used for eye adaptation. Theacquisition software includes a data quick-look to be performed by the cosmonaut whocan also add personal comments after the conclusion of each session. Data storage isperformed on PCMCIA hard disks; data transfer to Earth is performed by the crewwho brings the hard disks to Earth when returning from Mir.
3. DATA ANALYSIS
The study of the radiation environment on board manned spacecrafts allows evaluationof the dose absorbed by the astronauts in order to assess the risks involved in spacemissions. The complexity of the information required for a detailed comprehensionof the radiation environment grew with the improvement of the detectors and theunderstanding of the near Earth and interplanetary radiation environment. The useof active detectors allows a measurement in real time of the nature of charged radiationimpinging on the spacecraft and the modifications of the cosmic ray flux due to theinteraction with the material of the spacecraft itself. These studies have to be carriedforth both in solar quiet and active conditions, in order to take into account the doseabsorbed by astronauts during SPEs. The time and intensity variability of these eventsmake them real threats to long term activities outside the geomagnetic shielding suchas a mission to Mars[17]. In this work we analyse the performance of the silicondetector and report on cosmic ray measurements.
3.1. Calibration
Each acquisition session begins with the calibration of the detector. The position andRMS (Root Mean Squared) of the electronic pedestal of each silicon strip is evaluatedwith 1024 measurements. Figure 3 shows the histograms of average and RMS valuesof the detector strips. The thin line refers to one of the first acquisition sessions(14/02/98), while the thick line refers to one of the last (31/07/99). Notice how theposition of the pedestal has remained constant during work. In addition, the noiseof the pedestal has decreased (the RMS of 7 ADC channels during the first session
Cosmic ray abundances inside Mir with SilEye-2 experiment 5
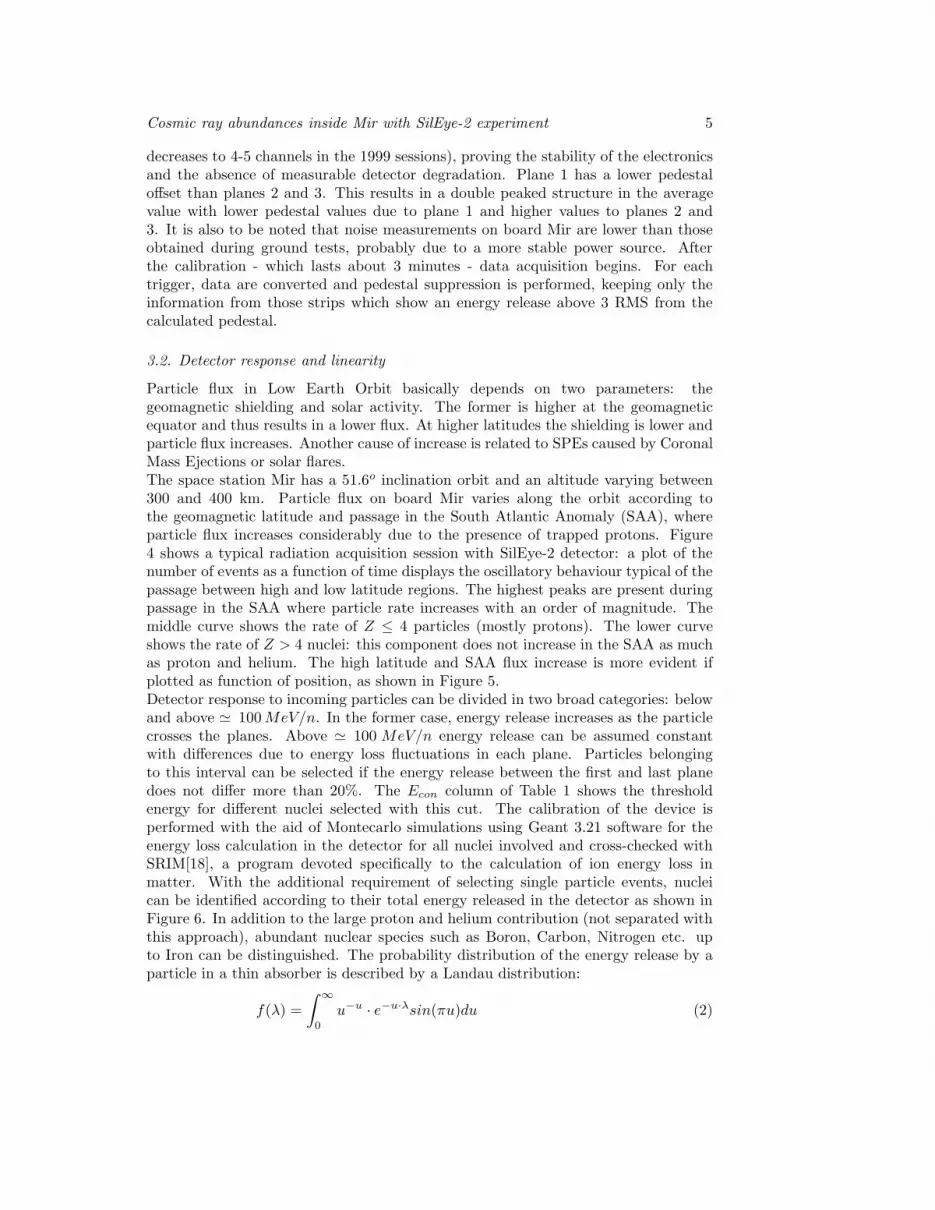
decreases to 4-5 channels in the 1999 sessions), proving the stability of the electronicsand the absence of measurable detector degradation. Plane 1 has a lower pedestaloffset than planes 2 and 3. This results in a double peaked structure in the averagevalue with lower pedestal values due to plane 1 and higher values to planes 2 and3. It is also to be noted that noise measurements on board Mir are lower than thoseobtained during ground tests, probably due to a more stable power source. Afterthe calibration - which lasts about 3 minutes - data acquisition begins. For eachtrigger, data are converted and pedestal suppression is performed, keeping only theinformation from those strips which show an energy release above 3 RMS from thecalculated pedestal.
3.2. Detector response and linearity
Particle flux in Low Earth Orbit basically depends on two parameters: thegeomagnetic shielding and solar activity. The former is higher at the geomagneticequator and thus results in a lower flux. At higher latitudes the shielding is lower andparticle flux increases. Another cause of increase is related to SPEs caused by CoronalMass Ejections or solar flares.The space station Mir has a 51.6o inclination orbit and an altitude varying between300 and 400 km. Particle flux on board Mir varies along the orbit according tothe geomagnetic latitude and passage in the South Atlantic Anomaly (SAA), whereparticle flux increases considerably due to the presence of trapped protons. Figure4 shows a typical radiation acquisition session with SilEye-2 detector: a plot of thenumber of events as a function of time displays the oscillatory behaviour typical of thepassage between high and low latitude regions. The highest peaks are present duringpassage in the SAA where particle rate increases with an order of magnitude. Themiddle curve shows the rate of Z ≤ 4 particles (mostly protons). The lower curveshows the rate of Z > 4 nuclei: this component does not increase in the SAA as muchas proton and helium. The high latitude and SAA flux increase is more evident ifplotted as function of position, as shown in Figure 5.Detector response to incoming particles can be divided in two broad categories: belowand above ≃ 100 MeV/n. In the former case, energy release increases as the particlecrosses the planes. Above ≃ 100 MeV/n energy release can be assumed constantwith differences due to energy loss fluctuations in each plane. Particles belongingto this interval can be selected if the energy release between the first and last planedoes not differ more than 20%. The Econ column of Table 1 shows the thresholdenergy for different nuclei selected with this cut. The calibration of the device isperformed with the aid of Montecarlo simulations using Geant 3.21 software for theenergy loss calculation in the detector for all nuclei involved and cross-checked withSRIM[18], a program devoted specifically to the calculation of ion energy loss inmatter. With the additional requirement of selecting single particle events, nucleican be identified according to their total energy released in the detector as shown inFigure 6. In addition to the large proton and helium contribution (not separated withthis approach), abundant nuclear species such as Boron, Carbon, Nitrogen etc. upto Iron can be distinguished. The probability distribution of the energy release by aparticle in a thin absorber is described by a Landau distribution:
f(λ) =
∫∞
0
u−u · e−u·λsin(πu)du (2)

Cosmic ray abundances inside Mir with SilEye-2 experiment 6
In order to extract calibration and nuclear abundance information, nuclear peakshave been fitted with a Landau distributions per nucleus. The fit has consideredthe nuclei from B to Si (10 distributions for 10 nuclei). Each distribution can becharacterized with three free parameters Pi according to the following equation:
f(λ) = P1 ·
∫∞
0
u−u · e−u·P2(λ−P3)sin(πu)du (3)
with: P1 proportional to the height, P2 to the width and P3 to the position ofeach nuclear distribution. The fit uses 32 free parameters: 30 for the 10 Landaudistributions and 2 for an exponential tail used to estimate the Z < 4 contaminationover B and C. With this approach it is possible to take into account reciprocalcontamination of different nuclei; the good agreement of data with the fit, with anormalized χ2 = 3.1 proves the excellent behavior of the detector. Subsequently weperformed a linear fit of the values of P3 (in ADC channels) of each nuclear species,corresponding to the peak of the distributions (the most probable energy release)as a function of the square of the charge of the incident particle. The correlationcoefficient of R = 1 shows the good detector linearity. A fit of the correlationbetween the theoretical energy loss (evaluated with Montecarlo) and the measuredADC values is used to determine the conversion factor of the detector: this is equalto 13.56 channels/MeV, corresponding to an ADC resolution of 74 keV/channel (withR = 0.9996).
3.3. Nuclear Abundances
From the fit of the Landau curves it is possible to derive the nuclear relativeabundances inside Mir in different positions and solar activity conditions. In thiscase we have considered solar quiet days in order to provide a reference to subsequentanalysis of Solar Particle Events. We have divided the data set according to theMcIlwain parameter L and the geomagnetic field B in three regions: Galactic CosmicRay region (GCR, L > 2), South Atlantic Anomaly (SAA, L < 2 and geomagneticfield B < 0.25G ), and the remaining region (L < 2, B ≥ 0.25 G). The McIlwainparameter L represents - at a first approximation - the value (expressed in Earthradii) at which the magnetic field line passing through the point considered intersectsthe geomagnetic equator. In case of low earth orbits (such as Mir) values close toL = 1 are in proximity to the equator and increase at higher latitudes. For a detaileddefinition see [6]. This reference system is particularly useful since charged particlesspiral along the magnetic field and bounce between the mirror points at values ofconstant L. In a given point of the orbit, the geomagnetic cutoff C determines theminimum energy for primary cosmic rays to reach Mir and to be detected by SilEye.Note that this value is valid for particles orthogonal to the local field line and outsideMir. In addition, particle energy inside the station can be modified by the interposedmaterial of the station and the presence of nuclear interactions, so it should be usedonly as a reference. Particles with energy equal or lower to the energies shown in theEabs column of Table 1 are absorbed by the 3mm Al material of the external hull ofthe station. The Emin column of Table 1 shows the minimum kinetic energy necessaryfor trigger (after passage through the hull of the Mir). This implies that a 50 Mev/ncarbon nucleus would have the energy to cross (in orthogonal incidence conditions)the hull of the station but could not give a trigger in the detector: in this experimentthe minimum trigger energy for carbon is 90 MeV/n, of which 20 Mev/n are lost in

Cosmic ray abundances inside Mir with SilEye-2 experiment 7
the Al of the station. Naturally the 3mm Al thickness assumed only represents a lowervalue, since the station and the equipment contained can be interposed between thedetector and the local field line along which the particles come.At L = 2, C = 3.9 GV while at high latitude (L=4.4) C = 0.8 GV . These two valuesrepresent the minimum cutoff for a given region; they correspond to a minimum kineticenergy (for particle with mass/charge ratio of 2) of ≃ 150 MeV/n (C = 0.8 GV ) and≃ 1600MeV/n (C = 3.9GV ). Particles have been selected with the same cut describedin the previous subsection. At this energies particles lose only a small fraction oftheir kinetic energy in crossing the hull of the station: again, using 3 mm of Al as areference, we find that, for instance, a 150 (1600) MeV H loses 3.4 (1.3) MeV to enterthe station. In case of other nuclei, the values are similar: if we consider carbon, wehave 4.8 (1.2) MeV lost for 150 (1600) MeV/n. The particle distributions of the threeregions are shown in Figure 7. The continuous line shows the galactic component,which has an higher flux due to the lower geomagnetic cutoff. This allows particleswith lower energy to reach Mir and be detected by SilEye resulting in a higher particlecount. The wider energy range implies a larger energy release range, resulting in thepeaks to be less sharply defined. In this range, proton and helium flux is lower thanthat measured in the SAA (dotted line) where the trapped component is dominantif compared to galactic and L < 2 abundances. Indeed the L < 2 curve (dashed)has a lower Z ≤ 2 flux if compared to SAA but an equal Z ≥ 5 flux, since in bothcases the component selected at this energy is the same. From these distributionsit is possible to reconstruct relative abundances and absolute integral fluxes for thedifferent nuclear species (shown respectively in Table 2 and 3). Thus absolute fluxesrepresent an average above the regions where the geomagnetic cutoff is higher thanthe minimum values of 3.9 and 0.8 GV and can be as high as 16 GV. Determinationof the proton spectrum requires detailed corrections for the energy dependent triggerefficiency so we currently present only Z > 4 results (where trigger efficiency canbe assumed equal to 1). Table 2 also shows the relative cosmic ray abundances at1AU[21] measured in the energy range of ≃ 1GeV . It is possible to see how, especiallyfor the L < 2 regions, notwithstanding the bulk of the Mir, the data are in general inagreement. There are, however, the following notable differences:
• An overabundance of B in respect to C. It is roughly twice the 1AU value in allthree regions. This could be accounted as secondary production due to hadronicinteractions.
• A higher amount of N in the L > 2 region compared to the other regions and1AU data. This could be due to an larger production of secondary N at lowerenergies.
• A lower amount of Oxygen nuclei in L > 2 and L < 2 regions (SAA value isin agreement within errors with 1 AU data). Also in this case the effect can beexplained with an higher hadronic interaction cross section for O in respect to C:Oxygen could be considered as composed of four alpha particles (He nuclei) andCarbon of three. Thus, if we assume the ratio of the cross sections to be equal ofthe ratio of the nucleons of Carbon and Oxygen (12/16 = 0.75) and we multiplyby the original flux of 0.93 we obtain an abundance of 0.7.
• An higher amount of Ne and lower amount of Mg and SI in the L > 2 region.
In all cases it is clear that a crucial role is played by hadronic interactions inthe matter, but an accurate estimate of the processes involved is complicated by

Cosmic ray abundances inside Mir with SilEye-2 experiment 8
the estimation of the energy-dependent cross sections and the amount of materialinterposed between SilEye and the exterior of the station. Given the conditions of thismeasure, the agreement with 1AU data is rather good: the larger differences occurin the L > 2 region, where cutoff is lower and particles have a wider energy range.To improve the measure of cosmic ray abundances inside Mir it will be necessary toseparate sessions and incident angles in order to obtain a clearer sample of cosmicrays.
3.4. Linear Energy Transfer
The LET in silicon measured with SilEye-2 is shown in Figure 8: in this work wepresent solar quiet period data for the three geomagnetic regions described in theprevious section. The LET is obtained normalizing the total energy release to theangle of incidence for single and multiple track events. The topmost curve shows theSAA, where trapped protons are the dominant contribution; the galactic nuclear flux(middle curve) is dominant at LET above 8 keV/µm. The bottom curve representsLET at L < 2 and outside the SAA: the proton component is below the previous tworegions, and the high LET component is - as expected - equal to the SAA region. Inthese two regions the nuclear component is lower than in the L > 2 zone due to thehigher geomagnetic cutoff. As previously mentioned, trigger efficiency for protons(which constitute the peak at 1 keV/µm) varies according to incident energy: adetailed Montecarlo simulation, currently in progress, is thus required to reconstructthe original proton spectrum, in order to derive - from the measured LET - the doseabsorbed by the cosmonauts. The different nuclear abundances and fluxes resultin different LETs and therefore different doses absorbed by the astronauts. If weevaluate the dose absorbed in silicon (considering the component above 1 keV/µm)from the LET of a typical session (20/10/98) we obtain 103±10µGy/day in the highlatitude region, 271±15µGy/day in the SAA and 34±3µGy/day in the remainingregion. GCR values are lower than those presented in [22] of 146.74 µGy/day (GCR)and in [9] of 172.8µGy/day. However, in the previous experiments the instrumentsensitivity extended below the SilEye limit of 1 keV/µ. In addition, in [22] a tissueequivalent proportional counter is used so that the LET in water is measured. In [9] themeasurement is made in silicon and the relation LET∞ = 1.193 × LETsilicon (whereLET∞ is the LET in water) is used. If we consider the SAA, the value presented by[22] is 233.31µGy/day, in good agreement with our measurement although they arelower than the value of 6912µGy/day of [9] due to the increased flux of high energytrapped protons which release less than 1 keV/µm. In all cases we find in the SAA(as expected) the highest absorbed dose due to the presence of trapped protons. Theequivalent dose, however, is at the maximum in the L > 2 region where cutoff is lowestand Z > 5 particle flux is higher: the dose equivalent (ICRP-1990) values are 840±50µSv/day in the L > 2 region, 600 ±40µSv/day in the SAA and 250 ±20µSv/dayin the remaining low latitude region.
4. Conclusions
In this work we have presented the in-flight performance of the SilEye-2 detectorand its first observational results. The good behaviour of the detector and its particleidentification capabilities enable the study of the cosmic ray and radiation environmentand its short- and long-term temporal variations. Analysis is currently in progress to

Cosmic ray abundances inside Mir with SilEye-2 experiment 9
determine relative abundances and fluxes in these conditions and in presence of SolarParticle Events and to improve the identification capabilities of the device for low Znuclei and at lower energies. Linear Energy Transfer measurements will be as wellused to characterize the radiation environment on board Mir space station in solarquiet and active days.Development is planned for a future detector with the construction of two new devicesto continue and extend the observational capabilities of SilEye-2 on the InternationalSpace Station: Sileye-3/Alteino. This detector, to be launched in 2002, is similarin size (8 wafers each 8 × 8cm2) to Sileye-2 and, in addition to new electronics anddetectors, will also carry an electroencephalograph to perform a real time correlationbetween Light Flash perceptions by astronauts and cosmic rays. The technologydeveloped for SilEye-3 will be used in the construction of a larger facility, originallyproposed in [19] and evolved in the Altea (SilEye-4) project[20], currently underdevelopment.
References
[1] Selesnick R S, Cummings A C, Cummings J R, Mewaldt R A, Stone E C and von RosenvingeT T 1995 J. Geophys Res. 100 (A6) 9503
[2] Tobias C A 1952 J. Aviat. Med. 23 345[3] D’arcy F J and Parker N A 1962 Nature 196 1013[4] Malachowski M J 1978 LBL Report LBL-5683, National Technical Information Service,
Springfield, Virginia[5] Horneck G 1992 Nucl. Tracks Radiat. Meas. 20 1 185[6] McIlwain C E, 1961 JGR 66, 3681[7] McNulty P J 1996 IEEE Trans. on Nucl. Sci. 43 2 475[8] Reitz G et al. 1996 Radiat. Meas. 26 6 679[9] Sakaguchi T, Doke T, Hasebe N, Hayashi T, Kashiwagi T, Kikuchi J, Kono S, Nagaoka S,
Nakano T, Takagi T, Takahashi K and Takahashi S 1999 NIM A 437 75[10] Galper A, et al. 1996 Proc. of the Sixth European Symposium on Life Sciences Research in
Space 17-21 June, Trondheim, Norway[11] Morselli A, et al. , 1997 Proc. of the XXV ICRC Durban OG 10.2.8, 5 45[12] Bidoli V, Casolino M, De Pascale M, Furano G, Morselli A, Picozza P, Reali E, Sparvoli
R, Galper A, Ozerov Yu, Popov A, Zemskov V, Zverev V, Alexandrov A, Avdeev S,Shabelnikov V, Boezio M, Carlson P, Fuglesang C, Barbellini G 1997 NIM A 399 477
[13] Bidoli V, Casolino M, De Pascale M P, Furano G, Morselli A, Narici L, Picozza P, RealiE, Sparvoli R, Galper A, Ozerov Y, Popov A, Vavilov N R, Alexandrov A P, Avdeev S,Carlson P, Fuglesang C, 2000 Adv. Space Res. 10 2075
[14] Avdeev, S. et al., submitted to Acta Astronautica.[15] Bidoli V, Canestro A, Casolino M, De Pascale M P, Furano G, Iannucci A, Morselli A,
Picozza P, Reali E, Sparvoli R, Bakaldin A, Galper A, Koldashov S, Korotkov M, LeonovA, Mikhailov V, Murashov A, Voronov S, Boezio M 2001 ApJS 132 2 365
[16] Sparvoli R, Bidoli B, Canestro A, Casolino M, DePascale M P, Furano G, Iannucci A, MorselliA, Picozza P, Bakaldin A, Galper A, Koldashov S, Korotkov M, Leonov A, Mikhailov V,Murashov A 2000 Nuclear Physics B (Proc. Suppl.) 85 28
[17] Spillantini P 2000 Nuc. Pys. B (proc. suppl.) 85 3[18] Ziegler J F 1985 The Stopping and Range of Ions in Solids Pergamon Press[19] Casolino M, De Pascale M P, Furano G, Morselli A, Narici L, Picozza P, Reali E, Sparvoli,
Adriani O, Spillantini P, Castellini G, Bartalucci S, Catena C, Conti D, Ricci M 1997 NuovoCimento D 19 10
[20] Bidoli V, Casolino M, De Pascale M P, Furano G, Morselli A, Narici L, Picozza P, Reali E,Sparvoli R, Galper A, Ozerov Y, Popov A, Vavilov N R, Alexandrov A P, Avdeev S 1999ESA SP-433
[21] Simpson J A 1983 Ann. Rev. Nucl. Part. Sci., 33, 323.[22] Badhwar D, Cucinotta F A 1998 Rad. Res., 149, 209

Cosmic ray abundances inside Mir with SilEye-2 experiment 10
Table 1. Left: Threshold energy for absorption in 3mm Al of the hull of Mir(Eabs); Center: Threshold energy (after entrance in the Mir) for trigger (Emin);Right: Threshold energy for constant energy loss in the detector (Econ) (see text).
Z Eabs (MeV/n) Emin (MeV/n) Econ (3mm Al) (MeV/n)
1 H 24 30 602 He 24 37 653 Li 28 40 754 Be 34 50 905 B 39 50 1056 C 45 70 1157 N 49 65 1258 O 53 80 1409 F 55 80 145
10 Ne 60 90 15011 Na 61 95 15512 Mg 66 100 16514 Si 71 110 18518 S 77 120 20020 Ca 88 140 23026Fe 98 150 250
Table 2. Relative abundances normalized to carbon in the three regions forparticle with E > Econ (see text).
Z L > 2 L ≤ 2 SAA 600-1000 MeV/n [21](C > 0.6 GV ) (C > 3.9 GV ) (C > 3.9 GV )
5 (B) 0.63 ± 0.09 0.53 ± 0.35 0.55 ± 0.09 0.307 ± 0.0056 (C) 1 ± 0.1 1 ± 0.06 1 ± 0.12 1 ± 0.027 (N) 0.41 ± 0.06 0.34 ± 0.08 0.22 ± 0.04 0.274 ± 0.0078 (O) 0.65 ± 0.07 0.66 ± 0.08 0.77 ± 0.17 0.93 ± 0.02
10 (Ne) 0.33 ± 0.06 0.13 ± 0.02 0.12 ± 0.02 0.149 ± 0.00412 (Mg) 0.07 ± 0.02 0.13 ± 0.02 0.12 ± 0.02 0.187 ± 0.00514 (Si) 0.05 ± 0.02 0.1 ± 0.02 0.1 ± 0.02 0.13158 ± 0.00003
Table 3. Integral fluxes measured in the three regions above for particles withE > Econ of Table 1.
Z L > 2 L ≤ 2 SAA(C > 0.6 GV ) (C > 3.9 GV ) (C > 3.9 GV )
part/(cm2 sr s) part/(cm2 sr s) part/(cm2 sr s)
5 (B) (6.6 ± 0.6) × 10−5 (1.6 ± 1) × 10−5 (1.5 ± 0.2) × 10−5
6 (C) (10.5 ± 0.5) × 10−5 (3.0 ± 0.1) × 10−5 (2.6 ± 0.2) × 10−5
7 (N) (4.3 ± 0.5) × 10−5 (1.0 ± 0.2) × 10−5 (0.59 ± 0.08) × 10−5
8 (O) (6.8 ± 0.4) × 10−5 (2.0 ± 0.2) × 10−5 (2.0 ± 0.3) × 10−5
10 (Ne) (3.5 ± 0.5) × 10−5 (0.38 ± 0.03) × 10−5 (0.31 ± 0.06) × 10−5
12 (Mg) (0.7 ± 0.2) × 10−5 (0.39 ± 0.05) × 10−5 (0.33 ± 0.06) × 10−5
14 (Si) (0.5 ± 0.2) × 10−5 (0.29 ± 0.15) × 10−5 (0.26 ± 0.05) × 10−5

Cosmic ray abundances inside Mir with SilEye-2 experiment 11
Figure 1. Photo of the SilEye-2 helmet and detector case: 1. Head Mounting.2. Eye mask with internal LEDs. 3. Detector Box. 4. Connection cable for theLEDs used for dark adaptation tests .

Cosmic ray abundances inside Mir with SilEye-2 experiment 12
Figure 2. Scheme of the SilEye-2 silicon detector: six 16 strip silicon layers gluedin pairs with strip orthogonally aligned form three planes (the two layers of thefirst plane are drawn separately). The position of the eye bulb is also shown.

Cosmic ray abundances inside Mir with SilEye-2 experiment 13
Pedestal Average (ADC Channels) 60 70 80 90 100 110 120
Nu
mb
er o
f en
trie
s
0
2
4
6
8
10
12
14
Pedestal RMS (ADC Channels) 0 2 4 6 8 10 12 14
Nu
mb
er o
f en
trie
s
0
10
20
30
40
50
60
70
80
90
Figure 3. Top: Histogram of the average value of the electronic pedestals ofeach detector strip. The data refers to the sessions of 14/02/98 (thin line) and31/07/99 (thick line). Bottom: Histogram of the RMS value of the electronicpedestals for the sessions of 14/02/98 (thin line) and 31/07/99 (thick line).

Cosmic ray abundances inside Mir with SilEye-2 experiment 14
Figure 4. Particle rate as a function of time for a typical acquisition session.Top line: acquisition rate for all events; Center line: Particle rate of Z ≤ 4,E > 40 MeV/n, Bottom line: Particle rate of Z > 4, E > 40 MeV/n. The peakswith rate of about 0.3 Hz correspond to passage in the northern (N) or southern(S) regions; the peaks above 1 Hz correspond to passage in the South AtlanticAnomaly (SAA)

Cosmic ray abundances inside Mir with SilEye-2 experiment 15
Figure 5. Acquisition rate as a function of position (Y: latitude - degrees, X:longitude - degrees) for all solar quiet sessions. It is possible to see the increasein the SAA region. Each contour level represents a flux increase of 3 Hz.

Cosmic ray abundances inside Mir with SilEye-2 experiment 16
Figure 6. Nuclear identification capabilities of SilEye-2 for nuclei up to Si. In theinset is shown the contribution of nuclei up to Ni. The continuous line correspondsto a fit using a sum of 10 Landau distributions, one per nuclear species (see text).

Cosmic ray abundances inside Mir with SilEye-2 experiment 17
Figure 7. High energy nuclear abundances: Continuous line: galactic (L > 2)component; Dotted line: SAA component (L < 2, B < 0.25G); Dashed line:remaining region (L < 2, B ≥ 0.25G). The SAA region has a higher proton fluxdue to trapped particles but Z > 5 particles are equally abundant to the L < 2region due to the equivalent cutoff. In case of the galactic component, the lowergeomagnetic cutoff results in a higher integral particle flux so that Z > 5 nucleiare more abundant.

Cosmic ray abundances inside Mir with SilEye-2 experiment 18
Figure 8. Linear Energy Transfer in silicon for solar quiet period measured withSilEye-2 (solar quiet sessions between August 1998 and August 1999). Top: SAAregion. Center: galactic (L > 2) region. Bottom: remaining region (L < 2,outside the SAA.