edge detection in image
TRANSCRIPT

Faculty of Electrical Engineering and Information Technology Slovak University of Technology, Bratislava, Slovak Republic
June 4, 2014
- 1 -
16th Conference of Doctoral Students ELITECH ’14
EDGE DETECTION IN IMAGE
O. Haffner – R. Ravas
Faculty of Electrical Engineering and Information Technology, Slovak University of Technology in Bratislava,
Ilkovičova 3, 812 19 Bratislava, Slovak Republic( e-mail: [email protected], [email protected])
Abstract: The aim of the paper is overview of methods for edge detectionin image and their feature comparison. Each method was tested andcompared on the set of artificial images. The noise and blur filter wereadded to these images in the next step. Also the real images were used.There are no objective criteria for edge detecting methods evaluation, sowe designed our own ones. One of the detecting method was programmed withmistaken algorithm which led to discovering that edge detectors can beused not only in industrial application but also in graphical software.
Keywords: edge, detection, brightness change, image processing
Faculty of Electrical Engineering and Information Technology Slovak University of Technology, Bratislava, Slovak Republic
June 4, 20141 INTRODUCTION
In various computer vision tasks(3-D reconstruction, imagerecognition) it is important to findfind the significant areas in image,called features. Features are cornerpoints and edges of objects. From the neurophysiological view,
for the organism there are importantplaces in images with rapidlychanged brightness. These placescarry more information than other.Edge is a border between two areas
with different brightness level. Themain idea of edge detecting is tofind the place, where the brightnesslevel is strongly changed. (Hlaváčand Sedláček, 2001)The ideal result of edge detecting
filter is the file of closed curveswhich represent borders of objects,borders of surfaces or changing thesurface orientation. It is possibleto reduce the amount of imageinformation using edge detectionalgorithms and less importantinformation can be filtered out.After successful edge detecting, theinterpretation of image informationcan be rapidly easier. However,getting ideal closed edges from reallife images is much more difficult.Results from real life images areoften discontinuous, cut off, missedor fake.Brightness level can be detected by
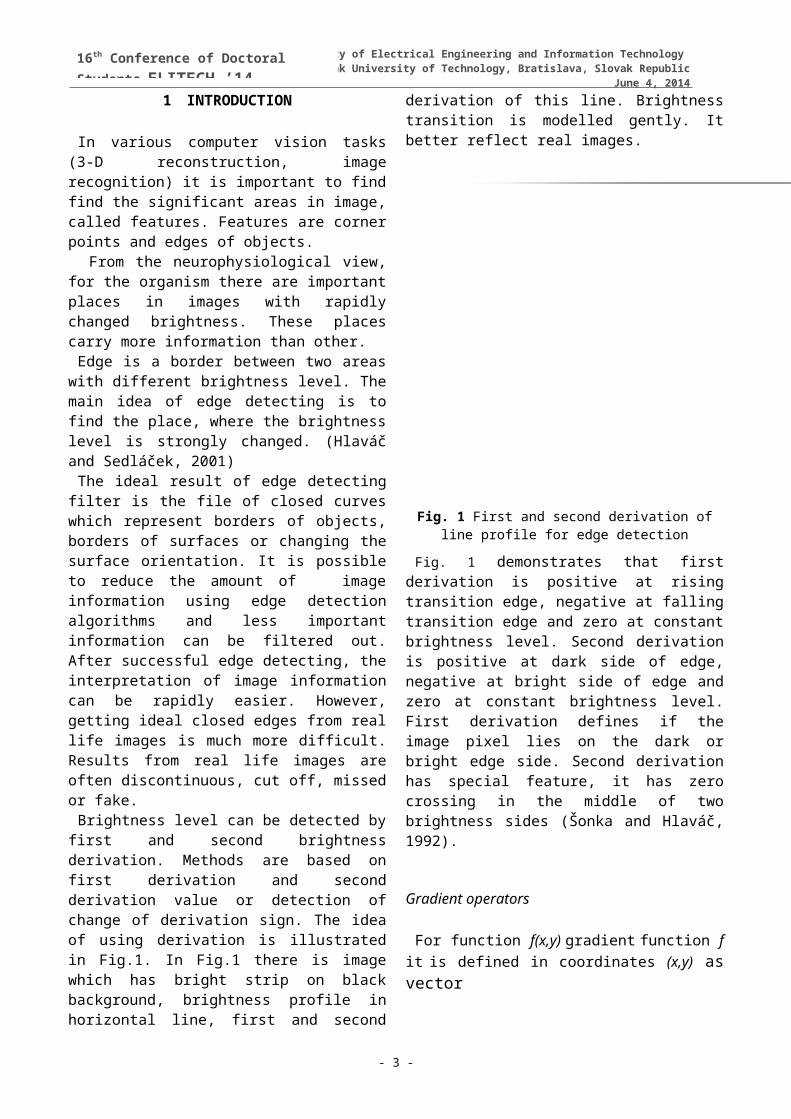
first and second brightnessderivation. Methods are based onfirst derivation and secondderivation value or detection ofchange of derivation sign. The ideaof using derivation is illustratedin Fig.1. In Fig.1 there is imagewhich has bright strip on blackbackground, brightness profile inhorizontal line, first and second
derivation of this line. Brightnesstransition is modelled gently. Itbetter reflect real images.
Fig. 1 First and second derivation ofline profile for edge detection
Fig. 1 demonstrates that firstderivation is positive at risingtransition edge, negative at fallingtransition edge and zero at constantbrightness level. Second derivationis positive at dark side of edge,negative at bright side of edge andzero at constant brightness level.First derivation defines if theimage pixel lies on the dark orbright edge side. Second derivationhas special feature, it has zerocrossing in the middle of twobrightness sides (Šonka and Hlaváč,1992).
Gradient operators
For function f(x,y) gradient function fit is defined in coordinates (x,y) asvector
- 3 -
16th Conference of Doctoral Students ELITECH ’14
Faculty of Electrical Engineering and Information Technology Slovak University of Technology, Bratislava, Slovak Republic
June 4, 2014
(1)
Gradient vector has direction inthe fastest reached f change in (x,y).For edge detection it is veryimportant module of this vector,generally called gradient andsymbolic named
(2)
For calculation simplifyinggradient approximation is used inpractice using absolute value
(3)
Which is much easier forimplementation.Operators are able to express as a
convolution mask. Operators will bestated using convolution core h(Dobeš, 2008).
Roberts operator
Roberts operator is the oldest andit is very simple. It usesneighbourhood only 2x2 forrepresentative pixel. Itsconvolution masks are
(4)
The main Roberts operatordisadvantage is high noisesensitivity, because the smallneighbourhood is used forapproximation.
Prewitt operator
Prewitt operator approximate firstderivation. In the neighbourhood 3x3the gradient is estimated for 8directions. Mask which has thehighest module is chosen. It ispossible to create larger mask
with more accurate directionresolution. We show only first 2convolution masks, others arecreated using only rotation
(5)
Sobel operator
Sobel operator derivate but alsosmooth. Derivation by itselfhighlights the noise so the smootheffect is useful. Convolution maskis created by rotation.
(6)
Laplace operator
Laplace operator, the secondderivation, represents the speed ofbrightness change. It shows up atthe sharp or isolated edges or itcan be used for detecting isolatedpoints - also noise will behighlighted. The second derivationin direction x is possible tocalculate as difference of neighbourpixel brightness difference. Laplaceoperator can be used for isolatedpoints detection. Masks for Laplaceoperator can be in positive ornegative variant
(7)
- 4 -
16th Conference of Doctoral Students ELITECH ’14
Faculty of Electrical Engineering and Information Technology Slovak University of Technology, Bratislava, Slovak Republic
June 4, 2014Together with Laplace operator it
is used smoothing Gauss filter. Thenwe call it the Laplacian of Gaussian- LoG. (Klíma et al., 1999) Approximation of LoG in 5x5 mask is
(8)
Canny edge detector
Canny edge detector realizes theprinciple of different resolutionsand search for the best of them. Themain idea is that the stepped edge(in 2D picture as a step) can befound using a filter. Design of thisfilter is formulated as calculus ofvariation task i.e. searching forthe best impulse function of filter.Nowadays Canny edge detector isadvanced edge detector. (Šonka etal., 2008)
2 REALISATION AND EVALUATION OFALGORITHM FOR EDGE DETECTION
Algorithms for edge detection wereimplemented in program environmentMATLAB. The functions of ImageProcessing Toolbox were used. Themain function is “edge”. In thisfunction Sobels, Prewitts andRoberts method is implemented. Thismethods returns edge where gradientis maximal.
Next method is zero-cross withLaplacian of Gaussian (LoG) filterusing. In this method there is ableto set SIGMA parameter as standard
deviation for LoG filter. In ourcase we use default value 2. Thesize of filter is computed byexpression CEIL(SIGMA*3)*2+1, whereCEIL rounds the number.
For easier work, the methods wereimplemented in graphic userinterface.
Evaluation and comparison of methods features
Set of artificial and real imageswere created for comparison ofmethods. In the first step, themethods are compared using theabsolute number of found edges. Inthe second step, the methods arecompared subjective using visualevaluation of edge quality, edgethickness, edge interruption, noiseor edge deformation.
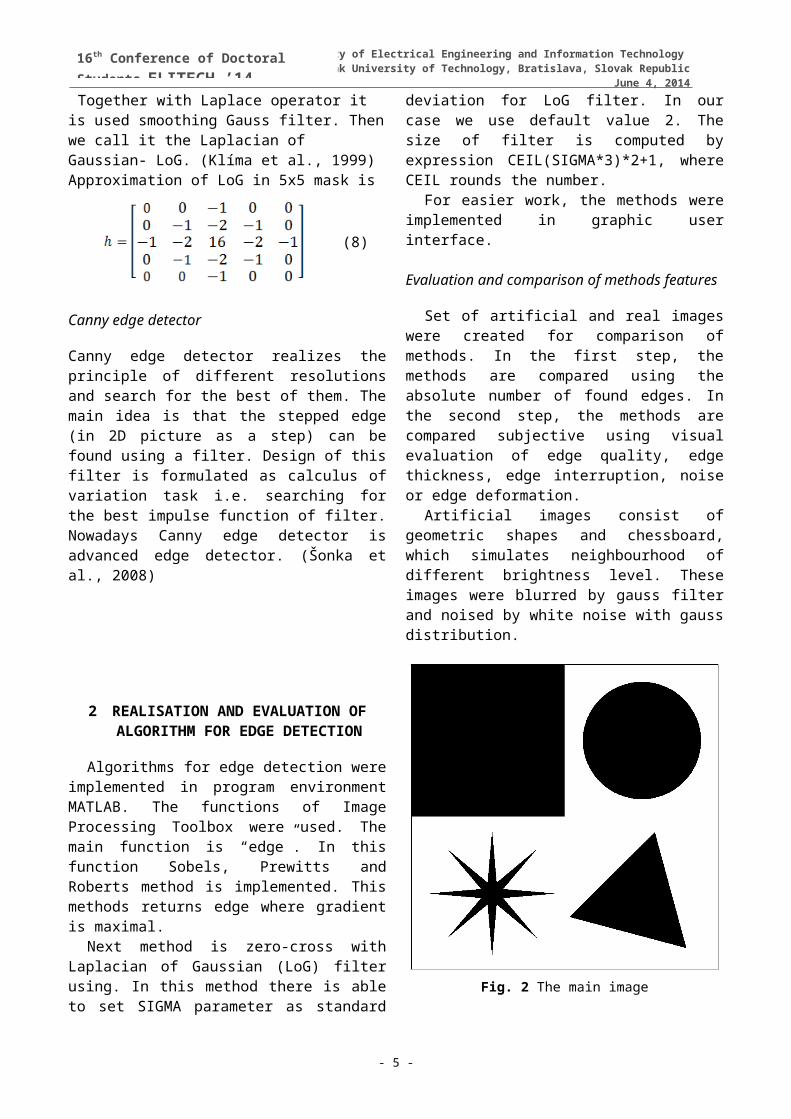
Artificial images consist ofgeometric shapes and chessboard,which simulates neighbourhood ofdifferent brightness level. Theseimages were blurred by gauss filterand noised by white noise with gaussdistribution.
Fig. 2 The main image
- 5 -
16th Conference of Doctoral Students ELITECH ’14
Faculty of Electrical Engineering and Information Technology Slovak University of Technology, Bratislava, Slovak Republic
June 4, 2014At first, methods were compared
using Fig. 2. Image representssimple geometric shapes. We canwatch methods behaving on horizontaland vertical lines, sharp corners,leaning lines, circle.
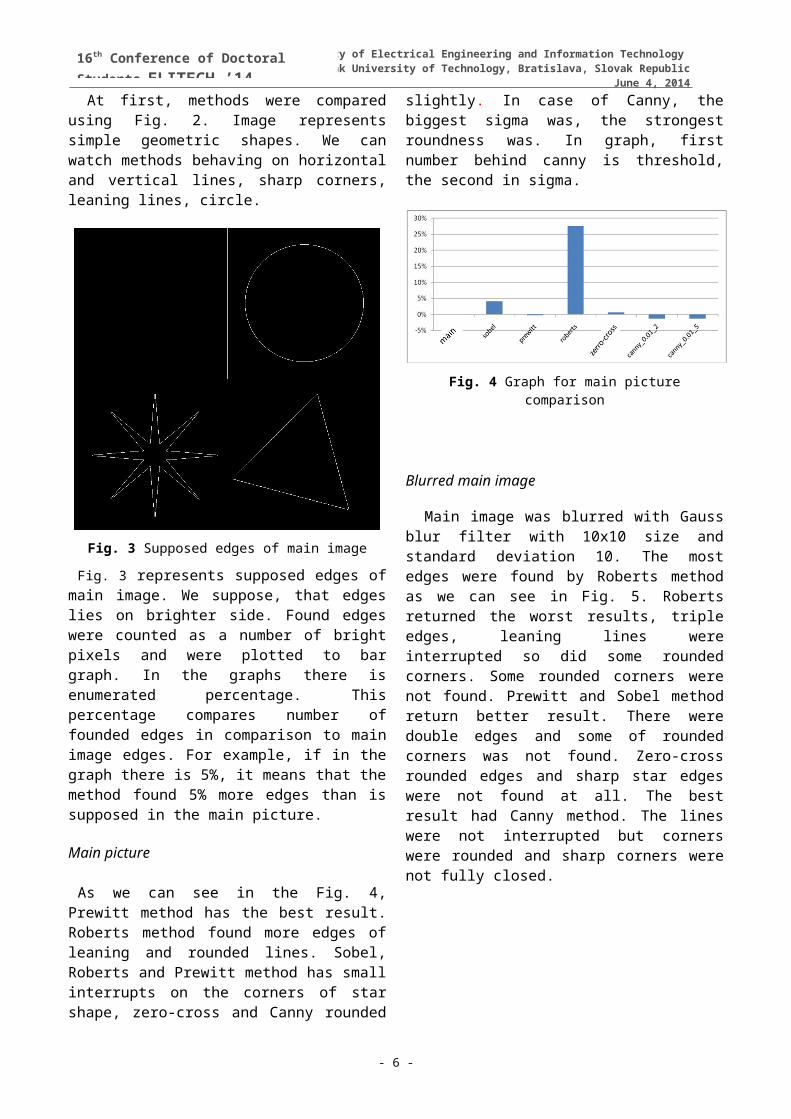
Fig. 3 Supposed edges of main image
Fig. 3 represents supposed edges ofmain image. We suppose, that edgeslies on brighter side. Found edgeswere counted as a number of brightpixels and were plotted to bargraph. In the graphs there isenumerated percentage. Thispercentage compares number offounded edges in comparison to mainimage edges. For example, if in thegraph there is 5%, it means that themethod found 5% more edges than issupposed in the main picture.
Main picture
As we can see in the Fig. 4,Prewitt method has the best result.Roberts method found more edges ofleaning and rounded lines. Sobel,Roberts and Prewitt method has smallinterrupts on the corners of starshape, zero-cross and Canny rounded
slightly. In case of Canny, thebiggest sigma was, the strongestroundness was. In graph, firstnumber behind canny is threshold,the second in sigma.
Fig. 4 Graph for main picturecomparison
Blurred main image
Main image was blurred with Gaussblur filter with 10x10 size andstandard deviation 10. The mostedges were found by Roberts methodas we can see in Fig. 5. Robertsreturned the worst results, tripleedges, leaning lines wereinterrupted so did some roundedcorners. Some rounded corners werenot found. Prewitt and Sobel methodreturn better result. There weredouble edges and some of roundedcorners was not found. Zero-crossrounded edges and sharp star edgeswere not found at all. The bestresult had Canny method. The lineswere not interrupted but cornerswere rounded and sharp corners werenot fully closed.
- 6 -
16th Conference of Doctoral Students ELITECH ’14
Faculty of Electrical Engineering and Information Technology Slovak University of Technology, Bratislava, Slovak Republic
June 4, 2014
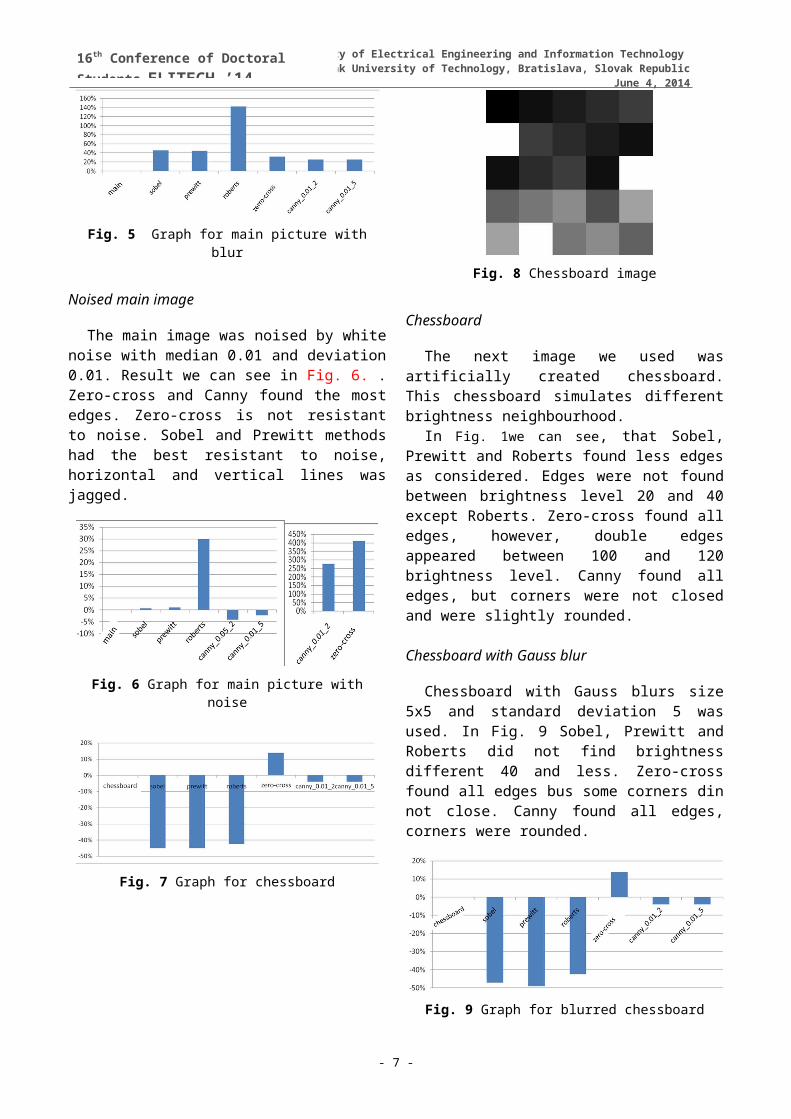
Fig. 5 Graph for main picture withblur
Noised main image
The main image was noised by whitenoise with median 0.01 and deviation0.01. Result we can see in Fig. 6. .Zero-cross and Canny found the mostedges. Zero-cross is not resistantto noise. Sobel and Prewitt methodshad the best resistant to noise,horizontal and vertical lines wasjagged.
Fig. 6 Graph for main picture withnoise
Fig. 7 Graph for chessboard
Fig. 8 Chessboard image
Chessboard
The next image we used wasartificially created chessboard.This chessboard simulates differentbrightness neighbourhood.
In Fig. 1we can see, that Sobel,Prewitt and Roberts found less edgesas considered. Edges were not foundbetween brightness level 20 and 40except Roberts. Zero-cross found alledges, however, double edgesappeared between 100 and 120brightness level. Canny found alledges, but corners were not closedand were slightly rounded.
Chessboard with Gauss blur
Chessboard with Gauss blurs size5x5 and standard deviation 5 wasused. In Fig. 9 Sobel, Prewitt andRoberts did not find brightnessdifferent 40 and less. Zero-crossfound all edges bus some corners dinnot close. Canny found all edges,corners were rounded.
Fig. 9 Graph for blurred chessboard
- 7 -
16th Conference of Doctoral Students ELITECH ’14
Faculty of Electrical Engineering and Information Technology Slovak University of Technology, Bratislava, Slovak Republic
June 4, 2014
Chessboard with noise
Chessboard with white noise withmedian 0.01 and deviation 0.01 wasused. Fig. 10 shows, that ingeneral, all methods had badresults. The worst results had zero-cross. It did not find a lot ofedges and found a lot of fakeedges. Sobel, Prewitt and Robertsdid not find some edges and somewere fake. The best results hadCanny with threshold 0.2, when fakeedges were filtered out but someedges were lost.
Fig. 10 Graph for noised chessboard
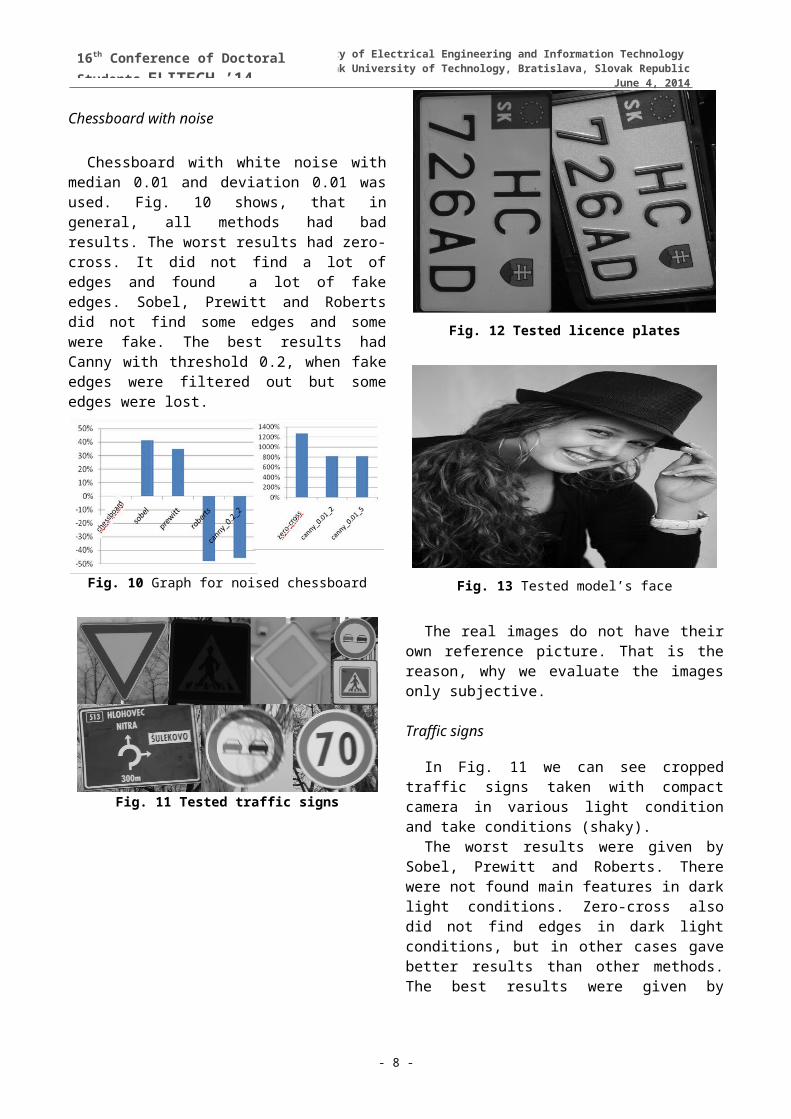
Fig. 11 Tested traffic signs
Fig. 12 Tested licence plates
Fig. 13 Tested model’s face
The real images do not have theirown reference picture. That is thereason, why we evaluate the imagesonly subjective. Traffic signs
In Fig. 11 we can see croppedtraffic signs taken with compactcamera in various light conditionand take conditions (shaky).
The worst results were given bySobel, Prewitt and Roberts. Therewere not found main features in darklight conditions. Zero-cross alsodid not find edges in dark lightconditions, but in other cases gavebetter results than other methods.The best results were given by
- 8 -
16th Conference of Doctoral Students ELITECH ’14
Faculty of Electrical Engineering and Information Technology Slovak University of Technology, Bratislava, Slovak Republic
June 4, 2014Canny, it found partial edges alsoin dark light.
Licence plates
In Fig. 12 we can see licenceplates from motorcycle taken underdirect sunlight and in shadow.
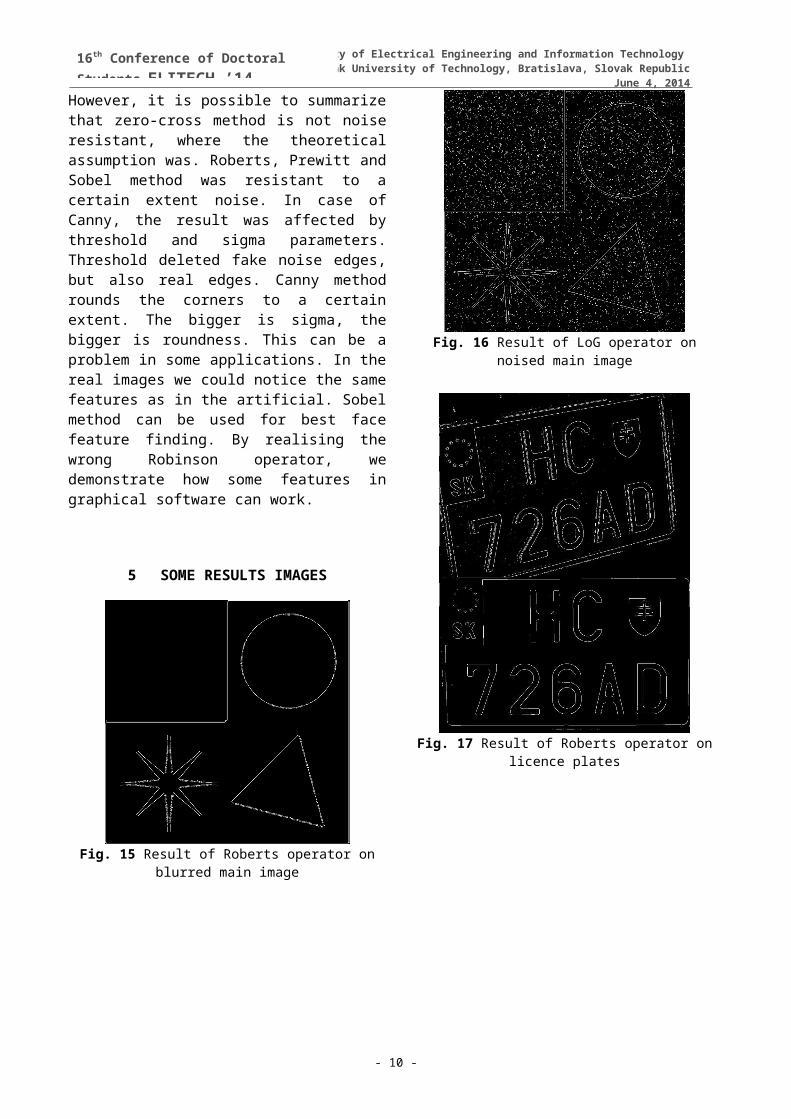
Sobel, Prewitt and Roberts gavegood results. In case of shadow,they gave clear number and lettercontours. Under direct sunlight,there were problems with sharpreflections. However, they gaveaverage results with shimmersurface. Zero-cross had problemswith shimmer surface. It found fakeedges and some double edges. Thebest results gave Canny with properparameters. In lighted plate it didnot find any noise edges, inunlighted it found number and lettercontours properly.
Models face
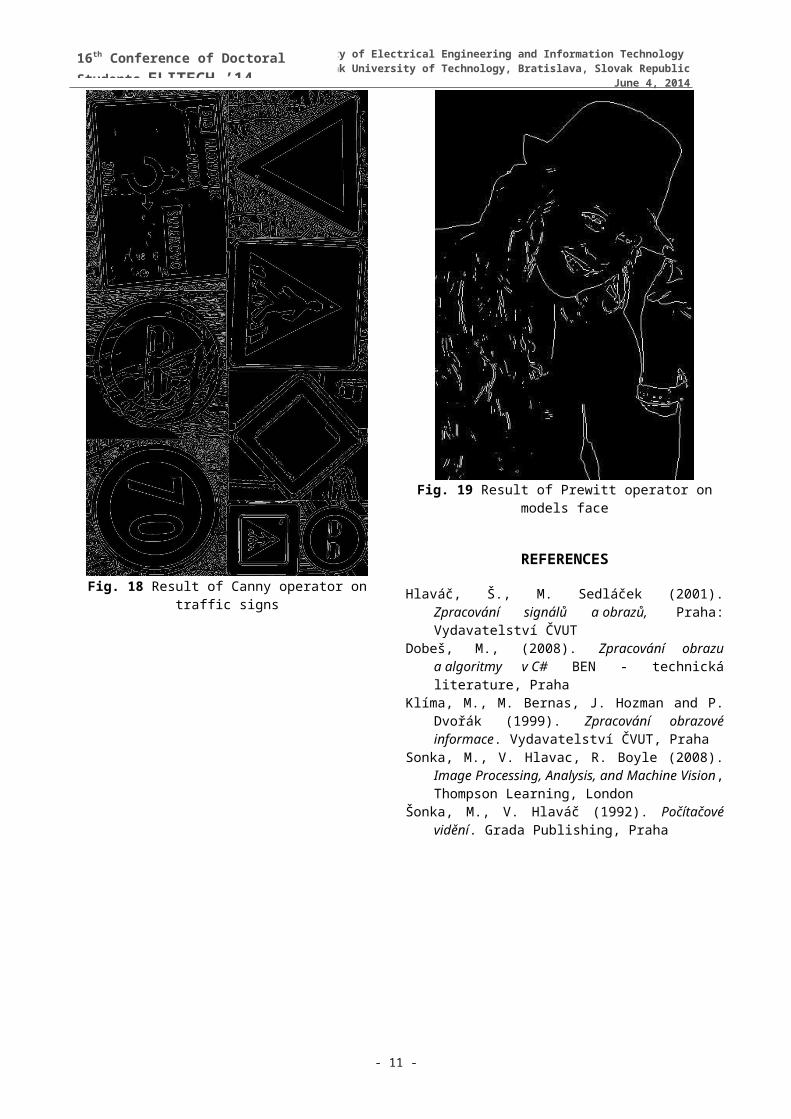
In Fig. 13 we can see testedportrait. In this case, it is verydifficult to say, which features areimportant. In general, all methodsfound figure contours; some of themface features - eyes, nose andmouth. Canny with threshold 0.2 andsigma 3.6 found the less of thesefeatures. The best face featureswere found by Sobel.
3 INTERESTING RESULTS FROM WRONGREALISED ALGORITHM
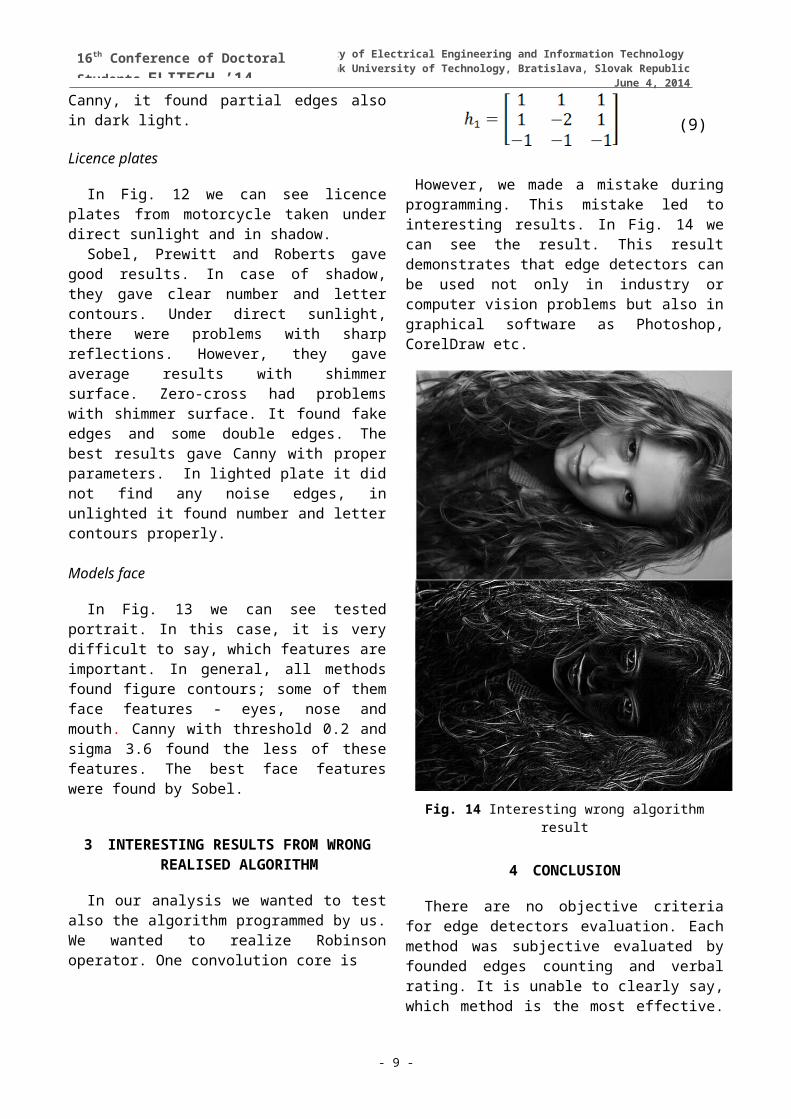
In our analysis we wanted to testalso the algorithm programmed by us.We wanted to realize Robinsonoperator. One convolution core is
(9)
However, we made a mistake duringprogramming. This mistake led tointeresting results. In Fig. 14 wecan see the result. This resultdemonstrates that edge detectors canbe used not only in industry orcomputer vision problems but also ingraphical software as Photoshop,CorelDraw etc.
Fig. 14 Interesting wrong algorithmresult
4 CONCLUSION
There are no objective criteriafor edge detectors evaluation. Eachmethod was subjective evaluated byfounded edges counting and verbalrating. It is unable to clearly say,which method is the most effective.
- 9 -
16th Conference of Doctoral Students ELITECH ’14
Faculty of Electrical Engineering and Information Technology Slovak University of Technology, Bratislava, Slovak Republic
June 4, 2014However, it is possible to summarizethat zero-cross method is not noiseresistant, where the theoreticalassumption was. Roberts, Prewitt andSobel method was resistant to acertain extent noise. In case ofCanny, the result was affected bythreshold and sigma parameters.Threshold deleted fake noise edges,but also real edges. Canny methodrounds the corners to a certainextent. The bigger is sigma, thebigger is roundness. This can be aproblem in some applications. In thereal images we could notice the samefeatures as in the artificial. Sobelmethod can be used for best facefeature finding. By realising thewrong Robinson operator, wedemonstrate how some features ingraphical software can work.
5 SOME RESULTS IMAGES
Fig. 15 Result of Roberts operator onblurred main image
Fig. 16 Result of LoG operator onnoised main image
Fig. 17 Result of Roberts operator onlicence plates
- 10 -
16th Conference of Doctoral Students ELITECH ’14
Faculty of Electrical Engineering and Information Technology Slovak University of Technology, Bratislava, Slovak Republic
June 4, 2014
Fig. 18 Result of Canny operator ontraffic signs
Fig. 19 Result of Prewitt operator onmodels face
REFERENCES
Hlaváč, Š., M. Sedláček (2001).Zpracování signálů a obrazů, Praha:Vydavatelství ČVUT
Dobeš, M., (2008). Zpracování obrazua algoritmy v C# BEN - technickáliterature, Praha
Klíma, M., M. Bernas, J. Hozman and P.Dvořák (1999). Zpracování obrazovéinformace. Vydavatelství ČVUT, Praha
Sonka, M., V. Hlavac, R. Boyle (2008).Image Processing, Analysis, and Machine Vision,Thompson Learning, London
Šonka, M., V. Hlaváč (1992). Počítačovévidění. Grada Publishing, Praha
- 11 -
16th Conference of Doctoral Students ELITECH ’14