analysis of rapideye’s red edge band for image segmentation and classification
TRANSCRIPT
¯¯¯¯¯¯¯¯¯¯¯¯¯¯¯¯¯¯¯¯¯¯¯¯¯¯¯¯¯
* Corresponding author.
ANALYSIS OF RAPIDEYE’S RED EDGE BAND FOR IMAGE SEGMENTATION AND
CLASSIFICATION
C. H. R. de Sousa a *, C. G. Souza a, L. Zanella b, L. M. T. de Carvalho a
a Departamento de Ciências Florestais, Universidade Federal de Lavras, Campus Universitário, Caixa Postal 3037, Lavras, MG,
Brasil – (celiohelder, carolinagusmaosouza)@gmail.com; [email protected] b Departamento de Ciências Biológicas, Universidade Federal de Lavras, Campus Universitário, Caixa Postal 3037, Lavras, MG,
Brasil – [email protected]
KEYWORDS: Multiresolution Segmentation, Land cover, Decision Tree, Accuracy, Attributes
ABSTRACT:
The objective of this study was to evaluate if a multi-resolution segmentation algorithm is sensitive to the RapidEye’s Red Edge band
and its benefits for vegetation mapping using GEOBIA and machine learning. We used a high-resolution multi-spectral RapidEye
image taken in June, 2010. This image was segmented with a multiresolution segmentation algorithm (MRIS) using a fine scale
parameter (300) and thirteen different weights (from ‘0’ to ‘100’) were assigned to the Red Edge spectral band to evaluate its
influence in the segmentation and classification process. Each weight generated a segmented image. Attributes related to spectral
information, geometry and texture were calculated for each image segment using the eCognition Developer®. Visual interpretation
was performed along with field data to select seven classes (Dense vegetation, Meadow, Mining area, Bare land, Rock outcrop,
Urban area and Water). A sample of 800 objects described by its attributes was selected from each segmented image. A decision tree
approach based on CART was applied to the samples to select the attributes that provides the best separation among the classes
within the scene. An accuracy assessment for the classification using CART was performed to compare the different weights
assigned to the Red edge spectral band. Results showed that the Red Edge channel had no significant influence on the segmentation
process. The attributes importance rank showed that the index derived from Red Edge channel can be used as input for image
classification.
1. INTRODUCTION
The use of remotely sensed images for mapping and monitoring
land cover had fundamental importance in recent decades, in
particular, due the development of new techniques and
computer programs that enhanced the analysis and manipulation
of these digital products.
Notable advances are being made in land cover mapping due the
technological advancement of the recent and upcoming sensors.
These advances rely mostly in the introduction of additional
bands in multi-spectral sensors. In this study, the wavelength
between red and near infrared (690 – 730 nm), called Red Edge
band, is particularly focused on. Because of its sensitivity to the
chlorophyll content of plants, this band is appropriate to
vegetation studies. Many studies have been conducted in order
to monitor biophysical parameters of vegetation to exploit the
importance of the Red Edge for these purposes using
spectroradiometry (Chang-Hua et al., 2010; Tian et al., 2011;
Ren et al., 2011) and airborne imagery (Schlerf et al., 2009). In
the context of spaceborne sensors, Delegido et al. (2011)
conducted a study for monitoring green leaf area index and
chlorophyll content using the Sentinel-2 Red Edge spectral
bands. They have found that Red Edge improved significantly
the accuracy of chlorophyll estimation.
RapidEye (Rapideye AG, 2011) represents a constellation of 5
multispectral satellites sensors which provide the Red Edge
band. These satellites are equally spaced around a sun-
synchronous orbit and have a spatial resolution of 5 meters
(resampled). Recent studies in land cover mapping suggest that
pixel-based approaches have disadvantages for such a high
resolution imagery. One alternative to the pixel-based approach
is the framework known as GEOBIA – Geographic Object-
Based Image Analysis (Hay and Castilla, 2008). Previous
studies have proved its advantages over the well-known pixel-
based approach (Ait Belaid et al., 1992; Herrera et al., 2004;
YU et al., 2006; Myint et al., 2011). The basic role of this new
approach is to merge the adjacent pixels into spectrally
homogeneous objects and lead the classification process as the
objects being the minimum unit of analysis.
Characteristics within a scene such as spatial resolution and the
number of bands can affect the segmentation results as well as
the final classification. Consequently, many segmentation
algorithms have been developed in recent years, all of them
aiming at homogeneous image segments. The multi-resolution
image segmentation (MRIS) implemented in eCognition
Developer® software is a frequently used algorithm in Earth
sciences (Blaschke, 2010). The MRIS offers the possibility to
assign different weights to the spectral bands of the image. In
this context, the evaluation of the influence of the spectral bands
on the process of segmentation might be considered relevant in
studies such vegetation mapping and land cover classification.
Schuster et al. (2010) evaluated the influence of RapidEye Red
Edge channel in the classification accuracy using a pixel-based
approach and they have found that the Red Edge led to a slight
improvement of the overall accuracy of the classification.
However, no studies exist to evaluate the influence of Red Edge
channel in high-resolution multispectral satellites on the image
segmentation process using the multiresolution segmentation
algorithm in an object-based approach.
1.1 Aims
The objective of this study is to evaluate if multi-resolution
segmentation is sensitive to the RapidEye Red Edge band and
its benefits for vegetation mapping using an object-based
Proceedings of the 4th GEOBIA, May 7-9, 2012 - Rio de Janeiro - Brazil. p.518
518
approach and a machine learning algorithm. Related research
questions are:
1) Does the Red Edge affect significantly the segmentation
process using a multi resolution segmentation algorithm?
2) Are land-use classifications based on multi-spectral
RapidEye satellite imagery sensitive for the Red Edge
spectral band or Red Edge derived indices?
3) Does the incorporation of the Red Edge spectral band
provide any improvement of the classification accuracy?
2. METODOLOGY
2.1. Study site and data
The Brazilian Atlantic Rainforest is one of the most important
biomes in the country and originally covered approximately 1
million square kilometers within 17 states, representing 16% of
the country area (Galindo-Leal and Câmara, 2003). However,
the Brazilian Atlantic Rainforest has been under severe pressure
since the colonial period due the agricultural cycles and the
expansion of cultivated areas. Nowadays, it occupies
approximately 98000 square kilometers, or 8% of its original
area and is still under strong anthropogenic activities resulting
in a high risk of extinction.
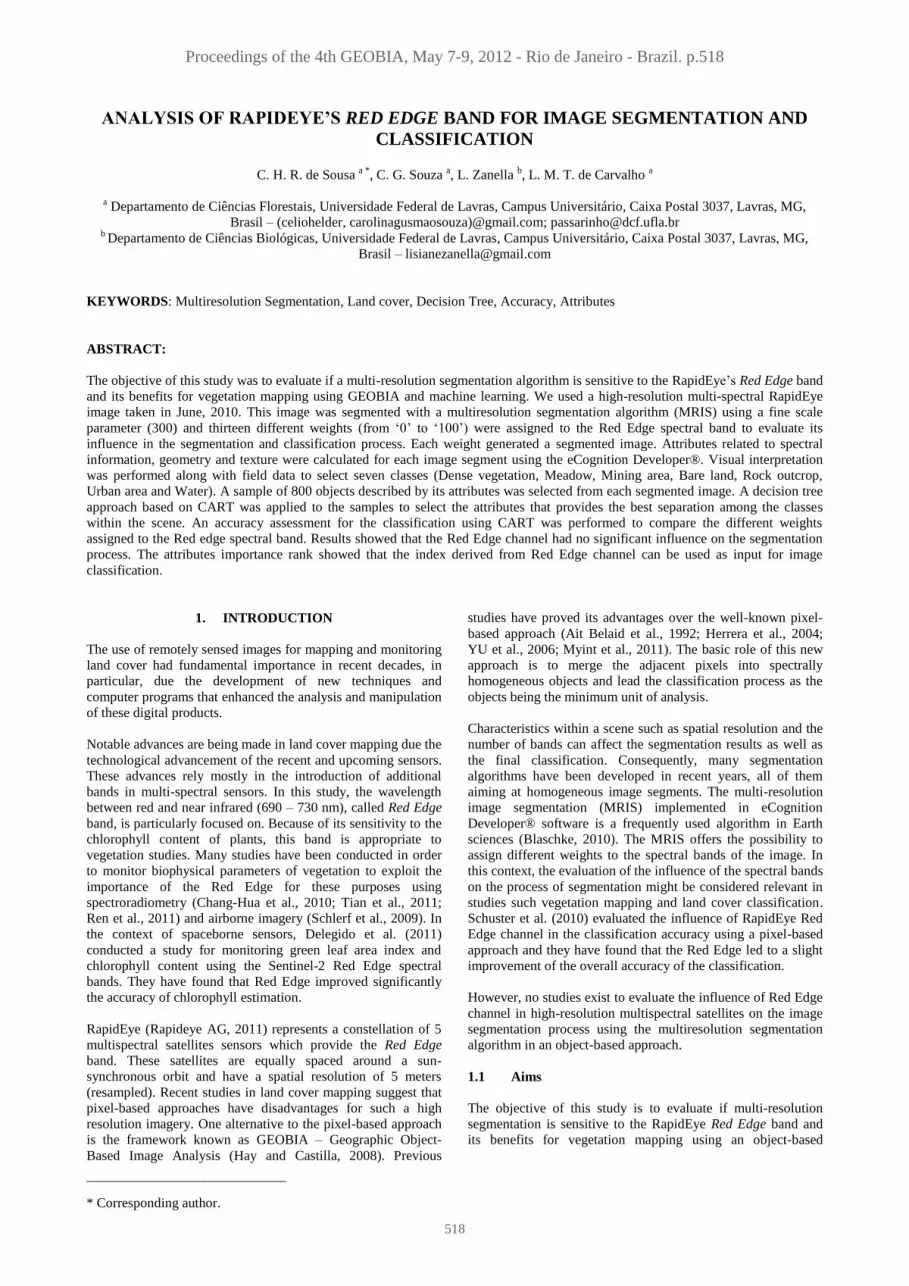
The study site is located in the central region of Minas Gerais,
Brazil, within the municipalities of Ouro Preto and Mariana
(Figure 1). This region holds the largest remnants of Brazilian
Atlantic Rainforest within the Minas Gerais state and is
considered an important biodiversity hotspot. This region is
characterized by a great diversity of environmental settings due
its predominant vegetation, urban areas, and mining areas.
Figure 1. Location of the study area in Minas Gerais, Brazil.
The data used for this study consists of one high-resolution
multi-spectral RapidEye imagery obtained from RapidEye AG
at standard processing level (orthorectified) by the Minas Gerais
state government. The RapidEye imagery was taken in June,
2010.
To evaluate the classification and segmentation results, as well
as to select the land cover classes, a visual interpretation of the
RapidEye imagery was performed along with the data from
Mapeamento da Flora Nativa e dos Reflorestamentos de Minas
Gerais (Scolforo and Carvalho., 2006).
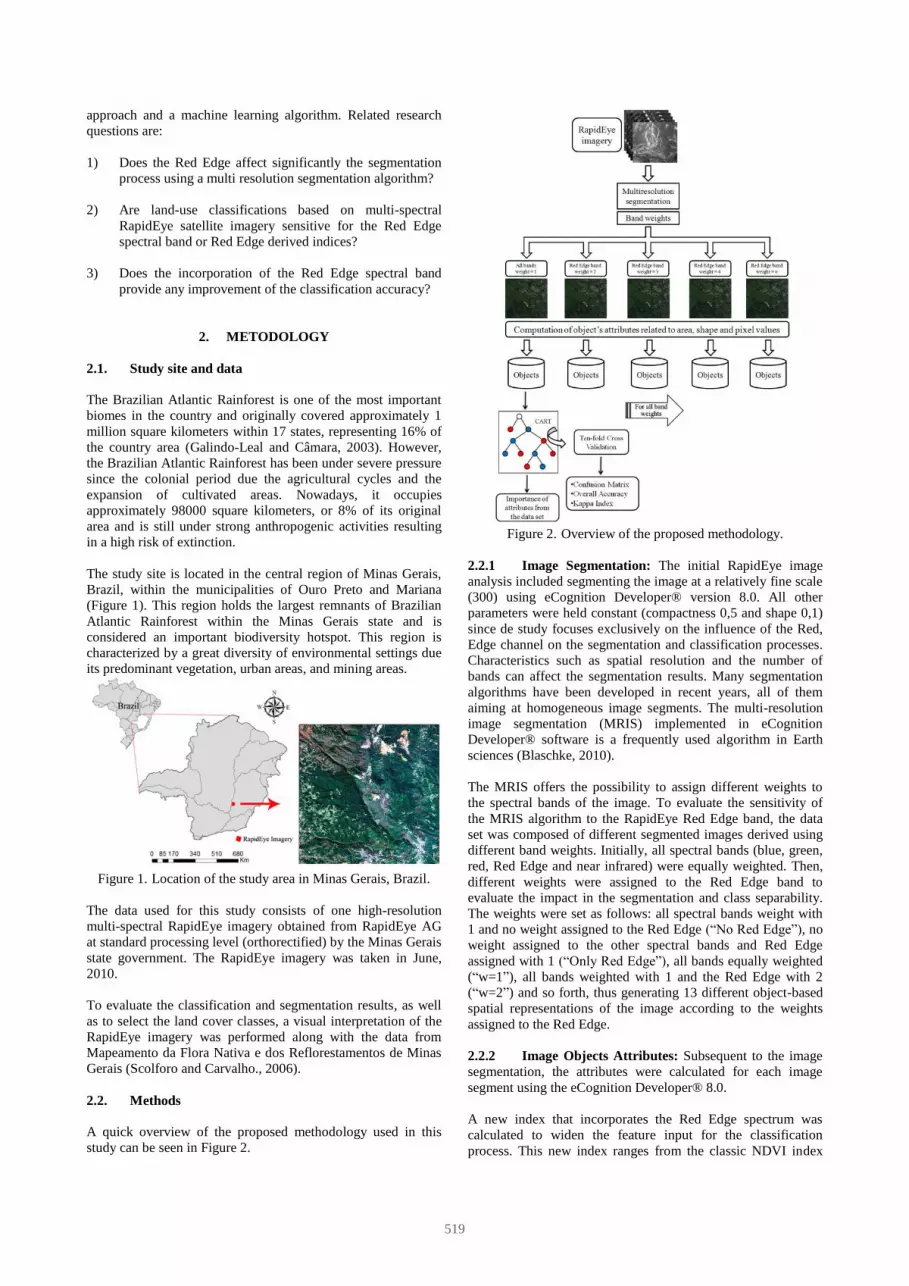
2.2. Methods
A quick overview of the proposed methodology used in this
study can be seen in Figure 2.
Figure 2. Overview of the proposed methodology.
2.2.1 Image Segmentation: The initial RapidEye image
analysis included segmenting the image at a relatively fine scale
(300) using eCognition Developer® version 8.0. All other
parameters were held constant (compactness 0,5 and shape 0,1)
since de study focuses exclusively on the influence of the Red,
Edge channel on the segmentation and classification processes.
Characteristics such as spatial resolution and the number of
bands can affect the segmentation results. Many segmentation
algorithms have been developed in recent years, all of them
aiming at homogeneous image segments. The multi-resolution
image segmentation (MRIS) implemented in eCognition
Developer® software is a frequently used algorithm in Earth
sciences (Blaschke, 2010).
The MRIS offers the possibility to assign different weights to
the spectral bands of the image. To evaluate the sensitivity of
the MRIS algorithm to the RapidEye Red Edge band, the data
set was composed of different segmented images derived using
different band weights. Initially, all spectral bands (blue, green,
red, Red Edge and near infrared) were equally weighted. Then,
different weights were assigned to the Red Edge band to
evaluate the impact in the segmentation and class separability.
The weights were set as follows: all spectral bands weight with
1 and no weight assigned to the Red Edge (“No Red Edge”), no
weight assigned to the other spectral bands and Red Edge
assigned with 1 (“Only Red Edge”), all bands equally weighted
(“w=1”), all bands weighted with 1 and the Red Edge with 2
(“w=2”) and so forth, thus generating 13 different object-based
spatial representations of the image according to the weights
assigned to the Red Edge.
2.2.2 Image Objects Attributes: Subsequent to the image
segmentation, the attributes were calculated for each image
segment using the eCognition Developer® 8.0.
A new index that incorporates the Red Edge spectrum was
calculated to widen the feature input for the classification
process. This new index ranges from the classic NDVI index
519
with the adaptation to the Red edge channel, according to the
Equation 1.
(1)
where
Red Edge = reflectance value for the Red Edge channel
Red = reflectance value for the Red channel
Thus, fifty-two attributes were generated using the
characteristics shown in Table 3.
Spectral information
Spectral bands
Band Ratio (RedEdge/NIR*,
NDVI and NDVI Red Edge)
Brightness
Texture
GLCMalldirections
Entropy
Homogeneity
Standard deviation
Contrast
Correlation
Geometry
Area
Roundness
Compacity
Boundarie index/Shape
Length/Width
Table 3. Attributes related to shape, pixel values and texture.
2.2.3 Data Mining and Variable Importance: A decision
tree approach based on Classification and Regression Tree
(Breiman et al., 1984) was used to select the attributes that
provide the best separation among the classes within the
RapidEye scene. Decision trees are strictly non-parametric and
do not require any assumption regarding the data set
distribution, presenting several advantages over traditional
supervised classification such Maximum Likelihood
classification (Friedl and Brodley, 1997).
The CART approach starts with a group of object samples
described by a set of attributes – the training objects. This
approach relies on splitting the data set into smaller
homogeneous sub-sets according to the attributes in each split
of the tree. For each weight applied to Red Edge spectral band,
the segmentation generated a different number of objects. From
these data sets, a sample of approximately 800 objects (from all
land cover class) were input to de CART for data mining and
classification to evaluate the effects of changing the weight of
the Red Edge on the segmentation process and on vegetation
mapping. The proportion of objects according to the occurrence
of each class within the scene is shown in Table 4.
Bare land 8%
Dense Vegetation 40%
Meadow 20%
Mining area 10%
Rock outcrop 16%
Urban area 5%
Water 1%
Table 4. Attributes related to shape and pixel values.
The CART approach was applied using the WEKA interface
freely distributed on the internet and the results were evaluated
using a ten-fold Cross-Validation. For further comparison
between the weights, an accuracy assessment for the
classification was performed using the Kappa statistic.
3. RESULTS AND DISCUSSION
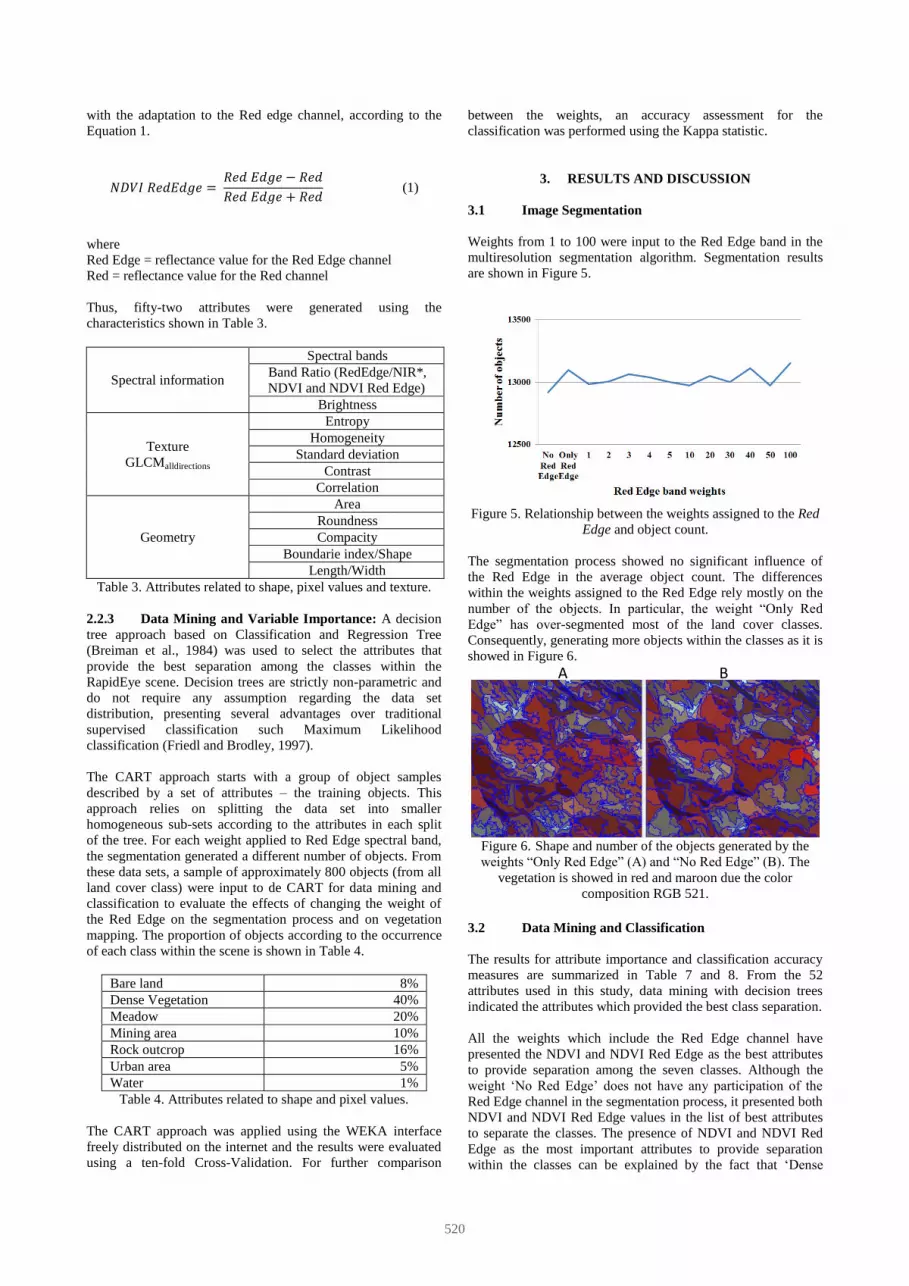
3.1 Image Segmentation
Weights from 1 to 100 were input to the Red Edge band in the
multiresolution segmentation algorithm. Segmentation results
are shown in Figure 5.
Figure 5. Relationship between the weights assigned to the Red
Edge and object count.
The segmentation process showed no significant influence of
the Red Edge in the average object count. The differences
within the weights assigned to the Red Edge rely mostly on the
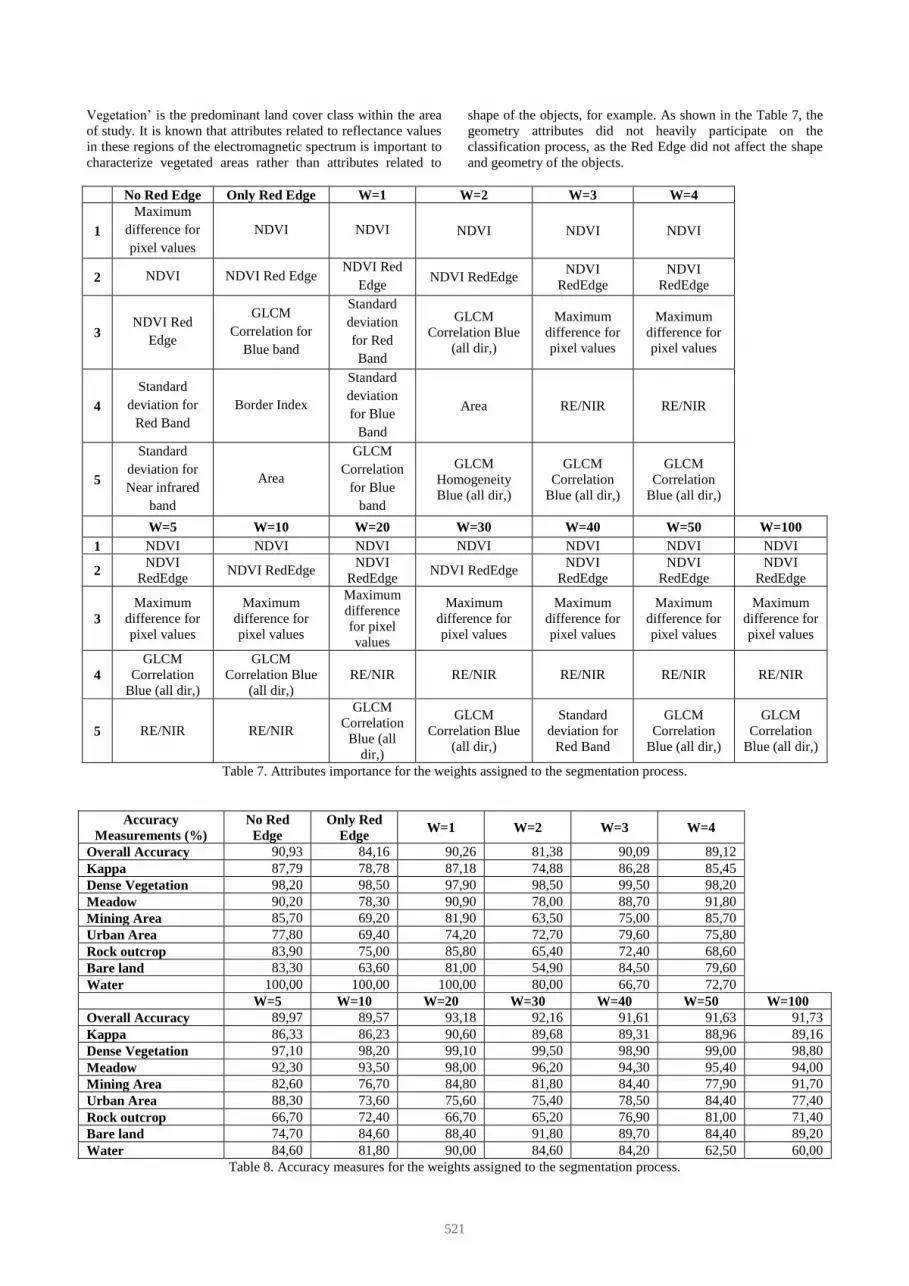
number of the objects. In particular, the weight “Only Red
Edge” has over-segmented most of the land cover classes.
Consequently, generating more objects within the classes as it is
showed in Figure 6.
Figure 6. Shape and number of the objects generated by the
weights “Only Red Edge” (A) and “No Red Edge” (B). The
vegetation is showed in red and maroon due the color
composition RGB 521.
3.2 Data Mining and Classification
The results for attribute importance and classification accuracy
measures are summarized in Table 7 and 8. From the 52
attributes used in this study, data mining with decision trees
indicated the attributes which provided the best class separation.
All the weights which include the Red Edge channel have
presented the NDVI and NDVI Red Edge as the best attributes
to provide separation among the seven classes. Although the
weight ‘No Red Edge’ does not have any participation of the
Red Edge channel in the segmentation process, it presented both
NDVI and NDVI Red Edge values in the list of best attributes
to separate the classes. The presence of NDVI and NDVI Red
Edge as the most important attributes to provide separation
within the classes can be explained by the fact that ‘Dense
A B
520
Vegetation’ is the predominant land cover class within the area
of study. It is known that attributes related to reflectance values
in these regions of the electromagnetic spectrum is important to
characterize vegetated areas rather than attributes related to
shape of the objects, for example. As shown in the Table 7, the
geometry attributes did not heavily participate on the
classification process, as the Red Edge did not affect the shape
and geometry of the objects.
No Red Edge Only Red Edge W=1 W=2 W=3 W=4
1
Maximum
difference for
pixel values
NDVI NDVI NDVI NDVI NDVI
2 NDVI NDVI Red Edge NDVI Red
Edge NDVI RedEdge
NDVI
RedEdge
NDVI
RedEdge
3 NDVI Red
Edge
GLCM
Correlation for
Blue band
Standard
deviation
for Red
Band
GLCM
Correlation Blue
(all dir,)
Maximum
difference for
pixel values
Maximum
difference for
pixel values
4
Standard
deviation for
Red Band
Border Index
Standard
deviation
for Blue
Band
Area RE/NIR RE/NIR
5
Standard
deviation for
Near infrared
band
Area
GLCM
Correlation
for Blue
band
GLCM
Homogeneity
Blue (all dir,)
GLCM
Correlation
Blue (all dir,)
GLCM
Correlation
Blue (all dir,)
W=5 W=10 W=20 W=30 W=40 W=50 W=100
1 NDVI NDVI NDVI NDVI NDVI NDVI NDVI
2 NDVI
RedEdge NDVI RedEdge
NDVI
RedEdge NDVI RedEdge
NDVI
RedEdge
NDVI
RedEdge
NDVI
RedEdge
3
Maximum
difference for
pixel values
Maximum
difference for
pixel values
Maximum
difference
for pixel
values
Maximum
difference for
pixel values
Maximum
difference for
pixel values
Maximum
difference for
pixel values
Maximum
difference for
pixel values
4
GLCM
Correlation
Blue (all dir,)
GLCM
Correlation Blue
(all dir,)
RE/NIR RE/NIR RE/NIR RE/NIR RE/NIR
5 RE/NIR RE/NIR
GLCM
Correlation
Blue (all
dir,)
GLCM
Correlation Blue
(all dir,)
Standard
deviation for
Red Band
GLCM
Correlation
Blue (all dir,)
GLCM
Correlation
Blue (all dir,)
Table 7. Attributes importance for the weights assigned to the segmentation process.
Accuracy
Measurements (%)
No Red
Edge
Only Red
Edge W=1 W=2 W=3 W=4
Overall Accuracy 90,93 84,16 90,26 81,38 90,09 89,12
Kappa 87,79 78,78 87,18 74,88 86,28 85,45
Dense Vegetation 98,20 98,50 97,90 98,50 99,50 98,20
Meadow 90,20 78,30 90,90 78,00 88,70 91,80
Mining Area 85,70 69,20 81,90 63,50 75,00 85,70
Urban Area 77,80 69,40 74,20 72,70 79,60 75,80
Rock outcrop 83,90 75,00 85,80 65,40 72,40 68,60
Bare land 83,30 63,60 81,00 54,90 84,50 79,60
Water 100,00 100,00 100,00 80,00 66,70 72,70
W=5 W=10 W=20 W=30 W=40 W=50 W=100
Overall Accuracy 89,97 89,57 93,18 92,16 91,61 91,63 91,73
Kappa 86,33 86,23 90,60 89,68 89,31 88,96 89,16
Dense Vegetation 97,10 98,20 99,10 99,50 98,90 99,00 98,80
Meadow 92,30 93,50 98,00 96,20 94,30 95,40 94,00
Mining Area 82,60 76,70 84,80 81,80 84,40 77,90 91,70
Urban Area 88,30 73,60 75,60 75,40 78,50 84,40 77,40
Rock outcrop 66,70 72,40 66,70 65,20 76,90 81,00 71,40
Bare land 74,70 84,60 88,40 91,80 89,70 84,40 89,20
Water 84,60 81,80 90,00 84,60 84,20 62,50 60,00
Table 8. Accuracy measures for the weights assigned to the segmentation process.
521
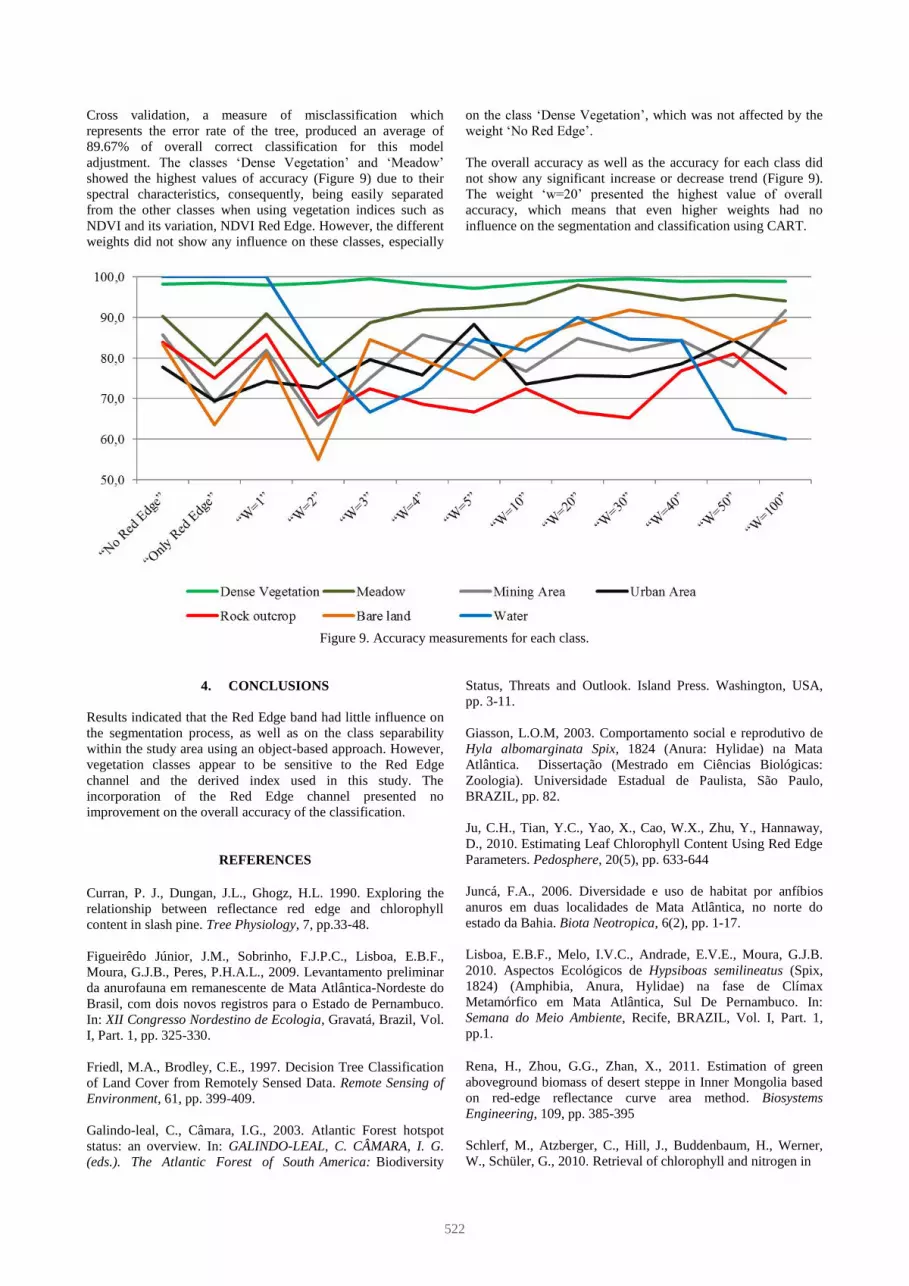
Cross validation, a measure of misclassification which
represents the error rate of the tree, produced an average of
89.67% of overall correct classification for this model
adjustment. The classes ‘Dense Vegetation’ and ‘Meadow’
showed the highest values of accuracy (Figure 9) due to their
spectral characteristics, consequently, being easily separated
from the other classes when using vegetation indices such as
NDVI and its variation, NDVI Red Edge. However, the different
weights did not show any influence on these classes, especially
on the class ‘Dense Vegetation’, which was not affected by the
weight ‘No Red Edge’.
The overall accuracy as well as the accuracy for each class did
not show any significant increase or decrease trend (Figure 9).
The weight ‘w=20’ presented the highest value of overall
accuracy, which means that even higher weights had no
influence on the segmentation and classification using CART.
Figure 9. Accuracy measurements for each class.
4. CONCLUSIONS
Results indicated that the Red Edge band had little influence on
the segmentation process, as well as on the class separability
within the study area using an object-based approach. However,
vegetation classes appear to be sensitive to the Red Edge
channel and the derived index used in this study. The
incorporation of the Red Edge channel presented no
improvement on the overall accuracy of the classification.
REFERENCES Curran, P. J., Dungan, J.L., Ghogz, H.L. 1990. Exploring the
relationship between reflectance red edge and chlorophyll
content in slash pine. Tree Physiology, 7, pp.33-48.
Figueirêdo Júnior, J.M., Sobrinho, F.J.P.C., Lisboa, E.B.F.,
Moura, G.J.B., Peres, P.H.A.L., 2009. Levantamento preliminar
da anurofauna em remanescente de Mata Atlântica-Nordeste do
Brasil, com dois novos registros para o Estado de Pernambuco.
In: XII Congresso Nordestino de Ecologia, Gravatá, Brazil, Vol.
I, Part. 1, pp. 325-330.
Friedl, M.A., Brodley, C.E., 1997. Decision Tree Classification
of Land Cover from Remotely Sensed Data. Remote Sensing of
Environment, 61, pp. 399-409.
Galindo-leal, C., Câmara, I.G., 2003. Atlantic Forest hotspot
status: an overview. In: GALINDO-LEAL, C. CÂMARA, I. G.
(eds.). The Atlantic Forest of South America: Biodiversity
Status, Threats and Outlook. Island Press. Washington, USA,
pp. 3-11.
Giasson, L.O.M, 2003. Comportamento social e reprodutivo de
Hyla albomarginata Spix, 1824 (Anura: Hylidae) na Mata
Atlântica. Dissertação (Mestrado em Ciências Biológicas:
Zoologia). Universidade Estadual de Paulista, São Paulo,
BRAZIL, pp. 82.
Ju, C.H., Tian, Y.C., Yao, X., Cao, W.X., Zhu, Y., Hannaway,
D., 2010. Estimating Leaf Chlorophyll Content Using Red Edge
Parameters. Pedosphere, 20(5), pp. 633-644
Juncá, F.A., 2006. Diversidade e uso de habitat por anfíbios
anuros em duas localidades de Mata Atlântica, no norte do
estado da Bahia. Biota Neotropica, 6(2), pp. 1-17.
Lisboa, E.B.F., Melo, I.V.C., Andrade, E.V.E., Moura, G.J.B.
2010. Aspectos Ecológicos de Hypsiboas semilineatus (Spix,
1824) (Amphibia, Anura, Hylidae) na fase de Clímax
Metamórfico em Mata Atlântica, Sul De Pernambuco. In:
Semana do Meio Ambiente, Recife, BRAZIL, Vol. I, Part. 1,
pp.1.
Rena, H., Zhou, G.G., Zhan, X., 2011. Estimation of green
aboveground biomass of desert steppe in Inner Mongolia based
on red-edge reflectance curve area method. Biosystems
Engineering, 109, pp. 385-395
Schlerf, M., Atzberger, C., Hill, J., Buddenbaum, H., Werner,
W., Schüler, G., 2010. Retrieval of chlorophyll and nitrogen in
522
Scolforo, J.R.S.; Carvalho, L.M.T., 2006. Mapeamento e
inventário da flora native e dos reflorestamentos em Minas
Gerais. UFLA, Lavras, 288p.
Norway spruce (Piceaabies L. Karst.) using imaging
spectroscopy. International Journal of Applied Earth
Observation and Geoinformation, 12, pp. 17–26
Tian, Y., Yao, X., Yang, J., Cao, W., Zhu, Y., 2011. Extracting
Red Edge Position Parameters from Ground and Space-Based
Hyperspectral Data for Estimation of Canopy Leaf Nitrogen
Concentration in Rice. Plant Production Science, 14(3), pp.
270-281.
AKNOWLEDGMENTS
We are very grateful to CAPES for providing financial support
and the scholarship.
523