common fragile sites: g-band characteristics within an r-band
TRANSCRIPT

895
Letters to the Editor
Am. J. Hum. Genet. 64:895, 1999
Psoriasis Linkage in the HLA Region
To the Editor:We were pleased to see the article by Jenisch et al. (1998),providing additional evidence for linkage between (fa-milial) psoriasis and human leukocyte antigen (HLA).This confirms, in partially new data, what we (Leder etal. 1998) and others (Nair et al. 1997; Trembath et al.1997) have already demonstrated—that there is a pso-riasis susceptibility locus (PSORS1) on chromosome 6,closely linked to HLA. Unlike genome scans (Nair et al.1997; Trembath et al. 1997), the analyses of Jenisch etal. (1998) and our own analyses show that support forlinkage is enhanced by use of haplotypes to account forHLA associations in linkage analysis.
However, we note that Jenisch et al. (1998) still hedgeon the finding of linkage. Readers should be aware thatour analyses of previously published data (Leder et al.1998) already support tight linkage beyond any reason-able doubt (LOD score of 23.7 under the assumption ofdominant inheritance).
The assertion by Jenisch et al. (1998) that “Previousstudies based on limited numbers of families found onlyweak evidence . . . for linkage to the HLA region” isalso belied by our analysis of the previously publisheddata. For example, the 31 families reported by Civatteet al. 1977 (cited in Jenisch et al. 1998) actually yield aLOD score of 6.29 between psoriasis and HLA-B, andfamily data from Sun et al. 1987 (not cited by Jenischet al. 1998) yield a LOD score of 4.29. When the Civatteand Sun data are combined with data from other familiesreported previously (including all of those cited in Jen-isch et al. 1998), evidence for linkage to psoriasis in theHLA region is overwhelming (summarized in table 3 ofLeder et al. 1998). Finally, we suggest that all investi-gators of HLA and psoriasis should use the official no-menclature for this psoriasis-susceptibility locus,PSORS1 (Leder et al. 1998; White et al. 1998; see alsoWhite et al. 1999). Now that HLA linkage in psoriasisis conclusively settled, it remains both to identify theHLA-linked psoriasis gene(s) and to solidify evidence forthe putative role(s) of non-HLA genes in the geneticetiology of psoriasis.
RICHARD O. LEDER AND SUSAN E. HODGE1,2,3
1Division of Clinical-Genetic Epidemiology, New YorkState Psychiatric Institute, 2Department of Psychiatry,Columbia University School of Physicians &Surgeons, and 3Division of Biostatistics, ColumbiaUniversity School of Public Health, New York
References
Civatte J, Lazarovici C, Ganas P, Leon S, Hors J, Contu L,Dausset J (1977) HLA system in psoriasis: study of 31 fam-ilies. Ann Dermatol Venereol 104:525–532
Jenisch S, Henseler T, Nair R, Guo S, Westphal E, Stuart P,Krønke M, et al (1998) Linkage analysis of human leukocyteantigen (HLA) markers in familial psoriasis: strong dise-quilibrium effects provide evidence for a major determinantin the HLA-B/-C region. Am J Hum Genet 63:191–199
Leder RO, Mansbridge JN, Hallmayer J, Hodge SE (1998).Familial psoriasis and HLA-B: unambiguous support forlinkage in 97 published families. Hum Hered 48:198–211
Nair R, Henseler T, Jenisch S, Stuart P, Bichakjian CK, LenkW, Westphal E, et al (1997) Evidence for two psoriasis sus-ceptibility loci (HLA and 17q) and two novel candidateregions (16q and 20p) by genome-wide scan. Hum Mol Ge-net 6:1349–1356
Sun Y, An J, Li S, Li H, Chen W, Lin L, Xu L, et al (1987)HLA antigen distribution and haplotype segregation in Chi-nese patients with psoriasis. Chin Med J 100:236–241
Trembath RC, Clough RL, Rosbotham JL, Jones AB, CampRDR, Frodsham A, Browne J, et al (1997) Identification ofa major susceptibility locus on chromosome 6p and evidencefor further disease loci revealed by a two-stage genome-widesearch in psoriasis. Hum Mol Genet 6:813–820
White J, Maltais L, Nebert D (1998) Networking nomencla-ture. Nat Genet 18:209
——— (1999) An increasingly urgent need for standardizedgene nomenclature. Nat Genet, http://genetics.nature.com/web_specials/nomen/nomen_article.html
Address for correspondence and reprints: Richard O. Leder, 725 Los RoblesAvenue, Palo Alto, CA 94306. E-mail: [email protected]
q 1999 by The American Society of Human Genetics. All rights reserved.0002-9297/99/6403-0027$02.00

896 Letters to the Editor
Am. J. Hum. Genet. 64:896–897, 1999
Reply to Leder and Hodge
To the Editor:On the basis of human leukocyte antigen (HLA) asso-ciation studies, workers in the field of psoriasis have longbeen aware that the HLA complex plays an importantrole in determining psoriasis susceptibility. The questionhas always been why many families appear not to showlinkage to HLA. We share in the pleasure of Drs. Lederand Hodge (1999 [in this issue]) now that the geneticsof the HLA region in psoriasis is coming into sharperfocus.
The general agreement between Leder and Hodge’sstudies (Leder et al. 1998), our own work (Jenisch et al.1998 and in press), and the recent studies of Trembathet al. (1997) and Burden et al. (1998) provides welcomeinsight into this long-standing puzzle. By optimizingLOD scores over a variety of penetrance functions, as-suming Hardy-Weinberg equilibrium, Leder and Hodge(Leder et al. 1998) found the highest LOD scores fordominant models specifying high disease allele frequencyand low penetrance. We reached essentially the sameconclusion, following the suggestions of Risch et al.(1989) for complex-trait data. It is well appreciated thatpower to detect linkage is diminished when the diseaseallele frequency is high and the penetrance is low. Giventhe smaller sample sizes of earlier studies, it is not sur-prising that linkage to the HLA region was not alwaysapparent.
We have reported that linkage to HLA is more readilydetected when marker-trait disequilibrium is taken intoaccount, in part because of more-accurate specificationof phase (Jenisch et al. 1998). Leder et al. (1998) andTrembath et al. (1997) report similar results. This effectwas first pointed out 15 years ago (Clerget-Darpoux1982) but has not been widely exploited in the geneticanalysis of other common HLA-associated disorders.Even without incorporation of disease-marker haplotypefrequencies, Leder et al. (1998) found strong evidencefor linkage to HLA under a dominant model, whereaswe did not. Leder et al.’s study made use of previouslypublished pedigrees, and concerns regarding ascertain-ment bias in favor of linkage are inevitable in such astudy. However, it is also possible that our sampleyielded lower LOD scores because it contained a numberof small pedigrees, thereby increasing the number ofphase-unknown individuals.
We concur with Leder and Hodge (1999) that thereis now excellent agreement regarding the importance ofthe HLA region in familial psoriasis and that this locusshould now be referred to as PSORS1. We would em-phasize that, because the HLA loci yielding the highest
LOD scores in familial psoriasis are so similar to thoseobserved in prior case-control association studies, thereis unlikely to be any difference between familial and“sporadic” juvenile-onset psoriasis with respect to theinvolvement of PSORS1. We can also infer that geneticdifferences between juvenile- and adult-onset psoriasismust exist, because of their different HLA associations(Henseler and Christophers 1985). Whether an HLA lo-cus different from PSORS1 is involved in the adult-onsetform of this disease remains to be determined.
High disease allele frequencies and low penetrancevalues are likely to be the rule rather than the exceptionin common multifactorial diseases. We hope that theserecent insights into the genetics of the HLA region inpsoriasis will be of benefit to other groups studying com-plex genetic disorders.
JAMES ELDER,1 RAJAN NAIR,1 PHILIP STUART,1
JOHN VOORHEES,1 SUN-WEI GUO,2 STEFAN JENISCH,3
ECKHARD WESTPHAL,3 MARTIN KRONKE,3
TILO HENSELER,4 AND ENNO CHRISTOPHERS4
1Department of Dermatology, University of Michigan,Ann Arbor; 2Institute of Human Genetics andDivision of Epidemiology,University of Minnesota,Minneapolis; and Departments of 3Immunology and4Dermatology, University of Kiel, Kiel, Germany
References
Burden AD, Javed S, Bailey M, Hodgins M, Connor M, Till-man D (1998) Genetics of psoriasis: paternal inheritance anda locus on chromosome 6p. J Invest Dermatol 110:958–960
Clerget-Darpoux F (1982) Bias of the estimated recombinationfraction and LOD score due to an association between adisease gene and a marker gene. Ann Hum Genet 46:363–372
Henseler T, Christophers E (1985) Psoriasis of early and lateonset: characterization of two types of psoriasis vulgaris. JAm Acad Dermatol 13:450–456
Jenisch S, Henseler T, Nair RP, Guo S-W, Westphal E, StuartP, Kronke M, et al (1998) Linkage analysis of HLA markersin familial psoriasis: strong disequilibrium effects provideevidence for a major determinant in the HLA-B/-C region.Am J Hum Genet 63:191–199
Jenisch S, Westphal E, Nair RP, Stuart P, Voorhees JJ, Chris-tophers E, Kronke M, et al. Linkage disequilibrium analysisof familial psoriasis: identification of multiple disease-as-sociated MHC haplotypes. Tissue Antigens (in press)
Leder RO, Hodge SE (1999) Psoriasis linkage in the HLAregion. Am J Hum Genet 64:895–895 (in this issue)
Leder RO, Mansbridge JN, Hallmayer J, Hodge SE (1998)Familial psoriasis and HLA-B: unambiguous support forlinkage in 97 published families. Hum Hered 48:198–211
Risch N, Claus E, Giuffra L (1989) Linkage and mode ofinheritance in complex traits. Prog Clin Biol Res 329:183–188
Trembath RC, Clough RL, Rosbotham JL, Jones AB, Camp
Letters to the Editor 897
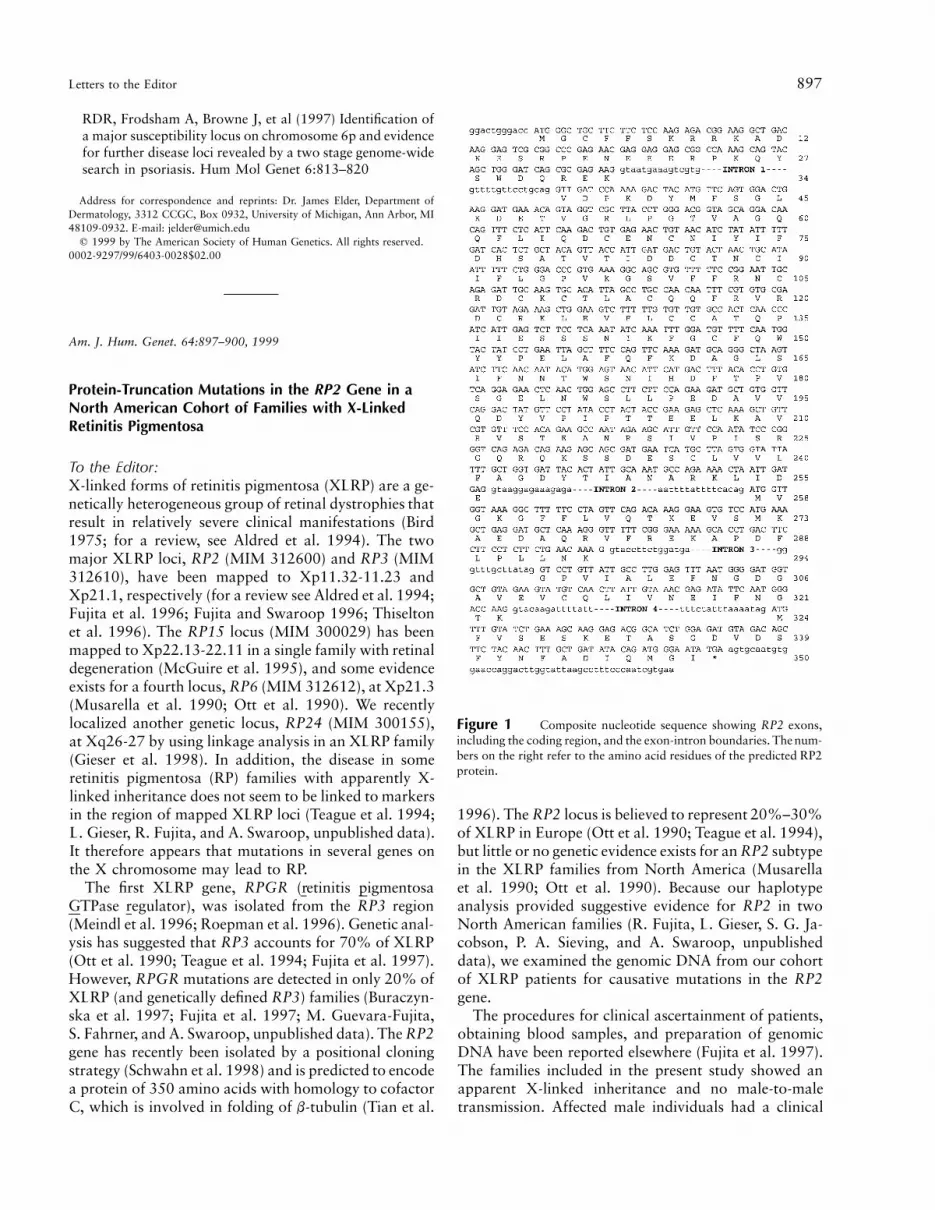
Figure 1 Composite nucleotide sequence showing RP2 exons,including the coding region, and the exon-intron boundaries. The num-bers on the right refer to the amino acid residues of the predicted RP2protein.
RDR, Frodsham A, Browne J, et al (1997) Identification ofa major susceptibility locus on chromosome 6p and evidencefor further disease loci revealed by a two stage genome-widesearch in psoriasis. Hum Mol Genet 6:813–820
Address for correspondence and reprints: Dr. James Elder, Department ofDermatology, 3312 CCGC, Box 0932, University of Michigan, Ann Arbor, MI48109-0932. E-mail: [email protected]
q 1999 by The American Society of Human Genetics. All rights reserved.0002-9297/99/6403-0028$02.00
Am. J. Hum. Genet. 64:897–900, 1999
Protein-Truncation Mutations in the RP2 Gene in aNorth American Cohort of Families with X-LinkedRetinitis Pigmentosa
To the Editor:X-linked forms of retinitis pigmentosa (XLRP) are a ge-netically heterogeneous group of retinal dystrophies thatresult in relatively severe clinical manifestations (Bird1975; for a review, see Aldred et al. 1994). The twomajor XLRP loci, RP2 (MIM 312600) and RP3 (MIM312610), have been mapped to Xp11.32-11.23 andXp21.1, respectively (for a review see Aldred et al. 1994;Fujita et al. 1996; Fujita and Swaroop 1996; Thiseltonet al. 1996). The RP15 locus (MIM 300029) has beenmapped to Xp22.13-22.11 in a single family with retinaldegeneration (McGuire et al. 1995), and some evidenceexists for a fourth locus, RP6 (MIM 312612), at Xp21.3(Musarella et al. 1990; Ott et al. 1990). We recentlylocalized another genetic locus, RP24 (MIM 300155),at Xq26-27 by using linkage analysis in an XLRP family(Gieser et al. 1998). In addition, the disease in someretinitis pigmentosa (RP) families with apparently X-linked inheritance does not seem to be linked to markersin the region of mapped XLRP loci (Teague et al. 1994;L. Gieser, R. Fujita, and A. Swaroop, unpublished data).It therefore appears that mutations in several genes onthe X chromosome may lead to RP.
The first XLRP gene, RPGR (retinitis pigmentosaGTPase regulator), was isolated from the RP3 region(Meindl et al. 1996; Roepman et al. 1996). Genetic anal-ysis has suggested that RP3 accounts for 70% of XLRP(Ott et al. 1990; Teague et al. 1994; Fujita et al. 1997).However, RPGR mutations are detected in only 20% ofXLRP (and genetically defined RP3) families (Buraczyn-ska et al. 1997; Fujita et al. 1997; M. Guevara-Fujita,S. Fahrner, and A. Swaroop, unpublished data). The RP2gene has recently been isolated by a positional cloningstrategy (Schwahn et al. 1998) and is predicted to encodea protein of 350 amino acids with homology to cofactorC, which is involved in folding of b-tubulin (Tian et al.
1996). The RP2 locus is believed to represent 20%–30%of XLRP in Europe (Ott et al. 1990; Teague et al. 1994),but little or no genetic evidence exists for an RP2 subtypein the XLRP families from North America (Musarellaet al. 1990; Ott et al. 1990). Because our haplotypeanalysis provided suggestive evidence for RP2 in twoNorth American families (R. Fujita, L. Gieser, S. G. Ja-cobson, P. A. Sieving, and A. Swaroop, unpublisheddata), we examined the genomic DNA from our cohortof XLRP patients for causative mutations in the RP2gene.
The procedures for clinical ascertainment of patients,obtaining blood samples, and preparation of genomicDNA have been reported elsewhere (Fujita et al. 1997).The families included in the present study showed anapparent X-linked inheritance and no male-to-maletransmission. Affected male individuals had a clinical
898 Letters to the Editor
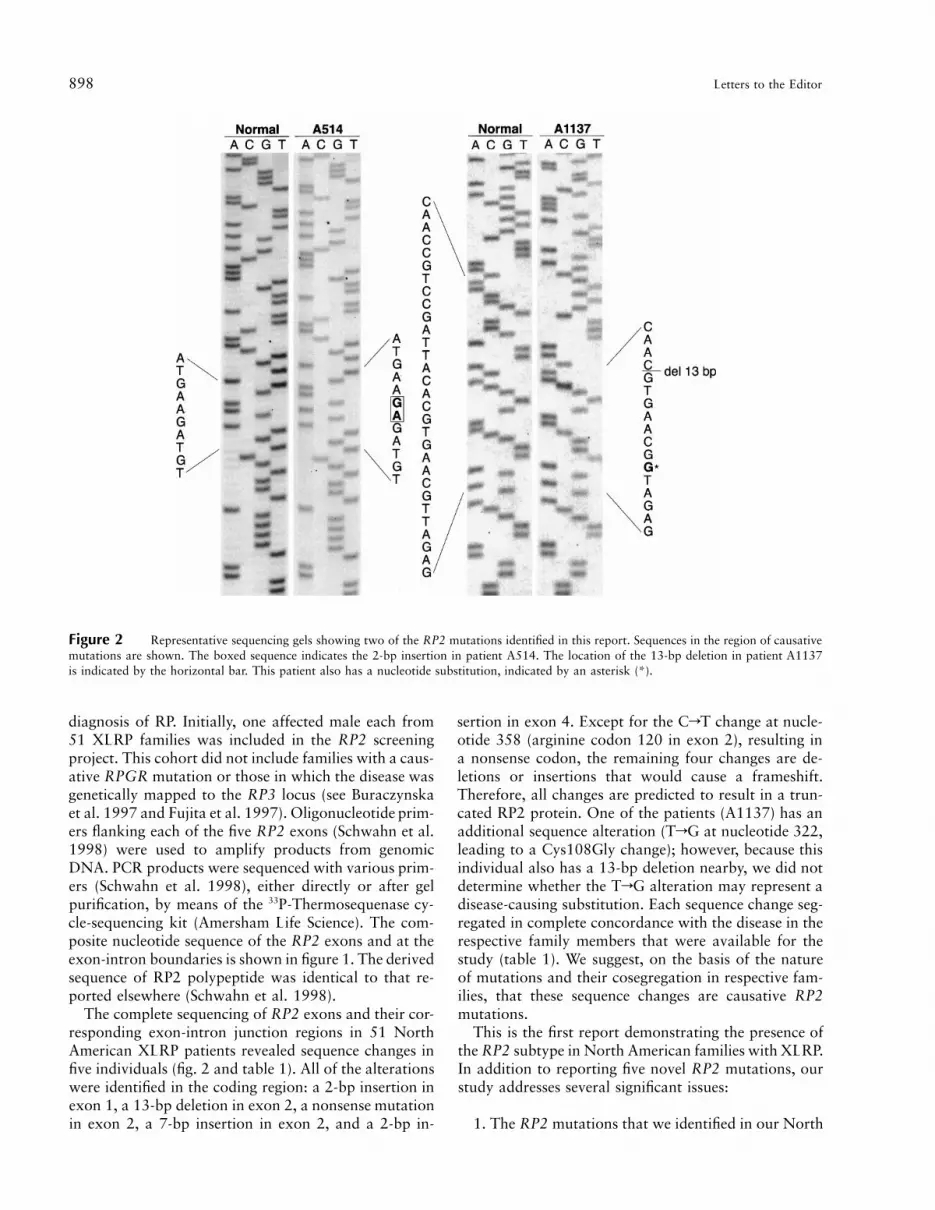
Figure 2 Representative sequencing gels showing two of the RP2 mutations identified in this report. Sequences in the region of causativemutations are shown. The boxed sequence indicates the 2-bp insertion in patient A514. The location of the 13-bp deletion in patient A1137is indicated by the horizontal bar. This patient also has a nucleotide substitution, indicated by an asterisk (*).
diagnosis of RP. Initially, one affected male each from51 XLRP families was included in the RP2 screeningproject. This cohort did not include families with a caus-ative RPGR mutation or those in which the disease wasgenetically mapped to the RP3 locus (see Buraczynskaet al. 1997 and Fujita et al. 1997). Oligonucleotide prim-ers flanking each of the five RP2 exons (Schwahn et al.1998) were used to amplify products from genomicDNA. PCR products were sequenced with various prim-ers (Schwahn et al. 1998), either directly or after gelpurification, by means of the 33P-Thermosequenase cy-cle-sequencing kit (Amersham Life Science). The com-posite nucleotide sequence of the RP2 exons and at theexon-intron boundaries is shown in figure 1. The derivedsequence of RP2 polypeptide was identical to that re-ported elsewhere (Schwahn et al. 1998).
The complete sequencing of RP2 exons and their cor-responding exon-intron junction regions in 51 NorthAmerican XLRP patients revealed sequence changes infive individuals (fig. 2 and table 1). All of the alterationswere identified in the coding region: a 2-bp insertion inexon 1, a 13-bp deletion in exon 2, a nonsense mutationin exon 2, a 7-bp insertion in exon 2, and a 2-bp in-
sertion in exon 4. Except for the CrT change at nucle-otide 358 (arginine codon 120 in exon 2), resulting ina nonsense codon, the remaining four changes are de-letions or insertions that would cause a frameshift.Therefore, all changes are predicted to result in a trun-cated RP2 protein. One of the patients (A1137) has anadditional sequence alteration (TrG at nucleotide 322,leading to a Cys108Gly change); however, because thisindividual also has a 13-bp deletion nearby, we did notdetermine whether the TrG alteration may represent adisease-causing substitution. Each sequence change seg-regated in complete concordance with the disease in therespective family members that were available for thestudy (table 1). We suggest, on the basis of the natureof mutations and their cosegregation in respective fam-ilies, that these sequence changes are causative RP2mutations.
This is the first report demonstrating the presence ofthe RP2 subtype in North American families with XLRP.In addition to reporting five novel RP2 mutations, ourstudy addresses several significant issues:
1. The RP2 mutations that we identified in our North
Letters to the Editor 899
Table 1
RP2 Mutations in Patients with X-Linked Retinitis Pigmentosa
PatientNumber Exon
Nucleotide SequenceChange Effect of Mutation
MeiosesExamined
A2240 1 77/78insCA Frameshift, 305 amino acids missing 8A1137 2 TrG at 322 and del 330-342 Cys108Gly and a frameshift, 200 amino acids missing 1A1135 2 CrT at 358 Arg120Stop, 230 amino acids missing 4A512 2 483/484insGGGCTAA Frameshift, 176 amino acids missing 2A514 4 925/926insAG Frameshift, 35 amino acids missing 3
NOTE.—Nucleotide positions are indicated according to the RP2 coding sequence (National Center for BiotechnologyInformation accession number AJ007590; Schwahn et al. 1998).
American cohort of XLRP families are different fromthe seven reported in European families (Schwahn et al.1998), suggesting a high rate of new mutations and alack of founder effect. Similar observations have beenmade for RPGR mutations in XLRP-RP3 families (Bur-aczynska et al. 1997).
2. All five mutations reported here are predicted toresult in a truncated RP2 protein. Except for Arg118His,the other six mutations identified by Schwahn et al.(1998) would also result in a shorter, or no, RP2 protein.We therefore suggest that the clinical phenotype in mostif not all affected XLRP-RP2 families is due to the lossof RP2 function.
3. Our results suggest that it should be possible toidentify a majority of RP2 mutations in XLRP familiesby a protein-truncation test. Because RP2 protein iswidely expressed, a relatively inexpensive diagnostic as-say based on immunoblot analysis with RP2-specific an-tibody (when available) can also be developed. It shouldbe noted that a protein-based diagnostic test has beenestablished for choroideremia, another X-linked retinaldystrophy (MacDonald et al. 1998). Such a test, how-ever, would be hard to develop for RPGR because ofthe diverse nature of mutations spanning a larger regionof protein (Buraczynska et al. 1997) and multiple mRNAand protein isoforms (Yan et al. 1998).
4. Most of the mutations (Schwahn et al. 1998; pre-sent article) are detected in exon 2, which can be am-plified as a 799-bp product. Additional mutations arepresent in two small exons—1 and 4. Of interest, nomutation has so far been detected in exon 3 or 5. Thisclustering of mutations might have significant implica-tions for functional analysis of the RP2 protein and forprenatal and presymptomatic diagnosis.
5. Thus far it appears that screening of both RPGRand RP2 genes leads to identification of disease-causingmutations in fewer than half of XLRP families. The fivereported RP2 mutations were identified by direct se-quencing of coding region and exon-intron boundaries.Analysis of the RP2 promoter region and/or the RP2genomic DNA by Southern blotting might reveal addi-tional causative mutations.
Although much of the genetic and phenotypic com-
plexities of XLRP have yet to be resolved, the cloningof RPGR and RP2 genes represents a milestone in RPresearch. Identification of mutations in these two genesin many XLRP families provides renewed hope for more-precise diagnosis and better genetic counseling for thisdevastating disease.
Acknowledgments
We thank Drs. Sten Andreasson, David Birch, NancyCarson, Bernie Chodirker, Mark Evans, Gerald Fishman, JohnHeckenlively, Dennis Hoffman, Maria Musarella, and BethSpriggs and Mr. Eric L. Krivchenia for some of the patientsamples that were included in the mutation screening. We ac-knowledge the assistance of Dr. Wolfgang Berger for providingthe RP2 primer sequences. We thank Dr. Monika Buraczynskafor organization of the patient registry; Dr. Radha Ayyagarifor discussions; Dr. Beverly Yashar for counseling; Ms. CaraCoats for assistance in patient collection; Mr. Jason Cook, Ms.Patricia Forsythe, and Ms. Eve Bingham for technical assis-tance; and Ms. D. Giebel for secretarial assistance. This re-search was supported by National Institutes of Health (NIH)grants EY05627, EY06094, and EY07961 and by grants fromthe Foundation Fighting Blindness, the Chatlos Foundation,the Kirby Foundation, the Mackall Trust, and Research toPrevent Blindness. We also acknowledge NIH grants EY07003(core) and M01-RR00042 (General Clinical Research Center)and a shared equipment grant from the Office of Vice Presidentfor Research (University of Michigan). A.S. is recipient of aLew R. Wasserman Merit Award, and P.A.S., a Senior ScientificInvestigator Award, both from Research to Prevent Blindness.
ALAN J. MEARS,1,∗ LINN GIESER,1,∗ DENISE YAN,1,∗
CYNTHIA CHEN,1,∗ STACEY FAHRNER,1
SUJA HIRIYANNA,1 RICARDO FUJITA,1,†
SAMUEL G. JACOBSON,3 PAUL A. SIEVING,1 AND
ANAND SWAROOP1,2
Departments of 1Ophthalmology and 2HumanGenetics, Kellogg Eye Center, University of Michigan,Ann Arbor, and 3Department of Ophthalmology,Scheie Eye Institute, University of Pennsylvania,Philadelphia

900 Letters to the Editor
Electronic-Database Information
Accession numbers and URLs for data in this article are asfollows:
Online Mendelian Inheritance in Man (OMIM), http://www.ncbi.nlm.nih.gov/Omim (for RP2 [MIM 312600], RP3[MIM 312610], RP6 [MIM 312612], RP15 [MIM 300029],and RP24 [MIM 300155])
National Center for Biotechnology Information, http://www.ncbi.nlm.nih.gov/(for RP2 sequence, accession num-ber AJ007590)
References
Aldred MA, Jay M, Wright AF (1994) X-linked retinitis pig-mentosa. In: Wright AF, Jay B (eds) Molecular genetics ofinherited eye disorders. Harwood Academic Publishers,Chur, Switzerland, pp 259–276
Bird AC (1975) X-linked retinitis pigmentosa. Br J Ophthalmol59:177–199
Buraczynska M, Wu W, Fujita R, Buraczynska K, Phelps E,Andreasson S, Bennett J, et al (1997) Spectrum of mutationsin the RPGR gene that are identified in 20% of families withX-linked retinitis pigmentosa. Am J Hum Genet 61:1287–1292
Fujita R, Bingham E, Forsythe P, Segal M, Aita V, Navia BA,Dry K, et al (1996) A recombination outside the BB deletionrefines the location of the X-linked retinitis pigmentosa locusRP3. Am J Hum Genet 59:152–158
Fujita R, Buraczynska M, Gieser L, Wu W, Forsythe P, Abra-hamson M, Jacobson SG, et al (1997) Analysis of the RPGRgene in 11 pedigrees with the retinitis pigmentosa type 3genotype: paucity of mutations in the coding region butsplice defects in two families. Am J Hum Genet 61:571–580
Fujita R, Swaroop A (1996) RPGR: part one of the X-linkedretinitis pigmentosa story. Mol Vis 2:4
Gieser L, Fujita R, Goring HHH, Ott J, Hoffman DR, Cide-ciyan AV, Birch DG, et al (1998) A novel locus (RP24) forX-linked retinitis pigmentosa maps to Xq26-27. Am J HumGenet 63:1439–1447
MacDonald IM, Mah DY, Ho YK, Lewis RA, Seabra MC(1998) A practical diagnostic test for choroideremia. Oph-thalmology 105:1637–1640
McGuire RE, Sullivan LS, Blanton SH, Church MW, Heck-enlively JR, Daiger SP (1995) X-linked dominant cone-roddegeneration: linkage mapping of a new locus for retinitispigmentosa (RP15) to Xp22.13-p22.11. Am J Hum Genet57:87–94
Meindl A, Dry K, Herrmann K, Manson F, Ciccodicola A,Edgar A, Carvalho MRS, et al (1996) A gene (RPGR) withhomology to the RCC1 guanine nucleotide exchange factoris mutated in X-linked retinitis pigmentosa (RP3). Nat Genet13:35–42
Musarella MA, Anson-Cartwright L, Leal SM, Gilbert LD,Worton RG, Fishman GA, Ott J (1990) Multipoint linkageanalysis and heterogeneity testing in 20 X-linked retinitispigmentosa families. Genomics 8:286–296
Ott J, Bhattacharya SS, Chen JD, Denton MJ, Donald J, DubayC, Farrar GJ, et al (1990) Localizing multiple X-chromo-
some–linked retinitis pigmentosa loci using multilocus ho-mogeneity tests. Proc Natl Acad Sci USA 87:701–704
Roepman R, van Duijnhoven G, Rosenberg T, Pinckers AJLG,Bleeker-Wagemakers LM, Bergen AAB, Post J, et al (1996)Positional cloning of the gene for X-linked retinitis pigmen-tosa 3: homology with the guanine-nucleotide–exchange fac-tor RCC1. Hum Mol Genet 5:1035–1041
Schwahn U, Lenzner S, Dong J, Feil S, Hinzmann B, van Du-ijnhoven G, Kirschner R, et al (1998) Positional cloning ofthe gene for X-linked retinitis pigmentosa 2. Nat Genet 19:327–332
Teague PW, Aldred MA, Jay M, Dempster M, Harrison C,Carothers AD, Hardwick LJ, et al (1994) Heterogeneityanalysis in 40 X-linked retinitis pigmentosa families. Am JHum Genet 55:105–111
Thiselton DL, Hampson RM, Nayudu M, Maldergem LV, WolfML, Saha BK, Bhattacharya SS, et al (1996) Mapping theRP2 locus for X-linked retinitis pigmentosa on proximal Xp:a genetically defined 5-cM critical region and exclusion ofcandidate genes by physical mapping. Genome Res 6:1093–1102
Tian G, Huang Y, Rommelaere H, Vandekerckhove J, AmpeC, Cowan NJ (1996) Pathways leading to correctly foldedb-tubulin. Cell 86:287–296
Yan D, Swain PK, Breuer D, Tucker RM, Wu W, Fujita R,Rehemtulla A, et al (1998) Biochemical characterization andsubcellular localization of the mouse retinitis pigmentosaGTPase regulator (mRpgr). J Biol Chem 273:19656–19663
Address for correspondence and reprints: Dr. Anand Swaroop, Kellogg EyeCenter, University of Michigan, 1000 Wall Street, Ann Arbor, MI 48105. E-mail:[email protected]
*Drs. Mears and Yan, Ms. Gieser, and Ms. Chen contributed equally to thiswork.
†Present affiliation: Facultad de Medicina Humana, Universidad San Martinde Porres, Lima, Peru.
q 1999 by The American Society of Human Genetics. All rights reserved.0002-9297/99/6403-0029$02.00
Am. J. Hum. Genet. 64:900–904, 1999
A Fifth Locus for Bardet-Biedl Syndrome Maps toChromosome 2q31
To the Editor:Bardet-Biedl syndrome (BBS) is a rare autosomal reces-sive disorder with major clinical manifestations of retinaldystrophy, obesity, dysmorphic extremities, hypogeni-talism, and renal structural and functional abnormali-ties. It is distinguished from Laurence-Moon syndrome(MIM 245800), Biemond syndrome II (MIM 210350),and Alstrom syndrome (MIM 203800) by the absenceof paraplegia, iris coloboma, and perceptive deafness,respectively. Four genetic loci for BBS have been mappedto distinct chromosomes, but the finding, in three recentpopulation surveys, of several unlinked families with
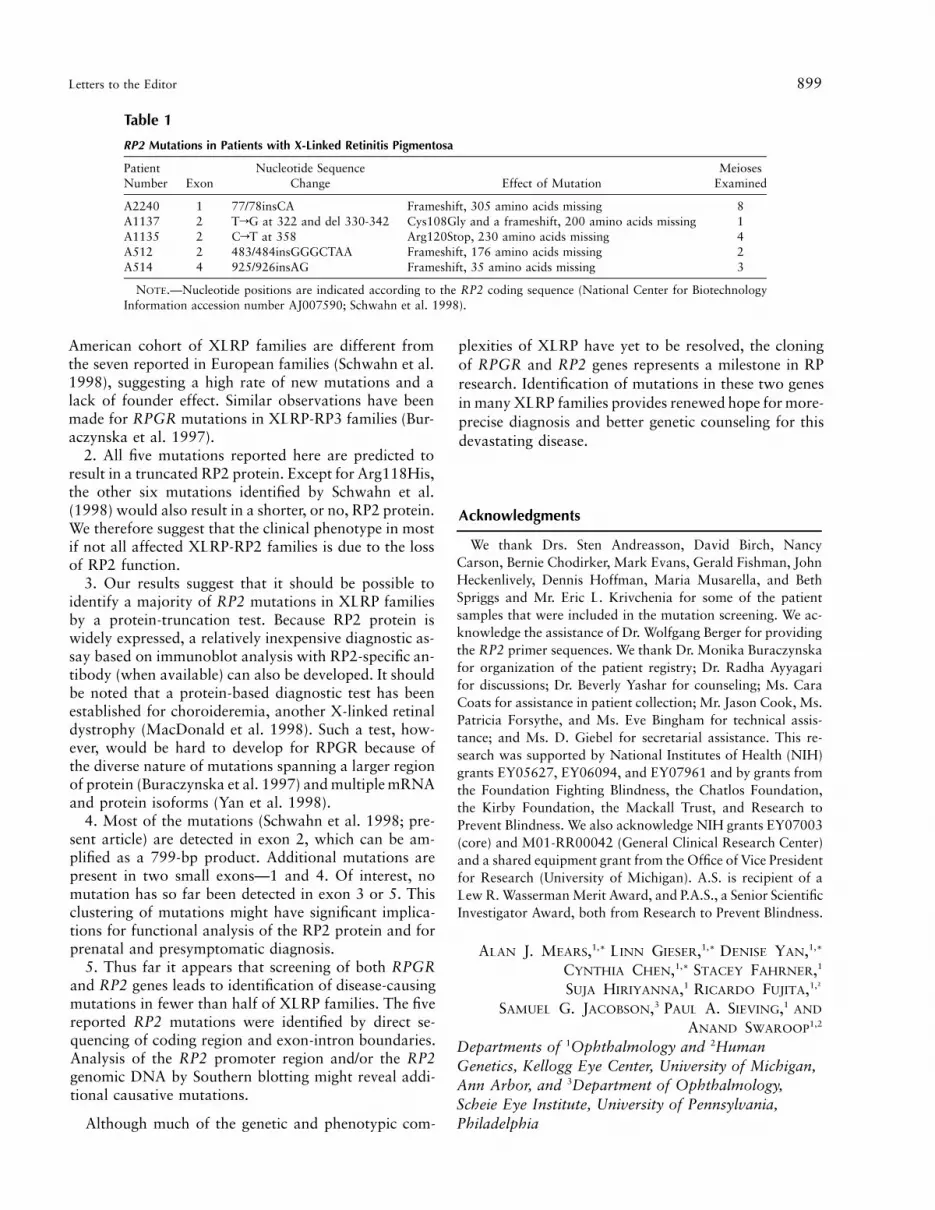
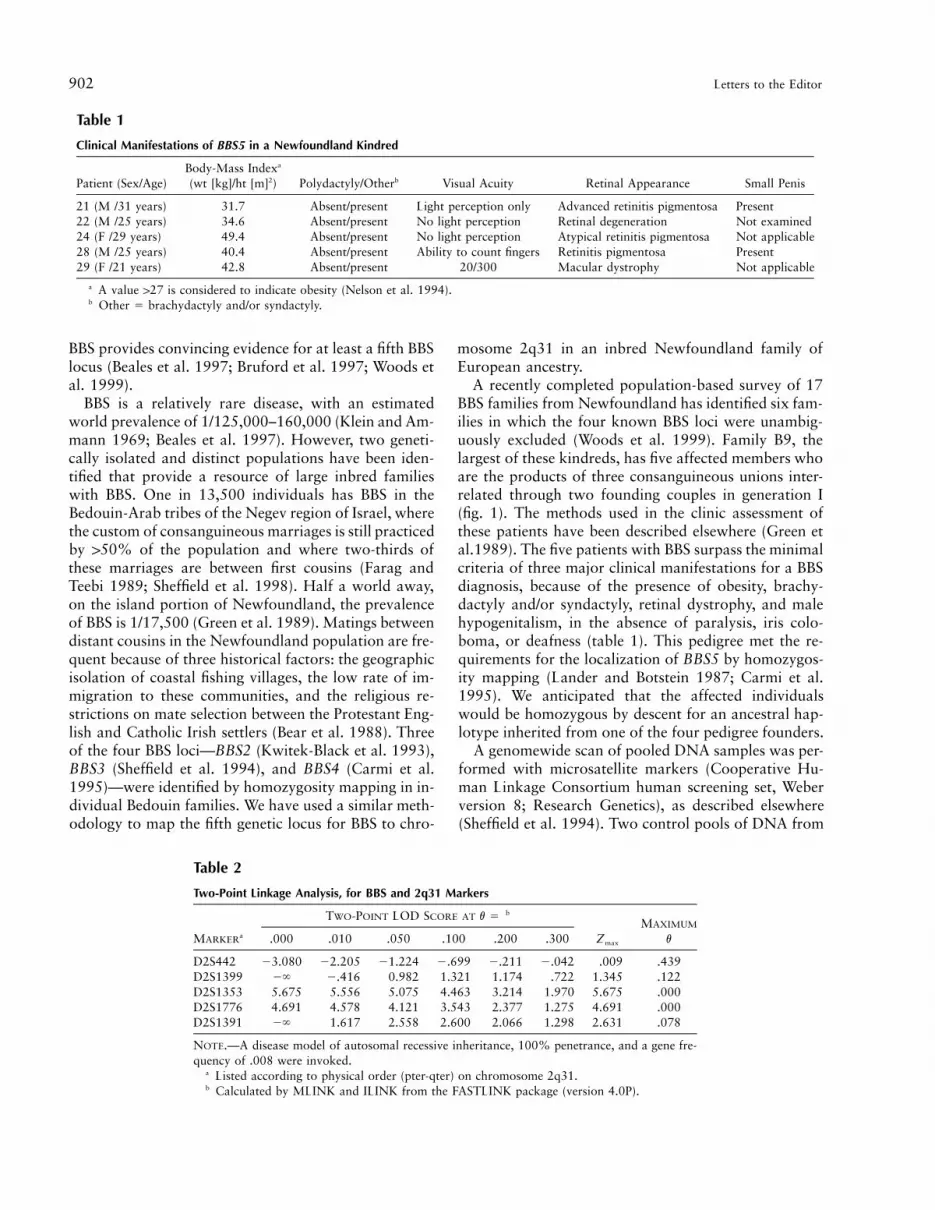
Figure 1 Cosegregation of BBS and an ancestral haplotype on chromosome 2q31 in kindred B9. Double marriage lines indicate consanguineous unions. Haplotypes were constructed manuallyand represent the minimal number of recombinations (x). The DNA sample from person 24 was extracted from a paraffin sample and often fails to amplify, but this person appears to be nonrecombinantfor both parental chromosomes. The family members with BBS have inherited two copies of the ancestral haplotype (boxed) from a great-great-grandparent in generation I. The minimal region ofhomozygosity in relatives with BBS includes the markers pter-D2S124, D2S2330, D2S1776, and D2S335-qter.
902 Letters to the Editor
Table 1
Clinical Manifestations of BBS5 in a Newfoundland Kindred
Patient (Sex/Age)Body-Mass Indexa
(wt [kg]/ht [m]2) Polydactyly/Otherb Visual Acuity Retinal Appearance Small Penis
21 (M /31 years) 31.7 Absent/present Light perception only Advanced retinitis pigmentosa Present22 (M /25 years) 34.6 Absent/present No light perception Retinal degeneration Not examined24 (F /29 years) 49.4 Absent/present No light perception Atypical retinitis pigmentosa Not applicable28 (M /25 years) 40.4 Absent/present Ability to count fingers Retinitis pigmentosa Present29 (F /21 years) 42.8 Absent/present 20/300 Macular dystrophy Not applicable
a A value 127 is considered to indicate obesity (Nelson et al. 1994).b Other 5 brachydactyly and/or syndactyly.
Table 2
Two-Point Linkage Analysis, for BBS and 2q31 Markers
MARKERa
TWO-POINT LOD SCORE AT v 5 b
Zmax
MAXIMUM
v.000 .010 .050 .100 .200 .300
D2S442 23.080 22.205 21.224 2.699 2.211 2.042 .009 .439D2S1399 2` 2.416 0.982 1.321 1.174 .722 1.345 .122D2S1353 5.675 5.556 5.075 4.463 3.214 1.970 5.675 .000D2S1776 4.691 4.578 4.121 3.543 2.377 1.275 4.691 .000D2S1391 2` 1.617 2.558 2.600 2.066 1.298 2.631 .078
NOTE.—A disease model of autosomal recessive inheritance, 100% penetrance, and a gene fre-quency of .008 were invoked.
a Listed according to physical order (pter-qter) on chromosome 2q31.b Calculated by MLINK and ILINK from the FASTLINK package (version 4.0P).
BBS provides convincing evidence for at least a fifth BBSlocus (Beales et al. 1997; Bruford et al. 1997; Woods etal. 1999).
BBS is a relatively rare disease, with an estimatedworld prevalence of 1/125,000–160,000 (Klein and Am-mann 1969; Beales et al. 1997). However, two geneti-cally isolated and distinct populations have been iden-tified that provide a resource of large inbred familieswith BBS. One in 13,500 individuals has BBS in theBedouin-Arab tribes of the Negev region of Israel, wherethe custom of consanguineous marriages is still practicedby 150% of the population and where two-thirds ofthese marriages are between first cousins (Farag andTeebi 1989; Sheffield et al. 1998). Half a world away,on the island portion of Newfoundland, the prevalenceof BBS is 1/17,500 (Green et al. 1989). Matings betweendistant cousins in the Newfoundland population are fre-quent because of three historical factors: the geographicisolation of coastal fishing villages, the low rate of im-migration to these communities, and the religious re-strictions on mate selection between the Protestant Eng-lish and Catholic Irish settlers (Bear et al. 1988). Threeof the four BBS loci—BBS2 (Kwitek-Black et al. 1993),BBS3 (Sheffield et al. 1994), and BBS4 (Carmi et al.1995)—were identified by homozygosity mapping in in-dividual Bedouin families. We have used a similar meth-odology to map the fifth genetic locus for BBS to chro-
mosome 2q31 in an inbred Newfoundland family ofEuropean ancestry.
A recently completed population-based survey of 17BBS families from Newfoundland has identified six fam-ilies in which the four known BBS loci were unambig-uously excluded (Woods et al. 1999). Family B9, thelargest of these kindreds, has five affected members whoare the products of three consanguineous unions inter-related through two founding couples in generation I(fig. 1). The methods used in the clinic assessment ofthese patients have been described elsewhere (Green etal.1989). The five patients with BBS surpass the minimalcriteria of three major clinical manifestations for a BBSdiagnosis, because of the presence of obesity, brachy-dactyly and/or syndactyly, retinal dystrophy, and malehypogenitalism, in the absence of paralysis, iris colo-boma, or deafness (table 1). This pedigree met the re-quirements for the localization of BBS5 by homozygos-ity mapping (Lander and Botstein 1987; Carmi et al.1995). We anticipated that the affected individualswould be homozygous by descent for an ancestral hap-lotype inherited from one of the four pedigree founders.
A genomewide scan of pooled DNA samples was per-formed with microsatellite markers (Cooperative Hu-man Linkage Consortium human screening set, Weberversion 8; Research Genetics), as described elsewhere(Sheffield et al. 1994). Two control pools of DNA from
Letters to the Editor 903
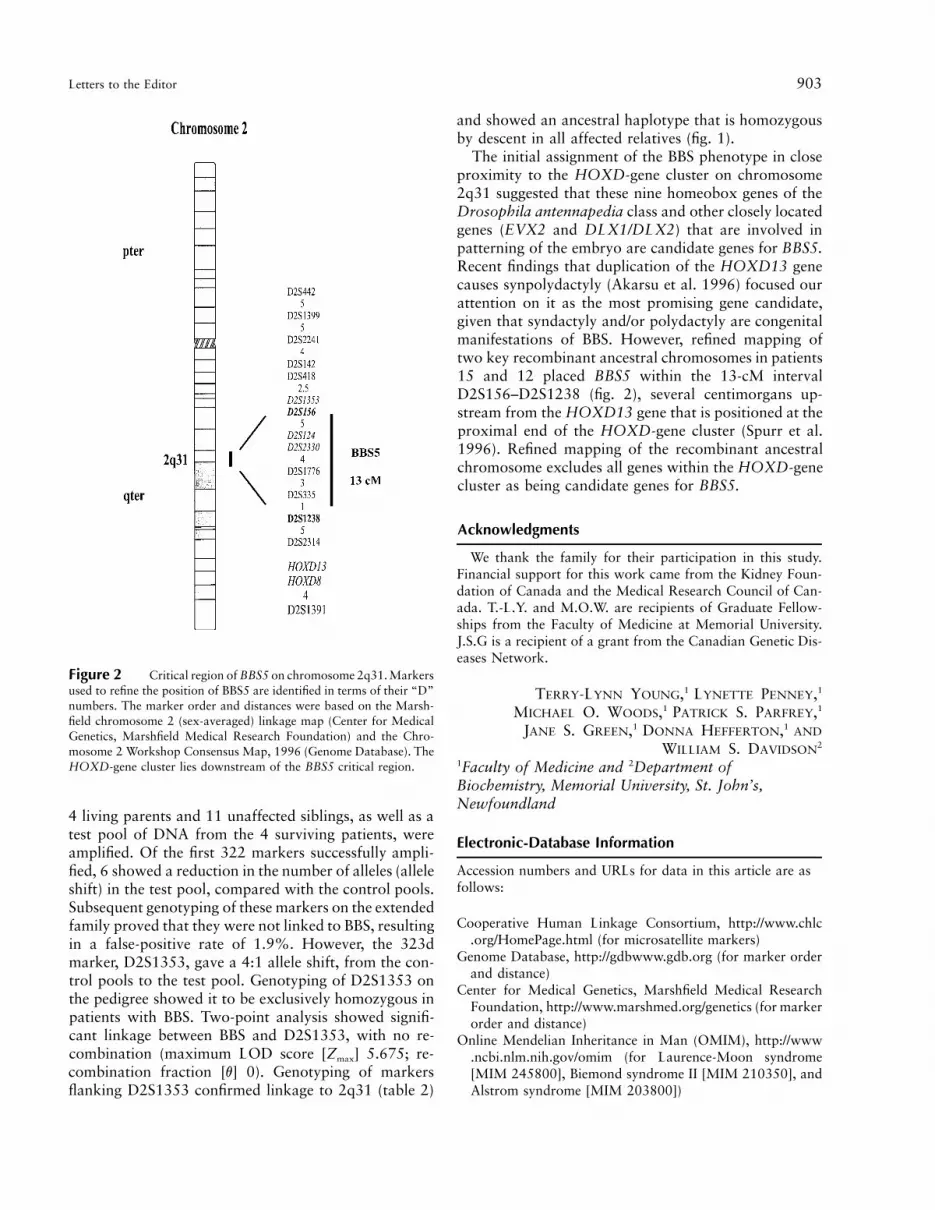
Figure 2 Critical region of BBS5 on chromosome 2q31. Markersused to refine the position of BBS5 are identified in terms of their “D”numbers. The marker order and distances were based on the Marsh-field chromosome 2 (sex-averaged) linkage map (Center for MedicalGenetics, Marshfield Medical Research Foundation) and the Chro-mosome 2 Workshop Consensus Map, 1996 (Genome Database). TheHOXD-gene cluster lies downstream of the BBS5 critical region.
4 living parents and 11 unaffected siblings, as well as atest pool of DNA from the 4 surviving patients, wereamplified. Of the first 322 markers successfully ampli-fied, 6 showed a reduction in the number of alleles (alleleshift) in the test pool, compared with the control pools.Subsequent genotyping of these markers on the extendedfamily proved that they were not linked to BBS, resultingin a false-positive rate of 1.9%. However, the 323dmarker, D2S1353, gave a 4:1 allele shift, from the con-trol pools to the test pool. Genotyping of D2S1353 onthe pedigree showed it to be exclusively homozygous inpatients with BBS. Two-point analysis showed signifi-cant linkage between BBS and D2S1353, with no re-combination (maximum LOD score [Zmax] 5.675; re-combination fraction [v] 0). Genotyping of markersflanking D2S1353 confirmed linkage to 2q31 (table 2)
and showed an ancestral haplotype that is homozygousby descent in all affected relatives (fig. 1).
The initial assignment of the BBS phenotype in closeproximity to the HOXD-gene cluster on chromosome2q31 suggested that these nine homeobox genes of theDrosophila antennapedia class and other closely locatedgenes (EVX2 and DLX1/DLX2) that are involved inpatterning of the embryo are candidate genes for BBS5.Recent findings that duplication of the HOXD13 genecauses synpolydactyly (Akarsu et al. 1996) focused ourattention on it as the most promising gene candidate,given that syndactyly and/or polydactyly are congenitalmanifestations of BBS. However, refined mapping oftwo key recombinant ancestral chromosomes in patients15 and 12 placed BBS5 within the 13-cM intervalD2S156–D2S1238 (fig. 2), several centimorgans up-stream from the HOXD13 gene that is positioned at theproximal end of the HOXD-gene cluster (Spurr et al.1996). Refined mapping of the recombinant ancestralchromosome excludes all genes within the HOXD-genecluster as being candidate genes for BBS5.
Acknowledgments
We thank the family for their participation in this study.Financial support for this work came from the Kidney Foun-dation of Canada and the Medical Research Council of Can-ada. T.-L.Y. and M.O.W. are recipients of Graduate Fellow-ships from the Faculty of Medicine at Memorial University.J.S.G is a recipient of a grant from the Canadian Genetic Dis-eases Network.
TERRY-LYNN YOUNG,1 LYNETTE PENNEY,1
MICHAEL O. WOODS,1 PATRICK S. PARFREY,1
JANE S. GREEN,1 DONNA HEFFERTON,1 AND
WILLIAM S. DAVIDSON2
1Faculty of Medicine and 2Department ofBiochemistry, Memorial University, St. John’s,Newfoundland
Electronic-Database Information
Accession numbers and URLs for data in this article are asfollows:
Cooperative Human Linkage Consortium, http://www.chlc.org/HomePage.html (for microsatellite markers)
Genome Database, http://gdbwww.gdb.org (for marker orderand distance)
Center for Medical Genetics, Marshfield Medical ResearchFoundation, http://www.marshmed.org/genetics (for markerorder and distance)
Online Mendelian Inheritance in Man (OMIM), http://www.ncbi.nlm.nih.gov/omim (for Laurence-Moon syndrome[MIM 245800], Biemond syndrome II [MIM 210350], andAlstrom syndrome [MIM 203800])
904 Letters to the Editor
References
Akarsu AN, Stoilov I, Yilmaz E, Sayli BS, Sarfarazi M (1996)Genomic structure of HOXD13 gene: a nine polyalanineduplication causes synpolydactyly in two unrelated families.Hum Mol Genet 5:945–952
Beales PL, Warner AM, Hitman GA, Thakker R, Flinter FA(1997) Bardet-Biedl syndrome: a molecular and phenotypicstudy of 18 families. J Med Genet 34:92–98
Bear JC, Nemec TF, Kennedy JC, Marshall WH, Power AA,Kolonel VM, Burke GB (1988) Inbreeding in outport New-foundland. Am J Med Genet 29:649–660
Bruford EA, Riise R, Teague PW, Porter K, Thomson KL,Moore AT, Jay M, et al (1997) Linkage mapping in 29 Bar-det-Biedl syndrome families confirms loci in chromosom-al regions 11q13, 15q22.3–q23, and 16q21. Genomics 41:93–99
Carmi R, Rokhlina T, Kwitek-Black AE, Elbedour K, Nishi-mura D, Stone EM, Sheffield VC (1995) Use of a DNApooling strategy to identify a human obesity syndrome locuson chromosome 15. Hum Mol Genet 4:9–13
Farag TI, Teebi AS (1989) High incidence of Bardet-Biedl syn-drome among the Bedouin. Clin Genet 36:463–465
Green JS, Parfrey PS, Harnett JD, Farid NR, Cramer BC, John-son G, Heath O, et al (1989) The cardinal manifestationsof Bardet-Biedl syndrome, a form of Laurence-Moon-Biedlsyndrome. N Engl J Med 321:1002–1009
Klein D, Ammann F (1969) The syndrome of Lawrence-Moon-Bardet-Biedl and allied diseases in Switzerland. J Neurol Sci9:479–513
Kwitek-Black AE, Carmi R, Duyk GM, Buetow KH, ElbedourK, Parvari R, Yandava C, et al (1993) Linkage of Bardet-Biedl syndrome to chromosome 16q and evidence for non-allelic genetic heterogeneity. Nat Genet 5:392–396
Lander ES, Botstein D (1987) Homozygosity mapping: a wayto map human recessive traits with the DNA of inbred chil-dren. Science 236:1567–1570
Nelson JK, Moxness KE, Jensen M, Gastmean C (1994) MayoClinic diet manual of nutrition practice, 7th ed. CW Mosby,St Louis, pp 186, 657
Sheffield VS, Carmi R, Kwitek-Black A, Rokhlina T, Nishi-mura D, Duyk GM, Elbedour K, et al (1994) Identificationof a Bardet-Biedl syndrome locus on chromosome 3 andevaluation of an efficient approach to homozygosity map-ping. Hum Mol Genet 3:1331–1335
Sheffield VS, Stone EM, Carmi R (1998) Use of isolated inbredhuman populations for identification of disease genes.Trends Genet 14:391–396
Spurr NK, Bashir R, Bushby K, Cox A, Cox S, HildebrandtF, Hill N, et al (1996) Report and abstracts of the FourthInternational Workshop on Human Chromosome 2 Map-ping 1996. Cytogenet Cell Genet 73:255–273
Woods MO, Young TL, Parfrey PS, Hefferton D, Green JS,Davidson WS (1999) Genetic heterogeneity of Bardet-Biedlsyndrome in a distinct Canadian population: evidence for afifth locus. Genomics 55:2–9
Address for correspondence and reprints: Dr. Terry-Lynn Young, Departmentof Biochemistry, Memorial University of Newfoundland, St. John’s, Newfound-land, Canada, A1B 3X9. E-mail: [email protected]
q 1999 by The American Society of Human Genetics. All rights reserved.0002-9297/99/6403-0030$02.00
Am. J. Hum. Genet. 64:904–908, 1999
Autosomal Dominant (Beukes) PrematureDegenerative Osteoarthropathy of the Hip Joint Mapsto an 11-cM Region on Chromosome 4q35
To the Editor:We have previously reported the clinical and radio-graphic features of affected individuals from a large kin-dred who have an autosomal dominant form of bilateraldysplasia of the hip joints with severe secondary os-teoarthrosis (Cilliers and Beighton 1990). This familycame to the attention of one of us (H.C.) because of thenumber of patients with the family name, Beukes, whopresented to the Department of Orthopaedic Surgery,University of Orange Free State, South Africa, for pros-thetic hip-joint replacement as a consequence of bilateralpremature degenerative osteoarthropathy. Genealogicalstudies subsequently revealed that all the affected indi-viduals were members of an extended family that couldbe traced back to a single Dutch immigrant to SouthAfrica who arrived in 1685 (Cilliers and Beighton 1990).Our continued investigation of this family has nowtraced 55 individuals in eight generations who, on thebasis of either their medical histories or clinical and ra-diographic presentation of the disorder, appear to haveinherited the disorder. The disorder clearly has an au-tosomal dominant mode of inheritance, but there is someevidence of nonpenetrance in that apparently unaffectedindividuals have had affected offspring. The clinical andradiographic manifestations have been described in de-tail elsewhere (Cilliers and Beighton 1990). In brief, thepresenting symptom is hip-joint discomfort, which usu-ally develops during childhood at age !2 years but maydevelop either later in childhood or, as in one instance,as late as the age of 35 years. After onset of symptoms,the hip joints deteriorate progressively, gait is disturbed,and, by early adulthood, affected persons are crippledby degenerative arthropathy. The earliest radiologicalchanges are broadening of the femoral necks, late ap-pearance of the secondary ossification centers of the fem-oral head, and an irregular appearance of the proximalepiphyseal line of the femur. By mid childhood, the fem-oral heads are flat (coxa plana), with broadening of thefemoral necks, adaptation of the acetabulum to the mal-

Figure 1 BHD pedigree, showing disease-linked haplotypes. Blackened circles and squares represent affected females and males, respectively. Symbols containing a question mark (?) are likelyto be nonpenetrant carriers of the disease. The haplotypes for all individuals that were genotyped are given under the symbols. The DNA sample from individual V-3 was obtained before his death.The disease-linked haplotype is on the left and is indicated by a blackened box to its right. The marker order, from top to bottom, is D4S1607, D4S2951, D4S1554, D4S408, D4S2924, D4S171,D4S1540, D4S3051, D4S426, and D4S2940.
906 Letters to the Editor
Table 1
Two-Point Z Values, between BHD and Chromosome 4q35 Markers
MARKER Zmax (vmax)
Z AT v 5
.00 .01 .05 .10 .20 .30 .40
D4S1607 1.54 (.18) 211.96 22.19 .37 1.23 1.53 1.14 .48D4S2951 1.46 (.17) 212.20 21.32 .63 1.26 1.43 1.07 .53D4S1554 2.00 (.10) 21.42 1.27 1.89 2.0 1.75 1.25 .63D4S408 3.58 (.00) 3.58 3.55 3.37 3.05 2.23 1.30 .39D4S2924 5.73 (.00) 5.73 5.68 5.40 4.96 3.87 2.58 1.17D4S171 4.84 (.00) 4.84 4.79 4.55 4.15 3.16 2.01 .82D4S1540 5.11 (.00) 5.11 5.03 4.67 4.17 3.06 1.90 .78D4S3051 .18 (.33) 23.14 22.35 21.01 2.43 .04 .17 .14D4S426 .03 (.40) 27.10 22.63 21.18 2.60 2.15 0 .03D4S2930 .18 (.29) 212.36 23.64 21.44 2.55 .07 .18 .11
NOTE.—All values are calculated under the assumption of 90% penetrance and a disease-allele frequency of .0001.
formed femoral head, superolateral displacement of thefemoral head, and an irregular appearance of the greatertrochanteric epiphyses. By adulthood, these features aremore pronounced, and there is superior migration andsuperolateral displacement of the femoral head and over-growth of the greater trochanter in a superomedial di-rection. In the later stages, coxa vara is a prominentfinding. Signs of degenerative osteoarthrosis (periarti-cular cysts, periarticular sclerosis, and narrowing of thejoint space) are evident in early to mid childhood andare progressive. Apart from the hip problems, the generalhealth of affected individuals is good, their height isnormal, and, other than in one instance in which a youngadult had severe kyphoscoliosis that necessitated spinalfusion, involvement of the vertebral bodies and otherjoints is minimal. The radiographic findings, the absenceof involvement of the vertebral bodies and joints otherthan the hip, and the normal stature of affected indi-viduals has led to the conclusion that this disorder isdistinct from other autosomal dominant forms of chon-drodysplasia, in which premature degenerative osteoar-thropathy of the hip joint is a major complication. Ittherefore seemed appropriate that this condition be cat-egorized as a familial hip dysplasia, and it was called“Beukes hip dysplasia” (BHD [MIM 142669]), on thebasis of the name of the affected family (Cilliers andBeighton 1990).
Mutations in the genes encoding components of theextracellular matrix of cartilage have been identified infamilies with forms of chondrodysplasia with secondaryosteoarthritis (see Kuivaniemi et al. 1997; Briggs et al.1998, and references therein). We commenced our stud-ies to locate the gene responsible for BHD, by perform-ing analyses of linkage to polymorphic markers withinor near cartilage candidate genes. We found, however,no evidence of linkage to COL2A1 (Beighton et al.1994), COL9A1, COL9A2, COL11A1, COL11A2,COL10A1, CRTL-1, CRTM, AGC1, or COMP (Al-Ali
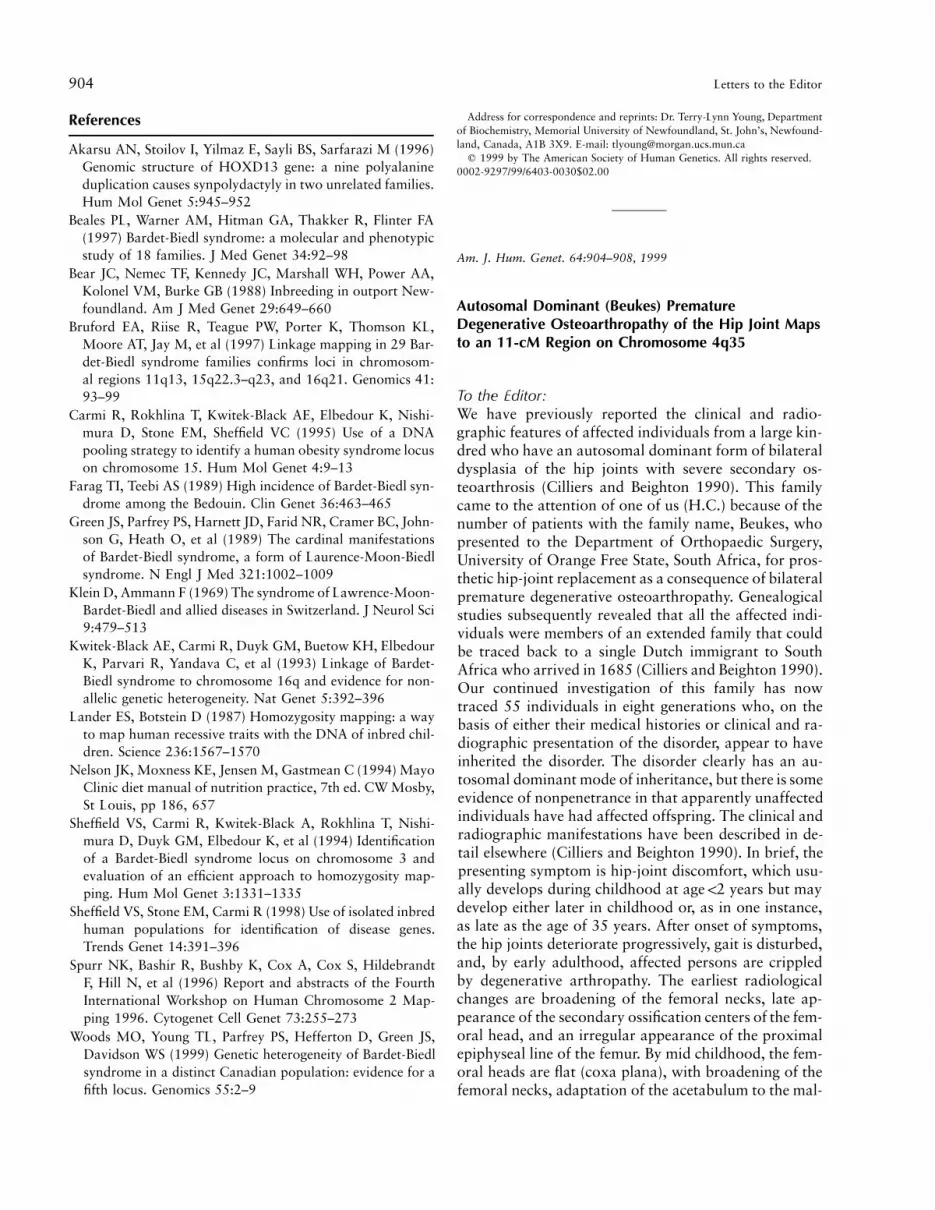
et al. 1994; G. Wallis, P. Roby, and S. Eyre, unpublisheddata). We therefore performed a genomewide screenwith a panel of 290 markers with an average spacing of11 cM (Davies et al. 1994). For this purpose, genotypedata were obtained from 32 individuals from the BHDkindred, including 15 affected individuals, 11 unaffectedrelated individuals, and 6 unrelated spouses. The af-fected status of the 15 individuals who were genotypedhad been established on the basis of their clinical andradiological presentation of the disorder. The BHD ped-igree shown infigure 1 has been condensed and includesonly those individuals who were genotyped and thosewho were required for the linkage analysis. Despite thefact that the pedigree has been condensed, the relation-ships between the members of the pedigree have beenretained. Genotyping was done with an ABI 373 se-quencer and GENESCAN 1.2.2-1 and GENOTYPER1.1.1 software. Two-point LOD score (Z) values werecomputed by the LINKAGE package (Lathrop and Lal-ouel 1984), for various recombination fraction (v) val-ues, with penetrance values of 90%, 95%, and 100%,and a disease frequency of .0001. One marker on chro-mosome 4, D4S408, had a maximum Z (Zmax) value of3.58 at a maximum v (vmax) of .00, at 90% penetrance(see table 1). Further analysis with markers from thisregion, with penetrance values of 85%, 90%, and 95%,gave a two-point Zmax value of 5.73 for markerD4S2924, at and at a penetrance of 90% (seev 5 .00table 1). Haplotypes were constructed with the map or-der D4S1607–1.5 cM–D4S2951–1 cM–D4S1554–4cM–D4S408–3.2 cM–D4S2924–0.5 cM–D4S171–0.5cM–D4S1540–3 cM–D4S3051–1 cM–D4S426–1.3cM–D4S2930. The order of the markers was derivedfrom on-line genetic mapping data at the Center forMedical Genetics, Marshfield Medical Research Foun-dation Website. As judged on the basis of an examina-tion of the marker haplotypes segregating with BHD (fig.1), the closest recombinants involving affected family

Letters to the Editor 907
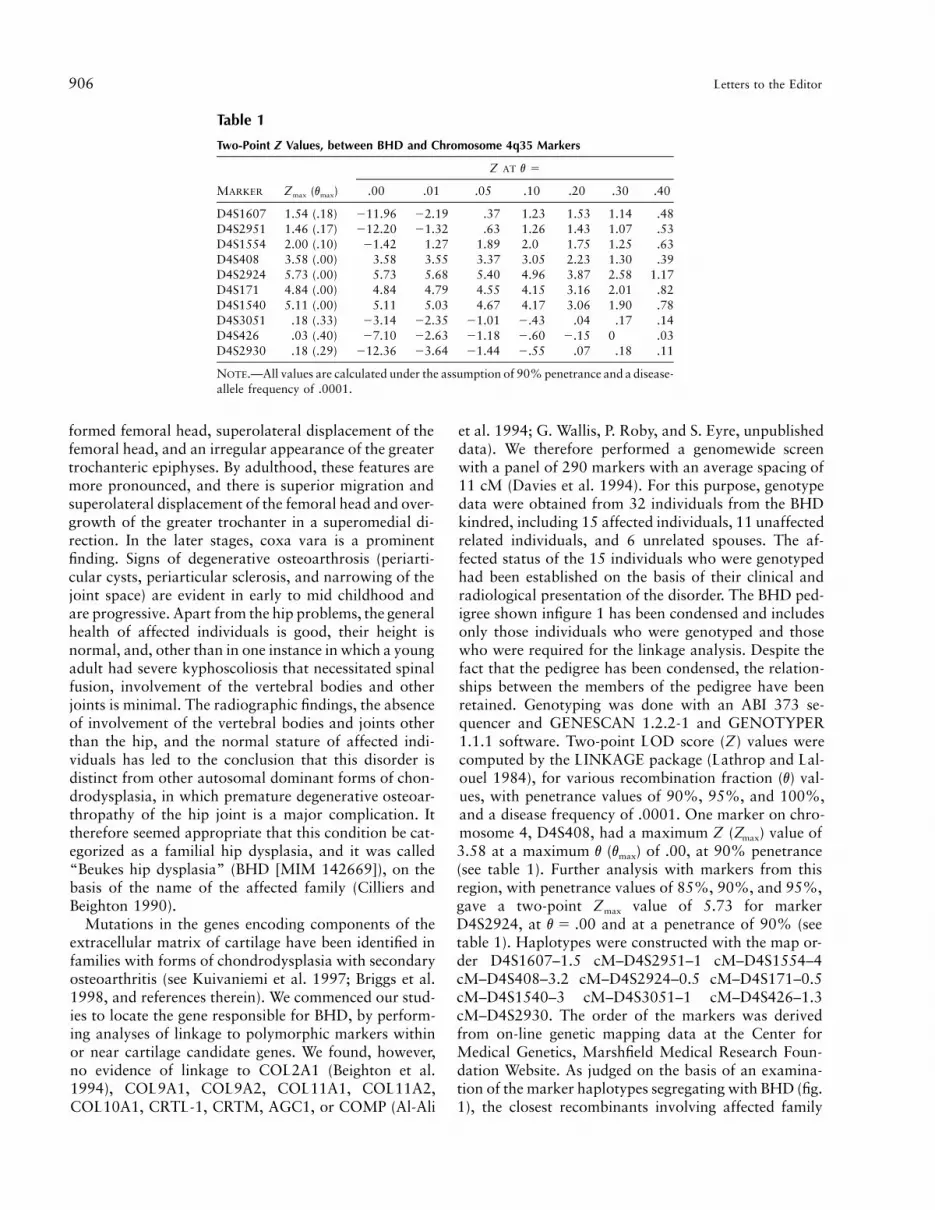
Figure 2 Graphic representation of three-point location scoresbased on genotype data for chromosome 4 markers and members ofthe BHD family. A location score is equivalent to Z multiplied by 4.6.
members were at D4S1554 proximally and D4S3051distally, which limits the BHD gene locus to an intervalof ∼11 cM. Three apparently clinically unaffected in-dividuals (VII-4, age 49 years; VII-7, age 33 years; andVII-9, age 33 years) were found to have inherited thedisease-linked haplotype. Individual VII-4 transmittedthe disorder and the disease-linked haplotype to her twoaffected offspring, demonstrating that she is a nonpe-netrant carrier of the mutated gene. However, to date,her only potential clinical symptom of the disorder hasbeen hip-joint pain during pregnancy. The remainingtwo individuals have not reported any symptoms of thedisorder. Attempts are currently underway to obtain re-cent radiographs of these three individuals, to determinewhether they have any radiological evidence of thedisorder.
Multipoint analysis was done with the LINKAGE 5.1LINKMAP program and the marker order given above.Multipoint analysis with the complete set of markersspanning the disease interval was not possible, becauseof both the high number of alleles per marker and thelarge number of individuals in the pedigree, so sequentialthree-point analyses were done. The combined resultsare shown in figure 2. The multipoint location score forthe chromosome 4 markers was 30.05 (equivalent to
), and the likely location of the BHD gene wasZ 5 6.5confirmed to be the 11-cM interval between D4S1554and D4S3051. Currently, within the linked region thereare no known or obvious potential candidate genes forthe disease, and no other forms of familial osteochon-drodysplasia are known to map to this region. Physicalmapping data for this region include a single YAC con-tig, WC4.7, to which a number of expressed sequencetags (ESTs) have been mapped (Whitehead Institute/MITGenome Sequencing Project).
Our finding that BHD does not map to any of the locithat have previously been identified for other forms ofautosomal dominant chondrodysplasia with associatedosteoarthropathy (notably, spondyloepiphyseal dyspla-sia [MIM 184100 and MIM 183900], multiple epi-physeal dysplasia [MIM 226900], and pseudoachon-droplasia [MIM 177170]) supports the clinical andradiographic data suggesting that this disorder is a dis-tinct form of familial hip dysplasia. Identification of theBHD gene within the linked region on 4q35 could haveimplications for the investigation of other, more com-mon forms of idiopathic hip osteoarthritis.
Acknowledgments
We sincerely thank the family members who participated inthis study, as well as the many genetics nurses who were in-volved in the collection of the DNA. We thank Mike Briggsand Mike Dixon for helpful discussions. This work was sup-ported by grants from the Royal Society (United Kingdom),the Arthritis Research Campaign (United Kingdom), the U.C.T.Staff Research Fund, and the Mauerberger Foundation, S.A.
PHILIP ROBY,1,2 STEPHEN EYRE,1,2
JANE WORTHINGTON,2 RAJKUMAR RAMESAR,4
HENDRIK CILLIERS,5 PETER BEIGHTON,4
MICHAEL GRANT,1 AND GILLIAN WALLIS1,3
1The Wellcome Trust Centre for Cell-Matrix Research,School of Biological Sciences, 2Arthritis ResearchCampaign Epidemiology Research Unit, and3Department of Medicine, University of Manchester,Manchester; 4Department of Human Genetics,University of Cape Town, Cape Town; and5University of Bloemfontein, Bloemfontein, SouthAfrica

908 Letters to the Editor
Electronic-Database Information
Accession numbers and URLs for data used in this study areas follows:
Center for Medical Genetics, Marshfield Medical ResearchFoundation, http://www.marshmed.org/genetics/ (for mark-er order)
Online Mendelian Inheritance in Man (OMIM), http://www.ncbi.nim.nih.gov/Omim (for BHD [MIM 142669],pseudoachondroplasia [MIM 177170], spondyloepiphysealdysplasia [MIM 183900 and MIM 184100], and multipleepiphyseal dysplasia [MIM 226900])
Whitehead Institute/MIT Genome Sequencing Project, http://carbon.wi.mit.edu (for mapping of ESTs)
References
Al-Ali M, Beighton P, Read A, Warman M, Donn R, Boot-Handford R, Wallis GA (1994) Exclusion of candidate genesin two families with inherited forms of osteoarthritis. Int JExp Pathol 75:A71
Beighton P, Cilliers HJ, Ramesar R (1994) Autosomal domi-nant (Beukes) premature degenerative osteoarthropathy ofthe hip joint unlinked to COL2A1. Am J Med Genet 53:348–351
Briggs MD, Mortier GR, Cole WG, King LM, Golik SS, Bon-aventure J, Nuytinck L, et al (1998) Diverse mutations inthe gene for cartilage oligomeric matrix protein in the pseu-doachondroplasia–multiple epiphyseal dysplasia diseasespectrum. Am J Hum Genet 62:311–319
Cilliers HJ, Beighton P (1990) Beukes familial hip dysplasia:an autosomal dominant entity. Am J Med Genet 36:386–390
Davies JL, Kawaguchi Y, Bennett ST, Copeman JB, Cordell HJ,Pritchard LE, Reed PW, et al (1994) Genome-wide searchfor human type 1 diabetes susceptibility genes. Nature 371:130–136
Kuivaniemi H, Tromp G, Prockop DJ (1997) Mutations infibrillar collagens (types I, II, III and XI), fibril-associatedcollagen (type IX) and network-forming collagen (type X)cause a spectrum of diseases of bone, cartilage and bloodvessels. Hum Mutat 9:300–315
Lathrop GM, Lalouel JM (1984) Easy calculations of LODscores and genetic risks on small computers. Am J HumGenet 36:460–465
Address for correspondence and reprints: Dr. Gillian A. Wallis, School ofBiological Sciences, University of Manchester, 2.205 Stopford Building, OxfordRoad, Manchester M13 9PT, United Kingdom. E-mail: [email protected]
q 1999 by The American Society of Human Genetics. All rights reserved.0002-9297/99/6403-0031$02.00
Am. J. Hum. Genet. 64:908–910, 1999
Common Fragile Sites: G-Band Characteristics withinan R-Band
To the Editor:Common fragile sites are chromosomal loci prone tobreakage and rearrangement and are considered to bepart of the normal chromosome structure. They are vi-sualized as constrictions, gaps, or breaks on metaphasechromosomes from cells exposed to specific tissue-cul-ture conditions (Sutherland and Richards 1995).Three common fragile sites—FRA3B, FRA7H, andFRA7G—were recently cloned and identified at the mo-lecular level (Boldog et al. 1997; Inoue et al. 1997;Huang et al. 1998; Mishmar et al. 1998). Sequence anal-ysis of these three common fragile sites revealed no CGGor other expanded repeated sequences, such as have beenfound in rare fragile sites (Sutherland and Richards1995). DNA sequence analysis of FRA3B, FRA7H, andFRA7G did not reveal any obvious feature that couldaccount for the fragility of these sites. To shed light onthe mechanism of fragility, we undertook a new ap-proach and analyzed the available sequences of FRA3B,FRA7H, and FRA7G, for DNA structural characteristicsthat might be associated with their fragility (Mishmaret al. 1998). The analysis revealed several regions witha potential to form unusual DNA structures, includinghigh flexibility, low stability, and non–B DNA–formingsequences. Thus, these unusual DNA characteristics arepossibly intrinsic properties of common fragile sites,which may affect their replication, condensation, andorganization and may lead to fragility.
While analyzing the sequences of FRA3B, FRA7H,and FRA7G, we noticed several features that are char-acteristic of G-bands (Gardiner 1995). The three clonedfragile sites have high (157%) A/T content, and are allgene poor. FRA3B and FRA7H are rich in LINE se-quences. FRA3B and markers proximal to FRA7G wereshown to replicate late during S-phase (Selig et al. 1992;Huang et al. 1998; Le Beau et al. 1998). G-bands andR-bands correspond to functional subregions, repre-sented as stained bands, that apparently reveal the basicstructural organization of chromosomes. G-bands arecharacterized as regions with high A/T content that rep-licate late during S-phase, are insensitive to DNase-I, andare gene poor, Alu poor, and LINE rich. In contrast, thecomplementary R-bands are regions with high G/C con-tent that replicate early during S-phase, are DNase sen-sitive, and are gene rich, Alu rich, and LINE poor (Gar-diner 1995). Most (76/89 [185%]) of the commonfragile sites, including the cloned sites, map to R-bands(according to our analysis of the Genome Databasedata). These characteristics suggest that fragile sites
Letters to the Editor 909
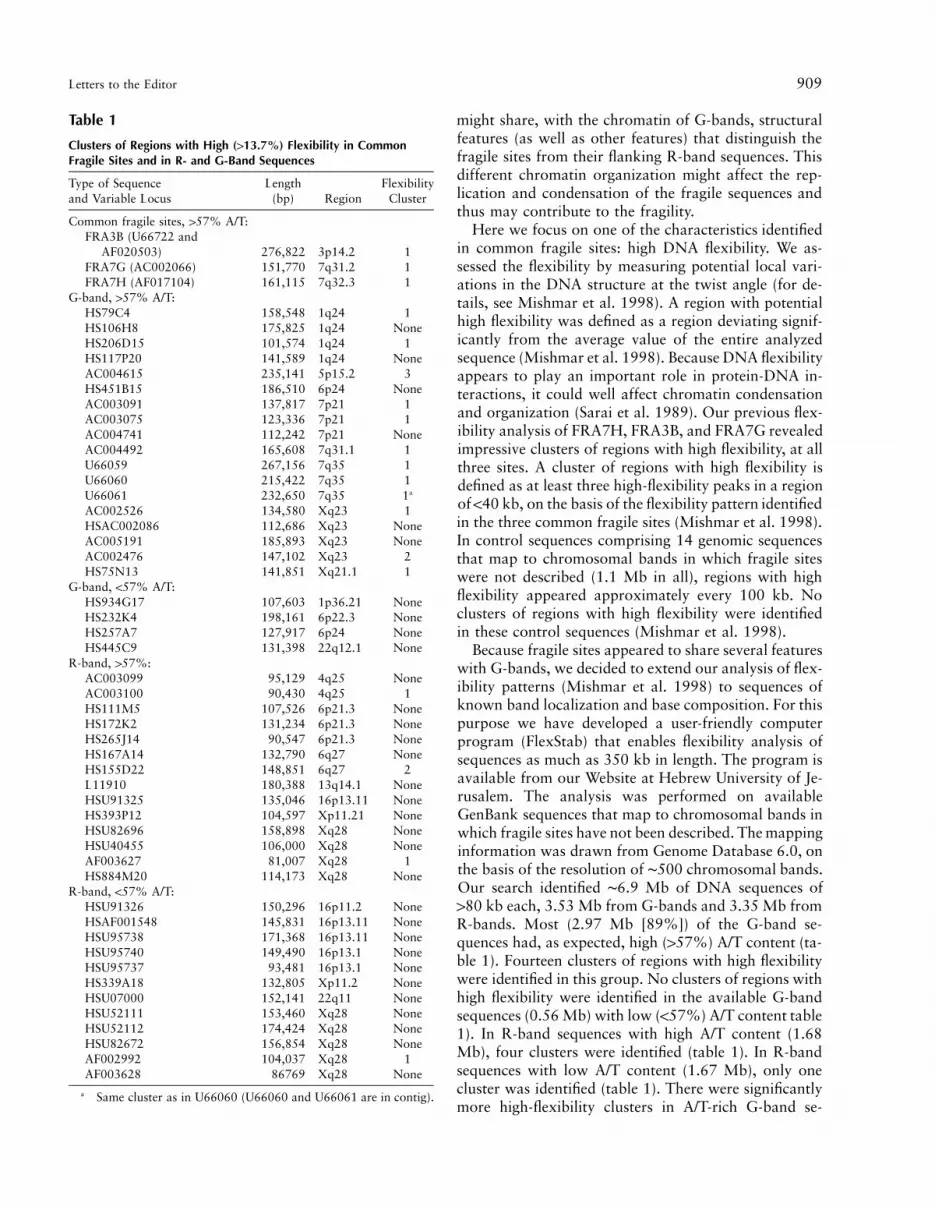
Table 1
Clusters of Regions with High (113.7%) Flexibility in CommonFragile Sites and in R- and G-Band Sequences
Type of Sequenceand Variable Locus
Length(bp) Region
FlexibilityCluster
Common fragile sites, 157% A/T:FRA3B (U66722 and
AF020503) 276,822 3p14.2 1FRA7G (AC002066) 151,770 7q31.2 1FRA7H (AF017104) 161,115 7q32.3 1
G-band, 157% A/T:HS79C4 158,548 1q24 1HS106H8 175,825 1q24 NoneHS206D15 101,574 1q24 1HS117P20 141,589 1q24 NoneAC004615 235,141 5p15.2 3HS451B15 186,510 6p24 NoneAC003091 137,817 7p21 1AC003075 123,336 7p21 1AC004741 112,242 7p21 NoneAC004492 165,608 7q31.1 1U66059 267,156 7q35 1U66060 215,422 7q35 1U66061 232,650 7q35 1a
AC002526 134,580 Xq23 1HSAC002086 112,686 Xq23 NoneAC005191 185,893 Xq23 NoneAC002476 147,102 Xq23 2HS75N13 141,851 Xq21.1 1
G-band, !57% A/T:HS934G17 107,603 1p36.21 NoneHS232K4 198,161 6p22.3 NoneHS257A7 127,917 6p24 NoneHS445C9 131,398 22q12.1 None
R-band, 157%:AC003099 95,129 4q25 NoneAC003100 90,430 4q25 1HS111M5 107,526 6p21.3 NoneHS172K2 131,234 6p21.3 NoneHS265J14 90,547 6p21.3 NoneHS167A14 132,790 6q27 NoneHS155D22 148,851 6q27 2L11910 180,388 13q14.1 NoneHSU91325 135,046 16p13.11 NoneHS393P12 104,597 Xp11.21 NoneHSU82696 158,898 Xq28 NoneHSU40455 106,000 Xq28 NoneAF003627 81,007 Xq28 1HS884M20 114,173 Xq28 None
R-band, !57% A/T:HSU91326 150,296 16p11.2 NoneHSAF001548 145,831 16p13.11 NoneHSU95738 171,368 16p13.11 NoneHSU95740 149,490 16p13.1 NoneHSU95737 93,481 16p13.1 NoneHS339A18 132,805 Xp11.2 NoneHSU07000 152,141 22q11 NoneHSU52111 153,460 Xq28 NoneHSU52112 174,424 Xq28 NoneHSU82672 156,854 Xq28 NoneAF002992 104,037 Xq28 1AF003628 86769 Xq28 None
a Same cluster as in U66060 (U66060 and U66061 are in contig).
might share, with the chromatin of G-bands, structuralfeatures (as well as other features) that distinguish thefragile sites from their flanking R-band sequences. Thisdifferent chromatin organization might affect the rep-lication and condensation of the fragile sequences andthus may contribute to the fragility.
Here we focus on one of the characteristics identifiedin common fragile sites: high DNA flexibility. We as-sessed the flexibility by measuring potential local vari-ations in the DNA structure at the twist angle (for de-tails, see Mishmar et al. 1998). A region with potentialhigh flexibility was defined as a region deviating signif-icantly from the average value of the entire analyzedsequence (Mishmar et al. 1998). Because DNA flexibilityappears to play an important role in protein-DNA in-teractions, it could well affect chromatin condensationand organization (Sarai et al. 1989). Our previous flex-ibility analysis of FRA7H, FRA3B, and FRA7G revealedimpressive clusters of regions with high flexibility, at allthree sites. A cluster of regions with high flexibility isdefined as at least three high-flexibility peaks in a regionof !40 kb, on the basis of the flexibility pattern identifiedin the three common fragile sites (Mishmar et al. 1998).In control sequences comprising 14 genomic sequencesthat map to chromosomal bands in which fragile siteswere not described (1.1 Mb in all), regions with highflexibility appeared approximately every 100 kb. Noclusters of regions with high flexibility were identifiedin these control sequences (Mishmar et al. 1998).
Because fragile sites appeared to share several featureswith G-bands, we decided to extend our analysis of flex-ibility patterns (Mishmar et al. 1998) to sequences ofknown band localization and base composition. For thispurpose we have developed a user-friendly computerprogram (FlexStab) that enables flexibility analysis ofsequences as much as 350 kb in length. The program isavailable from our Website at Hebrew University of Je-rusalem. The analysis was performed on availableGenBank sequences that map to chromosomal bands inwhich fragile sites have not been described. The mappinginformation was drawn from Genome Database 6.0, onthe basis of the resolution of ∼500 chromosomal bands.Our search identified ∼6.9 Mb of DNA sequences of180 kb each, 3.53 Mb from G-bands and 3.35 Mb fromR-bands. Most (2.97 Mb [89%]) of the G-band se-quences had, as expected, high (157%) A/T content (ta-ble 1). Fourteen clusters of regions with high flexibilitywere identified in this group. No clusters of regions withhigh flexibility were identified in the available G-bandsequences (0.56 Mb) with low (!57%) A/T content table1). In R-band sequences with high A/T content (1.68Mb), four clusters were identified (table 1). In R-bandsequences with low A/T content (1.67 Mb), only onecluster was identified (table 1). There were significantlymore high-flexibility clusters in A/T-rich G-band se-

910 Letters to the Editor
quences than in A/T-rich R-band sequences ( ).P 5 .009Thus, the flexibility pattern is one of the features thatdifferentiate R- and G-bands.
As mentioned, common fragile sites were found to beA/T rich. The pattern of high-flexibility clusters foundin the identified common fragile sites (see table 1) (Mish-mar et al. 1998) was significantly different ( )P 5 .02from that of A/T-rich control sequences mapped to R-bands. This pattern was not different from that of A/T-rich control sequences mapped to G-bands ( ).P 5 .85These results might indicate that common fragile sitesmapped to R-bands have the flexibility patterns char-acteristic of G-bands with the same A/T content.
Our previous analysis of potential unusual DNAstructures in FRA7H revealed a cluster of regions withpotential to form triple helixes (Mishmar et al. 1998).Previous studies, using monoclonal antibodies to triple-helix DNA, showed that G-bands are rich in triple-helixDNA (Burkholder et al. 1991). Thus, clusters of regionswith potential to form triple-helix DNA might be addedto the G-band characteristics found in common fragilesites.
Together, all the known molecular features of commonfragile sites indicate that they might consist of DNAsequences with characteristics of G-bands embeddedwithin R-bands. Of what significance could this featurebe to the mechanism of fragility? We think that delayedreplication and aberrant condensation of fragile sitesmight be involved. Chromosomal bands apparently rep-resent regions with several origins of replication that arecoordinately controlled to initiate the replication pro-cess. The presence of a relatively small region consistingof a common fragile site with G-band characteristicsmight lead to disturbances in the regional control ofreplication. This might involve inappropriate initiationof replication in the fragile region. The addition of aphi-dicolin, which inhibits DNA elongation, might furtheradd to the interference in replication at fragile sites, lead-ing to unreplicated sequences that might adopt abnormalchromatin organization, resulting in fragility.
DAN MISHMAR,1 YAEL MANDEL-GUTFREUND,2
HANAH MARGALIT,2 AYELET RAHAT,1 AND
BATSHEVA KEREM1
1Department of Genetics, The Hebrew University, and2Department of Genetics and Biotechnology, TheHebrew University, Hadassah, Jerusalem
Electronic-Database Information
URLs for data in this article are as follows:
Genome Database, http://www.gdb.orgHebrew University of Jerusalem, http://leonardo.ls.huji.ac.il/
departments/genesite/faculty/bkerem.htm
References
Boldog F, Gemmill RM, West J, Robinson M, Robinson L, LiE, Roche J, et al (1997) Chromosome 3p14 homozygousdeletions and sequence analysis of FRA3B. Hum Mol Genet6:193–203
Burkholder GD, Latimer LJ, Lee JS (1991) Immunofluorescentlocalization of triplex DNA in polytene chromosomes ofChironomus and Drosophila. Chromosoma 101:11–18
Gardiner K (1995) Human genome organization. Curr OpinGenet Dev 5:315–322
Huang H, Qian J, Proffit J, Wilber K, Jenkins R, Smith DI(1998) FRA7G extends over a broad region: coincidence ofhuman endogenous retroviral sequences (HERV-H) andsmall polydispersed circular DNAs (spcDNA) and fragilesites. Oncogene 16:2311–2319
Inoue H, Ishii H, Alder H, Synder E, Druck T, Huebner K,Croce CM (1997) Sequence of the FRA3B common fragileregion: implications for the mechanism of FHIT deletion.Proc Natl Acad Sci USA 94:14584–14589
Le Beau MM, Rassool FV, Neilly ME, Espinosa III R, GloverTW, Smith DI, McKeithan TW (1998) Replication of a com-mon fragile site, FRA3B, occurs late in S phase and is delayedfurther upon induction: implications for the mechanism offragile site induction. Hum Mol Genet 7:755–761
Mishmar D, Rahat A, Scherer SW, Nyakatura G, HinzmannB, Kohwi Y, Mandel-Gutfreund Y, et al (1998) Molecularcharacterization of a common fragile site (FRA7H) on hu-man chromosome 7 by the cloning of an SV40 integrationsite. Proc Natl Acad Sci USA 95:8141–8146
Sarai A, Mazur J, Nussinov R, Jernigan RL (1989) Sequencedependence of DNA conformational flexibility. Biochemistry28:7842–7849
Selig S, Okumura K, Ward DC, Cedar H (1992) Delineationof DNA replication time zones by fluorescence in situ hy-bridization. EMBO J 11:1217–1225
Sutherland GR, Richards RI (1995) The molecular basis offragile sites in human chromosomes. Curr Opin Genet Dev5:323–327
Address for correspondence and reprints: Dr. Batsheva Kerem, Departmentof Genetics, The Hebrew University, Jerusalem, Israel, 91904. E-mail:[email protected]
q 1999 by The American Society of Human Genetics. All rights reserved.0002-9297/99/6403-0032$02.00
Am. J. Hum. Genet. 64:910–915, 1999
Finite-Sample Properties of Family-BasedAssociation Tests
To the Editor:During the past few years, there has been much interestin the use of family-based association tests to detect link-age between marker and disease loci, since these methodsavoid the problems of ascertaining the appropriate pop-

Letters to the Editor 911
Figure 1 Achieved type I errors for TTDT(1) and L (D), compared with specified a (unbroken horizontal line), for (from top to bottom), .0001, (1e-06), and (5e-08).26 28a 5 .01 1 # 10 5 # 10
ulations of cases and controls implicit in population as-sociation studies. Although these tests were originallydeveloped for candidate-gene studies, the use of suchmethods in genome scans has recently been proposed(Risch and Merikangas 1996).
Perhaps the best-known family-based association test
is the transmission/disequilibrium test (TDT) for diallelicmarkers, introduced by Spielman and Ewens (1993). Anumber of similar tests have subsequently been sug-gested; for reviews, see the work of Spielman and Ewens(1996) and Curnow et al. (1998). However, it has oftennot been clear how these various tests are related, and

912 Letters to the Editor
Figure 2 Power versus number of heterozygous parents for TTDT
and likelihood-ratio statistic L (L.R. test), when andg 5 4 a 5 5 #.2810
there has been debate about the advantages and disad-vantages of several of the tests (e.g., see Kaplan et al.1997; Sham 1997). There is a need to investigate therelationships between the suggested tests and to establishwhich of them should be preferred in a given situation.Determining the relative merits of competing test statis-tics is often difficult, because the comparisons usuallyrely on simulation or on asymptotic results that may beof limited relevance to finite-sample data. Here we sug-gest a way of avoiding these problems for diallelic mark-ers, focusing particularly on the TDT, the extended TDT(ETDT [Sham and Curtis 1995]), the score tests intro-duced by Schaid (1996), and tests based on the condi-tional likelihood of the offspring marker types when theparental marker data are given.
We consider a sample of N families, each with a singleaffected child. All individuals have been genotyped at amarker locus with m alleles, labeled as “M1,”M2,),Mm.” We wish to use information on the allelestransmitted from the parents to the affected child, to testthe null hypothesis of no linkage or no association be-tween the marker and disease. Note that we can only
test this compound null hypothesis when we have a sin-gle affected child in each family; for families with mul-tiple affected children, the tests discussed below are validonly as tests of linkage, not as tests of association (Spiel-man and Ewens 1996).
Consider a single family, with parental marker gen-otypes g and h and with the genotype of the affectedchild denoted by x. If we use CA to denote that a childis affected, then the probability of the child’s genotype,conditional on the parental genotype is, by Bayes’stheorem,
P(C Fx,g,h)P(xFg,h)P(g,h)AP(xFg,h,C ) 5A ∗ ∗O P(C Fx ,g,h)P(x Fg,h)P(g,h)A∗x PG
P(C Fx)P(xFg,h)A5 ,∗ ∗O P(C Fx )P(x Fg,h)A∗x PG
where G is the set of possible marker types for the af-fected child (Schaid 1996). We shall assume normal seg-regation (which requires, e.g., absence of meiotic drive),so that P(xFg, h) is easily calculated, leaving onlyP(CAFx), the risk of disease for a particular marker ge-notype, to be discussed.
We could model the disease locus explicitly, but it isoften more convenient (Self et al. 1991; Schaid 1996) towork directly with the marker genotype, by putting
. The fx then reflects both the disease-locusf 5 P(C Fx)x A
penetrances and the strength of allelic association be-tween the marker and disease loci in the affected chil-dren. Note that parameters are needed inm(m 1 1)/2the general model; this will be large for highly poly-morphic markers. Schaid (1996) derives score tests forgeneral fx and for various special cases representing par-ticular disease models. In particular, Schaid shows that,for a log-additive model—that is, one in which alleliceffects combine multiplicatively at the marker, so that
—the score test for a diallelic marker is the TDTf 5 f fx x x1 2
statistic.Note that we are using this multiplicative model as a
convenient approximation, rather than as somethingthat we believe is exactly correct. If the true diseasemodel is not multiplicative, then tests based on the mul-tiplicative model remain valid in the sense of having thecorrect size, but they may not be optimal, in that theremay exist other test statistics with higher power. How-ever, the multiplicative model has the advantage of re-quiring ( ) parameters, where tests derived bym 2 1means of the general model need . Thism(m 1 1)/2means that tests based on the multiplicative model canbe more powerful than general alternatives even whenthe allelic effects do not combine multiplicatively at themarker (e.g., see Schaid 1996).
Schaid (1996) comments that likelihood-ratio tests
Letters to the Editor 913
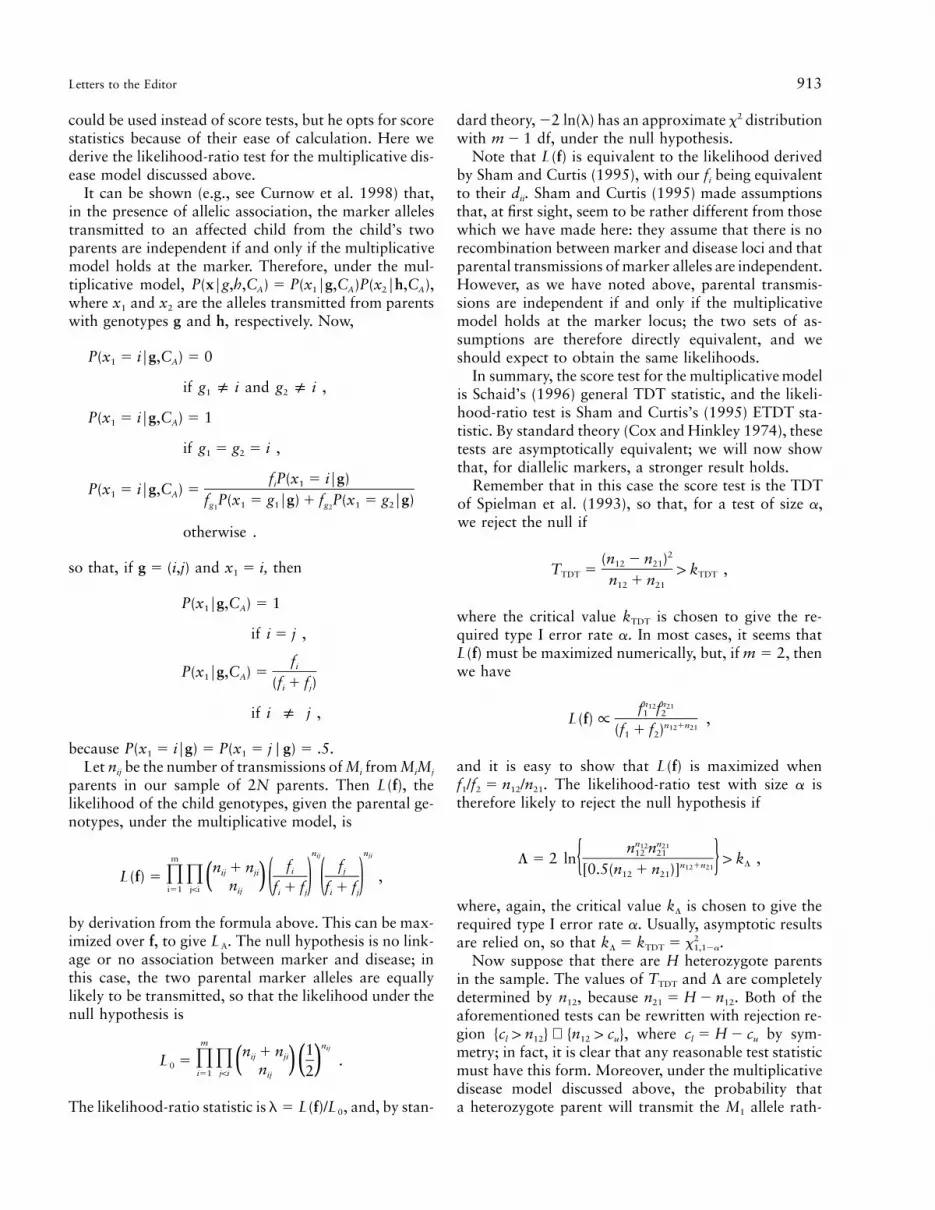
could be used instead of score tests, but he opts for scorestatistics because of their ease of calculation. Here wederive the likelihood-ratio test for the multiplicative dis-ease model discussed above.
It can be shown (e.g., see Curnow et al. 1998) that,in the presence of allelic association, the marker allelestransmitted to an affected child from the child’s twoparents are independent if and only if the multiplicativemodel holds at the marker. Therefore, under the mul-tiplicative model, ,P(xFg,h,C ) 5 P(x Fg,C )P(x Fh,C )A 1 A 2 A
where x1 and x2 are the alleles transmitted from parentswith genotypes g and h, respectively. Now,
P(x 5 iFg,C ) 5 01 A
if g ( i and g ( i ,1 2
P(x 5 iFg,C ) 5 11 A
if g 5 g 5 i ,1 2
f P(x 5 iFg)i 1P(x 5 iFg,C ) 51 A f P(x 5 g Fg) 1 f P(x 5 g Fg)g 1 1 g 1 21 2
otherwise .
so that, if and , theng 5 (i,j) x 5 i1
P(x Fg,C ) 5 11 A
if i 5 j ,
fiP(x Fg,C ) 51 A (f 1 f )i j
if i ( j ,
because .P(x 5 iFg) 5 P(x 5 j d g) 5 .51 1
Let nij be the number of transmissions of Mi from MiMj
parents in our sample of 2N parents. Then L(f), thelikelihood of the child genotypes, given the parental ge-notypes, under the multiplicative model, is
n nij jimf fn 1 n i jij jiL(f) 5 PP ,( ) ( ) ( )n!i51 j i f 1 f f 1 fij i j i j
by derivation from the formula above. This can be max-imized over f, to give LA. The null hypothesis is no link-age or no association between marker and disease; inthis case, the two parental marker alleles are equallylikely to be transmitted, so that the likelihood under thenull hypothesis is
m nij1n 1 nij jiL 5 PP .0 ( ) ( )n!i51 j i 2ij
The likelihood-ratio statistic is , and, by stan-l 5 L(f)/L0
dard theory, 22 ln(l) has an approximate x2 distributionwith df, under the null hypothesis.m 2 1
Note that L(f) is equivalent to the likelihood derivedby Sham and Curtis (1995), with our fi being equivalentto their dii. Sham and Curtis (1995) made assumptionsthat, at first sight, seem to be rather different from thosewhich we have made here: they assume that there is norecombination between marker and disease loci and thatparental transmissions of marker alleles are independent.However, as we have noted above, parental transmis-sions are independent if and only if the multiplicativemodel holds at the marker locus; the two sets of as-sumptions are therefore directly equivalent, and weshould expect to obtain the same likelihoods.
In summary, the score test for the multiplicative modelis Schaid’s (1996) general TDT statistic, and the likeli-hood-ratio test is Sham and Curtis’s (1995) ETDT sta-tistic. By standard theory (Cox and Hinkley 1974), thesetests are asymptotically equivalent; we will now showthat, for diallelic markers, a stronger result holds.
Remember that in this case the score test is the TDTof Spielman et al. (1993), so that, for a test of size a,we reject the null if
2(n 2 n )12 21T 5 1 k ,TDT TDTn 1 n12 21
where the critical value kTDT is chosen to give the re-quired type I error rate a. In most cases, it seems thatL(f) must be maximized numerically, but, if , thenm 5 2we have
n n12 21f f1 2L(f) ∝ ,n 1n12 21(f 1 f )1 2
and it is easy to show that L(f) is maximized when. The likelihood-ratio test with size a isf /f 5 n /n1 2 12 21
therefore likely to reject the null hypothesis if
n n12 21n n12 21L 5 2 ln 1 k ,Ln 1n{ }12 21[0.5(n 1 n )]12 21
where, again, the critical value kL is chosen to give therequired type I error rate a. Usually, asymptotic resultsare relied on, so that .2k 5 k 5 xL TDT 1,12a
Now suppose that there are H heterozygote parentsin the sample. The values of TTDT and L are completelydetermined by n12, because . Both of then 5 H 2 n21 12
aforementioned tests can be rewritten with rejection re-gion where by sym-{c 1 n } ∪ {n 1 c }, c 5 H 2 cl 12 12 u l u
metry; in fact, it is clear that any reasonable test statisticmust have this form. Moreover, under the multiplicativedisease model discussed above, the probability thata heterozygote parent will transmit the M1 allele rath-
914 Letters to the Editor
er than the M2 is , so that, condi-n 5 f /(f 1 f )1 1 2
tional on H heterozygote parents in the sample,. The constant cu can be chosen ton ∼ binomial(H,n)12
give the approximate type I error rate, by use of thisbinomial distribution; any cu corresponds to a particularkL and kTDT, and, clearly, for a particular cu, the teststatistics will be exactly equivalent. It follows that, pro-vided that type I error rates are properly controlled byappropriate choice of the critical values kL and kTDT, L
and TTDT will have identical power. However, the ap-propriate critical values will be the same for the twotests only if L and TTDT have the same distribution, forthen we will have for any cu; if not, then settingk 5 kL TDT
will give different rejection2k 5 k 5 xL TDT 1,12a
regions—and, therefore, different sizes and powers—forL and TTDT. We now consider the properties of the teststatistics if the x2 approximation is used.
It is convenient to put so thatg 5 f /f n 5 g/(1 1 g)1 2
and to condition on there being H heterozygote parents,so that the distribution of the tests statistic depends onlyon the two parameters H and n. Note that the null hy-pothesis that the two parental maker alleles are equallylikely to be transmitted corresponds to . We cang 5 1investigate the actual size and power of the test directly,because, for any a, it is easy to calculate the probabilitythat TTDT or L is greater than , via the above bi-2x1,12a
nomial distribution. We consider , .0001,a 5 .01 1 #, and . The first two values of a might be26 2810 5 # 10
appropriate for candidate loci, whereas the last has beensuggested, by Risch and Merikangas (1996), for genomescans using the TDT.
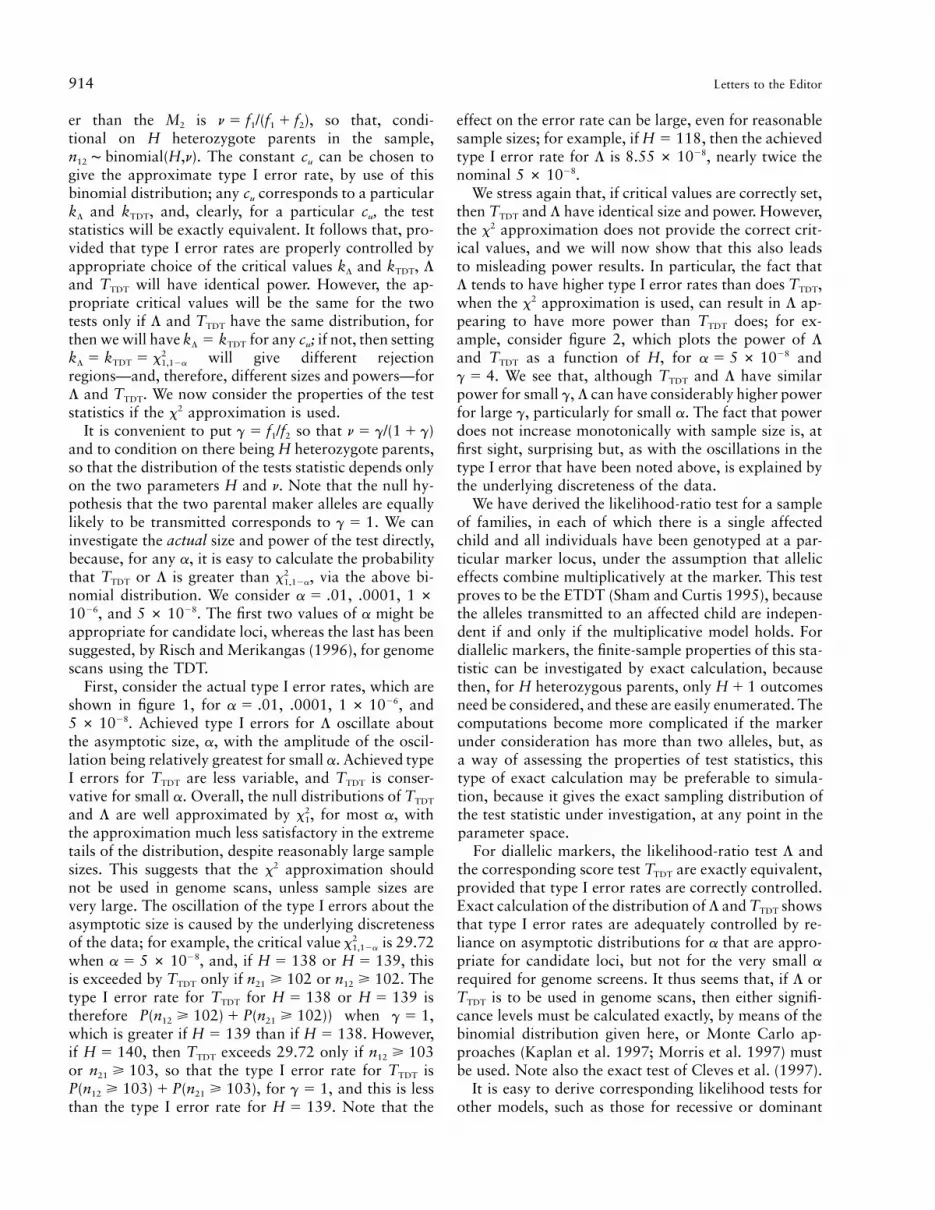
First, consider the actual type I error rates, which areshown in figure 1, for , .0001, , and26a 5 .01 1 # 10
. Achieved type I errors for L oscillate about285 # 10the asymptotic size, a, with the amplitude of the oscil-lation being relatively greatest for small a. Achieved typeI errors for TTDT are less variable, and TTDT is conser-vative for small a. Overall, the null distributions of TTDT
and L are well approximated by , for most a, with2x1
the approximation much less satisfactory in the extremetails of the distribution, despite reasonably large samplesizes. This suggests that the x2 approximation shouldnot be used in genome scans, unless sample sizes arevery large. The oscillation of the type I errors about theasymptotic size is caused by the underlying discretenessof the data; for example, the critical value is 29.722x1,12a
when , and, if or , this28a 5 5 # 10 H 5 138 H 5 139is exceeded by TTDT only if or . Then > 102 n > 10221 12
type I error rate for TTDT for or isH 5 138 H 5 139therefore ) when ,P(n > 102) 1 P(n > 102) g 5 112 21
which is greater if than if . However,H 5 139 H 5 138if , then TTDT exceeds 29.72 only ifH 5 140 n > 10312
or , so that the type I error rate for TTDT isn > 10321
, for , and this is lessP(n > 103) 1 P(n > 103) g 5 112 21
than the type I error rate for . Note that theH 5 139
effect on the error rate can be large, even for reasonablesample sizes; for example, if , then the achievedH 5 118type I error rate for L is , nearly twice the288.55 # 10nominal .285 # 10
We stress again that, if critical values are correctly set,then TTDT and L have identical size and power. However,the x2 approximation does not provide the correct crit-ical values, and we will now show that this also leadsto misleading power results. In particular, the fact thatL tends to have higher type I error rates than does TTDT,when the x2 approximation is used, can result in L ap-pearing to have more power than TTDT does; for ex-ample, consider figure 2, which plots the power of L
and TTDT as a function of H, for and28a 5 5 # 10. We see that, although TTDT and L have similarg 5 4
power for small g, L can have considerably higher powerfor large g, particularly for small a. The fact that powerdoes not increase monotonically with sample size is, atfirst sight, surprising but, as with the oscillations in thetype I error that have been noted above, is explained bythe underlying discreteness of the data.
We have derived the likelihood-ratio test for a sampleof families, in each of which there is a single affectedchild and all individuals have been genotyped at a par-ticular marker locus, under the assumption that alleliceffects combine multiplicatively at the marker. This testproves to be the ETDT (Sham and Curtis 1995), becausethe alleles transmitted to an affected child are indepen-dent if and only if the multiplicative model holds. Fordiallelic markers, the finite-sample properties of this sta-tistic can be investigated by exact calculation, becausethen, for H heterozygous parents, only outcomesH 1 1need be considered, and these are easily enumerated. Thecomputations become more complicated if the markerunder consideration has more than two alleles, but, asa way of assessing the properties of test statistics, thistype of exact calculation may be preferable to simula-tion, because it gives the exact sampling distribution ofthe test statistic under investigation, at any point in theparameter space.
For diallelic markers, the likelihood-ratio test L andthe corresponding score test TTDT are exactly equivalent,provided that type I error rates are correctly controlled.Exact calculation of the distribution of L and TTDT showsthat type I error rates are adequately controlled by re-liance on asymptotic distributions for a that are appro-priate for candidate loci, but not for the very small a
required for genome screens. It thus seems that, if L orTTDT is to be used in genome scans, then either signifi-cance levels must be calculated exactly, by means of thebinomial distribution given here, or Monte Carlo ap-proaches (Kaplan et al. 1997; Morris et al. 1997) mustbe used. Note also the exact test of Cleves et al. (1997).
It is easy to derive corresponding likelihood tests forother models, such as those for recessive or dominant
Letters to the Editor 915
diseases, or for the general model in which no relation-ship is assumed between the fx, and it is also easy toextend the test to cope with multiple affected or unaf-fected sibs (Thompson 1997). The properties of suchtests deserve further study; comparisons with the cor-responding score tests (Schaid 1996) would be of par-ticular interest. By analogy with the results given here,reliance on asymptotic null distributions should beavoided for such tests; also see the work of Chapman(1976). Monte Carlo approaches are always available,and they provide a simple alternative to asymptoticapproximations.
Finally, note that the results given here illustrate theproblems of comparing the test statistics by stochasticsimulation, especially when asymptotic distributional re-sults are relied on. When the x2 approximation is used,the properties of L and TTDT are very sensitive to thevalue of H, and to exhaustively survey the relevant pa-rameter space by simulation would be very time con-suming. On the basis of simulation results produced bythe asymptotic x2 distribution, it would have been easyto conclude, according to the values of a, H, and g
studied, either that L is preferable to TTDT, because ithas higher power for some parameter values, or thatTTDT is preferable to L, because L can be anticonservativefor certain values of H. For example, if 28a 5 5 # 10and , then TTDT is conservative, whereas theH 5 100achieved type I error rate for L is close to the nominalvalue, so we might conclude that L is preferable. How-ever, for and , TTDT is still con-28a 5 5 # 10 H 5 110servative but L is unacceptably anticonservative, and wewould prefer TTDT. As we have seen, we would be mis-taken in both cases, because the differences are due tofailure of the asymptotic x2 approximation, rather thanto differences between the test statistics.
Acknowledgments
We are grateful to Robert Curnow and Andrew Morris forhelpful discussions of this work and to two anonymous ref-erees who made useful comments on this letter.
J. C. WHITTAKER1 AND D. J. THOMPSON2
1Department of Applied Statistics, University ofReading, Reading, United Kingdom; and 1CRCGenetic Epidemiology Unit, University of Cambridge,Cambridge
References
Chapman JW (1976) A comparison of the x2, 22log R andmultinomial probability criteria for significance tests whenexpected frequencies are small. J Am Stat Assoc 71:854–863
Cleves MA, Olson JM, Jacobs KB (1997) Exact transmission-disequilibrium tests with multiallelic markers. Genet Epi-demiol 14:337–347
Cox DR, Hinkley DV (1974) Theoretical statistics. Chapman& Hall, London
Curnow RN, Morris AP, Whittaker JC (1998) Locating genesinvolved in human diseases. Appl Stat 47:63–76
Kaplan NL, Martin ER, Weir BS (1997) Power studies fortransmission/disequilibrium tests with multiple alleles. AmJ Hum Genet 60:691–702
Morris AP, Curnow RN, Whittaker JC (1997) Randomisationtests of disease-marker association. Ann Hum Genet 61:49–60
Risch N, Merikangas K (1996) The future of genetic studiesof complex human diseases. Science 273:1516–1517
Schaid DJ (1996) General score tests for associations of geneticmarkers with disease using cases and their parents. GenetEpidemiol 13:423–449
Self SG, Longton G, Kopecky KJ, Liang KY (1991) On esti-mating HLA-disease association with application to a studyof aplastic anemia. Biometrics 47:53–61
Sham P (1997) Transmission/disequilibrium tests for multial-lelic loci. Am J Hum Genet 61:774–778
Sham PC, Curtis D (1995) An extended transmission/disequi-librium test (TDT) for multiallele marker loci. Ann HumGenet 59:323–336
Spielman RS, Ewens WJ (1996) The TDT and other family-based tests for linkage disequilibrium and association. AmJ Hum Genet 59:983–989
Spielman RS, McGinnis RE, Ewens WJ (1993) Transmissiontest for linkage disequilibrium: the insulin gene region andinsulin-dependent diabetes mellitus (IDDM). Am J Hum Ge-net 52:506–516
Thompson DJ (1997) Using information from unaffected sibsin genetic association studies. MS diss, Department of Ap-plied Statistics, University of Reading, Reading, UK
Address for correspondence and reprints: Dr. John Whittaker, Department ofApplied Statistics, University of Reading, P.O. Box 240, Whiteknights Road,Reading, RG6 2FN, United Kingdom. E-mail: [email protected]
q 1999 by The American Society of Human Genetics. All rights reserved.0002-9297/99/6403-0033$02.00