direct generation of functional dopaminergic neurons from mouse and human fibroblasts
TRANSCRIPT
LETTERdoi:10.1038/nature10284
Direct generation of functional dopaminergicneurons from mouse and human fibroblastsMassimiliano Caiazzo1, Maria Teresa Dell’Anno1*, Elena Dvoretskova2*, Dejan Lazarevic3,4, Stefano Taverna2, Damiana Leo2,Tatyana D. Sotnikova2, Andrea Menegon5, Paola Roncaglia4, Giorgia Colciago1, Giovanni Russo2, Piero Carninci6, Gianni Pezzoli7,Raul R. Gainetdinov2, Stefano Gustincich4,8, Alexander Dityatev2 & Vania Broccoli1
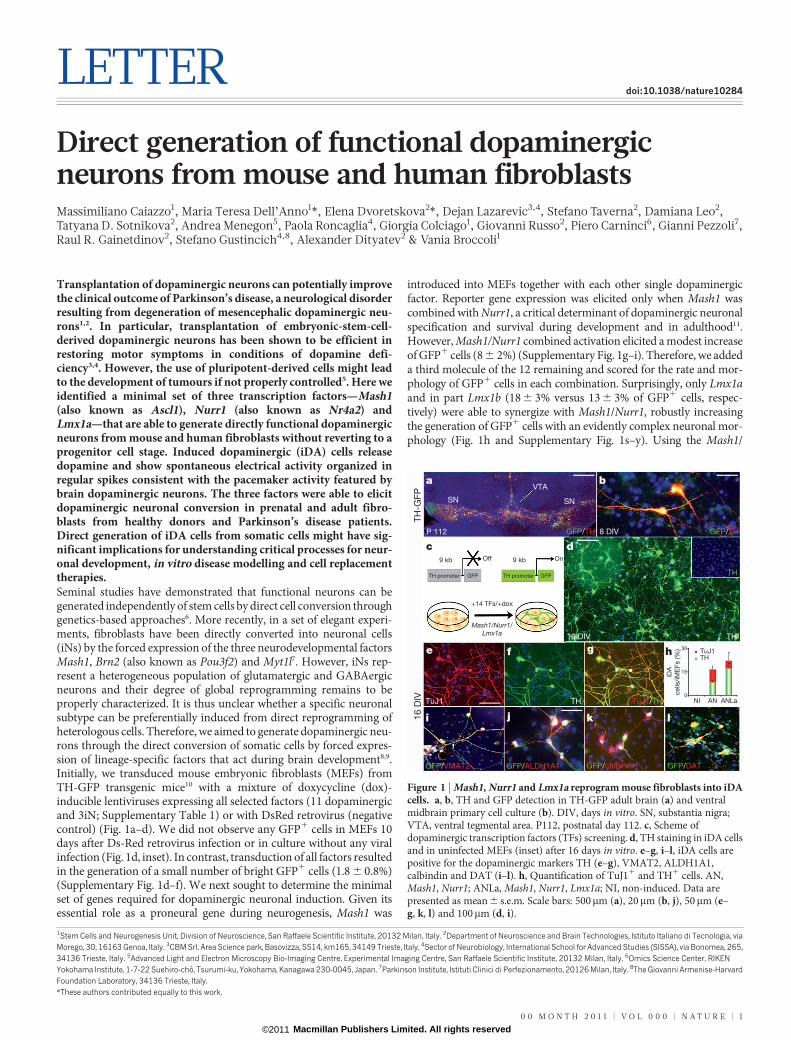
Transplantation of dopaminergic neurons can potentially improvethe clinical outcome of Parkinson’s disease, a neurological disorderresulting from degeneration of mesencephalic dopaminergic neu-rons1,2. In particular, transplantation of embryonic-stem-cell-derived dopaminergic neurons has been shown to be efficient inrestoring motor symptoms in conditions of dopamine defi-ciency3,4. However, the use of pluripotent-derived cells might leadto the development of tumours if not properly controlled5. Here weidentified a minimal set of three transcription factors—Mash1(also known as Ascl1), Nurr1 (also known as Nr4a2) andLmx1a—that are able to generate directly functional dopaminergicneurons from mouse and human fibroblasts without reverting to aprogenitor cell stage. Induced dopaminergic (iDA) cells releasedopamine and show spontaneous electrical activity organized inregular spikes consistent with the pacemaker activity featured bybrain dopaminergic neurons. The three factors were able to elicitdopaminergic neuronal conversion in prenatal and adult fibro-blasts from healthy donors and Parkinson’s disease patients.Direct generation of iDA cells from somatic cells might have sig-nificant implications for understanding critical processes for neur-onal development, in vitro disease modelling and cell replacementtherapies.Seminal studies have demonstrated that functional neurons can begenerated independently of stem cells by direct cell conversion throughgenetics-based approaches6. More recently, in a set of elegant experi-ments, fibroblasts have been directly converted into neuronal cells(iNs) by the forced expression of the three neurodevelopmental factorsMash1, Brn2 (also known as Pou3f2) and Myt1l7. However, iNs rep-resent a heterogeneous population of glutamatergic and GABAergicneurons and their degree of global reprogramming remains to beproperly characterized. It is thus unclear whether a specific neuronalsubtype can be preferentially induced from direct reprogramming ofheterologous cells. Therefore, we aimed to generate dopaminergic neu-rons through the direct conversion of somatic cells by forced expres-sion of lineage-specific factors that act during brain development8,9.Initially, we transduced mouse embryonic fibroblasts (MEFs) fromTH-GFP transgenic mice10 with a mixture of doxycycline (dox)-inducible lentiviruses expressing all selected factors (11 dopaminergicand 3iN; Supplementary Table 1) or with DsRed retrovirus (negativecontrol) (Fig. 1a–d). We did not observe any GFP1 cells in MEFs 10days after Ds-Red retrovirus infection or in culture without any viralinfection (Fig. 1d, inset). In contrast, transduction of all factors resultedin the generation of a small number of bright GFP1 cells (1.8 6 0.8%)(Supplementary Fig. 1d–f). We next sought to determine the minimalset of genes required for dopaminergic neuronal induction. Given itsessential role as a proneural gene during neurogenesis, Mash1 was
introduced into MEFs together with each other single dopaminergicfactor. Reporter gene expression was elicited only when Mash1 wascombined with Nurr1, a critical determinant of dopaminergic neuronalspecification and survival during development and in adulthood11.However, Mash1/Nurr1 combined activation elicited a modest increaseof GFP1 cells (8 6 2%) (Supplementary Fig. 1g–i). Therefore, we addeda third molecule of the 12 remaining and scored for the rate and mor-phology of GFP1 cells in each combination. Surprisingly, only Lmx1aand in part Lmx1b (18 6 3% versus 13 6 3% of GFP1 cells, respec-tively) were able to synergize with Mash1/Nurr1, robustly increasingthe generation of GFP1 cells with an evidently complex neuronal mor-phology (Fig. 1h and Supplementary Fig. 1s–y). Using the Mash1/
*These authors contributed equally to this work.
1Stem Cells and Neurogenesis Unit, Division of Neuroscience, San Raffaele Scientific Institute, 20132 Milan, Italy. 2Department of Neuroscience and Brain Technologies, Istituto Italiano di Tecnologia, viaMorego, 30, 16163 Genoa, Italy. 3CBM Srl. Area Science park, Basovizza, SS14, km165, 34149 Trieste, Italy. 4Sector of Neurobiology, International School for Advanced Studies (SISSA), via Bonomea, 265,34136 Trieste, Italy. 5Advanced Light and Electron Microscopy Bio-Imaging Centre, Experimental Imaging Centre, San Raffaele Scientific Institute, 20132 Milan, Italy. 6Omics Science Center, RIKENYokohama Institute, 1-7-22 Suehiro-cho, Tsurumi-ku, Yokohama, Kanagawa 230-0045, Japan. 7Parkinson Institute, Istituti Clinici di Perfezionamento, 20126 Milan, Italy. 8The Giovanni Armenise-HarvardFoundation Laboratory, 34136 Trieste, Italy.
0
15
30 TuJ1
9 kb 9 kb
TH promoter GFP GFPTH promoter
Off
+14 TFs/+dox
Mash1/Nurr1/
Lmx1a
On
TH
NI AN ANLa
iDA
cells
/iM
EF
s (%
)
TuJ1/TH
16 DIV
a b
f g
dc
e
i j k l
h
VTA
SN SN
P 112 GFP/TH8 DIV
16 D
IV
TH
TH
GFP/TH
TH
-GF
P
GFP/VMAT2 GFP/ALDH1A1 GFP/DATGFP/calbindin
THTuJ1
Figure 1 | Mash1, Nurr1 and Lmx1a reprogram mouse fibroblasts into iDAcells. a, b, TH and GFP detection in TH-GFP adult brain (a) and ventralmidbrain primary cell culture (b). DIV, days in vitro. SN, substantia nigra;VTA, ventral tegmental area. P112, postnatal day 112. c, Scheme ofdopaminergic transcription factors (TFs) screening. d, TH staining in iDA cellsand in uninfected MEFs (inset) after 16 days in vitro. e–g, i–l, iDA cells arepositive for the dopaminergic markers TH (e–g), VMAT2, ALDH1A1,calbindin and DAT (i–l). h, Quantification of TuJ11 and TH1 cells. AN,Mash1, Nurr1; ANLa, Mash1, Nurr1, Lmx1a; NI, non-induced. Data arepresented as mean 6 s.e.m. Scale bars: 500mm (a), 20mm (b, j), 50mm (e–g, k, l) and 100mm (d, i).
0 0 M O N T H 2 0 1 1 | V O L 0 0 0 | N A T U R E | 1
Macmillan Publishers Limited. All rights reserved©2011
Nurr1/Lmx1a factor combination, double GFP1/TH1 cells representedthe majority of the induced TuJ1 neuronal cells (85 6 4%). Supplemen-tation of a fourth factor among the remaining ones failed to produce anyfurther increase in GFP1 cells, with Brn2 and Myt1l, the other two iNfactors, even reducing the overall reprogramming efficiency (data notshown). For these reasons we focused on cells reprogrammed exclu-sively with the Mash1/Nurr1/Lmx1a factor combination. The samegene cocktail was also proficient in reprogramming adult mouse fibro-blasts with high efficiency (Supplementary Fig. 2).
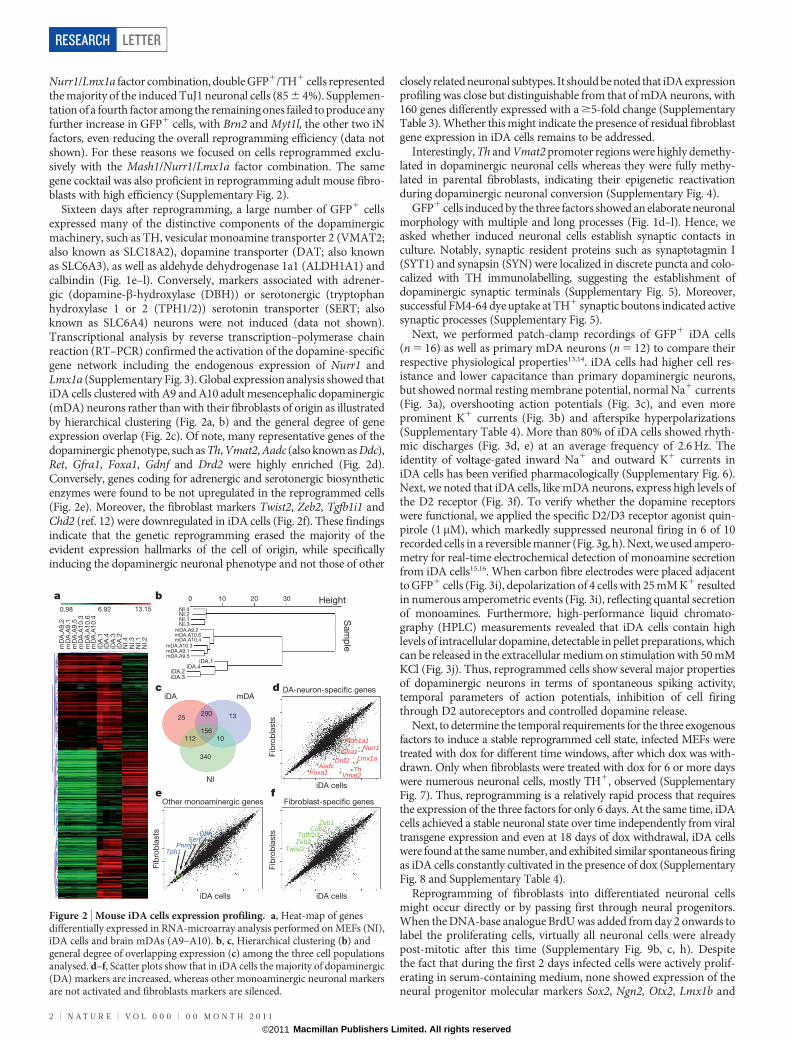
Sixteen days after reprogramming, a large number of GFP1 cellsexpressed many of the distinctive components of the dopaminergicmachinery, such as TH, vesicular monoamine transporter 2 (VMAT2;also known as SLC18A2), dopamine transporter (DAT; also knownas SLC6A3), as well as aldehyde dehydrogenase 1a1 (ALDH1A1) andcalbindin (Fig. 1e–l). Conversely, markers associated with adrener-gic (dopamine-b-hydroxylase (DBH)) or serotonergic (tryptophanhydroxylase 1 or 2 (TPH1/2)) serotonin transporter (SERT; alsoknown as SLC6A4) neurons were not induced (data not shown).Transcriptional analysis by reverse transcription–polymerase chainreaction (RT–PCR) confirmed the activation of the dopamine-specificgene network including the endogenous expression of Nurr1 andLmx1a (Supplementary Fig. 3). Global expression analysis showed thatiDA cells clustered with A9 and A10 adult mesencephalic dopaminergic(mDA) neurons rather than with their fibroblasts of origin as illustratedby hierarchical clustering (Fig. 2a, b) and the general degree of geneexpression overlap (Fig. 2c). Of note, many representative genes of thedopaminergic phenotype, such as Th, Vmat2, Aadc (also known as Ddc),Ret, Gfra1, Foxa1, Gdnf and Drd2 were highly enriched (Fig. 2d).Conversely, genes coding for adrenergic and serotonergic biosyntheticenzymes were found to be not upregulated in the reprogrammed cells(Fig. 2e). Moreover, the fibroblast markers Twist2, Zeb2, Tgfb1i1 andChd2 (ref. 12) were downregulated in iDA cells (Fig. 2f). These findingsindicate that the genetic reprogramming erased the majority of theevident expression hallmarks of the cell of origin, while specificallyinducing the dopaminergic neuronal phenotype and not those of other
closely related neuronal subtypes. It should be noted that iDA expressionprofiling was close but distinguishable from that of mDA neurons, with160 genes differently expressed with a $5-fold change (SupplementaryTable 3). Whether this might indicate the presence of residual fibroblastgene expression in iDA cells remains to be addressed.
Interestingly, Th and Vmat2 promoter regions were highly demethy-lated in dopaminergic neuronal cells whereas they were fully methy-lated in parental fibroblasts, indicating their epigenetic reactivationduring dopaminergic neuronal conversion (Supplementary Fig. 4).
GFP1 cells induced by the three factors showed an elaborate neuronalmorphology with multiple and long processes (Fig. 1d–l). Hence, weasked whether induced neuronal cells establish synaptic contacts inculture. Notably, synaptic resident proteins such as synaptotagmin I(SYT1) and synapsin (SYN) were localized in discrete puncta and colo-calized with TH immunolabelling, suggesting the establishment ofdopaminergic synaptic terminals (Supplementary Fig. 5). Moreover,successful FM4-64 dye uptake at TH1 synaptic boutons indicated activesynaptic processes (Supplementary Fig. 5).
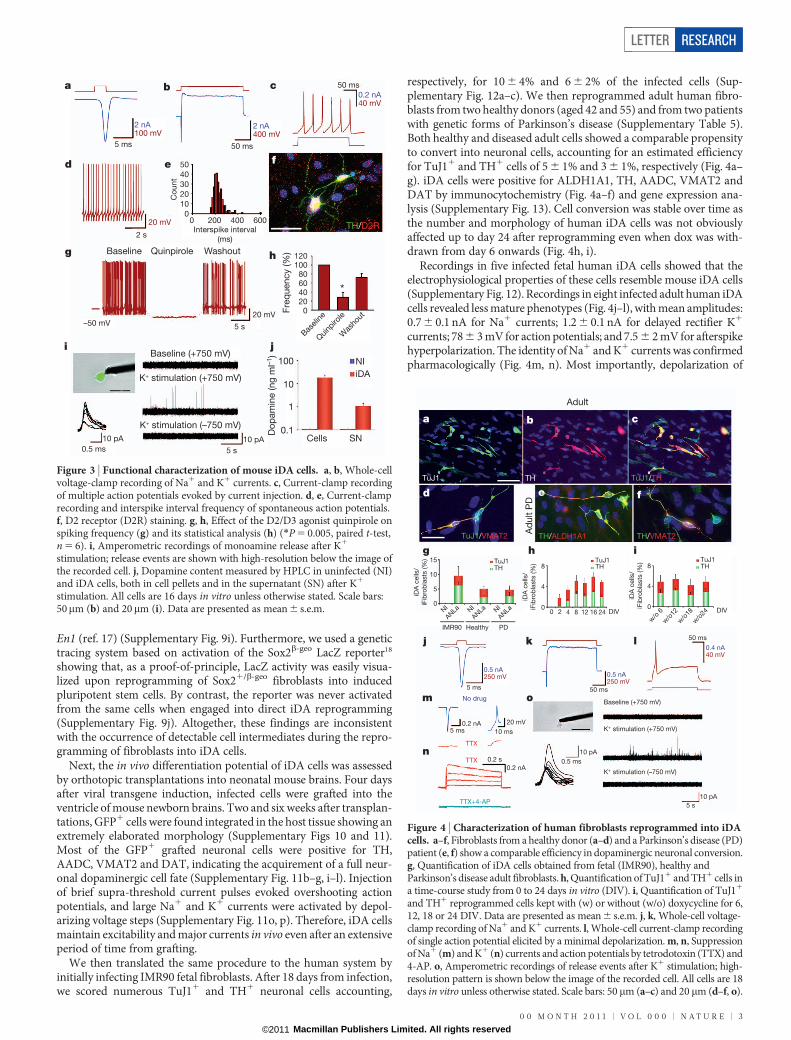
Next, we performed patch-clamp recordings of GFP1 iDA cells(n 5 16) as well as primary mDA neurons (n 5 12) to compare theirrespective physiological properties13,14. iDA cells had higher cell res-istance and lower capacitance than primary dopaminergic neurons,but showed normal resting membrane potential, normal Na1 currents(Fig. 3a), overshooting action potentials (Fig. 3c), and even moreprominent K1 currents (Fig. 3b) and afterspike hyperpolarizations(Supplementary Table 4). More than 80% of iDA cells showed rhyth-mic discharges (Fig. 3d, e) at an average frequency of 2.6 Hz. Theidentity of voltage-gated inward Na1 and outward K1 currents iniDA cells has been verified pharmacologically (Supplementary Fig. 6).Next, we noted that iDA cells, like mDA neurons, express high levels ofthe D2 receptor (Fig. 3f). To verify whether the dopamine receptorswere functional, we applied the specific D2/D3 receptor agonist quin-pirole (1mM), which markedly suppressed neuronal firing in 6 of 10recorded cells in a reversible manner (Fig. 3g, h). Next, we used ampero-metry for real-time electrochemical detection of monoamine secretionfrom iDA cells15,16. When carbon fibre electrodes were placed adjacentto GFP1 cells (Fig. 3i), depolarization of 4 cells with 25 mM K1 resultedin numerous amperometric events (Fig. 3i), reflecting quantal secretionof monoamines. Furthermore, high-performance liquid chromato-graphy (HPLC) measurements revealed that iDA cells contain highlevels of intracellular dopamine, detectable in pellet preparations, whichcan be released in the extracellular medium on stimulation with 50 mMKCl (Fig. 3j). Thus, reprogrammed cells show several major propertiesof dopaminergic neurons in terms of spontaneous spiking activity,temporal parameters of action potentials, inhibition of cell firingthrough D2 autoreceptors and controlled dopamine release.
Next, to determine the temporal requirements for the three exogenousfactors to induce a stable reprogrammed cell state, infected MEFs weretreated with dox for different time windows, after which dox was with-drawn. Only when fibroblasts were treated with dox for 6 or more dayswere numerous neuronal cells, mostly TH1, observed (SupplementaryFig. 7). Thus, reprogramming is a relatively rapid process that requiresthe expression of the three factors for only 6 days. At the same time, iDAcells achieved a stable neuronal state over time independently from viraltransgene expression and even at 18 days of dox withdrawal, iDA cellswere found at the same number, and exhibited similar spontaneous firingas iDA cells constantly cultivated in the presence of dox (SupplementaryFig. 8 and Supplementary Table 4).
Reprogramming of fibroblasts into differentiated neuronal cellsmight occur directly or by passing first through neural progenitors.When the DNA-base analogue BrdU was added from day 2 onwards tolabel the proliferating cells, virtually all neuronal cells were alreadypost-mitotic after this time (Supplementary Fig. 9b, c, h). Despitethe fact that during the first 2 days infected cells were actively prolif-erating in serum-containing medium, none showed expression of theneural progenitor molecular markers Sox2, Ngn2, Otx2, Lmx1b and
Twist2Zeb2Tgfb1i1
Cdh2Zeb1
Pnmt
Nurr1
Lmx1a
ThVmat2
Gfra1
Tph1
SertDbh
Aldh1a1
AadcFoxa1
Drd2
a b
c d
e
mD
A.A
9.1
mD
A.A
9.5
mD
A.A
10.4
mD
A.A
10.3
mD
A.A
10.6
mD
A.A
9.2
iDA
.1
iDA
.2
NI.1
NI.2
NI.3
NI.4
iDA
.3iD
A.4
0.98 13.15
0 10 20 30
6.92
DA-neuron-specific genes
Other monoaminergic genes Fibroblast-specific genes
Fib
rob
lasts
Fib
rob
lasts
Fib
rob
lasts
iDA cells
iDA cells
iDA cells
f
mDA.A9.2
mDA.A10.3
iDA.1iDA.4
iDA.2iDA.3
iDA mDA
NI
25 13
112 10
290
156
340
mDA.A9.5mDA.A9.1
mDA.A10.6mDA.A10.4
Sam
ple
HeightNI.4NI.2NI.1NI.3
Figure 2 | Mouse iDA cells expression profiling. a, Heat-map of genesdifferentially expressed in RNA-microarray analysis performed on MEFs (NI),iDA cells and brain mDAs (A9–A10). b, c, Hierarchical clustering (b) andgeneral degree of overlapping expression (c) among the three cell populationsanalysed. d–f, Scatter plots show that in iDA cells the majority of dopaminergic(DA) markers are increased, whereas other monoaminergic neuronal markersare not activated and fibroblasts markers are silenced.
RESEARCH LETTER
2 | N A T U R E | V O L 0 0 0 | 0 0 M O N T H 2 0 1 1
Macmillan Publishers Limited. All rights reserved©2011
En1 (ref. 17) (Supplementary Fig. 9i). Furthermore, we used a genetictracing system based on activation of the Sox2b-geo LacZ reporter18
showing that, as a proof-of-principle, LacZ activity was easily visua-lized upon reprogramming of Sox21/b-geo fibroblasts into inducedpluripotent stem cells. By contrast, the reporter was never activatedfrom the same cells when engaged into direct iDA reprogramming(Supplementary Fig. 9j). Altogether, these findings are inconsistentwith the occurrence of detectable cell intermediates during the repro-gramming of fibroblasts into iDA cells.
Next, the in vivo differentiation potential of iDA cells was assessedby orthotopic transplantations into neonatal mouse brains. Four daysafter viral transgene induction, infected cells were grafted into theventricle of mouse newborn brains. Two and six weeks after transplan-tations, GFP1 cells were found integrated in the host tissue showing anextremely elaborated morphology (Supplementary Figs 10 and 11).Most of the GFP1 grafted neuronal cells were positive for TH,AADC, VMAT2 and DAT, indicating the acquirement of a full neur-onal dopaminergic cell fate (Supplementary Fig. 11b–g, i–l). Injectionof brief supra-threshold current pulses evoked overshooting actionpotentials, and large Na1 and K1 currents were activated by depol-arizing voltage steps (Supplementary Fig. 11o, p). Therefore, iDA cellsmaintain excitability and major currents in vivo even after an extensiveperiod of time from grafting.
We then translated the same procedure to the human system byinitially infecting IMR90 fetal fibroblasts. After 18 days from infection,we scored numerous TuJ11 and TH1 neuronal cells accounting,
respectively, for 10 6 4% and 6 6 2% of the infected cells (Sup-plementary Fig. 12a–c). We then reprogrammed adult human fibro-blasts from two healthy donors (aged 42 and 55) and from two patientswith genetic forms of Parkinson’s disease (Supplementary Table 5).Both healthy and diseased adult cells showed a comparable propensityto convert into neuronal cells, accounting for an estimated efficiencyfor TuJ11 and TH1 cells of 5 6 1% and 3 6 1%, respectively (Fig. 4a–g). iDA cells were positive for ALDH1A1, TH, AADC, VMAT2 andDAT by immunocytochemistry (Fig. 4a–f) and gene expression ana-lysis (Supplementary Fig. 13). Cell conversion was stable over time asthe number and morphology of human iDA cells was not obviouslyaffected up to day 24 after reprogramming even when dox was with-drawn from day 6 onwards (Fig. 4h, i).
Recordings in five infected fetal human iDA cells showed that theelectrophysiological properties of these cells resemble mouse iDA cells(Supplementary Fig. 12). Recordings in eight infected adult human iDAcells revealed less mature phenotypes (Fig. 4j–l), with mean amplitudes:0.7 6 0.1 nA for Na1 currents; 1.2 6 0.1 nA for delayed rectifier K1
currents; 78 6 3 mV for action potentials; and 7.5 6 2 mV for afterspikehyperpolarization. The identity of Na1 and K1 currents was confirmedpharmacologically (Fig. 4m, n). Most importantly, depolarization of
TuJ1TH
0
5
10
15
Ad
ult P
D
IMR90 Healthy PD
5 ms
5 ms0.2 nA
50 ms
50 ms
Baseline (+750 mV)
K+ stimulation (+750 mV)
K+ stimulation (–750 mV)
0.5 nA
No drug
250 mV 0.5 nA250 mV
20 mV
10 pA
10 pA
0.2 nA
5 s
0.2 s
TTX
TTX
TTX+4-AP
0.5 ms
10 ms
0.4 nA40 mV
NI
ANLa N
I
ANLa N
I
ANLa
4 4
w/o
6
w/o
12
w/o
18
w/o
24
Adult
TH/ALDH1A1TuJ1/VMAT2
TuJ1/THTHTuJ1
TH/VMAT2
iDA
cells
/
iFib
rob
lasts
(%
)
iDA
cells
/
iFib
rob
lasts
(%
)
iDA
cells
/
iFib
rob
lasts
(%
)
0 2 4 8 12 16 24 DIV0 0
DIV
a
d
g
k
i
e f
h
b c
8 8
j l
m
n
o
TuJ1 TuJ1TH TH
Figure 4 | Characterization of human fibroblasts reprogrammed into iDAcells. a–f, Fibroblasts from a healthy donor (a–d) and a Parkinson’s disease (PD)patient (e, f) show a comparable efficiency in dopaminergic neuronal conversion.g, Quantification of iDA cells obtained from fetal (IMR90), healthy andParkinson’s disease adult fibroblasts. h, Quantification of TuJ11 and TH1 cells ina time-course study from 0 to 24 days in vitro (DIV). i, Quantification of TuJ11
and TH1 reprogrammed cells kept with (w) or without (w/o) doxycycline for 6,12, 18 or 24 DIV. Data are presented as mean 6 s.e.m. j, k, Whole-cell voltage-clamp recording of Na1 and K1 currents. l, Whole-cell current-clamp recordingof single action potential elicited by a minimal depolarization. m, n, Suppressionof Na1 (m) and K1 (n) currents and action potentials by tetrodotoxin (TTX) and4-AP. o, Amperometric recordings of release events after K1 stimulation; high-resolution pattern is shown below the image of the recorded cell. All cells are 18days in vitro unless otherwise stated. Scale bars: 50 mm (a–c) and 20 mm (d–f, o).
2 nA100 mV
20 mV
2 nA400 mV
0.2 nA40 mV
Co
unt
Interspike interval
(ms)
5 ms
Baseline
–50 mV 5 s
10 pA 10 pA Cells SN
NI
iDA
0.5 ms 5 s
100
10
0.1
1
120
*
Bas
eline
Quinp
irole
Was
hout
Fre
quency (%
)
Baseline (+750 mV)
K+ stimulation (+750 mV)
K+ stimulation (–750 mV)
100806040200
20 mV
Quinpirole Washout
2 s
50 ms
50
0 200 400 600
40
30
20
10
0
50 ms
Do
pam
ine (ng
ml–
1)
a b c
d e f
TH/D2R
g h
ji
Figure 3 | Functional characterization of mouse iDA cells. a, b, Whole-cellvoltage-clamp recording of Na1 and K1 currents. c, Current-clamp recordingof multiple action potentials evoked by current injection. d, e, Current-clamprecording and interspike interval frequency of spontaneous action potentials.f, D2 receptor (D2R) staining. g, h, Effect of the D2/D3 agonist quinpirole onspiking frequency (g) and its statistical analysis (h) (*P 5 0.005, paired t-test,n 5 6). i, Amperometric recordings of monoamine release after K1
stimulation; release events are shown with high-resolution below the image ofthe recorded cell. j, Dopamine content measured by HPLC in uninfected (NI)and iDA cells, both in cell pellets and in the supernatant (SN) after K1
stimulation. All cells are 16 days in vitro unless otherwise stated. Scale bars:50mm (b) and 20mm (i). Data are presented as mean 6 s.e.m.
LETTER RESEARCH
0 0 M O N T H 2 0 1 1 | V O L 0 0 0 | N A T U R E | 3
Macmillan Publishers Limited. All rights reserved©2011
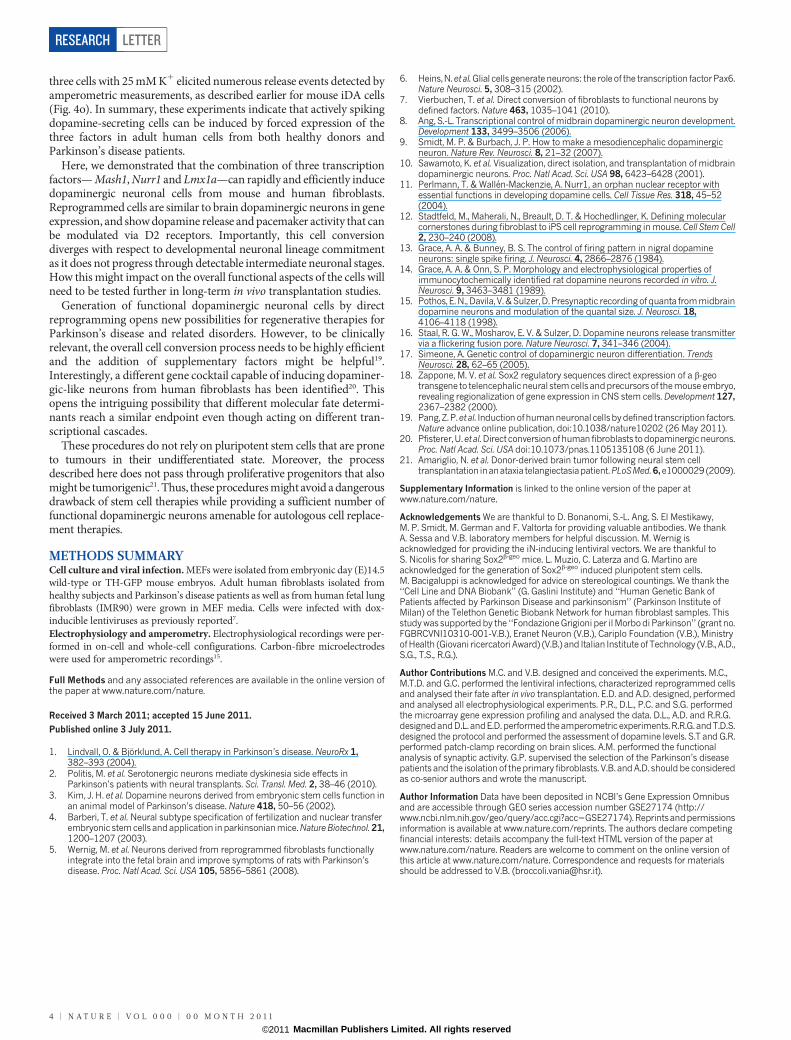
three cells with 25 mM K1 elicited numerous release events detected byamperometric measurements, as described earlier for mouse iDA cells(Fig. 4o). In summary, these experiments indicate that actively spikingdopamine-secreting cells can be induced by forced expression of thethree factors in adult human cells from both healthy donors andParkinson’s disease patients.
Here, we demonstrated that the combination of three transcriptionfactors— Mash1, Nurr1 and Lmx1a—can rapidly and efficiently inducedopaminergic neuronal cells from mouse and human fibroblasts.Reprogrammed cells are similar to brain dopaminergic neurons in geneexpression, and show dopamine release and pacemaker activity that canbe modulated via D2 receptors. Importantly, this cell conversiondiverges with respect to developmental neuronal lineage commitmentas it does not progress through detectable intermediate neuronal stages.How this might impact on the overall functional aspects of the cells willneed to be tested further in long-term in vivo transplantation studies.
Generation of functional dopaminergic neuronal cells by directreprogramming opens new possibilities for regenerative therapies forParkinson’s disease and related disorders. However, to be clinicallyrelevant, the overall cell conversion process needs to be highly efficientand the addition of supplementary factors might be helpful19.Interestingly, a different gene cocktail capable of inducing dopaminer-gic-like neurons from human fibroblasts has been identified20. Thisopens the intriguing possibility that different molecular fate determi-nants reach a similar endpoint even though acting on different tran-scriptional cascades.
These procedures do not rely on pluripotent stem cells that are proneto tumours in their undifferentiated state. Moreover, the processdescribed here does not pass through proliferative progenitors that alsomight be tumorigenic21. Thus, these procedures might avoid a dangerousdrawback of stem cell therapies while providing a sufficient number offunctional dopaminergic neurons amenable for autologous cell replace-ment therapies.
METHODS SUMMARYCell culture and viral infection. MEFs were isolated from embryonic day (E)14.5wild-type or TH-GFP mouse embryos. Adult human fibroblasts isolated fromhealthy subjects and Parkinson’s disease patients as well as from human fetal lungfibroblasts (IMR90) were grown in MEF media. Cells were infected with dox-inducible lentiviruses as previously reported7.Electrophysiology and amperometry. Electrophysiological recordings were per-formed in on-cell and whole-cell configurations. Carbon-fibre microelectrodeswere used for amperometric recordings15.
Full Methods and any associated references are available in the online version ofthe paper at www.nature.com/nature.
Received 3 March 2011; accepted 15 June 2011.
Published online 3 July 2011.
1. Lindvall, O. & Bjorklund, A. Cell therapy in Parkinson’s disease. NeuroRx 1,382–393 (2004).
2. Politis, M. et al. Serotonergic neurons mediate dyskinesia side effects inParkinson’s patients with neural transplants. Sci. Transl. Med. 2, 38–46 (2010).
3. Kim, J. H. et al. Dopamine neurons derived from embryonic stem cells function inan animal model of Parkinson’s disease. Nature 418, 50–56 (2002).
4. Barberi, T. et al. Neural subtype specification of fertilization and nuclear transferembryonic stem cells and application in parkinsonian mice. Nature Biotechnol. 21,1200–1207 (2003).
5. Wernig, M. et al. Neurons derived from reprogrammed fibroblasts functionallyintegrate into the fetal brain and improve symptoms of rats with Parkinson’sdisease. Proc. Natl Acad. Sci. USA 105, 5856–5861 (2008).
6. Heins,N.et al. Glial cellsgenerate neurons: the role of the transcription factorPax6.Nature Neurosci. 5, 308–315 (2002).
7. Vierbuchen, T. et al. Direct conversion of fibroblasts to functional neurons bydefined factors. Nature 463, 1035–1041 (2010).
8. Ang, S.-L. Transcriptional control of midbrain dopaminergic neuron development.Development 133, 3499–3506 (2006).
9. Smidt, M. P. & Burbach, J. P. How to make a mesodiencephalic dopaminergicneuron. Nature Rev. Neurosci. 8, 21–32 (2007).
10. Sawamoto, K. et al. Visualization, direct isolation, and transplantation of midbraindopaminergic neurons. Proc. Natl Acad. Sci. USA 98, 6423–6428 (2001).
11. Perlmann, T. & Wallen-Mackenzie, A. Nurr1, an orphan nuclear receptor withessential functions in developing dopamine cells. Cell Tissue Res. 318, 45–52(2004).
12. Stadtfeld, M., Maherali, N., Breault, D. T. & Hochedlinger, K. Defining molecularcornerstones during fibroblast to iPS cell reprogramming in mouse. Cell Stem Cell2, 230–240 (2008).
13. Grace, A. A. & Bunney, B. S. The control of firing pattern in nigral dopamineneurons: single spike firing. J. Neurosci. 4, 2866–2876 (1984).
14. Grace, A. A. & Onn, S. P. Morphology and electrophysiological properties ofimmunocytochemically identified rat dopamine neurons recorded in vitro. J.Neurosci. 9, 3463–3481 (1989).
15. Pothos, E. N., Davila, V. & Sulzer, D. Presynaptic recording of quanta from midbraindopamine neurons and modulation of the quantal size. J. Neurosci. 18,4106–4118 (1998).
16. Staal, R. G. W., Mosharov, E. V. & Sulzer, D. Dopamine neurons release transmittervia a flickering fusion pore. Nature Neurosci. 7, 341–346 (2004).
17. Simeone, A. Genetic control of dopaminergic neuron differentiation. TrendsNeurosci. 28, 62–65 (2005).
18. Zappone, M. V. et al. Sox2 regulatory sequences direct expression of a b-geotransgene to telencephalic neural stem cells andprecursors of themouse embryo,revealing regionalization of gene expression in CNS stem cells. Development 127,2367–2382 (2000).
19. Pang, Z.P.et al. Induction ofhuman neuronal cellsbydefined transcription factors.Nature advance online publication, doi:10.1038/nature10202 (26 May 2011).
20. Pfisterer, U.et al.Direct conversionofhuman fibroblasts to dopaminergic neurons.Proc. Natl Acad. Sci. USA doi:10.1073/pnas.1105135108 (6 June 2011).
21. Amariglio, N. et al. Donor-derived brain tumor following neural stem celltransplantation inanataxia telangiectasiapatient.PLoSMed.6,e1000029(2009).
Supplementary Information is linked to the online version of the paper atwww.nature.com/nature.
Acknowledgements We are thankful to D. Bonanomi, S.-L. Ang, S. El Mestikawy,M. P. Smidt, M. German and F. Valtorta for providing valuable antibodies. We thankA. Sessa and V.B. laboratory members for helpful discussion. M. Wernig isacknowledged for providing the iN-inducing lentiviral vectors. We are thankful toS. Nicolis for sharing Sox2b-geo mice. L. Muzio, C. Laterza and G. Martino areacknowledged for the generation of Sox2b-geo induced pluripotent stem cells.M. Bacigaluppi is acknowledged for advice on stereological countings. We thank the‘‘Cell Line and DNA Biobank’’ (G. Gaslini Institute) and ‘‘Human Genetic Bank ofPatients affected by Parkinson Disease and parkinsonism’’ (Parkinson Institute ofMilan) of the Telethon Genetic Biobank Network for human fibroblast samples. Thisstudy was supported by the ‘‘Fondazione Grigioni per il Morbo di Parkinson’’ (grant no.FGBRCVNI10310-001-V.B.), Eranet Neuron (V.B.), Cariplo Foundation (V.B.), Ministryof Health (Giovani ricercatori Award) (V.B.) and Italian Institute of Technology (V.B., A.D.,S.G., T.S., R.G.).
Author Contributions M.C. and V.B. designed and conceived the experiments. M.C.,M.T.D. and G.C. performed the lentiviral infections, characterized reprogrammed cellsand analysed their fate after in vivo transplantation. E.D. and A.D. designed, performedand analysed all electrophysiological experiments. P.R., D.L., P.C. and S.G. performedthe microarray gene expression profiling and analysed the data. D.L., A.D. and R.R.G.designedandD.L. andE.D. performed theamperometric experiments.R.R.G. andT.D.S.designed the protocol and performed the assessment of dopamine levels. S.T and G.R.performed patch-clamp recording on brain slices. A.M. performed the functionalanalysis of synaptic activity. G.P. supervised the selection of the Parkinson’s diseasepatients and the isolation of the primary fibroblasts. V.B. and A.D. should be consideredas co-senior authors and wrote the manuscript.
Author Information Data have been deposited in NCBI’s Gene Expression Omnibusand are accessible through GEO series accession number GSE27174 (http://www.ncbi.nlm.nih.gov/geo/query/acc.cgi?acc5GSE27174). Reprintsandpermissionsinformation is available at www.nature.com/reprints. The authors declare competingfinancial interests: details accompany the full-text HTML version of the paper atwww.nature.com/nature. Readers are welcome to comment on the online version ofthis article at www.nature.com/nature. Correspondence and requests for materialsshould be addressed to V.B. ([email protected]).
RESEARCH LETTER
4 | N A T U R E | V O L 0 0 0 | 0 0 M O N T H 2 0 1 1
Macmillan Publishers Limited. All rights reserved©2011
METHODSCell culture. MEFs were isolated from E14.5 wild-type or TH-GFP knock-in miceembryos. Head, vertebral column, dorsal root ganglia and all internal organs wereremoved and discarded and the remaining embryonic tissue was manually dis-sociated and incubated in 0.25% trypsin (Sigma) for 10–15 min. Cells from eachembryo were plated onto a 15-cm tissue culture dish in MEF media (Dulbecco’smodified Eagle medium (DMEM; Invitrogen) containing 10% fetal bovine serum(FBS; Hyclone), non-essential amino acids (Invitrogen), sodium pyruvate andpenicillin/streptomycin (Invitrogen)). In all experiments cells were not split morethan four times. Mouse adult fibroblasts were isolated from tail tip samples. Tailswere peeled, minced into 1 cm pieces, placed on culture dishes, and incubated inMEF media for 5 days. Adult human fibroblasts were isolated from skin biopsysamples of healthy and Parkinson’s disease patients22,23 provided from the ‘‘CellLine and DNA Biobank from Patients affected by Genetic Diseases’’ (G. GasliniInstitute) and ‘‘Parkinson Institute Biobank’’ (Milan, http://www.parkinson.it/dnabank.html) of the Telethon Genetic Biobank Network (http://www.biobanknetwork.org). The informed consent as issued by the ICP Ethical com-mittee was obtained by healthy and Parkinson’s disease patients enrolled for theDNA and cell biobank collection.
Human skin samples were mechanically dissociated and plated on matrigel-coated dishes. Human fibroblasts were cultured as MEFs. Mouse and adult fibro-blasts were grown in MEF media as well as human fetal lung fibroblasts IMR90(ATCC). Mesencephalic dopaminergic primary cell cultures from TH-GFP micewere prepared as previously described24. Mice were maintained at San RaffaeleScientific Institute Institutional mouse facility and experiments were performed inaccordance with experimental protocols approved by local Institutional AnimalCare and Use Committees.Molecular cloning and viral infection. Complementary DNAs for the dopami-nergic transcription factors were cloned into lentiviral vectors under the control ofthe tetracycline operator7. Replication-incompetent, VSVg-coated lentiviral particleswere packaged in 293T cells. MEFs, IMR90 and adult mouse and human fibroblastswere infected in MEF media. 16–20 h after infection cells were switched into freshMEF media containing doxycycline (2 mg ml21; Sigma). After 48 h medium wasreplaced with neuronal inducing media (DMEM/F12 (Invitrogen), 25mg ml21 insu-lin (Sigma), 50mg ml21 transferrin (Sigma), 30 nM sodium selenite, 20 nM proges-terone (Sigma), 100 nM putrescine (Sigma) and penicillin/streptomycin (Sigma))containing doxycycline. The medium was changed every 2–3 days for a further10–22 days. For proliferation assay, MEFs were treated with a 48 h pulse of 10mMBrdU.Immunohistochemistry. For immunocytochemical analysis, 5 3 104 mouse orhuman fibroblasts were plated on matrigel-coated glass coverslips the day beforethe infection. 10–28 days after viral infection cells were fixed for 20 min at roomtemperature (20–25 uC) in 4% paraformaldehyde in PBS, permeabilized for 30 minin PBS containing 0.1% Triton X-100 and 10% normal goat serum (NGS), andincubated overnight at 4 uC in PBS containing 10% NGS and primary antibodies.Then cells were washed three times with PBS and incubated for 2 h at roomtemperature with anti-rabbit or anti-mouse secondary antibodies Alexa Fluor-488 or Alexa Fluor-594 (1:500, Invitrogen). For immunohistochemical analysisP15 or adult mouse brains were fixed overnight at 4 uC with 4% paraformaldehyde,buffered in 30% sucrose and embedded in OCT. Frozen brains were sectioned into15- or 40-mm-thick sections with a cryostat and processed for immunostaining.Sections were boiled for 3 min in 10 mM citrate buffer solution pH 6 for antigenretrieval and permeabilized for 1 h at room temperature in PBS containing 0.1% or0.25% Triton X-100 and 10% NGS. Primary antibodies were as follows: mouseanti-TH (1:200, Millipore), rabbit anti-TH (1:200, Immunological Sciences),mouse anti-bIII-tubulin (1:500, Covance), rabbit anti-bIII-tubulin (TuJ1)(1:500, Covance), rabbit anti-VMAT2 (1:200, Chemicon), rat anti-DAT (1:500,Millipore), rabbit anti-D2 receptor (1:100, Millipore), rabbit anti-calbindin (1:200,Swant), rabbit anti-AADC (1:100, Novus Biologicals), rabbit anti-ALDH1A1(1:200, Abcam), mouse anti-synaptotagmin I (1:200, Synaptic Systems), mouseanti-synapsin (1:200; Synaptic Systems), chicken anti-GFP (1:2,000, MolecularProbes), rat anti-BrdU (1:200, BD), mouse anti-MAP2 (1:500, ImmunologicalSciences), rabbit anti-Otx2 (1:100 R&D). b-Galactosidase staining was performedas previously described25.Statistical analysis. The total numbers of Th1 and Tuj11 cells were quantified12–24 days after infection. Cell counting was performed on ten fields from threereplicates for each condition and normalized with the number of cells platedbefore the infection. Data were expressed as mean 6 s.e.m.RT–PCR. RNA was extracted from single cultures, using Trizol isolation system(Invitrogen) according to manufacturer’s instructions. The yield and integrity ofthe RNA were determined by the spectrophotometric measurement of A260 andby agarose-gel electrophoresis, respectively. Total RNA was treated with DNase I(Qiagen) to prevent DNA contamination. Two micrograms of RNA were reverse
transcribed using the Transcriptor High Fidelity cDNA Synthesis Kit (Roche).One twentieth of the reverse transcribed cDNA was amplified in a 25 microlitres ofreaction mixture containing Taq polymerase buffer (Fisher BioReagents), 0.2 mMdNTPs (Finnzymes OY), 0.4 micromolar of each primer, 1 U Taq polymerase(Fisher BioReagents). The primers used to amplify cDNA samples are listed inSupplementary Table 6.Cell sorting, laser capture dissection and microarray analysis. TH-GFP-positive iDA cells were directly sorted in Trizol (Invitrogen) using the cell sorterFACSVantage s.e. DiVa (Becton Dickinson). Thus RNA was extracted as reportedearlier and biotin-labelled cRNA was obtained using the Ovation kit (NuGEN).Labelled cRNA was hybridized (CBM genexpression facility, SISSA) onAffymetrix Mouse Gene 1.0 ST Arrays, containing 35,557 probe sets correspond-ing to 28,853 genes. Hybridized arrays were stained and washed (GeneChipFluidics Station 450) and scanned (GeneChip Scanner 3000 7G). Cell intensityvalues were computed using the Affymetrix GeneChip Operating Software(GCOS). Further data processing was performed in the R computing environ-ment (http://www.r-project.org/) version 2.8.0 with BioConductor packages(http://www.bioconductor.org/). Robust Multi-Array Average (RMA) normaliza-tion was applied26. Data were then filtered based on probe set intensity, so that onlyprobe sets that had intensity values of .50 in at least half the arrays were retained.Statistical analysis was performed with limma27. P values were adjusted for mul-tiple testing using Benjamini and Hochberg’s method to control the false discoveryrate28. Genes with adjusted P values below 0.01 were considered to be differentiallyexpressed. Furthermore, a fold-change threshold cutoff was set to focus on geneswhose expression level changed at least 2 times. Data were analysed throughDAVID Bioinformatics Resources v6.7 (refs 28, 29).
Gene expression profiles of adult A9 and A10 dopaminergic neurons wereobtained as previously described30. In brief, adult TH-GFP female mice were killedby cervical dislocation. The brains were rapidly cut to isolate the midbrain region,and immediately immerged in 13 zinc fixative (BD Pharmingen) for 4–6 h at14 uC. Once fixed, tissues were moved to 30% sucrose in 13 zinc fixative solutionat 14 uC overnight. Following inclusion in OCT, tissues were frozen in iso-pentan(Sigma) and percooled with liquid nitrogen. 14-mm cryosections were mountedon SuperFrost plus glass slides (Menzel–Glaser) and air dried. mDA A9 and A10neurons (each one from three different mice) were isolated from cryosections byusing a PALM LCM microdissection system (PALM Microlaser Technology). Tofacilitate detection of fluorescent neurons, a drop of 13 zinc fixative was applied tothe section during cell selection. The sections were air dried, neurons were dis-sected and catapulted onto PALM adhesive caps (Zeiss). Total RNA from 2,500pooled neurons was isolated by using the Nano RNA extraction kit (Stratagene)and contaminating genomic DNA was removed through on-column DNase diges-tion step. The common reference RNA was generated from three midbrain regionsof age-matched female mice. Midbrain RNA was isolated using RNeasy Mini kit(Qiagen), followed by DNase treatment. RNA from dissected neurons and allmidbrains was amplified and labelled by Ovation Pico kit, WT exon and Encorebiotin labelling kit (Nugene), following manufacturer’s instructions. Once pre-pared, each target was hybridizated on MoExon 1.0ST GeneChip (Affymetrix).Statistical analysis was performed by oneChannelGUI R package. All hierarchicalclusters were generated by TMEV software.Bisulphite genomic sequencing. DNA from sorted TH-GFP1 reprogrammedMEFs was modified using the CpGenome modification kit (Chemicon) accordingto the manufacturer’s recommendations. Thus Th and Vmat2 promoters CpG-rich selected regions were amplified using the PCR primers listed in Supplemen-tary Table 5.HPLC. To quantify dopamine level in reprogrammed cells, cell pellets were homo-genized in 100ml 0.1 N HClO4 and analysed by using HPLC with electrochemicaldetection (Alexis 100, Antec Leyden). To measure dopamine concentrations in thesupernatants, cells were exposed to media with or without 50 mM KCl for 30 min,then 0.9 ml of supernatants were collected with the addition of 0.1 ml of 1 NHClO4, filtered and analysed by HPLC. Dopamine was separated on a reverse-phase column (ALB-105, 3mm, 50 3 1 mm) with a mobile phase consisting of50 mM phosphate buffer, 8 mM KCl, 500 mg l21 octyl sodium sulphate, 0.1 mMEDTA, and 3% methanol (pH 6.0) at a flow rate of 50ml min21. Dopamine wasdetected by a Decade II electrochemical detector equipped with micro VT-03electrochemical flow cell and a 0.7-mm-diameter glassy carbon electrode (Alexis100, Antec Leyden). The volume of the injection was 5ml. The detection limitestablished as a 3:1 signal-to-noise ratio was below 0.5 nM.Electrophysiology. Recordings were performed from reprogrammed mouse andhuman fibroblasts and primary mDA neurons. The mouse TH-GFP1 cellsselected for the electrophysiological analysis were not so flat as the fibrobalsts,and had several well-developed neurites. The human cells selected for the electro-physiological analysis also had neuron-like shapes with clearly distinguishableneurites by phase contrast microscopy. Only cells without signs of detachment
LETTER RESEARCH
Macmillan Publishers Limited. All rights reserved©2011

from the substrate were used for recordings. Cells were perfused continuously withHEPES-buffered saline (HBS) of the following composition (in mM): 140 NaCl, 5KCl, 2 CaCl2, 2 MgCl2, 15 HEPES, and 25 glucose, pH 7.4. The patch pipettesolution contained (in mM): 130 K-gluconate, 10 KCl, 0.5 CaCl2, 15 HEPES, 5EGTA, 8 NaCl, 2 MgATP, 0.3 Na2GTP, and 10 glucose, pH adjusted to 7.2 withKOH. Action potentials were recorded in the on-cell and the current-clampwhole-cell configurations. A current was injected to have membrane potentialsaround 260 mV, and step currents from 250 pA to 40 pA were injected to elicitaction potentials. Na1 currents and composite K1 currents were recorded in thevoltage-clamp configuration by delivering voltage steps ranging from 2100 mV to120 mV in cells held at 260 mV. Delayed rectifier K1 currents were activated by0.5 s voltage steps from 240 mV to 120 mV after a 0.5-s-long step to 240 mV.A-type K1 currents were isolated by subtraction of delayed rectifier K1 currentsfrom those activated by voltage steps after a 0.5-s-long step to 2100 mV.Recordings were performed using an EPC10 USB patch clamp amplifier andPATCHMASTER software (HEKA Elektronik). Data were digitized at 10 kHzand analysed with FITMASTER Software (HEKA Elektronik). Detection andmeasurements of action potentials were performed using MiniAnalysis software(Synaptosoft).In vivo electrophysiology. Slices were obtained from transplanted mice at postnatalday 42. The brains were quickly removed from the skull in ice-cold artificial cere-brospinal fluid (ACSF) containing the following (in mM): 125 NaCl, 25 NaHCO3,2.5 KCl, 1.25 NaH2PO4, 2 CaCl2, 1 MgCl2, and 25 glucose, pH 7.4 (bubbled with95% O2 and 5% CO2). Coronal slices (300-mm thick) were cut using a vibratome(VT1000S; Leica) and stored in ACSF at 25–28 uC. For recording, slices weretransferred to a recording chamber continuously superfused with ACSF (1–2 mlmin21 at 30–32 uC). Whole-cell recordings were performed in both current- andvoltage-clamp configurations. Recording pipettes (3–5 MVof resistance) containedthe following solution (in mM): 124 KH2PO4, 10 NaCl, 2 MgCl2, 0.5 EGTA, 10HEPES, 2 Na2-ATP, 0.03 Na-GTP (pH 7.2, adjusted with KOH). Signals weresampled at 10 kHz, filtered at 2 kHz, and acquired using a MultiClamp 700Aamplifier and pClamp 10 software (Molecular Devices).Amperometric recording. Amperometry was used to detect the evoked catechol-amine exocytosis from single cells15,31. Carbon-fibre microelectrodes were fabri-cated from 5mm carbon fibres (Goodfellow), inserted in a 1.2 3 0.68 mm glasscapillary (A-M system, Sequim) and pulled with a PE-22 micropipette puller(Narishige). Electrodes were sealed by dipping in Epoxy resin (Epo-Tek 301,Epoxy Technology) and cured at 100 uC for 24 h. They were backfilled with 3 MKCl and trimmed to obtain a basal current between 140 and 180 nA. The electro-des’ responses were tested by cyclic voltammetry and those with unstable cyclicvoltammograms, when tested in a solution of 10mM dopamine, were rejected. Avoltage was applied to the carbon fibre using an EPC10 USB patch-clamp amplifier(HEKA Elektronik). The signal was low-pass filtered at 10 kHz using a 4-poleBessel filter, digitalized at 50 kHz and digitally refiltered at 1–1,000 Hz. The latterresulted in slightly longer responses, but significantly improved the visualization ofsecretion events that was the only aim of these experiments. The electrode waspositioned adjacent to individual cells and lowered to approach the somatoden-dritic domains of iDA cells32, using an Olympus BX51WI microscope with 340water immersion objective. To increase the signal-to-noise ratio, cells were pre-treated with 100mM L-DOPA (Sigma-Aldrich) for 30 min although we were ableto resolve single spike-like release events in two untreated cells. The experimentsconsisted of current recordings at 1750 mV during a brief baseline period, duringwhich cells were perfused with standard external medium containing 5 mM K1. Itwas then exchanged for a stimulation solution (25 mM K1), and amperometricsignals were recorded for a further period of 7 min. Catecholamine secretion wasapparent as discrete spike-like events, each corresponding to vesicular catechola-mine release. Most events were detected during 2 min after 25 mM K1 stimulation,but occasional events were observed also during baseline recordings. No vesicularrelease of dopamine was recorded at the electrode placed adjacent to a cell when theapplied potential was 0 mV or 2750 mV, or at 1750 mV when the electrode wasplaced remotely from cells.FM4-64 assay. FM4-64 dye uptake experiments were performed as previouslyreported33. Briefly, 21 days in vitro TH-GFP1 iDA cells were stimulated for 1 minwith 55 mM KCl, in the presence of FM4-64 (10mM). After FM4-64 loading,neuronal cells were washed and perfused for 10 min with warmed Krebs buffer(37 uC) supplemented with TTX (1mM) and CNQX (10mM). After live fluorescentFM4-64 signals were acquired, cells were fixed and immonostained for TH andSYT1.
Electron microscopy. For ultrastructural immunocytochemistry, 21 days in vitroinfected MEFs were fixed in 2% glutaraldehyde in PBS, washed in PBS, postfixed in2% OsO4 in PBS, and embedded in Epon. Ultrathin sections prepared from thesesamples were analysed with electron microscope (H-7000; Hitachi).Transplantation surgery. After 4 days of infection, TH-GFP MEFs were trypsinizedand resuspended at 2 3 105 cellsml21 in fresh prepared Krebs buffer containing thefollowing (in mM): 126 NaCl, 2.5 KCl, 1.2 NaH2PO4, 1.2 MgCl2, 2.1 CaCl2, 11glucose, 4.2 NaHCO3, 1 HEPES, and 1% vital dye Fast Green. P1 mice pups wereanaesthetized by hypothermia (4 min) and fixed to a support using band-aid. Theskin and the skull overlying the lateral ventricle were opened over about 2 mm usingan ophthalmic scalpel. Subsequently, the mouse was placed in a stereotaxic rig (Kopff)under a Hamilton syringe containing 2ml of cell suspension. The syringe was placedover the incision, positioned at the level of the skull, then lowered into the lumen ofthe right lateral ventricle (LV; 2.5 mm) or in the somatosensory cortex (1.5 mm) andcell solution was injected. Mice were left on a 37 uC heating blanket for severalminutes after surgical manipulation to avoid fatal hypothermia.Stereological analysis. Three mice transplanted with reprogrammed cells wereused for stereological analysis. Three weeks after transplantation mice were anaes-thetized and killed by transcardiac perfusion with PBS followed by 4% para-formaldehyde. Brains were cryoprotected through incubation in an ice-coldsolution of 30% sucrose in PBS and cut in coronal 40-mm-thick cryostat sections.From these sections, one systematic random series of sections was stained for GFP,so that sections were spaced at 7 section intervals (total of 16 sections per mouse).GFP immunoperoxidase staining was performed as described elsewere34. Cellswere quantified using the assistance of the Stereo Investigator v 3.0 software(MicroBrightField) and a personal computer running the software connected toa colour video camera mounted on a Leica microscope35,36. The motorized stage ofthe microscope allowed precise and well-defined movements along the x-, y- andz-axes. Images were first acquired with a CCD-IRIS colour video camera and thecerebral hemispheres were interactively delineated at low magnification on a videoimage of the section. Counting of cells was performed manually on every seventhsection using a 340 lens. To estimate the total number of GFP positive cells thetotal number of neurons counted on the sections was multiplied by seven.
22. Sironi, F. et al. a-Synuclein multiplication analysis in Italian familial Parkinsondisease. Parkinsonism Relat. Disord. 16, 228–231 (2010).
23. Sironi, F. et al. Parkin analysis in early onset Parkinson’s disease. ParkinsonismRelat. Disord. 14, 326–333 (2008).
24. Pruszak, J. et al. Isolation and culture of ventral mesencephalic precursor cells anddopaminergic neurons from rodent brain. Curr. Prot. Stem Cell Biol. Chapter 2,2D.5.1–2D.5.21 (2009).
25. Broccoli, V. et al. The caudal limit of Otx2 expression positions the isthmicorganizer. Nature 401, 164–168 (1999).
26. Irizarry, R. A. et al. Summaries of Affymetrix GeneChip probe level data. NucleicAcids Res. 31, e15 (2003).
27. Smyth,G. K. Linear models andempiricalBayesmethods for assessingdifferentialexpression in microarray experiments. Stat. Appl. Genet. Mol. Biol. 3, Article 3(2004).
28. Hochberg, Y. & Benjamini, Y. More powerful procedures for multiple significancetesting. Stat. Med. 9, 811–818 (1990).
29. Huang, D. W. et al. Bioinformatics enrichment tools: paths toward thecomprehensive functional analysis of large gene lists. Nucleic Acids Res. 37, 1–13(2009).
30. Biagioli, M. et al. Unexpected expression of a- and b-globin in mesencephalicdopaminergic neurons and glial cells. Proc. Natl Acad. USA 106, 15454–15459(2009).
31. Pothos, E., Desmond, D. & Sulzer, D. L-3,4-Dihydroxyphenylalanine increases thequantal size of exocytotic dopamine release in vitro. J. Neurochem. 66, 629–636(1996).
32. Mundroff, M. L. & Wightman, R. M. Amperometry and cyclic voltammetry withcarbon fiber microelectrodes at single cells. Curr. Protoc. Neurosci. Chapter 6,6.14.1–6.14.22 (2002).
33. Menegon, A. et al. Protein kinase A-mediated synapsin I phosphorylation is acentral modulator of Ca21-dependent synaptic activity. J. Neurosci. 26,11670–11681 (2006).
34. Colasante, G. et al. Arx is a direct target of Dlx2 and thereby contributes to thetangential migration of GABAergic interneurons. J. Neurosci. 28, 10674–10686(2008).
35. West, M. J. et al. Unbiased stereological estimation of the total number of neuronsin thesubdivisions of the rat hippocampususing the optical fractionator.Anat. Rec.231, 482–497 (1991).
36. Bacigaluppi, M. et al. Delayed post-ischaemic neuroprotection following systemicneural stem cell transplantation involves multiple mechanisms. Brain 132,2239–2251 (2009).
RESEARCH LETTER
Macmillan Publishers Limited. All rights reserved©2011