mitochondrial alterations by parkin in dopaminergic neurons using park2 patient-specific and park2...
TRANSCRIPT

Stem Cell ReportsArticle
Mitochondrial Alterations by PARKIN in Dopaminergic Neurons UsingPARK2 Patient-Specific and PARK2 Knockout Isogenic iPSC Lines
Atossa Shaltouki,1,4 Renuka Sivapatham,1,4 Ying Pei,1,4 Akos A. Gerencser,1 Olga Mom�cilovi�c,1
Mahendra S. Rao,2 and Xianmin Zeng1,3,*1Buck Institute, Novato, CA 94945, USA2NxCell Science, Novato, CA 94947, USA3XCell Science, Novato, CA 94947, USA4Co-first author
*Correspondence: [email protected]
http://dx.doi.org/10.1016/j.stemcr.2015.02.019
This is an open access article under the CC BY license (http://creativecommons.org/licenses/by/4.0/).
SUMMARY
In this study, we used patient-specific and isogenic PARK2-induced pluripotent stem cells (iPSCs) to show that mutations in PARK2 alter
neuronal proliferation. The percentage of TH+ neurons was decreased in Parkinson’s disease (PD) patient-derived neurons carrying
various mutations in PARK2 compared with an age-matched control subject. This reduction was accompanied by alterations in mito-
chondrial:cell volume fraction (mitochondrial volume fraction). The same phenotype was confirmed in isogenic PARK2 null lines.
The mitochondrial phenotype was also seen in non-midbrain neurons differentiated from the PARK2 null line, as was the functional
phenotype of reduced proliferation in culture. Whole genome expression profiling at various stages of differentiation confirmed the
mitochondrial phenotype and identified pathways altered by PARK2 dysfunction that include PD-related genes. Our results are con-
sistent with current model of PARK2 function where damaged mitochondria are targeted for degradation via a PARK2/PINK1-mediated
mechanism.
INTRODUCTION
PARKIN (PARK2), an E3 ubiquitin ligase, is the most
frequently mutated gene that has casually been linked to
autosomal recessive early onset familial Parkinson’s disease
(PD) (Abbas et al., 1999; Kitada et al., 1998). Abnormalities
of PARK2have also been described in sporadic PD (Dawson,
2006). The exact mechanism by which PARK2 causes PD-
like syndromes andwhy dopaminergic neurons are primar-
ily affected by a ubiquitously expressed mutation remain
unknown (Sulzer, 2007; Tanaka et al., 2004). Several
studies, however, suggest that PARK2 interacts with
PINK1, another genemutated in autosomal recessive famil-
ial form of PD (Geisler et al., 2010) to regulate mitochon-
drial biology, and alters mitochondrial dynamics (Chen
and Chan, 2009; Clark et al., 2006; Lee et al., 2004).
A link between PARK2 and mitochondrial biology was
first established inDrosophila, which displayed impairment
in mitochondrial function and neuronal loss in an age-
dependent manner when rendered deficient for PARK2
(Greene et al., 2003). Likewise, similar mitochondrial
defects exhibited in Park2 knockout (KO) mouse models,
although only mice with conditional KO of Park2 recapitu-
late parkinsonian phenotype and striatonigral degenera-
tion (Dawson et al., 2010; Goldberg et al., 2003). Analysis
of single and doublemutants inmice and flies also suggests
that Pink1 is upstream of Park2 and that overexpression of
PARK2 alone or directing PARK2 to mitochondria is suffi-
cient to introduce mitochondrial fragmentation (Akundi
et al., 2013; Clark et al., 2006; Kim et al., 2008; Shiba-
Fukushima et al., 2012). Thus, both gain or loss of func-
tion can affect mitochondrial dynamics. More recently,
post-mortem brain tissues of PD patients also confirmed
the involvement of altered mitochondrial pathologies in
disease process (Henchcliffe and Beal, 2008; Schapira
et al., 1989; Vila et al., 2008).
The emerging hypothesis is that in normal cells PARK2 is
cytoplasmic and PINK1 levels are low. However, when
mitochondrial potential is lost, PINK1 accumulates on de-
polarized membranes and recruits PARK2 to mitochondria
and are then targeted for degradation via mitophagy. Loss
or damaged mitochondria stimulate mitochondrial fission
and/or inhibit fusion by negatively regulating MFN and
OPA1 function and/or positively regulating DRP1 (van
der Bliek et al., 2013).
Despite these advances, differences between species in
displaying neurodegenerative phenotypes have made it
difficult to extrapolate the results obtained from animal
models to human. The discovery of induced pluripotent
stem cells (iPSCs) has for the first time enabled us to repro-
duce dopaminergic neurons from individuals who suffer
from familial or sporadic PD. Indeed, a recent iPSC-based
study showed that PARK2 controlled dopamine utilization
in iPSC-derived dopaminergic neurons (Jiang et al., 2012).
Likewise, advances in gene targeting (Cathomen and
Joung, 2008; Urnov et al., 2010; Zeng et al., 2014) allow
us to develop the corresponding models in an isogenic
background.
Stem Cell Reports j Vol. 4 j 1–13 j May 12, 2015 j ª2015 The Authors 1
Please cite this article in press as: Shaltouki et al., Mitochondrial Alterations by PARKIN in Dopaminergic Neurons Using PARK2 Patient-Specific and PARK2 Knockout Isogenic iPSC Lines, Stem Cell Reports (2015), http://dx.doi.org/10.1016/j.stemcr.2015.02.019

To enable us to study the role of PARK2 in human PD,
we made integration-free iPSC lines from four PD patients
carrying different PARK2 mutations (NINDS collection;
Table S1). We showed a deficiency in dopaminergic differ-
entiation and a reduction in mitochondrial volume
fraction in all four PARK2 lines compared with an age-
matched control subject. To confirm the results from the
patient-specific disease model and to overcome the ge-
netic variation among patient lines that could mask the
PARK2 phenotype, we generated PARK2 isogenic controls
using a KO strategy in a well-characterized integration-
free iPSC line. We found similar phenotypes in the
PARK2 KO isogenic line as seen from the familial PARK2
lines. We showed that loss-of-function mutations in
PARK2 impaired dopaminergic development by reducing
the percentage of Tyrosine hydroxylase-positive (TH+)
neurons and accumulation of a-synuclein (SNCA) in
dopaminergic neurons. These results were supported by
whole genome expression profiling in which alterations
in expression of mitochondria and cell death-related
genes were observed in the dopaminergic neuron stage
but not in earlier stages of differentiation. In addition,
we showed that similar changes were detected in a pure
population of forebrain neurons derived from the isogenic
model. Our results suggest that PARK2 is involved in mito-
chondrial regulation in neurons.
RESULTS
Generation of Integration-free iPSC Lines from Four
Patients with Various PARK2 Mutations
To investigate why mutations in PARK2 cause selective
degeneration of dopaminergic neurons in humans, we first
used a patient-specific-based-iPSC approach. Fibroblasts
from four patients (I, P, B, S) with various mutations in
PARK2 and an aged-matched control subject (Y) were
used to generate iPSC lines. Table S1 lists the clinical and
demographic data associated with each cell line. Whole
genome expression analysis was performed on the fibro-
blasts to obtain baseline data on the samples. No signifi-
cant difference in overall gene expression in major PD
genes was observed (Table S2).
Integration-free iPSC lines were generated by Sendai
technology (Cathomen and Joung, 2008; Pavletich and
Pabo, 1991; Wang et al., 2013; Yang et al., 2008). Multiple
clones from each subject were isolated and expanded and
validated for pluripotency ability to differentiate to three
germ layers absence of vector integration in iPSC lines
and identity by STR analysis and normal karyotype over
long-term culture (>20 passages) in vitro (Figures 1A–1P).
One clone of each line referred as Y09 (control), I3, P1,
S110, and B119 (PARK2 patients) was chosen for this study.
At this stage, no difference was observed between the
control line and the four PARK2 patient lines by growth
rate, morphology, and whole genome analysis. Thus,
neither the fibroblasts nor the iPSC derived from them dis-
played an obvious phenotype. PARK2 levels were low or
undetectable in normal fibroblasts and normal iPSC lines,
suggesting a possible explanation.
Neural and Neuronal Differentiation of PARK2
and Control iPSC Lines
We next determined whether the PARK2 iPSC lines could
differentiate to neuronal lineage. We observed no different
NSC formation between the patient and control lines, and
all lines differentiated into dopaminergic neurons (Figures
2A–2D). The experiment was repeated several times (n = 4),
and no difference was observed in any biological repli-
cates. Whole genome profiling of each line at various
stages of differentiation could not distinguish the patient
samples from the control (Figure S1). Instead, samples
were clustered by cell types as expected: hierarchial clus-
tering of NSC and dopaminergic neurons revealed a similar
gene expression pattern for all of the iPSC generated. The
overall correlation coefficiency between each population
showed highest similarities (higher R2 value) among each
population (e.g., iPSC versus iPSC, R2 > 0.98) (Table S3).
Examining the dataset at a higher resolution also showed
appropriate temporal expression of stage specific markers
such as LMX1A, FOXA2, and AADC, which were expressed
in all the generated lines at the dopaminergic stage (data
not shown), similar to what we had previously observed
in our experiments (Liu et al., 2013; Mom�cilovi�c et al.,
2014).
Impaired Dopaminergic Differentiation of PARK2
Lines
Although the ability of the normal and PARK2 patient NSC
differentiated in a qualitatively similar fashion, we did note
that the efficacy of dopaminergic differentiation appeared
to be reduced in the patient lines. To obtain a more quanti-
tativemeasure, we counted TH+ cells in each line by immu-
nocytochemistry and observed a significant decrease in
TH+ neurons from the patient lines: about 22%of total cells
expressed TH in the control line, whereas only 15%, 7%,
7% and 7% of total cells were TH+ dopaminergic neurons
from B119, I3, P1, and S110 PARK2 lines, respectively (Fig-
ure 3A). We repeated the experiment several times (n = 4),
and although the actual percentages varied in all cases, the
number of TH+ cells in the PARK2 lines was always less than
in the control. Given the temporally appropriate onset of
dopaminergic precursor markers in the array analysis of
patient and control lines, we interpret this result to suggest
that the changes we observed were likely the result of
death of differentiating or fully differentiated cells in the
2 Stem Cell Reports j Vol. 4 j 1–13 j May 12, 2015 j ª2015 The Authors
Please cite this article in press as: Shaltouki et al., Mitochondrial Alterations by PARKIN in Dopaminergic Neurons Using PARK2 Patient-Specific and PARK2 Knockout Isogenic iPSC Lines, Stem Cell Reports (2015), http://dx.doi.org/10.1016/j.stemcr.2015.02.019

patient-derived cultures rather than fewer dopaminergic
neurons being born in the patient lines.
Since death of dopaminergic neurons in PD is often
accompanied by changes in SNCA protein, we examined
SNCA expression in dopaminergic neurons of the patient
and control lines. As seen in Figure 3B, SNCA or its aggre-
gates were not detected in dopaminergic neurons derived
from the control line. However, SNCA and two forms of
SNCA aggregates were all elevated in all patient lines by
western blot (Figure 3B). The increased expression of
SNCA in PARK2 patient lines was also observed by immu-
nostaining of SNCA: approximately 4.6% of total cells
were SNCA+ in the control Y09 line, whereas approxi-
mately 12.1%, 7.4%, 8.5% and 9.0% of total cells were
Figure 1. Generation and Characterization of Parkinson’s Disease-Derived iPSC Using Sendai Virus Vector
(A) The workflow outlined here demonstrated the generation of human iPSC with Sendai virus vector encoding OCT4, KLF4, SOX2, and cMYC.
Approximately 53 105 human fibroblasts were plated onto a 35-mm dish 1 day before transduction. Day 1 denotes a day of transduction.
About 6 to 7 days after transduction, cells were collected and transferred onto inactivated mouse feeders at the density of 53 105 cells per
10-cm dish.
(B–J) Approximately 3-weeks posttransduction, TRA1-60-positive colonies were picked manually and transferred to a fresh feeder-coated
well. This shows representative colonies of PARK2 patient iPSCs stained for pluripotent markers NANOG, SOX2, OCT4, and TRA-1-60 (B–I),
as well as colonies positive for alkaline phosphatase activity (J).
(K–M) Immunofluorescence analysis of PARK2-PD-iPSC differentiated in vitro show the potential to generate cell derivatives of all three
primary germ cell layers, including ectoderm (stained for TUJ-1, green), mesoderm (stained for smooth muscle actin [SMA], green), and
endoderm (stained for a-fetoprotein, green).
(N) qPCR analyses of the endogenous (genomic) and exogenous (Sendai virus vector) expression levels of the indicated genes in PARK2
patient iPSCs.
(O) Short tandem repeat (STR) analysis of genomic DNA from PARK2-PD-iPSC matched the identity of iPSCs to their parent fibroblasts.
(P) Normal karyotype of PARK2 patient iPSC at passage 20.
(Q) The absence of persistent Sendai virus in I3 PARK2 patient fibroblasts and iPSC was confirmed as determined by RT-PCR analysis.
Results are representative of three biological replicates (individual clones in case of iPSC) from three independent experiments. Scale bars
are 100 mM.
Stem Cell Reports j Vol. 4 j 1–13 j May 12, 2015 j ª2015 The Authors 3
Please cite this article in press as: Shaltouki et al., Mitochondrial Alterations by PARKIN in Dopaminergic Neurons Using PARK2 Patient-Specific and PARK2 Knockout Isogenic iPSC Lines, Stem Cell Reports (2015), http://dx.doi.org/10.1016/j.stemcr.2015.02.019

SNCA positive in the patient lines I3, P1, B119, and S110,
respectively (Figures 3C and 3D). Double immunostaining
of TH and SNCA revealed that enhanced SNCA expression
was not limited to TH+ cells, as only a small percentage of
the SNCA-positive cells were TH+ neurons for all lines
(1.3% for the control Y09 line and 2.4%, 0.8%, 3.2%, and
0.6% for the patient lines I3, P1, B119, and S110, respec-
tively) (Figure 3D). These results suggested that mutations
in PARK2 gene may contribute to stress in neuronal cul-
tures that leads to the accumulation of SNCA in dopami-
nergic neurons. The accumulation of aggregates may
contribute to the reduction in the number of TH+ neurons
observed in the differentiating cultures form PARK2
mutated patient lines.
Reduced Mitochondrial Volume Fraction in PARK2
Patient Lines
Since we observed a phenotype in all four patient lines,
which in PARK2 may be related to mitochondrial dysfunc-
tion, we examined mitochondrial biology in more detail.
We first determinedmtDNA copy number in dopaminergic
cultures from the PARK2 and control lines. No significant
changes were seen in the amount of mitochondria DNA
measured by qPCR against the nuclear DNA between the
patient lines and the control or among the PARK2 lines
(Figure 4A). Nor did we find an alteration in mitochondrial
volume fraction, as determined by the ratio of mitochon-
dria to cell volume in total cells (Figure 4B).
However, since our cultures consist of a mixed popula-
tion of cells, we reexamined the cultures focusing solely
on TH+ cells. This was done post hoc by double labeling
cells for TH and TUJ-1 after live imaging of at least 600 cells
from each control and patient line (Figures 4C–4H). Mito-
Tracker staining (live) in TH+ (post hoc) neurons from the
control line and a representative PARK2 line are shown in
Figures 4E and 4H. As seen in Figure 4I, the fraction ofmito-
chondria (MitoTracker; green) to cell volume (Calcein-AM;
gray) calculated from confocal images constrained to TH+
neurons in all four PARK2 lines was significantly lower
than in the control line. These results indicate that muta-
tions in PARK2 contribute to changes in mitochondrial
content in dopaminergic neurons in these cultures, but at
Figure 2. Dopaminergic Differentiation
of Integration-free iPSC Lines Generated
from Four PARK2 Patients and One
Control
(A) A scheme of differentiation of dopami-
nergic neurons from patient-derived iPSC.
(B) Patient-derived iPSC and iPSC- from
the age-matched control subject were
directed to neuroepithelial cells using the
previously described protocol (Swistowski
et al., 2009).
(C) These neuroepithelial cells were ex-
posed to PA6-CM to produce FOXA2
expressing dopaminergic progenitors in the
subsequent 2 weeks.
(D) Finally, the progenitors were further
differentiated to post-mitotic dopami-
nergic neurons by the addition of neuro-
trophic factors to PA6-CM, as described
previously. Control and patient-specific
iPSC-derived neurons were analyzed by
immunofluorescence for expression of TH
(green) and TUJ-1 (red) at the end of the
28-day differentiation protocol. Shown are
representative images of three independent
differentiation experiments from Control-
iPSC, PARK2 patient iPSC lines carrying
different PARK2 mutations.
Scale bars = 100 mM.
4 Stem Cell Reports j Vol. 4 j 1–13 j May 12, 2015 j ª2015 The Authors
Please cite this article in press as: Shaltouki et al., Mitochondrial Alterations by PARKIN in Dopaminergic Neurons Using PARK2 Patient-Specific and PARK2 Knockout Isogenic iPSC Lines, Stem Cell Reports (2015), http://dx.doi.org/10.1016/j.stemcr.2015.02.019

this stage, no changes are seen in the other cell types pre-
sent in the culture including astrocytes, NSC, and other
midbrain neurons.
Decreased Dopaminergic Differentiation and
Mitochondrial Volume Ratio in Isogenic PARK2
KO iPSC Lines
Although the results were compelling and consistent, the
size of the cohort examined (four) is small, and the data
do not allow us to conclude that PARK2 is sufficient to
cause the observed phenotype. To address this issue, we ob-
tained a set of isogenic iPSC lines mimicking the loss of
function of PARK2 gene created by Zinc Finger Nuclease
(ZFN) in a well-characterized integration-free iPSC line
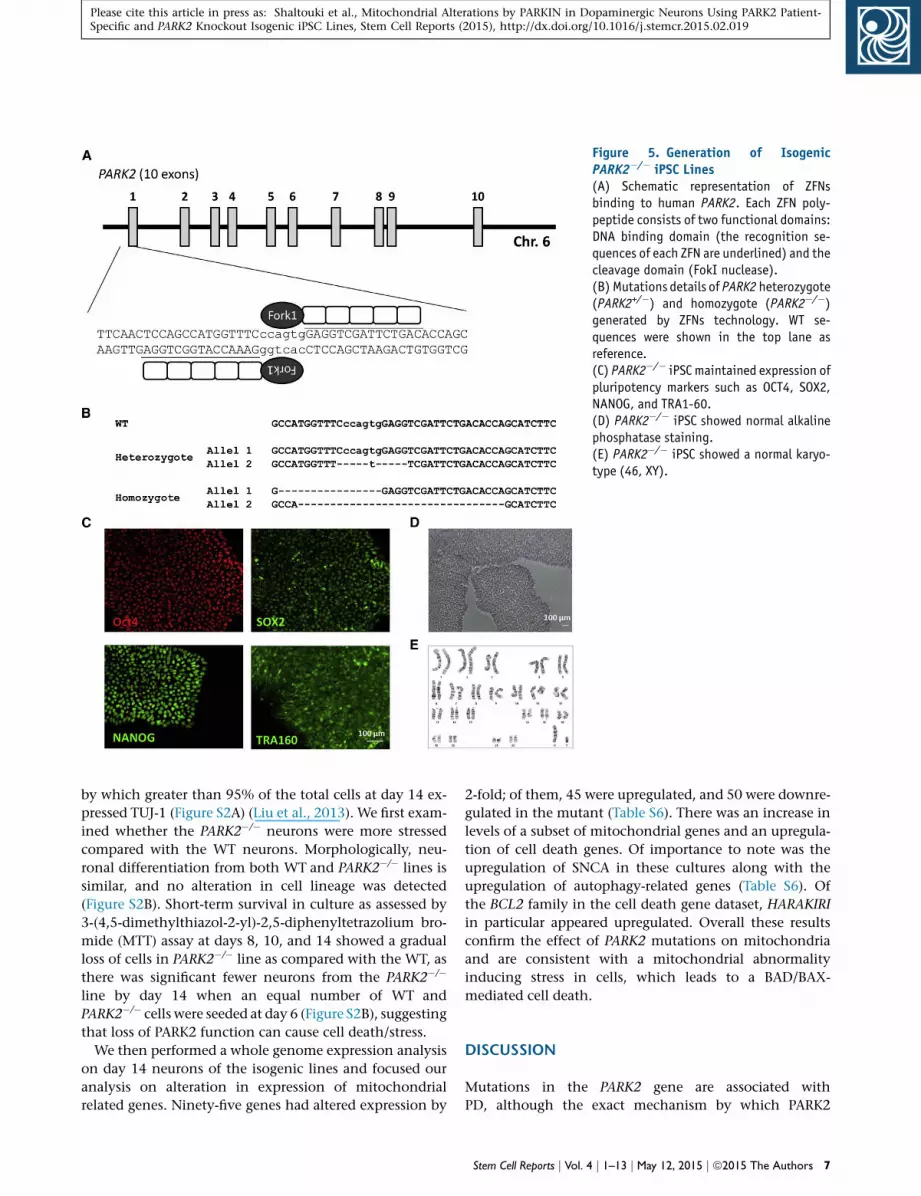
XCL1 (XCell Science). Figures 5A and 5B showed a sche-
matic representation of ZFN binding to PARK2 and the
frame-shift mutations introduced in the heterozygotes
(PARK2+/�) and homozygote (PARK2�/�) used in this study.
Both lines were validated for pluripotency and normal kar-
yotypes (Figures 5C–5E). As expected, gene expression
profiling did not show a phenotype at the iPSC stage. These
data confirmed that the targeting process did not alter the
line, and consistent with the patient line data, loss of
PARK2 did not affect iPSC behavior. We next generated
NSC from these isogenic lines (Figures 6A–6C). Consistent
with earlier results, no difference in early neural differenti-
ationwas observed between the lines. BothNSC lines could
differentiate into TH+ dopaminergic neurons (Figures
6D–6F). Quantification of the percentage of TH+ dopami-
nergic neurons revealed a significantly lower percentage
in the PARK2�/� line than in the WT control line (Fig-
ure 6G). We then examined the mtDNA copy number
and mitochondrial volume fraction in TH+ dopaminergic
neurons. No difference in DNA copy number or mitochon-
drial volume fraction in total cells in the mixed culture was
found between the PARK2�/� and its isogenic control (data
not shown). However, similar to what we discovered in the
patient-derived lines, mitochondrial volume fraction in
TH+ neurons was significantly reduced in the PARK2�/�
line, but not in the PARK2�/+ line (Figure 6H).
This loss of PARK2 was both necessary and sufficient to
mimic the phenotype observed in the patient lines. To
assess whether there were changes in mitochondrial
biology that were large enough to be detected by microar-
ray analysis, we prepared dopaminergic neurons from the
WT and PARK2�/� KO line and assessed the expression of
�600 mitochondrial genes, mitophagy-related genes,
genes known to be involved in cell death, and mitochon-
drial fission and fusion (Table S4). We reasoned that sensi-
tivity should be higher in isogenic line comparison, and
>2-fold changes may be enriched in genes that are biologi-
cally relevant genes. Consistent with our observation of a
change in mitochondrial volume fraction in dopaminergic
neurons, expression of several mitophagy-related genes
Figure 3. Decreased TH-Positive Neurons
and Increased SNCA Expression in iPSC
Lines Carrying PARK2 Mutations
(A) To determine differentiation efficiency,
the number TH-positive cells is represented
as the percentage of total number of cells
(stained with Hoechst). Error bars represent
mean SEM of triplicates from four indepen-
dent experiments. Significant differences
were found in the ability of iPSCs from
different patients to generate dopaminergic
neurons after 28 days of differentiation.
(B) Western blot analysis of extracts from
patient-derived neurons probed with SNCA
antibodies. The arrow marks the 19-kDa
SNCA present in patient lines and absent in
control healthy subject. The band just
above (present in only patient lines) may
represent an alternatively spliced form of
SNCA or aggregate form of SNCA.
(C) Immunofluorescence for expression
of SNCA in dopaminergic neurons from pa-
tient lines. Increased SNCA expression is
observed in PARK2 patient lines.
(D) Double stain of SNCA and TH expression in dopaminergic neurons from patient lines. SNCA is expressed in both TH-positive and non-
TH-expressing neurons. Shown are representative of four independent experiments.
Scale bars represent 100 mM.
Stem Cell Reports j Vol. 4 j 1–13 j May 12, 2015 j ª2015 The Authors 5
Please cite this article in press as: Shaltouki et al., Mitochondrial Alterations by PARKIN in Dopaminergic Neurons Using PARK2 Patient-Specific and PARK2 Knockout Isogenic iPSC Lines, Stem Cell Reports (2015), http://dx.doi.org/10.1016/j.stemcr.2015.02.019

was altered in the PARK2�/�-derived dopaminergic popula-
tion. Twenty-five genes were seen to be 2-fold or higher
expressed in the PARK2�/� line, whereas 20 genes were ex-
pressed 2-fold or lower in the PARK2�/� line (Table S5).
Overall, these data are consistent with our observation
that PARK2 null is a sensitive model of familial PARK2
patient-specific lines and can be used to assess the role of
PARK2 in disease.
Mitochondrial Ultrastructural Abnormalities in
PARK2�/� KO Line
To provide a more morphological assessment of the
phenotype, we examined change of mitochondria in
PARK2�/� KO cells by electron microscopy. Cells from
the isogenic control and the PARK2�/� line were grown
in parallel and differentiated into dopaminergic neurons.
The mitochondrial morphology was examined in neurites
and in cell soma using thin-cut electron microscopy sec-
tions. As a control, the normal cells were treated with
rotenone at 100 mM for 24 hr, a well-characterized mito-
chondrial toxin, which induces characteristic changes in
mitochondria that include changes in mitochondrial
volume (Chauvin et al., 2001; Panov et al., 2005; Sherer
et al., 2003a).
As seen in Figures 7A and 7B, rotenone caused overt
swelling and loss of matrix density in the WT control cul-
tures. These ultrastructural alterations are similar to what
has been previously described (Chauvin et al., 2001; Lin
et al., 2012). As with WT cells treated with rotenone
treatment, PARK2�/� cells also showed similar changes in
mitochondria present in the cell soma (Figure 7C). Mito-
chondria in PARK2�/� neurons showed signs of swelling
(decreased density of the mitochondrial matrix; Figure 7C,
open arrows) and irregular, dilated cristae (arrows) as
compared with the isogenic control. These differences
were not observed inmitochondria present in neurites (Fig-
ures 7D–7F), suggesting amore limitedmitochondrial dam-
age. These data confirm and extend our observation that
PARK2 null neurons undergo stress in culture, which leads
tomitochondrial damage and a slow progressive cell death.
Altered Gene Expression of PARK2�/� Neurons and Its
Response to Stress
Since PARK2 is ubiquitously expressed, we reasoned that a
subset ofmitochondrial changes observed in dopaminergic
cultures by microarray would likely be seen in other
neuronal cell types. We therefore prepared a pure popula-
tion of neurons from these isogenic lines using a protocol
Figure 4. Changes in Mitochondrial Con-
tent in PARK2 Patient-Derived Dopami-
nergic Neurons
(A) A variation of mtDNA copy number
in patient-derived dopaminergic neuron
mixed culture. Bars represent average with
SEM as error bars. Results are representative
of three independent experiments.
(B–H) Mitochondrial volume fraction
determination using confocal microscopy.
The ratio of mitochondria (MitoTracker Red;
green) to total cellular volume (Calcein-AM;
gray) was calculated from confocal images
for TH-positive cells. The upper two panels
show the TH, TUJ-1-positive cells in control
subject (C) and patient-derived neurons
(F). The middle two panels show the binary
processed images (D and G), which were
used as input for the calculation. The lower
two panels show mitotracker staining in
TH-positive cells (E and H). Mitochondrial
volume fraction quantification from con-
focal imaging. Bars represent means SEM of
triplicates from three independent experi-
ments (I). The statistical significance
was calculated from a one-way ANOVA;
**p < 0.001. The scale bar in (C)–(H) rep-
resents 75 mM.
6 Stem Cell Reports j Vol. 4 j 1–13 j May 12, 2015 j ª2015 The Authors
Please cite this article in press as: Shaltouki et al., Mitochondrial Alterations by PARKIN in Dopaminergic Neurons Using PARK2 Patient-Specific and PARK2 Knockout Isogenic iPSC Lines, Stem Cell Reports (2015), http://dx.doi.org/10.1016/j.stemcr.2015.02.019
by which greater than 95% of the total cells at day 14 ex-
pressed TUJ-1 (Figure S2A) (Liu et al., 2013). We first exam-
ined whether the PARK2�/� neurons were more stressed
compared with the WT neurons. Morphologically, neu-
ronal differentiation from both WT and PARK2�/� lines is
similar, and no alteration in cell lineage was detected
(Figure S2B). Short-term survival in culture as assessed by
3-(4,5-dimethylthiazol-2-yl)-2,5-diphenyltetrazolium bro-
mide (MTT) assay at days 8, 10, and 14 showed a gradual
loss of cells in PARK2�/� line as compared with the WT, as
there was significant fewer neurons from the PARK2�/�
line by day 14 when an equal number of WT and
PARK2�/� cells were seeded at day 6 (Figure S2B), suggesting
that loss of PARK2 function can cause cell death/stress.
We then performed a whole genome expression analysis
on day 14 neurons of the isogenic lines and focused our
analysis on alteration in expression of mitochondrial
related genes. Ninety-five genes had altered expression by
2-fold; of them, 45 were upregulated, and 50 were downre-
gulated in the mutant (Table S6). There was an increase in
levels of a subset of mitochondrial genes and an upregula-
tion of cell death genes. Of importance to note was the
upregulation of SNCA in these cultures along with the
upregulation of autophagy-related genes (Table S6). Of
the BCL2 family in the cell death gene dataset, HARAKIRI
in particular appeared upregulated. Overall these results
confirm the effect of PARK2 mutations on mitochondria
and are consistent with a mitochondrial abnormality
inducing stress in cells, which leads to a BAD/BAX-
mediated cell death.
DISCUSSION
Mutations in the PARK2 gene are associated with
PD, although the exact mechanism by which PARK2
Figure 5. Generation of Isogenic
PARK2�/� iPSC Lines
(A) Schematic representation of ZFNs
binding to human PARK2. Each ZFN poly-
peptide consists of two functional domains:
DNA binding domain (the recognition se-
quences of each ZFN are underlined) and the
cleavage domain (FokI nuclease).
(B) Mutations details of PARK2 heterozygote
(PARK2+/�) and homozygote (PARK2�/�)
generated by ZFNs technology. WT se-
quences were shown in the top lane as
reference.
(C) PARK2�/� iPSC maintained expression of
pluripotency markers such as OCT4, SOX2,
NANOG, and TRA1-60.
(D) PARK2�/� iPSC showed normal alkaline
phosphatase staining.
(E) PARK2�/� iPSC showed a normal karyo-
type (46, XY).
Stem Cell Reports j Vol. 4 j 1–13 j May 12, 2015 j ª2015 The Authors 7
Please cite this article in press as: Shaltouki et al., Mitochondrial Alterations by PARKIN in Dopaminergic Neurons Using PARK2 Patient-Specific and PARK2 Knockout Isogenic iPSC Lines, Stem Cell Reports (2015), http://dx.doi.org/10.1016/j.stemcr.2015.02.019

contributes to the selective neuronal degeneration in PD is
unknown. Different lines of evidence indicate that alter-
ations in many aspects of mitochondrial biology such as
complex I activity, fission and fusion,mitophagy, transport
ofmitochondria in neurons, and alterationsmitochondrial
membrane potential may contribute to PD (Dauer and
Przedborski, 2003; Exner et al., 2012). Consistent with
the mitochondrial hypothesis, it has been postulated that
the role of PARK2 and PINK1 inmitochondrial quality con-
trol underlies the basis of PARK2-related PD. Our results
showing an alteration in mitochondrial volume in PARK2
mutants in a primary human dopaminergic cell model is
consistent with this hypothesis. The deficits in mito-
chondrial volume were accompanied by a reduction in
dopaminergic neurons in PARK2 patient lines, and these
phenotypes were recapitulated in our isogenic PARK2�/�
lines. Whole genome expression profiling confirmed the
phenotype and identified mitochondrial-associated cell
death as a cause for the reduction in cell number.
Mitochondria play an important role in neuronal activity
and survival. Neurons rely on oxidative phosphorylation
for their energy supply, and the abundance of mitochon-
dria is an important factor in determining survivability of
neurons (Yadava and Nicholls, 2007). We have previously
reported that differentiated neurons display higher mito-
chondrial biogenesis when compared with their early pro-
genitors NSC (Birket et al., 2011). Misregulated biogenesis
has been implicated to underlie pathological conditions
in a number of neurodegenerative diseases. A host of pro-
teins such as VDAC, cytochrome C, POLG, TFAM and
PGC-1a, NRF-1 are known to regulate mitochondrial
biogenesis, and differential expression of these proteins
has been reported in various neurodegenerative disorders.
Our array data did not show substantive differences in
expression of these mitochondrial biogenesis genes be-
tween PARK2 patients and controls, indicating that the
phenotype was not caused by mitochondrial biogenesis.
Deletion and overreplication of mtDNA are emerging as
important factors underlying the selective loss of dopami-
nergic neurons during aging and in PD (Anderson et al.,
1981; Ekstrand et al., 2007; Johns, 1995; Wei, 1998).
Although we did not detect any changes in mtDNA copy
numbers between healthy and diseased samples, the mito-
chondria-to-cell-volume fraction, an important parameter
of mitochondrial membrane potential (Birket et al.,
2011), was significantly reduced in PARK2 dopaminergic
neurons. A decrease in mitochondrial membrane potential
in PARK2-deficient cells could make a selective population
of cells more vulnerable to stress stimuli. Consistent with
this, PARK2mutantDrosophila have been reported to accu-
mulate depolarized mitochondria in dopaminergic neu-
rons (Burman et al., 2012). Indeed, a declinemitochondrial
membrane potential has been reported in PD patient
derived fibroblasts, with PARK2 deficiency (Mortiboys
et al., 2008).
Our results are consistent with previous reports of the ac-
tion of PARK2 and reduction in TH-positive cells described
in mouse PARK2 KOmodel (Perier et al., 2013; Reeve et al.,
2013; Rothfuss et al., 2009) and consistent with work done
in the fly model. The mitochondrial phenotype was not
seen when we examined the total cells in the culture;
rather, it was only seen in TH-positive dopaminergic
Figure 6. Decreased Dopaminergic Dif-
ferentiation and Mitochondrial Abun-
dance in Isogenic PARK2�/� iPSC Lines
(A–C) No detectable difference was
observed in NSC uniformly expressing Nes-
tin and Sox1 derived fromWT, PARK2+/� and
PARK2�/� iPSC lines.
(D–F) Loss of dopaminergic neurons in
PARK2+/� and PARK2�/� lines compared
with the WT. Representative immuno-
histochemistry images of dopaminergic
differentiated culture of PARK2+/� and
PARK2�/� iPSC and their parental isogenic
control line were stained for dopaminergic
marker TH and TUJ-1.
(G) Percent of TH-positive dopaminergic
neurons PARK2+/� and PARK2�/� cells
compared with their parental isogenic con-
trol WT line at day 28.
(H) A significantly reduced mitochondrial volume fraction in TH-positive dopaminergic neurons was observed in the PARK2�/� line.
Bars represent means and SEM of four independent experiments. **p < 0.001 (Student’s t test).
Scale bars represent 100 mM.
8 Stem Cell Reports j Vol. 4 j 1–13 j May 12, 2015 j ª2015 The Authors
Please cite this article in press as: Shaltouki et al., Mitochondrial Alterations by PARKIN in Dopaminergic Neurons Using PARK2 Patient-Specific and PARK2 Knockout Isogenic iPSC Lines, Stem Cell Reports (2015), http://dx.doi.org/10.1016/j.stemcr.2015.02.019

neurons, which represented only a small percentage of the
total cells (<30%). This may explain the apparent discrep-
ancy with an earlier report on two PARK2 iPSC lines
whenmtDNA copy number was determined in themix cul-
ture (Jiang et al., 2012). These results also suggested that
NSC, astrocytes, and other cell populations may not
show a significant phenotype, and this was confirmed in
our whole genome analysis of NSC and astrocyte samples
(see Results; data not shown).
Of importance was our finding of changes in other PD-
associated genes, including SNCA (Kruger et al., 1998; Pol-
ymeropoulos et al., 1997; Singleton et al., 2003; Zarranz
et al., 2004). SNCA is a presynaptic protein and function
in regulating synaptic vesicle and neurotransmitter
release. Aggregates of SNCA have been identified within
the cytoplasmic inclusions (Lewy bodies) along with
PARK2 in the brains of PD patients. It has been suggested
that PARK2-mediated ubiquitination regulates SNCA
assembly into ubiquitin-positive cytosolic inclusions,
lending support for absence of these inclusions in PD
patients with PARK2 mutation (Chung et al., 2001).
Here, we report an increase in SNCA protein levels in
patient-derived neurons concomitant with a decrease in
TH-positive cells. Similar correlation was reported previ-
ously to be associated with the aging process (Chu and
Kordower, 2007). Although, some cellular and tissue
studies in PD patients argue against the excess of SNCA
in pathogenesis of PD (Dachsel et al., 2007), recent studies
reaffirm the increase in SNCA protein levels in iPSC-
derived neurons from patient with PARK2 mutation (Imai-
zumi et al., 2012). It is possible that this increase in SNCA
expression is an early event in the disease process and that
patients with a late stage of PD do not display this pheno-
type. We acknowledge that there are many differences
between a cell culture model and what may be seen in a
culture dish. One operating assumption is that loss of
PARK2 may lead to reduced processing of SNCA-associated
proteins in particular SYNPHILIN; other data suggest that
it is a nonclassical pathway (Chung et al., 2001; Lim
et al., 2005; Sherer et al., 2003b; Zhang et al., 2013). We
believe that altered ratios of interacting proteins may
lead to either an increase or decrease depending on the
stage of the disease. However, it is difficult to mimic the
exact disease stage in culture just as it has been hard to
Figure 7. Mitochondrial Ultrastructure in
Dopaminergic Neurons
Transmission electronmicrographs of dopa-
minergic neuronal cultures were recorded
at 368,000 magnification in 70-nm thick
sections.
(A–C) Representative images of mitochon-
dria (m) in neuronal somata.
(D–F) Representative images of mitochon-
dria in neurites identified by parallel orga-
nized microtubule tracts (m) (A and D) WT
dopaminergic neurons, (B and E) rotenone-
treated (100 mM, 24 hr) dopaminergic
neurons, and (C and F) PARK2�/� neurons.
Solid arrows point cristae of the inner
mitochondrial membrane; open arrows mark
the mitochondrial matrix. (E and F) (a),
mitophagic vacuole; (n), nucleus. Results
are representative of three independent
experimental replicates.
Stem Cell Reports j Vol. 4 j 1–13 j May 12, 2015 j ª2015 The Authors 9
Please cite this article in press as: Shaltouki et al., Mitochondrial Alterations by PARKIN in Dopaminergic Neurons Using PARK2 Patient-Specific and PARK2 Knockout Isogenic iPSC Lines, Stem Cell Reports (2015), http://dx.doi.org/10.1016/j.stemcr.2015.02.019

do so in rodents in vivo. Nevertheless, our data were
consistent in all PARK2 patient lines in vitro.
We did not examine the presence of inclusion bodies or
association of SNCA with these aggregates. In our culture,
we did not observe a selective expression of SNCA in TH-
positive cells, but rather, the expression was more random.
In the absence of an appropriate reporter line, we could not
infer from our data whether the TH-positive and SNCA-
negative cells are surviving cells or that SNCA upregulation
is delayed in these cells.
PARK2 is a ubiquitously expressed protein, and its
ubiquitination of outer mitochondrial membrane is a pre-
requisite step in mitophagy-mediated removal of damaged
mitochondria. However, PARK2 abnormalities in cells
other than neurons fail to display the selective loss of a
particular population of cells, suggesting that dysfunc-
tional mitophagy could be compensated or delayed. Both
PD patients and PARK2 KO dopaminergic neurons display
upregulation of several key mitophagy-associated proteins,
as determined by our array data. Similarly, in our isogenic
lines, the expression of these mitophagy-related genes
displayed alleleic dependency and stage specificity. We
identified a number cell death-inducing genes that were
upregulated in dopaminergic neurons derived from
PARK2 patients and PARK2 KO lines; these include BID,
BAX, BIM, BAK, PUMA, NOXA, BNIP3, and NIK (BCL-2
interacting killer). Although the mechanism by which
dysfunctional mitophagy contribute to PD pathogenesis
remain to be investigated, here we show that for the first
time that PARK2 contributes to mitochondrial mass (vol-
ume) in dopaminergic neurons. We show that TH-positive
neurons in PD patient and PARK2 KO lines have a reduced
mitochondrial mass compared with controls. A decrease in
population of mitochondria within these TH-positive cells
would shift the balance between healthy and defective
mitochondrial and render these cells more vulnerable to
accumulation of damaged mitochondria. We did not
observe this alteration in the absence of PARK2 mutations.
Given the ubiquitous expression of PARK2 and the
changes we observed in our mixed dopaminergic neuron
cultures, as well as previously published reports of observ-
able phenotypes in cell lines unrelated to neurons (da
Costa et al., 2009; Tsai et al., 2003), we reasoned that a sub-
set of these changes may be seen in other neurons other
than dopaminergic neurons. We took advantage of a
neuronal differentiation system that we have developed
(Liu et al., 2013) and examined a pure population of
neurons of PARK2 mutants. We focused our analysis on
isogenic PARK2 lines as a more sensitive model of the
PARK2 phenotype. Similar changes were seen, as with
dopaminergic neurons. We saw a gradual decline in the
number of surviving neurons in culture to approximately
half of that in the isogenic control sample. This phenotypic
change was consistent with previous observations in
mouse models, which showed a decreased survival in
response to stress (Sherer et al., 2003b; Testa et al., 2005).
Comparison of the mitochondrial and cell death gene
changes showed a similar but not identical profile. These
results along with the lack of a phenotype in iPSC, NSC,
and astrocytes highlight the importance of studying the
effect in an appropriate cellular context. Our observation
that the phenotype can be studied in generic neurons
provides a feasible assay with additional stress using a puri-
fied population of cells that can be obtained 2- to 3-fold
faster and with much less effort than authentic midbrain
dopaminergic neurons.
Overall, our results provide a current model of PARK2
function where damaged mitochondria are targeted for
degradation via a PARK2/PINK1 interaction. Loss of
PARK2 results in an initial accumulation of damaged mito-
chondria, and stress in culture results in a slow reduction in
cell number as internal repair process fail to compensate for
loss of metabolic activity. Cells with a higher metabolic
activity are more susceptible to suffer mitochondrial loss
and display a phenotype earlier thanmore robust glial cells.
Using multiple lines and generating isogenic controls and
combining phenotypic changes with gene expression
profiling provide a useful model for elucidating pathways
underlying the disease process and provide important tools
that are useful for the PD community. These results also
suggest that the engineered PARK2 KO and it isogenic con-
trols provide a valuable model to assess familial PD models
and to construct single- and double-mutant models.
EXPERIMENTAL PROCEDURES
Generation of Patient-Specific and Isogenic iPSC Lines
PD patient fibroblasts were obtained from Coriell. Fibroblasts
growing conditions, reprogramming, and differentiation proce-
dures are described in the Supplemental Information.
The isogenic PARK2 KO lines were generated by ZFN technology
and were obtained from XCell Science. The detailed method was
described in the Supplemental Information.
Neural and Dopaminergic Neuronal Differentiation
Generation of NSC and dopaminergic differentiation from NSC
was described (Swistowski et al., 2009). The detailed procedures
were seen in the Supplemental Information.
Immunocytochemistry and Western Blot
Immunocytochemistry and western blot procedures were as
described previously (Zeng et al., 2003). See Supplemental Infor-
mation for used antibodies and further descriptions.
Microarray and qPCR Analyses
Total RNA was isolated using the RNeasy Mini kit according to the
manufacturer’s instructions (QIAGEN) and hybridized to Illumina
10 Stem Cell Reports j Vol. 4 j 1–13 j May 12, 2015 j ª2015 The Authors
Please cite this article in press as: Shaltouki et al., Mitochondrial Alterations by PARKIN in Dopaminergic Neurons Using PARK2 Patient-Specific and PARK2 Knockout Isogenic iPSC Lines, Stem Cell Reports (2015), http://dx.doi.org/10.1016/j.stemcr.2015.02.019

Human HT-12 BeadChip (Illumina, performed by Microarray core
facility at the Burnham Institute for Medical Research). All of the
data processing and analysis were performed using the algorithms
included with the Illumina BeadStudio software, and further
description can be found in Supplemental Information. The
qPCR procedure was described in the Supplemental Information.
The GEO accession number for microarray data is GSE66241.
MtDNA Copy Number Assessment
The mtDNA copy number was determined by comparing
PCR amplification of a mitochondrial amplicon (human, NADH-
ubiquinone oxidoreductase chain 5 [ND5]) with a nuclear ampli-
con (human, cystic fibrosis) (Wong and Cortopassi, 2002). The
standard curves were generated for quantifications obtained by
amplification curves of nuclear cystic fibrosis gene and ND5 gene
amplified from 0- to 100-ng and 0- to 1-ng K562DNA, respectively.
Confocal Microscopic Stereology of Mitochondria
Volume Fraction
Mitochondria: cell volume fractions (VF) were determined using a
confocal microscopy and image processing-based stereologic
approach according to (Gerencser et al., 2012) and are further
described in Supplemental Information.
Electron Microscopy
Transmission electron microscopy was performed as previously
described (Birket et al., 2011), and the detail was described in the
Supplemental Information.
Statistical Analysis
Statistical analyses were performed using two-tailed paired or
unpaired when analyzing isogenic lines. For patient-derived cell
lines, the statistical significance was calculated from a one way
ANOVA using Dunnett’s correction. *p < 0.05, **p < 0.01.
ACCESSION NUMBERS
Themicroarray data utilized in this studywere deposited under the
GEO accession number GSE66241.
SUPPLEMENTAL INFORMATION
Supplemental Information includes Supplemental Experi-
mental Procedures, two figures, and six tables and can be found
with this article online at http://dx.doi.org/10.1016/j.stemcr.
2015.02.019.
AUTHOR CONTRIBUTIONS
A.S. performed differentiation and mitochondrial function exper-
iments. R.S. generated some patient iPSC lines and performed mi-
croarray analysis. Y.P. generated some isogenic Park2 iPSC lines.
ACKNOWLEDGMENTS
This work was supported in part by California Institute for Regen-
erativeMedicineGrants TR-01856 (Zeng) and TG2-01155 (Zeng) to
X.Z. We thank former and current Zeng lab members for technical
assistant and helpful discussions.
Received: September 26, 2014
Revised: February 23, 2015
Accepted: February 25, 2015
Published: April 2, 2015
REFERENCES
Abbas, N., Lucking, C.B., Ricard, S., Durr, A., Bonifati, V.,
De Michele, G., Bouley, S., Vaughan, J.R., Gasser, T., Marconi, R.,
et al.; French Parkinson’s Disease Genetics Study Group and the
European Consortium on Genetic Susceptibility in Parkinson’s
Disease (1999). A wide variety of mutations in the parkin gene
are responsible for autosomal recessive parkinsonism in Europe.
Hum. Mol. Genet. 8, 567–574.
Akundi, R.S., Zhi, L., Sullivan, P.G., and Bueler, H. (2013). Shared
and cell type-specific mitochondrial defects andmetabolic adapta-
tions in primary cells from PINK1-deficient mice. Neurodegener.
Dis. 12, 136–149.
Anderson, S., Bankier, A.T., Barrell, B.G., de Bruijn, M.H., Coulson,
A.R., Drouin, J., Eperon, I.C., Nierlich, D.P., Roe, B.A., Sanger, F.,
et al. (1981). Sequence and organization of the human mitochon-
drial genome. Nature 290, 457–465.
Birket, M.J., Orr, A.L., Gerencser, A.A., Madden, D.T., Vitelli, C.,
Swistowski, A., Brand, M.D., and Zeng, X. (2011). A reduction in
ATP demand and mitochondrial activity with neural differentia-
tion of human embryonic stem cells. J. Cell Sci. 124, 348–358.
Burman, J.L., Yu, S., Poole, A.C., Decal, R.B., and Pallanck, L.
(2012). Analysis of neural subtypes reveals selectivemitochondrial
dysfunction in dopaminergic neurons from parkin mutants. Proc.
Natl. Acad. Sci. USA 109, 10438–10443.
Cathomen, T., and Joung, J.K. (2008). Zinc-finger nucleases: the
next generation emerges. Mol. Ther. 16, 1200–1207.
Chauvin, C., De Oliveira, F., Ronot, X., Mousseau, M., Leverve, X.,
and Fontaine, E. (2001). Rotenone inhibits the mitochondrial
permeability transition-induced cell death in U937 and KB cells.
J. Biol. Chem. 276, 41394–41398.
Chen, H., and Chan, D.C. (2009). Mitochondrial dynamics—
fusion, fission, movement, andmitophagy—in neurodegenerative
diseases. Hum. Mol. Genet. 18 (R2), R169–R176.
Chu, Y., and Kordower, J.H. (2007). Age-associated increases of
alpha-synuclein in monkeys and humans are associated with
nigrostriatal dopamine depletion: Is this the target for Parkinson’s
disease? Neurobiol. Dis. 25, 134–149.
Chung, K.K., Zhang, Y., Lim, K.L., Tanaka, Y., Huang, H., Gao, J.,
Ross, C.A., Dawson, V.L., and Dawson, T.M. (2001). Parkin ubiqui-
tinates the alpha-synuclein-interacting protein, synphilin-1:
implications for Lewy-body formation in Parkinson disease. Nat.
Med. 7, 1144–1150.
Clark, I.E., Dodson, M.W., Jiang, C., Cao, J.H., Huh, J.R., Seol, J.H.,
Yoo, S.J., Hay, B.A., and Guo, M. (2006). Drosophila pink1 is
required for mitochondrial function and interacts genetically
with parkin. Nature 441, 1162–1166.
Stem Cell Reports j Vol. 4 j 1–13 j May 12, 2015 j ª2015 The Authors 11
Please cite this article in press as: Shaltouki et al., Mitochondrial Alterations by PARKIN in Dopaminergic Neurons Using PARK2 Patient-Specific and PARK2 Knockout Isogenic iPSC Lines, Stem Cell Reports (2015), http://dx.doi.org/10.1016/j.stemcr.2015.02.019
da Costa, C.A., Sunyach, C., Giaime, E., West, A., Corti, O., Brice,
A., Safe, S., Abou-Sleiman, P.M., Wood, N.W., Takahashi, H., et al.
(2009). Transcriptional repression of p53 by parkin and impair-
ment by mutations associated with autosomal recessive juvenile
Parkinson’s disease. Nat. Cell Biol. 11, 1370–1375.
Dachsel, J.C., Lincoln, S.J., Gonzalez, J., Ross, O.A., Dickson, D.W.,
and Farrer, M.J. (2007). The ups and downs of alpha-synuclein
mRNA expression. Mov. Disord. 22, 293–295.
Dauer, W., and Przedborski, S. (2003). Parkinson’s disease:
mechanisms and models. Neuron 39, 889–909.
Dawson, T.M. (2006). Parkin and defective ubiquitination in
Parkinson’s disease. J. Neural Transm. Suppl. 7, 209–213.
Dawson, T.M., Ko, H.S., and Dawson, V.L. (2010). Genetic animal
models of Parkinson’s disease. Neuron 66, 646–661.
Ekstrand, M.I., Terzioglu, M., Galter, D., Zhu, S., Hofstetter, C.,
Lindqvist, E., Thams, S., Bergstrand, A., Hansson, F.S., Trifunovic,
A., et al. (2007). Progressive parkinsonism in mice with respira-
tory-chain-deficient dopamine neurons. Proc. Natl. Acad. Sci.
USA 104, 1325–1330.
Exner, N., Lutz, A.K., Haass, C., and Winklhofer, K.F. (2012).
Mitochondrial dysfunction in Parkinson’s disease: molecular
mechanisms and pathophysiological consequences. EMBO J. 31,
3038–3062.
Geisler, S., Holmstrom, K.M., Skujat, D., Fiesel, F.C., Rothfuss, O.C.,
Kahle, P.J., and Springer, W. (2010). PINK1/Parkin-mediated
mitophagy is dependent on VDAC1 and p62/SQSTM1. Nat. Cell
Biol. 12, 119–131.
Gerencser, A.A., Chinopoulos, C., Birket, M.J., Jastroch, M., Vitelli,
C., Nicholls, D.G., and Brand, M.D. (2012). Quantitative measure-
ment of mitochondrial membrane potential in cultured cells:
calcium-induced de- andhyperpolarizationof neuronalmitochon-
dria. J. Physiol. 590, 2845–2871.
Goldberg,M.S., Fleming, S.M., Palacino, J.J., Cepeda, C., Lam,H.A.,
Bhatnagar, A.,Meloni, E.G.,Wu,N., Ackerson, L.C., Klapstein,G.J.,
et al. (2003). Parkin-deficient mice exhibit nigrostriatal deficits
but not loss of dopaminergic neurons. J. Biol. Chem. 278,
43628–43635.
Greene, J.C., Whitworth, A.J., Kuo, I., Andrews, L.A., Feany, M.B.,
and Pallanck, L.J. (2003). Mitochondrial pathology and apoptotic
muscle degeneration in Drosophila parkin mutants. Proc. Natl.
Acad. Sci. USA 100, 4078–4083.
Henchcliffe, C., and Beal, M.F. (2008). Mitochondrial biology and
oxidative stress in Parkinson disease pathogenesis. Nat. Clin. Pract.
Neurol. 4, 600–609.
Imaizumi, Y., Okada, Y., Akamatsu, W., Koike, M., Kuzumaki, N.,
Hayakawa, H., Nihira, T., Kobayashi, T., Ohyama, M., Sato, S.,
et al. (2012). Mitochondrial dysfunction associated with increased
oxidative stress and a-synuclein accumulation in PARK2 iPSC-
derived neurons and postmortem brain tissue. Mol. Brain 5, 35.
Jiang, H., Ren, Y., Yuen, E.Y., Zhong, P., Ghaedi, M., Hu, Z., Azab-
daftari, G., Nakaso, K., Yan, Z., and Feng, J. (2012). Parkin controls
dopamine utilization in human midbrain dopaminergic neurons
derived from induced pluripotent stem cells. Nat Commun 3, 668.
Johns, D.R. (1995). Seminars in medicine of the Beth Israel Hospi-
tal, Boston. Mitochondrial DNA and disease. N. Engl. J. Med. 333,
638–644.
Kim, Y., Park, J., Kim, S., Song, S., Kwon, S.K., Lee, S.H., Kitada, T.,
Kim, J.M., and Chung, J. (2008). PINK1 controls mitochondrial
localization of Parkin through direct phosphorylation. Biochem.
Biophys. Res. Commun. 377, 975–980.
Kitada, T., Asakawa, S., Hattori, N., Matsumine, H., Yamamura, Y.,
Minoshima, S., Yokochi, M., Mizuno, Y., and Shimizu, N. (1998).
Mutations in the parkin gene cause autosomal recessive juvenile
parkinsonism. Nature 392, 605–608.
Kruger, R., Kuhn,W.,Muller, T.,Woitalla, D., Graeber, M., Kosel, S.,
Przuntek, H., Epplen, J.T., Schols, L., and Riess, O. (1998). Ala30Pro
mutation in the gene encoding alpha-synuclein in Parkinson’s
disease. Nat. Genet. 18, 106–108.
Lee, Y.J., Jeong, S.Y., Karbowski, M., Smith, C.L., and Youle, R.J.
(2004). Roles of the mammalian mitochondrial fission and fusion
mediators Fis1, Drp1, and Opa1 in apoptosis. Mol. Biol. Cell 15,
5001–5011.
Lim, K.L., Chew, K.C., Tan, J.M., Wang, C., Chung, K.K., Zhang, Y.,
Tanaka, Y., Smith, W., Engelender, S., Ross, C.A., et al. (2005). Par-
kin mediates nonclassical, proteasomal-independent ubiquitina-
tion of synphilin-1: implications for Lewy body formation.
J. Neurosci. 25, 2002–2009.
Lin, T.K., Cheng, C.H., Chen, S.D., Liou, C.W., Huang, C.R., and
Chuang, Y.C. (2012). Mitochondrial Dysfunction and Oxidative
Stress Promote Apoptotic Cell Death in the Striatum via Cyto-
chrome c/Caspase-3 Signaling Cascade Following Chronic Rote-
none Intoxication in Rats. Int. J. Mol. Sci. 13, 8722–8739.
Liu, Q., Pedersen, O.Z., Peng, J., Couture, L.A., Rao,M.S., and Zeng,
X. (2013). Optimizing dopaminergic differentiation of pluripotent
stem cells for the manufacture of dopaminergic neurons for trans-
plantation. Cytotherapy 15, 999–1010.
Mom�cilovi�c, O., Liu, Q., Swistowski, A., Russo-Tait, T., Zhao, Y.,
Rao, M.S., and Zeng, X. (2014). Genome wide profiling of dopami-
nergic neurons derived from human embryonic and induced
pluripotent stem cells. Stem Cells Dev. 23, 406–420.
Mortiboys, H., Thomas, K.J., Koopman, W.J., Klaffke, S., Abou-
Sleiman, P., Olpin, S., Wood, N.W., Willems, P.H., Smeitink, J.A.,
Cookson, M.R., and Bandmann, O. (2008). Mitochondrial func-
tion and morphology are impaired in parkin-mutant fibroblasts.
Ann. Neurol. 64, 555–565.
Panov, A., Dikalov, S., Shalbuyeva, N., Taylor, G., Sherer, T., and
Greenamyre, J.T. (2005). Rotenone model of Parkinson disease:
multiple brain mitochondria dysfunctions after short term sys-
temic rotenone intoxication. J. Biol. Chem. 280, 42026–42035.
Pavletich, N.P., and Pabo, C.O. (1991). Zinc finger-DNA recogni-
tion: crystal structure of a Zif268-DNA complex at 2.1 A. Science
252, 809–817.
Perier, C., Bender, A., Garcıa-Arumı, E., Melia, M.J., Bove, J., Laub,
C., Klopstock, T., Elstner, M., Mounsey, R.B., Teismann, P., et al.
(2013). Accumulation of mitochondrial DNA deletions within
dopaminergic neurons triggers neuroprotective mechanisms.
Brain 136, 2369–2378.
12 Stem Cell Reports j Vol. 4 j 1–13 j May 12, 2015 j ª2015 The Authors
Please cite this article in press as: Shaltouki et al., Mitochondrial Alterations by PARKIN in Dopaminergic Neurons Using PARK2 Patient-Specific and PARK2 Knockout Isogenic iPSC Lines, Stem Cell Reports (2015), http://dx.doi.org/10.1016/j.stemcr.2015.02.019

Polymeropoulos,M.H., Lavedan, C., Leroy, E., Ide, S.E., Dehejia, A.,
Dutra, A., Pike, B., Root, H., Rubenstein, J., Boyer, R., et al. (1997).
Mutation in the alpha-synuclein gene identified in families with
Parkinson’s disease. Science 276, 2045–2047.
Reeve, A., Meagher, M., Lax, N., Simcox, E., Hepplewhite, P., Jaros,
E., and Turnbull, D. (2013). The impact of pathogenic mitochon-
drial DNA mutations on substantia nigra neurons. J. Neurosci.
33, 10790–10801.
Rothfuss, O., Fischer, H., Hasegawa, T., Maisel, M., Leitner, P.,
Miesel, F., Sharma, M., Bornemann, A., Berg, D., Gasser, T., and
Patenge, N. (2009). Parkin protects mitochondrial genome integ-
rity and supports mitochondrial DNA repair. Hum. Mol. Genet.
18, 3832–3850.
Schapira, A.H., Cooper, J.M., Dexter, D., Jenner, P., Clark, J.B., and
Marsden, C.D. (1989). Mitochondrial complex I deficiency in
Parkinson’s disease. Lancet 1, 1269.
Sherer, T.B., Betarbet, R., Testa, C.M., Seo, B.B., Richardson, J.R.,
Kim, J.H., Miller, G.W., Yagi, T., Matsuno-Yagi, A., and Greena-
myre, J.T. (2003a). Mechanism of toxicity in rotenone models of
Parkinson’s disease. J. Neurosci. 23, 10756–10764.
Sherer, T.B., Kim, J.H., Betarbet, R., and Greenamyre, J.T. (2003b).
Subcutaneous rotenone exposure causes highly selective dopami-
nergic degeneration and alpha-synuclein aggregation. Exp.
Neurol. 179, 9–16.
Shiba-Fukushima, K., Imai, Y., Yoshida, S., Ishihama, Y., Kanao, T.,
Sato, S., and Hattori, N. (2012). PINK1-mediated phosphorylation
of the Parkin ubiquitin-like domain primes mitochondrial translo-
cation of Parkin and regulates mitophagy. Sci Rep 2, 1002.
Singleton, A.B., Farrer, M., Johnson, J., Singleton, A., Hague, S.,
Kachergus, J., Hulihan, M., Peuralinna, T., Dutra, A., Nussbaum,
R., et al. (2003). alpha-Synuclein locus triplication causes Parkin-
son’s disease. Science 302, 841.
Sulzer, D. (2007). Multiple hit hypotheses for dopamine neuron
loss in Parkinson’s disease. Trends Neurosci. 30, 244–250.
Swistowski, A., Peng, J., Han, Y., Swistowska, A.M., Rao, M.S., and
Zeng, X. (2009). Xeno-free defined conditions for culture of
human embryonic stem cells, neural stem cells and dopaminergic
neurons derived from them. PLoS ONE 4, e6233.
Tanaka, K., Suzuki, T., Hattori, N., and Mizuno, Y. (2004).
Ubiquitin, proteasome and parkin. Biochim. Biophys. Acta 1695,
235–247.
Testa, C.M., Sherer, T.B., and Greenamyre, J.T. (2005). Rotenone
induces oxidative stress and dopaminergic neuron damage in orga-
notypic substantia nigra cultures. Brain Res. Mol. Brain Res. 134,
109–118.
Tsai, Y.C., Fishman, P.S., Thakor, N.V., and Oyler, G.A. (2003). Par-
kin facilitates the elimination of expanded polyglutamine proteins
and leads to preservation of proteasome function. J. Biol. Chem.
278, 22044–22055.
Urnov, F.D., Rebar, E.J., Holmes, M.C., Zhang, H.S., and Gregory,
P.D. (2010). Genome editingwith engineered zinc finger nucleases.
Nat. Rev. Genet. 11, 636–646.
van der Bliek, A.M., Shen, Q., and Kawajiri, S. (2013). Mechanisms
of mitochondrial fission and fusion. Cold Spring Harb. Perspect.
Biol. 5.
Vila, M., Ramonet, D., and Perier, C. (2008). Mitochondrial
alterations in Parkinson’s disease: new clues. J. Neurochem. 107,
317–328.
Wang, T., Choi, E., Monaco, M.C., Campanac, E., Medynets, M.,
Do, T., Rao, P., Johnson, K.R., Elkahloun, A.G., Von Geldern, G.,
et al. (2013). Derivation of neural stem cells from human adult
peripheral CD34+ cells for an autologous model of neuroinflam-
mation. PLoS ONE 8, e81720.
Wei, Y.H. (1998). Mitochondrial DNA mutations and oxidative
damage in aging and diseases: an emerging paradigm of geron-
tology and medicine. Proc. Natl. Sci. Counc. Repub. China B 22,
55–67.
Wong, A., and Cortopassi, G. (2002). Reproducible quantitative
PCR of mitochondrial and nuclear DNA copy number using the
LightCycler. Methods Mol. Biol. 197, 129–138.
Yadava, N., and Nicholls, D.G. (2007). Spare respiratory capacity
rather than oxidative stress regulates glutamate excitotoxicity after
partial respiratory inhibition of mitochondrial complex I with
rotenone. J. Neurosci. 27, 7310–7317.
Yang,W.,Mills, J.A., Sullivan, S., Liu, Y., French,D.L., andGadue, P.
(2008). iPSC Reprogramming fromHuman Peripheral Blood Using
Sendai Virus Mediated Gene Transfer. http://www.stembook.org/
sites/default/files/protocols/iPSC_Reprogramming_from_Human_
Peripheral_Blood_0.pdf.
Zarranz, J.J., Alegre, J., Gomez-Esteban, J.C., Lezcano, E., Ros, R.,
Ampuero, I., Vidal, L., Hoenicka, J., Rodriguez, O., Atares, B.,
et al. (2004). The new mutation, E46K, of alpha-synuclein causes
Parkinson and Lewy body dementia. Ann. Neurol. 55, 164–173.
Zeng, X., Chen, J., Sanchez, J.F., Coggiano, M., Dillon-Carter, O.,
Petersen, J., and Freed, W.J. (2003). Stable expression of hrGFP by
mouse embryonic stem cells: promoter activity in the undifferen-
tiated state and during dopaminergic neural differentiation. Stem
Cells 21, 647–653.
Zeng, X., Hunsberger, J.G., Simeonov, A., Malik, N., Pei, Y., and
Rao, M. (2014). Concise review: modeling central nervous system
diseases using induced pluripotent stem cells. Stem Cells Transl
Med 3, 1418–1428.
Zhang, Y.,Ma,H., Xie, B., Han, C.,Wang, C., Qing,H., andDeng, Y.
(2013). Alpha-synuclein overexpression induced mitochondrial
damage by the generation of endogenous neurotoxins in PC12
cells. Neurosci. Lett. 547, 65–69.
Stem Cell Reports j Vol. 4 j 1–13 j May 12, 2015 j ª2015 The Authors 13
Please cite this article in press as: Shaltouki et al., Mitochondrial Alterations by PARKIN in Dopaminergic Neurons Using PARK2 Patient-Specific and PARK2 Knockout Isogenic iPSC Lines, Stem Cell Reports (2015), http://dx.doi.org/10.1016/j.stemcr.2015.02.019