a cross-country analysis of spatial-relational proximities
TRANSCRIPT
agriculture
Article
Know the Farmer That Feeds You: A Cross-Country Analysis ofSpatial-Relational Proximities and the Attractiveness ofCommunity Supported Agriculture
Christina Gugerell 1,* , Takeshi Sato 2, Christine Hvitsand 3 , Daichi Toriyama 2, Nobuhiro Suzuki 2
and Marianne Penker 1
�����������������
Citation: Gugerell, C.; Sato, T.;
Hvitsand, C.; Toriyama, D.; Suzuki,
N.; Penker, M. Know the Farmer That
Feeds You: A Cross-Country Analysis
of Spatial-Relational Proximities and
the Attractiveness of Community
Supported Agriculture. Agriculture
2021, 11, 1006. https://doi.org/
10.3390/agriculture11101006
Academic Editors: José
Luis Vicente-Vicente,
Cristina Quintas-Soriano and
María D. López-Rodríguez
Received: 16 August 2021
Accepted: 7 October 2021
Published: 14 October 2021
Publisher’s Note: MDPI stays neutral
with regard to jurisdictional claims in
published maps and institutional affil-
iations.
Copyright: © 2021 by the authors.
Licensee MDPI, Basel, Switzerland.
This article is an open access article
distributed under the terms and
conditions of the Creative Commons
Attribution (CC BY) license (https://
creativecommons.org/licenses/by/
4.0/).
1 Department of Economics and Social Sciences, Institute for Sustainable Economic Development,University of Natural Resources and Life Sciences, Vienna, 1180 Vienna, Austria;[email protected]
2 Department of Global Agricultural Sciences, University of Tokyo, Tokyo 113-8654, Japan;[email protected] (T.S.); [email protected] (D.T.);[email protected] (N.S.)
3 Faculty of Biosciences, Norwegian University of Life Sciences, 1432 Ås, Norway; [email protected]* Correspondence: [email protected]; Tel.: +436-641-308-606
Abstract: While food production and consumption processes worldwide are characterized by geo-graphical and social distance, alternative food networks aim to reconnect producers and consumers.Our study proposes a framework to distinguish multiple dimensions of proximity in the contextof Community Supported Agriculture (a type of alternative food network) and to quantitativelyevaluate them. In a principal component analysis, we aggregated various detailed proximity itemsfrom a multinational survey using principal component analysis and examined their relationshipwith the attractiveness of Community Supported Agriculture in a multiple regression analysis. Ourfindings highlight the importance of relational proximity and thus of increasing trust, collaboration,and the sharing of values and knowledge within and across organizations in the food system. Ratherthan focusing on spatial proximity, increasing relational proximity might support alternative foodnetworks, such as Community Supported Agriculture.
Keywords: community supported agriculture; alternative food networks; spatial proximity;relational proximity; cross-national case study
1. Introduction
The current agricultural and food industry is based on labor division and connectscompanies in different regions, countries, and sometimes also continents [1]. As a result,production and consumption processes often take place at a great geographical and so-cial distance [2]. Alternative food networks (AFNs) aim to overcome this distance byanchoring food in its socio-ecological context and thus promote direct producer-consumerrelationships [3,4]. AFNs therefore pose an alternative to the mainstream, industrial foodsystem [3,5]. Community Supported Agriculture (CSA) is a food production and distri-bution model in which farming responsibilities, risks, and rewards are shared betweenfarmers and consumers [6]. They have mainly been established in or close to urban areas,where people are more spatially separated and alienated from food production than peoplein rural areas [7,8].
Previous research on AFNs has pointed especially to the importance of spatial dynam-ics and the essential role of place in building alternative food systems [9,10], as well as thesocio-cultural embeddedness of food in local relations of food provision [3,11]. Therefore,scholars highlighted the positive effects of local contexts on social ties and innovationprocesses [3]. However, food system actors are interconnected due to various spatial–relational configurations [12]. Close producer–consumer relations may also be performed
Agriculture 2021, 11, 1006. https://doi.org/10.3390/agriculture11101006 https://www.mdpi.com/journal/agriculture
Agriculture 2021, 11, 1006 2 of 20
“at a distance” [13–15]. To provide an attractive alternative to conventional food provision,AFNs aim to rebuild production and consumption processes [5].
In this context, we find it purposeful to utilize the term “proximity” and Boschma’s [16]differentiation between relational (i.e., social, cognitive, institutional, and organizational)proximity and spatial (i.e., geographical) proximity dimensions [16,17]. Using the proximityconcept could be one way to expand our knowledge of what makes AFNs, such as CSAs,attractive, and to better understand what constitutes attractive relationships betweenCSA members (i.e., consumers and producers) and between CSA members and society ingeneral [16,18].
While CSA literature [19,20] highlights implications of geographical proximity, to ourknowledge, only one study related Boschma’s [16] broader perspective on proximitydimensions to CSAs [21]. However, in an ever-evolving body of knowledge, criticalquestions on various spatial–relational configurations associated with AFNs are beingdebated [15,22–25]. With respect to CSAs, this includes motivations to join the CSAscheme [26–30], challenges CSAs face in retaining members [31–34], the institutionalizationof CSA principles [35] and up-scaling processes [36,37], as well as the extent to which CSAssucceed in creating an alternative to conventional practices in the market [3]. Furthermore,the appeal of CSAs has been investigated in previous studies [38–41]. Interrelating the latterto the different dimensions of spatial and relational proximity configurations promisesnew insights for better understanding the role of spatial–relational proximity for theattractiveness of CSA and other AFNs. Thus, we also hope to gain some insights into whatfactors should be used to promote AFNs—a knowledge gap that has been attributed totheir recentness [25].
More generally, we want to contribute to relational rural sociology. In theory, human-to-human relations and relations between humans and their bio-physical context (farm,land, infrastructure) are well debated (for an overview, see [42]). However, the relationalperspective still poses various methodological challenges, such as shifting the analyticalattention from nodes, objects, and subjects to their relations [42]. Taking the example ofCSA, we want to demonstrate that proximity theory can help to operationalize geograph-ical, social, cognitive, institutional, and organizational relations of CSA members withtheir social and bio-physical contexts using a quantitative multi-variate analysis and thuscomplement Actor–Network Theory, providing graphical or visceral methods that help toempirically analyze human-to-human, human–technology, or human–nature relations [42].
Our literature analysis revealed that there are hardly any studies quantitatively differ-entiating between spatial–relational proximity dimensions and their role in AFN attractive-ness. Taking the example of CSA, an AFN implemented in different parts of the world, thisstudy examines the interrelation of spatial–relational proximity with CSA’s attractiveness.CSA attractiveness has been investigated in several studies, but, to our knowledge, notyet regarding different proximity dimensions. More generally, the measurement of orga-nizational attraction dates back to early research, such as Vroom [43], who measured theattractiveness of different organizations to potential job seekers using a single item. A fewyears later, Singh [44] applied information integration theory to organization choice usinga single item that assessed the likelihood of accepting a job with the company. We assumethat organizational attractiveness can also help to understand the membership in non-profitorganizations, such as CSAs. Recent studies have analyzed member satisfaction withinCSAs [38–41]. In the literature, CSA attractiveness and satisfaction have been measuredwith single items, so there is no multi-item attractiveness scale yet.
The empirical analysis is based on data from several countries. We selected Austria,Japan, and Norway for this cross-national case study, as their national CSA movements havedeveloped differently. However, the organization of CSA movements in these countries issimilar (see Section 3 for further justification of study sites).
By interviewing CSA members in different (peri-)urban contexts, we aim to under-stand better the relevance of proximity dimensions for the attractiveness of the CSA model.We distinguish between spatial and relational proximity among CSA members (CSA-
Agriculture 2021, 11, 1006 3 of 20
internal proximity) as well as between CSA members and CSA-external actors, structures,and resources (CSA-external proximity). The central research question of our study is: Howare spatial and relational proximity within and outside CSAs related to the attractiveness ofCSAs in (peri-)urban contexts? Based on proximity and the CSA literature (see Section 2),we hypothesize that there is a positive correlation between all dimensions of social prox-imity and attractiveness, except for institutional and organizational proximity to externalactors (as members may seek to distance themselves from dominant food organizationsand deviate from prevailing rules and standards).
This paper is structured as follows. First, we briefly review proximity literature andpresent assumptions about proximity and CSAs (Section 2). We then describe our researchdesign and data collection process in Section 3. In Section 4, we create proximity variablesusing principal components analysis. In a multiple linear regression, we analyze theinterrelation between these proximity variables and CSA attractiveness. Section 5 discussesthe results and the limitations of the study. Finally, in Section 6, we conclude the paper byhighlighting its empirical and methodological contributions.
2. Theoretical Background on Proximity and Operationalization for CSA
Theoretical definitions of proximity dimensions have been proposed by scholars [16,45,46]aiming to understand the coordination of economic activities. Boschma [16] differentiatedbetween five dimensions of proximity: geographical proximity (i.e., spatial proximity),as well as social, institutional, cognitive, and organizational proximity. The latter fourcan be subsumed under the umbrella of relational proximity (i.e., non-spatial proximity),because they conceptually overlap (i.e., they are intangible dimensions based on affinityand similarity) and often coexist in practice [47]. The five proximity dimensions were lateradapted to the field of sustainability innovation [48]. The sustainability of AFNs, such asCSAs, has been addressed in previous studies [49–51]. The CSA concept represents analternative, sustainability-oriented model of food provision that addresses social justice,community, and environmental sustainability. Thus, we conceptualize CSA as a social inno-vation [52,53]. While previous scholars have examined proximity dimensions with a focuson innovation [16], this paper analyzes the exploratory value of proximity dimensions forCSA attractiveness. Since proximity dimensions have not previously been operationalizedfor analyzing CSA attractiveness, we ground our assumptions on a broader base in theliterature on proximity and CSA.
Scholars associate geographical proximity with physical distance between actors [16,48]and local availability of natural resources [48]. Cognitive proximity is understood as abase of knowledge, competence, and expectation shared between actors. Knowledge andexpectations that lead to the emergence of innovations need to be shared to create a mutualunderstanding between actors [16,48]. Social proximity is defined by trust-building activi-ties between actors. Mutual trust based on friendship, kinship, and mutual experience is aprerequisite for collaborations before knowledge or resources are deployed between ac-tors [16,48]. Institutional proximity refers to the similarity of contextual rules, norms,and values, e.g., the similarities of actors to external institutions, such as prevailingrules and regulations within a system (i.e., the rules and regulations by which actorsplay) [16,48,54]. Finally, organizational proximity refers to the extent to which relation-ships are shared among actors in a formal, organizational arrangement, including thedegree of autonomy and control under which actors can experiment and share knowl-edge [16,48]. The different proximity dimensions may support, complement, or replaceeach other [55,56]. Thus, the occurrence of relational proximity could replace the needfor geographical proximity as a precondition for experimentation and learning. Further-more, social proximity complemented by cognitive proximity can support the transmissionof “value-laden information” between actors without the need to enforce external stan-dards [22]. However, previous studies point to the positive effects of proximity whileneglecting the potential impediments that arise from it [48]. Thus, geographic proximitymight constrain organizations in accessing land and resources and in competing with other
Agriculture 2021, 11, 1006 4 of 20
local actors. While institutional proximity of alternative (e.g., social) innovations to prevail-ing food system structures could promote effective cross-level learning and coordination,being too rule-bound could hinder experimentation [48]. The greater the trust relationshipswithin or between actors, the less organizational control is required by or between actors.However, tendencies toward excessive trust between actors can also be detrimental to theircollaboration [48].
Due to their complementary, substitutive, and supporting nature, the analytically clearlydelineated proximity dimensions can be quite messy in real-life and therefore difficult to mea-sure empirically. Therefore, we opted for an explorative approach (see Section 3.1). Based onprevious definitions by scholars [16,48,54] and interpretations of proximity dimensions inthe context of CSAs [21], we operationalized social, cognitive, institutional, organizational,and geographical proximity:
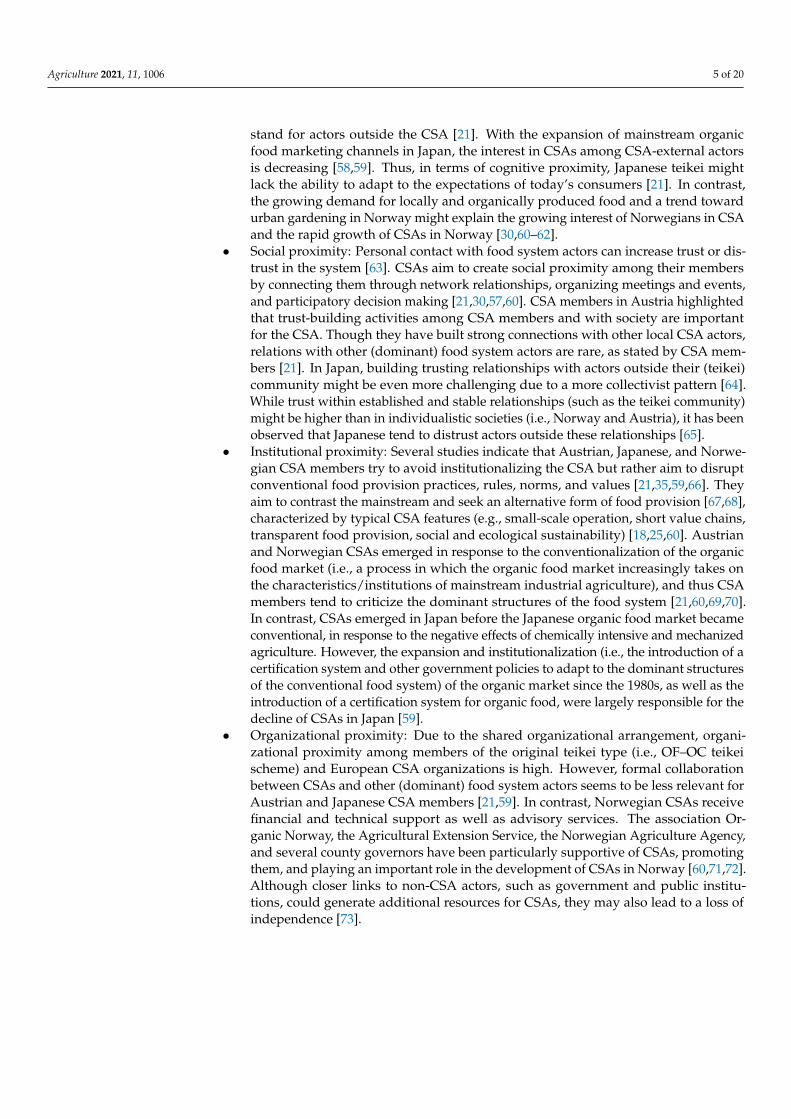
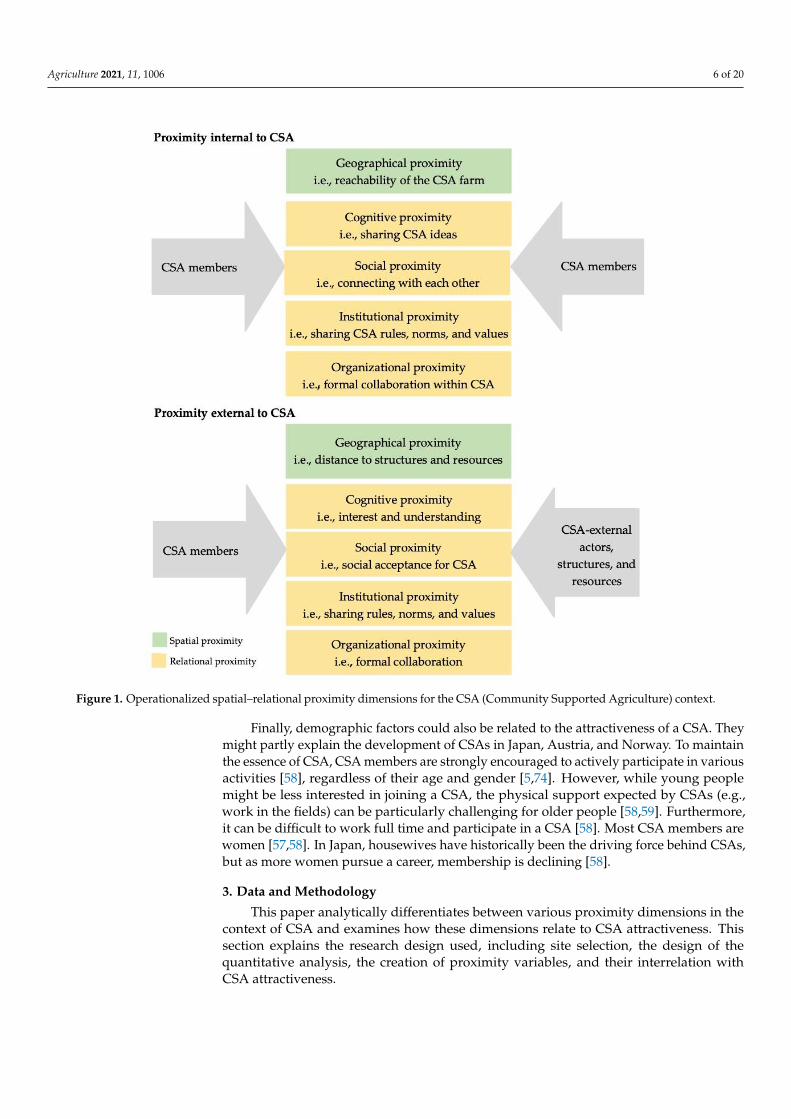
• Operationalization of geographical proximity: The spatial distance among CSA mem-bers (i.e., their access to the CSA farm) (CSA-internal) and the local availability ofresources and structures for the CSA farm (e.g., farmland, urban area, infrastructure)(CSA-external) [16,21,48].
• Operationalization of cognitive proximity: The degree to which CSA members em-pathize with CSA ideas and thus share knowledge, competence, and expectations withrespect to CSAs (CSA-internal), and, as CSA-external actors, the degree of interest inand understanding of the CSA model (CSA-external) [16,21,48].
• Operationalization of social proximity: The degree of connections among CSA mem-bers (i.e., their trust in each other) (CSA-internal) and societal acceptance (i.e., attitudes)between CSA members and CSA-external actors (CSA-external) [16,21,48].
• Operationalization of institutional proximity: The extent to which CSA rules, norms,and values are shared among CSA members (CSA-internal), and the similarities of theCSA institutions to external, prevailing food system institutions (i.e., production andmarket mechanisms of dominant food system actors) (CSA-external) [16,21,48,54].
• Operationalization of organizational proximity: The degree to which the CSA mem-bers are connected to other CSA members (CSA-internal) and CSA-external actors(CSA-external) in a formal, organizational arrangement [16,21,48].
Figure 1 illustrates the operationalization of spatial and relational proximity dimen-sions in the context of CSAs. The figure differentiates between CSA-internal proximity(i.e., arrows illustrating proximity among CSA members) and CSA-external proximity(i.e., arrows illustrating proximity between CSA members and CSA-external actors, struc-tures, and resources).
Operationalizing the proximity dimensions for the CSA context and a literature reviewon CSAs in Austria, Japan, Norway, and beyond helped to make assumptions about howthe different proximity dimensions might affect CSAs and their attractiveness in thesecountries. This review also helped to tailor the statements and questions for the cross-national contexts (see Section 3.1).
• Geographical proximity: In general, CSAs seem to face a trade-off between the loca-tional advantages of rural and urban areas. While CSAs target affordable access tobiophysically suitable farmland that is predominantly located in rural areas, a CSAwhich has a location in or near a city with mainly urban CSA consumers represents alocational advantage (e.g., access to public transportation, infrastructure, networkingopportunities) [21]. Thus, by being close to rural and urban areas, a CSA could stimu-late a mutual understanding (i.e., cognitive proximity) between people in rural andurban areas (see next point) [30].
• Cognitive proximity: CSA members in Austria share knowledge, competence,and expectations of CSA ideas (e.g., pricing based on self-assessment) with eachother, and therefore predominantly connect with individuals already connected to theCSA community (i.e., members of other CSA initiatives) [21]. CSA members’ empa-thy for CSA ideas promotes their endorsement of the CSA [57]. However, AustrianCSA members raised the concern that CSA ideas might be too difficult to under-
Agriculture 2021, 11, 1006 5 of 20
stand for actors outside the CSA [21]. With the expansion of mainstream organicfood marketing channels in Japan, the interest in CSAs among CSA-external actorsis decreasing [58,59]. Thus, in terms of cognitive proximity, Japanese teikei mightlack the ability to adapt to the expectations of today’s consumers [21]. In contrast,the growing demand for locally and organically produced food and a trend towardurban gardening in Norway might explain the growing interest of Norwegians in CSAand the rapid growth of CSAs in Norway [30,60–62].
• Social proximity: Personal contact with food system actors can increase trust or dis-trust in the system [63]. CSAs aim to create social proximity among their membersby connecting them through network relationships, organizing meetings and events,and participatory decision making [21,30,57,60]. CSA members in Austria highlightedthat trust-building activities among CSA members and with society are importantfor the CSA. Though they have built strong connections with other local CSA actors,relations with other (dominant) food system actors are rare, as stated by CSA mem-bers [21]. In Japan, building trusting relationships with actors outside their (teikei)community might be even more challenging due to a more collectivist pattern [64].While trust within established and stable relationships (such as the teikei community)might be higher than in individualistic societies (i.e., Norway and Austria), it has beenobserved that Japanese tend to distrust actors outside these relationships [65].
• Institutional proximity: Several studies indicate that Austrian, Japanese, and Norwe-gian CSA members try to avoid institutionalizing the CSA but rather aim to disruptconventional food provision practices, rules, norms, and values [21,35,59,66]. Theyaim to contrast the mainstream and seek an alternative form of food provision [67,68],characterized by typical CSA features (e.g., small-scale operation, short value chains,transparent food provision, social and ecological sustainability) [18,25,60]. Austrianand Norwegian CSAs emerged in response to the conventionalization of the organicfood market (i.e., a process in which the organic food market increasingly takes onthe characteristics/institutions of mainstream industrial agriculture), and thus CSAmembers tend to criticize the dominant structures of the food system [21,60,69,70].In contrast, CSAs emerged in Japan before the Japanese organic food market becameconventional, in response to the negative effects of chemically intensive and mechanizedagriculture. However, the expansion and institutionalization (i.e., the introduction of acertification system and other government policies to adapt to the dominant structuresof the conventional food system) of the organic market since the 1980s, as well as theintroduction of a certification system for organic food, were largely responsible for thedecline of CSAs in Japan [59].
• Organizational proximity: Due to the shared organizational arrangement, organi-zational proximity among members of the original teikei type (i.e., OF–OC teikeischeme) and European CSA organizations is high. However, formal collaborationbetween CSAs and other (dominant) food system actors seems to be less relevant forAustrian and Japanese CSA members [21,59]. In contrast, Norwegian CSAs receivefinancial and technical support as well as advisory services. The association Or-ganic Norway, the Agricultural Extension Service, the Norwegian Agriculture Agency,and several county governors have been particularly supportive of CSAs, promotingthem, and playing an important role in the development of CSAs in Norway [60,71,72].Although closer links to non-CSA actors, such as government and public institu-tions, could generate additional resources for CSAs, they may also lead to a loss ofindependence [73].
Agriculture 2021, 11, 1006 6 of 20Agriculture 2021, 11, 1006 5 of 21
Figure 1. Operationalized spatial–relational proximity dimensions for the CSA (Community Sup-ported Agriculture) context.
Operationalizing the proximity dimensions for the CSA context and a literature re-view on CSAs in Austria, Japan, Norway, and beyond helped to make assumptions about how the different proximity dimensions might affect CSAs and their attractiveness in these countries. This review also helped to tailor the statements and questions for the cross-national contexts (see Section 3.1). Geographical proximity: In general, CSAs seem to face a trade-off between the loca-
tional advantages of rural and urban areas. While CSAs target affordable access to biophysically suitable farmland that is predominantly located in rural areas, a CSA which has a location in or near a city with mainly urban CSA consumers represents a locational advantage (e.g., access to public transportation, infrastructure, network-ing opportunities) [21]. Thus, by being close to rural and urban areas, a CSA could stimulate a mutual understanding (i.e., cognitive proximity) between people in rural and urban areas (see next point) [30].
Cognitive proximity: CSA members in Austria share knowledge, competence, and expectations of CSA ideas (e.g., pricing based on self-assessment) with each other, and therefore predominantly connect with individuals already connected to the CSA
Figure 1. Operationalized spatial–relational proximity dimensions for the CSA (Community Supported Agriculture) context.
Finally, demographic factors could also be related to the attractiveness of a CSA. Theymight partly explain the development of CSAs in Japan, Austria, and Norway. To maintainthe essence of CSA, CSA members are strongly encouraged to actively participate in variousactivities [58], regardless of their age and gender [5,74]. However, while young peoplemight be less interested in joining a CSA, the physical support expected by CSAs (e.g.,work in the fields) can be particularly challenging for older people [58,59]. Furthermore,it can be difficult to work full time and participate in a CSA [58]. Most CSA members arewomen [57,58]. In Japan, housewives have historically been the driving force behind CSAs,but as more women pursue a career, membership is declining [58].
3. Data and Methodology
This paper analytically differentiates between various proximity dimensions in thecontext of CSA and examines how these dimensions relate to CSA attractiveness. Thissection explains the research design used, including site selection, the design of thequantitative analysis, the creation of proximity variables, and their interrelation withCSA attractiveness.
Agriculture 2021, 11, 1006 7 of 20
3.1. Site Selection
We applied the proximity framework in three very different national contexts. Draw-ing on a literature review, Internet research, and informal talks with CSA coordinators,we selected six CSAs in Austria, Japan, and Norway because they share organizationalsimilarities, even though CSA development paths differ in these countries.
CSA has its origins in various countries. One of them is Japan, where the CSAmovement, also known as teikei, originated in 1971 [75]. In Japan, there are differenttypes of teikei schemes, ranging from associations with 20–30 households and a singlefarm to hundreds or thousands of households and multiple farmers [75]. Most of today’steikei systems trade agricultural products to individual consumers who are not organized(e.g., farmers delivering vegetable boxes to consumers). Hence, they require little or noconsumer participation (e.g., for agricultural and delivery labor) [75–77]. The original formof teikei, consisting of a group of organized farmers and consumers (OF–OC teikei scheme),experienced rapid growth until the 1980s (there were about 238 teikeis in 1990) [58,77].Since then, it has gradually lost popularity, especially among younger families [58], and in2019, there were only about ten active OF–OC teikei schemes [78]. This study focuses onlyon the OF–OC teikei scheme, as its formal arrangement is similar to the CSA schemes inAustria and Norway.
Austria experienced an increase in CSAs in the first years after the introduction of CSAin 2011. However, CSA in Austria developed late and slowly compared to other countriesin Europe and beyond [6,67,79]. In 2020, there were approximately 30 CSA organizations inAustria [66]. The development of CSAs in Austria has been stagnating in recent years [21].
In contrast, the popularity of CSAs in Norway, a non-EU country, has grown rapidlysince their initial introduction in 2006 [60]. It is expected that their popularity will continueto grow [62]. In Norway, the number of registered CSAs reached 92 in 2020 [72].
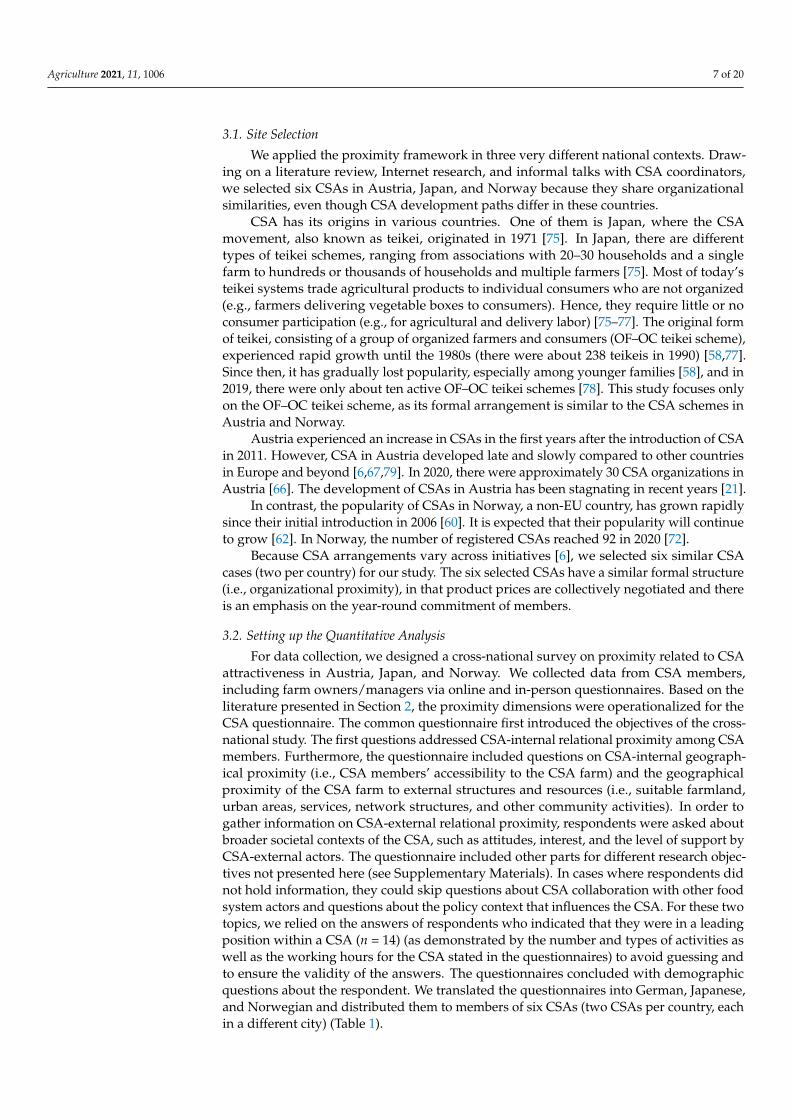
Because CSA arrangements vary across initiatives [6], we selected six similar CSAcases (two per country) for our study. The six selected CSAs have a similar formal structure(i.e., organizational proximity), in that product prices are collectively negotiated and thereis an emphasis on the year-round commitment of members.
3.2. Setting up the Quantitative Analysis
For data collection, we designed a cross-national survey on proximity related to CSAattractiveness in Austria, Japan, and Norway. We collected data from CSA members,including farm owners/managers via online and in-person questionnaires. Based on theliterature presented in Section 2, the proximity dimensions were operationalized for theCSA questionnaire. The common questionnaire first introduced the objectives of the cross-national study. The first questions addressed CSA-internal relational proximity among CSAmembers. Furthermore, the questionnaire included questions on CSA-internal geograph-ical proximity (i.e., CSA members’ accessibility to the CSA farm) and the geographicalproximity of the CSA farm to external structures and resources (i.e., suitable farmland,urban areas, services, network structures, and other community activities). In order togather information on CSA-external relational proximity, respondents were asked aboutbroader societal contexts of the CSA, such as attitudes, interest, and the level of support byCSA-external actors. The questionnaire included other parts for different research objec-tives not presented here (see Supplementary Materials). In cases where respondents didnot hold information, they could skip questions about CSA collaboration with other foodsystem actors and questions about the policy context that influences the CSA. For these twotopics, we relied on the answers of respondents who indicated that they were in a leadingposition within a CSA (n = 14) (as demonstrated by the number and types of activities aswell as the working hours for the CSA stated in the questionnaires) to avoid guessing andto ensure the validity of the answers. The questionnaires concluded with demographicquestions about the respondent. We translated the questionnaires into German, Japanese,and Norwegian and distributed them to members of six CSAs (two CSAs per country, eachin a different city) (Table 1).
Agriculture 2021, 11, 1006 8 of 20
Table 1. Selected CSAs and number of respondents in Austria, Japan and Norway.
Country (Peri-)urban Areas CSA Members Surveys(n = 209)
OrganizationalSimilarities
AustriaVienna About 300 51 Collective price
negotiation;
Year-round commitment ofmembers;
Participative decision-makingprocesses
Graz About 100 27
Norway Sandefjord About 140 39Porsgrunn About 120 49
Japan Tokyo About 40 25Tsukuba About 40 18
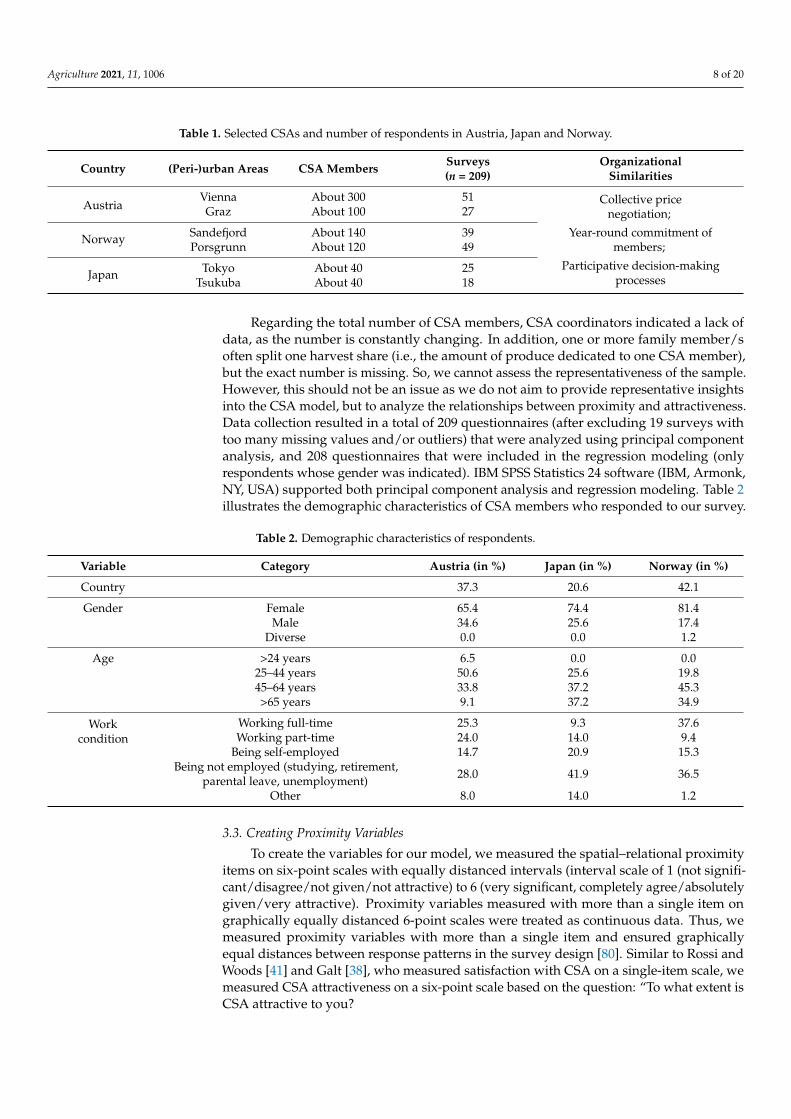
Regarding the total number of CSA members, CSA coordinators indicated a lack ofdata, as the number is constantly changing. In addition, one or more family member/soften split one harvest share (i.e., the amount of produce dedicated to one CSA member),but the exact number is missing. So, we cannot assess the representativeness of the sample.However, this should not be an issue as we do not aim to provide representative insightsinto the CSA model, but to analyze the relationships between proximity and attractiveness.Data collection resulted in a total of 209 questionnaires (after excluding 19 surveys withtoo many missing values and/or outliers) that were analyzed using principal componentanalysis, and 208 questionnaires that were included in the regression modeling (onlyrespondents whose gender was indicated). IBM SPSS Statistics 24 software (IBM, Armonk,NY, USA) supported both principal component analysis and regression modeling. Table 2illustrates the demographic characteristics of CSA members who responded to our survey.
Table 2. Demographic characteristics of respondents.
Variable Category Austria (in %) Japan (in %) Norway (in %)
Country 37.3 20.6 42.1
Gender Female 65.4 74.4 81.4Male 34.6 25.6 17.4
Diverse 0.0 0.0 1.2
Age >24 years 6.5 0.0 0.025–44 years 50.6 25.6 19.845–64 years 33.8 37.2 45.3>65 years 9.1 37.2 34.9
Workcondition
Working full-time 25.3 9.3 37.6Working part-time 24.0 14.0 9.4
Being self-employed 14.7 20.9 15.3Being not employed (studying, retirement,
parental leave, unemployment) 28.0 41.9 36.5
Other 8.0 14.0 1.2
3.3. Creating Proximity Variables
To create the variables for our model, we measured the spatial–relational proximityitems on six-point scales with equally distanced intervals (interval scale of 1 (not signifi-cant/disagree/not given/not attractive) to 6 (very significant, completely agree/absolutelygiven/very attractive). Proximity variables measured with more than a single item ongraphically equally distanced 6-point scales were treated as continuous data. Thus, wemeasured proximity variables with more than a single item and ensured graphicallyequal distances between response patterns in the survey design [80]. Similar to Rossi andWoods [41] and Galt [38], who measured satisfaction with CSA on a single-item scale, wemeasured CSA attractiveness on a six-point scale based on the question: “To what extent isCSA attractive to you?
Agriculture 2021, 11, 1006 9 of 20
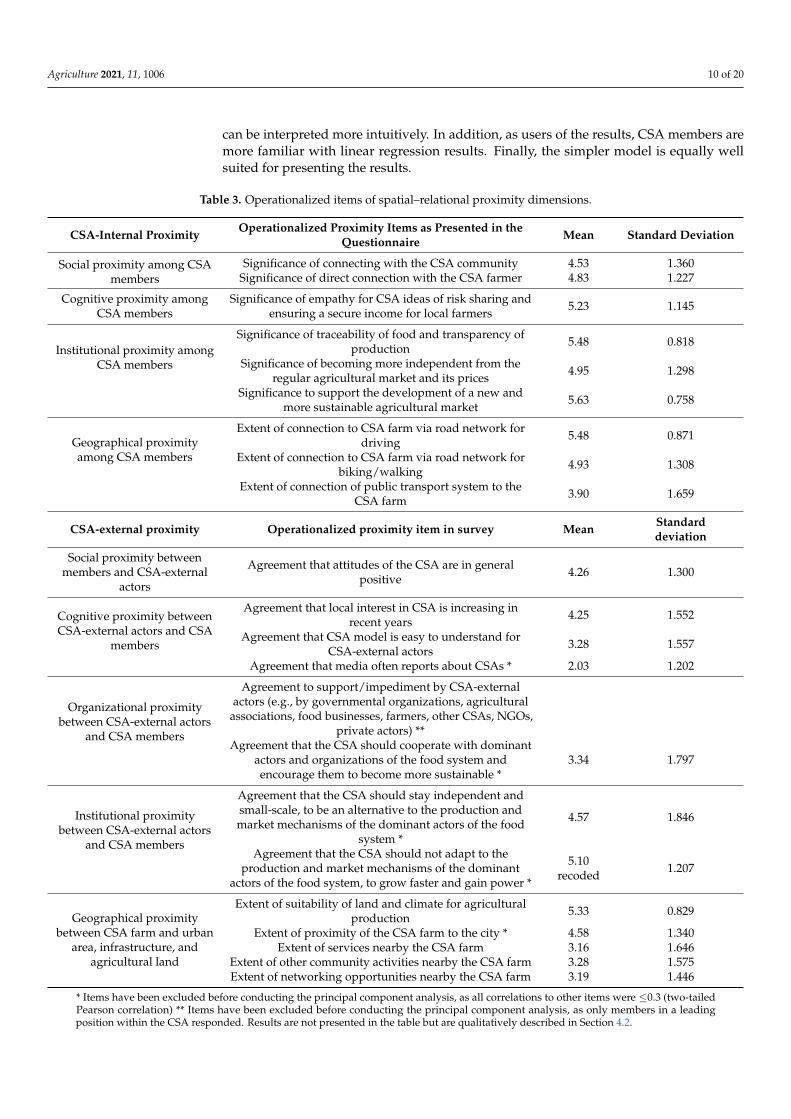
The operationalization of spatial and relational proximity dimensions for the CSAcontext provided the basis for developing the proximity statements. Table 3 presentsall operationalized proximity items in our survey. We asked about the importance ofthe proximity items to CSA participation (i.e., CSA-internal relational proximity), for theextent to which proximity items were present by participant (i.e., CSA-internal and -external geographical proximity), and for participants’ agreement with proximity items (i.e.,relational proximity to CSA-external actors). We used an explorative principal componentanalysis to weight, reduce, and linearly combine the operationalized proximity items (i.e.,items describing the overlapping, complementary, and partially substitutive proximitydimensions in the context of CSA presented above). Principal component analysis allowedus to create a small number of synthetic variables (i.e., principal components reflectingdifferent proximity dimensions) from a large number of operationalized proximity itemsand to test whether the structure of the principal components could be related to latentproximity dimensions similar to those described in the literature [16,21,48]. The resultingvariables (i.e., principal components) then served as explanatory variables for the multiplelinear regression [81].
The survey also captured perceptions about proximity among CSA members. Theseproximities refer to linkages within the same CSA to assess social, cognitive, institutional,and geographical proximity among CSA members. For internal linkages, we asked CSAmembers about the significance of several items for their participation in a CSA: connec-tion with the local CSA community and farmer (i.e., social proximity); empathy with theCSA idea of risk sharing and ensuring a secure income for local farmers (i.e., cognitiveproximity); independence from the regular food market and its prices, thus supportinga new food market; and traceability and transparency of food production (i.e., institu-tional proximity). In addition, we asked CSA members about the accessibility of the CSAfarm from their homes by car, bike, or on foot, as well as by public transportation) (i.e.,geographical proximity).
We also operationalized the proximity of CSA members to actors, structures,and resources outside of CSAs. Thus, the survey included questions on perceptionsof the social, cognitive, institutional, and organizational proximity of CSA members toCSA-external actors, as well as the geographical proximity of CSA members to the urbanareas, infrastructure, and agricultural land. Hence, we asked CSA members to assess howthey perceive CSA-external actors’ attitudes toward the CSA (i.e., social proximity), howunderstandable the CSA model is to CSA-external actors, and how they perceive the publicinterest in the CSA (i.e., cognitive proximity). Because members characterized the CSApreferably by institutional distance from the dominant structures of the food system [21,57],we also asked about external institutional linkages. Thus, we asked CSA members abouttheir agreement with CSA’s institutional orientation on independence from dominantproduct and market mechanisms of the food system to avoid institutional proximity to thelatter. Furthermore, we asked members in a leading position within the CSA about thedegree and type of support they received from CSA-external actors (i.e., organizationalproximity). Finally, CSA members were asked about the availability of infrastructure andsocial activities near their CSA farm, access to suitable land for agricultural production,and the proximity of their CSA farm to an urban area (i.e., geographical proximity).
3.4. Interrelating Proximity to CSA Attractiveness
To analyze the interrelation between proximity variables and CSA attractiveness, weapplied both a binary logistic model (which divides the responses on CSA attractivenessinto two groups: “very attractive” and “less attractive”) and a multiple linear regression(which measures CSA attractiveness on a 6-point interval scale based on equal distancesbetween response patterns in the survey). The two analyses showed basically the sameoutcome, indicating the robustness of the results. Although an ordered logit model mightbe more appropriate in terms of model assumptions, linear regression also has someadvantages. Therefore, we chose to present the linear regression results here because they
Agriculture 2021, 11, 1006 10 of 20
can be interpreted more intuitively. In addition, as users of the results, CSA members aremore familiar with linear regression results. Finally, the simpler model is equally wellsuited for presenting the results.
Table 3. Operationalized items of spatial–relational proximity dimensions.
CSA-Internal Proximity Operationalized Proximity Items as Presented in theQuestionnaire Mean Standard Deviation
Social proximity among CSAmembers
Significance of connecting with the CSA community 4.53 1.360Significance of direct connection with the CSA farmer 4.83 1.227
Cognitive proximity amongCSA members
Significance of empathy for CSA ideas of risk sharing andensuring a secure income for local farmers 5.23 1.145
Institutional proximity amongCSA members
Significance of traceability of food and transparency ofproduction 5.48 0.818
Significance of becoming more independent from theregular agricultural market and its prices 4.95 1.298
Significance to support the development of a new andmore sustainable agricultural market 5.63 0.758
Geographical proximityamong CSA members
Extent of connection to CSA farm via road network fordriving 5.48 0.871
Extent of connection to CSA farm via road network forbiking/walking 4.93 1.308
Extent of connection of public transport system to theCSA farm 3.90 1.659
CSA-external proximity Operationalized proximity item in survey Mean Standarddeviation
Social proximity betweenmembers and CSA-external
actors
Agreement that attitudes of the CSA are in generalpositive 4.26 1.300
Cognitive proximity betweenCSA-external actors and CSA
members
Agreement that local interest in CSA is increasing inrecent years 4.25 1.552
Agreement that CSA model is easy to understand forCSA-external actors 3.28 1.557
Agreement that media often reports about CSAs * 2.03 1.202
Organizational proximitybetween CSA-external actors
and CSA members
Agreement to support/impediment by CSA-externalactors (e.g., by governmental organizations, agricultural
associations, food businesses, farmers, other CSAs, NGOs,private actors) **
Agreement that the CSA should cooperate with dominantactors and organizations of the food system andencourage them to become more sustainable *
3.34 1.797
Institutional proximitybetween CSA-external actors
and CSA members
Agreement that the CSA should stay independent andsmall-scale, to be an alternative to the production andmarket mechanisms of the dominant actors of the food
system *
4.57 1.846
Agreement that the CSA should not adapt to theproduction and market mechanisms of the dominant
actors of the food system, to grow faster and gain power *
5.10recoded 1.207
Geographical proximitybetween CSA farm and urban
area, infrastructure, andagricultural land
Extent of suitability of land and climate for agriculturalproduction 5.33 0.829
Extent of proximity of the CSA farm to the city * 4.58 1.340Extent of services nearby the CSA farm 3.16 1.646
Extent of other community activities nearby the CSA farm 3.28 1.575Extent of networking opportunities nearby the CSA farm 3.19 1.446
* Items have been excluded before conducting the principal component analysis, as all correlations to other items were ≤0.3 (two-tailedPearson correlation) ** Items have been excluded before conducting the principal component analysis, as only members in a leadingposition within the CSA responded. Results are not presented in the table but are qualitatively described in Section 4.2.
Agriculture 2021, 11, 1006 11 of 20
Multiple linear regression shows the correlation between CSA attractiveness (i.e.,the dependent variable) and the latent proximity dimensions identified in the principalcomponent analysis (i.e., the explanatory variables) (see Section 4.1). Furthermore, weadded dummy-coded categorical variables to the regression to examine the extent to whichdemographic variables might explain CSA attractiveness. We selected country, age, gender,and work situation based on the demographic variables highlighted in the CSA literature(see Section 2). We also collected data on the geographical distance (measured as thelinear distance in kilometers based on zip codes) of the location of CSA members and theCSA farm and distance in minutes needed to access the farm. Since these variables didnot show correlations with the attractiveness variable, we did not include them in theregression. Before running the multiple linear regression, we checked the data for linearity,multicollinearity, and homoscedasticity [81].
4. Results
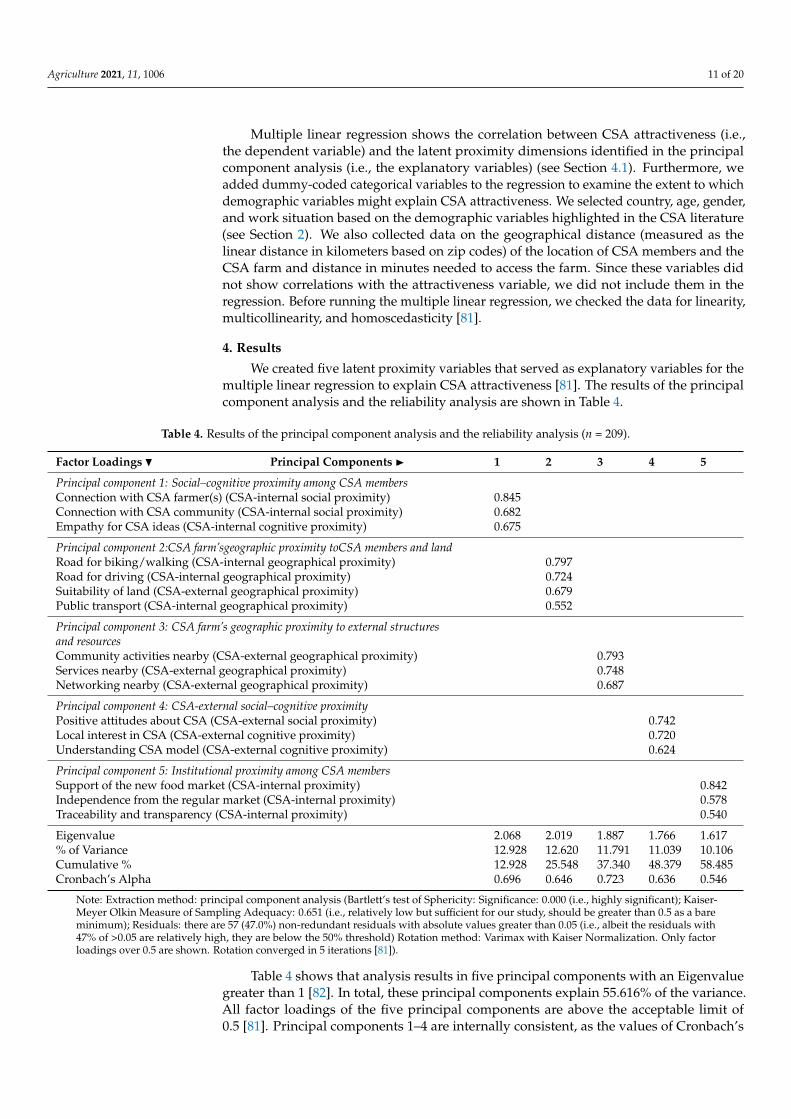
We created five latent proximity variables that served as explanatory variables for themultiple linear regression to explain CSA attractiveness [81]. The results of the principalcomponent analysis and the reliability analysis are shown in Table 4.
Table 4. Results of the principal component analysis and the reliability analysis (n = 209).
Factor Loadings L Principal Components � 1 2 3 4 5
Principal component 1: Social–cognitive proximity among CSA membersConnection with CSA farmer(s) (CSA-internal social proximity) 0.845Connection with CSA community (CSA-internal social proximity) 0.682Empathy for CSA ideas (CSA-internal cognitive proximity) 0.675
Principal component 2:CSA farm’sgeographic proximity toCSA members and landRoad for biking/walking (CSA-internal geographical proximity) 0.797Road for driving (CSA-internal geographical proximity) 0.724Suitability of land (CSA-external geographical proximity) 0.679Public transport (CSA-internal geographical proximity) 0.552
Principal component 3: CSA farm’s geographic proximity to external structuresand resourcesCommunity activities nearby (CSA-external geographical proximity) 0.793Services nearby (CSA-external geographical proximity) 0.748Networking nearby (CSA-external geographical proximity) 0.687
Principal component 4: CSA-external social–cognitive proximityPositive attitudes about CSA (CSA-external social proximity) 0.742Local interest in CSA (CSA-external cognitive proximity) 0.720Understanding CSA model (CSA-external cognitive proximity) 0.624
Principal component 5: Institutional proximity among CSA membersSupport of the new food market (CSA-internal proximity) 0.842Independence from the regular market (CSA-internal proximity) 0.578Traceability and transparency (CSA-internal proximity) 0.540
Eigenvalue 2.068 2.019 1.887 1.766 1.617% of Variance 12.928 12.620 11.791 11.039 10.106Cumulative % 12.928 25.548 37.340 48.379 58.485Cronbach’s Alpha 0.696 0.646 0.723 0.636 0.546
Note: Extraction method: principal component analysis (Bartlett’s test of Sphericity: Significance: 0.000 (i.e., highly significant); Kaiser-Meyer Olkin Measure of Sampling Adequacy: 0.651 (i.e., relatively low but sufficient for our study, should be greater than 0.5 as a bareminimum); Residuals: there are 57 (47.0%) non-redundant residuals with absolute values greater than 0.05 (i.e., albeit the residuals with47% of >0.05 are relatively high, they are below the 50% threshold) Rotation method: Varimax with Kaiser Normalization. Only factorloadings over 0.5 are shown. Rotation converged in 5 iterations [81]).
Table 4 shows that analysis results in five principal components with an Eigenvaluegreater than 1 [82]. In total, these principal components explain 55.616% of the variance.All factor loadings of the five principal components are above the acceptable limit of0.5 [81]. Principal components 1–4 are internally consistent, as the values of Cronbach’s
Agriculture 2021, 11, 1006 12 of 20
alpha (i.e., a measure of internal consistency that indicates the extent to which all itemsin a test measure describe the same concept or construct) are in the range of 0.636 and0.723, which are satisfactory values for exploratory research [83,84]. In contrast to the otherprincipal components, Cronbach’s alpha of principal component 5 is low, with a value of0.546. Because this value is still respectable for social science studies [84], we includedprincipal component 5 in the regression. The resulting factors in the rotated componentmatrix correspond to five different proximity dimensions:
• Principal component 1 groups CSA-internal social and cognitive proximities amongCSA members. We labelled this factor social–cognitive proximity among CSA members.
• Principal component 2 includes variables describing CSA farm’s geographic proximity toCSA members and land (hence the name of this component). The variables illustrate thelocation conflict between the proximity to CSA members, mainly located in the city,and suitable land for cultivation by the CSA farm.
• Principal component 3 also contains geographic variables that ask about the CSA farm’sgeographic proximity to external structures and resources (i.e., the name of this component),such as infrastructures and nearby services.
• Principal component 4 captures the CSA-external social and cognitive relations be-tween the CSA members and CSA-external actors. We have referred to principalcomponent 4 as CSA-external social–cognitive proximity.
• Principal component 5 contains variables on CSA members’ institutional proximity.Therefore, we termed principal component 5 institutional proximity among CSA members.
4.1. Interrelating Proximity to CSA Attractiveness
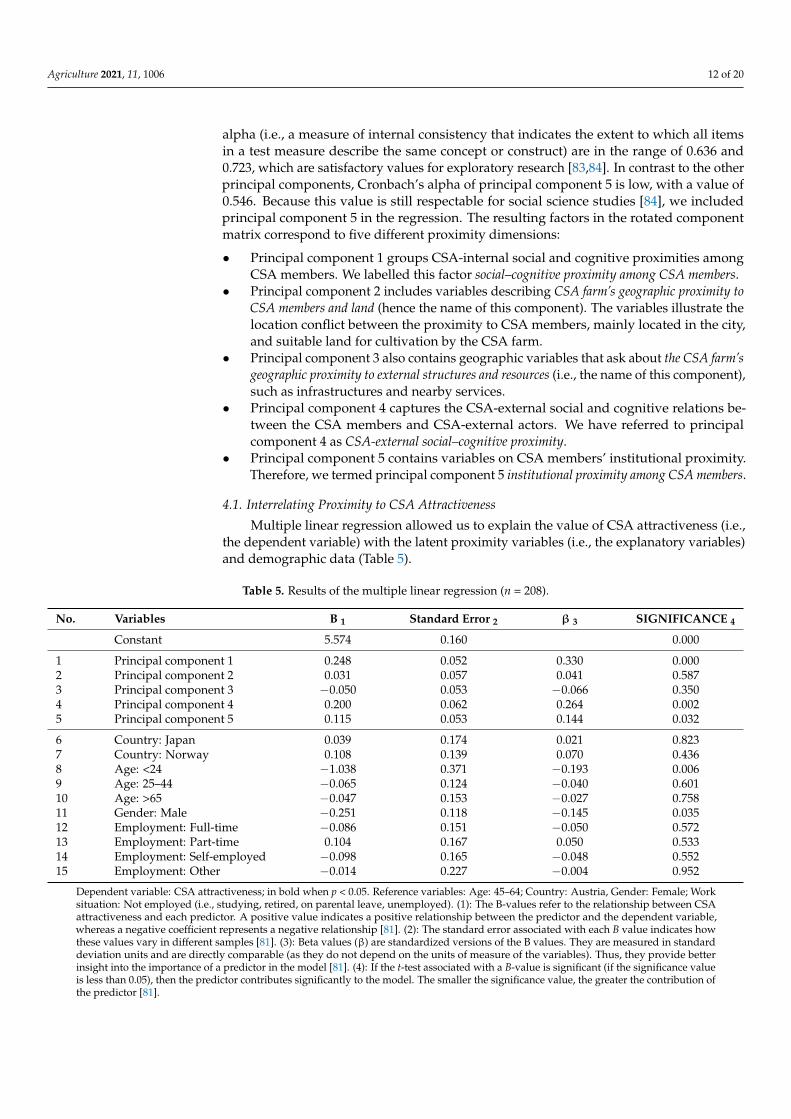
Multiple linear regression allowed us to explain the value of CSA attractiveness (i.e.,the dependent variable) with the latent proximity variables (i.e., the explanatory variables)and demographic data (Table 5).
Table 5. Results of the multiple linear regression (n = 208).
No. Variables B 1 Standard Error 2 β 3 SIGNIFICANCE 4
Constant 5.574 0.160 0.000
1 Principal component 1 0.248 0.052 0.330 0.0002 Principal component 2 0.031 0.057 0.041 0.5873 Principal component 3 −0.050 0.053 −0.066 0.3504 Principal component 4 0.200 0.062 0.264 0.0025 Principal component 5 0.115 0.053 0.144 0.032
6 Country: Japan 0.039 0.174 0.021 0.8237 Country: Norway 0.108 0.139 0.070 0.4368 Age: <24 −1.038 0.371 −0.193 0.0069 Age: 25–44 −0.065 0.124 −0.040 0.60110 Age: >65 −0.047 0.153 −0.027 0.75811 Gender: Male −0.251 0.118 −0.145 0.03512 Employment: Full-time −0.086 0.151 −0.050 0.57213 Employment: Part-time 0.104 0.167 0.050 0.53314 Employment: Self-employed −0.098 0.165 −0.048 0.55215 Employment: Other −0.014 0.227 −0.004 0.952
Dependent variable: CSA attractiveness; in bold when p < 0.05. Reference variables: Age: 45–64; Country: Austria, Gender: Female; Worksituation: Not employed (i.e., studying, retired, on parental leave, unemployed). (1): The B-values refer to the relationship between CSAattractiveness and each predictor. A positive value indicates a positive relationship between the predictor and the dependent variable,whereas a negative coefficient represents a negative relationship [81]. (2): The standard error associated with each B value indicates howthese values vary in different samples [81]. (3): Beta values (β) are standardized versions of the B values. They are measured in standarddeviation units and are directly comparable (as they do not depend on the units of measure of the variables). Thus, they provide betterinsight into the importance of a predictor in the model [81]. (4): If the t-test associated with a B-value is significant (if the significance valueis less than 0.05), then the predictor contributes significantly to the model. The smaller the significance value, the greater the contribution ofthe predictor [81].
Agriculture 2021, 11, 1006 13 of 20
Our results show a statistically significant fit of the data, as indicated by an F-teststatistic of 3.953 (i.e., the F-test looks at whether using the regression model predicts thevalues of the dependent variable significantly better than using the mean of the depen-dent variable. If the improvement from fitting the regression model is much greater thanthe imprecision within the model, then the F-value is greater than 1 [81]) and a p-valuebelow the 0.05 level. The model explains 24.8% of the variance in CSA attractiveness [81].Principal component 1 (i.e., social–cognitive proximity among CSA members) and prin-cipal component 4 (i.e., CSA-external social–cognitive proximity) are positively relatedto CSA attractiveness (p < 5%). The standardized beta value for principal component1 (β = 0.330) indicates that social–cognitive proximity among CSA members shows thestrongest interrelation with the attractiveness rating, followed by principal component 4(β = 0.264) (i.e., CSA-external social–cognitive proximity). Furthermore, our results suggestthat principal component 5 (β = 0.144) (i.e., institutional proximity among CSA members)is also positively related to CSA attractiveness (p < 0.05). Finally, principal component 2(i.e., CSA farm’s geographical proximity to members and land), and principal component 3(i.e., CSA farm’s geographical proximity to external structures) are not significantly relatedto the respondents’ attractiveness ratings.
Compared to their reference group, the regression coefficients of two dummy variablesin the multiple linear regression proved to be statistically significant: first, CSA membersaged under 24 years (β = −0.193) consider CSAs less attractive than the reference groupof CSA members aged between 45 and 64 years; second, male CSA members (β = −0.145)consider CSAs less attractive than their female counterparts.
4.2. Descriptive Analysis of Country-Specific Results on Institutional andOrganizational Proximity
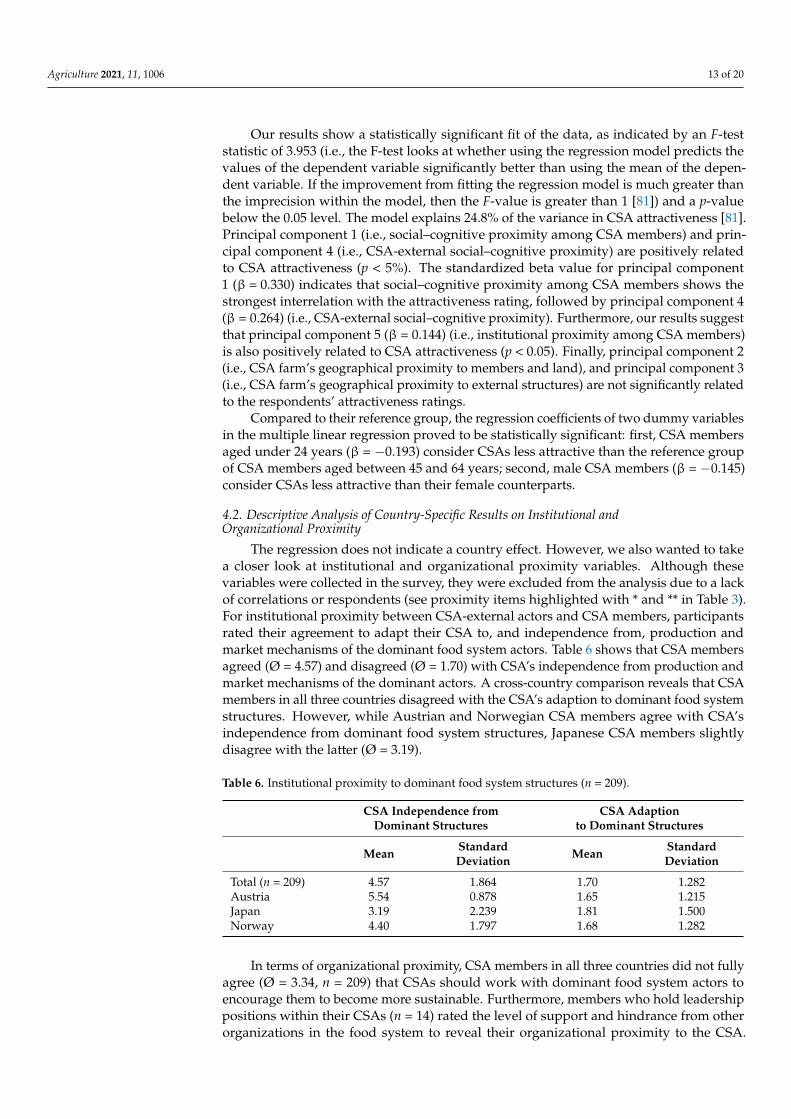
The regression does not indicate a country effect. However, we also wanted to takea closer look at institutional and organizational proximity variables. Although thesevariables were collected in the survey, they were excluded from the analysis due to a lackof correlations or respondents (see proximity items highlighted with * and ** in Table 3).For institutional proximity between CSA-external actors and CSA members, participantsrated their agreement to adapt their CSA to, and independence from, production andmarket mechanisms of the dominant food system actors. Table 6 shows that CSA membersagreed (Ø = 4.57) and disagreed (Ø = 1.70) with CSA’s independence from production andmarket mechanisms of the dominant actors. A cross-country comparison reveals that CSAmembers in all three countries disagreed with the CSA’s adaption to dominant food systemstructures. However, while Austrian and Norwegian CSA members agree with CSA’sindependence from dominant food system structures, Japanese CSA members slightlydisagree with the latter (Ø = 3.19).
Table 6. Institutional proximity to dominant food system structures (n = 209).
CSA Independence fromDominant Structures
CSA Adaptionto Dominant Structures
Mean StandardDeviation Mean Standard
Deviation
Total (n = 209) 4.57 1.864 1.70 1.282Austria 5.54 0.878 1.65 1.215Japan 3.19 2.239 1.81 1.500Norway 4.40 1.797 1.68 1.282
In terms of organizational proximity, CSA members in all three countries did not fullyagree (Ø = 3.34, n = 209) that CSAs should work with dominant food system actors toencourage them to become more sustainable. Furthermore, members who hold leadershippositions within their CSAs (n = 14) rated the level of support and hindrance from otherorganizations in the food system to reveal their organizational proximity to the CSA.
Agriculture 2021, 11, 1006 14 of 20
Norwegian CSA members perceived financial support from local, federal, and provincialgovernments (e.g., by Innovation Norway and county governors) during the establishmentphase, but also desired support thereafter. The Norwegian CSA network, organized bythe association Organic Norway (formerly OIKOS), has supported CSAs with networkingopportunities and has increased their visibility. Furthermore, the Norwegian AgriculturalExtension Service provides training and advice to organic farmers, including CSAs.
In contrast, Japanese and Austrian CSA members perceive the local, federal andprovincial government, as well as organic associations, as rather unsupportive. Althoughthey receive farm subsidies from the government (like any other farm), there is no specificfinancial support for the CSA scheme. Austrian CSA members point to the support fromother CSAs, private individuals, farmers, and farmer markets in the form of financialsupport, space and infrastructure, networking opportunities, and advice. Japanese CSAmembers mentioned that they have been mainly supported by private individuals and aCSA study group in terms of visibility, networking, infrastructure, and machinery.
5. Discussion
In our exploratory analysis, we operationalized spatial–relational proximity dimen-sions for a multivariate analysis of CSA attractiveness. We differentiate not only betweengeographical, social, organizational, institutional, and cognitive proximity, but also betweenCSA-internal relations among members and CSA-external relations between members andexternal actors, as well as structures and resources. In the first step of our analysis, we usedprincipal component analysis to create five latent proximity variables for CSA.
Principal components 2 and 3 (i.e., items loading on CSA geographical proximity)and 5 (items loading on institutional proximity) indicate latent variables corresponding tothe proximity dimensions differentiated in the literature. In principle component 2, we haveitems describing geographical proximity to other members (internal) and land (which welabeled as external geographical proximity). However, the respondents seem to distinguishless between the human–bio-physical divide and more between what they perceive as partof the CSA, which for them includes members and farmland. In retrospect, this makesa lot of sense. Social–cognitive principal components 1 and 4 combine two proximityvariables that have been analytically differentiated in the literature [16,21,48]. On the onehand, this result might confirm the supportive, complementary, or substitutive nature ofproximity dimensions [55,56]. The dimensions that are clearly differentiated analyticallymight be messily interwoven in real life. On the other hand, the complementarity of socialand cognitive proximity dimensions might be due to inadequate operationalization insurvey items.
Multiple linear regression (as well as binary logistic regression) showed differences inthe interrelations of latent proximity variables with members’ CSA attractiveness ratingsin Austria, Japan, and Norway. As hypothesized, relational proximities (i.e., social, cog-nitive, and institutional proximity) significantly predict CSA attractiveness in our model.Surprisingly and contrary to our hypothesis, however, this was not the case for the twogeographical proximity variables. Social–cognitive proximity among CSA members (i.e.,principal component 1) shows the strongest interrelation with member attractiveness rat-ings in the model. Thus, connection to other CSA members and farmer(s), as well as thesharing of CSA ideas, seem to be closely related to members’ perceptions of CSA attrac-tiveness. Furthermore, CSA-external social–cognitive proximity (i.e., principal component4) shows the second highest correlation with CSA attractiveness in the model. Thus, CSAattractiveness might increase with a growing understanding of a rising interest in anda positive attitude toward the CSA and its concept in society. Our results confirm theimportance of trust-building interactions within and outside the CSA [21]. Additionally,we confirm that empathy for the CSA model (i.e., cognitive proximity) promotes approvalof the CSA, which was also addressed by Samoggia et al. [57].
Institutional proximity: Previous studies [18,21,60,67] emphasized that CSA institu-tions (i.e., rules, norms, values) contrast with the dominant institutions of the food system.
Agriculture 2021, 11, 1006 15 of 20
Therefore, in this study, we assumed that institutional proximity among CSA membersreflects their shared values and identity based on being different from dominant foodsystem structures. However, the related component 5 (i.e., institutional proximity amongCSA members) shows low reliability with a Cronbach’s alpha of 0.546. Future analysesare needed with other or more items to increase the reliability of an institutional proximityscale [81]. Multiple linear regression suggests that institutional proximity among CSAmembers (i.e., principal component 5) might be positively related to CSA attractiveness.Thus, the latter increases as CSA members strive for more independence from the regularfood market and the establishment of a new one, as well as for traceable and transparentfood (production).
Descriptive analysis shows that respondents criticized prevailing rules, norms,and values in the food system, wanted to change the latter, and aimed to avoid insti-tutionalization of the CSA scheme, which is consistent with the findings of previousstudies [21,60]. Most respondents in the three countries studies agreed that CSA schemesshould rather avoid an adaption to the dominant institutions of the food system. In otherwords, they do not want to conform to the latter. Following Coenen et al. [48], alternative(e.g., social) innovations (such as CSA), could be limited in their freedom and experimen-tation if they were oriented towards dominant institutions. Thus, too much institutionalproximity to CSA-external (dominant) food system actors could have a negative impact onCSA attractiveness, as our study shows. However, the institutional distance of CSAs fromdominant structures might also hinder cross-level learning, collaboration, and coordinationbetween CSAs and dominant food system actors.
Organizational proximity: In Austria and Japan, political support for CSAs seems tobe low. Austrian and Japanese CSA members stated that there has been support, if any,from other alternative innovations or private actors. In contrast, Norwegian CSA memberspointed to various supporting measures for their CSAs from government organizationsand interest groups, which Devik [71] and Hvitsand [30] had already pointed out. Thismight explain why organizational proximity of the CSA to dominant food system actors isperceived as relatively low, especially by Austrian and Japanese respondents (as describedin Section 4.2). CSA members slightly disagree that their CSA should collaborate withdominant actors to encourage them to become more sustainable. CSA members might lacktrust toward dominant food system actors (i.e., lack of social proximity) [21] and may beafraid of too much dependence and organizational control by the latter [48,73].
Geographical proximity: The regression demonstrated that the principal componentsrelated to geographical proximity (i.e., principal components 2 and 3) do not predict CSAattractiveness. Thus, the latter is neither significantly increased by the accessibility tomembers of a CSA farm from their homes nor by CSA farms’ access to suitable farmland,the urban area, infrastructure, and social activities nearby. Linear distance (kilometers)and travel time variables from respondents’ homes to the CSA farm did not correlatewith the attractiveness ratings. This result might be different if we had also includednon-members in our sample or members who live far away. The CSA membership ofour respondents might result from a self-selection process that is strongly influenced bygeographical proximity. On the other hand, the distance between members and the CSAfarm is less relevant for CSA models in which members do not pick up the food at thefarm but at one of several collection sites near the CSA members. In this case, distance tofood collection points is more important than distance to the farm. Therefore, our resultsdo not necessarily indicate that geographical proximity is irrelevant to sustainable foodsystems. However, our model suggests that relational proximity might be more relevantto CSA attractiveness than spatial proximity (i.e., geographical proximity). Although theoverall goal of CSAs is to connect producers and consumers [3,5], which might be easier inspatially proximate situations, the latter might also be achieved “at a distance” [5,14,15].Therefore, the focus of CSAs on relational proximity could reduce or even partially replacethe importance of spatial (i.e., geographical) proximity [22].
Agriculture 2021, 11, 1006 16 of 20
Demographic variables: The generally low proportion of young members in oursample, especially in the Japanese and Norwegian subsamples, is in line with the Japaneseliterature [55,56]. The regression also shows that CSA attractiveness is significantly lowerfor the youngest age group (age: <24) compared to the reference group (age: 45–64).Furthermore, we found that most CSA members in all three country subsamples are fe-males, as already highlighted by previous scholars [57,58]. Consequently, the regressiondemonstrated that male CSA members consider CSAs less attractive than female respon-dents. Finally, neither respondent nationality nor work situation showed a significantinterrelation with attractiveness ratings. A limitation of our analysis is that we could notinclude comparable economic data (such as household income) that have been identi-fied as relevant in other studies [39]. Furthermore, the survey was conducted only withAustrian, Japanese, and Norwegian CSA members (and not with former members ornon-members) of six CSAs in three different countries. This limitation of our study pointsto the importance of studying CSAs in different countries and with nonmembers.
Finally, the development of CSAs has been stagnating in Austria and even decliningin Japan. In Norway, on the other hand, the number of CSA farms has been steadilyincreasing, partly due to the supportive attitude of public bodies and various agriculturalorganizations, especially the association Organic Norway, towards CSAs.
6. Conclusions
Since AFNs (such as CSAs) have only recently come into existence, there still isa lack of knowledge about which factors should be used to promote them [25]. Thisarticle shows that the notion of proximity can help operationalize geographical, socio-cognitive, organizational, and institutional relations as explanatory variables in a linearregression model of CSA attractiveness. Multivariate analysis of empirical data from sixCSA groups in Norway, Japan, and Austria highlights the importance of social–cognitiveand institutional proximity to CSA attractiveness and thus, the relevance of increased trust,collaboration, shared knowledge, and shared values within and across organizations in thefood system. Rather than focusing on geographical proximity, supporting social–cognitiveand institutional relations within the CSA and beyond might support CSAs’ attractiveness.The lack of a country effect suggests that the findings might be robust across socio-culturaland political contexts.
Future research could address this study’s possible limitations of operationalization(i.e., the complementarity of social and cognitive proximity; the low reliability of principalcomponent 5), and limitations of our sample (i.e., no inclusion of non-CSA members andeconomic data of respondents).
In our study, items for geographical, social, cognitive, institutional, and organizationaldimensions of proximity were operationalized and tested. They cover network-internaland -external relations, human-to-human relations, and the relations of AFN members totheir bio-physical context of land or infrastructure. We hope that our small methodologicalcontribution will be useful for future structured AFN surveys and the advancement ofdiverse methods in relational rural sociology.
Supplementary Materials: The following are available online at https://www.mdpi.com/article/10.3390/agriculture11101006/s1.
Author Contributions: Conceptualization, methodology, data collection and analysis, writing—original draft, preparation, visualization, C.G.; conceptualization, methodology, data analysis,writing—review and editing, T.S.; conceptualization, methodology, data collection, writing—reviewand editing, C.H.; conceptualization, data collection and analysis, D.T.; conceptualization, method-ology, N.S.; conceptualization, methodology, writing—review and editing, supervision, projectadministration, and funding acquisition, M.P. All authors have read and agreed to the publishedversion of the manuscript.
Funding: This work was supported by the Vienna Science and Technology Fund (WWTF) Vienna,Austria [grant number ESR17042].
Agriculture 2021, 11, 1006 17 of 20
Institutional Review Board Statement: Considering the UNESCO Recommendation for Science andScientific Researchers, this international comparative study followed social science ethical standards:transparency on study purpose, informed consent by CSA leaders and by individual respondents,privacy and anonymity, care in methods selection and analysis, no vulnerable groups involved.As BOKU established its Ethics Commission after data collection, this study was not subject to aformalized ethical review and approval.
Data Availability Statement: The data that support the findings of this study are available on requestfrom the corresponding author. The data are not publicly available due to privacy restrictions.
Acknowledgments: The authors thank all survey participants for their enthusiastic participation.Without them, this research would not have been possible. We are particularly grateful for ChristinaRoder’s editing support.
Conflicts of Interest: The authors declare no conflict of interest.
References1. Ermann, U.; Langthaler, E.; Penker, M.; Schermer, M. Agro-Food Studies: Eine Einführung; UTB Böhlau Verlag: Vienna, Austria,
2018; p. 260.2. Krausmann, F.; Langthaler, E. Food regimes and their trade links: A socio-ecological perspective. Ecol. Econ. 2019, 160, 87–95.
[CrossRef]3. Hinrichs, C.C. Embeddedness and local food systems: Notes on two types of direct agricultural market. J. Rural. Stud. 2000, 16,
295–303. [CrossRef]4. Penker, M. Mapping and measuring the ecological embeddedness of food supply chains. Geoforum 2006, 37, 368–379. [CrossRef]5. Renting, H.; Marsden, T.; Banks, J. Understanding alternative food networks: Exploring the role of short food supply chains in
rural development. Environ. Plan. A Econ. Space 2003, 35, 393–411. [CrossRef]6. Weckenbrock, P.; Volz, P.; Parot, J.; Cressot, N. Introduction to Community Supported Agriculture in Europe. In Overview of
Community Supported Agriculture in Europe; European CSA Research Group: Aubagne, France, 2016; pp. 8–10.7. Jossart-Marcelli, P.; Bosco, F.J. Alternative food projects, localization and neoliberal urban development. Métropoles 2014, 15.
[CrossRef]8. Watson, D.J. Working the fields: The organization of labor in community supported agriculture. Organization 2020, 27, 291–313.
[CrossRef]9. Brunori, G.; Bartolini, F. Local agri-food systems in a global world: Market, social and environmental challenges. Eur. Rev.
Agric. Econ. 2013, 40, 408–411. [CrossRef]10. Darnhofer, I.; Gibbon, D.; Dedieu, B. Farming Systems Research into the 21st Century: The New Dynamic; Springer: Dordrecht,
The Netherlands, 2012.11. Schermer, M. From “Food from Nowhere” to “Food from Here:” Changing producer—Consumer relations in Austria.
Agric. Hum. Values 2015, 32, 121–132. [CrossRef]12. DuPuis, E.M.; Goodman, D. Should we go “home” to eat? Towards a reflexive politics of localism. J. Rural. Stud. 2005, 21, 359–371.
[CrossRef]13. Milestad, R.; Westberg, L.; Geber, U.; Björklund, J. Enhancing adaptive capacity in food systems: Learning at farmers’ markets in
Sweden. Ecol. Soc. 2010, 15, 29–46. [CrossRef]14. Kneafsy, M.; Venn, L.; Schmutz, U.; Trenchard, L.; Eyden-Wood, T.; Bos, E.; Sutton, G.; Blackett, M. Short Food Supply Chains
and Local Food Systems in the EU. 2013. Available online: https://www.europarl.europa.eu/thinktank/en/document.html?reference=EPRS_BRI(2016)586650 (accessed on 18 January 2021). [CrossRef]
15. Watts, D.C.H.; Ilbery, B.; Maye, D. Making reconnections in agro-food geography: Alternative systems of food provision.Prog. Hum. Geogr. 2005, 29, 22–40. [CrossRef]
16. Boschma, R. Proximity and innovation: A critical assessment. Reg. Stud. 2005, 39, 61–74. [CrossRef]17. Aubry, C.; Kebir, L. Shortening food supply chains: A means for maintaining agriculture close to urban areas? The case of the
French metropolitan area of Paris. Food Policy 2013, 41, 85–93. [CrossRef]18. Abrahams, C.N. Globally useful conceptions of alternative food networks in the developing south: The case of Johannesburg’s
urban food supply system. In Alternative Food Geographies: Representation and Practice; Maye, D., Holloway, L., Kneafsey, M., Eds.;Emerald: Bingley, UK, 2007; pp. 95–114.
19. Sitaker, M.; McGuirt, J.T.; Wang, W.; Kolodinsky, J.; Seguin, R.A. Spatial considerations for implementing two direct-to-consumerfood models in two states. Sustainability 2019, 11, 2081. [CrossRef]
20. Strus, M.; Kalisik-Medelska, M.; Nadolny, M.; Kachniarz, M.; Raftowicz, M. Community-supported agriculture as a perspectivemodel for the development of small agricultural holding in the region. Sustainability 2020, 12, 2656. [CrossRef]
21. Gugerell, C.; Penker, M. Change Agents’ Perspectives on Spatial–Relational Proximities and Urban Food Niches. Sustainability2020, 12, 2333. [CrossRef]
Agriculture 2021, 11, 1006 18 of 20
22. Dubois, A. Translocal practices and proximities in short quality food chains at the periphery: The case of North Swedish farmers.Agric. Hum. Values 2019, 236, 763–778. [CrossRef]
23. Edelmann, H.; Quiñones-Ruiz, X.F.; Penker, M. Analytic Framework to Determine Proximity in Relationship Coffee Models.Sociol. Rural. 2019, 60, 458–481. [CrossRef] [PubMed]
24. Kebir, L.; Torre, A. Geographical proximity and new short supply food chains. In Creative Industries and Innovation in Europe,Concepts, Measures, and Comparative Case Studies; Lazzeretti, L., Ed.; Routledge: New York, NY, USA, 2013; p. 328.
25. De Bernardi, P.; Bertello, A.; Venuti, F.; Foscolo, E. How to avoid the tragedy of alternative food networks (AFNs)? The impact ofsocial capital and transparency on AFN performance. Br. Food J. 2020, 122, 2171–2186. [CrossRef]
26. Galt, R.; O’Sullivan, L.; Beckett, J.; Hiner, C.C. Community Supported Agriculture (CSA) in and around California’s Central Valley: Farmand Farmer Characteristics, Farm-Member Relationships, Economic Viability and Emerging Issues; University of California: Oakland,CA, USA, 2011.
27. Bougheraraa, D.; Grolleaub, G.; Mzoughic, N. Buy local, pollute less: What drives households to join a community supportedfarm? Ecol. Econ. 2009, 68, 1488–1495. [CrossRef]
28. Brehm, J.M.; Eisenhauer, B.W. Motivations for participating in community-supported agriculture and their relationship withcommunity attachment and social capital. J. Rural. Soc. Sci. 2008, 23, 5.
29. Cox, R.; Holloway, L.; Venn, L.; Dowler, L.; Hein, J.R.; Kneafsey, M.; Tuomainen, H. Common ground? Motivations forparticipation in a community-supported agriculture scheme. Local Environ. 2008, 13, 203–218. [CrossRef]
30. Hvitsand, C. Organic Spearhead—The Role of Community Supported Agriculture in Enhancing Bio Economy, and Increased Knowledgeabout and Consumption of Organic Food; Title Translated from Norwegian; Telemark Research Institute: Bø, Norway, 2014.
31. Kane, D.; Lohr, L. The Dangers of Space Turnips and Blind Dates: Bridging the Gap Between CSA Shareholders’ Expectations and Reality;CSA Farm Network: Stillwater, NY, USA, 1998.
32. Cone, C.; Myhre, A. Community-supported Agriculture: A Sustainable Alternative to Industrial Agriculture? Hum. Organ. 2000,59, 187–199. [CrossRef]
33. Galt, R.E.; Bradley, K.; Christensen, L.O.; Munden-Dixon, K. The (un)making of “CSA people”: Member retention and thecustomization paradox in Community Supported Agriculture (CSA) in California. J. Rural Stud. 2019, 65, 172–185. [CrossRef]
34. Witzling, L.; Shaw, B.R.; Strader, C.; Sedlak, C.; Jones, E. The role of community: CSA member retention. Br. Food J. 2020, 122,2289–2302. [CrossRef]
35. Vitari, C.; Whittingham, E. Tackling Conventional Agriculture: The Institutionalization of Community Supported Agriculture’s(CSA) Principles. In Proceedings of the Research & Degrowth Conference, Malmö, Sweden, 21–25 August 2018.
36. Balázs, B.; Pataki, G.; Lazányi, O. Prospects for the future: Community supported agriculture in Hungary. Futures 2016, 83,100–111. [CrossRef]
37. Nost, E. Scaling-up local foods: Commodity practice in community supported agriculture (CSA). J. Rural Stud. 2014, 34, 152–160.[CrossRef]
38. Galt, R.E.; Bradley, K.; Christiensen, L.; Van Soelen Kim, J.; Lobo, R. Eroding the Community in Community SupportedAgriculture (CSA): Competition’s Effects in Alternative Food Networks in California. Sociol. Rural. 2016, 56, 491–512. [CrossRef]
39. Galt, R.E.; Bradley, K.; Christiensen, L.; Fake, C.; Munden-Dixon, K.; Simpson, N.; Surls, R.; Van Soelen Kim, J. What differencedoes income make for Community Supported Agriculture (CSA) members in California? Comparing lower-income and higher-income households. Agric. Hum. Values 2017, 34, 435–452. [CrossRef]
40. Galt, R.E.; Bradley, K.; Christiensen, L.; Munden-Dixon, K. Exploring member data for Community Supported Agriculture (CSA)in California: Comparisons of former and current CSA members. Data Brief 2018, 21, 2082–2088. [CrossRef]
41. Rossi, J.; Woods, T. Understanding shareholder satisfaction and retention in CSA incentive programs. J. Food Distrib. Res. 2020, 51,16–40.
42. Darnhofer, I. Farming from a Process-Relational Perspective: Making Openings for Change Visible. Sociol. Rural. 2020, 60,505–528. [CrossRef]
43. Vroom, V.H. Organizational choice: A study of pre- and post-decision processes. Organ. Behav. Hum. Perform. 1966, 1, 212–225.[CrossRef]
44. Singh, R. Information integration theory applied to expected job attractiveness and satisfaction. J. Appl. Psychol. 1973, 60, 621–623.[CrossRef]
45. Belllet, M.; Colletis, G.; Lung, Y. Économie des proximités. Rev. D’économie Régionale Urbaine 1993, 3, 357–606.46. Rallet, A.; Torre, A. Is geographical proximity necessary in the innovation networks in the era of global economy? GeoJournal
1999, 49, 373–380. [CrossRef]47. Moodysson, J.; Jonsson, O. Knowledge collaboration and proximity: The spatial organization of Biotech innovation projects. Eur.
Urban Reg. Stud. 2007, 14, 115–131. [CrossRef]48. Coenen, L.; Raven, T.; Verbong, G. Local niche experimentation in energy transitions: A theoretical and empirical exploration of
proximity advantages and disadvantages. Technol. Soc. 2010, 32, 295–302. [CrossRef]49. Holloway, L.; Cox, R.; Venn, L.; Kneafsey, M.; Dowler, E.; Tuomainen, H. Managing sustainable farmed landscape through
‘alternative’ food networks: A case study from Italy. Geogr. J. 2006, 172, 219–229. [CrossRef]50. Hayden, J.; Buck, D. Doing community supported agriculture: Tactile space, affect and effects of membership. Geoforum 2012, 43,
332–341. [CrossRef]
Agriculture 2021, 11, 1006 19 of 20
51. Michel-Villarreal, R.; Hingley, M.; Canavari, M.; Bregoli, I. Sustainability in Alternative Food Networks: A Systematic LiteratureReview. Sustainability 2019, 11, 859. [CrossRef]
52. Rossi, A. Beyond Food Provisioning: The Transformative Potential of Grassroots Innovation around Food. Agriculture 2017, 7, 6.[CrossRef]
53. Parker, G. Social innovation in local food in Japan: Choku-bai-jo markets and Teikei cooperative practices. In Real Estate &Planning Working Papers; University of Reading: Reading, UK, 2016.
54. Edquist, C.; Johnson, B. Institutions and organizations in systems of innovation. In Systems of Innovation: Technologies, Institutions,and Organizations; Edquist, C., Ed.; Pinter: London, UK, 1997; pp. 41–63.
55. Breschi, S.; Lissoni, F. Mobility and Social Networks: Localised Knowledge Spillovers Revisited; CESPRI Working Paper No. 142;University Bocconi: Milano, Italy, 2003. Available online: https://ideas.repec.org/p/cri/cespri/wp142.html (accessed on 18January 2021).
56. Broekel, T.; Boschma, R. Knowledge networks in the Dutch aviation industry: The proximity paradox. J. Econ. Geogr. 2012, 12,409–433. [CrossRef]
57. Samoggia, A.; Perazzolo, C.; Kocsis, P.; Del Prete, M. Community supported agriculture farmers’ perceptions of managementbenefits and drawbacks. Sustainability 2019, 11, 3262. [CrossRef]
58. Hatano, J. The organic agriculture movement (teikei) and factors leading to its decline in Japan. Rural Food Econ. 2008, 54, 21–34.59. Kondoh, K. The alternative food movement in Japan: Challenges, limits, and resilience of the teikei system. Agric. Hum. Values
2015, 32, 143–153. [CrossRef]60. Hvitsand, C. Community supported agriculture (CSA) as a transformational act—Distinct values and multiple motivations
among farmers and consumers. Agroecol. Sustain. Food Syst. 2016, 40, 333–351. [CrossRef]61. Rømo Grande, E. Eating is an Agricultural Act: Community Supported Agriculture (CSA) in Norway. Master’s Thesis, Norwegian
University of Life Sciences, Ås, Norway, 2009.62. Rømo Grande, E. Norway. In Overview of Community Supported Agriculture in Europe; European CSA Research Group: Aubagne,
France, 2016; pp. 74–77.63. Coff, C.; Korthals, M.; Barling, D. Ethical traceability and informed food choice. In Ethical Traceability and Communicating Food;
The International Library of Environmental, Agricultural and Food Ethics; Coff, C., Barling, D., Korthals, M., Nielsen, T., Eds.;Springer: Dordrecht, The Netherlands, 2008; pp. 1–18.
64. Hofstede, G. Culture’s Consequences: Comparing Values, Behaviors, Institutions, and Organizations Across Nations, 2nd ed.; Sage:Thousand Oaks, CA, USA, 2001.
65. Ferrin, D.L.; Gillespie, N. Trust differences across national-societal cultures: Much to do, or much ado about nothing?In Organizational Trust: A Cultural Perspective; Saunders, M.N., Skinner, D., Dietz, G., Gillespie, N., Lewicki, R.J., Eds.; CambridgeUniversity Press: Cambridge, UK, 2010; pp. 42–86.
66. Storstad, O. The impact of consumer trust in the Norwegian food market. In Food, Nature and Society; Rural Life in Late, Modernity;Blanc, M., Tovey, H., Eds.; Routledge: Abingdon, UK, 2001; pp. 113–134.
67. Wohlmacher, E. Comparing Community Supported Agriculture in Vienna and Vancouver. Master’s Thesis, University of NaturalResources and Life Sciences, Vienna, Austria, 2018.
68. Plank, C.; Hafner, R.; Stotten, R. Analyzing values-based modes of production and consumption: Community-supportedagriculture in the Austrian Third Food Regime. Österreichische Zeitschrift für Soziologie 2020, 45, 49–68. [CrossRef]
69. Freyer, B.; Bingen, J. Re-Thinking Organic Food and Farming in a Changing World; The International Library of EnvironmentalAgricultural and Food Ethics 22; Springer: Dordrecht, The Netherlands, 2015.
70. Guthmann, J. Regulating meaning, appropriating nature: The codification of California organic agriculture. Antipode 1998, 30,135–154. [CrossRef]
71. Devik, A. Håndbok for å Starte Andelslandbruk; Oikos–Økologisk Norge: Oslo, Norway, 2015.72. Organic Norway. Community Supported Agriculture in Norway (Translated). 2020. Available online: https://www.
andelslandbruk.no/english-1/english (accessed on 18 January 2021).73. Poças Ribeiro, A.; Harmsen, R.; Feola, G.; Rosales Carréon, J.; Worrell, E. Organising Alternative Food Networks (AFNs):
Challenges and Facilitating Conditions of different AFN types in three EU countries. Sociol. Rural. 2021, 61, 491–517. [CrossRef]74. Braukmann, I. Potenzial und Grenzen von Community Supported Agriculture als Gegenhegemoniales Projekt. Master’s Thesis,
University of Vienna, Vienna, Austria, 2015. [CrossRef]75. McGreevy, S.R.; Akitsu, M. Steering sustainable food consumption in Japan: Trust, relationships, and the ties that bind.
In Sustainable Consumption: Design, Innovation, and Practice; Genus, A., Ed.; Springer: Cham, Switzerland, 2016; Volume 3,pp. 101–117.
76. Akitsu, M.; Aminaka, N. The development of farmer-consumer direct relationships in Japan: Focusing on the trade of organicproduce. In Proceedings of the 4th Asian Rural Sociology Association (ARSA) International Conference, Legazpi City, Philippines,7–10 September 2010.
77. Hatano, T. Economy of Organic Agriculture: TEIKEI Networks; Nihon Keizai Hyoronsha: Tokyo, Japan, 1998.78. Hatano, T.; Karasaki, T. CSA, Agriculture for Sharing: Case Studies in US, Europe, and Japan; Soshinsya: Tokyo, Japan, 2019.

Agriculture 2021, 11, 1006 20 of 20
79. Engel, A.; Pabst, S.; Steigberger, E.; Wellmann, L. Austria. In Overview of Community Supported Agriculture in Europe; European CSAResearch Group: Aubagne, France, 2016; pp. 12–15. Available online: http://www.fao.org/family-farming/detail/en/c/416085/(accessed on 18 January 2021).
80. Carifio, J.; Perla, R.J. Ten common misunderstandings, misconceptions, persistent myths and urban legends about Likert scalesand Likert response formats and their antidotes. J. Soc. Sci. 2007, 3, 106–116. [CrossRef]
81. Field, A.P. Discovering Statistics Using IBM SPSS Statistics: And Sex and Drugs and Rock ‘n’ Roll, 15th ed.; Sage: Chicago, IL,USA, 2013.
82. Kaiser, H.F. The application of electronic computers to factor analysis. Educ. Psychol. Manag. 1960, 20, 141–151. [CrossRef]83. Robinson, J.P.; Shaver, P.R.; Wrightsman, L.S. Criteria for scale selection and evaluation. In Measures of Personality and Social
Psychological Attitudes; Robinson, J.P., Shaver, P.R., Wrightsman, L.S., Eds.; Academic Press: San Diego, CA, USA, 1991; pp. 1–16.[CrossRef]
84. Kline, P. The Handbook of Psychological Testing, 2nd ed.; Routledge Taylor & Francis Group: London, UK, 1999.