the economics of religious participation: a cross-country study
TRANSCRIPT

KYKLOS. Vol. 51 - 1998 - Fasc. 1 ,2543
The Economics of Religious Participation: A Cross-country Study
Ian Smith. John W. Sawkins and Paul T. Seaman*
I. INTRODUCTION
Until recently, published studies in the economics of religion were occasional and diffuse. Prior to the mid-1970s very little attempt had been made to explain systematic patterns in religious production and consumption. If anything, reli- gious behaviour and affiliation were treated as exogenous variables in models explaining a wide variety of demographic, social and labour market outcomes. Recent examples include the effect of religion on earnings (Steen 1996, Tomes 1985), marital instability (Lehrer and Chiswick 1993), fertility (Mosher, Wil- liams and Johnson 1992), economic development (Grier 1997), economic welfare (Heath, Waters and Watson 1995), educational attainment (Sander 1992), entrepreneurship (Drakopoulou Dodd and Seaman 1995), unemploy- ment (Osborne and Cormack 1986), female labour supply (Lehrer 1993, skills and economic status (Chiswick 1993), criminal activity (Hull and Bold 1995), and suicide rates (Yang 1992).
However, care is required in treating religious behaviour as a strictly exoge- nous variable, since it is clearly an object of choice. People choose how much to participate, if at all, in organized religious activity, a decision which may vary over the life cycle. Indeed not only do religious participation rates vary system- atically according to age but also by sex, wealth, income and labour market status. Azzi and Ehrenberg ( 1 975) were perhaps the first economists to analyze the determinants of American church attendance. They used a household pro- duction model in which individuals allocate their resources to maximise utility derived from both religious and secular commodities. Adopting a similar modelling framework, related empirical studies were conducted by Long and
* Department of Economics, University of St Andrews; Department of Economics, Heriot Watt University; Department of Economic Studies, University of Dundee.
25

IAN SMITH, JOHN W. SAWKINS AND PAUL T. SEAMAN
Settle (1 9771, Ehrenberg (1 977), Ulbrich and Wallace (1 984), and Sullivan (1985) in the case of the United States, by Neuman (1 986) for Israel and by Sawkins, Seaman and Williams (1997) using British data.
Given the emphasis on country specific studies, the economics literature has rather neglected the wide cross-country variation in participation rates in organ- ized religion. Only an estimated 8.5% of the Norwegian (adult) population regularly attend religious worship, for example, compared to 20% in New Zealand, 49% in Italy and 76% in the Republic of Ireland. Such large interna- tional disparities in religious behaviour are conventionally ascribed to the cumulative forces of history and culture which are not readily amenable to economic investigation. And it is certainly true that historical and cultural bequests play a role in accounting for cross-country differences in both the scale of religious activity and its denominational composition. The contribution of the religious inheritance of a country operates primarily through its impact on religious upbringing since religious socialization is a major determinant of later religious participation as an adult. However, that observation constitutes the beginning rather than the conclusion of the analysis. For not only does childhood religious participation differ by country and church tradition, but also the ability of churches to maintain religious commitment in later stages of the life cycle. Recent theoretical developments suggest a fundamental explanation for these differences in retention rates is the degree of competition in a religious economy (Iannaccone 1991). If competition is weak, the clergy of dominant firms have little incentive to engage in vigorous marketing and product innovation. The outcome is low levels of religious participation which spillover into future generations as parental investment in the religious upbringing, that is the religious human capital, of children is correspondingly reduced. Moreover, this result is reinforced by the fact that the incentive to participate in organized religion, which arises out of the benefits from interacting in a social network, is diminished when overall religious activity is low. Thus the paper attempts to model the cross-country variation in religious participation as the outcome of three factors, namely: differences in national investment rates in religious human capital; social interactions; and religious market structures. To anticipate the results of the empirical analysis, these variables can fruitfully explain much of the variation in religious attendance across countries, even those with apparently similar economies and social structures.
The data employed in this study are drawn from the International Social Survey Programme’s (ISSP) religion survey conducted in 1991. The survey, covering 18 countries, selected samples of citizens aged I8 years and older, which were representative of their populations. Unfortunately, adult religious participation data are missing in the cases of Slovenia and Israel. These two
26
THE ECONOMICS OF RELIGIOUS PARTICIPATION
countries are, therefore, excluded from the analysis. However, the regional information collected by the survey permits the identification of respondents according to their membership of the constituent countries of Great Britain, namely: England, Scotland and Wales. This restores the sample to 18 countries which are identified in Table I together with the corresponding sample sizes, ni, and the proportion of the respondents who reported attending worship at least two or three times per month, 4, an estimate of the true proportion, Pi. Given the ni are large, then t. = q .
Information on the number of respondents who participated in organized religious activity in lower frequency categories is also available from the survey. However, for this study, an attendance level of two or three times per month is judged to be the minimum involvement that constitutes regular religious prac- tice. If anything, this is a permissive measure; some writers use an index of formal religious activity based on weekly attendance rates (e.g., Iannaccone 1991).
Also, although individual level data are available, in what follows the micro data are always grouped by country to give estimates of national attendance frequencies. It is differences in religious economies at the macro level which are the primary focus of our interest and for which the use of country level data is, therefore, most appropriate. However, there is naturally a price to pay from grouping the data especially with respect to loss of information and less efficient parameter estimates in the regression equations. Exploitation of the considerable individual respondent information at the micro level is the subject of further research.
Religious involvement is not limited to Christian churches. The sample includes Jews, Hindus, Moslems and so forth. But as the ‘Other’ column in Table I indicates, the sample of regular religious participants in the countries surveyed is overwhelming dominated by Christian denominations. In the apparently anomalous case of Russia, most of the comparatively few religious participants were members of the Orthodox church. In what follows, therefore, ‘religious participation’ and ‘church attendance’ will be used interchangeably.
The remainder of the paper is organized as follows. Section I1 seeks to outline and unify disparate theoretical ideas which are used in Section 111 to specify and estimate an empirical model explaining the cross-country variance in church attendance. Following discussion of the results, Section IV concludes the paper and indicates directions for future research.
21

IAN SMITH, JOHN W. SAWKINS AND PAUL T. SEAMAN
Table I Descriptive Statistics for Religious Participation
__ Country
West Germany
East Germany
England
Wales
Scotland
Northern Ireland
United States
Hungary
Netherlands
Italy
Ireland
Norway
Austria
Poland
Philippines
New Zealand
Russia
Australia
Mean
Standard Deviation
Coefficient of Variation
Sample
size ni
Regular
participants
i:
Share of participants who are:
Catholics Protestants D/o 7%
Other %
1342
1476
1066
52
126
836
1336
988
I622
98 I
1003
1470
977
1057
I I99
1047
2903
2147
0.148
0.036
0.161
0.135
0.230
0.568
0.436
0.194
0.213
0.490
0.760
0.086
0.261
0.673
0.673
0.198
0.033
0.212
0.306
0.232
0.76
79.8 15.2
47.2 37.7
24.5 63.5
33.3 66.7
41.4 58.6
50.2 48.7
30.7 66.7
76.6 16.7
31.7 52. I
98.5 0.2
97.2 2.4
2.4 82.3
94.5 2.7
99.1 0.0
83.0 14.4
27.2 65.4
0.0 0.0
42.0 54.5
53.6 36.0
32.8 29.0
0.61 0.81
5.0
15.1
12.0
0.0
0.0
1.1
2.6
6.7
10.2
I .3
0.4
15.3
2.8
0.9
2.6
7.4
100.0
3.5
10.4
22.9
2.21
Notes: Regular participants refers to those attending worship at least two or three times per month. Those who failed to identify a denomination or religion are excluded from the denominator in the calculation of Catholic, Protestant and Other shares in the total number of regular religious participants. _______ - ~-
28
THE ECONOMICS OF RELIGIOUS PARTICIPATION
11. THEORY
I . Religious Human Capital
It is natural that parents have a powerful influence on the preferences of their children. As with political commitments, there is typically a close link between the religious attitudes and affiliation of parents and their offspring. This asso- ciation arises from parental investment in a child’s religious human capital. Regular church attendance acquaints a child with specific religious rituals, traditions, doctrines and practices. Indeed, the larger the stock of religious knowledge, the deeper the understanding of rituals, the closer the familiarity with hymns, prayers and church music, the greater are the benefits from continued church attendance (Iannaccone 1995). Investment in religious skills and experiences is a key determinant of the ability to produce and enjoy religious commodities. In other words, religious human capital and participation are complements since past and present consumption will be positively related. Moreover, the accumulation of religious capital provides an incentive for further religious participation which in turn augments that capital stock. This comple- mentarity generates the habitual character of church attendance.
In a utility maximizing framework, if an individual’s utility is at any moment in time assumed to be a function of religious consumption, C(t), and the stock of religious capital, S(t), then, ignoring all other commodities, the utility function is given by:
Since the marginal utility of current consumption of religion is higher with a larger capital stock, Uc5 > 0, this in turn entails that past consumption will tend to reinforce current consumption, dC(r) / dS( t ) > 0.
The implication is that the larger the levels of religious human capital acquired as a child, the greater the probability ceteris paribus of continued formal religious observance as an adult and the greater the degree of involve- ment. Clearly the degree of childhood religious activity is a major determinant of the extent of adult religious practice. A major advantage of the ISSP data set is that it includes a question on the regularity of religious participation by each respondent when they were aged 11-12 years, a question whose structure corresponds exactly to that on frequency of adult attendance. These responses are aggregated to proxy the level of childhood investment in religious human capital at the national level. Such a variable is not typically collected in
29

IAN SMITH, JOHN W. SAWKmS AND PAUL T. SEAMAN
household surveys. Table 2 lists child church attendance frequencies, Si, by country.
As anticipated, there is a high correlation between childhood investment and adult religiosity. In all countries there is naturally some life cycle decay in attendance rates'. The differences in the intra-generational maintenance of religious belief by country can be illuminated by inspecting the denominational composition of each religious market.
Table I decomposes religious participation into its Catholic and Protestant market shares. It is immediately apparent that at least four countries are charac- terized by powerful Catholic monopolies, namely Italy, Ireland, Austria and Poland. Former West Germany, Hungary and the Philippines also display Catholic market shares exceeding 75%. Most other countries are roughly evenly mixed, though the United States, Britain, Norway and New Zealand have Protestant shares greater than 60%.
1. Those who do not remain loyal to their childhood denomination typically move into religious non-affiliation, though there may be some denominational switching between close Protestant substitutes (Breen and Hayes 1996).
30

THE ECONOMICS OF RELIGIOUS PARTICIPATION
Country
West Germany
East Germany
England
Wales
Scotland
Northern Ireland
United States
Hungary
Netherlands
Italy
Ireland
Norway
Austria
Poland
Philippines
New Zealand
Russia
Australia
Mean
Standard Deviation
Coefficient of Variation
Table 2 Explanatory Variables
~_____ Religious Human
Capital S, Retention Rate
4 I S ,
0.582
0.247
0.607
0.726
0.734
0.918
0.762
0.643
0.569
0.906
0.976
0. I87
0.7 19
0.918
0.830
0.583
0.039
0.716
0.648
0.260
0.40
0.254
0.145
0.266
0.186
0.314
0.619
0.572
0.302
0.375
0.541
0.778
0.458
0.363
0.733
0.81 1
0.339
0.847
0.295
0.455
0.224
0.49
Catholic Human Capital RQ
0.350
0.058
0.117
0.098
0.161
0.344
0.257
0.477
0.338
0.904
0.935
0.002
0.672
0.913
0.715
0.122
0.000
0.219
0.37 1
0.323
0.87
___-___
Herfindahl Index H ,
0.647
0.318
0.257
0.224
0.441
0.335
0.152
0.608
0.278
0.971
0.946
0.400
0.894
0.983
0.690
0.161
0.840
0.240
______
0.52 1
0.302
0.58
-
Notes: (i) Religious human capital is defined as the proportion of respondents who reported attending religious worship at least two or three times a month aged 11-12. (ii) Retention rate is the ratio of regular adult participants relative to those religiously active as children (religious human capital). (iii) Catholic human capital is the proportion of all respondents who identified themselves as Catholics and regular attenders at age I I - 12. (iv) The Herfindahl index is the sum of the squares of the religious market shares of each denomination or religious group, where the market refers only to those who attended at least two to three times monthlv.
31

IAN SMITH, JOHN W. SAWKINS AND PAUL T. SEAMAN
It is apparent that retention rates, defined as the ratio of regular adult religious participants relative to those who were religiously active as children, are greatest in three Catholic monopolies: Poland, Ireland, and the Philippines, and also among the Russian Orthodox. Indeed, retention is comparatively high in Catho- lic countries in general though clearly some are much less successful than others. The cases of Italy and Austria display poor retention relative to other Catholic monopoly countries. Even within religiously mixed countries, Catholicism is typically more able to retain the faithfulness of its membership over their life cycle than major Protestant denominations. Some evidence for this stylized fact is presented by Breen and Hayes (1996) in the cases of Great Britain and Northern Ireland. Undoubtedly a key factor accounting for this relative retention success is that Catholicism has a strong and significant input in the schooling of Catholics in many countries, reinforcing church-based religious socialization. In addition, the Catholic effect may be partly related to the strictness of the denomination. At least until the Second Vatican Council, it was a sin not to attend mass on a weekly basis. Table 2 lists Catholic human capital, RC,, for each country in the sample, where this is defined as the proportion of all respondents who attended a Catholic church frequently as children2. Beyond the influence of Catholicism, there are clearly other factors which contribute to the variation in retention rates and, thereby, for cross country differences in religious participation. Here we focus on social interactions and market structure.
2. Social Interactions
There is a positive covariance across individuals’ decisions regarding religious participation. This arises because the choices made by peers, colleagues, family members or other networks of people with which an individual interacts, or desires to interact, can be very influential in the decision making of that person. By conforming to the norms and behaviour of a reference group or network of relevant others, an individual invests in a set of positively valued social relations. Imitative behaviour in particular contexts can improve social interaction by maximizing opportunities for contact or by gaining the approval of a group. In the terminology of Becker (1996), a person thereby accumulates social capital which yields a stream of social benefits.
2. In the cases of Ireland and Poland, survey data were not reported on denominational affiliation as a child. The values for RC, in these two countries were imputed using the denomination of the respondents’ mothers.
32

THE ECONOMICS OF RELIGIOUS PARTICIPATION
Religious consumption has a major social component. It is a collective good in which people derive pleasure from worshipping and sharing in fellowship together. Thus if an individual chooses to engage in religious activities it may be with a desire to interact with others in a social network. An individual’s demand for religious services may be positively related, therefore, to the aggregate quantity demanded of the commodity. For the more widespread is religious participation, the greater the benefits of religious consumption in terms of social interactions. A corollary is that the desire to participate in religious activity and the volume of current participation are complements. So for a given level of personal investment in religious capital, the greater is the level of national religiosity, the higher is the probability that an individual will partici- pate regularly in religious activity. The individual utility function in (1) can be extended to incorporate this effect by specifying a religious market demand variable, R(t):
The higher is the general level of religious demand, R(t), the greater will be the contribution of religious consumption C(t) both to accumulating social capital, and to utility, U,, > 0 . In other words, increases in the level of organized religious activity in the religious economy raise the rate of return on religious participation for a given individual because C(t) is more productive for network- ing. More involvement will, in its turn, augment the level of overall religious demand leading to further growth in religious consumption as church linked networks expand. Thus, higher levels of aggregate religious participation will tend to reinforce individual consumption, dC(t)/dR(t) > 0.
3. Market Structure
Traditionally, low and declining rates of church attendance, especially in some northern and western European countries, are explained by weak demand, an inevitable outcome in a secularized and highly scientific social context which dismisses faith in the supernatural (Wilson 1982). The high level of formal religious participation in the United States, due to various ad hoc reasons such as its racial diversity or its origins as an immigrant based society, is identified as the exception to this. Recently, however, the secularization thesis has come under attack using simple theoretical models drawn from industrial economics.
33

IAN SMITH, JOHN W. SAWKINS AND PAUL T. SEAMAN
Given that surveys of subjective religious attitudes indicate high and persistent levels of religious belief, Stark and Iannaccone (1994) argue that low national rates of church attendance do not reflect weak (potential) demand from religious consumers at all but rather the behaviour of religious firms on the supply side. In particular, levels of religious consumption are related to religious market structure. Competition in religious supply generates much higher levels of religious activity than in monopolized religious markets.
This outcome arises from the religious market’s regulatory environment. An unregulated religious economy will have many active and specialized religious firms competing for market share. And such competition is argued to yield the same benefits in religious markets as elsewhere. It ensures the availability of a wide variety of differentiated religious products, stimulates innovation, and compels organizations to be responsive to consumer tastes and to make efficient use of their resources. In contrast, religious monopolies, usually heavily subsi- dized and regulated by the state, tend to be less diverse, innovative, responsive and efficient. It was Adam Smith in The Wealth of Nations who first argued that established religions face incentive problems in the same way as other state sponsored monopolies (Anderson 1988, Leathers and Raines 1992). Clerics paid by public taxes may be complacent, slothful and rigid, less willing to recruit a congregation by improving product quality or vigorous marketing. Case study evidence is provided by Hamberg and Petterson (1994) for Sweden where the Lutheran Church is state run and its clergy are civil servants. Given that barriers to entry in the religious market are naturally low, with both small capital requirements and start-up costs, the monopoly church must rely on the power of the state to protect its dominant and privileged position against potential new entrants.
Moreover, given that there are natural variations in the human condition based on age, sex, social class, health, and experience, there will be many market segments in religious demand. A single religious product line is intrinsically unable to satisfy the spectrum of tastes. A set of specialized firms will together be able to appeal to a much greater proportion of consumers than a monopoly firm. So overall levels of religious participation will tend to be high in pluralistic and competitive religious economies and low in those that are highly regulated. In this framework, free market religion explains why Americans are church going, and monopolized religion explains why Scandinavians are not. Empty churches, therefore, are a consequence of state regulation rather than underlying socio-economic change.
Following Iannaccone (199 1) the degree of competition can be measured indirectly by a Herfindahl index of religious firm concentration, H , , defined as the sum of the squares of the market shares:
34

THE ECONOMICS OF RELIGIOUS PARTICIPATION
I
$, is the religious market share of denominationj in country i, where the degree of competition is decreasing in H , (Hannah and Kay 1977). This index is an indirect or proxy indicator of actual levels of market competition since it identifies the degree of pluralism in the market, which is only a necessary rather than a sufficient condition for competition among religious firms. Table 2 lists the concentration index for each nation. The index is calculated using the religious market shares for twelve named Christian denominations and five non-Christian religions distinguished in the ISSP data3. In addition to Russia, the seven countries identified earlier with highly dominant Catholic denomina- tional shares display the most concentrated religious markets. The United States, as expected, and New Zealand are the most competitive. Note that the religious market is defined in terms of regular participants, consistent with the formulation of the variables described previously.
An informal comparison of Table 1 and Table 2 suggests that for countries with dominant Catholic monopolies such as Austria, Ireland, Italy, the Philip- pines and Poland, the postulated inverse relationship between attendance and concentration does not hold. They all tend to be characterised by both relatively high attendance and high market concentration. Iannaccone (1 99 1) attempts to explain the unanticipated success of Catholic monopoly with reference to its internal diversity. Within Catholicism itself there is quite a variety of worship styles ranging from Latin liturgies to folk masses or charismatic worship, an intra-denominational variance which is deemed not to be so apparent in some Protestant state churches. In addition, the links between the Catholic church and the state are claimed by Iannaccone to be fairly loose, though this assertion is questionable. Insofar as it is valid, the disincentive effects of heavy state regulation on clergy motivation will be much weaker in the case of Catholic monopolies and this may partially account for the sustained high attendance levels. The framework also needs to be modified in those cases where religious firms provide the organizational vehicle for social conflict as in Poland or for nationalistic resistance to external domination, as in Ireland, which will produce
3. The twelve named Christian denominations are Catholic, Greek Catholic, Orthodox, Baptist, Methodist, Lutheran, Presbyterian, Church of England etc., United ReformedKongregational, Episcopal, Unitarians, and the Protestant evangelical free church. The five non-Christian religions are Jewish, Moslem, Hindu, Buddhist, and Sikh.
35

IAN SMITH, JOHN W. SAWKNS AND PAUL T. SEAMAN
high levels of religious mobilisation even if the firms are (local) monopolies. The apparently anomalous performance of Catholic monopolies notwithstand- ing, the market model of religious participation is not without its critics. Bruce (1995) and Lechner ( 1 996) argue that the theory fails to explain historical trends in organized religious participation in Britain and the Netherlands respectively. The empirical work that follows permits a test of the market structure hypothesis. However, unlike previous studies, the hypothesis is nested within a model that incorporates religious human capital and social interaction effects.
111. SPECIFICATION AND ESTIMATION
Given the theoretical considerations outlined in Section I1 and the data listed and defined in Table I and Table 2, the following religious participation equation is specified and estimated:
Since the observed participation rate 6 is a fraction varying between 0 and 1, it is desirable that values of 6 predicted by the equation should be restricted to lie within this interval. This can be achieved by adopting the logit formulation for the dependent variable, L, , where:
L, =In ( - 1-9
With respect to the right hand side variables in (4), S, is religious human capital and RC, is Roman Catholic human capital which captures the fact that retention rates are greater within the Catholic denomination, though the precise mecha- nism through which this emerges is unclear. H , is the Herfindahl concentration index and u, is the error term.
It is not immediately apparent how to specify the impact of social interactions on religious participation. As argued earlier, the social interaction hypothesis implies that the probability of an individual participating in organized religion is causally and positively linked to the magnitude of religious market demand. The greater the demand, the greater are the network benefits of attending church
36

THE ECONOMICS OF RELIGIOUS PARTICIPATION
for a given individual. However, market demand is itself the dependent variable in an aggregate participation equation and so cannot be included on the right hand side. The solution adopted here arises from noticing that the social interaction mechanism entails that the larger the proportion of people in a given country that attended church regularly as children, the higher will be the proportion of these worshippers retained as active participants in their adult lives ceteris paribus. Levels of human capital in the religious economy, therefore, have a direct effect on adult religious participation that is reinforced by the positive effect of social interaction benefits which themselves increase with religious human capital. All else equal, this implies a quadratic relationshipbet- ween religious human capital and adult participation at the aggregate level. Thus it is appropriate for religious human capital to enter the equation in quadratic form with the expected signs on the coefficients of the terms in S, , p, < Oand p2 > 0. This non-linear formulation attempts to capture jointly both human capital and social interaction effects on religious participation. The main draw- back of the formulation is that it is not possible to distinguish readily the independent contributions of religious capital and social interactions.
It can be shown that the error term in the logit model is heteroscedastic. To obtain efficient parameter estimates and consistent standard errors, i t is appro- priate, therefore, to estimate equation (4) by Weighted Least Squares (WLS). We use a procedure suggested by Amemiya and Nold (1975). Since the sample size of eighteen countries is small, the results must be interpreted very cau- tiously. Column 1 of Table 3 lists the estimated logit coefficients with t-ratios reported in parentheses. The statistical performance of the equation is good for such a small sample. The signs of all of the estimated parameters are consistent with prior expectations and have reasonable magnitudes. Given thirteen degrees of freedom, the absolute critical value for statistical significance at the 5% level on a one tailed test is 1.77 (or 2.65 at the 1% level). All of the estimated coefficients are statistically significant at the 5% level or better, except for that on S, which only achieves significance at the 10% level. A joint F-test of zero restrictions on the coefficients of S, and S,2 easily rejects the null hypothesis at conventional significance levels, highlighting the importance of the non-linear relationship between religious human capital and participation. In short, the results provide primn facie empirical support for the roles of each of the determinants of religious participation.
37

IAN SMITH, JOHN W. SAWKINS AND PAUL T. SEAMAN
Table 3 Estimates for the Religious Participation Regressions
Dependent variable
-1.78 (2.45)
-2.70 (1.36)
5.09 (3.12)
2.58 (2.53)
-1.83 (2.23)
1.15
10. I 1 (0.56)
-0.43 (0.61)
0.01 (1.63)
0.21 (0.69)
-5.36 (0.35)
7.47 ~~ ~
Notes: (i) absolute values of t-ratios are in parentheses; (ii) 6 is the standard error of the regression.
It may be objected that the sizes of the samples for both Wales and Scotland are small relative to the rest of the countries surveyed. However, aggregating these observations with England to form the single country Great Britain and then re-estimating the equation did not yield any significant difference in the results.
Table 4 lists the actual participation rate by country, 6, together with that implied by the fitted values of the logistic regression. Inspection of the table indicates that the predicted values are close to actual values in most instances. However, the equation substantially underpredicts participation rates in the case of the Philippines and overpredicts by a large margin in the case of Italy, a country which has a surprisingly low retention rate by Catholic standards. However, the predictions are good for other countries where the religious economy is monopolized by the Catholic church, namely, Ireland, Austria, Poland, West Germany and Hungary. This is significant given the paradox described earlier of high levels of religious participation co-existing with religious monopoly in many Catholic countries, a relationship which generates a positive simple correlation in the sample between market structure and religious participation at the national level. The resolution offered here points to the importance of controlling for both religious human capital and social interaction variables to generate the expected negative regression coefficient on the Herfindahl index.
38

THE ECONOMICS OF RELIGIOUS PARTICIPATION
Tuble 4 Actual and Fitted Religious Participation Rates
Participation Rates . - ~ _ _ _ _. __ -
Country Actual Fitted Actual - Fitted
West Germany 0.148 0. I30 0.017
East Germany 0.036 0.07 I -0.036
England 0.161 0.154 0.008
Wales 0. I35 0.230 -0.095
Scotland 0.230 0. I97 0.033
Northern Ireland 0.568 0.578 -0.010
United States 0.436 0.380 0.056
Hungary
Net herlands
Italy
Ireland
Norway
Austria
Poland
0.194 0.2 17 -0.022
0.213 0.215 4.001
0.490 0.627 -0.137
0.760 0.756 0.004
0.086 0.056 0.030
0.261 0.272 4.01 1
0.673 0.645 0.028
Philippines 0.673 0.519 0.155
New Zealand 0.198 0.168 0.029
Russia 0.033 0.032 0.001
0.2 I2 0.275 -0.063 Australia _____
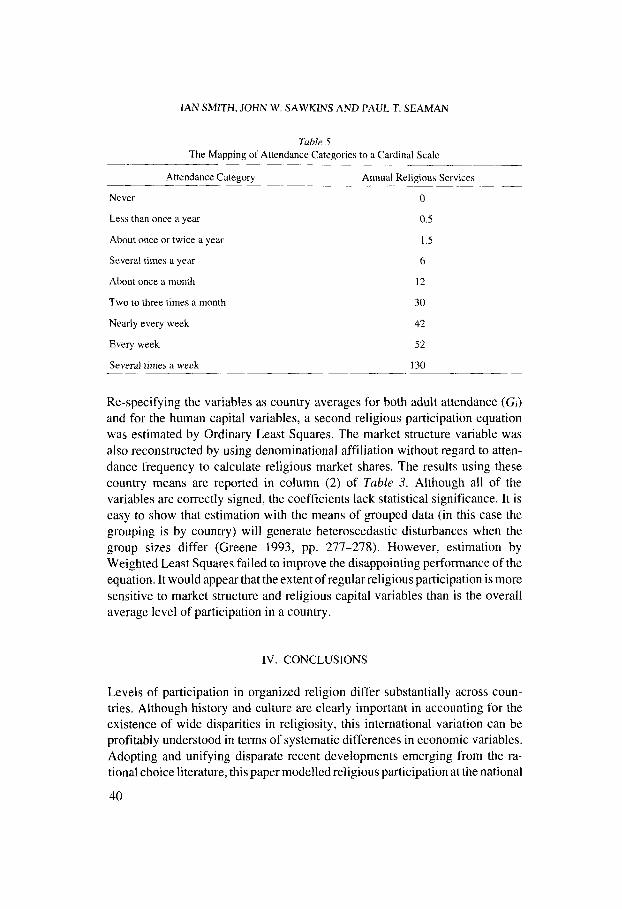
A disadvantage of defining the religious participation variable in terms of the fraction of the sample attending religious services at least two or three times per month is that considerable sample information regarding the religious activity of less frequent participants remains unexploited. As an alternative measure of involvement in organized religion, it is possible to compute the average number of services attended annually per sample respondent by country. The ISSP survey generally allocates each respondent to one of nine frequency categories listed below in Table 5. A corresponding annual number of religious services attended can be assigned to each frequency category and used to estimate a national average, with the number of respondents by category as weights. Of course, there are other equally plausible schemes that map the categorical scale on to the cardinal scale though the variations are likely to be fairly minor.
39
IAN SMITH, JOHN W. SAWKlNS AND PAUL T. SEAMAN
Tuble 5 The Mapping of Attendance Categories to a Cardinal Scale
__._ Attendance Category Annual Religious Services
~~~
Never 0
Less than once a year 0.5
1.5 About once or twice a year
Several times a year 6
About once a month 12
Two to three times a month 30
Nearly every week 42
Eveiy week 52
Several times a week 130
Re-specifying the variables as country averages for both adult attendance (G;) and for the human capital variables, a second religious participation equation was estimated by Ordinary Least Squares. The market structure variable was also reconstructed by using denominational affiliation without regard to atten- dance frequency to calculate religious market shares. The results using these country means are reported in column (2) of Table 3. Although all of the variables are correctly signed, the coefficients lack statistical significance. It is easy to show that estimation with the means of grouped data (in this case the grouping is by country) will generate heteroscedastic disturbances when the group sizes differ (Greene 1993, pp. 277-278). However, estimation by Weighted Least Squares failed to improve the disappointing performance of the equation. It would appear that the extent of regular religious participation is more sensitive to market structure and religious capital variables than is the overall average level of participation in a country.
IV. CONCLUSIONS
Levels of participation in organized religion differ substantially across coun- tries. Although history and culture are clearly important in accounting for the existence of wide disparities in religiosity, this international variation can be profitably understood in terms of systematic differences in economic variables. Adopting and unifying disparate recent developments emerging from the ra- tional choice literature, this paper modelled religious participation at the national
40

THE ECONOMICS OF RELIGIOUS PARTICIPATION
level as a function of investment in religious human capital, social interactions and religious market structure. Using data for eighteen countries derived from the 199 1 religious questionnaire of the International Social Survey Programme, it has been possible to demonstrate the empirical significance of these variables at the macro level by estimating simple regression equations. The small size of the sample naturally entails that the results must be treated cautiously. Further replication with a much larger number of countries is clearly required, though this is currently constrained by data availability.
The religious market in the countries surveyed is dominated by Christian denominations. Given the small numbers in the sample of those participating in non-Christian religions, it has not proved possible to test whether the theoretical framework applies equally to other religions or indeed to the religious partici- pation of Christians in non-western cultures. Ideally, data on religious practice across a wider range of countries and cultural conditions would be required to permit such a test. A larger sample would also facilitate examination of the role of the level of economic development, if any, on religious involvement.
REFERENCES
Anderson, G.M. (1988). Mr Smith and the Preachers: The Economics of Religion in the Wealth of
Amemiya, T. and F. Nold (1975). A Modified Logit Model, Review ofEconomics und Stufisrics.
Azzi, C. and R. Ehrenberg ( I 975). Household Allocation of Time and Church Attendance, Journul
Becker, G.S. ( I 996). Accounting jiw Tastes. Cambridge: Harvard University Press. Breen, R. and B.C. Hayes (1996). Religious Mobility in the UK, Journa/ ofthe R o y 1 Srutisticu/
Bruce, S. (1995). The Truth about Religion in Britain, Journu1,for the Scientijic Srudv of Religion.
Chiswick, B.R. (1993). The Skills and Economic Status of American Jewry: trends over the past
Drakopoulou Dodd, S. and P.T. Seaman (1995). Religion and the Self-Employed: Some British
Ehrenberg, R.G. ( I 977). Household Allocation of Time and Religiosity: Replication and Extension.
Greene, W.H. ( I 993). Econometric Anulysis. New York: Macmillan. Crier, R. (1997). The Effect of Religion on Economic Development: A Cross National Study of 63
Former Colonies, Kyklos. SO: 47-62. Hamberg, E.M. and T. Petterson (1994). The Religious Market: Denominational Competition and
Religious Participation in Contemporary Sweden, Journa1,for rhe Scientific Study cfReligion.
Nations, Juurnul offoliricul Economy. 96: 1066-1088.
57: 255-257.
of Political Economy. 84: 27-56.
Society, Series A. 159: 493-504.
34: 417430.
half century, Journul of Labor Economics. 11: 229-242.
Data, Discussion Paper in Economics No. 66, University of Dundee.
Journal of Political Economy. 85: 41 5 4 2 3 .
33: 205-216. Hannah, L. and J.A. Kay (1977). Concentration in Mudern Industry. London: Macmillan.
41

IAN SMITH, JOHN W. SAWKINS AND PAUL T. SEAMAN
Heath, W.C., M.S. Waters and J.K. Watson (1995). Religion and Economic Welfare: An Empirical Analysis of State Per Capita Income, Journal of Economic Behaviour and Organization. 27:
Hull, B.B. and F. Bold (19%). Preaching Matters: Replication and Extension, Journal ofEconotnic Behaviour and Organisation. 27: 143-1 50.
Iannaccone, L.R. (1991). The Consequences of Religious Market Structure: Adam Smith and the Economics of Religion, Rationality and Society. 3: 156-177.
Iannaccone, L.R. (1995). Household production, human capital and the economics of religion, in: M. Tommasi and K. Ierulli (eds.), The New Economics of Human Behavior. Cambridge: Cambridge University Press: 172-187.
Leathers, C.G. and P.J. Raines (1992). Adam Smith on Competitive Religious Markets, History of Political Economy. 24: 499-5 13.
Lechner, F.J. (1996). Secularization in the Netherlands?, Journulforrhe Scientific Srudy ofReligion. 35: 252-264.
Lehrer, E.L. (1995). The effects of religion on the labor supply of married women, Social Science Research. 24: 1-21.
Lehrer, E.L. andC.U. Chiswick( 1993). Religion as a Determinant ofMarital Stability, Demography. 30: 385-404.
Long, S.H. and R.F. Settle (1977). Household Allocation of Time and Church Attendance: Some Additional Evidence, Journal of Political Economy. 85: 409413.
Mosher, W.D., L.B. Williams and D.P. Johnson (1992). Religion and Fertility in the US: New Patterns, Demography. 29: 199-2 14.
Neuman, S. (1986). Religious observance within a human capital framework: theory and applica- tion, Applied Economics. 18: 1193-1202.
Oshorne, R.D. and R.J. Comack (1986). Unemployment and Religion in Northern Ireland, Eco- nomic and Social Review. 17: 215-225.
Sander, W. (1992). The Effects of Ethnicity and Religion on Educational Attainment, Economics nfEducation Review. I 1 : I 19-1 35.
Sawkins, J.W., P.T. Seaman and H.C.S. Williams (1997). Church Attendance in Great Britain: An Ordered Logit Approach, Applied Economics. 29: 125-134.
Stark, R. and L.R. lannaccone (1994). A supply-side reinterpretation of the ‘secularization’ of Europe, Journal for the Scientific Study of Religion. 33: 230-252.
Steen, T.P. (1996). Religion and Earnings: Evidence from the NLS Youth Cohort, International Journal of Social Economics. 23: 47-58.
Sullivan, D.H. ( 1985). Simultaneous Determination of Church Contributions and Church Atten- dance, Economic Inquiry. 23: 309-320.
Tomes, N. (1985). Religion and the Earnings Function, American Economic ReviPw. 75: 245-250. Ulbrich, H. and M. Wallace (1984). Women’s Work Force Status and Church Attendance, Journal
Wilson, B. ( 1982). Religion in Sociological Perspective. Oxford: Oxford University Press. Yang, B. (1992). The Economy and Suicide. A Time Series Study of the USA, American Journal
1 29- 142.
for the Scientific Study of Religion. 23: 341-350.
ojEconomic.7 and Sociology. 5 1 : 87-99.
SUMMARY
Levels of participation in organized religion differ markedly across countries, a stylized fact which has resisted a general theoretical explanation. The claim of this paper is that the international variation in religious attendance can be understood in terms of systematic differences in socio-eco- nomic variables. In particular, national religious participation is modelled as a function of investment
42
THE ECONOMICS OF RELIGIOUS PARTICIPATION
in religious human capital, social interactions and religious market structure. Using data for eighteen countries derived from the religious questionnaire of the International Social Survey Programme, the empirical significance of these variables is demonstrated by estimating simple regression equations.
ZUSAMMENFASSUNG
Es wird allgemein angenommen, dass sich die Teilnahme an kirchlichen Aktivitaten von Land zu Land unterscheidet. Fur diese Annahme gibt es gegenwirtig keine uberzeugende theoretische Erklarung. Dieser Artikel analysiert die Unterschiede in der Teilnahme an kirchlichen Aktivititen anhand sozio-okonomischer Variablen. Nationale Unterschiede in der Religionspartizipation kon- nen vor allem durch unterschiedliche Investitionen in das religiose Humankapital, unterschiedliche soziale Interaktionen und Unterschiede in der Struktur des Religionsmarktes erklart werden. Mit Hilfe von einfachen Regressionsmodellen werden Daten aus 18 Landern, die aus Fragebogen des International Social Survey Programme stammen, ausgewertet, urn die empirische Signifikanz dieser Variablen zu untermauern.
RESUME
Les niveaux de participation & une religion organiste different de f q o n marquCe entre lea pays, fait particulier qui tchappe ?I des explications thtoriques d’ordre gtntral. Cette etude aboutit a la conclusion que les variations internationales en matikre d e participation religieuse peuvent se comprendre en termes des difftrences systtmatiques qui existent dans les variables socio- tconomiques. En particulier, la participation religieuse nationale est modelk comme ttant une fonction de I’investissement dans le capital humain religieu, les interactions sociales et la structure du march6 religieu. A partir d’informations provenant de dix-huit pays, tirtes du questionnaire religieu tlabori par le Programme international d’ttude sociale, la signification empirique de ces variables est dtmontrke en estimant de simples tquations de regression.
43
