maritime economics
TRANSCRIPT
CLARKSON RESEARCH SERVICES LTD
1
Maritime Economics 3rd Edition
Wonders are many on earth,and the greatest of these is man,who rides the ocean and takes his waythrough the deeps, through wind-sweptvalleys of perilous seasthat surge and sway.
The chorus in Sophocles’ Antigone422BC Trans. R. C. Jebb
CLARKSON RESEARCH SERVICES LTD
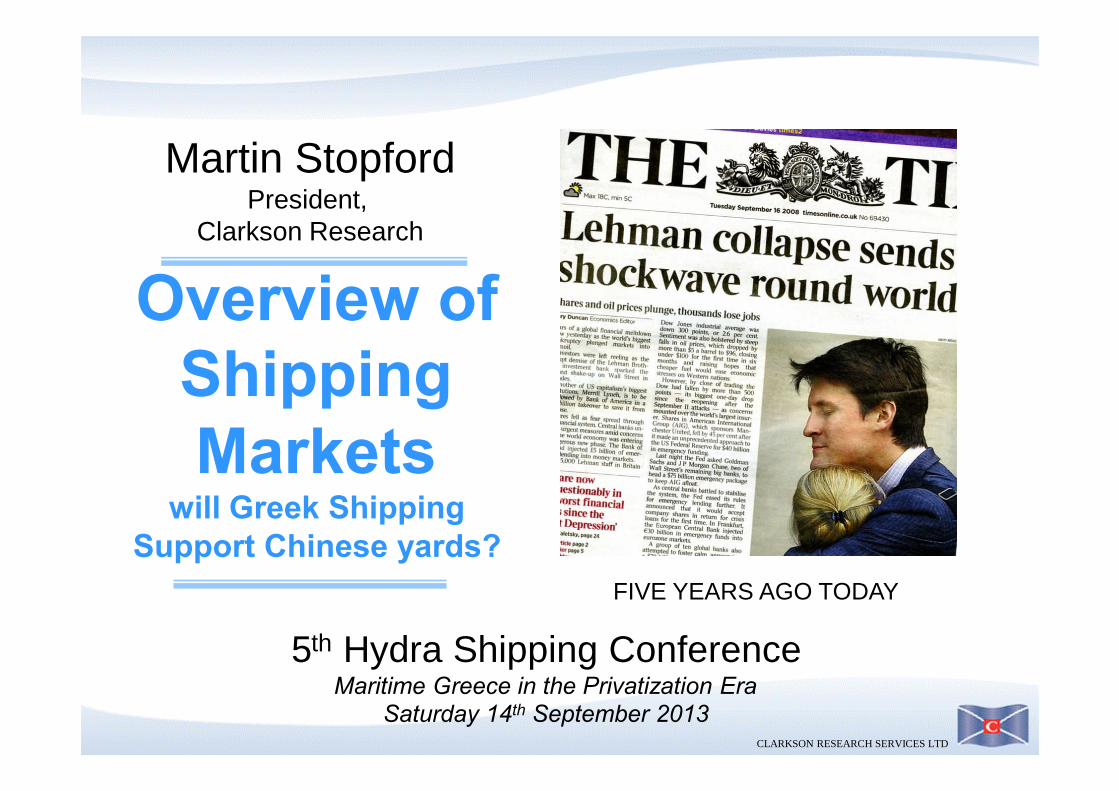
Overview ofShippingMarkets
will Greek ShippingSupport Chinese yards?
Martin StopfordPresident,
Clarkson Research
5th Hydra Shipping ConferenceMaritime Greece in the Privatization Era
Saturday 14th September 2013
FIVE YEARS AGO TODAY
CLARKSON RESEARCH SERVICES LTD
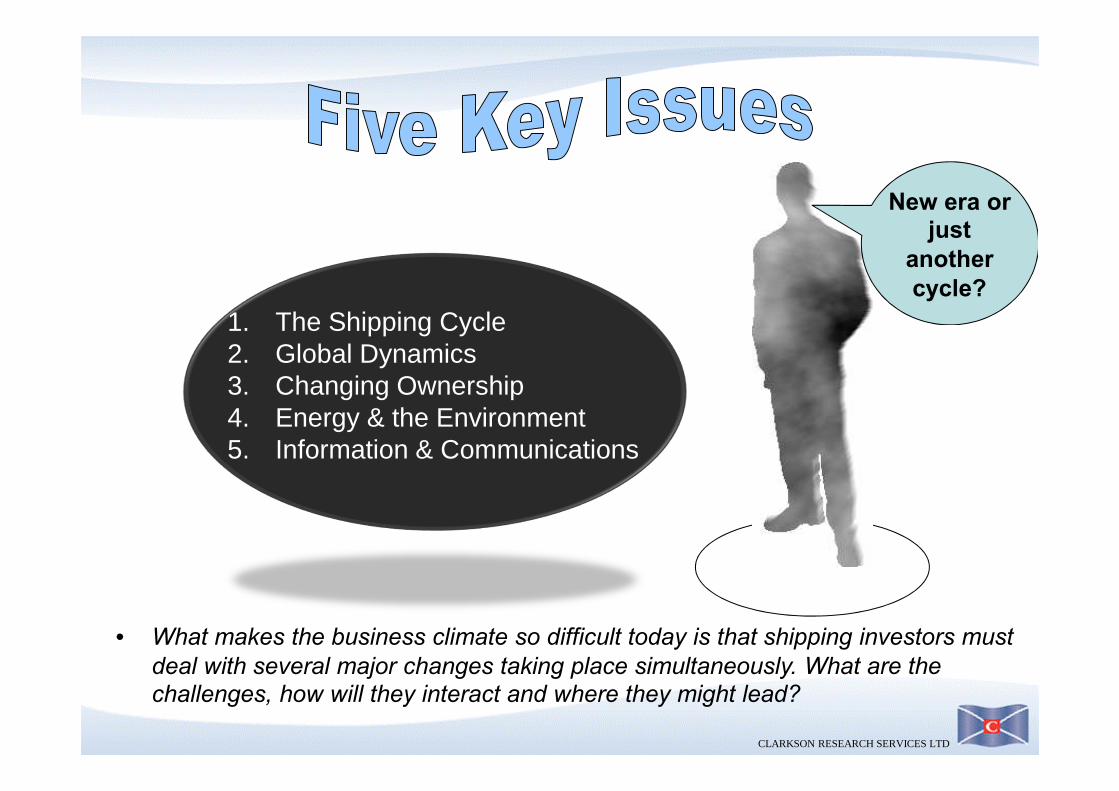
1. The Shipping Cycle2. Global Dynamics3. Changing Ownership4. Energy & the Environment5. Information & Communications
• What makes the business climate so difficult today is that shipping investors mustdeal with several major changes taking place simultaneously. What are thechallenges, how will they interact and where they might lead?
New era orjust
anothercycle?
CLARKSON RESEARCH SERVICES LTD
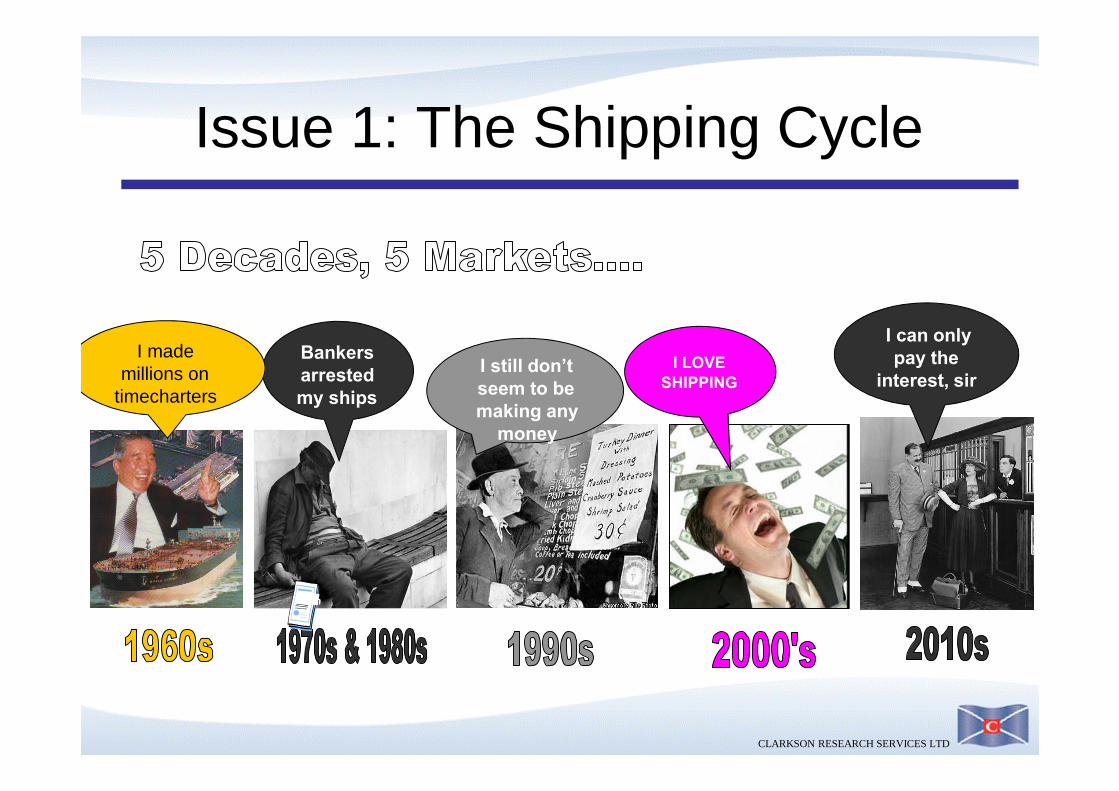
I LOVESHIPPING
I still don’tseem to bemaking any
money
Bankersarrestedmy ships
I mademillions on
timecharters
I can onlypay the
interest, sir
Issue 1: The Shipping Cycle
CLARKSON RESEARCH SERVICES LTD
0
10
20
30
40
50
60
1980
1981
1982
1983
1984
1985
1986
1987
1988
1989
1990
1991
1992
1993
1994
1995
1996
1997
1998
1999
2000
2001
2002
2003
2004
2005
2006
2007
2008
2009
2010
2011
2012
2013
Cla
rkse
aIn
dex
$00
0/da
y
Source: Clarkson Research Services Ltd
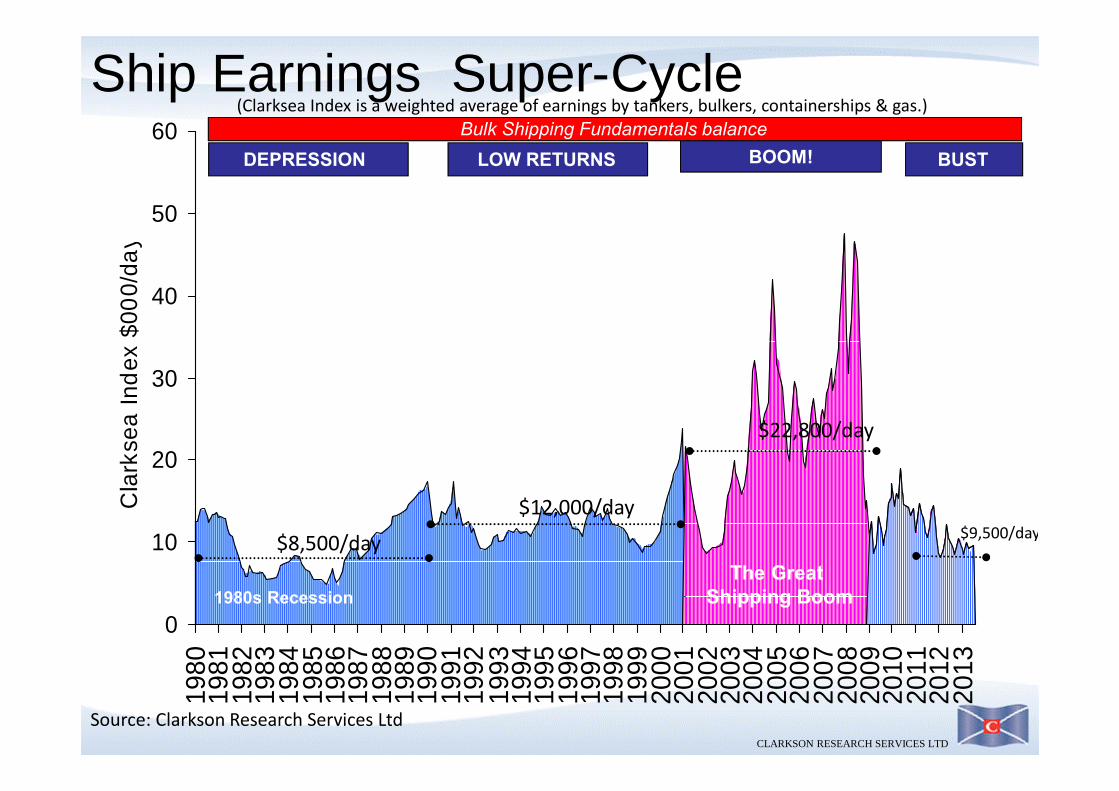
The GreatShipping Boom1980s Recession
$8,500/day$12,000/day
$22,800/day
DEPRESSION LOW RETURNS BOOM!Bulk Shipping Fundamentals balance
BUST
$9,500/day
Ship Earnings Super-Cycle(Clarksea Index is a weighted average of earnings by tankers, bulkers, containerships & gas.)
CLARKSON RESEARCH SERVICES LTD
0
10
20
30
40
50
60
1980
1981
1982
1983
1984
1985
1986
1987
1988
1989
1990
1991
1992
1993
1994
1995
1996
1997
1998
1999
2000
2001
2002
2003
2004
2005
2006
2007
2008
2009
2010
2011
2012
2013
Cla
rkse
aIn
dex
$000
/day
and
$m
illio
n
Source: Clarkson Research Services Ltd
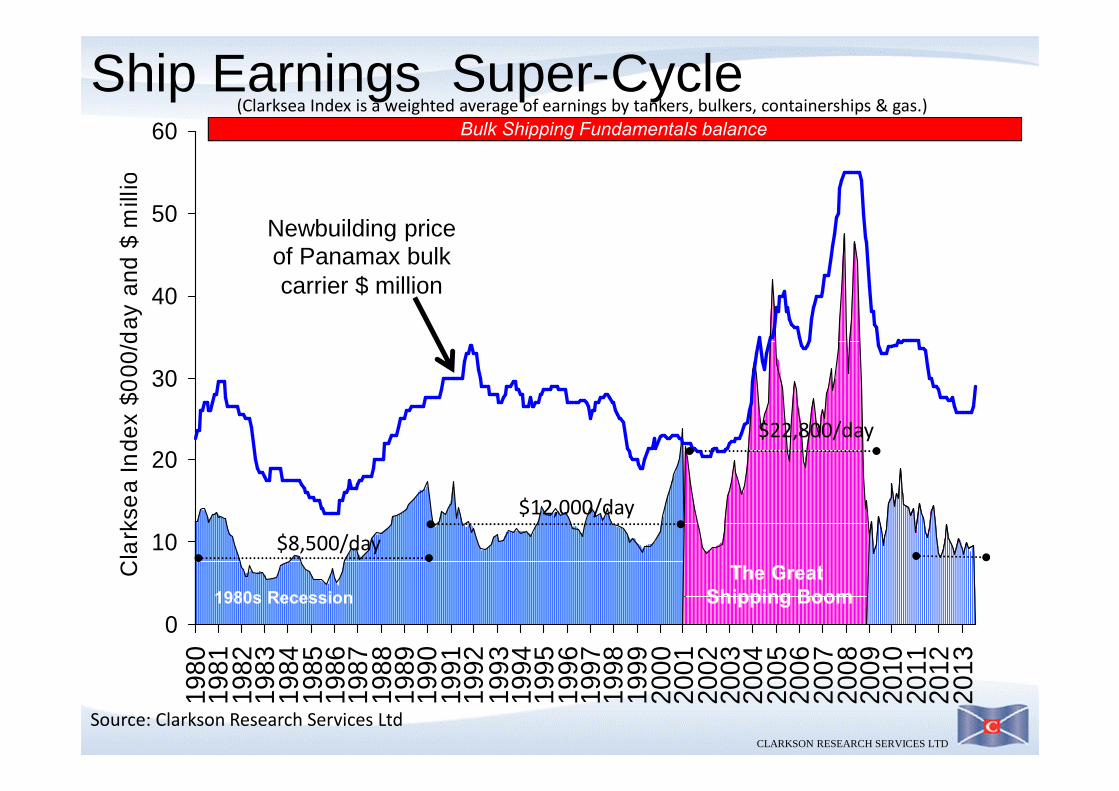
The GreatShipping Boom1980s Recession
$8,500/day$12,000/day
$22,800/day
Bulk Shipping Fundamentals balance
Ship Earnings Super-Cycle(Clarksea Index is a weighted average of earnings by tankers, bulkers, containerships & gas.)
Newbuilding priceof Panamax bulkcarrier $ million
CLARKSON RESEARCH SERVICES LTD
0102030405060708090
100
Jan-
80Ja
n-82
Jan-
84Ja
n-86
Jan-
88Ja
n-90
Jan-
92Ja
n-94
Jan
'96Ja
n-98
Jan-
00Ja
n-02
Jan-
04Ja
n'06
Jan
'08Ja
n'10
Jan
'12
pric
e$
mill
ion
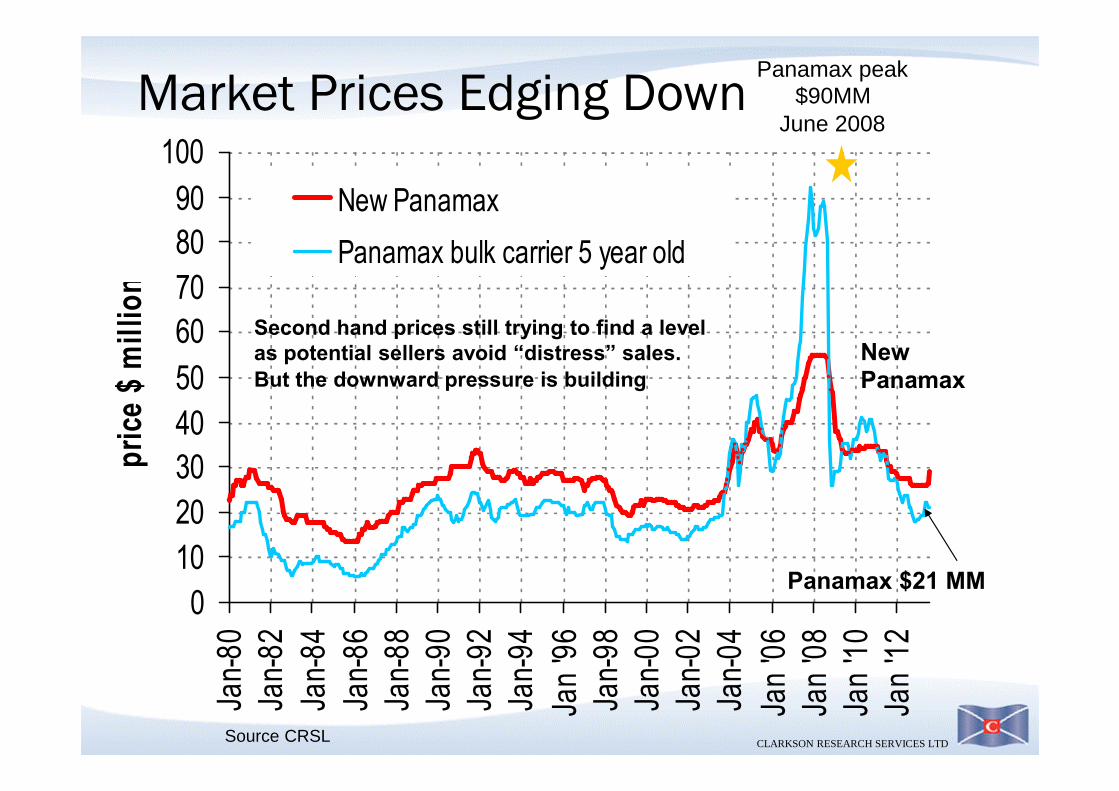
New Panamax
Panamax bulk carrier 5 year old
Panamax peak$90MM
June 2008Market Prices Edging Down
Source CRSL
Panamax $21 MM
NewPanamax
Second hand prices still trying to find a levelas potential sellers avoid “distress” sales.But the downward pressure is building
CLARKSON RESEARCH SERVICES LTD
0%20%40%60%80%
100%120%140%160%180%200%
Jan-
80Ja
n-82
Jan-
84Ja
n-86
Jan-
88Ja
n-90
Jan-
92Ja
n-94
Jan
'96
Jan-
98Ja
n-00
Jan
'02
Jan
'04
Jan
'06
Jan
'08
Jan
'10
Jan
'12
5ye
arol
d%
new
pric
emill
ion
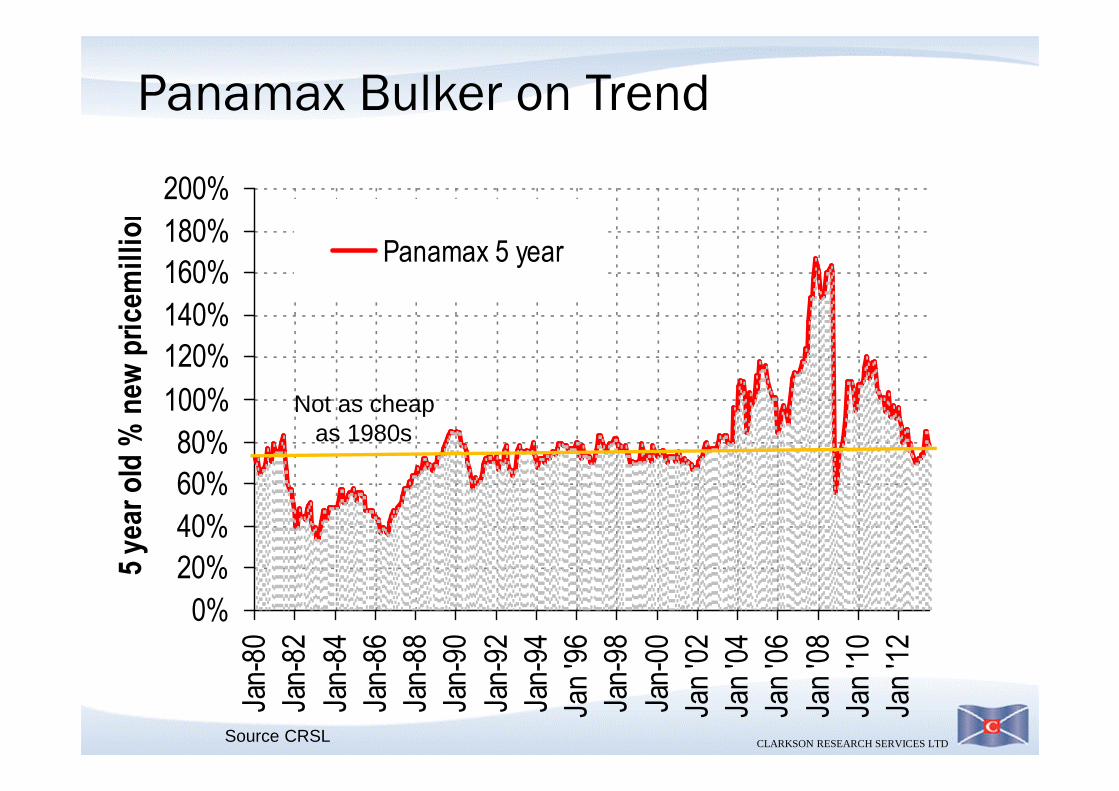
Panamax 5 year
Panamax Bulker on Trend
Source CRSL
Not as cheapas 1980s
CLARKSON RESEARCH SERVICES LTD
-10%-8%-6%-4%-2%0%2%4%6%8%
10%12%14%
1966
1968
1970
1972
1974
1976
1978
1980
1982
1984
1986
1988
1990
1992
1994
1996
1998
2000
2002
2004
2006
2008
2010
2012
2014
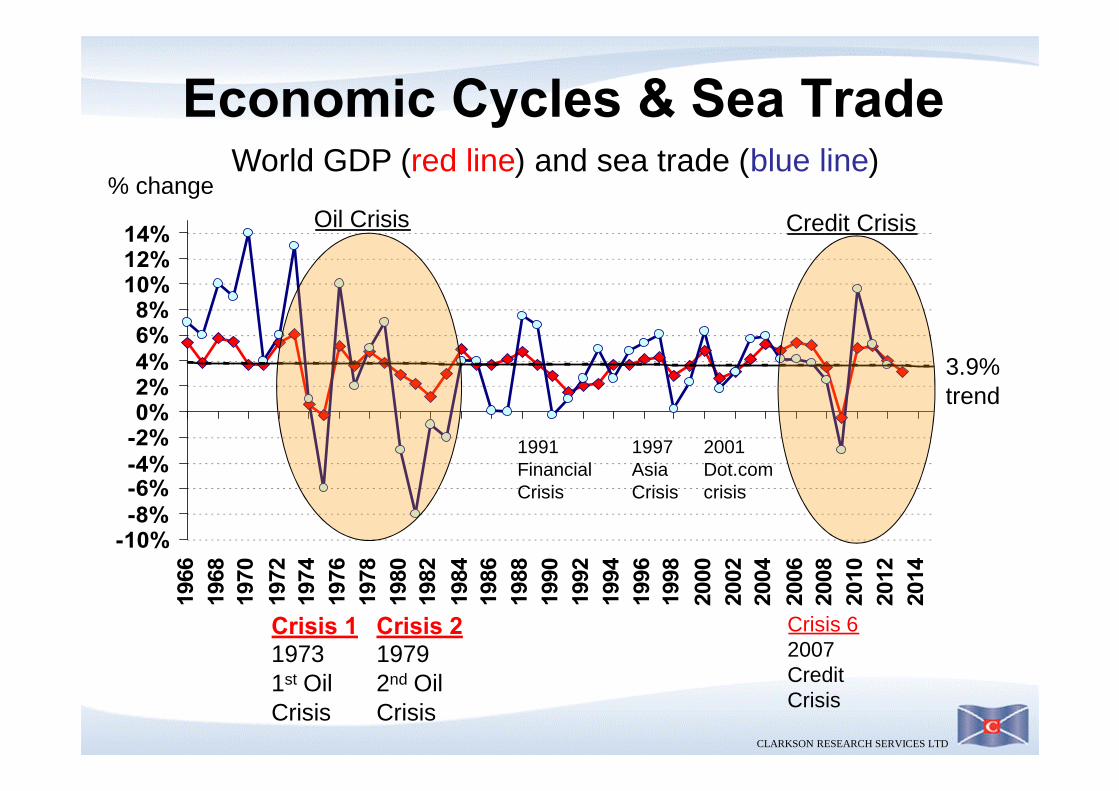
Economic Cycles & Sea TradeWorld GDP (red line) and sea trade (blue line)
Crisis 119731st OilCrisis
2001Dot.comcrisis
Crisis 219792nd OilCrisis
1991FinancialCrisis
1997AsiaCrisis
Crisis 62007CreditCrisis
% changeOil Crisis Credit Crisis
3.9%trend
CLARKSON RESEARCH SERVICES LTD
23/09/2013 10
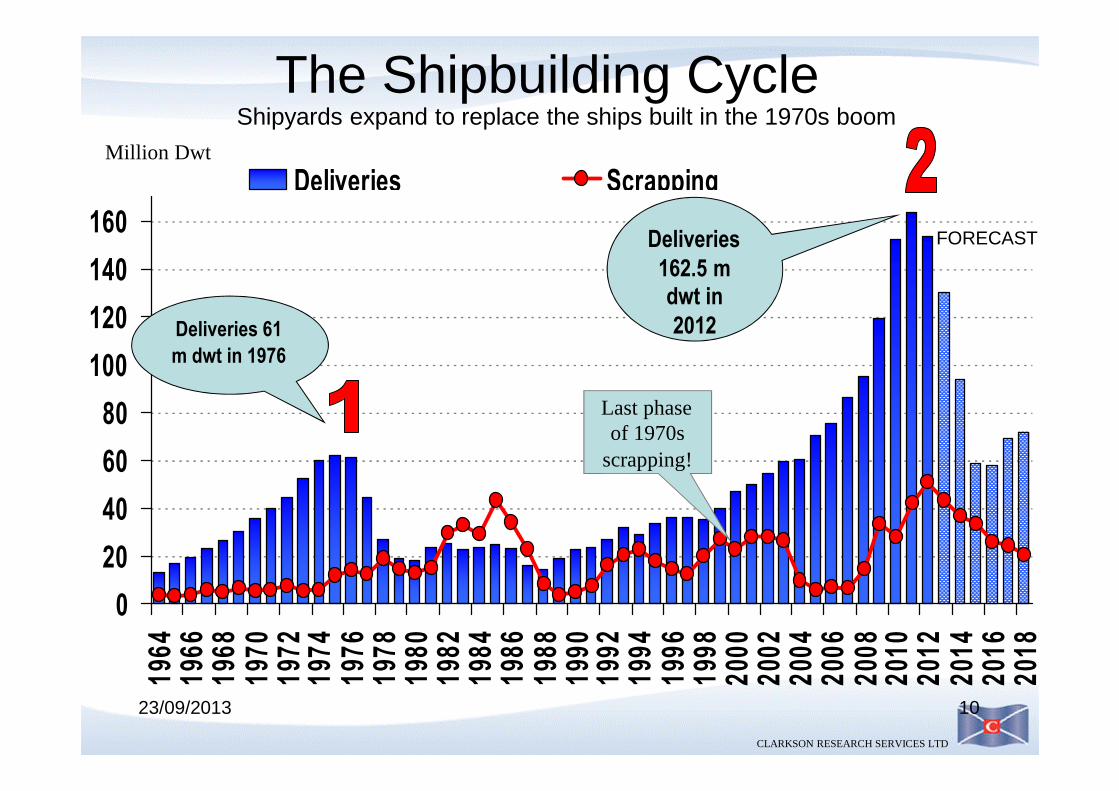
FORECAST
The Shipbuilding Cycle
0
20
40
60
80
100
120
140
160
1964
1966
1968
1970
1972
1974
1976
1978
1980
1982
1984
1986
1988
1990
1992
1994
1996
1998
2000
2002
2004
2006
2008
2010
2012
2014
2016
2018
Deliveries Scrapping
Deliveries 61m dwt in 1976
Deliveries162.5 mdwt in2012
Last phaseof 1970s
scrapping!
Million Dwt
Shipyards expand to replace the ships built in the 1970s boom
CLARKSON RESEARCH SERVICES LTD
0
10
2030
40
50
60
70
80
90
100
1902
1907
1912
1917
1922
1927
1932
1937
1942
1947
1952
1957
1962
1967
1972
1977
1982
1987
1992
1997
2002
2007
2012
%to
tals
hips
laun
ched
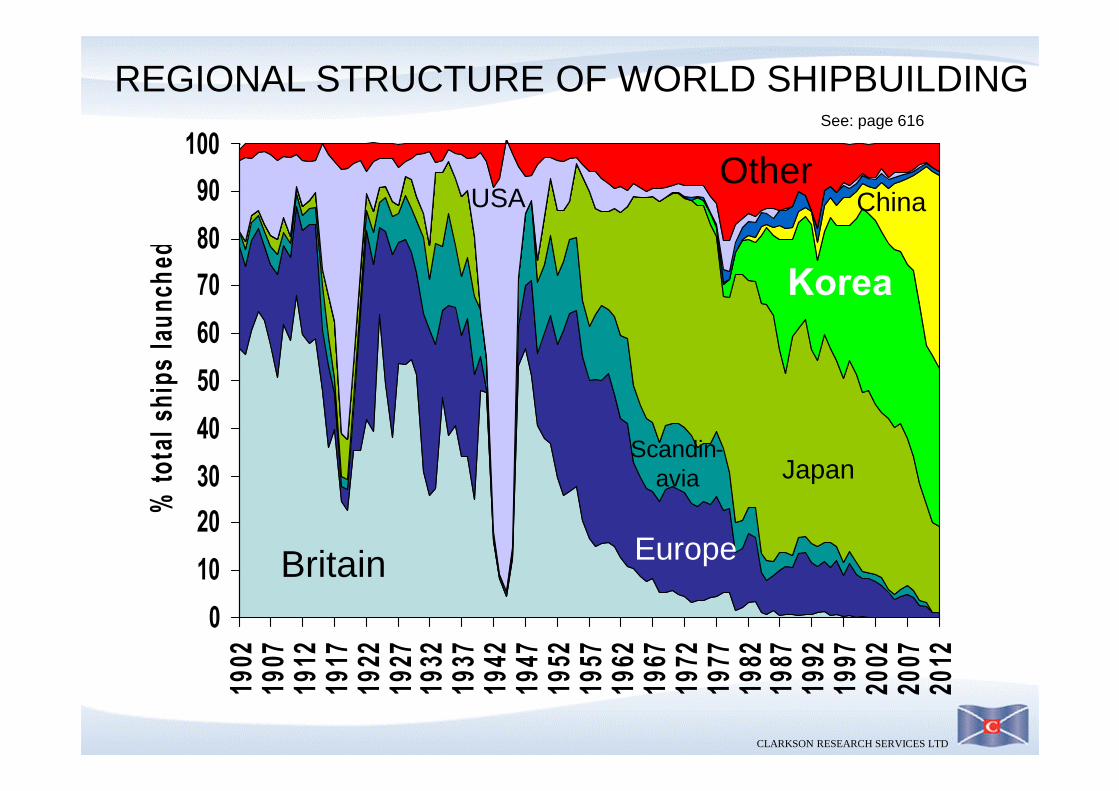
Korea
Japan
EuropeBritain
Other
Scandin-avia
USA China
REGIONAL STRUCTURE OF WORLD SHIPBUILDINGSee: page 616
CLARKSON RESEARCH SERVICES LTD
0
200
400
600
800
1,000
1,200
1,400
1,600
1963
1967
1971
1975
1979
1983
1987
1991
1995
1999
2003
2007
2011
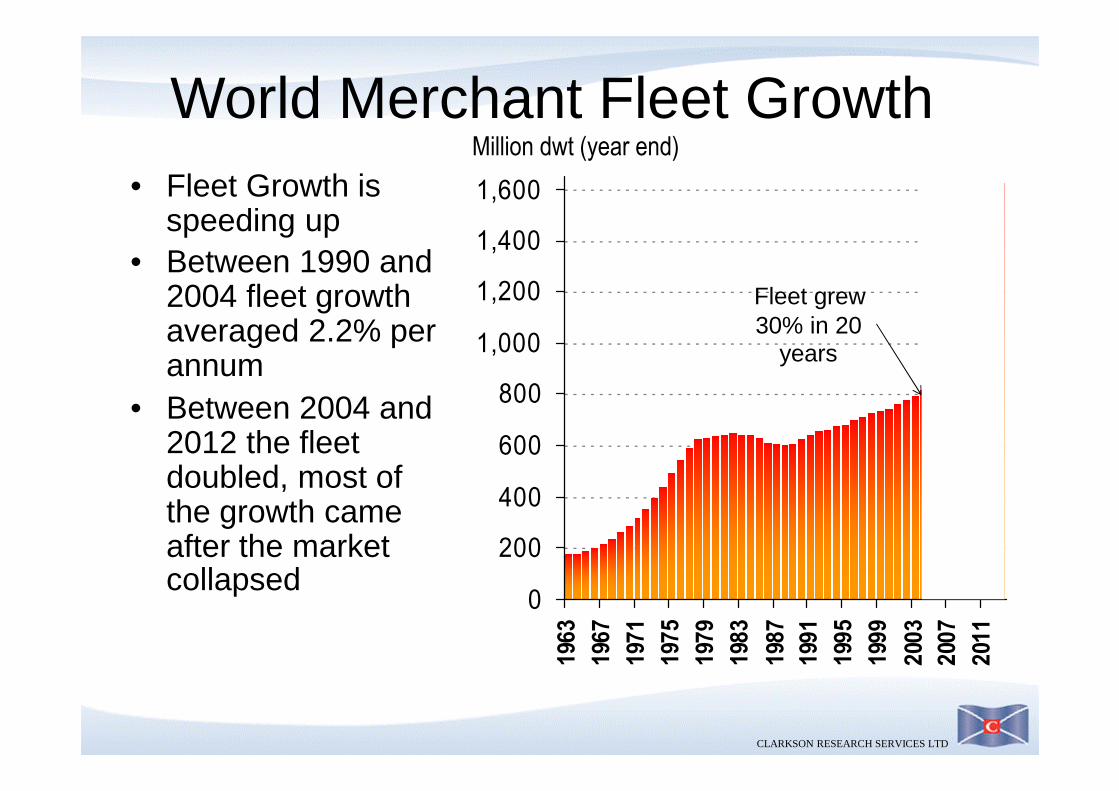
World Merchant Fleet GrowthMillion dwt (year end)
• Fleet Growth isspeeding up
• Between 1990 and2004 fleet growthaveraged 2.2% perannum
• Between 2004 and2012 the fleetdoubled, most ofthe growth cameafter the marketcollapsed
Fleet grew30% in 20
years
CLARKSON RESEARCH SERVICES LTD
0
200
400
600
800
1,000
1,200
1,400
1,600
1964 1968 1972 1976 1980 1984 1988 1992 1996 2000 2004 2008 2012
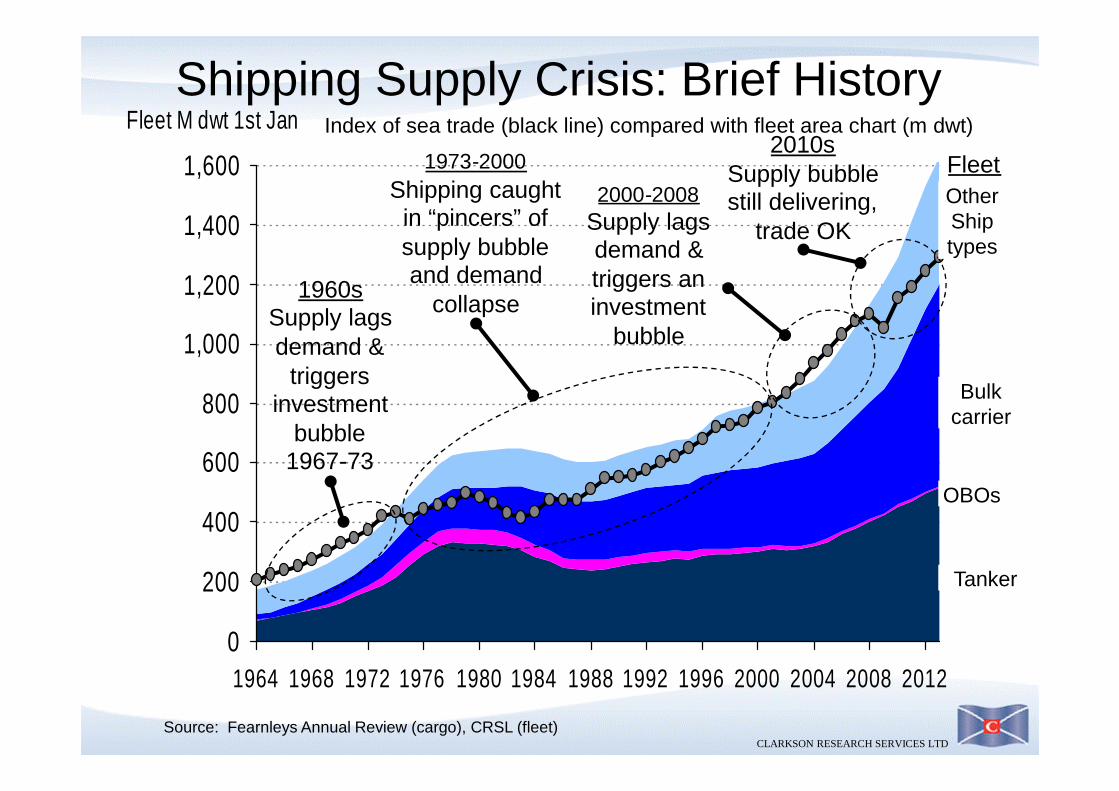
Fleet M dwt 1st Jan
Source: Fearnleys Annual Review (cargo), CRSL (fleet)
Tanker
BulkcarrierOther
OBOs
Index of sea trade (black line) compared with fleet area chart (m dwt)
Shipping Supply Crisis: Brief History
1973-2000Shipping caughtin “pincers” ofsupply bubbleand demand
collapse
2000-2008Supply lagsdemand &triggers aninvestment
bubble
1960sSupply lagsdemand &
triggersinvestment
bubble1967-73
2010sSupply bubblestill delivering,
trade OKOtherShiptypes
Fleet
CLARKSON RESEARCH SERVICES LTD
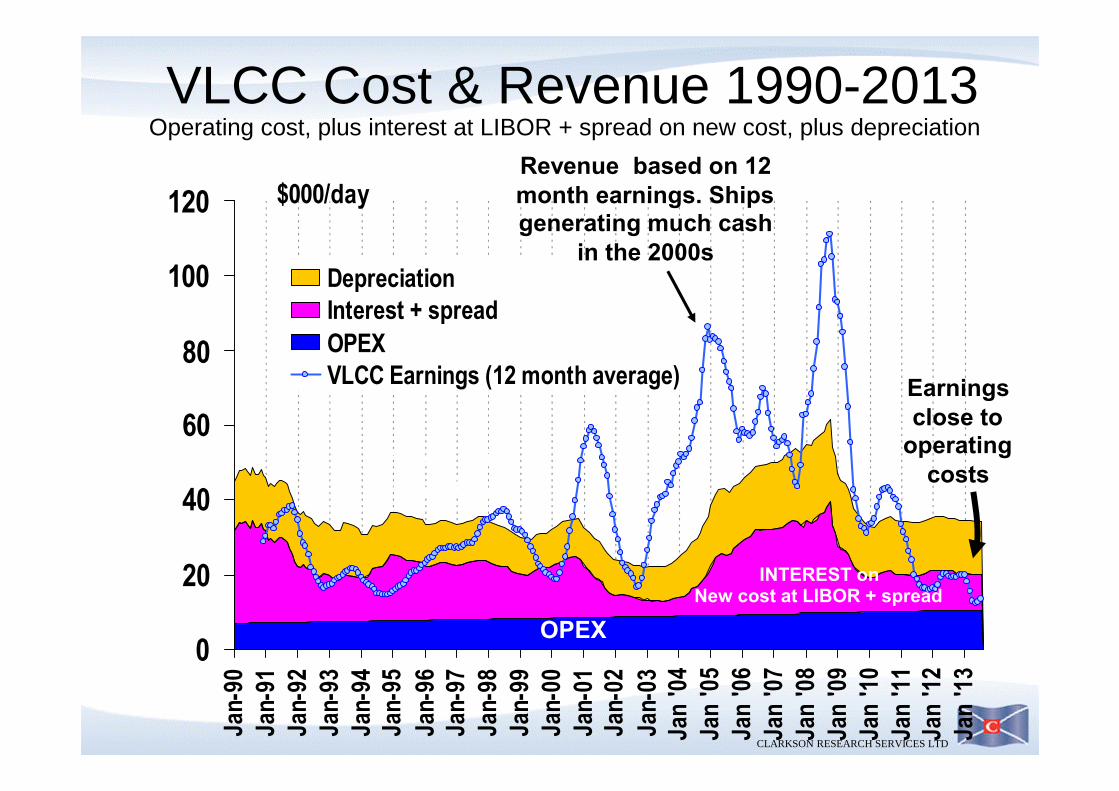
VLCC Cost & Revenue 1990-2013
0
20
40
60
80
100
120Ja
n-90
Jan-
91Ja
n-92
Jan-
93Ja
n-94
Jan-
95Ja
n-96
Jan-
97Ja
n-98
Jan-
99Ja
n-00
Jan-
01Ja
n-02
Jan-
03Ja
n'0
4Ja
n'0
5Ja
n'0
6Ja
n'0
7Ja
n'0
8Ja
n'0
9Ja
n'1
0Ja
n'1
1Ja
n'1
2Ja
n'1
3
$000/day
DepreciationInterest + spreadOPEXVLCC Earnings (12 month average)
Operating cost, plus interest at LIBOR + spread on new cost, plus depreciation
INTEREST onNew cost at LIBOR + spread
Depreciation –over 20 yrs
Revenue based on 12month earnings. Shipsgenerating much cash
in the 2000s
OPEX
Earningsclose to
operatingcosts
CLARKSON RESEARCH SERVICES LTD
23/09/2013 ©Martin Stopford 15
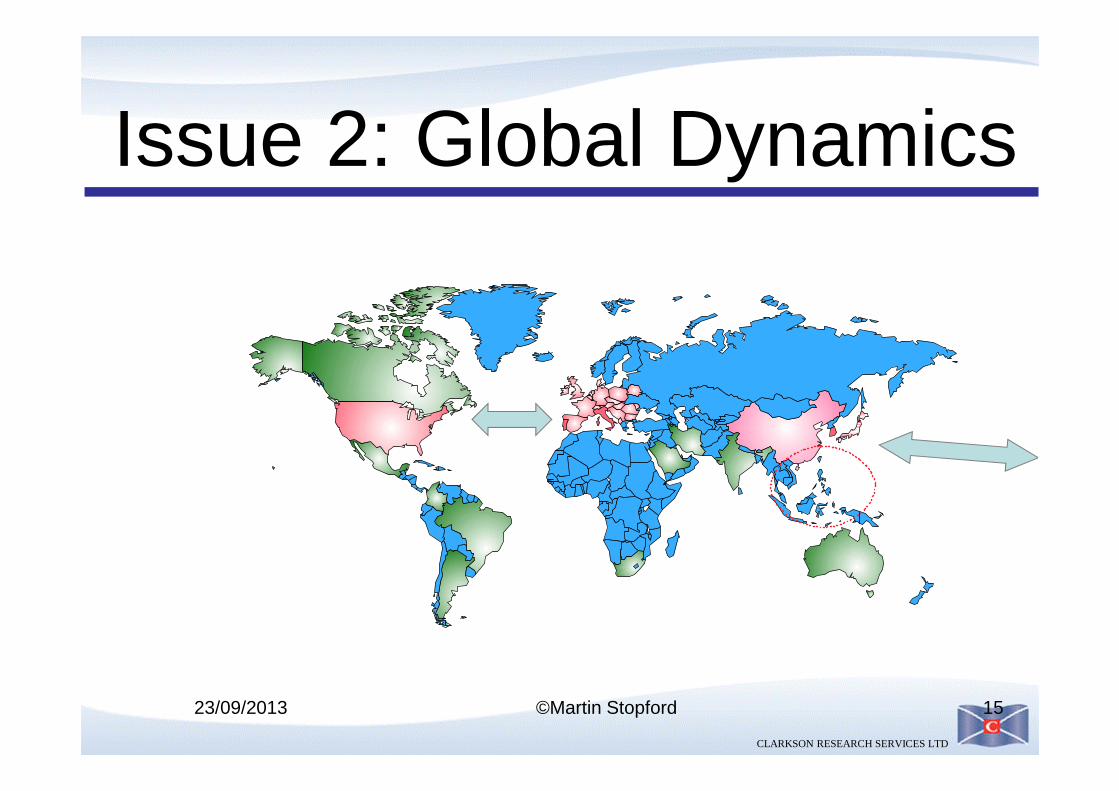
Issue 2: Global Dynamics
CLARKSON RESEARCH SERVICES LTD
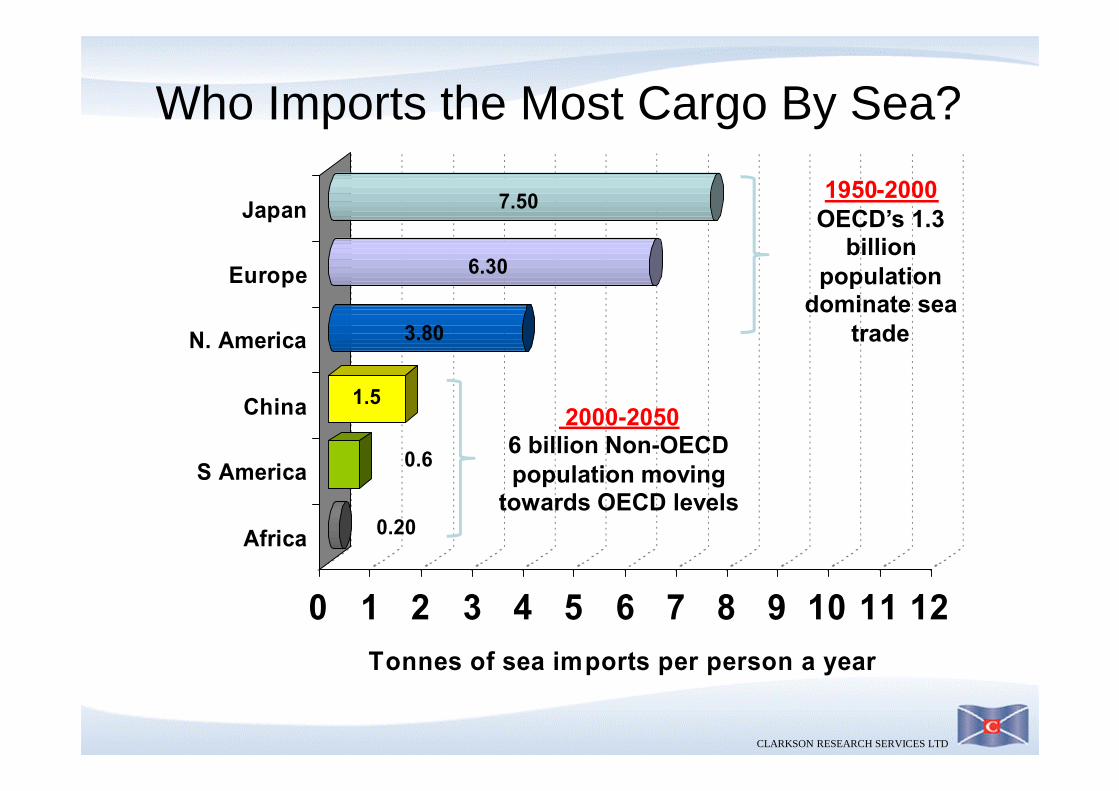
0.20
0.6
1.5
3.80
6.30
7.50
0 1 2 3 4 5 6 7 8 9 10 11 12Tonnes of sea imports per person a year
Japan
Europe
N. America
China
S America
Africa
Who Imports the Most Cargo By Sea?
2000-20506 billion Non-OECDpopulation moving
towards OECD levels
1950-2000OECD’s 1.3
billionpopulation
dominate seatrade
CLARKSON RESEARCH SERVICES LTD
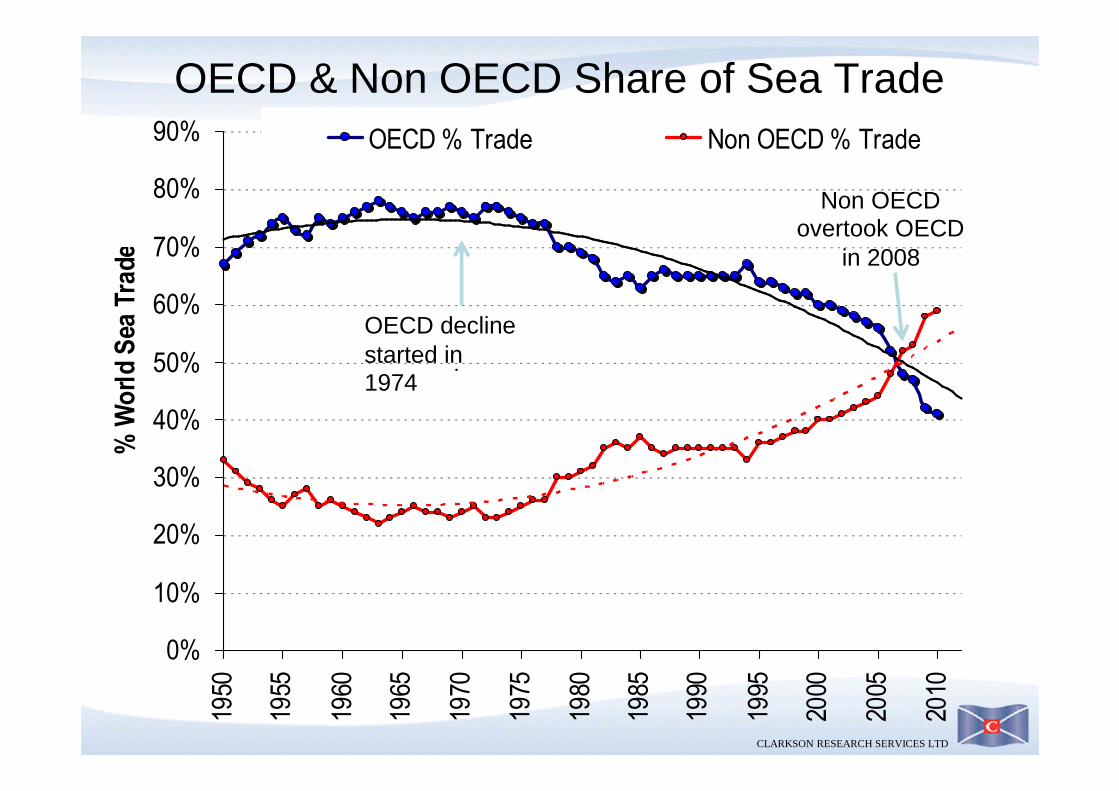
OECD & Non OECD Share of Sea Trade
0%
10%
20%
30%
40%
50%
60%
70%
80%
90%
1950
1955
1960
1965
1970
1975
1980
1985
1990
1995
2000
2005
2010
%W
orld
Sea
Trad
eOECD % Trade Non OECD % Trade
..
OECD declinestarted in1974
Non OECDovertook OECD
in 2008
CLARKSON RESEARCH SERVICES LTD
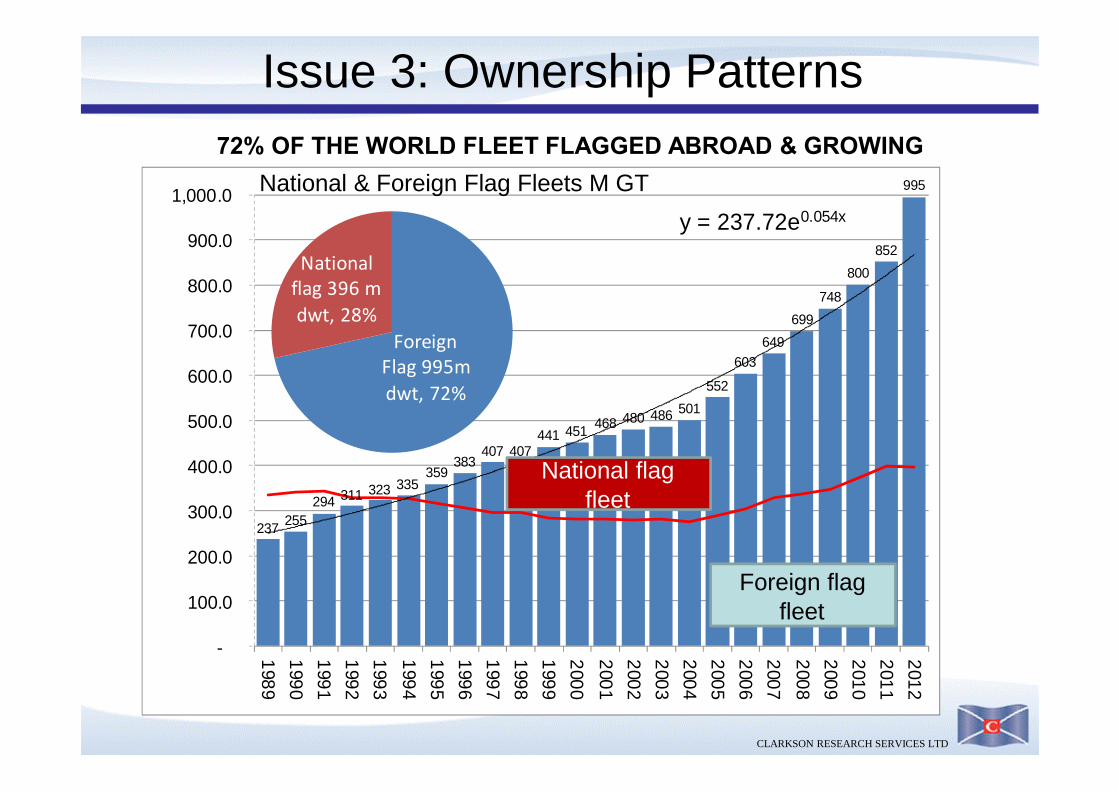
237 255294 311 323 335
359383
407 407441 451 468 480 486 501
552
603649
699
748
800
852
995
y = 237.72e0.054x
-
100.0
200.0
300.0
400.0
500.0
600.0
700.0
800.0
900.0
1,000.0
1989
1990
1991
1992
1993
1994
1995
1996
1997
1998
1999
2000
2001
2002
2003
2004
2005
2006
2007
2008
2009
2010
2011
2012National & Foreign Flag Fleets M GT
Nationalflag 396 mdwt, 28%
ForeignFlag 995mdwt, 72%
National flagfleet
Foreign flagfleet
72% OF THE WORLD FLEET FLAGGED ABROAD & GROWING
Issue 3: Ownership Patterns
CLARKSON RESEARCH SERVICES LTD
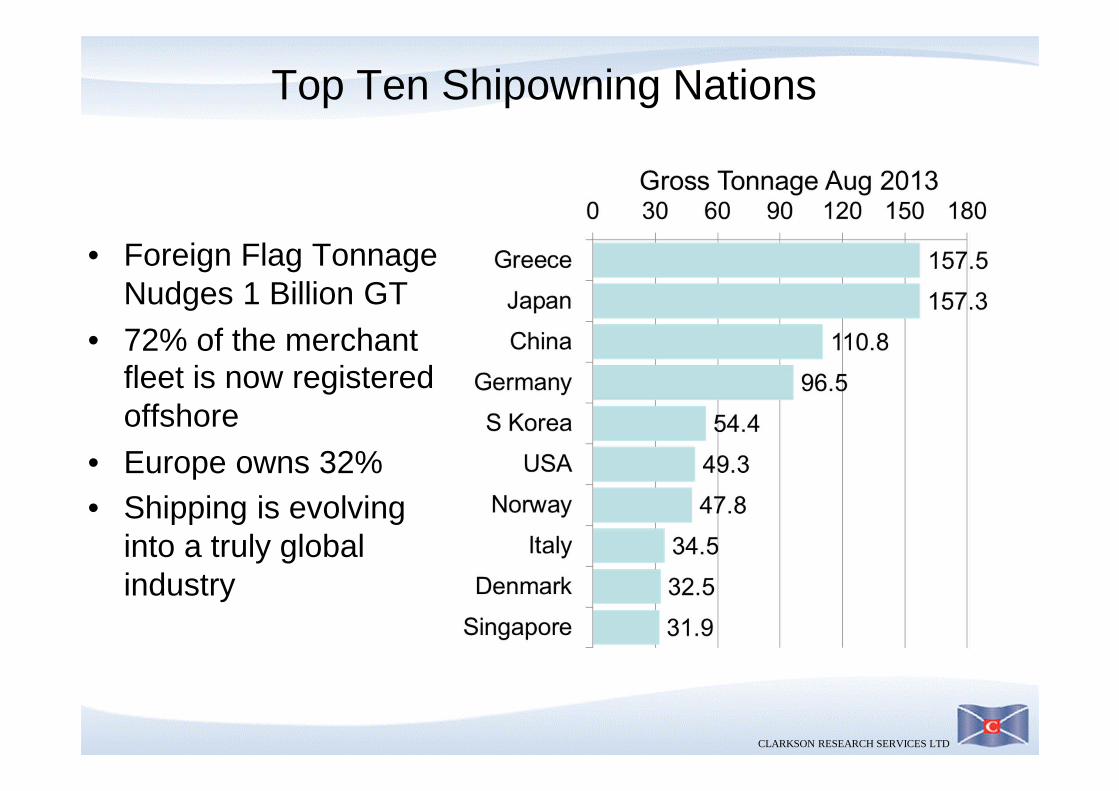
Top Ten Shipowning Nations
• Foreign Flag TonnageNudges 1 Billion GT
• 72% of the merchantfleet is now registeredoffshore
• Europe owns 32%• Shipping is evolving
into a truly globalindustry
CLARKSON RESEARCH SERVICES LTD
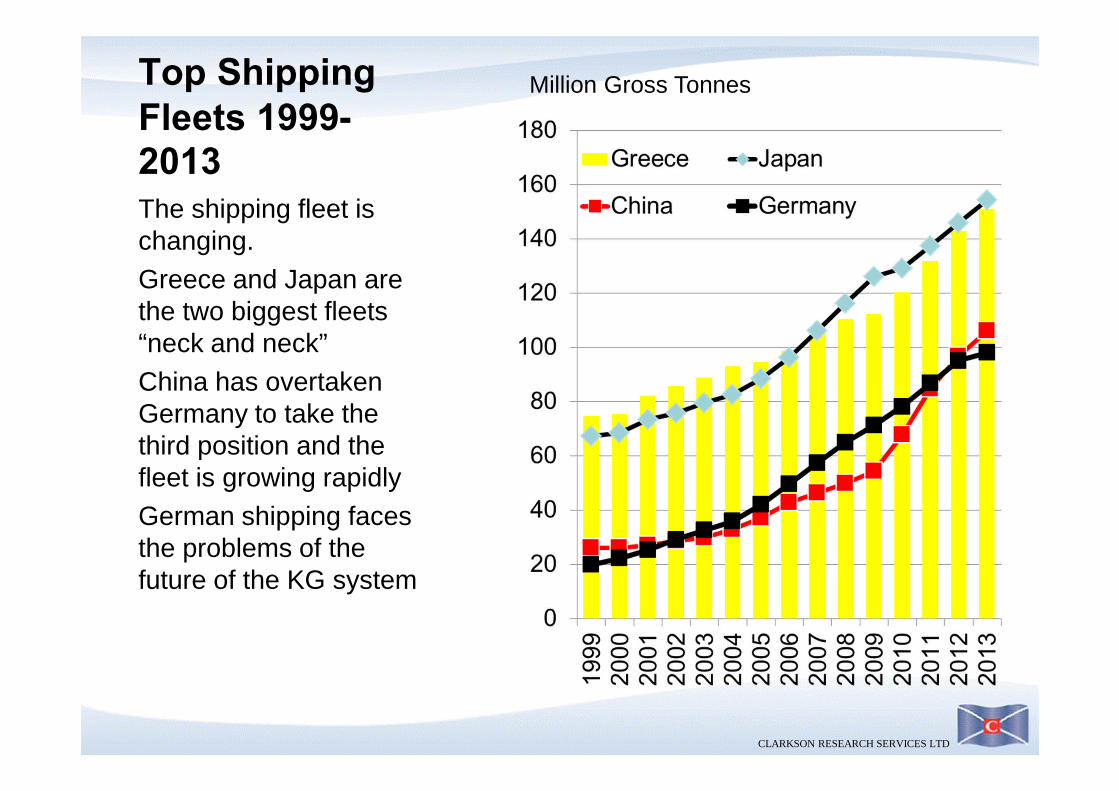
Top ShippingFleets 1999-2013The shipping fleet ischanging.Greece and Japan arethe two biggest fleets“neck and neck”China has overtakenGermany to take thethird position and thefleet is growing rapidlyGerman shipping facesthe problems of thefuture of the KG system
Million Gross Tonnes
CLARKSON RESEARCH SERVICES LTD
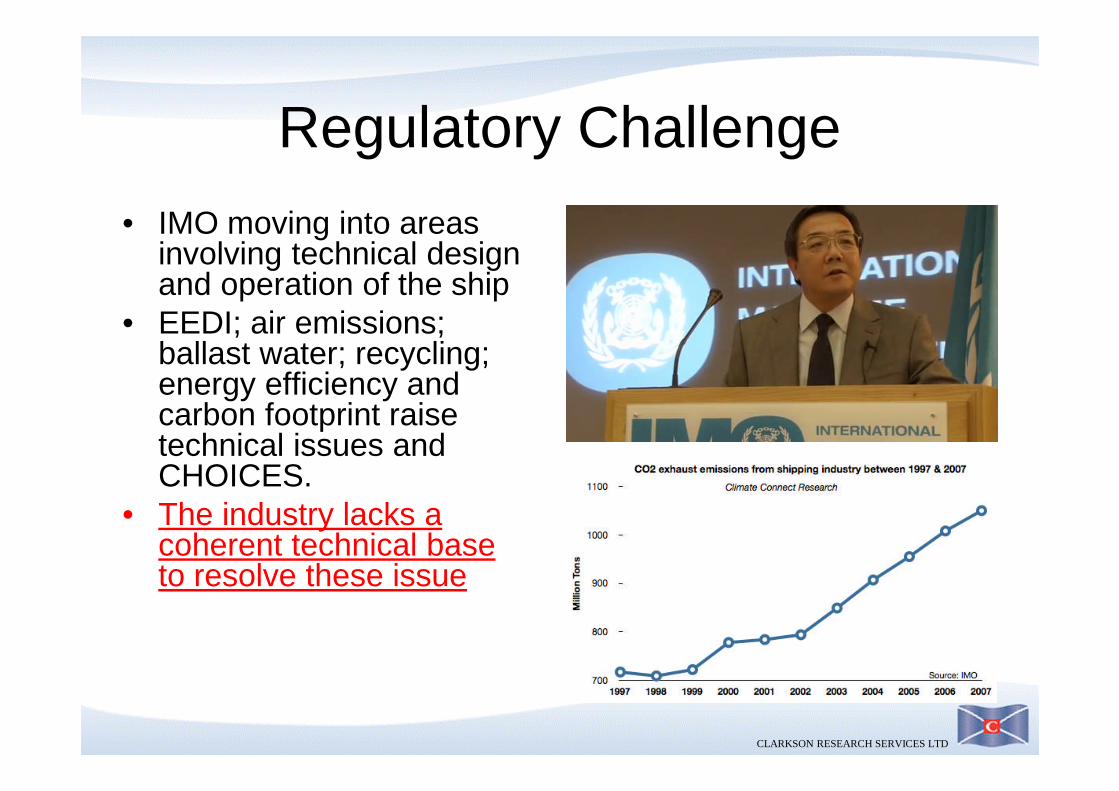
Regulatory Challenge• IMO moving into areas
involving technical designand operation of the ship
• EEDI; air emissions;ballast water; recycling;energy efficiency andcarbon footprint raisetechnical issues andCHOICES.
• The industry lacks acoherent technical baseto resolve these issue
CLARKSON RESEARCH SERVICES LTD
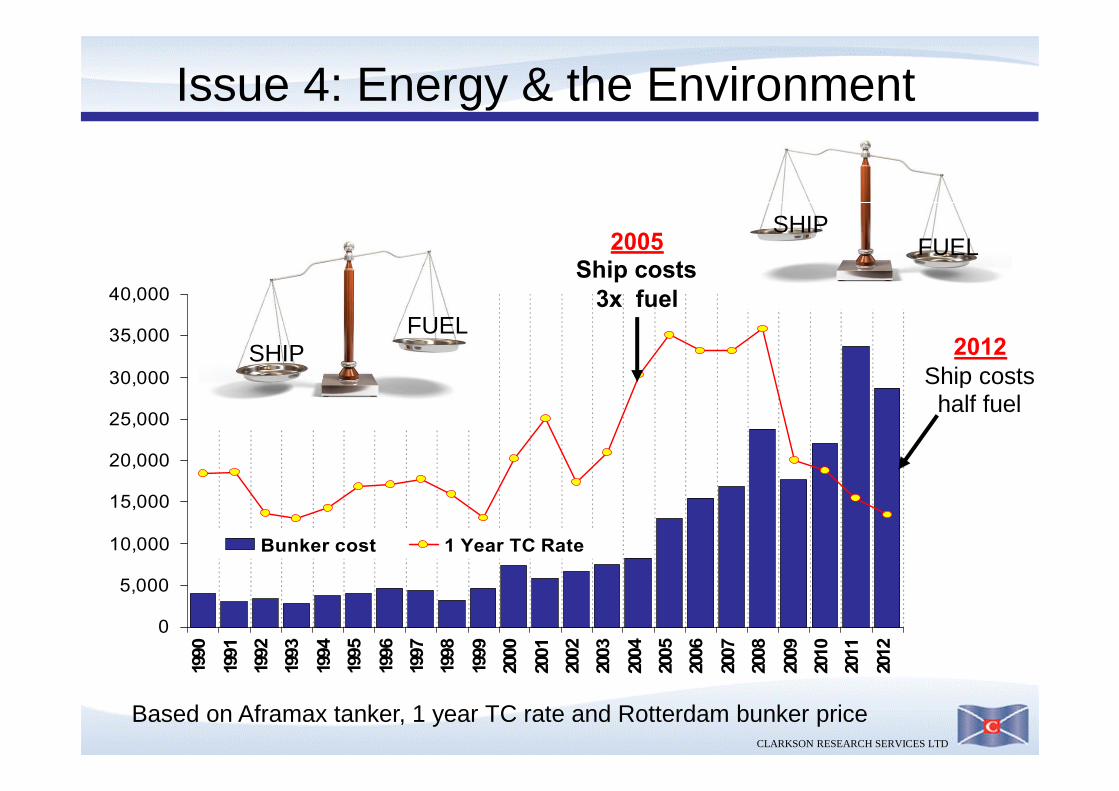
Issue 4: Energy & the Environment
0
5,000
10,000
15,000
20,000
25,000
30,000
35,000
40,000
1990
1991
1992
1993
1994
1995
1996
1997
1998
1999
2000
2001
2002
2003
2004
2005
2006
2007
2008
2009
2010
2011
2012
$/day cost
Bunker cost 1 Year TC Rate
2005Ship costs
3x fuel
2012Ship costshalf fuel
Based on Aframax tanker, 1 year TC rate and Rotterdam bunker price
FUELSHIP
FUELSHIP
CLARKSON RESEARCH SERVICES LTD
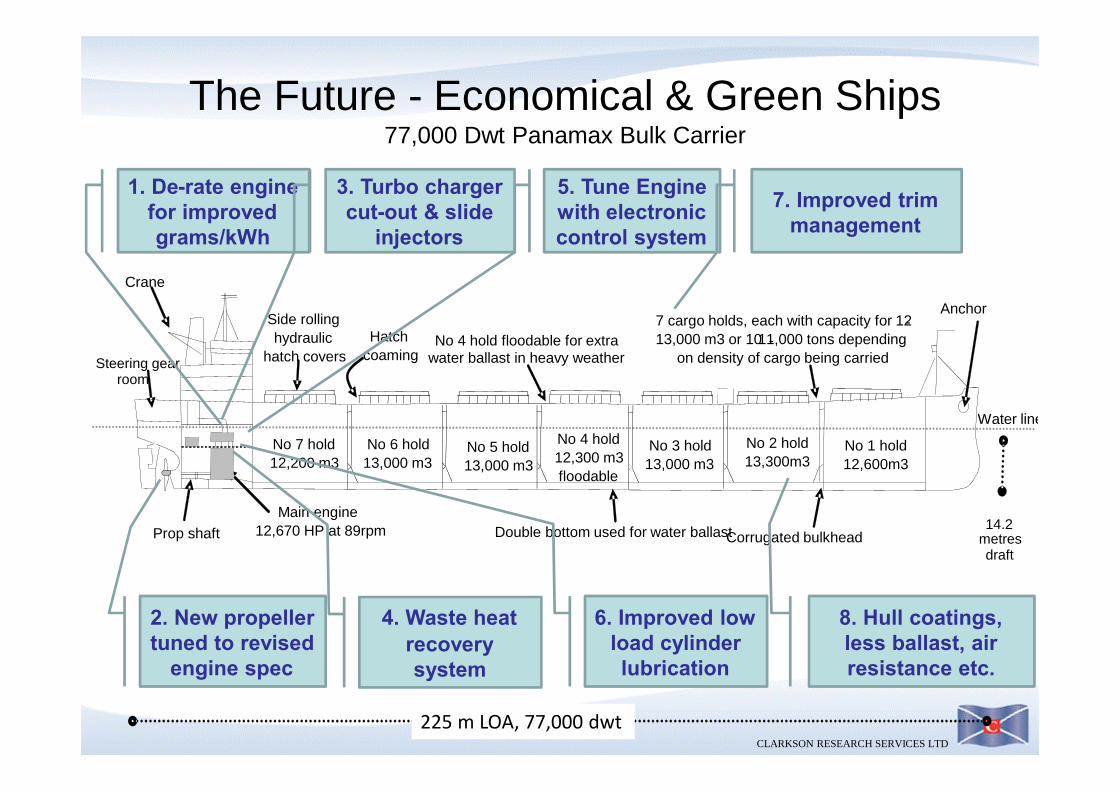
The Future - Economical & Green Ships77,000 Dwt Panamax Bulk Carrier
14.2metresdraft
Main engine12,670 HP at 89rpm
Side rollinghydraulic
hatch covers
7 cargo holds, each with capacity for 12-13,000 m3 or 10 -11,000 tons depending
on density of cargo being carried
Corrugated bulkhead
Water line
Double bottom used for water ballast
No 4 hold floodable for extrawater ballast in heavy weather
No 1 hold12,600m3
No 2 hold13,300m3
No 3 hold13,000 m3
No 4 hold12,300 m3floodable
No 5 hold13,000 m3
No 6 hold13,000 m3
No 7 hold12,200 m3
Crane
Steering gearroom
Anchor
Prop shaft
Hatchcoaming
225 m LOA, 77,000 dwt
2. New propellertuned to revised
engine spec
1. De-rate enginefor improvedgrams/kWh
3. Turbo chargercut-out & slide
injectors
5. Tune Enginewith electroniccontrol system
7. Improved trimmanagement
4. Waste heatrecoverysystem
6. Improved lowload cylinderlubrication
8. Hull coatings,less ballast, airresistance etc.
CLARKSON RESEARCH SERVICES LTD
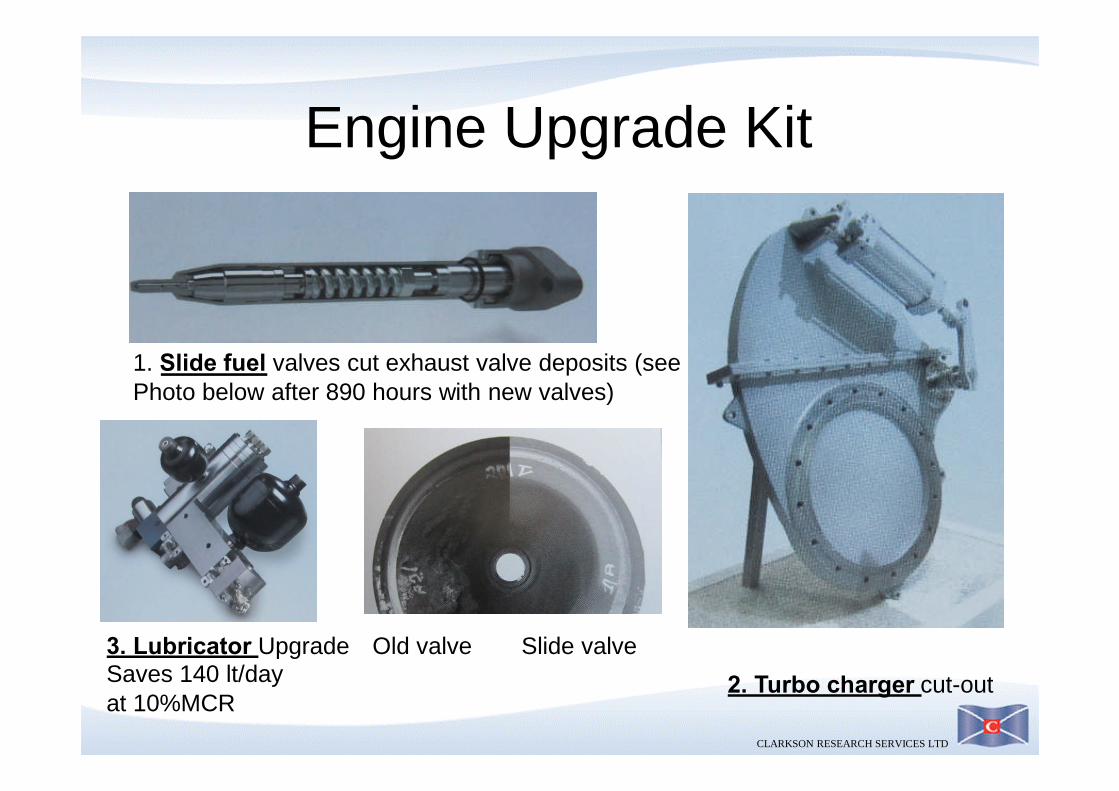
Engine Upgrade Kit
3. Lubricator UpgradeSaves 140 lt/dayat 10%MCR
1. Slide fuel valves cut exhaust valve deposits (seePhoto below after 890 hours with new valves)
Old valve Slide valve
2. Turbo charger cut-out
CLARKSON RESEARCH SERVICES LTD
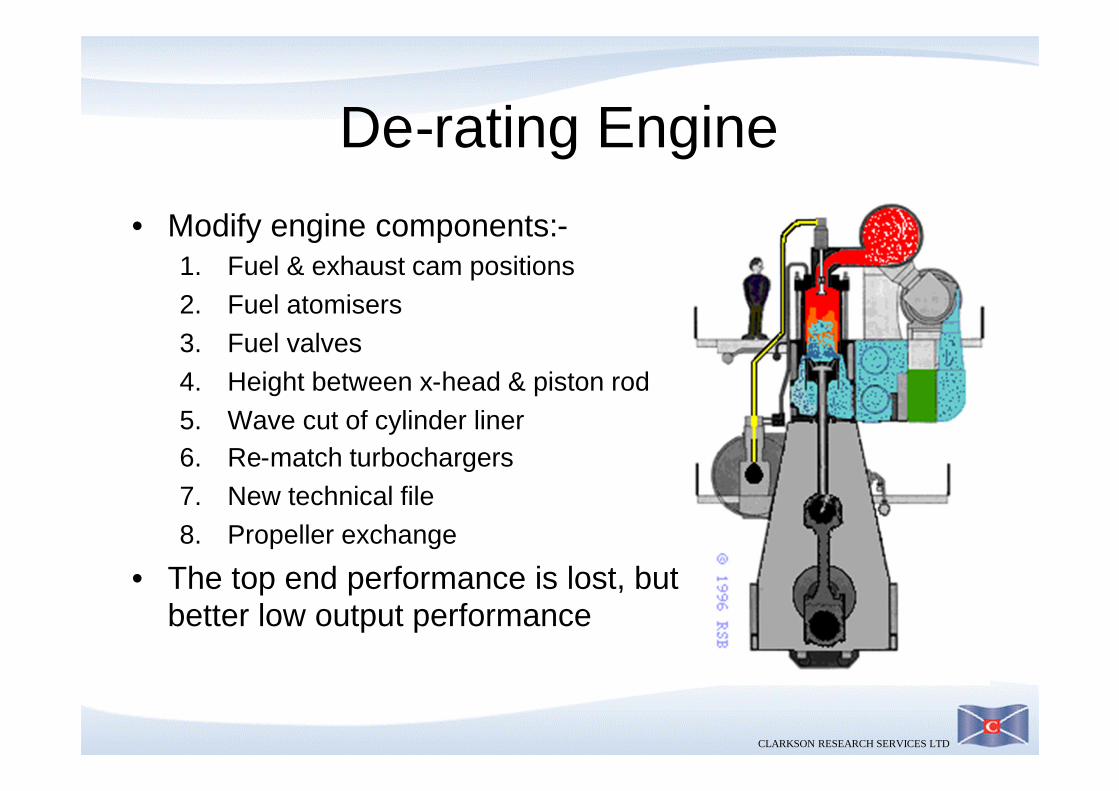
De-rating Engine
• Modify engine components:-1. Fuel & exhaust cam positions2. Fuel atomisers3. Fuel valves4. Height between x-head & piston rod5. Wave cut of cylinder liner6. Re-match turbochargers7. New technical file8. Propeller exchange
• The top end performance is lost, butbetter low output performance
CLARKSON RESEARCH SERVICES LTD
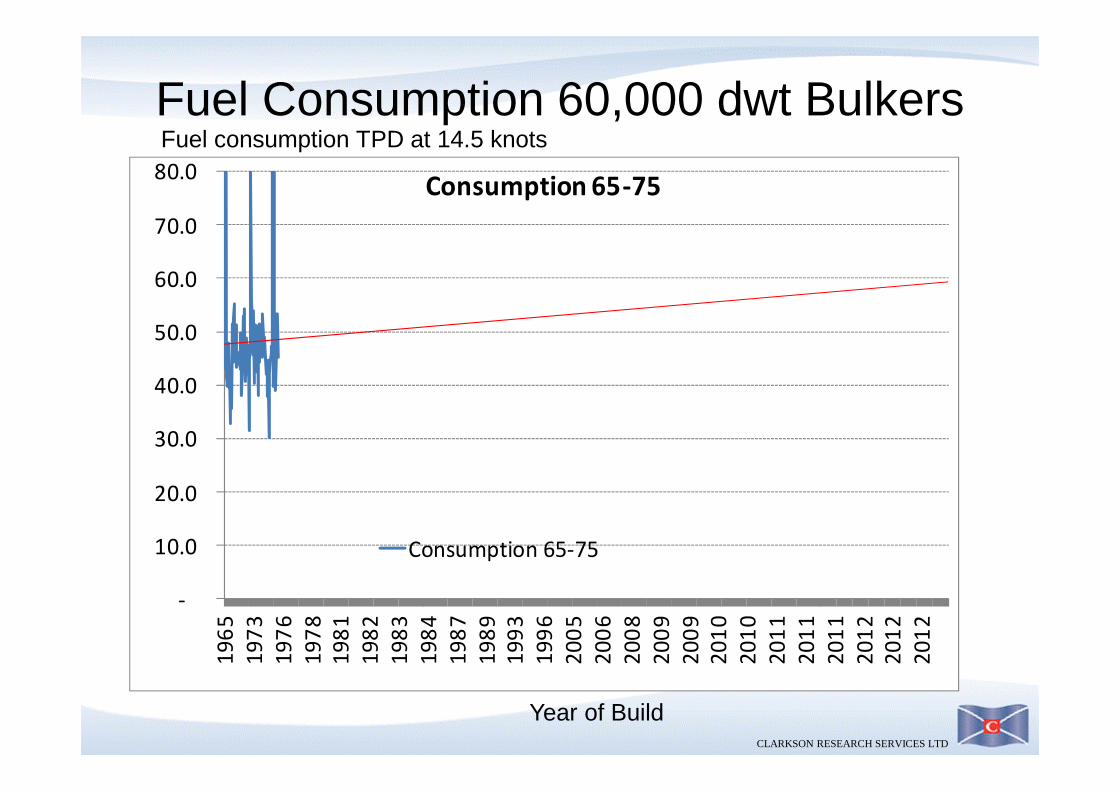
Fuel Consumption 60,000 dwt Bulkers
-
10.0
20.0
30.0
40.0
50.0
60.0
70.0
80.0
1965
1973
1976
1978
1981
1982
1983
1984
1987
1989
1993
1996
2005
2006
2008
2009
2009
2010
2010
2011
2011
2011
2012
2012
2012
Consumption 65-75
Consumption 65-75
Year of Build
Fuel consumption TPD at 14.5 knots
CLARKSON RESEARCH SERVICES LTD
-
10.0
20.0
30.0
40.0
50.0
60.0
70.0
80.0
1965
1973
1976
1978
1981
1982
1983
1984
1987
1989
1993
1996
2005
2006
2008
2009
2009
2010
2010
2011
2011
2011
2012
2012
2012
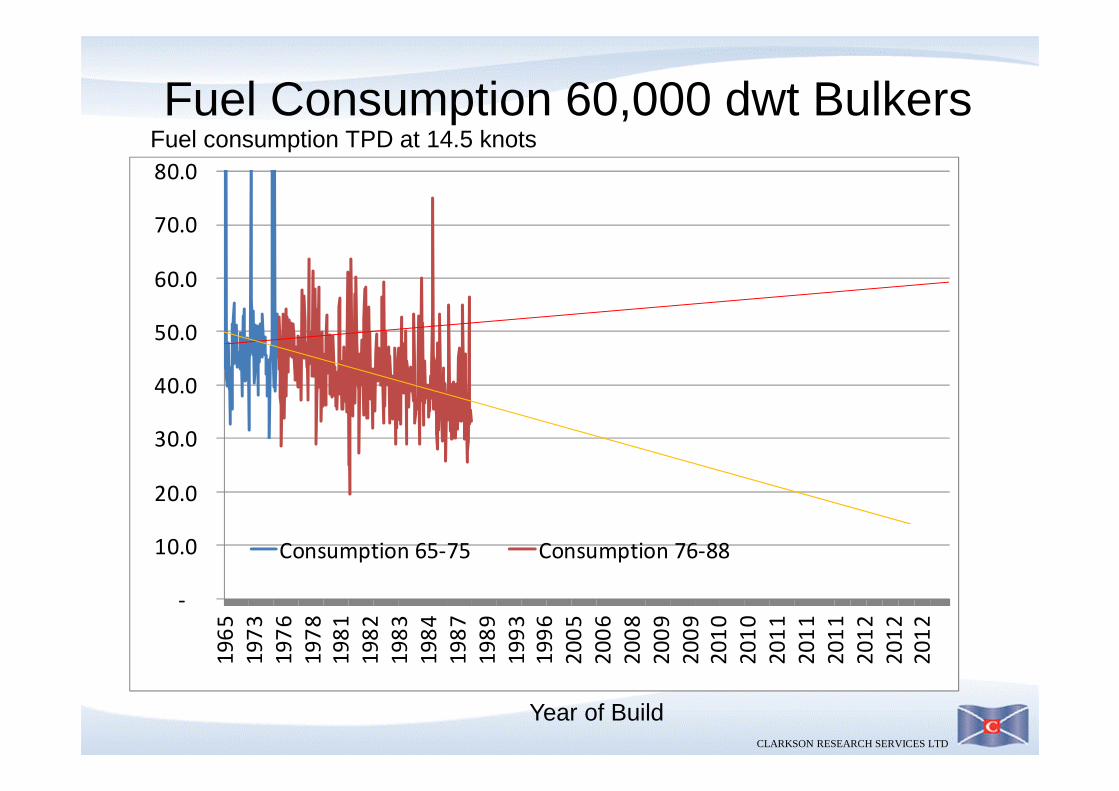
Consumption 65-75 Consumption 76-88
Year of Build
Fuel Consumption 60,000 dwt BulkersFuel consumption TPD at 14.5 knots
CLARKSON RESEARCH SERVICES LTD
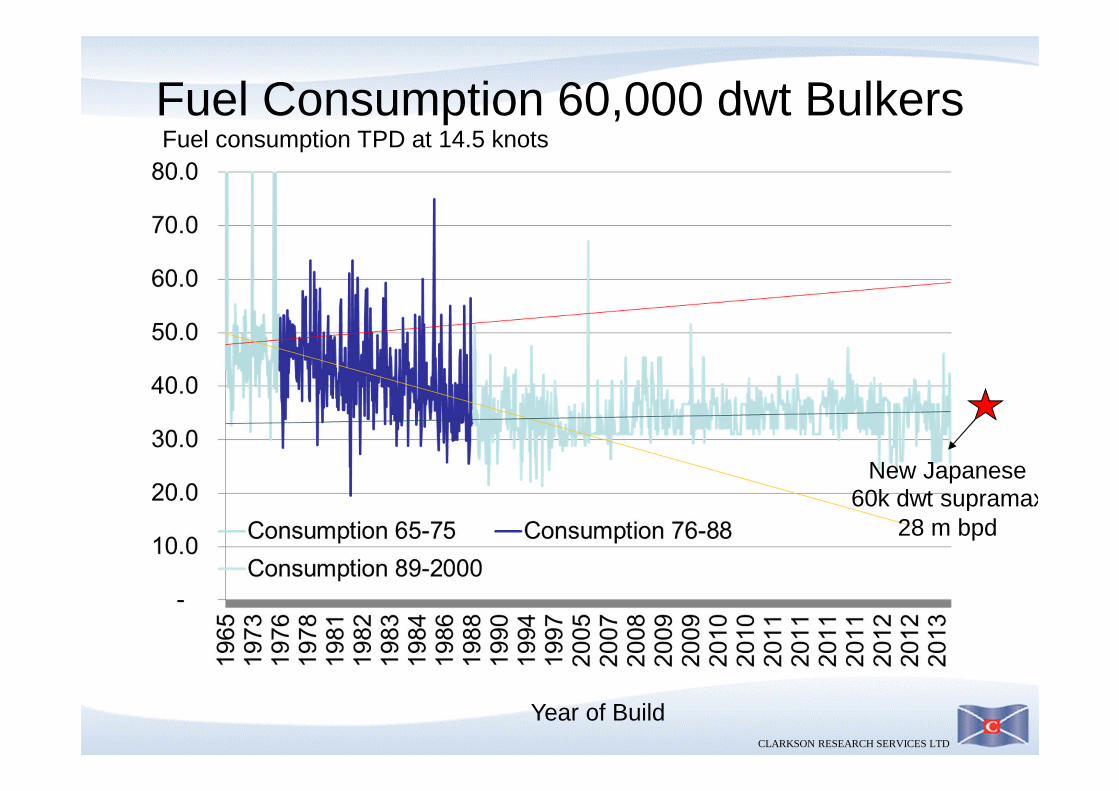
Fuel Consumption 60,000 dwt Bulkers
Year of Build
Fuel consumption TPD at 14.5 knots
New Japanese60k dwt supramax
28 m bpd
CLARKSON RESEARCH SERVICES LTD
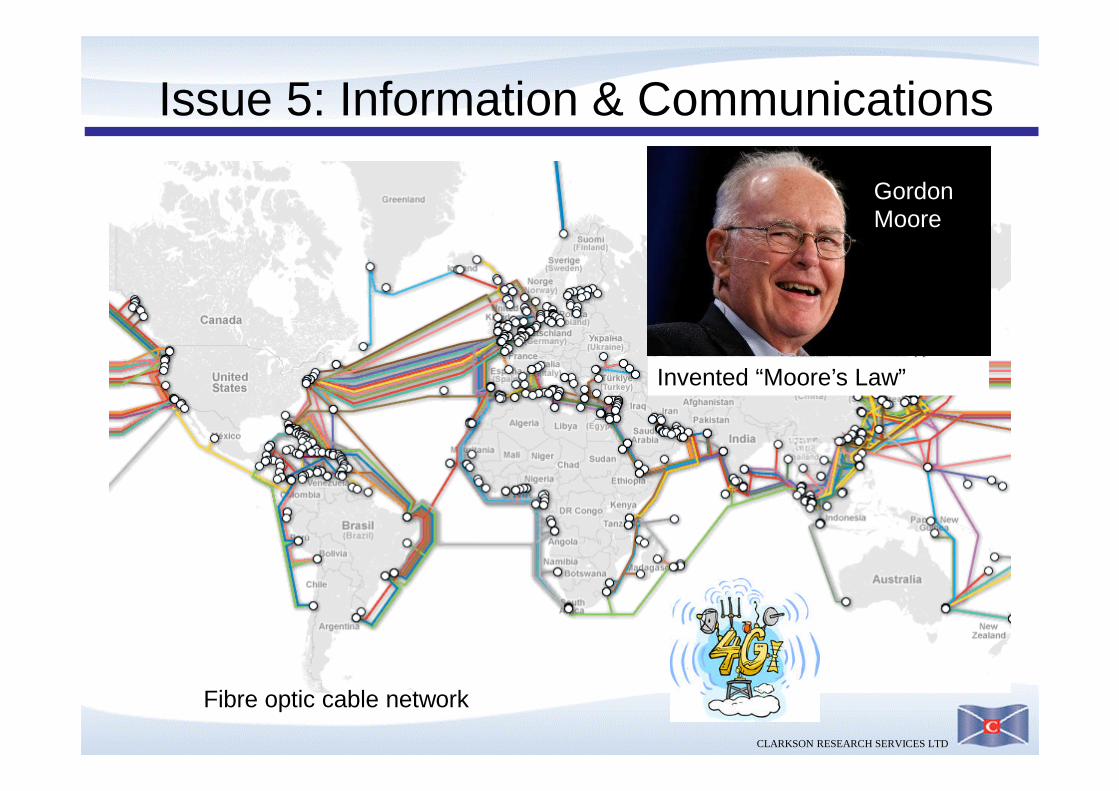
Issue 5: Information & Communications
Fibre optic cable network
GordonMoore
Invented “Moore’s Law”
CLARKSON RESEARCH SERVICES LTD
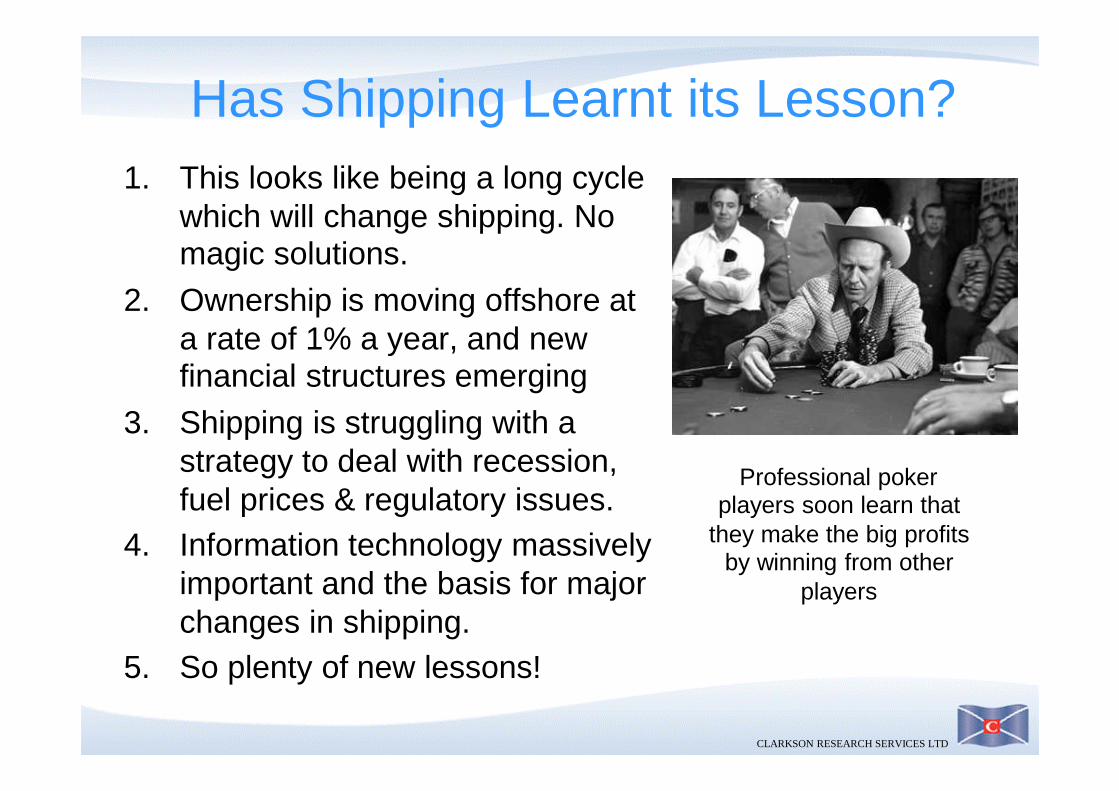
Has Shipping Learnt its Lesson?1. This looks like being a long cycle
which will change shipping. Nomagic solutions.
2. Ownership is moving offshore ata rate of 1% a year, and newfinancial structures emerging
3. Shipping is struggling with astrategy to deal with recession,fuel prices & regulatory issues.
4. Information technology massivelyimportant and the basis for majorchanges in shipping.
5. So plenty of new lessons!
Professional pokerplayers soon learn that
they make the big profitsby winning from other
players
CLARKSON RESEARCH SERVICES LTD
“The statistical, graphical information contained in this paper are drawn fromthe Clarkson Research Services Limited ("CRSL") database and othersources. CRSL advises that: (i) some information in CRSL's database isderived from estimates or subjective judgments; and (ii) the information in thedatabases of other maritime data collection agencies may differ from theinformation in CRSL's database; and (iii) whilst CRSL has taken reasonablecare in the compilation of the statistical and graphical information and believesit to be accurate and correct, data compilation is subject to limited audit andvalidation procedures and may accordingly contain errors; and (iv) CRSL, itsagents, officers and employees do not accept liability for any loss suffered inconsequence of reliance on such information or in any other manner; and (v)the provision of such information does not obviate any need to makeappropriate further enquiries; (vi) the provision of such information is not anendorsement of any commercial policies and/or any conclusions by CRSL; and(vii) shipping is a variable and cyclical business and anyone who thinks theycan forecast it needs their head examining. Where views are expressed theyare in the context of this general presentation and should not be used or reliedon in any other context without appropriate investigation, validation and thewritten permission of the author
Disclaimer