exploration of associations between governance and economics and country level foot‐and‐mouth...
TRANSCRIPT
© 2008 Royal Statistical Society 0964–1998/08/171699
J. R. Statist. Soc. A (2008)171, Part 3, pp. 699–722
Exploration of associations between governanceand economics and country level foot-and-mouthdisease status by using Bayesian model averaging
R. B. Garabed,
University of California, Davis, USA
W. O. Johnson,
University of California, Irvine, USA
J. Gill
Washington University, St Louis, USA
and A. M. Perez and M. C. Thurmond
University of California, Davis, USA
[Received July 2007. Revised October 2007]
Summary. Using Bayesian model averaging, we quantify associations of governance and ec-onomic health with country level presence of foot-and-mouth disease (FMD) and estimate theprobability of the presence of FMD in each country from 1997 to 2005. The Bayesian modelaveraging accounted for countries’ previous FMD status and other possible confounders, aswell as uncertainty about the ‘true’ model, and provided accurate predictions (90% specificityand 80% sensitivity). This model represents a novel approach to predicting FMD, and otherconditions, on a global scale and in identifying important risk factors that can be applied toglobal policy and allocation of resources for disease control.
Keywords: Animal disease; Economic health; Expert opinion; Political voice; Prediction
1. Introduction
In the international arena, disease control and eradication are often complicated by limitedresources and an inability to predict where international aid can be placed most effectively. Inaddition, control efforts are impeded by social, political and economic conditions that are unre-lated to the biology of diseases themselves. Foot-and-mouth disease (FMD) provides examplesboth of the complex forces preventing disease control and of the potential for better predictionof the presence of disease to improve resource allocation.
FMD is a readily transmissible viral disease of cloven-hoofed animals that has a hetero-geneous global distribution. The most common visible signs of infection with FMD virus(FMDV) are vesicles, erosions and ulcers in and around the mouth and along the coronaryband (part of the hoof) that cause decreased production and mobility. However, aside from
Address for correspondence: R. B. Garabed, Foot-and-Mouth Disease Modeling and Surveillance Laboratory,Department of Medicine and Epidemiology, School of Veterinary Medicine, University of California at Davis,One Shields Avenue, Davis, CA 95616, USA.E-mail: [email protected]
700 R. B. Garabed, W. O. Johnson, J. Gill, A. M. Perez and M. C. Thurmond
some strains infecting pigs, few adult animals die from uncomplicated FMDV infections(Kitching, 2002; Kitching and Alexandersen, 2002; Kitching and Hughes, 2002). Though mor-tality due directly to FMDV is rare, economic losses resulting from decreased production anddraught power initially justified investments by some countries to eradicate the disease fromwithin their borders, and later to implement trade restrictions to prevent reintroduction ofFMDV. The current global distribution of FMD (the endemic presence in some countries,epidemics in other countries and complete absence in the remaining countries) and thecomplex system of trade restrictions that are based on recommendations by the World Orga-nization for Animal Health (Office International des Epizooties: OIE) now contribute an addi-tional cost due to loss of export markets for countries with cases of FMD or with an unknownFMD status (Perry and Rich, 2007).
Even with stringent trade restrictions and border control, some countries that were initiallyfree of FMDV have not been able to remain free (Scudamore and Harris, 2002; Pluimers et al.,2002; Chmitelin and Moutou, 2002; Costelloe et al., 2002; Brückner et al., 2002; Sakamotoand Yoshida, 2002), convincing many that a global or regional strategy is necessary for long-term FMDV control and eradication (Correa-Melo and Lopez, 2002; Reyemamu and Astudilo,2002; Correa-Melo et al., 2002; Vosloo et al., 2002; Aidaros, 2002; Gleeson, 2002). For this, abetter understanding of the many aspects of FMD and FMDV probably would improve futurenational, regional and global control and eradication plans. For control and eradication pro-grammes of other diseases, such as the human immunodeficiency virus or acquired immunedeficiency syndrome, poliomyelitis, smallpox, measles and rinderpest, understanding a diseaseincludes not only thorough biological study but also a study of the political, social and economicfactors that are related to local and regional persistence of disease (Mohiddin and Johnston,2006; Rennie and Behets, 2006; Heymann, 2004; Aylward et al., 2003; Henao-Restrepo et al.,2003; Spinage, 2003; Cutts et al., 1999; Hull et al., 1998). For example, organizing vaccineand prevention programmes in regions where the susceptible populations reside often can becomplicated by political instability, corruption, economic hardship, inaccessibility due to poorinfrastructure and social resistance to the programmes (Mohiddin and Johnston, 2006; Rennieand Behets, 2006; Heymann, 2004; Aylward et al., 2003; Henao-Restrepo et al., 2003; Cuttset al., 1999; Hull et al., 1998).
As an initial exploration of why FMD has occurred and persisted in some countries but hasbeen eradicated from others, we hypothesize that country level FMD status, as indicated bypresence (positive) or absence (negative) of FMD, is more likely to be positive in countrieswith poor economic status and/or poor governance (ability to govern). Because FMD controlin a country requires the co-ordinated efforts of many stakeholder groups, including livestockproducers, animal health professionals, regulatory agencies and politicians, we proffer that thepresence or absence of FMD in a country will be related to the ability of the government toco-ordinate and direct these groups and to identify resources that are sufficient to control anderadicate FMD. The ability of a government to develop plans and programmes and to co-ordi-nate activities between disparate stakeholder groups, government agencies and constituencies isreferred to here as governance. In addition to adequate governance, we hypothesize that an FMDcontrol or eradication programme would require funding across all the stakeholder groups.For example, if a farmer relies on his or her animal for his or her livelihood, even governmentindemnities are unlikely to convince the farmer to cull the animal; thus, economic support that isrequired for an FMD control programme would be expected to be related to the overall economichealth of a country rather than to specific aid for FMD control programmes alone. Though thegovernance and economic health of a country, following the reasoning above, seem importantto success in controlling a disease like FMD (Perry and Rich, 2007), to our knowledge, no
Exploration of Foot-and-mouth Disease 701
reports have been published quantifying how such attributes of countries, in general, contributeto the presence of FMD.
The primary objective of the study that is presented in this paper is to quantify globally theassociations, if any, of governance and economic health on the country level presence of FMD.A secondary objective is to use country level information to estimate the probability that FMDwas present in each country in the world for each year from 1997 to 2005. By quantifying theassociations of governance and economic health on the presence of FMD and by providing goodglobal prediction of the presence of FMD, we hope to provide information that will improvefuture control and eradication of FMD.
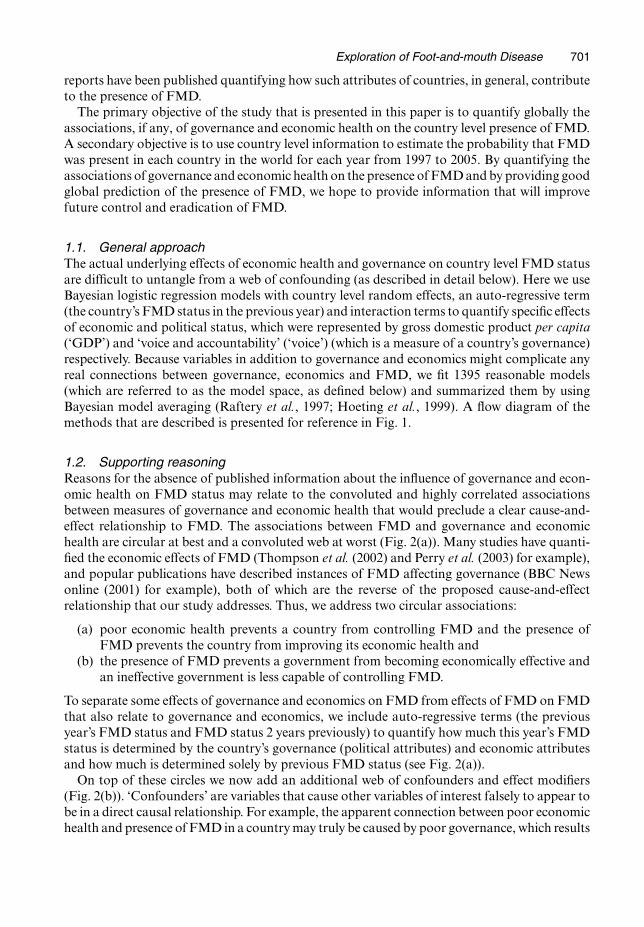
1.1. General approachThe actual underlying effects of economic health and governance on country level FMD statusare difficult to untangle from a web of confounding (as described in detail below). Here we useBayesian logistic regression models with country level random effects, an auto-regressive term(the country’s FMD status in the previous year) and interaction terms to quantify specific effectsof economic and political status, which were represented by gross domestic product per capita(‘GDP’) and ‘voice and accountability’ (‘voice’) (which is a measure of a country’s governance)respectively. Because variables in addition to governance and economics might complicate anyreal connections between governance, economics and FMD, we fit 1395 reasonable models(which are referred to as the model space, as defined below) and summarized them by usingBayesian model averaging (Raftery et al., 1997; Hoeting et al., 1999). A flow diagram of themethods that are described is presented for reference in Fig. 1.
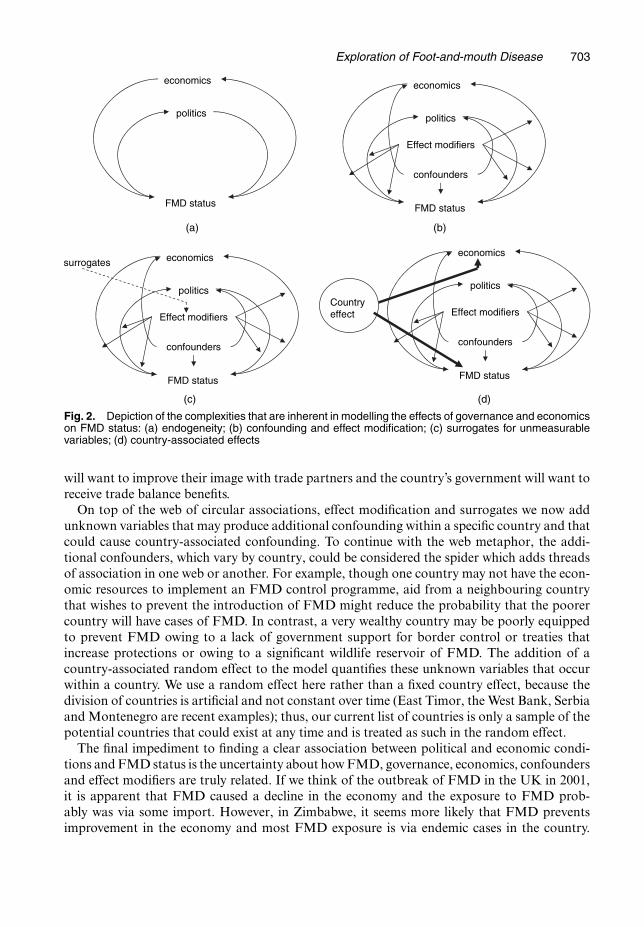
1.2. Supporting reasoningReasons for the absence of published information about the influence of governance and econ-omic health on FMD status may relate to the convoluted and highly correlated associationsbetween measures of governance and economic health that would preclude a clear cause-and-effect relationship to FMD. The associations between FMD and governance and economichealth are circular at best and a convoluted web at worst (Fig. 2(a)). Many studies have quanti-fied the economic effects of FMD (Thompson et al. (2002) and Perry et al. (2003) for example),and popular publications have described instances of FMD affecting governance (BBC Newsonline (2001) for example), both of which are the reverse of the proposed cause-and-effectrelationship that our study addresses. Thus, we address two circular associations:
(a) poor economic health prevents a country from controlling FMD and the presence ofFMD prevents the country from improving its economic health and
(b) the presence of FMD prevents a government from becoming economically effective andan ineffective government is less capable of controlling FMD.
To separate some effects of governance and economics on FMD from effects of FMD on FMDthat also relate to governance and economics, we include auto-regressive terms (the previousyear’s FMD status and FMD status 2 years previously) to quantify how much this year’s FMDstatus is determined by the country’s governance (political attributes) and economic attributesand how much is determined solely by previous FMD status (see Fig. 2(a)).
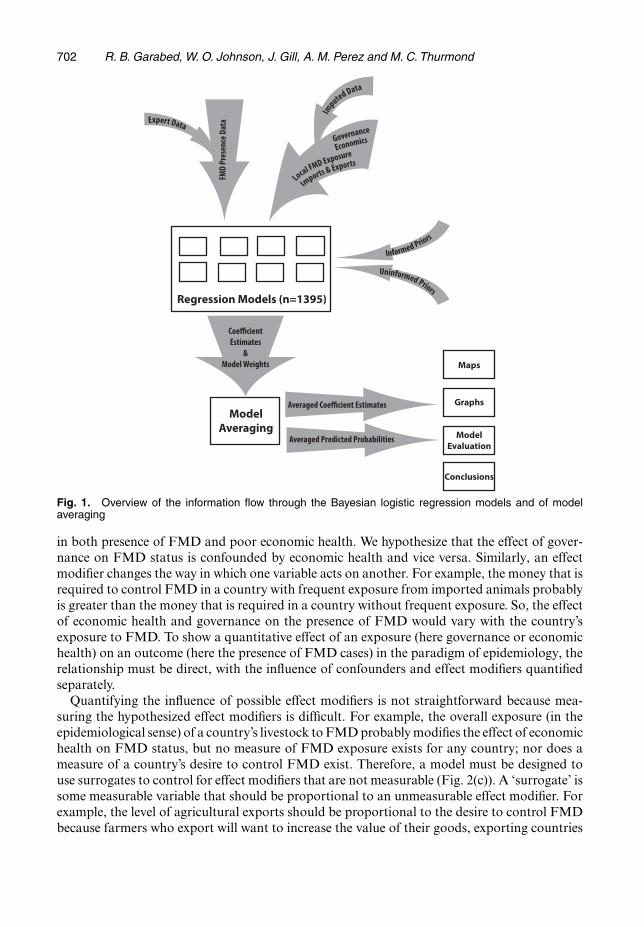
On top of these circles we now add an additional web of confounders and effect modifiers(Fig. 2(b)). ‘Confounders’ are variables that cause other variables of interest falsely to appear tobe in a direct causal relationship. For example, the apparent connection between poor economichealth and presence of FMD in a country may truly be caused by poor governance, which results
702 R. B. Garabed, W. O. Johnson, J. Gill, A. M. Perez and M. C. Thurmond
Fig. 1. Overview of the information flow through the Bayesian logistic regression models and of modelaveraging
in both presence of FMD and poor economic health. We hypothesize that the effect of gover-nance on FMD status is confounded by economic health and vice versa. Similarly, an effectmodifier changes the way in which one variable acts on another. For example, the money that isrequired to control FMD in a country with frequent exposure from imported animals probablyis greater than the money that is required in a country without frequent exposure. So, the effectof economic health and governance on the presence of FMD would vary with the country’sexposure to FMD. To show a quantitative effect of an exposure (here governance or economichealth) on an outcome (here the presence of FMD cases) in the paradigm of epidemiology, therelationship must be direct, with the influence of confounders and effect modifiers quantifiedseparately.
Quantifying the influence of possible effect modifiers is not straightforward because mea-suring the hypothesized effect modifiers is difficult. For example, the overall exposure (in theepidemiological sense) of a country’s livestock to FMD probably modifies the effect of economichealth on FMD status, but no measure of FMD exposure exists for any country; nor does ameasure of a country’s desire to control FMD exist. Therefore, a model must be designed touse surrogates to control for effect modifiers that are not measurable (Fig. 2(c)). A ‘surrogate’ issome measurable variable that should be proportional to an unmeasurable effect modifier. Forexample, the level of agricultural exports should be proportional to the desire to control FMDbecause farmers who export will want to increase the value of their goods, exporting countries
Exploration of Foot-and-mouth Disease 703
FMD status
economics
politics
FMD status
economics
politics
confounders
Effect modifiers
FMD status
economics
politics
confounders
Effect modifiers
(a)
(c) (d)
(b)
surrogates
Country effect
FMD status
economics
politics
confounders
Effect modifiers
Fig. 2. Depiction of the complexities that are inherent in modelling the effects of governance and economicson FMD status: (a) endogeneity; (b) confounding and effect modification; (c) surrogates for unmeasurablevariables; (d) country-associated effects
will want to improve their image with trade partners and the country’s government will want toreceive trade balance benefits.
On top of the web of circular associations, effect modification and surrogates we now addunknown variables that may produce additional confounding within a specific country and thatcould cause country-associated confounding. To continue with the web metaphor, the addi-tional confounders, which vary by country, could be considered the spider which adds threadsof association in one web or another. For example, though one country may not have the econ-omic resources to implement an FMD control programme, aid from a neighbouring countrythat wishes to prevent the introduction of FMD might reduce the probability that the poorercountry will have cases of FMD. In contrast, a very wealthy country may be poorly equippedto prevent FMD owing to a lack of government support for border control or treaties thatincrease protections or owing to a significant wildlife reservoir of FMD. The addition of acountry-associated random effect to the model quantifies these unknown variables that occurwithin a country. We use a random effect here rather than a fixed country effect, because thedivision of countries is artificial and not constant over time (East Timor, the West Bank, Serbiaand Montenegro are recent examples); thus, our current list of countries is only a sample of thepotential countries that could exist at any time and is treated as such in the random effect.
The final impediment to finding a clear association between political and economic condi-tions and FMD status is the uncertainty about how FMD, governance, economics, confoundersand effect modifiers are truly related. If we think of the outbreak of FMD in the UK in 2001,it is apparent that FMD caused a decline in the economy and the exposure to FMD prob-ably was via some import. However, in Zimbabwe, it seems more likely that FMD preventsimprovement in the economy and most FMD exposure is via endemic cases in the country.
704 R. B. Garabed, W. O. Johnson, J. Gill, A. M. Perez and M. C. Thurmond
Therefore, the model itself may be different depending on the starting place (not necessarily justa country), time and the opinion of the person designing the model (which spider makes the web).
To summarize, modelling the relationship of governance and economic factors and FMDstatus is complicated in five ways, each of which can be quantified and accounted for partiallythrough model design. First, the relationships between disease, governance and economics arethemselves complicated and often may be circular. These relationships were separated here byusing an auto-regressive term. Second, the effects of a given political or economic factor maybe masked by confounding and effect modification. Confounding and effect modification wereaccounted for by including hypothesized confounders and interactions. Third, factors that aredirectly related to transmission of disease, such as the extent to which a country is exposed toFMD, are not measured or are not measurable. These unmeasured effect modifiers were consid-ered to be related to surrogate variables that were measured. Fourth, an individual country maybe more or less effective at controlling disease than another country under the same conditionsowing to some national tendency or public will to control the disease. These additional country-associated confounders were included for the purposes of this study as a single random effectfor country. Fifth, as with any political or economic problem, there are differences of opinionabout how and to what extent a given factor influences, or is a surrogate for, a variable that isrelated to disease status. All the arrangements of available variables that we considered to bereasonable were modelled separately, and each was assessed for the extent to which its effectwas supported by the data.
2. Data
2.1. Presence of foot-and-mouth diseaseThe response variable was country level FMD status (positive or negative). This status was basedon the OIE’s official classifications of its member countries: countries voluntarily reportingFMD cases (FMD positive countries) and other countries applying for designated FMD-freestatus (FMD-free countries). An expert’s opinion on FMD status was used to supplement datafrom the OIE. The expert was given lists of FMD-free countries and lists of countries thatreported FMD cases (both from OIE data) for each country for each year and was asked toclassify each country in our master list as positive (having at least one positive animal outsideexperimental and quarantine facilities during the year) or negative (no positive animals outsideexperimental and quarantine facilities during the year) based on the OIE data and on personalopinion. Countries that were listed by the OIE as FMD free with vaccination and FMD freeonly in specific regions were listed as free and as positive respectively, if the expert believed theOIE assessments to be true.
Thus, the response variable, as specified here, represents the presence or absence of at leastone FMD case anywhere in the country at any time during the year, to the extent of the currentknowledge of the international community, as represented by the expert and OIE data. Thislevel of temporal (yearly) and spatial (country) resolution was chosen as the highest level ofresolution about which one could be reasonably sure of being correct because many countriesonly report cases annually, the exact duration of an outbreak is often unknown, few countriessurvey their livestock to determine the locations of all cases and many countries only reportcases or outbreaks summarized at the provincial or regional level.
2.2. GovernanceThe governance of each country was separated into six dimensions (voice and accountabil-ity, political stability and absence of violence, government effectiveness, regulatory quality,
Exploration of Foot-and-mouth Disease 705
rule of law and control of corruption) collected by the World Bank Institute every otheryear from 18 organizations from around the world (Kaufmann et al., 2005). Numerical meas-ures of these quantities, standardized by the World Bank Institute to have an approximaterange from −2.5 to 2.5 (the standardization procedure is detailed in Kaufmann et al. (2005)),were obtained from the World Bank Institute’s Web site (http://www.worldbank.org/wbi/governance/pubs/govmatters4.html) for years between 1996 and 2004. Esti-mates for odd-numbered years between 1996 and 2002 were calculated as the arithmetic meanof the two adjacent years or, in the absence of data for one year, the value for the remainingadjacent year was used. The estimated correlations between these variables indicated that theywere too highly correlated (range 0.714–0.943) to separate their individual effects. Thus, onevariable was chosen to represent overall governance.
We chose the voice and accountability (voice) variable to represent governance in this modelbecause we believe that the extent to which people can inform their government of outbreaksand the extent to which the government is accountable to the concerns of its constituency,which are both included in this variable, are the most important aspects of governance toelimination of FMD. The belief that voice was the most important aspect of governance forelimination of FMD was supported by consideration of univariate mixed logistic regressionmodels using each governance indicator separately (the results are not shown), and by the con-clusions of published philosophical and empirical studies (Busch, 2003; Kuklinski and Stanga,1979).
This predictor variable was restandardized (reduced by the mean and divided by the stan-dard deviation: (variable−mean)/standard deviation) for each year, after each year’s data werecollected and the records of countries with missing values in other variables were removed. Thisand the standardizations that were performed on all continuous variables were used to put allthe continuous variables onto approximately the same scale, which simplifies understandingand fitting of the model. Understanding is simplified because the value of the variable for anaverage country is 0 for each year so it is easy to make comparisons from year to year.
2.3. EconomyThe economic health of each country was measured by categories that are based on GDP (percapita), as listed in Central Intelligence Agency (2005). Though the values of GDP in this ref-erence are listed with a collection date that is often several years before the year of publication,for this study, the listed values were considered to be the best available measures for the year ofpublication.
Because the effect of economic health on national FMD status might be non-linear (i.e. coun-tries with GDP per capita over a certain value can support an animal health infrastructure of acertain quality rather than each additional dollar improving the animal health infrastructure),a categorical variable with three levels—lowest 25% (‘lowGDP’), middle 50% (‘midGDP’) andhighest 25% (‘highGDP’)—was constructed and used to represent economic health in modelsincluding that variable. This categorization was based on the assumption that countries in thelowGDP category would have mostly subsistence livestock owners and would not be able tofund FMD control programmes in the public or private sector. Conversely, countries in thehighGDP category would have enough cushion of resources in the public and private sectorsto fund FMD control programmes. In the midGDP category, expenditure of available capitalwould depend more on governance and on effect modifiers than on GDP per capita alone.A comparison of models using several versions of the categorical GDP per capita versus a con-tinuous measure of GDP per capita identified a clear preference for the categorical variable asdescribed above (the analysis is not shown).
706 R. B. Garabed, W. O. Johnson, J. Gill, A. M. Perez and M. C. Thurmond
2.4. Local exposure to foot-and-mouth diseaseData on the length (kilometres) of land borders for each country were obtained from CentralIntelligence Agency (2005). These data were used to construct a standardized (standardizationdoes not vary by year) measure of the length of the country’s borders (kilometres) and the pro-portion of the country’s border that is adjacent to FMD positive and FMD-not-free countries(‘%borders-P’ and ‘ %borders-NF’ respectively). The variables, %borders-P and %borders-NF,as calculated, were included as potential effect modifiers (interactions with voice and GDPper capita).
The FMD positive and FMD-not-free classifications were based on public information fromthe OIE’s Web site, http://www.oie.int. This Web site only collects voluntary reportsof FMD cases from OIE member countries (Handistatus II, 2005) and designates countriesas free of FMD (International Committee of the OIE, 2005). These two designations, one ofentirely free countries (with or without vaccination) and the other of positive countries, dictatethe three, partially overlapping, FMD status classifications for countries: positive (appearingon the list of countries with cases, FMD-P), not free (not appearing on the list of free countries;this includes positive countries, FMD-NF) and free (appearing on the list of free countries,FMD-F). In all models, the FMD-F classification was used as the reference category so thatthere were two dummy variables (FMD-P and FMD-NF), both of which could equal 1 at thesame time.
2.5. Imports and exportsThe World Bank Group’s measures of food and live animals imports and exports, as a per-centage of the country’s merchandise imports and exports respectively (World Bank Group,2005), were used as measures of trade related to FMD. The standardized exports measure wasused as a surrogate for the desire of farmers and the government to control FMD (‘exports’),and the imports measure multiplied by overall merchandise imports for the country—and thenstandardized—was part of the surrogate for ‘exposure to FMD’ (‘imports’). The country’s foodexports and imports were used as surrogate measures because they should be monotonicallyrelated to their respective unmeasurable variables, the desire to control FMD and exposure toFMD.
The size of a country’s food export market relative to its other export markets was used as ameasure of the relative importance of animal-related trade to the country’s economy. The greaterthe importance of animal-related trade to the economy in general, the greater its importancewould be to the government and to farmers, and the greater the desire in these stakeholdergroups to increase export profits by attaining an FMD-free status. Similarly, a country’s foodand live animal imports are a source of possible FMD exposure. The true measure of interesthere would be the amount of FMDV-infected material that is imported into the country towhich a susceptible animal might be exposed and for which the country must spend resources toscreen. This true (unobservable) measure of interest should be proportional to the total amountof possibly infected and infectious material, which is largely composed of food and live an-imal imports. Both of these variables, imports and exports, were included as potential effectmodifiers.
2.6. Notes on data assemblyBecause certain land areas and political–economic entities were given different names in differ-ent sources, records in some sources had to be appropriately summarized to match a master‘country’ list. For example, GDP per capita for Cyprus, which was split into Turkish Cyprus
Exploration of Foot-and-mouth Disease 707
GDP and Greek Cyprus GDP in Central Intelligence Agency (2005), was combined in a weightedaverage by using Central Intelligence Agency data on the population in each area. Similarly, theCentral Intelligence Agency data split between the West Bank and Gaza Strip were combinedand matched with World Bank Institute data on Palestinian Autonomous Territories. Dataon East Timor were included for 2001–2005, because the country was not recognized interna-tionally until 2002. Consequently, border and economic information from 2002 was used toapproximate respective 2001 values.
A large proportion of values for the predictors, voice, exports and imports, were missing inthe data set: 772 records out of 1877 (41%) had at least one missing predictor. To assess theeffect of these missing values, the predictions were made five times, employing different datasets with the missing values filled in by using multivariate imputation by chained equations(Van Buuren et al., 1999) and the accuracies of the predictions were compared. Calculationswere done by using the mice package (Van Buuren and Oudshoorn, 2000) in R statisticalsoftware (R Development Core Team, 2005) using the algorithm from Little and Rubin (1987).
3. Models
Inferences from the binary regression models were made by using the Bayesian paradigm; thus,posterior inferences for regression coefficients and model truth are based both on prior expertbeliefs about the effects of the parameters in the form of prior distributions (which are describedbelow), and on the data. The regression model is
Y[i,j] ∼Bernoulli.P[i,j]/,
ln(
p[i,j]
1−p[i,j]
)=βx[i,j−1] +φw[i,j−1] +γi
.3:1/
where Y[i,j] is the response and p[i,j] is the probability of country i (i=1, . . . , C) being consideredFMD positive in year j (j =1, . . . , ni) such that the total number of observations is n=ΣC
i=1ni.Also, x[i,j−1] is the corresponding vector of covariates, lagged by 1 year, and β is the vectorof the regression coefficients; w[i,j−1] is the vector of two-way interactions for effect modifiervariables lagged by 1 year with associated coefficients φ; γi is the random effect for country i.The random effects γ are assumed to be distributed normally with a mean of 0 and a varianceof 1=τ . All independent variables were lagged by 1 year so that their proposed association withpresence of FMD could be interpreted, to some extent, as causal. The use of FMD status laggedby 2 years j − 2 alone and in addition to j − 1 in a few models appeared to produce the sameresult as j −1 alone, so FMD [i, j −2] was not included in the model averaging that is describedbelow.
Using the formula
N =1+n∑
k=1mk.1+Lk/, mk =
(n
k
), Lk =2Ik −1, Ik =
(k
2
), .3:2/
where n is the total number of variables, mk is the total number of models with exactly k factorsand no interactions, Ik is the total number of possible two-way interactions for a given modelwith k factors and Lk is the number of ways to add two-way interactions to a model with kfactors, the total possible number of models with our seven variables would be N = 2350602.We selected 1395 ‘reasonable’ models and used Bayesian model averaging to summarize resultsof these models according to how well they fit the observed data. These 1395 models are definedas the ‘model space’. Of the 2350602 possible models with two-way interactions, the modelspace included only
708 R. B. Garabed, W. O. Johnson, J. Gill, A. M. Perez and M. C. Thurmond
(a) a model with only the intercept,(b) models with each governance or economic health measure alone,(c) models with each governance or economic health measure and each potential confounder
alone,(d) models with each governance or economic health measure with all combinations of
potential confounders and(e) models with each governance or economic health measure with all combinations of poten-
tial confounders, effect modifiers entered as interactions of the governance or economichealth measure and the potential effect modifier.
Models not including the governance or economic health measure were excluded because theycould not provide information about the association of interest to our study (governance, ec-onomic health and presence of FMD).
3.1. Prior distributionsThe prior distributions on the regression parameters were semi-informative—using expert opin-ion for only the governance and economic variables, whereas prior distributions for all othercovariates were specified to be relatively non-informative.
Informative priors were used for governance and economic coefficients. These were derivedfor ‘typical’ countries, i.e. with random effects set equal to 0. The method that is describedbelow is a modification of the elicitation method that was developed by Bedrick et al. (1997).Consider that the probability of being FMD positive, for a typical country that was free ofFMD in the previous year (FMD-P and FMD-NF equal to 0), had land borders only withFMD-free countries (borders-P, borders-NF, %borders-P and %borders-NF equal to 0), hadan average level of food and live animal exports as a percentage of overall merchandise exports(exports=0), had an average level of food and live animal imports (imports=0), had averagegovernance (voice=0) and had a high GDP per capita (top 25%) (lowGDP and midGDP equalto 0) would be a function only of the intercept term. In this instance, the probability of beingFMD positive is thus a function of only the intercept, say logit.p̃0/ = ln{p̃0=.1 − p̃0/} = β0,because all standardized covariates and dummy variables are set to 0, their mean and referencevalues. Using our own collective expert opinion based on 4–10 years of experience working withFMD, we elicited information about the probability that a country like this one (a country sim-ilar to Singapore or Chile, if it did not border FMD positive countries) having FMD. The modeof our prior on p̃0 was 0.01, and the 95% upper limit was 0.1. These probabilities were used todescribe a normal distribution for the intercept term with a mean of logit.0:019/ =−4:59512and a precision of
1:96{ln.0:1=0:9/− ln.0:01=0:99/}2 =0:67:
Thus, the informative distribution for the intercept is specified as β0 ∼N.−4:60, 0:67/.Additional covariate combinations were constructed in which the probabilities of FMD
were a function of the intercept and a single predictor. The value of the predictor was setto 1.0, which corresponds to 1 standard deviation above the mean in the case of a continuousvariate, or to a specified category in the case of a categorical variate. Then, denoting this var-iate generically as ‘Å’ and the corresponding probability of FMD as a function of it as p̃Å,logit.p̃Å/ =β0 +βÅ, prior information was elicited about this probability, conditional on theelicited prior mean for logit.p̃0/ = β0. Normal distributions were induced for βÅ in preciselythe same way that the prior for β0 was induced above. Three further elicitations were made,
Exploration of Foot-and-mouth Disease 709
all of them changes from the covariate combination that was used for p̃0: the first involvedchanging voice from 0 to 1, the second involved changing from lowGDP and midGDP equalto 0 to midGDP=1 and the third involved changing from lowGDP and midGDP equal to0 to lowGDP=1. So elicitations were for coefficients corresponding to voice, midGDP andlowGDP.
For case 1, the mode of the prior on p̃Å is 0.0001 (1 in 10000) with a 95% upper limit of0.01 leading to an N.−4:62, 0:18/ prior for the coefficient corresponding to voice; in case 2, themode was 0.08 with a 95% upper limit of 0.3 leading to an N.2:15, 1:51/ prior on the coefficientcorresponding to midGDP; in case 3, the mode was 0.07 with a 95% upper limit of 0.3 leading toan N.2:01, 1:27/ prior on the coefficient corresponding to lowGDP. Because the subsequent elic-itations all depend on the mean of the prior for the first, they are technically dependent, thoughwe regarded them independently to be consistent with our prior specification for the remainingparameters. A subsequent sensitivity analysis established that these informative priors do notoverly affect the conclusions of our analysis.
For the remaining regression parameters, we specified relatively non-informative and indepen-dent, N.0, 1/, priors. This choice is based on consideration of the induced priors on probabilitiesof FMD corresponding to covariate combinations that include 0s for values of the voice, low-GDP and midGDP parameters. This particular choice of prior led to plots of induced priorson FMD probabilities (by using formula (1)) that were reasonable approximations to uniformpriors across variations on covariate combinations that were found in the data. The reason thatthe prior precision of 1 worked was because continuous covariates were standardized so thatmost values were within 2 units of 0, and categorical (dummy) variates were either 0 or 1. Withsmaller precision (larger variance), induced distributions tended to look U shaped and, withvery small precision, the induced distributions tended towards 0.5 point masses at 0 and 1. Thedistributions selected, thus, conveyed no specific knowledge about the probability of a countrybeing FMD positive.
The prior distribution for the precision (τ = 1=variance) of the random effects was chosento be a gamma distribution with a mode of 1 and a standard deviation equal to 0.1, namelygamma(101.99,100.99). To understand this choice, first condition on our previously elicited0.01 ‘best guess’ for the probability of FMD in a typical baseline country, namely a countrywith FMD-P, FMD-NF, borders-P, borders-NF, %borders-P, %borders-NF, exports, imports,voice, lowGDP and midGDP equal to 0, and with random effect equal to 0. Then, the random-effects model presumes that other baseline countries (with presumed risk factor values of 0)would have probabilities that varied around the true value. Alternatively, we can imagine theprobabilities for a single country varying over time. This choice of prior for τ reflects a beliefthat 95% of those probabilities would be less than 0.05. So, although the typical (baseline)country is expected a priori to have a 0.01-probability, the prior reflects a belief that 19 out of20 baseline countries will have probabilities that do not exceed 0.05. Considering that the lastrecorded outbreak of FMD in Singapore (which is currently an approximately baseline country)was in 1935, the ‘elicited’ probability that, in the worst 5 years out of 100, a country that wasconstantly like the Singapore of today in its GDP, voice, trade, etc. would have a probability ofhaving FMD of 0.05 or larger seems reasonable.
3.2. Model averagingEach of the 1395 models was fitted separately by using OpenBUGS (http://www.math.helsinki.fi/openbugs/, version 2) with 1000 iterations used for burn-in and 5000 itera-tions used for estimation. Convergence was assessed for all 1395 models by using the Gewekestatistic (Geweke, 1992) in the boa package (Smith, 2005) of R (http://cran.ssds.
710 R. B. Garabed, W. O. Johnson, J. Gill, A. M. Perez and M. C. Thurmond
ucdavis.edu/, version 2.1.1). Of the 419895 parameters that were estimated, 0.9% (3779)had Geweke statistics outside the range from −1.96 to 1.96, which suggests convergence. Inaddition, history plots for a subset of parameters including those with extreme Geweke statis-tics appeared to converge. The models were summarized by using the Bayesian model averagingmethod (Raftery et al., 1997; Hoeting et al., 1999) in MATLAB (MathWorks, 2006). Bayesianmodel averaging weights coefficient estimates and predictions (in this case predictive probabili-ties of presence of FMD) from each model with the (approximate) posterior probability that itis ‘true’, given the data and the model space. The iterates of the Gibbs sampler (CODAs) wereused to approximate these weights by using equations (3.3) and (3.4) below.
All models were assumed to be equally likely true, a priori. The marginal probability of thedata under model Mk was numerically approximated by
P.data|Mk/≈m
(m∑
h=1
1Dh
)−1
,
Dh =[C,ni]∏
[i,j]=[1,1]
{exp.x[i,j−1]β
hMk
+w[i,j−1]φhMk
+γh{Mk ,i}/
1+ exp.x[i,j−1]βhMk
+w[i,j−1]φhMk
+γh{Mk ,i}/
}y[i,j]
×{
1
1+ exp.x[i,j−1]βhMk
+w[i,j−1]φhMk
+γh{Mk ,i}/
}1−y[i,j]
.3:3/
(Kass and Raftery, 1995) where m is the total number of iterations (5000), j is the year and i isthe country for data point [i, j], βh
Mk, φh
Mkand γh
Mk ,i are the hth iterate values of βMk, φMk
andγ{Mk ,i} respectively. For computational efficiency, equation (3.3) was calculated by using
Dh = exp
[[C,ni]∑
[i,j]=[1,1]y[i,j].x[i,j−1]β
hMk
+w[i,j−1]φhMk
+γh{Mk ,i}/
−[C,ni]∑
[i,j]=[1,1]ln{1+ exp.x[i,j−1]β
hMk
+w[i,j−1]φhMk
+γh{Mk ,i}/}
]:
With equal prior probabilities for each of the models, the posterior probability for model Mk is
P.Mk|data/=P.data|Mk/
/N∑
g=1P.data|Mg/, .3:4/
where N is the number of models under consideration. The approximation of P.data|Mk/ thatis used in equation (3.4) is generally referred to as the harmonic mean estimator and has beenshown to be an unstable estimator of P.data|Mk/ in some situations (Sinharay and Stern, 2000);however, the approximation appears to be adequate for this analysis.
3.3. Summary calculationsUsing the approximate model probabilities P.Mk|data/ and the posterior means of the coeffi-cients β̂Mk
and random effects γ̂Mkfor each model, we calculated measures of the effects of
governance and economic health on country level FMD status and also calculated predictiveprobabilities of presence of FMD in each country. First, we calculated the probability that thevariable of interest, say g, had some effect, which is similar to saying that the coefficient forvariable g was not equal to 0, P.βg �=0|data, model space/, and was calculated by summing themodel probabilities P.Mk|data/ for all models containing the variable of interest, g:
Exploration of Foot-and-mouth Disease 711
P.βg �=0|data, model space/= ∑k:βg∈Mk
P.Mk|data, model space/: .3:5/
In addition, the approximate posterior model-averaged distribution of each regression coeffi-cient and each country random effect were calculated. We constructed a posterior sample foreach ‘parameter’ from each of the 1395 models by randomly sampling a subset of size nk iteratesof the coefficient for each model (Mk) (CODA in OpenBUGS). The value of nk was chosen onthe basis of nk = 5000 P.Mk|data/. If nk was less than 0.5, no iterates were chosen from Mk,nk = 0. Summary measures (average and probability interval) and plots of these distributionswere based on the distribution of the resulting combined iterates.
Finally, the predictive probability of being FMD positive was obtained for each country ifor each year from 1997 to 2005, j, by using the formula below and using information fromthe previous year about governance, economic health and hypothesized confounders and effectmodifiers:
P̂.FMD[i,j+1]|data/=∑k
P̂.Mk|data/P̂.FMD[i,j+1]|Mk/,
P̂.FMD[i,j+1]|Mk/= exp.β̂Mkx[i,j] + ψ̂Mk
w[i,j] + γ̂[Mk ,i]/
1+ exp.β̂Mkx[i,j] + ψ̂Mk
w[i,j] + γ̂[Mk ,i]/: .3:6/
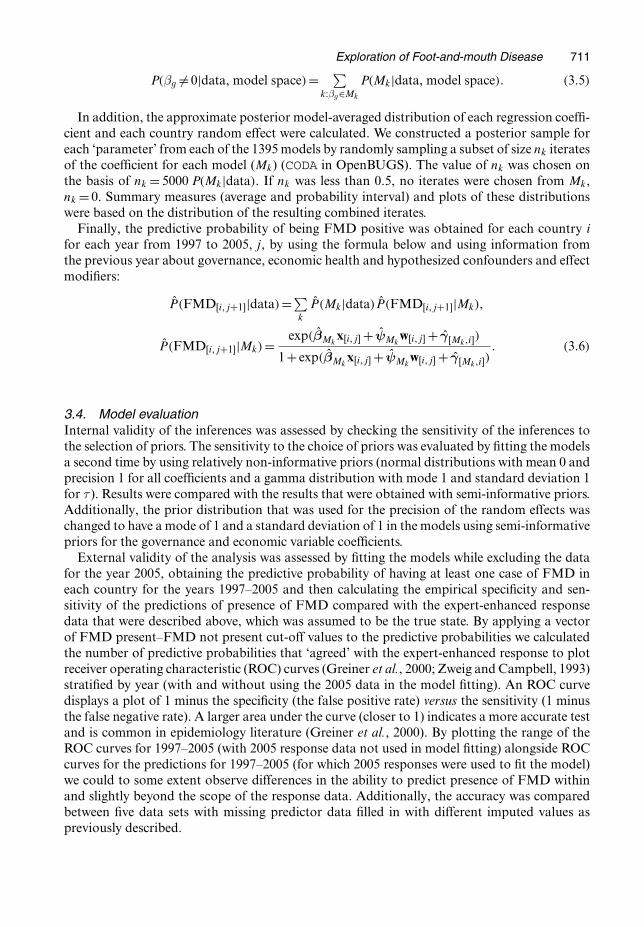
3.4. Model evaluationInternal validity of the inferences was assessed by checking the sensitivity of the inferences tothe selection of priors. The sensitivity to the choice of priors was evaluated by fitting the modelsa second time by using relatively non-informative priors (normal distributions with mean 0 andprecision 1 for all coefficients and a gamma distribution with mode 1 and standard deviation 1for τ ). Results were compared with the results that were obtained with semi-informative priors.Additionally, the prior distribution that was used for the precision of the random effects waschanged to have a mode of 1 and a standard deviation of 1 in the models using semi-informativepriors for the governance and economic variable coefficients.
External validity of the analysis was assessed by fitting the models while excluding the datafor the year 2005, obtaining the predictive probability of having at least one case of FMD ineach country for the years 1997–2005 and then calculating the empirical specificity and sen-sitivity of the predictions of presence of FMD compared with the expert-enhanced responsedata that were described above, which was assumed to be the true state. By applying a vectorof FMD present–FMD not present cut-off values to the predictive probabilities we calculatedthe number of predictive probabilities that ‘agreed’ with the expert-enhanced response to plotreceiver operating characteristic (ROC) curves (Greiner et al., 2000; Zweig and Campbell, 1993)stratified by year (with and without using the 2005 data in the model fitting). An ROC curvedisplays a plot of 1 minus the specificity (the false positive rate) versus the sensitivity (1 minusthe false negative rate). A larger area under the curve (closer to 1) indicates a more accurate testand is common in epidemiology literature (Greiner et al., 2000). By plotting the range of theROC curves for 1997–2005 (with 2005 response data not used in model fitting) alongside ROCcurves for the predictions for 1997–2005 (for which 2005 responses were used to fit the model)we could to some extent observe differences in the ability to predict presence of FMD withinand slightly beyond the scope of the response data. Additionally, the accuracy was comparedbetween five data sets with missing predictor data filled in with different imputed values aspreviously described.
712 R. B. Garabed, W. O. Johnson, J. Gill, A. M. Perez and M. C. Thurmond
4. Results
4.1. Description of the dataThe assembled data contained 1877 records from 210 countries or territories (which are hence-forth referred to as countries) over 9 years from 1997 to 2005. Of the 210 countries, 207 hadrecords for all 9 years, whereas Montserrat, the Falkland Islands and East Timor had data for7 years, 4 years and 3 years respectively. 186 countries of the 210 had only positive or only neg-ative expert-assigned FMD statuses for all 9 years of the study, and the remaining 24 countrieschanged status for at least 1 year. The expert-assigned FMD status generally matched the statusthat had been recorded by the OIE in the previous year (a potential predictor or confounder),but the expert additionally assigned the FMD status for 874 of 1877 records that were not listedby the OIE. Descriptive statistics for the remaining (unstandardized) hypothesized predictors(the data are not shown) showed large differences between the means and medians, indicatingskewed distributions for most variables.
4.2. Summary calculationsThe probabilities that each variable was associated with the probability of finding FMD in acountry are listed in Table 1. Because all levels of the categorical variables were either forcedin or forced out in any particular model, only one probability (the probability that any level ofthe categorical variable was associated with the probability of finding FMD) is listed in Table 1.The posterior probabilities that the categorical measure of GDP per capita, FMD status inthe previous year and the interaction between previous FMD status and GDP per capita wereassociated with FMD presence were all equal to 1. The probability that governance (voice),borders with FMD positive or FMD-not-free countries, food and live animal exports andimports, and their interactions with GDP per capita were associated with the probability ofFMD being present in a country were appreciable as well, ranging from 0.997 to 0.589, and theremaining variables (interactions with voice) all had probabilities of association that were lessthan 0.001.
Table 1. Probabilities that any level of a variablewas associated with the FMD status of countries for1997–2005†
Variable Probability
FMD status (OIE) 1.000GDP 1.000GDP Å FMD status (OIE) 1.000% borders with P or NF 0.997Border length with P or NF 0.996GDP Å border length with P or NF 0.991Voice 0.987GDP Å % borders with P or NF 0.939% food exports 0.821GDP Å % food exports 0.763Food imports 0.755Voice Å GDP 0.650GDP Å food imports 0.589All remaining interactions <0.001
†Asterisks denote interaction; NF, countries not freeof FMD; P, countries positive for FMD; GDP, GDPper capita, categorical.
Exploration of Foot-and-mouth Disease 713
−4 −2 0 2 4 6
0.0
0.2
0.4
0.6
0.8
Coefficient Value
(a)
App
roxi
mat
e P
roba
bilit
y D
ensi
ty
(b)
−4 −2 0 2 4 6
0.0
0.2
0.4
0.6
0.8
Coefficient Value
App
roxi
mat
e P
roba
bilit
y D
ensi
ty
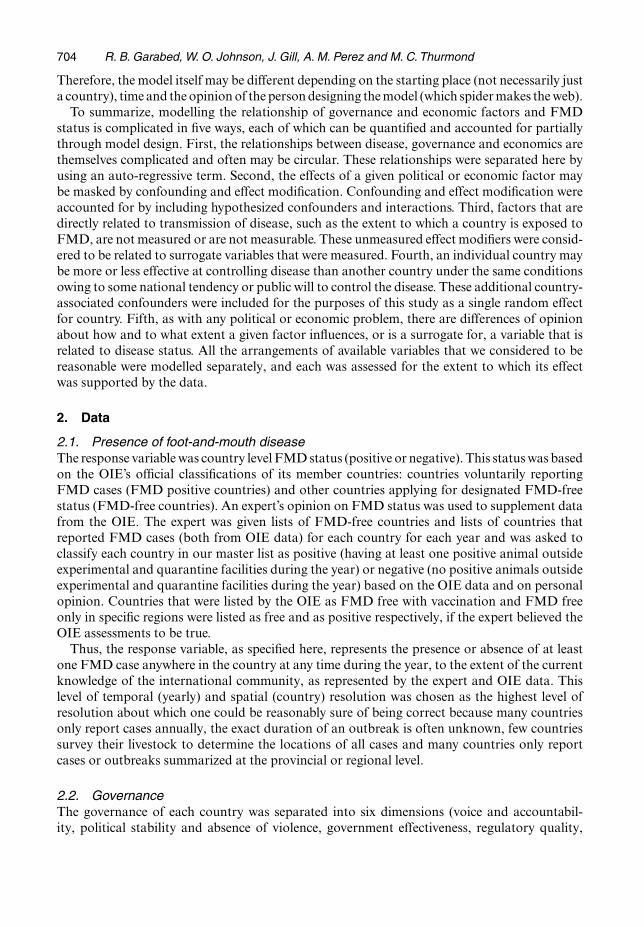
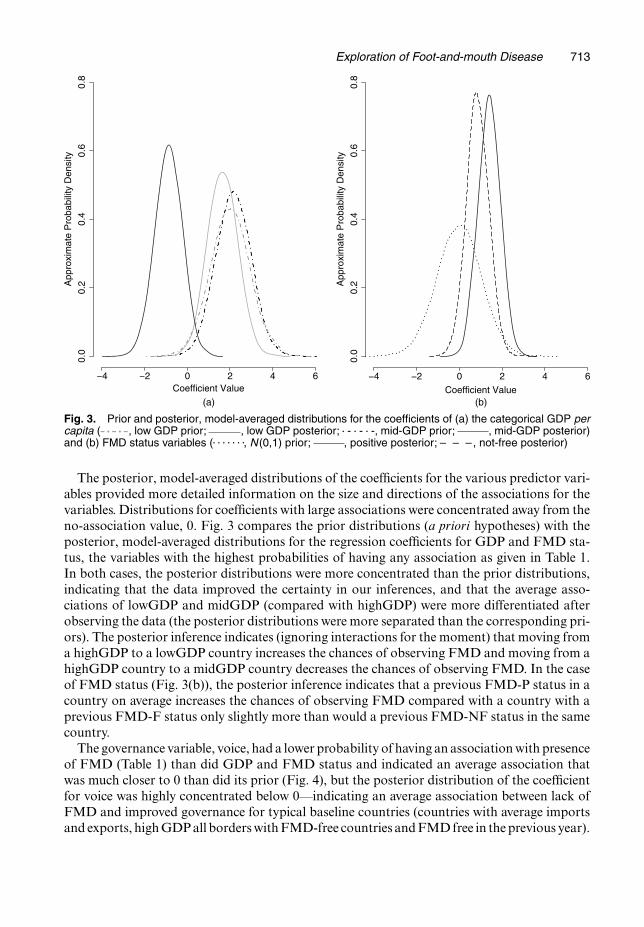
Fig. 3. Prior and posterior, model-averaged distributions for the coefficients of (a) the categorical GDP percapita ( , low GDP prior; , low GDP posterior; � - � - � -, mid-GDP prior; , mid-GDP posterior)and (b) FMD status variables (. . . . . . ., N (0,1) prior; , positive posterior; – – –, not-free posterior)
The posterior, model-averaged distributions of the coefficients for the various predictor vari-ables provided more detailed information on the size and directions of the associations for thevariables. Distributions for coefficients with large associations were concentrated away from theno-association value, 0. Fig. 3 compares the prior distributions (a priori hypotheses) with theposterior, model-averaged distributions for the regression coefficients for GDP and FMD sta-tus, the variables with the highest probabilities of having any association as given in Table 1.In both cases, the posterior distributions were more concentrated than the prior distributions,indicating that the data improved the certainty in our inferences, and that the average asso-ciations of lowGDP and midGDP (compared with highGDP) were more differentiated afterobserving the data (the posterior distributions were more separated than the corresponding pri-ors). The posterior inference indicates (ignoring interactions for the moment) that moving froma highGDP to a lowGDP country increases the chances of observing FMD and moving from ahighGDP country to a midGDP country decreases the chances of observing FMD. In the caseof FMD status (Fig. 3(b)), the posterior inference indicates that a previous FMD-P status in acountry on average increases the chances of observing FMD compared with a country with aprevious FMD-F status only slightly more than would a previous FMD-NF status in the samecountry.
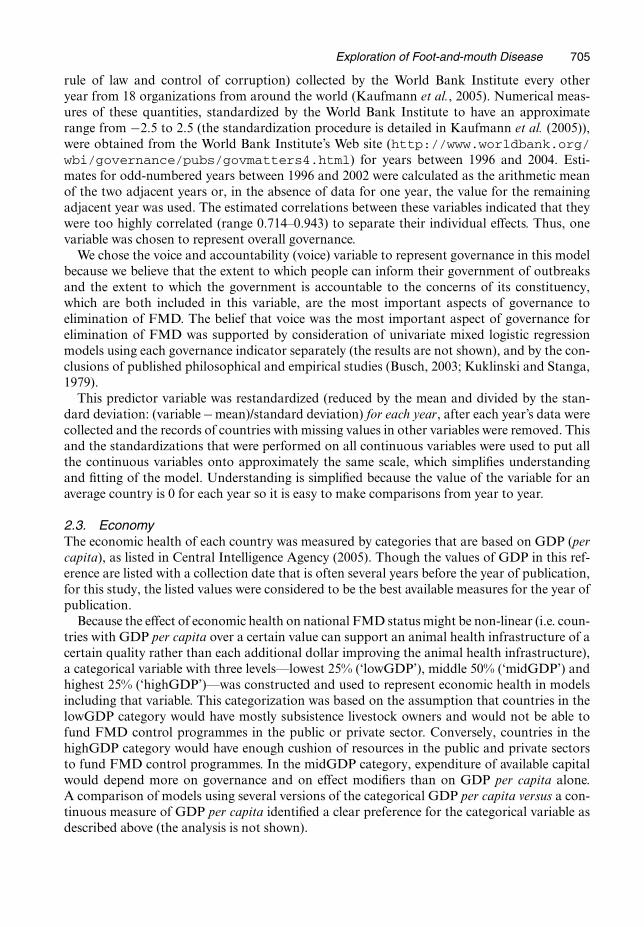
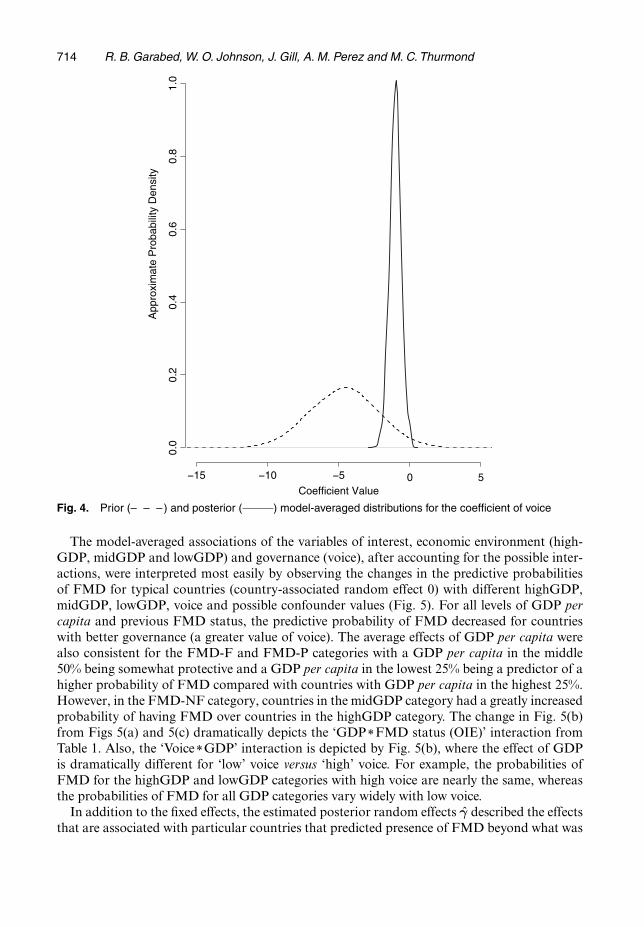
The governance variable, voice, had a lower probability of having an association with presenceof FMD (Table 1) than did GDP and FMD status and indicated an average association thatwas much closer to 0 than did its prior (Fig. 4), but the posterior distribution of the coefficientfor voice was highly concentrated below 0—indicating an average association between lack ofFMD and improved governance for typical baseline countries (countries with average importsand exports, high GDP all borders with FMD-free countries and FMD free in the previous year).
714 R. B. Garabed, W. O. Johnson, J. Gill, A. M. Perez and M. C. Thurmond
−15 −10 −5 0 5
0.0
0.2
0.4
0.6
0.8
1.0
Coefficient Value
App
roxi
mat
e P
roba
bilit
y D
ensi
ty
Fig. 4. Prior (– – –) and posterior ( ) model-averaged distributions for the coefficient of voice
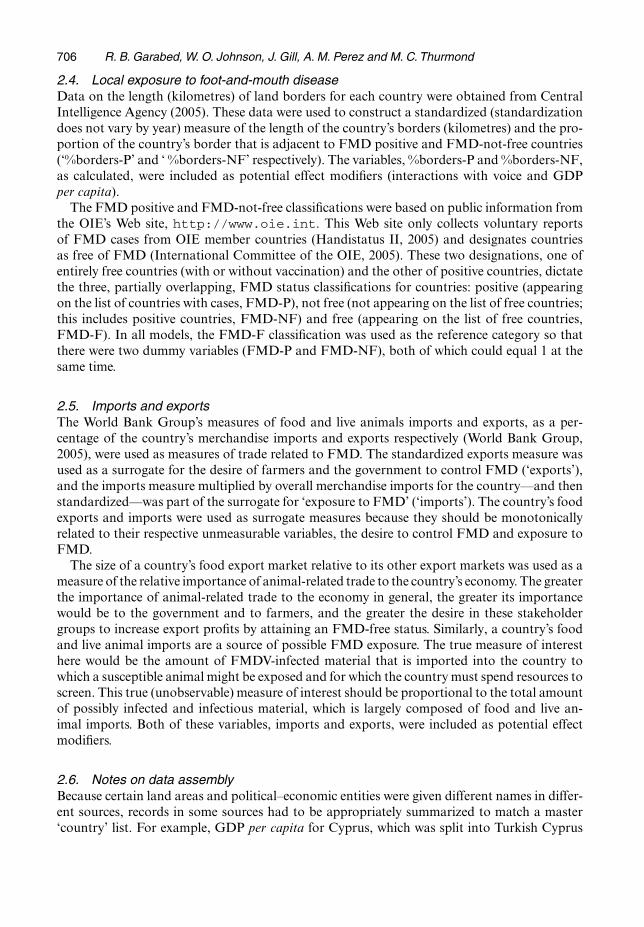
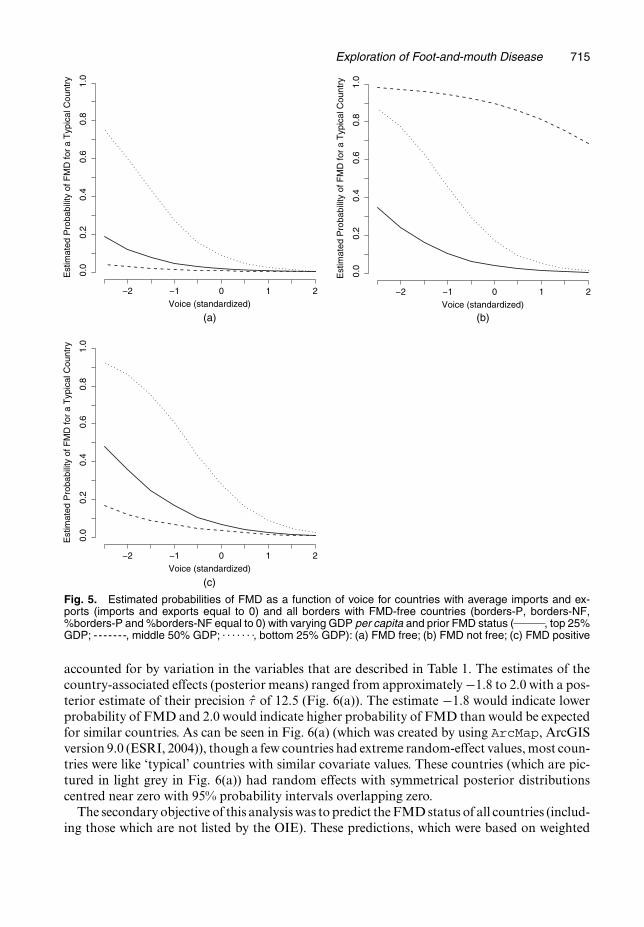
The model-averaged associations of the variables of interest, economic environment (high-GDP, midGDP and lowGDP) and governance (voice), after accounting for the possible inter-actions, were interpreted most easily by observing the changes in the predictive probabilitiesof FMD for typical countries (country-associated random effect 0) with different highGDP,midGDP, lowGDP, voice and possible confounder values (Fig. 5). For all levels of GDP percapita and previous FMD status, the predictive probability of FMD decreased for countrieswith better governance (a greater value of voice). The average effects of GDP per capita werealso consistent for the FMD-F and FMD-P categories with a GDP per capita in the middle50% being somewhat protective and a GDP per capita in the lowest 25% being a predictor of ahigher probability of FMD compared with countries with GDP per capita in the highest 25%.However, in the FMD-NF category, countries in the midGDP category had a greatly increasedprobability of having FMD over countries in the highGDP category. The change in Fig. 5(b)from Figs 5(a) and 5(c) dramatically depicts the ‘GDPÅFMD status (OIE)’ interaction fromTable 1. Also, the ‘VoiceÅGDP’ interaction is depicted by Fig. 5(b), where the effect of GDPis dramatically different for ‘low’ voice versus ‘high’ voice. For example, the probabilities ofFMD for the highGDP and lowGDP categories with high voice are nearly the same, whereasthe probabilities of FMD for all GDP categories vary widely with low voice.
In addition to the fixed effects, the estimated posterior random effects γ̂ described the effectsthat are associated with particular countries that predicted presence of FMD beyond what was
Exploration of Foot-and-mouth Disease 715
Voice (standardized)−2 −1 0 1 2
Est
imat
ed P
roba
bilit
y of
FM
D fo
r a
Typ
ical
Cou
ntry
0.0
0.2
0.4
0.6
0.8
1.0
(c)
Voice (standardized)−2 −1 0 1 2
Est
imat
ed P
roba
bilit
y of
FM
D fo
r a
Typ
ical
Cou
ntry
0.0
0.2
0.4
0.6
0.8
1.0
(b)Voice (standardized)
Est
imat
ed P
roba
bilit
y of
FM
D fo
r a
Typ
ical
Cou
ntry
−2 −1 0 1 2
0.0
0.2
0.4
0.6
0.8
1.0
(a)
Fig. 5. Estimated probabilities of FMD as a function of voice for countries with average imports and ex-ports (imports and exports equal to 0) and all borders with FMD-free countries (borders-P, borders-NF,%borders-P and %borders-NF equal to 0) with varying GDP per capita and prior FMD status ( , top 25%GDP; -- - - - - -, middle 50% GDP; . . . . . . ., bottom 25% GDP): (a) FMD free; (b) FMD not free; (c) FMD positive
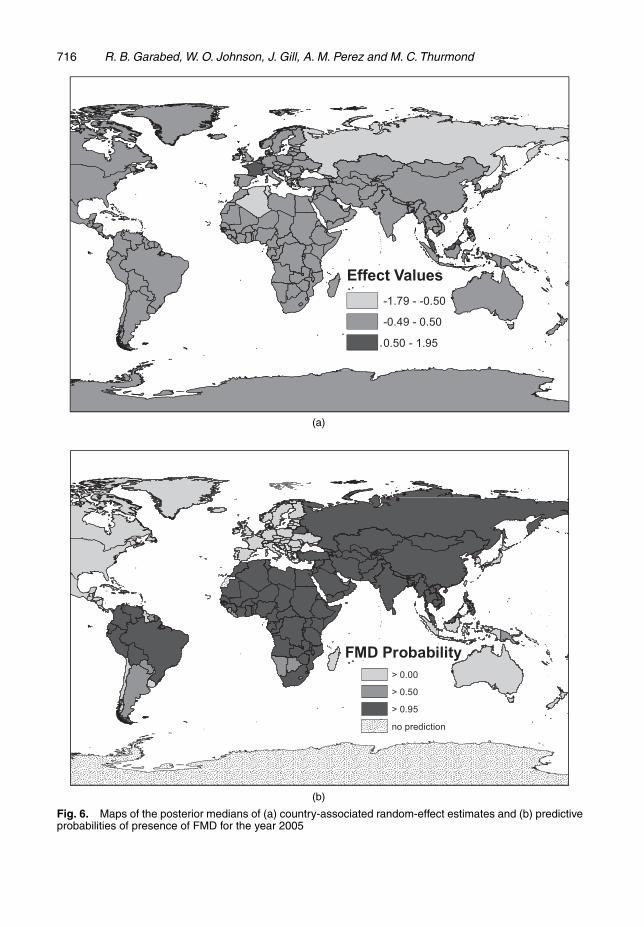
accounted for by variation in the variables that are described in Table 1. The estimates of thecountry-associated effects (posterior means) ranged from approximately −1.8 to 2.0 with a pos-terior estimate of their precision τ̂ of 12.5 (Fig. 6(a)). The estimate −1:8 would indicate lowerprobability of FMD and 2.0 would indicate higher probability of FMD than would be expectedfor similar countries. As can be seen in Fig. 6(a) (which was created by using ArcMap, ArcGISversion 9.0 (ESRI, 2004)), though a few countries had extreme random-effect values, most coun-tries were like ‘typical’ countries with similar covariate values. These countries (which are pic-tured in light grey in Fig. 6(a)) had random effects with symmetrical posterior distributionscentred near zero with 95% probability intervals overlapping zero.
The secondary objective of this analysis was to predict the FMD status of all countries (includ-ing those which are not listed by the OIE). These predictions, which were based on weighted
716 R. B. Garabed, W. O. Johnson, J. Gill, A. M. Perez and M. C. Thurmond
(a)
(b)
Fig. 6. Maps of the posterior medians of (a) country-associated random-effect estimates and (b) predictiveprobabilities of presence of FMD for the year 2005
Exploration of Foot-and-mouth Disease 717
averages of the predictions from all 1395 models for each year as described in the methods above,were displayed in maps that were created by using ArcMap, and an example map is shown inFig. 6(b). Most of the countries were predicted to have either high (greater than 95%) or low(less than 25%) probability of FMD, with few countries having moderate probabilities of FMD.
4.3. Model evaluationInternal validity tests of the modelling process included tests of the sensitivity of the results tospecification of the prior distributions of the parameters. The sensitivity of the results to thespecification of the prior distribution showed minimal differences in the predictive probabilitiesof FMD for the 1877 data points. Only four of the 1877 data points had predictive probabili-ties that differed by more than 0.20 when the three different priors were used and, of the four‘extreme’ data points, none of the differences in the prediction were sufficiently great to changewhich way the country would have been classified in a map like Fig. 6(b) (high risk, moderaterisk or low risk). As for the variables of interest, use of the non-informative prior led to a morenegative value for the coefficient of the midGDP category and a more positive value for thecoefficient of the lowGDP category; however, the plots of predictive probabilities were similarto those which are shown in Fig. 5 for all priors.
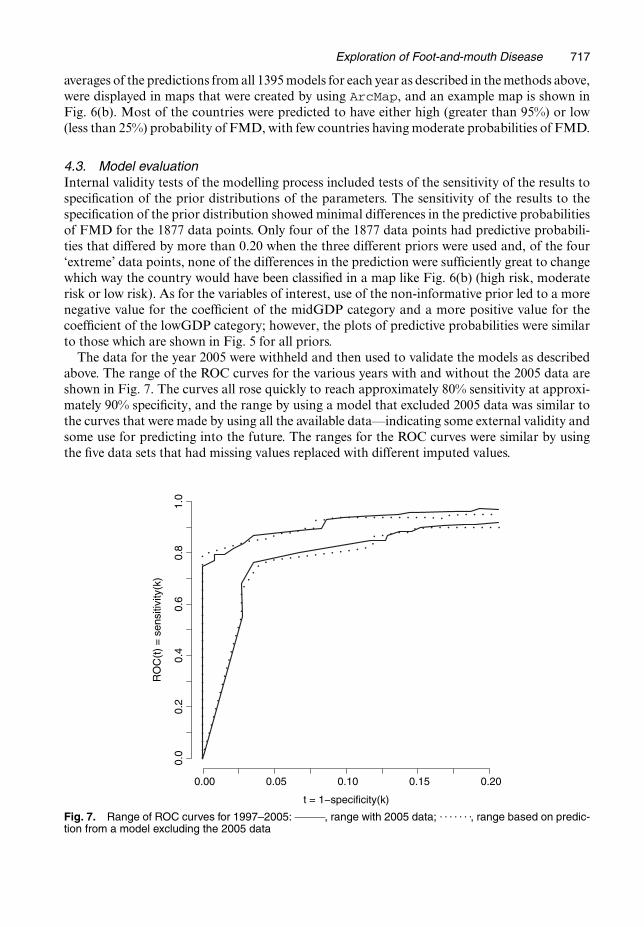
The data for the year 2005 were withheld and then used to validate the models as describedabove. The range of the ROC curves for the various years with and without the 2005 data areshown in Fig. 7. The curves all rose quickly to reach approximately 80% sensitivity at approxi-mately 90% specificity, and the range by using a model that excluded 2005 data was similar tothe curves that were made by using all the available data—indicating some external validity andsome use for predicting into the future. The ranges for the ROC curves were similar by usingthe five data sets that had missing values replaced with different imputed values.
t = 1−specificity(k)
RO
C(t
) =
sen
sitiv
ity(k
)
0.00 0.05 0.10 0.15 0.20
0.0
0.2
0.4
0.6
0.8
1.0
Fig. 7. Range of ROC curves for 1997–2005: , range with 2005 data; . . . . . . ., range based on predic-tion from a model excluding the 2005 data
718 R. B. Garabed, W. O. Johnson, J. Gill, A. M. Perez and M. C. Thurmond
5. Discussion
The results of this study suggest that the economic environment and the governance of a coun-try on average are both associated with whether or not FMD will be present in the country.The conclusion that governance was associated with presence of FMD is based on a prob-ability of 0.987 that the governance measure (voice and accountability) would be present(i.e. that its coefficient would not equal 0) in the model space, and on a 95% probability inter-val for the coefficient’s value (the average association with governance) that excluded 0. Thisconclusion was relatively insensitive to specification of prior distributions on the regressioncoefficient for voice. The priors N.−4:62, 0:18/ and N.0, 1/ yielded the posterior mean esti-mates β̂voice of −1.03 and −1.22 respectively, and probabilities that voice would be presentof 0.987 and 1.000 respectively. Therefore, we are confident in asserting that improved gover-nance on average decreases a country’s probability of having cases of FMD in the followingyear.
The economic environment, as measured by GDP per capita in a categorical form (lowest25%, middle 50% and highest 25%), had a probability of 1.00 of being present using all priors.However, the result that the coefficients for the two categories (midGDP and lowGDP) hadposterior distributions that were concentrated away from zero was not consistent across differ-ing prior distributions. The posterior model-averaged mean values of the coefficients rangedfrom −2.779 to −0.692 for midGDP with priors of N.0, 1/ versus N.2:15, 1:51/ respectively, andranged from −0:397 to 1:668 for lowGDP with priors of N.0, 1/ versus N.2:01, 1:27/ respec-tively. Therefore, use of these different prior specifications indicated that the average effect ofGDP over the different interactions was not necessarily consistent, but that, after includinginteractions, economic environment was important in predicting the presence of FMD.
The effects of the variables of interest (voice, GDP per capita and previous presence of FMD)on hypothetical countries with different combinations of the variables are shown in Fig. 5. Thepossibility that improved voice is associated with lower probability of FMD for countries withdifferent resources and exposures is clearly indicated by the predictions in Fig. 5. Addition-ally, countries with lowGDP are predicted to have a higher probability of FMD than similarcountries with stronger economies.
The apparent effects of %borders-P and %borders-NF were also of interest in the lowGDPcategory with predictive probabilities of FMD equal to 0.464 for countries that were FMD-Pin the previous year but had only FMD-F neighbours (%borders-P and %borders-NF equalto 0), 0.795 for countries that were FMD-F in the previous year but had borders with FMD-Pcountries (%borders-P=1 and %borders-NF=1) and 0.710 for countries that were FMD-F inthe previous year but had borders with FMD-NF countries (%borders-P=0 and %borders-NF=1). Though we did not design this study to explore the effects of regional FMD statuson country level FMD status, these results as well as the conclusions of several researchers(Correa-Melo and Lopez, 2002; Reyemamu and Astudilo, 2002; Correa-Melo et al., 2002;Vosloo et al., 2002; Aidaros, 2002; Gleeson, 2002) suggest that regional FMD status greatlyaffects a country’s FMD status, particularly in poorer countries.
As mentioned in the reasoning for categorizing the GDP per capita variable, the hypothesizedeffect modifiers probably play a larger role in determining the presence of FMD in the midGDPcategory than in the other categories. In Fig. 5 this can be seen when visualizing the effect ofprevious FMD status (FMD-F, FMD-NF and FMD-P) on the countries in the middle 50%category compared with the effects on the other two GDP categories (lowGDP and highGDP).In Fig. 5 it appears that having identified the presence of FMD in a country with midGDP theprevious year and reported the presence of FMD to the OIE (FMD-P=1 and FMD-NF=1)
Exploration of Foot-and-mouth Disease 719
were associated with a decrease in the probability that the country has FMD in the currentyear when compared with an identical country that had unknown FMD status in the previousyear (FMD-P=0 and FMD-NF=1). Three explanations for the apparent protective effect ofreporting FMD in countries with midGDP are
(a) that countries are more likely to report the presence of FMD if they believe that thedisease will be eradicated in the next year,
(b) countries that report FMD presence are more likely to receive outside aid and pressureto help in the eradication or
(c) countries that are technically capable of identifying and reporting FMD are more tech-nically capable of eradicating the disease.
In addition to evaluating the associations of governance and economic environment withFMD status, the models that are developed here provide good predictions of which countrieswill and will not have FMD in the coming year (approximately 80% sensitivity and 90% spec-ificity for all years at a cut-off of 0.90 for a positive ‘diagnosis’). Though these predictions arevery accurate for diagnosing background country level FMD status, the predictions fail for rareevents like an outbreak in a country that has long been free of FMD, has good governanceand has a strong economy—the UK in 2001 for example. A failure to predict unusual events isexpected for a model that bases its predictions on observed data, which tend to represent typicalevents.
Though these models provide interesting results and accurate predictions, there are limita-tions to their applications based on both the data and on the models themselves. A restrictionto the generalization of the models’ results was added by employing expert opinion to supple-ment the response (presence of FMD) data. Because of this expert opinion, we can say onlythat governance and economics appear to affect the probability of a country being assumed tohave FMD by an expert in the global distribution of FMD, and we can only predict accuratelywhether or not an expert in FMD, looking back on a year’s worth of FMD data, will think thata given country had FMD. Though this is a limitation, if we believe that the expert opinion istrue, the predictions represent the true FMD status for a country.
Another possible limitation is that results were calculated by using a data set with at least onepredictor variable missing for 41% of observations. The data were the most complete, publiclyavailable data that could be found, but the results are still partially sensitive to changes in themissing values (128 of 1877 predictive probabilities vary by 0.10 or more and none vary by morethan 0.59 by using different imputed data sets). The imputation procedure that was used hereassumes that missing data are missing at random, which means that the absence of data in onepredictor does not depend on the values of other predictors (see Raghunathan (2004) for amore thorough discussion). Therefore, the results would probably be more sensitive to missingdata if the countries missing data are unlike the countries with recorded data for the missingtrade and political variables. Because many missing values were from islands like Bermuda,Guadeloupe, Palau and Martinique, where the covariance between imports, exports, GDPper capita, voice and FMD category should not mirror those for similar continental countries,the assumption of data missing at random is violated for these countries. This might explainwhy 33 of 37 countries with predictive probabilities that varied by more than 0.10 by using thedifferent data sets were island nations. In addition to violating the assumption of data missing atrandom, the presence of FMD and the effects of the different variables are likely to be differentfor islands than would be estimated by using the model averaging based mostly on data fromnon-island countries, which is a result that is not evident from the sensitivity analysis usingmultiple imputation through chained equations. Though not visible in Fig. 6(b), the incorrect
720 R. B. Garabed, W. O. Johnson, J. Gill, A. M. Perez and M. C. Thurmond
predictions for many island nations represent much of the decrease in specificity that is shownin Fig. 7.
A general limitation of models themselves is the inability of any model to capture all thecomplexities in a system like that influencing global FMD distribution. We attempted to modelmany of the complexities, as described above, and the method of Bayesian model averagingproved to be useful for handling the many possible models for global FMD presence predic-tion. With information about the likely distribution of FMD in the coming year, national andinternational organizations have an additional tool to use in allocating resources to prevent andcontrol FMD globally. Future work to improve the coverage of the predictor data, to exam-ine the effects of additional variables specifically for countries with middle GDP per capita, toidentify factors that affect a country’s ability to control outbreaks of FMD and to improve theresolution of this model will complement the results of this study.
6. Conclusion
Models that provide accurate quantifiable predictions of disease on a global scale, such as themodel which was developed here for the first time in the scientific literature for FMD, haveimportant uses, implications and limitations—a discussion of which can be found for predic-tion models for the human immunodeficiency virus in Walker et al. (2004). Mathematical andstatistical models have been and can be (Schwartländer et al., 1999; Stein et al., 2003, Colizzaet al., 2006, Murray and Salomon, 1998) applied to develop policy for global disease control byoffering an assessment of the extent to which country-specific factors may or may not be impor-tant in controlling disease and in projecting future disease presence with or without anticipatedchanges in predictive factors. Statistical models also would be somewhat immune to humanand political biases that can affect international policy development and, thus, would offer astandardized addition to decision-making processes.
Such models could assist agencies in directing disease control resources by identifying targets(factors) for funding that, according to the models, most probably would have the greatest effecton disease. In a country with poor economic indicators and poor governance, for example, ourmodels’ results suggest that efforts of international agencies and of the country’s government toimprove communication with its populace overall would improve national FMD status. Simi-larly, expending resources to control FMD in a country while disregarding the FMD situationof the country’s neighbours was not supported by our models’ results.
By providing a systematic and analytical approach to testing hypotheses about possible causesor associations and by making predictions of expected disease occurrence, statisticians and epi-demiologists can begin to elucidate apparently complex problems like global FMD distribution.The systematic approach of statistical models, in general, can be used as a means to uncover newinsights into the convoluted web of disease biology, global politics and allocation of resourcesthat prevents the control of all diseases of international interest.
Acknowledgements
The authors thank Ms Michelle Norris and Mr Zachary Whedbee for their helpful program-ming suggestions, and Dr Paul Kitching for generously donating his time and expert opin-ion. This work was funded by a grant from the Armed Forces Medical Intelligence Center, ablock grant from the University of California, Davis, Graduate Group in Epidemiology and agraduate student support grant from the University of California, Davis, School of VeterinaryMedicine.
Exploration of Foot-and-mouth Disease 721
References
Aidaros, H. (2002) Regional status and approaches to control and eradication of foot and mouth disease in theMiddle East and North Africa. Rev. Scient. Tech. Off. Int. Epizoot., 21, 451–458.
Aylward, R., Acharya, A., England, S., Agocs, M. and Linkins, J. (2003) Global health goals: lessons from theworldwide effort to eradicate poliomyelitis. Lancet, 362, 909–914.
BBC News online (2001) Blair delays May election. BBC, London. (Available from http://news.bbc.co.uk/1/hi/uk-politics/1253755.stm.)
Bedrick, E., Christensen, R. and Johnson, W. (1997) Bayesian binomial regression: predicting survival at a traumacenter. Am. Statistn, 51, 211–218.
Brückner, G., Vosloo, W., Du Plessis, B., Kloeck, P., Connoway, L., Ekron, M., Weaver, D., Dickason, C.,Schreuder, F., Marais, T. and Mogajane, M. (2002) Foot and mouth disease: the experience of South Africa.Rev. Scient. Tech. Off. Int. Epizoot., 21, 751–764.
Busch, L. (2003) Virgil, vigilance, and voice: agrifood ethics in an age of globalization. J. Agric. Environ. Eth., 16,459–477.
Central Intelligence Agency (2005) The World Factbook. Washington DC: Central Intelligence Agency.Chmitelin, I. and Moutou, F. (2002) Foot and mouth disease: lessons to be learned from the experience of France.
Rev. Scient. Tech. Off. Int. Epizoot., 21, 731–737.Colizza, V., Barrat, A., Barthélemy, M. and Vespignani, A. (2006) The role of the airline transportation network
in the prediction and predictability of global epidemics. Proc. Natn. Acad. Sci. USA, 103, 2015–2020.Correa-Melo, E. and Lopez, A. (2002) Control of foot and mouth disease: the experience of the Americas. Rev.
Scient. Tech. Off. Int. Epizoot., 21, 695–698.Correa-Melo, E., Saraiva, V. and Astudillo, V. (2002) Review of the status of foot and mouth disease in coun-
tries of South America and approaches to control and eradication. Rev. Scient. Tech. Off. Int. Epizoot., 21,429–436.
Costelloe, J., Gaynor, M., Gaynor, S., McAteer, W. and O’Reilly, P. (2002) Control of foot and mouth disease:lessons learned from the experience of Ireland. Rev. Scient. Tech. Off. Int. Epizoot., 21, 739–750.
Cutts, F., Henao-Restrepo, A.-M. and Olivé, J. (1999) Measles elimination: progress and challenges. Vaccine, 17,suppl. 3, S47–S52.
ESRI (2004) ArcGIS 9.0. Redlands: ESRI.Geweke, J. (1992) Evaluating the accuracy of sampling-based approaches to calculating posterior moments. In
Bayesian Statistics 4 (eds J. M. Bernardo, J. O. Berger, A. P. Dawid and A. F. M. Smith). Oxford: Clarendon.Gleeson, L. (2002) A review of the status of foot and mouth disease in South-East Asia and approaches to control
and eradication. Rev. Scient. Tech. Off. Int. Epizoot., 21, 465–475.Greiner, M., Pfeiffer, D. and Smith, R. (2000) Principles and practical application of the receiver-operating
characteristic analysis for diagnostic tests. Prevent. Veter. Med., 45, 23–41.Handistatus II (2005) Multiannual animal disease status. World Organization for Animal Health, Paris. (Available
from http://www.oie.int/hs2/report.asp.)Henao-Restrepo, A.-M., Strebel, P., Hoekstra, E., Birmingham, M. and Bilous, J. (2003) Experience in global
measles control, 1990-2001. J. Infect. Dis., 187, suppl. 1, S15–S21.Heymann, D. (2004) Smallpox containment updated: considerations for the 21st century. Int. J. Infect. Dis., 8,
suppl. 2, S15–S20.Hoeting, J., Madigan, D., Raftery, A. and Volinsky, C. (1999) Bayesian model averaging: a tutorial. Statist. Sci.,
14, 382–401.Hull, H., deQuadros, C., Bilous, J., Oblapenko, G., Andrus, J., Aslanian, R., Jafari, H., Okwo Bele, J.-M. and
Aylward, R. (1998) Perspectives from the global poliomyelitis eradication initiative. Bull. Wrld Hlth Organizn,76, suppl. 2, 42–46.
International Committee of the OIE (2005) Recognition of the foot and mouth disease status of member countries:resolutions adopted by the international committee of the oie during its 73rd general session. World AnimalHealth Organization, Paris.
Kass, R. and Raftery, A. (1995) Bayes factors. J. Am. Statist. Ass., 90, 773–795.Kaufmann, D., Kraay, A. and Mastruzzi, M. (2005) Governance matters IV: governance indicators for 1996-
2004. World Bank, New York. (Available from http://www.worldbank.org/wbi/governance/pubs/govmatters4.html.)
Kitching, R. (2002) Clinical variation in foot and mouth disease: cattle. Rev. Scient. Tech. Off. Int. Epizoot., 21,499–504.
Kitching, R. and Alexandersen, S. (2002) Clinical variation in foot and mouth disease: pigs. Rev. Scient. Tech.Off. Int. Epizoot., 21, 513–518.
Kitching, R. and Hughes, G. (2002) Clinical variation in foot and mouth disease: sheep and goats. Rev. Scient.Tech. Off. Int. Epizoot., 21, 505–512.
Kuklinski, J. and Stanga, J. (1979) Political participation and government responsiveness: the behavior of califor-nia superior courts. Am. Polit. Sci. Rev., 73, 1090–1099.
Little, R. and Rubin, D. (1987) Statistical Analysis with Missing Data. New York: Wiley.MathWorks (2006) MATLAB Version 7.3.0 R2006b. Natick: MathWorks.
722 R. B. Garabed, W. O. Johnson, J. Gill, A. M. Perez and M. C. Thurmond
Mohiddin, A. and Johnston, D. (2006) HIV/AIDS mitigation strategies and the State in sub-Saharan Africa—themissing link? Globalizn Hlth, 2, no. 1.
Murray, C. and Salomon, J. (1998) Modeling the impact of global tuberculosis control strategies. Proc. Natn.Acad. Sci. USA, 95, 13881–13886.
Perry, B., Randolph, T., Ashley, S., Chimedza, R., Forman, T., Morrison, J., Poulton, C., Sibanda, L., Stevens,C., Tebele, N. and Yngstrom, I. (2003) The Impact and Poverty Reduction Implications of Foot and Mouth Dis-ease Control in Southern Africa with Special Reference to Zimbabwe. Nairobi: International Livestock ResearchInstitute.
Perry, B. and Rich, K. (2007) Poverty impacts of foot-and-mouth disease and the poverty reduction implicationsof its control. Veter. Rec., 160, 238–241.
Pluimers, F., Akkerman, A., van der Wal, P., Dekker, A. and Bianchi, A. (2002) Lessons from the foot and mouthdisease outbreak in the Netherlands in 2001. Rev. Scient. Tech. Off. Int. Epizoot., 21, 711–721.
Raftery, A., Madigan, D. and Hoeting, J. (1997) Bayesian model averaging for linear regression models. J. Am.Statist. Ass., 92, 179–191.
Raghunathan, T. (2004) What do we do with missing data?: some options for analysis of incomplete data. A. Rev.Publ. Hlth, 25, 99–117.
R Development Core Team (2005) R: a Language and Environment for Statistical Computing, Version 2.1.1.Vienna: R Foundation for Statistical Computing. (Available from http://cran.ssds.ucdavis.edu/.)
Rennie, S. and Behets, F. (2006) Desperately seeking targets: the ethics of routine HIV testing in low-incomecountries. Bull. Wrld Hlth Organizn, 84, 52–57.
Reyemamu, M. and Astudilo, V. (2002) Global perspective for foot and mouth disease control. Rev. Scient. Tech.Off. Int. Epizoot., 21, 765–773.
Sakamoto, K. and Yoshida, K. (2002) Recent outbreaks of foot and mouth disease in countries of east Asia. Rev.Scient. Tech. Off. Int. Epizoot., 21, 459–463.
Schwartländer, B., Stanecki, K., Brown, T., Way, P., Monasch, R., Chin, J., Tarantola, D. and Walker, N. (1999)Country-specific estimates and models of HIV and AIDS: methods and limitations. AIDS, 13, 2445–2458.
Scudamore, J. and Harris, D. (2002) Control of foot and mouth disease: lessons from the experience of theoutbreak in Great Britain in 2001. Rev. Scient. Tech. Off. Int. Epizoot., 21, 699–710.
Sinharay, S. and Stern, H. (2000) Bayes factors for variance component testing in generalized linear mixed models.In Bayesian Methods with Applications to Science, Policy, and Official Statistics: Proc. 6th Wrld Meet. Interna-tional Society for Bayesian Analysis, Hersonissos, pp. 507–516. International Society for Bayesian Analysis.
Smith, B. (2005) The Boa Package, Version 1.1.5-2. Vienna: Comprehensive R Network. (Available fromhttp://cran.ssds.ucdavis.edu/.)
Spinage, C. (2003) Cattle Plague: a History. New York: Kluwer.Stein, C., Birmingham, M., Kurian, M., Duclos, P. and Strebel, P. (2003) The global burden of measels in the year
2000—a model that uses country-specific indicators. J. Infect. Dis., 187, suppl 1, S8–S14.Thompson, D., Muriel, P., Russell, D., Osborne, P., Bromley, A., Rowland, M., Creigh-Tyte, S. and Brown, C.
(2002) Economic costs of the foot and mouth disease outbreak in the United Kingdom in 2001. Rev. Scient.Tech. Off. Int. Epizoot., 21, 675–687.
Van Buuren, S., Boshuizen, H. and Knook, D. (1999) Multiple imputation of missing blood pressure covariatesin survival analysis. Statist. Med., 18, 681–694.
Van Buuren, S. and Oudshoorn, K. (2000) The Mice Package, Version 1.14. Vienna: Comprehensive R Network.(Available from http://cran.ssds.ucdavis.edu/.)
Vosloo, W., Bastos, A., Sangare, O., Hargreaves, S. and Thompson, G. (2002) Review of the status and controlof foot and mouth disease in sub-Saharan Africa. Rev. Scient. Tech. Off. Int. Epizoot., 21, 437–449.
Walker, N., Grassly, N., Garnett, G., Stanecki, K. and Ghys, P. (2004) Estimating the global burden of HIV/AIDS:what do we really know about the hiv pandemic? Lancet, 363, 2180–2185.
World Bank Group (2005) World Development Indicators. New York: World Bank. (Available from http://devdata.worldbank.org/dataonline/.)
Zweig, M. H. and Campbell, G. (1993) Receiver-operating characteristic (roc) plots: a fundamental evaluationtool in clinical medicine. Clin. Chem., 39, 561–577; erratum, 1589.