a cross-country analysis of achievements and inequities in
TRANSCRIPT
ADB Economics Working Paper Series
A Cross-Country Analysis of Achievements and Inequities in Economic Growth and Standards of Living
Hyun H. SonNo. 159 | May 2009

ADB Economics Working Paper Series No. 159
A Cross-Country Analysis of Achievements and Inequities in Economic Growth and Standards of Living
Hyun H. Son May 2009
Hyun H. Son is an Economist in the Economic Analysis and Operations Support Division, Economics and Research Department, Asian Development Bank.
Asian Development Bank6 ADB Avenue, Mandaluyong City1550 Metro Manila, Philippineswww.adb.org/economics
©2008 by Asian Development BankMay 2009ISSN 1655-5252Publication Stock No.:
The views expressed in this paperare those of the author(s) and do notnecessarily reflect the views or policiesof the Asian Development Bank.
The ADB Economics Working Paper Series is a forum for stimulating discussion and eliciting feedback on ongoing and recently completed research and policy studies undertaken by the Asian Development Bank (ADB) staff, consultants, or resource persons. The series deals with key economic and development problems, particularly those facing the Asia and Pacific region; as well as conceptual, analytical, or methodological issues relating to project/program economic analysis, and statistical data and measurement. The series aims to enhance the knowledge on Asia’s development and policy challenges; strengthen analytical rigor and quality of ADB’s country partnership strategies, and its subregional and country operations; and improve the quality and availability of statistical data and development indicators for monitoring development effectiveness.
The ADB Economics Working Paper Series is a quick-disseminating, informal publication whose titles could subsequently be revised for publication as articles in professional journals or chapters in books. The series is maintained by the Economics and Research Department.
Contents
Abstract v
Executive Summary vii
I. Introduction 1
II. Living Standards: Concepts and Indicators 3
III. Cross–Country Inequities in Standards of Living 5
IV. Achievements in Standards of Living 7
V. Relationship between Per Capita GDP and Standards of Living 11
VI. Performance in Standards of Living 14
A. Methodological �ramework 1A. Methodological �ramework 14 B. Identifying Countries with Superior (Inferior) Performance 15 C. Relative Performance of Asian Countries 17
VII. Convergence in Standards of Living 20
VIII. Public Spending and Standards of Living 24
IX. Concluding Remarks 25
Appendix 27
References 41

Abstract
This paper compares achievements and inequities in standards of living across countries. Achievement is measured by an index, which is constructed to reflect greater achievement for an increase in the standard of living of a country that is already at a high level compared to that of another country with an equal increase but from a lower base. The paper tests for the statistical relationship between indicators of standards of living and per capita income across countries. It analyzes the disparity of achievement in standards of living across countries and explains inequality in achievement in standards of living both within and between regions. �urthermore, the paper estimates the number of years it will take for different regions and selected Asian countries to catch up with the average standard of living of industrialized countries. The analysis presented is based on data from 177 countries covering the period 2000–2007.

Executive Summary
This study compares achievements and inequalities in standards of living across 177 countries over the period 2000–2007. Standard of living is based on six indicators: per capita gross domestic product (GDP) at 2005 purchasing power parity terms; life expectancy at birth; adult literacy rate; primary enrollment rate; under-5 survival rate; and births attended by skilled health personnel. These indicators are selected to reflect people’s material well-being, health, and education, and are a mixture of both inputs and results that satisfy certain criteria such as availability of data and statistical correlation with other development indicators.
In this study, achievements in standards of living are measured and inequities are compared across countries using an achievement index. The achievement index is constructed to reflect greater achievement for a further increase in the standard of living of a country that is already at a high level compared to that of another country with an equal increase but from a lower base. The results suggest a large disparity in living standards across countries, and the disparity in per capita income is far greater than that in the other indicators of living standards. Sub-Saharan Africa is the poorest region with a per capita GDP that is only 19.9% of the world average during 2000–2007, while South Asia is the second poorest region with a per capita GDP that is 23.1% of the world average. The gap in per capita GDP between industrialized countries (including Japan) and the rest of the world is extremely large, with the former region having a per capita income that is almost four times as large as the world average. By comparison, the inequality for the other five non-income indicators of living standards—life expectancy at birth, adult literacy rate, net primary enrollment rate, under-5 survival rate, and births attended by skilled health personnel—is much lower than that for per capita GDP. Inequality in births attended by skilled health personnel is far higher than the other four indicators but substantially lower compared to per capita GDP.
The study also attempts to explain achievements in standard of living in terms of within- and between-region disparities. The study finds that inequalities in standards of living between regions account for most of the total inequality between countries. For instance, the regional inequality in the under-5 survival rate explains between-country inequality by more than 86%. This suggests that the inequality in standards of living within regions plays a minor role in explaining the total inequality between countries.
The study also investigates relative achievements in standards of living by different regions. Results suggest that South Asia has lower achievements in standards of
living relative to East Asia and the Pacific as well as to Central Asia. Individual country experiences in the relative achievements are also explored.
In South Asia, Sri Lanka presents an interesting study in achievements in standards of living. While Sri Lanka’s per capita income is relatively higher than that of other South Asian countries, its growth rate is much lower than India’s. However, achievements in standard of living indicators in Sri Lanka are shown to be far superior to all other countries in the region, including India. In particular, achievements in life expectancy at birth and net primary enrollment rate in Sri Lanka are superior not only to its neighboring countries in South Asia but also to those in Asia as a whole. In other words, Sri Lanka is punching above its economic weight in terms of improving people’s lives, delivering beyond what is expected based on its income. This points to an impressive ability of Sri Lanka’s institutions to effectively deliver social services to its citizens despite its weak macroeconomic performance; this ability could be a model for study and replication.
The study further explores the relationship between per capita GDP and achievements in standards of living. The relationship is investigated by deriving the growth elasticity of standard of living, which provides the responsiveness of changes in standards of living to economic growth. This elasticity is calculated for each of the 177 countries. The study finds that the growth elasticity of living standards for industrialized countries is extremely low, suggesting that they have already achieved high living standards; further improvements will be difficult and will require additional resources. The results also reveal that the impact of economic growth on standards of living in lower income countries—such as African countries—is more pronounced: at low levels of income, relatively small differences in per capita income can mean big improvements in outcomes. Moreover, the study results show that births attended by skilled health workers are the most responsive to growth in per capita GDP, while life expectancy at birth is more responsive to economic growth than the under-5 survival rate.
The current study also evaluates the prospects for countries in different regions to catch up with the living standards of industrialized countries. A methodology is introduced to estimate the number of years it would take for different regions or countries to catch up with the average standard of living of industrialized countries. Results show that the convergence in standards of living would take longer than the convergence in per capita incomes. �or instance, South Asia would take 79 years to catch up with the industrialized countries in terms of life expectancy at birth while East Asia and the Pacific would take 34 years to achieve the same goal.
However, this aggregate regional picture hides the challenges faced by individual
viii | ADB Economics Working Paper Series No. 159
countries. Results suggest that Nepal would never be able to catch up with the living standards of industrialized countries because during 2000–2007, Nepal’s per capita GDP growth rate of 1.1% is lower than the 1.5% of industrialized countries. This suggests that for Nepal to be able to catch up, it would require a substantially higher growth rate in per capita income as well as public policies that promote the efficient and effective delivery of social services, with a focus on improving health and education outcomes. If economic growth is the only channel to improve standards of living, it will take an exceptionally long —perhaps unrealistically long—period to improve standards of living; therefore, policies other than those promoting economic growth are essential to achieve this objective.
Other factors besides income influence the standards of living of a country. As shown in the experiences of Indonesia, Qatar, and Thailand, economic growth and increased public spending, though essential, are not enough to improve people’s standards of living. Rather, the government’s planning, delivery, and management of basic social services are major factors in improving people’s lives. The paper further discusses policy prescriptions to improve the delivery of basic social services from the perspective of public spending, highlighting the patterns of public spending that can effectively ensure that public money is spent on services utilized by the poor and that such services reach the intended program targets.
Finally, while procurement of and access to basic services are important, the quality of these services and the institutions that deliver them are just as crucial in improving people’s standards of living. The mere provision of services without quality maintenance and institutional development will fail to improve standards of living and could even prove detrimental if this results in a misalignment of priorities (e.g., bad schools could lead to lower enrollment rates). As the experiences of the countries covered by this study show, it is not enough that schools are built, medicines are distributed, and wells are dug—teachers will also have to be trained, patients have to be taught on proper use, and water has to be continually treated. This requires not only the enlargement of the economic pie and the allocation of resources toward basic services but also the development of policies and institutions that will enable the continuous and efficient delivery of quality basic social services.
A Cross-Country Analysis of Achievements and Inequities in Economic Growth and Standards of Living | ix

I. Introduction
It is commonly believed that economic growth ought to be broad-based enough so that even the poorer segments of the population may experience strong improvements in their living standards. The contemporary concept of human development views development as a broader and richer process than mere economic growth and wealth accumulation (UNDP 2007). According to this concept, development means the creation of an environment in which all members of a society can fully take advantage of their potentials, live lives they wish to live, and have more choices. There are numerous instances of countries where rapid growth did not lead to strong improvements in human development. Countries with high per capita incomes can have poor records on human development, while those with low per capita incomes or growth rates can nevertheless do well on this front.
Experience in economic development demonstrates that economic growth needs to be complemented by reforms of the public services sector if sustainable improvements in human development are to be achieved. Moreover, without these reforms, rapid growth will likely be difficult to sustain. One key goal of these reforms should be the equitable provision of basic public services such as education and health, which constitute the most important guarantees and determinants of human development. Effective delivery of basic public services plays a critical role in promoting a more equitable pattern of human development by gradually realizing the equalization of opportunities.
Human development outcomes in health and education are determined by more than the availability and quality of education and health care. Many factors influence outcomes on both the demand and the supply sides, and are linked at many levels. Better nutrition helps children learn better, while better storage facilities and transport networks help keep medicines safe. The demand for health and education is determined by individuals and households who weigh the benefits and costs of making a particular choice based on the constraints they face, while the supply side covers many factors ranging from global trade networks all the way to teacher absenteeism and water supplies. While the issues related to the demand and the supply sides are important, these are beyond the scope of the current study.
The main objective of this study is to assess inequities and achievements in health and education outcomes across countries. It should be noted at the outset that “health and education outcomes” and “standards of living” are interchangeably used in this study. Six indicators of standards of living are selected; namely, life expectancy at birth, literacy rate, primary enrollment rate, under-5 survival rate, births attended by skilled health personnel, and per capita gross domestic product (GDP). While these indicators are a mixture of both inputs and results, they are selected based on criteria such as availability of data and statistical correlation with other development indicators.
This paper uses an achievement function to assess the achievements of countries in standards of living at different stages of economic development. It purports that a further increase in the standard of living of a country that is already at a high level signifies a greater achievement than that of another country with an equal increase in standard of living but from a lower base.
The main focus of the paper is to assess the performance of countries in different regions, particularly those in Asia. The paper also tests for the statistical relationship between indicators of the countries’ standards of living and per capita GDP. The questions this paper will address include: To what extent can aggregate income measures such as per capita GDP explain people’s standards of living? Can growth in per capita GDP alone bring about significant improvements in people’s standards of living in a reasonable period of time? How many years will it take for Asia to achieve the standards of living of the rich industrialized countries?
The analysis presented is based on data from 177 countries over the period 2000–2007. The data are averaged over the period to avoid any adverse effects of yearly fluctuations. The study analyzes disparity in standards of living across regions in the world. Living standards in Asia as a whole are compared to that of the world. The paper also explains the disparity in standards of living within and between regions.
The remainder of the paper is structured as follows. Section II discusses the concepts and indicators of standards of living. Section III is devoted to cross-country inequities in living standards. Section IV introduces the achievement index, and Section V looks into the relationship between income and standards of living. Section VI explores a country’s performance in standards of living in relation to its per capita income, while Section VII deals with the convergence of per capita income and standards of living. Section VIII provides a brief discussion of policies that are required to facilitate the convergence process, and the final section summarizes the major findings of the study.
� | ADB Economics Working Paper Series No. 159
II. Living Standards: Concepts and Indicators
As stated in the Human Development Report 1990 (UN 1990), the primary objective of economic development is to improve the well-being of people. Several approaches have been used to define well-being or standard of living, including social indicators, quality of life, and basic needs (see Hicks and Streeten 1979, Hicks 1979, Drewnowski 1974, Morris 1979, Sen 1973, Streeten 1979, and Dasgupta 1990). While these approaches are evidently related to the concept of standard of living, they lack a unifying conceptual framework for defining and measuring standard of living. Such a framework has been developed by Sen (1985 and 1987), who defines standard of living in terms of functionings and capabilities. According to Sen (1985), standard of living must be seen in terms of an individual’s achievements (i.e., functionings) and his ability to achieve (i.e., capabilities), and not merely in terms of that individual’s means.
Having defined standard of living, the focus of attention should be on the selection of appropriate indicators to reflect people’s capabilities or abilities to achieve. Ideally, the measurement of standard of living should incorporate all the capabilities that enhance human well-being, but from an empirical standpoint this is not a feasible task. After applying a few selection criteria, six indicators that can adequately reflect capability are chosen: life expectancy at birth, adult literacy rate, primary enrollment rate, under-5 survival rate, births attended by skilled health personnel, and per capita GDP. Note that these indicators are selected based on their data availability and their ability to reflect an individual’s quality of life.
Reiterating Sen’s conceptualization of standard of living, the primary concern should be with individual achievements and not with means. While input indicators are important because they enhance capabilities and extend functionings, they are not indicators of achievements; thus, only those variables that reflect results, not inputs, should be selected. Hicks and Streeten (1979) argue that output indicators are, in general, better measures of the level of welfare and basic needs achievement.
The six indicators selected for this study are a mixture of both results and inputs. Note that the distinction between input and output indicators may not be precise. �or instance, primary and secondary school enrollments are input indicators because they provide the means to achieve higher literacy in the population. However, can literacy itself be considered as ultimate achievement of a society? Or is it only a means to achieve other functionings and capabilities? It is clear that a literate person is open to more capabilities —for example, being able to communicate more effectively with other members of a society. The literacy rate can thus be considered as both an input and an output indicator.
The under-5 survival rate and life expectancy at birth are the two most important indicators of achievement. The under-5 survival rate shows the number of children per one thousand live births who survive until their fifth birthday. This is a good indicator
A Cross-Country Analysis of Achievements and Inequities in Economic Growth and Standards of Living | 3
of the availability of sanitation and clean water facilities that can protect children from diseases and infections caused by unsanitary household conditions. Moreover, the survival rate of children under five years old is largely determined by their nutritional status; thus, a child who is seriously malnourished because of dietary inadequacies or deficiencies in the mother’s diet during pregnancy and lactation has a lower chance of survival. The infant mortality rate, similarly, points to the fulfillment of several basic needs such as health, sanitation, clean water supply, and good nutrition, making it a good indicator of achievement.
Life expectancy at birth indicates the number of years a newborn infant would live if patterns of mortality prevailing for all people at the time of birth were to stay the same throughout his life. It is the outcome of several input variables such as nutrition, water supply, sanitation, and medical facilities. As most people would prefer to live longer irrespective of the quality of life, life expectancy can be regarded as an indicator of achievement and, therefore, can be considered an important component of standard of living.
Births attended by skilled health personnel measures the proportion of births in which a skilled health worker is present. According to the World Health Organization (2008), complications arising from pregnancy and childbirth cause the deaths of more than half a million women every year and leave many others with serious and lifelong health problems. This input indicator is related to accessibility of appropriate health care services throughout pregnancy and childbirth. Evidence suggests that having a skilled health worker during delivery is highly associated with reduced maternal mortality (Graham et al. 2001). In this regard, the proportion of births attended by skilled health personnel can be regarded as an input measure because having a skilled attendant at birth provides the means to achieve lower maternal mortality.
Per capita GDP is considered an input variable because it provides a measure of the degree of command people have over commodities. It is an indicator of opulence, which is not the same thing as the standard of living.
Analysis in this study is confined to the five aggregate measures of well-being, in addition to per capita GDP. It excludes many other social and psychological characteristics that affect quality of life, such as security, justice, freedom of choice, human rights, employment, and satisfaction (see Morris 1979). The analysis is rather restricted mainly due to the unavailability of appropriate data and may appear to be too narrow in its scope. Nevertheless, it should be recognized that the five selected indicators apart from per capita GDP are proxies to a large number of important capabilities that influence human well-being.
In fact, the five indicators considered in this study are highly aggregated measures of well-being. Ideal measures would be those that reflect the well-being of individuals or
� | ADB Economics Working Paper Series No. 159
groups. In this context, Dasgupta (1990) correctly argues that focus should be on the distribution of well-being across class, caste, gender, or religion. It should be pointed out that the methodology used in this paper can be applied to analyze the standards of living at individual or socioeconomic group levels. However, it may not be feasible to carry out the same analysis for a large number of countries because of the demanding data requirements.
It must be emphasized that this study does not attempt to construct a single index of living standards. Several attempts have been made in this regard, including the widely known human development index (Morris 1979, UNRISD 1972, UN 1990). It is convenient and appealing to have a single overall index of well-being to be able to rank the countries, but the construction of such an index has many drawbacks. One of the main difficulties is the aggregation of several components of well-being into a single measure, and the selection of weights that should be attached to each component. In 1979, Morris constructed a single index derived by simply averaging three components: life expectancy at birth, infant mortality rate, and literacy rate. While this index has the merit of being simple, it is obviously arbitrary. There exists no rational economic justification for assigning equal weights to different components. An alternative approach that has been suggested in the literature is that of principal components in which the weights for indicators are taken as proportional to the leading principal component of the correlation matrix. The rationale behind this approach is that the data determine the optimal weights that capture the largest variation in the selected indicators.
In this study, analysis is done on each country’s achievements in terms of the five separate indicators of living standards. There is no attempt to combine the five indicators into one single index. According to Sen (1987), measurements of living standards or well-being that has inherent plurality should not be seen as a one-dimensional measure such as that of weight or height; therefore, a partial ordering approach is adopted in which comparisons of living standards are made by ranking countries in accordance with each of the capabilities considered.
III. Cross–Country Inequities in Standards of Living
The analysis presented here is based on data from 177 countries, which are divided into eight mutually exclusive regions. As discussed in Section II, the standard of living is measured by five indicators; life expectancy at birth; adult literacy rate; net primary school enrollment rate; under-5 survival rate: and births attended by skilled health personnel. Per capita GDP at 2005 purchasing power parity (PPP) terms is a measure of a country’s opulence or the command people have over goods and services; the higher is this measure, the richer a country is. Since per capita GDP is measured in PPP terms, values are comparable across countries. These six indicators used in the study are selected from World Development Indicators.
A Cross-Country Analysis of Achievements and Inequities in Economic Growth and Standards of Living | 5
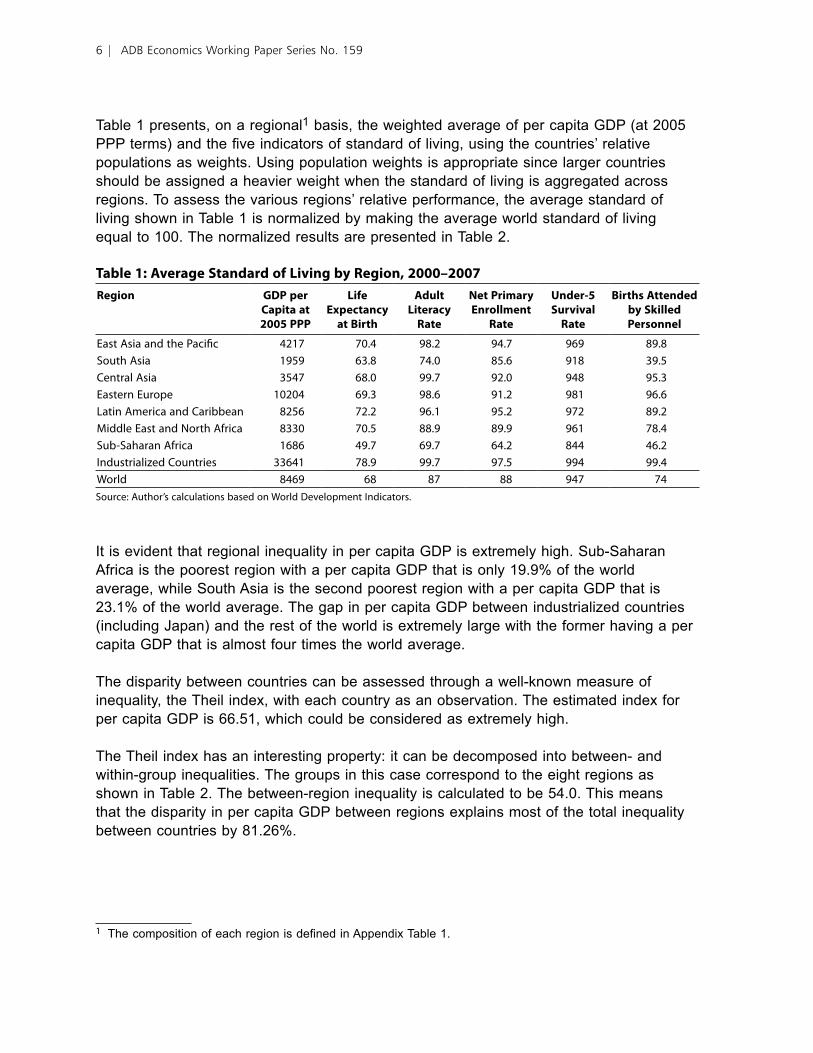
Table 1 presents, on a regional1 basis, the weighted average of per capita GDP (at 2005 PPP terms) and the five indicators of standard of living, using the countries’ relative populations as weights. Using population weights is appropriate since larger countries should be assigned a heavier weight when the standard of living is aggregated across regions. To assess the various regions’ relative performance, the average standard of living shown in Table 1 is normalized by making the average world standard of living equal to 100. The normalized results are presented in Table 2.
Table 1: Average Standard of Living by Region, 2000–2007Region GDP per
Capita at 2005 PPP
Life Expectancy
at Birth
Adult Literacy
Rate
Net Primary Enrollment
Rate
Under-5 Survival
Rate
Births Attended by Skilled Personnel
East Asia and the Pacific 4217 70.4 98.2 94.7 969 89.8South Asia 1959 63.8 74.0 85.6 918 39.5Central Asia 3547 68.0 99.7 92.0 948 95.3Eastern Europe 10204 69.3 98.6 91.2 981 96.6Latin America and Caribbean 8256 72.2 96.1 95.2 972 89.2Middle East and North Africa 8330 70.5 88.9 89.9 961 78.4Sub-Saharan Africa 1686 49.7 69.7 64.2 844 46.2Industrialized Countries 33641 78.9 99.7 97.5 994 99.4World 8469 68 87 88 947 74Source: Author’s calculations based on World Development Indicators.
It is evident that regional inequality in per capita GDP is extremely high. Sub-Saharan Africa is the poorest region with a per capita GDP that is only 19.9% of the world average, while South Asia is the second poorest region with a per capita GDP that is 23.1% of the world average. The gap in per capita GDP between industrialized countries (including Japan) and the rest of the world is extremely large with the former having a per capita GDP that is almost four times the world average.
The disparity between countries can be assessed through a well-known measure of inequality, the Theil index, with each country as an observation. The estimated index for per capita GDP is 66.51, which could be considered as extremely high.
The Theil index has an interesting property: it can be decomposed into between- and within-group inequalities. The groups in this case correspond to the eight regions as shown in Table 2. The between-region inequality is calculated to be 54.0. This means that the disparity in per capita GDP between regions explains most of the total inequality between countries by 81.26%.
1 The composition of each region is defined in Appendix Table 1.
� | ADB Economics Working Paper Series No. 159
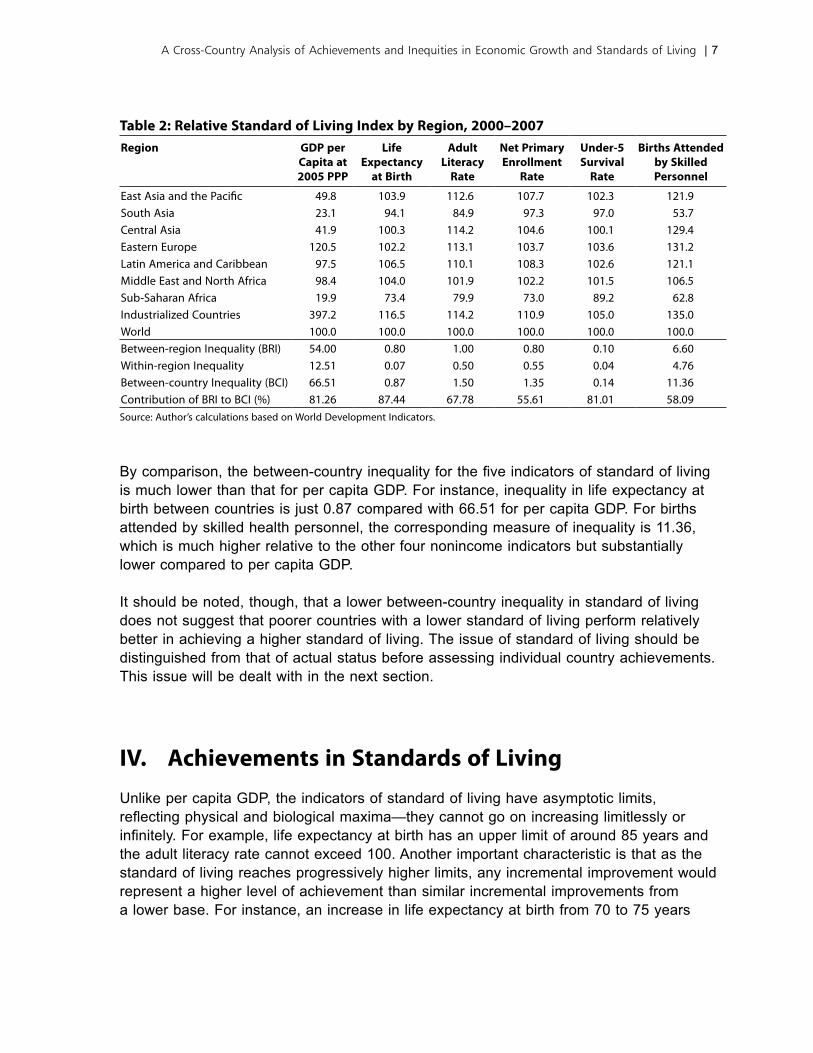
Table 2: Relative Standard of Living Index by Region, 2000–2007Region GDP per
Capita at 2005 PPP
Life Expectancy
at Birth
Adult Literacy
Rate
Net Primary Enrollment
Rate
Under-5 Survival
Rate
Births Attended by Skilled Personnel
East Asia and the Pacific 49.8 103.9 112.6 107.7 102.3 121.9South Asia 23.1 94.1 84.9 97.3 97.0 53.7Central Asia 41.9 100.3 114.2 104.6 100.1 129.4Eastern Europe 120.5 102.2 113.1 103.7 103.6 131.2Latin America and Caribbean 97.5 106.5 110.1 108.3 102.6 121.1Middle East and North Africa 98.4 104.0 101.9 102.2 101.5 106.5Sub-Saharan Africa 19.9 73.4 79.9 73.0 89.2 62.8Industrialized Countries 397.2 116.5 114.2 110.9 105.0 135.0World 100.0 100.0 100.0 100.0 100.0 100.0Between-region Inequality (BRI) 54.00 0.80 1.00 0.80 0.10 6.60Within-region Inequality 12.51 0.07 0.50 0.55 0.04 4.76Between-country Inequality (BCI) 66.51 0.87 1.50 1.35 0.14 11.36Contribution of BRI to BCI (%) 81.26 87.44 67.78 55.61 81.01 58.09Source: Author’s calculations based on World Development Indicators.
By comparison, the between-country inequality for the five indicators of standard of living is much lower than that for per capita GDP. For instance, inequality in life expectancy at birth between countries is just 0.87 compared with 66.51 for per capita GDP. �or births attended by skilled health personnel, the corresponding measure of inequality is 11.36, which is much higher relative to the other four nonincome indicators but substantially lower compared to per capita GDP.
It should be noted, though, that a lower between-country inequality in standard of living does not suggest that poorer countries with a lower standard of living perform relatively better in achieving a higher standard of living. The issue of standard of living should be distinguished from that of actual status before assessing individual country achievements. This issue will be dealt with in the next section.
IV. Achievements in Standards of Living
Unlike per capita GDP, the indicators of standard of living have asymptotic limits, reflecting physical and biological maxima—they cannot go on increasing limitlessly or infinitely. For example, life expectancy at birth has an upper limit of around 85 years and the adult literacy rate cannot exceed 100. Another important characteristic is that as the standard of living reaches progressively higher limits, any incremental improvement would represent a higher level of achievement than similar incremental improvements from a lower base. �or instance, an increase in life expectancy at birth from 70 to 75 years
A Cross-Country Analysis of Achievements and Inequities in Economic Growth and Standards of Living | 7
would imply a greater achievement than an increase from 45 to 50 years. In this regard, the relationship between achievement and the value of the indicator is not linear; thus, the observed differences in the levels of indicators of living standards do not reflect their true achievement.
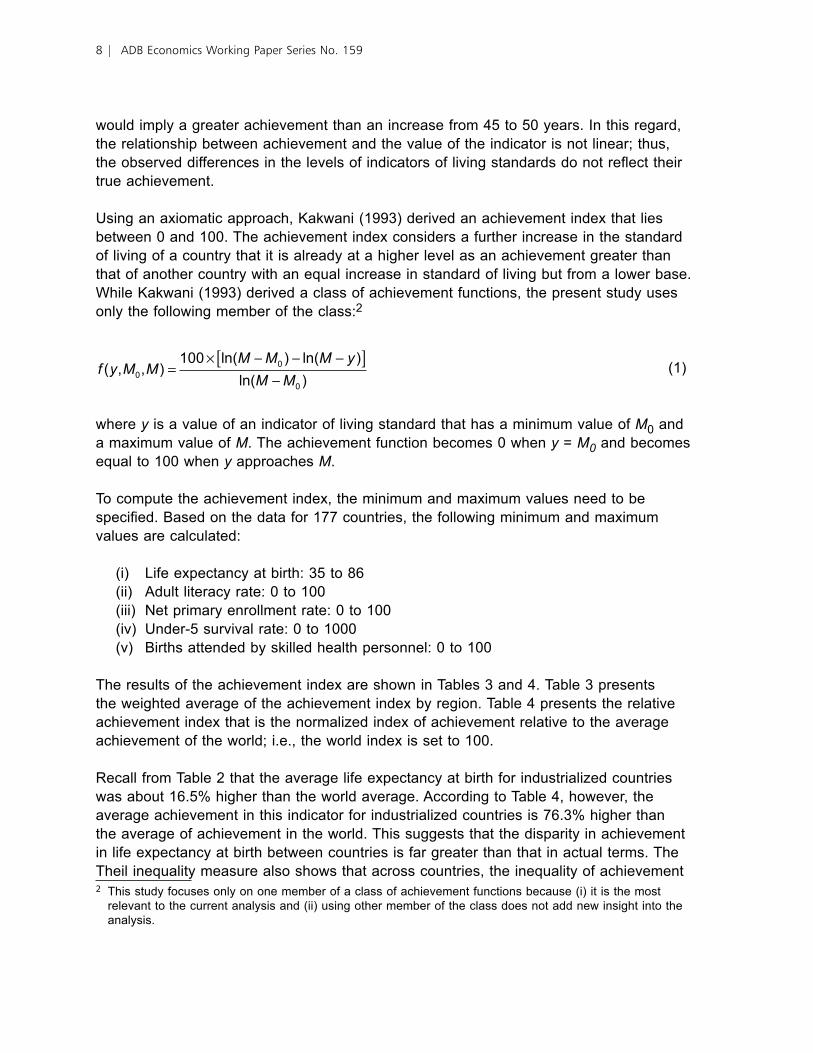
Using an axiomatic approach, Kakwani (1993) derived an achievement index that lies between 0 and 100. The achievement index considers a further increase in the standard of living of a country that it is already at a higher level as an achievement greater than that of another country with an equal increase in standard of living but from a lower base. While Kakwani (1993) derived a class of achievement functions, the present study uses only the following member of the class:2
f y M MM M M y
M M( , , )
ln( ) ln( )
ln( )00
0
100=
× − − −[ ]−
(1)
where y is a value of an indicator of living standard that has a minimum value of M0 and a maximum value of M. The achievement function becomes 0 when y = M0 and becomes equal to 100 when y approaches M.
To compute the achievement index, the minimum and maximum values need to be specified. Based on the data for 177 countries, the following minimum and maximum values are calculated:
(i) Life expectancy at birth: 35 to 86 (ii) Adult literacy rate: 0 to 100 (iii) Net primary enrollment rate: 0 to 100 (iv) Under-5 survival rate: 0 to 1000 (v) Births attended by skilled health personnel: 0 to 100
The results of the achievement index are shown in Tables 3 and 4. Table 3 presents the weighted average of the achievement index by region. Table 4 presents the relative achievement index that is the normalized index of achievement relative to the average achievement of the world; i.e., the world index is set to 100.
Recall from Table 2 that the average life expectancy at birth for industrialized countries was about 16.5% higher than the world average. According to Table 4, however, the average achievement in this indicator for industrialized countries is 76.3% higher than the average of achievement in the world. This suggests that the disparity in achievement in life expectancy at birth between countries is far greater than that in actual terms. The Theil inequality measure also shows that across countries, the inequality of achievement 2 This study focuses only on one member of a class of achievement functions because (i) it is the most
relevant to the current analysis and (ii) using other member of the class does not add new insight into the analysis.
� | ADB Economics Working Paper Series No. 159
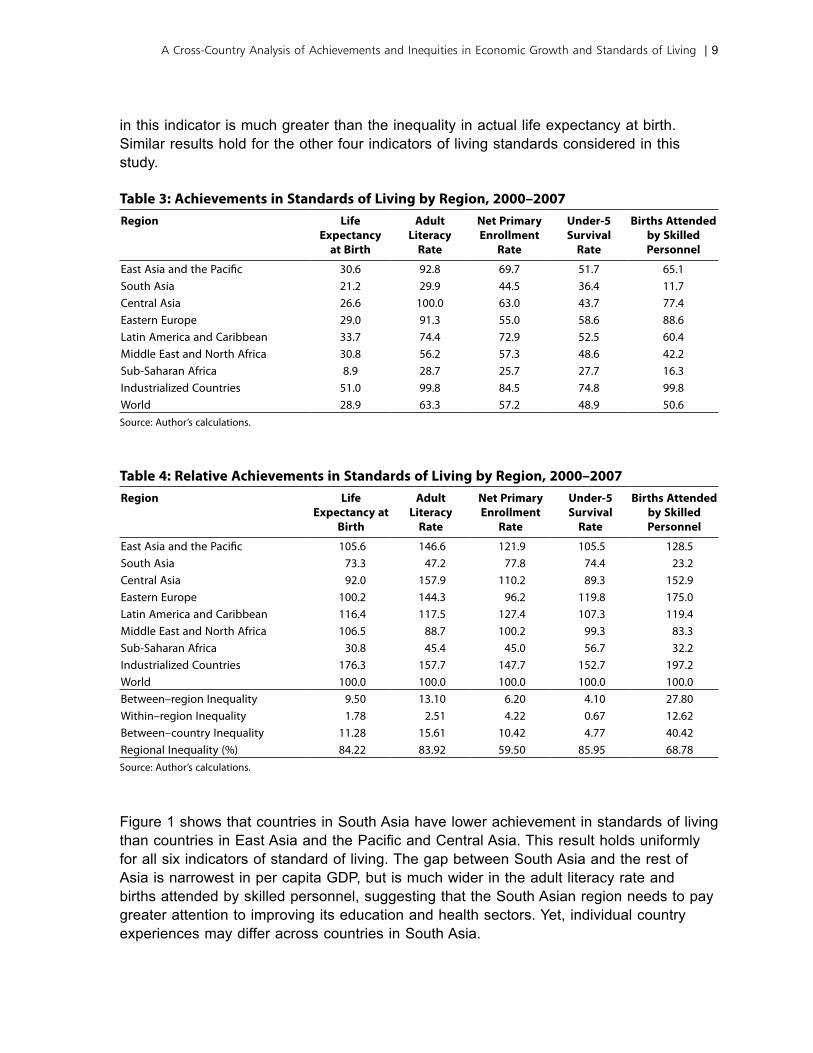
in this indicator is much greater than the inequality in actual life expectancy at birth. Similar results hold for the other four indicators of living standards considered in this study.
Table 3: Achievements in Standards of Living by Region, 2000–2007Region Life
Expectancy at Birth
Adult Literacy
Rate
Net Primary Enrollment
Rate
Under-5 Survival
Rate
Births Attended by Skilled Personnel
East Asia and the Pacific 30.6 92.8 69.7 51.7 65.1South Asia 21.2 29.9 44.5 36.4 11.7Central Asia 26.6 100.0 63.0 43.7 77.4Eastern Europe 29.0 91.3 55.0 58.6 88.6Latin America and Caribbean 33.7 74.4 72.9 52.5 60.4Middle East and North Africa 30.8 56.2 57.3 48.6 42.2Sub-Saharan Africa 8.9 28.7 25.7 27.7 16.3Industrialized Countries 51.0 99.8 84.5 74.8 99.8World 28.9 63.3 57.2 48.9 50.6Source: Author’s calculations.
Table 4: Relative Achievements in Standards of Living by Region, 2000–2007Region Life
Expectancy at Birth
Adult Literacy
Rate
Net Primary Enrollment
Rate
Under-5 Survival
Rate
Births Attended by Skilled Personnel
East Asia and the Pacific 105.6 146.6 121.9 105.5 128.5South Asia 73.3 47.2 77.8 74.4 23.2Central Asia 92.0 157.9 110.2 89.3 152.9Eastern Europe 100.2 144.3 96.2 119.8 175.0Latin America and Caribbean 116.4 117.5 127.4 107.3 119.4Middle East and North Africa 106.5 88.7 100.2 99.3 83.3Sub-Saharan Africa 30.8 45.4 45.0 56.7 32.2Industrialized Countries 176.3 157.7 147.7 152.7 197.2World 100.0 100.0 100.0 100.0 100.0Between–region Inequality 9.50 13.10 6.20 4.10 27.80Within–region Inequality 1.78 2.51 4.22 0.67 12.62Between–country Inequality 11.28 15.61 10.42 4.77 40.42Regional Inequality (%) 84.22 83.92 59.50 85.95 68.78Source: Author’s calculations.
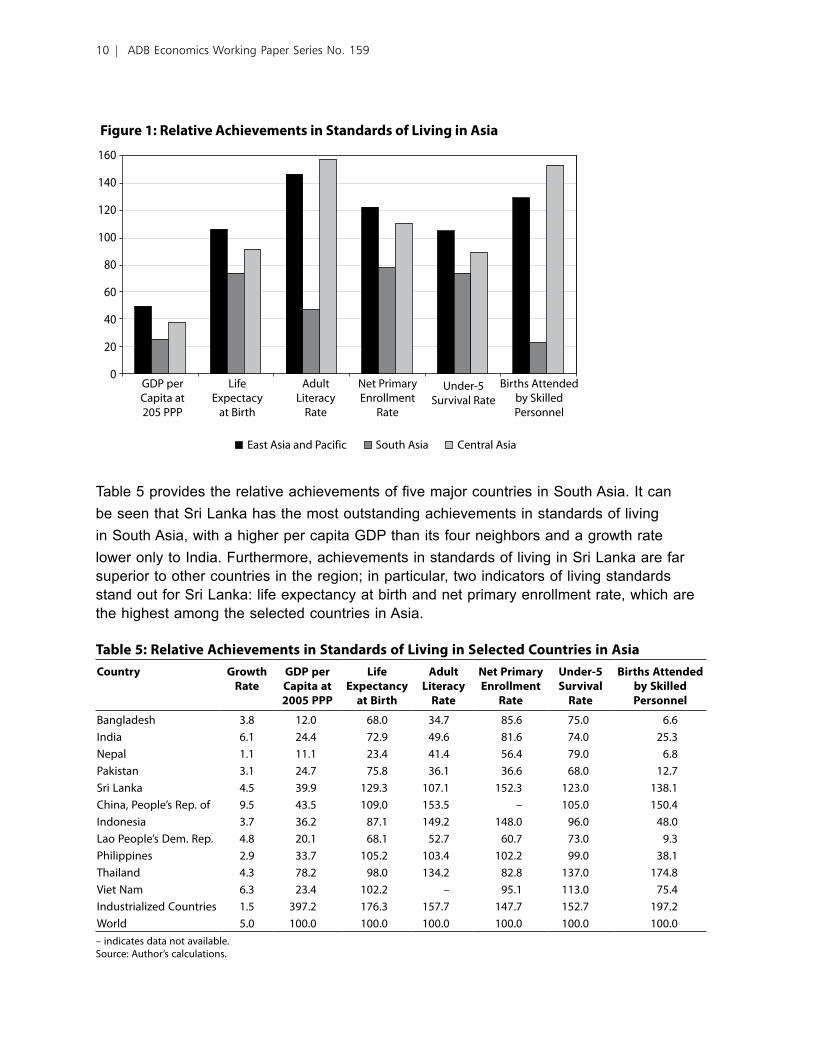
�igure 1 shows that countries in South Asia have lower achievement in standards of living than countries in East Asia and the Pacific and Central Asia. This result holds uniformly for all six indicators of standard of living. The gap between South Asia and the rest of Asia is narrowest in per capita GDP, but is much wider in the adult literacy rate and births attended by skilled personnel, suggesting that the South Asian region needs to pay greater attention to improving its education and health sectors. Yet, individual country experiences may differ across countries in South Asia.
A Cross-Country Analysis of Achievements and Inequities in Economic Growth and Standards of Living | 9
160
140
120
100
80
60
40
20
0
Figure 1: Relative Achievements in Standards of Living in Asia
AdultLiteracy
Rate
LifeExpectacy
at Birth
East Asia and Pacific South Asia Central Asia
Net PrimaryEnrollment
Rate
Under-5Survival Rate
Births Attendedby SkilledPersonnel
GDP perCapita at205 PPP
Table 5 provides the relative achievements of five major countries in South Asia. It can be seen that Sri Lanka has the most outstanding achievements in standards of living in South Asia, with a higher per capita GDP than its four neighbors and a growth rate lower only to India. �urthermore, achievements in standards of living in Sri Lanka are far superior to other countries in the region; in particular, two indicators of living standards stand out for Sri Lanka: life expectancy at birth and net primary enrollment rate, which are the highest among the selected countries in Asia.
Table 5: Relative Achievements in Standards of Living in Selected Countries in AsiaCountry Growth
RateGDP per Capita at 2005 PPP
Life Expectancy
at Birth
Adult Literacy
Rate
Net Primary Enrollment
Rate
Under-5 Survival
Rate
Births Attended by Skilled Personnel
Bangladesh 3.8 12.0 68.0 34.7 85.6 75.0 6.6India 6.1 24.4 72.9 49.6 81.6 74.0 25.3Nepal 1.1 11.1 23.4 41.4 56.4 79.0 6.8Pakistan 3.1 24.7 75.8 36.1 36.6 68.0 12.7Sri Lanka 4.5 39.9 129.3 107.1 152.3 123.0 138.1China, People’s Rep. of 9.5 43.5 109.0 153.5 – 105.0 150.4Indonesia 3.7 36.2 87.1 149.2 148.0 96.0 48.0Lao People’s Dem. Rep. 4.8 20.1 68.1 52.7 60.7 73.0 9.3Philippines 2.9 33.7 105.2 103.4 102.2 99.0 38.1Thailand 4.3 78.2 98.0 134.2 82.8 137.0 174.8Viet Nam 6.3 23.4 102.2 – 95.1 113.0 75.4Industrialized Countries 1.5 397.2 176.3 157.7 147.7 152.7 197.2World 5.0 100.0 100.0 100.0 100.0 100.0 100.0– indicates data not available. Source: Author’s calculations.
10 | ADB Economics Working Paper Series No. 159
In East Asia and the Pacific, the People’s Republic of China (PRC) is the fastest growing economy and its overall performance in virtually all available indicators of living standards surpasses world averages by wide margins, particularly in terms of adult literacy rate and births attended by skilled health personnel. On the other hand, while Thailand has a higher achievement in per capita GDP than the PRC, its achievements in standards of living are not as consistent. Note that although achievements in life expectancy at birth and adult literacy rate are better for the PRC, Thailand has superior achievements in the two other health indicators. Gaps (urban–rural gaps, regional disparities, gender gaps, and gaps among different social groups) in access to basic public services in health and education remain among the challenges facing the PRC in its current phase of development (UNDP 2007).
V. Relationship between Per Capita GDP and Standards of Living
Per capita GDP measures the total output per person that is produced in an economy: the higher the output, the greater the access people have to goods and services. Therefore, there would be a strong association between national income and standards of living, with higher national income being strongly associated with lower child mortality and higher primary school completion (World Bank 2004).
As noted earlier, however, the relationship between per capita GDP and standards of living is nonlinear. As per capita GDP increases, the standard of living increases less and less steeply until it reaches an asymptotic limit (Hicks and Streeten 1979). Many attempts have been made in the past to estimate the nonlinear relationship, which captures the asymptotic behavior of indicators of standard of living (Sheehan and Hopkins 1979, Morris 1979, Grosse and Perry 1983, Goldstein 1985). All these models are generally flawed because of the frequent misspecification of the nature of nonlinearity inherent in them.
The achievement index discussed in the previous section captures the nature of nonlinearity of indicators of standards of living. Kakwani (1993) argues that it is more natural to relate the achievement index to per capita GDP. �ollowing this argument, the following model is adopted:
f y M M x ui i i i( , , ) log( )0 = + +α β (2)
where f y M Mi i( , , )0 defined in equation (1) is the achievement index of the ith country with a social indicator yi , xi is the per capita GDP of the ith country, and ui is the error term. The use of the achievement function captures the nonlinear characteristics of standards of living.
A Cross-Country Analysis of Achievements and Inequities in Economic Growth and Standards of Living | 11
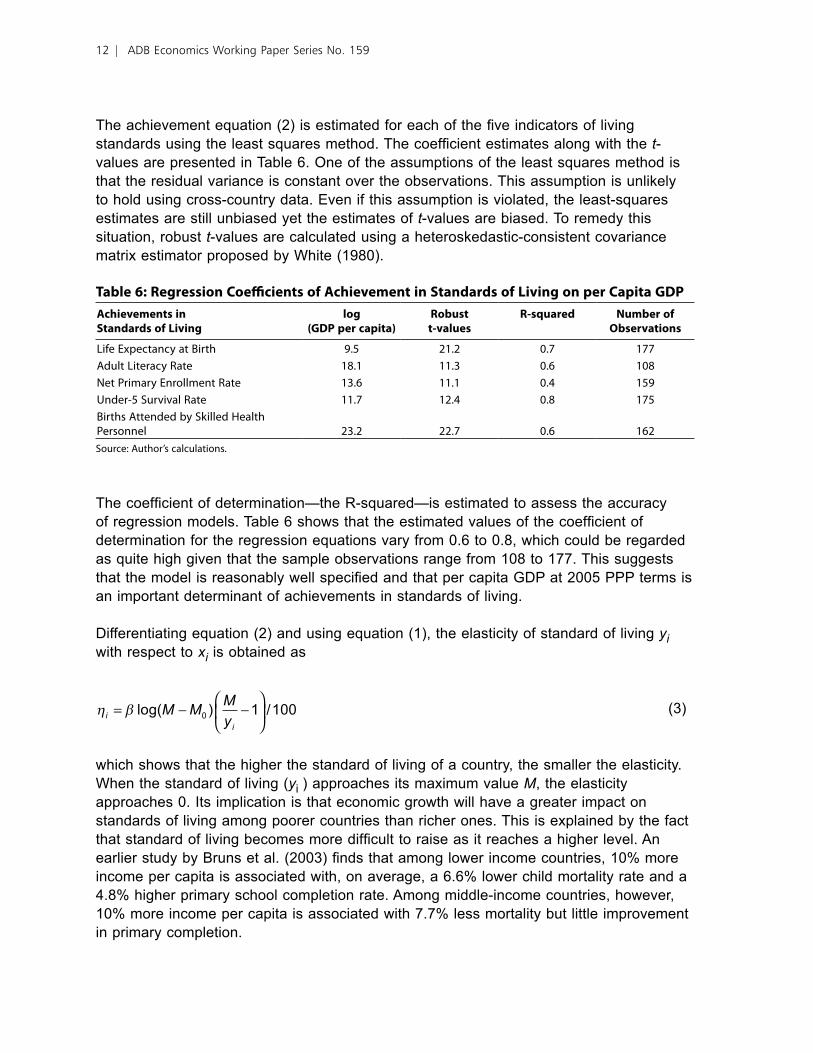
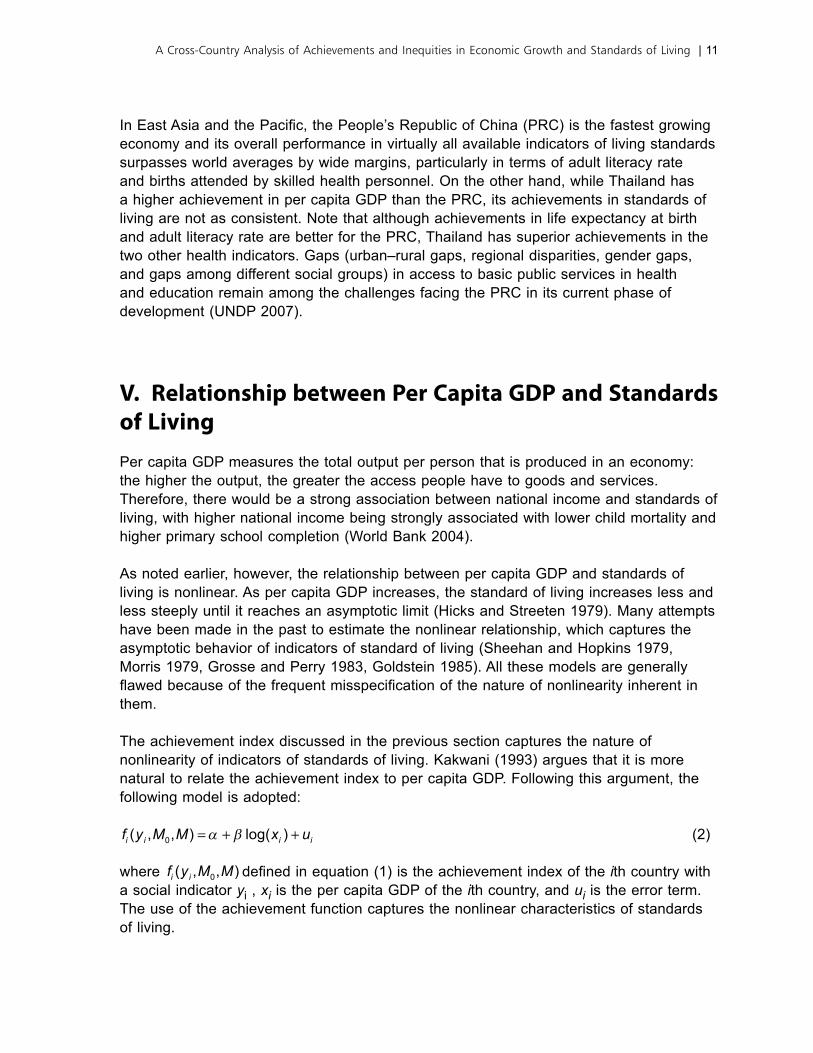
The achievement equation (2) is estimated for each of the five indicators of living standards using the least squares method. The coefficient estimates along with the t-values are presented in Table 6. One of the assumptions of the least squares method is that the residual variance is constant over the observations. This assumption is unlikely to hold using cross-country data. Even if this assumption is violated, the least-squares estimates are still unbiased yet the estimates of t-values are biased. To remedy this situation, robust t-values are calculated using a heteroskedastic-consistent covariance matrix estimator proposed by White (1980).
Table 6: Regression Coefficients of Achievement in Standards of Living on per Capita GDPAchievements inStandards of Living
log (GDP per capita)
Robustt-values
R-squared Number ofObservations
Life Expectancy at Birth 9.5 21.2 0.7 177Adult Literacy Rate 18.1 11.3 0.6 108Net Primary Enrollment Rate 13.6 11.1 0.4 159Under-5 Survival Rate 11.7 12.4 0.8 175Births Attended by Skilled Health Personnel 23.2 22.7 0.6 162Source: Author’s calculations.
The coefficient of determination—the R-squared—is estimated to assess the accuracy of regression models. Table 6 shows that the estimated values of the coefficient of determination for the regression equations vary from 0.6 to 0.8, which could be regarded as quite high given that the sample observations range from 108 to 177. This suggests that the model is reasonably well specified and that per capita GDP at 2005 PPP terms is an important determinant of achievements in standards of living.
Differentiating equation (2) and using equation (1), the elasticity of standard of living yi with respect to xi is obtained as
η βii
M MMy
= − −
log( ) /0 1 100 (3)
which shows that the higher the standard of living of a country, the smaller the elasticity. When the standard of living (yi ) approaches its maximum value M, the elasticity approaches 0. Its implication is that economic growth will have a greater impact on standards of living among poorer countries than richer ones. This is explained by the fact that standard of living becomes more difficult to raise as it reaches a higher level. An earlier study by Bruns et al. (2003) finds that among lower income countries, 10% more income per capita is associated with, on average, a 6.6% lower child mortality rate and a 4.8% higher primary school completion rate. Among middle-income countries, however, 10% more income per capita is associated with 7.7% less mortality but little improvement in primary completion.
1� | ADB Economics Working Paper Series No. 159
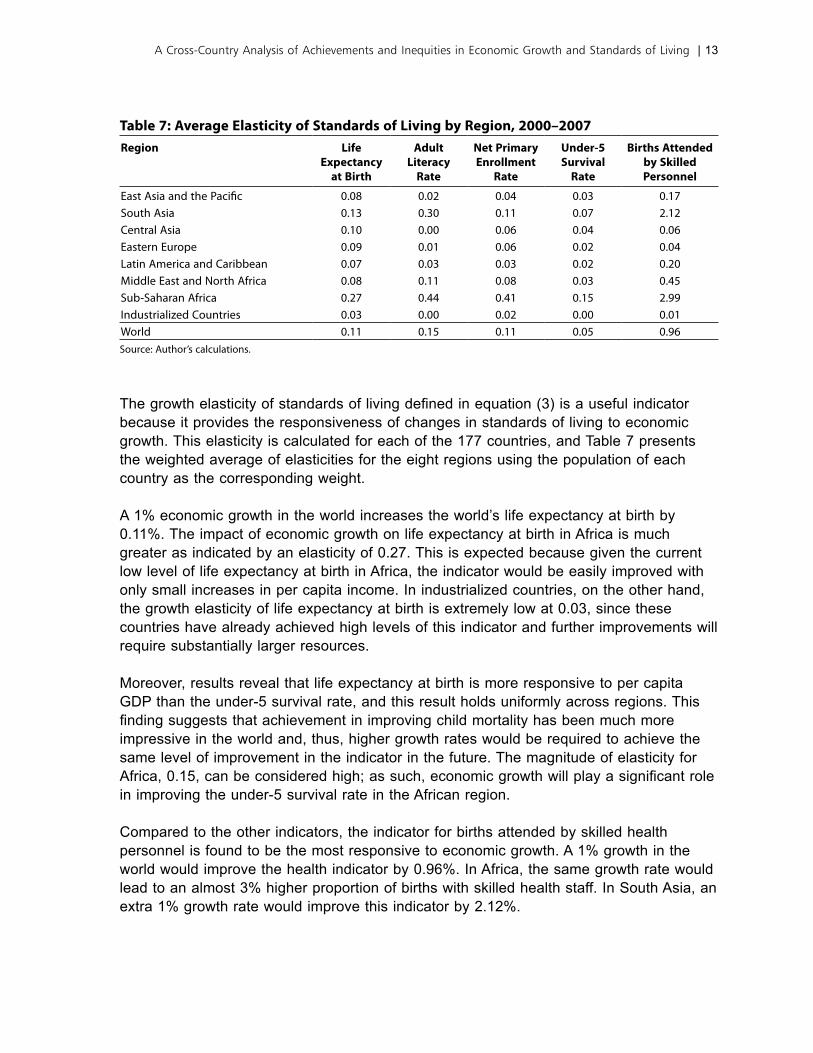
Table 7: Average Elasticity of Standards of Living by Region, 2000–2007Region Life
Expectancy at Birth
Adult Literacy
Rate
Net Primary Enrollment
Rate
Under-5 Survival
Rate
Births Attended by Skilled Personnel
East Asia and the Pacific 0.08 0.02 0.04 0.03 0.17South Asia 0.13 0.30 0.11 0.07 2.12Central Asia 0.10 0.00 0.06 0.04 0.06Eastern Europe 0.09 0.01 0.06 0.02 0.04Latin America and Caribbean 0.07 0.03 0.03 0.02 0.20Middle East and North Africa 0.08 0.11 0.08 0.03 0.45Sub-Saharan Africa 0.27 0.44 0.41 0.15 2.99Industrialized Countries 0.03 0.00 0.02 0.00 0.01World 0.11 0.15 0.11 0.05 0.96Source: Author’s calculations.
The growth elasticity of standards of living defined in equation (3) is a useful indicator because it provides the responsiveness of changes in standards of living to economic growth. This elasticity is calculated for each of the 177 countries, and Table 7 presents the weighted average of elasticities for the eight regions using the population of each country as the corresponding weight.
A 1% economic growth in the world increases the world’s life expectancy at birth by 0.11%. The impact of economic growth on life expectancy at birth in Africa is much greater as indicated by an elasticity of 0.27. This is expected because given the current low level of life expectancy at birth in Africa, the indicator would be easily improved with only small increases in per capita income. In industrialized countries, on the other hand, the growth elasticity of life expectancy at birth is extremely low at 0.03, since these countries have already achieved high levels of this indicator and further improvements will require substantially larger resources.
Moreover, results reveal that life expectancy at birth is more responsive to per capita GDP than the under-5 survival rate, and this result holds uniformly across regions. This finding suggests that achievement in improving child mortality has been much more impressive in the world and, thus, higher growth rates would be required to achieve the same level of improvement in the indicator in the future. The magnitude of elasticity for Africa, 0.15, can be considered high; as such, economic growth will play a significant role in improving the under-5 survival rate in the African region.
Compared to the other indicators, the indicator for births attended by skilled health personnel is found to be the most responsive to economic growth. A 1% growth in the world would improve the health indicator by 0.96%. In Africa, the same growth rate would lead to an almost 3% higher proportion of births with skilled health staff. In South Asia, an extra 1% growth rate would improve this indicator by 2.12%.
A Cross-Country Analysis of Achievements and Inequities in Economic Growth and Standards of Living | 13
The education indicators—adult literacy rate and net primary school enrollment rate—are much more responsive to per capita income in South Asia as well as in Africa. In these two regions, higher income per capita would result in more school-age children attending primary school and thus a higher adult literacy rate.
This section showed that income and standards of living are strongly associated, particularly in low-income countries. However, the low elasticities shown in Table 7 suggest that improving living standards will require significantly high growth rates if this is the only channel used for achieving such goals. Thus, policies that can do more than increase growth are required; these policies will be discussed in Section VIII.
VI. Performance in Standards of Living
A. Methodological Framework
Per capita GDP in PPP dollars measures how rich a country is in terms of material consumption. The regression model estimated in the previous section demonstrates that per capita GDP is an important determinant of a country’s standard of living. The positive and highly statistically significant values of β imply that the richer a country is, the higher is the expected standards of living. However, a one-to-one relationship between the country’s material prosperity and the standards of living does not exist because the model only explains around 60–80% of variations in standards of living. There is still a considerable unexplained variation which implies that there are factors other than income that impact a country’s standard of living. These factors may include the scope and quality of basic services in health and education provided by governments.
The unexplained variation in the model suggests that the level and distribution of health and education services vary widely among different countries even if they have the same level of per capita income. A country may be assessed as having superior (inferior) performance in standards of living if it enjoys higher (lower) living standards than what is expected on the basis of its per capita income. The residual term in the model includes the effect of factors other than income that affect the living standards. If the residual, or the difference, between actual and expected values of the achievement index is positive (negative), it can be said that the country has higher (lower) standards of living relative to its per capita income. This methodology allows the identification of countries that have superior (inferior) performance in standards of living.
The residual term in equation (2) is given by
u f xi i i = − ( )( )β log (4)
1� | ADB Economics Working Paper Series No. 159
�or large samples, it is expected that ui is normally distributed with zero mean and
variance s2, where s is the estimated standard error of the regression. This gives the studentized residual as
uf x
si
i i
* log=
− ( )( )β (5)
which, for large samples, is normally distributed with zero mean and unit variance. In this study, the value of ui
* is calculated for each country. The performance of a country in standards of living can be assessed by the magnitude of ui
*: the larger this value is, the more superior is the performance of the ith country. The average value of ui
* for all countries is equal to zero as some countries will register a positive value and others will record a negative value, with positive (negative) values implying superior (inferior) performance. Thus, ui
* can be used as an indicator of a country’s relative performance in living standards.
If ui
* is greater than 1.96, the ith country can be regarded as an outlier or a country with exceptionally superior performance. This is because the probability of achieving such an outcome is less than 0.05; i.e., the estimate is statistically significant at the 5% level. Similarly, if ui
* is less than –1.96, the ith country can be regarded as a country with exceptionally inferior performance in standards of living. Such outliers or exceptionally superior- and inferior-performing countries deserve special attention from the standpoint of policy making.
B. Identifying Countries with Superior (Inferior) Performance
Using the proposed indicator of a country’s relative performance, this section identifies the countries that have exceptionally superior or inferior performance in standards of living. Appendix Table 2 in the presents the values of relative performance for individual countries.
The results show that Japan is the only country with exceptionally superior performance in life expectancy at birth. Other positive outliers or higher achievers in this indicator include Costa Rica; Hong Kong, China; and Sri Lanka. On the other hand, countries that have exceptionally inferior performance in life expectancy at birth are Angola, Botswana, Gabon, Equatorial Guinea, Namibia, Qatar, South Africa, and Swaziland. None of the Asian countries is included in the list of these negative outliers. In fact, a majority of the exceptionally inferior-performing countries is located in Sub-Saharan Africa.
The high incidence of HIV/AIDS in Africa could be a cause of such low level of life expectancy in relation to its per capita income level. Africa faces a particular challenge in combating the HIV/AIDS pandemic, which is reversing gains in life expectancy made over decades. HIV/AIDS is undermining growth, reducing the productivity of the workforce,
A Cross-Country Analysis of Achievements and Inequities in Economic Growth and Standards of Living | 15
and diverting scarce public resources away from making progress in other health issues and increasing access to education. Moreover, the pandemic is now threatening countries with huge populations such as the PRC and India. Effective policies, backed by adequate resources, are required to check the spread of the pandemic and to provide health care for the millions who are or will be affected.
The under-5 survival rate is an indicator that reflects the health status of a country’s population. The results show that no country can be categorized as a positive outlier or exceptionally high achiever in this indicator; however, there are three countries (Moldova, Sri Lanka, and Viet Nam) that are close to being exceptional and could be regarded as having relatively better performance in the under-5 survival rate compared to the other 174 countries. The value of this performance indicator for these three countries is higher than 1.90 but less than 1.96. In contrast, six countries (Angola, Botswana, Gabon, Equatorial Guinea, Qatar, and Swaziland) have shown exceptionally inferior performance in the under-5 survival rate. Their poor performance in this indicator could be largely explained in terms of barriers to quality basic health services such as lack of information and knowledge, inaccessibility and poor quality of service, unresponsive service providers, and high costs involved in seeking health care.
Access to safe water and adequate sanitation has a direct impact on the health status and mortality of people, particularly children. A study of eight countries by the World Bank (2004) found that the prevalence of diarrhea in children under 3 years old from households with no sanitation declined by six percentage points as conditions shifted from no improved water to “optimal” water. Moreover, the same study finds that moving from no sanitation to “optimal” sanitation results in a drop of 10 percentage points in diarrhea incidence in households with no improved water source. As with education, there are spillover effects associated with sanitation at the community level. In Peru, for example, sanitation investments by a family’s neighbors were associated with better nutritional status for that family’s children (Alderman et al. 2006).
Another indicator that is related to the delivery of health services is the number of births attended by skilled personnel. The results suggest that seven countries (�iji Islands, Jordan, Kyrgyz Republic, Moldova, Mongolia, Samoa, and Uzbekistan) have achieved exceptionally superior performance in this indicator. In contrast, Equatorial Guinea is the only negative outlier, suggesting an exceptionally low achievement in terms of births attended by skilled personnel.
As regards net primary school enrollment rate, results suggest that Oman is an exceptionally inferior performer in relation to its per capita GDP, while another rich country in the Middle East and North African region, Qatar, is found to have exceptionally low achievement in adult literacy rate. These findings suggest that an overriding focus on economic growth without similar attention to public service systems and institutions would not produce a strong human development outcome. The absence of complementary actions to establish effective social services can be detrimental to long-term growth.
1� | ADB Economics Working Paper Series No. 159
C. Relative Performance of Asian Countries
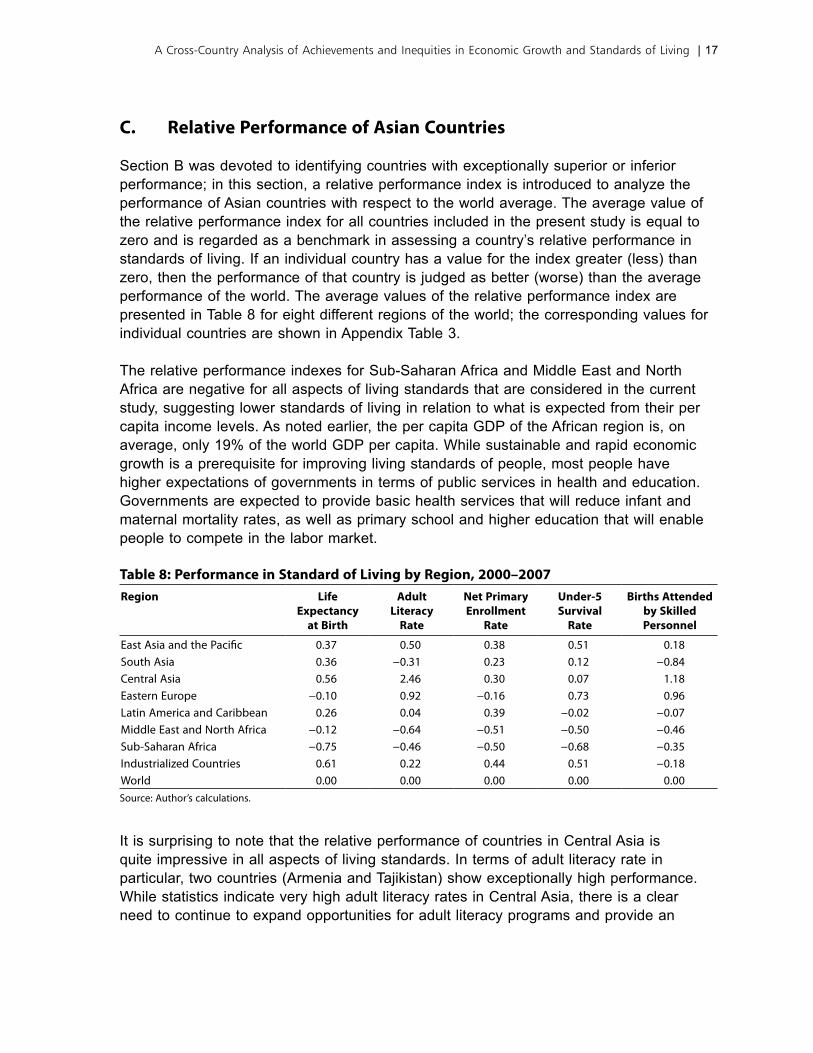
Section B was devoted to identifying countries with exceptionally superior or inferior performance; in this section, a relative performance index is introduced to analyze the performance of Asian countries with respect to the world average. The average value of the relative performance index for all countries included in the present study is equal to zero and is regarded as a benchmark in assessing a country’s relative performance in standards of living. If an individual country has a value for the index greater (less) than zero, then the performance of that country is judged as better (worse) than the average performance of the world. The average values of the relative performance index are presented in Table 8 for eight different regions of the world; the corresponding values for individual countries are shown in Appendix Table 3.
The relative performance indexes for Sub-Saharan Africa and Middle East and North Africa are negative for all aspects of living standards that are considered in the current study, suggesting lower standards of living in relation to what is expected from their per capita income levels. As noted earlier, the per capita GDP of the African region is, on average, only 19% of the world GDP per capita. While sustainable and rapid economic growth is a prerequisite for improving living standards of people, most people have higher expectations of governments in terms of public services in health and education. Governments are expected to provide basic health services that will reduce infant and maternal mortality rates, as well as primary school and higher education that will enable people to compete in the labor market.
Table 8: Performance in Standard of Living by Region, 2000–2007Region Life
Expectancy at Birth
Adult Literacy
Rate
Net Primary Enrollment
Rate
Under-5 Survival
Rate
Births Attended by Skilled Personnel
East Asia and the Pacific 0.37 0.50 0.38 0.51 0.18South Asia 0.36 −0.31 0.23 0.12 −0.84Central Asia 0.56 2.46 0.30 0.07 1.18Eastern Europe −0.10 0.92 −0.16 0.73 0.96Latin America and Caribbean 0.26 0.04 0.39 −0.02 −0.07Middle East and North Africa −0.12 −0.64 −0.51 −0.50 −0.46Sub-Saharan Africa −0.75 −0.46 −0.50 −0.68 −0.35Industrialized Countries 0.61 0.22 0.44 0.51 −0.18World 0.00 0.00 0.00 0.00 0.00Source: Author’s calculations.
It is surprising to note that the relative performance of countries in Central Asia is quite impressive in all aspects of living standards. In terms of adult literacy rate in particular, two countries (Armenia and Tajikistan) show exceptionally high performance. While statistics indicate very high adult literacy rates in Central Asia, there is a clear need to continue to expand opportunities for adult literacy programs and provide an
A Cross-Country Analysis of Achievements and Inequities in Economic Growth and Standards of Living | 17
enabling literacy environment for all (World Bank 2004). Equally important are concerns over gender disparity as these remain a challenge in some countries in the region. In Tajikistan, for instance, boys are favored, such that there are only 95 girls enrolled per 100 boys in primary education. Meanwhile, primary education appears to favor of girls in Armenia, where 104 girls are enrolled for every 100 boys.
Countries in East Asia and the Pacific surpass the world average performance in all aspects of living standards, although Papua New Guinea and Brunei Darussalam have the worst outcomes in the region. In contrast, South Asia as a whole has performed worse than the world average in adult literacy rate and births attended by skilled personnel, but better than the world average in life expectancy at birth, under-5 survival rate, and net primary enrollment rate.
South Asia faces many challenges regarding health services and health outcomes. Results show that South Asia’s indicator for births attended by skilled health staff is extremely poor compared to other regions. South Asia accounts for one third of maternal deaths worldwide (ADB 2007), and chances of dying during pregnancy are 1 in 43 in South Asia, compared to 1 in 30,000 in Sweden. However, there is a large variation in maternal death rates within South Asia, ranging from 58 per 100,000 live births in Sri Lanka to 450 in India in 2005 (World Bank 2008). Maternal mortality can be prevented with appropriate medical care and management, and thus depends mainly on health services. It is worth noting that midwifery services are linked to dramatic declines in maternal mortality in Sri Lanka (World Bank 2004). On the other hand, nutrition and child mortality depend on many other services such as education, water, food security, communication, electrification, and transportation.
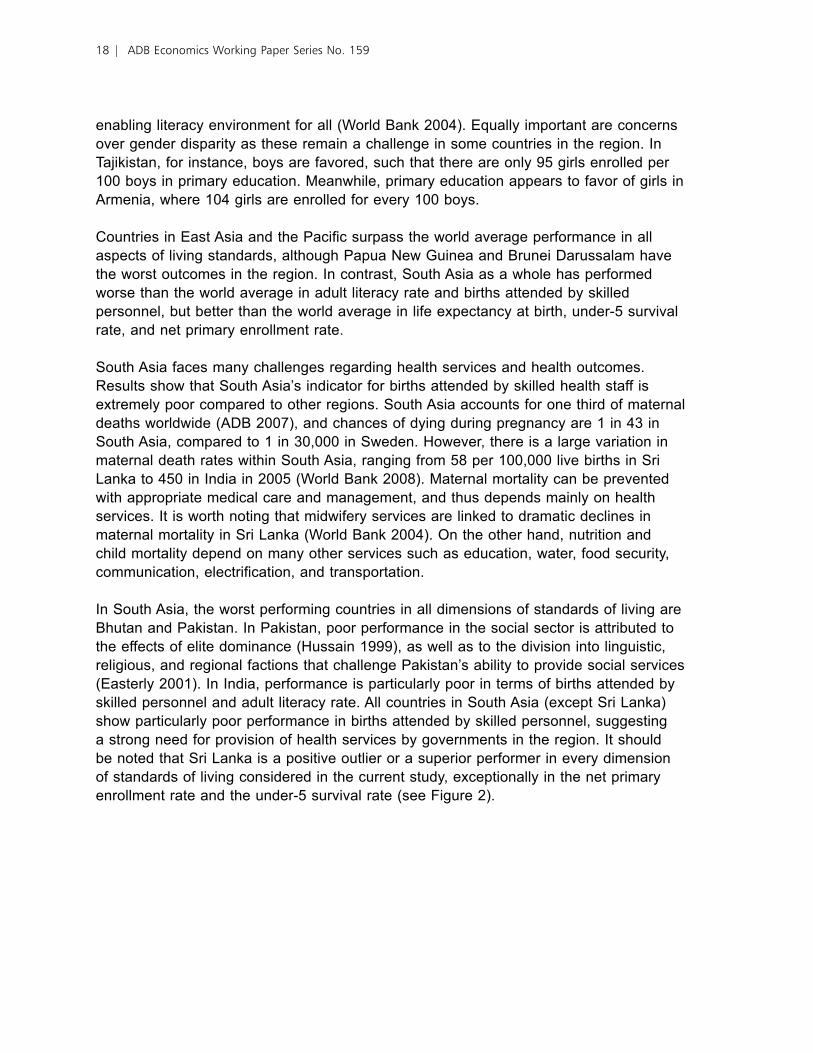
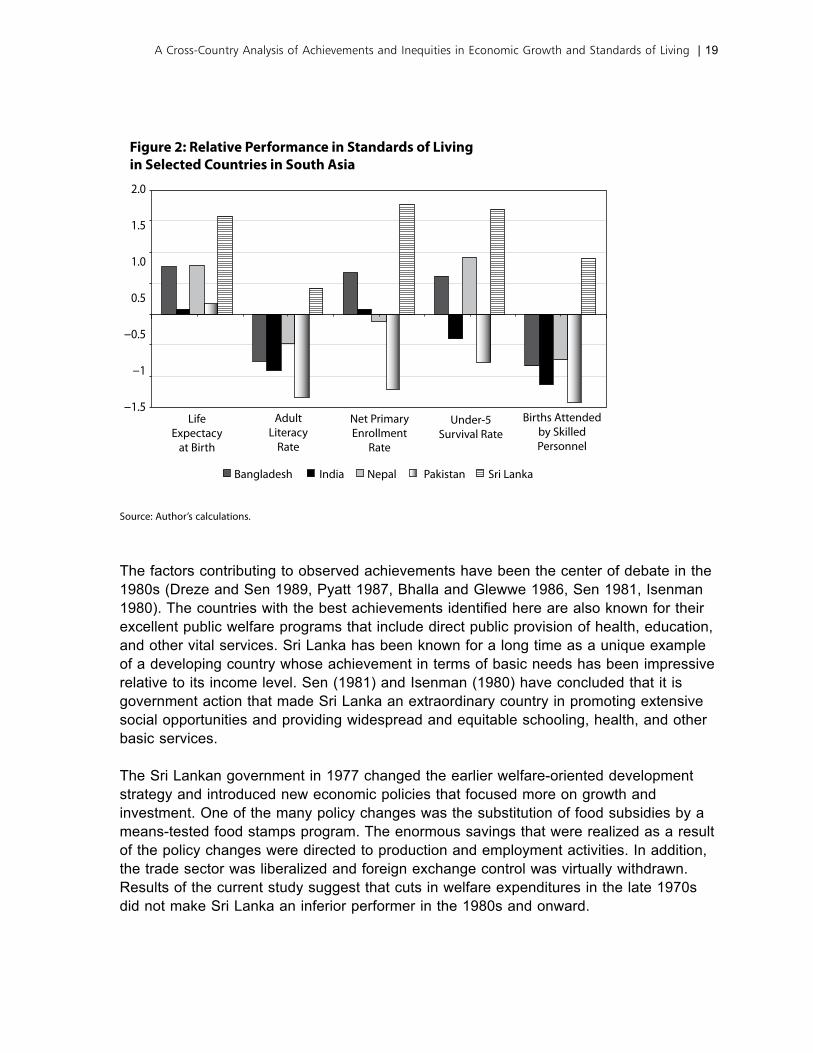
In South Asia, the worst performing countries in all dimensions of standards of living are Bhutan and Pakistan. In Pakistan, poor performance in the social sector is attributed to the effects of elite dominance (Hussain 1999), as well as to the division into linguistic, religious, and regional factions that challenge Pakistan’s ability to provide social services (Easterly 2001). In India, performance is particularly poor in terms of births attended by skilled personnel and adult literacy rate. All countries in South Asia (except Sri Lanka) show particularly poor performance in births attended by skilled personnel, suggesting a strong need for provision of health services by governments in the region. It should be noted that Sri Lanka is a positive outlier or a superior performer in every dimension of standards of living considered in the current study, exceptionally in the net primary enrollment rate and the under-5 survival rate (see �igure 2).
1� | ADB Economics Working Paper Series No. 159
2.0
1.5
1.0
0.5
−0.5
−1
−1.5
Figure 2: Relative Performance in Standards of Living in Selected Countries in South Asia
AdultLiteracy
Rate
LifeExpectacy
at Birth
Bangladesh India Pakistan Sri LankaNepal
Net PrimaryEnrollment
Rate
Under-5Survival Rate
Births Attendedby SkilledPersonnel
Source: Author’s calculations.
The factors contributing to observed achievements have been the center of debate in the 1980s (Dreze and Sen 1989, Pyatt 1987, Bhalla and Glewwe 1986, Sen 1981, Isenman 1980). The countries with the best achievements identified here are also known for their excellent public welfare programs that include direct public provision of health, education, and other vital services. Sri Lanka has been known for a long time as a unique example of a developing country whose achievement in terms of basic needs has been impressive relative to its income level. Sen (1981) and Isenman (1980) have concluded that it is government action that made Sri Lanka an extraordinary country in promoting extensive social opportunities and providing widespread and equitable schooling, health, and other basic services.
The Sri Lankan government in 1977 changed the earlier welfare-oriented development strategy and introduced new economic policies that focused more on growth and investment. One of the many policy changes was the substitution of food subsidies by a means-tested food stamps program. The enormous savings that were realized as a result of the policy changes were directed to production and employment activities. In addition, the trade sector was liberalized and foreign exchange control was virtually withdrawn. Results of the current study suggest that cuts in welfare expenditures in the late 1970s did not make Sri Lanka an inferior performer in the 1980s and onward.
A Cross-Country Analysis of Achievements and Inequities in Economic Growth and Standards of Living | 19
Government expenditures on education and health have an ability to influence human development outcomes; hence, public spending must concentrate in areas where market failure is pervasive and positive spillover is largest. Given limited public resources, the balance needs to shift more toward investments in primary health and education services. Additionally, the private sector and public–private partnerships should be encouraged to provide tertiary health and education services where market failure is minimal.
VII. Convergence in Standards of Living
In the previous sections, it was noted that the disparity in standards of living between industrialized countries and the rest of the world is extremely large. As pointed out in Section III, the average GDP per capita of industrialized countries is almost four times the average GDP per capita of the world. This section explores the likelihood of the rest of the world catching up with industrialized countries’ living standards. Assuming catch-up is feasible, the length of time for the process to be completed is estimated. Specifically, the number of years it will take for the different regions to catch up with the average standard of living in industrialized countries is calculated.
Suppose xk is the per capita GDP of the kth region, which is growing at an annual rate of γ k percent on average. Over the period of n years, the per capita GDP of the kth region will be given by
x xkn k kn= +( )1 γ (6)
�ollowing this, a similar expression can be derived for the reference group, i.e., the industrialized countries. Consider that the per capita GDP of the reference group is denoted as x0 and it grows at an annual rate of γ 0 percent on average. In n years, the average per capita GDP of the reference group will be
x xnn
0 0 01= +( )γ (7)
Suppose that after n years, the per capita GDP of the kth region approaches that of the reference group. This scenario results in x xkn n= 0 and also
nx xk
k
=−
+ − +log( ) log( )
log( ) log( )0
01 1γ γ (8)
�0 | ADB Economics Working Paper Series No. 159
which is obtained from equations (6) and (7). Since x xk0 > for all k regions, n will be positive if γ γk > 0 . Estimating the number of years (n) in equation (8) requires the growth rate γ k for the kth region.
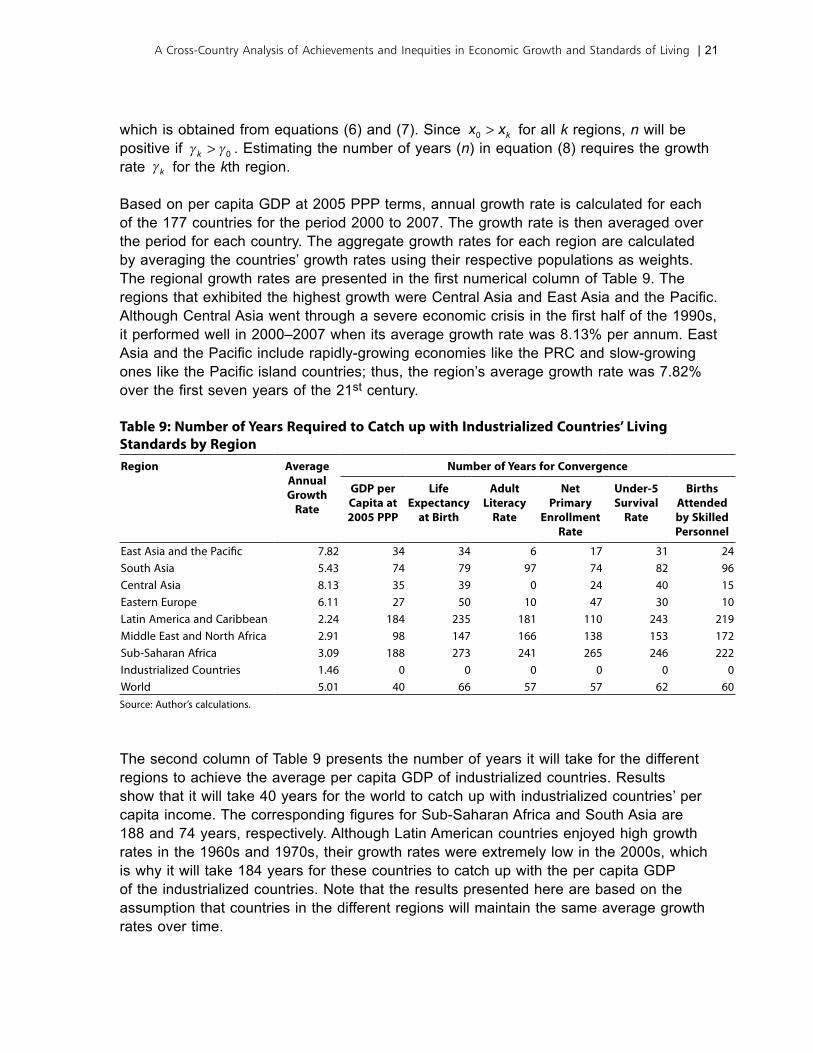
Based on per capita GDP at 2005 PPP terms, annual growth rate is calculated for each of the 177 countries for the period 2000 to 2007. The growth rate is then averaged over the period for each country. The aggregate growth rates for each region are calculated by averaging the countries’ growth rates using their respective populations as weights. The regional growth rates are presented in the first numerical column of Table 9. The regions that exhibited the highest growth were Central Asia and East Asia and the Pacific. Although Central Asia went through a severe economic crisis in the first half of the 1990s, it performed well in 2000–2007 when its average growth rate was 8.13% per annum. East Asia and the Pacific include rapidly-growing economies like the PRC and slow-growing ones like the Pacific island countries; thus, the region’s average growth rate was 7.82% over the first seven years of the 21st century.
Table 9: Number of Years Required to Catch up with Industrialized Countries’ Living Standards by RegionRegion Average
AnnualGrowth
Rate
Number of Years for Convergence
GDP per Capita at 2005 PPP
Life Expectancy
at Birth
Adult Literacy
Rate
Net Primary
Enrollment Rate
Under-5 Survival
Rate
Births Attended by Skilled Personnel
East Asia and the Pacific 7.82 34 34 6 17 31 24South Asia 5.43 74 79 97 74 82 96Central Asia 8.13 35 39 0 24 40 15Eastern Europe 6.11 27 50 10 47 30 10Latin America and Caribbean 2.24 184 235 181 110 243 219Middle East and North Africa 2.91 98 147 166 138 153 172Sub-Saharan Africa 3.09 188 273 241 265 246 222Industrialized Countries 1.46 0 0 0 0 0 0World 5.01 40 66 57 57 62 60Source: Author’s calculations.
The second column of Table 9 presents the number of years it will take for the different regions to achieve the average per capita GDP of industrialized countries. Results show that it will take 40 years for the world to catch up with industrialized countries’ per capita income. The corresponding figures for Sub-Saharan Africa and South Asia are 188 and 74 years, respectively. Although Latin American countries enjoyed high growth rates in the 1960s and 1970s, their growth rates were extremely low in the 2000s, which is why it will take 184 years for these countries to catch up with the per capita GDP of the industrialized countries. Note that the results presented here are based on the assumption that countries in the different regions will maintain the same average growth rates over time.
A Cross-Country Analysis of Achievements and Inequities in Economic Growth and Standards of Living | 21
Calculating the number of years to catch up with the reference group in terms of the five indicators of living standards requires a different approach. The growth elasticity of living standards presented in Table 7 cannot be used to project future standards of living. This is because elasticities do not remain constant over time since elasticity declines with rising standards of living. To tackle this problem, the following methodology is adopted.
The regression model presented in equation (2) provides the estimated achievement for the kth region as
f xk k = +α β log( ) (9)
which, on taking first differences, gives the change in achievement as
∆ ∆f xk k k = =β βγlog( ) (10)
where γ k kx= ∆ log( ) is the growth rate of the kth region and ∆f k is the annual absolute
change in achievement of the kth region, of which its per capita GDP increases at an annual rate of γ k percent.
In n years, the achievement of the kth region will be given by
f f nkn k k= + βγ (11)
Similarly, the achievement of the reference group over n years will be given by
f f nn0 0 0= + βγ (12)
Suppose that after n years, the achievement of the kth region approaches the achievement of the reference group. This will lead to f fkn n= 0 as well as
nf fk
k
=−−
( )
( )0
0β γ γ
(13)
which is obtained from equations (11) and (12). n in equation (13) is the number of years it will take for the standard of living in the kth region to approach that of the reference group, i.e., the industrialized countries. Note that n should always be positive. Since f fk0 > for all k regions, n will be positive if γ γk > 0 . Tables 9 and 10 present the values of n for the five indicators of living standards considered in this study.
The results in Table 9 suggest that convergence in standards of living will take longer than convergence in per capita GDP. East Asia and the Pacific will take 273 years to catch up with the reference group in life expectancy at birth while South Asia will take only 79 years.
�� | ADB Economics Working Paper Series No. 159
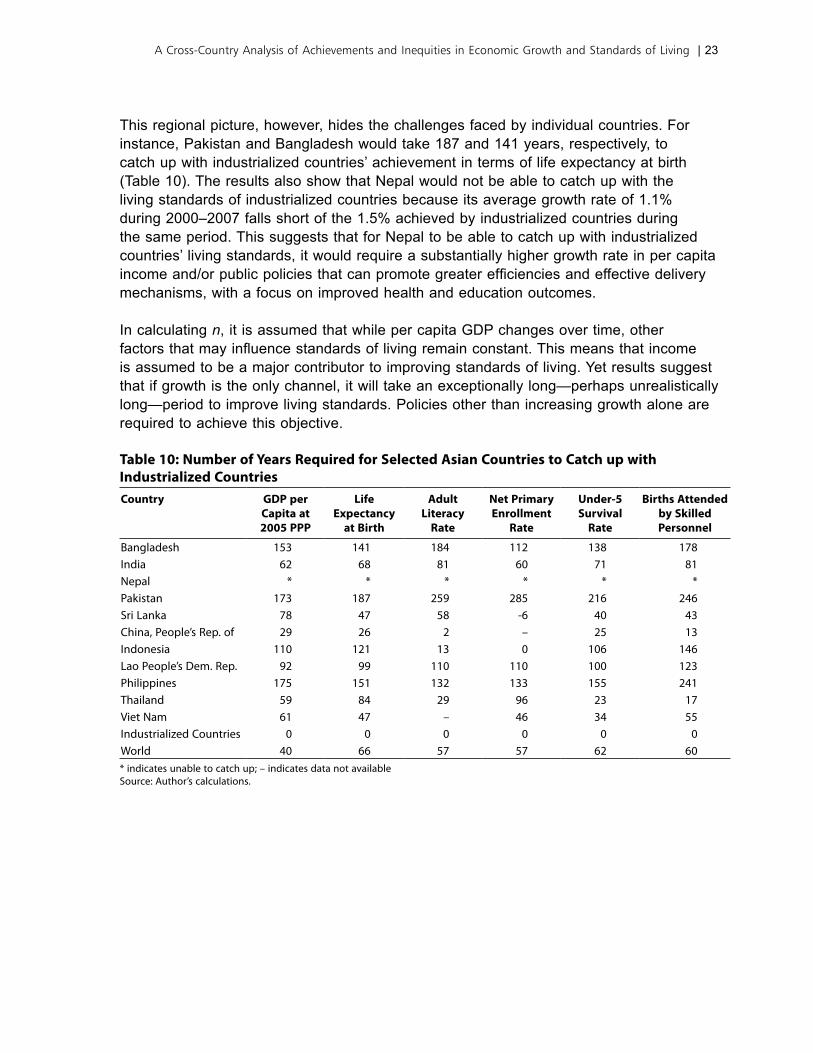
This regional picture, however, hides the challenges faced by individual countries. �or instance, Pakistan and Bangladesh would take 187 and 141 years, respectively, to catch up with industrialized countries’ achievement in terms of life expectancy at birth (Table 10). The results also show that Nepal would not be able to catch up with the living standards of industrialized countries because its average growth rate of 1.1% during 2000–2007 falls short of the 1.5% achieved by industrialized countries during the same period. This suggests that for Nepal to be able to catch up with industrialized countries’ living standards, it would require a substantially higher growth rate in per capita income and/or public policies that can promote greater efficiencies and effective delivery mechanisms, with a focus on improved health and education outcomes.
In calculating n, it is assumed that while per capita GDP changes over time, other factors that may influence standards of living remain constant. This means that income is assumed to be a major contributor to improving standards of living. Yet results suggest that if growth is the only channel, it will take an exceptionally long—perhaps unrealistically long—period to improve living standards. Policies other than increasing growth alone are required to achieve this objective.
Table 10: Number of Years Required for Selected Asian Countries to Catch up with Industrialized CountriesCountry GDP per
Capita at 2005 PPP
Life Expectancy
at Birth
Adult Literacy
Rate
Net Primary Enrollment
Rate
Under-5 Survival
Rate
Births Attended by Skilled Personnel
Bangladesh 153 141 184 112 138 178India 62 68 81 60 71 81Nepal * * * * * *Pakistan 173 187 259 285 216 246Sri Lanka 78 47 58 -6 40 43China, People’s Rep. of 29 26 2 – 25 13Indonesia 110 121 13 0 106 146Lao People’s Dem. Rep. 92 99 110 110 100 123Philippines 175 151 132 133 155 241Thailand 59 84 29 96 23 17Viet Nam 61 47 – 46 34 55Industrialized Countries 0 0 0 0 0 0World 40 66 57 57 62 60* indicates unable to catch up; – indicates data not availableSource: Author’s calculations.
A Cross-Country Analysis of Achievements and Inequities in Economic Growth and Standards of Living | 23
VIII. Public Spending and Standards of Living
This study has demonstrated that per capita GDP is an important determinant of a country’s living standards: the richer a country is, the higher is the expected standard of living. An implication of this observation is that a country can enhance its living standards by promoting economic growth. This study, however, finds that countries’ relative performance in standards of living varies widely in relation to their per capita GDP. This finding suggests that a one-to-one relationship between a country’s material prosperity and its living standards does not exist. There are factors other than income that have an impact on a country’s standard of living, including the basic services provided by governments in health and education, and access to these services by the population, which determines health and education outcomes. Countries whose performance in standards of living is inferior in relation to their per capita GDP do not have systems that promote the efficient delivery of services in health and education. While economic growth is essential, it is not enough to improve citizens’ well being.
If growth is not enough, then what else can governments do to improve standards of living?3 One approach would be to increase public spending. More spending by governments can be crucial in promoting improvements in health and education outcomes. For instance, policy interventions to reduce mortality may require increased public spending or, similarly, it may be necessary to spend more on educational programs that aim to increase primary completion rates. However, what matters is not only how much was spent but also how effectively this money was spent.
There are a handful of countries that suggest an inconsistent relationship between changes in public spending and outcomes. �or example, Thailand has increased public spending on primary schooling more than Peru did, yet primary school completion fell in Thailand and increased in Peru. Likewise, an analysis of Malaysia over the late 1980s found little association between public spending on doctors and infant or maternal mortality, and the increased construction of public schools in Indonesia that occurred in the 1970s did not have a significant positive impact on school enrollments. The cross-country association between public spending and outcomes, after controlling for national income, is found to be statistically and substantively weak. The message is not that public funding cannot be successful; rather, it is commitment and appropriate policies, backed by effective public spending, that can achieve these goals.
3 Governments often see improving health and education outcomes as a public responsibility. There are two economic rationales for this responsibility. The first rationale is market failure; more specifically, if there is no government intervention, the amount of services produced and consumed would be less than optimal from society’s point of view. As there is no market incentive to produce public goods, government intervention is required. The other economic justification for public responsibility is related to equity concerns. Issues such as improving outcomes in health and education for poor people or reducing the gaps in outcomes between the poor and the better-off are often considered a government responsibility.
�� | ADB Economics Working Paper Series No. 159
Most poor people do not get their fair share of government spending on public services in health and education. Benefit incidence analysis on public expenditure provides a clearer picture of who benefits from government spending. Evidence largely suggests that the poorest fifth of the population receives less than a fifth of education and health expenditures, while the richest fifth gets more: 46% of education spending in Nepal goes to the richest fifth, and the poorest receive only 11% (Filmer 2003). Similarly, in India the richest fifth receives three times the curative health care subsidy of the poorest fifth. One reason for this imbalance is that spending is biased toward services mainly utilized by richer people; another reason is that while channeling public spending toward services utilized by the poor helps, such services may not be reaching the targeted beneficiaries.
Indeed, public spending is not always effective in providing quality services and reaching the intended beneficiaries, who are often the poor, and this partly explains why spending has a weak relationship with outcomes. Another reason for such a weak relationship is the interaction between private and public sectors. Increasing public provision may simply crowd out, in part or in whole, equally effective services offered by nongovernment providers. Unless resources support services that work for poor people, the public resources spent on these services will not get the optimal outcome.
If more public money is spent on services and more of that money is spent on services utilized by the poor, the spending pattern will determine the efficacy of spending. For instance, wages and salaries of teachers on average account for 75% of recurrent public expenditure on education. There is no doubt that teachers play a critical role in the schooling process and giving them adequate incentives is important; however, spending on other vital inputs (such as textbooks) is also important. Too much spending on one input will have a negative impact on the quality of learning. To address this issue, governments must tackle not only the technical or managerial questions of how much to spend on one input relative to another, but also the institutional and political contexts that generate these decisions.
IX. Concluding Remarks
There are numerous cases where a country’s rapid growth did not generate strong improvements in human development. Countries with high per capita incomes can have poor records on human development, while those with low per capita incomes or growth rates can nevertheless do well on this front. The lack of a systematic relationship between progress in human development and economic growth suggests that in order to achieve social progress, patterns of investment in human development matter more than economic growth per se.
A Cross-Country Analysis of Achievements and Inequities in Economic Growth and Standards of Living | 25
Empirical evidence suggests that growth in per capita GDP does not necessarily translate to progress in human development, and similar results are seen from this study on cross-country variations in standards of living. Clearly, however, more work on causality is required to explain the major findings that emerge from the study.
Several important implications emerged from the results of this study. �irst, bridging the gap in indicators of living standards between low-income and industrialized economies appears to be a more feasible goal than closing the gap in per capita incomes. Second, bridging the gap in per capita incomes is not a necessary condition for bridging the gap in standards of living reflected by life expectancy, child mortality, births attended by skilled health personnel, and education. Third, adequate resources must flow into human development in health and education to bridge the gap in standards of living between developing and developed economies. While increased public spending is essential, it is not enough to improve people’s standards of living. Rather, governments’ planning, delivery, and management of public services are major factors that determine progress in human development.
It should be noted that this study does not call for a de-emphasis on economic growth. On the contrary, it finds that per capita income is an important explanatory variable for standard of living, and that standard of living is more responsive to growth in per capita income among lower income countries than in higher income countries. However, it also finds that there are countries that have comparable per capita incomes but are poles apart with respect to standards of living. �or these countries, public policies and institutions that enable the continuous and efficient delivery of quality basic services can play a more important role than mere growth in per capita GDP in improving life expectancy and education, as well as in reducing child and maternal mortality.
�� | ADB Economics Working Paper Series No. 159
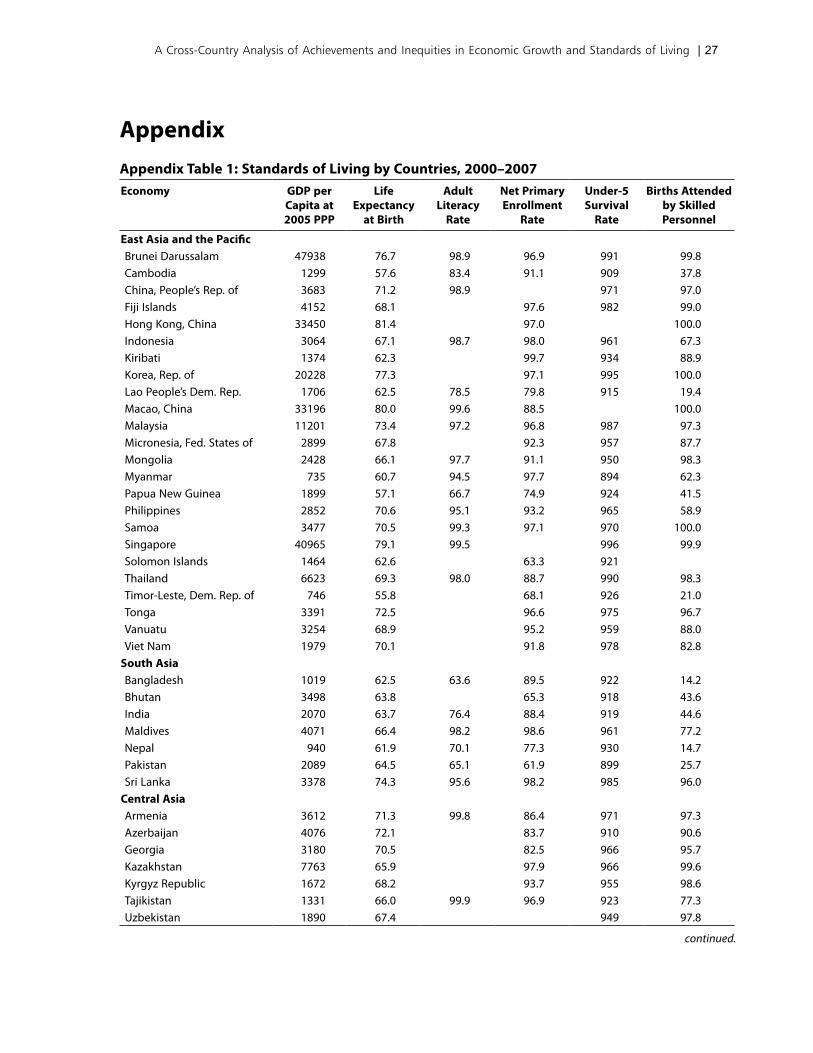
AppendixAppendix Table 1: Standards of Living by Countries, 2000–2007Economy GDP per
Capita at 2005 PPP
Life Expectancy
at Birth
Adult Literacy
Rate
Net Primary Enrollment
Rate
Under-5 Survival
Rate
Births Attended by Skilled Personnel
East Asia and the PacificBrunei Darussalam 47938 76.7 98.9 96.9 991 99.8Cambodia 1299 57.6 83.4 91.1 909 37.8China, People’s Rep. of 3683 71.2 98.9 971 97.0Fiji Islands 4152 68.1 97.6 982 99.0Hong Kong, China 33450 81.4 97.0 100.0Indonesia 3064 67.1 98.7 98.0 961 67.3Kiribati 1374 62.3 99.7 934 88.9Korea, Rep. of 20228 77.3 97.1 995 100.0Lao People’s Dem. Rep. 1706 62.5 78.5 79.8 915 19.4Macao, China 33196 80.0 99.6 88.5 100.0Malaysia 11201 73.4 97.2 96.8 987 97.3Micronesia, Fed. States of 2899 67.8 92.3 957 87.7Mongolia 2428 66.1 97.7 91.1 950 98.3Myanmar 735 60.7 94.5 97.7 894 62.3Papua New Guinea 1899 57.1 66.7 74.9 924 41.5Philippines 2852 70.6 95.1 93.2 965 58.9Samoa 3477 70.5 99.3 97.1 970 100.0Singapore 40965 79.1 99.5 996 99.9Solomon Islands 1464 62.6 63.3 921Thailand 6623 69.3 98.0 88.7 990 98.3Timor-Leste, Dem. Rep. of 746 55.8 68.1 926 21.0Tonga 3391 72.5 96.6 975 96.7Vanuatu 3254 68.9 95.2 959 88.0Viet Nam 1979 70.1 91.8 978 82.8
South AsiaBangladesh 1019 62.5 63.6 89.5 922 14.2Bhutan 3498 63.8 65.3 918 43.6India 2070 63.7 76.4 88.4 919 44.6Maldives 4071 66.4 98.2 98.6 961 77.2Nepal 940 61.9 70.1 77.3 930 14.7Pakistan 2089 64.5 65.1 61.9 899 25.7Sri Lanka 3378 74.3 95.6 98.2 985 96.0
Central AsiaArmenia 3612 71.3 99.8 86.4 971 97.3Azerbaijan 4076 72.1 83.7 910 90.6Georgia 3180 70.5 82.5 966 95.7Kazakhstan 7763 65.9 97.9 966 99.6Kyrgyz Republic 1672 68.2 93.7 955 98.6Tajikistan 1331 66.0 99.9 96.9 923 77.3Uzbekistan 1890 67.4 949 97.8
continued.
A Cross-Country Analysis of Achievements and Inequities in Economic Growth and Standards of Living | 27
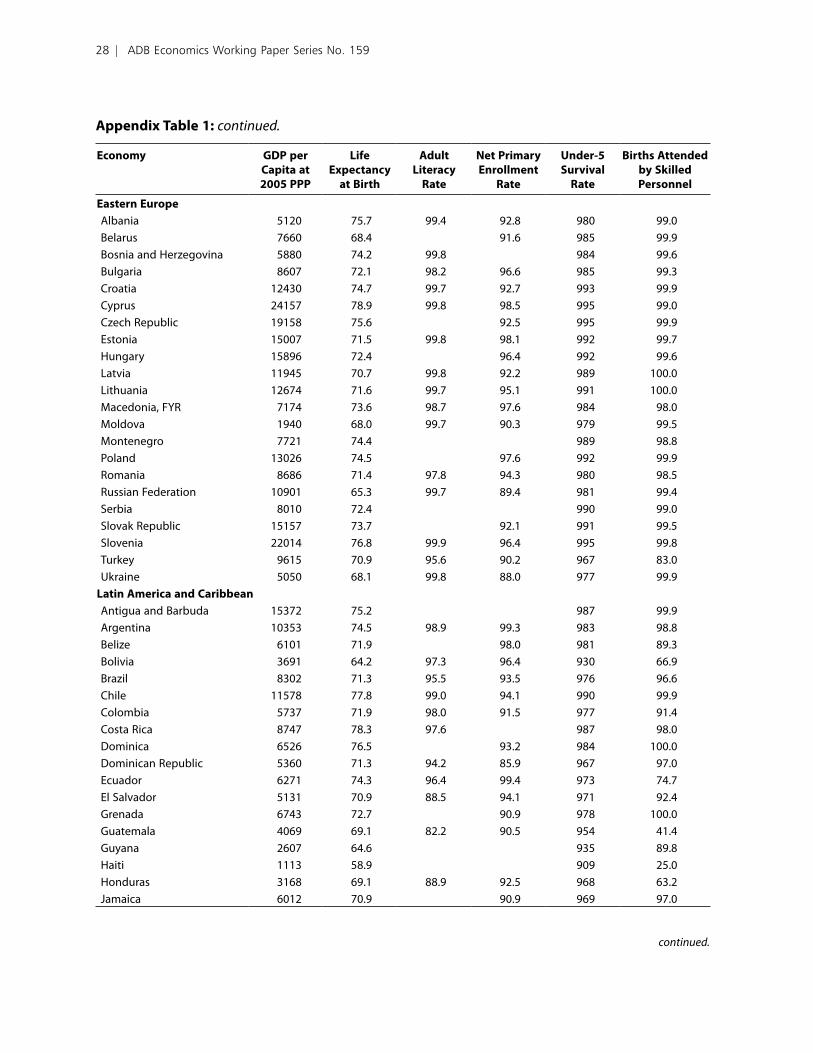
Economy GDP per Capita at 2005 PPP
Life Expectancy
at Birth
Adult Literacy
Rate
Net Primary Enrollment
Rate
Under-5 Survival
Rate
Births Attended by Skilled Personnel
Eastern EuropeAlbania 5120 75.7 99.4 92.8 980 99.0Belarus 7660 68.4 91.6 985 99.9Bosnia and Herzegovina 5880 74.2 99.8 984 99.6Bulgaria 8607 72.1 98.2 96.6 985 99.3Croatia 12430 74.7 99.7 92.7 993 99.9Cyprus 24157 78.9 99.8 98.5 995 99.0Czech Republic 19158 75.6 92.5 995 99.9Estonia 15007 71.5 99.8 98.1 992 99.7Hungary 15896 72.4 96.4 992 99.6Latvia 11945 70.7 99.8 92.2 989 100.0Lithuania 12674 71.6 99.7 95.1 991 100.0Macedonia, FYR 7174 73.6 98.7 97.6 984 98.0Moldova 1940 68.0 99.7 90.3 979 99.5Montenegro 7721 74.4 989 98.8Poland 13026 74.5 97.6 992 99.9Romania 8686 71.4 97.8 94.3 980 98.5Russian Federation 10901 65.3 99.7 89.4 981 99.4Serbia 8010 72.4 990 99.0Slovak Republic 15157 73.7 92.1 991 99.5Slovenia 22014 76.8 99.9 96.4 995 99.8Turkey 9615 70.9 95.6 90.2 967 83.0Ukraine 5050 68.1 99.8 88.0 977 99.9
Latin America and CaribbeanAntigua and Barbuda 15372 75.2 987 99.9Argentina 10353 74.5 98.9 99.3 983 98.8Belize 6101 71.9 98.0 981 89.3Bolivia 3691 64.2 97.3 96.4 930 66.9Brazil 8302 71.3 95.5 93.5 976 96.6Chile 11578 77.8 99.0 94.1 990 99.9Colombia 5737 71.9 98.0 91.5 977 91.4Costa Rica 8747 78.3 97.6 987 98.0Dominica 6526 76.5 93.2 984 100.0Dominican Republic 5360 71.3 94.2 85.9 967 97.0Ecuador 6271 74.3 96.4 99.4 973 74.7El Salvador 5131 70.9 88.5 94.1 971 92.4Grenada 6743 72.7 90.9 978 100.0Guatemala 4069 69.1 82.2 90.5 954 41.4Guyana 2607 64.6 935 89.8Haiti 1113 58.9 909 25.0Honduras 3168 69.1 88.9 92.5 968 63.2Jamaica 6012 70.9 90.9 969 97.0
continued.
Appendix Table 1: continued.
�� | ADB Economics Working Paper Series No. 159
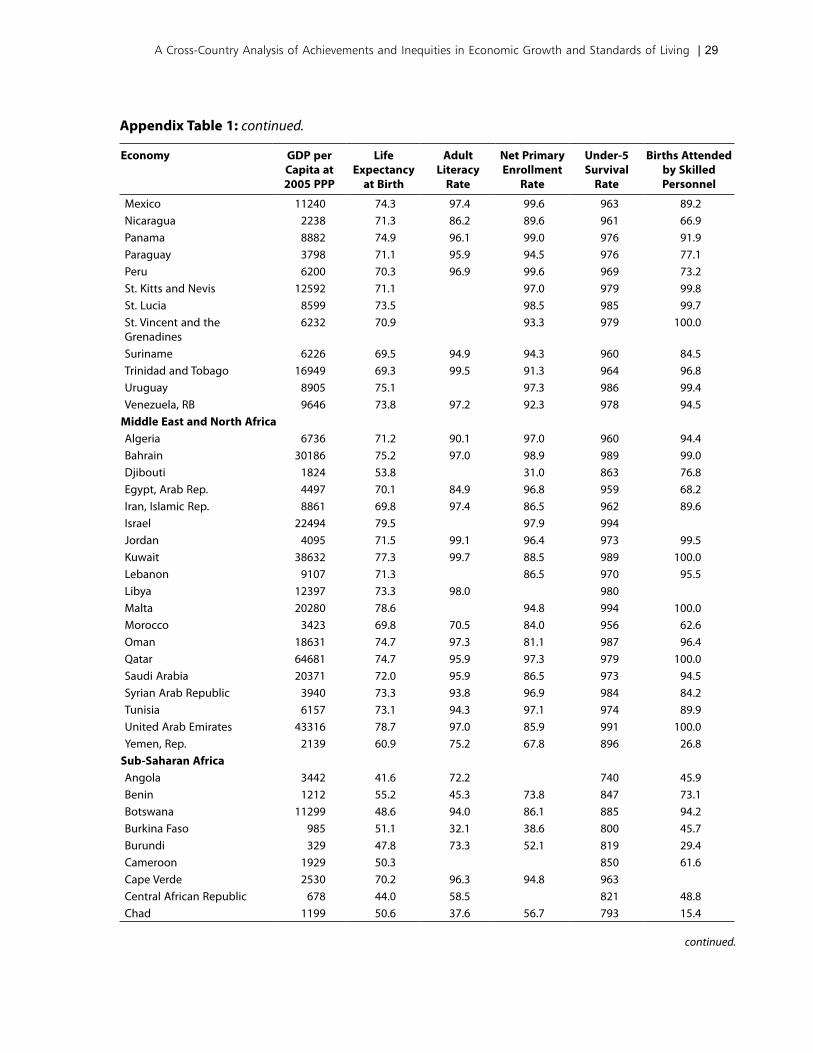
Economy GDP per Capita at 2005 PPP
Life Expectancy
at Birth
Adult Literacy
Rate
Net Primary Enrollment
Rate
Under-5 Survival
Rate
Births Attended by Skilled Personnel
Mexico 11240 74.3 97.4 99.6 963 89.2Nicaragua 2238 71.3 86.2 89.6 961 66.9Panama 8882 74.9 96.1 99.0 976 91.9Paraguay 3798 71.1 95.9 94.5 976 77.1Peru 6200 70.3 96.9 99.6 969 73.2St. Kitts and Nevis 12592 71.1 97.0 979 99.8St. Lucia 8599 73.5 98.5 985 99.7St. Vincent and the Grenadines
6232 70.9 93.3 979 100.0
Suriname 6226 69.5 94.9 94.3 960 84.5Trinidad and Tobago 16949 69.3 99.5 91.3 964 96.8Uruguay 8905 75.1 97.3 986 99.4Venezuela, RB 9646 73.8 97.2 92.3 978 94.5
Middle East and North AfricaAlgeria 6736 71.2 90.1 97.0 960 94.4Bahrain 30186 75.2 97.0 98.9 989 99.0Djibouti 1824 53.8 31.0 863 76.8Egypt, Arab Rep. 4497 70.1 84.9 96.8 959 68.2Iran, Islamic Rep. 8861 69.8 97.4 86.5 962 89.6Israel 22494 79.5 97.9 994Jordan 4095 71.5 99.1 96.4 973 99.5Kuwait 38632 77.3 99.7 88.5 989 100.0Lebanon 9107 71.3 86.5 970 95.5Libya 12397 73.3 98.0 980Malta 20280 78.6 94.8 994 100.0Morocco 3423 69.8 70.5 84.0 956 62.6Oman 18631 74.7 97.3 81.1 987 96.4Qatar 64681 74.7 95.9 97.3 979 100.0Saudi Arabia 20371 72.0 95.9 86.5 973 94.5Syrian Arab Republic 3940 73.3 93.8 96.9 984 84.2Tunisia 6157 73.1 94.3 97.1 974 89.9United Arab Emirates 43316 78.7 97.0 85.9 991 100.0Yemen, Rep. 2139 60.9 75.2 67.8 896 26.8
Sub-Saharan AfricaAngola 3442 41.6 72.2 740 45.9Benin 1212 55.2 45.3 73.8 847 73.1Botswana 11299 48.6 94.0 86.1 885 94.2Burkina Faso 985 51.1 32.1 38.6 800 45.7Burundi 329 47.8 73.3 52.1 819 29.4Cameroon 1929 50.3 850 61.6Cape Verde 2530 70.2 96.3 94.8 963Central African Republic 678 44.0 58.5 821 48.8Chad 1199 50.6 37.6 56.7 793 15.4
continued.
Appendix Table 1: continued.
A Cross-Country Analysis of Achievements and Inequities in Economic Growth and Standards of Living | 29
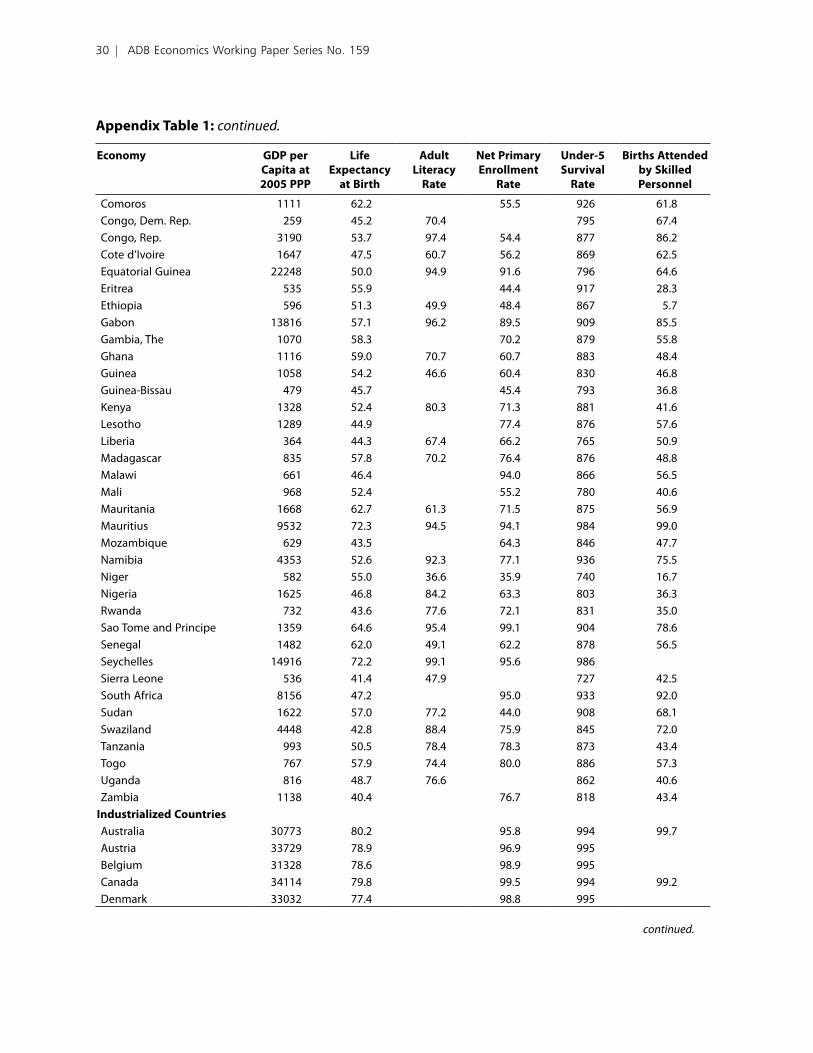
Economy GDP per Capita at 2005 PPP
Life Expectancy
at Birth
Adult Literacy
Rate
Net Primary Enrollment
Rate
Under-5 Survival
Rate
Births Attended by Skilled Personnel
Comoros 1111 62.2 55.5 926 61.8Congo, Dem. Rep. 259 45.2 70.4 795 67.4Congo, Rep. 3190 53.7 97.4 54.4 877 86.2Cote d’Ivoire 1647 47.5 60.7 56.2 869 62.5Equatorial Guinea 22248 50.0 94.9 91.6 796 64.6Eritrea 535 55.9 44.4 917 28.3Ethiopia 596 51.3 49.9 48.4 867 5.7Gabon 13816 57.1 96.2 89.5 909 85.5Gambia, The 1070 58.3 70.2 879 55.8Ghana 1116 59.0 70.7 60.7 883 48.4Guinea 1058 54.2 46.6 60.4 830 46.8Guinea-Bissau 479 45.7 45.4 793 36.8Kenya 1328 52.4 80.3 71.3 881 41.6Lesotho 1289 44.9 77.4 876 57.6Liberia 364 44.3 67.4 66.2 765 50.9Madagascar 835 57.8 70.2 76.4 876 48.8Malawi 661 46.4 94.0 866 56.5Mali 968 52.4 55.2 780 40.6Mauritania 1668 62.7 61.3 71.5 875 56.9Mauritius 9532 72.3 94.5 94.1 984 99.0Mozambique 629 43.5 64.3 846 47.7Namibia 4353 52.6 92.3 77.1 936 75.5Niger 582 55.0 36.6 35.9 740 16.7Nigeria 1625 46.8 84.2 63.3 803 36.3Rwanda 732 43.6 77.6 72.1 831 35.0Sao Tome and Principe 1359 64.6 95.4 99.1 904 78.6Senegal 1482 62.0 49.1 62.2 878 56.5Seychelles 14916 72.2 99.1 95.6 986Sierra Leone 536 41.4 47.9 727 42.5South Africa 8156 47.2 95.0 933 92.0Sudan 1622 57.0 77.2 44.0 908 68.1Swaziland 4448 42.8 88.4 75.9 845 72.0Tanzania 993 50.5 78.4 78.3 873 43.4Togo 767 57.9 74.4 80.0 886 57.3Uganda 816 48.7 76.6 862 40.6Zambia 1138 40.4 76.7 818 43.4
Industrialized CountriesAustralia 30773 80.2 95.8 994 99.7Austria 33729 78.9 96.9 995Belgium 31328 78.6 98.9 995Canada 34114 79.8 99.5 994 99.2Denmark 33032 77.4 98.8 995
Appendix Table 1: continued.
continued.
30 | ADB Economics Working Paper Series No. 159
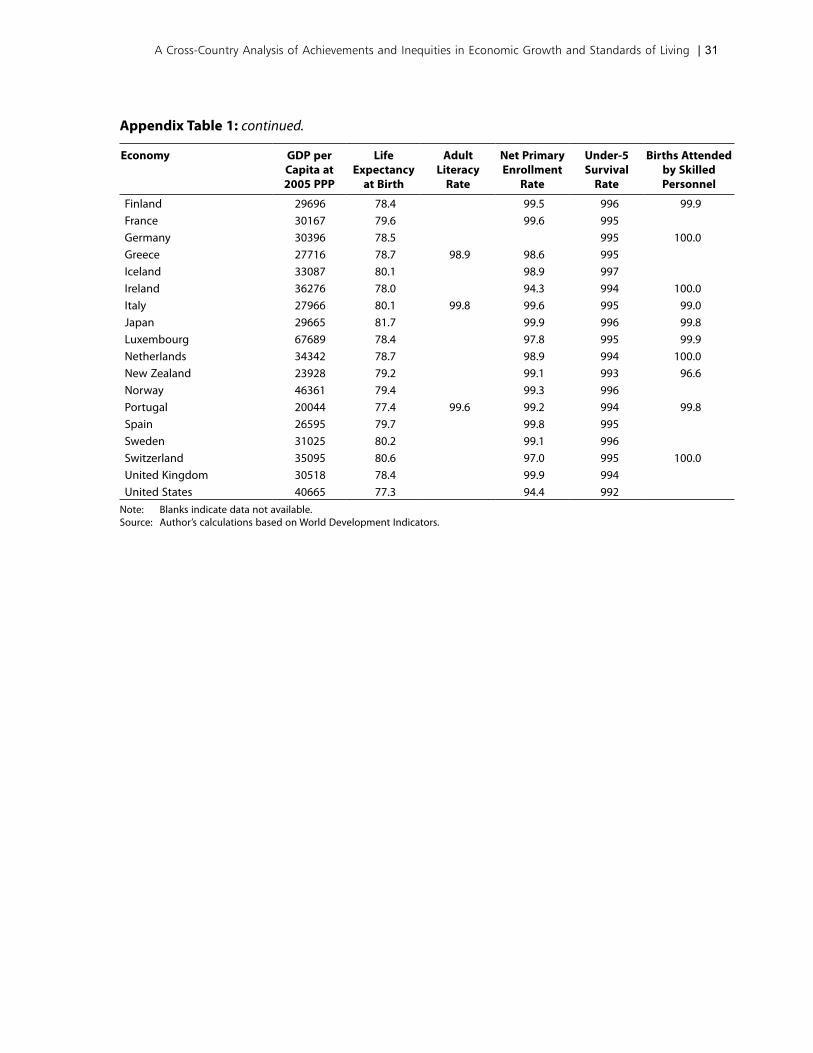
Economy GDP per Capita at 2005 PPP
Life Expectancy
at Birth
Adult Literacy
Rate
Net Primary Enrollment
Rate
Under-5 Survival
Rate
Births Attended by Skilled Personnel
Finland 29696 78.4 99.5 996 99.9France 30167 79.6 99.6 995Germany 30396 78.5 995 100.0Greece 27716 78.7 98.9 98.6 995Iceland 33087 80.1 98.9 997Ireland 36276 78.0 94.3 994 100.0Italy 27966 80.1 99.8 99.6 995 99.0Japan 29665 81.7 99.9 996 99.8Luxembourg 67689 78.4 97.8 995 99.9Netherlands 34342 78.7 98.9 994 100.0New Zealand 23928 79.2 99.1 993 96.6Norway 46361 79.4 99.3 996Portugal 20044 77.4 99.6 99.2 994 99.8Spain 26595 79.7 99.8 995Sweden 31025 80.2 99.1 996Switzerland 35095 80.6 97.0 995 100.0United Kingdom 30518 78.4 99.9 994United States 40665 77.3 94.4 992
Note: Blanks indicate data not available.Source: Author’s calculations based on World Development Indicators.
Appendix Table 1: continued.
A Cross-Country Analysis of Achievements and Inequities in Economic Growth and Standards of Living | 31
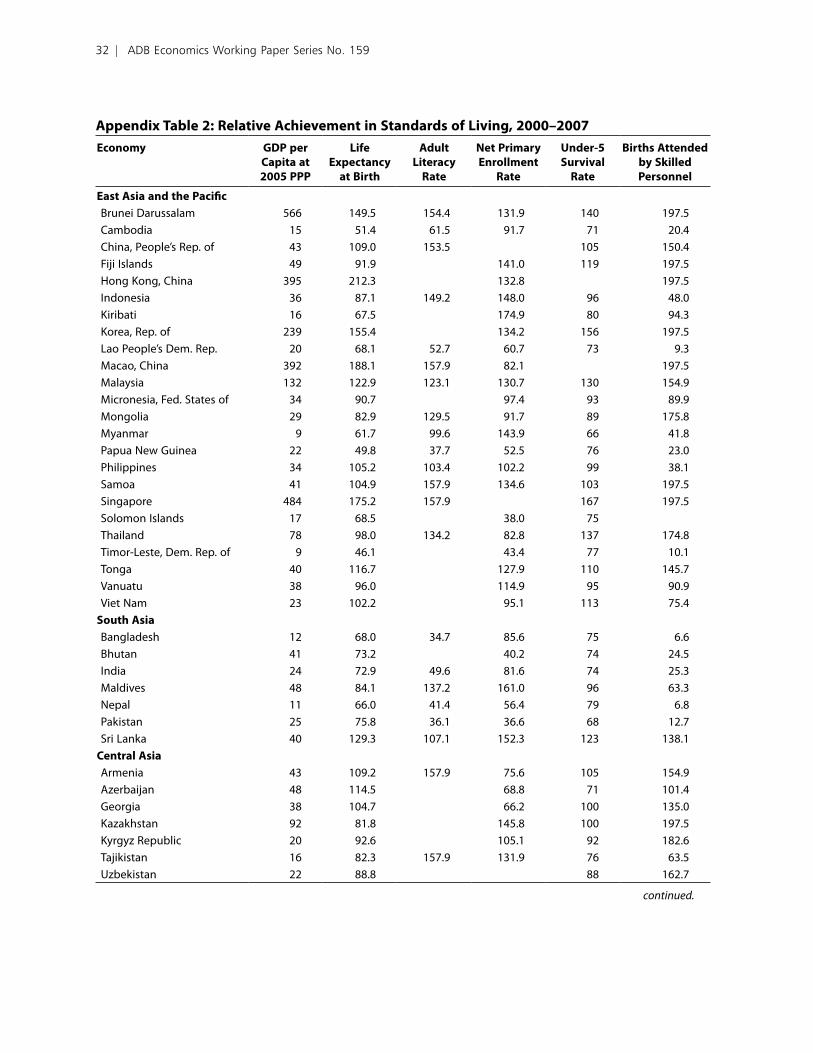
Appendix Table 2: Relative Achievement in Standards of Living, 2000–2007Economy GDP per
Capita at 2005 PPP
Life Expectancy
at Birth
Adult Literacy
Rate
Net Primary Enrollment
Rate
Under-5 Survival
Rate
Births Attended by Skilled Personnel
East Asia and the PacificBrunei Darussalam 566 149.5 154.4 131.9 140 197.5Cambodia 15 51.4 61.5 91.7 71 20.4China, People’s Rep. of 43 109.0 153.5 105 150.4Fiji Islands 49 91.9 141.0 119 197.5Hong Kong, China 395 212.3 132.8 197.5Indonesia 36 87.1 149.2 148.0 96 48.0Kiribati 16 67.5 174.9 80 94.3Korea, Rep. of 239 155.4 134.2 156 197.5Lao People’s Dem. Rep. 20 68.1 52.7 60.7 73 9.3Macao, China 392 188.1 157.9 82.1 197.5Malaysia 132 122.9 123.1 130.7 130 154.9Micronesia, Fed. States of 34 90.7 97.4 93 89.9Mongolia 29 82.9 129.5 91.7 89 175.8Myanmar 9 61.7 99.6 143.9 66 41.8Papua New Guinea 22 49.8 37.7 52.5 76 23.0Philippines 34 105.2 103.4 102.2 99 38.1Samoa 41 104.9 157.9 134.6 103 197.5Singapore 484 175.2 157.9 167 197.5Solomon Islands 17 68.5 38.0 75Thailand 78 98.0 134.2 82.8 137 174.8Timor-Leste, Dem. Rep. of 9 46.1 43.4 77 10.1Tonga 40 116.7 127.9 110 145.7Vanuatu 38 96.0 114.9 95 90.9Viet Nam 23 102.2 95.1 113 75.4
South AsiaBangladesh 12 68.0 34.7 85.6 75 6.6Bhutan 41 73.2 40.2 74 24.5India 24 72.9 49.6 81.6 74 25.3Maldives 48 84.1 137.2 161.0 96 63.3Nepal 11 66.0 41.4 56.4 79 6.8Pakistan 25 75.8 36.1 36.6 68 12.7Sri Lanka 40 129.3 107.1 152.3 123 138.1
Central AsiaArmenia 43 109.2 157.9 75.6 105 154.9Azerbaijan 48 114.5 68.8 71 101.4Georgia 38 104.7 66.2 100 135.0Kazakhstan 92 81.8 145.8 100 197.5Kyrgyz Republic 20 92.6 105.1 92 182.6Tajikistan 16 82.3 157.9 131.9 76 63.5Uzbekistan 22 88.8 88 162.7
continued.
3� | ADB Economics Working Paper Series No. 159
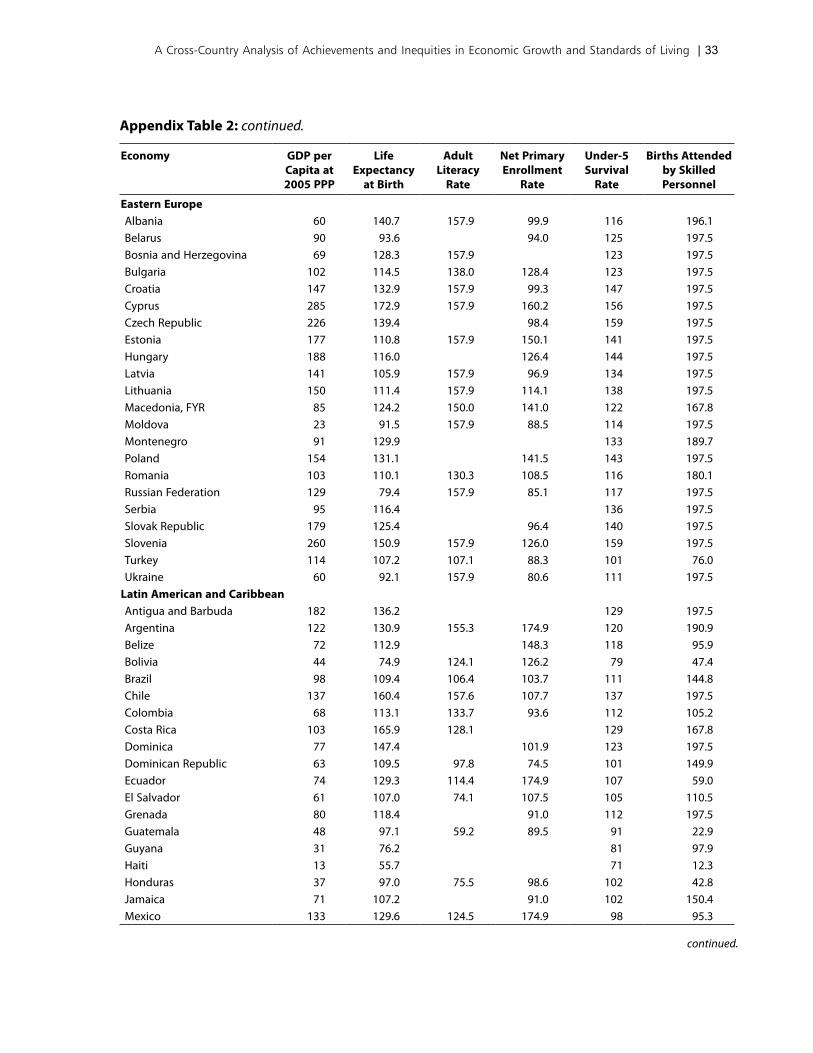
Economy GDP per Capita at 2005 PPP
Life Expectancy
at Birth
Adult Literacy
Rate
Net Primary Enrollment
Rate
Under-5 Survival
Rate
Births Attended by Skilled Personnel
Eastern EuropeAlbania 60 140.7 157.9 99.9 116 196.1Belarus 90 93.6 94.0 125 197.5Bosnia and Herzegovina 69 128.3 157.9 123 197.5Bulgaria 102 114.5 138.0 128.4 123 197.5Croatia 147 132.9 157.9 99.3 147 197.5Cyprus 285 172.9 157.9 160.2 156 197.5Czech Republic 226 139.4 98.4 159 197.5Estonia 177 110.8 157.9 150.1 141 197.5Hungary 188 116.0 126.4 144 197.5Latvia 141 105.9 157.9 96.9 134 197.5Lithuania 150 111.4 157.9 114.1 138 197.5Macedonia, FYR 85 124.2 150.0 141.0 122 167.8Moldova 23 91.5 157.9 88.5 114 197.5Montenegro 91 129.9 133 189.7Poland 154 131.1 141.5 143 197.5Romania 103 110.1 130.3 108.5 116 180.1Russian Federation 129 79.4 157.9 85.1 117 197.5Serbia 95 116.4 136 197.5Slovak Republic 179 125.4 96.4 140 197.5Slovenia 260 150.9 157.9 126.0 159 197.5Turkey 114 107.2 107.1 88.3 101 76.0Ukraine 60 92.1 157.9 80.6 111 197.5
Latin American and CaribbeanAntigua and Barbuda 182 136.2 129 197.5Argentina 122 130.9 155.3 174.9 120 190.9Belize 72 112.9 148.3 118 95.9Bolivia 44 74.9 124.1 126.2 79 47.4Brazil 98 109.4 106.4 103.7 111 144.8Chile 137 160.4 157.6 107.7 137 197.5Colombia 68 113.1 133.7 93.6 112 105.2Costa Rica 103 165.9 128.1 129 167.8Dominica 77 147.4 101.9 123 197.5Dominican Republic 63 109.5 97.8 74.5 101 149.9Ecuador 74 129.3 114.4 174.9 107 59.0El Salvador 61 107.0 74.1 107.5 105 110.5Grenada 80 118.4 91.0 112 197.5Guatemala 48 97.1 59.2 89.5 91 22.9Guyana 31 76.2 81 97.9Haiti 13 55.7 71 12.3Honduras 37 97.0 75.5 98.6 102 42.8Jamaica 71 107.2 91.0 102 150.4Mexico 133 129.6 124.5 174.9 98 95.3
continued.
Appendix Table 2: continued.
A Cross-Country Analysis of Achievements and Inequities in Economic Growth and Standards of Living | 33
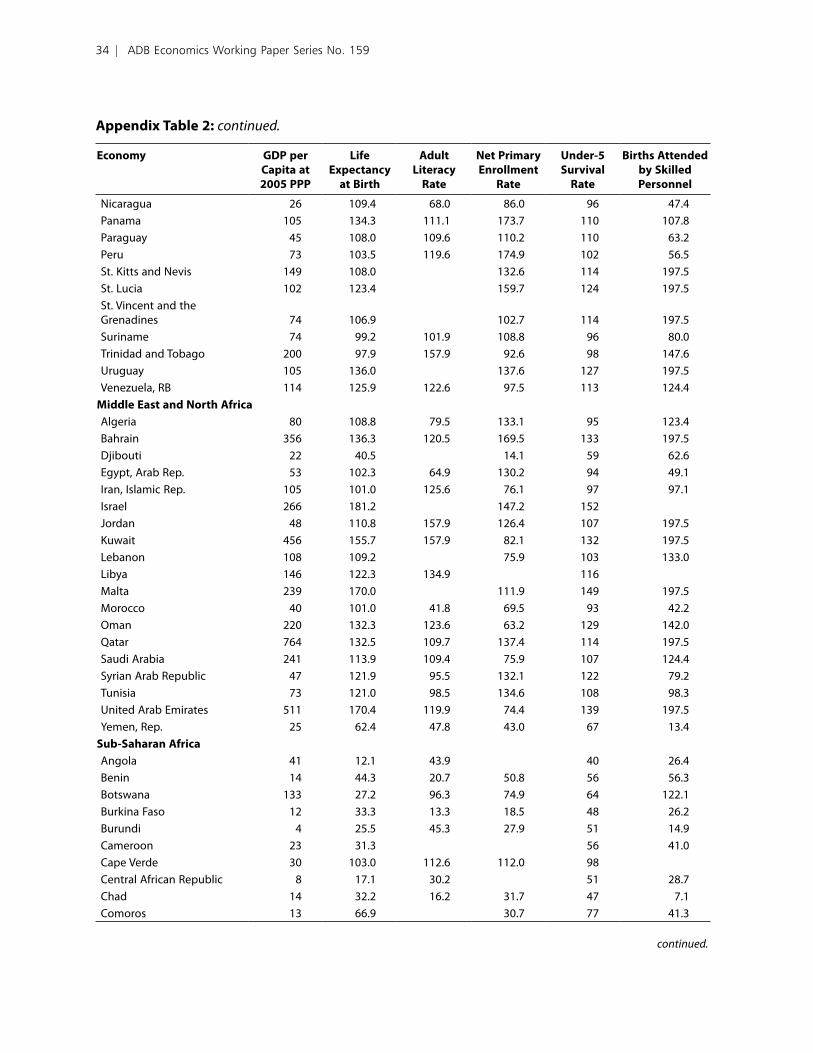
Economy GDP per Capita at 2005 PPP
Life Expectancy
at Birth
Adult Literacy
Rate
Net Primary Enrollment
Rate
Under-5 Survival
Rate
Births Attended by Skilled Personnel
Nicaragua 26 109.4 68.0 86.0 96 47.4Panama 105 134.3 111.1 173.7 110 107.8Paraguay 45 108.0 109.6 110.2 110 63.2Peru 73 103.5 119.6 174.9 102 56.5St. Kitts and Nevis 149 108.0 132.6 114 197.5St. Lucia 102 123.4 159.7 124 197.5St. Vincent and the Grenadines 74 106.9 102.7 114 197.5Suriname 74 99.2 101.9 108.8 96 80.0Trinidad and Tobago 200 97.9 157.9 92.6 98 147.6Uruguay 105 136.0 137.6 127 197.5Venezuela, RB 114 125.9 122.6 97.5 113 124.4
Middle East and North AfricaAlgeria 80 108.8 79.5 133.1 95 123.4Bahrain 356 136.3 120.5 169.5 133 197.5Djibouti 22 40.5 14.1 59 62.6Egypt, Arab Rep. 53 102.3 64.9 130.2 94 49.1Iran, Islamic Rep. 105 101.0 125.6 76.1 97 97.1Israel 266 181.2 147.2 152Jordan 48 110.8 157.9 126.4 107 197.5Kuwait 456 155.7 157.9 82.1 132 197.5Lebanon 108 109.2 75.9 103 133.0Libya 146 122.3 134.9 116Malta 239 170.0 111.9 149 197.5Morocco 40 101.0 41.8 69.5 93 42.2Oman 220 132.3 123.6 63.2 129 142.0Qatar 764 132.5 109.7 137.4 114 197.5Saudi Arabia 241 113.9 109.4 75.9 107 124.4Syrian Arab Republic 47 121.9 95.5 132.1 122 79.2Tunisia 73 121.0 98.5 134.6 108 98.3United Arab Emirates 511 170.4 119.9 74.4 139 197.5Yemen, Rep. 25 62.4 47.8 43.0 67 13.4
Sub-Saharan AfricaAngola 41 12.1 43.9 40 26.4Benin 14 44.3 20.7 50.8 56 56.3Botswana 133 27.2 96.3 74.9 64 122.1Burkina Faso 12 33.3 13.3 18.5 48 26.2Burundi 4 25.5 45.3 27.9 51 14.9Cameroon 23 31.3 56 41.0Cape Verde 30 103.0 112.6 112.0 98Central African Republic 8 17.1 30.2 51 28.7Chad 14 32.2 16.2 31.7 47 7.1Comoros 13 66.9 30.7 77 41.3
continued.
Appendix Table 2: continued.
3� | ADB Economics Working Paper Series No. 159
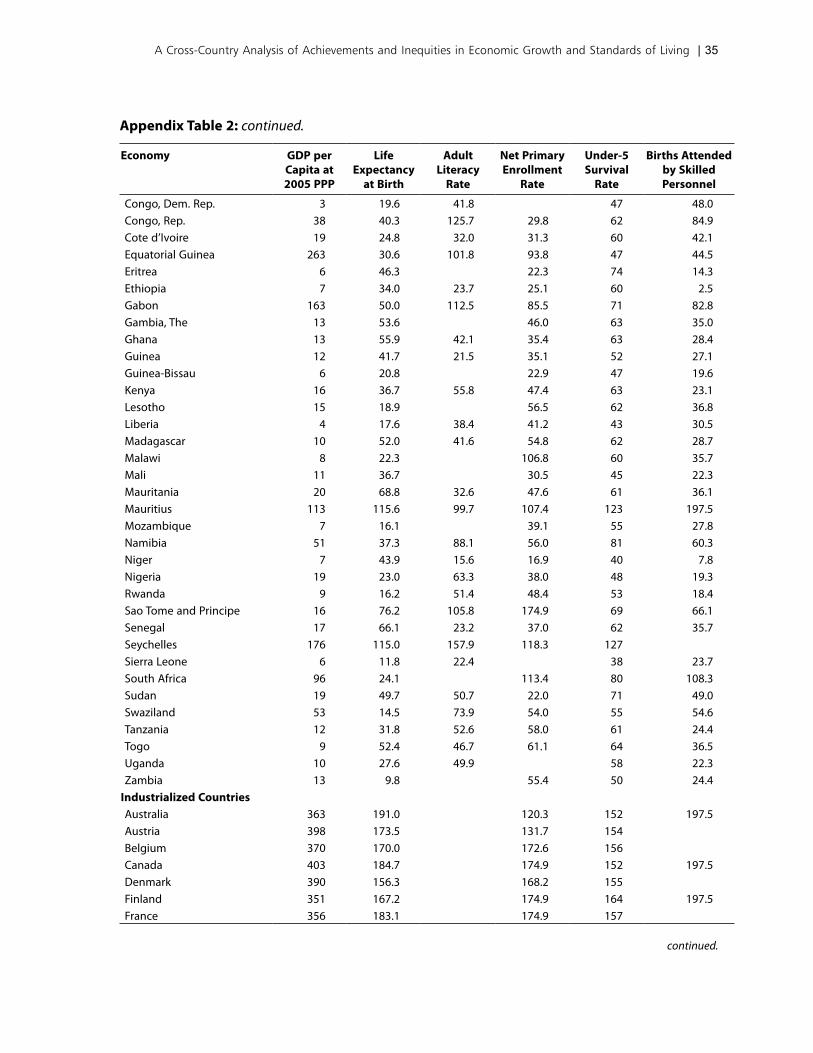
Economy GDP per Capita at 2005 PPP
Life Expectancy
at Birth
Adult Literacy
Rate
Net Primary Enrollment
Rate
Under-5 Survival
Rate
Births Attended by Skilled Personnel
Congo, Dem. Rep. 3 19.6 41.8 47 48.0Congo, Rep. 38 40.3 125.7 29.8 62 84.9Cote d’Ivoire 19 24.8 32.0 31.3 60 42.1Equatorial Guinea 263 30.6 101.8 93.8 47 44.5Eritrea 6 46.3 22.3 74 14.3Ethiopia 7 34.0 23.7 25.1 60 2.5Gabon 163 50.0 112.5 85.5 71 82.8Gambia, The 13 53.6 46.0 63 35.0Ghana 13 55.9 42.1 35.4 63 28.4Guinea 12 41.7 21.5 35.1 52 27.1Guinea-Bissau 6 20.8 22.9 47 19.6Kenya 16 36.7 55.8 47.4 63 23.1Lesotho 15 18.9 56.5 62 36.8Liberia 4 17.6 38.4 41.2 43 30.5Madagascar 10 52.0 41.6 54.8 62 28.7Malawi 8 22.3 106.8 60 35.7Mali 11 36.7 30.5 45 22.3Mauritania 20 68.8 32.6 47.6 61 36.1Mauritius 113 115.6 99.7 107.4 123 197.5Mozambique 7 16.1 39.1 55 27.8Namibia 51 37.3 88.1 56.0 81 60.3Niger 7 43.9 15.6 16.9 40 7.8Nigeria 19 23.0 63.3 38.0 48 19.3Rwanda 9 16.2 51.4 48.4 53 18.4Sao Tome and Principe 16 76.2 105.8 174.9 69 66.1Senegal 17 66.1 23.2 37.0 62 35.7Seychelles 176 115.0 157.9 118.3 127Sierra Leone 6 11.8 22.4 38 23.7South Africa 96 24.1 113.4 80 108.3Sudan 19 49.7 50.7 22.0 71 49.0Swaziland 53 14.5 73.9 54.0 55 54.6Tanzania 12 31.8 52.6 58.0 61 24.4Togo 9 52.4 46.7 61.1 64 36.5Uganda 10 27.6 49.9 58 22.3Zambia 13 9.8 55.4 50 24.4
Industrialized CountriesAustralia 363 191.0 120.3 152 197.5Austria 398 173.5 131.7 154Belgium 370 170.0 172.6 156Canada 403 184.7 174.9 152 197.5Denmark 390 156.3 168.2 155Finland 351 167.2 174.9 164 197.5France 356 183.1 174.9 157
Appendix Table 2: continued.
continued.
A Cross-Country Analysis of Achievements and Inequities in Economic Growth and Standards of Living | 35
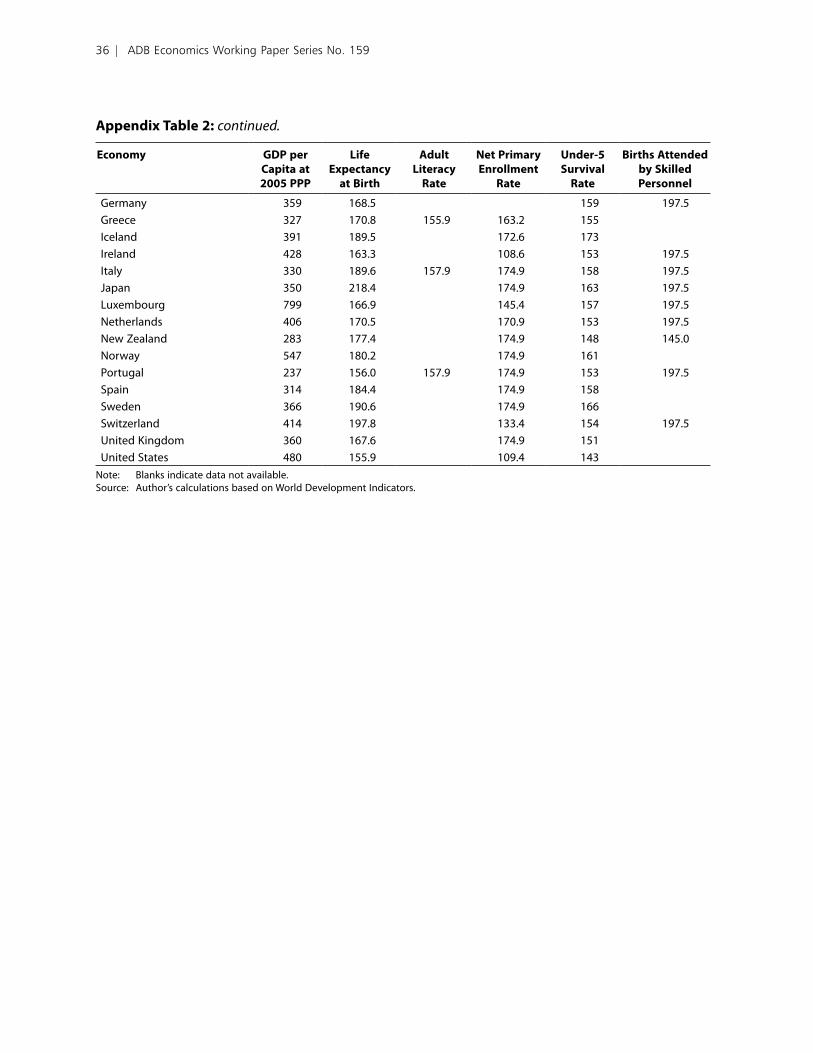
Economy GDP per Capita at 2005 PPP
Life Expectancy
at Birth
Adult Literacy
Rate
Net Primary Enrollment
Rate
Under-5 Survival
Rate
Births Attended by Skilled Personnel
Germany 359 168.5 159 197.5Greece 327 170.8 155.9 163.2 155Iceland 391 189.5 172.6 173Ireland 428 163.3 108.6 153 197.5Italy 330 189.6 157.9 174.9 158 197.5Japan 350 218.4 174.9 163 197.5Luxembourg 799 166.9 145.4 157 197.5Netherlands 406 170.5 170.9 153 197.5New Zealand 283 177.4 174.9 148 145.0Norway 547 180.2 174.9 161Portugal 237 156.0 157.9 174.9 153 197.5Spain 314 184.4 174.9 158Sweden 366 190.6 174.9 166Switzerland 414 197.8 133.4 154 197.5United Kingdom 360 167.6 174.9 151United States 480 155.9 109.4 143
Note: Blanks indicate data not available.Source: Author’s calculations based on World Development Indicators.
Appendix Table 2: continued.
3� | ADB Economics Working Paper Series No. 159
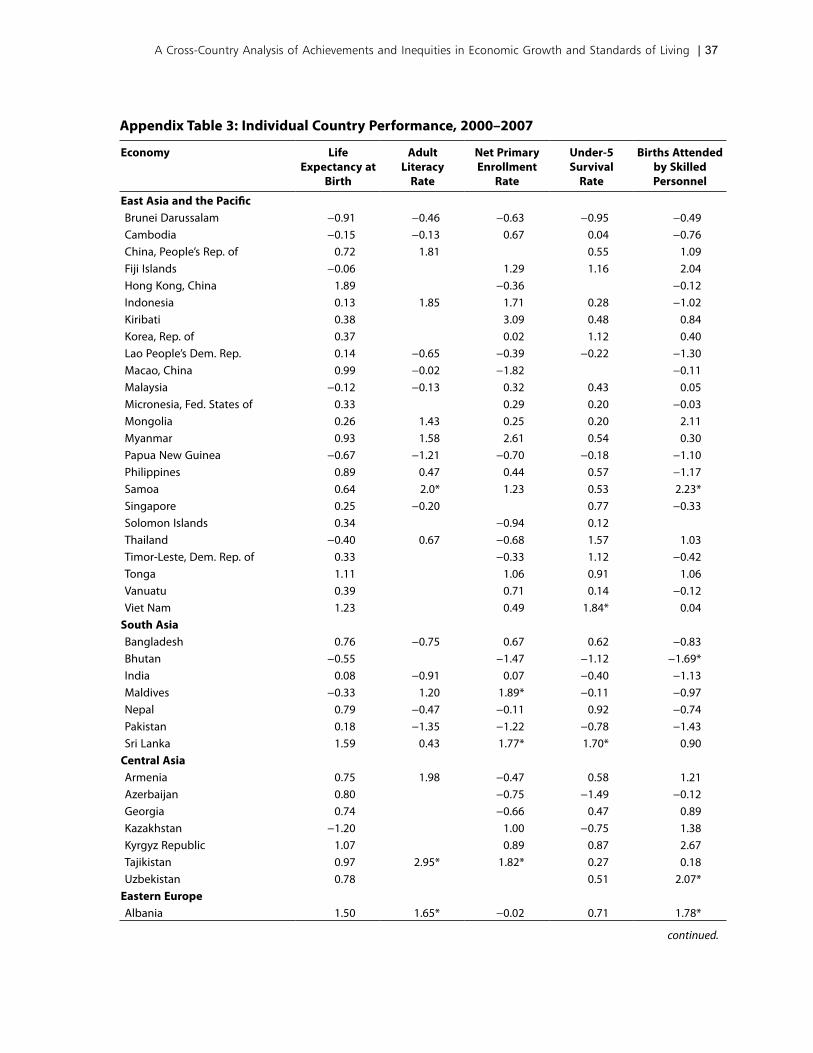
Economy Life Expectancy at
Birth
AdultLiteracy
Rate
Net Primary Enrollment
Rate
Under-5 Survival
Rate
Births Attended by Skilled Personnel
East Asia and the PacificBrunei Darussalam −0.91 −0.46 −0.63 −0.95 −0.49Cambodia −0.15 −0.13 0.67 0.04 −0.76China, People’s Rep. of 0.72 1.81 0.55 1.09Fiji Islands −0.06 1.29 1.16 2.04Hong Kong, China 1.89 −0.36 −0.12Indonesia 0.13 1.85 1.71 0.28 −1.02Kiribati 0.38 3.09 0.48 0.84Korea, Rep. of 0.37 0.02 1.12 0.40Lao People’s Dem. Rep. 0.14 −0.65 −0.39 −0.22 −1.30Macao, China 0.99 −0.02 −1.82 −0.11Malaysia −0.12 −0.13 0.32 0.43 0.05Micronesia, Fed. States of 0.33 0.29 0.20 −0.03Mongolia 0.26 1.43 0.25 0.20 2.11Myanmar 0.93 1.58 2.61 0.54 0.30Papua New Guinea −0.67 −1.21 −0.70 −0.18 −1.10Philippines 0.89 0.47 0.44 0.57 −1.17Samoa 0.64 2.0* 1.23 0.53 2.23*Singapore 0.25 −0.20 0.77 −0.33Solomon Islands 0.34 −0.94 0.12Thailand −0.40 0.67 −0.68 1.57 1.03Timor-Leste, Dem. Rep. of 0.33 −0.33 1.12 −0.42Tonga 1.11 1.06 0.91 1.06Vanuatu 0.39 0.71 0.14 −0.12Viet Nam 1.23 0.49 1.84* 0.04
South AsiaBangladesh 0.76 −0.75 0.67 0.62 −0.83Bhutan −0.55 −1.47 −1.12 −1.69*India 0.08 −0.91 0.07 −0.40 −1.13Maldives −0.33 1.20 1.89* −0.11 −0.97Nepal 0.79 −0.47 −0.11 0.92 −0.74Pakistan 0.18 −1.35 −1.22 −0.78 −1.43Sri Lanka 1.59 0.43 1.77* 1.70* 0.90
Central AsiaArmenia 0.75 1.98 −0.47 0.58 1.21Azerbaijan 0.80 −0.75 −1.49 −0.12Georgia 0.74 −0.66 0.47 0.89Kazakhstan −1.20 1.00 −0.75 1.38Kyrgyz Republic 1.07 0.89 0.87 2.67Tajikistan 0.97 2.95* 1.82* 0.27 0.18Uzbekistan 0.78 0.51 2.07*
Eastern EuropeAlbania 1.50 1.65* −0.02 0.71 1.78*
continued.
Appendix Table 3: Individual Country Performance, 2000–2007
A Cross-Country Analysis of Achievements and Inequities in Economic Growth and Standards of Living | 37
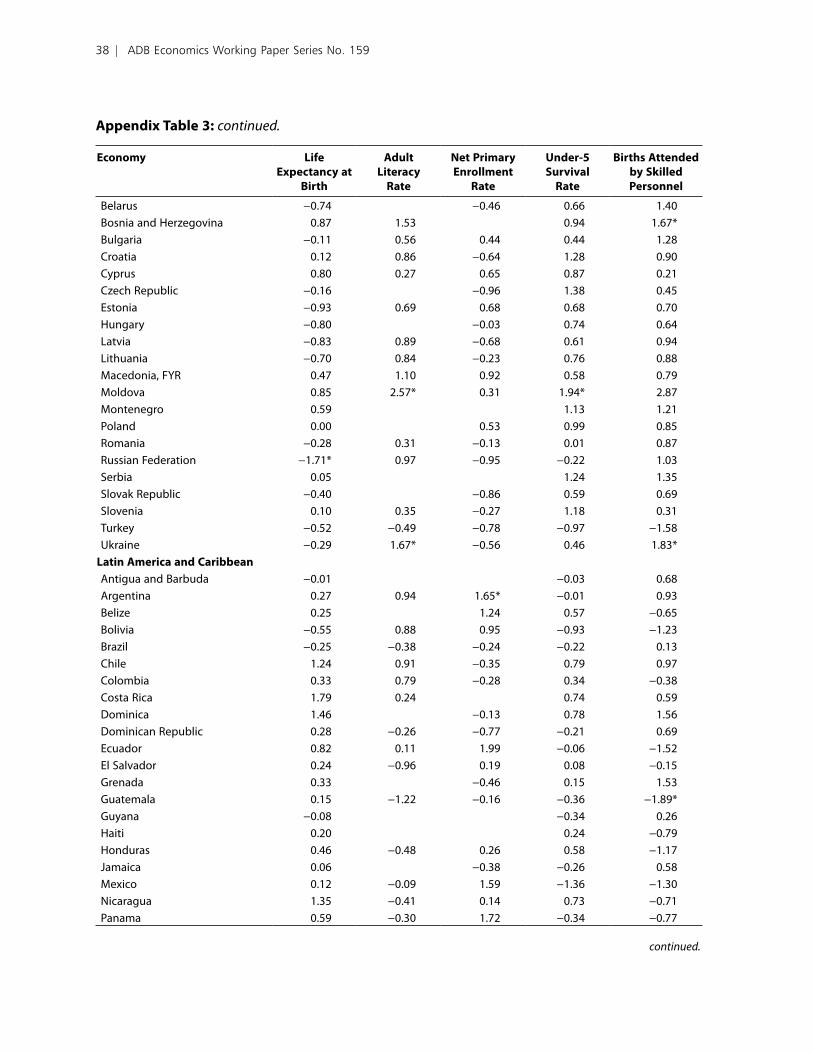
Economy Life Expectancy at
Birth
AdultLiteracy
Rate
Net Primary Enrollment
Rate
Under-5 Survival
Rate
Births Attended by Skilled Personnel
Belarus −0.74 −0.46 0.66 1.40Bosnia and Herzegovina 0.87 1.53 0.94 1.67*Bulgaria −0.11 0.56 0.44 0.44 1.28Croatia 0.12 0.86 −0.64 1.28 0.90Cyprus 0.80 0.27 0.65 0.87 0.21Czech Republic −0.16 −0.96 1.38 0.45Estonia −0.93 0.69 0.68 0.68 0.70Hungary −0.80 −0.03 0.74 0.64Latvia −0.83 0.89 −0.68 0.61 0.94Lithuania −0.70 0.84 −0.23 0.76 0.88Macedonia, FYR 0.47 1.10 0.92 0.58 0.79Moldova 0.85 2.57* 0.31 1.94* 2.87Montenegro 0.59 1.13 1.21Poland 0.00 0.53 0.99 0.85Romania −0.28 0.31 −0.13 0.01 0.87Russian Federation −1.71* 0.97 −0.95 −0.22 1.03Serbia 0.05 1.24 1.35Slovak Republic −0.40 −0.86 0.59 0.69Slovenia 0.10 0.35 −0.27 1.18 0.31Turkey −0.52 −0.49 −0.78 −0.97 −1.58Ukraine −0.29 1.67* −0.56 0.46 1.83*
Latin America and CaribbeanAntigua and Barbuda −0.01 −0.03 0.68Argentina 0.27 0.94 1.65* −0.01 0.93Belize 0.25 1.24 0.57 −0.65Bolivia −0.55 0.88 0.95 −0.93 −1.23Brazil −0.25 −0.38 −0.24 −0.22 0.13Chile 1.24 0.91 −0.35 0.79 0.97Colombia 0.33 0.79 −0.28 0.34 −0.38Costa Rica 1.79 0.24 0.74 0.59Dominica 1.46 −0.13 0.78 1.56Dominican Republic 0.28 −0.26 −0.77 −0.21 0.69Ecuador 0.82 0.11 1.99 −0.06 −1.52El Salvador 0.24 −0.96 0.19 0.08 −0.15Grenada 0.33 −0.46 0.15 1.53Guatemala 0.15 −1.22 −0.16 −0.36 −1.89*Guyana −0.08 −0.34 0.26Haiti 0.20 0.24 −0.79Honduras 0.46 −0.48 0.26 0.58 −1.17Jamaica 0.06 −0.38 −0.26 0.58Mexico 0.12 −0.09 1.59 −1.36 −1.30Nicaragua 1.35 −0.41 0.14 0.73 −0.71Panama 0.59 −0.30 1.72 −0.34 −0.77
Appendix Table 3: continued.
continued.
3� | ADB Economics Working Paper Series No. 159
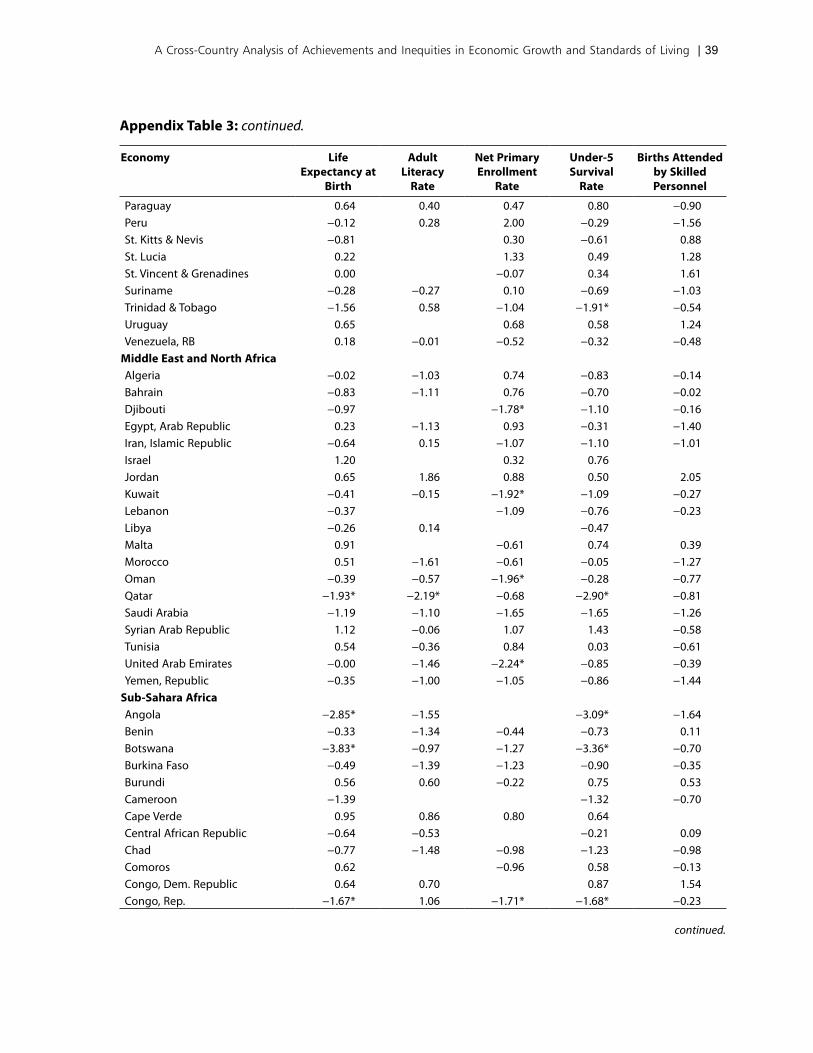
Economy Life Expectancy at
Birth
AdultLiteracy
Rate
Net Primary Enrollment
Rate
Under-5 Survival
Rate
Births Attended by Skilled Personnel
Paraguay 0.64 0.40 0.47 0.80 −0.90Peru −0.12 0.28 2.00 −0.29 −1.56St. Kitts & Nevis −0.81 0.30 −0.61 0.88St. Lucia 0.22 1.33 0.49 1.28St. Vincent & Grenadines 0.00 −0.07 0.34 1.61Suriname −0.28 −0.27 0.10 −0.69 −1.03Trinidad & Tobago −1.56 0.58 −1.04 −1.91* −0.54Uruguay 0.65 0.68 0.58 1.24Venezuela, RB 0.18 −0.01 −0.52 −0.32 −0.48
Middle East and North AfricaAlgeria −0.02 −1.03 0.74 −0.83 −0.14Bahrain −0.83 −1.11 0.76 −0.70 −0.02Djibouti −0.97 −1.78* −1.10 −0.16Egypt, Arab Republic 0.23 −1.13 0.93 −0.31 −1.40Iran, Islamic Republic −0.64 0.15 −1.07 −1.10 −1.01Israel 1.20 0.32 0.76Jordan 0.65 1.86 0.88 0.50 2.05Kuwait −0.41 −0.15 −1.92* −1.09 −0.27Lebanon −0.37 −1.09 −0.76 −0.23Libya −0.26 0.14 −0.47Malta 0.91 −0.61 0.74 0.39Morocco 0.51 −1.61 −0.61 −0.05 −1.27Oman −0.39 −0.57 −1.96* −0.28 −0.77Qatar −1.93* −2.19* −0.68 −2.90* −0.81Saudi Arabia −1.19 −1.10 −1.65 −1.65 −1.26Syrian Arab Republic 1.12 −0.06 1.07 1.43 −0.58Tunisia 0.54 −0.36 0.84 0.03 −0.61United Arab Emirates −0.00 −1.46 −2.24* −0.85 −0.39Yemen, Republic −0.35 −1.00 −1.05 −0.86 −1.44
Sub-Sahara AfricaAngola −2.85* −1.55 −3.09* −1.64Benin −0.33 −1.34 −0.44 −0.73 0.11Botswana −3.83* −0.97 −1.27 −3.36* −0.70Burkina Faso −0.49 −1.39 −1.23 −0.90 −0.35Burundi 0.56 0.60 −0.22 0.75 0.53Cameroon −1.39 −1.32 −0.70Cape Verde 0.95 0.86 0.80 0.64Central African Republic −0.64 −0.53 −0.21 0.09Chad −0.77 −1.48 −0.98 −1.23 −0.98Comoros 0.62 −0.96 0.58 −0.13Congo, Dem. Republic 0.64 0.70 0.87 1.54Congo, Rep. −1.67* 1.06 −1.71* −1.68* −0.23
Appendix Table 3: continued.
continued.
A Cross-Country Analysis of Achievements and Inequities in Economic Growth and Standards of Living | 39
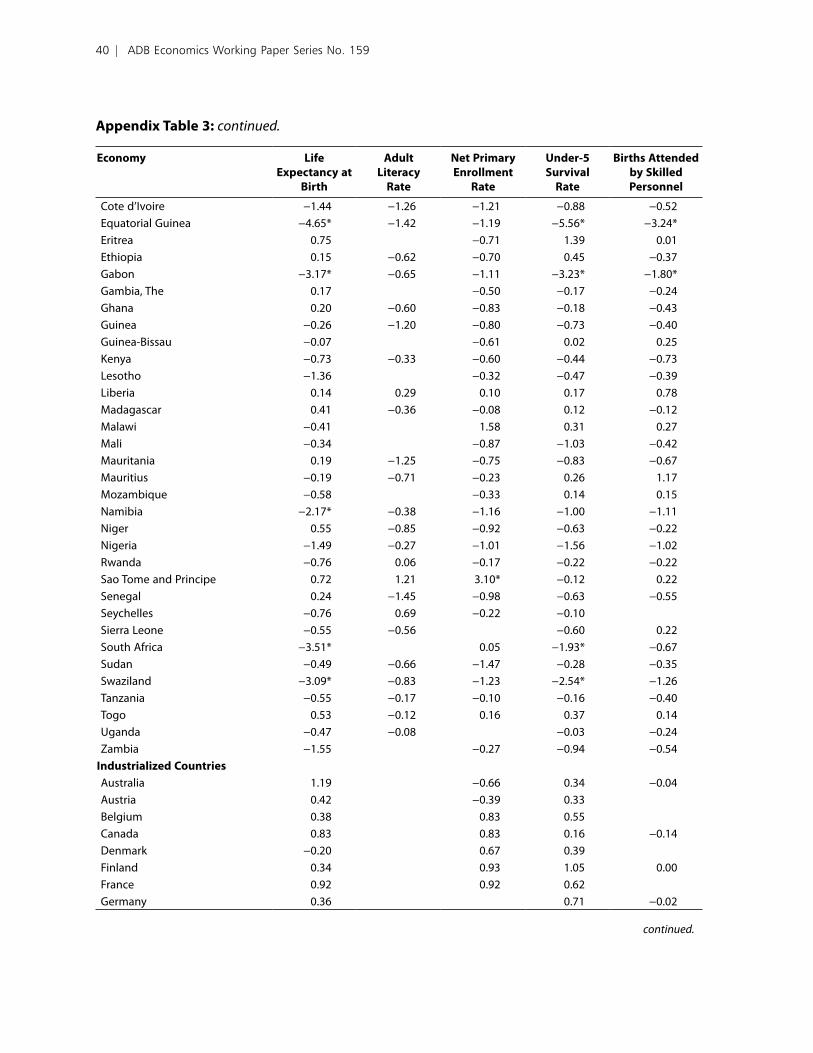
Economy Life Expectancy at
Birth
AdultLiteracy
Rate
Net Primary Enrollment
Rate
Under-5 Survival
Rate
Births Attended by Skilled Personnel
Cote d’Ivoire −1.44 −1.26 −1.21 −0.88 −0.52Equatorial Guinea −4.65* −1.42 −1.19 −5.56* −3.24*Eritrea 0.75 −0.71 1.39 0.01Ethiopia 0.15 −0.62 −0.70 0.45 −0.37Gabon −3.17* −0.65 −1.11 −3.23* −1.80*Gambia, The 0.17 −0.50 −0.17 −0.24Ghana 0.20 −0.60 −0.83 −0.18 −0.43Guinea −0.26 −1.20 −0.80 −0.73 −0.40Guinea-Bissau −0.07 −0.61 0.02 0.25Kenya −0.73 −0.33 −0.60 −0.44 −0.73Lesotho −1.36 −0.32 −0.47 −0.39Liberia 0.14 0.29 0.10 0.17 0.78Madagascar 0.41 −0.36 −0.08 0.12 −0.12Malawi −0.41 1.58 0.31 0.27Mali −0.34 −0.87 −1.03 −0.42Mauritania 0.19 −1.25 −0.75 −0.83 −0.67Mauritius −0.19 −0.71 −0.23 0.26 1.17Mozambique −0.58 −0.33 0.14 0.15Namibia −2.17* −0.38 −1.16 −1.00 −1.11Niger 0.55 −0.85 −0.92 −0.63 −0.22Nigeria −1.49 −0.27 −1.01 −1.56 −1.02Rwanda −0.76 0.06 −0.17 −0.22 −0.22Sao Tome and Principe 0.72 1.21 3.10* −0.12 0.22Senegal 0.24 −1.45 −0.98 −0.63 −0.55Seychelles −0.76 0.69 −0.22 −0.10Sierra Leone −0.55 −0.56 −0.60 0.22South Africa −3.51* 0.05 −1.93* −0.67Sudan −0.49 −0.66 −1.47 −0.28 −0.35Swaziland −3.09* −0.83 −1.23 −2.54* −1.26Tanzania −0.55 −0.17 −0.10 −0.16 −0.40Togo 0.53 −0.12 0.16 0.37 0.14Uganda −0.47 −0.08 −0.03 −0.24Zambia −1.55 −0.27 −0.94 −0.54
Industrialized CountriesAustralia 1.19 −0.66 0.34 −0.04Austria 0.42 −0.39 0.33Belgium 0.38 0.83 0.55Canada 0.83 0.83 0.16 −0.14Denmark −0.20 0.67 0.39Finland 0.34 0.93 1.05 0.00France 0.92 0.92 0.62Germany 0.36 0.71 −0.02
Appendix Table 3: continued.
continued.
�0 | ADB Economics Working Paper Series No. 159
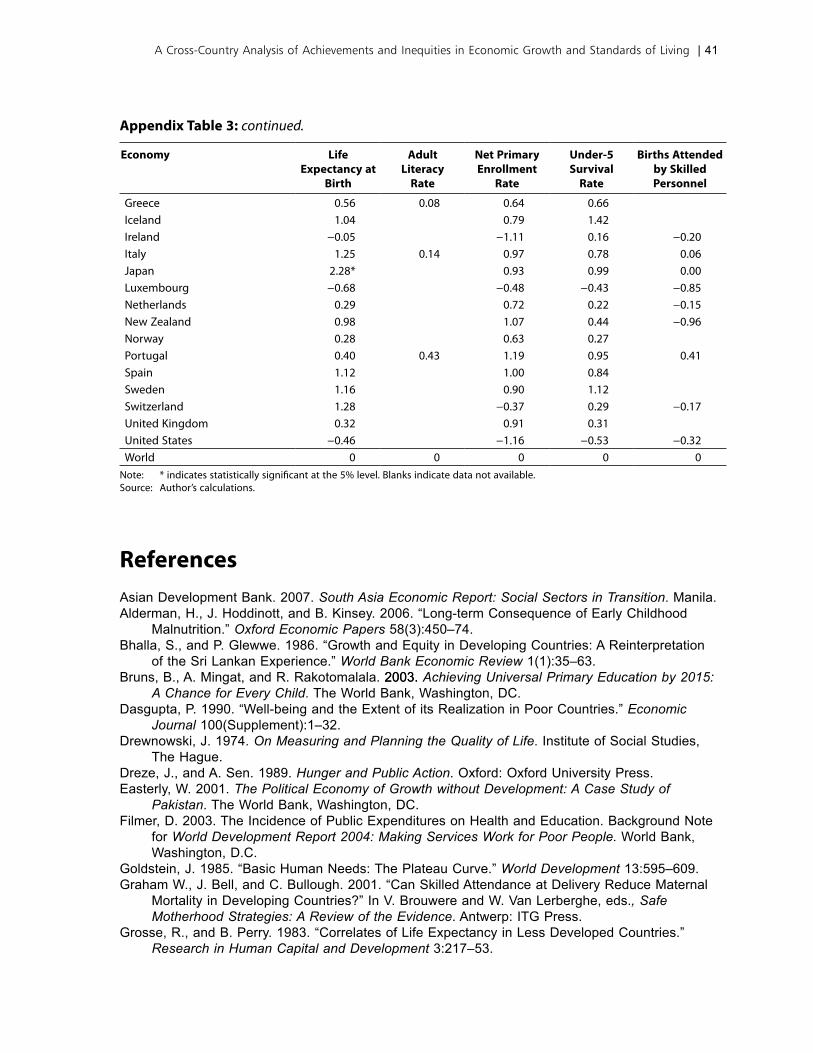
Economy Life Expectancy at
Birth
AdultLiteracy
Rate
Net Primary Enrollment
Rate
Under-5 Survival
Rate
Births Attended by Skilled Personnel
Greece 0.56 0.08 0.64 0.66Iceland 1.04 0.79 1.42Ireland −0.05 −1.11 0.16 −0.20Italy 1.25 0.14 0.97 0.78 0.06Japan 2.28* 0.93 0.99 0.00Luxembourg −0.68 −0.48 −0.43 −0.85Netherlands 0.29 0.72 0.22 −0.15New Zealand 0.98 1.07 0.44 −0.96Norway 0.28 0.63 0.27Portugal 0.40 0.43 1.19 0.95 0.41Spain 1.12 1.00 0.84Sweden 1.16 0.90 1.12Switzerland 1.28 −0.37 0.29 −0.17United Kingdom 0.32 0.91 0.31United States −0.46 −1.16 −0.53 −0.32World 0 0 0 0 0
Note: * indicates statistically significant at the 5% level. Blanks indicate data not available.Source: Author’s calculations.
ReferencesAsian Development Bank. 2007. South Asia Economic Report: Social Sectors in Transition. Manila.Alderman, H., J. Hoddinott, and B. Kinsey. 2006. “Long-term Consequence of Early Childhood
Malnutrition.” Oxford Economic Papers 58(3):450–74.Bhalla, S., and P. Glewwe. 1986. “Growth and Equity in Developing Countries: A Reinterpretation
of the Sri Lankan Experience.” World Bank Economic Review 1(1):35–63.Bruns, B., A. Mingat, and R. Rakotomalala. 2003.2003. Achieving Universal Primary Education by 2015:
A Chance for Every Child. The World Bank, Washington, DC.Dasgupta, P. 1990. “Well-being and the Extent of its Realization in Poor Countries.” Economic
Journal 100(Supplement):1–32.Drewnowski, J. 1974. On Measuring and Planning the Quality of Life. Institute of Social Studies,
The Hague.Dreze, J., and A. Sen. 1989. Hunger and Public Action. Oxford: Oxford University Press. Easterly, W. 2001. The Political Economy of Growth without Development: A Case Study of
Pakistan. The World Bank, Washington, DC.�ilmer, D. 2003. The Incidence of Public Expenditures on Health and Education. Background Note
for World Development Report 2004: Making Services Work for Poor People. World Bank, Washington, D.C.
Goldstein, J. 1985. “Basic Human Needs: The Plateau Curve.” World Development 13:595–609.Graham W., J. Bell, and C. Bullough. 2001. “Can Skilled Attendance at Delivery Reduce Maternal
Mortality in Developing Countries?” In V. Brouwere and W. Van Lerberghe, eds., Safe Motherhood Strategies: A Review of the Evidence. Antwerp: ITG Press.
Grosse, R., and B. Perry. 1983. “Correlates of Life Expectancy in Less Developed Countries.” Research in Human Capital and Development 3:217–53.
Appendix Table 3: continued.
A Cross-Country Analysis of Achievements and Inequities in Economic Growth and Standards of Living | 41
Hicks, N. 1979. “Growth vs. Basic Needs: Is there a Trade-off?” World Development 7:985–94.Hicks, N., and P. Streeten. 1979. “Indicators of Development: The Search for a Basic Needs Yard-
stick.” World Development 7:567–80.Hussain, I. 1999. Pakistan: The Economy of an Elitist State. Karachi: Oxford University Press.Isenman, P. 1980. “Basic Needs: The Case of Sri Lanka”. World Development 8(3):237–58.Kakwani, N. 1993. “Performance in Living Standards.” Journal of Development Economics 41:307–
36.Morris, D. 1979. Measuring the Conditions of the World Poor: The Physical Quality of Life Index.
New York: Pergamon Press.Pyatt, G. 1987. “A Comment on Growth and Equity in Developing Countries: A Reinterpretation of
the Sri Lankan Experience by Bhalla and Glewwe”. World Bank Economic Review 1(3):515–20.
Sen, A. 1973. “On the Development of Basic Economic Indicators to Supplement GNP Measures.” United Nations Economic Bulletin for Asia and the Far East 24.
. 1981. Public Action and the Quality of Life in Developing Countries. Oxford Bulletin of Economics and Statistics 43:287–319.
. 1985. Commodities and Capabilities. Amsterdam: North-Holland.
. 1987. Standard of Living. New York: Cambridge University Press. Sheehan, G., and M. Hopkins. 1979. Basic Needs Performance: An Analysis of Some International
Data. International Labour Organization, Geneva.Streeten, P. 1979. “Basic Needs: Premises and Promises.” Journal of Policy Modelling 1:136–46.Theil, H. 1967. Economics and Information Theory. Amsterdam: North-Holland.UN. 1990. Human Development Report 1990. New York: Oxford University Press for the United
Nations. UNDP. 2007. Human Development Report 2006: Beyond Scarcity: Power, Poverty and the Global
Water Crisis. United Nations Development Programme, New York.UNRISD. 1972. Contents and Measurement of Socio-Economic Development: A Staff Survey. New
York: Praeger for the United Nations Research Institute for Social Development.White, H. 1980. “A Heteroskedasticity—Consistent Covariance Matrix Estimator and a Direct Test
for Heteroskedasticity.” Econometrica 48:817–38.World Bank. 2004. World Development Report 2004: Making Services Work for Poor People.
Washington, DC.. 2008. World Development Indicators 2008. Washington D.C.
World Health Organization. 2008. Maternal Mortality in 2005: Estimates Developed by WHO, UNICEF, UNFPA, and The World Bank. Geneva.
�� | ADB Economics Working Paper Series No. 159
About the Paper
Hyun H. Son compares achievements and inequalities in standards of living across 177 countries over the period 2000–2007. To measure achievement, an achievement index is introduced, which holds the view that an increase in the standard of living of a country when it is already at a high level signifies a greater achievement than that of another country with an equal increase but from a lower base. Moreover, the paper estimates the number of years it will take for different regions and selected Asian countries to catch up with the average standard of living of industrialized countries.
About the Asian Development Bank
ADB’s vision is an Asia and Pacific region free of poverty. Its mission is to help its developing member countries substantially reduce poverty and improve the quality of life of their people. Despite the region’s many successes, it remains home to two thirds of the world’s poor: 1.8 billion people who live on less than $2 a day, with 903 million struggling on less than $1.25 a day. ADB is committed to reducing poverty through inclusive economic growth, environmentally sustainable growth, and regional integration. Based in Manila, ADB is owned by 67 members, including 48 from the region. Its main instruments for helping its developing member countries are policy dialogue, loans, equity investments, guarantees, grants, and technical assistance.
Asian Development Bank6 ADB Avenue, Mandaluyong City1550 Metro Manila, Philippineswww.adb.org/economicsISSN: 1655-5252Publication Stock No.: Printed in the Philippines