a report on health inequities in maharashtra
TRANSCRIPT

A Report on Health Inequities
in Maharashtra
Authors Srijit Mishra Ravi Duggal
Lakshmi Lingam Amita Pitre
Editors
Nilangi Sardeshpande Abhay Shukla
Report prepared by
SATHI For
Maharashtra Health Equity and Rights Watch Implemented in collaboration with
CEHAT & TISS

Published in January 2008 By SATHI-(Support for Advocacy and Training into Health Initiatives) Action Centre of Anusandhan Trust Evolved from CEHAT Flat no. 3 & 4, Aman E Terrace Plot no. 140 Dahanukar Colony Kothrud, Pune 411 029 Tel. : 91-20-25451413 / 25452325 Email: [email protected] Printed at: N. R. Enterprises, Pune. Contribution: Rs. 100/-
Preface
We are happy to present the report on “Health Inequities in Maharashtra’. This is the first in the series to be published under the project ‘Maharashtra Health Equity and Rights Watch’. This study project was undertaken by SATHI and CEHAT to make a small contribution in this emerging field of study of health inequities in India, and with the objective of strengthening advocacy on health rights, in which SATHI has been involved with other organizations, in the People’s Health Movement in India. This report attempts to highlight the socioeconomic inequities, inequities in health status and in access to healthcare amongst various groups based on caste, class, gender and geographic location. It makes use of state level secondary data from various community-based surveys such as National Family Health Survey, National Sample Survey, RCH facility survey, and some of the micro-studies on healthcare access. The subsequent reports will be based on the primary data collected during this study. This study project was conceptualised by Abhay Shukla and Ravi Duggal. SATHI’s work under this project is being executed under Abhay Shukla’s guidance by a team led by Nilangi Sardeshpande. Under his guidance, Nilangi shouldered the responsibility of liaisoning with the authors, giving them feedback, co-ordinating the review by external experts and doing the final round of editing to prepare the press copy..
This report is a product of hard work and collective efforts of several persons. We wish to thank
Amita Pitre, Lakshmi Lingam, Ravi Duggal, Srijit Mishra - the authors, for marshalling their expertise to bring forth the issue of inequities in health and healthcare access, and revising their papers in the light of the comments by the reviewers
Aditi Iyer, Rakhal Gaitonde, Thelma Narayan and Vibhuti Patel for reviewing the papers. Their critical comments have certainly added value to the report.
Leena Gangolli for her contribution in editing of the report Ms. Deepali Yakkundi and Ms. Sharada Mahalle of SATHI for formatting the copy for the press Administrative staff in SATHI for their full co-operation N. R. Enterprises for printing this report in time
Last but not the least, International Development Research Centre (IDRC), Canada for the financial assistance.
We look forward to suggestions from readers for furthering this work.
Dr. Anant Phadke, Co-ordinator, SATHI 26th January, 2008
II
List of Abbreviations ANC - Antenatal Check-up AYUSH - Ayurveda, Yoga and Naturopathy, Unani, Siddha and Homeopathy BE - Budget Estimate BMI - Body Mass Index CEHAT - Centre for Enquiry into Health and Allied Themes EGS - Employment Guarantee Scheme GDI - Gender Development Index GDP - Gross Domestic Product GSDP - Gross State Domestic Product HCR - Head Count Rate HDI - Human Development Index HIV - Human Immunodeficiency Virus ICDS - Integrated Child Development Scheme IMR - Infant Mortality Rate IUD - Intra Uterine Device JSR - Juvenile Sex Ration MCH - Mother and Child Health MDG - Millennium Development Goals MPCE - Monthly Per Capita Expenditure NFHS - National Family Health Survey NSDP - Net State Domestic Product NSSO - National Sample Survey Organisation OBC - Other Backward Castes OPD - Out Patients Department PCPNDT - Pre-conception and Prenatal Diagnostic Technique PHC - Primary Health Centre PID - Pelvic Inflammatory Disease PNC - Post Natal Care RCH - Reproductive and Child Health RGI - Registrar General of India RTI - Reproductive Tract Infections SAP - Structural Adjustment Program SATHI - Support for Advocacy and Training to Health Initiatives SC/ST - Scheduled Castes/ Scheduled Tribes SDP - State Domestic Product SLI - Standard of Living Index SMR - Suicidal Mortality Rate STD/ STI - Sexually Transmitted Diseases/ Sexually Transmitted Infections TE - Triennium Ending TISS - Tata Institute of Social Sciences UNDP - United Nations Development Program WDR - World Development Report WPR - Work Participation Rate

Contents Preface...................................................................................................................................................... …I List of Abbreviations .................................................................................................................................. II List of Tables ............................................................................................................................................ IV Introduction ................................................................................................................................................3 Section I - Socioeconomic Inequities in Maharashtra Srijit Mishra Introduction................................................................................................................................................9 Comparing Socio-economic Indicators......................................................................................................9 Inequities in Income.................................................................................................................................12 Poverty and Inequality .............................................................................................................................14 Inequities in Education.............................................................................................................................17 Human Development Index Across Districts...........................................................................................20 Agrarian Crisis and Farmers’ Suicides ....................................................................................................22
Section II - Inequities in Access to Health Care Ravi Duggal Introduction..............................................................................................................................................29 Rural-Urban Inequities in Health Infrastructure ......................................................................................31 Inequities in Utilization and Expenditure Patterns ..................................................................................35 Caste and Class Inequities........................................................................................................................38 Convergence between Class and Caste as Stratifiers of Inequities..........................................................47
Section III- Inequities in Health Status Ravi Duggal Introduction..............................................................................................................................................57 Morbidity .................................................................................................................................................57 Mortality and Life Expectancy ................................................................................................................61 Class and Caste Differentials in Mortality and Morbidity.......................................................................64 Inequities in Nutritional Status ................................................................................................................66 Class and Caste Inequities in Nutrition Status .........................................................................................69
Section IV- Gender Inequities in Health Access and Outcomes Lakshmi Lingam, Amita Pitre Introduction..............................................................................................................................................75 Gender, Access and Equity ......................................................................................................................75 Gender Equity in Health ..........................................................................................................................76 Horizontal and Vertical Equities..............................................................................................................76 Inequities in Health Determinants............................................................................................................77 Gender Inequities and Health Status........................................................................................................81 Inequities in Health Risks ........................................................................................................................89 Inequities in Access to Health Care .........................................................................................................94
Section V - Conclusions and Policy Recommendations Abhay Shukla
Conclusions............................................................................................................................................115 Policy Recommendations.......................................................................................................................124 Recommendations concerning gender equity in Health: .......................................................................128
IV
List of Tables Section I Socioeconomic Inequities in Maharashtra Table 1 Socio-economic Indicators in Maharashtra, Selected States and India ............................................... 10 Table 2 Share of Population and NSDP across Divisions, 1993-94 and 2004-05............................................ 13 Table 3 Annual Growth Rate of Per capita Income across Divisions in Maharashtra, 1993-94 to 2002-03 (1993-94 Prices).................................................................................................. 13 Table 4 Percentage of Poor and Percentage Points Decline, Maharashtra and India ....................................... 14 Table 5 Gini Coefficient of Consumption Expenditure in Maharashtra and India........................................... 15 Table 6 Head Count Ratio of Poverty by Religion in Maharashtra 2004-05 (%) ............................................ 15 Table 7 Head Count Ratio of Poverty for Unorganized Sector Workers by Industry, Region and Employment Status in Maharashtra and India, 2004-05 (%) ....................................................... 16 Table 8 Head Count Ratio of Poverty by Social Groups, Maharashtra 2004-05 (%) ...................................... 16 Table 9 Incidence of Poverty Across Regions in Maharashtra ........................................................................ 17 Table 10 Trends in Literacy Rate, Maharashtra and India, 1961-2001.............................................................. 18 Table 11 Region Wise and Sex Wise Literacy Rate Across Social Groups, Maharashtra and India, 2001........................................................................................................................................... 18 Table 12 Average Year of Schooling (1999-2000), Maharashtra ...................................................................... 19 Table 13 Education Gini Coefficients (1999-2000), Maharashtra ..................................................................... 19 Table 14 Human Development Index (HDI) for Districts of Maharashtra, 1999-2001 ..................................... 21
List of Figures Figure 1 Sectoral Share in Maharashtra’s NSDP, 1993-94 to 2004-05 (1993-94 prices) ................................ 12 Figure 2 Suicide Mortality Rate (SMR) for Males (Farmers and Non-Farmers) in Maharashtra, 1995-2005................................................................................................................. 22 Figure 3 Suicide Mortality Rate (SMR) for Farmers Across Divisions in Maharashtra, 2001-04 ................... 23
Section II Inequities in Access to Health Care Table 1A Rank of Maharashtra across All States and Union Territories on Selected Human Development Parameters..................................................................................................................... 30 Table 1B Rank of Maharashtra across All states and Union Territories for Selected Health Care
Infrastructure/Indicators ...................................................................................................................... 30 Table 1C Rank of Maharashtra across All States and Union Territories for Access to Selected Healthcare
Services................................................................................................................................................ 30 Table 1D Rank of Maharashtra across All States and Union Territories for Selected Health/ Nutrition Outcomes ............................................................................................................................. 30 Table 2 Maharashtra’s Rank in Selected Health Access Parameters Across Rural and Urban Regions,
2004 ..................................................................................................................................................... 31 Table 3 Health Infrastructure in Maharashtra 1981-2005 ................................................................................ 33 Table 4 Rural-Urban Availability of Doctors and Nurses in Maharashtra....................................................... 34 Table 5 Healthcare Facilities in Mumbai, Rural and Urban Maharashtra by Public and Private Sector .................................................................................................................... 34 Table 6 Availability of Adequate Critical Inputs (Defined as 60% Level of Availability) in Public Health
Facilities in Maharashtra, RCH Facility Survey 1999 and 2004......................................................... 35 Table 7 Utilisation of Public and Private Facilities in Rural and Urban Maharashtra for Outpatient and
Inpatient Care ...................................................................................................................................... 35
Table 8 Percent Using Public Facilities for Various Health Services Across Rural and Urban Areas ............ 36 Table 9 Access to Selected Women and Child Health Services Across Various Stratifiers ............................ 37 Table 10 Differentials Across Various Stratifiers in Access to Public Health Facilities, Hospitalization
Rate and Financial Reason for Not Seeking Treatment Maharashtra 2004......................................... 39 Table 11 Differentials Across Selected Stratifiers in Utilization of Public Facilities and not Seeking Treatment When Ill in Maharashtra, 1996 and 2004....................................................... 39 Table 12 Access to Maternity Services and Average Expenditure by Selected Stratifiers Maharashtra 2004 .. 40 Table 13 Inequities Across Class and Caste on Health Care Expenditures and Borrowings and Sale of Assets, Maharashtra 2004 ....................................................................................................... 40 Table 14 Inequity Index for Access to Various Health Care Services in Maharashtra 2004 ............................. 41 Table 15 Public Expenditure on Healthcare in Maharashtra Ministry of Health and Family Welfare; (revenue + capital) Rs. Million............................................................................................. 43 Table 16 Maharashtra 2001-02 Public Health Expenditures (Rs. Million) Across Rural and Urban Areas......................................................................................................................................... 43 Table 17 Average Out of Pocket Expenditure on Treatment of an Ailment in Outpatient Care and Inpatient
Care Units, Maharashtra 1986-87 and 1995-96 (Figures in Rupees) .................................................. 44 Table 17AAverage out of pocket expenditure for ailments, Maharashtra 2004 NSSO 60th Round 2004 ......................................................................................................................................... 44 Table 18 Outpatient Medical Expenditure by Gender, Social Group and Class (Rupees) ................................ 44 Table 19 Average Medical Expenditure on Inpatient Treatment Across Selected Stratifiers, Maharashtra
1995-96 & 2004................................................................................................................................... 45 Table 20 Percentage Distribution of Total Household Expenditure on Inpatient and Outpatient Care by Source of Finance and by Selected Stratifiers, Maharashtra 2004 ........................................ 46 Table 21 Debt Medical Expenditure Ratio and Debt-Monthly Per Capita Consumer Expenditure Ratio for
Households Incurring Expenditure on Inpatient and Outpatient Treatment, Maharashtra 2004......... 47 Table 22 Caste Differentials in Utilisation of Health Care and Health Expenditure, (A-D) Maharashtra 2004 ................................................................................................................................ 48
Section III Inequities in Health Status Table 1 Number of Persons Reporting Ailment during a Period of 15 Days per 1000 Persons and Number of Persons Hospitalised Per 1000 Population by Fractile-Group of m p c e and Social Group – Maharashtra 1996 ................................................................................... 58 Table 1A OPD Ailments in Last 15 Days Per 1000 Persons Across Selected Stratifiers, Maharashtra 2004 ................................................................................................................................ 59 Table 1B Proportion Reported as Ailing in Last 15 Days, Maharashtra 1995-96 & 2004 ................................. 60 Table 1C Proportion Hospitalized in Last One Year, Maharashtra 1995-96 & 2004 ......................................... 61 Table 2 Trends in Infant Mortality Rate by Residence and Sex, Maharashtra................................................. 62 Table 2A Inequity Ratio for IMR Across Residence and Sex............................................................................. 62 Table 3 Trends in Child Mortality Indicators by Place of Residence Maharashtra (Per 1000 Live Births).......................................................................................................................................... 62 Table 4 District Wise Variations in Infant and Under 5 Mortality Indicators, Maharashtra 1991................... 63 Table 5 Trends in Life Expectancy at Birth by Residence and Sex, Maharashtra ........................................... 64 Table 6 Selected Mortality and Morbidity Indicators Across Caste and Class Groups ................................... 64 Table 7A Caste Wise Differentials in Proportion of Persons Reported as Ailing in Last 15 Days,
Maharashtra 2004 ................................................................................................................................ 65
VI
Table 7B Caste Wise Differentials in Proportion of Persons Hospitalised in Last One Year, Maharashtra 2004 ..................................................................................................................................................... 65
Table 8 Per Thousand Distribution of Persons by Calorie Intake Level for Maharashtra 1983-2000............................................................................................................................................ 66 Table 9 Average Per Capita Intake of Calorie, Protein, and Fat Per Diem for Maharashtra 1972-2000............................................................................................................................................ 66 Table 10 Anaemia Among Women and Men Aged 15-49 Years and Children Under Three Years (6-35 Months) in Maharashtra, 1998-99 and 2005.............................................................................. 67 Table 11 Nutritional Status of Ever Married Women Aged 15-49 Years, 1998-99 and 2005 ........................... 68 Table 12 Nutritional Status of Children Under 3 Years Maharashtra, 1998-99 and 2005 ................................. 68 Table 13 Nutrition Status of Women and Children Across Caste and Class ..................................................... 69 Table 14 Number of Beneficiaries Under Supplementary Nutrition Programme (ICDS) in the Month of March 2001, Maharashtra............................................................................. 70
Section IV Gender inequities in Health Access and Outcomes Table 1 Districts With Highest and Lowest Female Work Participation ......................................................... 79 Table 2 Household Access to Amenities for Select States ............................................................................... 80 Table 3 Gender Differentials in Infant Mortality Rates ................................................................................... 83 Table 4 Under-Nutrition among Children Under 3 Years in Maharashtra....................................................... 84 Table 5 Sex Wise Under-Nutrition Among Children....................................................................................... 84 Table 6 Anaemia among Ever Married Women and Pregnant Women, 2002 ................................................. 87 Table 7 Disparities in Malnutrition among Men and Women, NFHS III......................................................... 88 Table 8 Disparities in Malnutrition and Anaemia in Maharashtra, NFHS II, 1998 ......................................... 89 Table 9 RTI/STI Prevalence and Treatment Seeking....................................................................................... 91 Table 10 Disparities in Maternal Health Care .................................................................................................... 96 Table 11 Proportion of Persons Reported as Ailing in Last 15 Days, Maharashtra 2004.................................. 98 Table 12 Proportion of Persons Reported to be hospitalised in Last 365 Days, by Selected Background Characteristics, Maharashtra 2004 ................................................................... 98 Table 13 Average Medical Expenditure on Outpatient Treatment in Last 15 Days by Selected Background Characteristics, Maharashtra 1995-96 & 2004.......................................... 100 Table 14 Percentage of Untreated Ailments Reported in Last 15 Days by Sex ..................................................... and Quintile Groups, Maharashtra, 2004 .......................................................................................... 101
List of Figures Figure 1 Region wise distribution of Districts by Female Literacy.................................................................. 78 Figure 2 Region-Wise Female Work Participation........................................................................................... 79 Figure 3 Percentage of Women and Men Married Before Legal Age (NFHS) ................................................ 85 Figure 4 Anaemia among Ever-Married Women, Pregnant Women and Ever-Married Men.......................... 87 Figure 5 Disparities in Maternal Health Care ................................................................................................... 97
Section V Conclusions and Policy Recommendations Table 1 Gini coefficient of consumption expenditure in Maharashtra ........................................................... 120 Table 2 Outpatient Medical Expenditure by gender, social group and class (in rupees) .............................. 122 Table 3 Differentials in average medical expenditure on inpatient treatment, Maharashtra 2004................ .122 Table 4 Average medical expenditure per episode of inpatient treatment by selected characteristics, Maharashtra, 2004 .................................................................................................... 123

INTRODUCTION


A Report on Health Inequities in Maharashtra 3
Introduction Nilangi Sardeshpande
Background In recent years, the intensification of socioeconomic inequities in India has become an issue of concern. Globalisation on one hand has accelerated the flow of various goods, money, technology and people across nations but on the other hand it has also led to unequal distribution of the benefits of development, thus increasing the inequities. The lopsided nature of the present globalisation process is apparent from the fast-growing gap between the world’s rich and poor people, who are unevenly distributed between the developed and developing countries. The UN Human Development Report (1999) compares the size of the income of the fifth of the world's
people living in the richest countries and that of the fifth in the poorest. The ratio had changed from 30 to 1 in 1960, to 60 to 1 in 1990 and to 74 to 1 in 1997. The world's 358 richest billionaires have a combined net worth of US $ 760 billion, which is equal to the total assets of the poorest 45% of the world's population. The overall consumption of the richest fifth of the world's people is 160 times that of the poorest fifth. From these figures, it is evident that the current forms of globalisation are making the world a place for unfettered market liberalism with the consequent growth of inequities. These socio-economic inequities are one of the major causes for inequities in health status. In most countries, disparities in health achievements may be found according to class, gender, ethnicity, religion, geographical region, and other such characteristics. Inequities in health are unfair and avoidable differences in health status and access to healthcare for various groups in any society. Inequities in health are a breach of basic principles of justice since they imply inequities in opportunities for people to live and deliver to the fullest of their capacity. The WHO position paper for the 1995 World Summit for Social Development also stated that investment in health is essential for economic growth based on a productive work force. To achieve this, growth needs to be accompanied by more equitable access to the benefits of development, as inequities have severe health consequences and pose an unacceptable threat to human well being and security. In these circumstances, reduction of these disparities becomes the prime responsibility of the Government. The Government is expected to play the role of equalizer to bridge the gaps between different sections of the society. However, often it is seen that lack of redistributive measures by Governments accentuates these inequities. The economy of India, when measured in USD exchange-rate terms, is the twelfth largest in the world, with a GDP of US $1.09 trillion (2007). India is the second fastest growing major economy in the world, with a GDP growth rate of 9.4% for the fiscal year 2006–2007. However, despite this commendable economic growth the health indicators for the country are not commensurate with this economic growth. Widening of gaps between the richest and the poorest of the society is a resultant of lack of effective redistributive policy.
A Report on Health Inequities in Maharashtra 4
These disparities have been widening rapidly since the 1990s, as the Structural Adjustment Program (SAP) and larger neo-liberal policies have led to reduction in employment and investment in the social sectors and have removed protection to local industries and labour regulations. It is the prime duty of the Government to allocate adequate budgets and ensure provision of basic determinants of health such as food, water, education and good quality health services to all sections of society. However, in India, in the post liberalisation period, Governments seem to be renouncing this responsibility. Integration with the global market is generating uncertainties and economic dislocation for vulnerable groups. In the last decade, thousands of farmers have committed suicides in states like Andhra Pradesh and Maharashtra due to such flawed policies. In this situation, social groups that are already marginalized like the dalits, tribals and women suffer the most. The effects of these policies are also evident in health sector. Due to declining investments in the public health sector, the quality of health services has been deteriorating. The obvious consequence is the burgeoning of unregulated private health services. Thus healthcare services are increasingly becoming an expensive commodity, available only to those who can afford it.
About the Project At the present juncture, it becomes imperative to study the inequities in access to health care in a more systematic manner. Thus, SATHI (Support for Advocacy and training into Health Initiatives) in collaboration with CEHAT (Centre for Enquiry into Health and Allied Themes) and TISS (Tata Institute of Social Sciences) has undertaken a project, “Maharashtra Health Equity and Rights Watch” to study inequities in health status and access to healthcare services across various groups based on caste, class and geographic location. A household survey in 10 select districts of Maharashtra to study the inequities in access to healthcare, survey of public health facilities accessed by the residents of studied villages and in-depth studies to study access to healthcare for specific marginalized groups are the primary research activities of this project. Along with primary research, analyzing secondary data and state and district budgets with an equity lens are other important activities of this project.
Structure of the Report The basic premise for undertaking this secondary data analysis is that post 1990s, due to adoption of neo-liberal globalisation as the development framework, the gap between the rich and poor is growing in every sphere of life. The wide gap in the availability of resources with different sections of the society has an obvious impact on health status of these sections, which is evident from the increasing health status inequities. The report attempts to study this through analysis of data pertaining to Maharashtra from the large community level surveys such as NFHS, NSS and RCH facility survey. Detailed analysis of inequities in health determinants would certainly have been desirable for holistic understanding of the issue of inequities in health. However in this report we have decided to focus on inequities in access to healthcare and health status. To address this gap to some extent, we are planning to bring out a separate report on nutritional inequities in Maharashtra
A Report on Health Inequities in Maharashtra 5
The first paper in the report is about socioeconomic inequities in Maharashtra. This paper explores inequities in the state of Maharashtra across regions as well as sub-groups of population in the indicators of income, poverty and educational attainment among others. The paper tries to establish that though Maharashtra is among the richer states in India, this has not adequately translated into poverty alleviation. It takes review of declining share of agriculture sector in the state’s economy. This paper also briefly traces the increasing incidence of farmers’ suicides from a socio-economic as well as public health perspective. The second chapter in the report delineates inequities in access to health care. This chapter gives state level information about various health services related indicators and rank of Maharashtra across all states and union territories for access to selected healthcare services, selected health/nutrition outcomes. The chapter tries to demonstrate the inequities in health infrastructure of Maharashtra and inequities in utilization of health care services and expenditure on health care in Maharashtra. This next chapter deals with inequities in health status. This chapter gives information about inequities in morbidity, infant mortality, child mortality and life expectancy across various stratifiers such as caste, class, gender and geographical distribution. The chapter also talks about inequities in nutritional status especially in case of women and children. Even though gender differnetials have been highlighted throughout the report,considering the uniqueness of gender as a stratifier which operates within each household, there is a special chapter dedicated to study of gender and health and healthcare access inequities. This chapter attempts to underscore horizontal and vertical inequities faced by women. Besides these two types of inequities faced by women, the chapter discusses the third unique inequity that women face, which is the additional health risk posed to them by violence of different kinds in society. The report ends by giving a summary of the findings of this secondary data analysis. Time trends regarding inequities and convergence of inequities are also explored. In addition, policy recommendations to achieve more equitable healthcare delivery and health outcomes have been put forth. This is the first report of this series and we are committed to bring out a sequence of such reports in the coming year, focusing on various dimensions of inequities in health.


A Report on Health Inequities in Maharashtra 7
SECTION I SOCIOECONOMIC INEQUITIES
IN MAHARASHTRA

A Report on Health Inequities in Maharashtra 9
Socio-economic Inequities in Maharashtra Srijit Mishra
Introduction Maharashtra throws a number of paradoxes. It is among the richest states of India, but head count ratio of poverty has remained around the national average. In 2004-05 current prices, per capita net state domestic product (NSDP) of Rs.32,170 was lower only to Haryana among major states and its gross state domestic product (GSDP) of Rs.371,877 crore was 12 per cent of the gross domestic product of India. Mumbai, the state’s capital city is considered to be the commercial and financial capital of India and said to contribute more than one-third of the country’s direct tax. Head count poverty estimate in 2004-05 at 31 per cent for the state is higher than the national average of 28 per cent. The state can boast of entrepreneurial farmers growing Alphonso mangoes, grapes, onions, oranges and sugarcane among other crops, yet in some regions like western Vidarbha there is a high incidence of farmers’ suicides. The first lady doctor to graduate in western medicine as also the first woman President of India hail from this state and its infant mortality rate (IMR) of 36 per 1000 live births in 2005 is much lower than the national average of 58, but the child sex ratio of 913 is among the lowest across states and a matter of serious concern. What is more, the child sex ratio is lower in urban areas (908) and in the economically better-off region of Western Maharashtra. In this current exercise we further delve into the temporal and spatial patterns of some socio-economic inequities in Maharashtra. This would serve as a background to the larger exercise on health inequities in the state. Before doing that, section 2 provides some broad indicators of Maharashtra along with other selected states and that of India. Sections 3-5 will look into trends in income, poverty and education respectively in the state. Section 6 provides an updated Human Development Index (HDI) for districts of Maharashtra. Section 7 gives a brief outline of the agrarian scenario in the state with a special emphasis on farmers’ suicides, an aspect that is not only relevant from a socio-economic perspective but also from a public health perspective. Concluding remarks have been given in section 8.
Comparing Socio-economic Indicators In terms of area and population, Maharashtra is a large entity – it constitutes a little less than one-tenth of the country’s share on both counts. Its population density is lower than that of India. It is difficult to bring in a comparable state of similar size. As the purpose of the current exercise is to provide some background information on health inequities, we select states based on our common knowledge on health indicators – the relatively better off Kerala and Tamil Nadu and the relatively worse off Bihar and Orissa as also the all India average.

A Report on Health Inequities in Maharashtra 10
Table 1 Socio-economic Indicators in Maharashtra, Selected States and India
Indicators KeralaTamil Nadu
Bihar Orissa Maha-rashtra
India
Geographical Area (Lakh sq.km.) 0.4 1.3 0.9 1.6 3.1 32.9Total Population, 2001 (Million) 31.8 62.4 83.0 36.8 96.9 1028.6Population Density, 2001 (Persons per sq.km.) 819 478 880 236 314 324Decadal Increase in Population, 1991-2001 (%) 9.4 11.2 28.4 15.9 22.6 21.3Urban Population, 2001 (%) 26.0 43.9 10.5 15.0 42.4 27.8Literacy Rate, 7+Years, 2001 (%) 90.9 73.5 47.0 63.1 77.3 65.4Gender Gap in Literacy, 2001 (%Age Points) 6.5 18.0 26.6 24.8 18.8 21.7Life Expectancy, Male, 2006-2010 (Years) # 70.8 64.2 61.4 58.4 66.8 64.1Life Expectancy, Female, 1998-2010 (Years) # 75.9 66.3 59.5 58.5 69.8 65.4Birth Rate, 2005 (Per ‘000 Persons) 15.0 16.5 30.4 22.3 19.0 23.8Death Rate, 2005 (Per ‘000 Persons) 6.4 7.4 8.1 9.5 6.7 7.6IMR, Persons, 2005 (Per ‘000 live Births) 14 3.7 61 75 36 58IMR, Urban Male, 2005 (Per ‘000 Live Births) 11 30 45 37 25 37IMR, Rural Female, 2005 (Per ‘000 Live Births) 16 40 63 79 42 66Sex Ratio, 2001 (Females Per ‘000 Males) 1058 987 919 972 922 933Sex Ratio, 0-6, 2001 (Females Per ‘000 Males) 960 942 942 953 913 927Per Capita NSDP, 2004-05 (Rs)@ 27048 25965 5772 13601 32170 23222Share of Agriculture in GSDP, 2004-05 (%) @ 12.9 10.7 31.9 26.4 9.9 17.6Total Workers, 2001 (%) 32.3 44.7 33.7 38.8 42.5 39.1Cultivators in Workers, 2001 (%) 7.0 7.8 29.3 29.8 28.7 31.7Agricultural Labourers in Workers, 2001 (%) 15.8 13.9 48.0 35.0 26.3 26.5Proportion BPL, Persons, 2004-05 (%) † 15.0 22.5 41.4 46.4 30.7 27.5Proportion BPL, Rural, 2004-05 (%) † 13.2 22.8 42.1 46.8 29.6 22.9Proportion BPL, Urban, 2004-05 (%) † 20.2 22.2 34.6 44.3 32.2 22.2Stunted (<-2SD), 0-4 Years, 2005-06 24.5 30.9 55.6 45.0 46.3 48.0Wasted (<-2SD), 0-4 Years, 2005-06 15.9 22.2 27.1 19.5 16.5 19.8Underweight (-2SD), 0-4 Years, 2005-06 22.9 29.8 55.9 40.7 37.0 42.5BMI <18.5 Kg/m2, 15-49 Years Male, 2005-06 18.0 18.4 45.1 41.4 36.2 35.6BMI >25.0 Kg/m2, 15-49 Years Male, 2005-06 28.1 20.9 4.6 6.6 14.5 12.6BMI <18.5 Kg/m2, 15-49 Years Female, 2005-06 21.5 27.1 35.3 37.5 33.5 34.2BMI >25.0 Kg/m2, 15-49 Years Female, 2005-06 17.8 14.5 6.3 6.0 11.9 9.3Scheduled Castes, 2001 (%) 9.8 19.0 15.7 16.5 10.2 16.2Scheduled Tribes, 2001 (%) 1.1 1.0 0.9 22.1 8.9 8.2Human Development Index, Value, 2001 0.64 0.53 0.37 0.40 0.52 0.47Human Development Index, Rank, 2001§ 1 3 15 11 4 -Note: Census information at the all India level excludes Mao-marum, Paomata and Purul sub-divisions of Senapati district in Mizoram. # Life Expectancy at birth. @ Provisional estimates in current prices for the year 2004-05; NSDP=Net state domestic product and GSDP=Gross state domestic product. † Proportion Below Poverty Line (BPL) is based on official estimates using uniform recall method calculated from National Sample Survey by the Planning Commission. § Human Development Index ranks are across 15 major states. Stunted, wasted and underweight refer to below two units of standard deviation from the median of the international reference population 2006 with regard to height-for-age, weight-for-height and weight-for-age respectively. BMI denotes body mass index where <18.5 Kg/m2 and >25.0 Kg/m2 indicate thin and fat individuals respectively. The former (latter) are identified as greater risk factors for communicable (non-communicable) diseases. Source: Census of India, 2001; Economic Survey 2005-06, Government of India; Economic Survey of Maharashtra 2006-07; National Family Health Survey (NFHS-3), 2005-06, India, Volume I; SRS Bulletin, October 2006, http://www.censusindia.net (accessed 23 May 2007); http://www.indiastat.com (accessed 8 Feb 2007) and http://pib.nic.in/archieve/others/2007/mar07/2007032102.xls (accessed 22 May 2007).
A Report on Health Inequities in Maharashtra 11
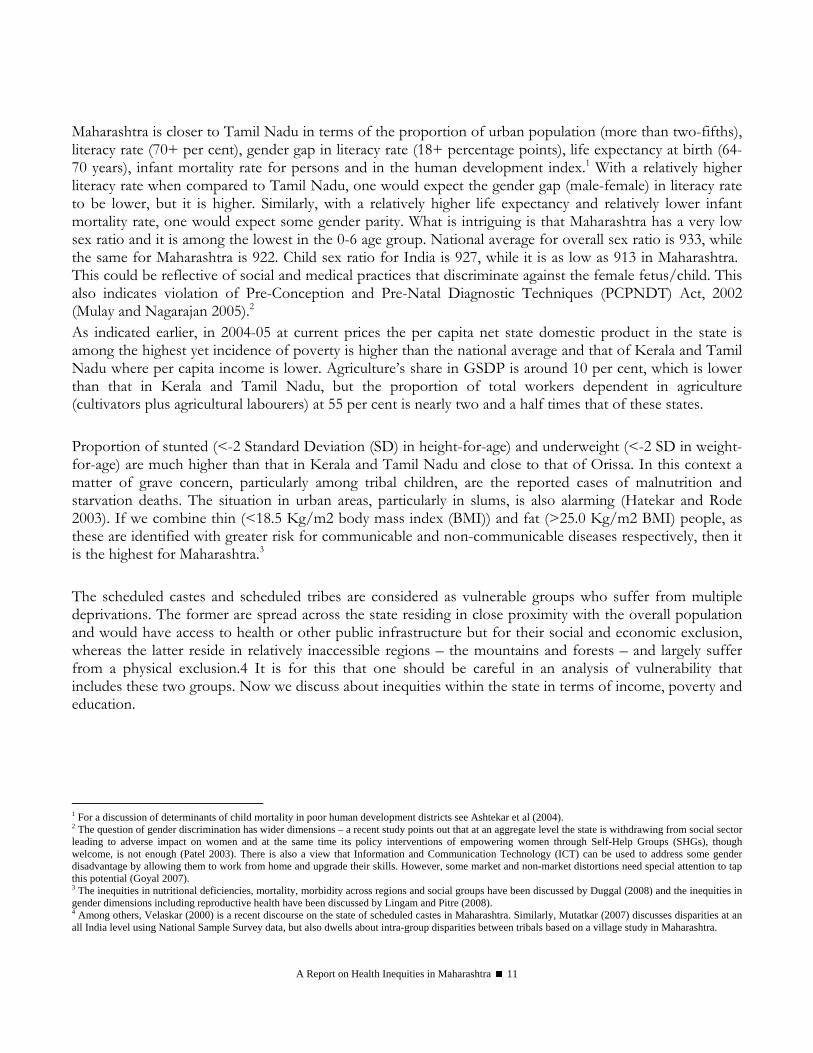
Maharashtra is closer to Tamil Nadu in terms of the proportion of urban population (more than two-fifths), literacy rate (70+ per cent), gender gap in literacy rate (18+ percentage points), life expectancy at birth (64-70 years), infant mortality rate for persons and in the human development index.1 With a relatively higher literacy rate when compared to Tamil Nadu, one would expect the gender gap (male-female) in literacy rate to be lower, but it is higher. Similarly, with a relatively higher life expectancy and relatively lower infant mortality rate, one would expect some gender parity. What is intriguing is that Maharashtra has a very low sex ratio and it is among the lowest in the 0-6 age group. National average for overall sex ratio is 933, while the same for Maharashtra is 922. Child sex ratio for India is 927, while it is as low as 913 in Maharashtra. This could be reflective of social and medical practices that discriminate against the female fetus/child. This also indicates violation of Pre-Conception and Pre-Natal Diagnostic Techniques (PCPNDT) Act, 2002 (Mulay and Nagarajan 2005).2 As indicated earlier, in 2004-05 at current prices the per capita net state domestic product in the state is among the highest yet incidence of poverty is higher than the national average and that of Kerala and Tamil Nadu where per capita income is lower. Agriculture’s share in GSDP is around 10 per cent, which is lower than that in Kerala and Tamil Nadu, but the proportion of total workers dependent in agriculture (cultivators plus agricultural labourers) at 55 per cent is nearly two and a half times that of these states. Proportion of stunted (<-2 Standard Deviation (SD) in height-for-age) and underweight (<-2 SD in weight-for-age) are much higher than that in Kerala and Tamil Nadu and close to that of Orissa. In this context a matter of grave concern, particularly among tribal children, are the reported cases of malnutrition and starvation deaths. The situation in urban areas, particularly in slums, is also alarming (Hatekar and Rode 2003). If we combine thin (<18.5 Kg/m2 body mass index (BMI)) and fat (>25.0 Kg/m2 BMI) people, as these are identified with greater risk for communicable and non-communicable diseases respectively, then it is the highest for Maharashtra.3 The scheduled castes and scheduled tribes are considered as vulnerable groups who suffer from multiple deprivations. The former are spread across the state residing in close proximity with the overall population and would have access to health or other public infrastructure but for their social and economic exclusion, whereas the latter reside in relatively inaccessible regions – the mountains and forests – and largely suffer from a physical exclusion.4 It is for this that one should be careful in an analysis of vulnerability that includes these two groups. Now we discuss about inequities within the state in terms of income, poverty and education.
1 For a discussion of determinants of child mortality in poor human development districts see Ashtekar et al (2004). 2 The question of gender discrimination has wider dimensions – a recent study points out that at an aggregate level the state is withdrawing from social sector leading to adverse impact on women and at the same time its policy interventions of empowering women through Self-Help Groups (SHGs), though welcome, is not enough (Patel 2003). There is also a view that Information and Communication Technology (ICT) can be used to address some gender disadvantage by allowing them to work from home and upgrade their skills. However, some market and non-market distortions need special attention to tap this potential (Goyal 2007). 3 The inequities in nutritional deficiencies, mortality, morbidity across regions and social groups have been discussed by Duggal (2008) and the inequities in gender dimensions including reproductive health have been discussed by Lingam and Pitre (2008). 4 Among others, Velaskar (2000) is a recent discourse on the state of scheduled castes in Maharashtra. Similarly, Mutatkar (2007) discusses disparities at an all India level using National Sample Survey data, but also dwells about intra-group disparities between tribals based on a village study in Maharashtra.
A Report on Health Inequities in Maharashtra 12
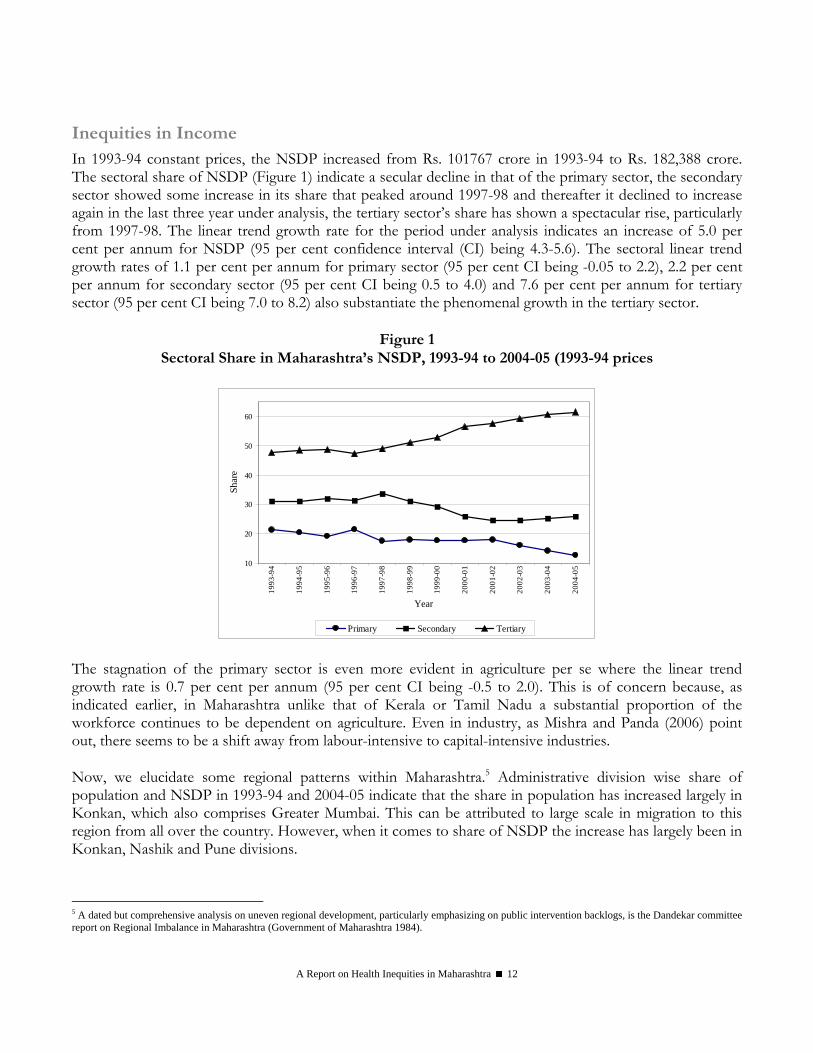
Inequities in Income In 1993-94 constant prices, the NSDP increased from Rs. 101767 crore in 1993-94 to Rs. 182,388 crore. The sectoral share of NSDP (Figure 1) indicate a secular decline in that of the primary sector, the secondary sector showed some increase in its share that peaked around 1997-98 and thereafter it declined to increase again in the last three year under analysis, the tertiary sector’s share has shown a spectacular rise, particularly from 1997-98. The linear trend growth rate for the period under analysis indicates an increase of 5.0 per cent per annum for NSDP (95 per cent confidence interval (CI) being 4.3-5.6). The sectoral linear trend growth rates of 1.1 per cent per annum for primary sector (95 per cent CI being -0.05 to 2.2), 2.2 per cent per annum for secondary sector (95 per cent CI being 0.5 to 4.0) and 7.6 per cent per annum for tertiary sector (95 per cent CI being 7.0 to 8.2) also substantiate the phenomenal growth in the tertiary sector.
Figure 1
Sectoral Share in Maharashtra’s NSDP, 1993-94 to 2004-05 (1993-94 prices
10
20
30
40
50
60
1993
-94
1994
-95
1995
-96
1996
-97
1997
-98
1998
-99
1999
-00
2000
-01
2001
-02
2002
-03
2003
-04
2004
-05
Year
Shar
e
Primary Secondary Tertiary The stagnation of the primary sector is even more evident in agriculture per se where the linear trend growth rate is 0.7 per cent per annum (95 per cent CI being -0.5 to 2.0). This is of concern because, as indicated earlier, in Maharashtra unlike that of Kerala or Tamil Nadu a substantial proportion of the workforce continues to be dependent on agriculture. Even in industry, as Mishra and Panda (2006) point out, there seems to be a shift away from labour-intensive to capital-intensive industries. Now, we elucidate some regional patterns within Maharashtra.5 Administrative division wise share of population and NSDP in 1993-94 and 2004-05 indicate that the share in population has increased largely in Konkan, which also comprises Greater Mumbai. This can be attributed to large scale in migration to this region from all over the country. However, when it comes to share of NSDP the increase has largely been in Konkan, Nashik and Pune divisions.
5 A dated but comprehensive analysis on uneven regional development, particularly emphasizing on public intervention backlogs, is the Dandekar committee report on Regional Imbalance in Maharashtra (Government of Maharashtra 1984).
A Report on Health Inequities in Maharashtra 13
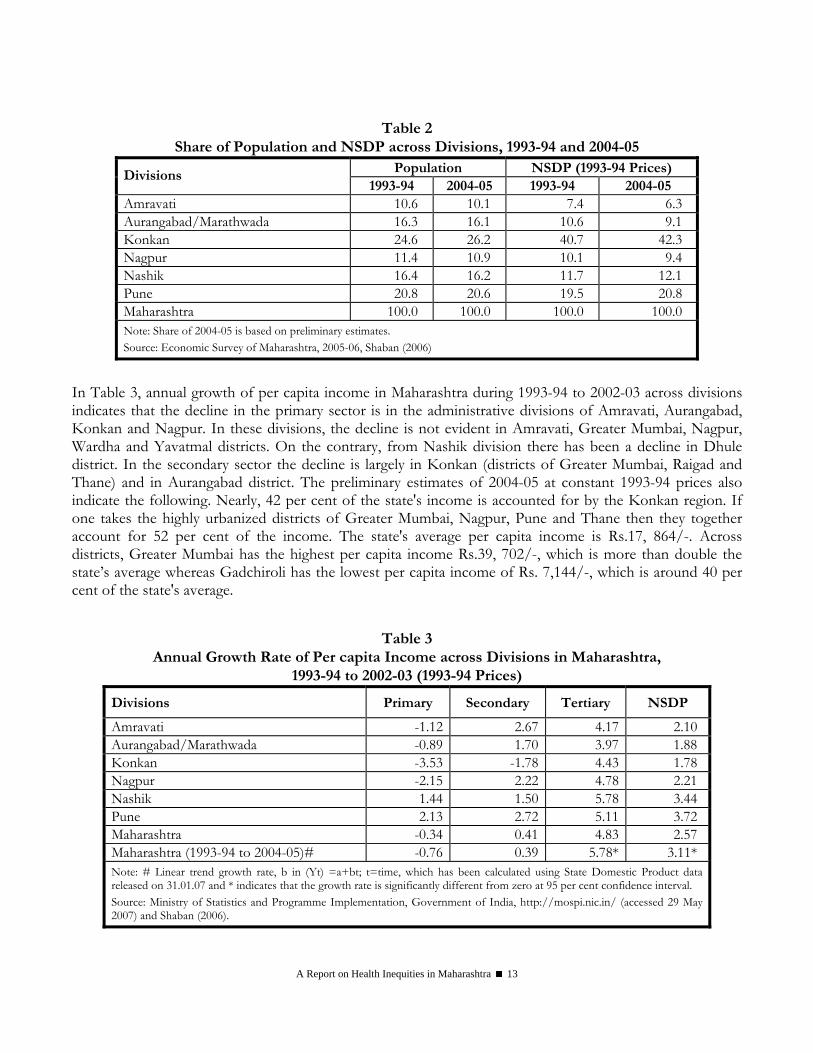
Table 2 Share of Population and NSDP across Divisions, 1993-94 and 2004-05
Population NSDP (1993-94 Prices) Divisions 1993-94 2004-05 1993-94 2004-05
Amravati 10.6 10.1 7.4 6.3 Aurangabad/Marathwada 16.3 16.1 10.6 9.1 Konkan 24.6 26.2 40.7 42.3 Nagpur 11.4 10.9 10.1 9.4 Nashik 16.4 16.2 11.7 12.1 Pune 20.8 20.6 19.5 20.8 Maharashtra 100.0 100.0 100.0 100.0 Note: Share of 2004-05 is based on preliminary estimates. Source: Economic Survey of Maharashtra, 2005-06, Shaban (2006)
In Table 3, annual growth of per capita income in Maharashtra during 1993-94 to 2002-03 across divisions indicates that the decline in the primary sector is in the administrative divisions of Amravati, Aurangabad, Konkan and Nagpur. In these divisions, the decline is not evident in Amravati, Greater Mumbai, Nagpur, Wardha and Yavatmal districts. On the contrary, from Nashik division there has been a decline in Dhule district. In the secondary sector the decline is largely in Konkan (districts of Greater Mumbai, Raigad and Thane) and in Aurangabad district. The preliminary estimates of 2004-05 at constant 1993-94 prices also indicate the following. Nearly, 42 per cent of the state's income is accounted for by the Konkan region. If one takes the highly urbanized districts of Greater Mumbai, Nagpur, Pune and Thane then they together account for 52 per cent of the income. The state's average per capita income is Rs.17, 864/-. Across districts, Greater Mumbai has the highest per capita income Rs.39, 702/-, which is more than double the state’s average whereas Gadchiroli has the lowest per capita income of Rs. 7,144/-, which is around 40 per cent of the state's average.
Table 3 Annual Growth Rate of Per capita Income across Divisions in Maharashtra,
1993-94 to 2002-03 (1993-94 Prices)
Divisions Primary Secondary Tertiary NSDP
Amravati -1.12 2.67 4.17 2.10 Aurangabad/Marathwada -0.89 1.70 3.97 1.88 Konkan -3.53 -1.78 4.43 1.78 Nagpur -2.15 2.22 4.78 2.21 Nashik 1.44 1.50 5.78 3.44 Pune 2.13 2.72 5.11 3.72 Maharashtra -0.34 0.41 4.83 2.57 Maharashtra (1993-94 to 2004-05)# -0.76 0.39 5.78* 3.11* Note: # Linear trend growth rate, b in (Yt) =a+bt; t=time, which has been calculated using State Domestic Product data released on 31.01.07 and * indicates that the growth rate is significantly different from zero at 95 per cent confidence interval. Source: Ministry of Statistics and Programme Implementation, Government of India, http://mospi.nic.in/ (accessed 29 May 2007) and Shaban (2006).
A Report on Health Inequities in Maharashtra 14
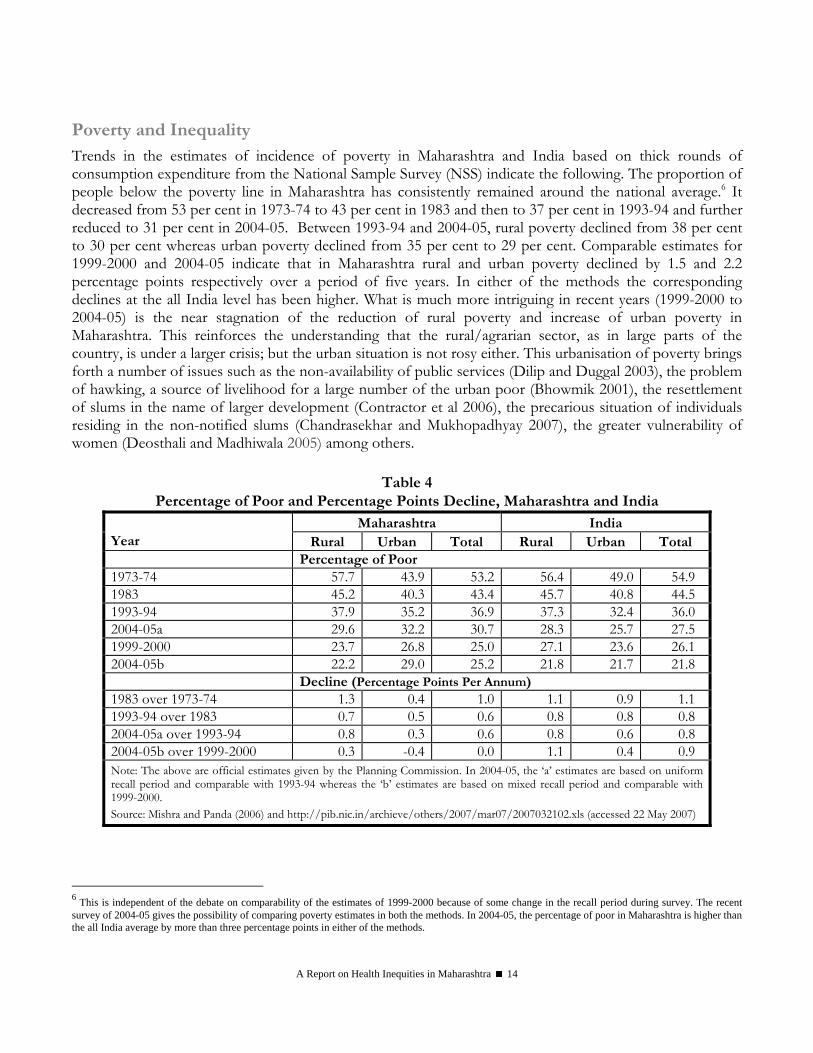
Poverty and Inequality Trends in the estimates of incidence of poverty in Maharashtra and India based on thick rounds of consumption expenditure from the National Sample Survey (NSS) indicate the following. The proportion of people below the poverty line in Maharashtra has consistently remained around the national average.6 It decreased from 53 per cent in 1973-74 to 43 per cent in 1983 and then to 37 per cent in 1993-94 and further reduced to 31 per cent in 2004-05. Between 1993-94 and 2004-05, rural poverty declined from 38 per cent to 30 per cent whereas urban poverty declined from 35 per cent to 29 per cent. Comparable estimates for 1999-2000 and 2004-05 indicate that in Maharashtra rural and urban poverty declined by 1.5 and 2.2 percentage points respectively over a period of five years. In either of the methods the corresponding declines at the all India level has been higher. What is much more intriguing in recent years (1999-2000 to 2004-05) is the near stagnation of the reduction of rural poverty and increase of urban poverty in Maharashtra. This reinforces the understanding that the rural/agrarian sector, as in large parts of the country, is under a larger crisis; but the urban situation is not rosy either. This urbanisation of poverty brings forth a number of issues such as the non-availability of public services (Dilip and Duggal 2003), the problem of hawking, a source of livelihood for a large number of the urban poor (Bhowmik 2001), the resettlement of slums in the name of larger development (Contractor et al 2006), the precarious situation of individuals residing in the non-notified slums (Chandrasekhar and Mukhopadhyay 2007), the greater vulnerability of women (Deosthali and Madhiwala 2005) among others.
Table 4
Percentage of Poor and Percentage Points Decline, Maharashtra and India Maharashtra India
Year Rural Urban Total Rural Urban Total Percentage of Poor 1973-74 57.7 43.9 53.2 56.4 49.0 54.9 1983 45.2 40.3 43.4 45.7 40.8 44.5 1993-94 37.9 35.2 36.9 37.3 32.4 36.0 2004-05a 29.6 32.2 30.7 28.3 25.7 27.5 1999-2000 23.7 26.8 25.0 27.1 23.6 26.1 2004-05b 22.2 29.0 25.2 21.8 21.7 21.8 Decline (Percentage Points Per Annum) 1983 over 1973-74 1.3 0.4 1.0 1.1 0.9 1.1 1993-94 over 1983 0.7 0.5 0.6 0.8 0.8 0.8 2004-05a over 1993-94 0.8 0.3 0.6 0.8 0.6 0.8 2004-05b over 1999-2000 0.3 -0.4 0.0 1.1 0.4 0.9 Note: The above are official estimates given by the Planning Commission. In 2004-05, the ‘a’ estimates are based on uniform recall period and comparable with 1993-94 whereas the ‘b’ estimates are based on mixed recall period and comparable with 1999-2000. Source: Mishra and Panda (2006) and http://pib.nic.in/archieve/others/2007/mar07/2007032102.xls (accessed 22 May 2007)
6 This is independent of the debate on comparability of the estimates of 1999-2000 because of some change in the recall period during survey. The recent survey of 2004-05 gives the possibility of comparing poverty estimates in both the methods. In 2004-05, the percentage of poor in Maharashtra is higher than the all India average by more than three percentage points in either of the methods.
A Report on Health Inequities in Maharashtra 15
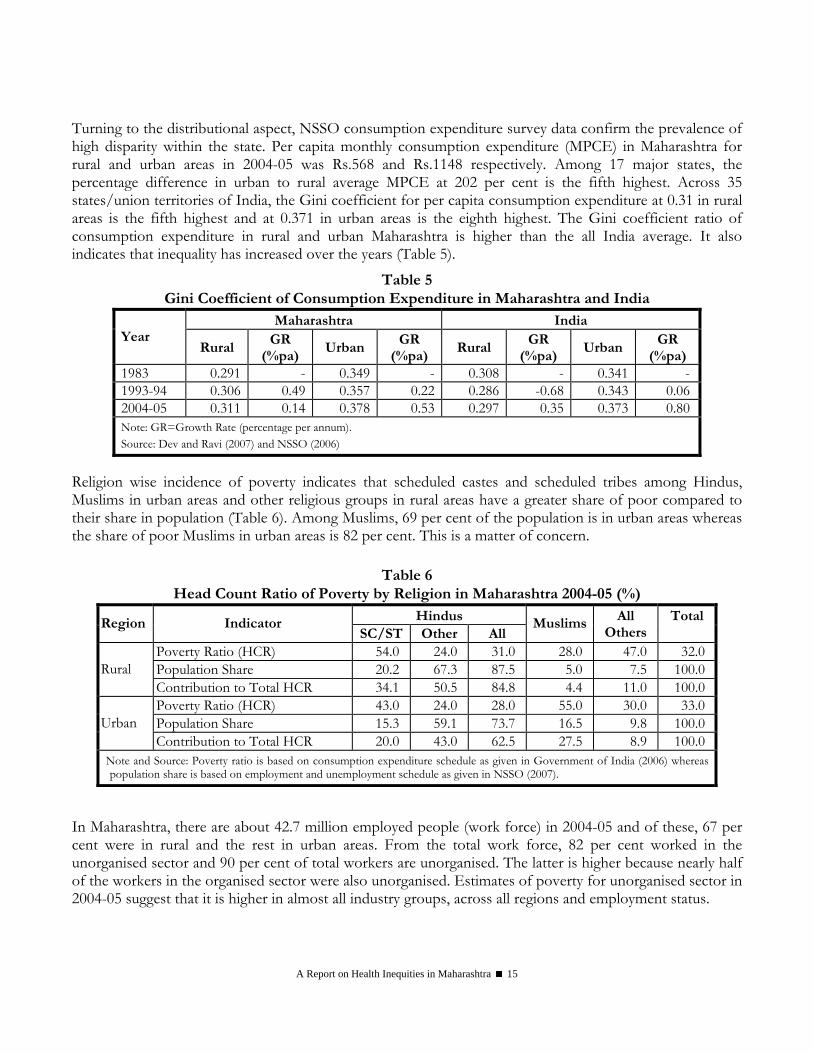
Turning to the distributional aspect, NSSO consumption expenditure survey data confirm the prevalence of high disparity within the state. Per capita monthly consumption expenditure (MPCE) in Maharashtra for rural and urban areas in 2004-05 was Rs.568 and Rs.1148 respectively. Among 17 major states, the percentage difference in urban to rural average MPCE at 202 per cent is the fifth highest. Across 35 states/union territories of India, the Gini coefficient for per capita consumption expenditure at 0.31 in rural areas is the fifth highest and at 0.371 in urban areas is the eighth highest. The Gini coefficient ratio of consumption expenditure in rural and urban Maharashtra is higher than the all India average. It also indicates that inequality has increased over the years (Table 5).
Table 5 Gini Coefficient of Consumption Expenditure in Maharashtra and India
Maharashtra India Year
Rural GR
(%pa) Urban
GR (%pa)
Rural GR
(%pa) Urban
GR (%pa)
1983 0.291 - 0.349 - 0.308 - 0.341 -1993-94 0.306 0.49 0.357 0.22 0.286 -0.68 0.343 0.062004-05 0.311 0.14 0.378 0.53 0.297 0.35 0.373 0.80Note: GR=Growth Rate (percentage per annum). Source: Dev and Ravi (2007) and NSSO (2006)
Religion wise incidence of poverty indicates that scheduled castes and scheduled tribes among Hindus, Muslims in urban areas and other religious groups in rural areas have a greater share of poor compared to their share in population (Table 6). Among Muslims, 69 per cent of the population is in urban areas whereas the share of poor Muslims in urban areas is 82 per cent. This is a matter of concern.
Table 6
Head Count Ratio of Poverty by Religion in Maharashtra 2004-05 (%) Hindus Region Indicator
SC/ST Other All Muslims All
Others Total
Poverty Ratio (HCR) 54.0 24.0 31.0 28.0 47.0 32.0Population Share 20.2 67.3 87.5 5.0 7.5 100.0Rural Contribution to Total HCR 34.1 50.5 84.8 4.4 11.0 100.0Poverty Ratio (HCR) 43.0 24.0 28.0 55.0 30.0 33.0Population Share 15.3 59.1 73.7 16.5 9.8 100.0Urban Contribution to Total HCR 20.0 43.0 62.5 27.5 8.9 100.0
Note and Source: Poverty ratio is based on consumption expenditure schedule as given in Government of India (2006) whereas population share is based on employment and unemployment schedule as given in NSSO (2007).
In Maharashtra, there are about 42.7 million employed people (work force) in 2004-05 and of these, 67 per cent were in rural and the rest in urban areas. From the total work force, 82 per cent worked in the unorganised sector and 90 per cent of total workers are unorganised. The latter is higher because nearly half of the workers in the organised sector were also unorganised. Estimates of poverty for unorganised sector in 2004-05 suggest that it is higher in almost all industry groups, across all regions and employment status.

A Report on Health Inequities in Maharashtra 16
Table 7 Head Count Ratio of Poverty for Unorganized Sector Workers by Industry, Region and
Employment Status in Maharashtra and India, 2004-05 (%) Industry Region/Status Maharashtra India
Rural 15.6 17.2 Urban 31.6 24.1
Agriculture Total 23.3 20.5
Rural 20.8 19.3 Urban 34.3 25.5 Casual Labour 49.6 29.8 Regular 25.6 17.4 Self-Employed 21.7 18.6
Non-agriculture Total 27.1 20.6 All Workforce 24.6 20.5 Source: NCEUS (2007)
Incidence of poverty will have social group as well as regional variations. The poverty estimates in 2004-05 across rural and urban regions for four categories of social groups: Scheduled Tribes (STs), Scheduled Castes (SCs), Other Backward Classes (OBCs) and Others are given in Table 8. The ST and SC groups have a substantially higher incidence of poverty. The proportion of poor among rural STs at 56 per cent is nearly double compared to the 30 per cent for rural Maharashtra. The ST group accounts for 26 per cent of the total rural poor as against a population share of 14 per cent whereas the SC group accounts for 23 per cent of the poor with a population share of 15 per cent. Incidence of rural poverty at 19 per cent for the Others category is nearly a third compared to STs. Disparity in incidence of poverty across social groups in urban areas is relatively lower - it varies between 43 per cent for the SC population and 27 per cent for Others.
Table 8
Head Count Ratio of Poverty by Social Groups, Maharashtra 2004-05 (%) Region Indicator ST SC OBC Others Total
Poverty Ratio (HCR) 56.3 44.8 24.1 18.6 29.6 Population Share 13.6 14.8 35.7 35.8 100.0 Rural Contribution to total HCR 25.9 22.5 29.1 22.6 100.0 Poverty Ratio (HCR) 40.9 42.8 35.6 26.8 32.1 Population Share 3.1 17.2 23.8 55.9 100.0 Urban Contribution to total HCR 4.0 22.9 26.4 46.7 100.0
Note: ST, SC and OBC denote Scheduled Tribe, Scheduled Caste and Other Backward Class respectively. Source: Calculated from unit level data.
Poverty ratio in 2004-05 across NSS regions of Maharashtra is given in Table 9. Taking the rural and urban areas together, the proportion of poor at 18 per cent was the least in the Coastal region (Konkan division that includes Mumbai and its suburban areas) of Maharashtra. In rural areas independently, it is the least in Inland Western region (Pune division and Ahmednagar district of Nashik division). In the rural areas incidence of poverty is more than 40 per cent in Eastern (Nagpur division after excluding Nagpur and
A Report on Health Inequities in Maharashtra 17
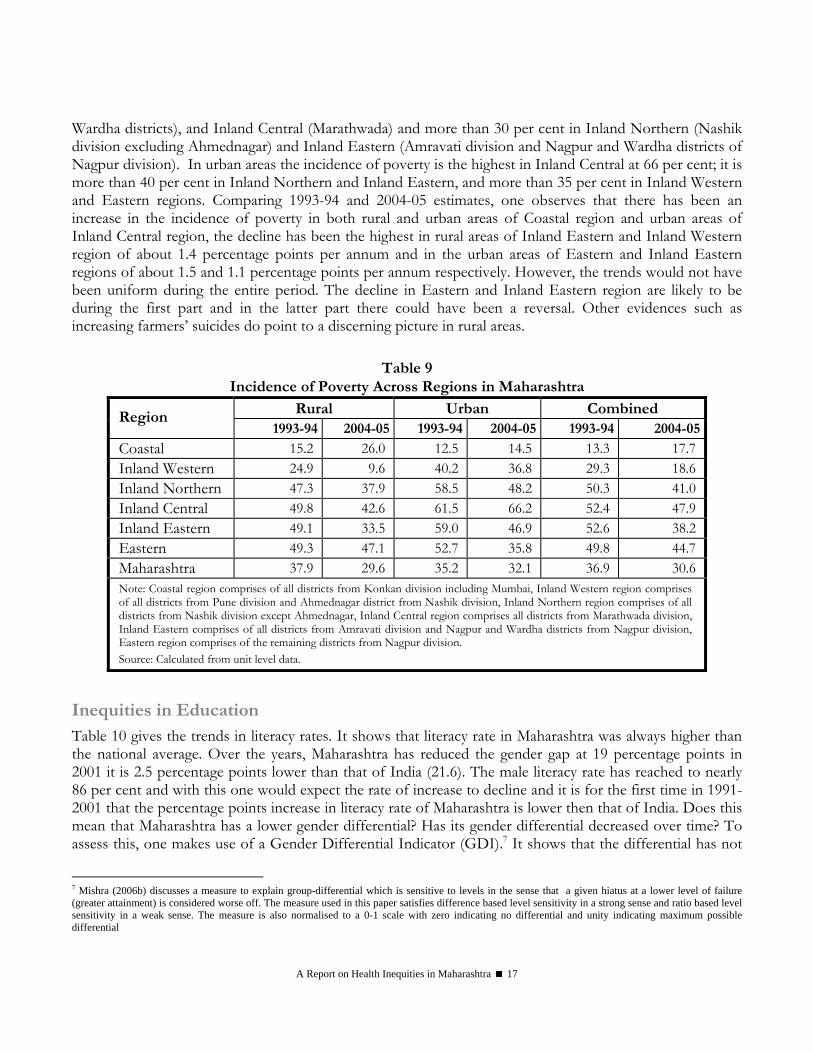
Wardha districts), and Inland Central (Marathwada) and more than 30 per cent in Inland Northern (Nashik division excluding Ahmednagar) and Inland Eastern (Amravati division and Nagpur and Wardha districts of Nagpur division). In urban areas the incidence of poverty is the highest in Inland Central at 66 per cent; it is more than 40 per cent in Inland Northern and Inland Eastern, and more than 35 per cent in Inland Western and Eastern regions. Comparing 1993-94 and 2004-05 estimates, one observes that there has been an increase in the incidence of poverty in both rural and urban areas of Coastal region and urban areas of Inland Central region, the decline has been the highest in rural areas of Inland Eastern and Inland Western region of about 1.4 percentage points per annum and in the urban areas of Eastern and Inland Eastern regions of about 1.5 and 1.1 percentage points per annum respectively. However, the trends would not have been uniform during the entire period. The decline in Eastern and Inland Eastern region are likely to be during the first part and in the latter part there could have been a reversal. Other evidences such as increasing farmers’ suicides do point to a discerning picture in rural areas.
Table 9 Incidence of Poverty Across Regions in Maharashtra
Rural Urban Combined Region 1993-94 2004-05 1993-94 2004-05 1993-94 2004-05
Coastal 15.2 26.0 12.5 14.5 13.3 17.7Inland Western 24.9 9.6 40.2 36.8 29.3 18.6Inland Northern 47.3 37.9 58.5 48.2 50.3 41.0Inland Central 49.8 42.6 61.5 66.2 52.4 47.9Inland Eastern 49.1 33.5 59.0 46.9 52.6 38.2Eastern 49.3 47.1 52.7 35.8 49.8 44.7Maharashtra 37.9 29.6 35.2 32.1 36.9 30.6Note: Coastal region comprises of all districts from Konkan division including Mumbai, Inland Western region comprises of all districts from Pune division and Ahmednagar district from Nashik division, Inland Northern region comprises of all districts from Nashik division except Ahmednagar, Inland Central region comprises all districts from Marathwada division, Inland Eastern comprises of all districts from Amravati division and Nagpur and Wardha districts from Nagpur division, Eastern region comprises of the remaining districts from Nagpur division. Source: Calculated from unit level data.
Inequities in Education Table 10 gives the trends in literacy rates. It shows that literacy rate in Maharashtra was always higher than the national average. Over the years, Maharashtra has reduced the gender gap at 19 percentage points in 2001 it is 2.5 percentage points lower than that of India (21.6). The male literacy rate has reached to nearly 86 per cent and with this one would expect the rate of increase to decline and it is for the first time in 1991-2001 that the percentage points increase in literacy rate of Maharashtra is lower then that of India. Does this mean that Maharashtra has a lower gender differential? Has its gender differential decreased over time? To assess this, one makes use of a Gender Differential Indicator (GDI).7 It shows that the differential has not
7 Mishra (2006b) discusses a measure to explain group-differential which is sensitive to levels in the sense that a given hiatus at a lower level of failure (greater attainment) is considered worse off. The measure used in this paper satisfies difference based level sensitivity in a strong sense and ratio based level sensitivity in a weak sense. The measure is also normalised to a 0-1 scale with zero indicating no differential and unity indicating maximum possible differential

A Report on Health Inequities in Maharashtra 18
only been increasing over time, but it has always been higher in Maharashtra when compared with that of all India.
Table 10 Trends in Literacy Rate, Maharashtra and India, 1961-2001
Maharashtra India Year Male Female Persons GDI Male Female Persons GDI
1961 49.3 19.8 35.1 0.37 40.4 15.3 28.3 0.30 1971 59.4 31.0 45.8 0.41 46.0 22.0 34.5 0.31 1981 66.6 39.6 53.5 0.45 53.5 28.5 41.4 0.35 1991 76.7 52.4 64.9 0.51 64.1 39.3 52.2 0.41 2001 86.0 67.0 76.9 0.58 75.3 53.7 64.8 0.47 Note: GDI=Gender Differential Indicator= [1-(Illiteracy ratio of Males/Illiteracy ratio of Females)]. Source: http://www.indiastat.com (accessed 12 February 2007).
Region wise and sex-wise literacy rate across social groups in 2001 is given in Table 11. To assess gender differential across caste groups we again make use of GDI. Despite relatively lower gaps, it shows higher gender differential in all areas in Maharashtra when compared with all India. Between regions, gender differentials are higher in urban areas. Across caste groups, gender differential is higher among Scheduled Castes. Similarly, we have also computed a Regional Differential Indicator (RDI). While comparing Maharashtra with all India, it shows relatively lower regional differential for males and all persons, but not for females. Across castes, the regional differential is higher for scheduled tribes but lower for scheduled castes. Within Maharashtra, the Scheduled Tribes show a greater regional differential. Despite greater literacy rates in Maharashtra, the gender and regional differentials point out to certain gaps in the nature and pace of attainments.
Table 11 Region Wise and Sex Wise Literacy Rate Across Social Groups,
Maharashtra and India, 2001 Maharashtra India Caste Region
Male Female Persons GDI Male Female Persons GDI Rural 64.52 39.88 52.31 0.41 57.39 32.44 45.02 0.37Urban 82.98 64.70 74.18 0.52 77.77 59.87 69.09 0.45Total 67.02 43.08 55.21 0.42 59.17 34.76 47.10 0.37ST
RDI 0.52 0.41 0.46 NA 0.48 0.41 0.44 NARural 80.56 54.71 67.88 0.57 63.66 37.84 51.16 0.42Urban 87.58 68.41 78.27 0.61 77.93 57.49 68.12 0.48Total 83.29 59.98 71.90 0.58 66.64 41.90 54.69 0.43SC
RDI 0.36 0.30 0.32 NA 0.39 0.32 0.35 NARural 81.93 58.40 70.36 0.56 70.70 46.13 58.74 0.46Urban 91.03 79.09 85.48 0.57 86.27 72.86 79.92 0.49Total 85.97 67.03 76.88 0.58 75.26 53.67 64.84 0.47All
RDI 0.50 0.50 0.51 NA 0.53 0.50 0.51 NAST=Scheduled Tribe, SC=Scheduled Caste, RDI=Regional Differential Indicator= [1-(Illiteracy ratio in urban/Illiteracy ratio in rural)].GDI is as in Table 10. Source: http://www.indiastat.com (accessed 12 February 2007).
A Report on Health Inequities in Maharashtra 19
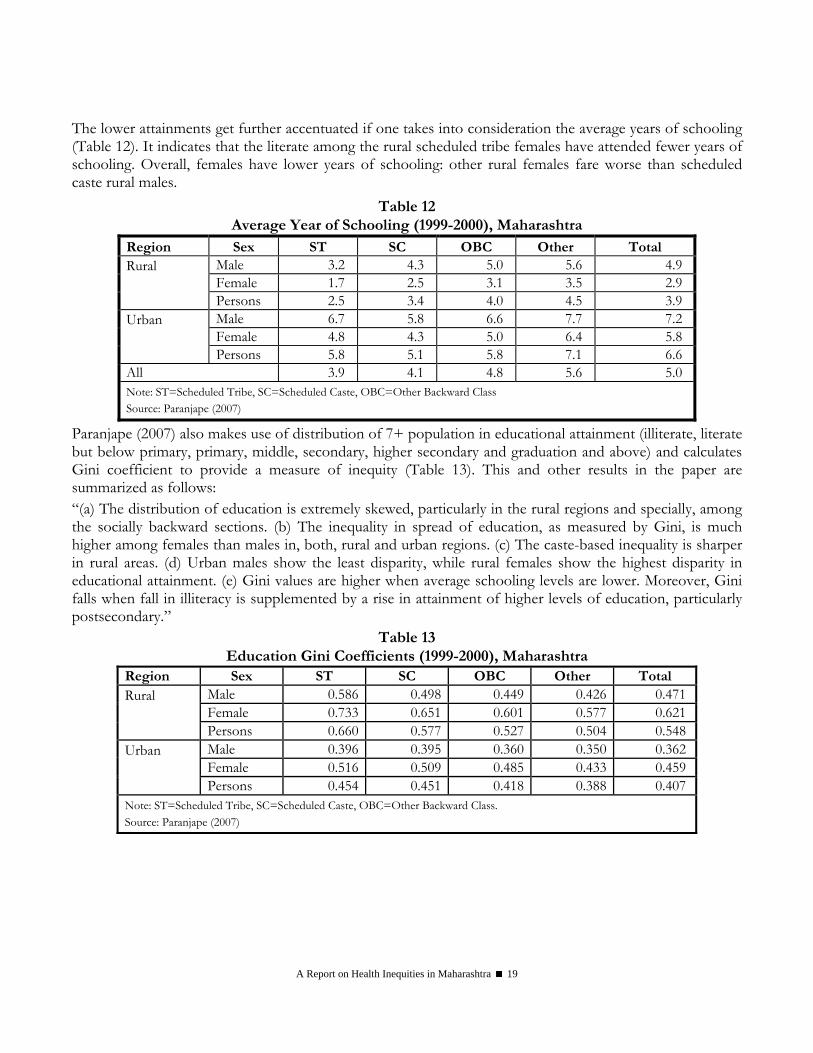
The lower attainments get further accentuated if one takes into consideration the average years of schooling (Table 12). It indicates that the literate among the rural scheduled tribe females have attended fewer years of schooling. Overall, females have lower years of schooling: other rural females fare worse than scheduled caste rural males.
Table 12 Average Year of Schooling (1999-2000), Maharashtra
Region Sex ST SC OBC Other Total Male 3.2 4.3 5.0 5.6 4.9 Female 1.7 2.5 3.1 3.5 2.9
Rural Persons 2.5 3.4 4.0 4.5 3.9
Male 6.7 5.8 6.6 7.7 7.2 Female 4.8 4.3 5.0 6.4 5.8
Urban Persons 5.8 5.1 5.8 7.1 6.6 All 3.9 4.1 4.8 5.6 5.0 Note: ST=Scheduled Tribe, SC=Scheduled Caste, OBC=Other Backward Class Source: Paranjape (2007)
Paranjape (2007) also makes use of distribution of 7+ population in educational attainment (illiterate, literate but below primary, primary, middle, secondary, higher secondary and graduation and above) and calculates Gini coefficient to provide a measure of inequity (Table 13). This and other results in the paper are summarized as follows: “(a) The distribution of education is extremely skewed, particularly in the rural regions and specially, among the socially backward sections. (b) The inequality in spread of education, as measured by Gini, is much higher among females than males in, both, rural and urban regions. (c) The caste-based inequality is sharper in rural areas. (d) Urban males show the least disparity, while rural females show the highest disparity in educational attainment. (e) Gini values are higher when average schooling levels are lower. Moreover, Gini falls when fall in illiteracy is supplemented by a rise in attainment of higher levels of education, particularly postsecondary.”
Table 13 Education Gini Coefficients (1999-2000), Maharashtra
Region Sex ST SC OBC Other Total Male 0.586 0.498 0.449 0.426 0.471Female 0.733 0.651 0.601 0.577 0.621
Rural Persons 0.660 0.577 0.527 0.504 0.548
Male 0.396 0.395 0.360 0.350 0.362Female 0.516 0.509 0.485 0.433 0.459
Urban Persons 0.454 0.451 0.418 0.388 0.407Note: ST=Scheduled Tribe, SC=Scheduled Caste, OBC=Other Backward Class. Source: Paranjape (2007)
A Report on Health Inequities in Maharashtra 20
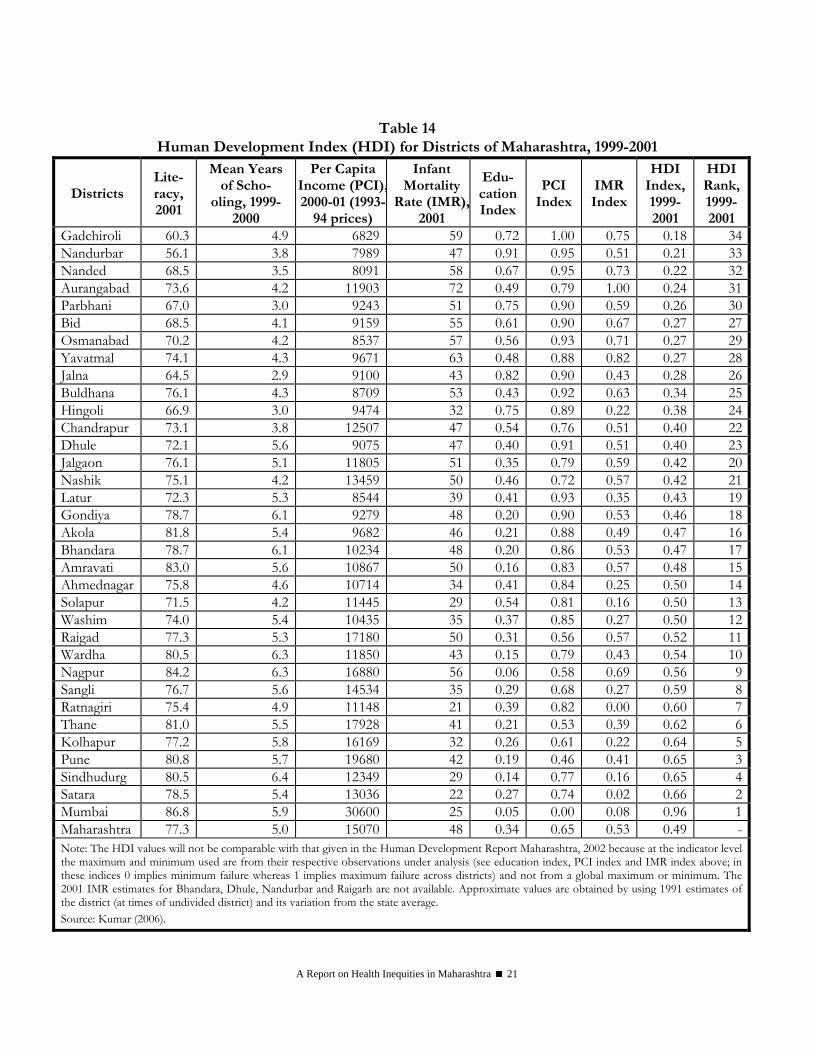
Human Development Index Across Districts The discourse on human development has identified issues beyond income. Seeta Prabhu and Kamdar (1999) point out that social expenditure has been biased towards urban areas and the regional as well as inter-personal inequalities persist. Growth in income has not translated itself to a growth in human development. More recently Kamdar and Basak (2005) also refer to a human development backlog that is not based on financial allocation but rather based on outcome or attainment indicators. Another recent exercise (Civil Society Report 2007) also critically evaluates the attainments or rather shortfalls of Maharashtra through the prism of the seven Millennium Development Goals (MDGs). In the Human Development Report Maharashtra 2002 the human development index (HDI) was calculated using some dated information on per capita income and infant mortality rate. Kumar (2006) has calculated an updated HDI for 1999-2001 for districts of Maharashtra by using per capita income for 2000-01 (at constant 1993-94 prices), infant mortality rate for 2001 (calculated by Ram et al 2005), literacy rate for 2001 and mean years of schooling for 1999-2000 (Table 14). These HDI values will not be comparable with that given in the Human Development Report Maharashtra, 2002. Nevertheless, it may be pointed out that because of changes in the value of indicators there are some ranking changes. The districts doing better then the state average HDI of 0.49 are largely the Konkan and Western Maharashtra and a few from Vidarbha (Nagpur, Wardha and Washim) and Ahmednagar district from Nashik division. The remaining districts of Nashik and Vidarbha and all the districts of Marathwada division have a value of HDI, which is lower than the state average. Mumbai has the highest HDI value whereas Gadchiroli has the least value. What is important to note is that there is wide disparity across districts in all the dimensions – education, health and income.
A Report on Health Inequities in Maharashtra 21
Table 14 Human Development Index (HDI) for Districts of Maharashtra, 1999-2001
Districts Lite-racy, 2001
Mean Years of Scho-
oling, 1999-2000
Per Capita Income (PCI),2000-01 (1993-
94 prices)
Infant Mortality
Rate (IMR),2001
Edu-cation Index
PCI Index
IMR Index
HDI Index, 1999-2001
HDI Rank, 1999-2001
Gadchiroli 60.3 4.9 6829 59 0.72 1.00 0.75 0.18 34Nandurbar 56.1 3.8 7989 47 0.91 0.95 0.51 0.21 33Nanded 68.5 3.5 8091 58 0.67 0.95 0.73 0.22 32Aurangabad 73.6 4.2 11903 72 0.49 0.79 1.00 0.24 31Parbhani 67.0 3.0 9243 51 0.75 0.90 0.59 0.26 30Bid 68.5 4.1 9159 55 0.61 0.90 0.67 0.27 27Osmanabad 70.2 4.2 8537 57 0.56 0.93 0.71 0.27 29Yavatmal 74.1 4.3 9671 63 0.48 0.88 0.82 0.27 28Jalna 64.5 2.9 9100 43 0.82 0.90 0.43 0.28 26Buldhana 76.1 4.3 8709 53 0.43 0.92 0.63 0.34 25Hingoli 66.9 3.0 9474 32 0.75 0.89 0.22 0.38 24Chandrapur 73.1 3.8 12507 47 0.54 0.76 0.51 0.40 22Dhule 72.1 5.6 9075 47 0.40 0.91 0.51 0.40 23Jalgaon 76.1 5.1 11805 51 0.35 0.79 0.59 0.42 20Nashik 75.1 4.2 13459 50 0.46 0.72 0.57 0.42 21Latur 72.3 5.3 8544 39 0.41 0.93 0.35 0.43 19Gondiya 78.7 6.1 9279 48 0.20 0.90 0.53 0.46 18Akola 81.8 5.4 9682 46 0.21 0.88 0.49 0.47 16Bhandara 78.7 6.1 10234 48 0.20 0.86 0.53 0.47 17Amravati 83.0 5.6 10867 50 0.16 0.83 0.57 0.48 15Ahmednagar 75.8 4.6 10714 34 0.41 0.84 0.25 0.50 14Solapur 71.5 4.2 11445 29 0.54 0.81 0.16 0.50 13Washim 74.0 5.4 10435 35 0.37 0.85 0.27 0.50 12Raigad 77.3 5.3 17180 50 0.31 0.56 0.57 0.52 11Wardha 80.5 6.3 11850 43 0.15 0.79 0.43 0.54 10Nagpur 84.2 6.3 16880 56 0.06 0.58 0.69 0.56 9Sangli 76.7 5.6 14534 35 0.29 0.68 0.27 0.59 8Ratnagiri 75.4 4.9 11148 21 0.39 0.82 0.00 0.60 7Thane 81.0 5.5 17928 41 0.21 0.53 0.39 0.62 6Kolhapur 77.2 5.8 16169 32 0.26 0.61 0.22 0.64 5Pune 80.8 5.7 19680 42 0.19 0.46 0.41 0.65 3Sindhudurg 80.5 6.4 12349 29 0.14 0.77 0.16 0.65 4Satara 78.5 5.4 13036 22 0.27 0.74 0.02 0.66 2Mumbai 86.8 5.9 30600 25 0.05 0.00 0.08 0.96 1Maharashtra 77.3 5.0 15070 48 0.34 0.65 0.53 0.49 -Note: The HDI values will not be comparable with that given in the Human Development Report Maharashtra, 2002 because at the indicator level the maximum and minimum used are from their respective observations under analysis (see education index, PCI index and IMR index above; in these indices 0 implies minimum failure whereas 1 implies maximum failure across districts) and not from a global maximum or minimum. The 2001 IMR estimates for Bhandara, Dhule, Nandurbar and Raigarh are not available. Approximate values are obtained by using 1991 estimates of the district (at times of undivided district) and its variation from the state average. Source: Kumar (2006).
A Report on Health Inequities in Maharashtra 22
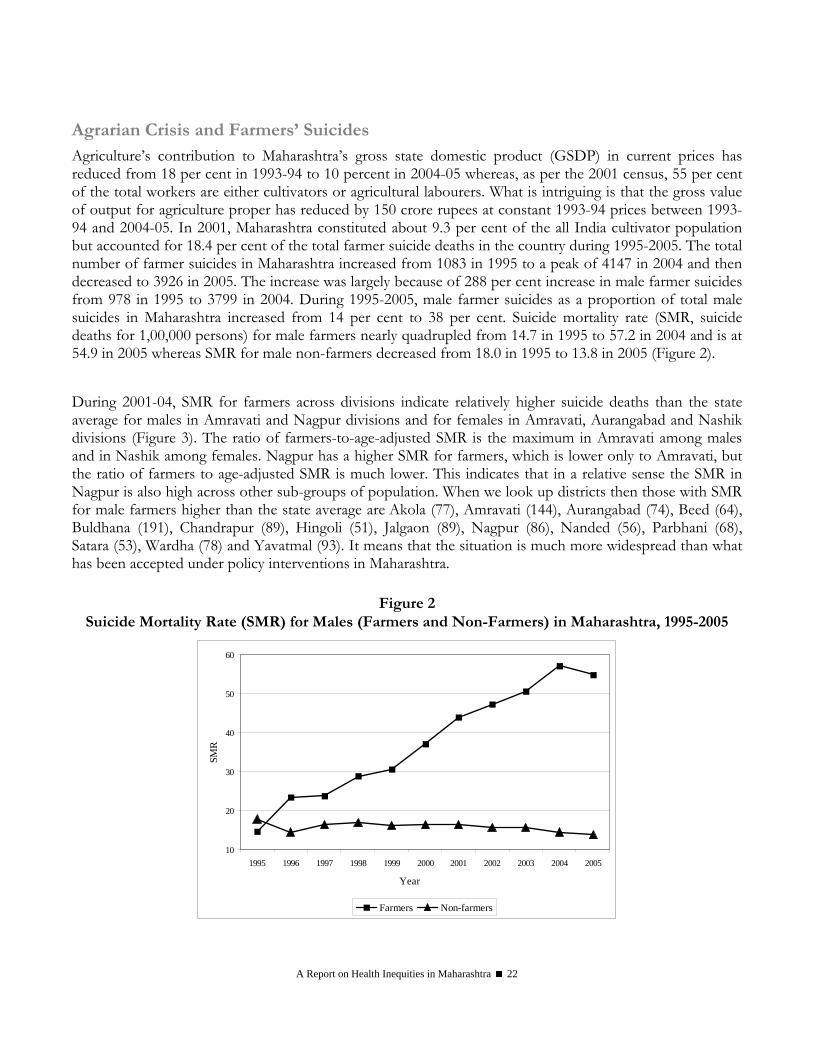
Agrarian Crisis and Farmers’ Suicides Agriculture’s contribution to Maharashtra’s gross state domestic product (GSDP) in current prices has reduced from 18 per cent in 1993-94 to 10 percent in 2004-05 whereas, as per the 2001 census, 55 per cent of the total workers are either cultivators or agricultural labourers. What is intriguing is that the gross value of output for agriculture proper has reduced by 150 crore rupees at constant 1993-94 prices between 1993-94 and 2004-05. In 2001, Maharashtra constituted about 9.3 per cent of the all India cultivator population but accounted for 18.4 per cent of the total farmer suicide deaths in the country during 1995-2005. The total number of farmer suicides in Maharashtra increased from 1083 in 1995 to a peak of 4147 in 2004 and then decreased to 3926 in 2005. The increase was largely because of 288 per cent increase in male farmer suicides from 978 in 1995 to 3799 in 2004. During 1995-2005, male farmer suicides as a proportion of total male suicides in Maharashtra increased from 14 per cent to 38 per cent. Suicide mortality rate (SMR, suicide deaths for 1,00,000 persons) for male farmers nearly quadrupled from 14.7 in 1995 to 57.2 in 2004 and is at 54.9 in 2005 whereas SMR for male non-farmers decreased from 18.0 in 1995 to 13.8 in 2005 (Figure 2). During 2001-04, SMR for farmers across divisions indicate relatively higher suicide deaths than the state average for males in Amravati and Nagpur divisions and for females in Amravati, Aurangabad and Nashik divisions (Figure 3). The ratio of farmers-to-age-adjusted SMR is the maximum in Amravati among males and in Nashik among females. Nagpur has a higher SMR for farmers, which is lower only to Amravati, but the ratio of farmers to age-adjusted SMR is much lower. This indicates that in a relative sense the SMR in Nagpur is also high across other sub-groups of population. When we look up districts then those with SMR for male farmers higher than the state average are Akola (77), Amravati (144), Aurangabad (74), Beed (64), Buldhana (191), Chandrapur (89), Hingoli (51), Jalgaon (89), Nagpur (86), Nanded (56), Parbhani (68), Satara (53), Wardha (78) and Yavatmal (93). It means that the situation is much more widespread than what has been accepted under policy interventions in Maharashtra.
Figure 2
Suicide Mortality Rate (SMR) for Males (Farmers and Non-Farmers) in Maharashtra, 1995-2005
10
20
30
40
50
60
1995 1996 1997 1998 1999 2000 2001 2002 2003 2004 2005
Year
SMR
Farmers Non-farmers

A Report on Health Inequities in Maharashtra 23
Figure 3 Suicide Mortality Rate (SMR) for Farmers Across Divisions in Maharashtra, 2001-04
0
20
40
60
80
100
120
Divisions
SMR
for F
arm
ers
Female Male
Female 7.7 3.6 12 9.2 8.5 24.3 9.1
Male 25.1 34.7 36.6 47.6 55.5 115.6 48.1
Konkan Pune Nashik Aurangabad Nagpur Amravati Maharashtra
Suicide is a complex and multifaceted phenomenon. The associated factors can be identified in the neurobiological or the socio-economic domain. The former are predisposing whereas the latter are the precipitating ones. Relatively higher suicides among farmers does point to an agrarian crisis, its absence is not necessarily indicating the absence of a crisis. The reasons for the agrarian crisis can be classified to systemic and idiosyncratic factors. The predominant among the systemic factors are declining public investment, inadequate availability of credit from formal sources, failure of research and extension, poor returns from cultivation, increasing cost of inputs, and increasing volatility of output prices due to linkages with the global market among others. At the idiosyncratic level, some of the coexisting and interrelated factors identified are greater credit burden, economic and social downfall, crop failure and difficulty in providing for social responsibility (daughter’s marriage, ward’s education or health care needs of family members) among others. A comparison of suicide case with non-suicide control households in Vidarbha does point to greater credit burden even after normalizing by family size and land size, absence of bullocks (a productive and liquid assets), greater number of family members (particularly, more daughters) and lower value of produce among others (Mishra 2006a). In short, the farmer is faced with a multitude of risks: weather, credit, market (input and output), technology and social responsibility among others. In the absence of appropriate risk mitigation strategies this makes the farmer vulnerable. One of the outcomes of this is the increasing incidence of farmers’ suicides. If not adequately addressed this is likely to spread. Farmers’ suicides also have implications from a public health perspective. First, it calls for public health facilities to deal with poisoning, a major method of committing suicide among farmers in Maharashtra. Second, it also requires adequate provisioning from a mental health perspective, a preventive aspect. Third, the inability of the farmer to meet certain health care expenditure from their normal sources of income is a matter of concern. This calls for some public provisioning. These, however, will in no way address the agrarian crisis per se.
A Report on Health Inequities in Maharashtra 24
Concluding Remarks The state of Maharashtra is among the richest across states, but it is not as successful in reducing poverty, which has consistently remained around the national average. Agriculture is not the state’s forte, as it is in Punjab or Haryana, and its share in the gross state domestic product has reduced to around 10 per cent, but more than half the states workforce is still dependent on agriculture. What is intriguing is that in constant 1993-94 prices the value of output from agriculture in TE 2004-05 over TE 1995-96 is lower. Returns to cultivation are abysmally low. There seems to be a large agrarian crisis and this reflects the increasing incidence of farmers’ suicides. The per capita income of Gadchiroli is less than one-fifth that of Mumbai. Comparable estimate of recent years (1999-2000 to 2004-05) indicate that the decline of rural poverty in Maharashtra is less than 0.2 percentage points per annum. In 2004-05, Vidarbha, Marathwada and Nashik and urban areas of Western Maharashtra had a greater share of poor people then their share of population. Across caste groups, the scheduled tribes and scheduled castes have a greater share of poor when compared to their share of population. Literacy and other educational attainment bring out gender, caste and rural-urban differences; for instance, the rural tribal female literacy rate of 40 per cent is less than half that of the overall urban male literacy rate of 91 per cent. This gets more and more accentuated when one looks at average years of schooling or educational attainment. The updated Human Development Index (HDI) reiterates the regional divide, but the independent indicators do convey the point that a district with relatively better income may not do as well in other indicators (Nagpur does not fare well in lowering IMR) whereas a district not doing well in income may fare better in other indicators (Akola, Amravati and Wardha do well in educational attainment). Overall, there are striking differences across regions, social groups or gender in the indicators of income, poverty and educational attainment among others.
Acknowledgments Comments received from participants in the workshops held on 15 February 2007 and 21 February 2007, subsequent discussions with Nilangi Sardeshpande and Abhay Shukla and comments from an anonymous reviewer were helpful. Ankush Agrawal helped in calculating the social group and region wise poverty estimates for Maharashtra. Usual disclaimers apply.
A Report on Health Inequities in Maharashtra 25
References Ashtekar, Shyam, Dhruv Mankad and Kranti Raimane (2004): Child Mortality Determinants in 3 Backward Districts: Nandurbar, Yavatmal and Jalna, Report prepared as part of Maharashtra Human Development Action Research Study, Indira Gandhi Institute of Development Research, Mumbai.
Bhowmik, Sharit (2001): Hawkers and the Urban Informal Sector: A Study of Street Vending for Seven Cities, National Alliance of Street Vendors of India.
Chandrasekhar, S and Abhiroop Mukhopadhyay (2007): Multidimensions of Urban Poverty: Evidence from India, WP-2007-008, Indira Gandhi Institute of Development Research, Mumbai.
Civil Society Report (2007): MDG Promises & Reality in Maharashtra: 7-7-7, Wada Na Todo Maha Abhiyan.
Contractor, Qudsiya, Neha Madhiwala and Meena Gopal (2006): Uprooted homes, Uprooted Lives- A Study of the Impact of Involuntary Resettlement of a Slum Community in Mumbai, Centre for Enquiry into Health and Allied Themes (CEHAT).
Deosthali, Padma and Neha Madhiwala (2005): In These Uncertain times: The Impact of Industrial Decline on the Lives and Health of Women Living in a Slum in Mumbai, in Padmini Swaminathan (ed.) Trapped Into Living: Women’s Work Environment and Their Perceptions of Health, CEHAT, Mumbai.
Dev, S Mahendra and C Ravi (2007): Poverty and Inequality: All India and States, 1983-2005, Economic and Political Weekly, Vol.42, No. 6, pp.509-521.
Duggal, Ravi (2008): Inequities in Health Status, this volume, page numbers – 57 to 71
Government of India (2006): Social, Economic and Educational Status of the Muslim Community of India: A Report (Chairman: R Sachar), Prime Minister’s High Level Committee, Cabinet Secretariat, New Delhi.
Government of Maharashtra (1984): Report of the Fact-Finding Committee on Regional Imbalance in Maharashtra, Planning Department, Mumbai.
Goyal, Ashima (2007): ICT and the Technological U-Turn for Women, in Rehana Ghadially (ed.) Urban Women in Contemporary India, Sage Publication, Delhi.
Hatekar, Neeraj and Sanjay Rode (2003): Quietly They Die: A Study of Malnourishment Related Deaths in Mumbai City, Working Paper No. 1/2003, Department of Economics, University of Mumbai, Mumbai.
Kamdar, Sangita and Asoke Basak (2005): Beyond the Human Development Index: Preliminary Notes on Deprivation and Inequality, Economic and Political Weekly, Vol. 40, No. 34, pp.4759-4765.
Kumar, Sujeet (2006): Recent Trend’s in Maharashtra’s Human Development: An Update of HDI 2000, Term paper submitted for the course on ‘Contemporary Issues in Human Development and Policy’ January-May 2006, Indira Gandhi Institute of Development Research, Mumbai.
Lingam, Laxmi and Amita Pitre (2008): Inequities in Health Access and Outcomes, this volume, page numbers- 75 to 112
Mishra, Srijit (2006a): Farmers’ Suicides in Maharashtra, Economic and Political Weekly, Vol. 41, No. 16, pp. 1538-1545.
Mishra, Srijit (2006b): On Measuring Group-differential Displayed by Socio-economic Indicators: An Extension, WP-2006-005, Indira Gandhi Institute of Development Research, Mumbai.
Mishra, Srijit (2007): Agrarian Scenario in Post-reform India: A Story of Distress, Despair and Death, WP-2007-001, Indira Gandhi Institute of Development Research, Mumbai.
Mishra, Srijit and Manoj Panda (2006): Growth and Poverty in Maharashtra, WP-2006-001, Indira Gandhi Institute of Development Research, Mumbai.
Mulay, Sanjeevanee and R Nagarajan (2005): A Study of Ultrasound Sonography Centres in Maharashtra, Gokhale Institute of Politics and Economics, Pune.
Mutatkar, Rohit (2007): Social Group Disparities, Ethnicity and Poverty in India, Unpublished Ph. D. Thesis, Indira Gandhi Institute of Development Research, Mumbai.
A Report on Health Inequities in Maharashtra 26
NCEUS (National Commission for Enterprises in the Unorganised Sector) (2007): Report on Conditions of Work and Promotions of Livelihoods in the Unorganised Sector, Government of India, New Delhi.
NSSO (National Sample Survey Organisation) (2006): Level and Pattern of Consumer Expenditure, 2004-05, NSS 61st round, July 2004-June 2005, Report No. 508 (61/1.0/1), Government of India.
NSSO (2007): Employment and Unemployment Situation among Major Religious Groups in India 2004 – 2005, NSS 61st Round, (July 2004-June 2005), Report No. 521(61/10/5), Government of India.
Panda, Manoj and A Chavan (2004): Some Aspects of Agriculture and Poverty Linkages in Maharashtra in K. Karnik and L.G. Burange (eds), Perspectives on Maharashtra’s Economy, Himalaya Publishing House, Mumbai, pp. 137-153.
Patel, Vibhuti (2003): Women in the Economy of Maharashtra, Working Paper No. UDE 9/5/2003, Centre for Women’s Studies, Department of Economics, University of Mumbai Mumbai.
Paranjape, Madhu S (2007): Uneven Distribution of Education in Maharashtra: Rural-Urban, Gender and Caste Inequalities, Economic and Political Weekly, Vol. 42, No. 3, pp. 213-216.
Ram, F, Chander Shekhar and SK Mohanty (2005): Preparing Database for Human Development: Strengthening Vital Statistics at the District Level, Report Sponsored by UNDP, International Institute for Population Sciences, Mumbai.
Seeta Prabhu K. & Sangita Kamdar (1999): Maharashtra’s Social Sector: Growth without Human Development, Working Paper 99/1, Department of Economics, University of Mumbai, Mumbai.
Shaban, Abdul (2006): Regional Structures, Growth and Convergence of Income in Maharashtra, Economic and Political Weekly, Vol. 41, No. 18, pp. 1803-1815.
Velaskar, Padma (2000): The Politics of Untouchability and Social Change: A Study of the Scheduled Castes of Maharashtra, Journal of Indian School of Political Economy, Vol. 12, Nos. 3 & 4, pp.473-499.
SECTION II INEQUITIES IN ACCESS
TO HEALTH CARE

A Report on Health Inequities in Maharashtra 29
Inequities in Access to Healthcare
Ravi Duggal
Introduction Being a wealthy and developed state does not guarantee that there is equity in access to health and healthcare. Maharashtra heads the ranking in India, though declining in recent years, in terms of economic indices like income, industrial and physical infrastructure, and financial capital but its social indicators like health, nutrition, education and welfare are not commensurate with its economic growth. (Maharashtra Economic Survey 2006) This gap between the two sets of indicators may be attributed to the lack of equity and distributive justice. With a population of over 105 million people it is equal to the tenth largest country in the world having the same population as Mexico. (World Bank - WDR 2006) However the state’s contribution to human and social development has been very inadequate and in present times is getting even worse. The human development index is not available across states for recent years but as per the 2001 National Human Development Report Maharashtra’s HDI rank amongst Indian states, which was 13 in 1981, had worsened to 15 in 1991. (Planning Commission/UNDP – National Human Development Report) The indicators in the Tables 1A – 1D below ranking Maharashtra for selected human development and healthcare services/outcomes across all states perhaps show that this rank may not have changed in recent years. Maharashtra’s decline began in the eighties. The textile mills strike and the subsequent closure of a number of mills was the first body blow to the robust industrial economy of the state. This also led to a massive informalisation of the manufacturing sector and a larger expansion of the service sector. Structural adjustment policies further worsened this situation as it impacted the rural economy of Maharashtra. Governance too weakened in the post-SAP phase and all this led to impacting adversely the social and health indicators of the state. So the historical advantage, which Maharashtra had, was gradually lost because Maharashtra was unable to cope with the changing political economy. It is not a question of lack of resources but clearly a case of mismanagement across the board. For instance Maharashtra’s pride, the EGS program continues to be cash rich because of dedicated resources that accrue to it via profession tax, nutrition cess etc. but the program has collapsed and is unable to generate employment across the state wherein many areas are suffering from severe deprivation that is manifested in malnutrition deaths and farmer suicides. What is most striking is that the NFHS-3 survey completed recently points out that 40.1% of children less than 3 years age in otherwise affluent Mumbai are malnourished and this figure is higher than Maharashtra’s average! (NFHS-3 fact sheet 2007) In Tables 1A- 1D, we see that apart from per capita income, life expectancy and to some extent education, Maharashtra ranks quite low with respect to the various health and nutrition indicators., With a strong private health sector we see that the penetration of private doctors in rural areas is also quite high and in contrast access to various public health services quite poor. This situation is largely due to poor public investment and expenditure in healthcare by Maharashtra, which is in the bottom quartile on this count.

Inequities in Access to Healthcare
A Report on Health Inequities in Maharashtra 30
Table 1A Rank of Maharashtra across All States and
Union Territories on Selected Human Development Parameters
Literacy 5 Female Literacy 5 Marriages Below Legal Age 20 Birth Rate 10 Per Capita Income 3 Per 1000 Primary and Secondary Enrolment 12
Safe Drinking Water 26 Toilet Facility 26 % Low Standard \of Living 21 Source: 1. Maharashtra Economic Survey 2005, GoM, Mumbai 2006; 2. RCH DLH Survey 2002-2004, IIPS, GoI, Mumbai 2006
Table 1B Rank of Maharashtra across All states and Union Territories for Selected Health Care
Infrastructure/Indicators Doctor : Population Ratio 9 Nurse: Population Ratio 7 Govt. bed: Population Ratio 15 PHC: Population Ratio 18
With Govt. Facility in Village 25 With Private Doctor in Village 5
Rural
With Anganwadi Worker in Village 3
Per Capita Public Health Expenditure 20 Health Expenditure as % of Govt. Expenditure 25 TB Prevalence 7 Malaria Prevalence 27 Source: 1. Health Information India 2005, CBHI, GoI, New Delhi 2006; 2. RCH DLH Survey 2002-2004, IIPS, GoI, Mumbai 2006
Table 1C
Rank of Maharashtra across All States and Union Territories for Access to Selected
Healthcare Services RCH Indicator Rank 12Full Immunisation of Children 9Full ANC 17Institutional Delivery 14Births in Public Facility 19ANC in Govt. Facility 20Women Who Needed to Visit Health Facility but Did Not 13
Women Who Visited Govt. Facility 31Use of Any Contraception 8Prevalence of Childhood Pneumonia 32Prevalence of RTI/STI Female/Male 30/14 Source: RCH DLH Survey 2002-2004, IIPS, GoI, Mumbai 2006
Table 1D Rank of Maharashtra across All States
and Union Territories for Selected Health/Nutrition Outcomes
BMI of Women Below Normal* 14BMI of Men Below Normal* 11Children < 3 Underweight* 10Death Rate 15Infant Mortality Rate 10Life Expectancy 4
* The ranking for this data is based only on 20 states Source: 1. NFHS-3 2005-06 Fact Sheets of various states, IIPS, GoI, Mumbai 2006; 2. Maharashtra Economic Survey 2005, GoM, Mumbai 2006
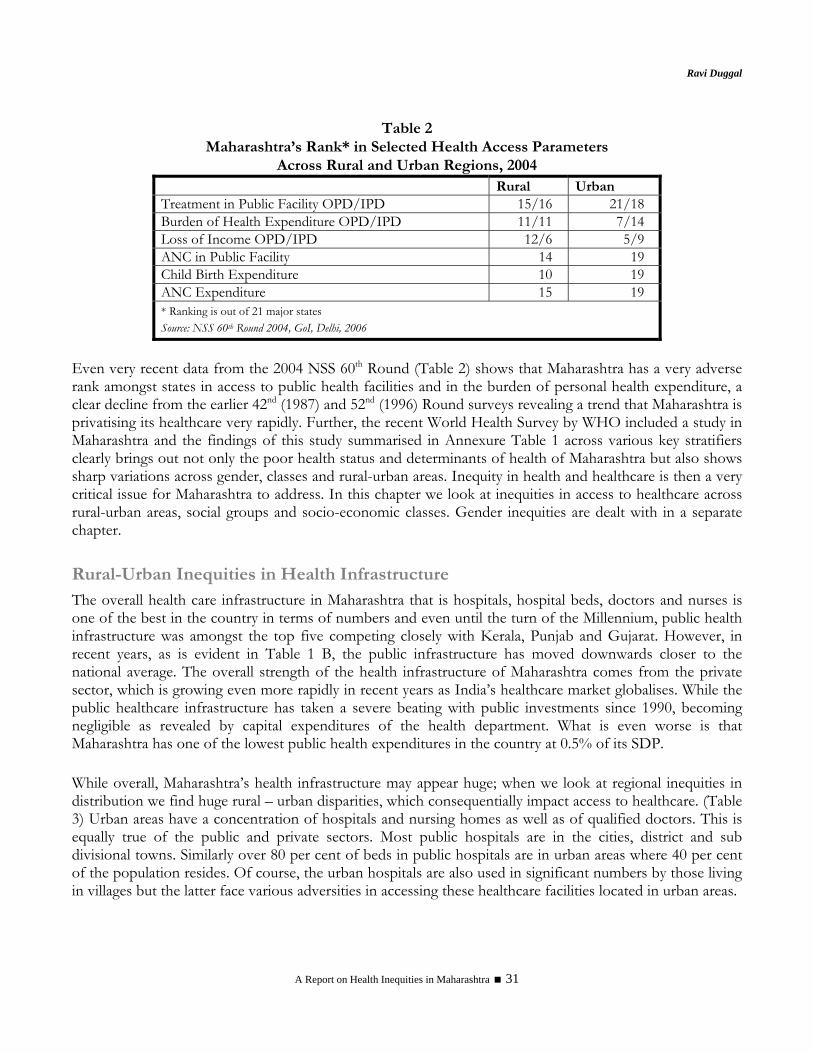
Ravi Duggal
A Report on Health Inequities in Maharashtra 31
Table 2 Maharashtra’s Rank* in Selected Health Access Parameters
Across Rural and Urban Regions, 2004 Rural Urban Treatment in Public Facility OPD/IPD 15/16 21/18 Burden of Health Expenditure OPD/IPD 11/11 7/14 Loss of Income OPD/IPD 12/6 5/9 ANC in Public Facility 14 19 Child Birth Expenditure 10 19 ANC Expenditure 15 19 * Ranking is out of 21 major states Source: NSS 60th Round 2004, GoI, Delhi, 2006
Even very recent data from the 2004 NSS 60th Round (Table 2) shows that Maharashtra has a very adverse rank amongst states in access to public health facilities and in the burden of personal health expenditure, a clear decline from the earlier 42nd (1987) and 52nd (1996) Round surveys revealing a trend that Maharashtra is privatising its healthcare very rapidly. Further, the recent World Health Survey by WHO included a study in Maharashtra and the findings of this study summarised in Annexure Table 1 across various key stratifiers clearly brings out not only the poor health status and determinants of health of Maharashtra but also shows sharp variations across gender, classes and rural-urban areas. Inequity in health and healthcare is then a very critical issue for Maharashtra to address. In this chapter we look at inequities in access to healthcare across rural-urban areas, social groups and socio-economic classes. Gender inequities are dealt with in a separate chapter.
Rural-Urban Inequities in Health Infrastructure The overall health care infrastructure in Maharashtra that is hospitals, hospital beds, doctors and nurses is one of the best in the country in terms of numbers and even until the turn of the Millennium, public health infrastructure was amongst the top five competing closely with Kerala, Punjab and Gujarat. However, in recent years, as is evident in Table 1 B, the public infrastructure has moved downwards closer to the national average. The overall strength of the health infrastructure of Maharashtra comes from the private sector, which is growing even more rapidly in recent years as India’s healthcare market globalises. While the public healthcare infrastructure has taken a severe beating with public investments since 1990, becoming negligible as revealed by capital expenditures of the health department. What is even worse is that Maharashtra has one of the lowest public health expenditures in the country at 0.5% of its SDP. While overall, Maharashtra’s health infrastructure may appear huge; when we look at regional inequities in distribution we find huge rural – urban disparities, which consequentially impact access to healthcare. (Table 3) Urban areas have a concentration of hospitals and nursing homes as well as of qualified doctors. This is equally true of the public and private sectors. Most public hospitals are in the cities, district and sub divisional towns. Similarly over 80 per cent of beds in public hospitals are in urban areas where 40 per cent of the population resides. Of course, the urban hospitals are also used in significant numbers by those living in villages but the latter face various adversities in accessing these healthcare facilities located in urban areas.
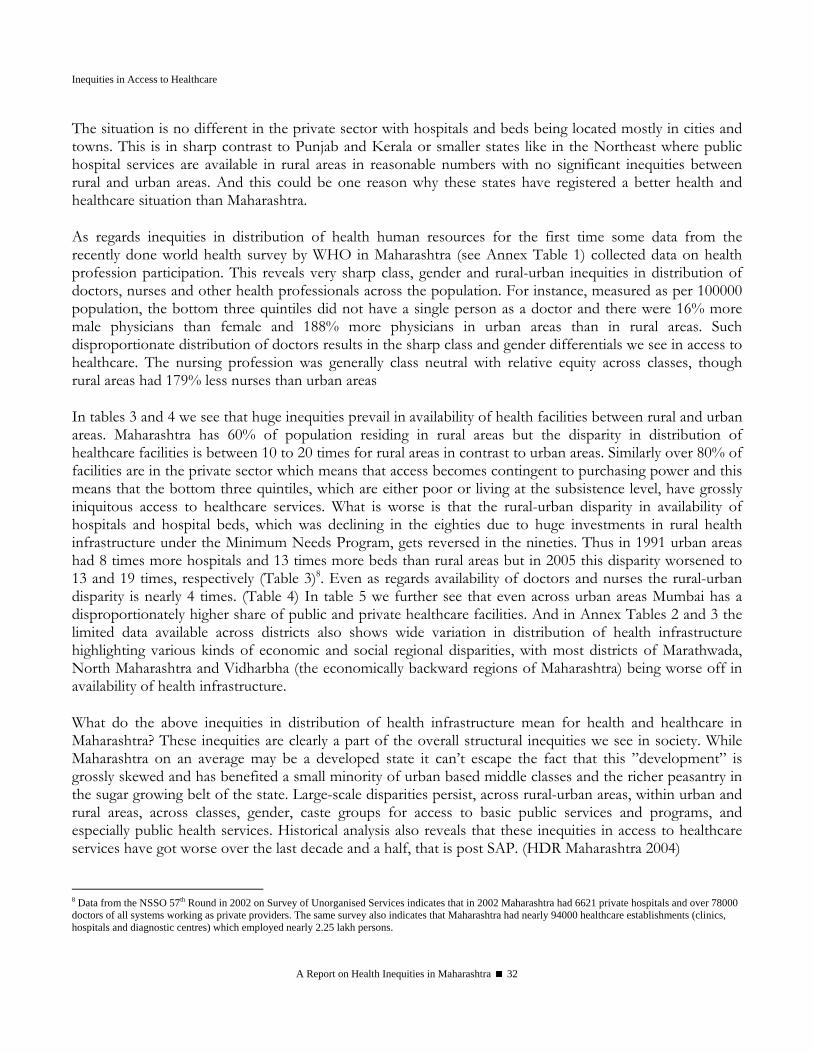
Inequities in Access to Healthcare
A Report on Health Inequities in Maharashtra 32
The situation is no different in the private sector with hospitals and beds being located mostly in cities and towns. This is in sharp contrast to Punjab and Kerala or smaller states like in the Northeast where public hospital services are available in rural areas in reasonable numbers with no significant inequities between rural and urban areas. And this could be one reason why these states have registered a better health and healthcare situation than Maharashtra. As regards inequities in distribution of health human resources for the first time some data from the recently done world health survey by WHO in Maharashtra (see Annex Table 1) collected data on health profession participation. This reveals very sharp class, gender and rural-urban inequities in distribution of doctors, nurses and other health professionals across the population. For instance, measured as per 100000 population, the bottom three quintiles did not have a single person as a doctor and there were 16% more male physicians than female and 188% more physicians in urban areas than in rural areas. Such disproportionate distribution of doctors results in the sharp class and gender differentials we see in access to healthcare. The nursing profession was generally class neutral with relative equity across classes, though rural areas had 179% less nurses than urban areas In tables 3 and 4 we see that huge inequities prevail in availability of health facilities between rural and urban areas. Maharashtra has 60% of population residing in rural areas but the disparity in distribution of healthcare facilities is between 10 to 20 times for rural areas in contrast to urban areas. Similarly over 80% of facilities are in the private sector which means that access becomes contingent to purchasing power and this means that the bottom three quintiles, which are either poor or living at the subsistence level, have grossly iniquitous access to healthcare services. What is worse is that the rural-urban disparity in availability of hospitals and hospital beds, which was declining in the eighties due to huge investments in rural health infrastructure under the Minimum Needs Program, gets reversed in the nineties. Thus in 1991 urban areas had 8 times more hospitals and 13 times more beds than rural areas but in 2005 this disparity worsened to 13 and 19 times, respectively (Table 3)8. Even as regards availability of doctors and nurses the rural-urban disparity is nearly 4 times. (Table 4) In table 5 we further see that even across urban areas Mumbai has a disproportionately higher share of public and private healthcare facilities. And in Annex Tables 2 and 3 the limited data available across districts also shows wide variation in distribution of health infrastructure highlighting various kinds of economic and social regional disparities, with most districts of Marathwada, North Maharashtra and Vidharbha (the economically backward regions of Maharashtra) being worse off in availability of health infrastructure.
What do the above inequities in distribution of health infrastructure mean for health and healthcare in Maharashtra? These inequities are clearly a part of the overall structural inequities we see in society. While Maharashtra on an average may be a developed state it can’t escape the fact that this ”development” is grossly skewed and has benefited a small minority of urban based middle classes and the richer peasantry in the sugar growing belt of the state. Large-scale disparities persist, across rural-urban areas, within urban and rural areas, across classes, gender, caste groups for access to basic public services and programs, and especially public health services. Historical analysis also reveals that these inequities in access to healthcare services have got worse over the last decade and a half, that is post SAP. (HDR Maharashtra 2004) 8 Data from the NSSO 57th Round in 2002 on Survey of Unorganised Services indicates that in 2002 Maharashtra had 6621 private hospitals and over 78000 doctors of all systems working as private providers. The same survey also indicates that Maharashtra had nearly 94000 healthcare establishments (clinics, hospitals and diagnostic centres) which employed nearly 2.25 lakh persons.
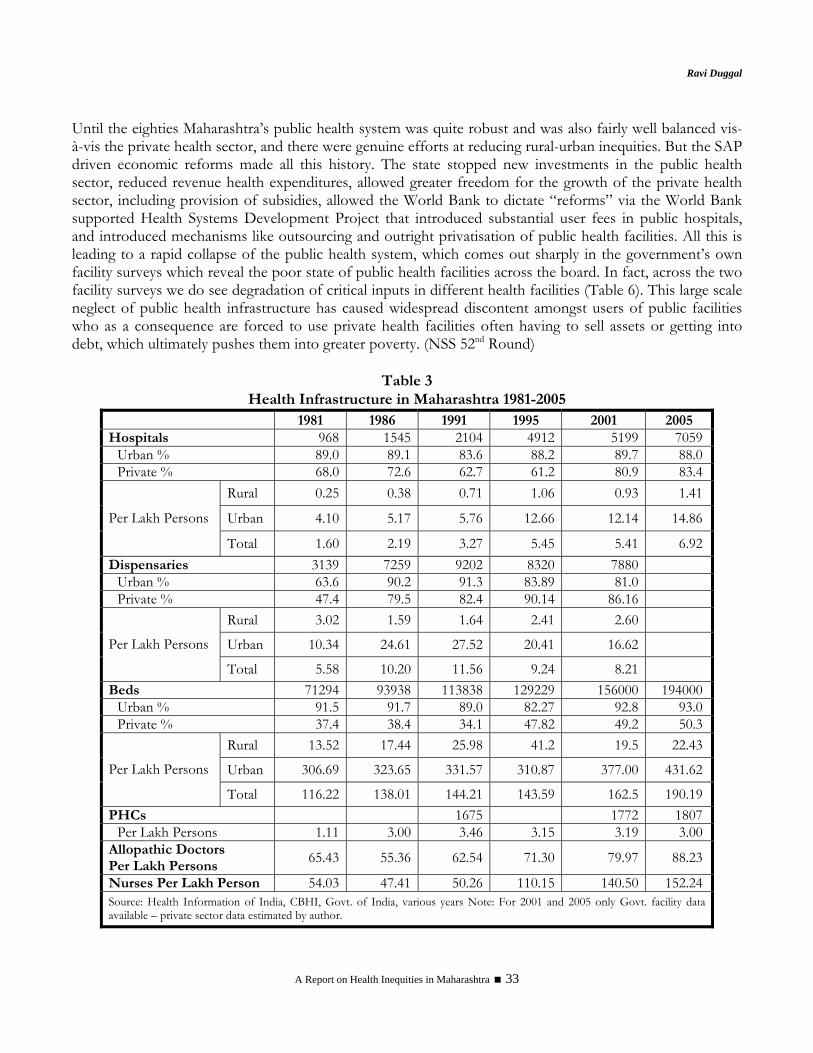
Ravi Duggal
A Report on Health Inequities in Maharashtra 33
Until the eighties Maharashtra’s public health system was quite robust and was also fairly well balanced vis-à-vis the private health sector, and there were genuine efforts at reducing rural-urban inequities. But the SAP driven economic reforms made all this history. The state stopped new investments in the public health sector, reduced revenue health expenditures, allowed greater freedom for the growth of the private health sector, including provision of subsidies, allowed the World Bank to dictate “reforms” via the World Bank supported Health Systems Development Project that introduced substantial user fees in public hospitals, and introduced mechanisms like outsourcing and outright privatisation of public health facilities. All this is leading to a rapid collapse of the public health system, which comes out sharply in the government’s own facility surveys which reveal the poor state of public health facilities across the board. In fact, across the two facility surveys we do see degradation of critical inputs in different health facilities (Table 6). This large scale neglect of public health infrastructure has caused widespread discontent amongst users of public facilities who as a consequence are forced to use private health facilities often having to sell assets or getting into debt, which ultimately pushes them into greater poverty. (NSS 52nd Round)
Table 3
Health Infrastructure in Maharashtra 1981-2005 1981 1986 1991 1995 2001 2005 Hospitals 968 1545 2104 4912 5199 7059
Urban % 89.0 89.1 83.6 88.2 89.7 88.0Private % 68.0 72.6 62.7 61.2 80.9 83.4
Rural 0.25 0.38 0.71 1.06 0.93 1.41
Urban 4.10 5.17 5.76 12.66 12.14 14.86Per Lakh Persons
Total 1.60 2.19 3.27 5.45 5.41 6.92Dispensaries 3139 7259 9202 8320 7880
Urban % 63.6 90.2 91.3 83.89 81.0 Private % 47.4 79.5 82.4 90.14 86.16
Rural 3.02 1.59 1.64 2.41 2.60
Urban 10.34 24.61 27.52 20.41 16.62 Per Lakh Persons
Total 5.58 10.20 11.56 9.24 8.21 Beds 71294 93938 113838 129229 156000 194000
Urban % 91.5 91.7 89.0 82.27 92.8 93.0Private % 37.4 38.4 34.1 47.82 49.2 50.3
Rural 13.52 17.44 25.98 41.2 19.5 22.43
Urban 306.69 323.65 331.57 310.87 377.00 431.62Per Lakh Persons
Total 116.22 138.01 144.21 143.59 162.5 190.19PHCs 1675 1772 1807
Per Lakh Persons 1.11 3.00 3.46 3.15 3.19 3.00Allopathic Doctors Per Lakh Persons
65.43 55.36 62.54 71.30 79.97 88.23
Nurses Per Lakh Person 54.03 47.41 50.26 110.15 140.50 152.24Source: Health Information of India, CBHI, Govt. of India, various years Note: For 2001 and 2005 only Govt. facility data available – private sector data estimated by author.
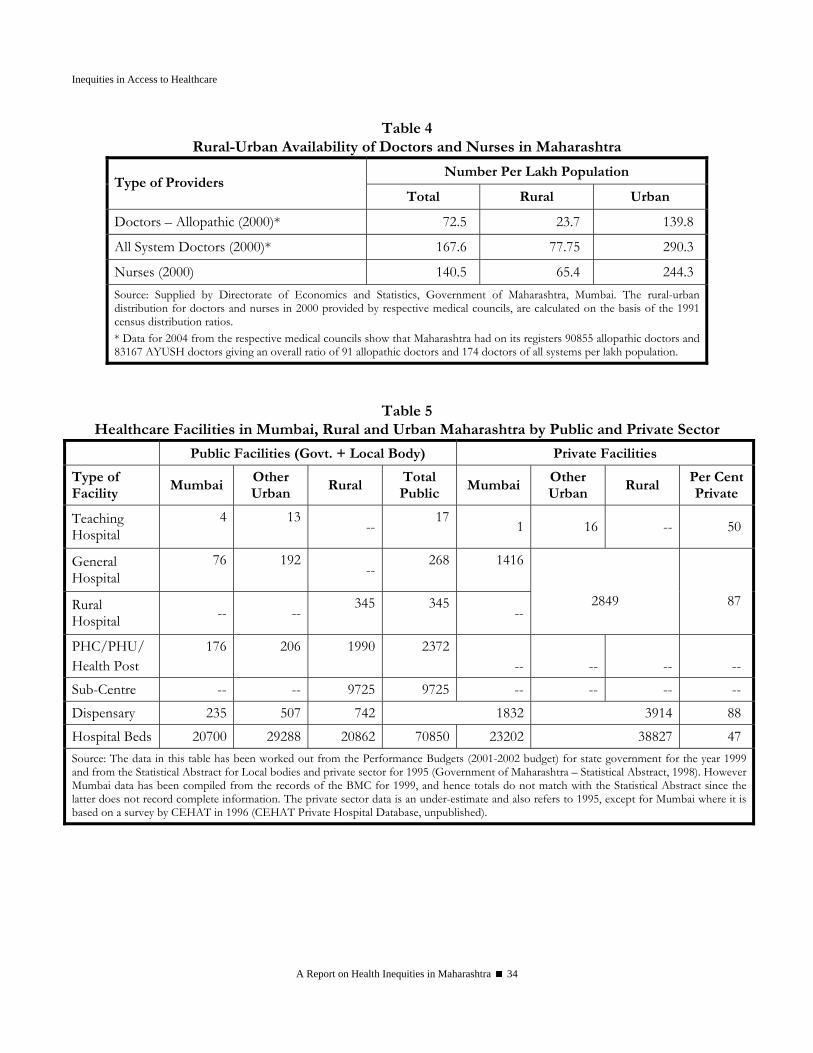
Inequities in Access to Healthcare
A Report on Health Inequities in Maharashtra 34
Table 4 Rural-Urban Availability of Doctors and Nurses in Maharashtra
Number Per Lakh Population Type of Providers
Total Rural Urban
Doctors – Allopathic (2000)* 72.5 23.7 139.8
All System Doctors (2000)* 167.6 77.75 290.3
Nurses (2000) 140.5 65.4 244.3 Source: Supplied by Directorate of Economics and Statistics, Government of Maharashtra, Mumbai. The rural-urban distribution for doctors and nurses in 2000 provided by respective medical councils, are calculated on the basis of the 1991 census distribution ratios. * Data for 2004 from the respective medical councils show that Maharashtra had on its registers 90855 allopathic doctors and 83167 AYUSH doctors giving an overall ratio of 91 allopathic doctors and 174 doctors of all systems per lakh population.
Table 5 Healthcare Facilities in Mumbai, Rural and Urban Maharashtra by Public and Private Sector
Public Facilities (Govt. + Local Body) Private Facilities
Type of Facility
Mumbai Other Urban
Rural Total Public
Mumbai Other Urban
Rural Per Cent Private
Teaching Hospital
4
13
--17
1 16 -- 50
General Hospital
76
192
--268 1416
Rural Hospital -- --
345 345 --
2849
87
PHC/PHU/ Health Post
176
206
1990 2372 --
--
--
--
Sub-Centre -- -- 9725 9725 -- -- -- -- Dispensary 235 507 742 1832 3914 88 Hospital Beds 20700 29288 20862 70850 23202 38827 47 Source: The data in this table has been worked out from the Performance Budgets (2001-2002 budget) for state government for the year 1999 and from the Statistical Abstract for Local bodies and private sector for 1995 (Government of Maharashtra – Statistical Abstract, 1998). However Mumbai data has been compiled from the records of the BMC for 1999, and hence totals do not match with the Statistical Abstract since the latter does not record complete information. The private sector data is an under-estimate and also refers to 1995, except for Mumbai where it is based on a survey by CEHAT in 1996 (CEHAT Private Hospital Database, unpublished).
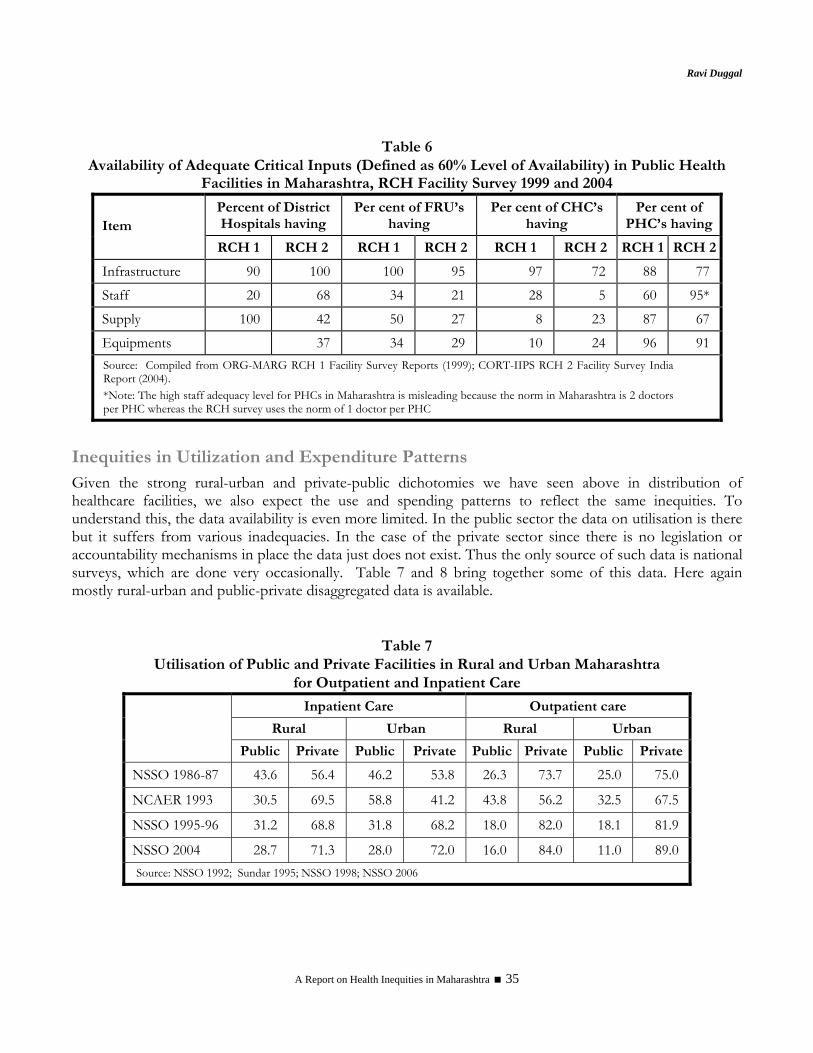
Ravi Duggal
A Report on Health Inequities in Maharashtra 35
Table 6
Availability of Adequate Critical Inputs (Defined as 60% Level of Availability) in Public Health Facilities in Maharashtra, RCH Facility Survey 1999 and 2004
Percent of District Hospitals having
Per cent of FRU’s having
Per cent of CHC’s having
Per cent of PHC’s havingItem
RCH 1 RCH 2 RCH 1 RCH 2 RCH 1 RCH 2 RCH 1 RCH 2
Infrastructure 90 100 100 95 97 72 88 77
Staff 20 68 34 21 28 5 60 95*
Supply 100 42 50 27 8 23 87 67
Equipments 37 34 29 10 24 96 91 Source: Compiled from ORG-MARG RCH 1 Facility Survey Reports (1999); CORT-IIPS RCH 2 Facility Survey India Report (2004). *Note: The high staff adequacy level for PHCs in Maharashtra is misleading because the norm in Maharashtra is 2 doctors per PHC whereas the RCH survey uses the norm of 1 doctor per PHC
Inequities in Utilization and Expenditure Patterns Given the strong rural-urban and private-public dichotomies we have seen above in distribution of healthcare facilities, we also expect the use and spending patterns to reflect the same inequities. To understand this, the data availability is even more limited. In the public sector the data on utilisation is there but it suffers from various inadequacies. In the case of the private sector since there is no legislation or accountability mechanisms in place the data just does not exist. Thus the only source of such data is national surveys, which are done very occasionally. Table 7 and 8 bring together some of this data. Here again mostly rural-urban and public-private disaggregated data is available.
Table 7 Utilisation of Public and Private Facilities in Rural and Urban Maharashtra
for Outpatient and Inpatient Care
Inpatient Care Outpatient care
Rural Urban Rural Urban
Public Private Public Private Public Private Public Private
NSSO 1986-87 43.6 56.4 46.2 53.8 26.3 73.7 25.0 75.0
NCAER 1993 30.5 69.5 58.8 41.2 43.8 56.2 32.5 67.5
NSSO 1995-96 31.2 68.8 31.8 68.2 18.0 82.0 18.1 81.9
NSSO 2004 28.7 71.3 28.0 72.0 16.0 84.0 11.0 89.0 Source: NSSO 1992; Sundar 1995; NSSO 1998; NSSO 2006

Inequities in Access to Healthcare
A Report on Health Inequities in Maharashtra 36
Table 8 Percent Using Public Facilities for Various Health Services Across Rural and Urban Areas#
Type of Services Rural Urban All Inpatient Care Services3 31.2 31.8 31.4 Outpatient Care Services3 18.0 18.1 18.0 Ante Natal Care Services2 53.0 39.6 48.8 Pregnancy Complications2 50.0 29.8 40.0 Delivery Care2 53.3 43.2 48.7 Post Delivery Complications2 36.3 36.7 36.5 Contraceptive Methods1
(a) Pill 28.6 10.6 18.1 (b) IUD * 28.1 29.8 (c) Condom 27.3 14.4 19.9 (d) Female Sterilisation 89.9 69.4 82.3 (e) Male Sterilisation 96.4 77.0 93.1 (f) All Modern Methods 85.5 59.1 75.2
Immunisation of Children2 89.1 67.1 82.7 Diarrhoea & Pneumonia2 (for Children) 13.6 10.0 12.5
# The figures are per cent using public facilities from amongst all users - the balance used private facilities 1 IIPS and ORC, Macro 2000; 2 IIPS 2000; 3 NSSO 1998 * number using IUD in rural areas are very few
The four surveys from which the data is drawn, and especially the three NSSO surveys, clearly show a trend of declining use of public health facilities for both outpatient and inpatient care (Table 7). Both outpatient and inpatient usage of public health facilities have dropped but the latter has dropped more drastically. This reflects the emergence of sharper inequities because hospitalization is often catastrophic and leads to impoverishment and indebtedness. Additionally, increased dependence on the private sector without any risk cover like insurance or social security, can take a toll of even middle class households when serious illness strikes. This is a very clear trend of growing inequities that we see in access to curative care. This trend has a logical relationship with declining public health investment and expenditure and neglect of the public health infrastructure. Together they lead to enhancing inequities for access to healthcare. Another linked logical factor is the emergence of private health insurance which is affordable only for the middle and upper middle classes and this becomes a mechanism to further widen the gap in healthcare access amongst classes because the poorer classes and/or those in the unorganized sector cannot afford to pay private health insurance premiums. Moreover, increasingly private healthcare, especially for hospitalizations, is becoming associated with insurance coverage and this pushes the middle classes who can afford insurance to use the high end hospitals which insurance companies favour and move away from the small hospital or nursing home segment. The impact of this is that the patient load of the smaller hospitals is getting eroded and this also reduces the possibilities of cross-subsidy which these smaller private hospitals could provide to their poor clientele9.
9 In a recent study in one of the taluka’s of Pune district we found that the smaller hospitals/nursing homes (5-15 bedded) were being threatened by the changing political economy of the private health markets. One response for survival was that few of the owners came together to pool their resources and set up a larger 100 bedded sophisticated multi-specialty hospital. And the other response was to convert outpatient care into day care cases or overnight cases, often using unnecessary and unjustified medical and surgical interventions, so that they had adequate turnover to survive as a small hospital. (CEHAT Unit Cost Study, awaiting publication)
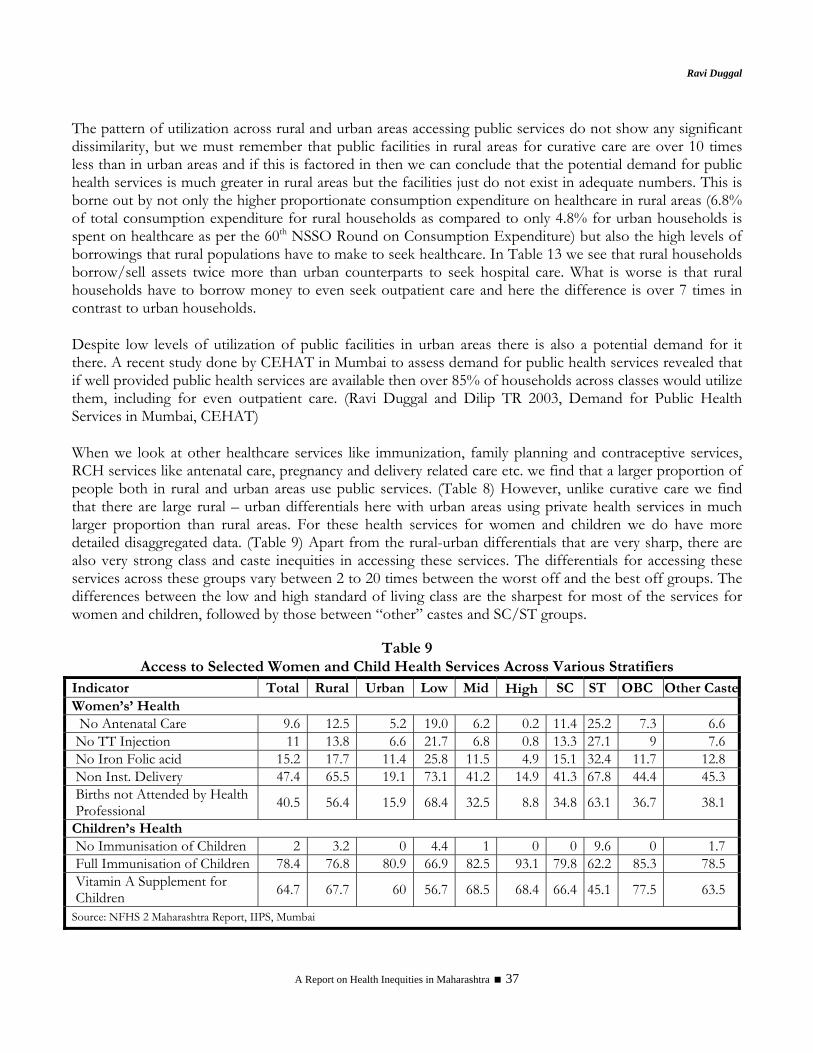
Ravi Duggal
A Report on Health Inequities in Maharashtra 37
The pattern of utilization across rural and urban areas accessing public services do not show any significant dissimilarity, but we must remember that public facilities in rural areas for curative care are over 10 times less than in urban areas and if this is factored in then we can conclude that the potential demand for public health services is much greater in rural areas but the facilities just do not exist in adequate numbers. This is borne out by not only the higher proportionate consumption expenditure on healthcare in rural areas (6.8% of total consumption expenditure for rural households as compared to only 4.8% for urban households is spent on healthcare as per the 60th NSSO Round on Consumption Expenditure) but also the high levels of borrowings that rural populations have to make to seek healthcare. In Table 13 we see that rural households borrow/sell assets twice more than urban counterparts to seek hospital care. What is worse is that rural households have to borrow money to even seek outpatient care and here the difference is over 7 times in contrast to urban households. Despite low levels of utilization of public facilities in urban areas there is also a potential demand for it there. A recent study done by CEHAT in Mumbai to assess demand for public health services revealed that if well provided public health services are available then over 85% of households across classes would utilize them, including for even outpatient care. (Ravi Duggal and Dilip TR 2003, Demand for Public Health Services in Mumbai, CEHAT) When we look at other healthcare services like immunization, family planning and contraceptive services, RCH services like antenatal care, pregnancy and delivery related care etc. we find that a larger proportion of people both in rural and urban areas use public services. (Table 8) However, unlike curative care we find that there are large rural – urban differentials here with urban areas using private health services in much larger proportion than rural areas. For these health services for women and children we do have more detailed disaggregated data. (Table 9) Apart from the rural-urban differentials that are very sharp, there are also very strong class and caste inequities in accessing these services. The differentials for accessing these services across these groups vary between 2 to 20 times between the worst off and the best off groups. The differences between the low and high standard of living class are the sharpest for most of the services for women and children, followed by those between “other” castes and SC/ST groups.
Table 9 Access to Selected Women and Child Health Services Across Various Stratifiers
Indicator Total Rural Urban Low Mid High SC ST OBC Other CasteWomen’s’ Health
No Antenatal Care 9.6 12.5 5.2 19.0 6.2 0.2 11.4 25.2 7.3 6.6 No TT Injection 11 13.8 6.6 21.7 6.8 0.8 13.3 27.1 9 7.6 No Iron Folic acid 15.2 17.7 11.4 25.8 11.5 4.9 15.1 32.4 11.7 12.8 Non Inst. Delivery 47.4 65.5 19.1 73.1 41.2 14.9 41.3 67.8 44.4 45.3 Births not Attended by Health Professional 40.5 56.4 15.9 68.4 32.5 8.8 34.8 63.1 36.7 38.1
Children’s Health No Immunisation of Children 2 3.2 0 4.4 1 0 0 9.6 0 1.7 Full Immunisation of Children 78.4 76.8 80.9 66.9 82.5 93.1 79.8 62.2 85.3 78.5 Vitamin A Supplement for Children 64.7 67.7 60 56.7 68.5 68.4 66.4 45.1 77.5 63.5
Source: NFHS 2 Maharashtra Report, IIPS, Mumbai

Inequities in Access to Healthcare
A Report on Health Inequities in Maharashtra 38
Caste and Class Inequities In India class is not the only defining factor in health related inequities in society but there is also caste to contend with. This is not very different from race as a factor in social inequities in the west. Like in the case of race, caste and class inequities go together. Invariably the “lower” castes are also the lower classes. Thus the distribution of healthcare access variables follows a similar trajectory across classes and caste groups. The data on class as a factor is not based on income or occupational groups in India as this kind of data is not collected in socio-economic surveys because of obvious difficulties. The National Sample survey collects consumption data and has developed the monthly per capita consumption classes and these can be grouped as quintiles. The National Family Health surveys have developed class categories on the basis of a specific basket of asset ownership and grouped them as low, medium and high on the basis of defined scores10. In the case of caste, standardized categories are used across all surveys – Scheduled tribes (constitutionally recognized tribal groups), scheduled castes (the erstwhile “untouchable” castes as recognized by the Constitution), other backward class (most of the lower caste groups) and other castes (representing mostly the upper and middle castes). The class/caste stratified data across various healthcare related variables in Tables 10 to 14 and Annexure 1 demonstrate sharp differentials in most cases indicating that the healthcare system is highly iniquitous. When we look at access to public health facilities we do find that as expected the lower classes and SC/ST groups are the largest users of both outpatient and inpatient care across classes and caste groups but overall this percentage is not very high (for SC 27% for OPD and 49% for inpatient care) indicating a substantial dependence of these underprivileged groups on the private health sector. The latter gets very clearly reflected in the high rates for not seeking treatment when ill and the significantly lower rates of hospitalization for these groups as compared to the better off groups. Further between 1996 and 2004 the situation on these counts for the underprivileged groups has worsened, especially for not seeking care and inpatient utilization rates in public facilities – this is strong evidence of the collapsing public health sector and reduced access of the poorer/ socially underprivileged groups during this period of intensified capitalist globalization and privatisation. In the case of maternity services like antenatal care and deliveries the inequities are even sharper. For instance the difference between the top and bottom quintile in terms of proportion of women not accessing antenatal care is ten times and for home deliveries nearly 3 times. Similarly the difference for this between the SC/ST and other castes is 2.5 times. (Table 12) In terms of healthcare spending while the average expenditure of the bottom quintile and the SC/ST is lower than others, it is still a substantial burden on these households given that an overwhelming proportion of them are below the poverty threshold. Another critical set of variables which reflect inequity in access to healthcare are indebtedness due to seeking treatment on one hand (Table 13) and financial reason being the main cause of not seeking care on the other hand (Table 10). Both these have very sharp class and caste differentials ranging from 2 to 7 times, the caste inequities being much stronger in both these cases. For instance between ST and other caste the
10 In NFHS-3 it is called the wealth index and is now a 5 point scale which divides the population into quintiles at the all India level
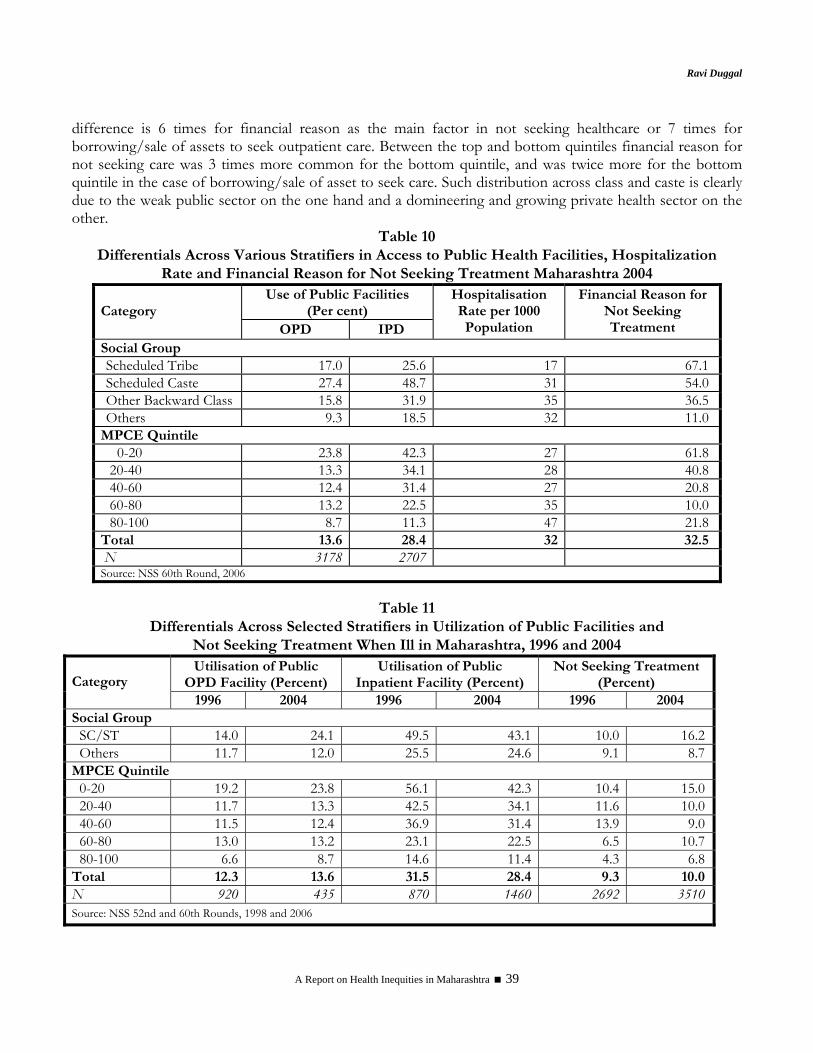
Ravi Duggal
A Report on Health Inequities in Maharashtra 39
difference is 6 times for financial reason as the main factor in not seeking healthcare or 7 times for borrowing/sale of assets to seek outpatient care. Between the top and bottom quintiles financial reason for not seeking care was 3 times more common for the bottom quintile, and was twice more for the bottom quintile in the case of borrowing/sale of asset to seek care. Such distribution across class and caste is clearly due to the weak public sector on the one hand and a domineering and growing private health sector on the other.
Table 10 Differentials Across Various Stratifiers in Access to Public Health Facilities, Hospitalization
Rate and Financial Reason for Not Seeking Treatment Maharashtra 2004 Use of Public Facilities
(Per cent) Category OPD IPD
Hospitalisation Rate per 1000 Population
Financial Reason for Not Seeking Treatment
Social Group Scheduled Tribe 17.0 25.6 17 67.1 Scheduled Caste 27.4 48.7 31 54.0 Other Backward Class 15.8 31.9 35 36.5 Others 9.3 18.5 32 11.0
MPCE Quintile 0-20 23.8 42.3 27 61.8 20-40 13.3 34.1 28 40.8 40-60 12.4 31.4 27 20.8 60-80 13.2 22.5 35 10.0 80-100 8.7 11.3 47 21.8
Total 13.6 28.4 32 32.5 N 3178 2707Source: NSS 60th Round, 2006
Table 11 Differentials Across Selected Stratifiers in Utilization of Public Facilities and
Not Seeking Treatment When Ill in Maharashtra, 1996 and 2004 Utilisation of Public
OPD Facility (Percent) Utilisation of Public
Inpatient Facility (Percent) Not Seeking Treatment
(Percent) Category 1996 2004 1996 2004 1996 2004
Social Group SC/ST 14.0 24.1 49.5 43.1 10.0 16.2Others 11.7 12.0 25.5 24.6 9.1 8.7
MPCE Quintile 0-20 19.2 23.8 56.1 42.3 10.4 15.020-40 11.7 13.3 42.5 34.1 11.6 10.040-60 11.5 12.4 36.9 31.4 13.9 9.060-80 13.0 13.2 23.1 22.5 6.5 10.780-100 6.6 8.7 14.6 11.4 4.3 6.8
Total 12.3 13.6 31.5 28.4 9.3 10.0N 920 435 870 1460 2692 3510Source: NSS 52nd and 60th Rounds, 1998 and 2006

Inequities in Access to Healthcare
A Report on Health Inequities in Maharashtra 40
Table 12 Access to Maternity Services and Average Expenditure by Selected Stratifiers Maharashtra 2004
Category No
ANC ANC
Expenditure Home
Delivery Delivery
Expenditure No
PNC
PNC Expendit
ure Social Group Scheduled Caste/Tribe 25.5 478 48.0 1517 51.4 357
Other Backward Class 16.3 1061 34.8 2014 24.4 451Others 11.4 1015 19.4 2892 29.3 521
MPCE Quintile 0-20 24.0 393 37.6 1127 41.3 27020-40 22.1 694 37.2 2008 37.5 33740-60 11.6 940 26.3 2031 30.6 48060-80 17.0 858 40.1 3123 29.9 60280-100 2.4 1962 14.4 5476 18.7 909
Total 16.8 903 32.4 2226 34.0 462N 99 542 114 458 135 328
Table 13 Inequities Across Class and Caste on Health Care Expenditures and
Borrowings and Sale of Assets, Maharashtra 2004
Average Expenditure on Seeking Care (Rupees)
Borrowings and Sale of Assets (Per cent of Households) for
Seeking Healthcare
Category OPD Inpatient OPD Inpatient Social Group Scheduled Tribe 184 4284 42.2 53.5 Scheduled Caste 243 5013 26.3 45.7 Other Backward Class 188 5858 14.0 40.6 Others 323 9901 6.0 30.5 MPCE Quintile 0-20 161 4668 18.6 53.0 20-40 211 6784 9.2 37.1 40-60 245 6716 15.0 35.5 60-80 326 9584 3.2 35.4 80-100 350 10240 13.5 26.5 Rural 235 5709 20.2 49.9 Urban 302 9776 2.8 24.1 Total 266 7426 11.2 35.6 N 2637 2526 Source: NSS 60th Round, 2006
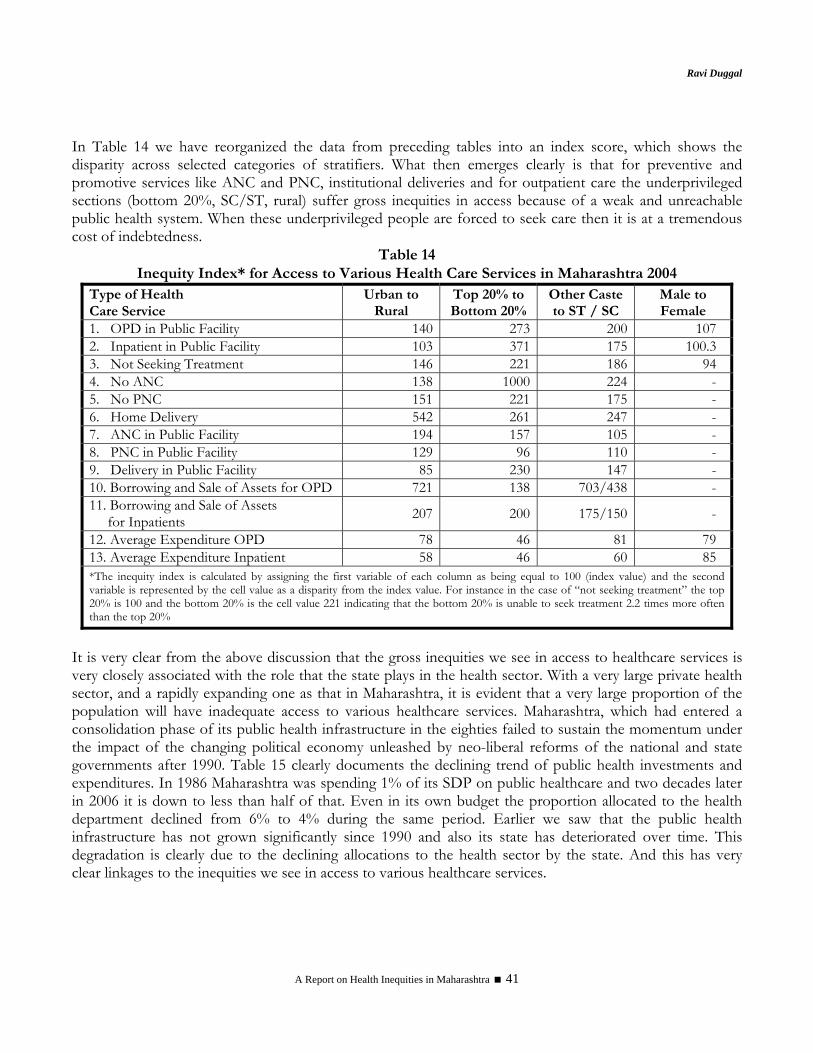
Ravi Duggal
A Report on Health Inequities in Maharashtra 41
In Table 14 we have reorganized the data from preceding tables into an index score, which shows the disparity across selected categories of stratifiers. What then emerges clearly is that for preventive and promotive services like ANC and PNC, institutional deliveries and for outpatient care the underprivileged sections (bottom 20%, SC/ST, rural) suffer gross inequities in access because of a weak and unreachable public health system. When these underprivileged people are forced to seek care then it is at a tremendous cost of indebtedness.
Table 14 Inequity Index* for Access to Various Health Care Services in Maharashtra 2004
Type of Health Care Service
Urban to Rural
Top 20% to Bottom 20%
Other Caste to ST / SC
Male to Female
1. OPD in Public Facility 140 273 200 107 2. Inpatient in Public Facility 103 371 175 100.3 3. Not Seeking Treatment 146 221 186 94 4. No ANC 138 1000 224 - 5. No PNC 151 221 175 - 6. Home Delivery 542 261 247 - 7. ANC in Public Facility 194 157 105 - 8. PNC in Public Facility 129 96 110 - 9. Delivery in Public Facility 85 230 147 - 10. Borrowing and Sale of Assets for OPD 721 138 703/438 - 11. Borrowing and Sale of Assets for Inpatients 207 200 175/150 -
12. Average Expenditure OPD 78 46 81 79 13. Average Expenditure Inpatient 58 46 60 85 *The inequity index is calculated by assigning the first variable of each column as being equal to 100 (index value) and the second variable is represented by the cell value as a disparity from the index value. For instance in the case of “not seeking treatment” the top 20% is 100 and the bottom 20% is the cell value 221 indicating that the bottom 20% is unable to seek treatment 2.2 times more often than the top 20%
It is very clear from the above discussion that the gross inequities we see in access to healthcare services is very closely associated with the role that the state plays in the health sector. With a very large private health sector, and a rapidly expanding one as that in Maharashtra, it is evident that a very large proportion of the population will have inadequate access to various healthcare services. Maharashtra, which had entered a consolidation phase of its public health infrastructure in the eighties failed to sustain the momentum under the impact of the changing political economy unleashed by neo-liberal reforms of the national and state governments after 1990. Table 15 clearly documents the declining trend of public health investments and expenditures. In 1986 Maharashtra was spending 1% of its SDP on public healthcare and two decades later in 2006 it is down to less than half of that. Even in its own budget the proportion allocated to the health department declined from 6% to 4% during the same period. Earlier we saw that the public health infrastructure has not grown significantly since 1990 and also its state has deteriorated over time. This degradation is clearly due to the declining allocations to the health sector by the state. And this has very clear linkages to the inequities we see in access to various healthcare services.
Inequities in Access to Healthcare
A Report on Health Inequities in Maharashtra 42
At one level while allocations are declining at another level we see built in inequities in public resource allocation within the health sector. The rural and urban areas get a different mix of healthcare services. There is what one may call a curative-preventive dichotomy in distribution of public resources for health between urban and rural areas. (see Table 16) An overwhelming proportion of curative care services like hospitals and dispensaries are located in urban areas. They take over 95% of the medical care budget, which means that rural facilities like PHCs and rural hospitals and dispensaries which cover 60% of the states population gets less than 5% of the curative services budget. In contrast 89% of the family planning program budget is spent on rural areas. Other heads like public health (disease programs), MCH etc. are proportionately allocated. In Table 16, which has data for 2001-02, we see that all capital expenditure (which is anyway very small) was allocated to urban areas. These inequities in distribution of resources for various services in rural and urban areas clearly indicate that allocation of resources is not evidence based and is still allocated based on the colonial paradigm of curative care for urban areas and preventive/ promotive care for rural areas. This not only creates avoidable inequities but also indicates that health policy is highly skewed in favour of the urban population, which is largely in the organized sector. Tables 17 and 17A provide further evidence from households whose out of pocket expenditure for healthcare has been growing over time. Out of pocket spending in both public and private hospitals has grown with the gap between the two narrowing as user fees have been increased substantially in the public hospitals at the turn of the millennium. Further in Table 18 and Table 19 we see that there is a clear gradient across classes, gender and social groups with the lowest quintile, women and tribals getting the least out of pocket resources for accessing healthcare, and for each of these groups the inequity in access is much higher in urban areas in the case of outpatient expenditure. Across 52nd and 60th Round we also see that the burden for the underprivileged groups has increased with the proportion of out-of-pocket spending increasing significantly more for these groups and as a consequence the gap between the rich and the poor in healthcare spending out of pocket has narrowed. Table 19 This is clearly indicative of growing inequity in healthcare access as the underprivileged groups are forced to spend much larger amounts of their income on seeking healthcare from both the private and public sectors. One more interesting fact is thrown up by the 60th round data for household health expenditure. Prior to that in Maharashtra out of pocket expenses were higher in rural areas, which could be taken to mean that public health services in urban areas, which anyway have 10 times more density of public health facilities, were being utilized effectively. The 60th round data of NSSO shows a complete about turn with urban out of pocket spending overtaking rural spending substantially (Tables 17 and 17A), and this clearly can be interpreted as reduced access to public health services in urban areas both due to its growing inadequacy as well as due to introduction of substantial user fees in public hospitals11. This has only further heightened inequities in access to healthcare services. The severity of out of pocket spending is further heightened when we look at non-treatment for illnesses and the reasons thereof. In 1996 11.4% of rural ailments and 7.7% of urban ailments were untreated and of these 20% and 25%, respectively were due to financial reasons. In 2004 financial reason for rural households had more than doubled to 41%, though it declined to 19% in urban areas. (Tables 10 and 11)
11 Data on user fees for 2003-04 obtained from the Directorate of Health Services, Maharashtra, reveals that the average annual collection of a district hospital was Rs 21 lakhs and expenditure only Rs 7 lakhs or just one-third. In July 2003 the average unutilized funds per district in the user fund account was a whopping Rs 31 lakhs per hospital
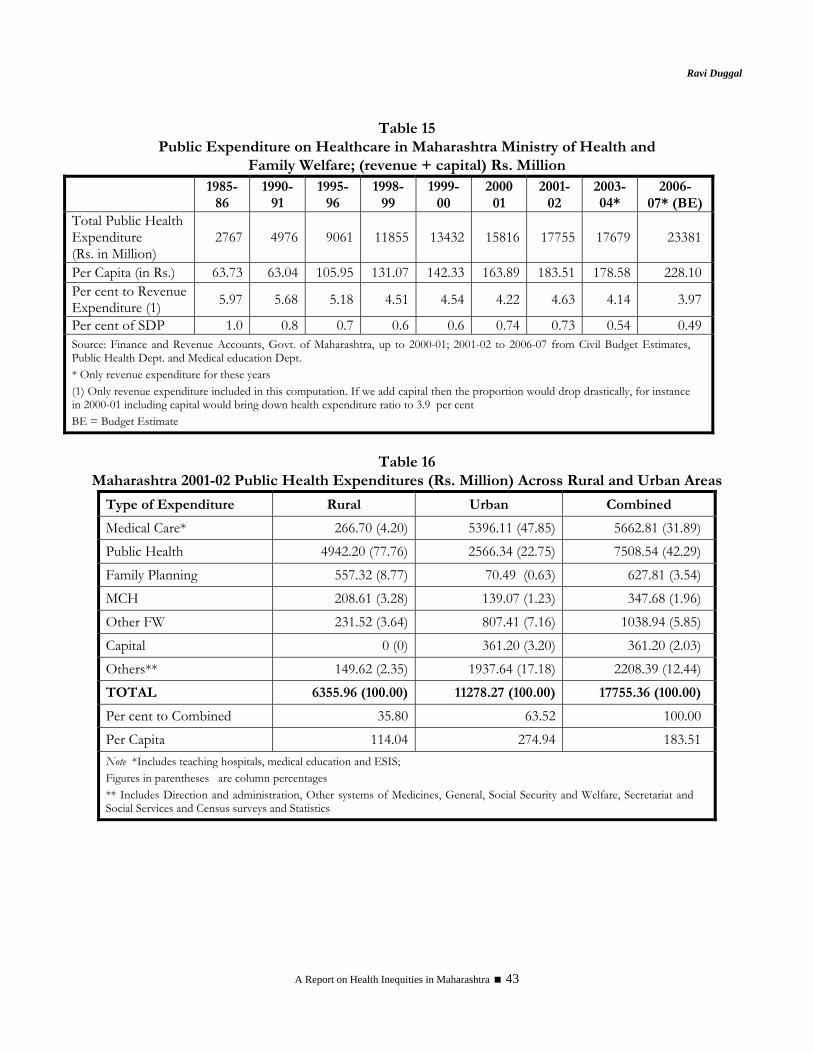
Ravi Duggal
A Report on Health Inequities in Maharashtra 43
Table 15 Public Expenditure on Healthcare in Maharashtra Ministry of Health and
Family Welfare; (revenue + capital) Rs. Million
1985-86
1990-91
1995-96
1998- 99
1999- 00
2000 01
2001- 02
2003-04*
2006- 07* (BE)
Total Public Health Expenditure (Rs. in Million)
2767 4976 9061 11855 13432 15816 17755 17679 23381
Per Capita (in Rs.) 63.73 63.04 105.95 131.07 142.33 163.89 183.51 178.58 228.10 Per cent to Revenue Expenditure (1) 5.97 5.68 5.18 4.51 4.54 4.22 4.63 4.14 3.97
Per cent of SDP 1.0 0.8 0.7 0.6 0.6 0.74 0.73 0.54 0.49 Source: Finance and Revenue Accounts, Govt. of Maharashtra, up to 2000-01; 2001-02 to 2006-07 from Civil Budget Estimates, Public Health Dept. and Medical education Dept. * Only revenue expenditure for these years (1) Only revenue expenditure included in this computation. If we add capital then the proportion would drop drastically, for instance in 2000-01 including capital would bring down health expenditure ratio to 3.9 per cent BE = Budget Estimate
Table 16
Maharashtra 2001-02 Public Health Expenditures (Rs. Million) Across Rural and Urban Areas
Type of Expenditure Rural Urban Combined
Medical Care* 266.70 (4.20) 5396.11 (47.85) 5662.81 (31.89) Public Health 4942.20 (77.76) 2566.34 (22.75) 7508.54 (42.29) Family Planning 557.32 (8.77) 70.49 (0.63) 627.81 (3.54) MCH 208.61 (3.28) 139.07 (1.23) 347.68 (1.96) Other FW 231.52 (3.64) 807.41 (7.16) 1038.94 (5.85) Capital 0 (0) 361.20 (3.20) 361.20 (2.03) Others** 149.62 (2.35) 1937.64 (17.18) 2208.39 (12.44) TOTAL 6355.96 (100.00) 11278.27 (100.00) 17755.36 (100.00)
Per cent to Combined 35.80 63.52 100.00 Per Capita 114.04 274.94 183.51 Note *Includes teaching hospitals, medical education and ESIS; Figures in parentheses are column percentages ** Includes Direction and administration, Other systems of Medicines, General, Social Security and Welfare, Secretariat and Social Services and Census surveys and Statistics
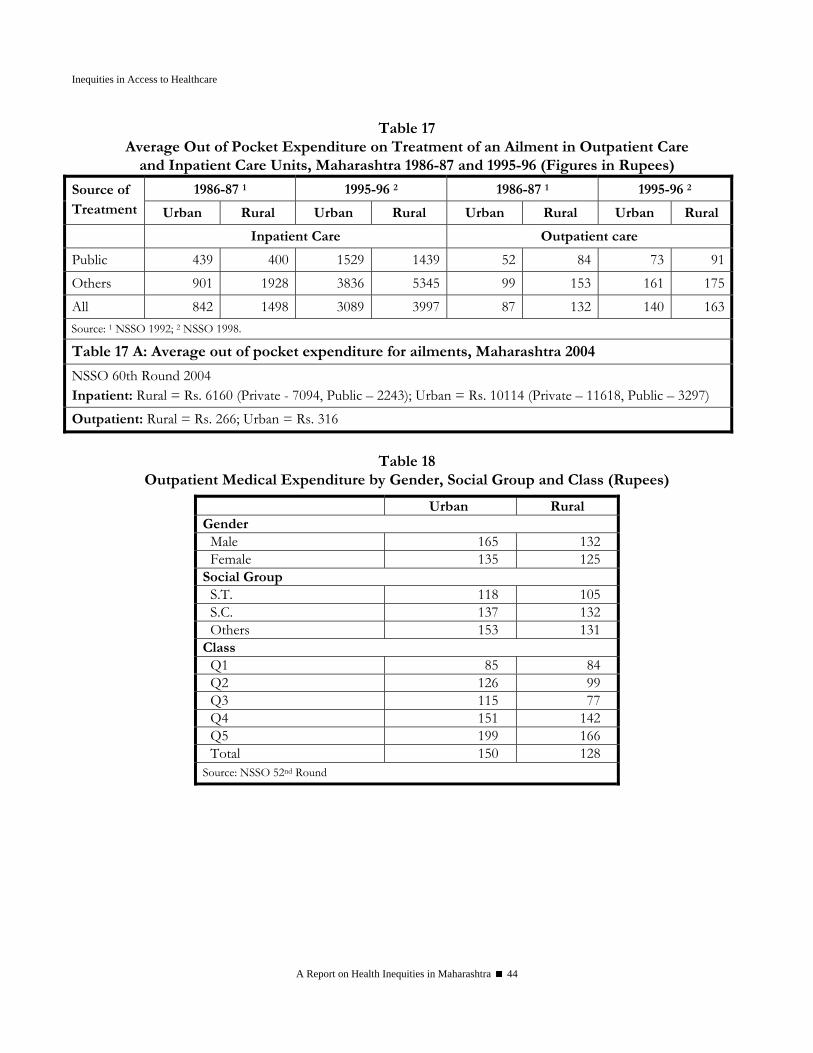
Inequities in Access to Healthcare
A Report on Health Inequities in Maharashtra 44
Table 17 Average Out of Pocket Expenditure on Treatment of an Ailment in Outpatient Care
and Inpatient Care Units, Maharashtra 1986-87 and 1995-96 (Figures in Rupees)
1986-87 1 1995-96 2 1986-87 1 1995-96 2 Source of Treatment Urban Rural Urban Rural Urban Rural Urban Rural
Inpatient Care Outpatient care
Public 439 400 1529 1439 52 84 73 91Others 901 1928 3836 5345 99 153 161 175All 842 1498 3089 3997 87 132 140 163
Source: 1 NSSO 1992; 2 NSSO 1998.
Table 17 A: Average out of pocket expenditure for ailments, Maharashtra 2004
NSSO 60th Round 2004 Inpatient: Rural = Rs. 6160 (Private - 7094, Public – 2243); Urban = Rs. 10114 (Private – 11618, Public – 3297) Outpatient: Rural = Rs. 266; Urban = Rs. 316
Table 18
Outpatient Medical Expenditure by Gender, Social Group and Class (Rupees)
Urban Rural Gender
Male 165 132 Female 135 125
Social Group S.T. 118 105 S.C. 137 132 Others 153 131
Class Q1 85 84 Q2 126 99 Q3 115 77 Q4 151 142 Q5 199 166 Total 150 128
Source: NSSO 52nd Round
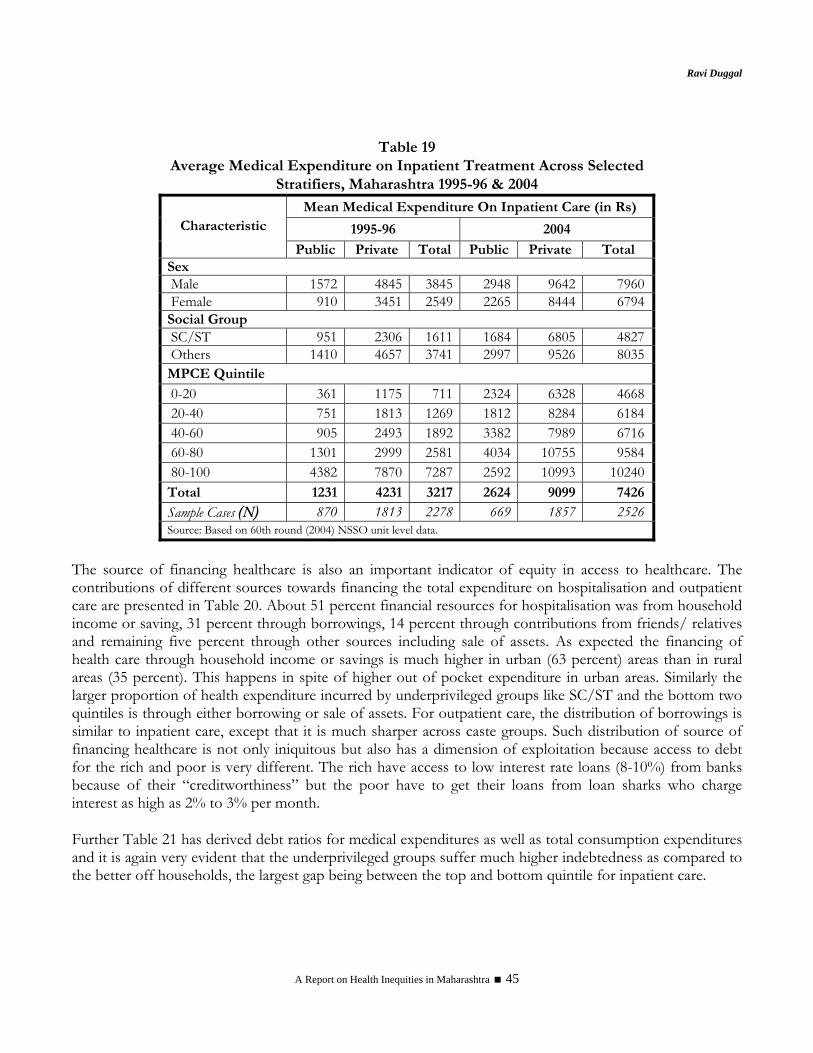
Ravi Duggal
A Report on Health Inequities in Maharashtra 45
Table 19
Average Medical Expenditure on Inpatient Treatment Across Selected Stratifiers, Maharashtra 1995-96 & 2004
Mean Medical Expenditure On Inpatient Care (in Rs)
1995-96 2004 Characteristic
Public Private Total Public Private Total Sex Male 1572 4845 3845 2948 9642 7960 Female 910 3451 2549 2265 8444 6794 Social Group SC/ST 951 2306 1611 1684 6805 4827 Others 1410 4657 3741 2997 9526 8035 MPCE Quintile 0-20 361 1175 711 2324 6328 4668 20-40 751 1813 1269 1812 8284 6184 40-60 905 2493 1892 3382 7989 6716 60-80 1301 2999 2581 4034 10755 9584 80-100 4382 7870 7287 2592 10993 10240 Total 1231 4231 3217 2624 9099 7426
Sample Cases (N) 870 1813 2278 669 1857 2526 Source: Based on 60th round (2004) NSSO unit level data.
The source of financing healthcare is also an important indicator of equity in access to healthcare. The contributions of different sources towards financing the total expenditure on hospitalisation and outpatient care are presented in Table 20. About 51 percent financial resources for hospitalisation was from household income or saving, 31 percent through borrowings, 14 percent through contributions from friends/ relatives and remaining five percent through other sources including sale of assets. As expected the financing of health care through household income or savings is much higher in urban (63 percent) areas than in rural areas (35 percent). This happens in spite of higher out of pocket expenditure in urban areas. Similarly the larger proportion of health expenditure incurred by underprivileged groups like SC/ST and the bottom two quintiles is through either borrowing or sale of assets. For outpatient care, the distribution of borrowings is similar to inpatient care, except that it is much sharper across caste groups. Such distribution of source of financing healthcare is not only iniquitous but also has a dimension of exploitation because access to debt for the rich and poor is very different. The rich have access to low interest rate loans (8-10%) from banks because of their “creditworthiness” but the poor have to get their loans from loan sharks who charge interest as high as 2% to 3% per month.
Further Table 21 has derived debt ratios for medical expenditures as well as total consumption expenditures and it is again very evident that the underprivileged groups suffer much higher indebtedness as compared to the better off households, the largest gap being between the top and bottom quintile for inpatient care.
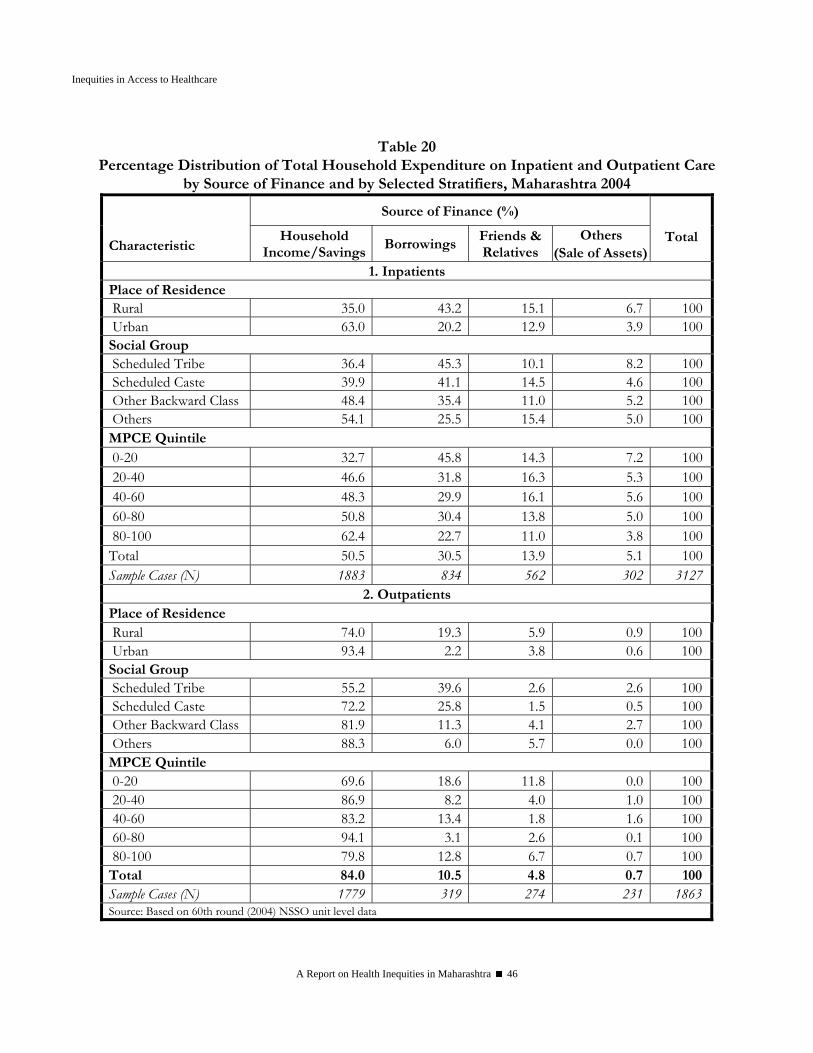
Inequities in Access to Healthcare
A Report on Health Inequities in Maharashtra 46
Table 20
Percentage Distribution of Total Household Expenditure on Inpatient and Outpatient Care by Source of Finance and by Selected Stratifiers, Maharashtra 2004
Source of Finance (%) Characteristic
Household Income/Savings
Borrowings Friends & Relatives
Others (Sale of Assets)
Total
1. Inpatients Place of Residence Rural 35.0 43.2 15.1 6.7 100 Urban 63.0 20.2 12.9 3.9 100Social Group Scheduled Tribe 36.4 45.3 10.1 8.2 100 Scheduled Caste 39.9 41.1 14.5 4.6 100 Other Backward Class 48.4 35.4 11.0 5.2 100 Others 54.1 25.5 15.4 5.0 100MPCE Quintile 0-20 32.7 45.8 14.3 7.2 100 20-40 46.6 31.8 16.3 5.3 100 40-60 48.3 29.9 16.1 5.6 100 60-80 50.8 30.4 13.8 5.0 100 80-100 62.4 22.7 11.0 3.8 100Total 50.5 30.5 13.9 5.1 100Sample Cases (N) 1883 834 562 302 3127
2. Outpatients Place of Residence Rural 74.0 19.3 5.9 0.9 100 Urban 93.4 2.2 3.8 0.6 100Social Group Scheduled Tribe 55.2 39.6 2.6 2.6 100 Scheduled Caste 72.2 25.8 1.5 0.5 100 Other Backward Class 81.9 11.3 4.1 2.7 100 Others 88.3 6.0 5.7 0.0 100MPCE Quintile 0-20 69.6 18.6 11.8 0.0 100 20-40 86.9 8.2 4.0 1.0 100 40-60 83.2 13.4 1.8 1.6 100 60-80 94.1 3.1 2.6 0.1 100 80-100 79.8 12.8 6.7 0.7 100Total 84.0 10.5 4.8 0.7 100Sample Cases (N) 1779 319 274 231 1863Source: Based on 60th round (2004) NSSO unit level data
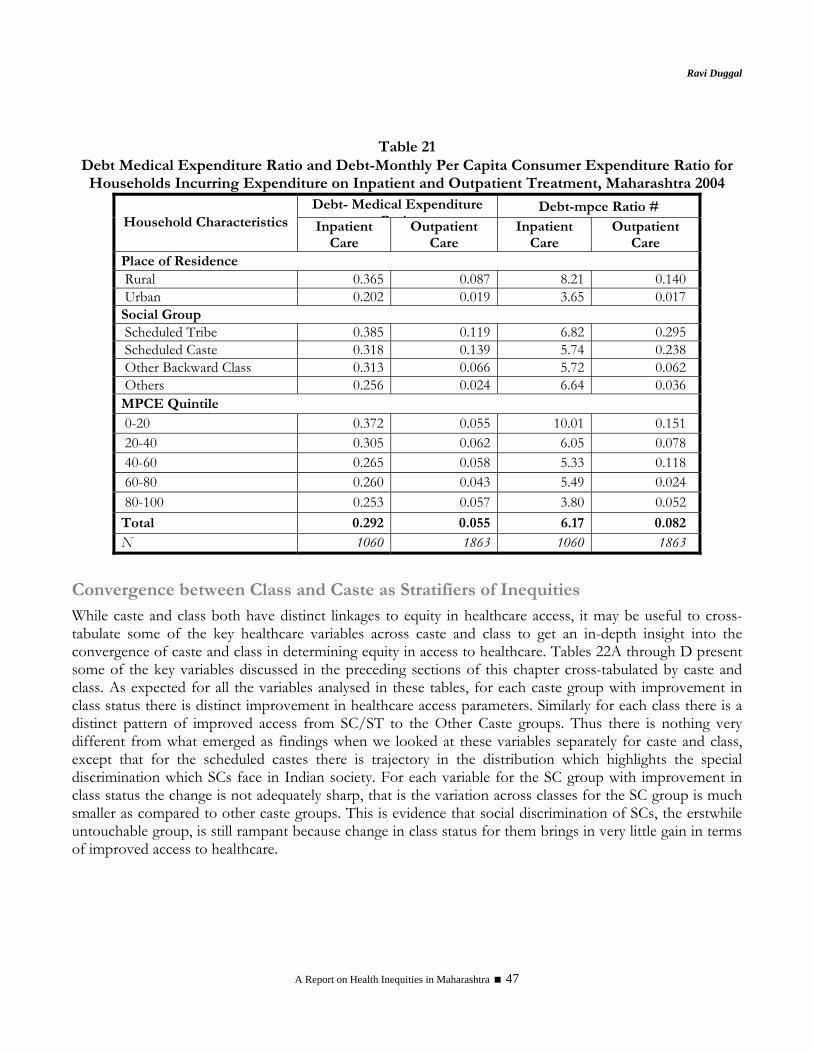
Ravi Duggal
A Report on Health Inequities in Maharashtra 47
Table 21
Debt Medical Expenditure Ratio and Debt-Monthly Per Capita Consumer Expenditure Ratio for Households Incurring Expenditure on Inpatient and Outpatient Treatment, Maharashtra 2004
Debt- Medical Expenditure R i
Debt-mpce Ratio # Household Characteristics Inpatient
Care Outpatient
Care Inpatient
Care Outpatient
Care Place of Residence Rural 0.365 0.087 8.21 0.140 Urban 0.202 0.019 3.65 0.017 Social Group Scheduled Tribe 0.385 0.119 6.82 0.295 Scheduled Caste 0.318 0.139 5.74 0.238 Other Backward Class 0.313 0.066 5.72 0.062 Others 0.256 0.024 6.64 0.036 MPCE Quintile 0-20 0.372 0.055 10.01 0.151 20-40 0.305 0.062 6.05 0.078 40-60 0.265 0.058 5.33 0.118 60-80 0.260 0.043 5.49 0.024 80-100 0.253 0.057 3.80 0.052 Total 0.292 0.055 6.17 0.082 N 1060 1863 1060 1863
Convergence between Class and Caste as Stratifiers of Inequities While caste and class both have distinct linkages to equity in healthcare access, it may be useful to cross-tabulate some of the key healthcare variables across caste and class to get an in-depth insight into the convergence of caste and class in determining equity in access to healthcare. Tables 22A through D present some of the key variables discussed in the preceding sections of this chapter cross-tabulated by caste and class. As expected for all the variables analysed in these tables, for each caste group with improvement in class status there is distinct improvement in healthcare access parameters. Similarly for each class there is a distinct pattern of improved access from SC/ST to the Other Caste groups. Thus there is nothing very different from what emerged as findings when we looked at these variables separately for caste and class, except that for the scheduled castes there is trajectory in the distribution which highlights the special discrimination which SCs face in Indian society. For each variable for the SC group with improvement in class status the change is not adequately sharp, that is the variation across classes for the SC group is much smaller as compared to other caste groups. This is evidence that social discrimination of SCs, the erstwhile untouchable group, is still rampant because change in class status for them brings in very little gain in terms of improved access to healthcare.
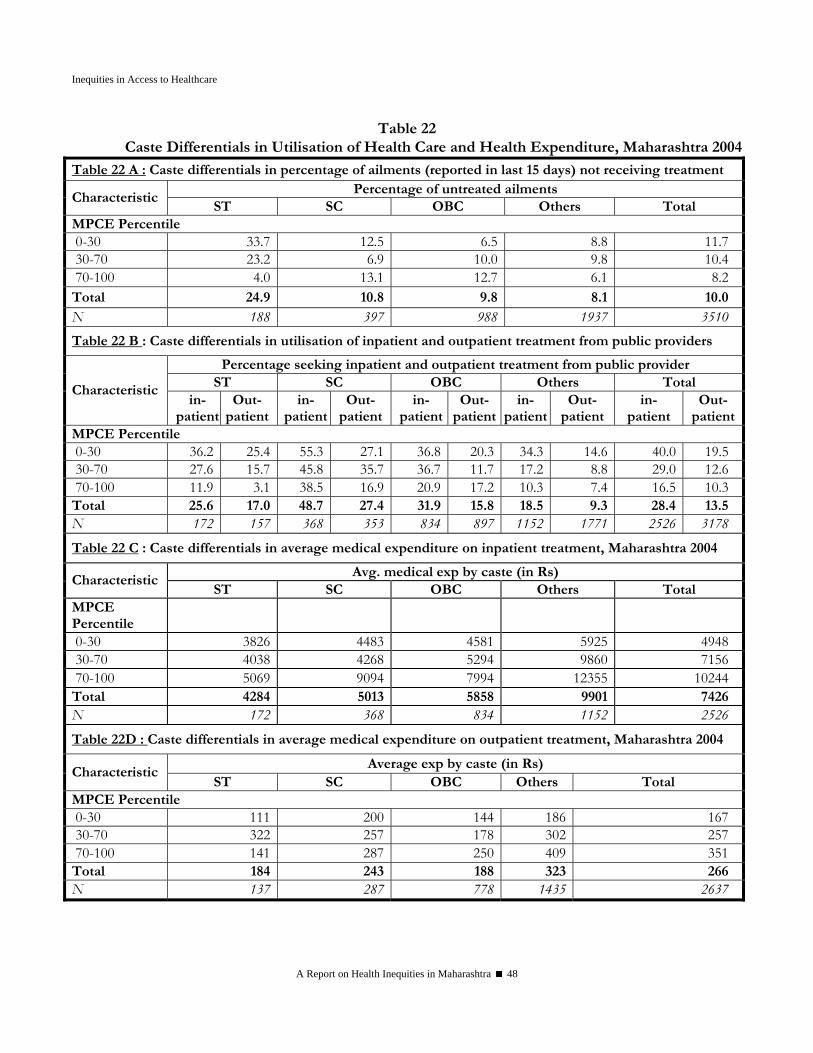
Inequities in Access to Healthcare
A Report on Health Inequities in Maharashtra 48
Table 22 Caste Differentials in Utilisation of Health Care and Health Expenditure, Maharashtra 2004
Table 22 A : Caste differentials in percentage of ailments (reported in last 15 days) not receiving treatment Percentage of untreated ailments
Characteristic ST SC OBC Others Total
MPCE Percentile 0-30 33.7 12.5 6.5 8.8 11.7 30-70 23.2 6.9 10.0 9.8 10.4 70-100 4.0 13.1 12.7 6.1 8.2 Total 24.9 10.8 9.8 8.1 10.0 N 188 397 988 1937 3510 Table 22 B : Caste differentials in utilisation of inpatient and outpatient treatment from public providers
Percentage seeking inpatient and outpatient treatment from public provider ST SC OBC Others Total Characteristic
in-patient
Out-patient
in- patient
Out-patient
in-patient
Out-patient
in-patient
Out-patient
in-patient
Out-patient
MPCE Percentile 0-30 36.2 25.4 55.3 27.1 36.8 20.3 34.3 14.6 40.0 19.5 30-70 27.6 15.7 45.8 35.7 36.7 11.7 17.2 8.8 29.0 12.6 70-100 11.9 3.1 38.5 16.9 20.9 17.2 10.3 7.4 16.5 10.3 Total 25.6 17.0 48.7 27.4 31.9 15.8 18.5 9.3 28.4 13.5 N 172 157 368 353 834 897 1152 1771 2526 3178
Table 22 C : Caste differentials in average medical expenditure on inpatient treatment, Maharashtra 2004
Avg. medical exp by caste (in Rs) Characteristic
ST SC OBC Others Total MPCE Percentile
0-30 3826 4483 4581 5925 4948 30-70 4038 4268 5294 9860 7156 70-100 5069 9094 7994 12355 10244 Total 4284 5013 5858 9901 7426 N 172 368 834 1152 2526
Table 22D : Caste differentials in average medical expenditure on outpatient treatment, Maharashtra 2004
Average exp by caste (in Rs) Characteristic
ST SC OBC Others Total MPCE Percentile 0-30 111 200 144 186 167 30-70 322 257 178 302 257 70-100 141 287 250 409 351 Total 184 243 188 323 266 N 137 287 778 1435 2637

Ravi Duggal
A Report on Health Inequities in Maharashtra 49
Conclusions Inequities in access to healthcare are an integral part of the overall structural inequities, which result in poverty. Therefore as long as structural inequities exist healthcare access inequities will persist. However, it has been demonstrated the world over that despite structural inequities a progressive/welfare state can minimise healthcare access inequities through affirmative action and an active role by the state in financing and provision of healthcare. Thus the role of the state is very critical in assuring basic equity in health and healthcare, and especially so in a country where income poverty is widespread. Thus a number of India’s neighbours like Sri Lanka, Thailand, Malaysia, Vietnam and China while suffering similar levels of income poverty have much better health outcomes precisely because the state accounts for 40-80% of all health expenditure in the country. In India and Maharashtra the contribution of the state is less than 20% to health spending and 95% of the balance 80% is out-of-pocket expenditure. Such a mode of financing accompanied by such high levels of poverty is a classic prescription for strong inequity in access to healthcare. In fact even within India there are states which demonstrate that higher the proportion of public health expenditure the better the health outcomes. States like Mizoram, Himachal, Goa and Kerala are good examples to learn from within the country. Maharashtra ranks a poor 26th in the country where proportion of public spending on health is concerned and this is a prime cause for its poor achievements in health and nutrition despite having one of the best macro economic aggregates. Thus the criticality of public financing cannot be discounted if we want to have reasonable access to healthcare for all and consequently health equity. The other critical concern, which stands out very sharply, is the rural-urban distribution of healthcare facilities, especially public health facilities. This is closely linked to the financing issue as we have seen that public investment in health is largely concentrated in urban areas. This is an inequity imposed directly by the state and can easily be resolved through a policy that mandates per capita distribution of resources for public services across all regions. And the rural-urban dichotomy is compounded by the presence of a large and unregulated private health sector, which exploits even the poor who are forced to use its services because of the inadequacies of the public health system. This also requires a strong regulatory and monitoring intervention by the state. Then there are the class and caste factors, which further aggravate inequities in access to healthcare. The data from national surveys provides very clear evidence that the SC/ST group and the bottom two quintiles suffer from avoidable inequities that are caused because of poor state investment in the health sector and the poorly functioning public health sector. In fact this data also indicates very strongly that the little access to healthcare that these underprivileged groups have is because there is a public health sector. What is thus needed is a strengthening of the public health sector if the class and caste inequities in access to health care have to be minimised. The historical advantage, which Maharashtra enjoyed via its investments in public health as well as early devolution of governance is now history post-neoliberal reforms of the nineties and its escalation in the new millennium. The compression of public expenditures and the privatisation initiatives which were unleashed consequently have caused untold damage to the public health sector as we have seen in the foregoing analysis. If the various inequities discussed above have to be reduced then public investment in health and public health expenditure has to be increased substantially, at least to the level (up to 3% of GDP), which the Common Minimum Program of the current coalition government had promised. The task for Maharashtra is even tougher given the fact that it spends only half the national average on public healthcare.
Inequities in Access to Healthcare
A Report on Health Inequities in Maharashtra 50
Thus it is time for the Maharashtra government to respond and the National Rural Health Mission, like the Minimum Needs Program of the eighties, offers a good opportunity to the state health department to make the architectural corrections within the public health system.
Acknowledgments The author would like to acknowledge Ms Suchitra Desai and Prashant Raymus for their help in putting together tables of the secondary data required for this paper.
Ravi Duggal
A Report on Health Inequities in Maharashtra 51
References Duggal Ravi, Dilip TR (2003), Demand for Public Health Services in Mumbai, CEHAT
Finance and Revenue Accounts, Govt. of Maharashtra, up to 2000-01; 2001-02 to 2006-07 from Civil Budget Estimates, Public Health Dept. and Medical education Dept.
Government of Maharashtra (2006).Maharashtra Economic Survey 2005, Mumbai.
Government of Maharashtra (2004).Human Development Report Maharashtra 2004.
Health Information of India 2005, Government of India, Central Bureau of Health Intelligence, Directorate General of Health Services, Ministry of Health & Family Welfare New Delhi 2006; www.cbhidghs.nic.in
Health Information of India, CBHI, Govt. of India, various years Note: For 2001 and 2005 only Govt. facility data available – private sector data estimated by author.
IIPS & WHO (2006): Health System Performance Assessment. World Health Survey, 2003, Maharashtra.
IIPS (1998-1999): National Family Health Survey (NFHS-2)
IIPS (2005-2006): National Family Health Survey (NFHS-3), Fact Sheet Maharashtra (Provisional Data)
IIPS, Reproductive and Child Health District Level Household Survey (2002-04) & Facility Survey (2003), Summary Report-India.
National Sample Survey organisation –1987:Morbidity and Utilisation of Medical Services, 42nd Round, Report No. 384, National Sample Survey Organisation, New Delhi
National Sample Survey, NSS 52nd round, Consumer Expenditure, Education, Health and Aged in India, July' 1995 -June' 1996, National Sample Survey Organisation, Ministry of Statistics and Programme Implementation, Government of India
National Sample Survey, NSS 60th round, Consumer Expenditure, Employment-Unemployment, Morbidity, Health Care & Condition of the Aged, January'2004-June' 2004, National Sample Survey Organisation, Ministry of Statistics and Programme Implementation, Government of India
ORG-MARG RCH 1 Facility Survey Reports (1999)
Performance Budgets (2001-2002 budget), Ministry of Health Govt. of Maharashtra, Mumbai
Sundar R. 1995. Household Survey of Health Care Utilisation and Expenditure. Working Paper No. 53. New Delhi: National Council of Applied Economic Research.
World Bank & Oxford University Press– ‘Equity and Development” World Development Report 2006
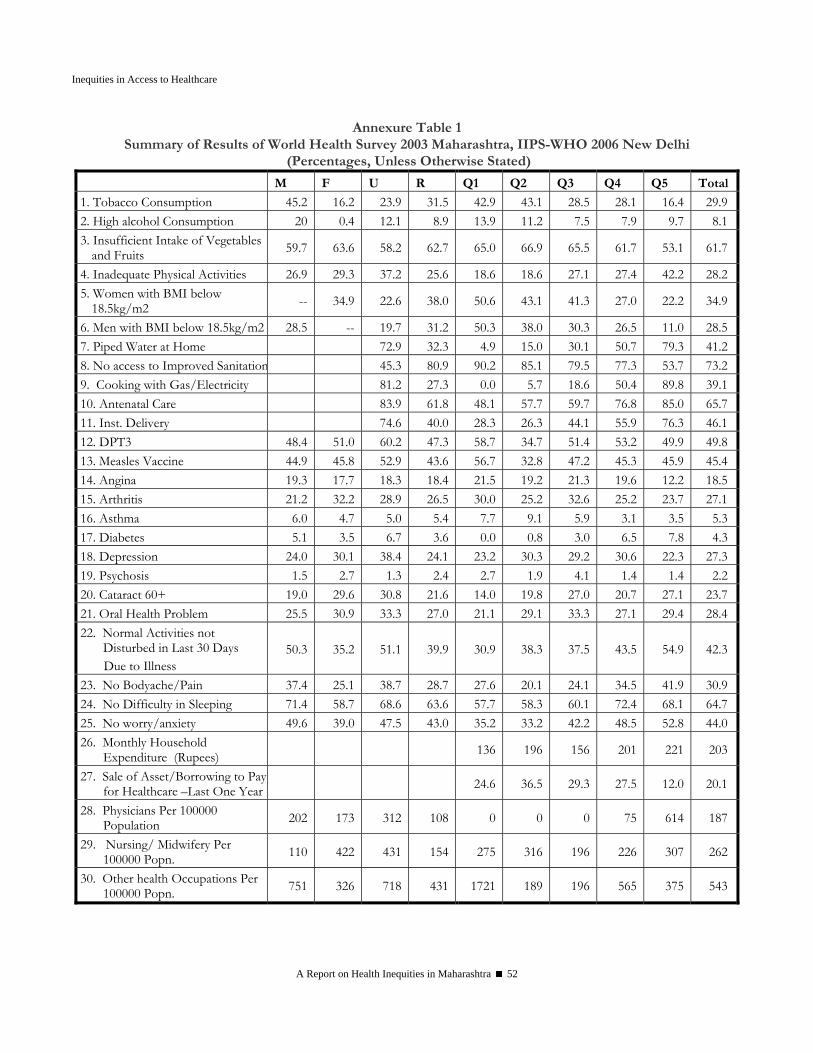
Inequities in Access to Healthcare
A Report on Health Inequities in Maharashtra 52
Annexure Table 1 Summary of Results of World Health Survey 2003 Maharashtra, IIPS-WHO 2006 New Delhi
(Percentages, Unless Otherwise Stated)
M F U R Q1 Q2 Q3 Q4 Q5 Total
1. Tobacco Consumption 45.2 16.2 23.9 31.5 42.9 43.1 28.5 28.1 16.4 29.92. High alcohol Consumption 20 0.4 12.1 8.9 13.9 11.2 7.5 7.9 9.7 8.13. Insufficient Intake of Vegetables
and Fruits 59.7 63.6 58.2 62.7 65.0 66.9 65.5 61.7 53.1 61.7
4. Inadequate Physical Activities 26.9 29.3 37.2 25.6 18.6 18.6 27.1 27.4 42.2 28.25. Women with BMI below
18.5kg/m2 -- 34.9 22.6 38.0 50.6 43.1 41.3 27.0 22.2 34.9
6. Men with BMI below 18.5kg/m2 28.5 -- 19.7 31.2 50.3 38.0 30.3 26.5 11.0 28.57. Piped Water at Home 72.9 32.3 4.9 15.0 30.1 50.7 79.3 41.28. No access to Improved Sanitation 45.3 80.9 90.2 85.1 79.5 77.3 53.7 73.29. Cooking with Gas/Electricity 81.2 27.3 0.0 5.7 18.6 50.4 89.8 39.110. Antenatal Care 83.9 61.8 48.1 57.7 59.7 76.8 85.0 65.711. Inst. Delivery 74.6 40.0 28.3 26.3 44.1 55.9 76.3 46.112. DPT3 48.4 51.0 60.2 47.3 58.7 34.7 51.4 53.2 49.9 49.813. Measles Vaccine 44.9 45.8 52.9 43.6 56.7 32.8 47.2 45.3 45.9 45.414. Angina 19.3 17.7 18.3 18.4 21.5 19.2 21.3 19.6 12.2 18.515. Arthritis 21.2 32.2 28.9 26.5 30.0 25.2 32.6 25.2 23.7 27.116. Asthma 6.0 4.7 5.0 5.4 7.7 9.1 5.9 3.1 3.5 5.317. Diabetes 5.1 3.5 6.7 3.6 0.0 0.8 3.0 6.5 7.8 4.318. Depression 24.0 30.1 38.4 24.1 23.2 30.3 29.2 30.6 22.3 27.319. Psychosis 1.5 2.7 1.3 2.4 2.7 1.9 4.1 1.4 1.4 2.220. Cataract 60+ 19.0 29.6 30.8 21.6 14.0 19.8 27.0 20.7 27.1 23.721. Oral Health Problem 25.5 30.9 33.3 27.0 21.1 29.1 33.3 27.1 29.4 28.422. Normal Activities not
Disturbed in Last 30 Days Due to Illness
50.3 35.2 51.1 39.9 30.9 38.3 37.5 43.5 54.9 42.3
23. No Bodyache/Pain 37.4 25.1 38.7 28.7 27.6 20.1 24.1 34.5 41.9 30.924. No Difficulty in Sleeping 71.4 58.7 68.6 63.6 57.7 58.3 60.1 72.4 68.1 64.725. No worry/anxiety 49.6 39.0 47.5 43.0 35.2 33.2 42.2 48.5 52.8 44.026. Monthly Household
Expenditure (Rupees) 136 196 156 201 221 203
27. Sale of Asset/Borrowing to Pay for Healthcare –Last One Year 24.6 36.5 29.3 27.5 12.0 20.1
28. Physicians Per 100000 Population 202 173 312 108 0 0 0 75 614 187
29. Nursing/ Midwifery Per 100000 Popn. 110 422 431 154 275 316 196 226 307 262
30. Other health Occupations Per 100000 Popn. 751 326 718 431 1721 189 196 565 375 543

Ravi Duggal
A Report on Health Inequities in Maharashtra 53
Annexure Table 2 Availability of Health Care Infrastructure Facilities in Maharashtra by Districts
Population Served Per % in Public Sector % in Urban Areas
Hospital @
Dispensary @
ISM # All
Medical Inst.
Bed Hospitals
@ Dispen-saries@
Hospitals @
Dispen-saries@ Beds
Ahmednagar 25691 12892 31940 6766 838 7.8 7.8 87.7 99.6 60.7 Akola 22815 8619 47492 5528 833 11.7 2.4 92.2 92.2 76.8 Amravati 11064 7557 7812 2851 418 16.8 10.3 94.7 87.9 71.9 Aurangabad 21350 2502 179009 2212 757 27.7 100.0 72.5 26.5 73.1Beed 26973 36134 23355 9297 1469 18.6 11.4 88.7 100.0 56.7 Bhandara 52755 79132 29154 15176 1458 22.5 5.5 61.9 47.2 51.4 Buldhana 27533 12957 17089 5813 1124 16.1 7.8 93.1 94.8 76.3 Chandrapur 20027 9701 16630 4692 856 7.6 4.2 81.7 67.2 64.7 Dhule 14809 12227 63466 6058 1385 15.9 2.9 95.0 100.0 69.0 Gadchiroli 48659 22357 22357 9090 1020 11.3 23.1 47.1 56.8 14.8 Greater Mumbai 13764 5251 65617 3593 355 8.0 100.0 100.0 100.0 100.0
Jalgaon 6742 17453 63224 4516 665 7.9 6.3 71.7 95.3 76.8 Jalna 25152 477897 89606 18864 1086 19.7 13.8 82.5 66.7 75.3 Kolhapur 36544 14755 42470 8426 1155 24.4 3.8 84.9 3.8 39.7 Latur 28896 440670 62953 18954 1157 12.8 2.5 93.4 100.0 73.5 Nagpur 9624 41130 29279 6159 471 22.8 100.0 44.7 84.3 69.9 Nanded 27212 17876 44528 8685 1058 16.0 5.7 98.1 61.9 93.4 Nashik 21192 8144 44975 5203 837 18.3 13.2 87.8 100.0 69.3 Osmanabad 38320 47900 41912 14118 1316 17.8 12.4 92.1 99.4 76.8 Parbhani 23672 21192 42792 8865 1284 25.7 10.7 80.0 100.0 55.3 Pune 11163 17257 306089 6631 373 19.7 100.0 90.4 100.0 67.9 Raigad 20192 12296 213138 7378 1062 18.1 5.9 96.5 96.4 99.2 Ratnagiri 34529 324577 324577 28472 1234 15.7 10.7 88.4 95.5 66.0 Sangli 11438 12093 22542 4662 618 10.0 17.6 74.5 100.0 68.5 Satara 13703 184016 143124 11710 615 33.7 11.6 95.1 99.5 83.4 Sindhudurg 20337 7110 9016 3325 694 22.0 47.5 79.3 100.0 81.8 Solapur 19631 26124 169804 10514 575 8.6 100.0 14.0 3.3 35.8 Thane 21468 3720 73562 3040 662 42.9 47.2 97.1 50.8 90.9 Wardha 27354 19009 86270 9925 438 19.4 7.3 96.9 99.5 91.8 Yavatmal 26303 19492 41191 8803 1011 64.7 43.2 85.4 52.5 53.4 Maharashtra 16891 9972 40811 5435 642 13.4 8.9 86.7 90.2 61.7
Source: Computed on the basis of information in Statistical Abstract of Maharashtra State 1993-94 & 1994-95, Mumbai: Directorate of Economics and Statistics, Government of Maharashtra. @ includes only allopathic medical institutions, excludes private GP Clinics.# includes Ayurvedic, Unani and Homeopathic institutions.

Inequities in Access to Healthcare
A Report on Health Inequities in Maharashtra 54
Annexure Table 3 Availability of Primary Health Centres (PHC's),
Rural Hospital (RH's) and Subcentres in Maharashtra, 1991-2001
Population Served Per
Popn Served Per No. of PHCs
No. of RH
PHCs RH
No. of Sub
Centres
No. of PHCs
No. of RH
Subcentre PHCs RH
1990-91 1990-91 1990-91 1990-91 2000 2001-02 2001-02 2000 2001-02 2001-02 Thane 73 13 25423.55 142763.00 470 77 12 3968 28952.94 185781.33Raigad 53 11 28229.74 136016.00 277 55 10 6240 30419.89 167309.40Ratnagiri 67 10 20985.09 140600.10 374 67 9 2382 22456.24 167174.22Nasik 91 16 27277.66 155141.69 530 106 25 5512 28832.45 122249.60Jalgaon 76 15 30433.75 154197.67 397 80 16 6765 32873.70 164368.50Ahmednagar 88 13 32266.52 218419.54 485 89 13 6898 36370.17 248995.77Dhule 81 12 24689.16 166651.83 431 41 3 5564 30782.00 420687.33Nandurbar* 49 10 22633.39 110903.60Satara 69 12 30949.74 177961.00 309 71 10 8142 33955.96 241087.30Kolhapur 67 13 32873.21 169423.46 371 72 13 6845 34344.57 190216.08Sindhudurg 38 7 20236.89 109857.43 246 38 9 6252 20697.53 87389.56Aurangabad 43 7 34619.44 212662.29 248 47 7 4437 38507.72 258551.86Jalna 33 6 34354.45 188949.50 171 38 7 13260 34345.13 186445.00Parbhani 51 9 32165.41 182270.67 351 31 8 5154 33629.97 130316.13Hingoli* 24 5 34713.75 166626.00Beed 45 8 33224.53 186888.00 253 47 8 6903 37748.51 221772.50Osmanabad 41 7 26401.15 154635.29 204 42 8 1453 29841.19 156666.25Latur 44 8 30335.75 166846.63 234 46 9 11408 34565.74 176669.33Akola 52 8 30383.46 197492.50 326 30 5 5525 33424.73 200548.40Amravati 54 9 27461.63 164769.78 320 56 11 5194 30492.52 155234.64Buldhana 47 7 31871.57 213994.86 265 52 7 6711 33828.79 251299.57Bhandara 64 11 28620.86 166521.36 427 30 3 4877 32013.93 320139.33Wardha 27 7 29031.11 111977.14 180 27 7 4886 33766.48 130242.14Chandrapur 59 9 21613.07 141685.67 336 58 13 2305 24241.97 108156.46Gadchiroli 45 8 15965.44 89805.63 372 45 12 3868 20067.40 75252.75Gondiya* 42 9 25173.24 117475.11Pune 82 16 33237.84 170343.94 501 86 15 6684 35252.53 202114.53Solapur 66 11 34872.33 209234.00 329 68 9 8446 38592.04 291584.33Sangli 57 9 29948.09 189671.22 270 59 9 7375 33056.03 216700.67Nagpur 45 8 27916.11 157028.13 300 48 8 4680 30289.29 181735.75Washim* 25 6 33670.84 140295.17Yawatmal 59 13 29156.15 132324.08 374 62 12 5294 32275.16 166755.00Nanded 58 11 31452.31 165839.45 374 64 14 5993 34174.92 156228.21
State Total** 1675 294 28883.31 164556.29 9725 1772 322 5807 31477.23 173222.51
Sources: Government of Maharashtra (1991-92 and 2001-02) Performance budget, Public Health Department (Medical, Public Health & Employees Insurance Scheme) part I, Mumbai Note:* are included in their parent district; * * Excluding Mumbai
Ravi Duggal
A Report on Health Inequities in Maharashtra 55
SECTION III INEQUITIES IN
HEALTH STATUS

A Report on Health Inequities in Maharashtra 57
Inequities in Health Status
Ravi Duggal
Introduction Health outcomes and health status are a function of peoples overall socio-economic condition as well as the amount of public investments made in the health sector. We have seen earlier that while Maharashtra is one of the lead states in the country in terms of macroeconomic indicators, the intra state variations are so strong that if microeconomics is included in the assessment then Maharashtra’s average economic status drops drastically to the bottom quartile and this gets reflected in the overall health outcomes and status of its population. Thus according to the latest RCH survey in terms of the proportion of population in the ‘low standard of living’ (microeconomics) category Maharashtra’s rank is a poor 21 in contrast to per capita income (macroeconomics) rank of 3. The latter is a function of gross wealth but the former is about distribution of that wealth or equity, and that is what determines the health status of the people. To understand inequities in health status the range of data available is relatively limited and also dependent on national surveys. One set of data like mortality and life expectancy is available on an annual basis through the continuous surveys of the Registrar General of India and is disaggregated by region and gender. Other data like that on immunization rates, morbidity rates, other services usage, nutritional status, determinants of health etc. is available less frequently from periodic national surveys like NSSO, NFHS and RCH.
Morbidity Illness is the immediate indicator of health status which comes to ones mind when we think of health status. Logically one would believe that illness incidence or prevalence would be higher amongst the poor and the underprivileged sections of society. Data does not always support this hypothesis because illness is not only a physical phenomenon. Illness is also socially determined, that is perception of illness is based on myriad factors, and not only by medical diagnosis. Thus it is not surprising that Kerala, which has the best health outcomes, like lowest mortality rates and highest life expectancy, actually reports the highest morbidity rate or prevalence of illness amongst states in India. This is largely because illness perception has a very close association with access to ameliorate that perceived condition. Thus if a population has access to a good public health system that does not have any access barriers like user fees then irrespective of which population sub-group you belong to the variance in reported morbidity would be very low. In contrast if one has a situation where the public health system is weak and the private health sector dominant, like in Maharashtra, then it is very likely that morbidity reporting or perception will be a function of purchasing power, and we are likely to see strong variations in reporting of morbidity in that population, and that variation will mostly be that the more better off you are (economically or socially) the higher will be the perceived or reported morbidity. Table 1 with data from NSS 52nd Round for 1996 shows a morbidity rate for a two-week recall period of 52 per thousand population in rural areas and 48 in urban areas. This has however changed drastically and even got reversed in the 60th Round for the year 2004 – 93 in rural areas and 118 in urban areas (Table 1A). The rate of hospitalisation in the state for a recall of one year was 26 per

Inequities in Health Status
A Report on Health Inequities in Maharashtra 58
thousand in urban areas and only 19 per thousand population in rural areas in 1996 and both increased to 36 and 30, respectively, in 2004. The large difference between urban and rural areas for hospitalization rate is probably a function of access to hospitals that as we have seen in the earlier chapter is vastly different for rural and urban areas. Similarly, gender differentials in morbidity reporting were smaller in 1996 with negligible difference in rural areas and some significant differences in urban areas with morbidity for women being higher. But in 2004 the scenario has changed completely with women in both rural and urban areas reporting much higher morbidity in contrast to men.
Table 1
Number of Persons Reporting Ailment during a Period of 15 Days per 1000 Persons and Number of Persons Hospitalised Per 1000 Population by
Fractile-Group of m p c e and Social Group – Maharashtra 1996 m p c e F r a c t i l e G r o u p Social Group Type of
Ailment
S e x 0 – 10
10 – 20
20 - 40
40 – 60
60 - 80
80 - 90
90 - 100 All ST SC Others
(1) (2) (3) (4) (5) (6) (7) (8) (9) (10) (11) (12) (13) Rural
M 36 12 33 29 29 55 69 37 34 23 41F 32 25 27 37 47 46 49 38 30 44 38Acute
Ailment T 34 19 30 33 38 50 60 37 32 33 39M 4 31 5 7 18 15 28 14 7 21 14F 4 6 10 11 22 25 21 15 8 12 17Chronic
Ailment T 4 17 7 9 20 20 25 15 7 16 16M 39 42 38 36 47 70 97 51 41 43 55F 35 31 36 47 68 71 69 52 38 55 55Any
Ailment T 37 36 37 41 57 70 84 52 40 49 55M 9 11 10 15 20 37 39 20 14 20 21F 10 8 13 13 19 30 41 18 17 20 18Annual Hosp.
Rate T 10 9 11 14 19 34 40 19 15 20 20
Urban M 34 21 34 37 30 28 39 33 28 35 33F 28 34 34 39 41 44 41 38 25 44 38Acute
Ailment T 31 27 34 38 35 35 40 35 26 40 35M 8 6 14 13 11 21 11 13 5 13 13F 11 7 11 8 13 20 16 13 8 8 14Chronic
Ailment T 10 6 12 11 12 21 14 13 7 10 13M 42 27 48 49 41 49 50 45 33 48 46F 39 40 45 47 53 64 57 51 33 51 52Any
Ailment T 41 34 46 48 47 56 53 48 33 49 48M 15 22 23 23 21 33 43 27 28 27 27F 18 18 21 25 24 33 34 25 29 29 25Annual Hosp.
Rate T 17 20 22 24 22 33 39 26 29 28 26
Source: NSSO 1998

Ravi Duggal
A Report on Health Inequities in Maharashtra 59
Tables 1 and 1A also gives class and caste differentials in morbidity and hospitalisation rates in Maharashtra for 1996. Prevalence of any ailment as well as acute and chronic ailments was found to be higher in high MPCE category as well as ‘others’, which is the non SC/ST categories. Overall the reported morbidity profile shows health of vulnerable sections to be “better” than the privileged ones. This is a common scenario we see in areas having inadequate public health care facilities, and also validates the purchasing power hypothesis that we discussed above. Thus the poor and underprivileged, who often cannot afford private healthcare, ignore treatment of illnesses unless absolutely warranted. When we desegregate the data across consumption classes and social groups (Table 1, 1A, 1B and 1C) the importance of access factors in defining morbidity gets further support. Thus, the poorer classes and the tribals, whose access to healthcare services is, restricted due to lack of purchasing power, report lower morbidity rates, especially for hospitalisations and chronic ailments. Further, across these groups one sees lower differentials in reported morbidity in urban areas in contrast to rural areas because the former have relatively better access to public health services. In fact in urban areas the SC population reports higher morbidity because of much better access to public health services in urban areas.
Table 1 A OPD Ailments in Last 15 Days Per 1000 Persons Across Selected
Stratifiers, Maharashtra 2004 All Urban Rural Total 103 118 93
Male 97 115 84 Female 110 122 103
Social Group S.T. 56 66 56 S.C. 64 78 60 O.B.C. 63 61 63 Others 66 65 66
MPCE Class* 1. Bottom 57 68 55 2 52 64 49 3 56 48 59 4 54 60 51 5 57 54 58 6 57 57 57 7 64 76 60 8 63 64 63 9 64 75 60 10 100 69 110 11 92 144 84 12. Top 135 138 133
* The categories used for urban, rural and All are different Source: NSSO 60th Round – 2004
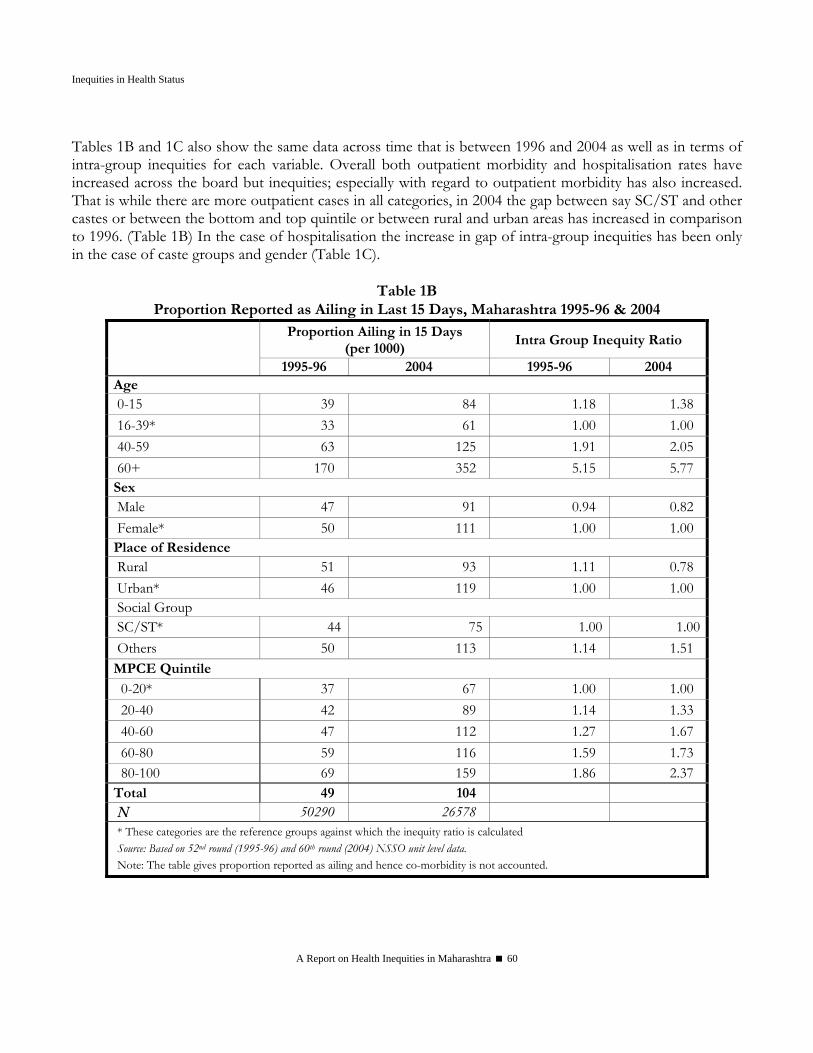
Inequities in Health Status
A Report on Health Inequities in Maharashtra 60
Tables 1B and 1C also show the same data across time that is between 1996 and 2004 as well as in terms of intra-group inequities for each variable. Overall both outpatient morbidity and hospitalisation rates have increased across the board but inequities; especially with regard to outpatient morbidity has also increased. That is while there are more outpatient cases in all categories, in 2004 the gap between say SC/ST and other castes or between the bottom and top quintile or between rural and urban areas has increased in comparison to 1996. (Table 1B) In the case of hospitalisation the increase in gap of intra-group inequities has been only in the case of caste groups and gender (Table 1C).
Table 1B Proportion Reported as Ailing in Last 15 Days, Maharashtra 1995-96 & 2004
Proportion Ailing in 15 Days (per 1000)
Intra Group Inequity Ratio 1995-96 2004 1995-96 2004
Age 0-15 39 84 1.18 1.38 16-39* 33 61 1.00 1.00 40-59 63 125 1.91 2.05 60+ 170 352 5.15 5.77 Sex Male 47 91 0.94 0.82 Female* 50 111 1.00 1.00 Place of Residence Rural 51 93 1.11 0.78 Urban* 46 119 1.00 1.00 Social Group SC/ST* 44 75 1.00 1.00 Others 50 113 1.14 1.51 MPCE Quintile
0-20* 37 67 1.00 1.00 20-40 42 89 1.14 1.33 40-60 47 112 1.27 1.67 60-80 59 116 1.59 1.73 80-100 69 159 1.86 2.37 Total 49 104 N 50290 26578 * These categories are the reference groups against which the inequity ratio is calculated Source: Based on 52nd round (1995-96) and 60th round (2004) NSSO unit level data. Note: The table gives proportion reported as ailing and hence co-morbidity is not accounted.

Ravi Duggal
A Report on Health Inequities in Maharashtra 61
Table 1C
Proportion Hospitalized in Last One Year, Maharashtra 1995-96 & 2004 Proportion Hospitalized in Last
One Year (per 1000 popn) Intra Group Inequalities
1995-96 2004 1995-96 2004 Age
0-15* 13 21 1.00 1.00 16-39 17 26 1.31 1.24 40-59 28 44 2.15 2.10 60+ 55 76 4.23 3.62
Sex Male 21 34 1.05 1.17 Female* 20 29 1.00 1.00
Place of Residence Rural 18 29 0.75 0.83 Urban* 24 35 1.00 1.00
Social Group SC/ST* 20 27 1.00 1.00 Others 21 33 1.05 1.22
MPCE Quintile 0-20* 12 27 1.00 1.00 20-40 17 28 1.42 1.04 40-60 17 27 1.42 1.00 60-80 27 35 2.25 1.30 80-100 35 47 2.92 1.74
Total 20 32 N 50290 26578
* These categories are the reference groups against which the inequity ratio is calculated Source: Based on 52nd round (1995-96) and 60th round (2004) NSSO unit level data.
Mortality and Life Expectancy Mortality and life expectancy are another set of health outcomes, which reflect well being of any population. The levels and trends of health status in Maharashtra are reflected in infant mortality and life expectancy at birth, which has shown substantial improvements over the years. The Infant Mortality Rate (IMR) in the state has come down from 129 per thousand population in 1971 to 36 per thousand population presently. Though the sex differentials of IMR are marginal, and the latest year shows a one- point increase in female IMR as compared to male, the rural - urban differentials are very marked and the gap has worsened over the years. (Table 2 and 2A) Infant mortality rate is presently 41 and 27 in rural and urban areas respectively. The rural urban gap kept increasing until 2001 after which we see a declining trend but in the case of gender the lower female IMR has seen a reversal after 1991. Similarly there is wide variation across various districts
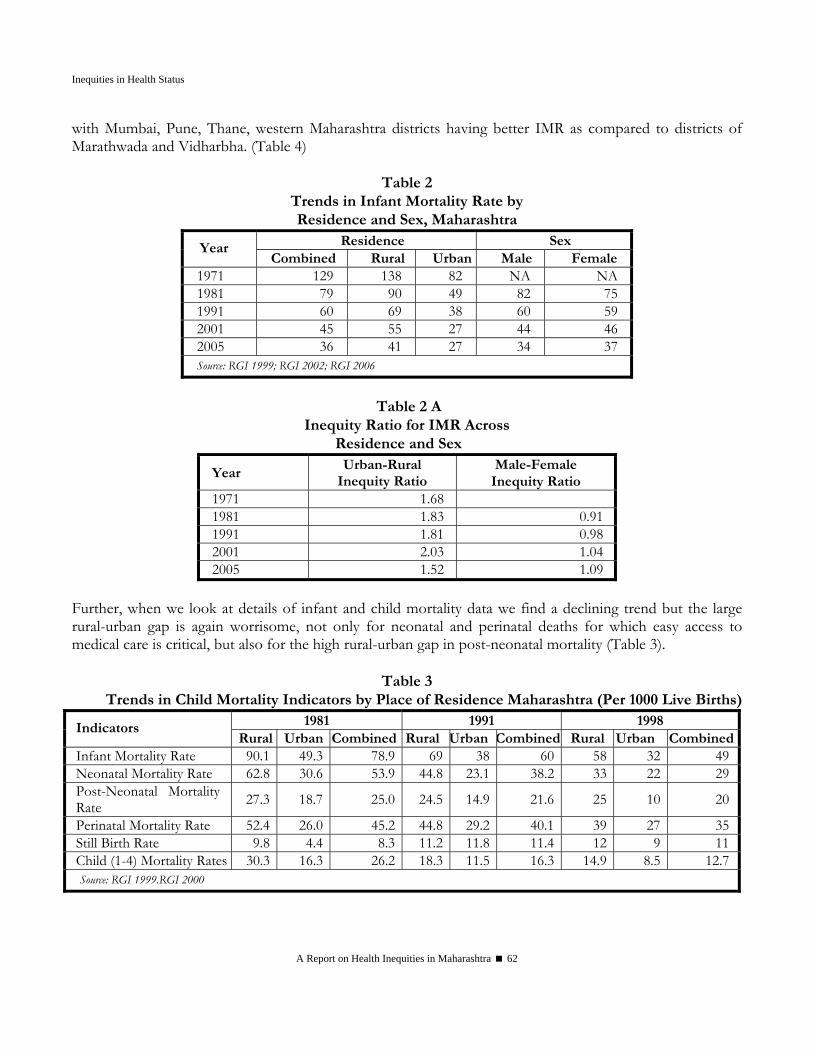
Inequities in Health Status
A Report on Health Inequities in Maharashtra 62
with Mumbai, Pune, Thane, western Maharashtra districts having better IMR as compared to districts of Marathwada and Vidharbha. (Table 4)
Table 2
Trends in Infant Mortality Rate by Residence and Sex, Maharashtra
Residence Sex Year Combined Rural Urban Male Female
1971 129 138 82 NA NA 1981 79 90 49 82 75 1991 60 69 38 60 59 2001 45 55 27 44 46 2005 36 41 27 34 37 Source: RGI 1999; RGI 2002; RGI 2006
Table 2 A
Inequity Ratio for IMR Across Residence and Sex
Year Urban-Rural
Inequity Ratio Male-Female
Inequity Ratio 1971 1.68 1981 1.83 0.91 1991 1.81 0.98 2001 2.03 1.04 2005 1.52 1.09
Further, when we look at details of infant and child mortality data we find a declining trend but the large rural-urban gap is again worrisome, not only for neonatal and perinatal deaths for which easy access to medical care is critical, but also for the high rural-urban gap in post-neonatal mortality (Table 3).
Table 3
Trends in Child Mortality Indicators by Place of Residence Maharashtra (Per 1000 Live Births) 1981 1991 1998 Indicators
Rural Urban Combined Rural Urban Combined Rural Urban CombinedInfant Mortality Rate 90.1 49.3 78.9 69 38 60 58 32 49Neonatal Mortality Rate 62.8 30.6 53.9 44.8 23.1 38.2 33 22 29Post-Neonatal Mortality Rate 27.3 18.7 25.0 24.5 14.9 21.6 25 10 20
Perinatal Mortality Rate 52.4 26.0 45.2 44.8 29.2 40.1 39 27 35Still Birth Rate 9.8 4.4 8.3 11.2 11.8 11.4 12 9 11Child (1-4) Mortality Rates 30.3 16.3 26.2 18.3 11.5 16.3 14.9 8.5 12.7Source: RGI 1999.RGI 2000
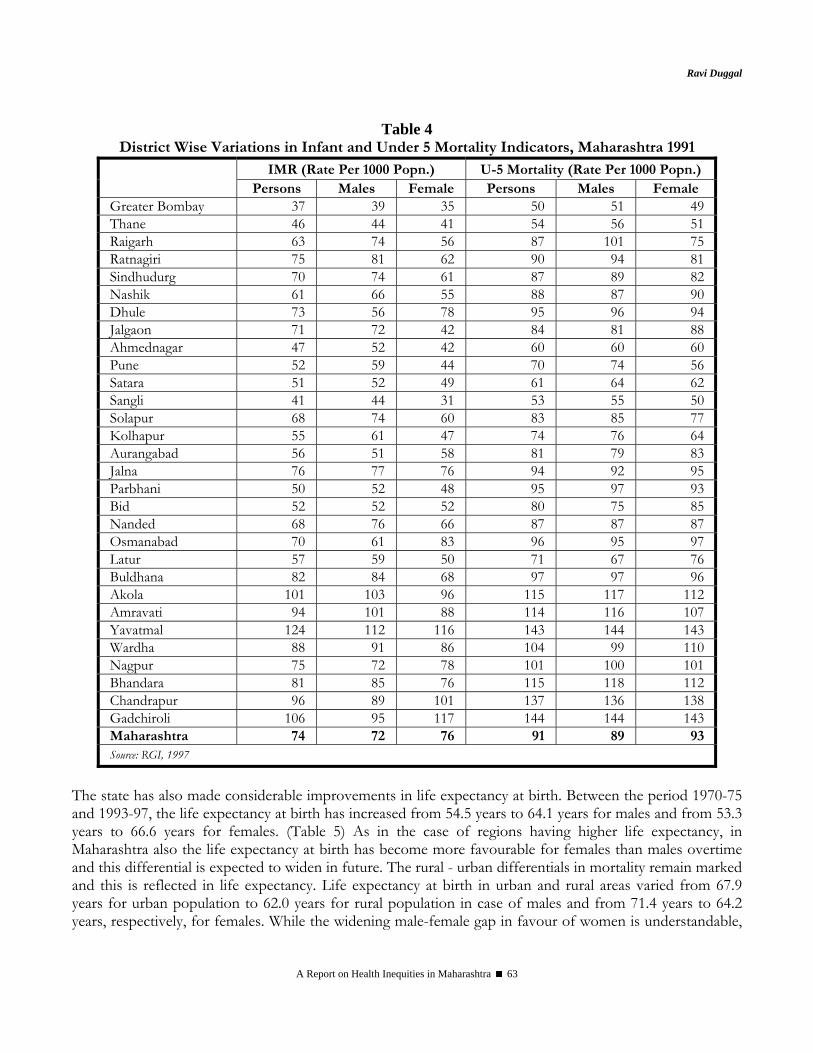
Ravi Duggal
A Report on Health Inequities in Maharashtra 63
Table 4 District Wise Variations in Infant and Under 5 Mortality Indicators, Maharashtra 1991
IMR (Rate Per 1000 Popn.) U-5 Mortality (Rate Per 1000 Popn.) Persons Males Female Persons Males Female
Greater Bombay 37 39 35 50 51 49 Thane 46 44 41 54 56 51 Raigarh 63 74 56 87 101 75 Ratnagiri 75 81 62 90 94 81 Sindhudurg 70 74 61 87 89 82 Nashik 61 66 55 88 87 90 Dhule 73 56 78 95 96 94 Jalgaon 71 72 42 84 81 88 Ahmednagar 47 52 42 60 60 60 Pune 52 59 44 70 74 56 Satara 51 52 49 61 64 62 Sangli 41 44 31 53 55 50 Solapur 68 74 60 83 85 77 Kolhapur 55 61 47 74 76 64 Aurangabad 56 51 58 81 79 83 Jalna 76 77 76 94 92 95 Parbhani 50 52 48 95 97 93 Bid 52 52 52 80 75 85 Nanded 68 76 66 87 87 87 Osmanabad 70 61 83 96 95 97 Latur 57 59 50 71 67 76 Buldhana 82 84 68 97 97 96 Akola 101 103 96 115 117 112 Amravati 94 101 88 114 116 107 Yavatmal 124 112 116 143 144 143 Wardha 88 91 86 104 99 110 Nagpur 75 72 78 101 100 101 Bhandara 81 85 76 115 118 112 Chandrapur 96 89 101 137 136 138 Gadchiroli 106 95 117 144 144 143 Maharashtra 74 72 76 91 89 93 Source: RGI, 1997
The state has also made considerable improvements in life expectancy at birth. Between the period 1970-75 and 1993-97, the life expectancy at birth has increased from 54.5 years to 64.1 years for males and from 53.3 years to 66.6 years for females. (Table 5) As in the case of regions having higher life expectancy, in Maharashtra also the life expectancy at birth has become more favourable for females than males overtime and this differential is expected to widen in future. The rural - urban differentials in mortality remain marked and this is reflected in life expectancy. Life expectancy at birth in urban and rural areas varied from 67.9 years for urban population to 62.0 years for rural population in case of males and from 71.4 years to 64.2 years, respectively, for females. While the widening male-female gap in favour of women is understandable,
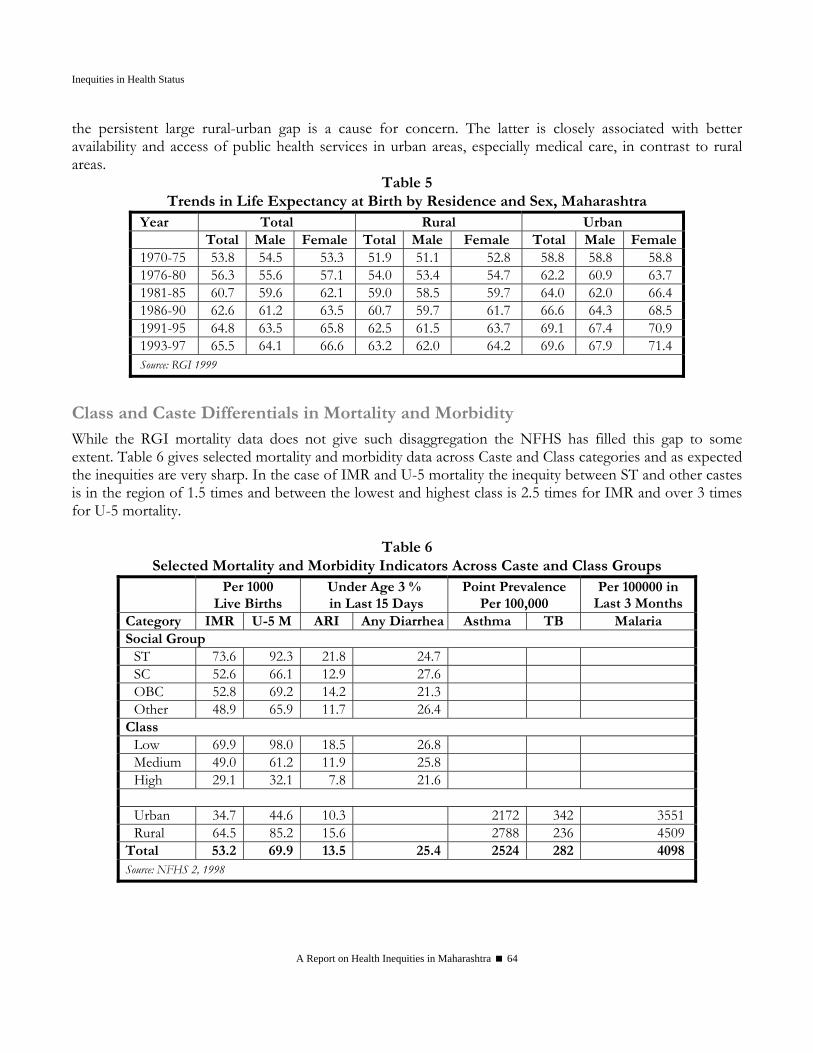
Inequities in Health Status
A Report on Health Inequities in Maharashtra 64
the persistent large rural-urban gap is a cause for concern. The latter is closely associated with better availability and access of public health services in urban areas, especially medical care, in contrast to rural areas.
Table 5 Trends in Life Expectancy at Birth by Residence and Sex, Maharashtra
Year Total Rural Urban Total Male Female Total Male Female Total Male Female1970-75 53.8 54.5 53.3 51.9 51.1 52.8 58.8 58.8 58.8 1976-80 56.3 55.6 57.1 54.0 53.4 54.7 62.2 60.9 63.7 1981-85 60.7 59.6 62.1 59.0 58.5 59.7 64.0 62.0 66.4 1986-90 62.6 61.2 63.5 60.7 59.7 61.7 66.6 64.3 68.5 1991-95 64.8 63.5 65.8 62.5 61.5 63.7 69.1 67.4 70.9 1993-97 65.5 64.1 66.6 63.2 62.0 64.2 69.6 67.9 71.4 Source: RGI 1999
Class and Caste Differentials in Mortality and Morbidity While the RGI mortality data does not give such disaggregation the NFHS has filled this gap to some extent. Table 6 gives selected mortality and morbidity data across Caste and Class categories and as expected the inequities are very sharp. In the case of IMR and U-5 mortality the inequity between ST and other castes is in the region of 1.5 times and between the lowest and highest class is 2.5 times for IMR and over 3 times for U-5 mortality.
Table 6 Selected Mortality and Morbidity Indicators Across Caste and Class Groups
Per 1000 Live Births
Under Age 3 % in Last 15 Days
Point Prevalence Per 100,000
Per 100000 in Last 3 Months
Category IMR U-5 M ARI Any Diarrhea Asthma TB Malaria Social Group
ST 73.6 92.3 21.8 24.7 SC 52.6 66.1 12.9 27.6 OBC 52.8 69.2 14.2 21.3 Other 48.9 65.9 11.7 26.4
Class Low 69.9 98.0 18.5 26.8 Medium 49.0 61.2 11.9 25.8 High 29.1 32.1 7.8 21.6
Urban 34.7 44.6 10.3 2172 342 3551Rural 64.5 85.2 15.6 2788 236 4509
Total 53.2 69.9 13.5 25.4 2524 282 4098Source: NFHS 2, 1998
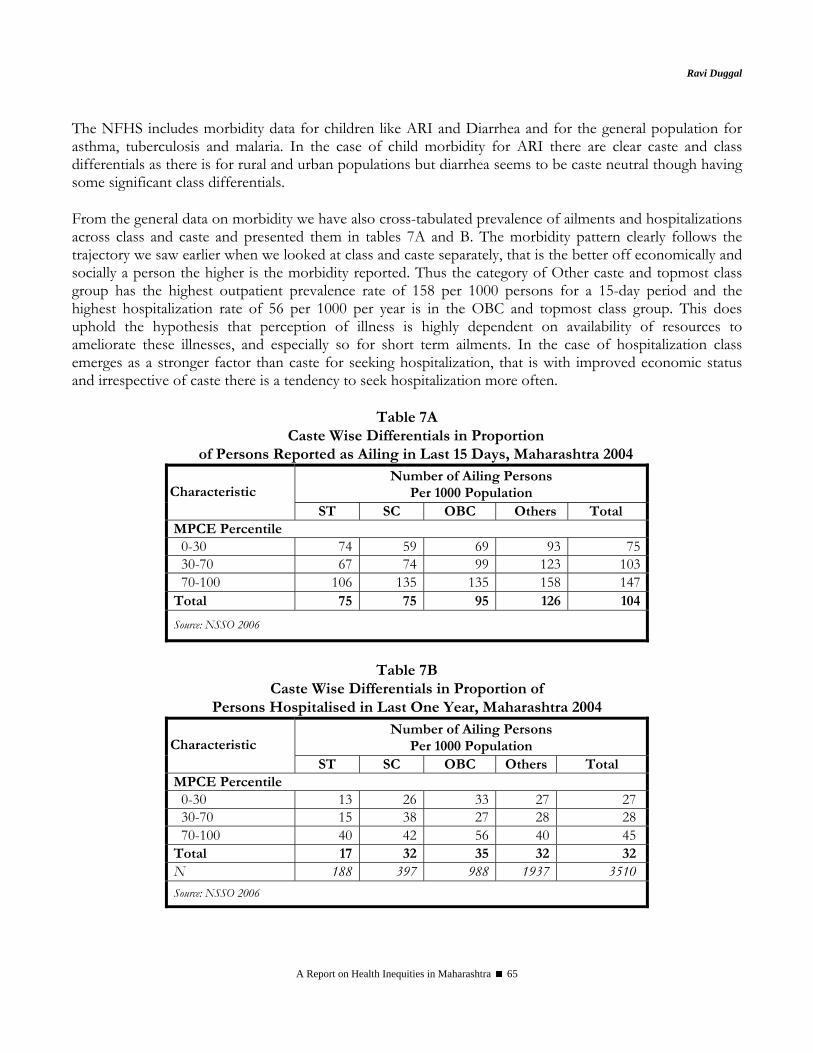
Ravi Duggal
A Report on Health Inequities in Maharashtra 65
The NFHS includes morbidity data for children like ARI and Diarrhea and for the general population for asthma, tuberculosis and malaria. In the case of child morbidity for ARI there are clear caste and class differentials as there is for rural and urban populations but diarrhea seems to be caste neutral though having some significant class differentials. From the general data on morbidity we have also cross-tabulated prevalence of ailments and hospitalizations across class and caste and presented them in tables 7A and B. The morbidity pattern clearly follows the trajectory we saw earlier when we looked at class and caste separately, that is the better off economically and socially a person the higher is the morbidity reported. Thus the category of Other caste and topmost class group has the highest outpatient prevalence rate of 158 per 1000 persons for a 15-day period and the highest hospitalization rate of 56 per 1000 per year is in the OBC and topmost class group. This does uphold the hypothesis that perception of illness is highly dependent on availability of resources to ameliorate these illnesses, and especially so for short term ailments. In the case of hospitalization class emerges as a stronger factor than caste for seeking hospitalization, that is with improved economic status and irrespective of caste there is a tendency to seek hospitalization more often.
Table 7A
Caste Wise Differentials in Proportion of Persons Reported as Ailing in Last 15 Days, Maharashtra 2004
Number of Ailing Persons Per 1000 Population Characteristic
ST SC OBC Others Total MPCE Percentile
0-30 74 59 69 93 75 30-70 67 74 99 123 103 70-100 106 135 135 158 147
Total 75 75 95 126 104
Source: NSSO 2006
Table 7B
Caste Wise Differentials in Proportion of Persons Hospitalised in Last One Year, Maharashtra 2004
Number of Ailing Persons Per 1000 Population Characteristic
ST SC OBC Others Total MPCE Percentile
0-30 13 26 33 27 27 30-70 15 38 27 28 28 70-100 40 42 56 40 45
Total 17 32 35 32 32 N 188 397 988 1937 3510 Source: NSSO 2006
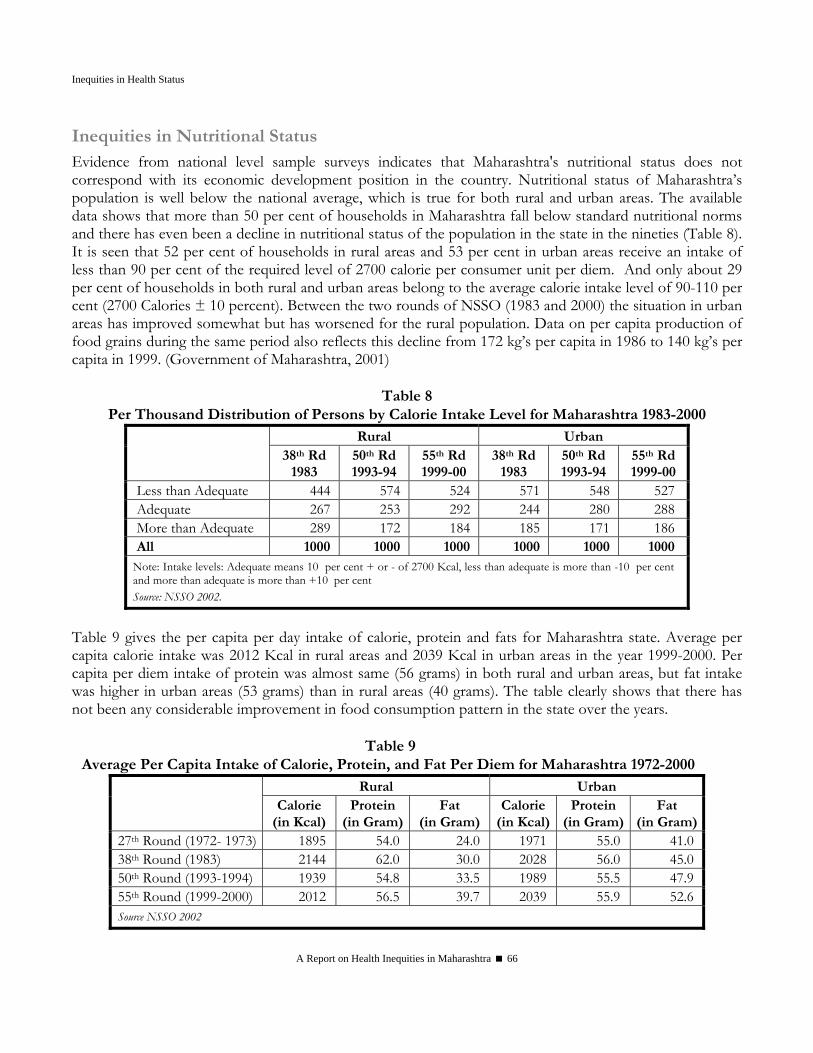
Inequities in Health Status
A Report on Health Inequities in Maharashtra 66
Inequities in Nutritional Status Evidence from national level sample surveys indicates that Maharashtra's nutritional status does not correspond with its economic development position in the country. Nutritional status of Maharashtra’s population is well below the national average, which is true for both rural and urban areas. The available data shows that more than 50 per cent of households in Maharashtra fall below standard nutritional norms and there has even been a decline in nutritional status of the population in the state in the nineties (Table 8). It is seen that 52 per cent of households in rural areas and 53 per cent in urban areas receive an intake of less than 90 per cent of the required level of 2700 calorie per consumer unit per diem. And only about 29 per cent of households in both rural and urban areas belong to the average calorie intake level of 90-110 per cent (2700 Calories ± 10 percent). Between the two rounds of NSSO (1983 and 2000) the situation in urban areas has improved somewhat but has worsened for the rural population. Data on per capita production of food grains during the same period also reflects this decline from 172 kg’s per capita in 1986 to 140 kg’s per capita in 1999. (Government of Maharashtra, 2001)
Table 8 Per Thousand Distribution of Persons by Calorie Intake Level for Maharashtra 1983-2000
Rural Urban 38th Rd
1983 50th Rd 1993-94
55th Rd 1999-00
38th Rd 1983
50th Rd 1993-94
55th Rd 1999-00
Less than Adequate 444 574 524 571 548 527 Adequate 267 253 292 244 280 288 More than Adequate 289 172 184 185 171 186 All 1000 1000 1000 1000 1000 1000
Note: Intake levels: Adequate means 10 per cent + or - of 2700 Kcal, less than adequate is more than -10 per cent and more than adequate is more than +10 per cent Source: NSSO 2002.
Table 9 gives the per capita per day intake of calorie, protein and fats for Maharashtra state. Average per capita calorie intake was 2012 Kcal in rural areas and 2039 Kcal in urban areas in the year 1999-2000. Per capita per diem intake of protein was almost same (56 grams) in both rural and urban areas, but fat intake was higher in urban areas (53 grams) than in rural areas (40 grams). The table clearly shows that there has not been any considerable improvement in food consumption pattern in the state over the years.
Table 9
Average Per Capita Intake of Calorie, Protein, and Fat Per Diem for Maharashtra 1972-2000 Rural Urban
Calorie (in Kcal)
Protein (in Gram)
Fat (in Gram)
Calorie (in Kcal)
Protein (in Gram)
Fat (in Gram)
27th Round (1972- 1973) 1895 54.0 24.0 1971 55.0 41.038th Round (1983) 2144 62.0 30.0 2028 56.0 45.050th Round (1993-1994) 1939 54.8 33.5 1989 55.5 47.955th Round (1999-2000) 2012 56.5 39.7 2039 55.9 52.6Source NSSO 2002
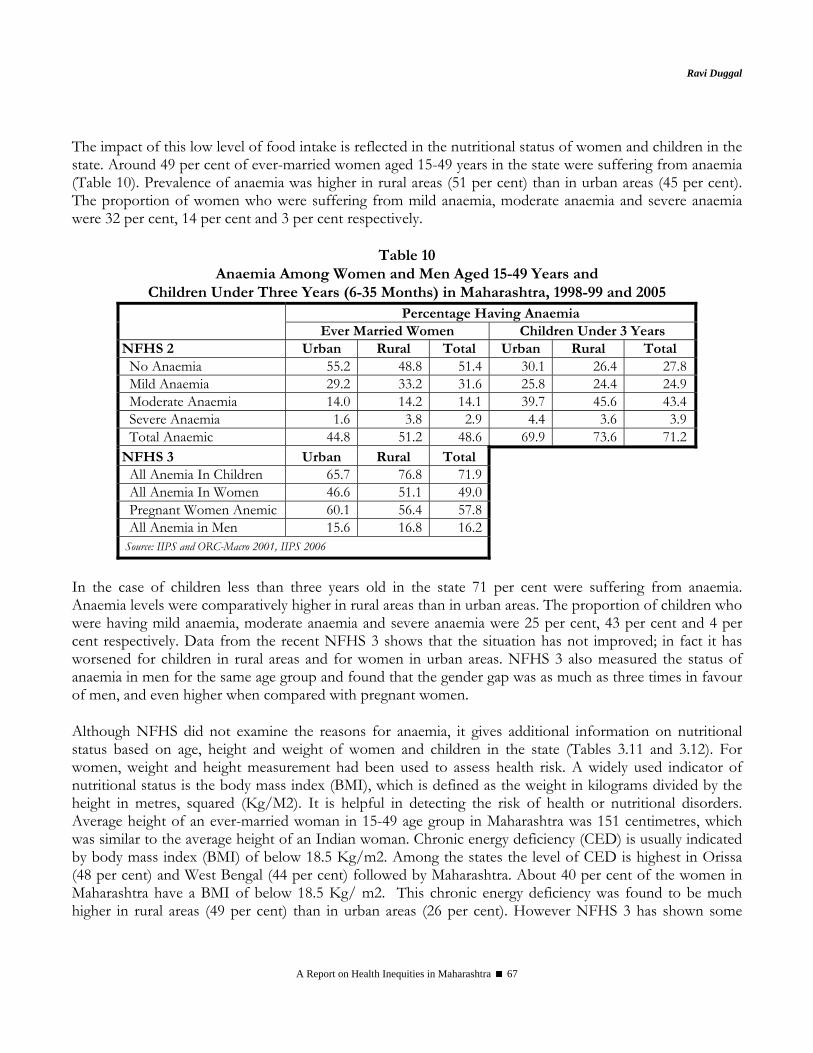
Ravi Duggal
A Report on Health Inequities in Maharashtra 67
The impact of this low level of food intake is reflected in the nutritional status of women and children in the state. Around 49 per cent of ever-married women aged 15-49 years in the state were suffering from anaemia (Table 10). Prevalence of anaemia was higher in rural areas (51 per cent) than in urban areas (45 per cent). The proportion of women who were suffering from mild anaemia, moderate anaemia and severe anaemia were 32 per cent, 14 per cent and 3 per cent respectively.
Table 10
Anaemia Among Women and Men Aged 15-49 Years and Children Under Three Years (6-35 Months) in Maharashtra, 1998-99 and 2005
Percentage Having Anaemia Ever Married Women Children Under 3 Years
NFHS 2 Urban Rural Total Urban Rural Total No Anaemia 55.2 48.8 51.4 30.1 26.4 27.8Mild Anaemia 29.2 33.2 31.6 25.8 24.4 24.9Moderate Anaemia 14.0 14.2 14.1 39.7 45.6 43.4Severe Anaemia 1.6 3.8 2.9 4.4 3.6 3.9Total Anaemic 44.8 51.2 48.6 69.9 73.6 71.2
NFHS 3 Urban Rural Total All Anemia In Children 65.7 76.8 71.9All Anemia In Women 46.6 51.1 49.0Pregnant Women Anemic 60.1 56.4 57.8All Anemia in Men 15.6 16.8 16.2
Source: IIPS and ORC-Macro 2001, IIPS 2006
In the case of children less than three years old in the state 71 per cent were suffering from anaemia. Anaemia levels were comparatively higher in rural areas than in urban areas. The proportion of children who were having mild anaemia, moderate anaemia and severe anaemia were 25 per cent, 43 per cent and 4 per cent respectively. Data from the recent NFHS 3 shows that the situation has not improved; in fact it has worsened for children in rural areas and for women in urban areas. NFHS 3 also measured the status of anaemia in men for the same age group and found that the gender gap was as much as three times in favour of men, and even higher when compared with pregnant women.
Although NFHS did not examine the reasons for anaemia, it gives additional information on nutritional status based on age, height and weight of women and children in the state (Tables 3.11 and 3.12). For women, weight and height measurement had been used to assess health risk. A widely used indicator of nutritional status is the body mass index (BMI), which is defined as the weight in kilograms divided by the height in metres, squared (Kg/M2). It is helpful in detecting the risk of health or nutritional disorders. Average height of an ever-married woman in 15-49 age group in Maharashtra was 151 centimetres, which was similar to the average height of an Indian woman. Chronic energy deficiency (CED) is usually indicated by body mass index (BMI) of below 18.5 Kg/m2. Among the states the level of CED is highest in Orissa (48 per cent) and West Bengal (44 per cent) followed by Maharashtra. About 40 per cent of the women in Maharashtra have a BMI of below 18.5 Kg/ m2. This chronic energy deficiency was found to be much higher in rural areas (49 per cent) than in urban areas (26 per cent). However NFHS 3 has shown some
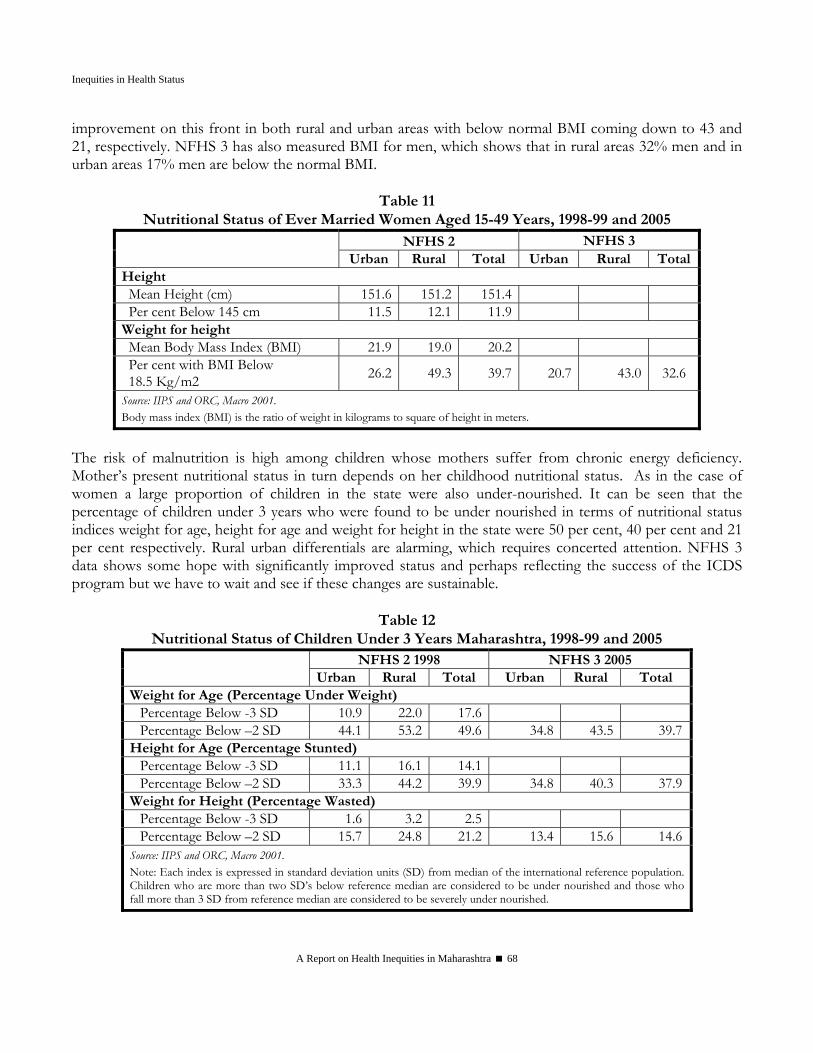
Inequities in Health Status
A Report on Health Inequities in Maharashtra 68
improvement on this front in both rural and urban areas with below normal BMI coming down to 43 and 21, respectively. NFHS 3 has also measured BMI for men, which shows that in rural areas 32% men and in urban areas 17% men are below the normal BMI.
Table 11 Nutritional Status of Ever Married Women Aged 15-49 Years, 1998-99 and 2005
NFHS 2 NFHS 3 Urban Rural Total Urban Rural Total
Height Mean Height (cm) 151.6 151.2 151.4 Per cent Below 145 cm 11.5 12.1 11.9
Weight for height Mean Body Mass Index (BMI) 21.9 19.0 20.2 Per cent with BMI Below 18.5 Kg/m2 26.2 49.3 39.7 20.7 43.0 32.6
Source: IIPS and ORC, Macro 2001. Body mass index (BMI) is the ratio of weight in kilograms to square of height in meters.
The risk of malnutrition is high among children whose mothers suffer from chronic energy deficiency. Mother’s present nutritional status in turn depends on her childhood nutritional status. As in the case of women a large proportion of children in the state were also under-nourished. It can be seen that the percentage of children under 3 years who were found to be under nourished in terms of nutritional status indices weight for age, height for age and weight for height in the state were 50 per cent, 40 per cent and 21 per cent respectively. Rural urban differentials are alarming, which requires concerted attention. NFHS 3 data shows some hope with significantly improved status and perhaps reflecting the success of the ICDS program but we have to wait and see if these changes are sustainable.
Table 12
Nutritional Status of Children Under 3 Years Maharashtra, 1998-99 and 2005 NFHS 2 1998 NFHS 3 2005
Urban Rural Total Urban Rural Total Weight for Age (Percentage Under Weight) Percentage Below -3 SD 10.9 22.0 17.6 Percentage Below –2 SD 44.1 53.2 49.6 34.8 43.5 39.7
Height for Age (Percentage Stunted) Percentage Below -3 SD 11.1 16.1 14.1 Percentage Below –2 SD 33.3 44.2 39.9 34.8 40.3 37.9
Weight for Height (Percentage Wasted) Percentage Below -3 SD 1.6 3.2 2.5 Percentage Below –2 SD 15.7 24.8 21.2 13.4 15.6 14.6
Source: IIPS and ORC, Macro 2001. Note: Each index is expressed in standard deviation units (SD) from median of the international reference population. Children who are more than two SD’s below reference median are considered to be under nourished and those who fall more than 3 SD from reference median are considered to be severely under nourished.

Ravi Duggal
A Report on Health Inequities in Maharashtra 69
Class and Caste Inequities in Nutrition Status NFHS provides caste and class disaggregation of nutritional status of ever married women and children under age 3. Table 13 shows fairly sharp gradients across caste groups and classes. For instance proportion of women having a BMI below 18.5 kg/m2 was 1.5 times more for ST as compared to other castes and 2.7 times more for the lowest class in comparison with the highest. In the case of severe anemia the class differentials were very strong but caste differentials not significantly different. With regard to children the class differentials were again over two times for weight for age (under-nutrition), height for age (stunting) and weight for height. Caste differentials also exist but are less sharp.
Table 13 Nutrition Status of Women and Children Across Caste and Class
Percent Ever Married Women Children Under Age 3
Category Below
145 cm BMI <
18.5kg/m2 Any
AnemiaSevere
AnemiaWt. for
Age -2SDHt for Age
– 2SD Wt for
Ht -2SD Any
Anemia Social Group
SC 17.4 38.1 49.7 3.0 51.4 43.7 15.6 81.4ST 10.6 54.8 64.2 3.9 65.2 57.1 31.0 83.2OBC 12.2 40.7 48.6 2.0 48.4 40.3 20.9 70.9Other 10.7 36.8 45.2 3.1 46.3 35.0 20.7 75.1
Class Low 14.4 55.2 51.8 4.2 60.4 52.6 28.2 81.5Medium 11.9 39.5 49.4 2.5 49.5 36.1 19.0 74.3High 8.3 20.6 42.7 1.9 27.5 24.2 14.7 67.4
Total 11.9 39.7 48.5 2.9 49.6 39.9 21.2 76.0Source: NFHS 2, 1998
The government of Maharashtra’s efforts to improve nutritional status of women and children in the state through the Integrated Child Development Services Schemes (ICDS) have met with some success. Under the ICDS schemes the state government has made provisions for supplementary nutrition to children less than six years of age, pregnant women and nursing mothers belonging to poor families enrolled at anganwadis. Service statistics (Table 14) show that about 2.4 lakh pregnant women, 2.5 lakh of nursing women and 31.3 lakh of children benefited from these schemes in the month of March 2001. But the proportion of eligible women/children who got enrolled and benefited from ICDS schemes varied between 55-68 per cent. Perhaps the overall nutritional status of the state would have been better than the one observed above if there had been a wider coverage of the ICDS schemes.
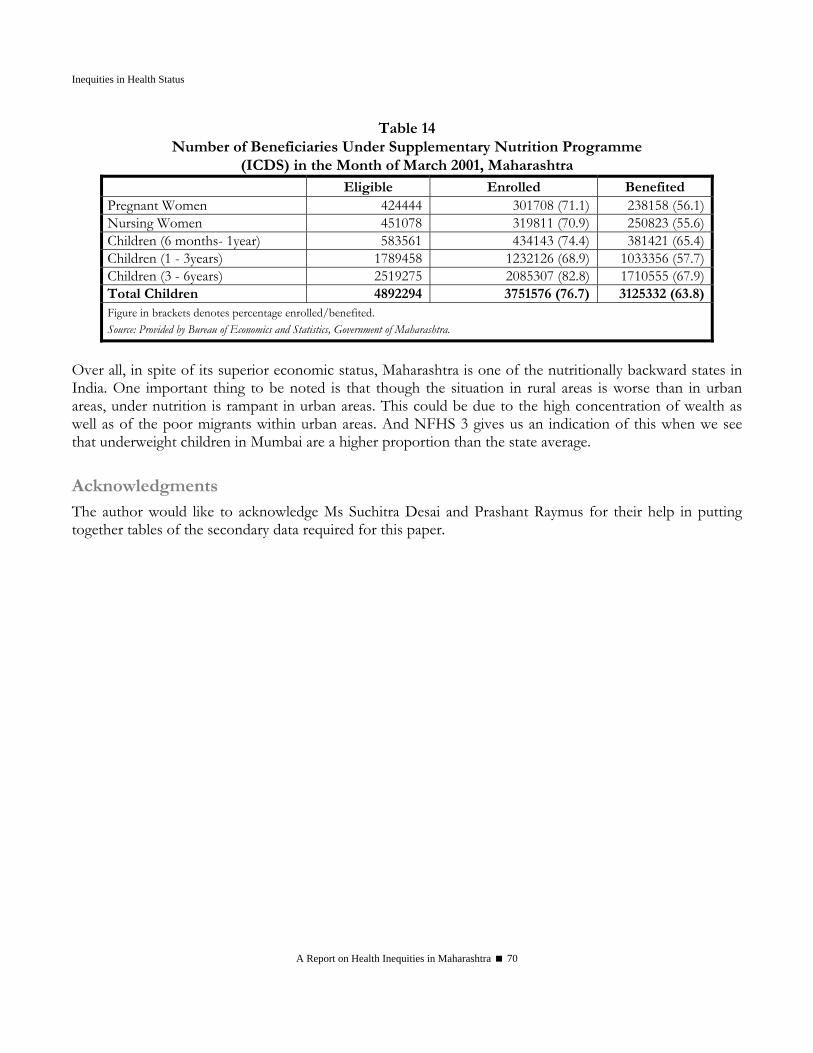
Inequities in Health Status
A Report on Health Inequities in Maharashtra 70
Table 14 Number of Beneficiaries Under Supplementary Nutrition Programme
(ICDS) in the Month of March 2001, Maharashtra Eligible Enrolled Benefited Pregnant Women 424444 301708 (71.1) 238158 (56.1)Nursing Women 451078 319811 (70.9) 250823 (55.6)Children (6 months- 1year) 583561 434143 (74.4) 381421 (65.4)Children (1 - 3years) 1789458 1232126 (68.9) 1033356 (57.7)Children (3 - 6years) 2519275 2085307 (82.8) 1710555 (67.9)Total Children 4892294 3751576 (76.7) 3125332 (63.8)Figure in brackets denotes percentage enrolled/benefited. Source: Provided by Bureau of Economics and Statistics, Government of Maharashtra.
Over all, in spite of its superior economic status, Maharashtra is one of the nutritionally backward states in India. One important thing to be noted is that though the situation in rural areas is worse than in urban areas, under nutrition is rampant in urban areas. This could be due to the high concentration of wealth as well as of the poor migrants within urban areas. And NFHS 3 gives us an indication of this when we see that underweight children in Mumbai are a higher proportion than the state average.
Acknowledgments The author would like to acknowledge Ms Suchitra Desai and Prashant Raymus for their help in putting together tables of the secondary data required for this paper.
Ravi Duggal
A Report on Health Inequities in Maharashtra 71
References International Institute For Population Sciences (1998-1999): National Family Health Survey (NFHS-2)
International Institute For Population Sciences (2005-2006): National Family Health Survey (NFHS-3), Fact Sheet Maharashtra (Provisional Data)
International Institute For Population Sciences (1999): Reproductive And Child Health Facility Survey 1999, Ministry Of Health And Family Welfare, Government Of India, New Delhi
National Sample Survey Organisation (1987): Morbidity And Utilisation Of Medical Services, 42nd Round, Report No. 384, National Sample Survey Organisation, New Delhi
National Sample Survey, NSS 52nd round, Consumer Expenditure, Education, Health and Aged in India, July' 1995 -June' 1996, National Sample Survey Organisation, Ministry of Statistics and Programme Implementation, Government of India
National Sample Survey, NSS 60th Round, Consumer Expenditure, Employment- Unemployment, Morbidity, Health Care & Condition Of The Aged, January'2004-June' 2004, National Sample Survey Organisation, Ministry Of Statistics And Programme Implementation, Government Of India
Sample Registration System Bulletin Volume 33 No. 2 October 1999 Registrar General India, Vital Statistics Division, West Block 1, Wing 1, 2nd Floor, R. K. Puram, New Delhi 110 066
Sample Registration System Bulletin Volume 34 No. 2 October 2000 Registrar General, India ISSN 0971-3549
Sample Registration System Bulletin Volume 36 No. 2, October 2002 Registrar General, India
Sample Registration System Bulletin Volume 40 No.1 April 2006 Registrar General, India ISSN 0971-3549
Inequities in Health Status
A Report on Health Inequities in Maharashtra 72
SECTION IV GENDER INEQUITIES IN
HEALTH ACCESS AND OUTCOMES
Lakshmi Lingam & Amita Pitre
A Report on Health Inequities in Maharashtra 75
Gender Inequities in Health Access and Outcomes
Lakshmi Lingam & Amita Pitre
Introduction This chapter attempts to closely examine the situation of women’s health in Maharashtra from a gender perspective and highlight underlying inequities in terms of access to health goods and services and health outcomes. The attempt is to view women’s health within the context of other inequities such as geography, region, class, caste, tribe and others, since these inequities work synergistically to produce negative health outcomes. The chapter is organised as follows. It initially gives the conceptual framework which underlies the paper, followed by a picture of gender inequities in health determinants, status, risks and access to health care.
Gender, Access and Equity Access is generally measured in terms of utilisation of health care services and is observed to manifest in improvements in health outcomes. Public policies, budgets, geographical distribution of services, class, gender, race, ethnicity and ability determine an individual’s access to several social resources including health. The issue of access to health care services is closely related to issues of equity. Unless otherwise stated, all public health services are supposedly universal in terms of access. However, there is enough evidence to inform us that public health services are unequally distributed between different population groups. Access is inversely correlated to socio-economic status, creating inequity and inefficient use of public funds. For example, in over 80% of the developing countries reviewed (17 of 21) in a recent World Bank study, the better off 20% of the population receives more than or as much of the government subsidies to health services as the population’s poorest 20%. On average, the benefit going to the better off 20% is two-thirds higher than that accruing to the poorest 20%. In addition, service coverage rates for essential services like basic maternal and child health care; have been found to be higher among the best-off 20% of developing country populations than among the poorest 20% (Qamruddin, Gwatkin and Yazbeck, 2005) Besides class ‘gender’ mediates health outcomes in ways detrimental to men and women. Understanding the conceptual distinction between ‘sex’ and ‘gender’ facilitates a more nuanced understanding of women’s health status and outcomes. The term ‘sex’ refers to the biological differences between men and women. ‘Gender’ refers to the socially constructed roles and responsibilities that women and men carry out which are differentially and hierarchically located and valued in various cultures. The differential valuation of men and women permeates several institutions within society often placing women at disadvantage. Gender asymmetry manifested in terms of power, control and access to resources is embedded in social relationships defined by caste, class, region, religion and other parameters.
Gender Inequities in Health Access and Outcomes
A Report on Health Inequities in Maharashtra 76
Gender roles and relations translate into excessive work burden, lower access to household and societal resources, poor decision-making power, low autonomy and control over their bodies for women. Apart from poor availability and access to health care services, there is enormous evidence at present to show that gender mediates and creates differential outcomes for women in terms of morbidity and mortality rates reversing the biological advantage they are endowed with. A gender perspective to understanding health enables us to move from a purely biological deterministic approach to one that accounts for biology embedded within the social context. While certain health problems can be considered to be located within biology, for example, cervical cancer for women and prostrate cancers among men, women’s susceptibility to cervical cancer is considerably enhanced due to social disadvantages like low autonomy, low control over sexuality, procreation and low access to early diagnosis and preventive care. The gendered privileges that men enjoy in most societies coupled with notions of masculinity also place them at special risk much more than women, e.g. to liver cirrhosis (due to alcohol consumption); to lung cancers due to smoking; to injuries and road accidents due to spatial mobility, risk taking and exposure to hazardous occupations (Basu, 1995). This positive disadvantage (if it can be so viewed) that women have is reversed by social and cultural practices, placing women to bear a large unrecognized and unacknowledged morbidities load. Age, marital status, ownership of property and support structures further mediate health outcomes. Gender interacts with other social stratifiers such as class, caste and ethnicity largely to exacerbate negative health outcomes for the doubly disadvantaged. For example, an elderly Dalit poor woman is more vulnerable to health problems compared to an elderly upper caste propertied woman. The social stratifiers - age, caste, class and gender intersect and mediate access to health resources and thereby health outcomes. Lack of gender disaggregated data masks gender gaps in health outcomes within different social stratifiers. Iyer, Sen and George (2007) have highlighted how apparent differences in access to health care by class, are in reality mediated through gender and the bulk of differences in access between the high and low income groups may be almost entirely explained by the differences in women’s access to health care services within each group. Women are not only materially disadvantaged, they encounter gender discrimination at all levels in society and experience higher opportunity costs when they fall ill or have to seek care or have to care for someone else. Therefore, achievement of gender equity requires focus on removing bias, inequality and injustice (Sen, George and Ostlin, 2002).
Gender Equity in Health Gender equity in health is a pursuit to attain desirable health goals/outcomes by addressing identical and different health requirements of men and women through policy priorities, budgetary allocations, infrastructure availability, staff training, and delivery of services and so on.
Horizontal and Vertical Equities Horizontal equity demands that equal resources and attention need to be given to men and women to realize their potential for health. For example, access to health care for all health problems, e.g., Malaria, TB, have to be the same for men and women without any discrimination. On the other hand, vertical equity

Lakshmi Lingam & Amita Pitre
A Report on Health Inequities in Maharashtra 77
means that different needs of men and women (that may or may not stem from biological differences) need to be recognized and addressed in terms of equitable allocation of resources. While men too have reproductive health needs (sexual health and infertility) the medical requirements that adolescent girls and women in their reproductive age groups have is comparatively higher. Menstruation, pregnancies, abortions, deliveries and contraception would necessitate that they access health care services much more than men. Not making sufficient provisions constitutes an inequity, which women face on a large scale. Horizontal and vertical equity issues intersect as well. For example, elderly men and women have a greater need for health care services, but the nature of each one’s needs may differ. Fulfilling these needs equally but differently will fulfill the horizontal and vertical equity requirements. Identifying the different needs, making provisions for addressing the same and removing barriers to access health resources are issues of priority for health policy and advocacy. Women face different kinds of inequalities that predispose them to poor health status, expose them to health problems, create barriers to their access to health care services, thus resulting in avoidable negative health outcomes. These inequalities are elaborated in the following sections in terms of
1. Inequities in the determinants of health, in other words, the preconditions that determine positive health and health outcomes;
2. Inequities in health status, which is a result of differential access to power and resources 3. Inequities in risk or exposure that originates in gender roles, relations and identity and 4. Inequities in access to health care services – the demand side and the supply side factors12.
1. Inequities in Health Determinants Socio-economic conditions, access to education, nutrition and basic amenities constitute fundamental determinants of health. The following sections deal with indicators like literacy, work participation, women’s work roles, quality of life and health, which are a few major health determinants. Major gender gaps exist pertaining to these indicators in Maharashtra. Social inequalities overlap with gender gaps in the case of women from marginalised groups such as Scheduled Castes (SC), Scheduled Tribes (ST), those living in rural areas, poor households and unorganised/informal sector workers. Literacy and Education Levels
Educational attainment is known to enhance health indicators, especially in the case of women and that of their children and family. Maharashtra ranks fifth in male as well as female literacy at the all India level. The literacy level is 77.27% (2001 Census) with a gender gap of 18.5 percentage points. Urban literacy is 85.76% with a gender gap of 12 and rural literacy is 70.84% with a gender gap of 23. Enrollment in schools in general, and particularly for girls is affected by other social disadvantages. Regional differences in female literacy exist in Maharashtra (see Fig 1). Konkan has 3 out of 5 districts with high female literacy (>70%) compared to Western and North Maharashtra that have 4 out of 5 districts in
12 Göran Dahlgren and Margaret Whitehead ( 2007) have attempted a similar framework to develop strategies for Europe for tackling social inequalities in health.
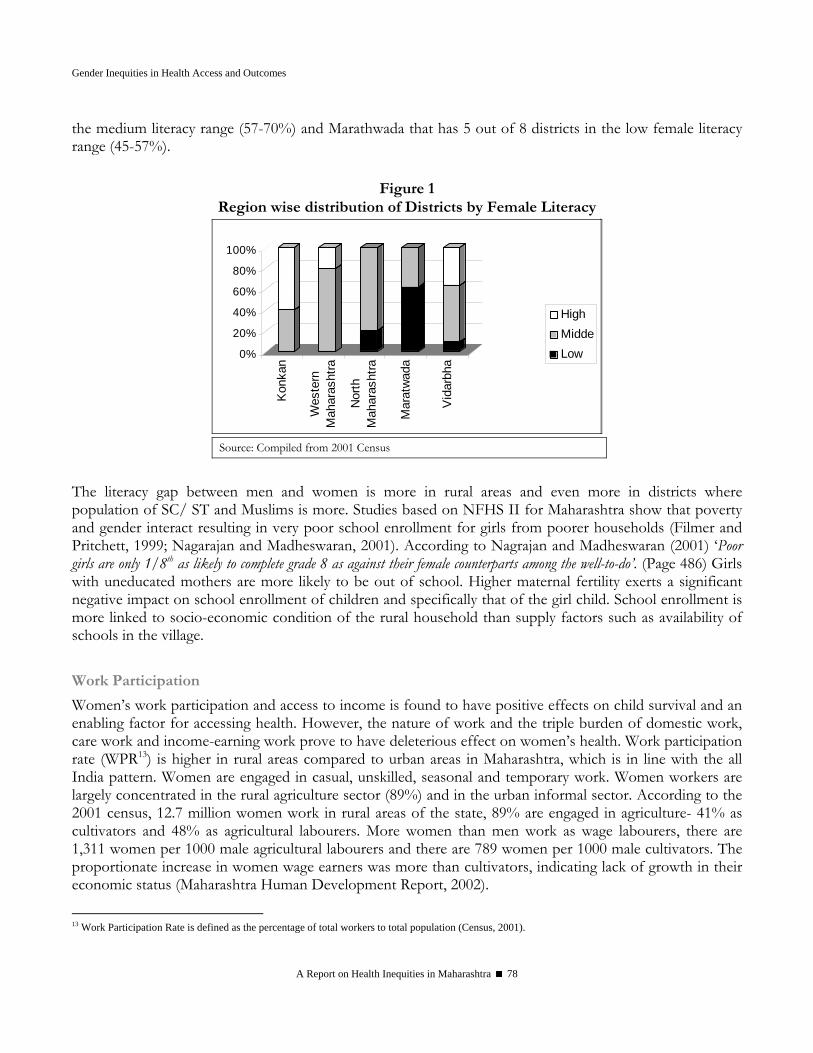
Gender Inequities in Health Access and Outcomes
A Report on Health Inequities in Maharashtra 78
the medium literacy range (57-70%) and Marathwada that has 5 out of 8 districts in the low female literacy range (45-57%).
Figure 1 Region wise distribution of Districts by Female Literacy
0%
20%
40%
60%
80%
100%
Kon
kan
Wes
tern
Mah
aras
htra
Nor
thM
ahar
asht
ra
Mar
atw
ada
Vid
arbh
a
HighMiddeLow
Source: Compiled from 2001 Census
The literacy gap between men and women is more in rural areas and even more in districts where population of SC/ ST and Muslims is more. Studies based on NFHS II for Maharashtra show that poverty and gender interact resulting in very poor school enrollment for girls from poorer households (Filmer and Pritchett, 1999; Nagarajan and Madheswaran, 2001). According to Nagrajan and Madheswaran (2001) ‘Poor girls are only 1/8th as likely to complete grade 8 as against their female counterparts among the well-to-do’. (Page 486) Girls with uneducated mothers are more likely to be out of school. Higher maternal fertility exerts a significant negative impact on school enrollment of children and specifically that of the girl child. School enrollment is more linked to socio-economic condition of the rural household than supply factors such as availability of schools in the village. Work Participation
Women’s work participation and access to income is found to have positive effects on child survival and an enabling factor for accessing health. However, the nature of work and the triple burden of domestic work, care work and income-earning work prove to have deleterious effect on women’s health. Work participation rate (WPR13) is higher in rural areas compared to urban areas in Maharashtra, which is in line with the all India pattern. Women are engaged in casual, unskilled, seasonal and temporary work. Women workers are largely concentrated in the rural agriculture sector (89%) and in the urban informal sector. According to the 2001 census, 12.7 million women work in rural areas of the state, 89% are engaged in agriculture- 41% as cultivators and 48% as agricultural labourers. More women than men work as wage labourers, there are 1,311 women per 1000 male agricultural labourers and there are 789 women per 1000 male cultivators. The proportionate increase in women wage earners was more than cultivators, indicating lack of growth in their economic status (Maharashtra Human Development Report, 2002).
13 Work Participation Rate is defined as the percentage of total workers to total population (Census, 2001).
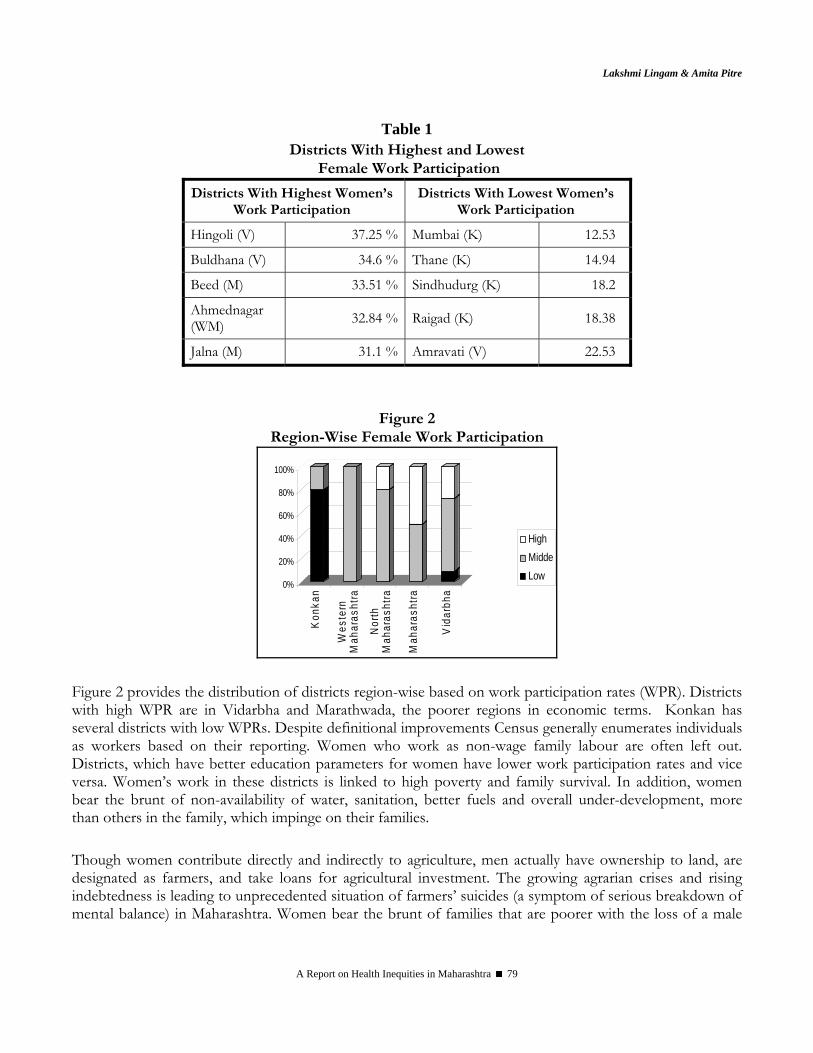
Lakshmi Lingam & Amita Pitre
A Report on Health Inequities in Maharashtra 79
Table 1 Districts With Highest and Lowest
Female Work Participation
Districts With Highest Women’s Work Participation
Districts With Lowest Women’s Work Participation
Hingoli (V) 37.25 % Mumbai (K) 12.53
Buldhana (V) 34.6 % Thane (K) 14.94
Beed (M) 33.51 % Sindhudurg (K) 18.2
Ahmednagar (WM) 32.84 % Raigad (K) 18.38
Jalna (M) 31.1 % Amravati (V) 22.53
Figure 2 Region-Wise Female Work Participation
0%
20%
40%
60%
80%
100%
Kon
kan
Wes
tern
Mah
aras
htra
Nor
thM
ahar
asht
ra
Mah
aras
htra
Vid
arbh
a
HighMiddeLow
Figure 2 provides the distribution of districts region-wise based on work participation rates (WPR). Districts with high WPR are in Vidarbha and Marathwada, the poorer regions in economic terms. Konkan has several districts with low WPRs. Despite definitional improvements Census generally enumerates individuals as workers based on their reporting. Women who work as non-wage family labour are often left out. Districts, which have better education parameters for women have lower work participation rates and vice versa. Women’s work in these districts is linked to high poverty and family survival. In addition, women bear the brunt of non-availability of water, sanitation, better fuels and overall under-development, more than others in the family, which impinge on their families. Though women contribute directly and indirectly to agriculture, men actually have ownership to land, are designated as farmers, and take loans for agricultural investment. The growing agrarian crises and rising indebtedness is leading to unprecedented situation of farmers’ suicides (a symptom of serious breakdown of mental balance) in Maharashtra. Women bear the brunt of families that are poorer with the loss of a male
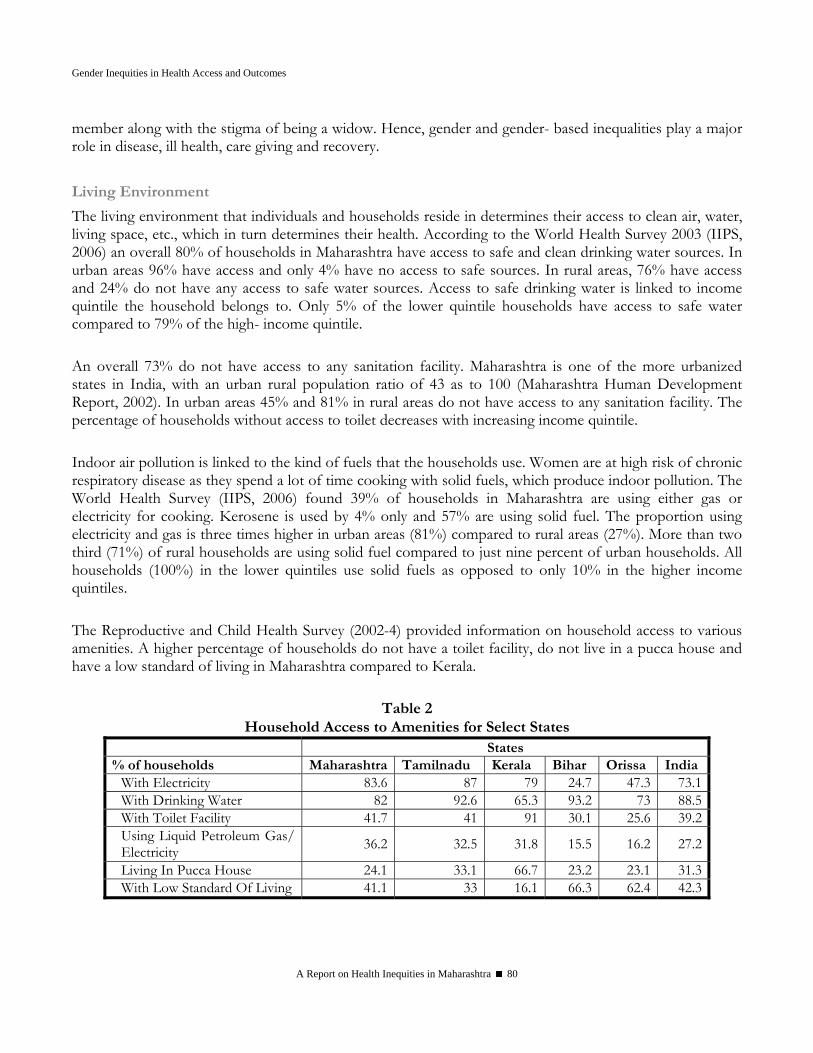
Gender Inequities in Health Access and Outcomes
A Report on Health Inequities in Maharashtra 80
member along with the stigma of being a widow. Hence, gender and gender- based inequalities play a major role in disease, ill health, care giving and recovery. Living Environment
The living environment that individuals and households reside in determines their access to clean air, water, living space, etc., which in turn determines their health. According to the World Health Survey 2003 (IIPS, 2006) an overall 80% of households in Maharashtra have access to safe and clean drinking water sources. In urban areas 96% have access and only 4% have no access to safe sources. In rural areas, 76% have access and 24% do not have any access to safe water sources. Access to safe drinking water is linked to income quintile the household belongs to. Only 5% of the lower quintile households have access to safe water compared to 79% of the high- income quintile. An overall 73% do not have access to any sanitation facility. Maharashtra is one of the more urbanized states in India, with an urban rural population ratio of 43 as to 100 (Maharashtra Human Development Report, 2002). In urban areas 45% and 81% in rural areas do not have access to any sanitation facility. The percentage of households without access to toilet decreases with increasing income quintile. Indoor air pollution is linked to the kind of fuels that the households use. Women are at high risk of chronic respiratory disease as they spend a lot of time cooking with solid fuels, which produce indoor pollution. The World Health Survey (IIPS, 2006) found 39% of households in Maharashtra are using either gas or electricity for cooking. Kerosene is used by 4% only and 57% are using solid fuel. The proportion using electricity and gas is three times higher in urban areas (81%) compared to rural areas (27%). More than two third (71%) of rural households are using solid fuel compared to just nine percent of urban households. All households (100%) in the lower quintiles use solid fuels as opposed to only 10% in the higher income quintiles. The Reproductive and Child Health Survey (2002-4) provided information on household access to various amenities. A higher percentage of households do not have a toilet facility, do not live in a pucca house and have a low standard of living in Maharashtra compared to Kerala.
Table 2 Household Access to Amenities for Select States
States % of households Maharashtra Tamilnadu Kerala Bihar Orissa India
With Electricity 83.6 87 79 24.7 47.3 73.1With Drinking Water 82 92.6 65.3 93.2 73 88.5With Toilet Facility 41.7 41 91 30.1 25.6 39.2Using Liquid Petroleum Gas/ Electricity 36.2 32.5 31.8 15.5 16.2 27.2
Living In Pucca House 24.1 33.1 66.7 23.2 23.1 31.3With Low Standard Of Living 41.1 33 16.1 66.3 62.4 42.3

Lakshmi Lingam & Amita Pitre
A Report on Health Inequities in Maharashtra 81
While men and women have similar chances of being impinged by poor living environment, women have to face the pressure of carrying out their domestic roles (cooking, fetching water, caring for old and young) within such hostile living environment. Therefore, improvements in living environment not only positively improve the quality of life of all members, but particularly improve the health situation of women.
2. Gender Inequities and Health Status Along with socio-economic inequalities that impinge on health, gender places several women at risk of various vulnerabilities and health conditions, which affect their health and well-being. As part of their socialisation most women in India are taught to place the well-being of others, especially men, children and family members, a priority compared to their own. Enduring ill-health, sacrificing their desires and needs, fasting several days in a week are all different ways by which young married women indicate their commitment/ responsibility to the conjugal family. Gendered existence of women and consequent gender gaps in factors that determine health become an additional determinant of women’s health. Addressing gender equity issues is therefore closely connected to addressing health equity. Women are disadvantaged at various stages of their life, for example, during infancy, childhood, adolescence and adulthood. The disadvantage women face in their life is deleterious to their own health and is also transmitted to future generations. The following section attempts to highlight inequities in women’s health and also reiterate how these form the health risks to the future generations. These sections are limited by availability of specific evidence on inequities in health status of women across various life stages. Gender based inequities manifest in differential health status of males and females. The following sections explore several outcomes such as declining sex ratio (that is linked to son preference culture) and few of the determinants of gender inequities such as low age at marriage.
Sex Ratio
Sex Ratio or the number of women per thousand men has seen a steady decline in India. In Maharashtra the sex ratio is 922 (Census 2001), which is a fall of 12 points from sex ratio in 1991. The juvenile sex ratio (JSR) or number of girls per 1000 boys in the 0 to 6 years age group, is relatively unaffected by migration and differential mortality rates and gives a fairly accurate estimate of ‘son preference’ in society. Maharashtra has seen a steady decline in JSR over the decades, from 946 in 1991 to 913 in 2001 census. Nearly one fourth of the districts in Maharashtra (8) have a JSR of less than 900 girls per 1000 boys. Half of these districts are in Western Maharashtra, and two each are in North Maharashtra and Marathwada. Gadchiroli in Vidarbha, a tribal dominated district, is the only district with a JSR of more than 970. ‘Development’ and situation of women shows a peculiar relationship in Maharashtra. The better-developed parts of Maharashtra are Mumbai, Western Maharashtra and some parts of Konkan. Here women’s education rates are better but there has been a sharp fall in sex ratio, especially in Western Maharashtra. Women’s literacy has not helped in reversing son preference. Rather families are using medical technologies as the new means to eliminate unwanted girl children even before their birth. Attaining the objective of a small family and simultaneously also fulfill the desire to have at least one son becomes a compulsive reason for utilising sex determination tests (like ultrasonography). The growing

Gender Inequities in Health Access and Outcomes
A Report on Health Inequities in Maharashtra 82
private sector and the ease with which ultrasound can be administered has made facilitating sex detection a lucrative business proposition. As a result, the districts that are most developed on several indicators also have masculine juvenile sex ratios. Despite the existence of the PNDT Act the implementation in Maharashtra is abysmal.
Source: Maps of India, http://www.mapsofindia.com/census2001/sexratio/sexratio-Maharashtra.htm, accessed on 24 October 2007
A community based study by Ganatra, Hirve and Rao (2001) in three districts of Western Maharashtra identified 1409 women who acknowledged having undergone induced abortion. 263 women (17.6%) have indicated that they have undergone abortion to avert the birth of a girl child. Where as only 2 women (0.1%) have undergone abortion to avert the birth of a male child. 81.3% women had abortions unrelated to sex selection, but linked to birth spacing, completion of family size and contraceptive failure. Majority of the women seeking selective abortions had a daughter as the youngest living child (82%). In terms of the characteristics of sex selective abortion seekers, the researchers observe that these women and their spouses are educated; they are more likely to belong to joint families, enjoy low autonomy and decision-making power within the family. The pressure to give birth to a male child within the family ‘encourages’ women to opt for sex selection. The researchers conclude that increasing woman’s autonomy and ability to make choices have to be emphasised in order to address sex selective abortions.

Lakshmi Lingam & Amita Pitre
A Report on Health Inequities in Maharashtra 83
High Infant and Child Mortality Infant and Child Mortality continue to be on the higher side in Maharashtra. Infant Mortality in Maharashtra (50.5) was more than twice of Kerala (23.8) as per NFHS I. The declines in IMR in Kerala recorded by NFHS II have been more substantial compared to Maharashtra (Maharashtra- 43.7, Kerala 16.3). The slow declines in infant mortality rates and significant gender differences seen in Table 3 in urban rates of Infant Mortality are a cause for concern. A study in Maharashtra now shows that stillbirths have also been under-reported until now. The recording of data on stillbirths does not provide for the sex of the child, hence, it is difficult to draw inferences from the official data. Bang et. al., (2002) confirmed in their study covering 13 sites in Maharashtra, that there is a substantial gap between actual and recorded deaths among infants and children. In addition, they discovered that Sangli district in western Maharashtra, reported 30% more still births than other sites. Two villages in the district reported 24 stillbirths, all of which were females and occurred among home deliveries. This cautions us to continuing female infanticide under the guise of stillbirths. The growing stillbirths mask underlying trends in mortality and hinder effective policies and programmes to reduce mortality rates.
Table 3
Gender Differentials in Infant Mortality Rates Total Male Female India 70.0 69.8 70.8 Urban 43.8 47.4 39.7 Rural 75.4 75.6 75.2 Maharashtra 48.2 47.8 48.5 Urban 31.3 20.5 42.8 Rural 58.2 64.1 51.9 Source: India, Registrar General. (2001). Sample Registration System Bulletin, April 2001, New Delhi. P 1-6, Accessed from http://www.indianngos.com/factfile.htm, on 24 October 2007
Western Maharashtra is the region with the lowest Infant Mortality Rates (IMR), but strikingly has the worst sex ratio followed by Marathwada and North Maharashtra. Thus lowered IMR seems to be associated with increased sex-selection. Until recently the under- five mortality rate for girls was higher than for boys. This trend has reversed after 1996 (Data on Causes of Death, RGI, New Delhi). (Annexure II gives the top and bottom ranking districts in male and female IMR and Annexure III gives the under 5 mortality region and district-wise).
High Malnutrition and Anaemia among Children
NFHS-2 (1998-99) shows that an overall three-fourths of children under age three are anaemic, and this proportion remains nearly unchanged (72%) in NFHS-3 (2005-06). Most of these children suffer from mild to moderate anaemia. It is well known that anaemic children are at greater risk of infection, impaired mental skills, physical development and poor school performance. The decline in the percentage of under weight children has been slow. Poor feeding practices begin in infancy. Only about two in five infants under four
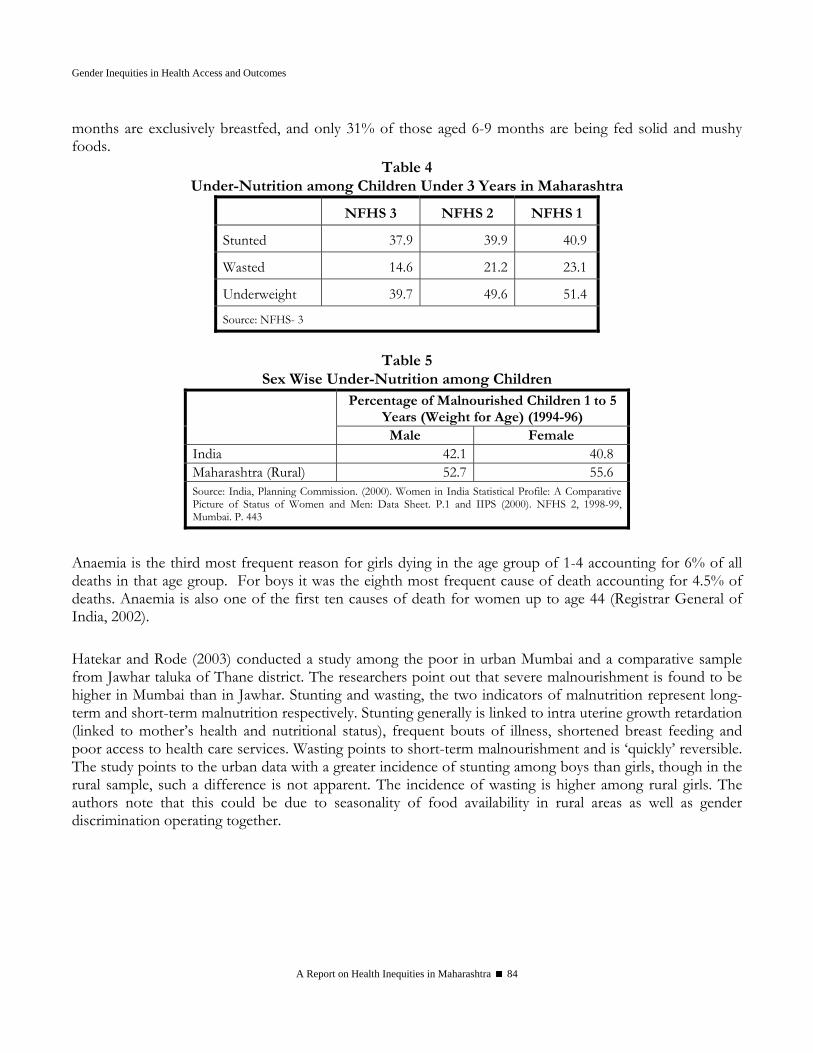
Gender Inequities in Health Access and Outcomes
A Report on Health Inequities in Maharashtra 84
months are exclusively breastfed, and only 31% of those aged 6-9 months are being fed solid and mushy foods.
Table 4 Under-Nutrition among Children Under 3 Years in Maharashtra
NFHS 3 NFHS 2 NFHS 1
Stunted 37.9 39.9 40.9
Wasted 14.6 21.2 23.1
Underweight 39.7 49.6 51.4
Source: NFHS- 3
Table 5
Sex Wise Under-Nutrition among Children Percentage of Malnourished Children 1 to 5
Years (Weight for Age) (1994-96) Male Female
India 42.1 40.8 Maharashtra (Rural) 52.7 55.6 Source: India, Planning Commission. (2000). Women in India Statistical Profile: A Comparative Picture of Status of Women and Men: Data Sheet. P.1 and IIPS (2000). NFHS 2, 1998-99, Mumbai. P. 443
Anaemia is the third most frequent reason for girls dying in the age group of 1-4 accounting for 6% of all deaths in that age group. For boys it was the eighth most frequent cause of death accounting for 4.5% of deaths. Anaemia is also one of the first ten causes of death for women up to age 44 (Registrar General of India, 2002). Hatekar and Rode (2003) conducted a study among the poor in urban Mumbai and a comparative sample from Jawhar taluka of Thane district. The researchers point out that severe malnourishment is found to be higher in Mumbai than in Jawhar. Stunting and wasting, the two indicators of malnutrition represent long-term and short-term malnutrition respectively. Stunting generally is linked to intra uterine growth retardation (linked to mother’s health and nutritional status), frequent bouts of illness, shortened breast feeding and poor access to health care services. Wasting points to short-term malnourishment and is ‘quickly’ reversible. The study points to the urban data with a greater incidence of stunting among boys than girls, though in the rural sample, such a difference is not apparent. The incidence of wasting is higher among rural girls. The authors note that this could be due to seasonality of food availability in rural areas as well as gender discrimination operating together.
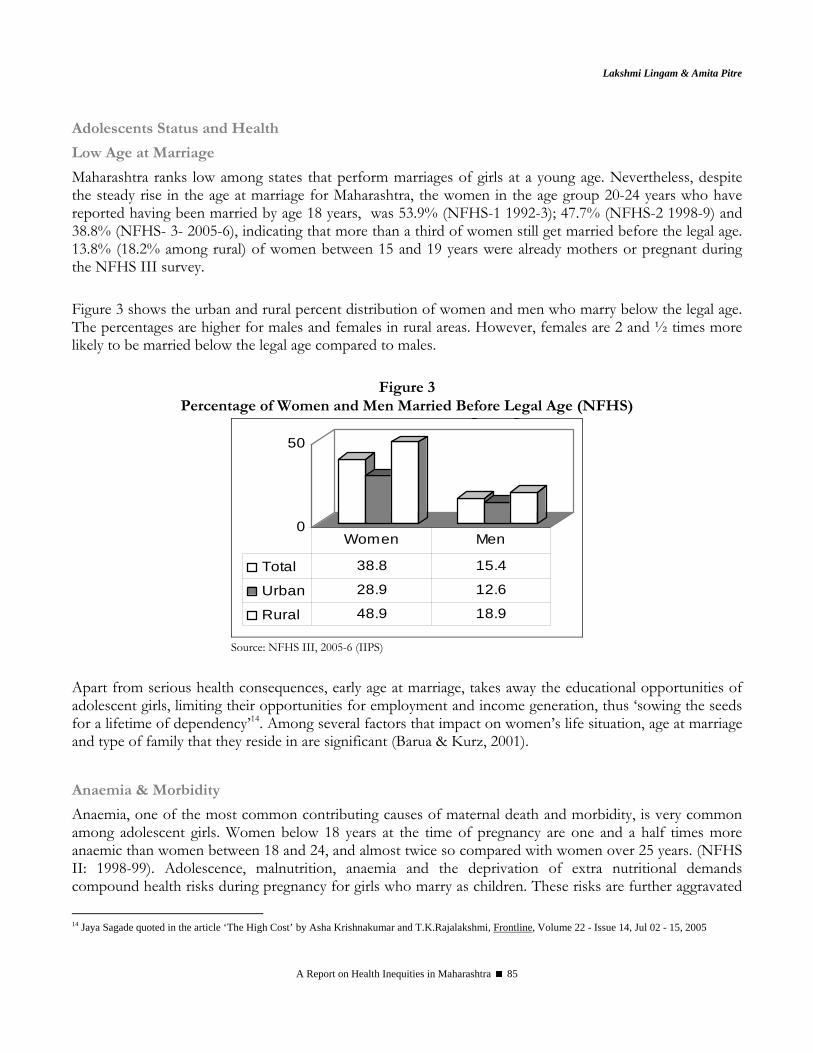
Lakshmi Lingam & Amita Pitre
A Report on Health Inequities in Maharashtra 85
Adolescents Status and Health
Low Age at Marriage
Maharashtra ranks low among states that perform marriages of girls at a young age. Nevertheless, despite the steady rise in the age at marriage for Maharashtra, the women in the age group 20-24 years who have reported having been married by age 18 years, was 53.9% (NFHS-1 1992-3); 47.7% (NFHS-2 1998-9) and 38.8% (NFHS- 3- 2005-6), indicating that more than a third of women still get married before the legal age. 13.8% (18.2% among rural) of women between 15 and 19 years were already mothers or pregnant during the NFHS III survey. Figure 3 shows the urban and rural percent distribution of women and men who marry below the legal age. The percentages are higher for males and females in rural areas. However, females are 2 and ½ times more likely to be married below the legal age compared to males.
Figure 3 Percentage of Women and Men Married Before Legal Age (NFHS)
0
50
g g
Total 38.8 15.4
Urban 28.9 12.6
Rural 48.9 18.9
Women Men
Source: NFHS III, 2005-6 (IIPS)
Apart from serious health consequences, early age at marriage, takes away the educational opportunities of adolescent girls, limiting their opportunities for employment and income generation, thus ‘sowing the seeds for a lifetime of dependency’14. Among several factors that impact on women’s life situation, age at marriage and type of family that they reside in are significant (Barua & Kurz, 2001).
Anaemia & Morbidity
Anaemia, one of the most common contributing causes of maternal death and morbidity, is very common among adolescent girls. Women below 18 years at the time of pregnancy are one and a half times more anaemic than women between 18 and 24, and almost twice so compared with women over 25 years. (NFHS II: 1998-99). Adolescence, malnutrition, anaemia and the deprivation of extra nutritional demands compound health risks during pregnancy for girls who marry as children. These risks are further aggravated
14 Jaya Sagade quoted in the article ‘The High Cost’ by Asha Krishnakumar and T.K.Rajalakshmi, Frontline, Volume 22 - Issue 14, Jul 02 - 15, 2005
Gender Inequities in Health Access and Outcomes
A Report on Health Inequities in Maharashtra 86
by poor antenatal care. NFHS III shows that only one third (30.5%) of pregnant women received Iron and Folic Acid tablets for 90 days as a part of the Ante Natal Care. (Annexure IV) A significant percentage of maternal morbidity is associated with unsafe induced abortions undergone by adolescents and the complications arising from them. According to the NFHS II (1998-99), the percentage of abortions among adolescents aged 15-19 is double that among women aged 20-49. These data, however, pertain only to the reported cases. The incidence of abortions and the number of pregnancies among girls are thought to be grossly underestimated (Hirve & Ganatra, 2002). Infants born to young mothers also suffer a great health risk. As per World Health Survey (2003) the level of neonatal mortality is lower for women who have given birth in ages 25-34 years compared to women in ages 18-24 and 35-49 years. The probability of neonatal deaths reduces sharply with increase in the education of the mother from 52 for illiterate women to a low of 18 per 1000 live births for women who have completed secondary education.
High Neo-Natal and Infant Mortality Linked to Poor Maternal Health
Deaths in the first month and first year form a major chunk of Under 5 Mortality. Causes such as prematurity, respiratory infection of newborn, diarrhea of new born were responsible for 60% of deaths within first year (Causes of Death, RGI, 1998). These are directly related to mother’s health. Neo-natal mortality has been more resistant to lowering than post neo-natal mortality. Low maternal nutrition, anaemia, lower socio-economic status of mother, poor antenatal care, morbidities, work burden, early age at pregnancy and multiple pregnancies are major maternal risk factors for higher neo-natal mortality (Hirve and Ganatra, 1984). Manageable inputs such as adequate diet and rest given to women in their third trimester has shown to increase the average weight of babies by 200 gm. Action research initiatives, such as reducing anemia and changing dietary behaviours among adolescent girls, by Institute of Health Management, Pachod; KEM Hospital’s reproductive and sexual health education, care and counseling for married adolescents in rural Maharashtra; and social mobilisation of Government services by the Foundation for Research in Community Health, have provided valuable insights in developing programmes for young people (Pande, Kurz, Walia, et., al., 2006).
Health Status of Adult Women
Anaemia among Men and Women
As per the NFHS- III (2006-7), 46.6% of urban women and 51% of rural women in the age group (15-49 yrs) are anaemic. This constitutes a major public health problem requiring urgent attention. The figures for pregnant women are higher compared to non-pregnant women and men and higher for urban women compared to rural women.
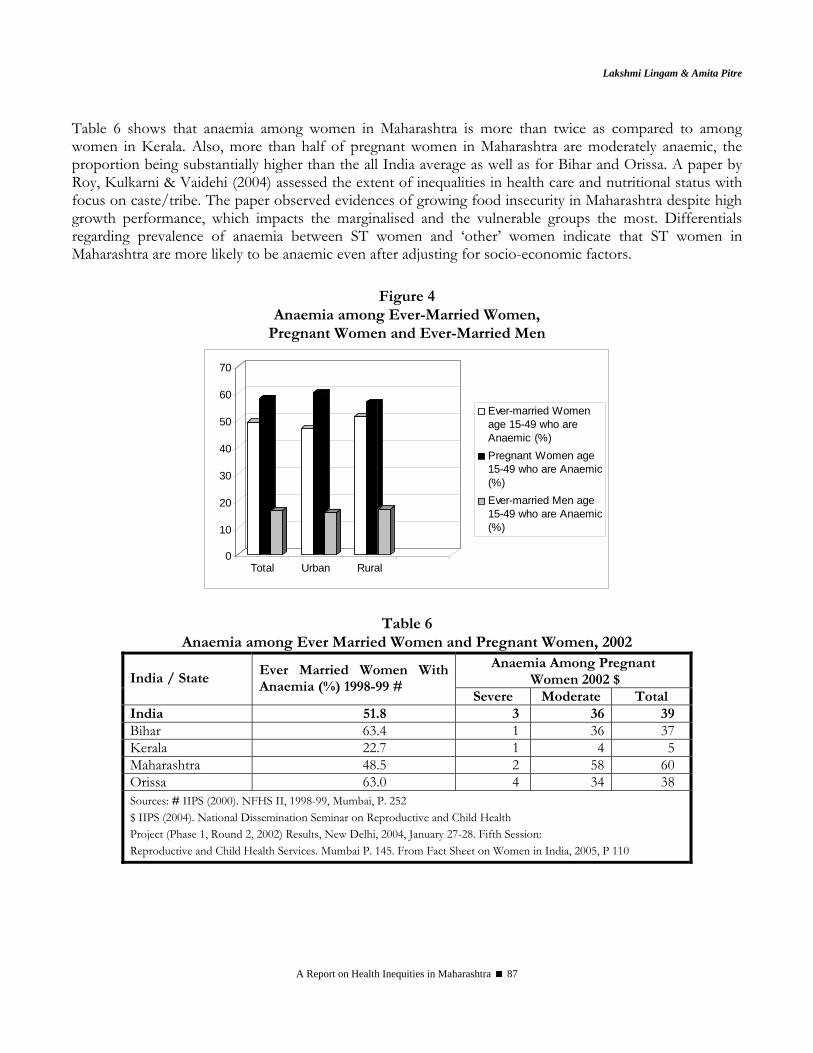
Lakshmi Lingam & Amita Pitre
A Report on Health Inequities in Maharashtra 87
Table 6 shows that anaemia among women in Maharashtra is more than twice as compared to among women in Kerala. Also, more than half of pregnant women in Maharashtra are moderately anaemic, the proportion being substantially higher than the all India average as well as for Bihar and Orissa. A paper by Roy, Kulkarni & Vaidehi (2004) assessed the extent of inequalities in health care and nutritional status with focus on caste/tribe. The paper observed evidences of growing food insecurity in Maharashtra despite high growth performance, which impacts the marginalised and the vulnerable groups the most. Differentials regarding prevalence of anaemia between ST women and ‘other’ women indicate that ST women in Maharashtra are more likely to be anaemic even after adjusting for socio-economic factors.
Figure 4 Anaemia among Ever-Married Women,
Pregnant Women and Ever-Married Men
0
10
20
30
40
50
60
70
Total Urban Rural
Ever-married Womenage 15-49 who areAnaemic (%)Pregnant Women age15-49 who are Anaemic(%)Ever-married Men age15-49 who are Anaemic(%)
Table 6 Anaemia among Ever Married Women and Pregnant Women, 2002
Anaemia Among Pregnant Women 2002 $ India / State
Ever Married Women With Anaemia (%) 1998-99 #
Severe Moderate Total India 51.8 3 36 39 Bihar 63.4 1 36 37 Kerala 22.7 1 4 5 Maharashtra 48.5 2 58 60 Orissa 63.0 4 34 38 Sources: # IIPS (2000). NFHS II, 1998-99, Mumbai, P. 252 $ IIPS (2004). National Dissemination Seminar on Reproductive and Child Health Project (Phase 1, Round 2, 2002) Results, New Delhi, 2004, January 27-28. Fifth Session: Reproductive and Child Health Services. Mumbai P. 145. From Fact Sheet on Women in India, 2005, P 110
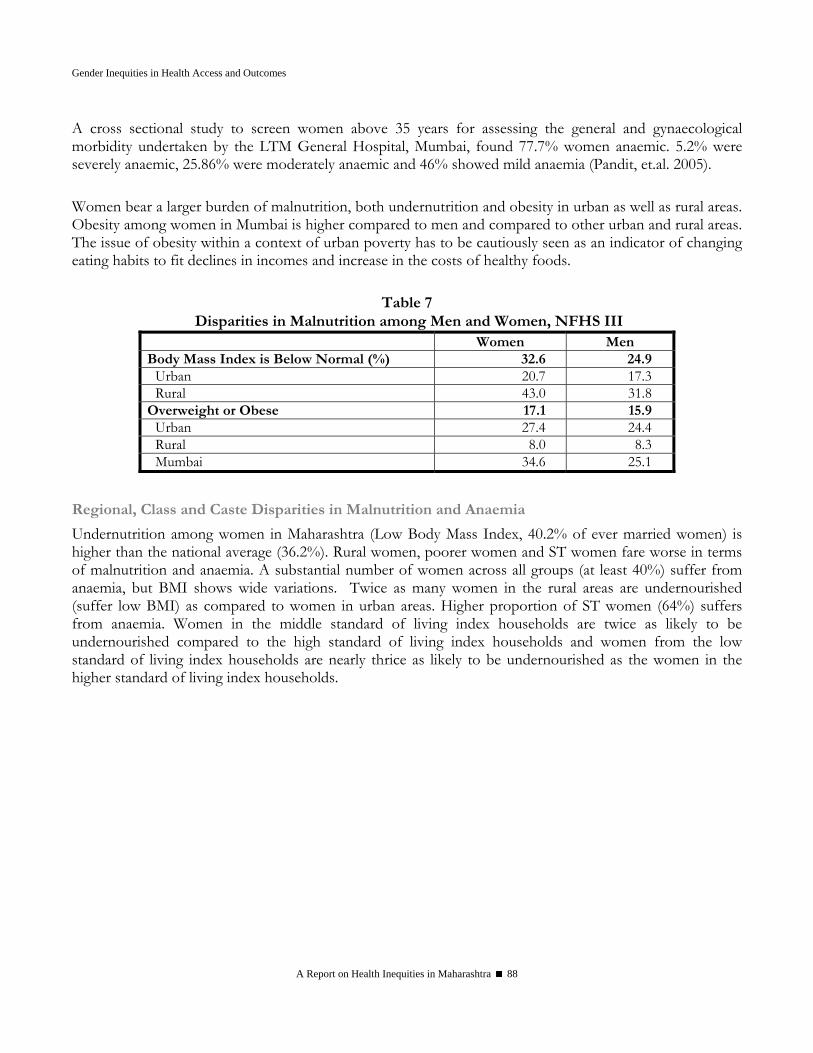
Gender Inequities in Health Access and Outcomes
A Report on Health Inequities in Maharashtra 88
A cross sectional study to screen women above 35 years for assessing the general and gynaecological morbidity undertaken by the LTM General Hospital, Mumbai, found 77.7% women anaemic. 5.2% were severely anaemic, 25.86% were moderately anaemic and 46% showed mild anaemia (Pandit, et.al. 2005). Women bear a larger burden of malnutrition, both undernutrition and obesity in urban as well as rural areas. Obesity among women in Mumbai is higher compared to men and compared to other urban and rural areas. The issue of obesity within a context of urban poverty has to be cautiously seen as an indicator of changing eating habits to fit declines in incomes and increase in the costs of healthy foods.
Table 7 Disparities in Malnutrition among Men and Women, NFHS III
Women Men Body Mass Index is Below Normal (%) 32.6 24.9
Urban 20.7 17.3 Rural 43.0 31.8
Overweight or Obese 17.1 15.9 Urban 27.4 24.4 Rural 8.0 8.3 Mumbai 34.6 25.1
Regional, Class and Caste Disparities in Malnutrition and Anaemia
Undernutrition among women in Maharashtra (Low Body Mass Index, 40.2% of ever married women) is higher than the national average (36.2%). Rural women, poorer women and ST women fare worse in terms of malnutrition and anaemia. A substantial number of women across all groups (at least 40%) suffer from anaemia, but BMI shows wide variations. Twice as many women in the rural areas are undernourished (suffer low BMI) as compared to women in urban areas. Higher proportion of ST women (64%) suffers from anaemia. Women in the middle standard of living index households are twice as likely to be undernourished compared to the high standard of living index households and women from the low standard of living index households are nearly thrice as likely to be undernourished as the women in the higher standard of living index households.
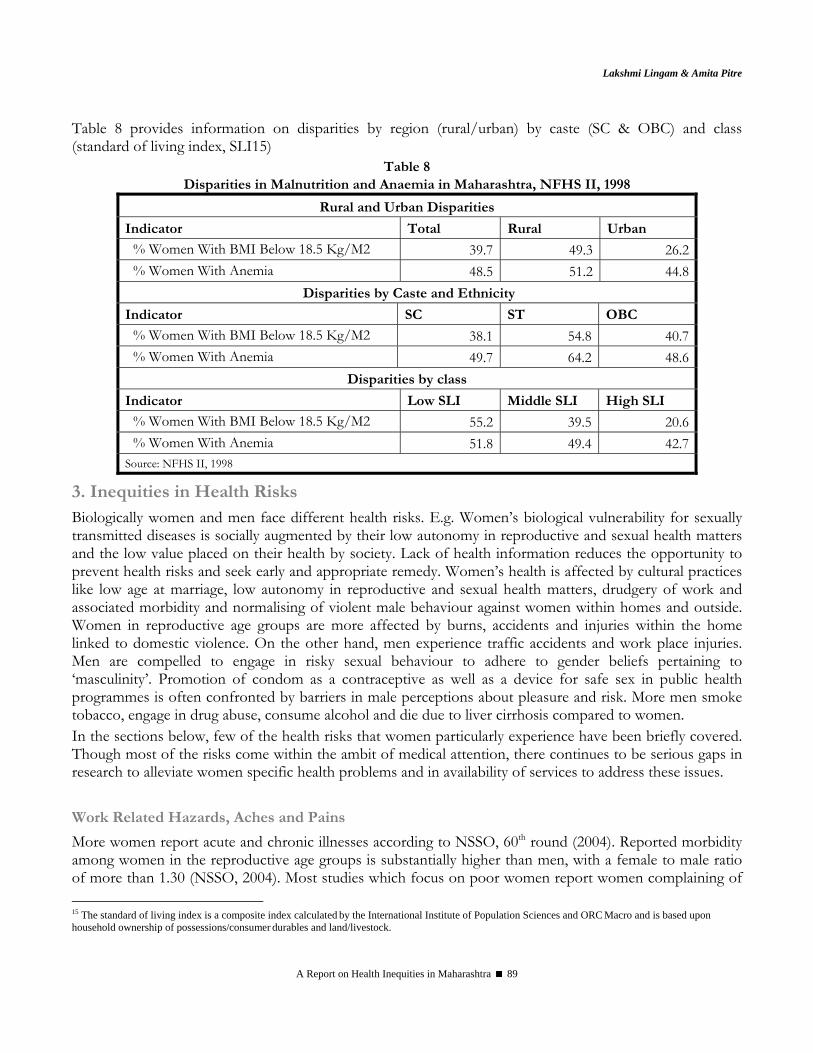
Lakshmi Lingam & Amita Pitre
A Report on Health Inequities in Maharashtra 89
Table 8 provides information on disparities by region (rural/urban) by caste (SC & OBC) and class (standard of living index, SLI15)
Table 8 Disparities in Malnutrition and Anaemia in Maharashtra, NFHS II, 1998
Rural and Urban Disparities
Indicator Total Rural Urban
% Women With BMI Below 18.5 Kg/M2 39.7 49.3 26.2% Women With Anemia 48.5 51.2 44.8
Disparities by Caste and Ethnicity
Indicator SC ST OBC
% Women With BMI Below 18.5 Kg/M2 38.1 54.8 40.7% Women With Anemia 49.7 64.2 48.6
Disparities by class
Indicator Low SLI Middle SLI High SLI
% Women With BMI Below 18.5 Kg/M2 55.2 39.5 20.6% Women With Anemia 51.8 49.4 42.7
Source: NFHS II, 1998
3. Inequities in Health Risks Biologically women and men face different health risks. E.g. Women’s biological vulnerability for sexually transmitted diseases is socially augmented by their low autonomy in reproductive and sexual health matters and the low value placed on their health by society. Lack of health information reduces the opportunity to prevent health risks and seek early and appropriate remedy. Women’s health is affected by cultural practices like low age at marriage, low autonomy in reproductive and sexual health matters, drudgery of work and associated morbidity and normalising of violent male behaviour against women within homes and outside. Women in reproductive age groups are more affected by burns, accidents and injuries within the home linked to domestic violence. On the other hand, men experience traffic accidents and work place injuries. Men are compelled to engage in risky sexual behaviour to adhere to gender beliefs pertaining to ‘masculinity’. Promotion of condom as a contraceptive as well as a device for safe sex in public health programmes is often confronted by barriers in male perceptions about pleasure and risk. More men smoke tobacco, engage in drug abuse, consume alcohol and die due to liver cirrhosis compared to women. In the sections below, few of the health risks that women particularly experience have been briefly covered. Though most of the risks come within the ambit of medical attention, there continues to be serious gaps in research to alleviate women specific health problems and in availability of services to address these issues.
Work Related Hazards, Aches and Pains
More women report acute and chronic illnesses according to NSSO, 60th round (2004). Reported morbidity among women in the reproductive age groups is substantially higher than men, with a female to male ratio of more than 1.30 (NSSO, 2004). Most studies which focus on poor women report women complaining of 15 The standard of living index is a composite index calculated by the International Institute of Population Sciences and ORC Macro and is based upon household ownership of possessions/consumer durables and land/livestock.
Gender Inequities in Health Access and Outcomes
A Report on Health Inequities in Maharashtra 90
body aches and pains. This is closely linked to not only the high levels of energy that women have to spend in carrying out household, agricultural and non-agricultural activities but also is coupled with their procreation roles, poor and gendered access to household and social resources. Substantially higher percentage of women reported difficulties in carrying out day to day tasks, experiencing aches and pains, difficulty in sleeping and depression in the World Health Survey (2003) for Maharashtra. One of the most neglected aspects is the amount of hard work and drudgery that is involved in women’s work. Apart from poor socio-economic status of the household and women’s poor status within the household, the health care system has serious shortcomings in addressing women’s health in a comprehensive manner. Women face a variety of work related health hazards such as damage to the eyes and high prevalence of respiratory illnesses and kitchen accidents as a result of the cooking fuels and inefficient stoves. The World Health Survey found a higher proportion of women (30%) are diagnosed for cataract compared to men (19%). Chronic back-ache and uterus prolapse are a result of postures at work, repetitive work operations, carrying and lifting of weights and weakened support for the uterus due to multiple pregnancies. Several community based NGOs report high prevalence of uterus prolapse among women, but there is no systematic research done on the same. HIV & Related Morbidities: Inequities in Risk of Infection
Biologically women face higher risk of contracting HIV infection due to the structure of their reproductive tracts. Untreated reproductive tract morbidities and STDs increase women’s vulnerability for HIV infections, which in turn may increase their risk of cervical cancer. In the RCH Survey (2002-03), women reporting at least one reproductive or sexually transmitted illness were 2 and ½ times that of men. Female sex workers form a vulnerable group for contracting the infection on account of their occupation, as do migrant workers, truck drivers and such other workers. Reduced access to health information and reduced autonomy over use of condoms or other reproductive and sexual health decisions augment women’s vulnerability to the infection. Based on the 2005 annual Sentinel Surveillance there are estimated 5.206 million HIV infections in the country. Out of this 38.4% are among women and 57% of those infected are in rural areas. This gives an adult prevalence of 0.91% in the country. HIV prevalence was >1% among antenatal mothers in 95 districts, including 9 districts in the low prevalence states. Similarly, HIV prevalence was >10% in 34 STD sites across the country, indicating multiple heterogeneous epidemics. During 2005 the contribution of HIV infection from STD population group has been found to be 1.7 million in comparison to 1.33 million during 2004. Maharashtra is considered to be a high prevalence state with 1% and over of HIV in the population. A study done in a STD clinic in Pune screened 5321 STD patients for HIV seroprevalence. The results indicated HIV seropositivity was 13.9% among women who were not commercial sex workers (CSWs), 47.4% in female CSW and 19.5% in males with history of exposure to CSWs and 17.3% in males without a history of exposure to CSWs. While HIV seroprevalence is high among high-risk populations, the difference, especially between men with and without ‘risky’ sexual behavior is narrow (Mehendale, Shepherd, et al., 1996).
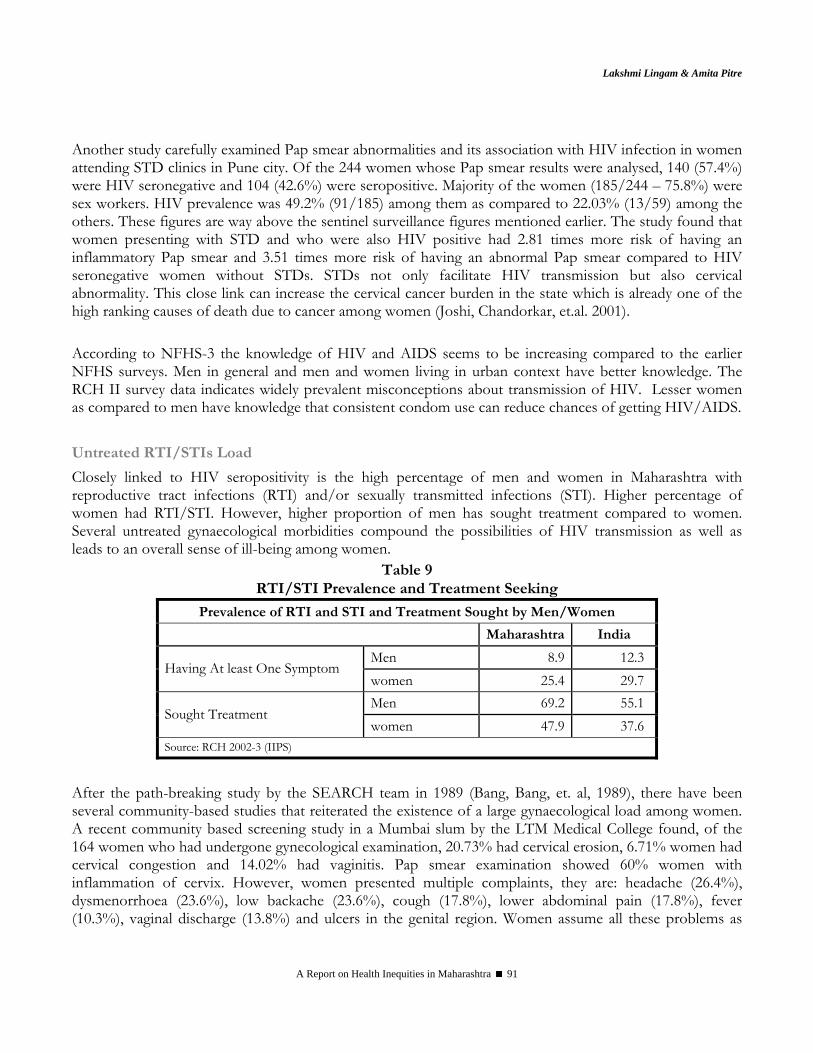
Lakshmi Lingam & Amita Pitre
A Report on Health Inequities in Maharashtra 91
Another study carefully examined Pap smear abnormalities and its association with HIV infection in women attending STD clinics in Pune city. Of the 244 women whose Pap smear results were analysed, 140 (57.4%) were HIV seronegative and 104 (42.6%) were seropositive. Majority of the women (185/244 – 75.8%) were sex workers. HIV prevalence was 49.2% (91/185) among them as compared to 22.03% (13/59) among the others. These figures are way above the sentinel surveillance figures mentioned earlier. The study found that women presenting with STD and who were also HIV positive had 2.81 times more risk of having an inflammatory Pap smear and 3.51 times more risk of having an abnormal Pap smear compared to HIV seronegative women without STDs. STDs not only facilitate HIV transmission but also cervical abnormality. This close link can increase the cervical cancer burden in the state which is already one of the high ranking causes of death due to cancer among women (Joshi, Chandorkar, et.al. 2001). According to NFHS-3 the knowledge of HIV and AIDS seems to be increasing compared to the earlier NFHS surveys. Men in general and men and women living in urban context have better knowledge. The RCH II survey data indicates widely prevalent misconceptions about transmission of HIV. Lesser women as compared to men have knowledge that consistent condom use can reduce chances of getting HIV/AIDS. Untreated RTI/STIs Load
Closely linked to HIV seropositivity is the high percentage of men and women in Maharashtra with reproductive tract infections (RTI) and/or sexually transmitted infections (STI). Higher percentage of women had RTI/STI. However, higher proportion of men has sought treatment compared to women. Several untreated gynaecological morbidities compound the possibilities of HIV transmission as well as leads to an overall sense of ill-being among women.
Table 9 RTI/STI Prevalence and Treatment Seeking
Prevalence of RTI and STI and Treatment Sought by Men/Women
Maharashtra India
Men 8.9 12.3 Having At least One Symptom
women 25.4 29.7 Men 69.2 55.1
Sought Treatment women 47.9 37.6
Source: RCH 2002-3 (IIPS)
After the path-breaking study by the SEARCH team in 1989 (Bang, Bang, et. al, 1989), there have been several community-based studies that reiterated the existence of a large gynaecological load among women. A recent community based screening study in a Mumbai slum by the LTM Medical College found, of the 164 women who had undergone gynecological examination, 20.73% had cervical erosion, 6.71% women had cervical congestion and 14.02% had vaginitis. Pap smear examination showed 60% women with inflammation of cervix. However, women presented multiple complaints, they are: headache (26.4%), dysmenorrhoea (23.6%), low backache (23.6%), cough (17.8%), lower abdominal pain (17.8%), fever (10.3%), vaginal discharge (13.8%) and ulcers in the genital region. Women assume all these problems as

Gender Inequities in Health Access and Outcomes
A Report on Health Inequities in Maharashtra 92
part of women’s lives and do not complain or seek treatment consistently (Pandit, et.al. 2005). Cost of treatment and male doctors were said to act as deterrents to seeking care.
Cancers
Deaths and morbidity due to cancers need attention in the state of Maharashtra. Among the leading cause of death in the league of non-communicable diseases among women in the reproductive age group, Maharashtra records cancers as the third most frequent cause. Among life style related factors that contribute to oral and liver related cancers smoking tobacco, chewing tobacco related products, poor oral hygiene, alcohol use are serious causes. The World Health Survey observed that tobacco consumption is 30% in Maharashtra whether consumed or chewed. Three times higher among males (45%) compared to females (16%). It is greater among rural population (32%) than in urban population (24%). Higher among lower income quintiles (45%) compared to higher income quintiles (16%). Higher among elderly compared to younger age groups. In the case of alcohol consumption the prevalence is 17% for males and 0.4% for females, consumed more among the lower income quintiles and among elderly. Hospital and community based studies record the gender and socio-economic indicators in detail. A study conducted to ascertain the pattern, pathology, distribution and determinants of cancer in rural Konkan, observed that out of the total 212 patients (50.47% males and 49.53 females) cancers of the gastro-intestinal tract constitute the highest number of malignancies in males and cancers of the reproductive system among females. Leading sites of cancer among elderly are oral cavity, rectum, esophagus and lung (Mishra, 2005). A study to determine the prevalence of oral cancers and precancerous lesions in a community in Naigaon, Mumbai, examined 200 men and women with precancerous lesions. The prevalence was 53%, most of the cases were in the age group of 45-55 years and 58% of lesions were among women. Smoking and chewing of tobacco were found as the reasons (Talole, Bansode & Patki, 2006). The study by Pandit, Prabha, Shanbhag & Mayekar,(2005) which screened women for gyanecological morbidities found a significant number (32.18%) reported to be using tobacco daily in the form of mishri, paan, gutkha or sniffing. While most studies find the occurrence of many non-communicable diseases among the poor and low income households, they do not sufficiently probe to comprehend how poverty not only creates preconditions for poor health but mediates the same through gender, age and kinship hierarchy within the household. For women poverty is not only a gendered experience it is also an embodied experience.
Violence and Crimes against Women as Health Risk
Crimes against women have seen a steady rise in Maharashtra, with cruelty at home being the most widespread crime (see Annexure V). Significant rise is seen in the crime heads - Dowry Prohibition Act (139%), Murder for Dowry (40%) and Attempt to Commit Murder for Dowry (28%), which signify violence faced by women within the home. Together these crimes constitute 54.7% of the crimes against women. Facility based studies in Mumbai reveal that over 20% cases visiting the emergency department were definite cases of domestic violence and more than 40% were cases of ‘possible violence’. More than 25% of pregnant women visiting an antenatal clinic had experienced violence during pregnancy, mostly by family members (Daga, Jejeebhoy, Rajgopal, 2004). An urban community based study found 64% of ever-married women had faced violence (Khot, Menon, Dilip, 2004). ‘Burns’ in Maharashtra causes a substantial number
Lakshmi Lingam & Amita Pitre
A Report on Health Inequities in Maharashtra 93
of deaths in the reproductive age group (15.2%), twice the all India figures (7.1%) (RGI, Survey of Causes of Death (Rural), India (2002)). According to NFHS III, 35% rural women and 26% urban women reported experiencing spousal violence. A hospital based study from Nagpur noted the male-female death ratio due to burns is 1:2.9. Most of the victims of burn deaths were between 11-40 years with peak at 21-30 years (47.1%). Married women outnumbered unmarried ones in burning (Ambade & Godbole, 2006). The official records of sexual violence in the Crimes in Maharashtra Report are a gross under-reporting and a sad commentary both on status of women and law enforcement. About 45% of crimes against women reported either constitute sexual violence or lead to sexual violence. The last decade has seen increasing instances of acid burns, one more addition to the spectrum of violence faced by women, this one faced by young women for spurning unwanted lovers. Needless to say that violence is a physical and mental health hazard, besides considerably lowering the quality and autonomy of women’s life. Lorie Heise et al (1995) have enlisted health risks related to violence and the consequences of violence on women’s health. Health risks include inability to use condoms and violent sexual initiation leading to fear of sex and loss of pleasure. Health consequences range from STDs and HIV, Unwanted pregnancy, Abortion related morbidity and mortality, Miscarriage and low birth weight from battering during pregnancy, Premature labour and Gynaecological problems to Suicide or Homicide related to stigma of violence.
Mental Health: Neglected Area
Among several non-communicable diseases that women endure, mental health is an area neglected by families because of the stigma attached to seeking care and the traditional beliefs that are held. Further, the available health services are inadequate and presumably not gender sensitive. The World Health Survey (2003) had gathered self reported morbidity and coverage (percent of persons treated) for six non-communicable diseases. They are angina, arthritis, asthma, diabetes, depression and psychosis. The survey observed a prevalence of 27% indicated each for arthritis and depression followed by angina (18%) and asthma (5%). Highest coverage is indicated for diabetes (71%) and angina (65%). On the other hand lowest coverage is indicated for depression. A greater proportion of males have been diagnosed with angina, asthma and diabetes whereas a greater proportion of females were diagnosed with arthritis, depression and psychosis. Among all the six non-communicable diseases, depression emerges high- urban (38%) and rural (24%). However, coverage for depression seemed to be low for both males and females. The World Health Survey (2003) had also probed into questions of ‘worry or anxiety’ in the last 30 days in Maharashtra. The survey found that 50% males and only 39% females reported that they have no worries and anxieties. Higher proportion of women, individuals belonging to rural areas, of low levels of education, of higher ages and lower incomes reported moderate to severe levels of worry or anxiety. These findings do indicate the general existence of distress linked to issues of employment and growing agrarian distress in the countryside. In Maharashtra, the non-communicable disease load coupled with communicable disease load will have serious repercussions for the poor in general and women in particular.
Gender Inequities in Health Access and Outcomes
A Report on Health Inequities in Maharashtra 94
4. Inequities in Access to Health Care Inequities related to health status, health risks and lack of health information could be remedied if health systems recognise these risks and provide equitable access to comprehensive health care and also design health programmes to address vertical inequities. Gaining access to health care is considered to be one of the most important ways in which one can recover from morbidity/ill health or one can receive timely medical support (for e.g., at the time of delivery) and avert possibilities of life threatening causes of death. In terms of actual use, there are several factors on the supply (service delivery) side and on the demand (familial or community) side that create barriers to access. Non-availability of services, physical distances, lack of transportation facilities, insensitivity and lack of responsive health personnel, lack of privacy within the hospital setting, non-availability of medicines, doctors, for example, create the supply side barriers. Health beliefs, attitudes, knowledge and experience at the community and familial level (demand side), which vary across social strata create barriers or enabling resources for seeking health care. At the familial level, cultural practices that govern distribution of labour, resources and decision-making on the basis of age, gender, ability and kinship status determine members’ access to health care services. Health Systems Fostering Inequities
Free and full access to public health care services can go a long way in overcoming health inequities and establishing equity in health outcomes. Unfortunately health care services often do not fulfill stated objectives due to limitations in viewing women’s health in terms of maternal health and poor quality of services. The weakening of the public health system and a growing private health sector also augment inequities in health care, reconfigure the utilisation patterns and increase household indebtedness due to expenditures on health. This section highlights the role of the health care system and the policy environment in augmenting the inequities in health care access. Field based studies and intervention projects identify several supply side issues that create barriers for women to seek antenatal care and delivery services in Primary Health Centers and rural hospitals. A PHC based initiative by Foundation for Research in Community Health in Ahmednagar district, identified several weaknesses like badly functioning or non-availability of equipment, poor skills among the health workers, inefficient work schedules, lack of drug supplies, poor access to services in villages that do not have a health service. The evidently poor quality services and women’s perceived poor quality of services force them to seek private health care or opt for home deliveries (Barua, Waghmare and Venkiteswaran, 2003).
Poor Quality Services and Iatrogenic Morbidities
Little attention is paid to women’s health before pregnancy or after sterilisation by the public health system. This leaves the entire gamut of reproductive tract infections and sexually transmitted infections out of the purview of diagnosis and treatment. While reproductive morbidity gets scant attention from the health system, studies point that poor quality reproductive services may actually enhance this morbidity. Women often also attribute several of these morbidities, especially backache to sterilisation operation. However, this has never been acknowledged or affirmed with well-designed research studies. Health care
Lakshmi Lingam & Amita Pitre
A Report on Health Inequities in Maharashtra 95
services also do not take note of special health problems faced by women. Women also undergo hysterectomy to deal with excessive bleeding and untreated gynaecological problems. Women strongly perceived sterilisations and/ or IUD insertions to be linked to reproductive tract infections in studies carried out in rural Karnataka and slums of Mumbai (Bhatia and Cleland 1995; Parikh et.al., 1996; Koenig et.al., 1998, Sabala et al, 2002). One study in Karnataka reported that sterilised women had a significantly higher level of laboratory confirmed lower reproductive tract infections (Bhatia and others, 1997). A study of pelvic inflammatory diseases (PID) in Mumbai concludes that invasive procedures such as sterilisations, IUD insertions and abortions are responsible for majority of reproductive tract infections rather than sexually transmitted diseases in the city (Gogate and others, 1998). While there are no studies conducted as yet, field based experience indicates growing incidence of hysterectomies often attributed by women to problems with sterilisations. NFHS III reports 51% of currently married women aged 15 to 49 had undergone sterilisation. As per NFHS-2 (1998-99), the median age at sterilisation for women declined from 26.1 years in 1984-85 (8-9 years before NFHS 1) to 24.6 years in 1990- 91 and has since increased steadily to 25.3 years in recent years. The NFHS-2 (1998-99) which probed into the reasons for women not using contraception in Maharashtra, found 22.7% women between the ages 15 – 49 years have attained menopause or have undergone hysterectomy (the disaggregated data is not available). This finding signals premature menopause among women linked to anaemia. Hysterectomy among women should also be seen in the light of low age at sterilisation of women in Maharashtra. Sterilisations are the method of choice to complete the family and a majority is performed on women. Male sterilisations have steadily reduced from 6.2% (NFHS-1, 1992-93) to 3.7% (NFHS-2, 1998-99) to 2.1% (NFHS-3, 2005-06) Studies reveal a high prevalence of diagnosed as well as self reported reproductive health problems in women, including infections and uterus prolapse. Women’s health activists in Maharashtra have documented poor quality of services in sterilisation camps. Hygiene, dignity and privacy of women are easily compromised in a camp setting. Besides women often have to wait long hours on an empty stomach for the surgeon. The plight of women in a tubectomy camp at Haveli PHC in Pune District of Western Maharashtra was documented and presented at a Public Hearing to highlight denial of health care organised by the Jan Arogya Abhiyaan in 2004. A study of laparoscopic sterilisation camps in Maharashtra and Gujarat, recorded a caseload of 8 per hour per surgeon in Mumbai and 16 per hour per surgeon in Baroda, which is very high (Bhatt, 1988). Other studies have also recorded poor conditions of sterilization camps, pressures on those conducting sterilisations to complete targets set and poor overall quality of care at these camps ( Koenig, et.al., 2000). Regional Imbalances in Availability of Health Care Services
There are regional imbalances in the availability of public health care services in Maharashtra with poor districts more neglected both by the public and private health sectors. The overall urban rural disparity in availability of health care services also distorts the utilisation of maternal health care services. Women in the rural areas are twice as likely to forego antenatal care, and more than three times unlikely to get institutional or health personnel support for delivery. There is also wide variation regionally in Maharashtra with better-developed regions better able to access maternal health care services from public as well as private sources than the under-developed regions.
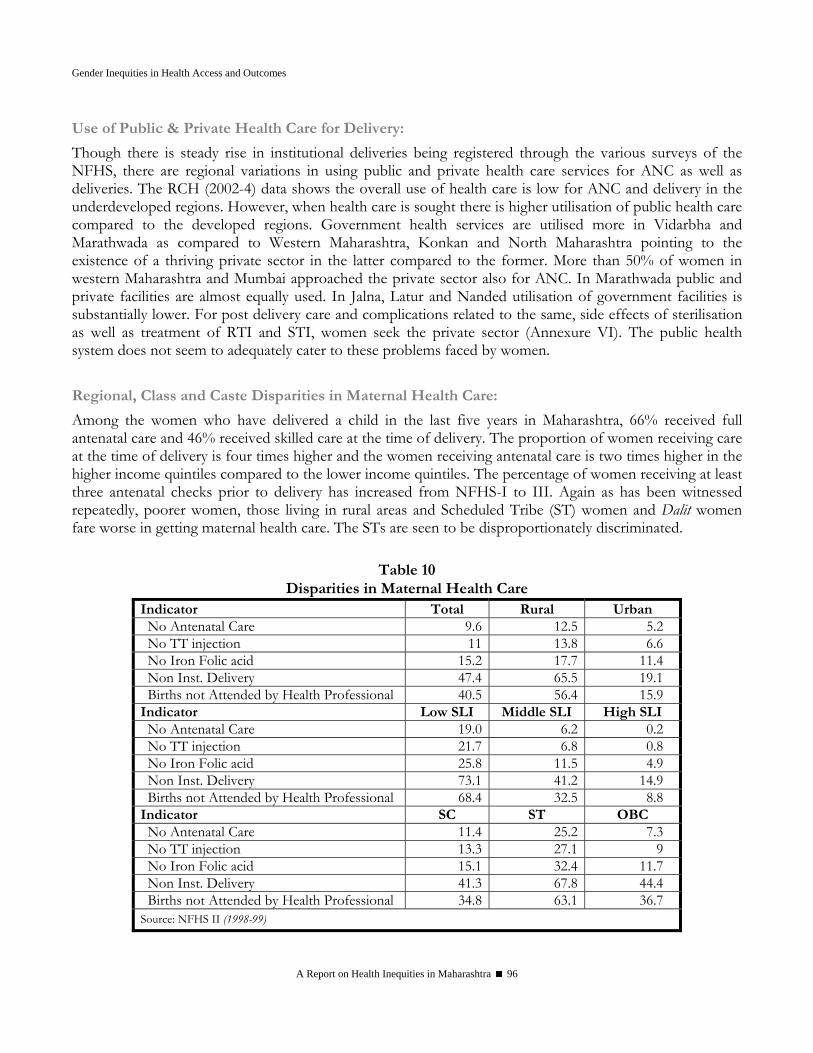
Gender Inequities in Health Access and Outcomes
A Report on Health Inequities in Maharashtra 96
Use of Public & Private Health Care for Delivery:
Though there is steady rise in institutional deliveries being registered through the various surveys of the NFHS, there are regional variations in using public and private health care services for ANC as well as deliveries. The RCH (2002-4) data shows the overall use of health care is low for ANC and delivery in the underdeveloped regions. However, when health care is sought there is higher utilisation of public health care compared to the developed regions. Government health services are utilised more in Vidarbha and Marathwada as compared to Western Maharashtra, Konkan and North Maharashtra pointing to the existence of a thriving private sector in the latter compared to the former. More than 50% of women in western Maharashtra and Mumbai approached the private sector also for ANC. In Marathwada public and private facilities are almost equally used. In Jalna, Latur and Nanded utilisation of government facilities is substantially lower. For post delivery care and complications related to the same, side effects of sterilisation as well as treatment of RTI and STI, women seek the private sector (Annexure VI). The public health system does not seem to adequately cater to these problems faced by women. Regional, Class and Caste Disparities in Maternal Health Care:
Among the women who have delivered a child in the last five years in Maharashtra, 66% received full antenatal care and 46% received skilled care at the time of delivery. The proportion of women receiving care at the time of delivery is four times higher and the women receiving antenatal care is two times higher in the higher income quintiles compared to the lower income quintiles. The percentage of women receiving at least three antenatal checks prior to delivery has increased from NFHS-I to III. Again as has been witnessed repeatedly, poorer women, those living in rural areas and Scheduled Tribe (ST) women and Dalit women fare worse in getting maternal health care. The STs are seen to be disproportionately discriminated.
Table 10 Disparities in Maternal Health Care
Indicator Total Rural Urban No Antenatal Care 9.6 12.5 5.2 No TT injection 11 13.8 6.6 No Iron Folic acid 15.2 17.7 11.4 Non Inst. Delivery 47.4 65.5 19.1 Births not Attended by Health Professional 40.5 56.4 15.9
Indicator Low SLI Middle SLI High SLI No Antenatal Care 19.0 6.2 0.2 No TT injection 21.7 6.8 0.8 No Iron Folic acid 25.8 11.5 4.9 Non Inst. Delivery 73.1 41.2 14.9 Births not Attended by Health Professional 68.4 32.5 8.8
Indicator SC ST OBC No Antenatal Care 11.4 25.2 7.3 No TT injection 13.3 27.1 9 No Iron Folic acid 15.1 32.4 11.7 Non Inst. Delivery 41.3 67.8 44.4 Births not Attended by Health Professional 34.8 63.1 36.7
Source: NFHS II (1998-99)
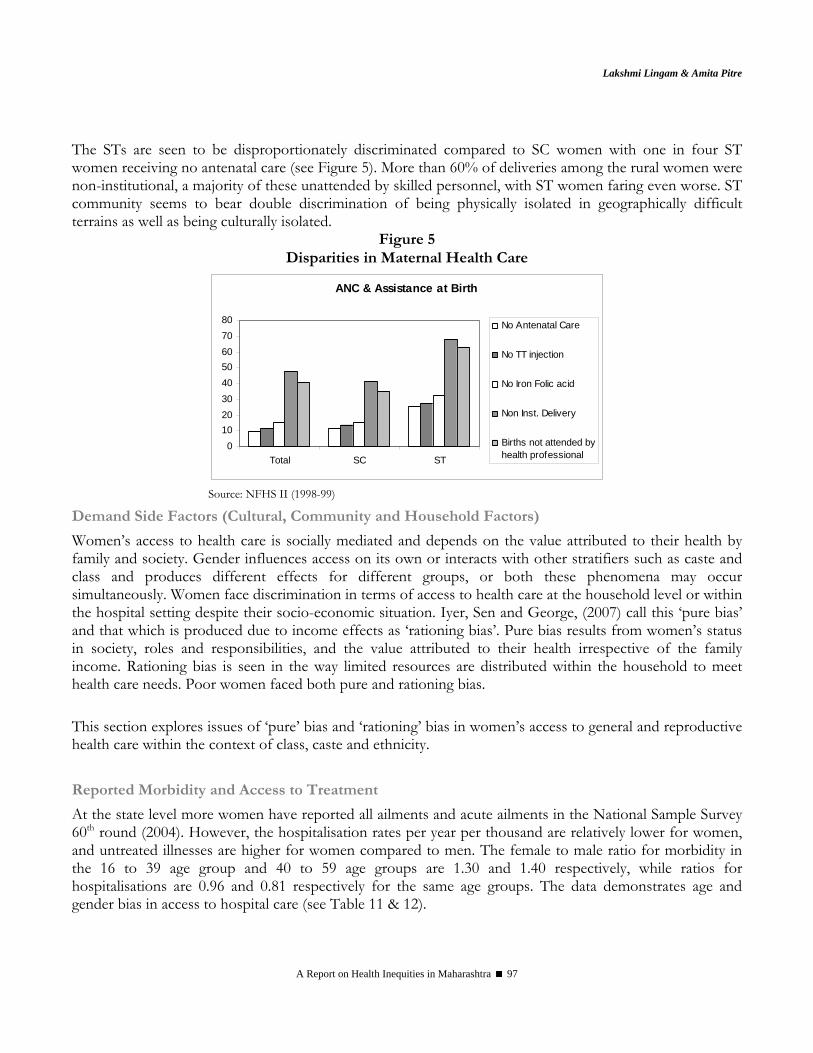
Lakshmi Lingam & Amita Pitre
A Report on Health Inequities in Maharashtra 97
The STs are seen to be disproportionately discriminated compared to SC women with one in four ST women receiving no antenatal care (see Figure 5). More than 60% of deliveries among the rural women were non-institutional, a majority of these unattended by skilled personnel, with ST women faring even worse. ST community seems to bear double discrimination of being physically isolated in geographically difficult terrains as well as being culturally isolated.
Figure 5 Disparities in Maternal Health Care
ANC & Assistance at Birth
01020304050607080
Total SC ST
No Antenatal Care
No TT injection
No Iron Folic acid
Non Inst. Delivery
Births not attended byhealth professional
Source: NFHS II (1998-99)
Demand Side Factors (Cultural, Community and Household Factors)
Women’s access to health care is socially mediated and depends on the value attributed to their health by family and society. Gender influences access on its own or interacts with other stratifiers such as caste and class and produces different effects for different groups, or both these phenomena may occur simultaneously. Women face discrimination in terms of access to health care at the household level or within the hospital setting despite their socio-economic situation. Iyer, Sen and George, (2007) call this ‘pure bias’ and that which is produced due to income effects as ‘rationing bias’. Pure bias results from women’s status in society, roles and responsibilities, and the value attributed to their health irrespective of the family income. Rationing bias is seen in the way limited resources are distributed within the household to meet health care needs. Poor women faced both pure and rationing bias. This section explores issues of ‘pure’ bias and ‘rationing’ bias in women’s access to general and reproductive health care within the context of class, caste and ethnicity. Reported Morbidity and Access to Treatment
At the state level more women have reported all ailments and acute ailments in the National Sample Survey 60th round (2004). However, the hospitalisation rates per year per thousand are relatively lower for women, and untreated illnesses are higher for women compared to men. The female to male ratio for morbidity in the 16 to 39 age group and 40 to 59 age groups are 1.30 and 1.40 respectively, while ratios for hospitalisations are 0.96 and 0.81 respectively for the same age groups. The data demonstrates age and gender bias in access to hospital care (see Table 11 & 12).
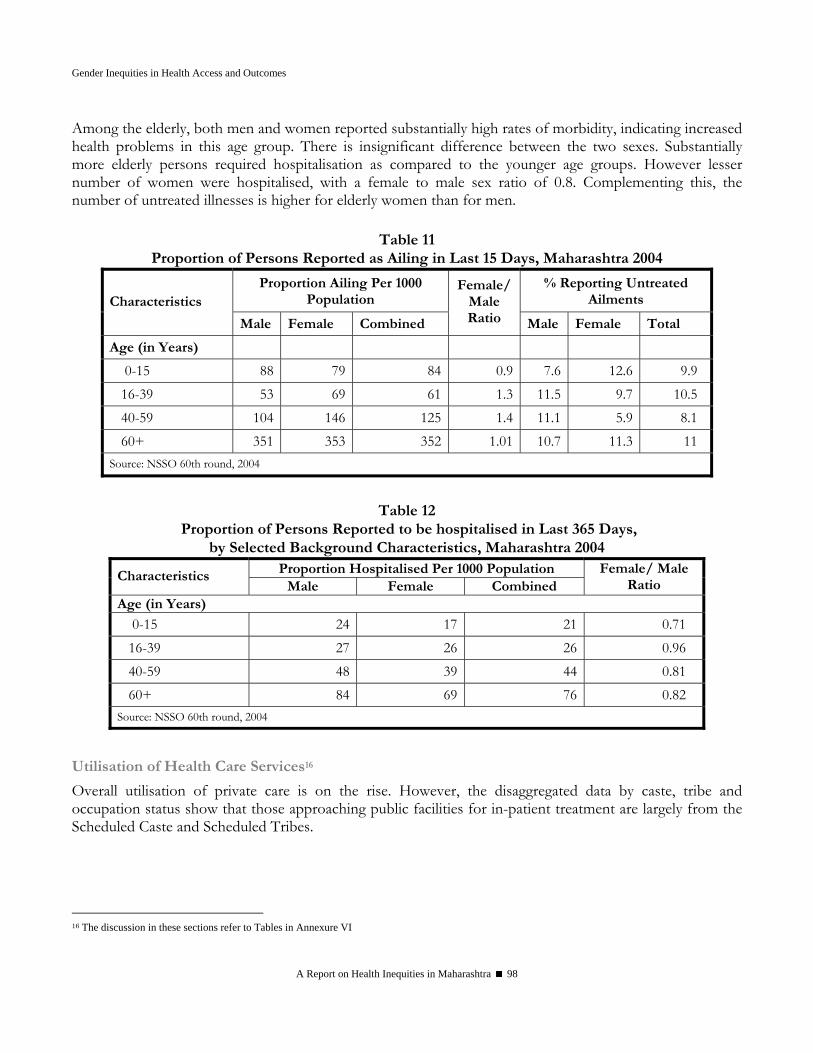
Gender Inequities in Health Access and Outcomes
A Report on Health Inequities in Maharashtra 98
Among the elderly, both men and women reported substantially high rates of morbidity, indicating increased health problems in this age group. There is insignificant difference between the two sexes. Substantially more elderly persons required hospitalisation as compared to the younger age groups. However lesser number of women were hospitalised, with a female to male sex ratio of 0.8. Complementing this, the number of untreated illnesses is higher for elderly women than for men.
Table 11
Proportion of Persons Reported as Ailing in Last 15 Days, Maharashtra 2004
Proportion Ailing Per 1000 Population
% Reporting Untreated Ailments Characteristics
Male Female Combined
Female/ Male Ratio Male Female Total
Age (in Years) 0-15 88 79 84 0.9 7.6 12.6 9.9 16-39 53 69 61 1.3 11.5 9.7 10.5 40-59 104 146 125 1.4 11.1 5.9 8.1 60+ 351 353 352 1.01 10.7 11.3 11
Source: NSSO 60th round, 2004
Table 12
Proportion of Persons Reported to be hospitalised in Last 365 Days, by Selected Background Characteristics, Maharashtra 2004
Proportion Hospitalised Per 1000 Population Characteristics Male Female Combined
Female/ Male Ratio
Age (in Years)
0-15 24 17 21 0.71 16-39 27 26 26 0.96 40-59 48 39 44 0.81 60+ 84 69 76 0.82
Source: NSSO 60th round, 2004
Utilisation of Health Care Services16
Overall utilisation of private care is on the rise. However, the disaggregated data by caste, tribe and occupation status show that those approaching public facilities for in-patient treatment are largely from the Scheduled Caste and Scheduled Tribes.
16 The discussion in these sections refer to Tables in Annexure VI
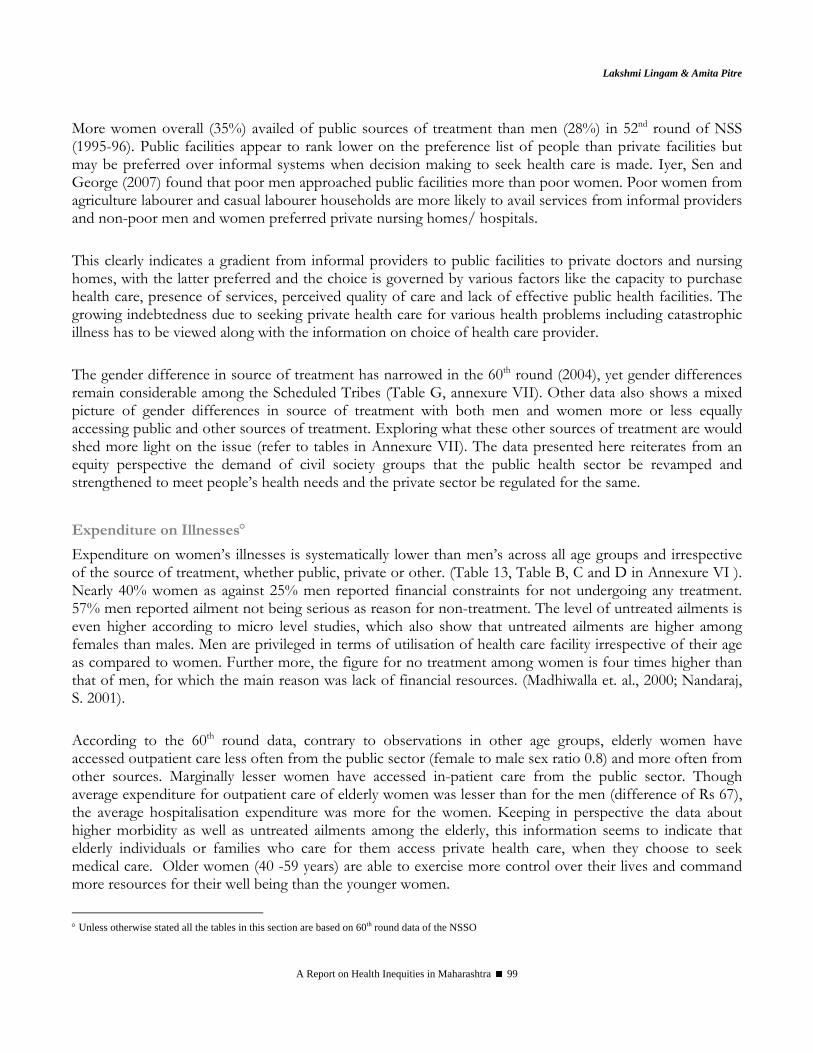
Lakshmi Lingam & Amita Pitre
A Report on Health Inequities in Maharashtra 99
More women overall (35%) availed of public sources of treatment than men (28%) in 52nd round of NSS (1995-96). Public facilities appear to rank lower on the preference list of people than private facilities but may be preferred over informal systems when decision making to seek health care is made. Iyer, Sen and George (2007) found that poor men approached public facilities more than poor women. Poor women from agriculture labourer and casual labourer households are more likely to avail services from informal providers and non-poor men and women preferred private nursing homes/ hospitals. This clearly indicates a gradient from informal providers to public facilities to private doctors and nursing homes, with the latter preferred and the choice is governed by various factors like the capacity to purchase health care, presence of services, perceived quality of care and lack of effective public health facilities. The growing indebtedness due to seeking private health care for various health problems including catastrophic illness has to be viewed along with the information on choice of health care provider. The gender difference in source of treatment has narrowed in the 60th round (2004), yet gender differences remain considerable among the Scheduled Tribes (Table G, annexure VII). Other data also shows a mixed picture of gender differences in source of treatment with both men and women more or less equally accessing public and other sources of treatment. Exploring what these other sources of treatment are would shed more light on the issue (refer to tables in Annexure VII). The data presented here reiterates from an equity perspective the demand of civil society groups that the public health sector be revamped and strengthened to meet people’s health needs and the private sector be regulated for the same.
Expenditure on Illnesses° Expenditure on women’s illnesses is systematically lower than men’s across all age groups and irrespective of the source of treatment, whether public, private or other. (Table 13, Table B, C and D in Annexure VI ). Nearly 40% women as against 25% men reported financial constraints for not undergoing any treatment. 57% men reported ailment not being serious as reason for non-treatment. The level of untreated ailments is even higher according to micro level studies, which also show that untreated ailments are higher among females than males. Men are privileged in terms of utilisation of health care facility irrespective of their age as compared to women. Further more, the figure for no treatment among women is four times higher than that of men, for which the main reason was lack of financial resources. (Madhiwalla et. al., 2000; Nandaraj, S. 2001). According to the 60th round data, contrary to observations in other age groups, elderly women have accessed outpatient care less often from the public sector (female to male sex ratio 0.8) and more often from other sources. Marginally lesser women have accessed in-patient care from the public sector. Though average expenditure for outpatient care of elderly women was lesser than for the men (difference of Rs 67), the average hospitalisation expenditure was more for the women. Keeping in perspective the data about higher morbidity as well as untreated ailments among the elderly, this information seems to indicate that elderly individuals or families who care for them access private health care, when they choose to seek medical care. Older women (40 -59 years) are able to exercise more control over their lives and command more resources for their well being than the younger women.
° Unless otherwise stated all the tables in this section are based on 60th round data of the NSSO
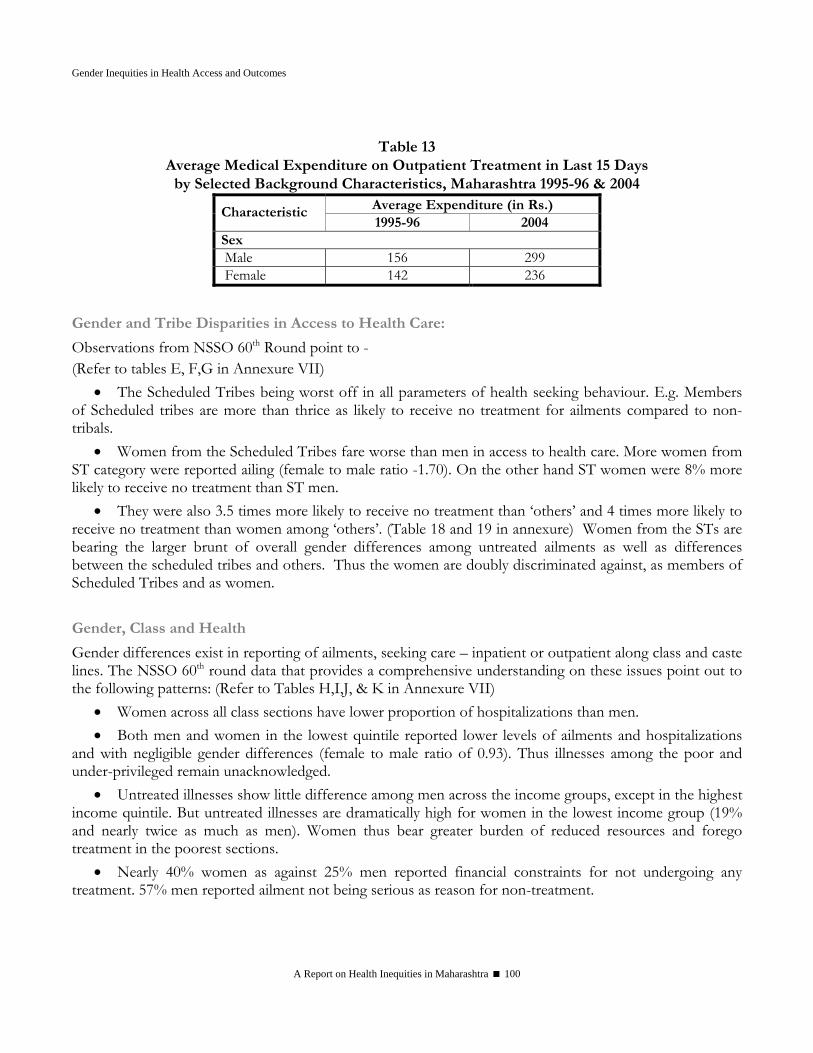
Gender Inequities in Health Access and Outcomes
A Report on Health Inequities in Maharashtra 100
Table 13
Average Medical Expenditure on Outpatient Treatment in Last 15 Days by Selected Background Characteristics, Maharashtra 1995-96 & 2004
Average Expenditure (in Rs.) Characteristic 1995-96 2004
Sex Male 156 299 Female 142 236
Gender and Tribe Disparities in Access to Health Care:
Observations from NSSO 60th Round point to - (Refer to tables E, F,G in Annexure VII)
• The Scheduled Tribes being worst off in all parameters of health seeking behaviour. E.g. Members of Scheduled tribes are more than thrice as likely to receive no treatment for ailments compared to non-tribals.
• Women from the Scheduled Tribes fare worse than men in access to health care. More women from ST category were reported ailing (female to male ratio -1.70). On the other hand ST women were 8% more likely to receive no treatment than ST men.
• They were also 3.5 times more likely to receive no treatment than ‘others’ and 4 times more likely to receive no treatment than women among ‘others’. (Table 18 and 19 in annexure) Women from the STs are bearing the larger brunt of overall gender differences among untreated ailments as well as differences between the scheduled tribes and others. Thus the women are doubly discriminated against, as members of Scheduled Tribes and as women.
Gender, Class and Health
Gender differences exist in reporting of ailments, seeking care – inpatient or outpatient along class and caste lines. The NSSO 60th round data that provides a comprehensive understanding on these issues point out to the following patterns: (Refer to Tables H,I,J, & K in Annexure VII)
• Women across all class sections have lower proportion of hospitalizations than men. • Both men and women in the lowest quintile reported lower levels of ailments and hospitalizations
and with negligible gender differences (female to male ratio of 0.93). Thus illnesses among the poor and under-privileged remain unacknowledged.
• Untreated illnesses show little difference among men across the income groups, except in the highest income quintile. But untreated illnesses are dramatically high for women in the lowest income group (19% and nearly twice as much as men). Women thus bear greater burden of reduced resources and forego treatment in the poorest sections.
• Nearly 40% women as against 25% men reported financial constraints for not undergoing any treatment. 57% men reported ailment not being serious as reason for non-treatment.
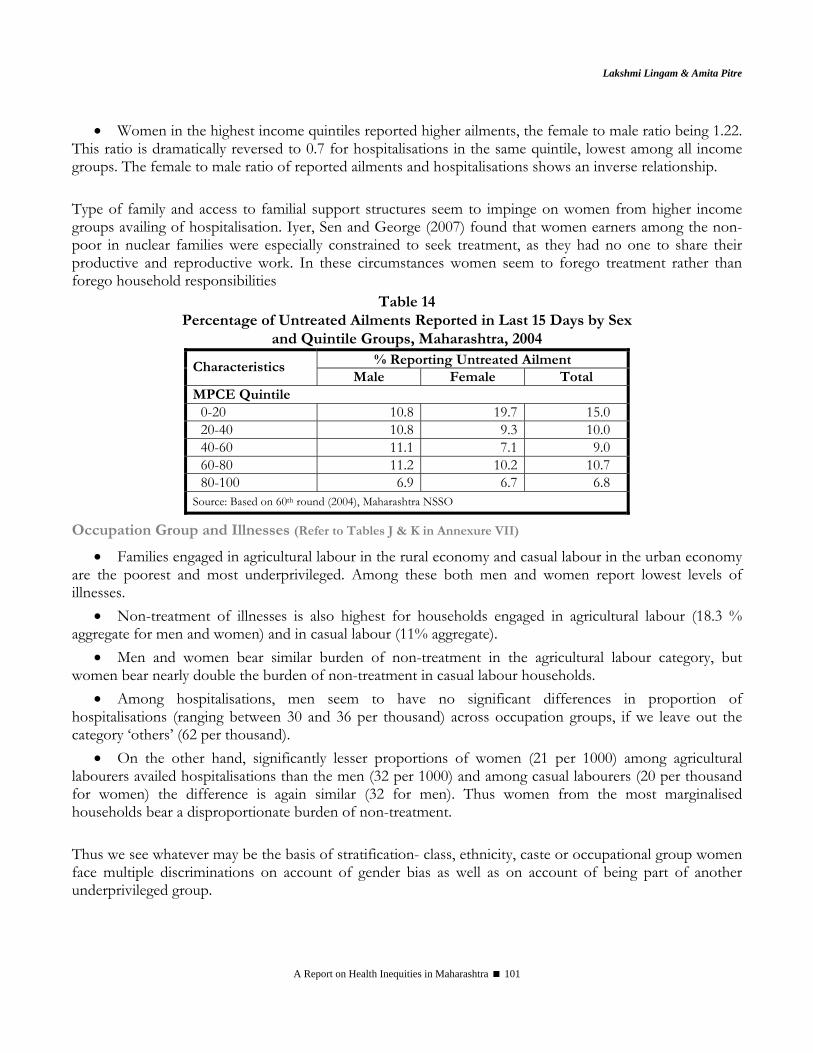
Lakshmi Lingam & Amita Pitre
A Report on Health Inequities in Maharashtra 101
• Women in the highest income quintiles reported higher ailments, the female to male ratio being 1.22. This ratio is dramatically reversed to 0.7 for hospitalisations in the same quintile, lowest among all income groups. The female to male ratio of reported ailments and hospitalisations shows an inverse relationship. Type of family and access to familial support structures seem to impinge on women from higher income groups availing of hospitalisation. Iyer, Sen and George (2007) found that women earners among the non-poor in nuclear families were especially constrained to seek treatment, as they had no one to share their productive and reproductive work. In these circumstances women seem to forego treatment rather than forego household responsibilities
Table 14 Percentage of Untreated Ailments Reported in Last 15 Days by Sex
and Quintile Groups, Maharashtra, 2004 % Reporting Untreated Ailment Characteristics
Male Female Total MPCE Quintile
0-20 10.8 19.7 15.0 20-40 10.8 9.3 10.0 40-60 11.1 7.1 9.0 60-80 11.2 10.2 10.7 80-100 6.9 6.7 6.8
Source: Based on 60th round (2004), Maharashtra NSSO
Occupation Group and Illnesses (Refer to Tables J & K in Annexure VII)
• Families engaged in agricultural labour in the rural economy and casual labour in the urban economy are the poorest and most underprivileged. Among these both men and women report lowest levels of illnesses.
• Non-treatment of illnesses is also highest for households engaged in agricultural labour (18.3 % aggregate for men and women) and in casual labour (11% aggregate).
• Men and women bear similar burden of non-treatment in the agricultural labour category, but women bear nearly double the burden of non-treatment in casual labour households.
• Among hospitalisations, men seem to have no significant differences in proportion of hospitalisations (ranging between 30 and 36 per thousand) across occupation groups, if we leave out the category ‘others’ (62 per thousand).
• On the other hand, significantly lesser proportions of women (21 per 1000) among agricultural labourers availed hospitalisations than the men (32 per 1000) and among casual labourers (20 per thousand for women) the difference is again similar (32 for men). Thus women from the most marginalised households bear a disproportionate burden of non-treatment. Thus we see whatever may be the basis of stratification- class, ethnicity, caste or occupational group women face multiple discriminations on account of gender bias as well as on account of being part of another underprivileged group.

Gender Inequities in Health Access and Outcomes
A Report on Health Inequities in Maharashtra 102
Conclusions This chapter focused on four kinds of inequities women face. The first are the inequities faced by women as compared to men, the second kind of inequities are those faced by women from a relatively affluent state (Maharashtra) as compared to women in other states with lower economic prosperity but more equitable outcomes (e.g. Kerala and Tamil Nadu). The third are regional inequities between rural and urban areas and regions of the state and the fourth are the inequities within women based on social stratifiers of tribe, class and caste. Inequities as Compared to Men
Women face barriers to health determining factors such as literacy and secure income generation, compounded by unhealthy living conditions, excessive work burden, lack of sanitation and safe water sources and low standard of living. Gender inequities also manifest in pernicious forms such as a low sex ratio and low age at marriage, which indicate further neglect and exploitation, which is more difficult to measure. Children and women are worse off than men in case of undernutrition and anaemia contributing to a vicious cycle of low birth weight, disease and premature death. Women face special health risks such as
• Those of reproductive tract infections and higher risk of HIV transmission due to biology coupled with reduced autonomy
• Cataract and Respiratory health problems due to indoor air pollution • Aches and pains, arthritis and vaginal and uterine prolapse due to excessive work burden and
occupational hazards • Mental health problems and depression
Women’s health care needs are inadequately acknowledged, and further women do not receive health care in proportion to their acknowledged needs either. They have more untreated illnesses, reduced hospitalisation, and reduced expenditure on their health care and source of health care of a lower grade as compared to men. Women have an enhanced need for reproductive health services and additional needs of maternal services, but receive less than their needs. Inequity as Compared to Kerala
Women in Maharashtra are worse off than some other states such as Kerala in health determining parameters such as lower standard of living, lower access to good housing, lower access to toilets and sanitation. Women in Maharashtra suffer higher levels of undernutrition and anaemia, and higher child and maternal mortality among other indicators.
Regional Inequities
Women are not homogenous in their experiences of health status and access to health care, though generally women in each category are worse off than men in those categories. Rural women and women in urban slums fare worse in terms of malnutrition and anaemia, access to maternal, reproductive and general health care and pregnancy outcomes.
Lakshmi Lingam & Amita Pitre
A Report on Health Inequities in Maharashtra 103
Inequities Based on Class, Ethnicity and Caste
Poorer women, ST and SC women are the worst off in all parameters of health determinants, health risks, health status and access to health care, with ST women especially discriminated against. Nearly the entire burden of untreated illnesses among the poorest ‘people’ is explained by the gaps for the poorest ‘women’ and the same burden among the ST population is explained by untreated ailments in ST ‘women’.
Convergence of Inequities
Inequities suffered by rural women, poor women, ST and SC women are in reality largely faced by rural, poor, SC or rural, poor, ST women, among others.. Thus inequities measured for discrete groups are actually experienced by the same women falling in each of these groups, thus multiplying many times the effects of inequities.
Acknowledgments We would like to acknowledge Ms Suchitra Desai for her considerable efforts in putting together tables of the secondary data required for this project. We would like to thank Ms. Susan Mathew and Ms. Laxmi Bhanjan for sourcing articles and reports. The authors would like to acknowledge the two referees who provided valuable comments on an earlier version of the paper. Thanks are also due to Dr. Abhay Shukla and Dr. Nilangi Sardeshpande for their support and encouragement.
References Ambade, V.N & Godbole, H.V. (2006): Study of Burn Deaths in Nagpur, Central India. Burns, 32, p. 902-908.
Bang, R., Bang, A. et. al., (1989): High Prevalence of Gynaecological Diseases among Rural Indian Women. Lancet, 8629, January 14, p.85-88.
Bang A, Reddy M H, Deshmukh M D (2002): Child Mortality in Maharashtra, Economic and Political Weekly, December 7, Vol.37 (49),
Barua, A, Waghmare, R, & Venkiteswaran (2003): Implementing Reproductive and Child Health Services in rural Maharashtra: A Pragmatic Approach. Reproductive Health Matters, 11 (21), 140- 149.
Barua A., Kurz K., (2001) Reproductive health seeking by married adolescent girls in Maharashtra, India, Reproductive health matters, Vol.9, No.17, May.
Basu, A. M. (1995) Women’s roles and the gender gap in health and survival. In: Women’s Health in India. Das Gupta, M., Chen, L. C., & Krishnan, T. N., (Eds.), pp. 153–174. Oxford University Press, Bombay, India.
Bhatia, J. C., Cleland, J. Bhagavan, L & Rao, N.S.N. (1997) ‘Levels and Determinants of Gynaecological Morbidity in a district of South India’. Studies in Family Planning, 28, 2, 95-103.
Bhatt., Engineer, Gupta, Kambo et al, (1988) Evaluation of Laparoscopic Sterilisations in Rural Camps, Demography India, Vol XVII, No. 1 , pp. 148-160
Char, Arundhati., (2001) Women’s Perception of Reproductive Health Before and After Sterilization in Rural Maharashtra, India, Asia Pacific Population Journal, Vol. 16, No.2
Daga, Jejeebhoy, Rajgopal (2004): An investigation of Domestic Violence Using Hospital Casualty Records. In Jesani, Deosthali, Madhiwalla (Eds), Preventing Violence Caring For Survivors, Kalpaz Publishing House, Mumbai
Filmer, D., and L. Pritchett. (1999): The effect of household wealth on educational attainment: Evidence from 35 countries,
Gender Inequities in Health Access and Outcomes
A Report on Health Inequities in Maharashtra 104
Population and Development Review, 25(1):85-120
Ganatra, B., Hirve and Rao (2001): Sex Selective Abortions: Evidence from a community based study in Western India. Asia Pacific Population Journal, Vol. 16, No.2, June, p.109-124
Gogate, A, Loretta Brabin, et. al., (1998): ‘Risk Factors for Laparoscopically confirmed pelvic inflammatory disease: Findings from Mumbai (Bombay), India’. Sexually Transmitted Infections, 74 (6), p.426-432, 1998.
Hatekar, N & Rode, S (2003): Truth about Hunger and Disease in Mumbai: Malnourishment among Slum Children. Economic and Political Weekly, October 25, p. 4604 - 4610.
Heise, Lorie et al, 1995 as quoted in Khanna, Koning et al (2004): Sexual Coercion and PID in Slum Women of Mumbai: Role of Health Care Provider. In Jesani, Deosthali, Madhiwalla, (Eds), Preventing Violence, Caring For Survivors, Kalpaz Publishing House, Mumbai
Ganatra, B., Hirve and Rao (2001): Sex Selective Abortions: Evidence from a community based study in Western India. Asia Pacific Population Journal, Vol. 16, No.2, June, p.109-124.
Hirve, S. & Ganatra, B. (2002): Induced Abortions among Adolescent Women in Rural Maharashtra, India. Reproductive Health Matters, Vol. 10, No.19, May, 76-85.
Human Development Report Maharashtra, 2002, Government of Maharashtra, Mumbai
IIPS (2005-2006): National Family Health Survey (NFHS-3), Fact Sheet Maharashtra (Provisional Data)
IIPS (1998-1999): National Family Health Survey (NFHS-2)
IIPS & WHO (2006): Health System Performance Assessment. World Health Survey, 2003, Maharashtra.
IIPS, Reproductive and Child Health District Level Household Survey (2002-04) &Facility Survey (2003), Summary Report-India,
Iyer, A., Sen, G., & George, A (2007): the Dynamics of Gender and Class in Access to Health Care: Evidence from Rural Karnataka, India. International Journal of Health Services, Volume 37, Number 3, Pages 537–554.
Jan Arogya Abhiyan (2004): Report on Denial of Healthcare and Status of Public Health System in Maharashtra, 2004, Pune, Maharashtra (unpublished report)
Joshi, S. Chandorkar, A, et.al., (2001): Cervical Intraepithelial Changes & HIV infection in Women Attending Sexually Transmitted Disease Clinics in Pune, India.
Kishor, Sunita & Gupta, Kamala (2004): Women’s Empowerment in India. In Irudyarajan and James (Eds.), Demographic Change, Health Inequality and Human Development in India, Centre for Economic and Social Studies, Hyderabad
Koenig, M.A, Foo, G.H.C, Joshi, K (2000): Quality of Care within the Indian Family Welfare Programme: A Review of Recent Evidence. Studies in Family Planning. Vol. 31, No.1, March, 1-18.
Khot, Menon, Dilip (2004): Domestic Violence: Levels, Corelates, Causes, Impact and Response, A community based study of married women from Mumbai slums, CEHAT, Mumbai
Madhiwalla, N., S. Nandraj, and R. Sinha . Health, households and women's lives: A study of illness and childbearing among women in Nasik district. Center for Enquiry into Health and Allied Themes, Mumbai, 2000.
Mehendale, S.M., Shepherd, M.E., et. al., (1996) Evidence for High Prevalence and Rapid Transmission of HIV among Individuals Attending STD clinics in Pune, India. Indian Journal Medical Research, 104, 327-335.
Nagarajan R., Madheswaran S., Determinants of Child Schooling in Rural Maharashtra: A district level analysis, Journal of Educational Planning and Administration, Volume XV No. 4, October 2001, pp 463-485
Nandraj et al., Women and health care in Mumbai, CEHAT, 2001
National Sample Survey, NSS 52nd round, Consumer Expenditure, Education, Health and Aged in India, July'1995-June'1996, National Sample Survey Organisation, Ministry of Statistics and Programme Implementation, Government of India
National Sample Survey, NSS 60th round, Consumer Expenditure, Employment-Unemployment, Morbidity, Health Care & Condition of the Aged, January'2004-June'2004,
Lakshmi Lingam & Amita Pitre
A Report on Health Inequities in Maharashtra 105
National Sample Survey Organisation, Ministry of Statistics and Programme Implementation, Government of India
Pande, R, Kurz, Kathleen, Walia, Sunayana, et. Al., (2006): Improving the Reproductive Health of Married and Unmarried Youth in India: Evidence of Effectiveness and Costs from Community based Interventions. Final Report of the Adolescent Reproductive Health Program in India. ICRW, New Delhi.
Pandit, D, Prabha, R. Shanbhag, S, Mayekar, R (2005): Morbidity Pattern of Women Attending Screening Program in an Urban Slum in Mumbai. Indian Journal of Community Medicine, Vol. 30, No.4, October-December, p.134-135.
Parikh, I.G., et., al., Gynaecological Aspects of Women in a Bombay Slum”. Streehitakarini. Unpublished Paper, 1996, Mumbai.
Registrar General of India, Survey of causes of Death (Rural), India, 2002
Report on Denial of Healthcare and Status of Public Health System in Maharashtra, 2004, Pune, Jan Arogya Abhiyan, Maharashtra (unpublished report)
Roy, T.K., Kulkarni, S., Vaidehi, Y., (2004): Social inequalities in health and nutrition in selected states. Economic and Political Weekly. Vol 39, Num 7, Page; 647-651
Sen, G. George, A., and Ostlin,P (2002): ‘Engendering Health Equity: A Review of Research and Policy’ in Engendering International Health: The Challenge of Equity (Eds) Sen, G. George, A., and Ostlin,P. MIT, USA, p. 1-33.
Tripathi, S, Joshi, D.R., et al., (2002): Sentinel Surveillance for HIV Infection in Tuberculosis Patients in India. Indian Journal of Tuberculosis. Vol. 49 (1), 17, Jan, 17-20
Qamruddin, J. Gwatkin, D and Yazbeck, A.S (2005): ‘Rediscovering inequalities in health: A new Research Agenda’ in Achieving Equity in Health: A Research Dimension. Global Forum Update on Research for Health, Vol. 2.
http://www.globalforumhealth.org/filesupld/global_update2/2_achieving_equity_revised.pdf, Accessed on 28 November 2007
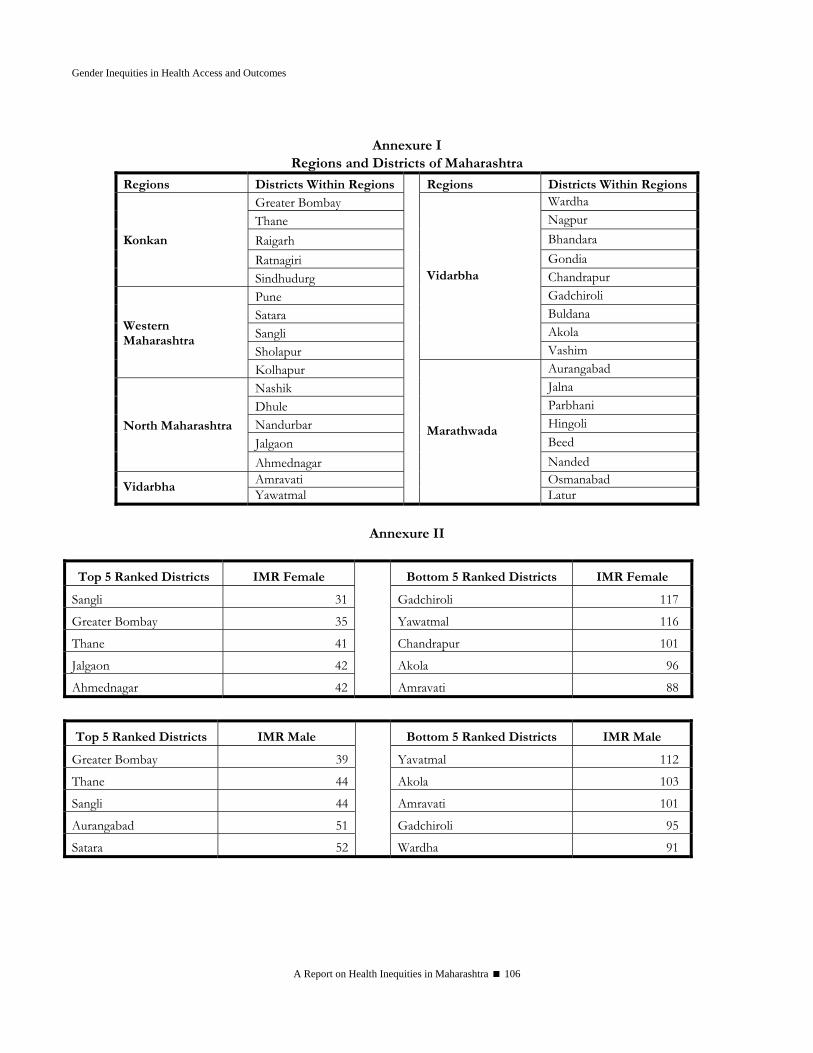
Gender Inequities in Health Access and Outcomes
A Report on Health Inequities in Maharashtra 106
Annexure I
Regions and Districts of Maharashtra
Regions Districts Within Regions Regions Districts Within RegionsGreater Bombay Wardha Thane Nagpur Raigarh Bhandara Ratnagiri Gondia
Konkan
Sindhudurg Chandrapur Pune Gadchiroli Satara Buldana Sangli Akola Sholapur
Vidarbha
Vashim
Western Maharashtra
Kolhapur Aurangabad Nashik Jalna Dhule Parbhani Nandurbar Hingoli Jalgaon Beed
North Maharashtra
Ahmednagar Nanded Amravati Osmanabad
Vidarbha Yawatmal
Marathwada
Latur
Annexure II
Top 5 Ranked Districts IMR Female Bottom 5 Ranked Districts IMR Female
Sangli 31 Gadchiroli 117
Greater Bombay 35 Yawatmal 116
Thane 41 Chandrapur 101
Jalgaon 42 Akola 96
Ahmednagar 42 Amravati 88
Top 5 Ranked Districts IMR Male Bottom 5 Ranked Districts IMR Male
Greater Bombay 39 Yavatmal 112
Thane 44 Akola 103
Sangli 44 Amravati 101
Aurangabad 51 Gadchiroli 95
Satara 52 Wardha 91
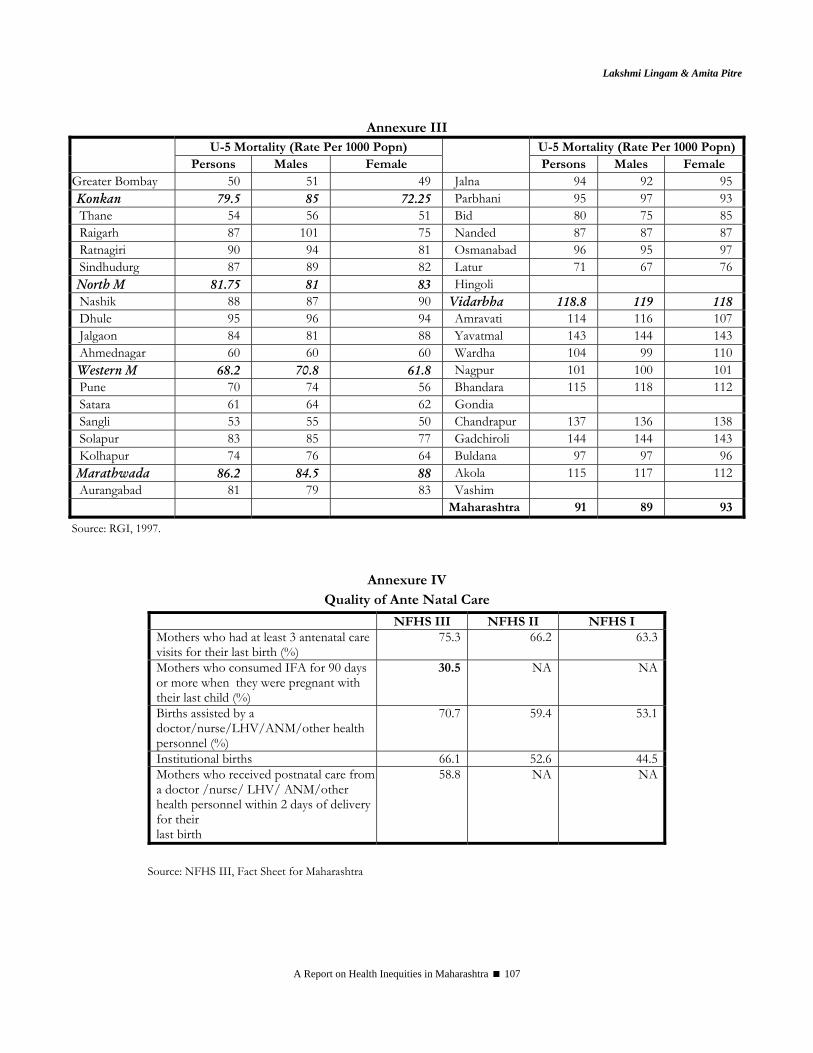
Lakshmi Lingam & Amita Pitre
A Report on Health Inequities in Maharashtra 107
Annexure III U-5 Mortality (Rate Per 1000 Popn) U-5 Mortality (Rate Per 1000 Popn)
Persons Males Female
Persons Males Female Greater Bombay 50 51 49 Jalna 94 92 95 Konkan 79.5 85 72.25 Parbhani 95 97 93 Thane 54 56 51 Bid 80 75 85 Raigarh 87 101 75 Nanded 87 87 87 Ratnagiri 90 94 81 Osmanabad 96 95 97 Sindhudurg 87 89 82 Latur 71 67 76 North M 81.75 81 83 Hingoli Nashik 88 87 90 Vidarbha 118.8 119 118 Dhule 95 96 94 Amravati 114 116 107 Jalgaon 84 81 88 Yavatmal 143 144 143 Ahmednagar 60 60 60 Wardha 104 99 110 Western M 68.2 70.8 61.8 Nagpur 101 100 101 Pune 70 74 56 Bhandara 115 118 112 Satara 61 64 62 Gondia Sangli 53 55 50 Chandrapur 137 136 138 Solapur 83 85 77 Gadchiroli 144 144 143 Kolhapur 74 76 64 Buldana 97 97 96 Marathwada 86.2 84.5 88 Akola 115 117 112 Aurangabad 81 79 83 Vashim Maharashtra 91 89 93
Source: RGI, 1997.
Annexure IV Quality of Ante Natal Care
NFHS III NFHS II NFHS I Mothers who had at least 3 antenatal care visits for their last birth (%)
75.3 66.2 63.3
Mothers who consumed IFA for 90 days or more when they were pregnant with their last child (%)
30.5 NA NA
Births assisted by a doctor/nurse/LHV/ANM/other health personnel (%)
70.7 59.4 53.1
Institutional births 66.1 52.6 44.5Mothers who received postnatal care from a doctor /nurse/ LHV/ ANM/other health personnel within 2 days of delivery for their last birth
58.8 NA NA
Source: NFHS III, Fact Sheet for Maharashtra

Gender Inequities in Health Access and Outcomes
A Report on Health Inequities in Maharashtra 108
Annexure V Crimes against Women during 2004 to 2006
Crime Head 2004
2005
2006
Percentage variation in 2006 as compared
to 2005 Murder for Dowry 150 120 168 40.00 Attempt to Commit Murder for Dowry
94 76 98 28.95
Dowry Death 314 341 387 13.49 Abetment to commit suicide 1244 1436 1329 -7.45 Rape 1388 1545 1500 -2.91 Kidnapping and Abduction (W & G)
787 851 921 8.23
Cruelty by Husband and Relatives 5646 6233 6738 8.10 Molestation 2831 3228 3479 7.78 Sexual Harassment 862 919 984 7.07 Importation of Girls 0 0 1 100.00 Sati Prevention Act 0 0 0 0.00 Immoral Trafic (P) Act 309 222 378 70.27 Indecent Rep. of Women (P) Act 11 8 9 12.50 Dowry Proh. Act 21 23 55 139.13 TOTAL 13657 15002 16047 6.96
Source: Crime in Maharashtra, 2006
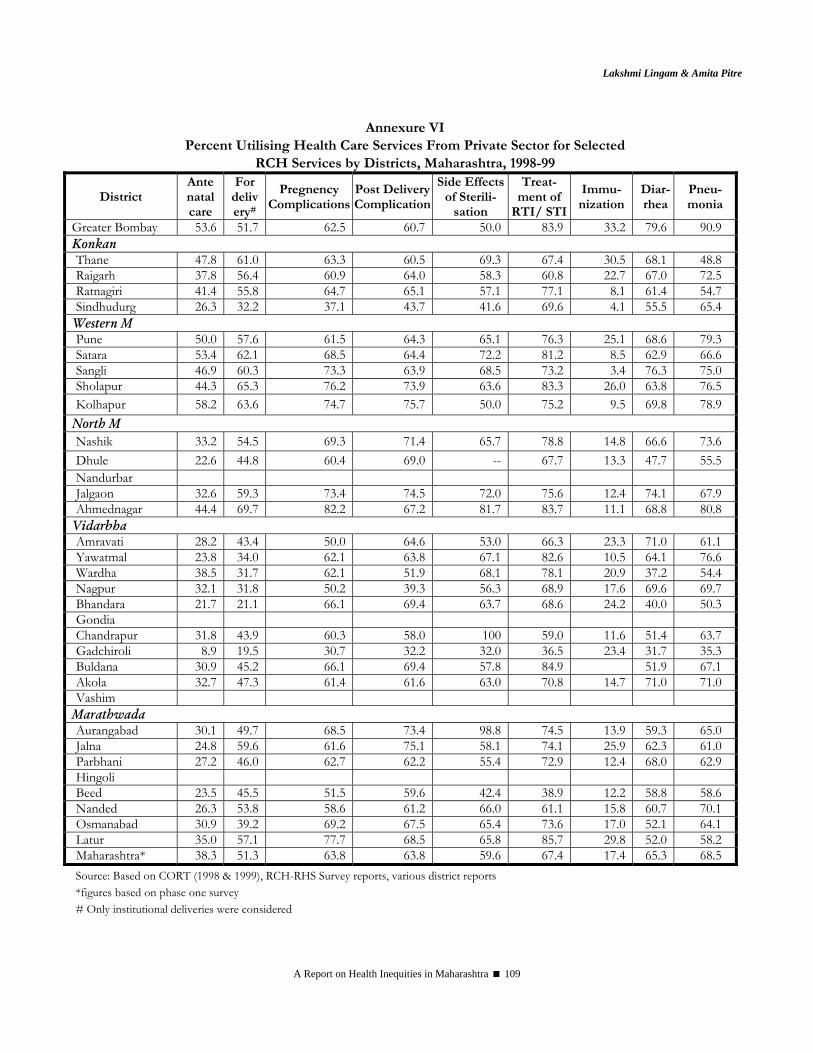
Lakshmi Lingam & Amita Pitre
A Report on Health Inequities in Maharashtra 109
Annexure VI Percent Utilising Health Care Services From Private Sector for Selected
RCH Services by Districts, Maharashtra, 1998-99
District Ante natal care
For delivery#
Pregnency Complications
Post Delivery Complication
Side Effects of Sterili-
sation
Treat- ment of
RTI/ STI
Immu-nization
Diar-rhea
Pneu-monia
Greater Bombay 53.6 51.7 62.5 60.7 50.0 83.9 33.2 79.6 90.9 Konkan Thane 47.8 61.0 63.3 60.5 69.3 67.4 30.5 68.1 48.8 Raigarh 37.8 56.4 60.9 64.0 58.3 60.8 22.7 67.0 72.5 Ratnagiri 41.4 55.8 64.7 65.1 57.1 77.1 8.1 61.4 54.7 Sindhudurg 26.3 32.2 37.1 43.7 41.6 69.6 4.1 55.5 65.4
Western M Pune 50.0 57.6 61.5 64.3 65.1 76.3 25.1 68.6 79.3 Satara 53.4 62.1 68.5 64.4 72.2 81.2 8.5 62.9 66.6 Sangli 46.9 60.3 73.3 63.9 68.5 73.2 3.4 76.3 75.0 Sholapur 44.3 65.3 76.2 73.9 63.6 83.3 26.0 63.8 76.5 Kolhapur 58.2 63.6 74.7 75.7 50.0 75.2 9.5 69.8 78.9
North M Nashik 33.2 54.5 69.3 71.4 65.7 78.8 14.8 66.6 73.6 Dhule 22.6 44.8 60.4 69.0 -- 67.7 13.3 47.7 55.5 Nandurbar Jalgaon 32.6 59.3 73.4 74.5 72.0 75.6 12.4 74.1 67.9 Ahmednagar 44.4 69.7 82.2 67.2 81.7 83.7 11.1 68.8 80.8
Vidarbha Amravati 28.2 43.4 50.0 64.6 53.0 66.3 23.3 71.0 61.1 Yawatmal 23.8 34.0 62.1 63.8 67.1 82.6 10.5 64.1 76.6 Wardha 38.5 31.7 62.1 51.9 68.1 78.1 20.9 37.2 54.4 Nagpur 32.1 31.8 50.2 39.3 56.3 68.9 17.6 69.6 69.7 Bhandara 21.7 21.1 66.1 69.4 63.7 68.6 24.2 40.0 50.3 Gondia Chandrapur 31.8 43.9 60.3 58.0 100 59.0 11.6 51.4 63.7 Gadchiroli 8.9 19.5 30.7 32.2 32.0 36.5 23.4 31.7 35.3 Buldana 30.9 45.2 66.1 69.4 57.8 84.9 51.9 67.1 Akola 32.7 47.3 61.4 61.6 63.0 70.8 14.7 71.0 71.0 Vashim
Marathwada Aurangabad 30.1 49.7 68.5 73.4 98.8 74.5 13.9 59.3 65.0 Jalna 24.8 59.6 61.6 75.1 58.1 74.1 25.9 62.3 61.0 Parbhani 27.2 46.0 62.7 62.2 55.4 72.9 12.4 68.0 62.9 Hingoli Beed 23.5 45.5 51.5 59.6 42.4 38.9 12.2 58.8 58.6 Nanded 26.3 53.8 58.6 61.2 66.0 61.1 15.8 60.7 70.1 Osmanabad 30.9 39.2 69.2 67.5 65.4 73.6 17.0 52.1 64.1 Latur 35.0 57.1 77.7 68.5 65.8 85.7 29.8 52.0 58.2 Maharashtra* 38.3 51.3 63.8 63.8 59.6 67.4 17.4 65.3 68.5 Source: Based on CORT (1998 & 1999), RCH-RHS Survey reports, various district reports *figures based on phase one survey # Only institutional deliveries were considered
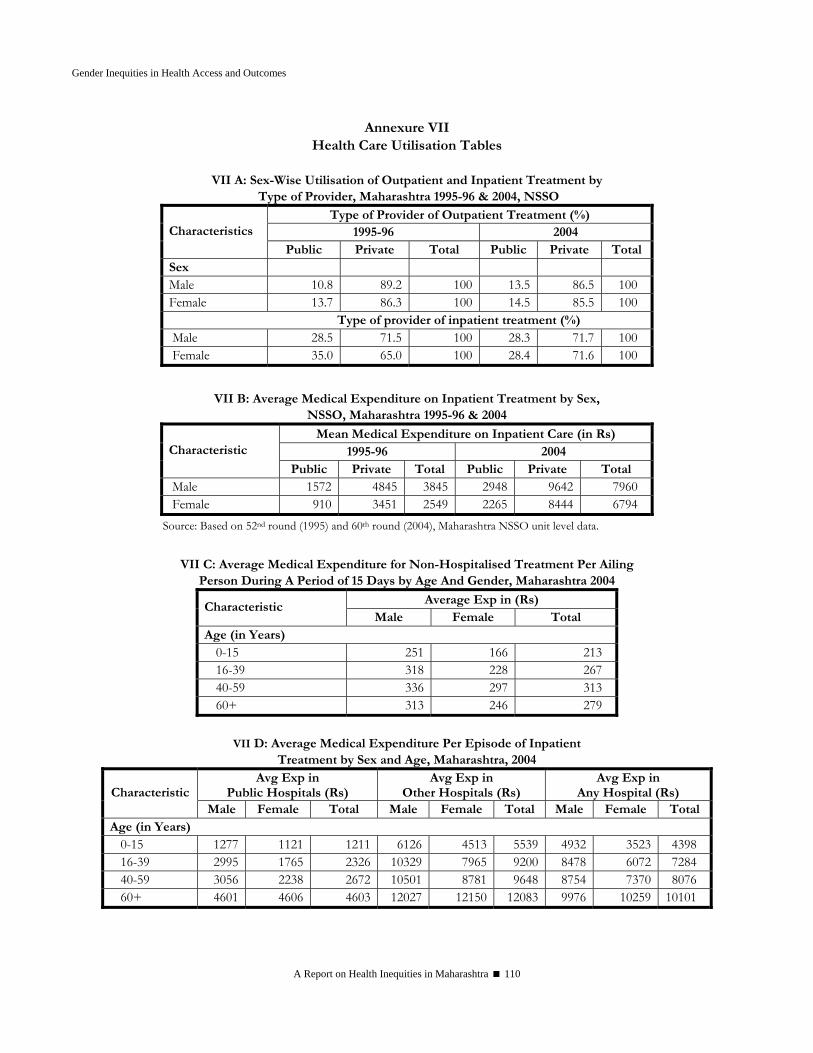
Gender Inequities in Health Access and Outcomes
A Report on Health Inequities in Maharashtra 110
Annexure VII Health Care Utilisation Tables
VII A: Sex-Wise Utilisation of Outpatient and Inpatient Treatment by
Type of Provider, Maharashtra 1995-96 & 2004, NSSO
Type of Provider of Outpatient Treatment (%) 1995-96 2004 Characteristics
Public Private Total Public Private Total Sex Male 10.8 89.2 100 13.5 86.5 100 Female 13.7 86.3 100 14.5 85.5 100
Type of provider of inpatient treatment (%) Male 28.5 71.5 100 28.3 71.7 100 Female 35.0 65.0 100 28.4 71.6 100
VII B: Average Medical Expenditure on Inpatient Treatment by Sex,
NSSO, Maharashtra 1995-96 & 2004
Mean Medical Expenditure on Inpatient Care (in Rs) 1995-96 2004 Characteristic
Public Private Total Public Private Total Male 1572 4845 3845 2948 9642 7960 Female 910 3451 2549 2265 8444 6794
Source: Based on 52nd round (1995) and 60th round (2004), Maharashtra NSSO unit level data.
VII C: Average Medical Expenditure for Non-Hospitalised Treatment Per Ailing
Person During A Period of 15 Days by Age And Gender, Maharashtra 2004
Average Exp in (Rs) Characteristic Male Female Total
Age (in Years) 0-15 251 166 213 16-39 318 228 267 40-59 336 297 313 60+ 313 246 279
VII D: Average Medical Expenditure Per Episode of Inpatient
Treatment by Sex and Age, Maharashtra, 2004 Avg Exp in
Public Hospitals (Rs) Avg Exp in
Other Hospitals (Rs) Avg Exp in
Any Hospital (Rs) Characteristic Male Female Total Male Female Total Male Female Total
Age (in Years) 0-15 1277 1121 1211 6126 4513 5539 4932 3523 4398 16-39 2995 1765 2326 10329 7965 9200 8478 6072 7284 40-59 3056 2238 2672 10501 8781 9648 8754 7370 8076 60+ 4601 4606 4603 12027 12150 12083 9976 10259 10101
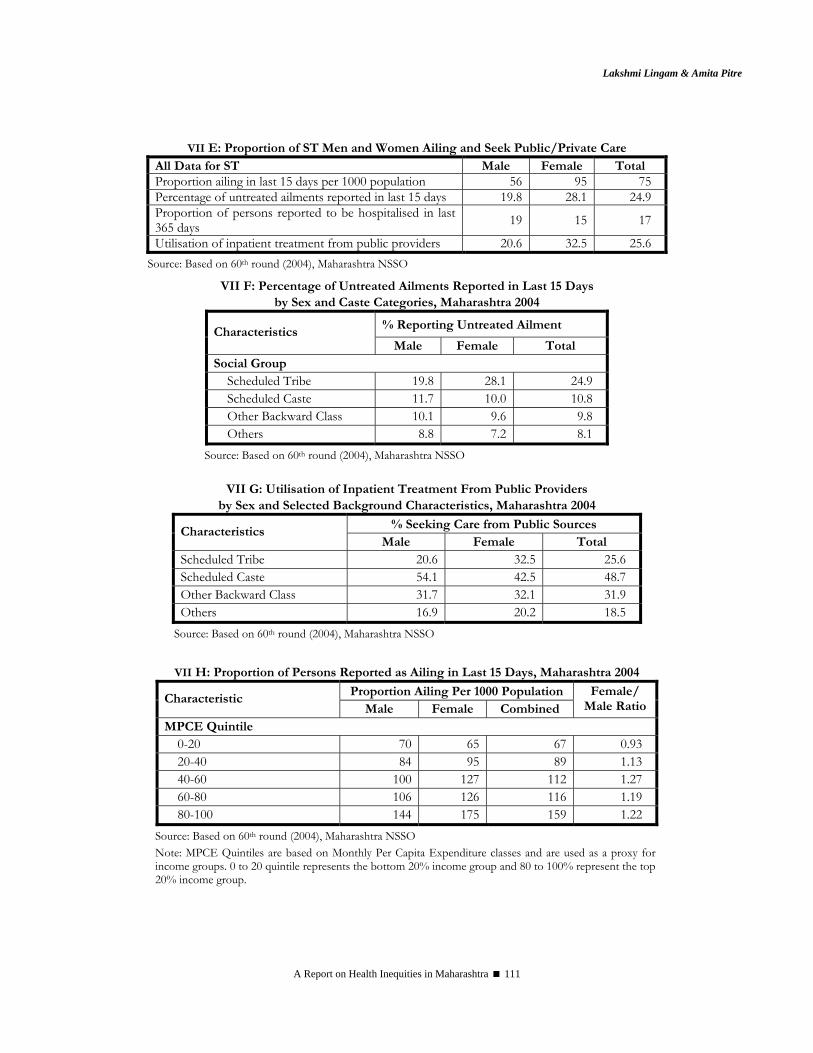
Lakshmi Lingam & Amita Pitre
A Report on Health Inequities in Maharashtra 111
VII E: Proportion of ST Men and Women Ailing and Seek Public/Private Care
All Data for ST Male Female Total Proportion ailing in last 15 days per 1000 population 56 95 75 Percentage of untreated ailments reported in last 15 days 19.8 28.1 24.9 Proportion of persons reported to be hospitalised in last 365 days 19 15 17
Utilisation of inpatient treatment from public providers 20.6 32.5 25.6 Source: Based on 60th round (2004), Maharashtra NSSO
VII F: Percentage of Untreated Ailments Reported in Last 15 Days by Sex and Caste Categories, Maharashtra 2004
% Reporting Untreated Ailment Characteristics Male Female Total
Social Group Scheduled Tribe 19.8 28.1 24.9 Scheduled Caste 11.7 10.0 10.8 Other Backward Class 10.1 9.6 9.8 Others 8.8 7.2 8.1
Source: Based on 60th round (2004), Maharashtra NSSO
VII G: Utilisation of Inpatient Treatment From Public Providers by Sex and Selected Background Characteristics, Maharashtra 2004
% Seeking Care from Public Sources Characteristics Male Female Total
Scheduled Tribe 20.6 32.5 25.6 Scheduled Caste 54.1 42.5 48.7 Other Backward Class 31.7 32.1 31.9 Others 16.9 20.2 18.5
Source: Based on 60th round (2004), Maharashtra NSSO
VII H: Proportion of Persons Reported as Ailing in Last 15 Days, Maharashtra 2004
Proportion Ailing Per 1000 Population Characteristic Male Female Combined
Female/ Male Ratio
MPCE Quintile 0-20 70 65 67 0.93 20-40 84 95 89 1.13 40-60 100 127 112 1.27 60-80 106 126 116 1.19 80-100 144 175 159 1.22
Source: Based on 60th round (2004), Maharashtra NSSO Note: MPCE Quintiles are based on Monthly Per Capita Expenditure classes and are used as a proxy for income groups. 0 to 20 quintile represents the bottom 20% income group and 80 to 100% represent the top 20% income group.
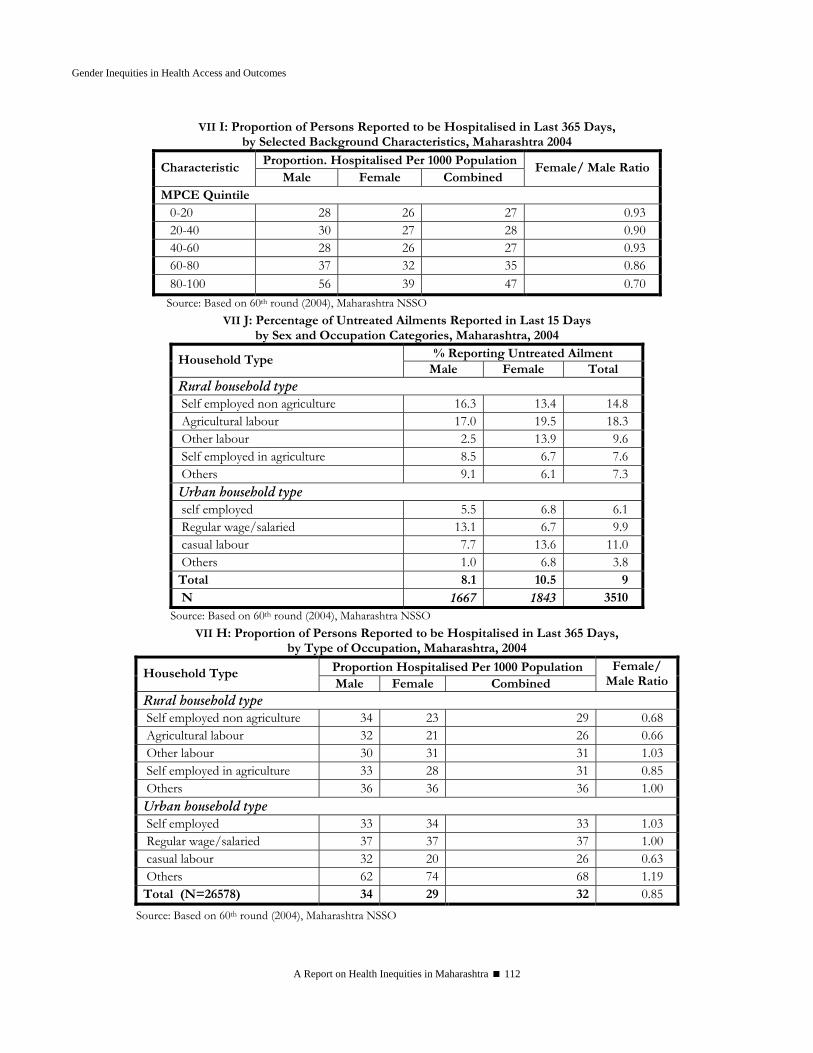
Gender Inequities in Health Access and Outcomes
A Report on Health Inequities in Maharashtra 112
VII I: Proportion of Persons Reported to be Hospitalised in Last 365 Days, by Selected Background Characteristics, Maharashtra 2004
Proportion. Hospitalised Per 1000 PopulationCharacteristic
Male Female Combined Female/ Male Ratio
MPCE Quintile 0-20 28 26 27 0.93 20-40 30 27 28 0.90 40-60 28 26 27 0.93 60-80 37 32 35 0.86 80-100 56 39 47 0.70 Source: Based on 60th round (2004), Maharashtra NSSO
VII J: Percentage of Untreated Ailments Reported in Last 15 Days by Sex and Occupation Categories, Maharashtra, 2004
% Reporting Untreated Ailment Household Type Male Female Total
Rural household type Self employed non agriculture 16.3 13.4 14.8 Agricultural labour 17.0 19.5 18.3 Other labour 2.5 13.9 9.6 Self employed in agriculture 8.5 6.7 7.6 Others 9.1 6.1 7.3 Urban household type self employed 5.5 6.8 6.1 Regular wage/salaried 13.1 6.7 9.9 casual labour 7.7 13.6 11.0 Others 1.0 6.8 3.8 Total 8.1 10.5 9 N 1667 1843 3510
Source: Based on 60th round (2004), Maharashtra NSSO VII H: Proportion of Persons Reported to be Hospitalised in Last 365 Days,
by Type of Occupation, Maharashtra, 2004
Proportion Hospitalised Per 1000 Population Household Type Male Female Combined
Female/ Male Ratio
Rural household type Self employed non agriculture 34 23 29 0.68 Agricultural labour 32 21 26 0.66 Other labour 30 31 31 1.03 Self employed in agriculture 33 28 31 0.85 Others 36 36 36 1.00 Urban household type Self employed 33 34 33 1.03 Regular wage/salaried 37 37 37 1.00 casual labour 32 20 26 0.63 Others 62 74 68 1.19 Total (N=26578) 34 29 32 0.85
Source: Based on 60th round (2004), Maharashtra NSSO
Lakshmi Lingam & Amita Pitre
A Report on Health Inequities in Maharashtra 113
SECTION V CONCLUSIONS AND POLICY
RECOMMENDATIONS


Conclusions and Policy Recommendations Drafted by Abhay Shukla
based on chapters by Srijit Mishra, Ravi Duggal, Lakshmi Lingam and Amita Pitre
When they visit the metropolis of Mumbai, international tourists as well as first time visitors from smaller towns or villages, often comment on the sharp contrasts that are visibly obvious in this ‘maximum city’ – which are clearly sharper than in any other place in India. The stark disparity of gleaming skyscrapers side by side with humble jhopadpattis in the capital of Maharashtra, is just a reflection of the large scale economic inequities in the state. These socio-economic inequities have been discussed in detail in Chapter 2 and are summarised here by looking at certain key indicators. Further we have seen in Chapters 3 and 4 how despite public commitments to ensure health services for all, there are major inequities of Health status and access to Health care; the related key findings are briefly reiterated here. Based on the cross-cutting gender dimension of Health inequities analysed in chapter 5, certain key issues have been summarised here. Further we look at time-trends, attempting to examine whether these inequities have decreased or increased during the last several years. We have also attempted to look at convergence between various axes of inequity. This is followed by certain policy recommendations, suggesting as to how we can move towards a Maharashtra which has a more just approach to the health of all its citizens, which has greater health equity, based on purposive public action in the spheres of public health and determinants of health.
1. Conclusions A. Maharashtra has Major Socio-Economic Inequities despite Economic Growth Despite high growth rates and a high GSDP, Maharashtra is one of the most unequal states in the country in socio-economic terms, as seen from the following facts: Rich State With Many Poor People: Maharashtra is among the top two or three states in the country regarding per capita income, but poverty ratio is much higher than expected, being slightly above the national average. Estimates for 2004-05 indicate a poverty ratio of 30.7% in Maharashtra which is somewhat higher than India's 27.5%. We need to further keep in mind that there are problems with the officially defined poverty line, which does not necessarily identify all households with inadequate levels of consumption. If we look at actual caloric intake, then according to recent NSSO 61st round data, 68% of households in rural areas and 74% households in urban areas of Maharashtra have caloric intake below the norm (below 2700 calories per day). Thus needy or poor households are likely to be actually many more than those identified by the poverty line. We also need to observe that basic food security in Maharashtra is worse even than the national average, since the same report shows that in the country 61% households in rural areas and 63% households in urban areas have inadequate caloric intake.

A Report on Health Inequities in Maharashtra 116
Overall we can surmise that incomes are more unequally distributed in Maharashtra than at the national level, and higher per capita income has not ‘trickled down’ to the poor, resulting in high levels of poverty and inadequate food security. Agriculture supports most of the population but has very low share of income: More than 55% of Maharashtra's workforce is dependent on agriculture (2001 census). However agriculture's share in the State domestic product is just 10% (2004-05). It is obvious that the large population dependent on agriculture has a very inadequate share of income, and hence higher levels of poverty. Large gap between urban and rural areas: In urban areas of Maharashtra, monthly consumption expenditure (MPCE) is Rs. 1148, which is double compared to expenditure in rural areas at Rs. 568. This large gap between urban and rural economic status is higher in Maharashtra compared to most other major states of India. Scheduled castes, scheduled tribes and Muslims bear a heavier burden of poverty: 54% of SC / ST population in rural areas were below poverty level in 2004-05, this is more than double compared to other Hindu caste groups where poverty level was at 24%. Similarly, in urban areas, SC / ST population had high poverty estimates of 43% compared to 24% among other Hindu caste groups. It is striking that poverty levels among Muslims in urban areas was as high as 55%, more than double compared to other Hindu caste groups. Some regions are better off, other regions are very poor: There are major economic disparities between different regions of Maharashtra. On one hand, Konkan (including Mumbai) had poverty level of 12.9% and Western Maharashtra had poverty level of 15.6%. On the other hand, Marathwada region had higher poverty level of 31 % and Vidarbha region had a much higher poverty level of about 39%. Thus poverty is three times higher in Vidarbha region compared to Konkan region. As a further example of this contrast, per capita income in Gadchiroli district (Rs. 7577) is only around one-fifth of the per capita income in Mumbai (Rs. 35483)! District wise Human development index for Mumbai was calculated at 0.96, compared to 0.21 for Nandurbar and 0.18 for Gadchiroli. Major gender inequities in literacy and education: Maharashtra has a reputation of having higher female literacy and better status of women. While overall literacy is higher in the state, there are surprisingly high gender gaps in literacy. The Gender Differential Indicator in Maharashtra (indicating inequity in literacy levels) has been consistently higher than at national level, with a GDI of 0.58 compared to national figure of 0.47 in 2001. The years of schooling in rural areas among ST females are just 1.7 years, for SC females are 2.5 years, and for other caste group females 3.5 years – compared to 5.6 years for other caste group rural males. Farmers' suicides signify the continuing agrarian crisis: Despite a small group of farmers producing Alphonso mangoes and grapes for the global market, there is an overall agrarian crisis in Maharashtra, which manifests in its sharpest form as farmers suicides. In Maharashtra in 2004, 4147 farmers committed suicide, followed by 3926 farmers ending their lives in 2005. There has been a 288% increase in male farmer suicides between 1995 and 2004; suicide mortality rate nearly quadrupled during these years from 14.7 to 57.2. Suicide Mortality Rate among male farmers in 2005 was 54.9, which is almost four times higher than 13.8
Abhay Shukla
A Report on Health Inequities in Maharashtra 117
for the male non-farmer population! Moving beyond the state average if we look at Vidarbha region, the suicide mortality rate has been stunningly high in districts like Buldhana (191), Amravati (144) and Yavatmal (93).
B. Maharashtra has Large Scale Inequities in Health Status and Health Care Despite being one of the richest states in the country, Maharashtra has large-scale inequities in Health status and health care. The less privileged have poorer health and much poorer access to health care, compared to the more privileged. This signifies a failure of the state to ensure adequate health services and basic health related conditions for the less privileged; the public health system has fallen short of its duty to protect the poor and marginalised. The following dimensions of health inequity substantiate this: Maharashtra ranks high in income, low in public health: Comparing to other states, although Maharashtra ranks among the highest in the country in per capita income, it ranks way down for public health related indicators. It nationally ranks 25th in terms of public health expenditure as a proportion of government spending; it ranks 25th in the country concerning availability of a government facility in the village and ranks 31st among states in terms of proportion of women visiting government health facilities related to pregnancy. The poor are condemned to poorer health, worse access to health care While poverty is a widespread reality in the state, health services being weak have been unable to rescue the poor from the worst health effects of poverty. According to NFHS-2 data, under-five mortality for Households with Low standard of living is 98, which is over three times higher than under-five mortality for Households with High standard of living, which is 32. Similarly, infant mortality rate for Households with Low standard of living is 70, which is almost two and half times higher than IMR for households with High standard of living which was 29. Coming to access to health care, we find that lower income groups have much worse access than higher income groups. For example, the annual hospitalisation rate is half among men from the poorest expenditure bracket, compared to men in the richest expenditure bracket (MPCE quintile). Similarly, proportion of women not receiving antenatal care in the poorest fifth of the population is ten times higher compared to women among the richest fifth. Similarly, the proportion of households which had to sell assets or take loans to pay for hospitalisation in last one year is twice as high in the poorest quintile (53%) compared to the richest quintile (26.5%). Proportion of untreated ailments in last 15 days was more than double among poorest quintile households (15%) compared to richest quintile households (6.8%). This situation is getting worse for the poor with increasing costs of health care, which is mostly privatized, in both rural and urban areas. The cost of an average episode of inpatient care was Rs. 3997 in rural areas and Rs. 3089 in urban areas in Maharashtra in 1995-96. However, according to recent NSS data this has gone up substantially in 2004 to Rs. 6160 in rural areas and Rs. 10114 in urban areas.
A Report on Health Inequities in Maharashtra 118
Rural Maharashtra has Worse Health, Poorer Health Services Compared to the Cities People living in rural areas of the state have significantly worse health status than people living in urban areas. A striking illustration of this is that according to recent figures, Infant Mortality Rate (IMR) in rural areas is 51, more than twice as high as for urban areas at 22. What is even more disturbing is that while IMR in urban areas has declined in this period, IMR in rural areas has remained stagnant at 51 during the seven years between NFHS-2 (1998-99) and recent NFHS-3 (2005-06)! This is linked to poorer access to health care for rural areas of Maharashtra: Urban areas have 140 Allopathic doctors per lakh population, compared to just 24 per lakh in rural areas; thus rural areas have almost six times lower availability of doctors. Urban areas have per 244 Nurses per lakh population, compared to just 65 per lakh in rural areas. Here again there is almost four-fold lower availability of nurses in rural areas compared to cities. The vast majority, a whopping 93% of hospital beds are in urban areas. Hospital beds per lakh persons are nearly twenty times lower in rural areas (22 beds per lakh) compared to urban areas (432 beds per lakh). Although a proportion of the urban hospital beds cater to rural patients, there is no doubt that there is major disproportion, which indicates inadequate planning and regulation regarding the development of both private medical services and the public health system. Further if we look at public health expenditure, instead of being spent equitably, it is skewed towards urban areas. It has been estimated that while public health spending in urban areas is about Rs. 275, in rural areas it is much lower at Rs.114. As a consequence of this serious misdistribution, which includes public health resources, service coverage is much lower for rural areas. For example, in urban areas only 15.9% of births are not attended by a Health professional; however in rural areas such deliveries unattended by health professionals is as high as 56.4%. Adivasis and Dalits Bear the Brunt of Poor Health and Denial of Health Services Health indicators are worse for the adivasi population, and to some extent for the dalit population, compared to other caste groups. For example according to NFHS-2, the IMR in ST households was 74, and in SC households was 53, compared to 49 in other caste groups. The under-5 mortality rate for ST households was 92, compared to 66 for other caste groups. Similarly, anemia among ST children was found to be 83%, and among SC children is 81 % compared to 75% for other groups. Of course such high levels of anemia among children of all groups is a matter of concern. This is linked to poorer access to health care, especially for adivasi populations who may suffer from poorer outreach of health services. For example, ST children had only 62% complete immunisation compared to 78% for the entire population as per NFHS-2. A high proportion of i.e. 63% of births in ST households are not attended by health professionals, compared to 38% for other castes. 25% ST women and 11 % of SC women were found to have not received any antenatal care compared to 7% for other castes.
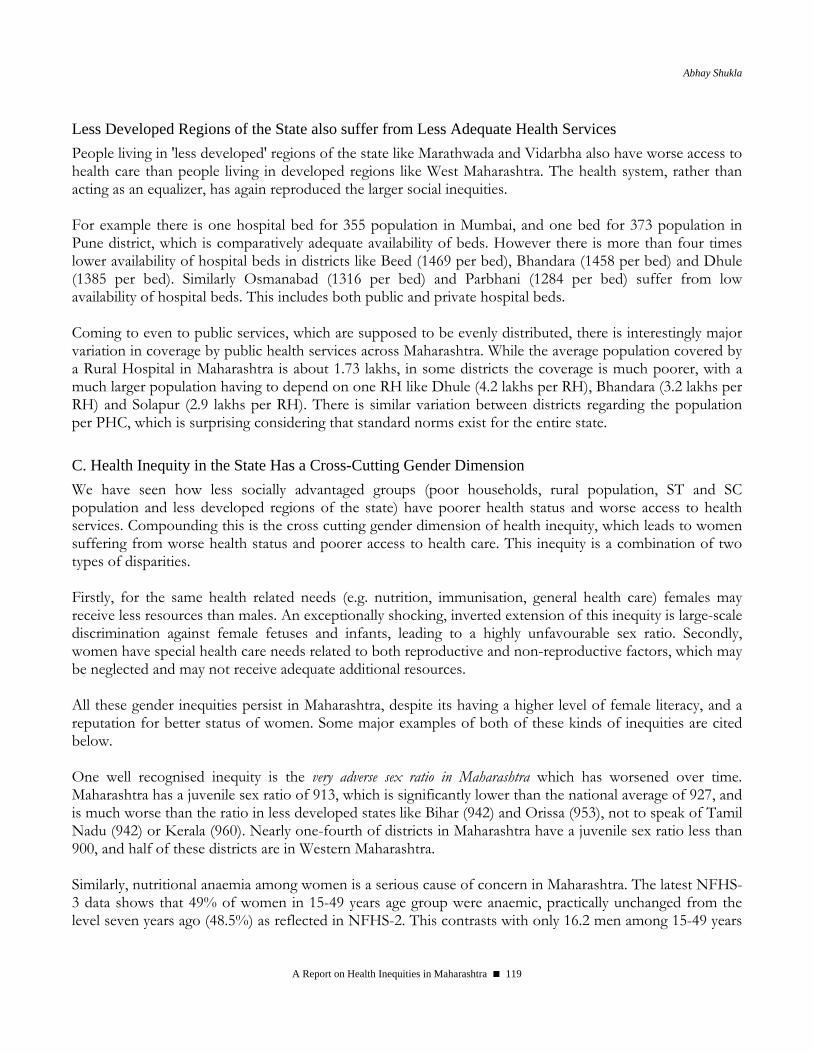
Abhay Shukla
A Report on Health Inequities in Maharashtra 119
Less Developed Regions of the State also suffer from Less Adequate Health Services People living in 'less developed' regions of the state like Marathwada and Vidarbha also have worse access to health care than people living in developed regions like West Maharashtra. The health system, rather than acting as an equalizer, has again reproduced the larger social inequities. For example there is one hospital bed for 355 population in Mumbai, and one bed for 373 population in Pune district, which is comparatively adequate availability of beds. However there is more than four times lower availability of hospital beds in districts like Beed (1469 per bed), Bhandara (1458 per bed) and Dhule (1385 per bed). Similarly Osmanabad (1316 per bed) and Parbhani (1284 per bed) suffer from low availability of hospital beds. This includes both public and private hospital beds. Coming to even to public services, which are supposed to be evenly distributed, there is interestingly major variation in coverage by public health services across Maharashtra. While the average population covered by a Rural Hospital in Maharashtra is about 1.73 lakhs, in some districts the coverage is much poorer, with a much larger population having to depend on one RH like Dhule (4.2 lakhs per RH), Bhandara (3.2 lakhs per RH) and Solapur (2.9 lakhs per RH). There is similar variation between districts regarding the population per PHC, which is surprising considering that standard norms exist for the entire state.
C. Health Inequity in the State Has a Cross-Cutting Gender Dimension We have seen how less socially advantaged groups (poor households, rural population, ST and SC population and less developed regions of the state) have poorer health status and worse access to health services. Compounding this is the cross cutting gender dimension of health inequity, which leads to women suffering from worse health status and poorer access to health care. This inequity is a combination of two types of disparities. Firstly, for the same health related needs (e.g. nutrition, immunisation, general health care) females may receive less resources than males. An exceptionally shocking, inverted extension of this inequity is large-scale discrimination against female fetuses and infants, leading to a highly unfavourable sex ratio. Secondly, women have special health care needs related to both reproductive and non-reproductive factors, which may be neglected and may not receive adequate additional resources. All these gender inequities persist in Maharashtra, despite its having a higher level of female literacy, and a reputation for better status of women. Some major examples of both of these kinds of inequities are cited below. One well recognised inequity is the very adverse sex ratio in Maharashtra which has worsened over time. Maharashtra has a juvenile sex ratio of 913, which is significantly lower than the national average of 927, and is much worse than the ratio in less developed states like Bihar (942) and Orissa (953), not to speak of Tamil Nadu (942) or Kerala (960). Nearly one-fourth of districts in Maharashtra have a juvenile sex ratio less than 900, and half of these districts are in Western Maharashtra. Similarly, nutritional anaemia among women is a serious cause of concern in Maharashtra. The latest NFHS-3 data shows that 49% of women in 15-49 years age group were anaemic, practically unchanged from the level seven years ago (48.5%) as reflected in NFHS-2. This contrasts with only 16.2 men among 15-49 years

A Report on Health Inequities in Maharashtra 120
age group being anaemic, reflecting both less availability of nutritious food for women, and inadequate iron supplementation compared to their greater biological need. Only 30.5% women reported having taken Iron-Folic Acid tablets during their last pregnancy. Overall women are more undernourished than men, with recent NHFS-3 data showing 32.6% women having low body mass index compared to 24.9% men. Here it is worth noting that undernutrition among women in Maharashtra is practically the same as the All-India average (33%), confirming that it is a rich state but populated by poorly nourished women. A final aspect of gender inequity that may be noted is the alarmingly high levels of spousal violence in Maharashtra. A high level of almost one-third (30.7%) women in the state reported having experienced spousal violence according to recent NFHS-3 information. D. Are These Inequities Growing? Do These Inequities Reinforce Each Other? It is important for us to know as to how these inequities are faring over time, especially in the recent one and half decades since the full fledged ‘globalisation-liberalisation-privatisation’ model has been adopted. Has this model resulted in greater health equity and fairer distribution of health care resources? We also need to look at how multiple axes of inequity, such as socio-economic class, caste / tribe, gender, urban/rural location intersect with each other and strengthen each other. While looking at the time trends of socio-economic inequities over the last two decades using the Gini coefficient as an indicator, we have seen that inequities have increased in both rural and urban areas of Maharashtra:
Table 1 Gini coefficient of consumption expenditure in Maharashtra
It is also notable that levels of poverty in Maharashtra have been stagnating in the recent years. To look at recent trends, we would need to take poverty estimates based on mixed recall period, since with this method we have comparable estimates for 1999-2000 and 2004-05. We find that in this period urban poverty in Maharashtra has slightly increased (from 26.8% to 29%) and poverty in rural areas has declined only marginally (from 23.7% to 22.2%). Hence despite high growth rates and increasing affluence for certain sections, inequities seem to be increasing. This is further borne out by figures on trends in regional inequities in Maharashtra, looking at the share of various regions in contributing to NSDP. Between 1993-94 and 2004-05, the already high share of Konkan division (including Mumbai) increased from 40.7% to 42.3%, and that of Pune division increased
Rural Urban
1983 0.291 0.349
1993-94 0.306 0.357
2004-05 0.311 0.378

Abhay Shukla
A Report on Health Inequities in Maharashtra 121
from 19.5% to 20.8%. On the other hand the share of Marathwada division declined from 10.6% to 9.1%, and the already low share of Amravati division declined from 7.4% to 6.3%. We have some information to comment on the time trends concerning health inequities in the state, during recent years. While further detailed analysis using the primary data of large surveys needs to be carried out, there is disturbing evidence that regarding some key indicators, during the recent years, inequities have increased. Regarding immunisation coverage, we see that at the time of NFHS-l (1992-93), coverage in rural areas (66%) was slightly higher than in urban areas (62%). This pattern became reversed by the time of NFHS-2 (1998-99), with urban areas having slightly higher coverage (81%) than rural areas (77%). However a shocking deterioration is seen during the last seven years, so that by the time of the recent NFHS-3 (2005-06), overall immunisation coverage has declined by almost 20 percentage points (from 78% to 59%). Besides this overall decline being a matter of serious concern, it is notable that if we break up this decline, we find it is much more in rural areas (from 77% to 50%) than urban areas (from 81 to 68%). Hence the rural-urban inequity in immunisation has markedly increased, with the urban-rural ratio increasing from 1.05 to 1.36! Concerning Infant mortality rate (IMR) we see an intriguing pattern. During the six years between NFHS-1 (1992-93) and NFHS-2 (1998-99), IMR declined in rural areas (from 61 to 51) but did not decline at all in urban areas (remained at 33). However, during the recent seven years between NFHS-2 (1998-99) and NFHS-3 (2005-06), while IMR has declined in urban areas from 33 to 22, there is no decline at all in rural areas (remained at 51), leading to significant increase in rural-urban inequity. Further we can look at how proportion of untreated ailments has fared in the period between 1995-96 (NSSO 52nd round) and 2004 (NSSO 60th round). Despite considerable expansion of medical care providers in this period, proportion of untreated ailments have increased in most groups and have slightly increased overall (from 9.3% to 10%) largely due to unaffordability of private services for the entire population. While this itself is a significant problem, untreated ailments have increased in this period by 62% among SC/ST groups compared to a decline of 5% among other caste groups, reflecting major inequity in this regard. Similarly if we look at increase in inpatient expenditures between 1995-96 (NSSO 52nd round) and 2004 (NSSO 60th round), we find sharp increases across the board for all groups, an issue of serious concern. Yet the increase in average expenditure for the poorest quintile was by 6.5 times (from Rs. 711 to Rs. 4668) compared to 1.4 times for the richest quintile (from Rs. 7287 to Rs. 10240). Similarly average expenditure for SC/ST groups tripled in this period (from Rs. 1611 to Rs. 4827) while it roughly doubled for other caste groups (from Rs. 3741 to Rs. 8035). If we next look at the issue of inequities reinforcing each other, further analysis is required to make definitive statements. However it is obvious that there is significant degree of overlap between various dimensions of social deprivation (class, caste, gender, rural-urban location and region in the state). Those groups which suffer from multiple forms of deprivation, have the resultant severe adverse health effects, while other groups having multiple forms of privilege, enjoy better health.
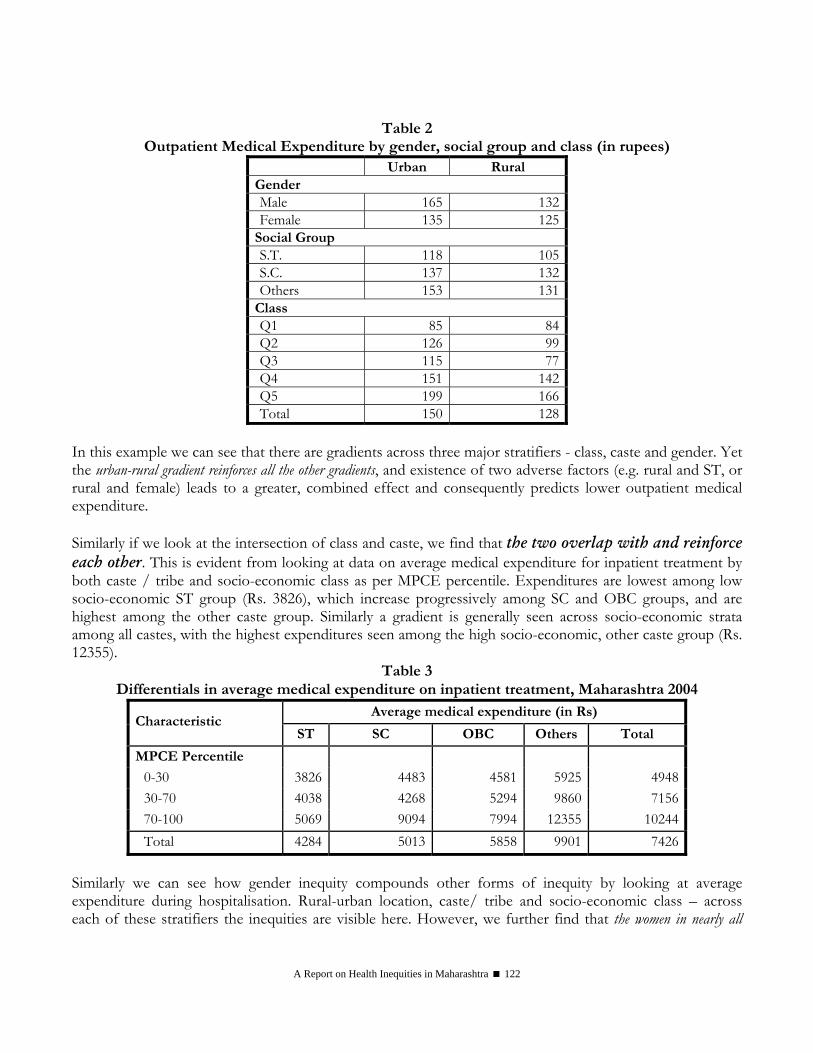
A Report on Health Inequities in Maharashtra 122
Table 2 Outpatient Medical Expenditure by gender, social group and class (in rupees)
Urban Rural Gender Male 165 132Female 135 125
Social Group S.T. 118 105S.C. 137 132Others 153 131
Class Q1 85 84Q2 126 99Q3 115 77Q4 151 142Q5 199 166Total 150 128
In this example we can see that there are gradients across three major stratifiers - class, caste and gender. Yet the urban-rural gradient reinforces all the other gradients, and existence of two adverse factors (e.g. rural and ST, or rural and female) leads to a greater, combined effect and consequently predicts lower outpatient medical expenditure. Similarly if we look at the intersection of class and caste, we find that the two overlap with and reinforce each other. This is evident from looking at data on average medical expenditure for inpatient treatment by both caste / tribe and socio-economic class as per MPCE percentile. Expenditures are lowest among low socio-economic ST group (Rs. 3826), which increase progressively among SC and OBC groups, and are highest among the other caste group. Similarly a gradient is generally seen across socio-economic strata among all castes, with the highest expenditures seen among the high socio-economic, other caste group (Rs. 12355).
Table 3 Differentials in average medical expenditure on inpatient treatment, Maharashtra 2004
Average medical expenditure (in Rs) Characteristic
ST SC OBC Others Total
MPCE Percentile 0-30 3826 4483 4581 5925 494830-70 4038 4268 5294 9860 715670-100 5069 9094 7994 12355 10244Total 4284 5013 5858 9901 7426
Similarly we can see how gender inequity compounds other forms of inequity by looking at average expenditure during hospitalisation. Rural-urban location, caste/ tribe and socio-economic class – across each of these stratifiers the inequities are visible here. However, we further find that the women in nearly all
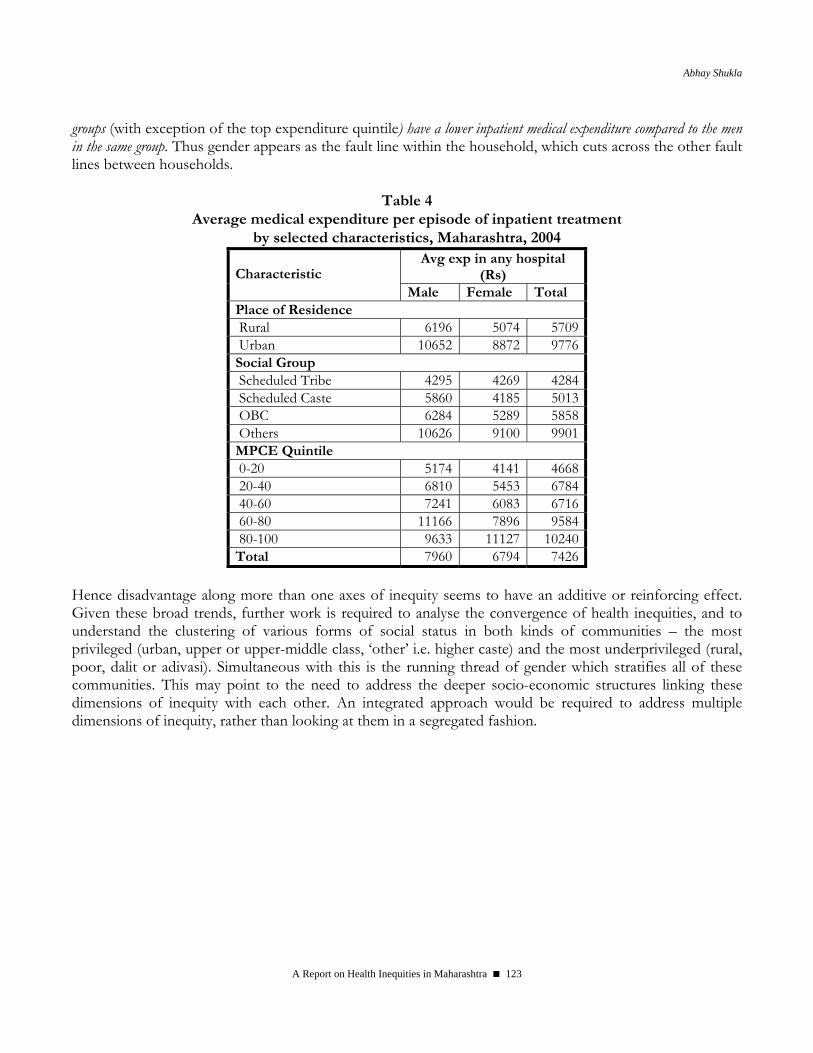
Abhay Shukla
A Report on Health Inequities in Maharashtra 123
groups (with exception of the top expenditure quintile) have a lower inpatient medical expenditure compared to the men in the same group. Thus gender appears as the fault line within the household, which cuts across the other fault lines between households.
Table 4 Average medical expenditure per episode of inpatient treatment
by selected characteristics, Maharashtra, 2004 Avg exp in any hospital
(Rs) Characteristic Male Female Total
Place of Residence Rural 6196 5074 5709 Urban 10652 8872 9776 Social Group Scheduled Tribe 4295 4269 4284 Scheduled Caste 5860 4185 5013 OBC 6284 5289 5858 Others 10626 9100 9901 MPCE Quintile 0-20 5174 4141 4668 20-40 6810 5453 6784 40-60 7241 6083 6716 60-80 11166 7896 9584 80-100 9633 11127 10240 Total 7960 6794 7426
Hence disadvantage along more than one axes of inequity seems to have an additive or reinforcing effect. Given these broad trends, further work is required to analyse the convergence of health inequities, and to understand the clustering of various forms of social status in both kinds of communities – the most privileged (urban, upper or upper-middle class, ‘other’ i.e. higher caste) and the most underprivileged (rural, poor, dalit or adivasi). Simultaneous with this is the running thread of gender which stratifies all of these communities. This may point to the need to address the deeper socio-economic structures linking these dimensions of inequity with each other. An integrated approach would be required to address multiple dimensions of inequity, rather than looking at them in a segregated fashion.
A Report on Health Inequities in Maharashtra 124
2. Policy Recommendations If we regard health as a human right which should be enjoyed by everyone, and consider that basic health care is a social good which should be available to all, then the major inequities that we have analysed would be regarded as an unacceptable affront to human rights. This situation should prompt us to take prompt, large-scale, definitive action, to ensure much greater equity in health and a decent standard of health for all. Before going into specific recommendations, we could make a few generalizations based on the previous analyses:
• Economic growth in Maharashtra has not translated into comparable economic betterment of all sections of society.
Poverty levels remain higher than the national average and particularly the entire agrarian sector is facing a serious crisis, which will not disappear on its own. The myth propagated during the last one-and half decades that 'globalisation is good for everyone' needs to be questioned; the processes underlying rural-urban inequities need effective corrective public action.
• Higher average per capita income in Maharashtra has not translated into a strong public health system with equitable
access to health care and healthy conditions, for the population of the state. Economic growth alone will not necessarily lead to good health for all sections of society; nor can private medical enterprise and the market ensure access to health care for all. In fact the last nearly two decades tell us a dismal story of 'market failure' in health care. This failure needs to be squarely recognised and confronted. Purposive state intervention designed with clear equity considerations would be necessary to ensure equitable access to health care and health determinants across the state.
• Higher literacy among women and a heritage of women's education in the state has not led to gender equity in health; the
large scale gender inequities in various aspects of health and nutrition, which compare unfavourably even with other states, require focused public interventions and actions from household to social levels.
Based on these general observations, the following policy recommendations may be proposed:
A. Making Access to Health Care Equitable, Including Addressing the Gender Dimension Here we would proceed from the principle of "Care on the basis of need and not on the basis of social position or ability to pay". It would be recognised that only the public health system can address this challenge in a definitive way. Regarding public health resources, actions of at least four kinds are required: • Urgently 'increasing the size of the bhakri' (substantial increase in public resources, regulating and
harnessing private health care resources for public health) • Ensuring 'equitable division of the bhakri' (equal resources for similar groups; addressing neglect of
rural areas and backward regions by equitable allocations) • Making available 'additional portions of bhakri for the most needy' (additional resources for groups
with special health needs) • 'Making the bhakri tasty' (improving utilisation of public health resources by increasing acceptability,
addressing felt needs and non-medical expectations, improved provider behaviour, active partnering with communities and people-based planning for health etc.)
Abhay Shukla
A Report on Health Inequities in Maharashtra 125
Keeping this in mind, the following steps need to be taken: A. General recommendations concerning the health system: • Large scale health inequities cannot be addressed without adequate public health resources ('increasing
the size of the bhakri'). Hence a high priority is to substantially increase public investment and expenditure in health, to achieve the CMP promise level of 3% of SDP. As part of NRHM we are now seeing an influx of resources from the Union government, which needs to be matched by raising more resources for public health from within the state and effective utilisation of these resources where they are most required. This must be combined with effectively regulating and harnessing the large and unregulated private medical sector for public health needs and goals. This sector benefits from public subsidies, draws away the main portion of health humanpower often trained at public expense, yet presently caters only to those who can pay and has fractured and commercialized the entire health care sector, thereby weakening and distorting even the public health system (this issue is dealt with further below).
• Large-scale inequities in public health allocations need to be redressed, especially between rural and urban areas, and between various regions of the state - the Public health system must act as a ‘great equalizer’, not as a passive accomplice in increasing inequities. Over a period of time, block budgeting for health may be ensured (a standard basic allocation per lakh population), leading to equitable resource allocations for rural and urban areas, and all regions.
• As one of the key, early steps in implementing the National Rural Health Mission in the state, a task group on Health equity may be set up to carry out careful examination of existing inequities in public health allocations and health services in Maharashtra. This would include examination of inequities, unaddressed special needs and barriers in accessing quality health care for various sections of the population. This should particularly address class, rural-urban, gender, caste / tribe related, and regional health inequities in the state. This would need to be followed by preferential allocations of the additional NRHM funds with an equity perspective, and redesigning of programmes to ensure improved access and quality for underserved populations and regions of the state.
• Major strengthening of public health facility infrastructure, supplies and maintenance needs to be ensured. Ensuring fulfillment of NRHM service guarantees, including assured availability of all essential drugs in all public health facilities is essential. Priority would need to be given to upgrading rural medical care at PHC, rural hospital and sub-divisional hospital levels to reduce inequities in distribution.
• Combined with the above-mentioned measures, there must be regular participatory monitoring of reduction of Health inequities, involving legislators, Panchayat representatives, civil society organisations including organisations based among women, dalits and adivasis, along with the Public health department. One of the parameters of community based monitoring under NRHM should be to look at health inequities within communities, at district level and across the state.
• There is a need to make adequate allocations and programmatic provisions for sections with special health needs, within the comprehensive health care framework. This would include greater attention and effective investment to upgrade public health services in adivasi areas of Maharashtra, given the significant socio-economic, cultural and geographical barriers they face in accessing health care. Similarly, special measures need to be taken to ensure equitable access by the dalit population (including addressing issues of discrimination) to correct the existing inequities.
A Report on Health Inequities in Maharashtra 126
• The outstanding special health needs of persons with mental health problems, persons living with HIV-AIDS, elderly persons and differently abled persons would need to be met through sets of measures worked out and implemented with participation of groups of these beneficiaries, sensitively delivered by the general health system.
• One major group which suffers from Health inequity is children. They suffer from a combination of inadequately addressed special health needs and a weak voice in the socio-political sphere. The effects of reduced food security, inadequate welfare programmes and dysfunctional public health services are manifested the earliest, and in the sharpest form, in the poor health and nutrition of children. The 'unreached' children must be reached - both the under-three children requiring special semi-solid foods, and the children in remote hamlets and households who are unable to reach the Anganwadi. The present trend of minimising the importance of Grade I and II malnutrition within ICDS needs to be changed, and adequate attention needs to be given to both moderately and severely malnourished children – with the aim that no child should suffer from malnutrition. There is need to ensure full regularity, quality and culturally appropriate variety in supplementary feeding and participatory monitoring of anganwadis by groups of parents and self-help groups at the village level. Supplementary meals cannot be a complete solution, and must be accompanied by context-relevant education of parents regarding improved child feeding along with food security and livelihood security to enable them to provide adequate food for the whole family (also discussed below). Combined with this, child health services need to be strengthened at all levels, ranging from full coverage with routine immunisation and first contact care for childhood illnesses at the village level, to availability of basic child health services in all PHCs and relevant specialized pediatric care services in all CHCs.
• Although this report has emphasised better access to health care in urban areas compared to rural areas, the inequities within urban areas need to be recognised and the barriers faced by the urban poor in accessing health care also need to be urgently addressed. Most cities and towns of Maharashtra lack primary health care systems to cover authorised and ‘unauthorized’ slum populations. The urban poor may have geographic access but lack financial access to private medical facilities, which are usually unaffordable for them. Keeping this in mind, operationalising an integrated system of primary and secondary public health care services for urban areas, which interlinks with improved and accountable tertiary facilities, is an important priority. It must be ensured that residents of ‘unauthorized’ slums, pavement dwellers, migrant groups, street children and similar groups lacking officially approved residence are definitely entitled to the full range of health related facilities and services without barriers of user charges or official procedures.
• Unorganised sector workers, estimated to constitute over 90% of the workers in the state, today do not have assured healthcare coverage. At the same time the Employees State Insurance (ESI) system for organised sector workers is quite dysfunctional and there is large-scale stagnation and underutilization of ESI hospitals. In this situation there is a need to cover all unorganised sector workers by a social security scheme, which includes Health care coverage. The Health care component could incorporate a reorganized and rejuvenated ESI combined with Public Health care facilities and some regulated private services where necessary. This could bring unorganised sector employers (including principal employers) to contribute to their workers health, and could lead to reorganisation and effective utilisation of ESI, while ensuring adequate health care coverage for all workers and their families.
• We need to recognise that BPL-style targeting has not been effective in ensuring access to Health care either for the very poor, or the lower and lower-middle income groups; hence such targeting needs to be abandoned (the massive divergence between the numbers for BPL population and
Abhay Shukla
A Report on Health Inequities in Maharashtra 127
proportion of households who are actually resource-poor, with inadequate food intake has already been noted above). Abandoning of BPL targeting should be accompanied by abolishing user fees, which form a barrier to access for lower and lower-middle income groups and have anyway not resulted in availability of substantial additional resources. In a situation where a large proportion of the population suffers from barriers in accessing health care (as noted above over two-thirds of the population suffers from food insecurity according to recent data) instead of targeting a sub-section of the poor, it makes sense to provide universally accessible services and then to ‘target’ the rich and better off sections to generate adequate resources. This may be done by taxing industry and wealthy sections of the population, or introducing social insurance for some kind of cross-subsidisation.
• Further it needs to be recognised that focus on narrow vertical programmes is not the solution to addressing inequities. Large scale, systemic inequities cannot be addressed by limited targeted interventions, but rather require effective universal systems, which are sensitive to the needs of the most deprived. Narrowly focused vertical programmes (e.g. a separate programme for neonatal mortality reduction) may not be very sustainable or generalisable in the context of a weak Public health system. We have already seen how the highly vertical Pulse polio programme has had a very serious adverse impact on routine immunization, especially in rural areas. Such myopic programmes need basic re-examination and may be discarded in favour of a more comprehensive approach; all programmes must be developed only on the base of a strong public health system. This also involves moving beyond the 'IMR-MMR fixation'; these rates should only be regarded as indicators which must reflect a larger spectrum of health improvements; their reduction should be sought as a welcome outcome of overall health system strengthening and outreach, rather than their monopolizing the entire health agenda. An indicator should not become a substitute for the goal.
• A top priority issue is comprehensive legal regulation of quality of care and costs in the private health sector, linked with building accountability of the private health sector to citizens and civil society. A key first step in this regard would be the enactment of updated BNHRA rules, including provisions to protect patients’ rights. We further need to move towards minimising irrational and unnecessary care and interventions through ensuring adherence to standard treatment protocols. From equity considerations there is requirement for a system of 'certificate of need' for all new private hospitals and nursing homes - these should be preferentially allowed in underserved areas and not licensed in over-served areas. Moves are already underway by the High Court to ensure the fulfillment of social obligation of Trust hospitals and all health care institutions, which have availed of public subsidies. This could be done more effectively by handing over allocation of their beds for poor patients to an independent public agency.
• A related important action area is how to harness the large and presently unaccountable private medical sector for public health needs and goals. We need to recognise that presently over 80% of hospitals and 50% of hospital beds in the state are in the private sector. The gross inequities in access to Health care cannot be tackled without ensuring more equitable access to these large scale resources. However this would require an approach that is qualitatively different from the present dominant trend regarding ‘Public Private Partnerships’. There is a need to bring in resources to strengthen public facilities, and to extend control by the public health system rather than outsourcing responsibilities and reducing control by the public health system. Ongoing moves to hand over public hospitals to private agencies, particularly given the absence of regulatory and accountability mechanisms, are deeply problematic and need to be reversed. On the other hand, in areas where public health services are lacking in specialists, there may be contracting in of private professionals, to strengthen people’s access to publicly funded health services. Similarly the
A Report on Health Inequities in Maharashtra 128
beds supposed to be reserved for poor patients in Trust hospitals (which amount to a large number of beds across the state) could be allocated to patients and monitored by a public agency with civil society involvement. Further specific public health obligations (reporting of notifiable diseases and contribution to surveillance, assistance in control of TB and Malaria, action during epidemics) could be made mandatory by private health care providers. Of course all these and similar steps must be accompanied by legal and operational regulation of the private medical sector as mentioned above. Such steps could lead towards integration of regulated private providers under the framework of a publicly financed, universal healthcare access system.
B. Recommendations concerning gender equity in Health: To counter the ill effects of socially and economically rooted gender bias, efforts will have to be made at three levels-
1. Awareness Building, Engendering Medical Research, Engendering Medical Education - To publicise and reduce the ill effects of gender on women’s health. To conduct research to find as yet unknown effects of gender on women’s health.
2. Public Policy - To recognise these effects and set up policies and programmes to counteract them 3. Health Programmes - To set up or qualitatively strengthen programmes to deal with the health
consequences. These efforts would need to cover the following dimensions:
1. Engendering Management Information Systems, Research and Education
The first and foremost difficulty in researching gender related health inequities is the paucity of systematic, gender disaggregated data made publicly available. It is important to periodically collect and make publicly available, compiled information on causes of death across age groups, infant, child and adult mortality rates, rates of significant diseases including cancers and other significant information for policy making. A gender policy for all medical and health research must be implemented wherein gender will be considered right at the design stage and gender disaggregated data for the research will be available. Funds should be allocated for neglected areas affecting women such as health consequences of sterilisation operations for women, prevalence of violence against women, health consequences of violence, facilities available to respond and health seeking behaviour of violated women. The concept of gender, health consequences of gender in the context of social determinants of health and gender differences within and across other social stratifiers of class, caste and ethnicity to be included in medical education.
2. Enhancing Access to Health determining Factors
a. Special policies and programmes to retain girls in school at least till secondary school completion, with a special emphasis on SC, ST and Muslim population. Measures would include opening schools where none exist, financial assistance and ensuring the safety and
Abhay Shukla
A Report on Health Inequities in Maharashtra 129
security of adolescent girls to attend schools. Special programmes for adolescents and adults should include health literacy.
b. Concept of gender and its implications for women’s health should become a part of the school curriculum right from primary education progressively at all levels.
c. Making kerosene and LPG available to rural poor women at a subsidised rate and schemes to phase out use of solid fuels in kitchens.
d. Toilet facilities and sanitation to be made universally available in all villages and urban slums. e. Strict implementation of the ‘Child Marriage Prohibition Act, 2005’
3. Reduction in Girl Child Morbidities and Mortality
a. Strict implementation of the PNDT Act and other measures to stop sex selection. b. Regular public audit of reporting of stillbirths and infant mortality figures and appropriate action
to be taken for 100% recording and if found that deaths of girl children are disproportionately high.
c. Regular survey and public audit of undernutrition and anaemia among children and women at district levels, and city level for urban slums and immediate action to be taken.
d. Regular public audit of functioning of anganwadis, mid-day meal programmes and availability of Iron and Folic acid at all Sub-centers, Primary Health Centers and Urban dispensaries. Action taken immediately and report to be made public through media.
4. Improvement in Adolescent Health
• Adolescents are at risk of anaemia, undernutrition, teenage sexuality risks in the absence of adequate information, early marriage, early pregnancy and childbearing. Special programmes to continue their schooling, vocational and life skills training, self-development, health and body literacy and prevention of undernutrition and anaemia should be implemented.
5. Improvement in Health of Adult Women
• The Public Health System should take up periodic drives to diagnose and treat anaemia and undernutrition among women at the community level. Clinical and if required laboratory diagnosis of anaemia among all women visiting public health facilities should be made standard practice. Iron and Folic acid tablets and nutrition education must be provided free of cost to all women diagnosed with anaemia and/ or undernutrition. A special emphasis should be for rural, ST and SC women to be able to access these services.
• Iron and Folic Acid stock to be maintained and publicly displayed by every public health facility. • Health programmes to screen women for health problems specially affecting women such as
reproductive health problems, cervical, breast and oral cancers, osteoporosis, vaginal/ uterine prolapse, menopause related problems should be run free of cost on a regular basis at all public health facilities.
• Health programmes should also broaden the scope of occupational and environmental health hazards and screen women for effects of indoor pollution on respiratory system and eyes, aches, pains and arthritis due to drudgery of work, vaginal and uterine prolapse
A Report on Health Inequities in Maharashtra 130
• Reducing violence and crime against women should be on the political agenda. • Women need to be regularly screened for possible violence faced by them and treated for health
consequences. Support centers to help women deal with violence need to be set up first in every district and then at all sub-district and rural hospitals. Other support services such as shelters, legal aid etc should be linked to these centres.
• Sterilisations done in camp settings should be abolished altogether. Contraceptive services, safe abortions, male and female sterilisations, maternal health services, general, reproductive and mental health services should be available on demand in accordance to laws of the land.
• Since women face special barriers to access health care, health care professionals must utilize the opportunities of Ante Natal Care and when women visit health facilities to screen them for commonly identified health problems and to educate them.
B. Making Access to Key Health Determinants Equitable; Questioning and Re-Structuring the Model of Development
The role of key health determinants such as food security and nutrition, water supply and sanitation, and healthy environmental conditions in promoting health equity cannot be under estimated. While it has not been possible to deal with various determinants in detail in this report, a few key issues can be touched upon: • The poor nutritional status of large sections of the population in Maharashtra is manifesting in the
form of high levels of child malnutrition and raised IMR and under-5 mortality rates, large scale undernutrition among women, very high levels of anaemia among children and women, and resultant morbidity and mortality. These need to be traced to large scale food insecurity and poverty, which have not responded to existing rather narrowly targeted interventions, since around 70% of the population in Maharashtra has inadequate calorific intake. The issue of agrarian poverty is separately dealt with below. Concerning food security and nutrition, there is a need to move beyond rather defective and restrictive income-based targeting of PDS. Entire social sections such as women headed households, all rural adivasi and dalit households not having organised sector employment, landless labourers and marginal farmers with less than an acre of land, manual workers in the unorganized sector, pavement dwellers and those living in temporary shelters, etc. should be treated as entire categories which are food insecure (without need for any separate poverty assessment) and requiring subsidized foodgrains. Significantly broadening the coverage of PDS to include such entire sections of the population would break the impasse created by Targeted PDS, and would also make ration shops much more functional with a broader base of buyers. The idea should be to move towards near-universal coverage for supply of subsidized foodgrains in a state where around 70% of families are food-insecure. The upper-middle class and the rich may self-select out of such a near-universal system, rather than the present highly selective situation where even a large proportion of the food-insecure poor are getting pushed out from the system. Further, food security cannot be separated from the issue of employment and migration in rural areas, and would require an integrated strategy. Combined with this is the need to end the gross under-reporting of malnutrition by ICDS, and to make it reach the children requiring its services the most. Given the major under-reporting of severe malnutrition by ICDS (10 to 20 fold in adivasi areas, compared to independent national surveys like NFHS and NIN) there is a need to have an independent system, involving rural women's groups, to monitor levels of malnutrition in Anganwadis and to ensure

Abhay Shukla
A Report on Health Inequities in Maharashtra 131
that all malnourished children are identified and are given adequate supplementation. This needs to be combined with much more effective inter-sectoral coordination between the Health, Women and Child Development and Food and Civil Supplies departments, to ensure integrated action against malnutrition and its health consequences.
Concerning water supply, although there have been significant improvements in recent years, still
24% of rural households lack regular access to safe drinking water. Here it is worrisome that only 5% of households in the poorest quintile have such access - highlighting the continued inequities and vulnerability of the poor. Here emerging trends of semi-privatisation of water supply, including certain rural drinking water schemes, which require the village community to pay contributions, need careful scrutiny from an equity perspective. Would the poorest households be able to share in such contributions? If the well-off households make their own arrangements (e.g. private borings) who will look after the poor? The caste factor limiting access to certain sources of water also needs to be kept in mind while tackling these issues.
Finally, we need to look at the larger developmental scenario, large scale socio-economic inequities and the agrarian crisis which have been noted in this report. The following measures would need to be considered:
The agrarian crisis needs to be squarely recognised and this sector needs urgent steps for revitalisation. The impact of integration with the global market, in terms of fluctuation of purchase prices of key agricultural commodities like cotton needs close examination leading to revised policy. Need for institutional credit for farmers is still an issue, given the continued adverse influence of moneylenders. Substantial public investment in agriculture and rural employment appear necessary.
Agricultural policies and Health policies must be developed in an integrated manner: Growing agrarian crises and weak rural credit policies being pursued in Maharashtra are manifesting in farmers' suicides on the one hand, and growing untreated mental health problems on the other. It is important that agriculture and health policies have to be congruent on issues of people's health and well-being.
Another key aspect of farmer suicides concerning the health system is the frequent inability of the farmer to meet the health care expenditure of family members from his normal sources of income. This catastrophic expenditure often proves to be the last straw in an already critical domestic economy. This situation calls for major strengthening of public provisioning and guaranteed health services in rural areas.
For suicide mitigation, as another measure, availability of toxic pesticides needs to be phased out, with preference to organic pest control methods. This is of course not a substitute for the larger steps that need to be taken to address the agrarian risk per se. From the public health angle, availability of treatment for poisoning at PHC and CHC levels in rural areas (a curative aspect) and mental health promotion (a preventive aspect) also need to be looked into.
The growth of tertiary and capital intensive manufacturing in recent years is largely providing employment for skilled workers. This means that unskilled and semi-skilled workers do not have much option; industrial growth must be planned with balanced and dispersed growth of employment in mind.
Large scale land acquisition, usually without the definitive consent of village communities and without adequate provisions for long term alternative livelihood options is an additional serious challenge emerging across Maharashtra. In parallel with the critique and opposition to SEZs and
A Report on Health Inequities in Maharashtra 132
similar industrial enclaves, which is rapidly growing at the grassroots level, critical analysis and basic reconsideration of such measures is required at the policy level.
Further, equity is a cross cutting value and principle which should not be limited to the health sector alone. It is well documented that societies with greater socio-economic equity have more solidarity and much better health outcomes, compared to societies which have comparable average incomes but higher levels of economic inequity. In the context of drought-prone areas of Maharashtra, adopting equity in agricultural water distribution is a social measure which can ensure increased productivity and livelihood security among households with none or smaller landholdings, while promoting overall equity and solidarity in village communities.
To conclude, the deciding point for choosing a developmental model should not be focussed on growth rates but on universal fulfillment of human needs. Given the enthusiasm of the neo-liberal model to privatize social services, it must be re-emphasised that private enterprise on its own never regulates itself, nor does it necessarily lead to equitable socio-economic improvement; state action is essential to ensure balanced growth and redistribution. It may be kept in mind that without human development, even sustained economic development becomes impossible. Keeping the large scale health inequities that have resulted from the neo-liberal, globalised path of development and the crisis of the health system in Maharashtra, now there is a need for the great mass of people to re-claim and re-shape state institutions. Building on the best traditions of Maharashtra, we must adopt a more equitable and humane socio-economic model and chart out a different future, which includes everyone. We need to re-invent public action while placing the health and well-being of ordinary people at the centre.

About Contributors Abhay Shukla Senior Programme Coordinator, SATHI- CEHAT, [email protected] Abhay Shukla, M.D. is a medical graduate with a postgraduate degree in Community Medicine from the All India Institute of Medical Sciences, New Delhi. Since more than a decade, he has been based in Maharashtra, working on health issues in association with people’s organisations. As a Senior Programme Coordinator in SATHI-CEHAT, he has been involved in training health workers, developing health training material and advocacy on Health rights and Primary Health care issues in Maharashtra and West M.P. He is one of the National Joint Convenors of Jan Swasthya Abhiyan (JSA) and has been responsible for hosting the National Secretariat of JSA. Amita Pitre Research Consultant, Mumbai. Email: [email protected] Amita Pitre has a Masters in Health Sciences and a degree in the Indian System of Medicine. She has been involved in Public Health Research, Action and Advocacy for the last seven years. Currently she works as an independent research consultant. Women and Health and Responding to Gender Based Violence are areas of special interest. Lakshmi Lingam Professor & Chair, Centre for Women’s Studies, Tata Institute of Social Sciences, Mumbai. Email: [email protected] Lakshmi Lingam is a Professor at the Tata Institute of Social Sciences, Mumbai, India. She is currently the Chairperson of the Centre for Women's Studies. Lakshmi Lingam has acquired her PhD from the Indian Institute of Technology, Bombay. Her research interests range from exploring the social and gender specific implications of health sector reforms and other macro economic policies; studying women's and other social movements in the period of globalization; understanding women’s health and reproductive rights; and exploring issues of culture, women’s identity and agency. Ravi Duggal Independent Researcher/Consultant Ravi Duggal is a Sociologist by academic training and also holds a professional diploma in Business Management. For nearly three decades he has contributed to health services research, especially in the areas of political economy of health and health financing through institutions like CEHAT and FRCH in Mumbai. He now works as an independent consultant undertaking research, advocacy and trainings on issues like health systems and health sector reforms, health financing and budgets, health and human rights, reproductive health, governance and accountability mechanisms. Presently he is engaged in an international initiative across nine south and south-east Asian countries building capacity in understanding budgets and using budgets to advocate for development rights of citizens and strengthening good governance. Email: [email protected] Srijit Mishra Associate Professor, Indira Gandhi Institute of Development Research, General Arun Kumar Vaidya Marg, Goregaon (E), Mumbai-400065, INDIA, Email: [email protected]. Srijit Mishra is currently Associate Professor at the Indira Gandhi Institute of Development Research, Mumbai. He works on health and other development related issues. His recent work on ‘Suicide of farmers in Maharashtra’ and related work has received a lot of attention from policy makers and academia among others. He is co-editing a book on Agrarian Crisis in India, which is forthcoming from the Oxford University Press. He is currently a part of a research team comprising members from India and Canada who are analyzing the World Health Survey through a Canadian Institute of Health Research funding. He also has research interest in measurement related issues and is currently working on a refinement of the Human Development Index.

S A T H I (Support for Advocacy and Training to Health Initiatives)
SATHI is the action-centre of Anusandhan Trust evolved from CEHAT. SATHI team originated in 1998 as part of CEHAT. From 1st April 2005, SATHI has developed into an
independent action-centre of Anusandhan Trust with headquarters in Pune. The core principles of SATHI’s functioning are social relevance, democratic mode of functioning, ethical conduct and social accountability.
Our Goal, Strategy SATHI’s goal is Health for All. This means to work towards a society Which has realized its right to health and health care, Which has adopted a developmental path which fosters health of both the people and their environment Where people, instead of becoming appendages of the health care system are its prime movers and have
universal access to appropriate health care as a human right. To achieve this goal SATHI’s strategy is to work as a team of pro-people health professionals to contribute to the movement and initiatives towards ‘Health For All’.
Our Activities: To achieve this goal, SATHI undertakes following types of activities with a rights based perspective -
Collaboration with Peoples’ Organizations and like minded NGOs for • organizing Village Health Worker based Primary Health Care Programmes in remote areas • local advocacy to improve the functioning of Public Health Services in these areas, including
increased sensitivity to the needs of the marginalized, labouring population Mainstreaming the training methodology and training material developed during this work in
remote areas of training of especially less educated Community Health Workers Collaboration with Peoples’ Organizations and like minded NGOs for promoting Health Rights of
the people, especially in rural areas As part of Jan Swasthya Abhiyan - JSA - (the national collaborative health advocacy platform)
advocacy on policy issues at national level. For example, • Engagement with – NRHM - the National Rural Health Mission including participation in the
Community Based Monitoring under NRHM. • Public Hearings, in collaboration with the NHRC about denial of health services in the Public
Health Facilities and advocacy for improvements in this scenario As part of Jan Aaroghya Abhiyan - JAA - (the state level collaborative health advocacy platform in
Maharashtra) advocacy on policy issues at state level for accountability and sensitivity of Public and Private health care in urban and rural areas
Orientation workshops on health rights for activists of like minded organisations. Conducting various surveys –
• Baseline and end-project surveys in our four field areas to assess the impact of our VHW-based First Contact Care work.
• Playing a leading role in several surveys in collaboration with other organizations to assess the availability of Primary Health Care Services at the village level;
‘Health Equity and Rights Watch’ project to document the statewide inequities in provisioning of health services and people’s access to these services in Maharashtra.
Preparation of relevant training material and awareness material on some important health issues like women’s reproductive health, exploitation of pharma industry, ill effects of alcoholism etc.
Preparation of • Standard Treatment Guidelines (STGs) for Medical Officers for diagnosis and treatment at
PHCs and Rural Hospitals and • Training manual for paramedical staff for rational use of drugs.
Health Inequities in Maharashtra
This report on ‘Health inequities in Maharashtra’ is the first in a series of studies being
done by Maharashtra Health Equity and Rights Watch, an activity of SATHI in collaboration with CEHAT and TISS. Given the widening socio-economic inequities in the current phase of neo-liberal globalisation, the situation regarding inequities in health status and access to health care has become a matter of concern. This report consists of papers which analyse the variety of existing data from an equity lens, to explore various dimensions of health inequity in the state.
The first chapter analyses socioeconomic inequities in the state of Maharashtra looking at regions as well as sub-groups of the population, using indicators of income, poverty and educational attainment among others. It is observed that the high per capita income in the state has not ‘trickled down’ to the poor, resulting in levels of poverty that are even higher than the national average. It also briefly traces the declining share of agricultural sector in the state’s economy and looks at increasing incidence of farmers’ suicides from a socio-economic as well as public health perspective.
The second chapter delineates inequities in access to health care. It gives the rank of Maharashtra across all states and union territories for access to selected healthcare services, along with selected health and nutrition outcomes. It analyses the inequities in health infrastructure, utilization of health care services and expenditure on health care in Maharashtra. The third chapter on inequities in health status gives information about inequities in morbidity, infant mortality, child mortality and life expectancy across various stratifiers such as caste, class, gender and geographical distribution. From both these chapters it emerges that despite public commitments to ensure health services for all, there are major inequities of health status and access to health care in the state.
Considering the uniqueness of gender as a cross-cutting stratifier, the fourth chapter studies gender and health and healthcare access inequities. It attempts to underscore horizontal and vertical inequities faced by women. Besides these two types of inequities faced by women, the chapter discusses the third unique inequity that women face - the additional health risks faced by them, such as gender violence of different kinds in society.
The final chapter of the report summarises the key findings emerging from the previous chapters. Time trends regarding inequities and convergence of inequities are also explored. In addition, policy recommendations have been made, pointing a direction to move towards more equitable healthcare delivery and health outcomes in Maharashtra.
This report, which attempts to develop the newly emerging field of Health equity in India, would be found useful by Health researchers, Public health professionals, Social science researchers, and activists concerned with health and social sector issues.
A report by SATHI
For Maharashtra Health Equity and Rights Watch