sanitation, drinking-water and health: achievements and
TRANSCRIPT

Sanitation, drinking-water and health:Achievements and challenges ahead
© World Health Organization 2017
ISBN 978 92 9061 791 4
Some rights reserved. This work is available under the Creative Commons Attribution-NonCommercial-ShareAlike 3.0 IGO licence (CC BY-NC-SA 3.0 IGO; https://creativecommons.org/licenses/by-nc-sa/3.0/igo).
Under the terms of this licence, you may copy, redistribute and adapt the work for non-commercial purposes, provided the work is appropriately cited, as indicated below. In any use of this work, there should be no suggestion that WHO endorses any specific organization, products or services. The use of the WHO logo is not permitted. If you adapt the work, then you must license your work under the same or equivalent Creative Commons licence. If you create a translation of this work, you should add the following disclaimer along with the suggested citation: “This translation was not created by the World Health Organization (WHO). WHO is not responsible for the content or accuracy of this translation. The original English edition shall be the binding and authentic edition”.
Any mediation relating to disputes arising under the licence shall be conducted in accordance with the mediation rules of the World Intellectual Property Organization (http://www.wipo.int/amc/en/mediation/rules).
Suggested citation. Sanitation, drinking-water and health: achievements and challenges ahead. Manila, Philippines. World Health Organization Regional Office for the Western Pacific; 2017. Licence: CC BY-NC-SA 3.0 IGO.
Cataloguing-in-Publication (CIP) data. 1. Conservation of natural resources. 2. Drinking water. 3. Hygiene. 4. Sanitation. I. World Health Organization Regional Office for the Western Pacific. (NLM Classification: WC765).
Sales, rights and licensing. To purchase WHO publications, see http://apps.who.int/bookorders. To submit requests for commercial use and queries on rights and licensing, see http://www.who.int/about/licensing.
For WHO Western Pacific Regional Publications, request for permission to reproduce should be addressed to Publications Office, World Health Organization, Regional Office for the Western Pacific, P.O. Box 2932, 1000, Manila, Philippines, Fax. No. (632) 521-1036, email: [email protected]
Third-party materials. If you wish to reuse material from this work that is attributed to a third party, such as tables, figures or images, it is your responsibility to determine whether permission is needed for that reuse and to obtain permission from the copyright holder. The risk of claims resulting from infringement of any third-party-owned component in the work rests solely with the user.
General disclaimers. The designations employed and the presentation of the material in this publication do not imply the expression of any opinion whatsoever on the part of WHO concerning the legal status of any country, territory, city or area or of its authorities, or concerning the delimitation of its frontiers or boundaries. Dotted and dashed lines on maps represent approximate border lines for which there may not yet be full agreement.
The mention of specific companies or of certain manufacturers’ products does not imply that they are endorsed or recommended by WHO in preference to others of a similar nature that are not mentioned. Errors and omissions excepted, the names of proprietary products are distinguished by initial capital letters.
All reasonable precautions have been taken by WHO to verify the information contained in this publication. However, the published material is being distributed without warranty of any kind, either expressed or implied. The responsibility for the interpretation and use of the material lies with the reader. In no event shall WHO be liable for damages arising from its use.
For inquiries and request for WHO Western Pacific Regional Publications, please contact the Publications Office, World Health Organization, Regional Office for the Western Pacific, P.O. Box 2932, 1000, Manila, Philippines, Fax. No. (632) 521-1036, email: [email protected]
iii
Contents
Abbreviations . . . . . . . . . . . . . . . . . . . . . . . . . . . . . . . . . . . . . . . . . . . . . . . . . . . . . . . . . . . . . . . . . . . .viAcknowledgements . . . . . . . . . . . . . . . . . . . . . . . . . . . . . . . . . . . . . . . . . . . . . . . . . . . . . . . . . . . . . viiSummary . . . . . . . . . . . . . . . . . . . . . . . . . . . . . . . . . . . . . . . . . . . . . . . . . . . . . . . . . . . . . . . . . . . . . . . .viii1. Introduction . . . . . . . . . . . . . . . . . . . . . . . . . . . . . . . . . . . . . . . . . . . . . . . . . . . . . . . . . . . . . . . . 1 1.1 Justification . . . . . . . . . . . . . . . . . . . . . . . . . . . . . . . . . . . . . . . . . . . . . . . . . . . . . . . . . . . . . 1 1.2 Objectives . . . . . . . . . . . . . . . . . . . . . . . . . . . . . . . . . . . . . . . . . . . . . . . . . . . . . . . . . . . . . . . 2 1.3 What is being measured? . . . . . . . . . . . . . . . . . . . . . . . . . . . . . . . . . . . . . . . . . . . . . . . . 22. The TWG WSH countries . . . . . . . . . . . . . . . . . . . . . . . . . . . . . . . . . . . . . . . . . . . . . . . . . . . . . 5 2.1 Overview of TWG WSH countries . . . . . . . . . . . . . . . . . . . . . . . . . . . . . . . . . . . . . . . . . 5 2.2 Overall status of sanitation and drinking-water in TWG WSH countries . . . . . 63. Sanitation coverage in TWG WSH countries . . . . . . . . . . . . . . . . . . . . . . . . . . . . . . . . . 9 3.1 Current status . . . . . . . . . . . . . . . . . . . . . . . . . . . . . . . . . . . . . . . . . . . . . . . . . . . . . . . . . . . 9 3.2 Sanitation inequities . . . . . . . . . . . . . . . . . . . . . . . . . . . . . . . . . . . . . . . . . . . . . . . . . . . . 12 3.2.1 Urban and rural disparities . . . . . . . . . . . . . . . . . . . . . . . . . . . . . . . . . . . . . . . 12 3.2.2 Economic and social inequities in sanitation coverage . . . . . . . . . . . . . 134. Drinking-water coverage in TWG WSH countries . . . . . . . . . . . . . . . . . . . . . . . . . . . 15 4.1 Current status . . . . . . . . . . . . . . . . . . . . . . . . . . . . . . . . . . . . . . . . . . . . . . . . . . . . . . . . . . 15 4.2 Drinking-water inequities . . . . . . . . . . . . . . . . . . . . . . . . . . . . . . . . . . . . . . . . . . . . . . . 17 4.2.1 Urban and rural disparities . . . . . . . . . . . . . . . . . . . . . . . . . . . . . . . . . . . . . . . 17 4.2.2 Economic and social inequities in drinking-water coverage . . . . . . . . 195. The MDG drinking-water and sanitation target . . . . . . . . . . . . . . . . . . . . . . . . . . . . 21 5.1 Achieving the MDG sanitation target . . . . . . . . . . . . . . . . . . . . . . . . . . . . . . . . . . . . 21 5.2 Achieving the MDG drinking-water target . . . . . . . . . . . . . . . . . . . . . . . . . . . . . . . 226. Sustainable Development Goals and targets . . . . . . . . . . . . . . . . . . . . . . . . . . . . . . 257. Health and economic development in drinking-water and sanitation . . . . . 31 7.1 Health . . . . . . . . . . . . . . . . . . . . . . . . . . . . . . . . . . . . . . . . . . . . . . . . . . . . . . . . . . . . . . . . . . 31 7.2 Drinking-water and sanitation in health-care facilities . . . . . . . . . . . . . . . . . . . . 33 7.3 The challenge of urbanization in TWG WSH countries . . . . . . . . . . . . . . . . . . . . 34References . . . . . . . . . . . . . . . . . . . . . . . . . . . . . . . . . . . . . . . . . . . . . . . . . . . . . . . . . . . . . . . . . . . . . . . 35
AnnexesAnnex 1. Definitions of the post-2015 terms proposed by the JMP
(WHO and UNICEF, 2017) . . . . . . . . . . . . . . . . . . . . . . . . . . . . . . . . . . . . . . . . . . . . . . . . 37Annex 2. Country and regional estimates of improved sanitation coverage
in TWG WSH countries . . . . . . . . . . . . . . . . . . . . . . . . . . . . . . . . . . . . . . . . . . . . . . . . . . 39Annex 3. Country and regional estimates of improved drinking-water coverage
in TWG WSH countries . . . . . . . . . . . . . . . . . . . . . . . . . . . . . . . . . . . . . . . . . . . . . . . . . . 41
iv
FiguresFigure 1. Proportion of urban, rural and total populations
in TWG WSH region using improved sanitation, 1990 and 2015 . . . . . . . . . . . . 6Figure 2. Proportion of urban, rural and total populations in TWG WSH region
using improved drinking-water sources, 1990 and 2015 . . . . . . . . . . . . . . . . . . . 7Figure 3. Proportion of population in TWG WSH region using improved, shared,
or unimproved sanitation facilities, or practising open defecation, 2015 . . . 7Figure 4. Proportion of population in TWG WSH region using different types
of drinking-water facilities, 2015 . . . . . . . . . . . . . . . . . . . . . . . . . . . . . . . . . . . . . . . . . . 8Figure 5. Proportion of population in TWG WSH region using improved,
shared, or unimproved sanitation facilities, or practising open defecation, 1990 and 2015 . . . . . . . . . . . . . . . . . . . . . . . . . . . . . . . . . . . . . . . . . . . . . . . 9
Figure 6. Number of people in TWG WSH region using improved, shared, or unimproved sanitation facilities, or practising open defecation, 1990–2012 . . . . . . . . . . . . . . . . . . . . . . . . . . . . . . . . . . . . . . . . . . . . . . . . . . . . . . . . . . . . .10
Figure 7. Proportion of populations in TWG WSH countries using improved, shared, or unimproved sanitation facilities, or practising open defecation, 2015 . . . . . . . . . . . . . . . . . . . . . . . . . . . . . . . . . . . . . . . . . . . . . . . . . .11
Figure 8. Distribution of population in TWG WSH region not using improved sanitation facilities, by country, 2015 . . . . . . . . . . . . . . . . . . . . . . . . . .11
Figure 9. Proportion of urban and rural populations in TWG WSH region using improved, shared, or unimproved sanitation facilities, or practising open defecation, 1990 and 2015 . . . . . . . . . . . . . . . . . . . . . . . . . . . . . . . . . . . . . . . .12
Figure 10. Proportion of urban and rural populations in TWG WSH countries using improved sanitation, 2015 . . . . . . . . . . . . . . . . . . . . . . . . . . . . . . . . . . . . . . . .12
Figure 11. Urban and rural populations in TWG WSH region not using improved sanitation, 1990–2015 . . . . . . . . . . . . . . . . . . . . . . . . . . . . . . . . . . . . . . . .13
Figure 12. Percentage of population using improved, shared, or unimproved sanitation facilities, or using open defecation by wealth quintile, Lao People’s Democratic Republic, 2012 . . . . . . . . . . . . . . . . . . . . . . . . . . . . . . . . .14
Figure 13. Percentage of population using improved, shared, or unimproved sanitation facilities or using open defecation by education level, Lao People’s Democratic Republic, 2012 . . . . . . . . . . . . . . . . . . . . . . . . . . . . . . . . .14
Figure 14. Proportion of population in TWG WSH region using different types of drinking-water sources, 1990 and 2015 . . . . . . . . . . . . . . . . . . . . . . . . .15
Figure 15. Number of people in TWG WSH region using different types of drinking-water sources, 1990–2015 . . . . . . . . . . . . . . . . . . . . . . . . . . . . . . . . . . .16
Figure 16. Proportion of populations in TWG WSH countries using different types of drinking-water sources, 2015 . . . . . . . . . . . . . . . . . . . . . . . . . . . . . . . . . . .16
Figure 17. Distribution of population in TWG WSH region not using improved drinking-water sources, by country, 2015 . . . . . . . . . . . . . . . . . . . . . .17
Figure 18. Proportion of urban and rural populations in TWG WSH region using different drinking-water sources, 1990 and 2015 . . . . . . . . . . . . . . . . . . .18
v
Figure 19. Proportion of urban and rural populations in TWG WSH countries using improved drinking-water sources, 2015 . . . . . . . . . . . . . . . . . . . . . . . . . . . .18
Figure 20. Urban and rural populations in TWG WSH region not using improved drinking-water sources, 1990–2015 . . . . . . . . . . . . . . . . . . . . . . . . . . .19
Figure 21. Percentage of population using different types of drinking-water sources by wealth quintile, Lao People’s Democratic Republic, 2012 . . . . . .19
Figure 22. Percentage of population using different types of drinking-water sources by education level, Lao People’s Democratic Republic, 2012 . . . . . .20
Figure 23. Change in the use of improved sanitation from 1990 to 2015 and MDG targets in TWG WSH region . . . . . . . . . . . . . . . . . . . . . . . . . . . . . . . . . . . .21
Figure 24. Difference between sanitation coverage in 2015 and the MDG sanitation target in TWG WSH countries . . . . . . . . . . . . . . . . . . . . . . . . . . . . . . . . . . . . . . . . . . . .22
Figure 25. Change in the use of improved drinking-water sources from 1990 and 2015 and MDG targets in TWG WSH region . . . . . . . . . . . . . . . . . . . . . . . . . .23
Figure 26. Difference between drinking-water coverage in 2015 and the MDG drinking-water target in TWG WSH countries . . . . . . . . . . . . . . . . . . . . . . . . . . . .23
Figure 27. Distribution of causes of death among children under 5 years old in TWG WSH countries, 2013 . . . . . . . . . . . . . . . . . . . . . . . . . . . . . . . . . . . . . . . . . . . .31
Figure 28. Deaths of children under 5 years old attributable to drinking-water, sanitation and hygiene in TWG WSH countries, 2012 (per 100 000 population) . . . . . . . . . . . . . . . . . . . . . . . . . . . . . . . . . . . . . . . . . . . . . . . .32
Figure 29. Under-5 mortality rate (per 1000 live births), 1990 and 2013 . . . . . . . . . . . .32Figure 30. Use of improved drinking-water and sanitation compared
with under-5 mortality rate in TWG WSH countries, 2013 . . . . . . . . . . . . . . . . .33Figure 31. Urban and rural populations in TWG WSH region, 1990 and 2015 . . . . . . .34
TablesTable 1. Drinking-water and sanitation categories of technologies
according to the JMP . . . . . . . . . . . . . . . . . . . . . . . . . . . . . . . . . . . . . . . . . . . . . . . . . . . . 2Table 2. Proposed indicators for monitoring sanitation services . . . . . . . . . . . . . . . . . . .26Table 3. Proposed indicators for monitoring drinking-water services . . . . . . . . . . . . . .27Table 4. Proposed indicators for monitoring hygiene . . . . . . . . . . . . . . . . . . . . . . . . . . . . .28Table 5. Contribution of JMP to SDG target 6.3 . . . . . . . . . . . . . . . . . . . . . . . . . . . . . . . . . . .29
vi
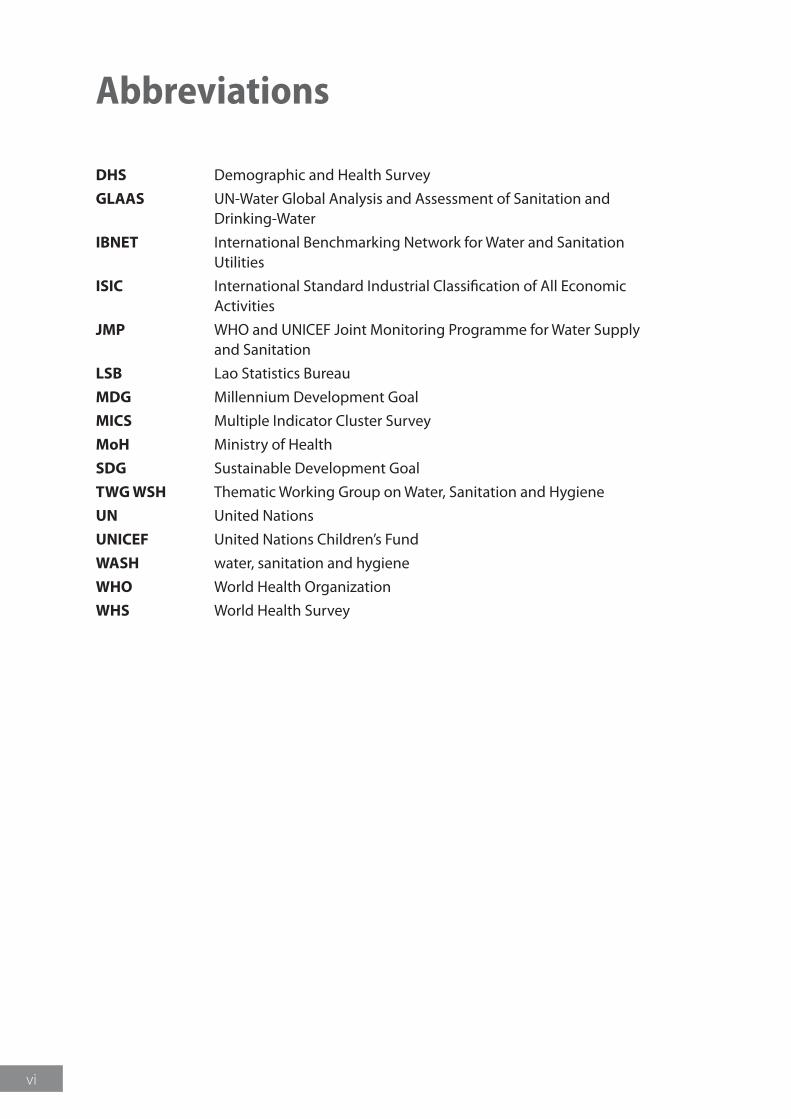
Abbreviations
DHS Demographic and Health SurveyGLAAS UN-Water Global Analysis and Assessment of Sanitation and
Drinking-WaterIBNET International Benchmarking Network for Water and Sanitation
UtilitiesISIC International Standard Industrial Classification of All Economic
ActivitiesJMP WHO and UNICEF Joint Monitoring Programme for Water Supply
and SanitationLSB Lao Statistics BureauMDG Millennium Development GoalMICS Multiple Indicator Cluster SurveyMoH Ministry of Health SDG Sustainable Development GoalTWG WSH Thematic Working Group on Water, Sanitation and HygieneUN United NationsUNICEF United Nations Children’s FundWASH water, sanitation and hygieneWHO World Health OrganizationWHS World Health Survey
vii
Acknowledgements
This document was prepared by the World Health Organization (WHO) for the Thematic Working Group on Water, Sanitation and Hygiene (TWG WSH).
Many thanks are extended to Dr Rokho Kim, Dr Mohd Nasir Hassan and Ms Seoyeon Jeong of the WHO Regional Office for the Western Pacific for their support with the preparation of this document. Special mention is made to Mr Alexander von Hildebrand of the WHO Regional Office for the Western Pacific for his overall management of the project. Without his leadership, managerial guidance and quality assurance, preparing this document would not have been possible.
Mr Jose Hueb was the author of the document.
viii
Summary
This report deals primarily with the analysis of the drinking-water and sanitation situation in the member countries of the Thematic Working Group on Water, Sanitation and Hygiene (TWG WSH), based on statistics published by the World Health Organization (WHO) and United Nations Children’s Fund (UNICEF) Joint Monitoring Programme for Water Supply and Sanitation (JMP) updated in 2015. This document also provides key information on selected health and development issues for TWG WSH member countries. The member countries covered in this report are: Brunei Darussalam, Cambodia, China, Indonesia, Japan, the Lao People’s Democratic Republic, Malaysia, Mongolia, Myanmar, the Philippines, the Republic of Korea, Singapore, Thailand and Viet Nam. Previous documents prepared by WHO for the TWG WSH include extensive analyses of the drinking-water, sanitation and hygiene sector as a whole, based on country-level information.
A key finding of this report is that the TWG WSH region has succeeded in meeting the Millennium Development Goal (MDG) target for drinking-water and sanitation, which is to “halve, by 2015, the proportion of the population without sustainable access to safe drinking-water and basic sanitation” (UN, 2017). Individually, nine TWG WSH countries achieved the MDG sanitation target, but four countries (i.e. Cambodia, Indonesia, Mongolia and the Philippines) did not. All TWG WSH countries met the MDG drinking-water target except Mongolia, which fell short of the target by 13 percentage points.
Overall, 77% of people in the TWG WSH region are using improved sanitation facilities, whereas 94% are using improved drinking-water sources (UNICEF and WHO, 2015).
Despite an impressive effort made to provide drinking-water and sanitation infrastructure to the residents in this region, about one quarter of the population still lacks access to improved sanitation and 7% lacks access to improved drinking-water.
Water-related diseases, including diarrhoeal diseases, are significant causes of death among children under 5 years old in the region. Almost 30 000 people in the TWG WSH region, especially children under 5, die each year due to water, sanitation and hygiene-related diseases (WHO, 2014).
This document includes the following main sections:
Section 1: Introduction
This section provides the rationale for preparing this document as well as its objectives and the overall characterization of the indicators under presentation according to the WHO and UNICEF JMP.
ix
Section 2: The TWG WSH countries
This section presents an overall analysis of the status of drinking-water and sanitation in TWG WSH countries, showing how drinking-water and sanitation coverage evolved in the TWG WSH region from 1990 to 2015.
Section 3: Sanitation coverage in the TWG WSH countries
This section provides a more detailed analysis of the status of access to improved sanitation in TWG WSH countries, including key graphs showing how the status of these countries evolved over time. It includes statistics exposing different aspects of equity in sanitation service provision.
Section 4: Drinking-water coverage in TWG WSH countries
This section provides a detailed analysis of access to improved drinking-water in TWG WSH countries and presents statistics on different aspects of equity in drinking-water use.
Section 5: The MDG drinking-water and sanitation target
This section provides an analysis of the progress in achieving the MDG drinking-water and sanitation target for the region and analyses the individual progress of TWG WSH countries.
Section 6: Sustainable Development Goals and targets
This section provides an overview of the 2030 Sustainable Development Goals (SDGs) drinking-water and sanitation targets and insight into the implications to the region of coping with such targets.
Section 7: Health and economic development in drinking-water and sanitation
This section summarizes improved drinking-water and sanitation coverage in the region and includes a brief analysis of the health and social situation of the region. An attempt is made to demonstrate the link between drinking-water and sanitation and the health status of the population in the region.
Annex 1: Definitions of the post-2015 terms proposed by the JMP
This list presents the proposed definitions associated with the SDG drinking-water and sanitation targets, taking into account the definitions adopted during the MDG era.
Annex 2: Country and regional estimates of improved sanitation coverage in TWG WSH countries
This table summarizes the status of sanitation coverage in the TWG WSH region and in each country. It includes statistics from 1990, 2000, 2010 and 2015.
Annex 3: Country and regional estimates of improved drinking-water coverage in TWG WSH countries
This table summarizes the status of drinking-water coverage in the TWG WSH region and in each country. It includes statistics from 1990, 2000, 2010 and 2015.
© W
HO
/Yos
hi S
him
izu
Access to water for laundry and bathing
1
1.1 Justification
The Regional Forum on Environment and Health in Southeast and East Asian Countries is a platform that brings together the ministries of environment and ministries of health of member countries at regular intervals to fulfil the vision and objectives of its membership. The ministers of environment and ministers of health nominate high-level officials to represent their respective ministries. The high-level officials also serve as national communication focal points for the Regional Forum on Environment and Health and liaise with the Secretariat of the Regional Forum (United Nations Environment Programme and the World Health Organization). The membership of the Regional Forum comprises ten Southeast Asian countries (Brunei Darussalam, Cambodia, Indonesia, Lao People’s Democratic Republic, Malaysia, Myanmar, Philippines, Singapore, Thailand and Viet Nam) and four East Asian countries (China, Japan, Mongolia and the Republic of Korea).
The objective of the Regional Forum on Environment and Health is to strengthen the cooperation of the ministries responsible for environment and health within their respective countries by providing a mechanism for sharing knowledge and experiences, improving policy and regulatory frameworks at the national and regional levels, and promoting the implementation of integrated environmental health strategies and regulations.
The Thematic Working Group on Water, Sanitation and Hygiene (TWG WSH) is one of the seven intercountry thematic working groups established by the First Regional Forum on Environment and Health in Southeast and East Asian Countries on 9 August 2007 in Bangkok, Thailand. Currently, 13 of the 14 Regional Forum countries are collaborating members of the TWG WSH. This document provides an overview of the status of drinking-water and sanitation in member countries of the Thematic Working Group on Water, Sanitation and Hygiene (TWG WSH) based on the coverage estimates published by the World Health Organization (WHO) and United Nations Children’s Fund (UNICEF) Joint Monitoring Programme for Water Supply and Sanitation (JMP) in 2015. The document also provides key statistics on health and development in the region.
The drinking-water and sanitation estimates presented in this document are calculated from national censuses and nationally representative sample household surveys, including Demographic and Health Surveys (DHS), Multiple Indicator Cluster Surveys (MICS) and many other surveys conducted by national statistics offices.
1 Introduction
2
The countries included in this analysis are current members of the TWG WSH, namely: Brunei Darussalam, Cambodia, China, Indonesia, Japan, the Lao People’s Democratic Republic, Malaysia, Mongolia, Myanmar, the Philippines, the Republic of Korea, Singapore, Thailand and Viet Nam. (Note that Brunei Darussalam does not appear in most graphs as the JMP does not have statistics on drinking-water and sanitation coverage for this country.)
1.2 ObjectivesThe objectives of this document are:
zz to provide an overview of the status of sanitation, drinking-water and hygiene in TWG WSH countries;
zz to look into the implications for TWG WSH countries of the 2030 Sustainable Development Goals (SDGs) targets on water and sanitation;
zz to look into key health and development indicators to help characterize the drinking-water and sanitation status of TWG WSH countries; and
zz to provide the basis for discussion on how to accelerate investment to improve drinking-water, sanitation and hygiene in the TWG WSH region.
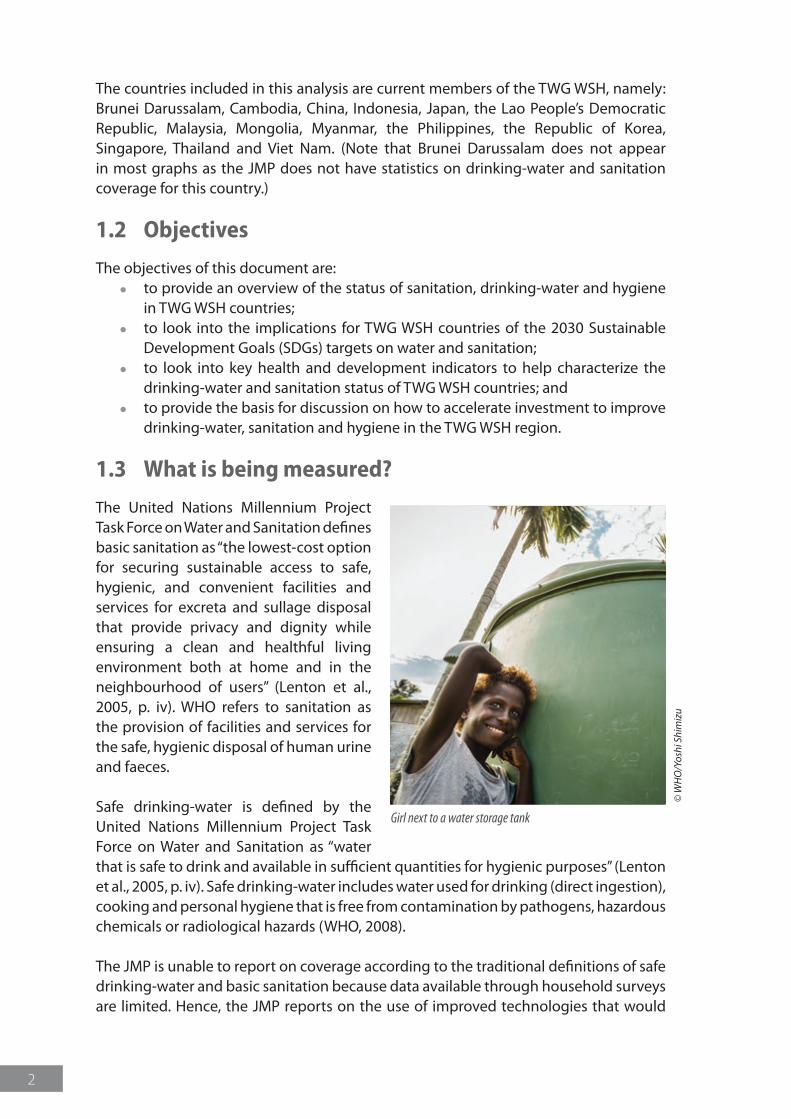
1.3 What is being measured?The United Nations Millennium Project Task Force on Water and Sanitation defines basic sanitation as “the lowest-cost option for securing sustainable access to safe, hygienic, and convenient facilities and services for excreta and sullage disposal that provide privacy and dignity while ensuring a clean and healthful living environment both at home and in the neighbourhood of users” (Lenton et al., 2005, p. iv). WHO refers to sanitation as the provision of facilities and services for the safe, hygienic disposal of human urine and faeces.
Safe drinking-water is defined by the United Nations Millennium Project Task Force on Water and Sanitation as “water that is safe to drink and available in sufficient quantities for hygienic purposes” (Lenton et al., 2005, p. iv). Safe drinking-water includes water used for drinking (direct ingestion), cooking and personal hygiene that is free from contamination by pathogens, hazardous chemicals or radiological hazards (WHO, 2008).
The JMP is unable to report on coverage according to the traditional definitions of safe drinking-water and basic sanitation because data available through household surveys are limited. Hence, the JMP reports on the use of improved technologies that would
© W
HO
/Yos
hi S
him
izu
Girl next to a water storage tank
3
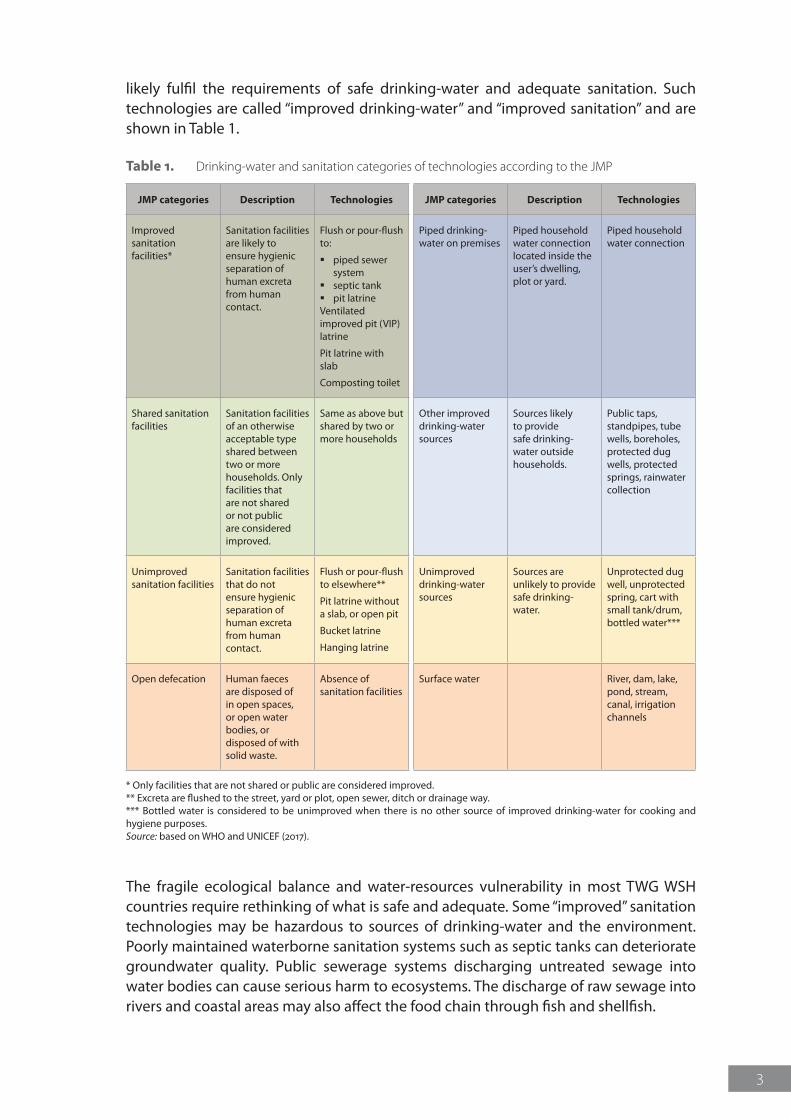
likely fulfil the requirements of safe drinking-water and adequate sanitation. Such technologies are called “improved drinking-water” and “improved sanitation” and are shown in Table 1.
The fragile ecological balance and water-resources vulnerability in most TWG WSH countries require rethinking of what is safe and adequate. Some “improved” sanitation technologies may be hazardous to sources of drinking-water and the environment. Poorly maintained waterborne sanitation systems such as septic tanks can deteriorate groundwater quality. Public sewerage systems discharging untreated sewage into water bodies can cause serious harm to ecosystems. The discharge of raw sewage into rivers and coastal areas may also affect the food chain through fish and shellfish.
Table 1. Drinking-water and sanitation categories of technologies according to the JMP
JMP categories Description Technologies JMP categories Description Technologies
Improved sanitation facilities*
Sanitation facilities are likely to ensure hygienic separation of human excreta from human contact.
Flush or pour-flush to:
� piped sewer system
� septic tank � pit latrine
Ventilated improved pit (VIP) latrine
Pit latrine with slab
Composting toilet
Piped drinking-water on premises
Piped household water connection located inside the user’s dwelling, plot or yard.
Piped household water connection
Shared sanitation facilities
Sanitation facilities of an otherwise acceptable type shared between two or more households. Only facilities that are not shared or not public are considered improved.
Same as above but shared by two or more households
Other improved drinking-water sources
Sources likely to provide safe drinking-water outside households.
Public taps, standpipes, tube wells, boreholes, protected dug wells, protected springs, rainwater collection
Unimproved sanitation facilities
Sanitation facilities that do not ensure hygienic separation of human excreta from human contact.
Flush or pour-flush to elsewhere**
Pit latrine without a slab, or open pit
Bucket latrine
Hanging latrine
Unimproved drinking-water sources
Sources are unlikely to provide safe drinking-water.
Unprotected dug well, unprotected spring, cart with small tank/drum, bottled water***
Open defecation Human faeces are disposed of in open spaces, or open water bodies, or disposed of with solid waste.
Absence of sanitation facilities
Surface water River, dam, lake, pond, stream, canal, irrigation channels
* Only facilities that are not shared or public are considered improved.** Excreta are flushed to the street, yard or plot, open sewer, ditch or drainage way.*** Bottled water is considered to be unimproved when there is no other source of improved drinking-water for cooking and hygiene purposes.Source: based on WHO and UNICEF (2017).
© W
HO
/Yos
hi S
him
izu
Children playing near a stream
5
2 The TWG WSH countries
2.1 Overview of TWG WSH countries
Australia
China
Mongolia
Japan
Viet Nam
Malaysia
Papua New Guinea
New Zealand
CambodiaPhilippines
Lao People'sDemocratic Republic
FijiVanuatu
Solomon Islands
Samoa
Palau
Kiribati
Niue
Singapore
Tonga
Tuvalu
Federated States ofMicronesia
Marshall Islands
Cook Islands
Tokelau
Nauru
Republic ofKorea
BruneiDarussalam
Macao SARHong Kong SAR
Northern Mariana Islands
Guam
New Caledonia
Wallis & Futuna American SamoaFrench Polynesia
Pitcairn IslandsAustralia
China
Mongolia
Japan
Viet Nam
Malaysia
Papua New Guinea
New Zealand
CambodiaPhilippines
Lao People'sDemocratic Republic
FijiVanuatu
Solomon Islands
Samoa
Palau
Kiribati
Niue
Singapore
Tonga
Tuvalu
Federated States ofMicronesia
Marshall Islands
Cook Islands
Tokelau
Nauru
Republic ofKorea
BruneiDarussalam
Macao SARHong Kong SAR
Northern Mariana Islands
Guam
New Caledonia
Wallis & Futuna American SamoaFrench Polynesia
Pitcairn Islands
The boundaries and names shown and the designations used on this map do not imply the expression of any opinion whatsoever on the part ofthe World Health Organization concerning the legal status of any country, territory, city or area or of its authorities, or concerning the delimitationof its frontiers or boundaries. Dotted lines on maps represent approximate border lines for which there may not yet be full agreement.© WHO Regional Office for the Western Pacific 2009. All rights reserved.
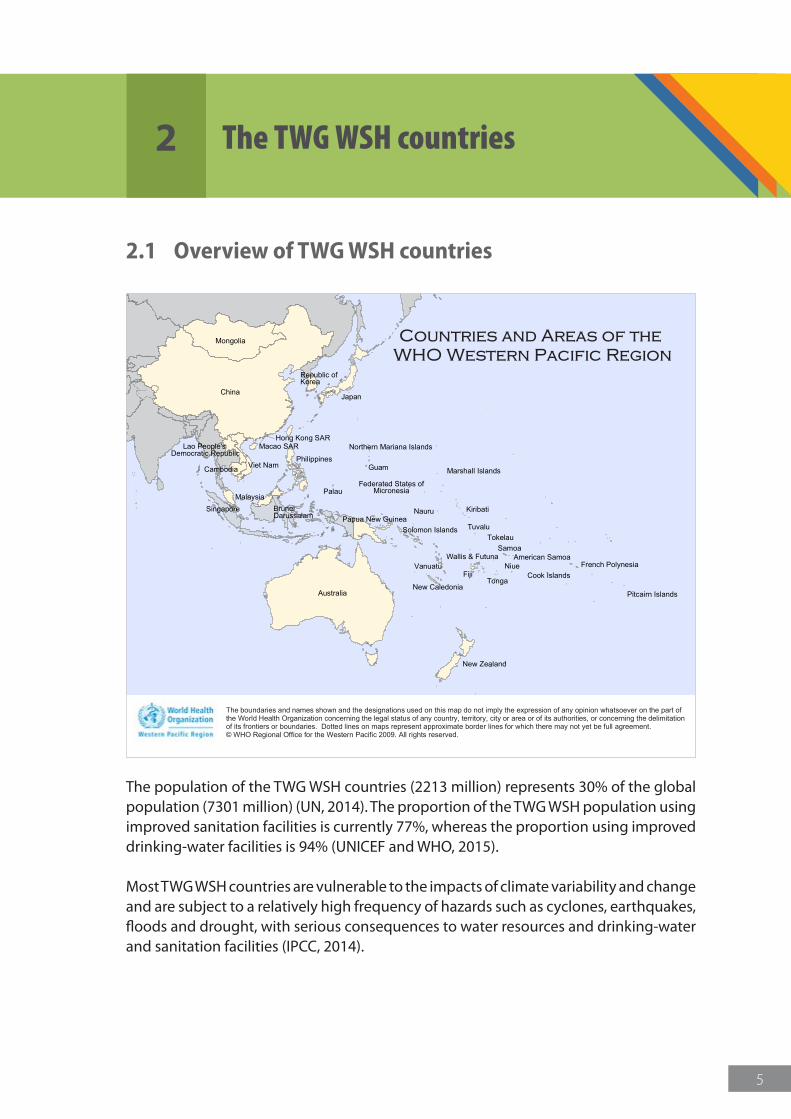
The population of the TWG WSH countries (2213 million) represents 30% of the global population (7301 million) (UN, 2014). The proportion of the TWG WSH population using improved sanitation facilities is currently 77%, whereas the proportion using improved drinking-water facilities is 94% (UNICEF and WHO, 2015).
Most TWG WSH countries are vulnerable to the impacts of climate variability and change and are subject to a relatively high frequency of hazards such as cyclones, earthquakes, floods and drought, with serious consequences to water resources and drinking-water and sanitation facilities (IPCC, 2014).
6
2.2 Overall status of sanitation and drinking-water in TWG WSH countriesInadequate disposal of human excreta, lack of safe drinking-water and poor hygiene are associated with a range of water-related diseases, including diarrhoeal diseases. Improved sanitation and drinking-water and sound hygiene behaviours can significantly reduce the prevalence of diarrhoeal diseases, and significantly lessen the adverse health impacts of other disorders responsible for death and disease among millions of children in the TWG WSH region.
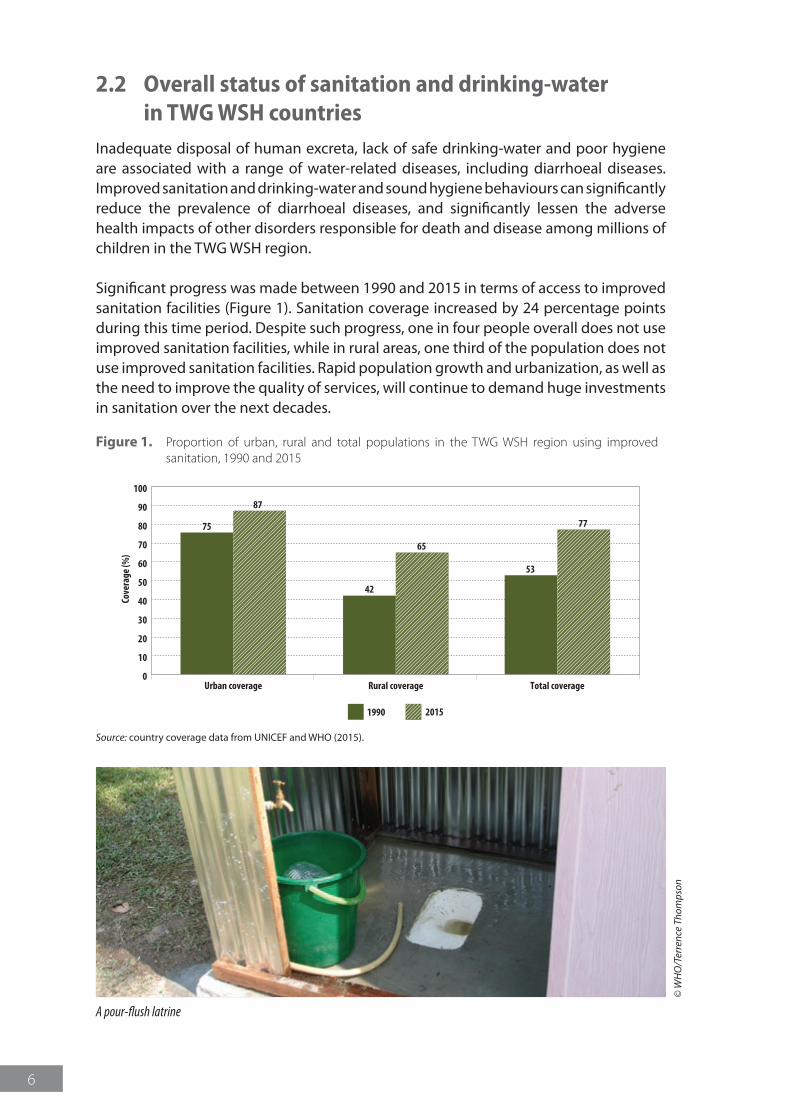
Significant progress was made between 1990 and 2015 in terms of access to improved sanitation facilities (Figure 1). Sanitation coverage increased by 24 percentage points during this time period. Despite such progress, one in four people overall does not use improved sanitation facilities, while in rural areas, one third of the population does not use improved sanitation facilities. Rapid population growth and urbanization, as well as the need to improve the quality of services, will continue to demand huge investments in sanitation over the next decades.
Figure 1. Proportion of urban, rural and total populations in the TWG WSH region using improved sanitation, 1990 and 2015
0
10
20
30
40
50
60
70
80
90
100
Urban coverage
Cove
rage
(%)
Rural coverage
1990 2015
75
87
42
65
53
77
Total coverage
Source: country coverage data from UNICEF and WHO (2015).
© W
HO
/Ter
renc
e Th
omps
on
A pour-flush latrine
7
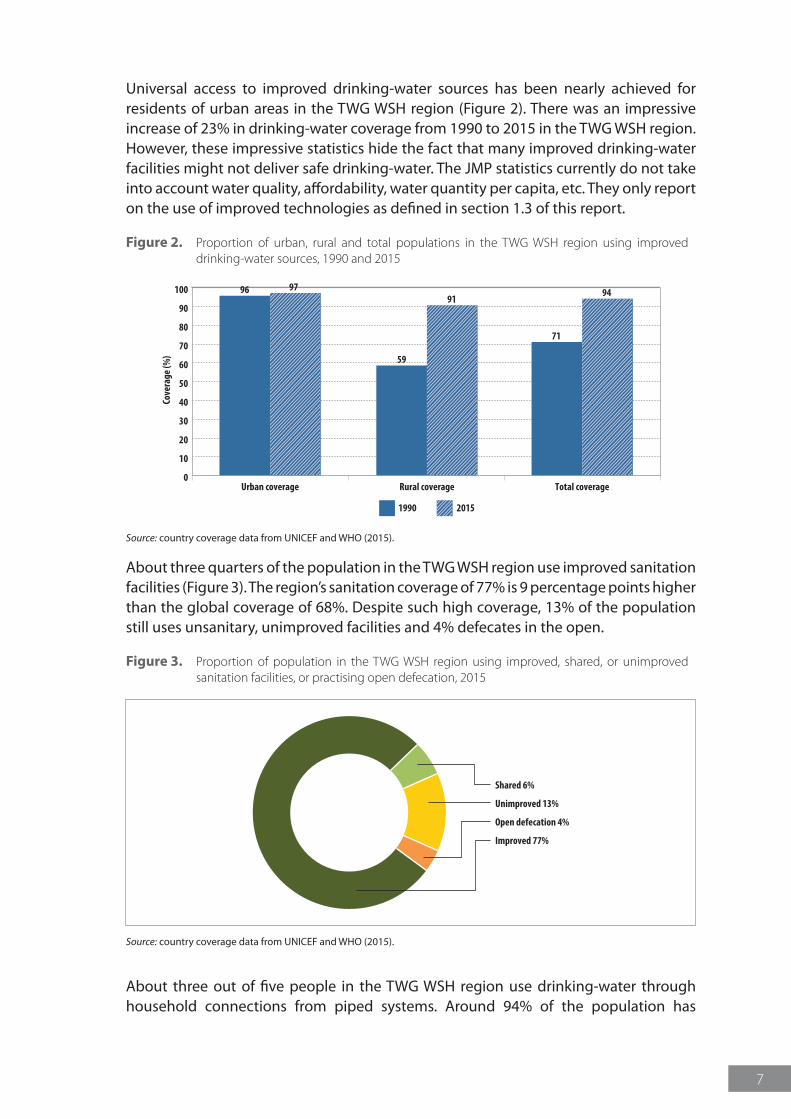
Universal access to improved drinking-water sources has been nearly achieved for residents of urban areas in the TWG WSH region (Figure 2). There was an impressive increase of 23% in drinking-water coverage from 1990 to 2015 in the TWG WSH region. However, these impressive statistics hide the fact that many improved drinking-water facilities might not deliver safe drinking-water. The JMP statistics currently do not take into account water quality, affordability, water quantity per capita, etc. They only report on the use of improved technologies as defined in section 1.3 of this report.
Figure 2. Proportion of urban, rural and total populations in the TWG WSH region using improved drinking-water sources, 1990 and 2015
0
10
20
30
40
50
60
70
80
90
100
Urban coverage
Cove
rage
(%)
Rural coverage
1990 2015
96 97
59
91
71
94
Total coverage
Source: country coverage data from UNICEF and WHO (2015).
About three quarters of the population in the TWG WSH region use improved sanitation facilities (Figure 3). The region’s sanitation coverage of 77% is 9 percentage points higher than the global coverage of 68%. Despite such high coverage, 13% of the population still uses unsanitary, unimproved facilities and 4% defecates in the open.
Figure 3. Proportion of population in the TWG WSH region using improved, shared, or unimproved sanitation facilities, or practising open defecation, 2015
Improved 77%
Shared 6%
Unimproved 13%
Open defecation 4%
Source: country coverage data from UNICEF and WHO (2015).
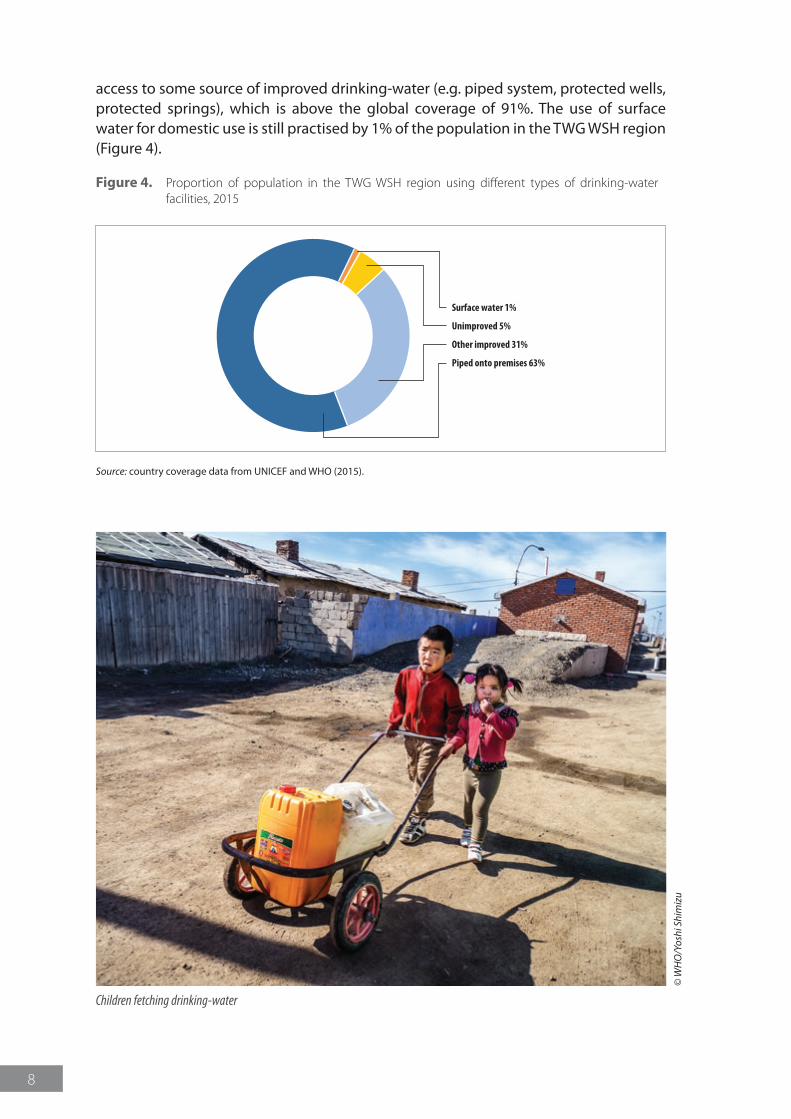
About three out of five people in the TWG WSH region use drinking-water through household connections from piped systems. Around 94% of the population has
8
access to some source of improved drinking-water (e.g. piped system, protected wells, protected springs), which is above the global coverage of 91%. The use of surface water for domestic use is still practised by 1% of the population in the TWG WSH region (Figure 4).
Figure 4. Proportion of population in the TWG WSH region using different types of drinking-water facilities, 2015
Piped onto premises 63%
Surface water 1%
Unimproved 5%
Other improved 31%
Source: country coverage data from UNICEF and WHO (2015).
© W
HO
/Yos
hi S
him
izu
Children fetching drinking-water
9
3 Sanitation coverage in TWG WSH countries
3.1 Current status
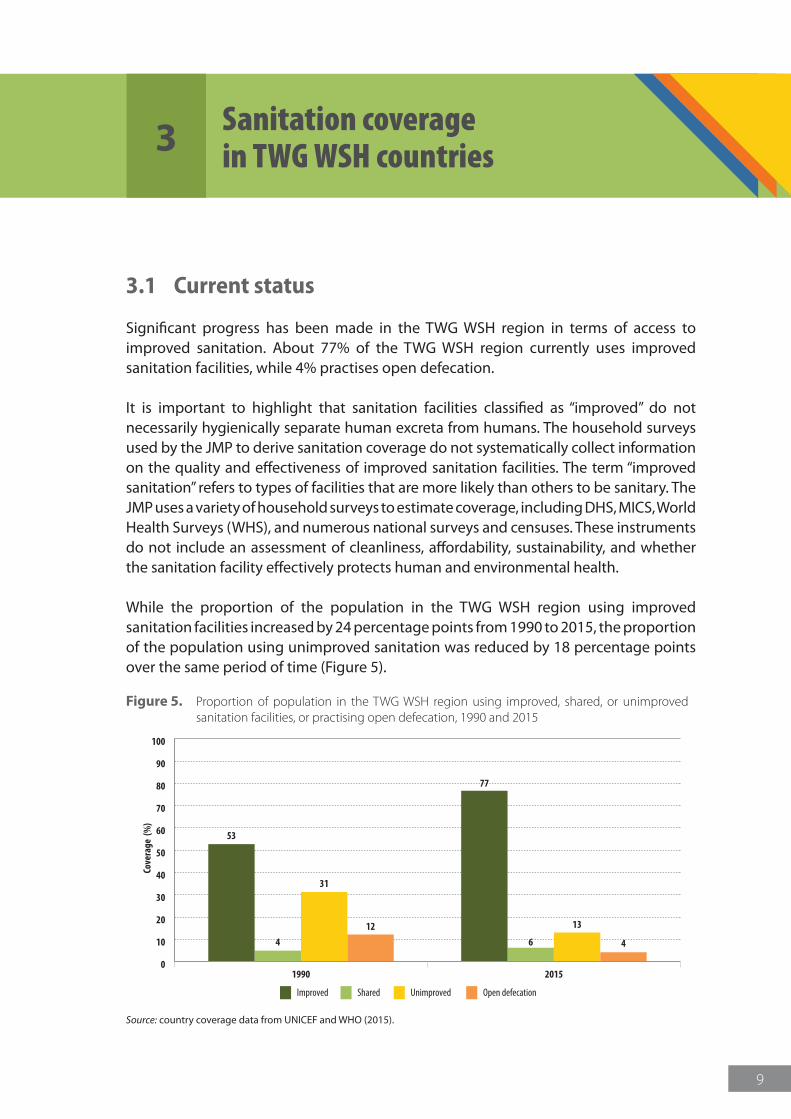
Significant progress has been made in the TWG WSH region in terms of access to improved sanitation. About 77% of the TWG WSH region currently uses improved sanitation facilities, while 4% practises open defecation.
It is important to highlight that sanitation facilities classified as “improved” do not necessarily hygienically separate human excreta from humans. The household surveys used by the JMP to derive sanitation coverage do not systematically collect information on the quality and effectiveness of improved sanitation facilities. The term “improved sanitation” refers to types of facilities that are more likely than others to be sanitary. The JMP uses a variety of household surveys to estimate coverage, including DHS, MICS, World Health Surveys (WHS), and numerous national surveys and censuses. These instruments do not include an assessment of cleanliness, affordability, sustainability, and whether the sanitation facility effectively protects human and environmental health.
While the proportion of the population in the TWG WSH region using improved sanitation facilities increased by 24 percentage points from 1990 to 2015, the proportion of the population using unimproved sanitation was reduced by 18 percentage points over the same period of time (Figure 5).
Figure 5. Proportion of population in the TWG WSH region using improved, shared, or unimproved sanitation facilities, or practising open defecation, 1990 and 2015
0
10
20
30
40
50
60
70
80
90
100
Improved Shared Unimproved Open defecation
1990
Cove
rage
(%
)
2015
4
31
12
53
6
13
4
77
Source: country coverage data from UNICEF and WHO (2015).
10
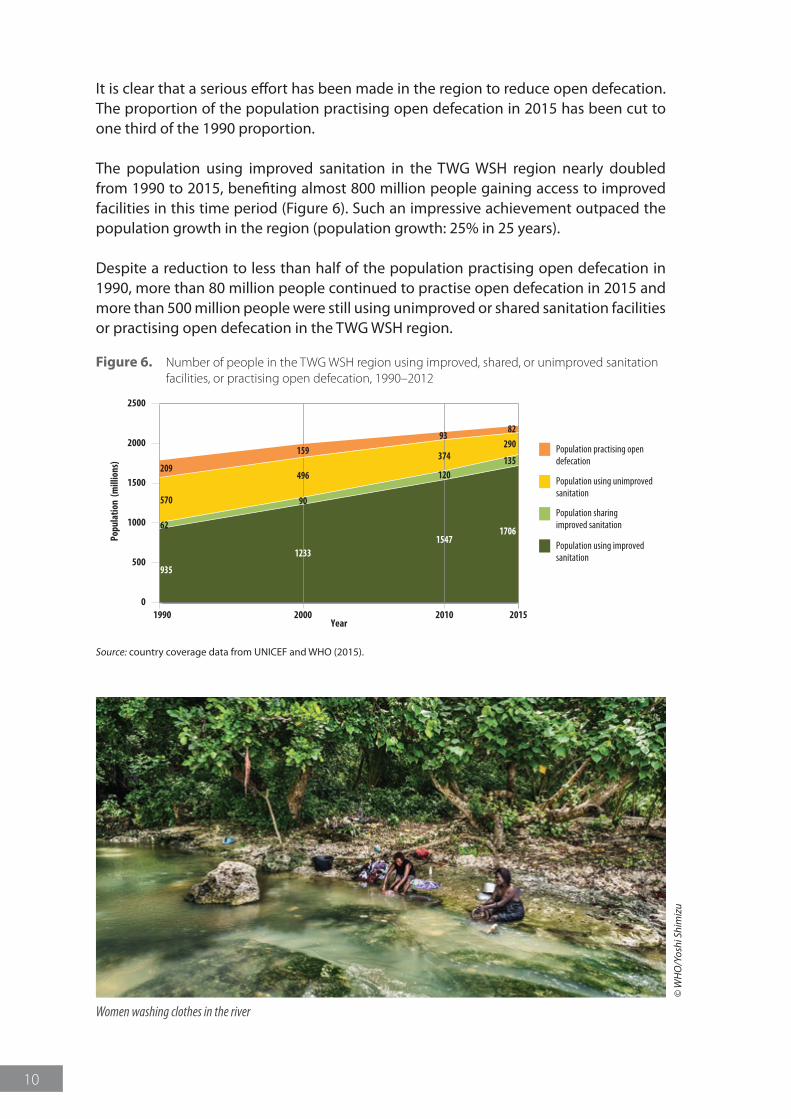
It is clear that a serious effort has been made in the region to reduce open defecation. The proportion of the population practising open defecation in 2015 has been cut to one third of the 1990 proportion.
The population using improved sanitation in the TWG WSH region nearly doubled from 1990 to 2015, benefiting almost 800 million people gaining access to improved facilities in this time period (Figure 6). Such an impressive achievement outpaced the population growth in the region (population growth: 25% in 25 years).
Despite a reduction to less than half of the population practising open defecation in 1990, more than 80 million people continued to practise open defecation in 2015 and more than 500 million people were still using unimproved or shared sanitation facilities or practising open defecation in the TWG WSH region.
Figure 6. Number of people in the TWG WSH region using improved, shared, or unimproved sanitation facilities, or practising open defecation, 1990–2012
0
500
1000
1500
2000
2500
Population practising opendefecation
Population using unimprovedsanitation
Population sharingimproved sanitation
Population using improvedsanitation
20001990
Popu
latio
n (m
illio
ns)
Year20152010
1233
90
496
159
1547
120
374
93
935
62
570
209
1706
135
29082
Source: country coverage data from UNICEF and WHO (2015).
© W
HO
/Yos
hi S
him
izu
Women washing clothes in the river
11
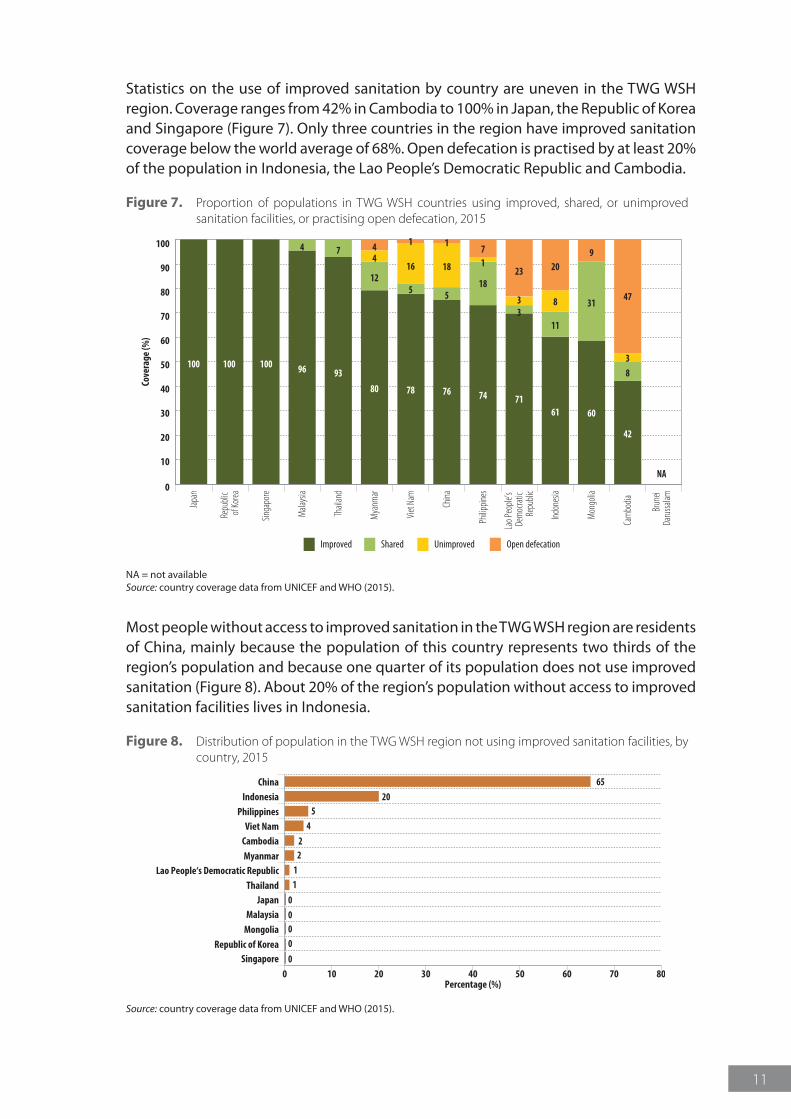
Statistics on the use of improved sanitation by country are uneven in the TWG WSH region. Coverage ranges from 42% in Cambodia to 100% in Japan, the Republic of Korea and Singapore (Figure 7). Only three countries in the region have improved sanitation coverage below the world average of 68%. Open defecation is practised by at least 20% of the population in Indonesia, the Lao People’s Democratic Republic and Cambodia.
Figure 7. Proportion of populations in TWG WSH countries using improved, shared, or unimproved sanitation facilities, or practising open defecation, 2015
100 100 100 96
4
93
7
80
12
44
78
5
16
1 1
76
5
18
74
18
17
71
33
23
61
11
8
209
60
3147
38
42
NA0
10
20
30
40
50
60
70
80
90
100
Improved Shared Unimproved Open defecation
Japa
n
Repu
blic
of Ko
rea
Singa
pore
Mala
ysia
Thail
and
Mya
nmar
Viet
Nam
China
Philip
pines
Lao P
eople
’s De
moc
ratic
Repu
blic
Indon
esia
Mon
golia
Cam
bodia
Brun
ei Da
russa
lam
Cove
rage
(%)
NA = not availableSource: country coverage data from UNICEF and WHO (2015).
Most people without access to improved sanitation in the TWG WSH region are residents of China, mainly because the population of this country represents two thirds of the region’s population and because one quarter of its population does not use improved sanitation (Figure 8). About 20% of the region’s population without access to improved sanitation facilities lives in Indonesia.
Figure 8. Distribution of population in the TWG WSH region not using improved sanitation facilities, by country, 2015
Cambodia 2
China 65Indonesia 20
Lao People‘s Democratic Republic 1Myanmar 2
Philippines 5
Thailand 1
Viet Nam 4
Japan 0Malaysia 0
Mongolia 0
Republic of Korea 0
Singapore 00 10 20 30 40 50 60 70 80
Percentage (%)
Source: country coverage data from UNICEF and WHO (2015).
12
3.2 Sanitation inequities
3.2.1 Urban and rural disparities
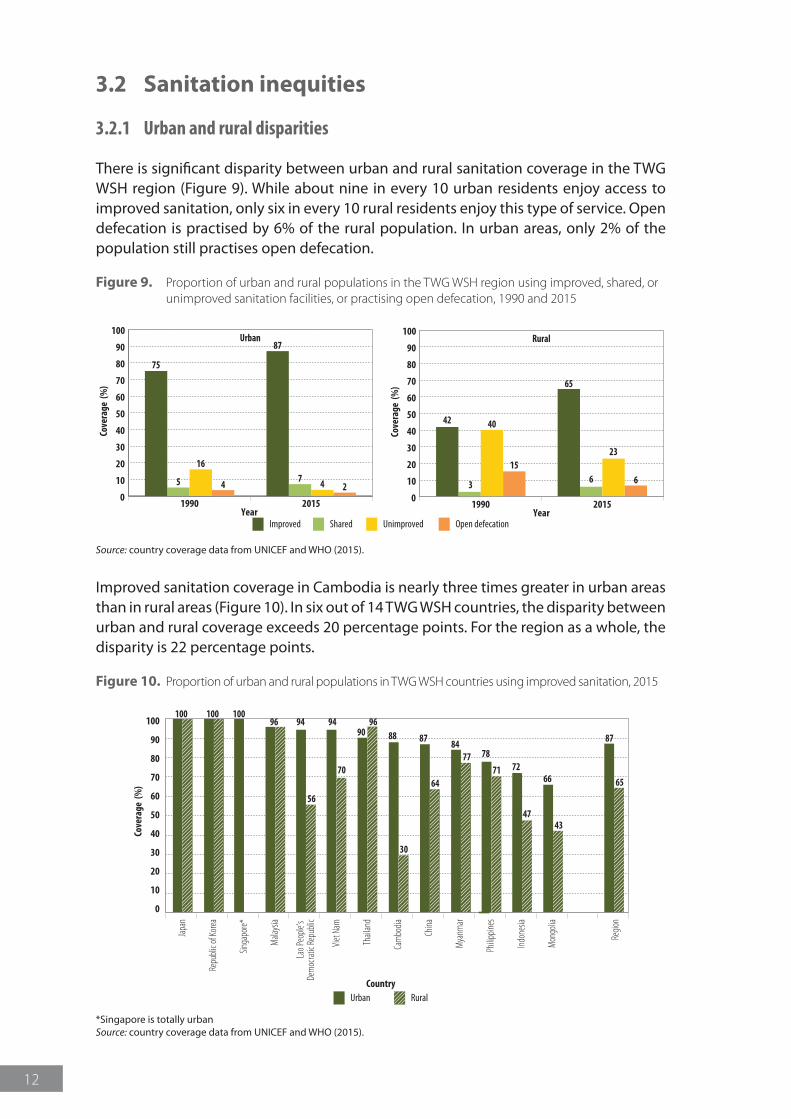
There is significant disparity between urban and rural sanitation coverage in the TWG WSH region (Figure 9). While about nine in every 10 urban residents enjoy access to improved sanitation, only six in every 10 rural residents enjoy this type of service. Open defecation is practised by 6% of the rural population. In urban areas, only 2% of the population still practises open defecation.
Figure 9. Proportion of urban and rural populations in the TWG WSH region using improved, shared, or unimproved sanitation facilities, or practising open defecation, 1990 and 2015
Improved Shared Unimproved Open defecation
0
10
20
30
40
50
60
70
80
90
100
1990
Cove
rage
(%
)
2015Year
Urban
5
16
4
75
7 4 2
87
0
10
20
30
40
50
60
70
80
90
100
1990
Cove
rage
(%
)
2015Year
Rural
3
40
15
42
6
23
6
65
Source: country coverage data from UNICEF and WHO (2015).
Improved sanitation coverage in Cambodia is nearly three times greater in urban areas than in rural areas (Figure 10). In six out of 14 TWG WSH countries, the disparity between urban and rural coverage exceeds 20 percentage points. For the region as a whole, the disparity is 22 percentage points.
Figure 10. Proportion of urban and rural populations in TWG WSH countries using improved sanitation, 2015
Urban Rural
96100 100 100
9690
94 94
56
70
88 87 8784
787771 72
4743
66 65
30
64
Japa
n
Repu
blic o
f Kor
ea
Singa
pore*
Mala
ysia
Lao P
eople
’s De
moc
ratic
Repu
blic
Viet
Nam
Thail
and
Cam
bodia
China
Mya
nmar
Philip
pines
Indon
esia
Mon
golia
Regio
n
0
10
20
30
40
50
60
70
80
90
100
Cove
rage
(%
)
Country
*Singapore is totally urbanSource: country coverage data from UNICEF and WHO (2015).
13
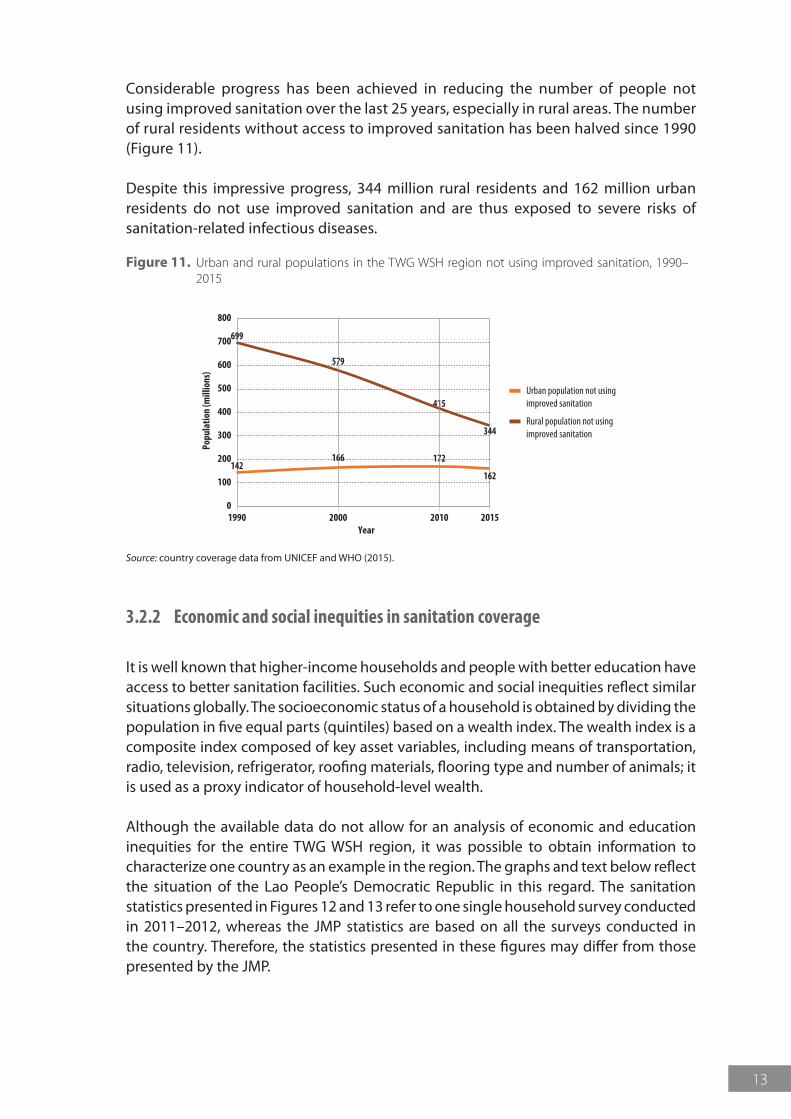
Considerable progress has been achieved in reducing the number of people not using improved sanitation over the last 25 years, especially in rural areas. The number of rural residents without access to improved sanitation has been halved since 1990 (Figure 11).
Despite this impressive progress, 344 million rural residents and 162 million urban residents do not use improved sanitation and are thus exposed to severe risks of sanitation-related infectious diseases.
Figure 11. Urban and rural populations in the TWG WSH region not using improved sanitation, 1990–2015
0
100
200
300
400
500
600
700
800
Urban population not usingimproved sanitation
Rural population not using improved sanitation
1990 2000
Popu
latio
n (m
illio
ns)
2010Year
2015
699
142
579
166
415
172
344
162
Source: country coverage data from UNICEF and WHO (2015).
3.2.2 Economic and social inequities in sanitation coverage
It is well known that higher-income households and people with better education have access to better sanitation facilities. Such economic and social inequities reflect similar situations globally. The socioeconomic status of a household is obtained by dividing the population in five equal parts (quintiles) based on a wealth index. The wealth index is a composite index composed of key asset variables, including means of transportation, radio, television, refrigerator, roofing materials, flooring type and number of animals; it is used as a proxy indicator of household-level wealth.
Although the available data do not allow for an analysis of economic and education inequities for the entire TWG WSH region, it was possible to obtain information to characterize one country as an example in the region. The graphs and text below reflect the situation of the Lao People’s Democratic Republic in this regard. The sanitation statistics presented in Figures 12 and 13 refer to one single household survey conducted in 2011–2012, whereas the JMP statistics are based on all the surveys conducted in the country. Therefore, the statistics presented in these figures may differ from those presented by the JMP.
14
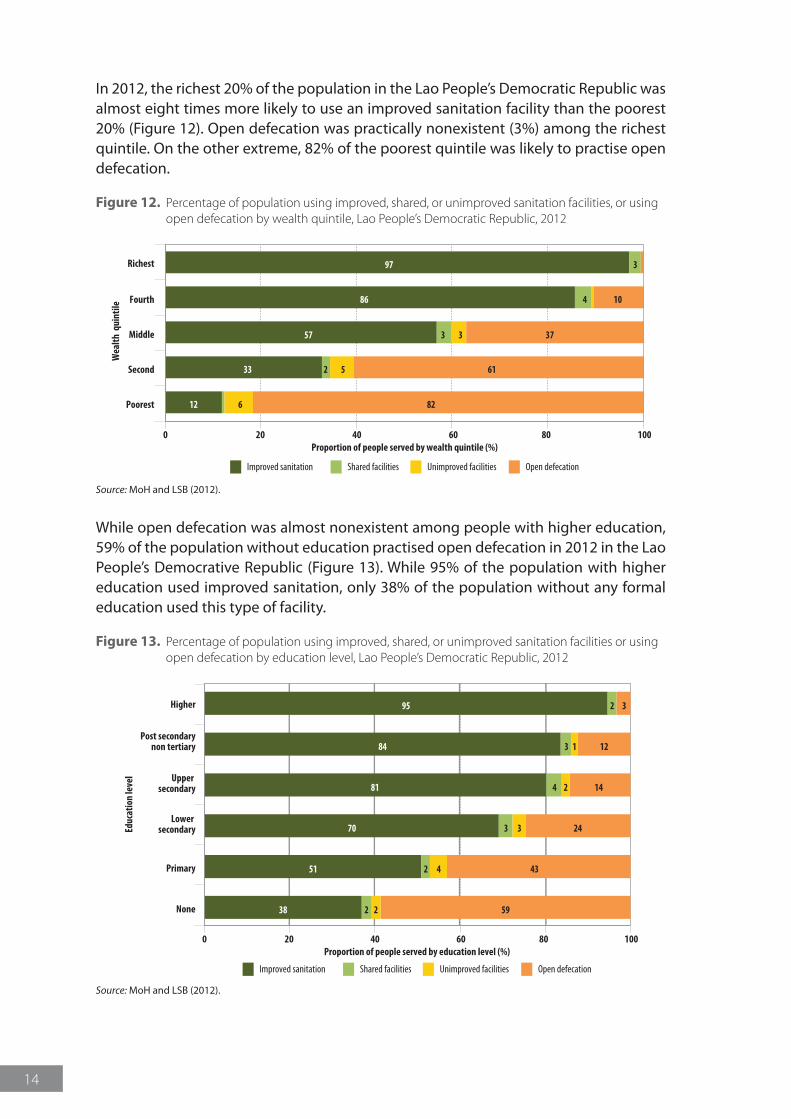
In 2012, the richest 20% of the population in the Lao People’s Democratic Republic was almost eight times more likely to use an improved sanitation facility than the poorest 20% (Figure 12). Open defecation was practically nonexistent (3%) among the richest quintile. On the other extreme, 82% of the poorest quintile was likely to practise open defecation.
Figure 12. Percentage of population using improved, shared, or unimproved sanitation facilities, or using open defecation by wealth quintile, Lao People’s Democratic Republic, 2012
0 20 40 60
Wea
lth q
uint
ile
80Proportion of people served by wealth quintile (%)
100
Improved sanitation Shared facilities Unimproved facilities Open defecation
Poorest 12 826
Second 33 612 5
Middle 57 373 3
Fourth 86 104
Richest 97 3
Source: MoH and LSB (2012).
While open defecation was almost nonexistent among people with higher education, 59% of the population without education practised open defecation in 2012 in the Lao People’s Democrative Republic (Figure 13). While 95% of the population with higher education used improved sanitation, only 38% of the population without any formal education used this type of facility.
Figure 13. Percentage of population using improved, shared, or unimproved sanitation facilities or using open defecation by education level, Lao People’s Democratic Republic, 2012
0 20 40 60
Educ
atio
n le
vel
80Proportion of people served by education level (%)
100
None 38 5922
Primary 51 4342
Lower secondary 70 2433
Upper secondary 81 144 2
Post secondarynon tertiary 84 1213
Higher 95 32
Improved sanitation Shared facilities Unimproved facilities Open defecation
Source: MoH and LSB (2012).
15
4 Drinking-water coverage in TWG WSH countries
4.1 Current status
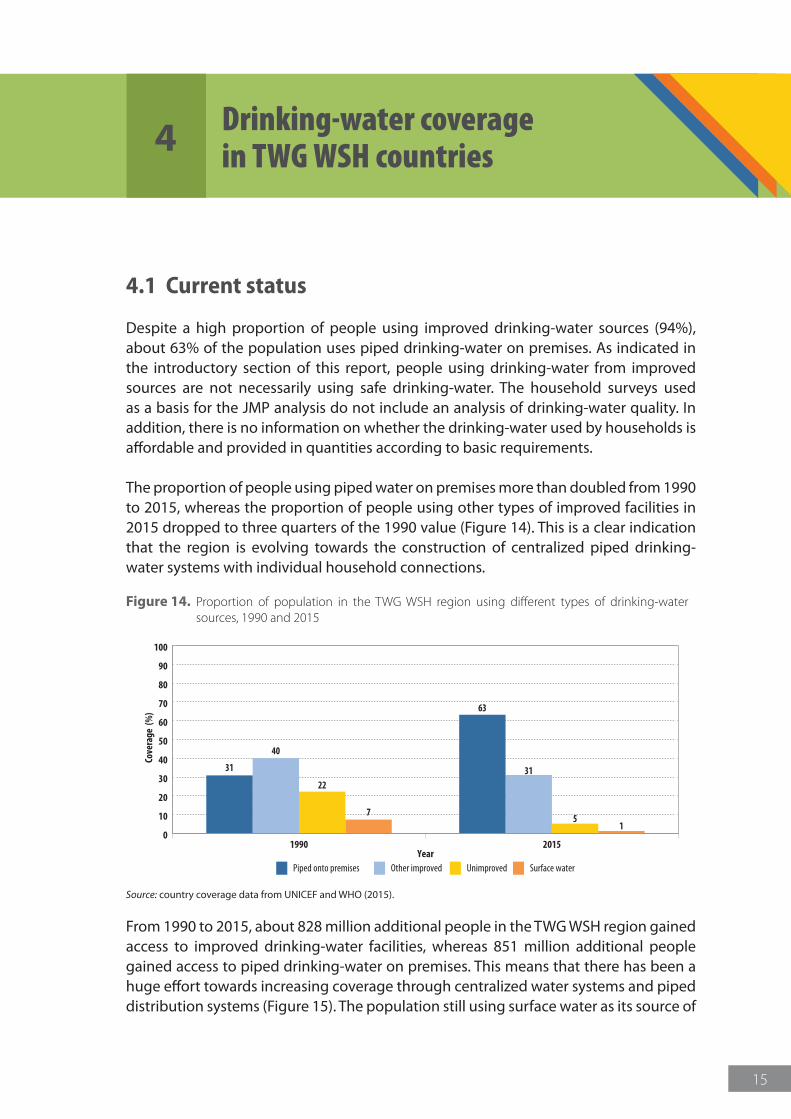
Despite a high proportion of people using improved drinking-water sources (94%), about 63% of the population uses piped drinking-water on premises. As indicated in the introductory section of this report, people using drinking-water from improved sources are not necessarily using safe drinking-water. The household surveys used as a basis for the JMP analysis do not include an analysis of drinking-water quality. In addition, there is no information on whether the drinking-water used by households is affordable and provided in quantities according to basic requirements.
The proportion of people using piped water on premises more than doubled from 1990 to 2015, whereas the proportion of people using other types of improved facilities in 2015 dropped to three quarters of the 1990 value (Figure 14). This is a clear indication that the region is evolving towards the construction of centralized piped drinking-water systems with individual household connections.
Figure 14. Proportion of population in the TWG WSH region using different types of drinking-water sources, 1990 and 2015
0
10
20
30
40
50
60
70
80
90
100
Piped onto premises Other improved Unimproved Surface water
1990Year
Cove
rage
(%
)
2015
40
22
7
31 31
51
63
Source: country coverage data from UNICEF and WHO (2015).
From 1990 to 2015, about 828 million additional people in the TWG WSH region gained access to improved drinking-water facilities, whereas 851 million additional people gained access to piped drinking-water on premises. This means that there has been a huge effort towards increasing coverage through centralized water systems and piped distribution systems (Figure 15). The population still using surface water as its source of
16
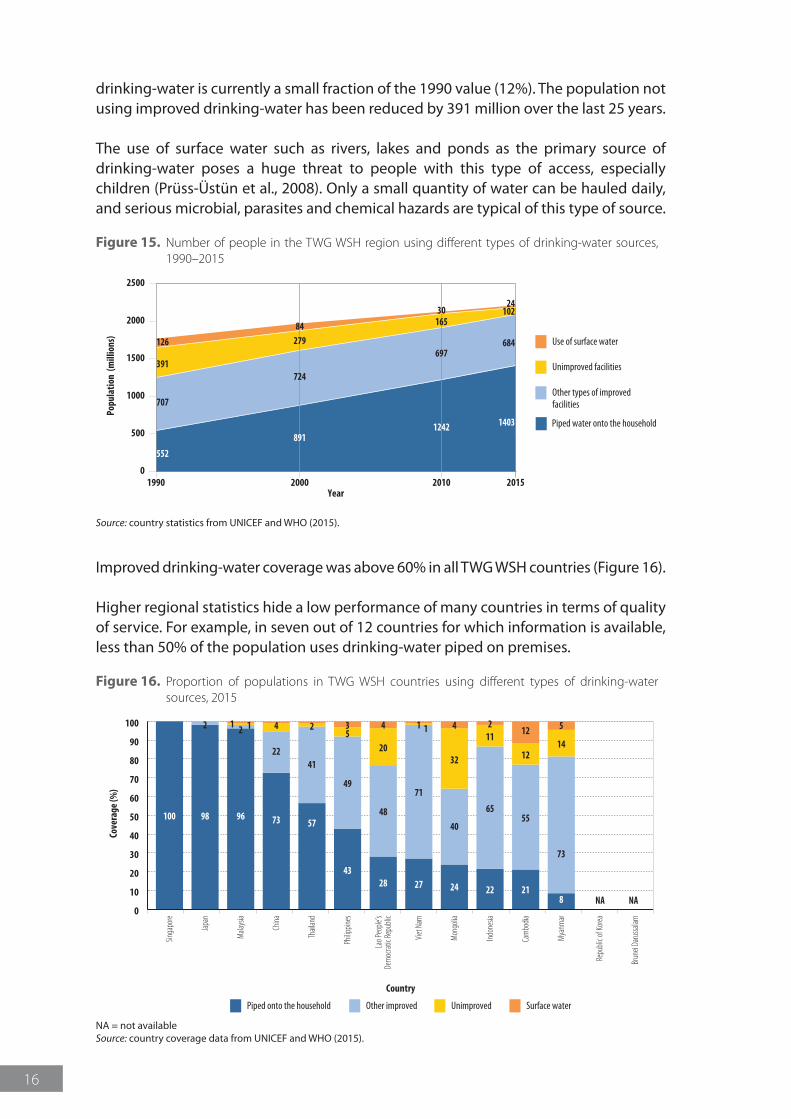
drinking-water is currently a small fraction of the 1990 value (12%). The population not using improved drinking-water has been reduced by 391 million over the last 25 years.
The use of surface water such as rivers, lakes and ponds as the primary source of drinking-water poses a huge threat to people with this type of access, especially children (Prüss-Üstün et al., 2008). Only a small quantity of water can be hauled daily, and serious microbial, parasites and chemical hazards are typical of this type of source.
Figure 15. Number of people in the TWG WSH region using different types of drinking-water sources, 1990–2015
Use of surface water
Piped water onto the household
0
500
1000
1500
2000
2500
Unimproved facilities
Other types of improved facilities
20001990
Popu
latio
n (m
illio
ns)
Year20152010
707
391
126
891
724
27984
1242
697
16530
1403
684
10224
552
Source: country statistics from UNICEF and WHO (2015).
Improved drinking-water coverage was above 60% in all TWG WSH countries (Figure 16).
Higher regional statistics hide a low performance of many countries in terms of quality of service. For example, in seven out of 12 countries for which information is available, less than 50% of the population uses drinking-water piped on premises.
Figure 16. Proportion of populations in TWG WSH countries using different types of drinking-water sources, 2015
100 98
2
96
21 1
73
22
4
57
41
2
43
49
53
28
48
20
4 1
27
71
1
24
40
32
4
22
65
112
21
55
12
12 5
73
8
14
NANA0
10
20
30
40
50
60
70
80
90
100
Piped onto the household Other improved Unimproved Surface water
Singa
pore
Japa
n
Mala
ysia
China
Thail
and
Philip
pines
Lao P
eople
’sDe
moc
ratic
Repu
blic
Viet
Nam
Mon
golia
Indon
esia
Cam
bodia
Mya
nmar
Repu
blic o
f Kor
ea
Brun
ei Da
russa
lam
Cove
rage
(%)
Country
NA = not availableSource: country coverage data from UNICEF and WHO (2015).
17
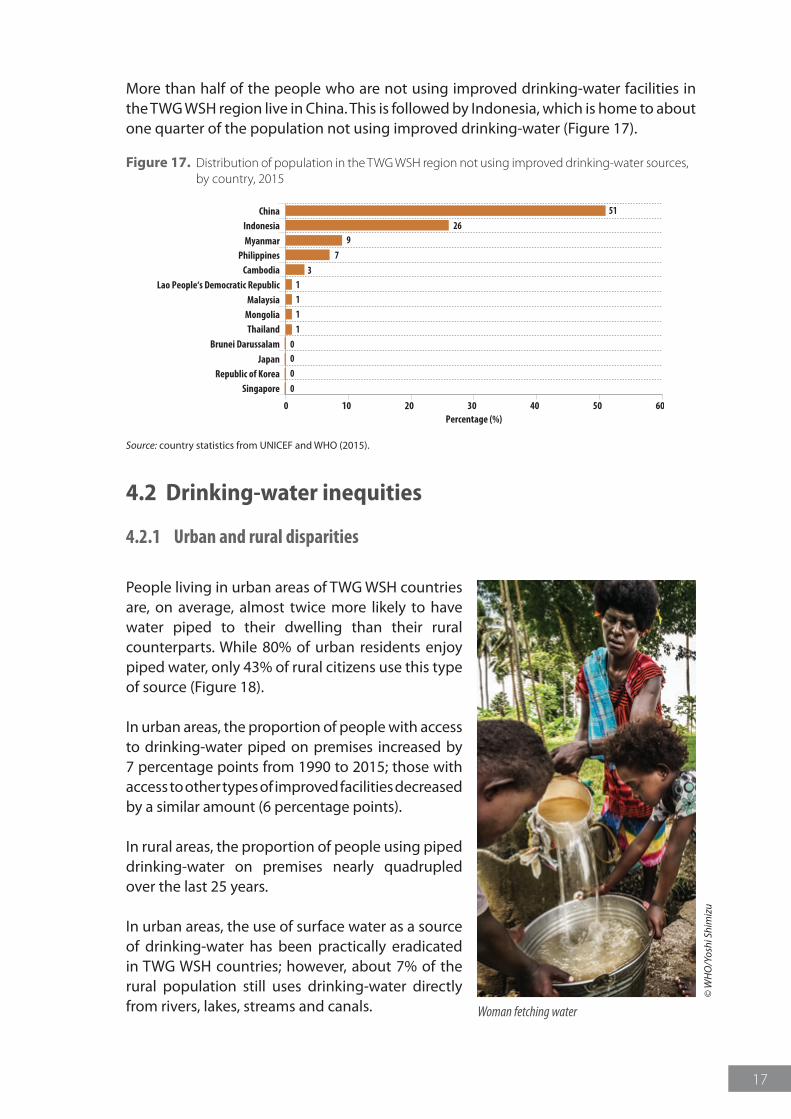
More than half of the people who are not using improved drinking-water facilities in the TWG WSH region live in China. This is followed by Indonesia, which is home to about one quarter of the population not using improved drinking-water (Figure 17).
Figure 17. Distribution of population in the TWG WSH region not using improved drinking-water sources, by country, 2015
Cambodia 3
Indonesia 26
Lao People‘s Democratic Republic 1
Mongolia 1
Myanmar 9
Philippines 7
Thailand 1
Malaysia 1
China 51
Brunei Darussalam 0Japan 0
Republic of Korea 0
Singapore 0
0 10 20 30 40 50 60Percentage (%)
Source: country statistics from UNICEF and WHO (2015).
4.2 Drinking-water inequities
4.2.1 Urban and rural disparities
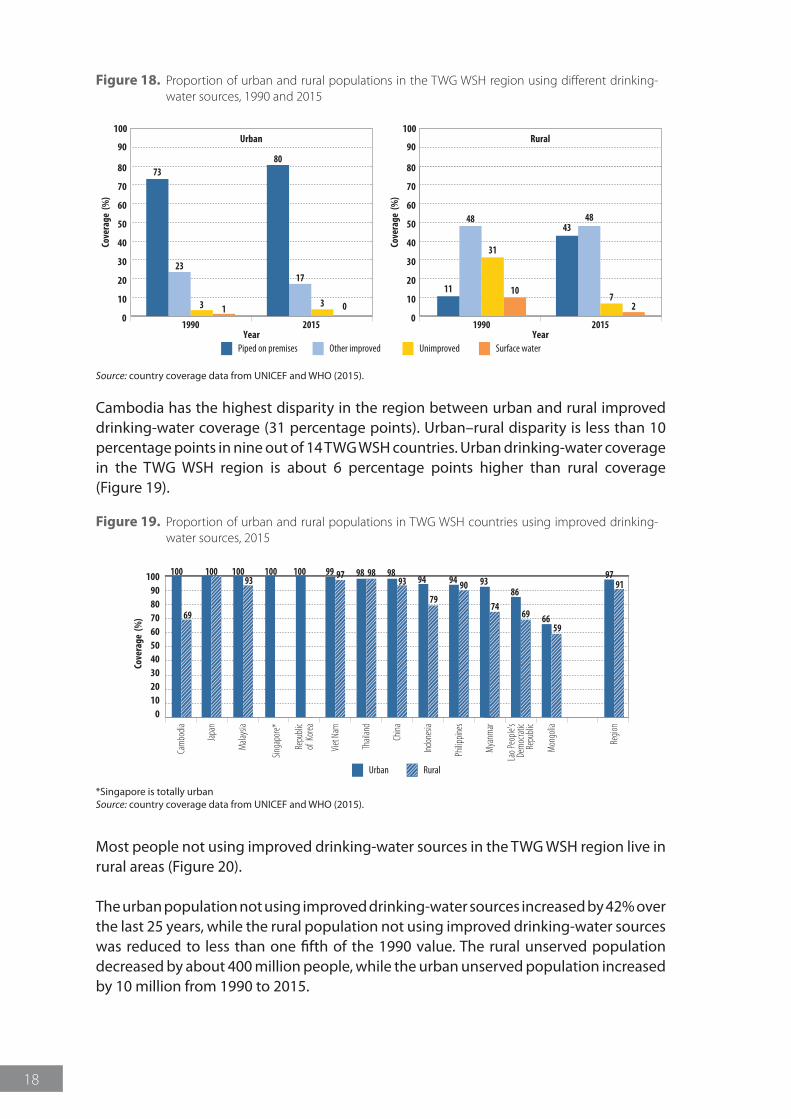
People living in urban areas of TWG WSH countries are, on average, almost twice more likely to have water piped to their dwelling than their rural counterparts. While 80% of urban residents enjoy piped water, only 43% of rural citizens use this type of source (Figure 18).
In urban areas, the proportion of people with access to drinking-water piped on premises increased by 7 percentage points from 1990 to 2015; those with access to other types of improved facilities decreased by a similar amount (6 percentage points).
In rural areas, the proportion of people using piped drinking-water on premises nearly quadrupled over the last 25 years.
In urban areas, the use of surface water as a source of drinking-water has been practically eradicated in TWG WSH countries; however, about 7% of the rural population still uses drinking-water directly from rivers, lakes, streams and canals.
© W
HO
/Yos
hi S
him
izu
Woman fetching water
18
Figure 18. Proportion of urban and rural populations in the TWG WSH region using different drinking-water sources, 1990 and 2015
YearPiped on premises Other improved Unimproved Surface water
Year
0
10
20
30
40
50
60
70
80
1990
Cove
rage
(%
)
2015
Urban
23
3 1
73
17
3 0
80
0
10
20
30
40
50
60
70
80
90 90
100 100
1990
Cove
rage
(%
)
2015
Rural
48
31
1011
48
72
43
Source: country coverage data from UNICEF and WHO (2015).
Cambodia has the highest disparity in the region between urban and rural improved drinking-water coverage (31 percentage points). Urban–rural disparity is less than 10 percentage points in nine out of 14 TWG WSH countries. Urban drinking-water coverage in the TWG WSH region is about 6 percentage points higher than rural coverage (Figure 19).
Figure 19. Proportion of urban and rural populations in TWG WSH countries using improved drinking-water sources, 2015
Urban Rural
100
Cam
bodia
Japa
n
Mala
ysia
Viet
Nam
Thail
and
China
Indon
esia
Philip
pines
Mya
nmar
Lao P
eople
’sDe
moc
ratic
Repu
blic
Mon
golia
Regio
n
0102030405060708090
100
Cove
rage
(%
)
100
69
100 98 9899 97 94 90 93
7486
6959
66
9791
9893 94
79
100
Singa
pore*
Repu
blic
of Ko
rea
10093
*Singapore is totally urbanSource: country coverage data from UNICEF and WHO (2015).
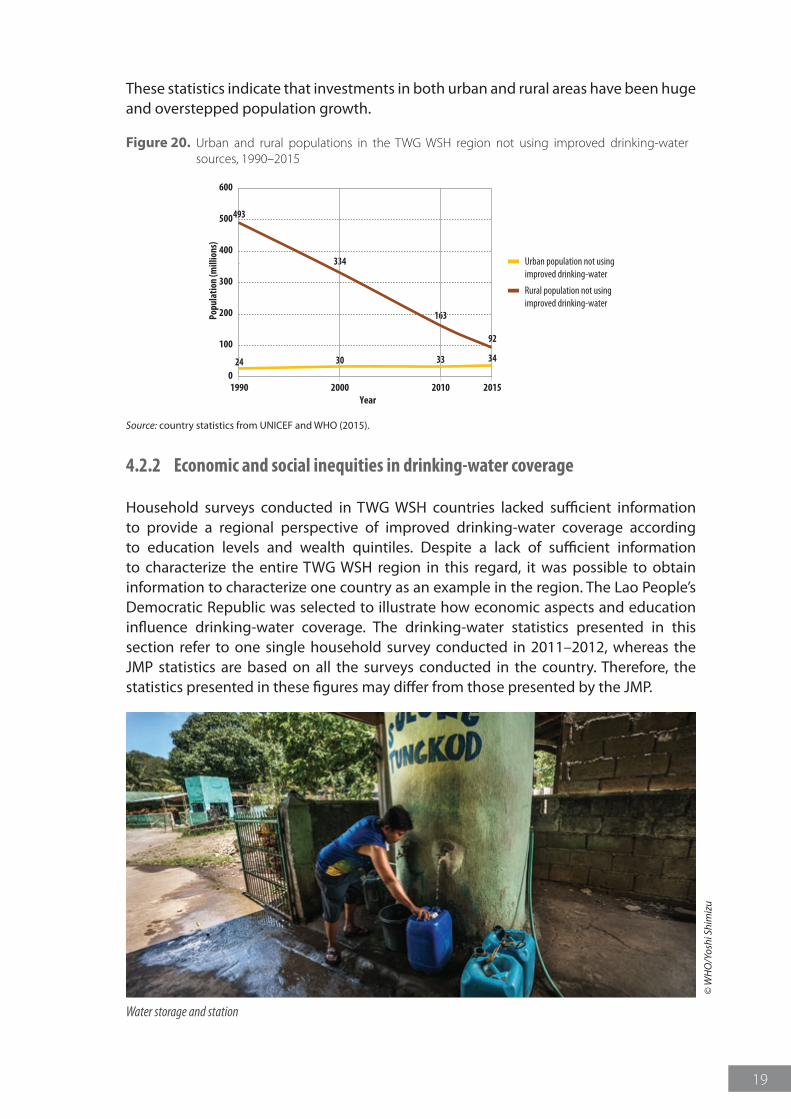
Most people not using improved drinking-water sources in the TWG WSH region live in rural areas (Figure 20).
The urban population not using improved drinking-water sources increased by 42% over the last 25 years, while the rural population not using improved drinking-water sources was reduced to less than one fifth of the 1990 value. The rural unserved population decreased by about 400 million people, while the urban unserved population increased by 10 million from 1990 to 2015.
19
These statistics indicate that investments in both urban and rural areas have been huge and overstepped population growth.
Figure 20. Urban and rural populations in the TWG WSH region not using improved drinking-water sources, 1990–2015
0
100
200
300
400
500
600
Urban population not usingimproved drinking-water
Rural population not using improved drinking-water
1990 2000
Popu
latio
n (m
illio
ns)
2010Year
2015
493
24
334
30
163
33
92
34
Source: country statistics from UNICEF and WHO (2015).
4.2.2 Economic and social inequities in drinking-water coverage
Household surveys conducted in TWG WSH countries lacked sufficient information to provide a regional perspective of improved drinking-water coverage according to education levels and wealth quintiles. Despite a lack of sufficient information to characterize the entire TWG WSH region in this regard, it was possible to obtain information to characterize one country as an example in the region. The Lao People’s Democratic Republic was selected to illustrate how economic aspects and education influence drinking-water coverage. The drinking-water statistics presented in this section refer to one single household survey conducted in 2011–2012, whereas the JMP statistics are based on all the surveys conducted in the country. Therefore, the statistics presented in these figures may differ from those presented by the JMP.
© W
HO
/Yos
hi S
him
izu
Water storage and station
20
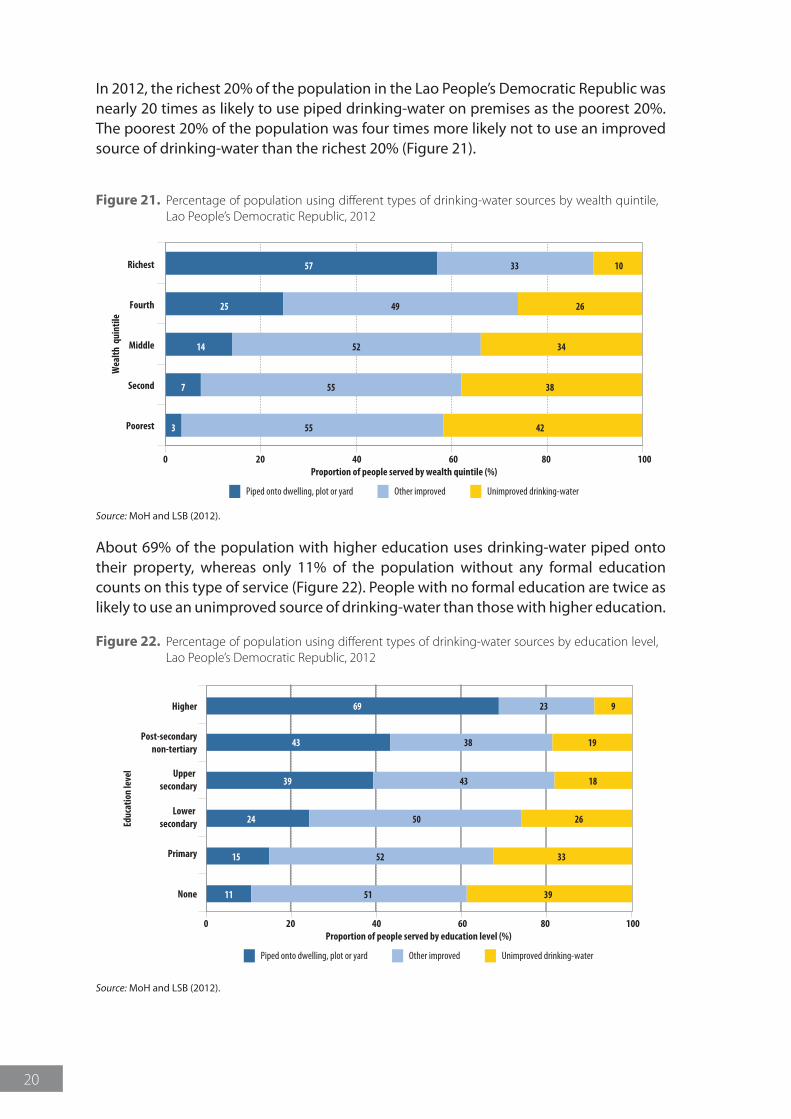
In 2012, the richest 20% of the population in the Lao People’s Democratic Republic was nearly 20 times as likely to use piped drinking-water on premises as the poorest 20%. The poorest 20% of the population was four times more likely not to use an improved source of drinking-water than the richest 20% (Figure 21).
Figure 21. Percentage of population using different types of drinking-water sources by wealth quintile, Lao People’s Democratic Republic, 2012
0 20 40 60
Wea
lth q
uint
ile
80Proportion of people served by wealth quintile (%)
100
Piped onto dwelling, plot or yard Other improved Unimproved drinking-water
Richest 57 1033
Fourth 25 2649
Middle 14 3452
Second 7 3855
Poorest 3 4255
Source: MoH and LSB (2012).
About 69% of the population with higher education uses drinking-water piped onto their property, whereas only 11% of the population without any formal education counts on this type of service (Figure 22). People with no formal education are twice as likely to use an unimproved source of drinking-water than those with higher education.
Figure 22. Percentage of population using different types of drinking-water sources by education level, Lao People’s Democratic Republic, 2012
None
Primary
Lower secondary
Upper secondary
0 20 40 60
Educ
atio
n le
vel
80Proportion of people served by education level (%)
100
11 3951
15 3352
24 2650
39 1843
Post-secondarynon-tertiary
43 1938
Higher 69 923
Piped onto dwelling, plot or yard Other improved Unimproved drinking-water
Source: MoH and LSB (2012).
21
In September 2000, building on a decade of major United Nations conferences and summits, world leaders adopted the United Nations Millennium Declaration, committing their nations to a global partnership to reduce extreme poverty and setting out time-bound goals and targets to be achieved by 2015. These became known as the Millennium Development Goals (MDGs). MDG target 7.C is to “halve, by 2015, the proportion of the population without sustainable access to safe drinking water and basic sanitation” (UN, 2017). As information is not available to measure access to “safe drinking-water” and “basic sanitation”, the international community adopted the proxies “improved drinking-water” and “improved sanitation” to measure progress in coverage since 1990 (see section 1.3).
5.1 Achieving the MDG sanitation target
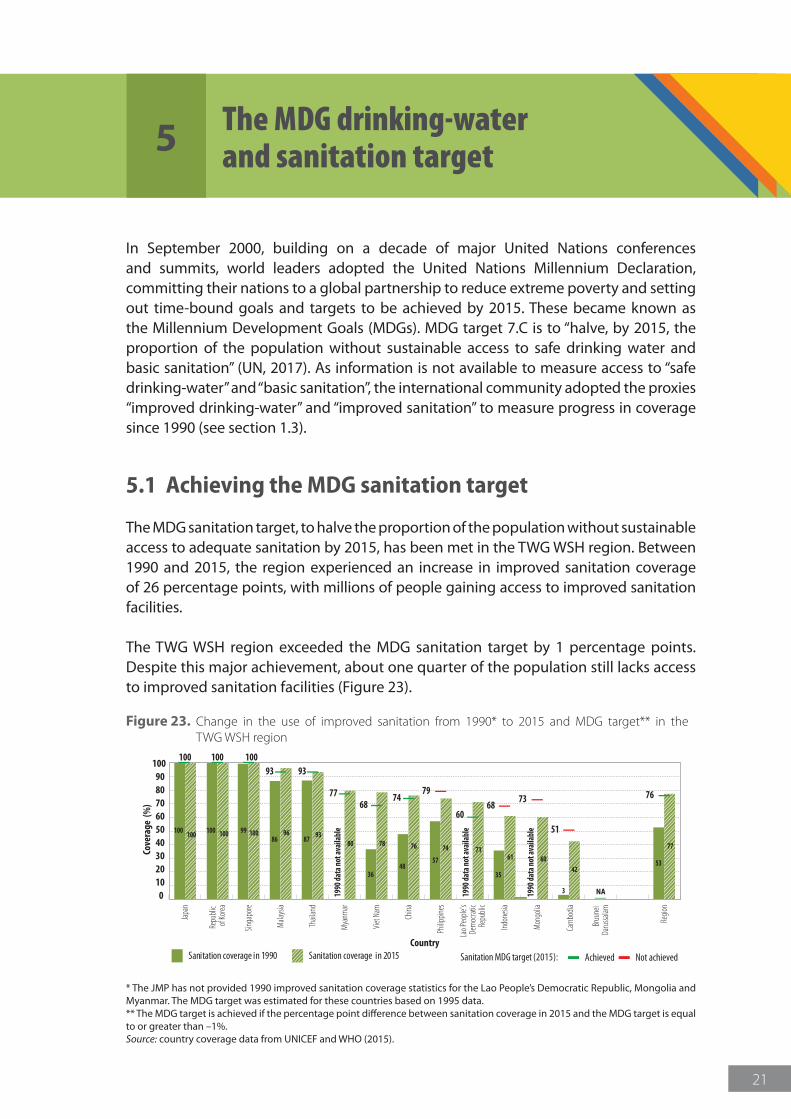
The MDG sanitation target, to halve the proportion of the population without sustainable access to adequate sanitation by 2015, has been met in the TWG WSH region. Between 1990 and 2015, the region experienced an increase in improved sanitation coverage of 26 percentage points, with millions of people gaining access to improved sanitation facilities.
The TWG WSH region exceeded the MDG sanitation target by 1 percentage points. Despite this major achievement, about one quarter of the population still lacks access to improved sanitation facilities (Figure 23).
Figure 23. Change in the use of improved sanitation from 1990* to 2015 and MDG target** in the TWG WSH region
100
100 100 99 100 9387 80
36 35
53
77
4857
7161 60
42
3
747678
100 10093
100 100 8696
93
7768
60
74 767968
73
51
NA
Sanitation coverage in 1990 Sanitation coverage in 2015 Achieved Not achievedSanitation MDG target (2015):
Cam
bodia
Japa
n
Mala
ysia
Singa
pore
Repu
blic
of Ko
rea
Viet
Nam
Thail
and
China
Indon
esia
Philip
pines
Mya
nmar
Lao P
eople
’sDe
moc
ratic
Repu
blic
Mon
golia
Bruu
nei
Daru
ssalam
Regio
n
0102030405060708090
100
Cove
rage
(%
)
Country
1990
data
not a
vaila
ble
1990
data
not a
vaila
ble
1990
data
not a
vaila
ble
* The JMP has not provided 1990 improved sanitation coverage statistics for the Lao People’s Democratic Republic, Mongolia and Myanmar. The MDG target was estimated for these countries based on 1995 data. ** The MDG target is achieved if the percentage point difference between sanitation coverage in 2015 and the MDG target is equal to or greater than –1%.Source: country coverage data from UNICEF and WHO (2015).
5 The MDG drinking-water and sanitation target
22
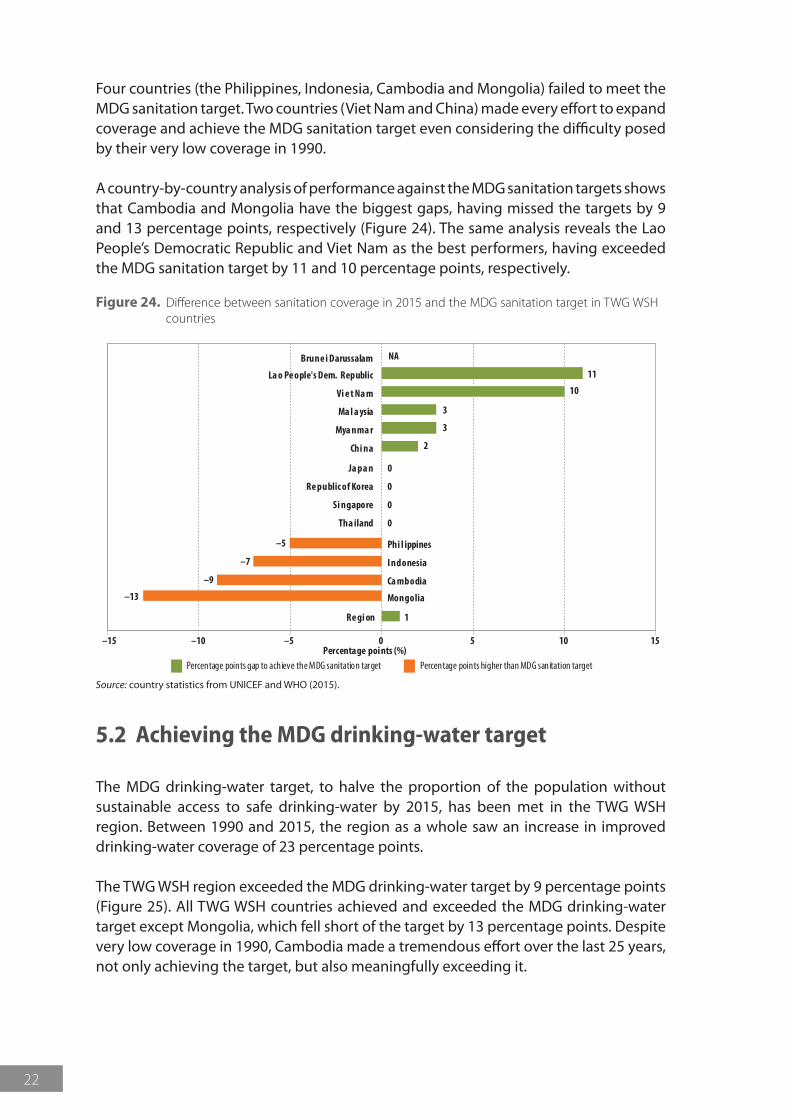
Four countries (the Philippines, Indonesia, Cambodia and Mongolia) failed to meet the MDG sanitation target. Two countries (Viet Nam and China) made every effort to expand coverage and achieve the MDG sanitation target even considering the difficulty posed by their very low coverage in 1990.
A country-by-country analysis of performance against the MDG sanitation targets shows that Cambodia and Mongolia have the biggest gaps, having missed the targets by 9 and 13 percentage points, respectively (Figure 24). The same analysis reveals the Lao People’s Democratic Republic and Viet Nam as the best performers, having exceeded the MDG sanitation target by 11 and 10 percentage points, respectively.
Figure 24. Difference between sanitation coverage in 2015 and the MDG sanitation target in TWG WSH countries
0
0
0
0
Ja pa n
Re public of Korea
Si ngapore
Tha iland
Phi l ippines–5
I ndonesia–7
Ca mbodia –9
Mongolia –13
Re gi on 1
–15 –10 –5 0 5 10 15Percentage points (%)
Percentage points higher than MDG sanitation targetPercentage points gap to achieve the MDG sanitation target
Brune i Darussalam
Vi e t Na m
Ma l a ysia
Mya nma r
Chi na
La o Pe ople's Dem. Republic 11
10
3
3
2
NA
Source: country statistics from UNICEF and WHO (2015).
5.2 Achieving the MDG drinking-water target
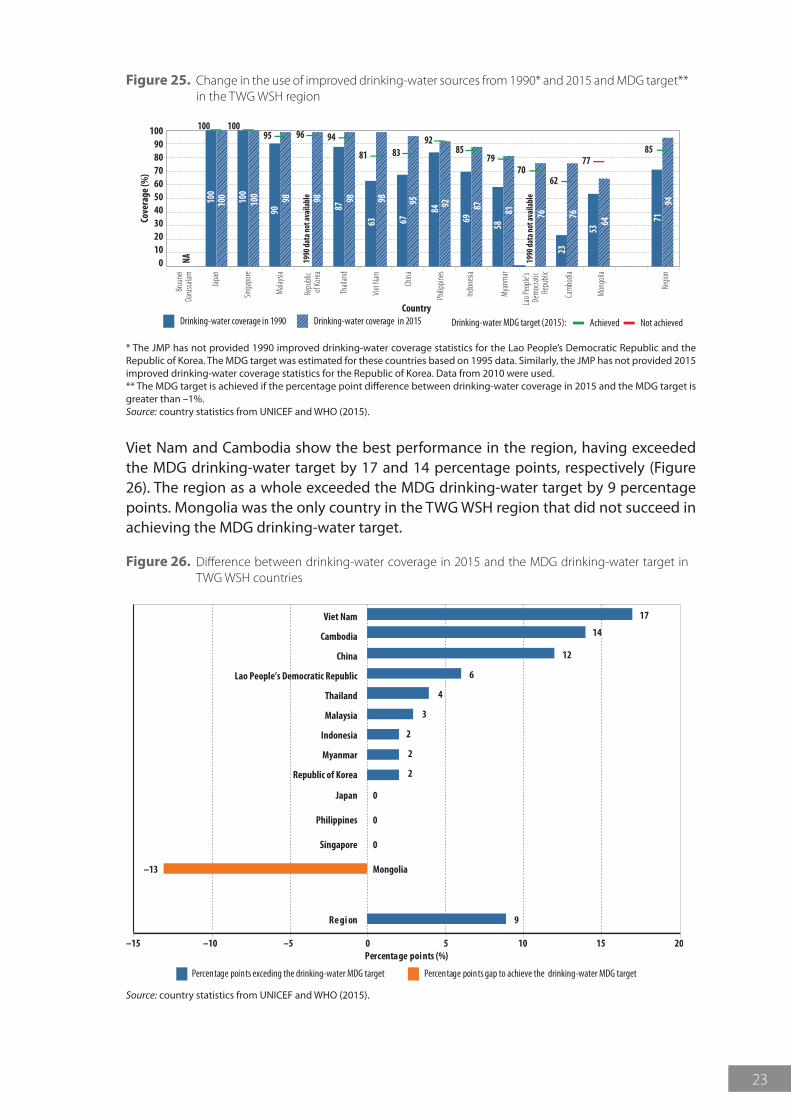
The MDG drinking-water target, to halve the proportion of the population without sustainable access to safe drinking-water by 2015, has been met in the TWG WSH region. Between 1990 and 2015, the region as a whole saw an increase in improved drinking-water coverage of 23 percentage points.
The TWG WSH region exceeded the MDG drinking-water target by 9 percentage points (Figure 25). All TWG WSH countries achieved and exceeded the MDG drinking-water target except Mongolia, which fell short of the target by 13 percentage points. Despite very low coverage in 1990, Cambodia made a tremendous effort over the last 25 years, not only achieving the target, but also meaningfully exceeding it.
23
Figure 25. Change in the use of improved drinking-water sources from 1990* and 2015 and MDG target** in the TWG WSH region
Cam
bodia
Bruu
nei
Daru
ssalam
Mala
ysia
Singa
pore
Japa
n
Viet
Nam
Repu
blic
of Ko
rea
China
Mya
nmar
Indon
esia
Philip
pines
Thail
and
Lao P
eople
’s De
moc
ratic
Repu
blic
Mon
golia
Regio
n
0102030405060708090
100Co
vera
ge (%
)
CountryDrinking-water coverage in 1990 Drinking-water coverage in 2015 Achieved Not achievedDrinking-water MDG target (2015):
100
100 10
010
0 9890
98 9887
63 7194
67
84 8769
8158
76 7623
6453
929598
100 10095 96 94
81 8583 8592
7970
77
62NA 19
90 da
ta no
t ava
ilabl
e
1990
data
not a
vaila
ble
* The JMP has not provided 1990 improved drinking-water coverage statistics for the Lao People’s Democratic Republic and the Republic of Korea. The MDG target was estimated for these countries based on 1995 data. Similarly, the JMP has not provided 2015 improved drinking-water coverage statistics for the Republic of Korea. Data from 2010 were used. ** The MDG target is achieved if the percentage point difference between drinking-water coverage in 2015 and the MDG target is greater than –1%.Source: country statistics from UNICEF and WHO (2015).
Viet Nam and Cambodia show the best performance in the region, having exceeded the MDG drinking-water target by 17 and 14 percentage points, respectively (Figure 26). The region as a whole exceeded the MDG drinking-water target by 9 percentage points. Mongolia was the only country in the TWG WSH region that did not succeed in achieving the MDG drinking-water target.
Figure 26. Difference between drinking-water coverage in 2015 and the MDG drinking-water target in TWG WSH countries
Viet Nam
Cambodia
China
Lao People’s Democratic Republic
Thailand
Malaysia
Indonesia
Myanmar
Republic of Korea
17
14
12
6
4
3
2
2
2
0
0
0
Japan
Philippines
Singapore
Mongolia–13
Re gi on 9
–15 –10 –5 0 5 1510 20Percentage points (%)
Percentage points gap to achieve the drinking-water MDG targetPercentage points exceding the drinking-water MDG target
Source: country statistics from UNICEF and WHO (2015).
T E M P I M A G E
© W
HO
/Yos
hi S
him
izu
View of a river
25
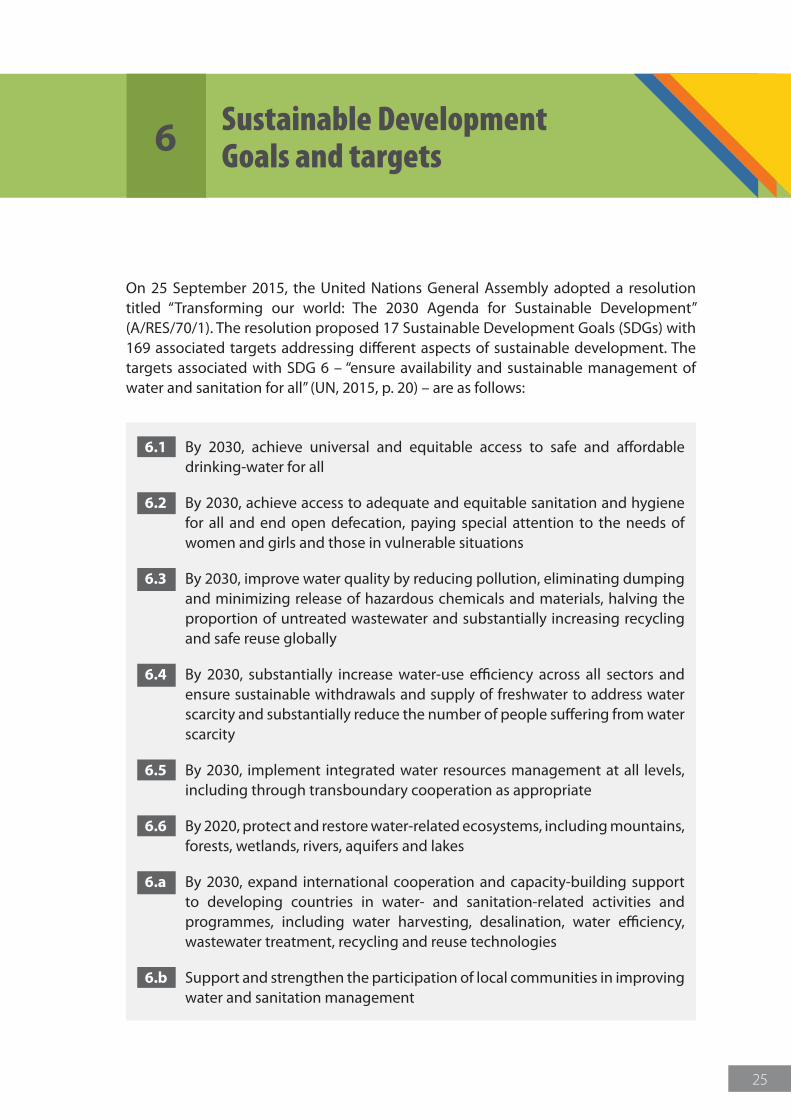
On 25 September 2015, the United Nations General Assembly adopted a resolution titled “Transforming our world: The 2030 Agenda for Sustainable Development” (A/RES/70/1). The resolution proposed 17 Sustainable Development Goals (SDGs) with 169 associated targets addressing different aspects of sustainable development. The targets associated with SDG 6 – “ensure availability and sustainable management of water and sanitation for all” (UN, 2015, p. 20) – are as follows:
6.1 By 2030, achieve universal and equitable access to safe and affordable drinking-water for all
6.2 By 2030, achieve access to adequate and equitable sanitation and hygiene for all and end open defecation, paying special attention to the needs of women and girls and those in vulnerable situations
6.3 By 2030, improve water quality by reducing pollution, eliminating dumping and minimizing release of hazardous chemicals and materials, halving the proportion of untreated wastewater and substantially increasing recycling and safe reuse globally
6.4 By 2030, substantially increase water-use efficiency across all sectors and ensure sustainable withdrawals and supply of freshwater to address water scarcity and substantially reduce the number of people suffering from water scarcity
6.5 By 2030, implement integrated water resources management at all levels, including through transboundary cooperation as appropriate
6.6 By 2020, protect and restore water-related ecosystems, including mountains, forests, wetlands, rivers, aquifers and lakes
6.a By 2030, expand international cooperation and capacity-building support to developing countries in water- and sanitation-related activities and programmes, including water harvesting, desalination, water efficiency, wastewater treatment, recycling and reuse technologies
6.b Support and strengthen the participation of local communities in improving water and sanitation management
6 Sustainable Development Goals and targets
T E M P I M A G E
26
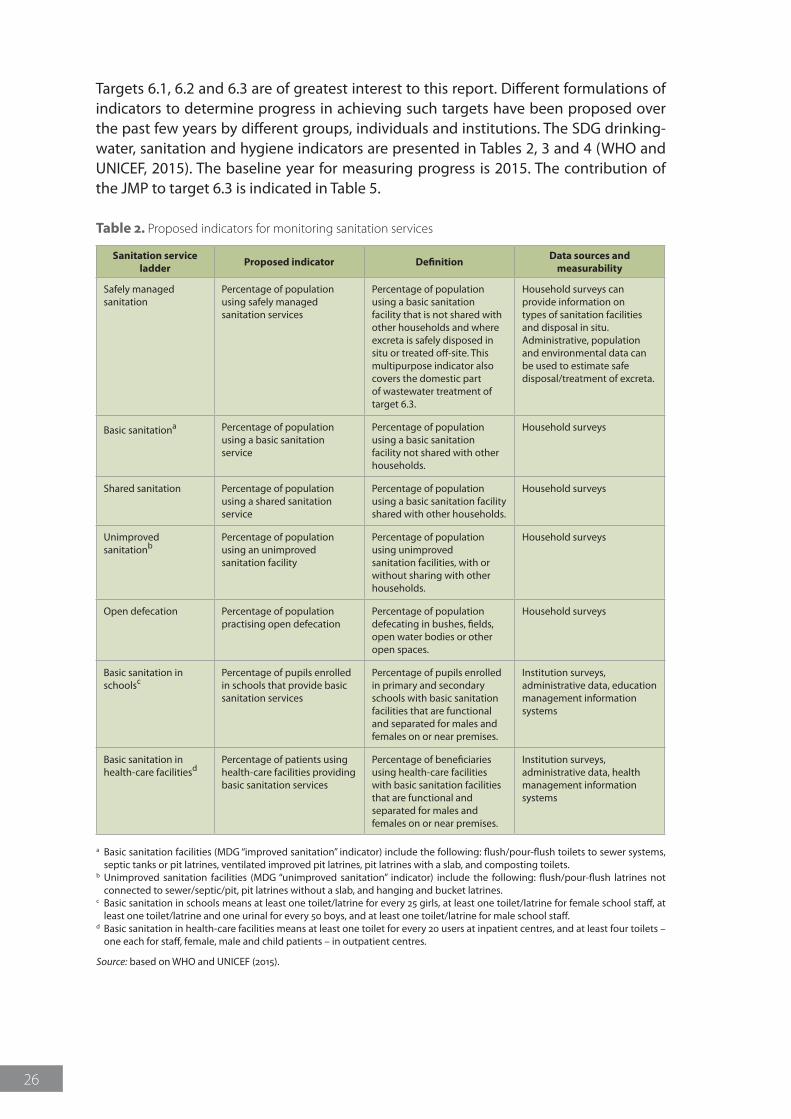
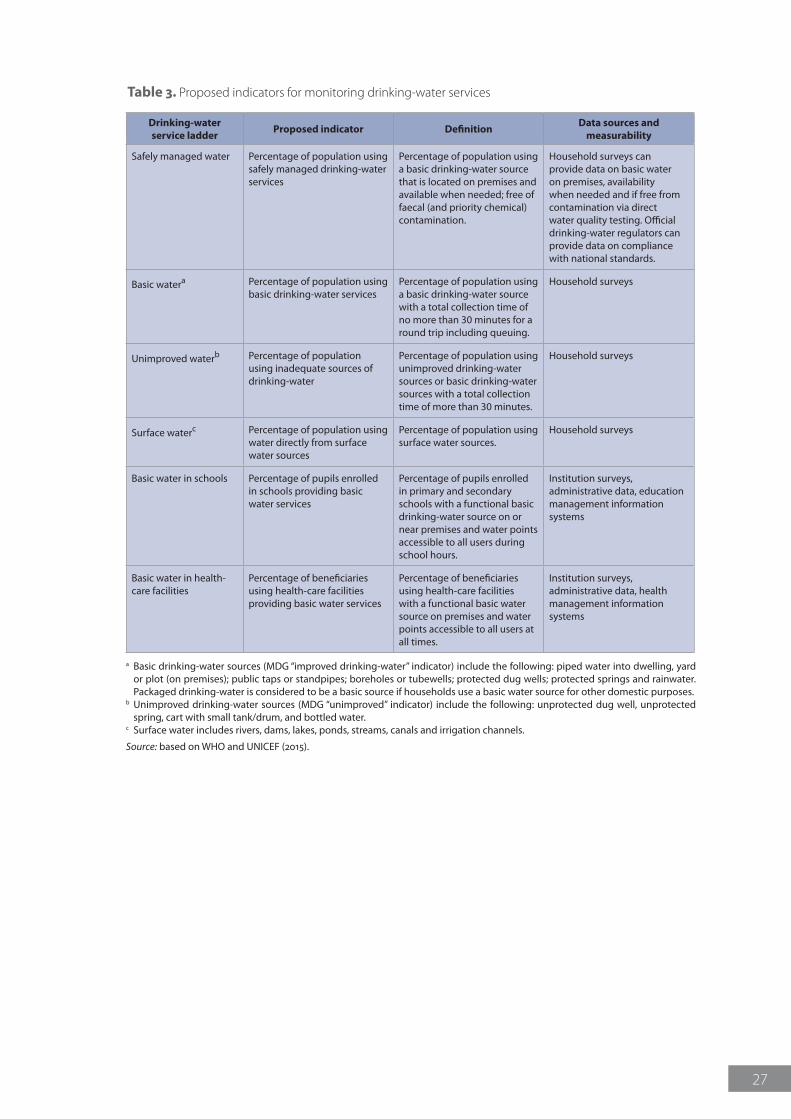
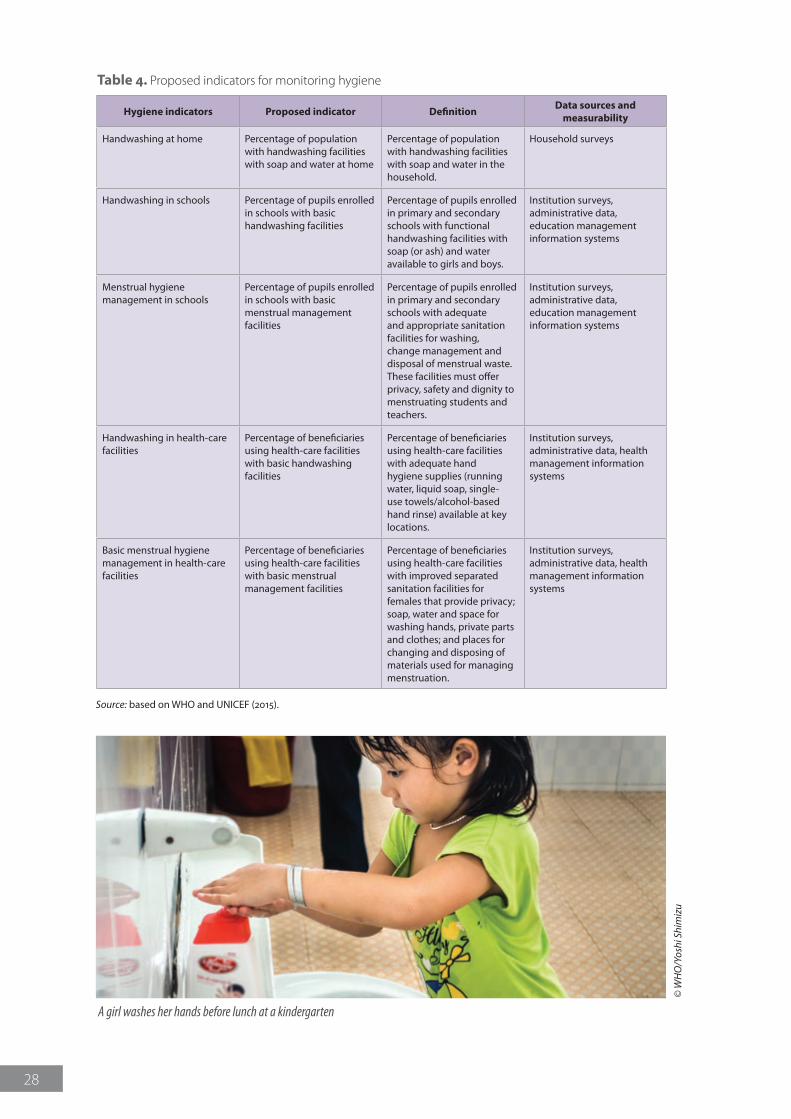
Targets 6.1, 6.2 and 6.3 are of greatest interest to this report. Different formulations of indicators to determine progress in achieving such targets have been proposed over the past few years by different groups, individuals and institutions. The SDG drinking-water, sanitation and hygiene indicators are presented in Tables 2, 3 and 4 (WHO and UNICEF, 2015). The baseline year for measuring progress is 2015. The contribution of the JMP to target 6.3 is indicated in Table 5.
Sanitation service ladder Proposed indicator Definition Data sources and
measurability
Safely managed sanitation
Percentage of population using safely managed sanitation services
Percentage of population using a basic sanitation facility that is not shared with other households and where excreta is safely disposed in situ or treated off-site. This multipurpose indicator also covers the domestic part of wastewater treatment of target 6.3.
Household surveys can provide information on types of sanitation facilities and disposal in situ. Administrative, population and environmental data can be used to estimate safe disposal/treatment of excreta.
Basic sanitationa Percentage of population using a basic sanitation service
Percentage of population using a basic sanitation facility not shared with other households.
Household surveys
Shared sanitation Percentage of population using a shared sanitation service
Percentage of population using a basic sanitation facility shared with other households.
Household surveys
Unimproved sanitationb
Percentage of population using an unimproved sanitation facility
Percentage of population using unimproved sanitation facilities, with or without sharing with other households.
Household surveys
Open defecation Percentage of population practising open defecation
Percentage of population defecating in bushes, fields, open water bodies or other open spaces.
Household surveys
Basic sanitation in schoolsc
Percentage of pupils enrolled in schools that provide basic sanitation services
Percentage of pupils enrolled in primary and secondary schools with basic sanitation facilities that are functional and separated for males and females on or near premises.
Institution surveys, administrative data, education management information systems
Basic sanitation in health-care facilitiesd
Percentage of patients using health-care facilities providing basic sanitation services
Percentage of beneficiaries using health-care facilities with basic sanitation facilities that are functional and separated for males and females on or near premises.
Institution surveys, administrative data, health management information systems
Table 2. Proposed indicators for monitoring sanitation services
a Basic sanitation facilities (MDG “improved sanitation” indicator) include the following: flush/pour-flush toilets to sewer systems, septic tanks or pit latrines, ventilated improved pit latrines, pit latrines with a slab, and composting toilets.
b Unimproved sanitation facilities (MDG “unimproved sanitation” indicator) include the following: flush/pour-flush latrines not connected to sewer/septic/pit, pit latrines without a slab, and hanging and bucket latrines.
c Basic sanitation in schools means at least one toilet/latrine for every 25 girls, at least one toilet/latrine for female school staff, at least one toilet/latrine and one urinal for every 50 boys, and at least one toilet/latrine for male school staff.
d Basic sanitation in health-care facilities means at least one toilet for every 20 users at inpatient centres, and at least four toilets – one each for staff, female, male and child patients – in outpatient centres.
Source: based on WHO and UNICEF (2015).
27
Drinking-water service ladder Proposed indicator Definition Data sources and
measurability
Safely managed water Percentage of population using safely managed drinking-water services
Percentage of population using a basic drinking-water source that is located on premises and available when needed; free of faecal (and priority chemical) contamination.
Household surveys can provide data on basic water on premises, availability when needed and if free from contamination via direct water quality testing. Official drinking-water regulators can provide data on compliance with national standards.
Basic watera Percentage of population using basic drinking-water services
Percentage of population using a basic drinking-water source with a total collection time of no more than 30 minutes for a round trip including queuing.
Household surveys
Unimproved waterb Percentage of population using inadequate sources of drinking-water
Percentage of population using unimproved drinking-water sources or basic drinking-water sources with a total collection time of more than 30 minutes.
Household surveys
Surface waterc Percentage of population using water directly from surface water sources
Percentage of population using surface water sources.
Household surveys
Basic water in schools Percentage of pupils enrolled in schools providing basic water services
Percentage of pupils enrolled in primary and secondary schools with a functional basic drinking-water source on or near premises and water points accessible to all users during school hours.
Institution surveys, administrative data, education management information systems
Basic water in health-care facilities
Percentage of beneficiaries using health-care facilities providing basic water services
Percentage of beneficiaries using health-care facilities with a functional basic water source on premises and water points accessible to all users at all times.
Institution surveys, administrative data, health management information systems
Table 3. Proposed indicators for monitoring drinking-water services
a Basic drinking-water sources (MDG “improved drinking-water” indicator) include the following: piped water into dwelling, yard or plot (on premises); public taps or standpipes; boreholes or tubewells; protected dug wells; protected springs and rainwater. Packaged drinking-water is considered to be a basic source if households use a basic water source for other domestic purposes.
b Unimproved drinking-water sources (MDG “unimproved” indicator) include the following: unprotected dug well, unprotected spring, cart with small tank/drum, and bottled water.
c Surface water includes rivers, dams, lakes, ponds, streams, canals and irrigation channels.
Source: based on WHO and UNICEF (2015).
28
Hygiene indicators Proposed indicator Definition Data sources and measurability
Handwashing at home Percentage of population with handwashing facilities with soap and water at home
Percentage of population with handwashing facilities with soap and water in the household.
Household surveys
Handwashing in schools Percentage of pupils enrolled in schools with basic handwashing facilities
Percentage of pupils enrolled in primary and secondary schools with functional handwashing facilities with soap (or ash) and water available to girls and boys.
Institution surveys, administrative data, education management information systems
Menstrual hygiene management in schools
Percentage of pupils enrolled in schools with basic menstrual management facilities
Percentage of pupils enrolled in primary and secondary schools with adequate and appropriate sanitation facilities for washing, change management and disposal of menstrual waste. These facilities must offer privacy, safety and dignity to menstruating students and teachers.
Institution surveys, administrative data, education management information systems
Handwashing in health-care facilities
Percentage of beneficiaries using health-care facilities with basic handwashing facilities
Percentage of beneficiaries using health-care facilities with adequate hand hygiene supplies (running water, liquid soap, single-use towels/alcohol-based hand rinse) available at key locations.
Institution surveys, administrative data, health management information systems
Basic menstrual hygiene management in health-care facilities
Percentage of beneficiaries using health-care facilities with basic menstrual management facilities
Percentage of beneficiaries using health-care facilities with improved separated sanitation facilities for females that provide privacy; soap, water and space for washing hands, private parts and clothes; and places for changing and disposing of materials used for managing menstruation.
Institution surveys, administrative data, health management information systems
Table 4. Proposed indicators for monitoring hygiene
Source: based on WHO and UNICEF (2015).
© W
HO
/Yos
hi S
him
izu
A girl washes her hands before lunch at a kindergarten
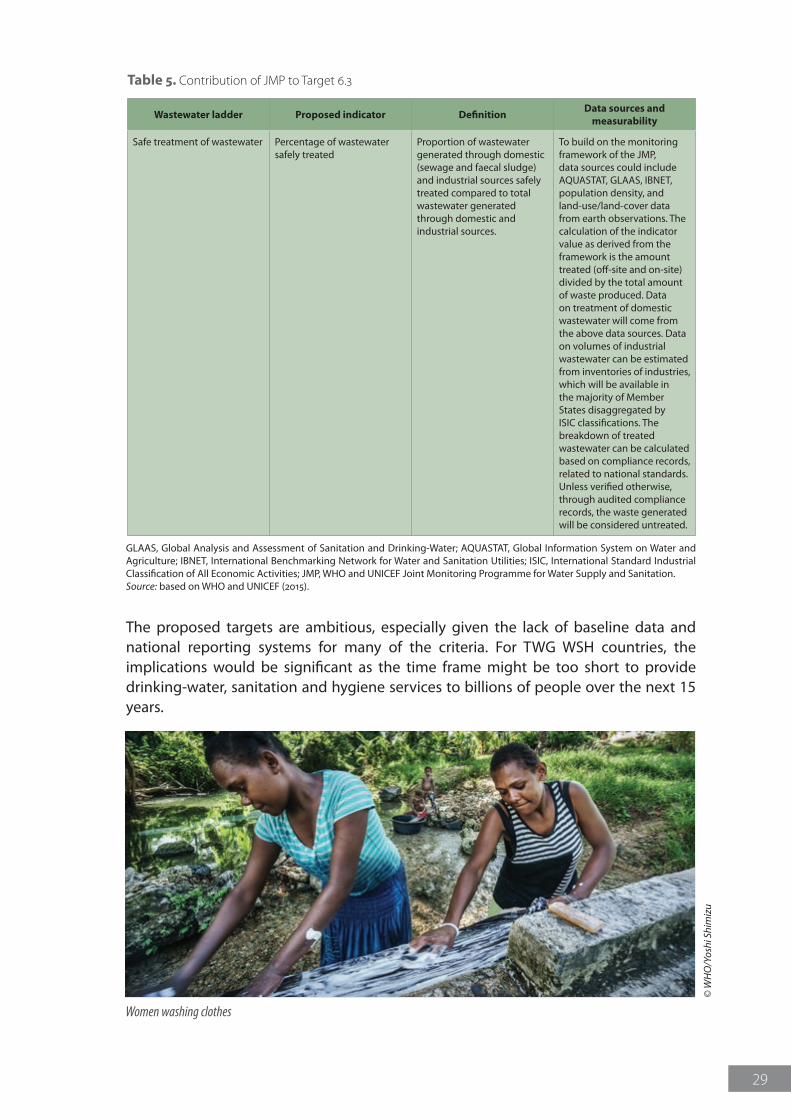
29
Wastewater ladder Proposed indicator Definition Data sources and measurability
Safe treatment of wastewater Percentage of wastewater safely treated
Proportion of wastewater generated through domestic (sewage and faecal sludge) and industrial sources safely treated compared to total wastewater generated through domestic and industrial sources.
To build on the monitoring framework of the JMP, data sources could include AQUASTAT, GLAAS, IBNET, population density, and land-use/land-cover data from earth observations. The calculation of the indicator value as derived from the framework is the amount treated (off-site and on-site) divided by the total amount of waste produced. Data on treatment of domestic wastewater will come from the above data sources. Data on volumes of industrial wastewater can be estimated from inventories of industries, which will be available in the majority of Member States disaggregated by ISIC classifications. The breakdown of treated wastewater can be calculated based on compliance records, related to national standards. Unless verified otherwise, through audited compliance records, the waste generated will be considered untreated.
Table 5. Contribution of JMP to Target 6.3
GLAAS, Global Analysis and Assessment of Sanitation and Drinking-Water; AQUASTAT, Global Information System on Water and Agriculture; IBNET, International Benchmarking Network for Water and Sanitation Utilities; ISIC, International Standard Industrial Classification of All Economic Activities; JMP, WHO and UNICEF Joint Monitoring Programme for Water Supply and Sanitation.Source: based on WHO and UNICEF (2015).
The proposed targets are ambitious, especially given the lack of baseline data and national reporting systems for many of the criteria. For TWG WSH countries, the implications would be significant as the time frame might be too short to provide drinking-water, sanitation and hygiene services to billions of people over the next 15 years.
© W
HO
/Yos
hi S
him
izu
Women washing clothes
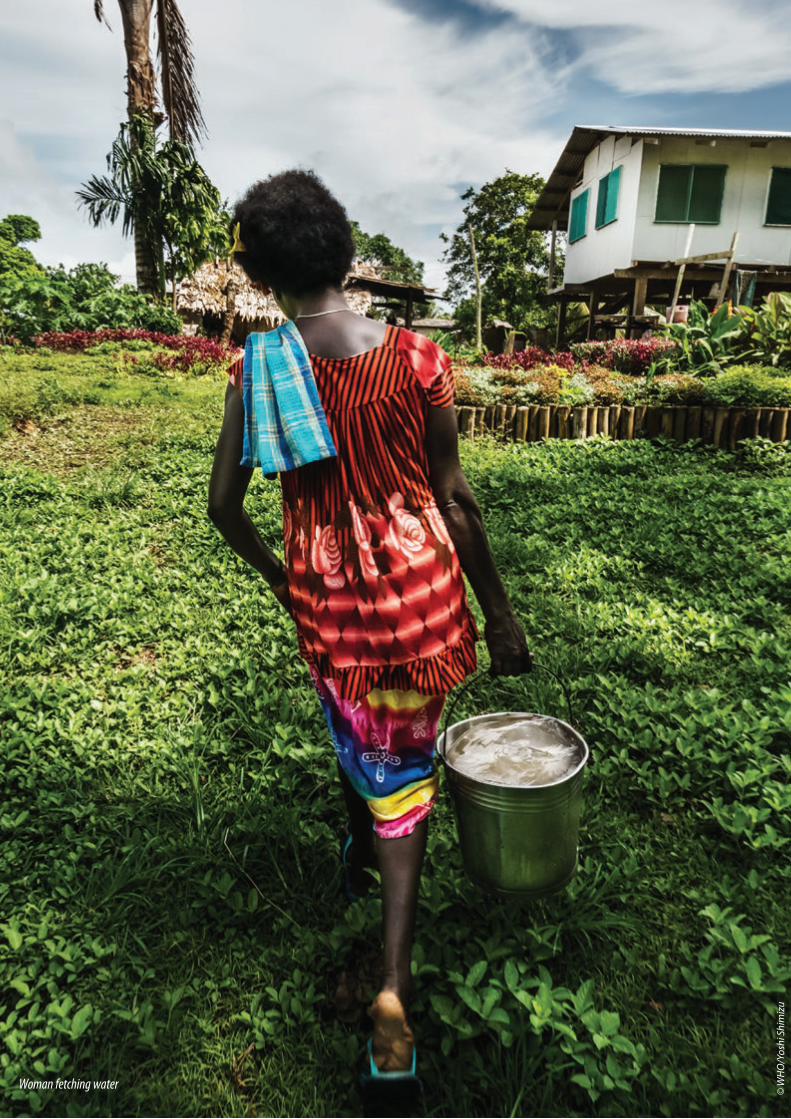
© W
HO
/Yos
hi S
him
izu
Woman fetching water
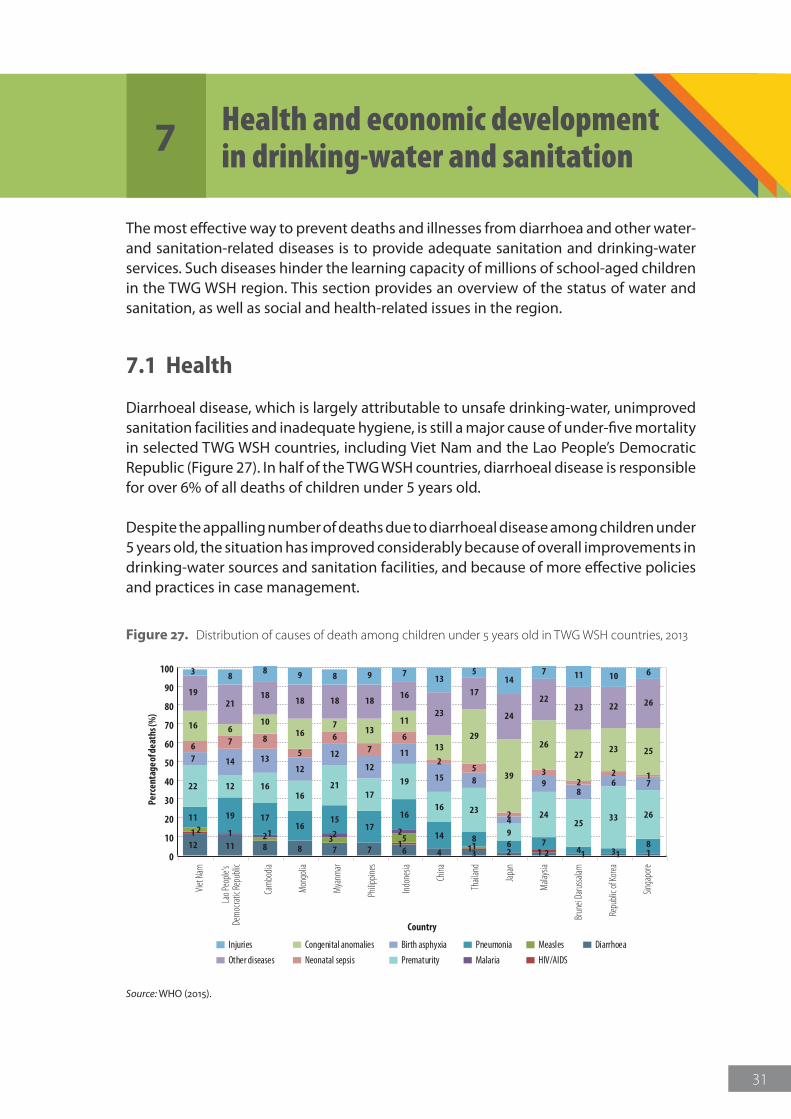
31
The most effective way to prevent deaths and illnesses from diarrhoea and other water- and sanitation-related diseases is to provide adequate sanitation and drinking-water services. Such diseases hinder the learning capacity of millions of school-aged children in the TWG WSH region. This section provides an overview of the status of water and sanitation, as well as social and health-related issues in the region.
7.1 Health
Diarrhoeal disease, which is largely attributable to unsafe drinking-water, unimproved sanitation facilities and inadequate hygiene, is still a major cause of under-five mortality in selected TWG WSH countries, including Viet Nam and the Lao People’s Democratic Republic (Figure 27). In half of the TWG WSH countries, diarrhoeal disease is responsible for over 6% of all deaths of children under 5 years old.
Despite the appalling number of deaths due to diarrhoeal disease among children under 5 years old, the situation has improved considerably because of overall improvements in drinking-water sources and sanitation facilities, and because of more effective policies and practices in case management.
0
10
20
30
40
50
60
70
80
90
100
Japa
n
Repu
blic o
f Kor
ea
Singa
pore
Mala
ysia
Thail
and
Mya
nmar
Viet
Nam
China
Philip
pines
Lao P
eople
’s De
moc
ratic
Repu
blic
Indon
esia
Mon
golia
Cam
bodia
Brun
ei Da
russa
lam
Perc
enta
ge of
deat
hs (%
)
Country
Injuries
Other diseases
Congenital anomalies
Neonatal sepsis
Birth asphyxia
Prematurity
Pneumonia
Malaria
Measles
HIV/AIDS
Diarrhoea
12 11 8 8 7 7 6 4 3 2 2 1 1 1
11 1
1
22 3 5
1
1 1 2 2
11 19 1716
1517
16
14 8 6 74 3
8
22 12 1616
2117
19
16 23
9
2425
33 26
7 14 1312
1212
11
15 8
4
98
6 7
6 7 8
5
67
6
25
2
32
2 1
16 610
167
1311
1329
39
2627
23 25
1921
1818 18 18
16
23
17
24
2223 22 26
3 88 9 8 9 7
135
147 11 10 6
Figure 27. Distribution of causes of death among children under 5 years old in TWG WSH countries, 2013
Source: WHO (2015).
7 Health and economic development in drinking-water and sanitation
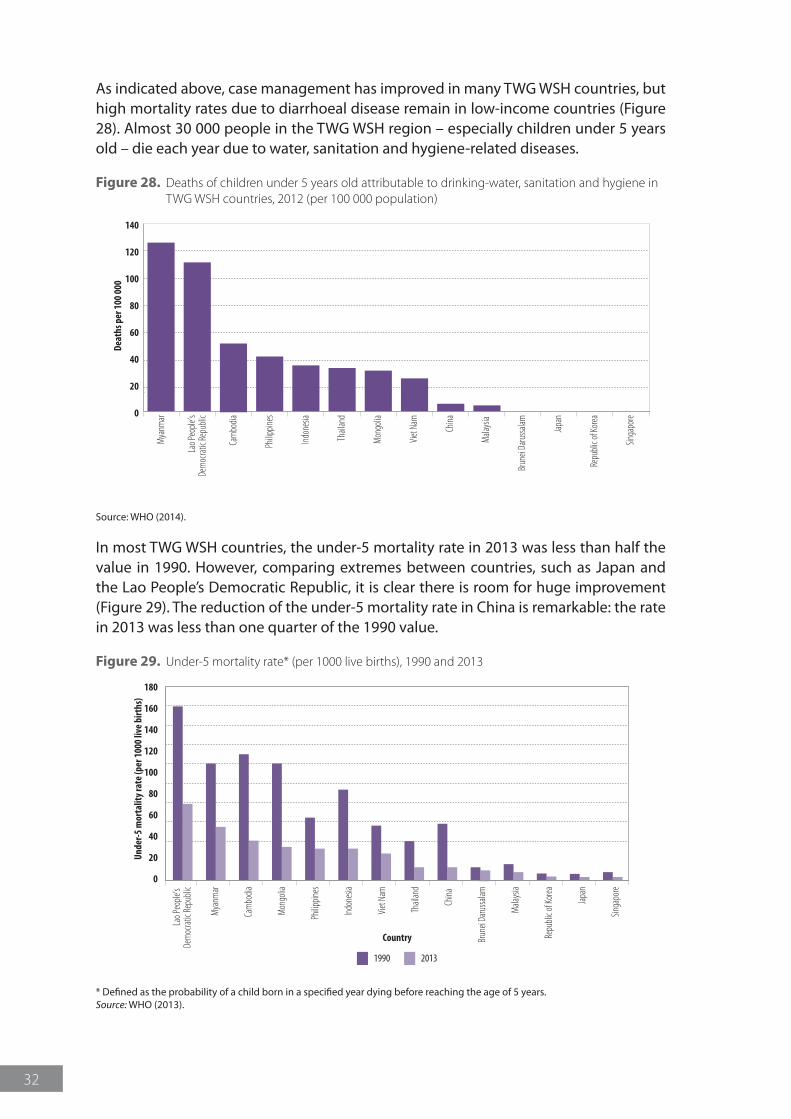
32
As indicated above, case management has improved in many TWG WSH countries, but high mortality rates due to diarrhoeal disease remain in low-income countries (Figure 28). Almost 30 000 people in the TWG WSH region – especially children under 5 years old – die each year due to water, sanitation and hygiene-related diseases.
Figure 28. Deaths of children under 5 years old attributable to drinking-water, sanitation and hygiene in TWG WSH countries, 2012 (per 100 000 population)
0
20
40
60
80
100
120
140
Japa
n
Repu
blic o
f Kor
ea
Singa
pore
Mala
ysia
Thail
and
Mya
nmar
Viet
Nam
China
Philip
pines
Lao P
eople
’sDe
moc
ratic
Repu
blic
Indon
esia
Mon
golia
Cam
bodia
Brun
ei Da
russa
lam
Deat
hs p
er 1
00 0
00
Source: WHO (2014).
In most TWG WSH countries, the under-5 mortality rate in 2013 was less than half the value in 1990. However, comparing extremes between countries, such as Japan and the Lao People’s Democratic Republic, it is clear there is room for huge improvement (Figure 29). The reduction of the under-5 mortality rate in China is remarkable: the rate in 2013 was less than one quarter of the 1990 value.
Figure 29. Under-5 mortality rate* (per 1000 live births), 1990 and 2013
1990 2013
Cam
bodia
Japa
n
Mala
ysia
Singa
pore
Repu
blic o
f Kor
ea
Viet
Nam
Thail
and
China
Indon
esia
Philip
pines
Mya
nmar
Lao P
eople
’s De
moc
ratic
Repu
blic
Mon
golia
Brun
ei Da
russa
lam
0
20
40
60
80
100
140
120
180
160
Unde
r-5 m
orta
lity r
ate
(per
100
0 liv
e bi
rths
)
Country
* Defined as the probability of a child born in a specified year dying before reaching the age of 5 years.Source: WHO (2013).
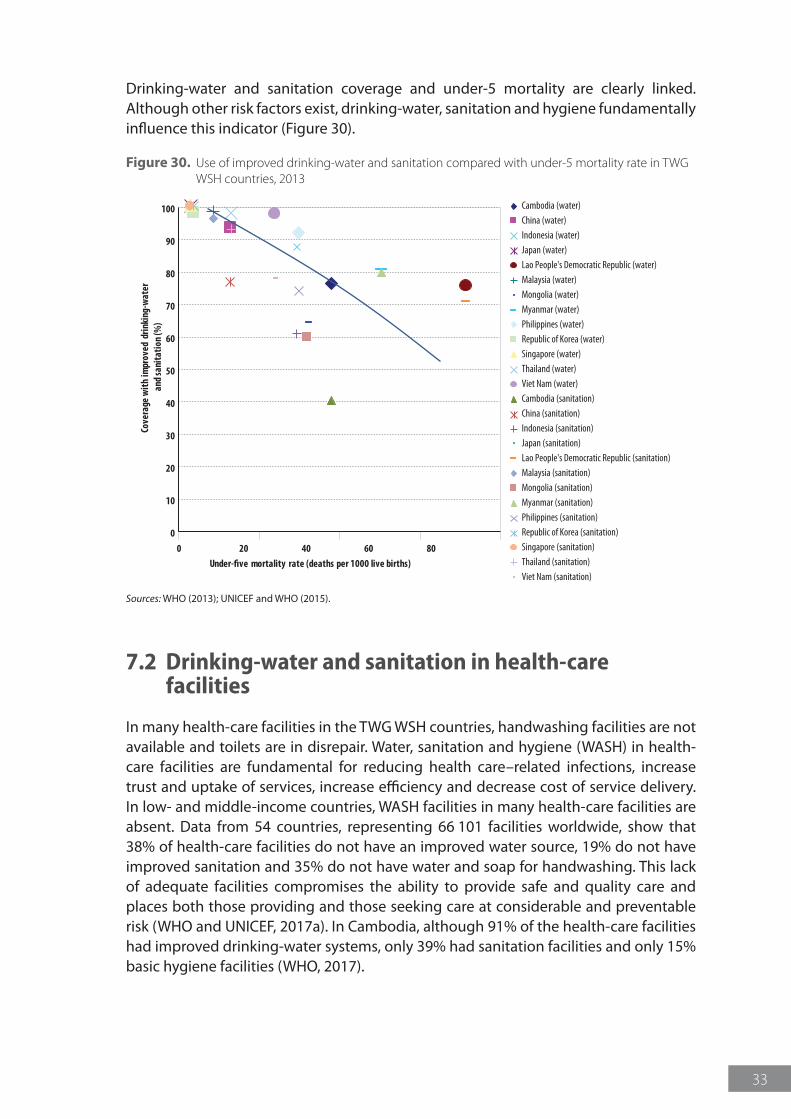
33
Drinking-water and sanitation coverage and under-5 mortality are clearly linked. Although other risk factors exist, drinking-water, sanitation and hygiene fundamentally influence this indicator (Figure 30).
Figure 30. Use of improved drinking-water and sanitation compared with under-5 mortality rate in TWG WSH countries, 2013
0
10
20
30
40
50
60
70
80
90
100
0 20 40 60 80
Cove
rage
with
impr
oved
drin
king
-wat
er a
nd sa
nita
tion
(%)
Under-five mortality rate (deaths per 1000 live births)
Cambodia (water)China (water)Indonesia (water)Japan (water)Lao People's Democratic Republic (water)Malaysia (water)Mongolia (water)Myanmar (water)Philippines (water)Republic of Korea (water)Singapore (water)Thailand (water)Viet Nam (water)Cambodia (sanitation)China (sanitation)Indonesia (sanitation)Japan (sanitation)Lao People's Democratic Republic (sanitation)Malaysia (sanitation)Mongolia (sanitation)Myanmar (sanitation)Philippines (sanitation)Republic of Korea (sanitation)Singapore (sanitation)Thailand (sanitation)Viet Nam (sanitation)
Sources: WHO (2013); UNICEF and WHO (2015).
7.2 Drinking-water and sanitation in health-care facilities
In many health-care facilities in the TWG WSH countries, handwashing facilities are not available and toilets are in disrepair. Water, sanitation and hygiene (WASH) in health-care facilities are fundamental for reducing health care–related infections, increase trust and uptake of services, increase efficiency and decrease cost of service delivery. In low- and middle-income countries, WASH facilities in many health-care facilities are absent. Data from 54 countries, representing 66 101 facilities worldwide, show that 38% of health-care facilities do not have an improved water source, 19% do not have improved sanitation and 35% do not have water and soap for handwashing. This lack of adequate facilities compromises the ability to provide safe and quality care and places both those providing and those seeking care at considerable and preventable risk (WHO and UNICEF, 2017a). In Cambodia, although 91% of the health-care facilities had improved drinking-water systems, only 39% had sanitation facilities and only 15% basic hygiene facilities (WHO, 2017).
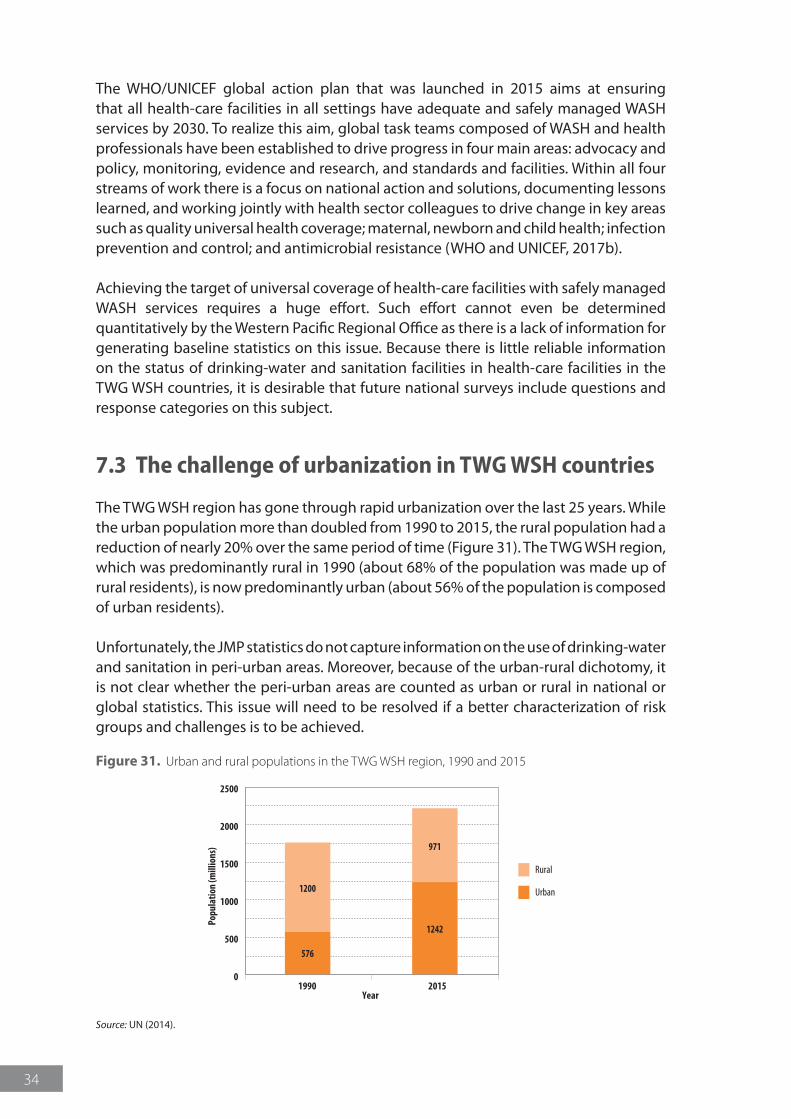
34
The WHO/UNICEF global action plan that was launched in 2015 aims at ensuring that all health-care facilities in all settings have adequate and safely managed WASH services by 2030. To realize this aim, global task teams composed of WASH and health professionals have been established to drive progress in four main areas: advocacy and policy, monitoring, evidence and research, and standards and facilities. Within all four streams of work there is a focus on national action and solutions, documenting lessons learned, and working jointly with health sector colleagues to drive change in key areas such as quality universal health coverage; maternal, newborn and child health; infection prevention and control; and antimicrobial resistance (WHO and UNICEF, 2017b).
Achieving the target of universal coverage of health-care facilities with safely managed WASH services requires a huge effort. Such effort cannot even be determined quantitatively by the Western Pacific Regional Office as there is a lack of information for generating baseline statistics on this issue. Because there is little reliable information on the status of drinking-water and sanitation facilities in health-care facilities in the TWG WSH countries, it is desirable that future national surveys include questions and response categories on this subject.
7.3 The challenge of urbanization in TWG WSH countries
The TWG WSH region has gone through rapid urbanization over the last 25 years. While the urban population more than doubled from 1990 to 2015, the rural population had a reduction of nearly 20% over the same period of time (Figure 31). The TWG WSH region, which was predominantly rural in 1990 (about 68% of the population was made up of rural residents), is now predominantly urban (about 56% of the population is composed of urban residents).
Unfortunately, the JMP statistics do not capture information on the use of drinking-water and sanitation in peri-urban areas. Moreover, because of the urban-rural dichotomy, it is not clear whether the peri-urban areas are counted as urban or rural in national or global statistics. This issue will need to be resolved if a better characterization of risk groups and challenges is to be achieved.
Figure 31. Urban and rural populations in the TWG WSH region, 1990 and 2015
0
500
1000
1500
2000
2500
Rural
Urban
1990Year
Popu
latio
n (m
illio
ns)
576
1200
1242
971
2015
Source: UN (2014).
35
References
Hutton G (2012). Global costs and benefits of drinking-water supply and sanitation interventions to reach the MDG target and universal coverage. Geneva: World Health Organization (http://www.who.int/water_sanitation_health/publications/2012/global_costs/en/, accessed 16 August 2017).
IPCC (2014). Summary for policymakers. In: Climate change 2014: Impacts, Adaptation, and Vulnerability. Part A: global and sectoral aspects. Contribution of Working Group II to the Fifth Assessment Report of the Intergovernmental Panel on Climate Change. New York, NY: Cambridge University Press; 1–32 (http://www.ipcc.ch/pdf/assessment-report/ar5/wg2/ar5_wgII_spm_en.pdf; accessed 16 August 2017).
Lenton R, Wright A, Lewis K (2005). Health, dignity and development: What will it take? New York, NY: UN Millennium Project Task Force on Water and Sanitation.
MoH and LSB (2012). Lao PDR Social Indicator Survey 2011-12 (Multiple Indicator Cluster Survey/Demographic and Health Survey). Vientiane: Ministry of Health and Lao Statistics Bureau (http://dhsprogram.com/pubs/pdf/FR268/FR268.pdf, accessed 16 August 2017).
Prüss-Üstün A, Bos R, Gore F, Bartram J (2008). Safer water, better health: Costs, benefits and sustainability of interventions to protect and promote health. Geneva: World Health Organization (http://apps.who.int/iris/bitstream/10665/43840/1/9789241596435_eng.pdf; accessed 16 August 2017).
UN (2014). World urbanization prospects: The 2014 revision [CD-ROM]. New York, NY: United Nations.
UN (2015). Transforming our world: The 2030 Agenda for Sustainable Development. New York, NY: United Nations (https://sustainabledevelopment.un.org/post2015/transformingourworld/publication, accessed 16 August 2017).
UN (2017). Millennium Summit [website]. New York, NY: United Nations (http://www.un.org/millenniumgoals/bkgd.shtml, accessed 16 August 2017).
UN and WHO (2014). UN-Water Global Analysis and Assessment of Sanitation and Drinking-water (GLAAS) 2014 – report: Investing in water and sanitation: increasing access, reducing inequalities. Geneva: World Health Organization (http://www.who.int/water_sanitation_health/publications/glaas_report_2014/en/, accessed 16 August 2017).
UNICEF (2012). Water, sanitation and hygiene (WASH) in schools. New York: United Nations Children’s Fund (http://www.unicef.org/publications/files/CFS_WASH_E_web.pdf, accessed 16 August 2017).
UNICEF and WHO (2015). Progress on sanitation and drinking water – 2015 update and MDG assessment. Geneva: United Nations Children’s Fund and World Health Organization (http://apps.who.int/iris/bitstream/10665/177752/1/9789241509145_eng.pdf?ua=1, accessed 16 August 2017).

36
WHO (2008). Guidelines for drinking-water quality. Third edition: Incorporating the first and second addenda. Volume 1: Recommendations. Geneva: World Health Organization (http://www.who.int/water_sanitation_health/dwq/fulltext.pdf, accessed 16 August 2017).
WHO (2013). World health statistics 2013. Geneva: World Health Organization (http://www.who.int/gho/publications/world_health_statistics/2013/en/; accessed 16 August 2017).
WHO (2014). Preventing diarrhoea through better water, sanitation and hygiene: exposures and impacts in low- and middle-income countries. Geneva: World Health Organization (http://apps.who.int/iris/bitstream/10665/150112/1/9789241564823_eng.pdf; accessed 16 August 2017).
WHO (2017). Achieving quality universal health coverage through better water, sanitation and hygiene services in health care facilities: a brief focus on Cambodia and Ethiopia. Geneva: World Health Organization (http://www.who.int/water_sanitation_health/publications/uhc-thru-better-wash.pdf, accessed 16 January 2018).
WHO and UNICEF (2013). Progress on sanitation and drinking-water: 2013 update. Geneva: World Health Organization (http://apps.who.int/iris/bitstream/10665/81245/1/9789241505390_eng.pdf, accessed 16 August 2017).
WHO and UNICEF (2015). WASH POST-2015: proposed indicators for drinking water, sanitation and hygiene. Geneva: World Health Organization and United Nations Children’s Fund (http://www.who.int/water_sanitation_health/monitoring/coverage/wash-post-2015-rev.pdf?ua=1/; accessed 16 August 2017).
WHO and UNICEF (2017). WASH in the 2030 agenda: New global indicators for water, sanitation and hygiene. Geneva: World Health Organization and United Nations Children’s Fund (https://washdata.org/reports, accessed 17 August 2017).
WHO and UNICEF (2017a). Progress on drinking water, sanitation and hygiene: 2017 update and SDG baselines. Geneva: World Health Organization and United Nations Children’s Fund (https://washdata.org/report/jmp-2017-report-final-en, accessed 16 January 2018).
WHO and UNICEF (2017b). WASH in health care facilities: global action to provide universal access by 2030 [website]. Geneva: World Health Organization (https://www.washinhcf.org/home/, accessed 16 January 2018).
World Bank (2017). GDP per capita (current US$) [website]. Washington, DC: World Bank (http://data.worldbank.org/indicator/NY.GDP.PCAP.CD, accessed 16 August 2017).
37
AnnexAnnex 1. Definitions of the post-2015 terms proposed by
the JMP (WHO and UNICEF, 2017)Open defecation: defecation in which excreta of adults or children are deposited (directly or after being covered by a layer of earth) in the bush, a field, a beach or other open area; are discharged into a drainage channel, river, sea or other water body; or are wrapped in temporary material and discarded.
Basic drinking-water service at home: households are considered to have a basic drinking-water service when they use water from an improved source (pre-2015 JMP definitions in rural areas; piped water into dwelling, yard or plot, or a standpipe/public tap or a tubewell/borehole in urban areas) with a total collection time of 30 minutes or less for a round trip, including queuing.
Basic handwashing facilities at home: handwashing facilities, with soap and water, available near sanitation facilities and where food is prepared or consumed.
Adequate sanitation facilities in schools and health centres: facilities that effectively separate excreta from human contact, and ensure that excreta do not re-enter the immediate environment. An adequate school or health centre sanitation facility:
zz is located in close proximity to the school or health centre;zz is accessible to all users, including adults and children, the elderly, and those
with physical disabilities;zz provides separate facilities for males and females (boys and girls at school), and
for adults and children;zz is equipped with handwashing stations that include soap and water and are
inside or immediately outside the sanitation facility;zz provides adequate menstrual management facilities in sanitation facilities that
are used by women and girls of menstruating age;zz at schools, provides at least one toilet per 25 girls and at least one toilet for
female school staff, as well as a minimum of one toilet plus one urinal (or 50 centimetres of urinal wall) per 50 boys, and at least one toilet for male school staff;
zz at inpatient health centres, includes at least one toilet per 20 users; andzz at outpatient health centres, includes at least four toilets – one each for staff,
female patients, male patients and child patients.
Basic drinking-water service in schools: water from an improved source on premises (in rural, pre-2015 JMP definitions; in urban, piped water into school, yard or plot or a stand pipe/public tap or a tubewell/borehole) capable of delivering sufficient water at all times for drinking, personal hygiene and, where appropriate, food preparation, cleaning and laundry.
Basic drinking-water service in health centres: water from an improved source on premises (in rural, pre-2015 JMP definitions; in urban, piped water into health centre
38
yard or plot or a stand pipe/public tap or a tubewell/borehole) capable of delivering the minimum quantity of water that is required for different situations in the health-care setting as defined by WHO (2008). Drinking-water points are accessible to all users, including those with disabilities, throughout the school day.
Adequate menstrual hygiene management facilities in schools and health centres: facilities that provide privacy for changing materials and for washing hands, private parts and clothes with soap and water; include access to water and soap within a place that provides an adequate level of privacy for washing stains from clothes and drying reusable menstrual materials; include disposal facilities for used menstrual materials (from collection point to final disposal).
Adequate handwashing facilities in schools and health centres: handwashing facilities, with soap and water, available inside or immediately outside sanitation facilities, where food is prepared or consumed, and in patient-care areas.
Intermediate drinking-water services at home: households are considered to have intermediate drinking-water service when they use water from an improved source (pre-2015 JMP definitions in rural areas; piped water into dwelling, yard or plot, or a tubewell/borehole in urban areas) located on their premises, which delivers an acceptable quantity of water with only moderate levels of discontinuity (non-functional for no more than two days in the last two weeks), water quality at source meets a threshold of less than 10 colony-forming units (cfu) Escherichia coli (E. coli ) per 100 millilitres year-round, and the water point is accessible to all household members at the times they need it.
Adequate sanitation at home: each of the following sanitation facility types is considered as adequate sanitation for monitoring progress towards the household sanitation targets, if the facility is shared among no more than five families or 30 people, whichever is fewer:
zz a pit latrine with a superstructure, and a platform or squatting slab constructed of durable material (a variety of latrine types can fall under this category, including composting latrines, pour-flush latrines, and ventilated improved pit latrines);
zz a toilet connected to a septic tank; orzz a toilet connected to a sewer (small bore or conventional).
Safe management of household excreta: the containment, extraction and transport of excreta to a designated disposal or treatment site, or the safe reuse of excreta at the household or community level, as appropriate to the local context. The share of households with safely managed excreta is defined as the fraction of households whose excreta:
zz are carried through a sewer network to a designated location (e.g. treatment facility);
zz are hygienically collected from septic tanks or latrine pits by a suction truck (or similar equipment that limits human contact) and transported to a designated location (e.g. treatment facility or solid waste collection site); or
zz are stored on site (e.g. in a sealed latrine pit) until they are safe to handle and reuse (e.g. as an agricultural input).
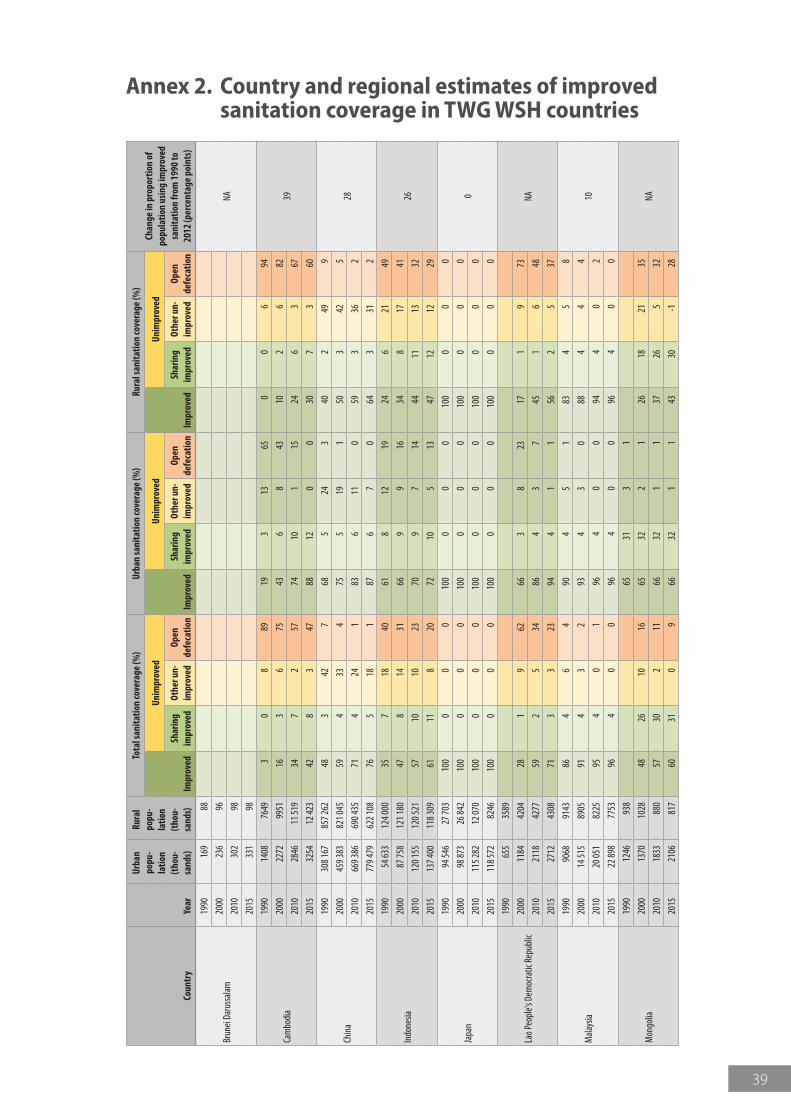
39
Annex 2. Country and regional estimates of improved sanitation coverage in TWG WSH countries
Coun
try
Year
Urba
n po
pu-
latio
n (t
hou-
sand
s)
Rura
l po
pu-
latio
n (t
hou-
sand
s)
Tota
l san
itatio
n co
vera
ge (%
)Ur
ban
sani
tatio
n co
vera
ge (%
)Ru
ral s
anita
tion
cove
rage
(%)
Chan
ge in
pro
port
ion
of
popu
latio
n us
ing
impr
oved
sa
nita
tion
from
199
0 to
20
12 (p
erce
ntag
e po
ints
)Im
prov
ed
Unim
prov
ed
Impr
oved
Unim
prov
ed
Impr
oved
Unim
prov
ed
Shar
ing
impr
oved
Othe
r un-
impr
oved
Open
de
feca
tion
Shar
ing
impr
oved
Othe
r un-
impr
oved
Open
de
feca
tion
Shar
ing
impr
oved
Othe
r un-
impr
oved
Open
de
feca
tion
Brun
ei Da
russ
alam
1990
169
88
NA20
0023
696
2010
302
98
2015
331
98
Cam
bodi
a
1990
1408
7649
30
889
193
1365
00
694
3920
0022
7299
5116
36
7543
68
4310
26
82
2010
2846
11 51
934
72
5774
101
1524
63
67
2015
3254
12 42
342
83
4788
120
030
73
60
Chin
a
1990
308 1
6785
7 262
483
427
685
243
402
499
2820
0045
9 383
821 0
4559
433
475
519
150
342
5
2010
669 3
8669
0 435
714
241
836
110
593
362
2015
779 4
7962
2 108
765
181
876
70
643
312
Indo
nesia
1990
54 63
312
4 000
357
1840
618
1219
246
2149
2620
0087
758
121 1
8047
814
3166
99
1634
817
41
2010
120 1
5512
0 521
5710
1023
709
714
4411
1332
2015
137 4
0011
8 309
6111
820
7210
513
4712
1229
Japa
n
1990
94 54
627
703
100
00
010
00
00
100
00
0
020
0098
873
26 84
210
00
00
100
00
010
00
00
2010
115 2
8212
070
100
00
010
00
00
100
00
0
2015
118 5
7282
4610
00
00
100
00
010
00
00
Lao P
eopl
e's D
emoc
ratic
Rep
ublic
1990
655
3589
NA20
0011
8442
0428
19
6266
38
2317
19
73
2010
2118
4277
592
534
864
37
451
648
2015
2712
4308
713
323
944
11
562
537
Mala
ysia
1990
9068
9143
864
64
904
51
834
58
1020
0014
515
8905
914
32
934
30
884
44
2010
20 05
182
2595
40
196
40
094
40
2
2015
22 89
877
5396
40
096
40
096
40
0
Mon
golia
1990
1246
938
6531
31
NA20
0013
7010
2848
2610
1665
322
126
1821
35
2010
1833
880
5730
211
6632
11
3726
532
2015
2106
817
6031
09
6632
11
4330
-128
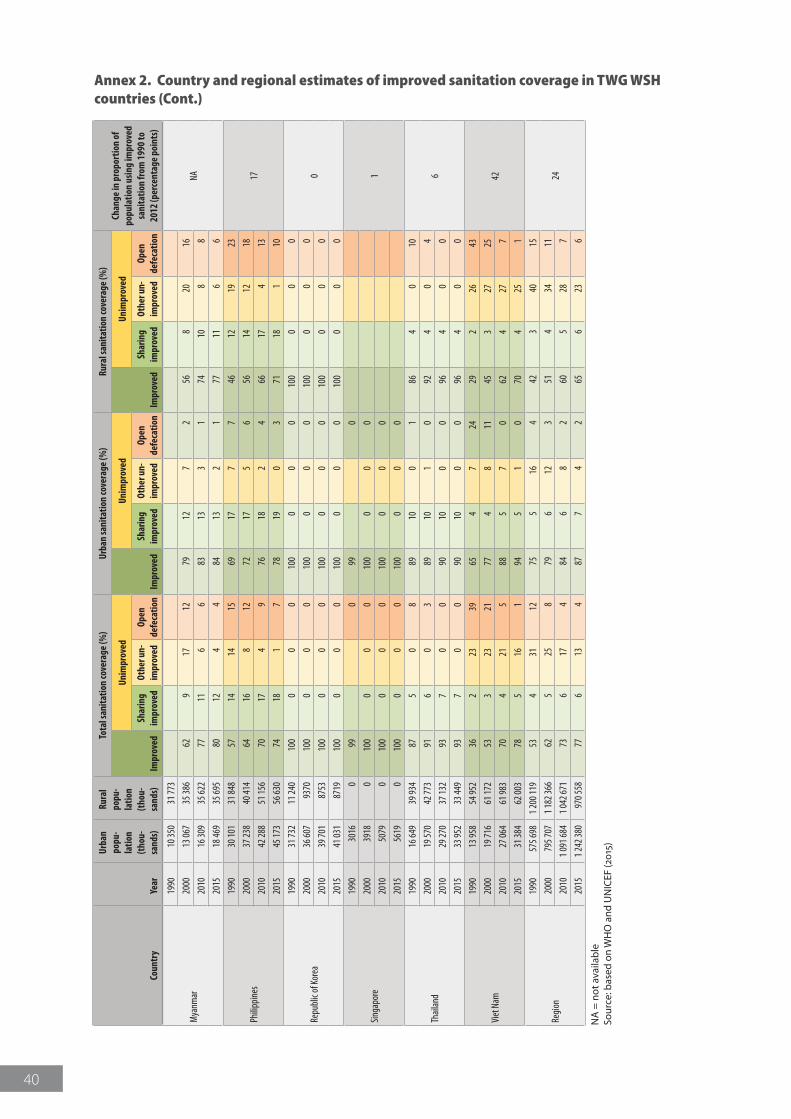
40
Coun
try
Year
Urba
n po
pu-
latio
n (t
hou-
sand
s)
Rura
l po
pu-
latio
n (t
hou-
sand
s)
Tota
l san
itatio
n co
vera
ge (%
)Ur
ban
sani
tatio
n co
vera
ge (%
)Ru
ral s
anita
tion
cove
rage
(%)
Chan
ge in
pro
port
ion
of
popu
latio
n us
ing
impr
oved
sa
nita
tion
from
199
0 to
20
12 (p
erce
ntag
e po
ints
)Im
prov
ed
Unim
prov
ed
Impr
oved
Unim
prov
ed
Impr
oved
Unim
prov
ed
Shar
ing
impr
oved
Othe
r un-
impr
oved
Open
de
feca
tion
Shar
ing
impr
oved
Othe
r un-
impr
oved
Open
de
feca
tion
Shar
ing
impr
oved
Othe
r un-
impr
oved
Open
de
feca
tion
Mya
nmar
1990
10 35
031
773
NA20
0013
067
35 38
662
917
1279
127
256
820
16
2010
16 30
935
622
7711
66
8313
31
7410
88
2015
18 46
935
695
8012
44
8413
21
7711
66
Philip
pine
s
1990
30 10
131
848
5714
1415
6917
77
4612
1923
1720
0037
238
40 41
464
168
1272
175
656
1412
18
2010
42 28
851
156
7017
49
7618
24
6617
413
2015
45 17
356
630
7418
17
7819
03
7118
110
Repu
blic
of Ko
rea
1990
31 73
211
240
100
00
010
00
00
100
00
0
020
0036
607
9370
100
00
010
00
00
100
00
0
2010
39 70
187
5310
00
00
100
00
010
00
00
2015
41 03
187
1910
00
00
100
00
010
00
00
Singa
pore
1990
3016
099
099
0
120
0039
180
100
00
010
00
00
2010
5079
010
00
00
100
00
0
2015
5619
010
00
00
100
00
0
Thail
and
1990
16 64
939
934
875
08
8910
01
864
010
620
0019
570
42 77
391
60
389
101
092
40
4
2010
29 27
037
132
937
00
9010
00
964
00
2015
33 95
233
449
937
00
9010
00
964
00
Viet
Nam
1990
13 95
854
952
362
2339
654
724
292
2643
4220
0019
716
61 17
253
323
2177
48
1145
327
25
2010
27 06
461
983
704
215
885
70
624
277
2015
31 38
462
003
785
161
945
10
704
251
Regi
on
1990
575 6
981 2
00 11
953
431
1275
516
442
340
15
2420
0079
5 707
1 182
366
625
258
796
123
514
3411
2010
1 091
684
1 042
671
736
174
846
82
605
287
2015
1 242
380
970 5
5877
613
487
74
265
623
6
NA
= n
ot a
vaila
ble
Sour
ce: b
ased
on
WH
O a
nd U
NIC
EF (2
015)
Annex 2. Country and regional estimates of improved sanitation coverage in TWG WSH countries (Cont.)
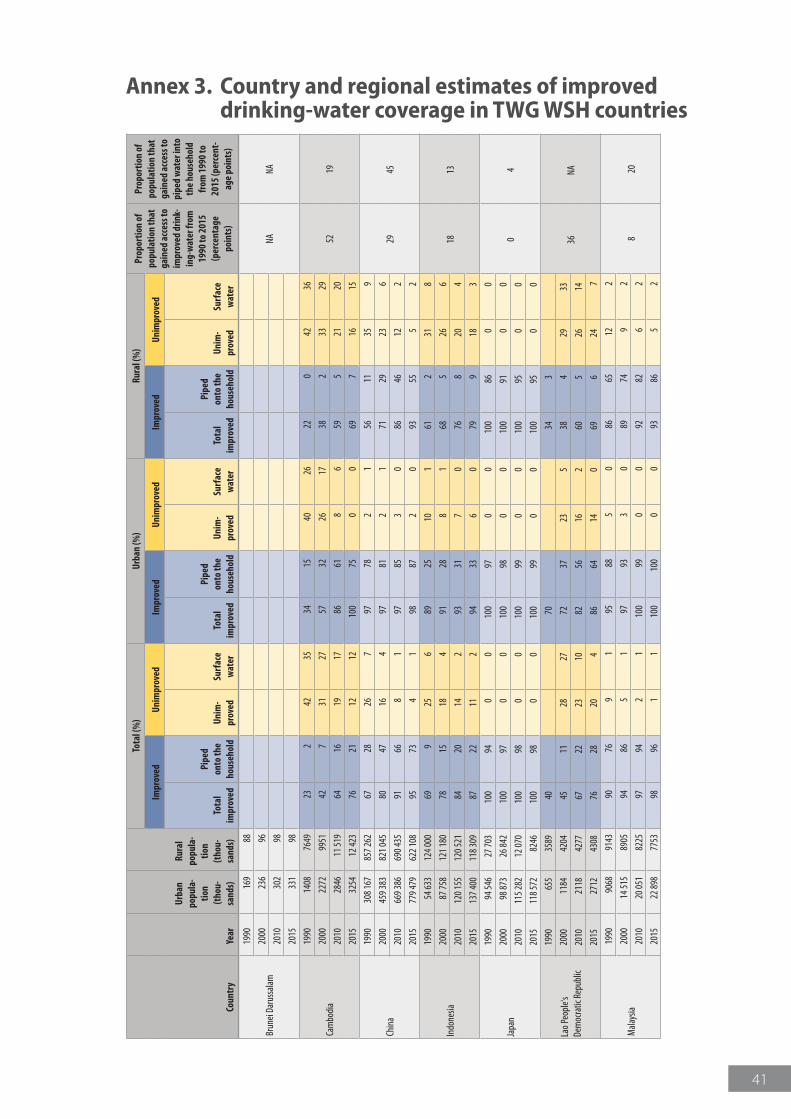
41
Annex 3. Country and regional estimates of improved drinking-water coverage in TWG WSH countries
Coun
try
Year
Urba
n po
pula
-tio
n (t
hou-
sand
s)
Rura
l po
pula
-tio
n
(tho
u-sa
nds)
Tota
l (%
)Ur
ban
(%)
Rura
l (%
)Pr
opor
tion
of
popu
latio
n th
at
gain
ed a
cces
s to
impr
oved
drin
k-in
g-w
ater
from
19
90 to
201
5 (p
erce
ntag
e po
ints
)
Prop
ortio
n of
po
pula
tion
that
ga
ined
acc
ess t
o pi
ped
wat
er in
to
the
hous
ehol
d fr
om 1
990
to
2015
(per
cent
-ag
e po
ints
)
Impr
oved
Unim
prov
edIm
prov
edUn
impr
oved
Impr
oved
Unim
prov
ed
Tota
l im
prov
ed
Pipe
d
onto
the
hous
ehol
dUn
im-
prov
edSu
rfac
e w
ater
Tota
l im
prov
ed
Pipe
d
onto
the
hous
ehol
dUn
im-
prov
edSu
rfac
e w
ater
Tota
l im
prov
ed
Pipe
d
onto
the
hous
ehol
dUn
im-
prov
edSu
rfac
e w
ater
Brun
ei Da
russ
alam
1990
169
88
NANA
2000
236
96
2010
302
98
2015
331
98
Cam
bodi
a
1990
1408
7649
232
4235
3415
4026
220
4236
5219
2000
2272
9951
427
3127
5732
2617
382
3329
2010
2846
11 51
964
1619
1786
618
659
521
20
2015
3254
12 42
376
2112
1210
075
00
697
1615
Chin
a
1990
308 1
6785
7 262
6728
267
9778
21
5611
359
2945
2000
459 3
8382
1 045
8047
164
9781
21
7129
236
2010
669 3
8669
0 435
9166
81
9785
30
8646
122
2015
779 4
7962
2 108
9573
41
9887
20
9355
52
Indo
nesia
1990
54 63
312
4 000
699
256
8925
101
612
318
1813
2000
87 75
812
1 180
7815
184
9128
81
685
266
2010
120 1
5512
0 521
8420
142
9331
70
768
204
2015
137 4
0011
8 309
8722
112
9433
60
799
183
Japa
n
1990
94 54
627
703
100
940
010
097
00
100
860
0
04
2000
98 87
326
842
100
970
010
098
00
100
910
0
2010
115 2
8212
070
100
980
010
099
00
100
950
0
2015
118 5
7282
4610
098
00
100
990
010
095
00
Lao P
eopl
e's
Dem
ocra
tic R
epub
lic
1990
655
3589
4070
343
36NA
2000
1184
4204
4511
2827
7237
235
384
2933
2010
2118
4277
6722
2310
8256
162
605
2614
2015
2712
4308
7628
204
8664
140
696
247
Mala
ysia
1990
9068
9143
9076
91
9588
50
8665
122
820
2000
14 51
589
0594
865
197
933
089
749
2
2010
20 05
182
2597
942
110
099
00
9282
62
2015
22 89
877
5398
961
110
010
00
093
865
2
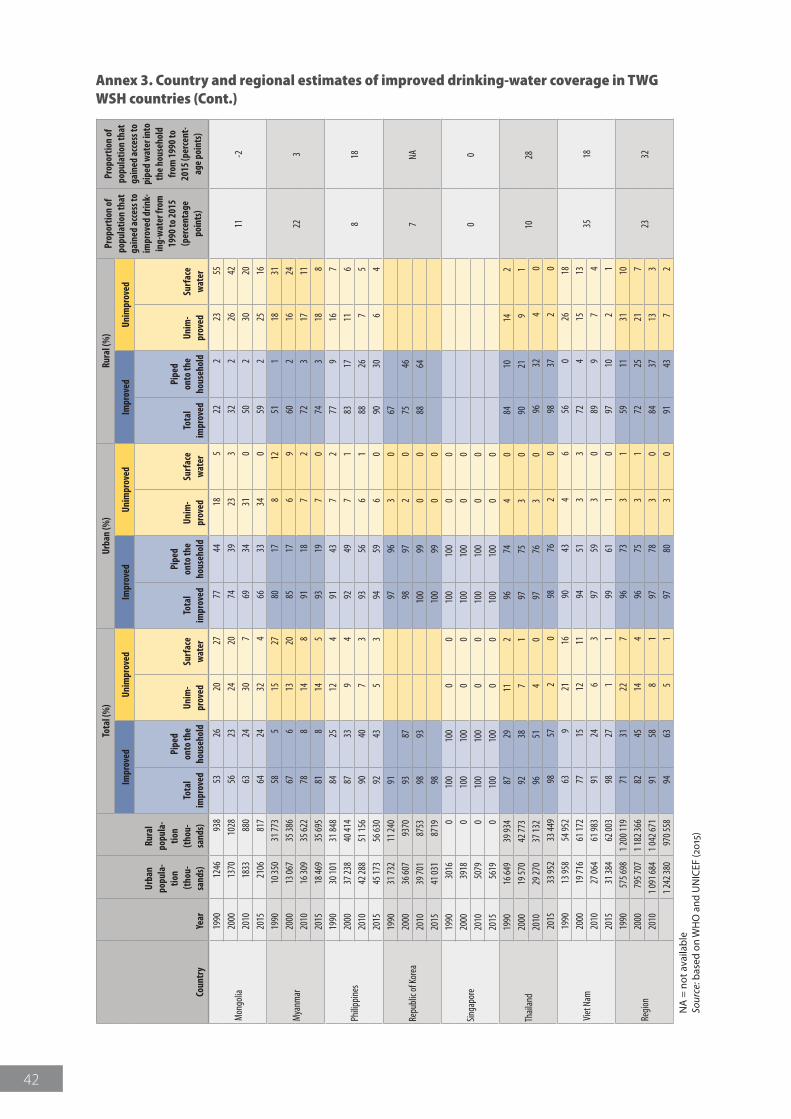
42
Coun
try
Year
Urba
n po
pula
-tio
n (t
hou-
sand
s)
Rura
l po
pula
-tio
n
(tho
u-sa
nds)
Tota
l (%
)Ur
ban
(%)
Rura
l (%
)Pr
opor
tion
of
popu
latio
n th
at
gain
ed a
cces
s to
impr
oved
drin
k-in
g-w
ater
from
19
90 to
201
5 (p
erce
ntag
e po
ints
)
Prop
ortio
n of
po
pula
tion
that
ga
ined
acc
ess t
o pi
ped
wat
er in
to
the
hous
ehol
d fr
om 1
990
to
2015
(per
cent
-ag
e po
ints
)
Impr
oved
Unim
prov
edIm
prov
edUn
impr
oved
Impr
oved
Unim
prov
ed
Tota
l im
prov
ed
Pipe
d
onto
the
hous
ehol
dUn
im-
prov
edSu
rfac
e w
ater
Tota
l im
prov
ed
Pipe
d
onto
the
hous
ehol
dUn
im-
prov
edSu
rfac
e w
ater
Tota
l im
prov
ed
Pipe
d
onto
the
hous
ehol
dUn
im-
prov
edSu
rfac
e w
ater
Mon
golia
1990
1246
938
5326
2027
7744
185
222
2355
11-2
2000
1370
1028
5623
2420
7439
233
322
2642
2010
1833
880
6324
307
6934
310
502
3020
2015
2106
817
6424
324
6633
340
592
2516
Mya
nmar
1990
10 35
031
773
585
1527
8017
812
511
1831
223
2000
13 06
735
386
676
1320
8517
69
602
1624
2010
16 30
935
622
788
148
9118
72
723
1711
2015
18 46
935
695
818
145
9319
70
743
188
Philip
pine
s
1990
30 10
131
848
8425
124
9143
72
779
167
818
2000
37 23
840
414
8733
94
9249
71
8317
116
2010
42 28
851
156
9040
73
9356
61
8826
75
2015
45 17
356
630
9243
53
9459
60
9030
64
Repu
blic
of Ko
rea
1990
31 73
211
240
9197
963
067
7NA
2000
36 60
793
7093
8798
972
075
4620
1039
701
8753
9893
100
990
088
6420
1541
031
8719
9810
099
00
Singa
pore
1990
3016
010
010
00
010
010
00
0
00
2000
3918
010
010
00
010
010
00
020
1050
790
100
100
00
100
100
00
2015
5619
010
010
00
010
010
00
0
Thail
and
1990
16 64
939
934
8729
112
9674
40
8410
142
1028
2000
19 57
042
773
9238
71
9775
30
9021
91
2010
29 27
037
132
9651
40
9776
30
9632
40
2015
33 95
233
449
9857
20
9876
20
9837
20
Viet
Nam
1990
13 95
854
952
639
2116
9043
46
560
2618
3518
2000
19 71
661
172
7715
1211
9451
33
724
1513
2010
27 06
461
983
9124
63
9759
30
899
74
2015
31 38
462
003
9827
11
9961
10
9710
21
Regi
on
1990
575 6
981 2
00 11
971
3122
796
733
159
1131
10
2332
2000
795 7
071 1
82 36
682
4514
496
753
172
2521
720
101 0
91 68
41 0
42 67
191
588
197
783
084
3713
31 2
42 38
097
0 558
9463
51
9780
30
9143
72
NA
= n
ot a
vaila
ble
Sour
ce: b
ased
on
WH
O a
nd U
NIC
EF (2
015)
Annex 3. Country and regional estimates of improved drinking-water coverage in TWG WSH countries (Cont.)
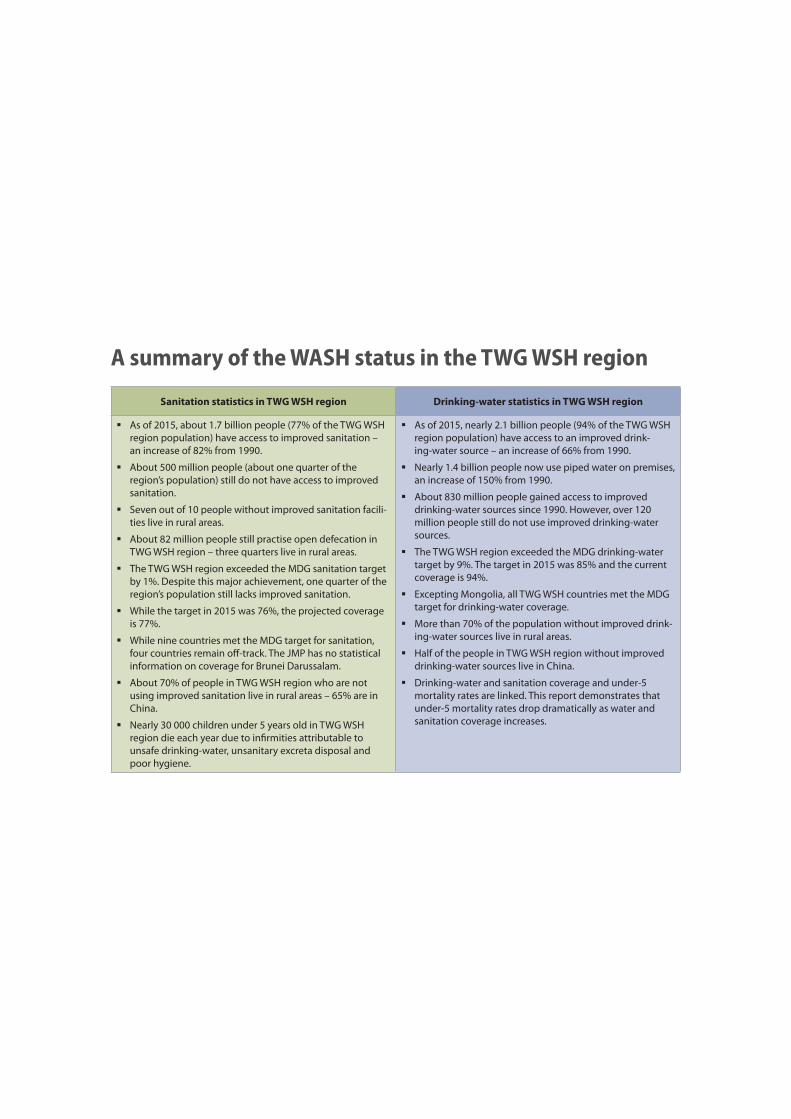
A summary of the WASH status in the TWG WSH region
Sanitation statistics in TWG WSH region Drinking-water statistics in TWG WSH region
� As of 2015, about 1.7 billion people (77% of the TWG WSH region population) have access to improved sanitation – an increase of 82% from 1990.
� About 500 million people (about one quarter of the region’s population) still do not have access to improved sanitation.
� Seven out of 10 people without improved sanitation facili-ties live in rural areas.
� About 82 million people still practise open defecation in TWG WSH region – three quarters live in rural areas.
� The TWG WSH region exceeded the MDG sanitation target by 1%. Despite this major achievement, one quarter of the region’s population still lacks improved sanitation.
� While the target in 2015 was 76%, the projected coverage is 77%.
� While nine countries met the MDG target for sanitation, four countries remain off-track. The JMP has no statistical information on coverage for Brunei Darussalam.
� About 70% of people in TWG WSH region who are not using improved sanitation live in rural areas – 65% are in China.
� Nearly 30 000 children under 5 years old in TWG WSH region die each year due to infirmities attributable to unsafe drinking-water, unsanitary excreta disposal and poor hygiene.
� As of 2015, nearly 2.1 billion people (94% of the TWG WSH region population) have access to an improved drink-ing-water source – an increase of 66% from 1990.
� Nearly 1.4 billion people now use piped water on premises, an increase of 150% from 1990.
� About 830 million people gained access to improved drinking-water sources since 1990. However, over 120 million people still do not use improved drinking-water sources.
� The TWG WSH region exceeded the MDG drinking-water target by 9%. The target in 2015 was 85% and the current coverage is 94%.
� Excepting Mongolia, all TWG WSH countries met the MDG target for drinking-water coverage.
� More than 70% of the population without improved drink-ing-water sources live in rural areas.
� Half of the people in TWG WSH region without improved drinking-water sources live in China.
� Drinking-water and sanitation coverage and under-5 mortality rates are linked. This report demonstrates that under-5 mortality rates drop dramatically as water and sanitation coverage increases.