self-employment and labor turnover - cross-country evidence
TRANSCRIPT

*My thanks to Norman Hicks, Tom Krebs, Guillermo Perry and Martin Rama for helpful comments. Specialthanks to Kenny Lee for able research assistance. Correspondance: [email protected].
Self-Employment and Labor Turnover in LDCs:Cross Country Evidence*
William F. MaloneyThe World Bank
October 26, 1998
Abstract: The paper uses cross-country data from Latin America and theOECD to test the predictions of a simple efficiency wage model (Krebsand Maloney 1998) about the share of employment in self-employmentand the rate of labor turnover. It finds support for the model and findsnumerous demographic, economic and labor market institutions to beimportant to determining both self-employment and turnover. Afteradjusting for these factors, Latin American labor markets appear neitherespecially rigid nor distorted although individual countries stand out asimportant exceptions.

1 See Harris and Todaro (1970) for an early presentation of this view.
2 See Maloney (1995) for Mexico, Gonzaga (1996) for Brazil, Anderson Shaffner (1997) for Colombia,Márquez and Pagés (1998) more generally. See Hopenhayn and Rogerson (1993) for a recent theoretical discussion.
3 See for example Burki and Perry (1997) The Long March.
1..1 Introduction
This paper develops and tests an integrated approach to understanding two outstanding
questions central to understanding the functioning of LDC labor markets and the impact of labor
legislation. Though the paper focuses primarily on Latin America, the issues and analysis are germane
both to other LDCs and the industrialized countries.
The first is the role of the large informal sector in the region (see table 1). A traditional view
argues that the sector testifies to government or union induced rigidities that force formal remuneration
above market clearing and ration workers into informality.1 We argue that this view is probably
incorrect and that it is difficult to draw any conclusions about efficiency from sector size alone.
The second question centers on what recent findings of high turnover, a common measure of
rigidities (see Nickell 1997), imply about the flexibility of labor markets in the region.2 It is often
asserted that high firing costs and excessive benefits in the formal sector prevent the efficient allocation
of workers among jobs.3 However, as table 1 suggests, average tenure is shorter, and a larger fraction
of the work force has been employed in their current position for less than two years in Latin America
than in the OECD. We argue that this probably cannot be interpreted a priori as evidence of greater
flexibility.
The structure of the paper is as follows: Section 2 heuristically develops a model that moves
beyond the standard segmentation-based view of the relationship of formal and informal sectors, and
2
incorporates the increasing evidence that a large fraction of the employment in the informal sector is
voluntary. It is developed in an efficiency wage context both because recent evidence suggests that
much observed segmentation may arise endogenously rather than being imposed by labor unions or
minimum wages, and because it permits explicit modeling of the determinants of turnover. Predictions
can be made about how the size of the self-employed sector, the degree of segmentation in the market,
and turnover should move with the development process and policy innovations.
Section 3 examines cross country data from Latin America, Europe and Asia with three
objectives. The first two are straightforward: to test the predictions of the model about the size of the
informal sector and rates of turnover with respect to several key labor market, productivity, and
demographic variables suggested by the theoretical framework and second, to suggest the direction of
possible influence of variables that are theoretically ambiguous. But somewhat speculatively, we also
attempt to provide more informed estimates of the incidence of unmeasurable distortions that ration
more workers into the informal sector or rigidities that decrease turnover. Since our theoretical
framework abstracts from such exogenous phenomena, we tentatively measure their impact by the
deviations from the model’s predicted values. Though it is trivial to raise objections to this approach on
either theoretical or empirical grounds, the results at once strongly coincide with the stylized facts about
industrialized countries and challenge what is commonly thought about Latin America: with some
predictable exceptions, regional labor markets do not appear unusually distorted or inflexible.
2. Motivation and Theoretical Overview

4 See the classic statement of this view in Harris and Todaro(1974).
5 In the absence of any distortions, we should find a wedge between formal and informal incomes thatincorporates the value of benefits forgone, the value of taxes evaded, the value of lifestyle differences between wageand self-employment, capital costs, implicit training costs and payments in kind. Without this information, wagecomparisons tell us nothing about segmentation or relative welfare between sectors. See MacIsaac and Rama (1997)and Maloney (1995, 1997a.)
3
The empirical work here is motivated by a macroeconomic model based on micro behavior of
workers describe in detail in Krebs and Maloney 1998. It is built as a growth model so that secular
movements in labor productivity can be incorporated and makes predictions about movements in
formal and informal sector employment, the degree market segmentation, and labor turnover rates
across the course of the development process. It also attempts to incorporate two emerging stylized
facts about LDC labor markets.
1. The informal sector is extremely heterogeneous containing both voluntary and
involuntary members. The informal sector is frequently considered the disadvantaged segment of a
labor marketed segmented by government or union intervention in the wage setting process in the
formal sector.4 During downturns, the sector is thought to expand as it absorbs displaced workers,
then contracting again with recovery.
While some fraction of the sector corresponds to this view, recent studies find that many of the
informal employed are voluntarily so and should probably be viewed as unregulated entrepreneurs.
Comparisons of formal/informal wage differentials traditionally used to show segmentation have been
shown to be meaningless, and there appears to be high degrees of mobility among sectors.5 The
Mexican micro-enterprise survey suggests that 70% of workers enter the sector voluntarily for reasons
of independence or higher income and recent time series data from Mexico and Chile suggest that both

6 See Maloney (1997b) and Pages(1998). Pais de Barros finds no cyclical movement in Brazil. Saavedra inPeru finds a broadly countercyclical movement but this may be largely driven by secular trends.
7Aroca and Maloney (1998) model the transitions into informality as a destination of entrepreneurs andfind evidence using logit techniques adapted to panel logit context.
8 See Maloney and Ribeiro (1998), and Hernandez -Laos (1998). Panagides and Patrinos (1994) find somewage effects, but these are likely to disappear when relevant firm characteristics, such as size, are included.
4
the size of and transitions into the self-employed sector behave procyclically.6 There is increasing
evidence both in the sociology and economics literature that suggests a life cycle view of the trajectory
between formal and informal self-employment: in the absence of well-functioning credit markets and
effective educational systems, workers may take formal sector jobs to accumulate human and financial
capital and then quit to open their own business.7 In sum, there is ample evidence suggesting that self-
employment is a desirable destination for many workers who voluntarily leave formal employment.
2. In the absence of government or union induced rigidities, there is still strong evidence
of “segmentation.” Recent work on Mexico challenges the customary view of the sources of labor
market segmentation. Minimum wages are not binding (See Bell 1998) and the evidence suggests that
union power is directed largely to the maintenance of employment and find no significant effect on
wages.8 As Marquez and Ros (1990), noted, and has been confirmed by later studies for Peru
(Shaffner,1998)and Guatemala (Funkhauser1998), wages of similar workers rise with firm size, much
as they do in industrialized countries. Further, Márquez (1990), and Abuhadba and Romaguera
(1993) find evidence consistent with efficiency wage effects in the high correlation of wage differentials
among Chile, Venezuela, and Brazil and the US. This evidence suggests that the conditional wage
dispersion (wages adjusted for human capital) may be emerging endogenously and is not due to either
government or union intervention.
9 For discussions of the theory of efficiency wages see Stiglitz (1974), Krueger and Summers (1988), Phelps(1994).
10 Some fraction of the informal sector serves the role of unemployment benefits in industrialized countries. This raises the possibility of an analogy between the size of the sector and the natural rate of unemployment
5
Both stylized facts suggest an interpretation of the interaction of formal and informal markets
rooted in the extensive literature on efficiency wages where firms voluntarily pay wages above the
market clearing level.9 One common variant of these models arises from the difficulty of monitoring
individual workers and the lack of any penalty from being caught “shirking” - any activity, or lack
thereof, that might be detrimental to the firm. If wages are market clearing, a worker fired for shirking
can simply get another job at the same wage. However, if all firms pay higher than market clearing
wages, unemployment will be created in the economy that creates a disincentive to being laid off and
hence to shirking.
Since in many Latin American countries, workers can be fired only with difficulty, the
“turnover” variant of efficiency wage models seems more appropriate: Firms must invest resources in
workers when they are hired, perhaps through training or through the process of recruitment, that will
be lost if the worker leaves. Hence, it is worthwhile for firms to pay higher wages and raise the
opportunity cost of leaving to other firms or jobs. This argument may be particularly compelling in
LDCs given the life cycle model of self-employment developed above. In an inversion of the
commonly held view that higher than market clearing wages create informality, it may be that
the attractiveness of self-employment causes firms to pay above market clearing wages. This,
in fact, does create a subset of the informal sector that is involuntarily self-employed and who are
unable to easily move back into the formal sector.10 Thus, potential self-employed, aware of the high

(NAIRU). The large movements in formal/informal remuneration in LDCs can generating insights on the elasticity ofthe NAIRU to unemployment benefits in the industrialized countries where the lack of variation inwages/unemployment benefits have prohibited rigorous testing. (Katz and Blanchard 1997).
11 For the worker’s decision to enter self-employment, we have in mind a model something like the “noisyselection” model of Jovanovic (1982). Here, workers have only a very diffuse idea of their ability as entrepreneursand whether they will be able to stay in business. Only by actually opening a business can they learn about theirtrue underlying abilities. The ability to be rehired is therefore and important consideration in risking self-employment.
6
rates of failure of small businesses, will think
twice about leaving formal employment if the probability of being rehired is reduced.11
The efficiency wage approach has the advantage of dealing explicitly with the issue of turnover,
the second of our central issues to be examined. However, it also complicates our view of the informal
sector and what its existence reveals about inequality, poverty or labor market distortions. A large
fraction of workers may treat the sector as a very desirable destination either to attempt to run a
business, or as a place where workers quitting an undesirable formal sector job may search for another
and for them the traditional conflation of informality with disadvantage or relative poverty are
inappropriate. However, it is also clear that some fraction is trapped there involuntarily- that is the
expected byproduct of efficiency wages.
Despite abstracting from wage rigidities introduced by minimum wage or unions, this approach
is useful for understanding labor markets in the region. First, in Brazil, Chile, as in Mexico, government
mandated minimum wage and the curbed power of labor unions are unconvincing as the principal
sources of segmentation. Second, efficiency wage phenomena are likely to exist as an important
underlying determinant of wage structure, however overlaid by other local institutions, and they have
long term implications for labor, education, and poverty alleviation policies. Third, careful modeling

7
these effects aids in identifying abnormalities in informal sector size or turnover that may be interpretable
as more reliable evidence of distortions that are not explicitly introduced through the model.
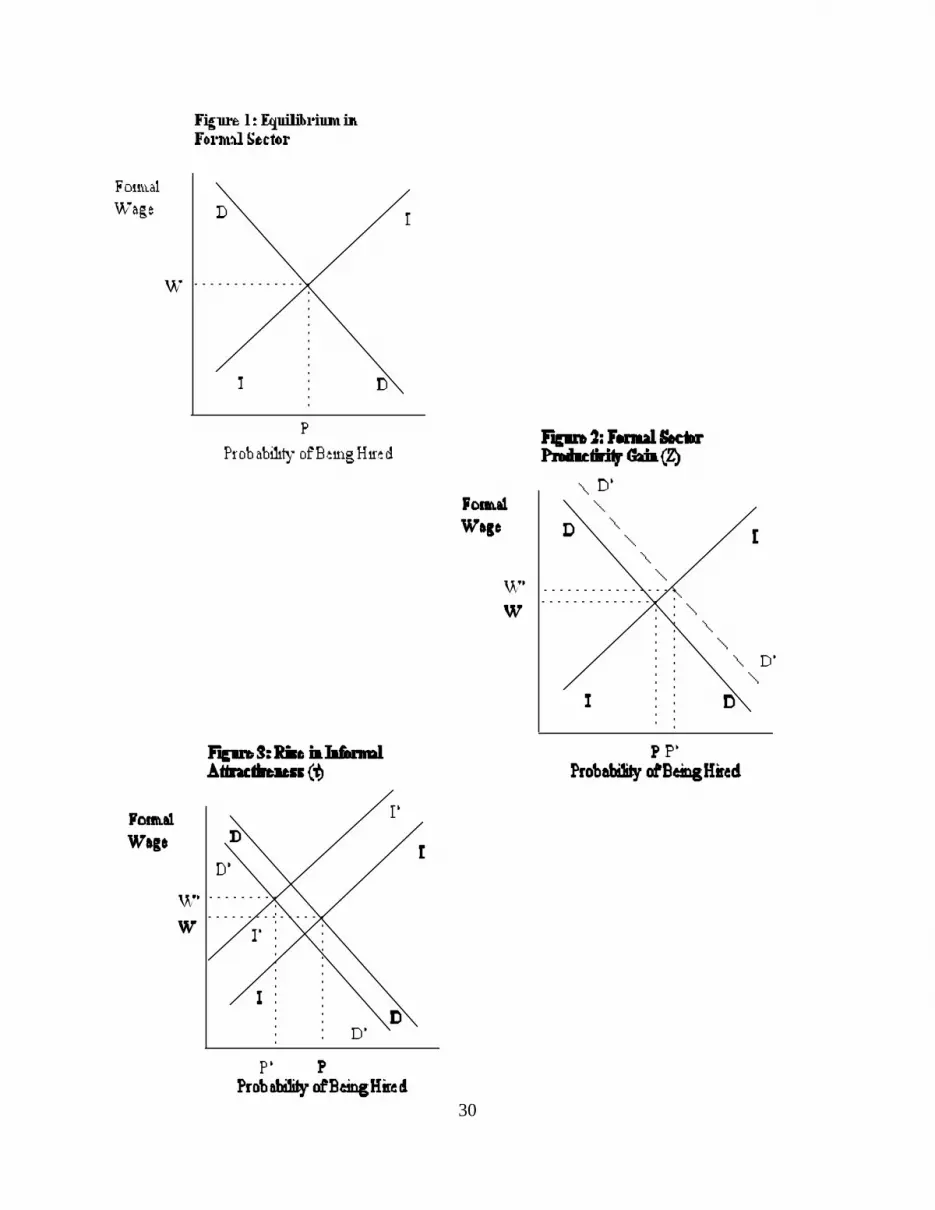
Though the model is general equilibrium in design, the intuition can be distilled to two equations.
These can be broadly represented as an upward sloping “incentive curve” and as a downward sloping
labor demand curve shown in figure 1. The curves are plotted with the probability of being hired in the
formal sector on the X axis and formal wages relative to the average in the self-employed sector on
the Y axis. The incentive curve II captures the essence of the efficiency wage story. It represents the
constraint that firms face in trying to prevent workers from leaving with their training and opening a
business in the informal sector. The higher the probability that a worker will be hired in the formal
sector if the business turns out to be less successful than expected, the greater the likelihood of quitting
his current formal sector job, and hence the higher the formal sector wage must be to persuade him
from trying his luck. Though it is not a traditional labor supply curve, it incorporates the usual
depressing effects on labor supply to the formal sector of increased attractiveness of the informal
sector, or a rise in taxation of formal sector wages. The second curve DD is similar to the traditional
labor demand curve. It can be argued that as wages rise, formal firms hire fewer workers and the
probability of being hired falls.
2.2 Comparative statics
These two curves allow analysis of the impact of several important variables on the size of the
informal sector, what share of it is likely to be voluntary, and on rates of turnover. We analyze the
impact of three broad classes of policy interventions or economic innovations: Increases in labor
8
productivity or firm profitability, a rise in the benefit to being self employed and changes in hiring costs.
2.2.a Increases in labor productivity or firm profitability.(Z)
This includes technological progress, and of particular interest, a fall in labor taxes, or a
reduction in any regulation that adversely affects productivity. Any of these changes has the effect of
shifting the DD curve to the right along the II curve (figure 2). As productivity increases, firms are
willing to hire more workers, and hence to increase the probability of being hired. The movement along
the incentive curve implies that a higher wage relative to that in the informal sector must be paid to
retain workers. But this also necessarily implies that a larger fraction of informal workers is involuntary
and would experience welfare enhancements upon finding a job in the formal sector. For each of the
shocks discussed below, the rise in formal sector employment and wage therefore may have negative
distributional effects.
The impact on turnover is ambiguous. Both wages and the probability of being hired rise over
time with opposing effects on turnover and it is not clear, ex ante, what the net effect should be. Though
the implied shifts of curves are the same for the following cases, it is worth highlighting certain aspects.
Technological progress: A secular rise in formal sector productivity due to technological
progress has the effect of raising both the level of employment in the formal sector, and the
wage paid there. The model has the prediction, then, that as countries grow, a larger and larger
fraction of those self-employed are involuntary and segmentation increases among the sectors.
For very poor countries, salaried vs. self-employment maybe very close substitutes, but in
9
richer countries, perhaps Argentina, self-employment is, on average less desirable. This
dynamic may offer some insight into the elusive Kuznets relation of worsening and then
improving distribution with development. A poor country has a very large self-employed sector.
As productivity rises, segmentation between the formal and informal sector increases and
increases the wage differential between formal and informal sector workers, worsening
distribution. However, eventually, the self-employed sector shrinks to so small a size that,
though the differentials are great, the number of workers affected is small, leading to a relative
improvement of the Gini. Using estimates of the important elasticities, section 4 shows this to be
a plausible dynamic. The indeterminacy of turnover suggests that it is not obvious that LDC’s
should have higher or lower rates of turnover.
Regulations and Taxes: Any regulation that can be reinterpreted as a tax on firms-non-wage
benefits, firing costs- or any economy wide regulation that leads to lowering the marginal
product of labor reduces the size of the formal sector and lowers the formal sector wage. It is
important, however, to bear in mind that this effect is most compelling if workers do not value
these benefits. To the degree that they do, this is simply payment in a different form.
This even applies in some measure to restrictions on firings which can be seen as a tax
equal to the option value of the ability to divest of an underperforming asset. To the degree that
the worker sees these costs as an insurance premium against termination, they are passed along
to workers as lower wages with no impact. However, it is easy to generate scenarios where
12 See Bentolila and Bertola(1990) for a discussion of the impact of firing costs and labor demand.
10
this might not be the case, and the net result is to reduce employment, and turnover.12
It is important to highlight that the distributional impacts of a reduction in labor taxes are
the opposite of those generally postulated in the traditional view with a minimum wage or union
induced wage rigidities. There, a reduction in taxes reduces total remuneration to the formal
sector relative to the formal, and at the same time increases the size of the formal sector, with
likely positive distributional effects. Here the result is less clear.
2.2.b Rise in the benefit to being self-employed, or a reduction in worker taxes ( t )
Anything that raises the benefit to being self-employed relative to being formally employed
increases the rate of turnover and causes a shift in both the incentive curve and the demand curve
(figure 3). In the former, for any probability of being hired, the formal wage must rise to offset the
increased desirability of the informal sector. In the latter, the increased cost of retaining workers also
shifts the labor demand curve left. What is clear is that employment in the formal sector falls.
This coincides with existing literature on unemployment in the OECD countries that increasingly
focuses on the level and duration of benefits as the key determinant of unemployment. Nickell finds the
duration to be the key determinant of long-run unemployment levels while Blanchard and Jimeno(1995)
attribute the relatively high Spanish unemployment to the fact that Spaniards get access to benefits of
indefinite duration if employed only 6 months of the last 4 years while Portugese workers must have
been working 1.5 of the last two years. Benefits of indefinite duration are similar in principal to self-

11
employment as an alternative to formal work. The absence of unemployment benefits in LDCs has the
effect of collapsing both the self-employed and the “unemployed” into one sector.
The impact on relative wages, however, is ambiguous since both curves shift left, hence it is
difficult to say anything definite about distribution. This indeterminacy also prevents any ex ante
statement about turnover despite the increased difficulty of finding a formal job.
Income or other taxes: Any tax that finances a public good or whose benefits are perceived as
below its cost in terms of taxation renders the informal sector more attractive.
Internal mobility restrictions: Where internal reallocation in the formal firm is highly regulated,
talented workers may choose to work on their own.
2.2.c Changes in Hiring Costs
Any policy that serves to lower the fixed costs of hiring ( recruitment, training, etc.) reduces the
loss involved with a quit and hence the magnitude of efficiency wage effects. Showing the effect
graphically is difficult since it involves both shifting and changing the slopes of both curves. However,
what is clear, is that in the limit where training costs fall to zero, there is no longer any need to pay
efficiency wages, no segmentation, and there is an increase in formal sector employment. The impact
on turnover is positive since there is no reason for firms to prevent identical workers from leaving and
replacing them with new ones.
Public education: Public education has long been justified on the grounds that it addresses the
externality implicit in the efficiency wage story: the private sector will under-invest since the
basic skills they pay to impart can be easily transferred elsewhere. To the degree that poor
LDC education systems force both training and socialization costs on individual firms, the wage

12
gap between self-employed and formal salaried workers will be larger, segmentation greater
and distribution worse, and a larger fraction of the self- employed involuntarily employed. This
offers another channel through which improving education may equalize the distribution of
income in the economy.
Reduced Interest Rates: Reduced interest rates lower the cost of investment in human capital
and thus lower hiring costs.
Better job matching and signaling: If the recruitment and selection process constitutes a sizeable
fixed cost, any improvement in mechanisms to promote good matching, or that reliably signals
workers’ skills, such as the education certification schemes in Mexico, cause all the same
desirable outcomes.
Trade Reforms: To the degree to which other reforms, such as that of the current account,
increase the demand for skilled labor and raise implicit training costs, segmentation and wage
dispersion may increase. This may offer one explanation for the increasing wage dispersion
observed with trade liberalization in Mexico and Chile.
3. Cross Sectional Regressions
We next test these hypotheses on a cross section of countries for which a consistent set of
productivity and distortion variables are available. In the first set of regressions, we examine the
determinants of self-employment as a share of the total work force. In the second set, we focus on two
13 See Levenson and Maloney(1998) for a development of this view.
14 Chief Economist Office of the IDB.
13
measures of turnover. Using deviations from the predicted values of these regressions, we construct
somewhat speculative measures of the magnitude of distortions and of rigidities.
3.1 Variables
The data sources and more detailed descriptions are listed in Appendix I.
3.1 Dependent Variables
Share of Workforce in Self-employment: The OECD tabulates the share of non-agriculural workers inself-employment or as owners of firms. To the degree possible, the same variable was created fromthe employment and household surveys from Latin America. We focus on self-employment rather thaninformality more generally for two reasons. First, we believe that it is the act of opening a business thatis the central issue and that informality while important and often highly correlated is secondary.13
Second, data on informality in the OECD is largely unavailable and the LAC data sets differ in thevariables available to use as proxies. Third, data on those employed in micro-enterprises is not availablefor the OECD. We assume that the total population employed in the self-employed sector, both asowners and workers is proportional to the share declaring themselves self-employed.
Mean Tenure in the Manufacturing Sector and Share of the Manufacturing Work Force with underTwo Years of Tenure: These are two alternative variables available from the OECD and then generatedfrom the LAC household and labor market surveys. We focus on manufacturing turnover because thisis the best proxy for formal sector turnover that is available.
3.1.a Formal Sector Labor Productivity/Profitability (Z)
Industrial Value Added (Indust. V.A.): The log of industrial value added per industrial worker is theproxy for formal sector labor productivity.
Social Security Tax-Employers (SSEmp): Social security (broadly defined) taxes as a share of thewage by worker. The model suggests that there may be different effects. Employment Protection(Protection): An index of employment protection constructed by GustavoMarquez that captures both the difficulty of laying off workers and the cost in terms of severance pay.14 Unfortunately, this leads to roughly a halving of the available observations and hence a separate set of

14
regressions are run using this reduced sample.
3.1.b Rise in the benefits to being self employed, or a reduction in worker taxes. (t )
Social Security Tax-Workers (SSWorker): Social security (broadly defined) taxes as a share of thewage by worker. Ideally, we would have a measure of labor productivity in the self-employed sector. Unfortunately, this is not feasible as even in the OECD possible proxies, such as wages in thecommerce or other services are not consistent across countries. However, social security tax incidenceon workers does capture an important element of the relative attractiveness of each sector.
3.1.c Hiring Costs.
Education (Education): The share of the appropriate age group with secondary education. No crosscountry direct measures of hiring costs are available. However, public education is a public good thataddresses exactly the externality identified in the efficiency wage model. The more firms have to train,the more they have to lose by workers moving to another firm or to self-employment. We interpret anyeffect of this variable as working through training costs.
Real Interest Rate (Real Interest): The real interest rate affects the cost of training workers to raisefuture productivity as it would in the case of any other investment. We use the average of the 30-90day borrowing rate deflated by changes in the CPI in most cases. While this is not generally the rate atwhich larger corporations borrow, it is none the less a rough indicator of the cost of investing inworkers in the economy.
3.1.d Other Variables:
Duration of Unemployment Benefits: (U Benefits): Some share of the self-employed in Latin Americawould be found unemployed in the industrialized countries where unemployment benefits exist and areoften generous. Its exclusion as an alternative to self-employment may bias results. For OECDcountries with traditional unemployment benefits, the variable takes the value of the duration ofunemployment benefits which Nickell (1997) found this to be the most important variable for explaininglevels of unemployment. For Latin America and other countries, we calculate the standard severancepay package given the mean tenure (or predicted if unavailable).
Youth (Youth): We include one demographic measure as well, the share of the working populationfound between the ages of 16 and 20. The model implicitly assumes homogeneous work forces acrosscountries. This is clearly not true as the share of young workers is much higher in Latin America than inthe OECD countries. This variable is most relevant to the turnover regressions where traditionally

15 We included a squared income term as well but it was never significant. This does not, however precludemore exotic non-linear functions.
15
young workers have higher rates of turnover as they shop around for careers. But it may also have asimilar interpretation in the self-employment regressions.
Latin Dummy (LA): We include a dummy for being from the Latin American region. In theory, this maycapture any difference between OECD economies and the region, including labor legislation.15 Ideally,we would like to eliminate the significance of this variable by including the labor market variables that itmay be proxying for.
3.2 Results
The results must be interpreted with caution. First, we have at best 40 observations and in our
most courageous moments, only 17. This in some cases can make the results sensitive to the countries
included. Second, the data are not uniform. Most of the OECD variables were gleaned from
presumably consistent publications of that organization while the Latin variables were individually
extracted from not necessarily consistent survey data. The LAC dummy may pick up these data
discrepancies.
Despite these potential pit-falls, the regressions prove surprisingly robust and consistent with the
model. The three Formerly Socialist Countries in the sample, Czech Republic, Hungary and Poland
have extraordinarily low self employed sectors given their income level and affected the results. Since it
seems likely that the repression of entrepreneurial freedom under communism is related to this result,
we did drop these. However, the addition or subtraction of most of the other countries might change the
parameter values some, but the overall story remains the same.
16
3.2 Results: Self Employment
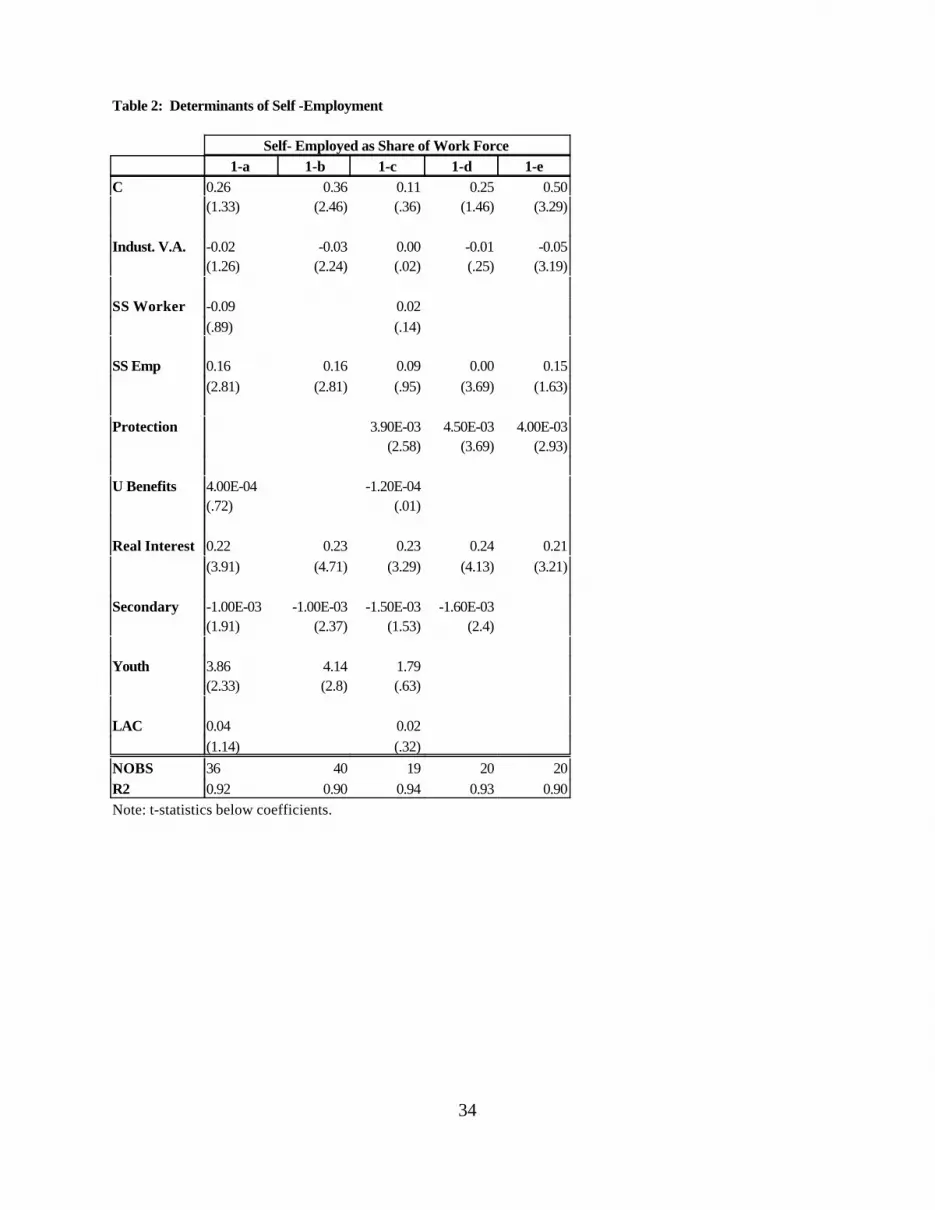
The results are broadly consistent across the regressions. Column 1a in table 2 presents the
complete regression with all variables included with the exception of the employment protection
measure. As is clear, the employers’ social security tax, the real interest rate, the level of education, the
share of young people enter significantly and of predicted sign. Progressive parsing out of the less
significant variables in column 1b makes the labor productivity and educational variables significant. In
no case was the worker’s share of social security remotely significant. Part of this poor performance
may be due to measurement error. In roughly 25% of the cases, the social security law dictates a
progressive tax that varies greatly across the range of incomes. We chose the midpoint of this range,
but we can have no way of knowing if, in fact, this represents that average tax on labor. Similarly, the
unemployment benefits variable is never significant, nor, in this case, is the LA dummy.
The significant variables enter of the signs predicted by theory. Most important in terms of
magnitude is formal sector labor productivity. Taking the extreme values of this variable would account
for 9.6 points of the variance in the share of self-employments detailed in column 1 of table 3. Figure 4
illustrates the same, but important conclusion: a large self-employed sector is not ipso facto evidence
of distortions, but that the opportunity cost of self-employment is lower in poorer countries.
The relative youth of Latin America’s population also explains much of the variance with the
spread across the sample accounting for 8.8% of the higher share in self-employment. The education
variable that measures the degree to which firms must bear the burden of financing overall education
would account for roughly 7.5 percentage point difference. Real interest rates are also surprisingly
important. Peru’s very high self-employed sector (46%) and high real interest rates (67%) are clearly
17
dominating the relationship although even dropping this outlier yields a significant coefficient. The
difference between real interest rates of under 5% as in the OECD vs often above 30% in Latin
America is worth over 6%. Once again, the importance of ensuring macro-economic stability, and
reducing risk to bring down interest rates seems clear.
In general, these effects dwarf the impact of any of the three labor market variables. Across the
range observed, social security taxes on employers explain relatively little of the size of the sector, 3.2
percentage points in the share of self-employment.
The same exercise was repeated with the smaller sample arising from using the Marquez
protection index, 1c-1e. With fewer observations, the apparent collinearity of the productivity variable
and education variables makes identifying the “correct” parsimonious form difficult (1d-1e). However,
in all cases, the employment protection index has the impact of increasing the size of the self-employed
sector. But, again, the difference between the highly protective Bolivia, Honduras, Mexico, Peru or
Spain compared to the unprotective US or UK is worth only about 1.35 percentage points in the share
of self-employment, a fairly small impact. The results are similar to those of Marquez (1998) who also
found a positive impact of his protection index, as well as a negative sign on GDP per capita which may
be seen as a proxy for formal sector productivity.
In sum, the three labor distortion variables, the tax on salaries, on payroll, and restrictions on
hiring and firing have relatively small impacts compared to those of the productivity, real interest rate,
education variables and, in the larger sample, the relative youth measure. Thus, given the level of
productivity in a country which again, may be affected by labor legislation, it is hard to argue that these
distortions are responsible for the size of the sector.
18
The Adjusted Size of the Informal Sector: A Measure of Unobserved Distortions?
Can we say anything about distortions on which we have little reliable information, such as
union or government induced wage rigidities from these regressions? Perhaps. In theory, the residuals
of the regression capture the impact of all variables not explicitly included in the regression, including
other labor market distortions. It is absolutely correct to argue that they also include any country
specific variables, and any error in measuring sector size which cast doubt on using the residuals for this
purpose. However, this critique applies to the use of the raw sector sizes as well and if sector size is
thought to contain information, then the adjusted values obtained from the residuals are probably more
appropriate.
Table 3 tabulates three sets of residuals from regressions on subsets of the significant
explanatory variables. The results tell a reasonable story with a few exceptions. The first set of
residuals are those from regressing only on formal sector labor productivity only. The complete re-
ranking of size shows immediately the importance of compensating for productivity, or more generally
level of development when drawing inferences from the size of the sector. Among the OECD
countries, they tell a story that is broadly consistent with the literature and suggest that the approach is
not entirely misguided. The U.S., Canada show up as relatively clean, while Spain, Greece and Italy
appear heavily burdened. Among the Latin countries, Costa Rica, Honduras, Guatemala, Chile,
Paraguay, Brazil are all below trend in their share of the work force in self-employment and hence,
arguably, with less onerous legislation than the mean, while Colombia, Argentina, Uruguay, Venezuela
and Peru far above.
The second set of residuals add the structural variables measuring share of young people in the

19
work force and the level of education, as well as the level of interest rates. The extremeness of this last
variable and the difficulty of measuring it may distort the results some. Mexico is now firmly below
trend and Chile, with relatively moderate interest rates, is actually above, although not by a significant
amount. Peru now emerges as far less pathological that previously, but it still is joined by Argentina,
and Venezuela as appearing to have a high level of unobserved distortions.
The third set of residuals add to the regressors the burden of taxation for social security.
Consistent with the previous findings, this does little to change the overall ranking although Mexico’s
sector share is now even more below trend and Colombia approaches trend.
The final set of residuals attempts to incorporate the Marquez index. To take advantage of the
more precise parameter estimates from the large sample, they are constructed by taking Resid 3 and
regressing it on the measure of employment protection for the countries for which it was available. In
general, Latin America shifts up in the rankings due to their overall higher firing costs. Now, Costa
Rica, Bolivia, Mexico, Honduras, and El Salvador, and Paraguay appear to have fewer residual
distortions than the U.S. or most OECD countries. The Latin Countries that still appear with residual
distortions are Venezuela, Argentina, Peru and to a lesser degree Colombia and Chile.
Again, this entire exercise is distorted to the degree that sector size is poorly measured, or that
included variables are correlated with those excluded. Still, as a measure of segmentation, it is
probably better than conventional comparisons of wages among sectors, and suggests a fairly robust
story. Numerous countries in the region do not appear to be unduly saddled by labor legislation relative
to that elsewhere.
These results are somewhat at odds with some previous work. Loayza (1996) built a model of

16 See Márquez and Pagés (1998) for a graphical treatment of these issues. The econometric results here arebroadly consistent with their findings.
20
informality that focuses largely on issues of taxes and regulation of business. He also generates
standardize estimates of the size of the informal sector as a share of production, based on the VAT
evasion rate. Chile, Argentina, and Costa Rica to have the lowest adjusted size and Peru, Panama,
and Bolivia to have the largest. Given the possible divergence of VAT evasion rates from the relative
share of employment in self-employment, these differences are, perhaps, not surprising. The results are
also not entirely consistent with the indexes of distortion calculated in The Long March, a regional
reform perspective published by the World Bank, which showed Peru, Chile and Colombia among the
most liberalized and Mexico, Bolivia and perhaps Brazil among the least. This divergence, again, may
be due to data problems-Chile may count its self -employed more conscientiously. But it also may be
the case that enforcement varies greatly, and that a formally rigid market may, in practice, be quite fluid.
3.3 Results: Turnover
The turnover results are more difficult to interpret first, because of the fewer degrees of
freedom available, and second because the theory is far less clear about what the signs should be.
Nonetheless, the results are provocative.16
Mean Tenure
Columns 1a to 1c in table 4 present various specification of average tenure in manufacturing

21
employment. Column a includes all variables in the specification, again with the exclusion of the
protection variable. Neither the LAC, Youth, Unemployment Benefits enter significantly. Labor
productivity enters both in levels and with its square suggesting a non-linear relationship. Taken at the
mean, labor productivity appears to have a negative impact on tenure. This can be reversed with the
exclusion of all other variables, but the inclusion of the share of the population with secondary schooling
reverses its sign. Thus, although the OECD countries have more stable work forces, it appears that it is
the fact that they are educated, rather than rich that drives the result. Both taxes on social security
appear to increase tenure and real interest rates decrease it. Again, these results are consistent with the
theoretical framework.
The reduction in sample to 17 observations with the inclusion of the employment protection
variable leaves only the productivity, social security tax on employers and protection variables
significant. The latter enters with predicted sign, suggesting that it does negatively affect turnover and
importantly. The difference across the range from the U.S.(1) to Mexico to Venezuela (37) accounts
for 3.24 years on a mean of about 9.
Table 5 presents a set of residuals for the average job tenure regression analogous to those
previous. With the usual caveats about small sample size and the possible correlation of ommitted
variables with those included, Venezuela, Bolivia, Brazil, Bolivia appear with greater than average
turnover when adjusted for productivity while Paraguay, Argentina, Honduras and Panama are below
suggesting less. When adjusted for education levels and interest rates, Brazil shows closer to mean
turnover and Panama now is above. Adding employers’ social security contributions has the effect of
bringing Honduras up above mean turnover and moving Panama below.

22
The share of the manufacturing workforce with under two years of seniority.
The results for the second measure of turnover, the share of the manufacturing work force with
under 2 years of tenure are broadly consistent but suggest the sensitivity of the results when sample
sizes are so small. Labor productivity, the real interest rate, the employers contribution to social
security, and education variables enter significantly and with signs consistent with the previous results.
As column 2a suggests, the education variable proved very unstable with the youth variable included.
However, because the youth variable entered with the sign opposite to that expected, the preferred
regression was that presented in 2b. 2c suggests that in these regressions, the Marquez protection
variable does not enter significantly. The residuals are not presented in tabular form for this regression.
3. The Overall Picture
Figures 5a and 5b plot the residuals from the second set of residuals (productivity, education,
real interest rate, youth) from the self-employment regression and from the turnover regressions to see if
the combination of the two can reveal anything about the functioning of a given labor market. Though
speculative, we will interpret these residuals as measuring labor market distortion (self -employment
above the conditional mean) and rigidity (average tenure above the conditional mean). In the North
East quadrant of figure 5a, rigid and distorted economies, we find Greece, Italy and Spain, all
European countries renowned for repressive labor codes. It is, however, interesting to note that only
one Latin country appears in this quadrant, perhaps unsurprisingly Argentina, but in figure 5b it will
show higher than average turnover. In both graphs, Honduras, Paraguay, also appear somewhat rigid
although less distorted than average. Among most flexible and undistorted in the South West quadrant

23
we find, unsurprisingly, the U.S. and Canada, accompanied by Panama, Bolivia, Brazil. Venezuela,
Peru. There is some sensitivity of the results to which measure of turnover is used. Using the share of
workers with under 2 years of tenure, Figure 5b suggests that Argentina has above average flexiblity
and Brazil, below average. The graphs were redone replacing industrial value added per worker with
purchasing power parity adjusted per capita GNP. The placement of countries changed little suggesting
that the results are not very sensitive to the exact measure of labor productivity used. In sum, with some
exceptions and with strong caveats about the reliability of the results, Latin labor markets do not appear
exceptionally distorted, or inflexible.
4. Conclusion
This paper has presented the results of cross country regressions motivated by an efficiency
wage model of the LDC economy. The model departs from the assumption that for many workers,
informal self-employment is a desirable destination for salaried workers rather than the disadvantage
sector of a market made dual by union or government induced wage rigidities. Nonetheless,
segmentation will always be present in all labor markets, even in the absence of unions or minimum
wages so long as firms seek to retain workers in whom they have invested. Firms will pay above
market clearing “efficiency wages” to lower turnover and in the process, create unemployment or
segmentation that may cut across lines of formality. The predictions about the size of the self employed
sector and turnover were tested using cross sectional OECD and Latin American data and generally
supported.
The size of the informal sector can tell something about the impact of labor legislation on
24
efficiency or distribution, but only if adjusted for demographic and other variables that theory suggests
are important. Raw measures of sector size are not a reliable measure of distortions or inequality. The
adjusted size of the informal sector suggests that, Venezuela, Peru, Argentina, and perhaps Colombia
emerge as having relatively high levels of distortion by global standards, while Brazil, Costa Rica,
Panama, Bolivia, Mexico, Guatemala, Honduras, and Paraguay have lower than average distortions.
Such crude comparisons of adjusted sector sizes may offer an alternative to meaningless comparisons
of earnings across formal and informal sectors. The divergence of these measures from those created
from formal labor legislation in The Long March may suggest differences in enforcement, or the ability
of the market to work around oppressive regulations.
Comparisons of raw turnover rates across countries tell us little about true labor market
flexibility. Theory and preliminary empirical work suggests that many variables affect turnover in
significant ways. Once these are considered, Latin American labor markets appear of average flexibility:
Paraguay, Honduras, and perhaps Argentina and Brazil appear more rigid than average while Bolivia,
Panama, and perhaps Peru are less.
Barriers to firing workers, and social security taxes on firms appear to reduce the size of the
formal sector. Anticipation of costly firing may lead to a reluctance to employ new workers while high
non-wage benefits raise labor costs. That said, empirically, the level of formal sector productivity, real
interest rates, and education levels in general have a larger impact on the size of the informal sector than
labor market taxes or barriers to firing.

25
References
Abuhadba, Mario, Romaguera Pilar (1993), “Inter-industrial Wage Differentials: Evidence from LatinAmerican Countries” Journal-of-Development-Studies. Andersen Schaffner, Julie (1997), “Job Stability in Developing and Developed Countries: Evidencefrom Colombia and the United States.” Mimeo, Stanford University.
Aroca, P. and W. F. Maloney (1998), “Logit Analysis in a Rotating Panel Context and an Applicationto Self-Employment Decisions,” mimeo The World Bank and Universidad Catolica del Norte, Chile.
Begin, James P. (1995) Singapore’s Industrial Relations System in Stephen Frenkel and Jeffrey HarrodEds. Industrialization and Labor Relations Contemporary Research in Seven countries. ILRPress, Ithaca.
Bell, L (1997) “The Impact of Minimum Wages in Mexico and Colombia” Journal of laborEconomics.
Bentolila, Samuel and Giuseppe Bertola (1990) Firing Costs and Labour Demand: How Bad isEurosclerosis?” Review of Economic Studies, 57:381-402.
Birdsall, Nancy and Frederick Jaspersen (1997) EDS. Pathways to Growth, InteramericanDevelopment Bank, Johns Hopkins.
Blanchard, O. and J. Jimeno “Structural Unemployment: Spain vs. Portugal” American EconomicReview 85:2 p. 212-218.
Blanchard, Olivier and Lawrence, F. Katz, “What we Know and do Not Know about the Natural Rateof Unemployment,” Journal of Economic Perspectives, 11:1.
Blanchard, Olivier and Juan F. Jimeno, “Structural Unemployment: Spain vs. Portugal,”American Economic Review, 85:212-217.
Boyer (1994) “Do Labour Institutions Matter for Economic Development” in Workers, Institutions,and Economic Growth in Asia. Gerry Rodgers Ed. ILO Geneva.
Cox- Edwards, Alejandra (1993), Labor Market Legislation in Latin American and theCaribbean, Report 31, Latin America and the Caribbean Technical Department, the World Bank.

26
Fields, Gary (1994), “Changing labor Market Conditions and Economic Development in Hong Kong,the Republic of Korea, Singapore, and Taiwan, China, World Bank Economic Review 8:3.
Funkhouser, E. (1998) “The Importance of Firm Wage Differentials in Explaining Hourly Earnings Variationin the Large Scale Sector of Guatemala” Journal of Development Economics 55(1), 115-131.
Gonzaga, Gustavo (1996), “The Effects of Openness on Industrial Employment in Brazil” mimeo,Departmento de Economia, PUC-RIO, Brazil.
Gonzalez, Jose Antonio Labor Market Flexibility in 13 Latin American Countries and the United States:Stylized Facts about Structural Relationships Between Output and Employment-Unemployment-Wages"Mimeo, The World Bank.
Harris, J.R. and M.P. Todaro (1970) “Migration, Unemployment and Development: A Two SectorAnalysis,”American Economic Review, 60:1, 126-142.
Hernandez Laos, (1995). “Costo Laboral y Competitividad Manufacturera en Mexico (1984-1993)”mimeo.
Hopenhayn, Hugo and Richard Rogerson (1993), “Job Turnover and Policy Evaluation: A GeneralEquilibrium Analysis.” Journal of Political Economy, 101:5:915-938.
Jovanovic, Boyan (1982), “Selection and Evolution of Industry,” Econometrica, 649-670.
Krueger, A.B and L. H. Summers (1988), “ Efficiency Wages and the Inter-Industry Wage Structure,”Econometrica 56:2 p 259-293.
Krebs, T. and W. F. Maloney (1998), “Quitting and Labor Turnover: Microeconomic Evidence andMacroeconomic Consequences” mimeo, World Bank, Washington, D.C.
Levenson, Alec and William F. Maloney (1997), “The Informal Sector, Firm Dynamics and InstitutionalParticipation,” Mimeo, University of Illinois IBRD and Policy Research Working Paper No.1988.
Levine, Marvin (1997) Worker Rights and Labor Standards in Asia’s Four New Tigers, Plenum Press,New York.
Loayza, N.(1996), The Economics of the Informal Sector: A Simple Model and Some Empirical Evidencefrom Latin America.” Carnegie-Rochester Conference Series on Public Policy 45:129-162, NorthHolland.

27
MacIsaac, Donna and Martin Rama(1997), “Determinants of Hourly Earnings in Ecuador: The Role ofLabor Market Regulations” Journal of Labor Economics;15(3), Part 2 July 1997, pages S136-65.
Márquez, Gustavo(1990), “Wage Differentials and Labor market Equilibrium in Venezuela, UnpublishedPh.D. Dissertation, Boston University.
Márquez, Gustavo(1998), Protección al Empleo y Funcionamiento del Mercado de Trabajo: unaAproximación Comparativa. Uncitable mimeo, Chief Economist Office, IDB.
Márquez, Gustavo and Carmen Pagés (1998), “Ties that Bind: Employment Protection and Labor MarketOutcomes in Latin America.” IDB mimeo.
Maloney, William F. (1997a) “Are LDC Labor Markets Dualistic?” mimeo, the World Bank.
Maloney, W.F. and E. Ribeiro (1998), “Efficiency Wage and Union Effects in labor Demand and WageStructure in Mexico” Mimeo, The World Bank and Universidade Federal do Rio Grande do Sul, Brazil.
Maloney, William F. (1997b) “Labor Market Structure in LDC’s: Time Series Evidence on CompetingViews,” mimeo, the World Bank.
Maloney, William F. (1995), The Informal Sector in Mexico: A Dynamic Approach.mimeo, The World Bank.
Marquez, Carlos and Jaime Ros (1990), Segmentacion del Mercado de Trabajo y Desarrollo Economicoen Mexico, El Trimestre Economico, Fondo de Cultural Economica, Mexico, LVII:2
Nickell, S. (1997) , “Unemployment and Market Rigidities: Europe versus North America,” Journal ofEconomic Perspectives, 11:3 pp. 5-74.
Revenga, Ana and William F. Maloney (1994) “Mexico Labor Market Strategy Paper” The World Bank.
Schaffner, J.A.(1998) “Premiums to Employment in Larger Establishments: evidence from Peru. Journalof Development Economics 55(1), 81-113.
Shapiro, Carl and Joseph Stiglitz (1984), Equilibrium Unemployment as a Worker Discipline Device”American Economic Review, 74:3 431-444.
Stiglitz, J.E.(1974) “Alternative Theories of Wage Determination and Unemployment in LDC’s: The LaborTurnover Model, “ Quarterly Journal of Economics, 88:194-227.

28
World Bank (1990,95), World Development Report.
You, Jong Il, (1994) “Labour institution and Economic Development in the Republic of Korea” in Workers,Institutions, Economic Growth in Asia. Gerry Rodgers Ed. ILO Geneva.

29
Appendix I: Data Sources
1. Tenure variables of the OECD countries are from the following sources:
Table 2: Measures of the Sluggishness of Employment and of Adjustment Costs, Page 11, in StephenNickell, “Labour Market Dynamics in OECD Countries”,Centre for Economic Performance, Discussion Paper #255, August 1995
Table 5.5: Distribution of Employment by Employer Tenure, 1995, Page 138,Table 5.6: Average Employer Tenure by gender, Age, Industry, Occupation, 1995, Page 139, in “OECDEmployment Outlook, July 1997”,
2. Self-employment rate of the OECD countries is from “OECD Labour Force Statistics 1976-1996.”
3. Self-employment rate and tenure variables of the Latin America and the Caribbean countries arefrom various CEPAL surveys of the following years: Argentina 1992,Bolivia 1995,Chile 1995,Colombia 1995, Costa Rica 1995, El Salvador 1995, Guatemala 1989, Honduras 1995, Mexico1994,Panama 1995, Paraguay 1995, Peru 1996, Uruguay 1995, Venezuela 1995.
4. Per capita GNP and wages of Industrial workers are from Table 1: Basic Indicators, Page 214,215and Table 12: Structure of the Economy: Production in “World Development Report 1997”,
5. Employment Protection variables provided by Gustavo Marquez, Chief Economist Office, IDB.
6. Social Security variables are from Table3: Contribution rates for social security programs -OECDcountries(1997), and Table 5.8: Social security and non-wage labour costs, in “Social SecurityPrograms Throughout the World - 1997”.
30

31
Share
of Labor
Forc
e in
Self-
Em
plo
yment
Figure 4: Self-Employment vs. Industrial ProductivityLog of Industrial V.A./ Worker
6.63332 10.5322
.0576
.461
Arg
Ausl
Aus
Bel
Bol
Bra
Can
Chi
Col
CR
Den
ElS
FinFra Ger
Gre
GuaHon
Ice
Ire
Ita
Jap
Kor
Lux
Mex
Neth
New
Nor
Pan
Par
Peru
PorSpa
SweSwit
Turk
UK
US
UruVen

32
Adju
sted S
hare
in S
elf-
Em
plo
yment
Figure 5a: Distortion and Rigidity?Adjusted Mean Tenure
-4 -2 0 2 4
-.1
-.05
0
.05
.1
Arg
AuslAus
Bel
Bol
Bra
CanDen
Fin
Fra
Ger
Gre
Hon
Ire
Ita
Jap
Lux
NethPan
ParPor
Spa
Swe
SwitUK
US
Ven
Adju
sted S
hare
in S
elf-
Em
plo
yment
Figure 5b: Distortion and Rigidity?Adjusted Share < 2 Years Job Tenure [negative]
-20 -10 0 10 20
-.1
-.05
0
.05
.1
Bol
Ven
DenNeth
USIre
Ita
Ausl
UK
Fra
Ger
Spa
Hon
Swit
Can
Arg
Bra
BelFin
Pan
Jap
Par
Peru
Nor

33
Table 1: Size of Informal Self-Employment and Turnover Rates
LAC OECD
% Workforce in Informal Self-Employment 31.5 12.9
% < 2 Years Seniority (Manufactures) 38.1 24.5
Average Tenure (Manufactures) 7.61 10.5
34
Table 2: Determinants of Self -Employment
Self- Employed as Share of Work Force1-a 1-b 1-c 1-d 1-e
C 0.26 0.36 0.11 0.25 0.50(1.33) (2.46) (.36) (1.46) (3.29)
Indust. V.A. -0.02 -0.03 0.00 -0.01 -0.05(1.26) (2.24) (.02) (.25) (3.19)
SS Worker -0.09 0.02(.89) (.14)
SS Emp 0.16 0.16 0.09 0.00 0.15(2.81) (2.81) (.95) (3.69) (1.63)
Protection 3.90E-03 4.50E-03 4.00E-03(2.58) (3.69) (2.93)
U Benefits 4.00E-04 -1.20E-04(.72) (.01)
Real Interest 0.22 0.23 0.23 0.24 0.21(3.91) (4.71) (3.29) (4.13) (3.21)
Secondary -1.00E-03 -1.00E-03 -1.50E-03 -1.60E-03(1.91) (2.37) (1.53) (2.4)
Youth 3.86 4.14 1.79(2.33) (2.8) (.63)
LAC 0.04 0.02(1.14) (.32)
NOBS 36 40 19 20 20R2 0.92 0.90 0.94 0.93 0.90Note: t-statistics below coefficients.
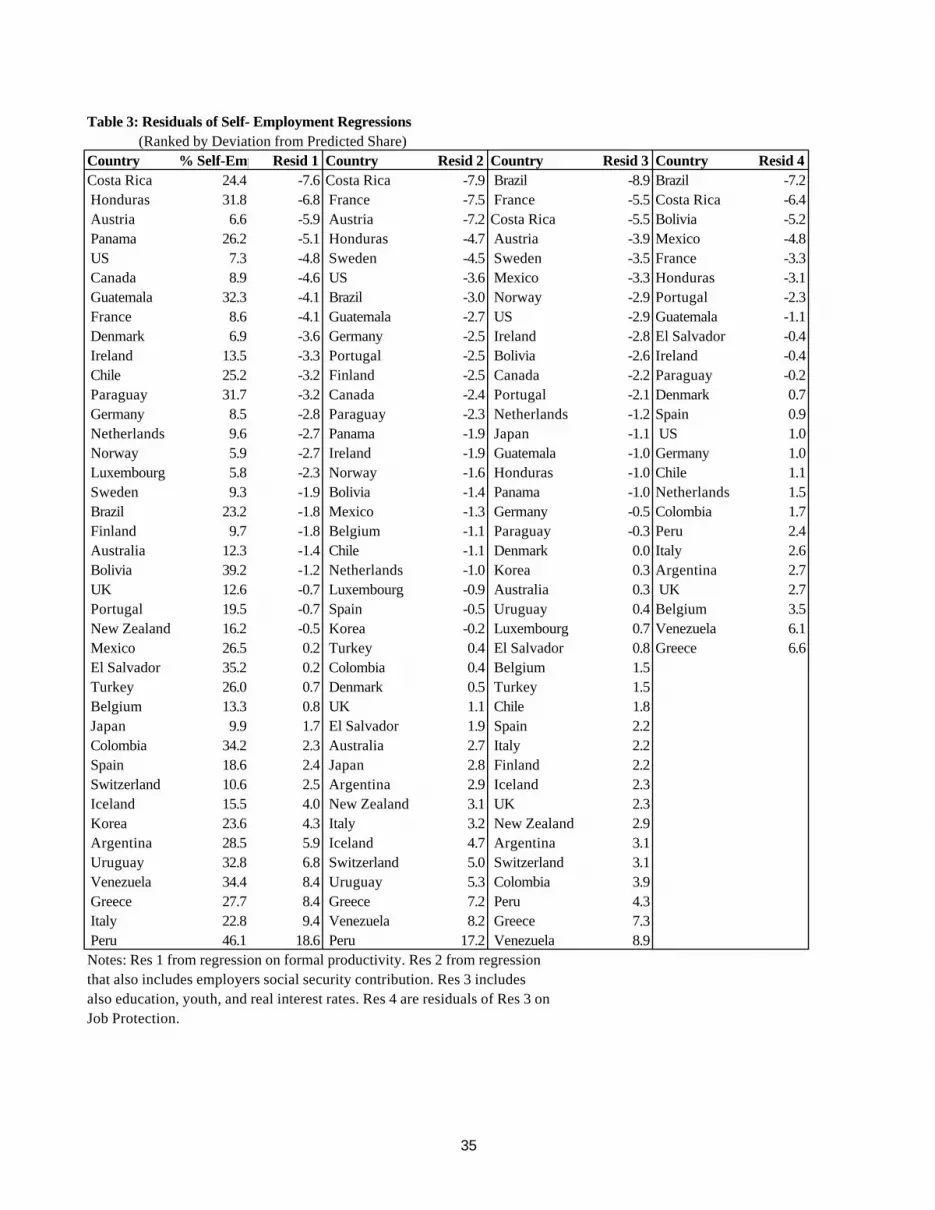
Table 3: Residuals of Self- Employment Regressions (Ranked by Deviation from Predicted Share)Country % Self-Emp Resid 1 Country Resid 2 Country Resid 3 Country Resid 4Costa Rica 24.4 -7.6 Costa Rica -7.9 Brazil -8.9 Brazil -7.2 Honduras 31.8 -6.8 France -7.5 France -5.5 Costa Rica -6.4 Austria 6.6 -5.9 Austria -7.2 Costa Rica -5.5 Bolivia -5.2 Panama 26.2 -5.1 Honduras -4.7 Austria -3.9 Mexico -4.8 US 7.3 -4.8 Sweden -4.5 Sweden -3.5 France -3.3 Canada 8.9 -4.6 US -3.6 Mexico -3.3 Honduras -3.1 Guatemala 32.3 -4.1 Brazil -3.0 Norway -2.9 Portugal -2.3 France 8.6 -4.1 Guatemala -2.7 US -2.9 Guatemala -1.1 Denmark 6.9 -3.6 Germany -2.5 Ireland -2.8 El Salvador -0.4 Ireland 13.5 -3.3 Portugal -2.5 Bolivia -2.6 Ireland -0.4 Chile 25.2 -3.2 Finland -2.5 Canada -2.2 Paraguay -0.2 Paraguay 31.7 -3.2 Canada -2.4 Portugal -2.1 Denmark 0.7 Germany 8.5 -2.8 Paraguay -2.3 Netherlands -1.2 Spain 0.9 Netherlands 9.6 -2.7 Panama -1.9 Japan -1.1 US 1.0 Norway 5.9 -2.7 Ireland -1.9 Guatemala -1.0 Germany 1.0 Luxembourg 5.8 -2.3 Norway -1.6 Honduras -1.0 Chile 1.1 Sweden 9.3 -1.9 Bolivia -1.4 Panama -1.0 Netherlands 1.5 Brazil 23.2 -1.8 Mexico -1.3 Germany -0.5 Colombia 1.7 Finland 9.7 -1.8 Belgium -1.1 Paraguay -0.3 Peru 2.4 Australia 12.3 -1.4 Chile -1.1 Denmark 0.0 Italy 2.6 Bolivia 39.2 -1.2 Netherlands -1.0 Korea 0.3 Argentina 2.7 UK 12.6 -0.7 Luxembourg -0.9 Australia 0.3 UK 2.7 Portugal 19.5 -0.7 Spain -0.5 Uruguay 0.4 Belgium 3.5 New Zealand 16.2 -0.5 Korea -0.2 Luxembourg 0.7 Venezuela 6.1 Mexico 26.5 0.2 Turkey 0.4 El Salvador 0.8 Greece 6.6 El Salvador 35.2 0.2 Colombia 0.4 Belgium 1.5 Turkey 26.0 0.7 Denmark 0.5 Turkey 1.5 Belgium 13.3 0.8 UK 1.1 Chile 1.8 Japan 9.9 1.7 El Salvador 1.9 Spain 2.2 Colombia 34.2 2.3 Australia 2.7 Italy 2.2 Spain 18.6 2.4 Japan 2.8 Finland 2.2 Switzerland 10.6 2.5 Argentina 2.9 Iceland 2.3 Iceland 15.5 4.0 New Zealand 3.1 UK 2.3 Korea 23.6 4.3 Italy 3.2 New Zealand 2.9 Argentina 28.5 5.9 Iceland 4.7 Argentina 3.1 Uruguay 32.8 6.8 Switzerland 5.0 Switzerland 3.1 Venezuela 34.4 8.4 Uruguay 5.3 Colombia 3.9 Greece 27.7 8.4 Greece 7.2 Peru 4.3 Italy 22.8 9.4 Venezuela 8.2 Greece 7.3 Peru 46.1 18.6 Peru 17.2 Venezuela 8.9Notes: Res 1 from regression on formal productivity. Res 2 from regressionthat also includes employers social security contribution. Res 3 includesalso education, youth, and real interest rates. Res 4 are residuals of Res 3 onJob Protection.
35

Table 4: Determinants of Turnover
Mean Tenure %< 2 Years1-a 1-b 1-c 2-a 2-b 2-c
C 60.58 74.35 43.30 -288.38 -288.67 -272.71(3.09) (4.23) (6.03) (3.82) (4.78) (2.23)
Indust. V.A. -11.95 -16.21 -3.19 84.40 77.61 73.37(2.35) (3.99) (4.88) (4.17) (4.02) (2.47)
I.V.A. sq 0.64 0.92 -4.84 -4.31 -3.98(2.07) (3.99) (3.84) (3.89) (2.12)
SS Worker 8.13 8.68 -2.51(3.29) (3.62) (.16)
SS Emp 7.00 6.23 11.65 -46.92 -44.45 -41.84(1.79) (1.79) (5.86) -(4.63) (3.92) (2.54)
Protection 0.09 -0.05(2.99) (.21)
U Benefits -0.03 -0.13-(1.13) -(1.42)
Real Interest -7.41 -7.10 14.45 21.44 24.14(1.92) (1.89) (1.65) (2.22) (1.98)
Secondary 0.05 0.04 -0.07 -0.24 -0.31(2.15) (2.23) (.69) (2.57) (2.11)
Youth -39.23 -754.73(.48) (2.38)
LAC -0.70 10.13(.41) (1.33)
NOBS 25 26 17 23 24 16R2 0.63 0.68 0.81 0.50 0.65 0.54Note: t-statistics below coefficient.
Manufactures
36

Table 5: Residuals of Average Job Tenure in Manufacturing Regressions (Ranked by Deviations from Predicted Tenure)Country Avg. Tenure Resid 1 Country Resid 2 Country Resid 3Denmark 7.80 -3.35 Denmark -3.76 Bolivia -1.84Australia 7.00 -3.08 Australia -2.69 Venezuela -1.56Venezuela 5.77 -1.87 Ireland -1.78 Austria -1.49Bolivia 6.22 -1.84 Bolivia -1.69 Denmark -1.47Brazil 6.25 -1.50 US -1.38 Netherlands -0.95Switzerland 10.60 -1.43 UK -1.11 US -0.81US 9.20 -1.40 Venezuela -1.10 Ireland -0.79Canada 8.90 -1.25 Canada -0.98 Italy -0.54UK 9.00 -1.20 Switzerland -0.65 Australia -0.46Ireland 8.30 -0.93 Austria -0.36 UK -0.45Netherlands 10.30 -0.21 Panama -0.29 France -0.43Germany 10.80 -0.09 Brazil -0.24 Germany -0.27Austria 10.60 0.14 Germany -0.03 Spain -0.26Greece 9.00 0.34 Netherlands 0.03 Honduras -0.16Panama 7.84 0.45 Honduras 0.21 Switzerland 0.16Honduras 8.39 0.56 Greece 0.39 Sweden 0.17Sweden 11.50 0.60 Spain 0.40 Canada 0.29Argentina 8.89 0.83 Finland 0.75 Argentina 0.30Italy 11.20 1.03 Sweden 0.75 Brazil 0.36Japan 13.10 1.09 Argentina 0.97 Belgium 0.39Belgium 11.80 1.34 Belgium 1.15 Greece 0.47Finland 12.30 1.53 France 1.32 Finland 0.69Spain 10.90 1.53 Japan 1.63 Panama 1.00France 12.10 1.71 Italy 1.68 Japan 1.45Portugal 10.40 1.92 Portugal 1.80 Portugal 1.55Paraguay 9.93 2.44 Luxembourg 2.43 Luxembourg 2.22Luxembourg 14.70 2.63 Paraguay 2.54 Paraguay 2.44Notes: Resid 1 from regression on formal sector productivity. Resid 2 from regressionthat also includes real interest rate, and education. Resid 3 includes also employers' social security contribution.
37